SPRINT REPORTS CONTINUED PROGRESS IN ITS TURNAROUND DURING THE FIRST FISCAL QUARTER OF 2015
POSTPAID PHONE NET ADDITIONS IN THE LAST TWO MONTHS OF THE QUARTER
LOWEST POSTPAID CHURN IN COMPANY HISTORY
| |
| • | Sprint platform postpaid phone losses were 12,000 in the quarter with phone net additions in May, June and July |
| |
| ◦ | Improved sequentially for the fifth consecutive quarter and by over 600,000 year-over-year |
| |
| • | Best-ever Sprint platform postpaid churn of 1.56 percent improved 49 basis points year-over-year |
| |
| • | Sprint platform net additions of 675,000 compared to net losses of 220,000 in the prior year quarter |
| |
| • | Massive improvement in network performance |
| |
| ◦ | Earned 180 RootScore® awards in the first-half of 2015 compared to only 27 a year ago |
| |
| ◦ | Deployment of carrier aggregation bringing greater data speed and capacity to customers |
| |
| • | Operating Income of $501 million and Adjusted EBITDA* of $2.1 billion |
| |
| ◦ | Raising fiscal year 2015 Adjusted EBITDA* outlook from $6.5 to $6.9 billion to $7.2 to $7.6 billion |
|
| | | |
| TABLE OF CONTENTS | |
| Customer Metrics | 3 |
|
| Sales | 4 |
|
| Distribution | 5 |
|
| Network | 6 |
|
| Financials | 7 |
|
The Sprint Quarterly Investor Update is a publication of the Sprint Investor Relations department, which can be reached by phone at 1-800-259-3755 or via e-mail at investor.relations@sprint.com.
| Financial and Operational Results Tables | 11 |
|
| Notes to the Financial Information | 18 |
|
| Financial Measures | 19 |
|
Trended financial performance metrics can also be found on our Investor Relations website at sprint.com/investors.
| Safe Harbor | 20 |
|
| |
Sprint is improving the customer experience with better network performance and a compelling value proposition, including simple offers such as its industry-first leasing program and the recently introduced All-In Wireless plans. The company made significant progress on retaining more of its valuable postpaid customers, including a record low Sprint platform postpaid churn rate of 1.56 percent - a 49 basis point improvement year-over-year. Additionally, the company saw strong improvement in the more profitable phone customers.
The company had more than 57 million connections at the end of the quarter, with 56.8 million on the Sprint platform including 30 million postpaid, 15.3 million prepaid, and 11.5 million wholesale and affiliate connections. Sprint platform net additions were 675,000 for the quarter compared to net losses of 220,000 in the year-ago period. The year-over-year improvement was primarily attributable to fewer postpaid phone customer losses.
| |
| • | Retail net losses on the Sprint Platform were 56,000 in the quarter, compared to net losses of 723,000 in the year-ago quarter and net additions of 757,000 in the prior quarter. The year-over-year improvement was driven by both higher gross additions and lower postpaid churn. The sequential decline was attributable to lower gross additions. |
| |
| • | Wholesale and affiliate net additions on the Sprint platform were 731,000 in the quarter, compared to 503,000 in the year-ago quarter and 492,000 in the prior quarter. The year-over-year and sequential growth was mostly driven by connected devices. |
Postpaid^
| |
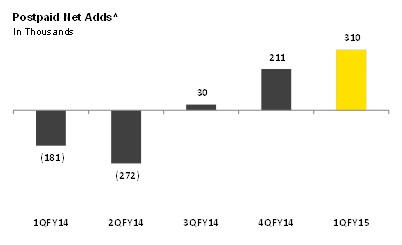
| • | Net additions were 310,000 during the quarter compared to 181,000 net losses in the year-ago period and 211,000 net additions in the prior quarter. The 491,000 year-over-year improvement was driven by both lower churn and higher prime credit quality gross additions, while the sequential improvement was mostly related to lower churn. Fewer phone losses were a major contributor to the year-over-year improvement in net additions, partially offset by lower tablet additions. The sequential improvement was primarily driven by fewer phone losses, which improved for the fifth consecutive quarter. Additionally, postpaid was net port positive versus competitors for the second consecutive quarter. |
| |
| • | Churn was 1.56 percent - a record low - compared to 2.05 percent for the year-ago period and 1.84 percent for the prior quarter. The 49 basis point year-over-year improvement was driven by improved quality of recently acquired customers and network performance improvements. The sequential improvement was driven |
|
| |
| THE SPRINT QUARTERLY INVESTOR UPDATE - FISCAL 1Q15 | ^ indicates results specific to Sprint Platform 3 |
by seasonality and continuing benefits from network performance improvements.
| |
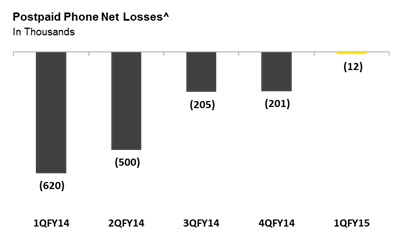
| • | Phone losses of 12,000 in the quarter were the fifth consecutive quarter of sequential improvement and compared to 620,000 for the year-ago period and 201,000 for the prior quarter. The year-over-year improvement was primarily driven by lower churn and a 13 percent increase in gross additions, including a 47 percent increase in prime credit quality gross additions. Sequentially, fewer deactivations were the primary driver of the improvement. For the first time in nearly two years, Sprint recorded monthly postpaid phone net additions in both May and June. The company ended the quarter with 24.9 million phone connections. |
| |
| • | Tablet net additions were 271,000 in the quarter compared to 535,000 for the year-ago period and 349,000 for the prior quarter. Both the year-over-year and sequential declines were due to lower gross additions as the company focuses on growing phone connections. The company ended the quarter with 2.9 million tablet connections. |
Prepaid^
| |
| • | Net losses were 366,000 during the quarter compared to net losses of 542,000 in the year-ago quarter and net additions of 546,000 in the prior quarter. The year-over-year improvement was primarily associated with fewer losses in the Assurance brand. The sequential decline was primarily driven by seasonality and less promotional activity in the Boost brand. |
| |
| • | Churn was 5.08 percent compared to 4.44 percent for the year-ago period and 3.84 percent for the prior quarter. In the quarter, the company enhanced prepaid subscriber reporting to remove one of our rules that matches customers who disconnect and then re-engage. This enhancement had no impact to net additions, but did result in reporting higher deactivations and higher gross additions in the quarter. Without this enhancement, churn in the quarter would have been 4.33 percent, relatively flat year-over-year and sequentially higher by 49 basis points mostly due to seasonality. |
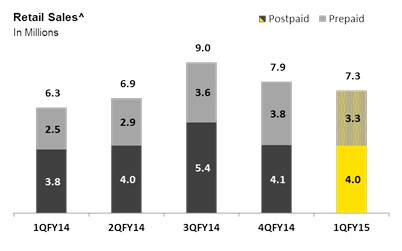
Retail Sales on the Sprint platform were 7.3 million during the quarter compared to 6.3 million in the year-ago quarter and 7.9 million in the prior quarter. The 16 percent year-over-year increase was driven by higher prepaid sales and higher postpaid upgrades. The sequential decline was primarily driven by prepaid seasonality.
|
| |
| THE SPRINT QUARTERLY INVESTOR UPDATE - FISCAL 1Q15 | ^ indicates results specific to Sprint Platform 4 |
Postpaid^
| |
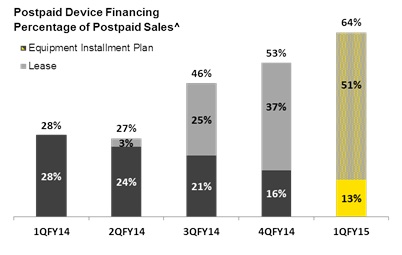
| • | Device financing take rate was 64 percent for the quarter compared to 28 percent for the year-ago period and 53 percent for the prior quarter. Leasing take rate rose to 51 percent of sales in the quarter from 37 percent in the prior quarter. At the end of the quarter, 31 percent of the postpaid connection base was active on a device financing agreement, with 16 percent on leasing and 15 percent on installment. |
| |
| • | Upgrade rate was 7.9 percent during the quarter, compared to 7.2 percent for the year-ago quarter and 7.5 percent for the prior quarter. |
| |
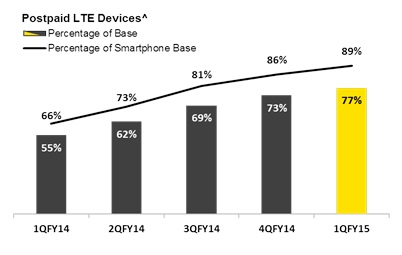
| • | Smartphones comprised 97 percent of phones sold in the quarter, a two percentage point increase year-over-year and flat with the prior quarter. At the end of the quarter, smartphones represented 89 percent of the 24.9 million ending phone connection base. |
| |
| • | LTE devices represented 77 percent of the 30 million ending connection base, compared to 55 percent at the end of the year-ago quarter. The percentage of the smartphone base with LTE capable devices rose to 89 percent at the end of the quarter, a 23 percentage point increase from the year-ago period. |
Closing the Gap on Distribution
To build on its recent momentum and increase customer acquisition in the future, Sprint took several actions to expand its retail distribution and close the gap with its competitors. Sprint’s total retail footprint now includes approximately 4,500 locations in the U.S.
|
| |
| THE SPRINT QUARTERLY INVESTOR UPDATE - FISCAL 1Q15 | ^ indicates results specific to Sprint Platform 5 |
iRankings based on 125 RootMetrics (January 1 - June 30, 2015) RootScore Reports for mobile performance as tested on best available plans and devices on four mobile networks across all available network types. Your experiences may vary. The RootMetrics award is not an endorsement of Sprint. Visit www.rootmetrics.com for more details.
| |
| • | Sprint-RadioShack Stores - All 1,435 co-branded stores are open and staffed with Sprint employees. The fully operational “store-within-a-store” retail model has been completed in about one quarter of the locations with the remaining expected to be complete by the end of calendar year 2015. |
| |
| • | Sprint® Direct 2 You - This one-of-a-kind service, which features a Sprint expert helping customers set up a mobile device at any location the customer chooses for free, has expanded to several new major metropolitan areas across the country. The service is now available in Chicago, Dallas, Denver, Kansas City, Los Angeles, Miami, New York, San Francisco, Tampa, Washington, D.C. and surrounding areas. |
| |
| • | Dixon’s Carphone - Sprint entered into a commercial relationship with Dixon’s Carphone, a premier European consumer electronics retailer renowned for innovation in wireless retail sales, to build and operate approximately 20 new Sprint stores in select U.S. markets with potential for significant expansion. |
RootScore® Awards Demonstrate Continued Progress on Network Performance; Next Evolution Underway
Sprint remained focused on building a network that delivers the consistent reliability, capacity and speed that customers demand and its progress continues to be recognized. Independent mobile analytics firm RootMetrics demonstrated the company’s network improvements by awarding Sprint a total of 180 first place (outright or shared) RootScore Awards for overall, reliability, speed, data, call, or text network performance in 125 markets measured in the first half of 2015 compared to only 27 awards in the year-ago periodi.
More recently, the company announced the availability of carrier aggregation, which produces more capacity and is expected to double data speeds, addressing a key area for improvement. The company is rolling out two-channel (2x20 MHz) carrier aggregation, a feature of LTE-Advanced that combines bands of spectrum to create wider channels in the 2.5 GHz band, on select sites within various markets across the country. In addition, Sprint is one of the first operators to roll out carrier aggregation with antenna beamforming, which significantly improves customers’ experience at the cell edge. Tests by independent third parties have confirmed the performance improvements of these actions.
Sprint has made significant progress on network performance and has started the next evolution of the network. This will involve significant densification of the network including additional macro cell sites, deployment of tens of thousands of small cells, and further expansion of the 2.5 GHz spectrum across the company’s existing sites.
|
| |
| THE SPRINT QUARTERLY INVESTOR UPDATE - FISCAL 1Q15 | 6 |
Revenues
| |
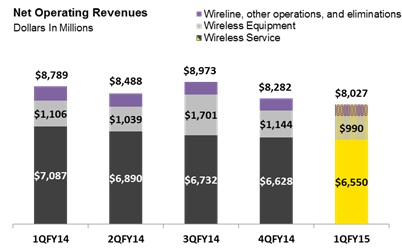
| • | Net operating revenues of $8 billion for the quarter decreased nine percent when compared to the year-ago quarter and three percent when compared to the prior quarter. The $762 million year-over-year decline was driven by lower wireless and wireline service revenues and also lower equipment revenues. The $255 million sequential decline was primarily due to lower equipment and wireless service revenues. |
| |
| • | Wireless service revenues of $6.6 billion for the quarter were down eight percent year-over-year due to a lower postpaid phone customer base and lower rate plans offered in conjunction with device financing options. The sequential decline of one percent was primarily attributable to lower rate plans offered in conjunction with device financing options. |
| |
| • | Wireless equipment revenues of $990 million for the quarter declined $116 million year-over-year and $154 million sequentially. The year-over-year decline was mostly related to a shift from installment billing sales, which recognize more revenue at the point of sale, to leasing sales, which recognize revenues over time. The sequential decline was primarily driven by lower non-lease sales volumes, partially offset by higher revenues from leased devices. |
| |
| • | Wireline revenues of $630 million for the quarter declined $116 million year-over-year and $38 million sequentially. The year-over-year and sequential declines were both driven by lower voice rates and volumes and the annual intercompany rate reduction based on current market prices for voice and IP services sold to the wireless segment. Additionally, the year-over-year decline was also impacted by the migration of wholesale cable VoIP customers off of Sprint’s IP platform. |
| |
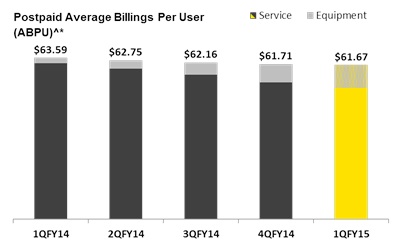
| • | Postpaid Average Billings Per User (ABPU)^* of $61.67 for the quarter declined three percent year-over-year and was flat sequentially. The year-over-year decline was primarily related to a higher mix of tablets, which have a lower monthly recurring charge than phones, and a shift to lower priced rate plans offered in conjunction with device financing options, partially offset by higher installment billings and lease revenues associated with device financing. |
| |
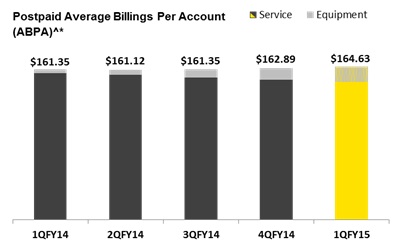
| • | Postpaid Average Billings Per Account (ABPA)^* of $164.63 for the quarter increased two percent year-over-year and one percent sequentially. Both year-over-year and sequentially, higher installment billings and lease revenues more than offset the lower rate plans offered in conjunction with device financing options. |
|
| |
| THE SPRINT QUARTERLY INVESTOR UPDATE - FISCAL 1Q15 | ^ indicates results specific to Sprint Platform 7 |
| |
| • | Prepaid ARPU^ of $27.81 for the quarter increased $0.43 year-over-year and $0.31 sequentially. The year-over-year and sequential increases were primarily driven by changes in the mix of our customer base among our prepaid brands, partially offset by pricing changes in our Boost brand. |
Operating Expenses
| |
| • | Cost of services of $2.4 billion for the quarter decreased $127 million year-over-year, primarily due to lower wireline international voice volumes and rates, lower wireless postpaid roaming expenses, and lower backhaul spend driven by T-1 migration to Ethernet, partially offset by higher wireless service and repair costs. Sequentially, cost of services was relatively flat. |
| |
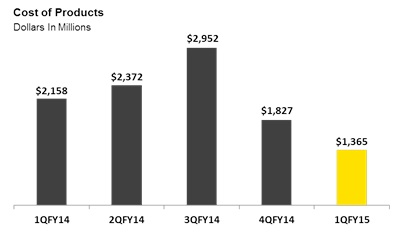
| • | Cost of products of $1.4 billion for the quarter declined $793 million year-over-year and $462 million sequentially mostly driven by lower non-lease sales volumes as customer preference shifts towards device leasing options. |
| |
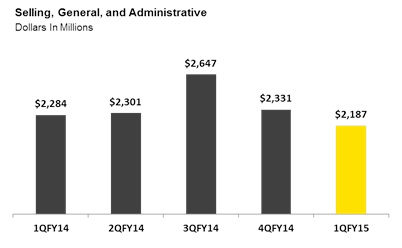
| • | SG&A expenses of $2.2 billion for the quarter declined $97 million year-over-year and $144 million sequentially. The year-over-year decrease was primarily driven by lower bad debt expense as our customer credit profile improved. The sequential decline in SG&A was mostly attributable to overhead reductions. |
| |
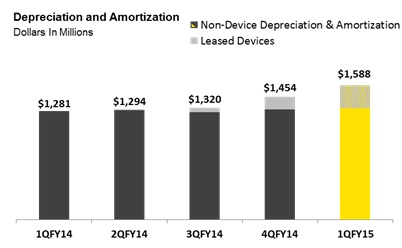
| • | Depreciation and amortization expense of $1.6 billion for the quarter increased $307 million year-over-year and $134 million sequentially. Both the year-over-year and sequential increases were primarily related to depreciation of devices associated with our leasing options, which were introduced in September 2014. Leased device depreciation was $276 million in the quarter and $150 million in the prior quarter. |
|
| |
| THE SPRINT QUARTERLY INVESTOR UPDATE - FISCAL 1Q15 | 8 |
Adjusted EBITDA* & Operating Income (Loss)
| |
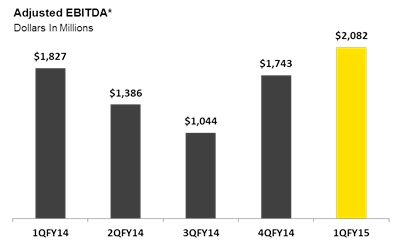
| • | Adjusted EBITDA* was $2.1 billion for the quarter compared to $1.8 billion in the year-ago quarter and $1.7 billion in the prior quarter. Adjusted EBITDA* increased 14 percent year-over-year as expense reductions more than offset the decline in operating revenues. In spite of additional costs related to higher retail sales volumes, total expenses improved primarily due to lower cost of product expenses related to the introduction of device leasing options for which the associated cost is recorded as depreciation expense over the term of the lease, lower cost of service expenses on the wireline network, and lower wireless bad debt expense as a result of a higher mix of prime credit quality customers. Sequentially, Adjusted EBITDA* increased $339 million mostly due to lower cost of products. |
| |
| • | Operating income was $501 million in the quarter compared to operating income of $519 million in the year-ago quarter and $318 million in the prior quarter. Operating income was essentially flat year-over-year as higher depreciation associated with the introduction of device leasing offset the items identified above in Adjusted EBITDA*. Sequentially, operating income increased by $183 million as the increase in Adjusted EBITDA* identified above was partially offset by higher depreciation associated with device leasing. |
Capital Expenditures & Free Cash Flow*
| |
| • | Cash capital expenditures were $2.3 billion in the quarter compared to $1.2 billion in the year-ago quarter and $2.0 billion in the prior quarter. The year-over-year $1.1 billion increase in spending was due to $556 million greater investments in the network, as well as $544 million related to device leasing in our indirect channels, where we purchase the title to the devices from the dealers and retailers. |
| |
| • | Free Cash Flow* was negative $2.2 billion for the quarter compared to negative $496 million in the year-ago quarter and negative $914 million in the prior quarter. The year-over-year change was primarily impacted by unfavorable changes to working capital and higher capital expenditures, as the shift to installment billing and leasing for devices from the subsidy model shifts customer payments for devices from the point of sale to over time. Sequentially, after normalizing for non-operational impacts of a $500 million repayment in the quarter on the receivables facility, free cash flow* would have been negative $1.7 billion for the quarter, which is roughly flat to last quarter when adjusting for the $500 million receivables draw and small spectrum sale. |
|
| |
| THE SPRINT QUARTERLY INVESTOR UPDATE - FISCAL 1Q15 | 9 |
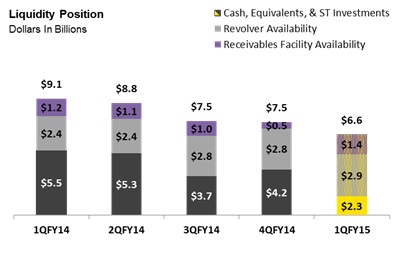
Liquidity & Debt
| |
| • | Total liquidity was $6.6 billion at the end of the quarter including $2.3 billion of cash, cash equivalents and short-term investments, $2.9 billion of undrawn borrowing capacity under the revolving bank credit facility, and $1.4 billion of undrawn capacity under the receivables facility. In addition, the company had $1.3 billion of availability under vendor financing agreements that can be utilized toward the purchase of 2.5 GHz network equipment. Sprint has been working with Softbank and other partners in setting up a leasing company that will finance its devices leased by customers on attractive terms. These arrangements are expected to be finalized in the coming months, and Softbank is expected to be a minority equity investor in the leasing company. With additional expected expense reductions, a capital efficient deployment of the network, and funding from the proposed leasing company, Sprint currently does not expect to raise additional capital through the public debt or equity markets in the foreseeable future, nor does it currently expect to sell spectrum. |
| |
| • | Net Debt* excluding net premiums was $30.8 billion at the end of the quarter. This compares to $25.7 billion in the year-ago quarter and $28.5 billion in the prior quarter. |
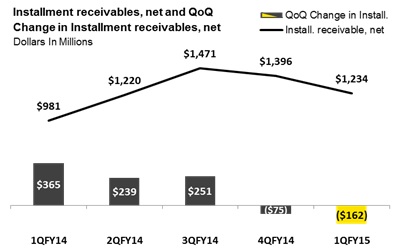
Device Financing
| |
| • | Net Installment receivables at the end of the quarter were $1.2 billion compared to $1 billion at the end of the year-ago quarter and $1.4 billion at the end of the prior quarter. The sequential decline was primarily driven by billings for prior period sales exceeding new installment billing sales. |
| |
| • | Leased Devices included in net PP&E at the end of the quarter were $2.8 billion. The $1 billion sequential increase was primarily due to a $1.3 billion increase in leased devices in gross PP&E driven by a 51 percent leasing take rate for postpaid sales in the quarter. |
Financial Outlook
| |
| • | As a result of improved customer trends, a greater reduction in operating expenses, and a higher mix of sales on device financing options, the company is raising its outlook for fiscal year 2015 Adjusted EBITDA* from its previous expectation of $6.5 to $6.9 billion to a range of $7.2 and $7.6 billion, excluding any accounting impacts from the potential lease financing. |
| |
| • | The company expects fiscal year 2015 cash capital expenditures to be approximately $5 billion, excluding the impact of leased devices sold through indirect channels. This compares to the previous expectation of accrued capital expenditures of approximately $5 billion. |
|
| |
| THE SPRINT QUARTERLY INVESTOR UPDATE - FISCAL 1Q15 | 10 |
Wireless Operating Statistics (Unaudited) |
| | | | | | | | | |
| | Quarter To Date |
| | 6/30/15 | 3/31/15 | 6/30/14 |
| Sprint Platform: | | | |
| Net Additions (Losses) (in thousands) | | | |
| Postpaid | 310 |
| 211 |
| (181 | ) |
| Prepaid | (366 | ) | 546 |
| (542 | ) |
| Wholesale and affiliate | 731 |
| 492 |
| 503 |
|
| Total Sprint Platform Wireless Net Additions (Losses) | 675 |
| 1,249 |
| (220 | ) |
| | | | |
| End of Period Connections (in thousands) | | | |
| Postpaid | 30,016 |
| 29,706 |
| 29,737 |
|
| Prepaid | 15,340 |
| 15,706 |
| 14,715 |
|
| Wholesale and affiliate | 11,456 |
| 10,725 |
| 8,879 |
|
| Total Sprint Platform End of Period Connections | 56,812 |
| 56,137 |
| 53,331 |
|
| | | | |
| Churn | | | |
| Postpaid | 1.56 | % | 1.84 | % | 2.05 | % |
| Prepaid | 5.08 | % | 3.84 | % | 4.44 | % |
| | | | |
| Supplemental Data - Connected Devices | | | |
| End of Period Connections (in thousands) | | | |
| Retail postpaid | 1,439 |
| 1,320 |
| 988 |
|
| Wholesale and affiliate | 6,620 |
| 5,832 |
| 4,192 |
|
| Total | 8,059 |
| 7,152 |
| 5,180 |
|
| | | | |
| Supplemental Data - Total Company | | | |
| End of Period Connections (in thousands) | | | |
| Sprint platform | 56,812 |
| 56,137 |
| 53,331 |
|
Transactions (1) | 856 |
| 1,004 |
| 1,222 |
|
| Total | 57,668 |
| 57,141 |
| 54,553 |
|
| | | | |
Sprint Platform ARPU (a) | | | |
| Postpaid | $ | 55.48 |
| $ | 56.94 |
| $ | 62.07 |
|
| Prepaid | $ | 27.81 |
| $ | 27.50 |
| $ | 27.38 |
|
| | | | |
NON-GAAP RECONCILIATION - AVERAGE BILLINGS PER USER (ABPU)* and AVERAGE BILLINGS PER ACCOUNT (ABPA)* (Unaudited)
(Millions, except ABPU*, accounts and ABPA*)
|
| | | | | | | | | |
| | Quarter to Date |
| | 6/30/15 | 3/31/15 | 6/30/14 |
ABPU* (b) and ABPA* (c) | | | |
| Sprint platform postpaid service revenue | $ | 4,964 |
| $ | 5,049 |
| $ | 5,553 |
|
| Add: Installment plan billings and lease revenue | 554 |
| 423 |
| 137 |
|
| Total for Sprint platform postpaid connections | $ | 5,518 |
| $ | 5,472 |
| $ | 5,690 |
|
| | | | |
| Sprint platform postpaid ABPU* | $ | 61.67 |
| $ | 61.71 |
| $ | 63.59 |
|
| | | | |
| Sprint platform postpaid accounts (in thousands) | 11,175 |
| 11,199 |
| 11,753 |
|
| Sprint platform postpaid ABPA* | $ | 164.63 |
| $ | 162.89 |
| $ | 161.35 |
|
(a) ARPU is calculated by dividing service revenue by the sum of the monthly average number of connections in the applicable service category. Changes in average monthly service revenue reflect connections for either the postpaid or prepaid service category who change rate plans, the level of voice and data usage, the amount of service credits which are offered to connections, plus the net effect of average monthly revenue generated by new connections and deactivating connections.
(b) Sprint platform postpaid ABPU* is calculated by dividing service revenue earned from customers plus installment plan billings and lease revenue by the sum of the monthly average number of connections during the period.
(c) Sprint platform postpaid ABPA* is calculated by dividing service revenue earned from customers plus installment plan billings and lease revenue by the sum of the monthly average number of accounts during the period.
|
| |
| THE SPRINT QUARTERLY INVESTOR UPDATE - FISCAL 1Q15 | 11 |
CONDENSED CONSOLIDATED STATEMENTS OF OPERATIONS (Unaudited)
(Millions, except per Share Data)
|
| | | | | | | | | |
| | Quarter to Date |
| | 6/30/15 | 3/31/15 | 6/30/14 |
| | | | |
| Net Operating Revenues |
|
|
|
| Service revenue | $ | 7,037 |
| $ | 7,138 |
| $ | 7,683 |
|
| Equipment revenue | 990 |
| 1,144 |
| 1,106 |
|
| Total Net Operating Revenues | 8,027 |
| 8,282 |
| 8,789 |
|
| Net Operating Expenses | | | |
| Cost of services (exclusive of depreciation and amortization below) | 2,393 |
| 2,381 |
| 2,520 |
|
| Cost of products (exclusive of depreciation and amortization below) | 1,365 |
| 1,827 |
| 2,158 |
|
| Selling, general and administrative | 2,187 |
| 2,331 |
| 2,284 |
|
| Depreciation and amortization | 1,588 |
| 1,454 |
| 1,281 |
|
| Other, net | (7 | ) | (29 | ) | 27 |
|
| Total net operating expenses | 7,526 |
| 7,964 |
| 8,270 |
|
| Operating Income | 501 |
| 318 |
| 519 |
|
| Interest expense | (542 | ) | (523 | ) | (512 | ) |
Equity in earnings of unconsolidated investments and other, net | 4 |
| 8 |
| 1 |
|
| (Loss) Income before Income Taxes | (37 | ) | (197 | ) | 8 |
|
| Income tax benefit (expense) | 17 |
| (27 | ) | 15 |
|
| Net (Loss) Income | $ | (20 | ) | $ | (224 | ) | $ | 23 |
|
| Basic Net (Loss) Income Per Common Share | $ | (0.01 | ) | $ | (0.06 | ) | $ | 0.01 |
|
| Diluted Net (Loss) Income Per Common Share | $ | (0.01 | ) | $ | (0.06 | ) | $ | 0.01 |
|
| Basic Weighted Average Common Shares outstanding | 3,967 |
| 3,962 |
| 3,945 |
|
| Diluted Weighted Average Common Shares outstanding | 3,967 |
| 3,962 |
| 4,002 |
|
| Effective Tax Rate | 45.9 | % | -13.7 | % | -187.5 | % |
NON-GAAP RECONCILIATION - NET (LOSS) INCOME TO ADJUSTED EBITDA* (Unaudited)
(Millions) |
| | | | | | | | | |
| | Quarter to Date |
| | 6/30/15 | 3/31/15 | 6/30/14 |
| | | | |
| Net (Loss) Income | $ | (20 | ) | $ | (224 | ) | $ | 23 |
|
| Income tax (benefit) expense | (17 | ) | 27 |
| (15 | ) |
| (Loss) Income before Income Taxes | (37 | ) | (197 | ) | 8 |
|
| Equity in earnings of unconsolidated investments and other, net | (4 | ) | (8 | ) | (1 | ) |
| Interest expense | 542 |
| 523 |
| 512 |
|
| Operating Income | 501 |
| 318 |
| 519 |
|
| Depreciation and amortization | 1,588 |
| 1,454 |
| 1,281 |
|
| EBITDA* | 2,089 |
| 1,772 |
| 1,800 |
|
Severance and exit costs (2) | 13 |
| (29 | ) | 27 |
|
Reduction in liability - U.S. Cellular asset acquisition (3) | (20 | ) | — |
| — |
|
| Adjusted EBITDA* | $ | 2,082 |
| $ | 1,743 |
| $ | 1,827 |
|
| Adjusted EBITDA Margin* | 29.6 | % | 24.4 | % | 23.8 | % |
| Selected items: | | | |
| Cash paid for capital expenditures - network and other | $ | 1,802 |
| $ | 1,608 |
| $ | 1,246 |
|
| Cash paid for capital expenditures - leased devices | $ | 544 |
| $ | 439 |
| $ | — |
|
|
| |
| THE SPRINT QUARTERLY INVESTOR UPDATE - FISCAL 1Q15 | 12 |
WIRELESS STATEMENTS OF OPERATIONS (Unaudited)
(Millions)
|
| | | | | | | | | |
| | Quarter to Date |
| | 6/30/15 | 3/31/15 | 6/30/14 |
| | | | |
| Net Operating Revenues | | | |
| Service revenue | | | |
| Sprint platform: | | | |
| Postpaid | $ | 4,964 |
| $ | 5,049 |
| $ | 5,553 |
|
| Prepaid | 1,300 |
| 1,272 |
| 1,221 |
|
| Wholesale, affiliate and other | 181 |
| 189 |
| 163 |
|
| Total Sprint platform | 6,445 |
| 6,510 |
| 6,937 |
|
| | | | |
Total transactions (1) | 105 |
| 118 |
| 150 |
|
| Total service revenue | 6,550 |
| 6,628 |
| 7,087 |
|
| | | | |
| Equipment revenue | 990 |
| 1,144 |
| 1,106 |
|
| Total net operating revenues | 7,540 |
| 7,772 |
| 8,193 |
|
| | | | |
| Net Operating Expenses | | | |
| Cost of services (exclusive of depreciation and amortization below) | 2,005 |
| 2,006 |
| 2,049 |
|
| Cost of products (exclusive of depreciation and amortization below) | 1,365 |
| 1,827 |
| 2,158 |
|
| Selling, general and administrative | 2,096 |
| 2,242 |
| 2,193 |
|
| Depreciation and amortization | 1,540 |
| 1,406 |
| 1,212 |
|
| Other, net | (8 | ) | (29 | ) | 23 |
|
| Total net operating expenses | 6,998 |
| 7,452 |
| 7,635 |
|
| Operating Income | $ | 542 |
| $ | 320 |
| $ | 558 |
|
| | | | |
WIRELESS NON-GAAP RECONCILIATION (Unaudited)
(Millions)
|
| | | | | | | | | |
| | Quarter to Date |
| | 6/30/15 | 3/31/15 | 6/30/14 |
| | | | |
| Operating Income | $ | 542 |
| $ | 320 |
| $ | 558 |
|
Severance and exit costs (2) | 12 |
| (29 | ) | 23 |
|
Reduction in liability - U.S. Cellular asset acquisition (3) | (20 | ) | — |
| — |
|
| Depreciation and amortization | 1,540 |
| 1,406 |
| 1,212 |
|
| Adjusted EBITDA* | $ | 2,074 |
| $ | 1,697 |
| $ | 1,793 |
|
| Adjusted EBITDA Margin* | 31.7 | % | 25.6 | % | 25.3 | % |
| Selected items: | | | |
| Cash paid for capital expenditures - network and other | $ | 1,640 |
| $ | 1,518 |
| $ | 1,120 |
|
| Cash paid for capital expenditures - leased devices | $ | 544 |
| $ | 439 |
| $ | — |
|
|
| |
| THE SPRINT QUARTERLY INVESTOR UPDATE - FISCAL 1Q15 | 13 |
WIRELINE STATEMENTS OF OPERATIONS (Unaudited)
(Millions)
|
| | | | | | | | | |
| | Quarter to Date |
| | 6/30/15 | 3/31/15 | 6/30/14 |
| Net Operating Revenues | | | |
| Voice | $ | 233 |
| $ | 264 |
| $ | 327 |
|
| Data | 49 |
| 52 |
| 56 |
|
| Internet | 328 |
| 335 |
| 345 |
|
| Other | 20 |
| 17 |
| 18 |
|
| Total net operating revenues | 630 |
| 668 |
| 746 |
|
| | | | |
| Net Operating Expenses | | | |
| Cost of services (exclusive of depreciation and amortization below) | 534 |
| 538 |
| 626 |
|
| Selling, general and administrative | 87 |
| 90 |
| 85 |
|
| Depreciation and amortization | 46 |
| 46 |
| 67 |
|
| Other, net | 1 |
| (2 | ) | 4 |
|
| Total net operating expenses | 668 |
| 672 |
| 782 |
|
| Operating Loss | $ | (38 | ) | $ | (4 | ) | $ | (36 | ) |
WIRELINE NON-GAAP RECONCILIATION (Unaudited)
(Millions)
|
| | | | | | | | | |
| | Quarter to Date |
| | 6/30/15 | 3/31/15 | 6/30/14 |
| | | | |
| Operating Loss | $ | (38 | ) | $ | (4 | ) | $ | (36 | ) |
Severance and exit costs (2) | 1 |
| (2 | ) | 4 |
|
| Depreciation and amortization | 46 |
| 46 |
| 67 |
|
| Adjusted EBITDA* | $ | 9 |
| $ | 40 |
| $ | 35 |
|
| Adjusted EBITDA Margin* | 1.4 | % | 6.0 | % | 4.7 | % |
| Selected items: | | | |
| Cash paid for capital expenditures - network and other | $ | 68 |
| $ | 70 |
| $ | 59 |
|
|
| |
| THE SPRINT QUARTERLY INVESTOR UPDATE - FISCAL 1Q15 | 14 |
CONDENSED CONSOLIDATED CASH FLOW INFORMATION (Unaudited)
(Millions)
|
| | | | | | | | | |
| | Quarter to Date |
| | 6/30/15 | 3/31/15 | 6/30/14 |
| Operating Activities | | | |
| Net (loss) income | $ | (20 | ) | $ | (224 | ) | $ | 23 |
|
| Depreciation and amortization | 1,588 |
| 1,454 |
| 1,281 |
|
| Provision for losses on accounts receivable | 163 |
| 162 |
| 225 |
|
| Share-based and long-term incentive compensation expense | 18 |
| (3 | ) | 26 |
|
| Deferred income tax (benefit) expense | (13 | ) | 25 |
| (23 | ) |
| Amortization of long-term debt premiums, net | (78 | ) | (77 | ) | (74 | ) |
| Other changes in assets and liabilities: | | | |
| Accounts and notes receivable | (1,683 | ) | 712 |
| (369 | ) |
| Inventories and other current assets | 869 |
| (529 | ) | (97 | ) |
| Accounts payable and other current liabilities | (867 | ) | (702 | ) | (272 | ) |
| Non-current assets and liabilities, net | 83 |
| 82 |
| (76 | ) |
| Other, net | 68 |
| 76 |
| 35 |
|
| Net cash provided by operating activities | 128 |
| 976 |
| 679 |
|
| | | | |
| Investing Activities | | | |
| Capital expenditures - network and other | (1,802 | ) | (1,608 | ) | (1,246 | ) |
| Capital expenditures - leased devices | (544 | ) | (439 | ) | — |
|
| Expenditures relating to FCC licenses | (26 | ) | (42 | ) | (41 | ) |
| Reimbursements relating to FCC licenses | — |
| — |
| 95 |
|
| Change in short-term investments, net | (37 | ) | 88 |
| (102 | ) |
| Proceeds from sales of assets and FCC licenses | 1 |
| 201 |
| 20 |
|
| Other, net | (3 | ) | (2 | ) | (3 | ) |
| Net cash used in investing activities | (2,411 | ) | (1,802 | ) | (1,277 | ) |
| | | | |
| Financing Activities | | | |
| Proceeds from debt and financings | 346 |
| 1,630 |
| — |
|
| Repayments of debt, financing and capital lease obligations | (26 | ) | (184 | ) | (210 | ) |
| Proceeds from issuance of common stock, net | 4 |
| (15 | ) | 9 |
|
| Other, net | 9 |
| (50 | ) | — |
|
| Net cash provided by (used in) financing activities | 333 |
| 1,381 |
| (201 | ) |
| | | | |
| Net (Decrease) Increase in Cash and Cash Equivalents | (1,950 | ) | 555 |
| (799 | ) |
| | | | |
| Cash and Cash Equivalents, beginning of period | 4,010 |
| 3,455 |
| 4,970 |
|
| Cash and Cash Equivalents, end of period | $ | 2,060 |
| $ | 4,010 |
| $ | 4,171 |
|
RECONCILIATION TO CONSOLIDATED FREE CASH FLOW* (NON-GAAP) (Unaudited)
(Millions) |
| | | | | | | | | |
| | Quarter to Date |
| | 6/30/15 | 3/31/15 | 6/30/14 |
| | | | |
| Net Cash Provided by Operating Activities | $ | 128 |
| $ | 976 |
| $ | 679 |
|
| | | | |
| Capital expenditures - network and other | (1,802 | ) | (1,608 | ) | (1,246 | ) |
| Capital expenditures - leased devices | (544 | ) | (439 | ) | — |
|
| (Expenditures) reimbursements relating to FCC licenses, net | (26 | ) | (42 | ) | 54 |
|
| Proceeds from sales of assets and FCC licenses | 1 |
| 201 |
| 20 |
|
| Other investing activities, net | (3 | ) | (2 | ) | (3 | ) |
| Free Cash Flow* | $ | (2,246 | ) | $ | (914 | ) | $ | (496 | ) |
|
| |
| THE SPRINT QUARTERLY INVESTOR UPDATE - FISCAL 1Q15 | 15 |
CONDENSED CONSOLIDATED BALANCE SHEETS (Unaudited)
(Millions)
|
| | | | | | |
| | 6/30/15 | 3/31/15 |
| Assets | | |
| Current assets | | |
| Cash and cash equivalents | $ | 2,060 |
| $ | 4,010 |
|
| Short-term investments | 203 |
| 166 |
|
| Accounts and notes receivable, net | 3,813 |
| 2,290 |
|
| Device and accessory inventory | 949 |
| 1,359 |
|
| Deferred tax assets | 87 |
| 62 |
|
| Prepaid expenses and other current assets | 673 |
| 1,890 |
|
| Total current assets | 7,785 |
| 9,777 |
|
| | | |
| Property, plant and equipment, net | 20,563 |
| 19,721 |
|
| Goodwill | 6,575 |
| 6,575 |
|
| FCC licenses and other | 40,013 |
| 39,987 |
|
| Definite-lived intangible assets, net | 5,516 |
| 5,893 |
|
| Other assets | 987 |
| 1,077 |
|
| Total assets | $ | 81,439 |
| $ | 83,030 |
|
| | | |
| Liabilities and Stockholders' Equity | | |
| Current liabilities | | |
| Accounts payable | $ | 3,272 |
| $ | 4,347 |
|
| Accrued expenses and other current liabilities | 4,458 |
| 5,293 |
|
| Current portion of long-term debt, financing and capital lease obligations | 1,384 |
| 1,300 |
|
| Total current liabilities | 9,114 |
| 10,940 |
|
| | | |
| Long-term debt, financing and capital lease obligations | 32,746 |
| 32,531 |
|
| Deferred tax liabilities | 13,913 |
| 13,898 |
|
| Other liabilities | 3,941 |
| 3,951 |
|
| Total liabilities | 59,714 |
| 61,320 |
|
| | | |
| Stockholders' equity | | |
| Common shares | 40 |
| 40 |
|
| Paid-in capital | 27,492 |
| 27,468 |
|
| Treasury shares, at cost | — |
| (7 | ) |
| Accumulated deficit | (5,403 | ) | (5,383 | ) |
| Accumulated other comprehensive loss | (404 | ) | (408 | ) |
| Total stockholders' equity | 21,725 |
| 21,710 |
|
| Total liabilities and stockholders' equity | $ | 81,439 |
| $ | 83,030 |
|
NET DEBT* (NON-GAAP) (Unaudited)
(Millions)
|
| | | | | | |
| | 6/30/15 | 3/31/15 |
| | | |
| Total Debt | $ | 34,130 |
| $ | 33,831 |
|
| Less: Cash and cash equivalents | (2,060 | ) | (4,010 | ) |
| Less: Short-term investments | (203 | ) | (166 | ) |
| Net Debt* | $ | 31,867 |
| $ | 29,655 |
|
|
| |
| THE SPRINT QUARTERLY INVESTOR UPDATE - FISCAL 1Q15 | 16 |
SCHEDULE OF DEBT (Unaudited)
(Millions)
|
| | | | | |
| | | | 6/30/15 |
| ISSUER | COUPON | MATURITY | PRINCIPAL |
| Sprint Corporation | | | |
| 7.25% Notes due 2021 | 7.250% | 09/15/2021 | $ | 2,250 |
|
| 7.875% Notes due 2023 | 7.875% | 09/15/2023 | 4,250 |
|
| 7.125% Notes due 2024 | 7.125% | 06/15/2024 | 2,500 |
|
| 7.625% Notes due 2025 | 7.625% | 02/15/2025 | 1,500 |
|
| Sprint Corporation | | | 10,500 |
|
| | | | |
| Sprint Communications, Inc. | | | |
| Export Development Canada Facility (Tranche 2) | 4.155% | 12/15/2015 | 500 |
|
| Export Development Canada Facility (Tranche 3) | 3.655% | 12/17/2019 | 300 |
|
| 6% Senior Notes due 2016 | 6.000% | 12/01/2016 | 2,000 |
|
| 9.125% Senior Notes due 2017 | 9.125% | 03/01/2017 | 1,000 |
|
| 8.375% Senior Notes due 2017 | 8.375% | 08/15/2017 | 1,300 |
|
| 9% Guaranteed Notes due 2018 | 9.000% | 11/15/2018 | 3,000 |
|
| 7% Guaranteed Notes due 2020 | 7.000% | 03/01/2020 | 1,000 |
|
| 7% Senior Notes due 2020 | 7.000% | 08/15/2020 | 1,500 |
|
| 11.5% Senior Notes due 2021 | 11.500% | 11/15/2021 | 1,000 |
|
| 9.25% Debentures due 2022 | 9.250% | 04/15/2022 | 200 |
|
| 6% Senior Notes due 2022 | 6.000% | 11/15/2022 | 2,280 |
|
| Sprint Communications, Inc. | | | 14,080 |
|
| | | | |
| Sprint Capital Corporation | | | |
| 6.9% Senior Notes due 2019 | 6.900% | 05/01/2019 | 1,729 |
|
| 6.875% Senior Notes due 2028 | 6.875% | 11/15/2028 | 2,475 |
|
| 8.75% Senior Notes due 2032 | 8.750% | 03/15/2032 | 2,000 |
|
| Sprint Capital Corporation | | | 6,204 |
|
| | | | |
| Clearwire Communications LLC | | | |
| 14.75% First-Priority Senior Secured Notes due 2016 | 14.750% | 12/01/2016 | 300 |
|
| 8.25% Exchangeable Notes due 2040 | 8.250% | 12/01/2040 | 629 |
|
| Clearwire Communications LLC | | | 929 |
|
| | | | |
| Secured Equipment Credit Facilities | 1.805% - 2.397% | 2017 - 2022 | 956 |
|
| | | | |
| Tower financing obligation | 6.092% | 09/30/2021 | 261 |
|
| Capital lease obligations and other | | 2015 - 2023 | 174 |
|
| TOTAL PRINCIPAL | | | 33,104 |
|
| | | | |
| Net premiums | | | 1,026 |
|
| TOTAL DEBT | | | $ | 34,130 |
|
*This table excludes (i) our unsecured revolving bank credit facility, which will expire in 2018 and has no outstanding balance, (ii) $438 million in letters of credit outstanding under the unsecured revolving bank credit facility, and (iii) all capital leases and other financing obligations.
|
| |
| THE SPRINT QUARTERLY INVESTOR UPDATE - FISCAL 1Q15 | 17 |
NOTES TO THE FINANCIAL INFORMATION (Unaudited)
(1) Postpaid and prepaid connections from transactions are defined as retail postpaid and prepaid connections acquired from Clearwire in July 2013 who had not deactivated or been recaptured on the Sprint platform.
| |
(2) | Severance and exit costs are primarily associated with work force reductions, access terminations and costs related to exiting certain operations of Clearwire. |
| |
(3) | As a result of the U.S. Cellular asset acquisition, we recorded a liability related to network shut-down costs, which primarily consisted of lease exit costs, for which we agreed to reimburse U.S. Cellular. During the first quarter of fiscal year 2015, we revised our estimate and, as a result, reduced the liability resulting in approximately $20 million of income. |
|
| |
| THE SPRINT QUARTERLY INVESTOR UPDATE - FISCAL 1Q15 | 18 |
*FINANCIAL MEASURES
Sprint provides financial measures determined in accordance with GAAP and adjusted GAAP (non-GAAP). The non-GAAP financial measures reflect industry conventions, or standard measures of liquidity, profitability or performance commonly used by the investment community for comparability purposes. These measurements should be considered in addition to, but not as a substitute for, financial information prepared in accordance with GAAP. We have defined below each of the non-GAAP measures we use, but these measures may not be synonymous to similar measurement terms used by other companies.
Sprint provides reconciliations of these non-GAAP measures in its financial reporting. Because Sprint does not predict special items that might occur in the future, and our forecasts are developed at a level of detail different than that used to prepare GAAP-based financial measures, Sprint does not provide reconciliations to GAAP of its forward-looking financial measures.
The measures used in this release include the following:
EBITDA is operating income/(loss) before depreciation and amortization. Adjusted EBITDA is EBITDA excluding severance, exit costs, and other special items. Adjusted EBITDA Margin represents Adjusted EBITDA divided by non-equipment net operating revenues for Wireless and Adjusted EBITDA divided by net operating revenues for Wireline. We believe that Adjusted EBITDA and Adjusted EBITDA Margin provide useful information to investors because they are an indicator of the strength and performance of our ongoing business operations. While depreciation and amortization are considered operating costs under GAAP, these expenses primarily represent non-cash current period costs associated with the use of long-lived tangible and definite-lived intangible assets. Adjusted EBITDA and Adjusted EBITDA Margin are calculations commonly used as a basis for investors, analysts and credit rating agencies to evaluate and compare the periodic and future operating performance and value of companies within the telecommunications industry.
ABPU is average billings per user and calculated by dividing service revenue earned from customers plus installment plan billings and lease revenue by the sum of the monthly average number of connections during the period. We believe that ABPU provides useful information to investors, analysts and our management to evaluate average Sprint platform postpaid customer billings as it approximates the expected cash collections, including installment plan billings and lease revenue, per user each month.
ABPA is average billings per account and calculated by dividing service revenue earned from customers plus installment plan billings and lease revenue by the sum of the monthly average number of accounts during the period. We believe that ABPA provides useful information to investors, analysts and our management to evaluate average Sprint platform postpaid customer billings per account as it approximates the expected cash collections, including installment plan billings and lease revenue, per account each month.
Free Cash Flow is the cash provided by operating activities less the cash used in investing activities other than short-term investments, including changes in restricted cash, if any, and amounts included as investments in Sprint Communications, Inc. during the period, if applicable. We believe that Free Cash Flow provides useful information to investors, analysts and our management about the cash generated by our core operations after interest and dividends, if any, and our ability to fund scheduled debt maturities and other financing activities, including discretionary refinancing and retirement of debt and purchase or sale of investments.
Net Debt is consolidated debt, including current maturities, less cash and cash equivalents, short-term investments and, if any, restricted cash. We believe that Net Debt provides useful information to investors, analysts and credit rating agencies about the capacity of the company to reduce the debt load and improve its capital structure.
|
| |
| THE SPRINT QUARTERLY INVESTOR UPDATE - FISCAL 1Q15 | 19 |
SAFE HARBOR
This release includes “forward-looking statements” within the meaning of the securities laws. The words “may,” “could,” “should,” “estimate,” “project,” “forecast,” “intend,” “expect,” “anticipate,” “believe,” “target,” “plan,” “providing guidance,” and similar expressions are intended to identify information that is not historical in nature. All statements that address operating performance, events or developments that we expect or anticipate will occur in the future - including statements relating to our network, connections growth, and liquidity; and statements expressing general views about future operating results - are forward-looking statements. Forward-looking statements are estimates and projections reflecting management’s judgment based on currently available information and involve a number of risks and uncertainties that could cause actual results to differ materially from those suggested by the forward-looking statements. With respect to these forward-looking statements, management has made assumptions regarding, among other things, the development and deployment of new technologies and services; efficiencies and cost savings of new technologies and services; customer and network usage; connection growth and retention; service, speed, coverage and quality; availability of devices; availability of various financings, including any leasing transactions; the timing of various events and the economic environment. Sprint believes these forward-looking statements are reasonable; however, you should not place undue reliance on forward-looking statements, which are based on current expectations and speak only as of the date when made. Sprint undertakes no obligation to publicly update or revise any forward-looking statements, whether as a result of new information, future events or otherwise, except as required by law. In addition, forward-looking statements are subject to certain risks and uncertainties that could cause actual results to differ materially from our company's historical experience and our present expectations or projections. Factors that might cause such differences include, but are not limited to, those discussed in Sprint Corporation’s Annual Report on Form 10-K for the fiscal year ended March 31, 2015. You should understand that it is not possible to predict or identify all such factors. Consequently, you should not consider any such list to be a complete set of all potential risks or uncertainties.
About Sprint:
Sprint (NYSE: S) is a communications services company that creates more and better ways to connect its customers to the things they care about most. Sprint served more than 57 million connections as of June 30, 2015 and is widely recognized for developing, engineering and deploying innovative technologies, including the first wireless 4G service from a national carrier in the United States; leading no-contract brands including Virgin Mobile USA, Boost Mobile, and Assurance Wireless; instant national and international push-to-talk capabilities; and a global Tier 1 Internet backbone. Sprint has been named to the Dow Jones Sustainability Index (DJSI) North America for the past four years. You can learn more and visit Sprint at www.sprint.com or www.facebook.com/sprint and www.twitter.com/sprint.
###
|
| |
| THE SPRINT QUARTERLY INVESTOR UPDATE - FISCAL 1Q15 | 20 |