SPRINT REPORTS HIGHEST RETAIL PHONE NET ADDITIONS IN MORE THAN TWO YEARS WITH FISCAL 2017 SECOND QUARTER RESULTS
| |
| • | Highest share of postpaid phone gross additions in company history |
| |
| ◦ | Postpaid phone gross additions grew 10 percent year-over-year |
| |
| • | Postpaid phone net additions of 279,000 were the ninth consecutive quarter of net additions |
| |
| • | Prepaid net additions of 95,000 compared to net losses of 449,000 in the prior year |
| |
| ◦ | Third consecutive quarter of net additions and improved by 544,000 year-over-year |
| |
| ◦ | Prepaid gross additions grew year-over-year for the first time in two years |
| |
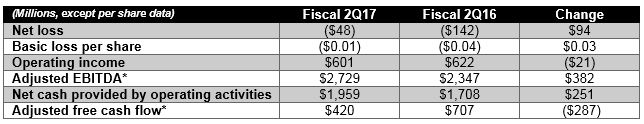
| • | Net loss of $48 million, operating income of $601 million, and adjusted EBITDA* of $2.7 billion |
| |
| ◦ | Seventh consecutive quarter of operating income |
| |
| ◦ | Highest fiscal second quarter adjusted EBITDA* in 10 years |
| |
| • | Net cash provided by operating activities of $2 billion and adjusted free cash flow* of $420 million |
| |
| ◦ | More than $650 million of adjusted free cash flow* in the first half of fiscal year 2017 |
| |
| ◦ | Positive adjusted free cash flow* in seven of the last eight quarters |
OVERLAND PARK, Kan. - Oct. 25, 2017 - Sprint Corporation (NYSE: S) today reported operating results for the second quarter of fiscal year 2017, including its highest share of postpaid phone gross additions in company history and its third consecutive quarter of net additions in both postpaid phones and prepaid with 279,000 and 95,000 net additions, respectively. The company also reported operating income of $601 million and its highest fiscal second quarter adjusted EBITDA* in 10 years at $2.7 billion.
Net cash provided by operating activities of $2 billion improved by $251 million year-over-year, bringing the year-to-date total to $3.2 billion, an improvement of $1 billion compared to a year ago. Adjusted free cash flow* was $420 million in the quarter, bringing the year-to-date total to more than $650 million. The company now expects adjusted free cash flow* for fiscal year 2017 to be around break-even.
“Sprint was able to deliver net additions in both its postpaid phone and prepaid business for the third consecutive quarter,” said Sprint CEO Marcelo Claure. “I’m even more proud that the team was able to deliver this customer growth while continuing to attack the cost structure, improve the network, and maintain positive adjusted free cash flow*.”
Highest Retail Phone Net Additions in More Than Two Years
Sprint’s execution in both its postpaid and prepaid business resulted in the highest retail phone net additions in more than two years. The company continued to add postpaid phone customers with 279,000 net additions in the quarter, its ninth consecutive quarter of net additions. Postpaid phone gross additions grew 10 percent year-over-year, including 30 percent year-over-year growth in digital channels, and Sprint’s share of postpaid phone gross additions was the highest in company history.
The recent turnaround of the prepaid business resulted in 95,000 net additions in the quarter, its third consecutive quarter of net additions and a 544,000 improvement compared to the prior year. Prepaid gross additions grew year-over-year for the first time in two years, and prepaid churn improved year-over-year for the fifth consecutive quarter.
Total company net additions were 378,000 in the quarter, including postpaid net additions of 168,000, prepaid net additions of 95,000, and wholesale and affiliate net additions of 115,000.
Cost Reduction Program Contributes to Improved Profitability
Sprint continued to make progress on its multiyear plan to transform the way it does business and improve its cost structure. The company delivered nearly $400 million of combined year-over-year reductions in cost of services and SG&A expenses in the quarter, bringing the year-to-date total reduction to more than $750 million, primarily driven by changes to the device insurance program. Lower network and customer care expenses also contributed to the year-to-date reduction.
Sprint continues to expect $1.3 billion to $1.5 billion of year-over-year net reductions in cost of services and SG&A expenses in fiscal year 2017. Although the gross reductions are expected to be higher, the company plans to reinvest some of the savings into future growth initiatives.
The cost reduction program has contributed to improved profitability, as the company has now reported seven consecutive quarters of operating income and $158 million of net income year-to-date.
Operating income and net loss in the quarter were negatively impacted by $34 million of hurricane-related charges and future quarters may be impacted by additional charges.
The company also reported the following financial results:
Sprint Magic Box Contributes to Network Speed Improvements
Sprint is unlocking the value of the largest spectrum holdings in the U.S. by densifying and optimizing its network. The company has already deployed tens of thousands of small cell solutions, including the Sprint Magic Box, which recently won the 2017 Mobile Breakthrough Award for Small Cell Technology Innovation of the Year. As the world’s first all-wireless small cell, Sprint Magic Box improves data coverage and increases download and upload speeds on average by 200 percent.1
Sprint’s extended network toolbox is improving the experience for customers across the country. Based on Ookla’s Speedtest Intelligence data, Sprint is the most improved network with national average download speeds up 33 percent year-over-year.2 And in more than 25 of 99 top markets, the company’s average download speeds increased anywhere from 40 percent to more than 100 percent, including Chicago, Los Angeles, Seattle, and Houston.3
Fiscal Year 2017 Outlook
| |
| • | The company continues to expect adjusted EBITDA* of $10.8 billion to $11.2 billion. |
| |
| • | The company continues to expect operating income of $2.1 billion to $2.5 billion. |
___________________________
1 Signal and speeds based on optimal conditions for most Sprint devices.
2 Average download speed increase based on Ookla’s analysis of Speedtest Intelligence data comparing Sept. 2016 to Sept. 2017 for all mobile results.
3 Average download speed increase based on Sprint’s analysis of Ookla Speedtest Intelligence data comparing Sept. 2016 to Sept. 2017 for all mobile results.
| |
| • | The company continues to expect cash capital expenditures, excluding devices leased through indirect channels, of $3.5 billion to $4 billion. |
| |
| • | The company expects adjusted free cash flow* to be around break-even. |
Additional Information
| |
| • | Additional information about results, including a message from management, is available on the Investor Relations website at www.sprint.com/investors |
Contact Information
| |
| • | Media contact: Dave Tovar, David.Tovar@sprint.com |
| |
| • | Investor contact: Jud Henry, Investor.Relations@sprint.com |
Wireless Operating Statistics (Unaudited) |
| | | | | | | | | | | | | | | | |
| | Quarter To Date | | Year To Date |
| | 9/30/17 | 6/30/17 | 9/30/16 | | 9/30/17 | 9/30/16 |
| Net additions (losses) (in thousands) | | | | | | |
| Postpaid | 168 |
| (39 | ) | 344 |
| | 129 |
| 524 |
|
| Postpaid phone | 279 |
| 88 |
| 347 |
| | 367 |
| 520 |
|
Prepaid (f) | 95 |
| 35 |
| (449 | ) | | 130 |
| (755 | ) |
Wholesale and affiliate (f) | 115 |
| 65 |
| 704 |
| | 180 |
| 1,432 |
|
| Total wireless net additions | 378 |
| 61 |
| 599 |
| | 439 |
| 1,201 |
|
| | | | | | | |
| End of period connections (in thousands) | | | | | | |
Postpaid (d) | 31,686 |
| 31,518 |
| 31,289 |
| | 31,686 |
| 31,289 |
|
Postpaid phone (d) | 26,432 |
| 26,153 |
| 25,669 |
| | 26,432 |
| 25,669 |
|
Prepaid (d) (e) (f) (h) | 8,765 |
| 8,719 |
| 10,187 |
| | 8,765 |
| 10,187 |
|
Wholesale and affiliate (d) (e) (f) | 13,576 |
| 13,461 |
| 12,486 |
| | 13,576 |
| 12,486 |
|
| Total end of period connections | 54,027 |
| 53,698 |
| 53,962 |
| | 54,027 |
| 53,962 |
|
| | | | | | | |
Churn (g) | | | | | | |
| Postpaid | 1.72 | % | 1.65 | % | 1.52 | % | | 1.69 | % | 1.54 | % |
| Postpaid phone | 1.59 | % | 1.50 | % | 1.37 | % | | 1.55 | % | 1.38 | % |
Prepaid (e) | 4.83 | % | 4.57 | % | 5.59 | % | | 4.70 | % | 5.49 | % |
| | | | | | | |
| Supplemental data - connected devices | | | | | | |
| End of period connections (in thousands) | | | | | | |
| Retail postpaid | 2,158 |
| 2,091 |
| 1,874 |
| | 2,158 |
| 1,874 |
|
| Wholesale and affiliate | 11,221 |
| 11,100 |
| 9,951 |
| | 11,221 |
| 9,951 |
|
| Total | 13,379 |
| 13,191 |
| 11,825 |
| | 13,379 |
| 11,825 |
|
| | | | | | | |
ARPU (a) | | | | | | |
| Postpaid | $ | 46.00 |
| $ | 47.30 |
| $ | 50.54 |
| | $ | 46.65 |
| $ | 51.04 |
|
| Postpaid phone | $ | 52.34 |
| $ | 53.92 |
| $ | 58.03 |
| | $ | 53.13 |
| $ | 58.61 |
|
Prepaid (e) | $ | 37.83 |
| $ | 38.24 |
| $ | 33.15 |
| | $ | 38.04 |
| $ | 33.07 |
|
NON-GAAP RECONCILIATION - ABPA* AND ABPU* (Unaudited)
(Millions, except accounts, connections, ABPA*, and ABPU*) |
| | | | | | | | | | | | | | | | |
| | Quarter to Date | | Year to Date |
| | 9/30/17 | 6/30/17 | 9/30/16 | | 9/30/17 | 9/30/16 |
| ABPA* | | | | | | |
| Postpaid service revenue | $ | 4,363 |
| $ | 4,466 |
| $ | 4,720 |
| | $ | 8,829 |
| $ | 9,498 |
|
| Add: Installment plan and non-operating lease billings | 397 |
| 368 |
| 274 |
| | 765 |
| 538 |
|
| Add: Lease revenue - operating | 966 |
| 899 |
| 811 |
| | 1,865 |
| 1,566 |
|
| Total for postpaid connections | $ | 5,726 |
| $ | 5,733 |
| $ | 5,805 |
| | $ | 11,459 |
| $ | 11,602 |
|
| | | | | | | |
| Average postpaid accounts (in thousands) | 11,277 |
| 11,312 |
| 11,363 |
| | 11,295 |
| 11,346 |
|
Postpaid ABPA* (b) | $ | 169.25 |
| $ | 168.95 |
| $ | 170.29 |
| | $ | 169.10 |
| $ | 170.43 |
|
| | Quarter to Date | | Year to Date |
| | 9/30/17 | 6/30/17 | 9/30/16 | | 9/30/17 | 9/30/16 |
| Postpaid phone ABPU* | | | | | | |
| Postpaid phone service revenue | $ | 4,132 |
| $ | 4,214 |
| $ | 4,441 |
| | $ | 8,346 |
| $ | 8,930 |
|
| Add: Installment plan and non-operating lease billings | 358 |
| 332 |
| 248 |
| | 690 |
| 491 |
|
| Add: Lease revenue - operating | 953 |
| 887 |
| 797 |
| | 1,840 |
| 1,538 |
|
| Total for postpaid phone connections | $ | 5,443 |
| $ | 5,433 |
| $ | 5,486 |
| | $ | 10,876 |
| $ | 10,959 |
|
| | | | | | | |
| Postpaid average phone connections (in thousands) | 26,312 |
| 26,052 |
| 25,514 |
| | 26,182 |
| 25,394 |
|
Postpaid phone ABPU* (c) | $ | 68.95 |
| $ | 69.51 |
| $ | 71.69 |
| | $ | 69.23 |
| $ | 71.93 |
|
(a) ARPU is calculated by dividing service revenue by the sum of the monthly average number of connections in the applicable service category. Changes in average monthly service revenue reflect connections for either the postpaid or prepaid service category who change rate plans, the level of voice and data usage, the amount of service credits which are offered to connections, plus the net effect of average monthly revenue generated by new connections and deactivating connections. Postpaid phone ARPU represents revenues related to our postpaid phone connections.
(b) Postpaid ABPA* is calculated by dividing service revenue earned from connections plus billings from installment plans and non-operating leases, as well as, operating lease revenue by the sum of the monthly average number of accounts during the period. Installment plan billings represent the substantial majority of the total billings in the table above for all periods presented.
(c) Postpaid phone ABPU* is calculated by dividing postpaid phone service revenue earned from postpaid phone connections plus billings from installment plans and non-operating leases, as well as, operating lease revenue by the sum of the monthly average number of postpaid phone connections during the period. Installment plan billings represent the substantial majority of the total billings in the table above for all periods presented.
(d) As part of the Shentel transaction, 186,000 and 92,000 subscribers were transferred from postpaid and prepaid, respectively, to affiliates, of which 18,000 prepaid subscribers were subsequently excluded from our customer base as a result of the Lifeline regulatory change as noted in (f) below. An additional 270,000 of nTelos' subscribers are now part of our affiliate relationship with Shentel and were reported in wholesale and affiliate subscribers beginning with the quarter ended June 30, 2016. In addition, during the three-month period ended June 30, 2017, 17,000 and 4,000 subscribers were transferred from postpaid and prepaid, respectively, to affiliates as a result of a the transfer of additional subscribers to Shentel.
(e) During the three-month period ended June 30, 2017, 2,000 Wi-Fi connections were adjusted from the postpaid subscriber base.
(f) Sprint is no longer reporting Lifeline subscribers due to recent regulatory changes resulting in tighter program restrictions. We have excluded them from our customer base for all periods presented, including our Assurance Wireless prepaid brand and subscribers through our wholesale MVNO's.
(g) In the quarter ended June 30, 2017, the Company enhanced subscriber reporting to better align certain early-life gross activations and deactivations. This enhancement had no impact to net additions, but did result in reporting lower gross additions and lower deactivations in the quarter. Without this enhancement, total postpaid churn in the quarter would have been 1.73 percent versus 1.65 percent.
(h) During the three-month period ended September 30, 2017, the Prepaid Data Share platform It's On was decommissioned as the Company continues to focus on higher value contribution offerings resulting in the reduction of 49,000 to prepaid end of period subscribers.
Wireless Device Financing Summary (Unaudited)
(Millions, except sales, connections, and leased devices in property, plant and equipment)
|
| | | | | | | | | | | | | | | | |
| | Quarter To Date | | Year To Date |
| | 9/30/17 | 6/30/17 | 9/30/16 | | 9/30/17 | 9/30/16 |
| | | | | | | |
| Postpaid activations (in thousands) | 3,917 |
| 3,668 |
| 3,747 |
| | 7,585 |
| 7,015 |
|
| Postpaid activations financed | 85 | % | 85 | % | 73 | % | | 85 | % | 71 | % |
| Postpaid activations - operating leases | 68 | % | 55 | % | 39 | % | | 62 | % | 41 | % |
| | | | | | | |
| Installment plans | | | | | | |
| Installment sales financed | $ | 268 |
| $ | 553 |
| $ | 745 |
| | $ | 821 |
| $ | 1,152 |
|
| Installment billings | $ | 373 |
| $ | 368 |
| $ | 274 |
| | $ | 741 |
| $ | 538 |
|
| Installment receivables, net | $ | 1,583 |
| $ | 1,792 |
| $ | — |
| | $ | 1,583 |
| $ | — |
|
| | | | | | | |
| Leasing revenue and depreciation | | | | | | |
| Lease revenue - operating | $ | 966 |
| $ | 899 |
| $ | 811 |
| | $ | 1,865 |
| $ | 1,566 |
|
| Lease depreciation | $ | 888 |
| $ | 854 |
| $ | 724 |
| | $ | 1,742 |
| $ | 1,368 |
|
| | | | | | | |
| Leased device additions | | | | | | |
| Cash paid for capital expenditures - leased devices | $ | 608 |
| $ | 497 |
| $ | 358 |
| | $ | 1,105 |
| $ | 763 |
|
| Transfers from inventory - leased devices | $ | 1,060 |
| $ | 850 |
| $ | 645 |
| | $ | 1,910 |
| $ | 1,186 |
|
| | | | | | | |
| Leased devices | | | | | | |
| Leased devices in property, plant and equipment, net | $ | 4,709 |
| $ | 4,336 |
| $ | 3,759 |
| | $ | 4,709 |
| $ | 3,759 |
|
| | | | | | | |
| Leased device units | | | | | | |
| Leased devices in property, plant and equipment (units in thousands) | 13,019 |
| 12,223 |
| 9,366 |
| | 13,019 |
| 9,366 |
|
| | | | | | | |
| Leased device and receivables financings net proceeds | | | | | | |
| Proceeds | $ | 789 |
| $ | 765 |
| $ | — |
| | $ | 1,554 |
| $ | 1,055 |
|
| Repayments | (1,148 | ) | (273 | ) | (184 | ) | | (1,421 | ) | (424 | ) |
| Net (repayments) proceeds of financings related to devices and receivables | $ | (359 | ) | $ | 492 |
| $ | (184 | ) | | $ | 133 |
| $ | 631 |
|
CONDENSED CONSOLIDATED STATEMENTS OF OPERATIONS (Unaudited)
(Millions, except per share data)
|
| | | | | | | | | | | | | | | | |
| | Quarter to Date | | Year to Date |
| | 9/30/17 | 6/30/17 | 9/30/16 | | 9/30/17 | 9/30/16 |
| | | | | | | |
| Net operating revenues | | | | | | |
| Service revenue | $ | 5,967 |
| $ | 6,071 |
| $ | 6,413 |
| | $ | 12,038 |
| $ | 12,929 |
|
| Equipment revenue | 1,960 |
| 2,086 |
| 1,834 |
| | 4,046 |
| 3,330 |
|
| Total net operating revenues | 7,927 |
| 8,157 |
| 8,247 |
| | 16,084 |
| 16,259 |
|
| Net operating expenses | | | | | | |
| Cost of services (exclusive of depreciation and amortization below) | 1,698 |
| 1,709 |
| 2,101 |
| | 3,407 |
| 4,200 |
|
| Cost of products (exclusive of depreciation and amortization below) | 1,404 |
| 1,545 |
| 1,693 |
| | 2,949 |
| 3,112 |
|
| Selling, general and administrative | 2,013 |
| 1,938 |
| 1,995 |
| | 3,951 |
| 3,912 |
|
| Depreciation - network and other | 997 |
| 977 |
| 986 |
| | 1,974 |
| 2,022 |
|
| Depreciation - leased devices | 888 |
| 854 |
| 724 |
| | 1,742 |
| 1,368 |
|
| Amortization | 209 |
| 223 |
| 271 |
| | 432 |
| 558 |
|
| Other, net | 117 |
| (252 | ) | (145 | ) | | (135 | ) | 104 |
|
| Total net operating expenses | 7,326 |
| 6,994 |
| 7,625 |
| | 14,320 |
| 15,276 |
|
| Operating income | 601 |
| 1,163 |
| 622 |
| | 1,764 |
| 983 |
|
| Interest expense | (595 | ) | (613 | ) | (630 | ) | | (1,208 | ) | (1,245 | ) |
| Other income (expense), net | 44 |
| (52 | ) | (15 | ) | | (8 | ) | (7 | ) |
| Income (loss) before income taxes | 50 |
| 498 |
| (23 | ) | | 548 |
| (269 | ) |
| Income tax expense | (98 | ) | (292 | ) | (119 | ) | | (390 | ) | (175 | ) |
| Net (loss) income | $ | (48 | ) | $ | 206 |
| $ | (142 | ) | | $ | 158 |
| $ | (444 | ) |
| | | | | | | |
| Basic net (loss) income per common share | $ | (0.01 | ) | $ | 0.05 |
| $ | (0.04 | ) | | $ | 0.04 |
| $ | (0.11 | ) |
| Diluted net (loss) income per common share | $ | (0.01 | ) | $ | 0.05 |
| $ | (0.04 | ) | | $ | 0.04 |
| $ | (0.11 | ) |
| Weighted average common shares outstanding | 3,998 |
| 3,993 |
| 3,979 |
| | 3,996 |
| 3,977 |
|
| Diluted weighted average common shares outstanding | 3,998 |
| 4,076 |
| 3,979 |
| | 4,080 |
| 3,977 |
|
| | | | | | | |
| Effective tax rate | 196.0 | % | 58.6 | % | -517.4 | % | | 71.2 | % | -65.1 | % |
NON-GAAP RECONCILIATION - NET (LOSS) INCOME TO ADJUSTED EBITDA* (Unaudited)
(Millions) |
| | | | | | | | | | | | | | | | |
| | Quarter to Date | | Year to Date |
| | 9/30/17 | 6/30/17 | 9/30/16 | | 9/30/17 | 9/30/16 |
| | | | | | | |
| Net (loss) income | $ | (48 | ) | $ | 206 |
| $ | (142 | ) | | $ | 158 |
| $ | (444 | ) |
| Income tax expense | 98 |
| 292 |
| 119 |
| | 390 |
| 175 |
|
| Income (loss) before income taxes | 50 |
| 498 |
| (23 | ) | | 548 |
| (269 | ) |
| Other (income) expense, net | (44 | ) | 52 |
| 15 |
| | 8 |
| 7 |
|
| Interest expense | 595 |
| 613 |
| 630 |
| | 1,208 |
| 1,245 |
|
| Operating income | 601 |
| 1,163 |
| 622 |
| | 1,764 |
| 983 |
|
| Depreciation - network and other | 997 |
| 977 |
| 986 |
| | 1,974 |
| 2,022 |
|
| Depreciation - leased devices | 888 |
| 854 |
| 724 |
| | 1,742 |
| 1,368 |
|
| Amortization | 209 |
| 223 |
| 271 |
| | 432 |
| 558 |
|
EBITDA* (1) | 2,695 |
| 3,217 |
| 2,603 |
| | 5,912 |
| 4,931 |
|
Gain from asset dispositions, exchanges, and other, net (2) | — |
| (304 | ) | (354 | ) | | (304 | ) | (354 | ) |
Severance and exit costs (3) | — |
| — |
| (5 | ) | | — |
| 11 |
|
Contract terminations (4) | — |
| (5 | ) | — |
| | (5 | ) | 113 |
|
Litigation and other contingencies (5) | — |
| (55 | ) | 103 |
| | (55 | ) | 103 |
|
Hurricanes (6) | 34 |
| — |
| — |
| | 34 |
| — |
|
Adjusted EBITDA* (1) | $ | 2,729 |
| $ | 2,853 |
| $ | 2,347 |
| | $ | 5,582 |
| $ | 4,804 |
|
| | | | | | | |
| Adjusted EBITDA margin* | 45.7 | % | 47.0 | % | 36.6 | % | | 46.4 | % | 37.2 | % |
| | | | | | | |
| Selected items: | | | | | | |
| Cash paid for capital expenditures - network and other | $ | 682 |
| $ | 1,121 |
| $ | 470 |
| | $ | 1,803 |
| $ | 943 |
|
| Cash paid for capital expenditures - leased devices | $ | 608 |
| $ | 497 |
| $ | 358 |
| | $ | 1,105 |
| $ | 763 |
|
WIRELESS STATEMENTS OF OPERATIONS (Unaudited)
(Millions)
|
| | | | | | | | | | | | | | | | |
| | Quarter to Date | | Year to Date |
| | 9/30/17 | 6/30/17 | 9/30/16 | | 9/30/17 | 9/30/16 |
| | | | | | | |
| Net operating revenues | | | | | | |
| Service revenue | | | | | | |
| Postpaid | $ | 4,363 |
| $ | 4,466 |
| $ | 4,720 |
| | $ | 8,829 |
| $ | 9,498 |
|
Prepaid (7) | 990 |
| 999 |
| 1,037 |
| | 1,989 |
| 2,111 |
|
Wholesale, affiliate and other (7) | 296 |
| 259 |
| 260 |
| | 555 |
| 509 |
|
| Total service revenue | 5,649 |
| 5,724 |
| 6,017 |
| | 11,373 |
| 12,118 |
|
| | | | | | | |
| Equipment revenue | 1,960 |
| 2,086 |
| 1,834 |
| | 4,046 |
| 3,330 |
|
| Total net operating revenues | 7,609 |
| 7,810 |
| 7,851 |
| | 15,419 |
| 15,448 |
|
| | | | | | | |
| Net operating expenses | | | | | | |
| Cost of services (exclusive of depreciation and amortization below) | 1,422 |
| 1,412 |
| 1,793 |
| | 2,834 |
| 3,577 |
|
| Cost of products (exclusive of depreciation and amortization below) | 1,404 |
| 1,545 |
| 1,693 |
| | 2,949 |
| 3,112 |
|
| Selling, general and administrative | 1,936 |
| 1,875 |
| 1,931 |
| | 3,811 |
| 3,765 |
|
| Depreciation - network and other | 944 |
| 925 |
| 936 |
| | 1,869 |
| 1,921 |
|
| Depreciation - leased devices | 888 |
| 854 |
| 724 |
| | 1,742 |
| 1,368 |
|
| Amortization | 209 |
| 223 |
| 271 |
| | 432 |
| 558 |
|
| Other, net | 117 |
| (202 | ) | (151 | ) | | (85 | ) | 98 |
|
| Total net operating expenses | 6,920 |
| 6,632 |
| 7,197 |
| | 13,552 |
| 14,399 |
|
| Operating income | $ | 689 |
| $ | 1,178 |
| $ | 654 |
| | $ | 1,867 |
| $ | 1,049 |
|
| | | | | | | |
WIRELESS NON-GAAP RECONCILIATION (Unaudited)
(Millions) |
| | | | | | | | | | | | | | | | |
| | Quarter to Date | | Year to Date |
| | 9/30/17 | 6/30/17 | 9/30/16 | | 9/30/17 | 9/30/16 |
| | | | | | | |
| Operating income | $ | 689 |
| $ | 1,178 |
| $ | 654 |
| | $ | 1,867 |
| $ | 1,049 |
|
Gain from asset dispositions, exchanges, and other, net (2) | — |
| (304 | ) | (354 | ) | | (304 | ) | (354 | ) |
Severance and exit costs (3) | — |
| (5 | ) | (11 | ) | | (5 | ) | 5 |
|
Contract terminations (4) | — |
| (5 | ) | — |
| | (5 | ) | 113 |
|
Litigation and other contingencies (5) | — |
| — |
| 103 |
| | — |
| 103 |
|
Hurricanes (6) | 34 |
| — |
| — |
| | 34 |
| — |
|
| Depreciation - network and other | 944 |
| 925 |
| 936 |
| | 1,869 |
| 1,921 |
|
| Depreciation - leased devices | 888 |
| 854 |
| 724 |
| | 1,742 |
| 1,368 |
|
| Amortization | 209 |
| 223 |
| 271 |
| | 432 |
| 558 |
|
Adjusted EBITDA* (1) | $ | 2,764 |
| $ | 2,866 |
| $ | 2,323 |
| | $ | 5,630 |
| $ | 4,763 |
|
| | | | | | | |
| Adjusted EBITDA margin* | 48.9 | % | 50.1 | % | 38.6 | % | | 49.5 | % | 39.3 | % |
| | | | | | | |
| Selected items: | | | | | | |
| Cash paid for capital expenditures - network and other | $ | 539 |
| $ | 938 |
| $ | 358 |
| | $ | 1,477 |
| $ | 734 |
|
| Cash paid for capital expenditures - leased devices | $ | 608 |
| $ | 497 |
| $ | 358 |
| | $ | 1,105 |
| $ | 763 |
|
WIRELINE STATEMENTS OF OPERATIONS (Unaudited)
(Millions)
|
| | | | | | | | | | | | | | | | |
| | Quarter to Date | | Year to Date |
| | 9/30/17 | 6/30/17 | 9/30/16 | | 9/30/17 | 9/30/16 |
| Net operating revenues | | | | | | |
| Voice | $ | 109 |
| $ | 124 |
| $ | 172 |
| | $ | 233 |
| $ | 353 |
|
| Data | 33 |
| 34 |
| 43 |
| | 67 |
| 86 |
|
| Internet | 256 |
| 255 |
| 288 |
| | 511 |
| 590 |
|
| Other | 11 |
| 20 |
| 18 |
| | 31 |
| 37 |
|
| Total net operating revenues | 409 |
| 433 |
| 521 |
| | 842 |
| 1,066 |
|
| | | | | | | |
| Net operating expenses | | | | | | |
| Cost of services (exclusive of depreciation and amortization below) | 372 |
| 387 |
| 436 |
| | 759 |
| 884 |
|
| Selling, general and administrative | 66 |
| 57 |
| 62 |
| | 123 |
| 140 |
|
| Depreciation and amortization | 49 |
| 51 |
| 48 |
| | 100 |
| 97 |
|
| Other, net | — |
| 5 |
| 7 |
| | 5 |
| 7 |
|
| Total net operating expenses | 487 |
| 500 |
| 553 |
| | 987 |
| 1,128 |
|
| Operating loss | $ | (78 | ) | $ | (67 | ) | $ | (32 | ) | | $ | (145 | ) | $ | (62 | ) |
WIRELINE NON-GAAP RECONCILIATION (Unaudited)
(Millions)
|
| | | | | | | | | | | | | | | | |
| | Quarter to Date | | Year to Date |
| | 9/30/17 | 6/30/17 | 9/30/16 | | 9/30/17 | 9/30/16 |
| | | | | | | |
| Operating loss | $ | (78 | ) | $ | (67 | ) | $ | (32 | ) | | $ | (145 | ) | $ | (62 | ) |
Severance and exit costs (3) | — |
| 5 |
| 7 |
| | 5 |
| 7 |
|
| Depreciation and amortization | 49 |
| 51 |
| 48 |
| | 100 |
| 97 |
|
| Adjusted EBITDA* | $ | (29 | ) | $ | (11 | ) | $ | 23 |
| | $ | (40 | ) | $ | 42 |
|
| | | | | | | |
| Adjusted EBITDA margin* | -7.1 | % | -2.5 | % | 4.4 | % | | -4.8 | % | 3.9 | % |
| | | | | | | |
| Selected items: | | | | | | |
| Cash paid for capital expenditures - network and other | $ | 40 |
| $ | 62 |
| $ | 31 |
| | $ | 102 |
| $ | 51 |
|
CONDENSED CONSOLIDATED CASH FLOW INFORMATION (Unaudited)
(Millions)
|
| | | | | | |
| | Year to Date |
| | 9/30/17 | 9/30/16 |
| Operating activities | | |
| Net income (loss) | $ | 158 |
| $ | (444 | ) |
| Depreciation and amortization | 4,148 |
| 3,948 |
|
| Provision for losses on accounts receivable | 199 |
| 232 |
|
| Share-based and long-term incentive compensation expense | 87 |
| 29 |
|
| Deferred income tax expense | 364 |
| 157 |
|
| Gains from asset dispositions and exchanges | (479 | ) | (354 | ) |
| Call premiums paid on debt redemptions | (129 | ) | — |
|
| Loss on early extinguishment of debt | 65 |
| — |
|
| Amortization of long-term debt premiums, net | (90 | ) | (159 | ) |
| Loss on disposal of property, plant and equipment | 410 |
| 231 |
|
| Contract terminations | (5 | ) | 96 |
|
| Other changes in assets and liabilities: | | |
| Accounts and notes receivable | (179 | ) | (126 | ) |
| Inventories and other current assets | (1,459 | ) | (892 | ) |
| Deferred purchase price from sale of receivables | — |
| (400 | ) |
| Accounts payable and other current liabilities | (161 | ) | (195 | ) |
| Non-current assets and liabilities, net | 183 |
| (205 | ) |
| Other, net | 127 |
| 332 |
|
| Net cash provided by operating activities | 3,239 |
| 2,250 |
|
| | | |
| Investing activities | | |
| Capital expenditures - network and other | (1,803 | ) | (943 | ) |
| Capital expenditures - leased devices | (1,105 | ) | (763 | ) |
| Expenditures relating to FCC licenses | (19 | ) | (32 | ) |
| Change in short-term investments, net | 3,834 |
| (1,650 | ) |
| Proceeds from sales of assets and FCC licenses | 218 |
| 66 |
|
| Other, net | (1 | ) | (36 | ) |
| Net cash provided by (used in) investing activities | 1,124 |
| (3,358 | ) |
| | | |
| Financing activities | | |
| Proceeds from debt and financings | 1,860 |
| 3,278 |
|
| Repayments of debt, financing and capital lease obligations | (4,261 | ) | (667 | ) |
| Debt financing costs | (9 | ) | (175 | ) |
| Other, net | (21 | ) | 37 |
|
| Net cash (used in) provided by financing activities | (2,431 | ) | 2,473 |
|
| | | |
| Net increase in cash and cash equivalents | 1,932 |
| 1,365 |
|
| | | |
| Cash and cash equivalents, beginning of period | 2,870 |
| 2,641 |
|
| Cash and cash equivalents, end of period | $ | 4,802 |
| $ | 4,006 |
|
RECONCILIATION TO CONSOLIDATED FREE CASH FLOW* (NON-GAAP) (Unaudited)
(Millions) |
| | | | | | | | | | | | | | | | |
| | Quarter to Date | | Year to Date |
| | 9/30/17 | 6/30/17 | 9/30/16 | | 9/30/17 | 9/30/16 |
| | | | | | | |
| Net cash provided by operating activities | $ | 1,959 |
| $ | 1,280 |
| $ | 1,708 |
| | $ | 3,239 |
| $ | 2,250 |
|
| | | | | |
|
|
| Capital expenditures - network and other | (682 | ) | (1,121 | ) | (470 | ) | | (1,803 | ) | (943 | ) |
| Capital expenditures - leased devices | (608 | ) | (497 | ) | (358 | ) | | (1,105 | ) | (763 | ) |
| Expenditures relating to FCC licenses, net | (6 | ) | (13 | ) | (17 | ) | | (19 | ) | (32 | ) |
| Proceeds from sales of assets and FCC licenses | 117 |
| 101 |
| 39 |
| | 218 |
| 66 |
|
| Other investing activities, net | (1 | ) | (3 | ) | (11 | ) | | (4 | ) | (36 | ) |
| Free cash flow* | $ | 779 |
| $ | (253 | ) | $ | 891 |
| | $ | 526 |
| $ | 542 |
|
| | | | | | | |
| Net (repayments) proceeds of financings related to devices and receivables | (359 | ) | 492 |
| (184 | ) | | 133 |
| 631 |
|
| Adjusted free cash flow* | $ | 420 |
| $ | 239 |
| $ | 707 |
| | $ | 659 |
| $ | 1,173 |
|
CONDENSED CONSOLIDATED BALANCE SHEETS (Unaudited)
(Millions)
|
| | | | | | |
| | 9/30/17 | 3/31/17 |
| ASSETS | | |
| Current assets | | |
| Cash and cash equivalents | $ | 4,802 |
| $ | 2,870 |
|
| Short-term investments | 1,610 |
| 5,444 |
|
| Accounts and notes receivable, net | 4,118 |
| 4,138 |
|
| Device and accessory inventory | 751 |
| 1,064 |
|
| Prepaid expenses and other current assets | 654 |
| 601 |
|
| Total current assets | 11,935 |
| 14,117 |
|
| | | |
| Property, plant and equipment, net | 18,901 |
| 19,209 |
|
| Goodwill | 6,578 |
| 6,579 |
|
| FCC licenses and other | 41,072 |
| 40,585 |
|
| Definite-lived intangible assets, net | 2,848 |
| 3,320 |
|
| Other assets | 1,132 |
| 1,313 |
|
| Total assets | $ | 82,466 |
| $ | 85,123 |
|
| | | |
| LIABILITIES AND STOCKHOLDERS' EQUITY | | |
| Current liabilities | | |
| Accounts payable | $ | 2,947 |
| $ | 3,281 |
|
| Accrued expenses and other current liabilities | 3,808 |
| 4,141 |
|
| Current portion of long-term debt, financing and capital lease obligations | 4,142 |
| 5,036 |
|
| Total current liabilities | 10,897 |
| 12,458 |
|
| | | |
| Long-term debt, financing and capital lease obligations | 34,236 |
| 35,878 |
|
| Deferred tax liabilities | 14,780 |
| 14,416 |
|
| Other liabilities | 3,533 |
| 3,563 |
|
| Total liabilities | 63,446 |
| 66,315 |
|
| | | |
| Stockholders' equity | | |
| Common stock | 40 |
| 40 |
|
| Treasury shares, at cost | (9 | ) | — |
|
| Paid-in capital | 27,807 |
| 27,756 |
|
| Accumulated deficit | (8,426 | ) | (8,584 | ) |
| Accumulated other comprehensive loss | (392 | ) | (404 | ) |
| Total stockholders' equity | 19,020 |
| 18,808 |
|
| Total liabilities and stockholders' equity | $ | 82,466 |
| $ | 85,123 |
|
NET DEBT* (NON-GAAP) (Unaudited)
(Millions)
|
| | | | | | |
| | 9/30/17 | 3/31/17 |
| | | |
| Total debt | $ | 38,378 |
| $ | 40,914 |
|
| Less: Cash and cash equivalents | (4,802 | ) | (2,870 | ) |
| Less: Short-term investments | (1,610 | ) | (5,444 | ) |
| Net debt* | $ | 31,966 |
| $ | 32,600 |
|
SCHEDULE OF DEBT (Unaudited)
(Millions)
|
| | | | |
| | | 9/30/17 |
| ISSUER | MATURITY | PRINCIPAL |
| Sprint Corporation | | |
| 7.25% Senior notes due 2021 | 09/15/2021 | $ | 2,250 |
|
| 7.875% Senior notes due 2023 | 09/15/2023 | 4,250 |
|
| 7.125% Senior notes due 2024 | 06/15/2024 | 2,500 |
|
| 7.625% Senior notes due 2025 | 02/15/2025 | 1,500 |
|
| Sprint Corporation | | 10,500 |
|
| | | |
| Sprint Spectrum Co LLC, Sprint Spectrum Co II LLC, and Sprint Spectrum Co III LLC | | |
| 3.36% Senior secured notes due 2021 | 09/20/2021 | 3,500 |
|
| Sprint Spectrum Co LLC, Sprint Spectrum Co II LLC, and Sprint Spectrum Co III LLC | | 3,500 |
|
| | | |
| Sprint Communications, Inc. | | |
| Export Development Canada secured loan | 12/17/2019 | 300 |
|
| 9% Guaranteed notes due 2018 | 11/15/2018 | 1,800 |
|
| 7% Guaranteed notes due 2020 | 03/01/2020 | 1,000 |
|
| 7% Senior notes due 2020 | 08/15/2020 | 1,500 |
|
| 11.5% Senior notes due 2021 | 11/15/2021 | 1,000 |
|
| 9.25% Secured debentures due 2022 | 04/15/2022 | 200 |
|
| 6% Senior notes due 2022 | 11/15/2022 | 2,280 |
|
| Sprint Communications, Inc. | | 8,080 |
|
| | | |
| Sprint Capital Corporation | | |
| 6.9% Senior notes due 2019 | 05/01/2019 | 1,729 |
|
| 6.875% Senior notes due 2028 | 11/15/2028 | 2,475 |
|
| 8.75% Senior notes due 2032 | 03/15/2032 | 2,000 |
|
| Sprint Capital Corporation | | 6,204 |
|
| | | |
| Clearwire Communications LLC | | |
8.25% Exchangeable notes due 2040 (a) | 12/01/2017 | 629 |
|
| Clearwire Communications LLC | | 629 |
|
| | | |
| Credit facilities | | |
| Secured equipment credit facilities | 2020 - 2021 | 552 |
|
| Secured term loan | 02/03/2024 | 3,980 |
|
| Credit facilities | | 4,532 |
|
| | | |
| Accounts receivable facility | 11/19/2018 | 2,393 |
|
| | | |
| Financing obligations | 2017 - 2021 | 2,011 |
|
| | | |
| Capital leases and other obligations | 2017 - 2024 | 533 |
|
| Total principal | | 38,382 |
|
| | | |
| Net premiums and debt financing costs | | (4 | ) |
| Total debt | | $ | 38,378 |
|
(a) $629 million Clearwire 8.25% Exchangeable Notes due 2040 have both a par call and put in December 2017.
NOTES TO THE FINANCIAL INFORMATION (Unaudited)
| |
(1) | As more of our customers elect to lease a device rather than purchasing one under our subsidized program, there is a significant positive impact to EBITDA* and Adjusted EBITDA* from direct channel sales primarily due to the fact the cost of the device is not recorded as cost of products but rather is depreciated over the customer lease term. Under our device leasing program for the direct channel, devices are transferred from inventory to property and equipment and the cost of the leased device is recognized as depreciation expense over the customer lease term to an estimated residual value. The customer payments are recognized as revenue over the term of the lease. Under our subsidized program, the cash received from the customer for the device is recognized as equipment revenue at the point of sale and the cost of the device is recognized as cost of products. During the three and six-month periods ended September 30, 2017, we leased devices through our Sprint direct channels totaling approximately $1,060 million and $1,910 million, respectively, which would have increased cost of products and reduced EBITDA* if they had been purchased under our subsidized program. |
The impact to EBITDA* and Adjusted EBITDA* resulting from the sale of devices under our installment billing program is generally neutral except for the impact from the time value of money element related to the imputed interest on the installment receivable.
| |
(2) | During the first quarter of fiscal year 2017, the company recorded losses on dispositions of assets primarily related to cell site construction and network development costs that are no longer relevant as a result of changes in the company's network plans. Additionally, the company recorded a pre-tax non-cash gain related to spectrum swaps with other carriers. During the second quarter of fiscal year 2016 the company recorded a pre-tax non-cash gain of $354 million related to spectrum swaps with other carriers. |
| |
(3) | Severance and exit costs consist of lease exit costs primarily associated with tower and cell sites, access exit costs related to payments that will continue to be made under the company's backhaul access contracts for which the company will no longer be receiving any economic benefit, and severance costs associated with reduction in its work force. |
| |
(4) | During the first quarter of fiscal year 2017, we recorded a $5 million gain due to reversal of a liability recorded in relation to the termination of our relationship with General Wireless Operations, Inc. (Radio Shack). During the first quarter of fiscal year 2016, contract terminations primarily relate to the termination of our pre-existing wholesale arrangement with NTELOS Holding Corp. |
| |
(5) | During the first quarter of fiscal year 2017, we recorded a $55 million reduction in legal reserves related to favorable developments in pending legal proceedings. During the second quarter of fiscal year 2016, litigation and other contingencies consist of unfavorable developments associated with legal matters as well as federal and state matters such as sales, use or property taxes. |
| |
(6) | During the second quarter of fiscal year 2017 we recorded estimated hurricane-related charges of $34 million, consisting of customer service credits, incremental roaming costs, network repairs and replacements. |
| |
(7) | Sprint is no longer reporting Lifeline subscribers due to recent regulatory changes resulting in tighter program restrictions. We have excluded them from our customer base for all periods presented, including our Assurance Wireless prepaid brand and subscribers through our wholesale Lifeline mobile virtual network operators (MVNO). The table reflects the reclassification of the related Assurance Wireless prepaid revenue from Prepaid service revenue to Wholesale, affiliate and other revenue of $92 million and $183 million for the three and six-month periods ended September 30, 2016, respectively. Revenue associated with subscribers through our wholesale Lifeline MVNO's continue to remain in Wholesale, affiliate and other revenue following this change. |
*FINANCIAL MEASURES
Sprint provides financial measures determined in accordance with GAAP and adjusted GAAP (non-GAAP). The non-GAAP financial measures reflect industry conventions, or standard measures of liquidity, profitability or performance commonly used by the investment community for comparability purposes. These measurements should be considered in addition to, but not as a substitute for, financial information prepared in accordance with GAAP. We have defined below each of the non-GAAP measures we use, but these measures may not be synonymous to similar measurement terms used by other companies.
Sprint provides reconciliations of these non-GAAP measures in its financial reporting. Because Sprint does not predict special items that might occur in the future, and our forecasts are developed at a level of detail different than that used to prepare GAAP-based financial measures, Sprint does not provide reconciliations to GAAP of its forward-looking financial measures.
The measures used in this release include the following:
EBITDA is operating income/(loss) before depreciation and amortization. Adjusted EBITDA is EBITDA excluding severance, exit costs, and other special items. Adjusted EBITDA Margin represents Adjusted EBITDA divided by non-equipment net operating revenues for Wireless and Adjusted EBITDA divided by net operating revenues for Wireline. We believe that Adjusted EBITDA and Adjusted EBITDA Margin provide useful information to investors because they are an indicator of the strength and performance of our ongoing business operations. While depreciation and amortization are considered operating costs under GAAP, these expenses primarily represent non-cash current period costs associated with the use of long-lived tangible and definite-lived intangible assets. Adjusted EBITDA and Adjusted EBITDA Margin are calculations commonly used as a basis for investors, analysts and credit rating agencies to evaluate and compare the periodic and future operating performance and value of companies within the telecommunications industry.
Postpaid ABPA is average billings per account and calculated by dividing postpaid service revenue earned from postpaid customers plus billings from installment plans and non-operating leases, as well as, operating lease revenue by the sum of the monthly average number of postpaid accounts during the period. We believe that ABPA provides useful information to investors, analysts and our management to evaluate average postpaid customer billings per account as it approximates the expected cash collections, including billings from installment plans and non-operating leases, as well as, operating lease revenue, per postpaid account each month.
Postpaid Phone ABPU is average billings per postpaid phone user and calculated by dividing service revenue earned from postpaid phone customers plus billings from installment plans and non-operating leases, as well as, operating lease revenue by the sum of the monthly average number of postpaid phone connections during the period. We believe that ABPU provides useful information to investors, analysts and our management to evaluate average postpaid phone customer billings as it approximates the expected cash collections, including billings from installment plans and non-operating leases, as well as, operating lease revenue, per postpaid phone user each month.
Free Cash Flow is the cash provided by operating activities less the cash used in investing activities other than short-term investments, including changes in restricted cash, if any, and excluding the sale-leaseback of devices and equity method investments. Adjusted Free Cash Flow is Free Cash Flow plus the proceeds from device financings and sales of receivables, net of repayments. We believe that Free Cash Flow and Adjusted Free Cash Flow provide useful information to investors, analysts and our management about the cash generated by our core operations and net proceeds obtained to fund certain leased devices, respectively, after interest and dividends, if any, and our ability to fund scheduled debt maturities and other financing activities, including discretionary refinancing and retirement of debt and purchase or sale of investments.
Net Debt is consolidated debt, including current maturities, less cash and cash equivalents, short-term investments and, if any, restricted cash. We believe that Net Debt provides useful information to investors, analysts and credit rating agencies about the capacity of the company to reduce the debt load and improve its capital structure.
SAFE HARBOR
This release includes “forward-looking statements” within the meaning of the securities laws. The words “may,” “could,” “should,” “estimate,” “project,” “forecast,” “intend,” “expect,” “anticipate,” “believe,” “target,” “plan”, “outlook,” “providing guidance,” and similar expressions are intended to identify information that is not historical in nature. All statements that address operating performance, events or developments that we expect or anticipate will occur in the future - including statements relating to our network, cost reductions, connections growth, and liquidity; and statements expressing general views about future operating results - are forward-looking statements. Forward-looking statements are estimates and projections reflecting management’s judgment based on currently available information and involve a number of risks and uncertainties that could cause actual results to differ materially from those suggested by the forward-looking statements. With respect to these forward-looking statements, management has made assumptions regarding, among other things, the development and deployment of new technologies and services; efficiencies and cost savings of new technologies and services; customer and network usage; connection growth and retention; service, speed, coverage and quality; availability of devices; availability of various financings, including any leasing transactions; the timing of various events and the economic environment. Sprint believes these forward-looking statements are reasonable; however, you should not place undue reliance on forward-looking statements, which are based on current expectations and speak only as of the date when made. Sprint undertakes no obligation to publicly update or revise any forward-looking statements, whether as a result of new information, future events or otherwise, except as required by law. In addition, forward-looking statements are subject to certain risks and uncertainties that could cause actual results to differ materially from our company's historical experience and our present expectations or projections. Factors that might cause such differences include, but are not limited to, those discussed in Sprint Corporation’s Annual Report on Form 10-K for the fiscal year ended March 31, 2017. You should understand that it is not possible to predict or identify all such factors. Consequently, you should not consider any such list to be a complete set of all potential risks or uncertainties.
About Sprint:
Sprint (NYSE: S) is a communications services company that creates more and better ways to connect its customers to the things they care about most. Sprint served 54 million connections as of Sept. 30, 2017 and is widely recognized for developing, engineering and deploying innovative technologies, including the first wireless 4G service from a national carrier in the United States; leading no-contract brands including Virgin Mobile USA, Boost Mobile, and Assurance Wireless; instant national and international push-to-talk capabilities; and a global Tier 1 Internet backbone. Sprint has been named to the Dow Jones Sustainability Index (DJSI) North America for the past five years. You can learn more and visit Sprint at www.sprint.com or www.facebook.com/sprint and www.twitter.com/sprint.
###