UNITED STATES
SECURITIES AND EXCHANGE COMMISSION
WASHINGTON, D.C. 20549
FORM N-CSR
CERTIFIED SHAREHOLDER REPORT OF REGISTERED
MANAGEMENT INVESTMENT COMPANIES
Investment Company Act file number: 811-07707
AB GLOBAL REAL ESTATE INVESTMENT FUND, INC.
(Exact name of registrant as specified in charter)
1345 Avenue of the Americas, New York, New York 10105
(Address of principal executive offices) (Zip code)
Joseph J. Mantineo
AllianceBernstein L.P.
1345 Avenue of the Americas
New York, New York 10105
(Name and address of agent for service)
Registrant’s telephone number, including area code: (800) 221-5672
Date of fiscal year end: November 30, 2016
Date of reporting period: November 30, 2016
ITEM 1. REPORTS TO STOCKHOLDERS.
NOV 11.30.16
ANNUAL REPORT
AB GLOBAL REAL ESTATE INVESTMENT FUND

Investment Products Offered
|
•Are Not FDIC Insured •May Lose Value •Are Not Bank Guaranteed |
Investors should consider the investment objectives, risks, charges and expenses of the Fund carefully before investing. For copies of our prospectus or summary prospectus, which contain this and other information, visit us online at www.abfunds.com or contact your AB representative. Please read the prospectus and/or summary prospectus carefully before investing.
This shareholder report must be preceded or accompanied by the Fund’s prospectus for individuals who are not current shareholders of the Fund.
You may obtain a description of the Fund’s proxy voting policies and procedures, and information regarding how the Fund voted proxies relating to portfolio securities during the most recent 12-month period ended June 30, without charge. Simply visit AB’s website at www.abfunds.com, or go to the Securities and Exchange Commission’s (the “Commission”) website at www.sec.gov, or call AB at (800) 227-4618.
The Fund files its complete schedule of portfolio holdings with the Commission for the first and third quarters of each fiscal year on Form N-Q. The Fund’s Forms N-Q are available on the Commission’s website at www.sec.gov. The Fund’s Forms N-Q may also be reviewed and copied at the Commission’s Public Reference Room in Washington, DC; information on the operation of the Public Reference Room may be obtained by calling (800) SEC-0330. AB publishes full portfolio holdings for the Fund monthly at www.abfunds.com.
AllianceBernstein Investments, Inc. (ABI) is the distributor of the AB family of mutual funds. ABI is a member of FINRA and is an affiliate of AllianceBernstein L.P., the Adviser of the funds.
The [A/B] logo is a registered service mark of AllianceBernstein and AllianceBernstein® is a registered service mark used by permission of the owner, AllianceBernstein L.P.
January 12, 2017
Annual Report
This report provides management’s discussion of fund performance for AB Global Real Estate Investment Fund (the “Fund”) for the annual reporting period ended November 30, 2016.
Investment Objectives and Policies
The Fund’s investment objective is total return from long-term growth of capital and income. Under normal circumstances, the Fund invests at least 80% of its net assets in the equity securities of real estate investment trusts (“REITs”), and other real estate industry companies, such as real estate operating companies. The Fund invests in real estate companies that AllianceBernstein L.P. (the “Adviser”) believes have strong property fundamentals and management teams. The Fund seeks to invest in real estate companies whose underlying portfolios are diversified geographically and by property type.
The Fund invests in US and non-US issuers. Under normal circumstances, the Fund invests significantly (at least 40%—unless market conditions are not deemed favorable by the Adviser) in securities of non-US companies. In addition, the Fund invests, under normal circumstances, in the equity securities of companies located in at least three countries. The Fund’s investment policies emphasize investments in companies determined by the Adviser to
be undervalued relative to their peers, using a fundamental value approach.
Currencies can have a dramatic impact on equity return, significantly adding to returns in some years and greatly diminishing them in others. The Adviser evaluates currency and equity positions separately and may seek to hedge the currency exposure resulting from securities positions when it finds the currency exposure unattractive. To hedge a portion of its currency risk, the Fund may invest from time to time in currency-related derivatives, including forward currency exchange contracts, futures contracts, options on futures contracts, swaps and options. The Adviser also may seek investment opportunities by taking long or short positions in currencies through the use of currency-related derivatives.
The Fund invests in equity securities that include common stock, shares of beneficial interest of REITs, and securities with common stock characteristics, such as preferred stock or convertible securities (“real estate equity securities”). The Fund may enter into forward commitments and standby commitment agreements. The Fund may enter into other derivatives transactions, such as options, futures contracts, forwards and swaps. The Fund may use options strategies involving the purchase and/or writing of various combinations of call and/or put options, including on individual
| | | | |
| AB GLOBAL REAL ESTATE INVESTMENT FUND • | | | 1 | |
securities and stock indices, futures contracts (including futures contracts on individual securities and stock indices) or shares of exchange-traded funds (“ETFs”). These transactions may be used, for example, in an effort to earn extra income, to adjust exposure to individual securities or markets, or to protect all or a portion of the Fund’s portfolio from a decline in value, sometimes within certain ranges. The Fund may, at times, invest in shares of ETFs in lieu of making direct investments in equity securities. ETFs may provide more efficient and economical exposure to the type of companies and geographic locations in which the Fund seeks to invest than direct investments.
Investment Results
The table on page 7 shows the Fund’s performance compared to its primary benchmark, the Financial Times Stock Exchange European Public Real Estate Association/National Association of Real Estate Investment Trusts (“FTSE EPRA/NAREIT”) Developed Real Estate (“RE”) Index (net), for the six- and 12-month periods ended November 30, 2016. A comparison to the global equity market is also shown, as represented by the Morgan Stanley Capital International (“MSCI”) World Index, for the same timeframes; additionally, a comparison to the overall US stock market, as represented by the Standard & Poor’s (“S&P”) 500 Index, is shown.
For the 12-month period, all share classes of the Fund underperformed the primary benchmark, before sales charges. Sector selection detracted, relative to the benchmark, primarily because of an overweight position in the lodging sector and an underweight position in the specialty sector. Overall stock selection contributed to returns. The largest contributors were from the industrial/office and health care sectors, which were only partially offset by negative stock selection in the lodging sector.
For the six-month period, all share classes outperformed the primary benchmark, with the exception of Class B shares, which performed in-line, before sales charges. Sector selection modestly contributed to returns, benefiting from an underweight to the health care sector, which was only partially offset by an overweight to the lodging sector. Overall stock selection also contributed to returns. The largest contributors were from the retail and diversified sectors, which were partially offset by negative stock selection in the industrial/office sector.
Derivatives in the form of foreign currency forwards were utilized for hedging and investment purposes, which had an immaterial impact on performance during both periods, in absolute terms. The Fund’s performance was not impacted by leverage during either period.
| | |
| 2 | | • AB GLOBAL REAL ESTATE INVESTMENT FUND |
Market Review and Investment Strategy
Real estate markets fell slightly during the six-month period ended November 30, 2016, but rose over the 12-month period. Real estate fundamentals continued to improve, though the rate of cash flow growth began to slow during the 12-month period. The FTSE EPRA/NAREIT Developed RE Index (net) finished the 12-month period up 1.95%. The MSCI World Index rose 3.15% during the same period.
Real estate fundamentals were generally healthy across the globe. In Australia, retail sales remained robust, which supported income growth for retail REITs. In Japan, office occupancy remained at historically high levels. In the UK,
the outlook for demand growth became more uncertain following the Brexit vote. In continental Europe, aggressive monetary policy easing lowered debt cost for property firms. In the US, most segments of the property market performed well. In the industrial sector, for example, growth in e-commerce retailing supported ongoing demand growth, which continued to outpace supply growth in most segments of the market. The Fund’s Senior Investment Management Team continues to find attractive opportunities across a wide group of countries and sectors, focusing on attractively priced companies with improving fundamentals, together with the balance sheet strength to withstand periods of renewed volatility.
| | | | |
| AB GLOBAL REAL ESTATE INVESTMENT FUND • | | | 3 | |
DISCLOSURES AND RISKS
Benchmark Disclosure
The FTSE® EPRA/NAREIT Developed RE Index, MSCI World Index and S&P® 500 Index are unmanaged and do not reflect fees and expenses associated with the active management of a mutual fund portfolio. The FTSE EPRA/NAREIT Developed RE Index is a market value-weighted index based upon the last closing price of the month for tax-qualified REITs listed on the NYSE, AMEX and the NASDAQ. The MSCI World Index (free float-adjusted, market capitalization weighted) represents the equity market performance of developed markets. The S&P 500 Index includes 500 US stocks and is a common representation of the performance of the overall US stock market. MSCI makes no express or implied warranties or representations, and shall have no liability whatsoever with respect to any MSCI data contained herein. The MSCI data may not be further redistributed or used as a basis for other indices, any securities or financial products. This report is not approved, reviewed or produced by MSCI. Net returns include the reinvestment of dividends after deduction of non-US withholding tax; gross returns include reinvestment of dividends prior to such deduction. An investor cannot invest directly in an index, and its results are not indicative of the performance for any specific investment, including the Fund.
A Word About Risk
Market Risk: The value of the Fund’s investments will fluctuate as the stock or bond market fluctuates. The value of its investments may decline, sometimes rapidly and unpredictably, simply because of economic changes or other events that affect large portions of the market.
Interest Rate Risk: Changes in interest rates will affect the value of investments in fixed-income securities. When interest rates rise, the value of investments in fixed-income securities tends to fall and this decrease in value may not be offset by higher income from new investments. The Fund may be subject to a heightened risk of rising rates as the current period of historically low interest rates ends. Interest rate risk is generally greater for fixed-income securities with longer maturities or durations.
Credit Risk: An issuer or guarantor of a fixed-income security, or the counterparty to a derivatives or other contract, may be unable or unwilling to make timely payments of interest or principal, or to otherwise honor its obligations. The issuer or guarantor may default, causing a loss of the full principal amount of a security. The degree of risk for a particular security may be reflected in its credit rating. There is the possibility that the credit rating of a fixed-income security may be downgraded after purchase, which may adversely affect the value of the security. Investments in fixed-income securities with lower ratings tend to have a higher probability that an issuer will default or fail to meet its payment obligations.
(Disclosures, Risks and Note about Historical Performance continued on next page)
| | |
| 4 | | • AB GLOBAL REAL ESTATE INVESTMENT FUND |
Disclosures and Risks
DISCLOSURES AND RISKS
(continued from previous page)
Real Estate Risk: The Fund’s investments in the real estate market have many of the same risks as direct ownership of real estate, including the risk that the value of real estate could decline due to a variety of factors that affect the real estate market generally. Investments in REITs may have additional risks. REITs are dependent on the capability of their managers, may have limited diversification, and could be significantly affected by changes in tax laws.
Foreign (Non-US) Risk: Investments in securities of non-US issuers may involve more risk than those of US issuers. These securities may fluctuate more widely in price and may be less liquid due to adverse market, economic, political, regulatory or other factors.
Currency Risk: Fluctuations in currency exchange rates may negatively affect the value of the Fund’s investments or reduce its returns.
Prepayment Risk: The value of mortgage-related or asset-backed securities may be particularly sensitive to changes in prevailing interest rates. Early payments of principal on some mortgage-related securities may occur during periods of falling mortgage interest rates and expose the Fund to a lower rate of return upon reinvestment of principal. Early payments associated with mortgage-related securities cause these securities to experience significantly greater price and yield volatility than is experienced by traditional fixed-income securities. During periods of rising interest rates, a reduction in prepayments may increase the effective life of mortgage-related securities, subjecting them to greater risk of decline in market value in response to rising interest rates. If the life of a mortgage-related security is inaccurately predicted, the Fund may not be able to realize the rate of return it expected.
Derivatives Risk: Derivatives may be illiquid, difficult to price, and leveraged so that small changes may produce disproportionate losses for the Fund, and may be subject to counterparty risk to a greater degree than more traditional investments.
Leverage Risk: When the Fund borrows money or otherwise leverages its portfolio, it may be more volatile because leverage tends to exaggerate the effect of any increase or decrease in the value of the Fund’s investments. The Fund may create leverage through the use of reverse repurchase agreements, forward commitments, or by borrowing money.
Management Risk: The Fund is subject to management risk because it is an actively managed investment fund. The Adviser will apply its investment techniques and risk analyses in making investment decisions for the Fund, but there is no guarantee that its techniques will produce the intended results.
These risks are fully discussed in the Fund’s prospectus. As with all investments, you may lose money by investing in the Fund.
(Disclosures, Risks and Note about Historical Performance continued on next page)
| | | | |
| AB GLOBAL REAL ESTATE INVESTMENT FUND • | | | 5 | |
Disclosures and Risks
DISCLOSURES AND RISKS
(continued from previous page)
An Important Note About Historical Performance
The investment return and principal value of an investment in the Fund will fluctuate, so that shares, when redeemed, may be worth more or less than their original cost. Performance shown on the following pages represents past performance and does not guarantee future results. Current performance may be lower or higher than the performance information shown. You may obtain performance information current to the most recent month-end by visiting www.abfunds.com.
All fees and expenses related to the operation of the Fund have been deducted. Net asset value (“NAV”) returns do not reflect sales charges; if sales charges were reflected, the Fund’s quoted performance would be lower. SEC returns reflect the applicable sales charges for each share class: a 4.25% maximum front-end sales charge for Class A shares; the applicable contingent deferred sales charge for Class B shares (4% year 1, 3% year 2, 2% year 3, 1% year 4); a 1%, 1-year contingent deferred sales charge for Class C shares. Returns for the different share classes will vary due to different expenses associated with each class. Performance assumes reinvestment of distributions and does not account for taxes.
| | |
| 6 | | • AB GLOBAL REAL ESTATE INVESTMENT FUND |
Disclosures and Risks
HISTORICAL PERFORMANCE
| | | | | | | | | | | | |
| | | | | | | | | | | | |
THE FUND VS. ITS BENCHMARK
PERIODS ENDED NOVEMBER 30, 2016 (unaudited) | | NAV Returns | | | | |
| | 6 Months | | | 12 Months | | | | |
| AB Global Real Estate Investment Fund | | | | | | | | | | | | |
Class A | | | -3.44% | | | | 1.13% | | | | | |
| |
Class B* | | | -3.76% | | | | 0.36% | | | | | |
| |
Class C | | | -3.71% | | | | 0.38% | | | | | |
| |
Advisor Class† | | | -3.27% | | | | 1.42% | | | | | |
| |
Class R† | | | -3.57% | | | | 0.76% | | | | | |
| |
Class K† | | | -3.40% | | | | 1.13% | | | | | |
| |
Class I† | | | -3.23% | | | | 1.47% | | | | | |
| |
Primary Benchmark: FTSE EPRA/NAREIT Developed RE Index (net) | | | -3.76% | | | | 1.95% | | | | | |
| |
| FTSE EPRA/NAREIT Developed RE Index (gross) | | | -3.37% | | | | 2.83% | | | | | |
| |
| MSCI World Index | | | 3.15% | | | | 3.15% | | | | | |
| |
| S&P 500 Index | | | 6.01% | | | | 8.06% | | | | | |
| |
Performance returns for the FTSE EPRA/NAREIT Developed RE Index are shown both net and gross of withholding taxes on dividends. More specifically, net performance returns are calculated applying dividend withholding tax rates applicable to non-resident persons who do not benefit from double taxation treaties; gross performance returns do not take into account such dividend withholding taxes. * Effective January 31, 2009, Class B shares are no longer available for purchase to new investors. Please see Note A for additional information. † Please note that these share classes are for investors purchasing shares through accounts established under certain fee-based programs sponsored and maintained by certain broker-dealers and financial intermediaries, institutional pension plans and/or investment advisory clients of, and certain other persons associated with, the Adviser and its affiliates or the Fund. | |
| | | | | | | | | | | | |
See Disclosures, Risks and Note about Historical Performance on pages 4-6.
(Historical Performance continued on next page)
| | | | |
| AB GLOBAL REAL ESTATE INVESTMENT FUND • | | | 7 | |
Historical Performance
HISTORICAL PERFORMANCE
(continued from previous page)
GROWTH OF A $10,000 INVESTMENT IN THE FUND 11/30/06 TO 11/30/16 (unaudited)
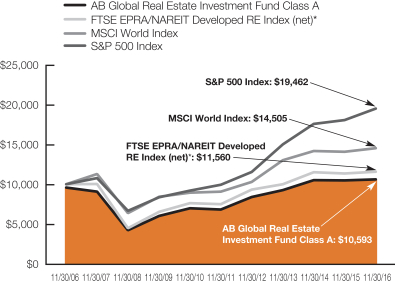
This chart illustrates the total value of an assumed $10,000 investment in AB Global Real Estate Investment Fund Class A shares (from 11/30/06 to 11/30/16) as compared to the performance of the Fund’s primary benchmark, the FTSE EPRA/NAREIT Developed RE Index, as well as the MSCI World Index and the S&P 500 Index. The chart reflects the deduction of the maximum 4.25% sales charge from the initial $10,000 investment in the Fund and assumes the reinvestment of dividends and capital gains distributions.
| * | | The FTSE EPRA/NAREIT Developed RE Index (net) benchmark performance represents the time blend of FTSE EPRA/NAREIT Developed RE Index (gross) from inception to 2/28/2005 and the FTSE EPRA/NAREIT Developed RE Index (net) from 3/1/2005 to present. |
See Disclosures, Risks and Note about Historical Performance on pages 4-6.
(Historical Performance continued on next page)
| | |
| 8 | | • AB GLOBAL REAL ESTATE INVESTMENT FUND |
Historical Performance
HISTORICAL PERFORMANCE
(continued from previous page)
| | | | | | | | |
| AVERAGE ANNUAL RETURNS AS OF NOVEMBER 30, 2016 (unaudited) | |
| | | NAV Returns | | | SEC Returns
(reflects applicable
sales charges) | |
| | | | | | | | |
| Class A Shares | | | | | | | | |
1 Year | | | 1.13 | % | | | -3.17 | % |
5 Years | | | 9.17 | % | | | 8.23 | % |
10 Years | | | 1.01 | % | | | 0.58 | % |
| | | | | | | | |
| Class B Shares | | | | | | | | |
1 Year | | | 0.36 | % | | | -3.55 | % |
5 Years | | | 8.33 | % | | | 8.33 | % |
10 Years(a) | | | 0.36 | % | | | 0.36 | % |
| | | | | | | | |
| Class C Shares | | | | | | | | |
1 Year | | | 0.38 | % | | | -0.59 | % |
5 Years | | | 8.39 | % | | | 8.39 | % |
10 Years | | | 0.29 | % | | | 0.29 | % |
| | | | | | | | |
| Advisor Class Shares* | | | | | | | | |
1 Year | | | 1.42 | % | | | 1.42 | % |
5 Years | | | 9.48 | % | | | 9.48 | % |
10 Years | | | 1.34 | % | | | 1.34 | % |
| | | | | | | | |
| Class R Shares* | | | | | | | | |
1 Year | | | 0.76 | % | | | 0.76 | % |
5 Years | | | 8.86 | % | | | 8.86 | % |
10 Years | | | 0.77 | % | | | 0.77 | % |
| | | | | | | | |
| Class K Shares* | | | | | | | | |
1 Year | | | 1.13 | % | | | 1.13 | % |
5 Years | | | 9.20 | % | | | 9.20 | % |
10 Years | | | 1.09 | % | | | 1.09 | % |
| | | | | | | | |
| Class I Shares* | | | | | | | | |
1 Year | | | 1.47 | % | | | 1.47 | % |
5 Years | | | 9.57 | % | | | 9.57 | % |
10 Years | | | 1.43 | % | | | 1.43 | % |
The Fund’s current prospectus fee table shows the Fund’s total annual operating expense ratios as 1.29%, 2.09%, 2.05%, 1.04%, 1.62%, 1.30% and 0.99% for Class A, Class B, Class C, Advisor Class, Class R, Class K and Class I shares, respectively. The Financial Highlights section of this report sets forth expense ratio data for the current reporting period; the expense ratios shown above may differ from the expense ratios in the Financial Highlights section since they are based on different time periods.
| (a) | | Assumes conversion of Class B shares into Class A shares after eight years. |
| * | | These share classes are offered at NAV to eligible investors and their SEC returns are the same as their NAV returns. Please note that these share classes are for investors purchasing shares through accounts established under certain fee-based programs sponsored and maintained by certain broker-dealers and financial intermediaries, institutional pension plans and/or investment advisory clients of, and certain other persons associated with, the Adviser and its affiliates or the Fund. |
See Disclosures, Risks and Note about Historical Performance on pages 4-6.
(Historical Performance continued on next page)
| | | | |
| AB GLOBAL REAL ESTATE INVESTMENT FUND • | | | 9 | |
Historical Performance
HISTORICAL PERFORMANCE
(continued from previous page)
| | | | |
SEC AVERAGE ANNUAL RETURNS AS OF THE MOST RECENT CALENDAR QUARTER-END DECEMBER 31, 2016 (unaudited) | |
| | | SEC Returns
(reflects applicable
sales charges) | |
| | | | |
| Class A Shares | | | | |
1 Year | | | -1.52 | % |
5 Years | | | 8.79 | % |
10 Years | | | 0.94 | % |
| | | | |
| Class B Shares | | | | |
1 Year | | | -1.91 | % |
5 Years | | | 8.90 | % |
10 Years(a) | | | 0.73 | % |
| | | | |
| Class C Shares | | | | |
1 Year | | | 1.04 | % |
5 Years | | | 8.94 | % |
10 Years | | | 0.64 | % |
| | | | |
| Advisor Class Shares* | | | | |
1 Year | | | 3.14 | % |
5 Years | | | 10.06 | % |
10 Years | | | 1.67 | % |
| | | | |
| Class R Shares* | | | | |
1 Year | | | 2.54 | % |
5 Years | | | 9.44 | % |
10 Years | | | 1.14 | % |
| | | | |
| Class K Shares* | | | | |
1 Year | | | 2.83 | % |
5 Years | | | 9.79 | % |
10 Years | | | 1.46 | % |
| | | | |
| Class I Shares* | | | | |
1 Year | | | 3.20 | % |
5 Years | | | 10.15 | % |
10 Years | | | 1.80 | % |
| (a) | | Assumes conversion of Class B shares into Class A shares after eight years. |
| * | | Please note that these share classes are for investors purchasing shares through accounts established under certain fee-based programs sponsored and maintained by certain broker dealers and financial intermediaries, institutional pension plans and/or investment advisory clients of, and certain other persons associated with, the Adviser and its affiliates or the Fund. |
See Disclosures, Risks and Note about Historical Performance on pages 4-6.
| | |
| 10 | | • AB GLOBAL REAL ESTATE INVESTMENT FUND |
Historical Performance
EXPENSE EXAMPLE
(unaudited)
As a shareholder of the Fund, you incur two types of costs: (1) transaction costs, including sales charges (loads) on purchase payments, contingent deferred sales charges on redemptions and (2) ongoing costs, including management fees; distribution (12b-1) fees; and other Fund expenses. This example is intended to help you understand your ongoing costs (in dollars) of investing in the Fund and to compare these costs with the ongoing costs of investing in other mutual funds.
The Example is based on an investment of $1,000 invested at the beginning of the period and held for the entire period as indicated below.
Actual Expenses
The table below provides information about actual account values and actual expenses. You may use the information, together with the amount you invested, to estimate the expenses that you paid over the period. Simply divide your account value by $1,000 (for example, an $8,600 account value divided by $1,000 = 8.6), then multiply the result by the number under the heading entitled “Expenses Paid During Period” to estimate the expenses you paid on your account during this period.
Hypothetical Example for Comparison Purposes
The table below also provides information about hypothetical account values and hypothetical expenses based on the Fund’s actual expense ratio and an assumed annual rate of return of 5% before expenses, which is not the Fund’s actual return. The hypothetical account values and expenses may not be used to estimate the actual ending account balance or expenses you paid for the period. You may use this information to compare the ongoing costs of investing in the Fund and other funds by comparing this 5% hypothetical example with the 5% hypothetical examples that appear in the shareholder reports of other funds.
Please note that the expenses shown in the table are meant to highlight your ongoing costs only and do not reflect any transactional costs, such as sales charges (loads), or contingent deferred sales charges on redemptions. Therefore, the hypothetical example is useful in comparing ongoing costs only, and will not help you determine the relative total costs of owning different funds. In addition, if these transactional costs were included, your costs would have been higher.
| | | | | | | | | | | | | | | | |
| | | Beginning
Account Value
June 1, 2016 | | | Ending
Account Value
November 30, 2016 | | | Expenses Paid
During Period* | | | Annualized
Expense Ratio* | |
| Class A | | | | | | | | | | | | | | | | |
Actual | | $ | 1,000 | | | $ | 965.60 | | | $ | 6.34 | | | | 1.29 | % |
Hypothetical** | | $ | 1,000 | | | $ | 1,018.55 | | | $ | 6.51 | | | | 1.29 | % |
| Class B | | | | | | | | | | | | | | | | |
Actual | | $ | 1,000 | | | $ | 962.40 | | | $ | 10.16 | | | | 2.07 | % |
Hypothetical** | | $ | 1,000 | | | $ | 1,014.65 | | | $ | 10.43 | | | | 2.07 | % |
| Class C | | | | | | | | | | | | | | | | |
Actual | | $ | 1,000 | | | $ | 962.90 | | | $ | 10.06 | | | | 2.05 | % |
Hypothetical** | | $ | 1,000 | | | $ | 1,014.75 | | | $ | 10.33 | | | | 2.05 | % |
| Advisor Class | | | | | | | | | | | | | | | | |
Actual | | $ | 1,000 | | | $ | 967.30 | | | $ | 5.07 | | | | 1.03 | % |
Hypothetical** | | $ | 1,000 | | | $ | 1,019.85 | | | $ | 5.20 | | | | 1.03 | % |
| Class R | | | | | | | | | | | | | | | | |
Actual | | $ | 1,000 | | | $ | 964.30 | | | $ | 8.05 | | | | 1.64 | % |
Hypothetical** | | $ | 1,000 | | | $ | 1,016.80 | | | $ | 8.27 | | | | 1.64 | % |
| Class K | | | | | | | | | | | | | | | | |
Actual | | $ | 1,000 | | | $ | 966.00 | | | $ | 6.54 | | | | 1.33 | % |
Hypothetical** | | $ | 1,000 | | | $ | 1,018.35 | | | $ | 6.71 | | | | 1.33 | % |
| Class I | | | | | | | | | | | | | | | | |
Actual | | $ | 1,000 | | | $ | 967.70 | | | $ | 4.72 | | | | 0.96 | % |
Hypothetical** | | $ | 1,000 | | | $ | 1,020.20 | | | $ | 4.85 | | | | 0.96 | % |
| * | | Expenses are equal to the classes’ annualized expense ratios multiplied by the average account value over the period, multiplied by 183/366 (to reflect the one-half year period). |
| ** | | Assumes 5% annual return before expenses. |
| | | | |
| AB GLOBAL REAL ESTATE INVESTMENT FUND • | | | 11 | |
Expense Example
PORTFOLIO SUMMARY
November 30, 2016 (unaudited)
PORTFOLIO STATISTICS
Net Assets ($mil): $153.2

| * | | All data are as of November 30, 2016. The Fund’s industry breakdown is expressed as a percentage of total investments (excluding security lending collateral) and may vary over time. The Fund also enters into derivative transactions, which may be used for hedging or investment purposes (see “Portfolio of Investments” section of the report for additional details). “Other” industry type weightings represent 0.6% or less in the following industries: Funds and Investment Trusts, Hotels, Resorts & Cruise Lines, Mortgage REITs, Property & Casualty Insurance, Railroads and Real Estate Services. |
Please note: The industry classifications presented herein are based on industry categorization methodology of the Adviser. These industry classifications are broadly defined. The “Portfolio of Investments” section of the report reflects more specific sector information and is consistent with the investment restrictions discussed in the Fund’s prospectus.
| | |
| 12 | | • AB GLOBAL REAL ESTATE INVESTMENT FUND |
Portfolio Summary
PORTFOLIO SUMMARY
November 30, 2016 (unaudited)
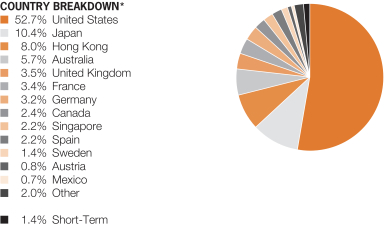
| * | | All data are as of November 30, 2016. The Fund’s country breakdown is expressed as a percentage of total investments (excluding security lending collateral) and may vary over time. The Fund also enters into derivative transactions, which may be used for hedging or investment purposes (see “Portfolio of Investments” section of the report for additional details). “Other” country weightings represent 0.6% or less in the following countries: Chile, China, Italy, New Zealand and Turkey. |
| | | | |
| AB GLOBAL REAL ESTATE INVESTMENT FUND • | | | 13 | |
Portfolio Summary
TEN LARGEST HOLDINGS*
November 30, 2016 (unaudited)
| | | | | | | | |
| Company | | U.S. $ Value | | | Percent of
Net Assets | |
Simon Property Group, Inc. | | $ | 8,608,469 | | | | 5.6 | % |
Link REIT | | | 4,135,065 | | | | 2.7 | |
Cheung Kong Property Holdings Ltd. | | | 3,811,427 | | | | 2.5 | |
Mitsui Fudosan Co., Ltd. | | | 3,745,747 | | | | 2.5 | |
Boston Properties, Inc. | | | 3,575,177 | | | | 2.3 | |
AvalonBay Communities, Inc. | | | 3,451,000 | | | | 2.3 | |
Ventas, Inc. | | | 3,125,526 | | | | 2.0 | |
Extra Space Storage, Inc. | | | 2,877,963 | | | | 1.9 | |
National Retail Properties, Inc. | | | 2,718,289 | | | | 1.8 | |
Federal Realty Investment Trust | | | 2,666,576 | | | | 1.7 | |
| | $ | 38,715,239 | | | | 25.3 | % |
| | |
| 14 | | • AB GLOBAL REAL ESTATE INVESTMENT FUND |
Ten Largest Holdings
PORTFOLIO OF INVESTMENTS
November 30, 2016
| | | | | | | | | | |
| Company | | | | Shares | | | U.S. $ Value | |
| |
| | | | | | | | | | |
COMMON STOCKS – 98.7% | | | | | | | | | | |
Real Estate – 94.6% | | | | | | | | | | |
Diversified Real Estate Activities – 7.6% | | | | | | | | | | |
LendLease Group | | | | | 160,430 | | | $ | 1,608,298 | |
Mitsubishi Estate Co., Ltd. | | | | | 38,000 | | | | 777,583 | |
Mitsui Fudosan Co., Ltd. | | | | | 156,000 | | | | 3,745,747 | |
Sumitomo Realty & Development Co., Ltd. | | | | | 83,000 | | | | 2,337,118 | |
UOL Group Ltd. | | | | | 341,548 | | | | 1,399,653 | |
Wharf Holdings Ltd. (The) | | | | | 243,000 | | | | 1,798,517 | |
| | | | | | | | | | |
| | | | | | | | | 11,666,916 | |
| | | | | | | | | | |
Diversified REITs – 13.4% | | | | | | | | | | |
Armada Hoffler Properties, Inc. | | | | | 97,410 | | | | 1,368,611 | |
Empire State Realty Trust, Inc. – Class A | | | | | 101,820 | | | | 2,053,709 | |
Gecina SA | | | | | 7,470 | | | | 979,552 | |
GPT Group (The) | | | | | 420,250 | | | | 1,499,303 | |
Gramercy Property Trust | | | | | 221,314 | | | | 1,934,284 | |
H&R Real Estate Investment Trust | | | | | 59,020 | | | | 958,257 | |
Hankyu REIT, Inc. | | | | | 355 | | | | 463,182 | |
Hulic REIT, Inc. | | | | | 656 | | | | 1,067,882 | |
ICADE | | | | | 16,430 | | | | 1,133,966 | |
Kenedix Office Investment Corp. – Class A | | | | | 179 | | | | 955,942 | |
Liberty Property Trust | | | | | 45,220 | | | | 1,781,668 | |
Merlin Properties Socimi SA | | | | | 161,545 | | | | 1,628,064 | |
Premier Investment Corp. | | | | | 770 | | | | 912,126 | |
Spirit Realty Capital, Inc. | | | | | 167,590 | | | | 1,808,296 | |
STORE Capital Corp. | | | | | 77,820 | | | | 1,923,710 | |
| | | | | | | | | | |
| | | | | | | | | 20,468,552 | |
| | | | | | | | | | |
Health Care REITs – 3.6% | | | | | | | | | | |
Assura PLC | | | | | 547,320 | | | | 392,052 | |
HCP, Inc. | | | | | 20,500 | | | | 605,365 | |
LTC Properties, Inc. | | | | | 20,030 | | | | 910,564 | |
Ventas, Inc. | | | | | 51,730 | | | | 3,125,526 | |
Welltower, Inc. | | | | | 8,550 | | | | 536,769 | |
| | | | | | | | | | |
| | | | | | | | | 5,570,276 | |
| | | | | | | | | | |
Hotel & Resort REITs – 1.6% | | | | | | | | | | |
DiamondRock Hospitality Co. | | | | | 129,400 | | | | 1,370,346 | |
Summit Hotel Properties, Inc. | | | | | 70,210 | | | | 998,386 | |
| | | | | | | | | | |
| | | | | | | | | 2,368,732 | |
| | | | | | | | | | |
Industrial REITs – 6.2% | | | | | | | | | | |
DCT Industrial Trust, Inc. | | | | | 38,310 | | | | 1,760,345 | |
Goodman Group | | | | | 324,080 | | | | 1,595,439 | |
LaSalle Logiport REIT | | | | | 779 | | | | 755,028 | |
Monmouth Real Estate Investment Corp. – Class A | | | | | 83,310 | | | | 1,169,672 | |
Pure Industrial Real Estate Trust | | | | | 211,780 | | | | 838,733 | |
| | | | |
| AB GLOBAL REAL ESTATE INVESTMENT FUND • | | | 15 | |
Portfolio of Investments
| | | | | | | | | | |
| | | |
| Company | | | | Shares | | | U.S. $ Value | |
| |
| | | | | | | | | | |
Rexford Industrial Realty, Inc. | | | | | 96,280 | | | $ | 2,126,825 | |
Segro PLC | | | | | 229,360 | | | | 1,200,010 | |
| | | | | | | | | | |
| | | | | | | | | 9,446,052 | |
| | | | | | | | | | |
Office REITs – 12.9% | | | | | | | | | | |
Alexandria Real Estate Equities, Inc. | | | | | 19,140 | | | | 2,097,553 | |
Allied Properties Real Estate Investment Trust | | | | | 39,482 | | | | 996,088 | |
alstria office REIT-AG(a) | | | | | 159,004 | | | | 1,943,780 | |
Axiare Patrimonio SOCIMI SA | | | | | 64,810 | | | | 899,037 | |
Boston Properties, Inc. | | | | | 28,860 | | | | 3,575,177 | |
Brandywine Realty Trust | | | | | 144,330 | | | | 2,215,465 | |
CapitaLand Commercial Trust | | | | | 1,425,400 | | | | 1,511,696 | |
Concentradora Hipotecaria SAPI de CV | | | | | 552,880 | | | | 656,169 | |
Equity Commonwealth(a) | | | | | 39,310 | | | | 1,143,135 | |
Highwoods Properties, Inc. | | | | | 34,750 | | | | 1,670,085 | |
Investa Office Fund | | | | | 310,621 | | | | 1,010,350 | |
MCUBS MidCity Investment Corp. | | | | | 232 | | | | 695,854 | |
Workspace Group PLC | | | | | 161,450 | | | | 1,383,086 | |
| | | | | | | | | | |
| | | | | | | | | 19,797,475 | |
| | | | | | | | | | |
Real Estate Development – 3.3% | | | | | | | | | | |
Cheung Kong Property Holdings Ltd. | | | | | 558,000 | | | | 3,811,427 | |
Kaisa Group Holdings Ltd.(a)(b)(c) | | | | | 1,770,000 | | | | 321,619 | |
Sino Land Co., Ltd. | | | | | 630,000 | | | | 988,367 | |
| | | | | | | | | | |
| | | | | | | | | 5,121,413 | |
| | | | | | | | | | |
Real Estate Operating Companies – 6.9% | | | | | | | | | | |
CA Immobilien Anlagen AG(a) | | | | | 71,621 | | | | 1,304,973 | |
Fabege AB | | | | | 84,620 | | | | 1,337,873 | |
Hongkong Land Holdings Ltd. | | | | | 255,700 | | | | 1,633,691 | |
Inmobiliaria Colonial SA | | | | | 116,623 | | | | 781,341 | |
Kungsleden AB | | | | | 132,940 | | | | 813,662 | |
Parque Arauco SA | | | | | 233,762 | | | | 541,184 | |
TLG Immobilien AG | | | | | 24,888 | | | | 448,200 | |
UNITE Group PLC (The) | | | | | 171,591 | | | | 1,200,208 | |
Vonovia SE | | | | | 77,716 | | | | 2,505,406 | |
| | | | | | | | | | |
| | | | | | | | | 10,566,538 | |
| | | | | | | | | | |
Real Estate Services – 0.6% | | | | | | | | | | |
CBRE Group, Inc. – Class A(a) | | | | | 32,060 | | | | 931,022 | |
| | | | | | | | | | |
| | | |
Residential REITs – 11.5% | | | | | | | | | | |
Apartment Investment & Management Co. – Class A | | | | | 40,030 | | | | 1,685,263 | |
AvalonBay Communities, Inc. | | | | | 20,980 | | | | 3,451,000 | |
Colony Starwood Homes | | | | | 56,960 | | | | 1,740,128 | |
Education Realty Trust, Inc. | | | | | 50,320 | | | | 2,042,992 | |
Emlak Konut Gayrimenkul Yatirim Ortakligi AS | | | | | 674,650 | | | | 566,498 | |
| | |
| 16 | | • AB GLOBAL REAL ESTATE INVESTMENT FUND |
Portfolio of Investments
| | | | | | | | | | |
| | | |
| Company | | | | Shares | | | U.S. $ Value | |
| |
| | | | | | | | | | |
Independence Realty Trust, Inc. | | | | | 140,160 | | | $ | 1,198,368 | |
Japan Rental Housing Investments, Inc. | | | | | 1,219 | | | | 875,491 | |
Kenedix Residential Investment Corp. | | | | | 297 | | | | 779,902 | |
Killam Apartment Real Estate Investment Trust | | | | | 96,410 | | | | 863,405 | |
Mid-America Apartment Communities, Inc. | | | | | 19,180 | | | | 1,757,464 | |
Milestone Apartments Real Estate Investment Trust | | | | | 47,971 | | | | 648,160 | |
Sun Communities, Inc. | | | | | 27,883 | | | | 2,012,316 | |
| | | | | | | | | | |
| | | | | | | | | 17,620,987 | |
| | | | | | | | | | |
Retail REITs – 21.6% | | | | | | | | | | |
Brixmor Property Group, Inc. | | | | | 81,980 | | | | 1,996,213 | |
Federal Realty Investment Trust | | | | | 18,990 | | | | 2,666,576 | |
Fibra Shop Portafolios Inmobiliarios SAPI de CV | | | | | 703,774 | | | | 444,647 | |
Frontier Real Estate Investment Corp. | | | | | 194 | | | | 864,883 | |
Fukuoka REIT Corp. | | | | | 520 | | | | 831,340 | |
Kite Realty Group Trust | | | | | 39,148 | | | | 941,509 | |
Klepierre | | | | | 48,923 | | | | 1,820,031 | |
Link REIT | | | | | 601,261 | | | | 4,135,065 | |
Mapletree Commercial Trust | | | | | 533,100 | | | | 537,433 | |
Mercialys SA | | | | | 63,490 | | | | 1,238,383 | |
National Retail Properties, Inc. | | | | | 63,690 | | | | 2,718,289 | |
Ramco-Gershenson Properties Trust | | | | | 93,589 | | | | 1,588,205 | |
Retail Opportunity Investments Corp. | | | | | 48,375 | | | | 998,460 | |
Scentre Group | | | | | 490,483 | | | | 1,534,047 | |
Simon Property Group, Inc. | | | | | 47,918 | | | | 8,608,469 | |
Taubman Centers, Inc. | | | | | 29,920 | | | | 2,174,287 | |
| | | | | | | | | | |
| | | | | | | | | 33,097,837 | |
| | | | | | | | | | |
Specialized REITs – 5.4% | | | | | | | | | | |
Big Yellow Group PLC | | | | | 108,630 | | | | 903,587 | |
Equinix, Inc. | | | | | 3,160 | | | | 1,070,482 | |
Extra Space Storage, Inc. | | | | | 41,020 | | | | 2,877,963 | |
Four Corners Property Trust, Inc. | | | | | 46,690 | | | | 895,514 | |
National Storage Affiliates Trust | | | | | 122,210 | | | | 2,515,082 | |
| | | | | | | | | | |
| | | | | | | | | 8,262,628 | |
| | | | | | | | | | |
| | | | | | | | | 144,918,428 | |
| | | | | | | | | | |
Transportation – 1.6% | | | | | | | | | | |
Highways & Railtracks – 1.0% | | | | | | | | | | |
Transurban Group | | | | | 198,910 | | | | 1,545,099 | |
| | | | | | | | | | |
| | | |
Railroads – 0.6% | | | | | | | | | | |
East Japan Railway Co. | | | | | 10,000 | | | | 862,546 | |
| | | | | | | | | | |
| | | | | | | | | 2,407,645 | |
| | | | | | | | | | |
Materials – 1.0% | | | | | | | | | | |
Construction Materials – 1.0% | | | | | | | | | | |
Buzzi Unicem SpA | | | | | 41,190 | | | | 875,581 | |
Fletcher Building Ltd. | | | | | 99,650 | | | | 724,963 | |
| | | | | | | | | | |
| | | | | | | | | 1,600,544 | |
| | | | | | | | | | |
| | | | |
| AB GLOBAL REAL ESTATE INVESTMENT FUND • | | | 17 | |
Portfolio of Investments
| | | | | | | | | | |
| | | |
| Company | | | | Shares | | | U.S. $ Value | |
| |
| | | | | | | | | | |
Diversified Financials – 0.5% | | | | | | | | | | |
Mortgage REITs – 0.5% | | | | | | | | | | |
Blackstone Mortgage Trust, Inc. – Class A | | | | | 25,970 | | | $ | 781,177 | |
| | | | | | | | | | |
| | | |
Insurance – 0.5% | | | | | | | | | | |
Property & Casualty Insurance – 0.5% | | | | | | | | | | |
First American Financial Corp. | | | | | 20,200 | | | | 762,348 | |
| | | | | | | | | | |
| | | |
Consumer Services – 0.5% | | | | | | | | | | |
Hotels, Resorts & Cruise Lines – 0.5% | | | | | | | | | | |
Wyndham Worldwide Corp. | | | | | 10,290 | | | | 740,777 | |
| | | | | | | | | | |
| | | |
Total Common Stocks
(cost $143,549,414) | | | | | | | | | 151,210,919 | |
| | | | | | | | | | |
| | | | | | | | | | |
INVESTMENT COMPANIES – 0.1% | | | | | | | | | | |
Funds and Investment Trusts – 0.1% | | | | | | | | | | |
Kennedy Wilson Europe Real Estate PLC
(cost $299,158) | | | | | 20,961 | | | | 257,237 | |
| | | | | | | | | | |
| | | | | | | | | | |
SHORT-TERM INVESTMENTS – 1.4% | | | | | | | | | | |
Investment Companies – 1.2% | | | | | | | | | | |
AB Fixed Income Shares, Inc. – Government Money Market Portfolio – Class AB,
0.30%(d)(e)
(cost $1,856,643) | | | | | 1,856,643 | | | | 1,856,643 | |
| | | | | | | | | | |
| | | |
| | | | | Principal
Amount
(000) | | | | |
Time Deposits – 0.2% | | | | | | | | | | |
ANZ, London
0.05%, 12/01/16 | | GBP | | | 31 | | | | 38,175 | |
Bank of Montreal, London
0.05%, 12/01/16 | | CAD | | | 68 | | | | 50,402 | |
BBH, Grand Cayman
(1.45)%, 12/01/16 | | CHF | | | 3 | | | | 2,540 | |
(0.978)%, 12/01/16 | | SEK | | | 117 | | | | 12,633 | |
(0.574)%, 12/01/16 | | EUR | | | 16 | | | | 16,714 | |
0.01%, 12/01/16 | | SGD | | | 24 | | | | 17,021 | |
0.05%, 12/01/16 | | NOK | | | 102 | | | | 12,020 | |
0.495%, 12/01/16 | | AUD | | | 26 | | | | 19,372 | |
0.95%, 12/01/16 | | NZD | | | 20 | | | | 13,935 | |
BNP Paribas, Paris
0.005%, 12/01/16 | | HKD | | | 237 | | | | 30,602 | |
| | |
| 18 | | • AB GLOBAL REAL ESTATE INVESTMENT FUND |
Portfolio of Investments
| | | | | | | | | | |
| | | |
| | | | | Principal Amount (000) | | | U.S. $ Value | |
| |
| | | | | | | | | | |
Sumitomo, Tokyo
(0.36)%, 12/01/16 | | JPY | | | 7,430 | | | $ | 64,947 | |
| | | | | | | | | | |
| | | |
Total Time Deposits
(cost $285,008) | | | | | | | | | 278,361 | |
| | | | | | | | | | |
| | | |
Total Short-Term Investments
(cost $2,141,651) | | | | | | | | | 2,135,004 | |
| | | | | | | | | | |
| | | |
Total Investments – 100.2%
(cost $145,990,223) | | | | | | | | | 153,603,160 | |
Other assets less liabilities – (0.2)% | | | | | | | | | (353,422 | ) |
| | | | | | | | | | |
| | | |
Net Assets – 100.0% | | | | | | | | $ | 153,249,738 | |
| | | | | | | | | | |
| | | | | | | | | | | | | | | | | | | | |
FORWARD CURRENCY EXCHANGE CONTRACTS (see Note D) | |
| Counterparty | | Contracts to
Deliver
(000) | | | In Exchange
For
(000) | | | Settlement
Date | | | Unrealized
Appreciation/
(Depreciation) | |
Barclays Bank PLC | | AUD | | | 1,433 | | | USD | | | 1,087 | | | | 12/15/16 | | | $ | 28,690 | |
Barclays Bank PLC | | CNY | | | 8,012 | | | USD | | | 1,192 | | | | 12/15/16 | | | | 32,127 | |
Barclays Bank PLC | | MXN | | | 26,087 | | | USD | | | 1,408 | | | | 12/15/16 | | | | 141,810 | |
Barclays Bank PLC | | SEK | | | 9,741 | | | USD | | | 1,062 | | | | 3/16/17 | | | | (323 | ) |
BNP Paribas SA | | SEK | | | 8,629 | | | USD | | | 955 | | | | 12/15/16 | | | | 18,964 | |
Brown Brothers Harriman & Co. | | CAD | | | 422 | | | USD | | | 319 | | | | 12/15/16 | | | | 4,446 | |
Brown Brothers Harriman & Co. | | USD | | | 713 | | | CAD | | | 956 | | | | 12/15/16 | | | | (1,358 | ) |
Brown Brothers Harriman & Co. | | USD | | | 1,607 | | | EUR | | | 1,454 | | | | 12/15/16 | | | | (65,041 | ) |
Brown Brothers Harriman & Co. | | USD | | | 446 | | | MXN | | | 8,465 | | | | 12/15/16 | | | | (35,230 | ) |
Brown Brothers Harriman & Co. | | CAD | | | 2,528 | | | USD | | | 1,887 | | | | 3/16/17 | | | | 2,979 | |
Brown Brothers
Harriman & Co. | | EUR | | | 1,454 | | | USD | | | 1,614 | | | | 3/16/17 | | | | 64,771 | |
Brown Brothers
Harriman & Co. | | NZD | | | 886 | | | USD | | | 628 | | | | 3/16/17 | | | | 2,380 | |
Brown Brothers
Harriman & Co. | | USD | | | 625 | | | AUD | | | 839 | | | | 3/16/17 | | | | (6,757 | ) |
Brown Brothers
Harriman & Co. | | USD | | | 392 | | | GBP | | | 314 | | | | 3/16/17 | | | | 2,181 | |
Citibank, NA | | AUD | | | 791 | | | USD | | | 608 | | | | 12/15/16 | | | | 24,177 | |
Citibank, NA | | CAD | | | 2,030 | | | USD | | | 1,572 | | | | 12/15/16 | | | | 60,782 | |
Citibank, NA | | CHF | | | 668 | | | USD | | | 684 | | | | 12/15/16 | | | | 26,774 | |
Citibank, NA | | EUR | | | 1,454 | | | USD | | | 1,645 | | | | 12/15/16 | | | | 103,010 | |
Citibank, NA | | USD | | | 1,143 | | | CAD | | | 1,496 | | | | 12/15/16 | | | | (29,626 | ) |
Citibank, NA | | USD | | | 2,579 | | | JPY | | | 265,354 | | | | 12/15/16 | | | | (257,573 | ) |
Citibank, NA | | USD | | | 1,033 | | | SEK | | | 8,629 | | | | 12/15/16 | | | | (97,103 | ) |
Credit Suisse International | | JPY | | | 245,388 | | | USD | | | 2,222 | | | | 3/16/17 | | | | 65,793 | |
| | | | |
| AB GLOBAL REAL ESTATE INVESTMENT FUND • | | | 19 | |
Portfolio of Investments
| | | | | | | | | | | | | | | | | | | | |
| Counterparty | | Contracts to
Deliver
(000) | | | In Exchange
For
(000) | | | Settlement
Date | | | Unrealized
Appreciation/
(Depreciation) | |
Goldman Sachs Bank USA | | USD | | | 1,114 | | | EUR | | | 1,044 | | | | 3/16/17 | | | $ | (2,043 | ) |
Goldman Sachs Bank USA | | USD | | | 1,646 | | | NOK | | | 13,565 | | | | 3/16/17 | | | | (51,291 | ) |
JPMorgan Chase Bank NA | | USD | | | 682 | | | CHF | | | 668 | | | | 12/15/16 | | | | (24,330 | ) |
Morgan Stanley & Co., Inc. | | GBP | | | 433 | | | USD | | | 536 | | | | 12/15/16 | | | | (5,753 | ) |
Royal Bank of Scotland PLC | | USD | | | 1,710 | | | AUD | | | 2,224 | | | | 12/15/16 | | | | (68,664 | ) |
Royal Bank of Scotland PLC | | AUD | | | 3,104 | | | USD | | | 2,355 | | | | 3/16/17 | | | | 68,991 | |
Societe Generale | | USD | | | 943 | | | MXN | | | 17,622 | | | | 12/15/16 | | | | (87,756 | ) |
Societe Generale | | MXN | | | 17,622 | | | USD | | | 934 | | | | 3/16/17 | | | | 88,297 | |
Standard Chartered Bank | | JPY | | | 265,354 | | | USD | | | 2,544 | | | | 12/15/16 | | | | 222,486 | |
Standard Chartered Bank | | USD | | | 1,194 | | | CNY | | | 8,012 | | | | 12/15/16 | | | | (33,726 | ) |
Standard Chartered Bank | | USD | | | 3,461 | | | JPY | | | 359,441 | | | | 3/16/17 | | | | (302,209 | ) |
UBS AG | | USD | | | 537 | | | GBP | | | 433 | | | | 12/15/16 | | | | 5,151 | |
| | | | | | | | | | | | | | | | | | | | |
| | | $ | (104,974 | ) |
| | | | | | | | | | | | | | | | | | | | |
| (a) | | Non-income producing security. |
| (c) | | Fair valued by the Adviser. |
| (d) | | Investment in affiliated money market mutual fund. The rate shown represents the 7-day yield as of period end. |
| (e) | | To obtain a copy of the fund’s financial statements, please go to the Securities and Exchange Commission’s website at www.sec.gov, or call AB at (800) 227-4618. |
Currency Abbreviations:
AUD – Australian Dollar
CAD – Canadian Dollar
CHF – Swiss Franc
CNY – Chinese Yuan Renminbi
EUR – Euro
GBP – Great British Pound
HKD – Hong Kong Dollar
JPY – Japanese Yen
MXN – Mexican Peso
NOK – Norwegian Krone
NZD – New Zealand Dollar
SEK – Swedish Krona
SGD – Singapore Dollar
USD – United States Dollar
Glossary:
REIT – Real Estate Investment Trust
See notes to financial statements.
| | |
| 20 | | • AB GLOBAL REAL ESTATE INVESTMENT FUND |
Portfolio of Investments
STATEMENT OF ASSETS & LIABILITIES
November 30, 2016
| | | | |
| Assets | | | | |
Investments in securities, at value | | | | |
Unaffiliated issuers (cost $144,133,580) | | $ | 151,746,517 | |
Affiliated issuers (cost $1,856,643) | | | 1,856,643 | |
Foreign currencies, at value (cost $82,489) | | | 72,537 | |
Unrealized appreciation on forward currency exchange contracts | | | 963,809 | |
Receivable for investment securities sold | | | 546,287 | |
Receivable for capital stock sold | | | 486,086 | |
Dividends receivable | | | 302,801 | |
Affiliated Dividends receivable | | | 392 | |
| | | | |
Total assets | | | 155,975,072 | |
| | | | |
| Liabilities | | | | |
Unrealized depreciation on forward currency exchange contracts | | | 1,068,783 | |
Payable for investment securities purchased and foreign currency transactions | | | 874,883 | |
Payable for capital stock redeemed | | | 457,089 | |
Advisory fee payable | | | 68,118 | |
Distribution fee payable | | | 37,184 | |
Administrative fee payable | | | 13,698 | |
Transfer Agent fee payable | | | 8,371 | |
Accrued expenses and other liabilities | | | 197,208 | |
| | | | |
Total liabilities | | | 2,725,334 | |
| | | | |
Net Assets | | $ | 153,249,738 | |
| | | | |
| Composition of Net Assets | | | | |
Capital stock, at par | | $ | 11,316 | |
Additional paid-in capital | | | 190,336,378 | |
Distributions in excess of net investment income | | | (94,607 | ) |
Accumulated net realized loss on investment
and foreign currency transactions | | | (44,486,777 | ) |
Net unrealized appreciation on investments
and foreign currency denominated assets and liabilities | | | 7,483,428 | |
| | | | |
| | $ | 153,249,738 | |
| | | | |
Net Asset Value Per Share—21 billion shares of capital stock authorized, $.001 par value
| | | | | | | | | | | | |
| Class | | Net Assets | | | Shares
Outstanding | | | Net Asset
Value | |
| |
| A | | $ | 70,984,166 | | | | 5,214,085 | | | $ | 13.61 | * |
| |
| B | | $ | 785,820 | | | | 58,390 | | | $ | 13.46 | |
| |
| C | | $ | 21,627,291 | | | | 1,607,240 | | | $ | 13.46 | |
| |
| Advisor | | $ | 37,191,243 | | | | 2,757,598 | | | $ | 13.49 | |
| |
| R | | $ | 8,654,218 | | | | 643,216 | | | $ | 13.45 | |
| |
| K | | $ | 9,529,863 | | | | 705,344 | | | $ | 13.51 | |
| |
| I | | $ | 4,477,137 | | | | 330,004 | | | $ | 13.57 | |
| |
| * | | The maximum offering price per share for Class A shares was $14.21, which reflects a sales charge of 4.25%. |
See notes to financial statements.
| | | | |
| AB GLOBAL REAL ESTATE INVESTMENT FUND • | | | 21 | |
Statement of Assets & Liabilities
STATEMENT OF OPERATIONS
Year Ended November 30, 2016
| | | | | | | | |
| Investment Income | | | | | | | | |
Dividends | | | | | | | | |
Unaffiliated issuers (net of foreign taxes withheld of $252,451) | | $ | 5,227,030 | | | | | |
Affiliated issuers | | | 10,244 | | | | | |
Securities lending income | | | 19,361 | | | $ | 5,256,635 | |
| | | | | | | | |
| Expenses | | | | | | | | |
Advisory fee (see Note B) | | | 872,988 | | | | | |
Distribution fee—Class A | | | 189,909 | | | | | |
Distribution fee—Class B | | | 10,045 | | | | | |
Distribution fee—Class C | | | 206,721 | | | | | |
Distribution fee—Class R | | | 46,185 | | | | | |
Distribution fee—Class K | | | 25,610 | | | | | |
Transfer agency—Class A | | | 129,895 | | | | | |
Transfer agency—Class B | | | 2,272 | | | | | |
Transfer agency—Class C | | | 36,640 | | | | | |
Transfer agency—Advisor Class | | | 62,115 | | | | | |
Transfer agency—Class R | | | 22,025 | | | | | |
Transfer agency—Class K | | | 19,195 | | | | | |
Transfer agency—Class I | | | 3,805 | | | | | |
Custodian | | | 118,183 | | | | | |
Registration fees | | | 88,064 | | | | | |
Audit and tax | | | 87,514 | | | | | |
Administrative | | | 54,088 | | | | | |
Legal | | | 41,874 | | | | | |
Printing | | | 36,734 | | | | | |
Directors’ fees | | | 24,606 | | | | | |
Miscellaneous | | | 52,186 | | | | | |
| | | | | | | | |
Total expenses | | | 2,130,654 | | | | | |
Less: expenses waived and reimbursed by the Adviser (see Note B) | | | (2,345 | ) | | | | |
| | | | | | | | |
Net expenses | | | | | | | 2,128,309 | |
| | | | | | | | |
Net investment income | | | | | | | 3,128,326 | |
| | | | | | | | |
| Realized and Unrealized Gain (Loss) on Investment and Foreign Currency Transactions | | | | | | | | |
Net realized gain (loss) on: | | | | | | | | |
Investment transactions | | | | | | | 3,178,961 | |
Foreign currency transactions | | | | | | | 125,957 | |
Net change in unrealized appreciation/depreciation on: | | | | | | | | |
Investments | | | | | | | (4,257,356 | ) |
Foreign currency denominated assets and liabilities | | | | | | | (49,587 | ) |
| | | | | | | | |
Net loss on investment and foreign currency transactions | | | | | | | (1,002,025 | ) |
| | | | | | | | |
Net Increase in Net Assets from Operations | | | | | | $ | 2,126,301 | |
| | | | | | | | |
See notes to financial statements.
| | |
| 22 | | • AB GLOBAL REAL ESTATE INVESTMENT FUND |
Statement of Operations
STATEMENT OF CHANGES IN NET ASSETS
| | | | | | | | |
| | | Year Ended
November 30,
2016 | | | Year Ended
November 30,
2015 | |
| Increase (Decrease) in Net Assets from Operations | | | | | | | | |
Net investment income | | $ | 3,128,326 | | | $ | 2,791,615 | |
Net realized gain on investment and foreign currency transactions | | | 3,304,918 | | | | 11,860,661 | |
Net change in unrealized appreciation/depreciation on investments and foreign currency denominated assets and liabilities | | | (4,306,943 | ) | | | (15,199,160 | ) |
| | | | | | | | |
Net increase (decrease) in net assets from operations | | | 2,126,301 | | | | (546,884 | ) |
| Dividends to Shareholders from | | | | | | | | |
Net investment income | | | | | | | | |
Class A | | | (2,736,971 | ) | | | (4,413,373 | ) |
Class B | | | (29,245 | ) | | | (49,715 | ) |
Class C | | | (598,815 | ) | | | (713,318 | ) |
Advisor Class | | | (1,348,664 | ) | | | (1,770,081 | ) |
Class R | | | (311,548 | ) | | | (407,356 | ) |
Class K | | | (372,094 | ) | | | (503,012 | ) |
Class I | | | (174,461 | ) | | | (131,029 | ) |
| Capital Stock Transactions | | | | | | | | |
Net increase (decrease) | | | 8,002,521 | | | | (31,917,540 | ) |
| | | | | | | | |
Total increase (decrease) | | | 4,557,024 | | | | (40,452,308 | ) |
| Net Assets | | | | | | | | |
Beginning of period | | | 148,692,714 | | | | 189,145,022 | |
| | | | | | | | |
End of period (including distributions in excess of net investment income of $(94,607) and undistributed net investment income of $24,645, respectively) | | $ | 153,249,738 | | | $ | 148,692,714 | |
| | | | | | | | |
See notes to financial statements.
| | | | |
| AB GLOBAL REAL ESTATE INVESTMENT FUND • | | | 23 | |
Statement of Changes in Net Assets
NOTES TO FINANCIAL STATEMENTS
November 30, 2016
NOTE A
Significant Accounting Policies
AB Global Real Estate Investment Fund, Inc. (the “Fund”), incorporated in the state of Maryland on July 15, 1996, is registered under the Investment Company Act of 1940, as a diversified, open-end management investment company. The Fund offers Class A, Class B, Class C, Advisor Class, Class R, Class K and Class I shares. Class A shares are sold with a front-end sales charge of up to 4.25% for purchases not exceeding $1,000,000. With respect to purchases of $1,000,000 or more, Class A shares redeemed within one year of purchase may be subject to a contingent deferred sales charge of 1%. Class B shares are currently sold with a contingent deferred sales charge which declines from 4% to zero depending on the period of time the shares are held. Effective January 31, 2009, sales of Class B shares of the Fund to new investors were suspended. Class B shares will only be issued (i) upon the exchange of Class B shares from another AB Mutual Fund, (ii) for purposes of dividend reinvestment, (iii) through the Fund’s Automatic Investment Program (the “Program”) for accounts that established the Program prior to January 31, 2009, and (iv) to Class B shareholders as of January 31, 2009. The ability to establish a new Program for accounts containing Class B shares was suspended as of January 31, 2009. Class B shares will automatically convert to Class A shares eight years after the end of the calendar month of purchase. Class C shares are subject to a contingent deferred sales charge of 1% on redemptions made within the first year after purchase. Class R and Class K shares are sold without an initial or contingent deferred sales charge. Advisor Class and Class I shares are sold without an initial or contingent deferred sales charge and are not subject to ongoing distribution expenses. All seven classes of shares have identical voting, dividend, liquidation and other rights, except that the classes bear different distribution and transfer agency expenses. Each class has exclusive voting rights with respect to its distribution plan. The financial statements have been prepared in conformity with U.S. generally accepted accounting principles (“U.S. GAAP”), which require management to make certain estimates and assumptions that affect the reported amounts of assets and liabilities in the financial statements and amounts of income and expenses during the reporting period. Actual results could differ from those estimates. The Fund is an investment company under U.S. GAAP and follows the accounting and reporting guidance applicable to investment companies. The following is a summary of significant accounting policies followed by the Fund.
1. Security Valuation
Portfolio securities are valued at their current market value determined on the basis of market quotations or, if market quotations are not readily available or are deemed unreliable, at “fair value” as determined in
| | |
| 24 | | • AB GLOBAL REAL ESTATE INVESTMENT FUND |
Notes to Financial Statements
accordance with procedures established by and under the general supervision of the Fund’s Board of Directors (the “Board”).
In general, the market values of securities which are readily available and deemed reliable are determined as follows: securities listed on a national securities exchange (other than securities listed on the NASDAQ Stock Market, Inc. (“NASDAQ”)) or on a foreign securities exchange are valued at the last sale price at the close of the exchange or foreign securities exchange. If there has been no sale on such day, the securities are valued at the last traded price from the previous day. Securities listed on more than one exchange are valued by reference to the principal exchange on which the securities are traded; securities listed only on NASDAQ are valued in accordance with the NASDAQ Official Closing Price; listed or over the counter (“OTC”) market put or call options are valued at the mid-level between the current bid and asked prices. If either a current bid or current ask price is unavailable, AllianceBernstein L.P. (the “Adviser”) will have discretion to determine the best valuation (e.g. last trade price in the case of listed options); open futures are valued using the closing settlement price or, in the absence of such a price, the most recent quoted bid price. If there are no quotations available for the day of valuation, the last available closing settlement price is used; U.S. Government securities and any other debt instruments having 60 days or less remaining until maturity are generally valued at market by an independent pricing vendor, if a market price is available. If a market price is not available, the securities are valued at amortized cost. This methodology is commonly used for short-term securities that have an original maturity of 60 days or less, as well as short-term securities that had an original term to maturity that exceeded 60 days. In instances when amortized cost is utilized, the Valuation Committee (the “Committee”) must reasonably conclude that the utilization of amortized cost is approximately the same as the fair value of the security. Such factors the Committee will consider include, but are not limited to, an impairment of the creditworthiness of the issuer or material changes in interest rates. Fixed-income securities, including mortgage-backed and asset-backed securities, may be valued on the basis of prices provided by a pricing service or at a price obtained from one or more of the major broker-dealers. In cases where broker-dealer quotes are obtained, the Adviser may establish procedures whereby changes in market yields or spreads are used to adjust, on a daily basis, a recently obtained quoted price on a security. Swaps and other derivatives are valued daily, primarily using independent pricing services, independent pricing models using market inputs, as well as third party broker-dealers or counterparties. Open end mutual funds are valued at the closing net asset value per share, while exchange traded funds are valued at the closing market price per share.
| | | | |
| AB GLOBAL REAL ESTATE INVESTMENT FUND • | | | 25 | |
Notes to Financial Statements
Securities for which market quotations are not readily available (including restricted securities) or are deemed unreliable are valued at fair value as deemed appropriate by the Adviser. Factors considered in making this determination may include, but are not limited to, information obtained by contacting the issuer, analysts, analysis of the issuer’s financial statements or other available documents. In addition, the Fund may use fair value pricing for securities primarily traded in non-U.S. markets because most foreign markets close well before the Fund values its securities at 4:00 p.m., Eastern Time. The earlier close of these foreign markets gives rise to the possibility that significant events, including broad market moves, may have occurred in the interim and may materially affect the value of those securities. To account for this, the Fund may frequently value many of its foreign equity securities using fair value prices based on third party vendor modeling tools to the extent available.
2. Fair Value Measurements
In accordance with U.S. GAAP regarding fair value measurements, fair value is defined as the price that the Fund would receive to sell an asset or pay to transfer a liability in an orderly transaction between market participants at the measurement date. U.S. GAAP establishes a framework for measuring fair value, and a three-level hierarchy for fair value measurements based upon the transparency of inputs to the valuation of an asset or liability (including those valued based on their market values as described in Note A.1 above). Inputs may be observable or unobservable and refer broadly to the assumptions that market participants would use in pricing the asset or liability. Observable inputs reflect the assumptions market participants would use in pricing the asset or liability based on market data obtained from sources independent of the Fund. Unobservable inputs reflect the Fund’s own assumptions about the assumptions that market participants would use in pricing the asset or liability based on the best information available in the circumstances. Each investment is assigned a level based upon the observability of the inputs which are significant to the overall valuation. The three-tier hierarchy of inputs is summarized below.
| | • | | Level 1—quoted prices in active markets for identical investments |
| | • | | Level 2—other significant observable inputs (including quoted prices for similar investments, interest rates, prepayment speeds, credit risk, etc.) |
| | • | | Level 3—significant unobservable inputs (including the Fund’s own assumptions in determining the fair value of investments) |
The fair value of debt instruments, such as bonds, and over-the-counter derivatives is generally based on market price quotations, recently executed market transactions (where observable) or industry recognized modeling techniques and are generally classified as Level 2. Pricing vendor inputs to
| | |
| 26 | | • AB GLOBAL REAL ESTATE INVESTMENT FUND |
Notes to Financial Statements
Level 2 valuations may include quoted prices for similar investments in active markets, interest rate curves, coupon rates, currency rates, yield curves, option adjusted spreads, default rates, credit spreads and other unique security features in order to estimate the relevant cash flows which is then discounted to calculate fair values. If these inputs are unobservable and significant to the fair value, these investments will be classified as Level 3. In addition, non-agency rated investments are classified as Level 3.
Where readily available market prices or relevant bid prices are not available for certain equity investments, such investments may be valued based on similar publicly traded investments, movements in relevant indices since last available prices or based upon underlying company fundamentals and comparable company data (such as multiples to earnings or other multiples to equity). Where an investment is valued using an observable input, such as another publicly traded security, the investment will be classified as Level 2. If management determines that an adjustment is appropriate based on restrictions on resale, illiquidity or uncertainty, and such adjustment is a significant component of the valuation, the investment will be classified as Level 3. An investment will also be classified as Level 3 where management uses company fundamentals and other significant inputs to determine the valuation.
The following table summarizes the valuation of the Fund’s investments by the above fair value hierarchy levels as of November 30, 2016:
| | | | | | | | | | | | | | | | |
Investments in
Securities | | Level 1 | | | Level 2 | | | Level 3 | | | Total | |
Assets: | | | | | | | | | | | | | | | | |
Common Stocks: | | | | | | | | | | | | | | | | |
Real Estate | | $ | 84,921,221 | | | $ | 59,675,588 | | | $ | 321,619 | | | $ | 144,918,428 | |
Transportation | | | – 0 | – | | | 2,407,645 | | | | – 0 | – | | | 2,407,645 | |
Materials | | | – 0 | – | | | 1,600,544 | | | | – 0 | – | | | 1,600,544 | |
Diversified Financials | | | 781,177 | | | | – 0 | – | | | – 0 | – | | | 781,177 | |
Insurance | | | 762,348 | | | | – 0 | – | | | – 0 | – | | | 762,348 | |
Consumer Services | | | 740,777 | | | | – 0 | – | | | – 0 | – | | | 740,777 | |
Investment Companies | | | – 0 | – | | | 257,237 | | | | – 0 | – | | | 257,237 | |
Short-Term Investments: | | | | | | | | | | | | | | | | |
Investment Companies | | | 1,856,643 | | | | – 0 | – | | | – 0 | – | | | 1,856,643 | |
Time Deposits | | | – 0 | – | | | 278,361 | | | | – 0 | – | | | 278,361 | |
| | | | | | | | | | | | | | | | |
Total Investments in Securities | | | 89,062,166 | | | | 64,219,375 | † | | | 321,619 | | | | 153,603,160 | |
Other Financial Instruments*: | | | | | | | | | | | | | | | | |
Assets | | | | | | | | | | | | | | | | |
Forward Currency Exchange Contracts | | | – 0 | – | | | 963,809 | | | | – 0 | – | | | 963,809 | |
Liabilities | | | | | | | | | | | | | | | | |
Forward Currency Exchange Contracts | | | – 0 | – | | | (1,068,783 | ) | | | – 0 | – | | | (1,068,783 | ) |
| | | | | | | | | | | | | | | | |
Total^ | | $ | 89,062,166 | | | $ | 64,114,401 | | | $ | 321,619 | | | $ | 153,498,186 | |
| | | | | | | | | | | | | | | | |
| | | | |
| AB GLOBAL REAL ESTATE INVESTMENT FUND • | | | 27 | |
Notes to Financial Statements
| † | | A significant portion of the Fund’s foreign equity investments are categorized as Level 2 investments since they are valued using fair value prices based on third party vendor modeling tools to the extent available, see Note A.1. |
| * | | Other financial instruments are derivative instruments, such as futures, forwards and swaps, which are valued at the unrealized appreciation/(depreciation) on the instrument. |
| ^ | | An amount of $2,763,736 was transferred from Level 1 to Level 2 due to the above mentioned foreign equity fair valuation using third party vendor modeling tools during the reporting period. There were no transfers from Level 2 to Level 1 during the reporting period. |
The Fund recognizes all transfers between levels of the fair value hierarchy assuming the financial instrument was transferred at the beginning of the reporting period.
Following is a reconciliation of investments in which significant unobservable inputs (Level 3) were used in determining fair value.
| | | | | | | | | | | | |
| | | Common Stocks -
Equity: Other | | | Common Stocks -
Real Estate | | | Total | |
Balance as of 11/30/15 | | $ | 267,094 | | | $ | – 0 | – | | $ | 267,094 | |
Accrued discounts/(premiums) | | | – 0 | – | | | – 0 | – | | | – 0 | – |
Realized gain (loss) | | | – 0 | – | | | – 0 | – | | | – 0 | – |
Change in unrealized appreciation/depreciation | | | – 0 | – | | | 54,525 | | | | 54,525 | |
Purchases | | | – 0 | – | | | – 0 | – | | | – 0 | – |
Sales | | | – 0 | – | | | – 0 | – | | | – 0 | – |
Reclassification | | | (267,094 | ) | | | 267,094 | | | | – 0 | – |
Transfers into Level 3 | | | – 0 | – | | | – 0 | – | | | – 0 | – |
Transfers out of Level 3 | | | – 0 | – | | | – 0 | – | | | – 0 | – |
| | | | | | | | | | | | |
Balance as of 11/30/16 | | $ | – 0 | – | | $ | 321,619 | | | $ | 321,619 | |
| | | | | | | | | | | | |
Net change in unrealized appreciation/depreciation from investments held as of 11/30/16** | | $ | – 0 | – | | $ | 54,525 | | | $ | 54,525 | |
| | | | | | | | | | | | |
| ** | | The unrealized appreciation/(depreciation) is included in net change in unrealized appreciation/depreciation on investments and other financial instruments in the accompanying statement of operations. |
The Adviser established the Committee to oversee the pricing and valuation of all securities held in the Fund. The Committee operates under pricing and valuation policies and procedures established by the Adviser and approved by the Board, including pricing policies which set forth the mechanisms and processes to be employed on a daily basis to implement these policies and procedures. In particular, the pricing policies describe how to determine market quotations for securities and other instruments. The Committee’s responsibilities include: 1) fair value and liquidity determinations (and oversight of any third parties to whom any responsibility for fair value and liquidity determinations is delegated), and 2) regular monitoring of the Adviser’s pricing and valuation policies and
| | |
| 28 | | • AB GLOBAL REAL ESTATE INVESTMENT FUND |
Notes to Financial Statements
procedures and modification or enhancement of these policies and procedures (or recommendation of the modification of these policies and procedures) as the Committee believes appropriate.
The Committee is also responsible for monitoring the implementation of the pricing policies by the Adviser’s Pricing Group (the “Pricing Group”) and any third party which performs certain pricing functions in accordance with the pricing policies. The Pricing Group is responsible for the oversight of the third party on a day-to-day basis. The Committee and the Pricing Group perform a series of activities to provide reasonable assurance of the accuracy of prices including: 1) periodic vendor due diligence meetings, review of methodologies, new developments and process at vendors, 2) daily compare of security valuation versus prior day for all fixed income securities that exceeded established thresholds, and 3) daily review of unpriced, stale, and variance reports with exceptions reviewed by senior management and the Committee.
In addition, several processes outside of the pricing process are used to monitor valuation issues including: 1) performance and performance attribution reports are monitored for anomalous impacts based upon benchmark performance, and 2) portfolio managers review all portfolios for performance and analytics (which are generated using the Adviser’s prices).
3. Currency Translation
Assets and liabilities denominated in foreign currencies and commitments under forward currency exchange contracts are translated into U.S. dollars at the mean of the quoted bid and ask prices of such currencies against the U.S. dollar. Purchases and sales of portfolio securities are translated into U.S. dollars at the rates of exchange prevailing when such securities were acquired or sold. Income and expenses are translated into U.S. dollars at rates of exchange prevailing when accrued.
Net realized gain or loss on foreign currency transactions represents foreign exchange gains and losses from sales and maturities of foreign fixed income investments, foreign currency exchange contracts, holding of foreign currencies, currency gains or losses realized between the trade and settlement dates on foreign investment transactions, and the difference between the amounts of dividends, interest and foreign withholding taxes recorded on the Fund’s books and the U.S. dollar equivalent amounts actually received or paid. Net unrealized currency gains and losses from valuing foreign currency denominated assets and liabilities at period end exchange rates are reflected as a component of net unrealized appreciation and depreciation of foreign currency denominated assets and liabilities.
| | | | |
| AB GLOBAL REAL ESTATE INVESTMENT FUND • | | | 29 | |
Notes to Financial Statements
4. Taxes
It is the Fund’s policy to meet the requirements of the Internal Revenue Code applicable to regulated investment companies and to distribute all of its investment company taxable income and net realized gains, if any, to shareholders. Therefore, no provisions for federal income or excise taxes are required. The Fund may be subject to taxes imposed by countries in which it invests. Such taxes are generally based on income and/or capital gains earned or repatriated. Taxes are accrued and applied to net investment income, net realized gains and net unrealized appreciation/depreciation as such income and/or gains are earned.
In accordance with U.S. GAAP requirements regarding accounting for uncertainties in income taxes, management has analyzed the Fund’s tax positions taken or expected to be taken on federal and state income tax returns for all open tax years (the current and the prior three tax years) and has concluded that no provision for income tax is required in the Fund’s financial statements.
5. Investment Income and Investment Transactions
Dividend income is recorded on the ex-dividend date or as soon as the Fund is informed of the dividend. Interest income is accrued daily. Investment transactions are accounted for on the date securities are purchased or sold. Investment gains and losses are determined on the identified cost basis. The Fund amortizes premiums and accretes discounts as adjustments to interest income.
6. Class Allocations
All income earned and expenses incurred by the Fund are borne on a pro-rata basis by each settled class of shares, based on the proportionate interest in the Fund represented by the net assets of such class, except for class specific expenses which are allocated to the respective class. Realized and unrealized gains and losses are allocated among the various share classes based on their respective net assets.
7. Dividends and Distributions
Dividends and distributions to shareholders, if any, are recorded on the ex-dividend date. Income dividends and capital gains distributions are determined in accordance with federal tax regulations and may differ from those determined in accordance with U.S. GAAP. To the extent these differences are permanent, such amounts are reclassified within the capital accounts based on their federal tax basis treatment; temporary differences do not require such reclassification.
| | |
| 30 | | • AB GLOBAL REAL ESTATE INVESTMENT FUND |
Notes to Financial Statements
NOTE B
Advisory Fee and Other Transactions with Affiliates
Under the terms of the investment advisory agreement, the Fund pays the Adviser an advisory fee at an annual rate of .55% of the first $2.5 billion, ..45% of the next $2.5 billion and .40% in excess of $5 billion, of the Fund’s average daily net assets. The fee is accrued daily and paid monthly.
Pursuant to the investment advisory agreement, the Fund may reimburse the Adviser for certain legal and accounting services provided to the Fund by the Adviser. For the year ended November 30, 2016, such fee amounted to $54,088.
The Fund compensates AllianceBernstein Investor Services, Inc. (“ABIS”), a wholly-owned subsidiary of the Adviser, under a Transfer Agency Agreement for providing personnel and facilities to perform transfer agency services for the Fund. ABIS may make payments to intermediaries that provide omnibus account services, sub-accounting services and/or networking services. The compensation retained by ABIS amounted to $104,600 for the year ended November 30, 2016.
AllianceBernstein Investments, Inc. (the “Distributor”), a wholly-owned subsidiary of the Adviser, serves as the distributor of the Fund’s shares. The Distributor has advised the Fund that it has retained front-end sales charges of $2,069 from the sale of Class A shares and received $ 987, $456 and $528 in contingent deferred sales charges imposed upon redemptions by shareholders of Class A, Class B and Class C shares, respectively, for the year ended November 30, 2016.
The AB Fixed-Income Shares, Inc.—Government STIF Portfolio (the “Government STIF Portfolio”), prior to June 1, 2016, was offered as a cash management option to mutual funds and other institutional accounts of the Adviser, and was not available for direct purchase by members of the public. Prior to June 1, 2016, the Government STIF Portfolio paid no investment management fees but did bear its own expenses. As of June 1, 2016, the Government STIF Portfolio, which was renamed “AB Government Money Market Portfolio” (the “Government Money Market Portfolio”), has a contractual investment management fee rate of .20% and continues to bear its own expenses. In connection with the investment by the Fund in the Government Money Market Portfolio, the Adviser has agreed to waive its investment advisory fee from the Fund in an amount equal to the Fund’s share of the advisory fees of Government Money Market Portfolio, as borne indirectly by the Fund as an acquired fund fee and expense. For the year ended November 30, 2016 such waiver amounted to $914. A
| | | | |
| AB GLOBAL REAL ESTATE INVESTMENT FUND • | | | 31 | |
Notes to Financial Statements
summary of the Fund’s transactions in shares of the Government Money Market Portfolio for the year ended November 30, 2016 is as follows:
| | | | | | | | | | | | | | | | | | |
Market Value November 30, 2015 (000) | | | Purchases
at Cost
(000) | | | Sales
Proceeds
(000) | | | Market Value
November 30, 2016
(000) | | | Dividend
Income
(000) | |
| $ | 781 | | | $ | 65,587 | | | $ | 64,511 | | | $ | 1,857 | | | $ | 4 | |
Brokerage commissions paid on investment transactions for the year ended November 30, 2016 amounted to $240,979, none of which was paid to Sanford C. Bernstein & Co., LLC and Sanford C. Bernstein Limited, respectively, affiliates of the Adviser.
NOTE C
Distribution Services Agreement
The Fund has adopted a Distribution Services Agreement (the “Agreement”) pursuant to Rule 12b-1 under the Investment Company Act of 1940. Under the Agreement the Fund pays distribution and servicing fees to the Distributor at an annual rate of up to .30% of the Fund’s average daily net assets attributable to Class A shares, 1% of the Fund’s average daily net assets attributable to Class B and Class C shares, .50% of the Fund’s average daily net assets attributable to Class R shares and .25% of the Fund’s average daily net assets attributable to Class K shares. Effective February 27, 2015, payments under the Agreement in respect of Class A shares are limited to an annual rate of .25% of Class A shares’ average daily net assets. There are no distribution and servicing fees on the Advisor Class and Class I shares. The fees are accrued daily and paid monthly. The Agreement provides that the Distributor will use such payments in their entirety for distribution assistance and promotional activities. Since the commencement of the Fund’s operations, the Distributor has incurred expenses in excess of the distribution costs reimbursed by the Fund in the amounts of $8,950,892, $2,357,273, $335,345 and $146,781 for Class B, Class C, Class R and Class K shares, respectively. While such costs may be recovered from the Fund in future periods so long as the Agreement is in effect, the rate of the distribution and servicing fees payable under the Agreement may not be increased without a shareholder vote. In accordance with the Agreement, there is no provision for recovery of unreimbursed distribution costs incurred by the Distributor beyond the current fiscal year for Class A shares. The Agreement also provides that the Adviser may use its own resources to finance the distribution of the Fund’s shares.
| | |
| 32 | | • AB GLOBAL REAL ESTATE INVESTMENT FUND |
Notes to Financial Statements
NOTE D
Investment Transactions
Purchases and sales of investment securities (excluding short-term investments) for the year ended November 30, 2016 were as follows:
| | | | | | | | |
| | | Purchases | | | Sales | |
Investment securities (excluding
U.S. government securities) | | $ | 135,042,118 | | | $ | 129,804,884 | |
U.S. government securities | | | – 0 | – | | | – 0 | – |
The cost of investments for federal income tax purposes, gross unrealized appreciation and unrealized depreciation (excluding foreign currency contracts) are as follows:
| | | | |
Cost | | $ | 149,195,877 | |
| | | | |
Gross unrealized appreciation | | $ | 14,331,796 | |
Gross unrealized depreciation | | | (9,924,513 | ) |
| | | | |
Net unrealized appreciation | | $ | 4,407,283 | |
| | | | |
1. Derivative Financial Instruments
The Fund may use derivatives in an effort to earn income and enhance returns, to replace more traditional direct investments, to obtain exposure to otherwise inaccessible markets (collectively, “investment purposes”), or to hedge or adjust the risk profile of its portfolio.
The principal types of derivatives utilized by the Fund, as well as the methods in which they may be used are:
| | • | | Forward Currency Exchange Contracts |
The Fund may enter into forward currency exchange contracts in order to hedge its exposure to changes in foreign currency exchange rates on its foreign portfolio holdings, to hedge certain firm purchase and sale commitments denominated in foreign currencies and for non-hedging purposes as a means of making direct investments in foreign currencies, as described below under “Currency Transactions”.
A forward currency exchange contract is a commitment to purchase or sell a foreign currency at a future date at a negotiated forward rate. The gain or loss arising from the difference between the original contract and the closing of such contract would be included in net realized gain or loss on foreign currency transactions. Fluctuations in the value of open forward currency exchange contracts are recorded for financial reporting purposes as unrealized appreciation and/or depreciation by the Fund. Risks may arise from the potential inability of a counterparty to meet the terms of a contract and from unanticipated movements in the value of a foreign currency relative to the U.S. dollar.
| | | | |
| AB GLOBAL REAL ESTATE INVESTMENT FUND • | | | 33 | |
Notes to Financial Statements
During the year ended November 30, 2016, the Fund held forward currency exchange contracts for hedging and non-hedging purposes.
The Fund typically enters into International Swaps and Derivatives Association, Inc. Master Agreements (“ISDA Master Agreement”) or similar master agreements (collectively, “Master Agreements”) with its derivative contract counterparties in order to, among other things, reduce its credit risk to counterparties. ISDA Master Agreements include provisions for general obligations, representations, collateral and events of default or termination. Under an ISDA Master Agreement, the Fund typically may offset with the counterparty certain derivative financial instruments’ payables and/or receivables with collateral held and/or posted and create one single net payment (close-out netting) in the event of default or termination.
Various master agreements govern the terms of certain transactions with counterparties, including transactions such as derivative transactions, repurchase and reverse repurchase agreements. These Master Agreements typically attempt to reduce the counterparty risk associated with such transactions by specifying credit protection mechanisms and providing standardization that improves legal certainty. Cross-termination provisions under Master Agreements typically provide that a default in connection with one transaction between the Fund and a counterparty gives the non-defaulting party the right to terminate any other transactions in place with the defaulting party to create one single net payment due to/due from the defaulting party. In the event of a default by a Master Agreements counterparty, the return of collateral with market value in excess of the Fund’s net liability, held by the defaulting party, may be delayed or denied.
The Fund’s Master Agreements may contain provisions for early termination of OTC derivative transactions in the event the net assets of the Fund decline below specific levels (“net asset contingent features”). If these levels are triggered, the Fund’s counterparty has the right to terminate such transaction and require the Fund to pay or receive a settlement amount in connection with the terminated transaction. For additional details, please refer to netting arrangements by counterparty tables below.
During the year ended November 30, 2016, the Fund had entered into the following derivatives:
| | | | | | | | | | | | |
| | | Asset Derivatives | | | Liability Derivatives | |
Derivative Type | | Statement of
Assets and
Liabilities
Location | | Fair Value | | | Statement of
Assets and
Liabilities
Location | | Fair Value | |
Foreign exchange contracts | |
Unrealized appreciation on forward currency exchange contracts | | $ | 963,809 | | | Unrealized depreciation on forward currency exchange contracts | | $ | 1,068,783 | |
| | | | | | | | | | | | |
Total | | | | $ | 963,809 | | | | | $ | 1,068,783 | |
| | | | | | | | | | | | |
| | |
| 34 | | • AB GLOBAL REAL ESTATE INVESTMENT FUND |
Notes to Financial Statements
| | | | | | | | | | |
Derivative Type | | Location of Gain or
(Loss) on Derivatives
Within Statement of
Operations | | Realized Gain
or (Loss) on
Derivatives | | | Change in
Unrealized
Appreciation or
(Depreciation) | |
Foreign exchange contracts | | Net realized gain/(loss) on foreign currency transactions; Net change in unrealized appreciation/depreciation on foreign currency denominated assets and liabilities | | $ | 104,267 | | | $ | (38,101 | ) |
| | | | | | | | | | |
Total | | | | $ | 104,267 | | | $ | (38,101 | ) |
| | | | | | | | | | |
The following table represents the average monthly volume of the Fund’s derivative transactions during the year ended November 30, 2016:
| | | | |
Forward Currency Exchange Contracts: | | | | |
Average principal amount on buy contracts | | $ | 9,753,723 | |
Average principal amount on sale contracts | | $ | 14,522,245 | |
For financial reporting purposes, the Fund does not offset derivative assets and derivative liabilities that are subject to netting arrangements in the statement of assets and liabilities.
All derivatives held at period end were subject to netting arrangements. The following tables present the Fund’s derivative assets and liabilities by counterparty net of amounts available for offset under Master Agreements (“MA”) and net of the related collateral received/pledged by the Fund as of November 30, 2016:
| | | | | | | | | | | | | | | | | | | | |
Counterparty | | Derivative
Assets
Subject
to a MA | | | Derivatives
Available
for Offset | | | Cash
Collateral
Received | | | Security
Collateral
Received | | | Net Amount of
Derivatives
Assets | |
OTC Derivatives: | | | | | | | | | | | | | | | | | | | | |
Barclays Bank PLC | | $ | 202,627 | | | $ | (323 | ) | | $ | ��� 0 | – | | $ | – 0 | – | | $ | 202,304 | |
BNP Paribas SA | | | 18,964 | | | | – 0 | – | | | – 0 | – | | | – 0 | – | | | 18,964 | |
Brown Brothers Harriman & Co. | | | 76,757 | | | | (76,757 | ) | | | – 0 | – | | | – 0 | – | | | – 0 | – |
Citibank, N.A. | | | 214,743 | | | | (214,743 | ) | | | – 0 | – | | | – 0 | – | | | – 0 | – |
Credit Suisse International | | | 65,793 | | | | – 0 | – | | | – 0 | – | | | – 0 | – | | | 65,793 | |
Royal Bank of Scotland PLC | | | 68,991 | | | | (68,664 | ) | | | – 0 | – | | | – 0 | – | | | 327 | |
Societe Generale | | | 88,297 | | | | (87,756 | ) | | | – 0 | – | | | – 0 | – | | | 541 | |
Standard Chartered Bank | | | 222,486 | | | | (222,486 | ) | | | – 0 | – | | | – 0 | – | | | – 0 | – |
UBS AG | | | 5,151 | | | | – 0 | – | | | – 0 | – | | | – 0 | – | | | 5,151 | |
| | | | | | | | | | | | | | | | | | | | |
Total | | $ | 963,809 | | | $ | (670,729 | ) | | $ | – 0 | – | | $ | – 0 | – | | $ | 293,080 | ^ |
| | | | | | | | | | | | | | | | | | | | |
| | | | |
| AB GLOBAL REAL ESTATE INVESTMENT FUND • | | | 35 | |
Notes to Financial Statements
| | | | | | | | | | | | | | | | | | | | |
Counterparty | | Derivative
Liabilities
Subject
to a MA | | | Derivatives
Available
for Offset | | | Cash
Collateral
Pledged | | | Security
Collateral
Pledged | | | Net Amount of
Derivatives
Liabilities | |
OTC Derivatives: | | | | | | | | | | | | | | | | | | | | |
Barclays Bank PLC | | $ | 323 | | | $ | (323 | ) | | $ | – 0 | – | | $ | – 0 | – | | $ | – 0 | – |
Brown Brothers Harriman & Co. | | | 108,386 | | | | (76,757 | ) | | | – 0 | – | | | – 0 | – | | | 31,629 | |
Citibank, N.A. | | | 384,302 | | | | (214,743 | ) | | | – 0 | – | | | – 0 | – | | | 169,559 | |
Goldman Sachs Bank USA | | | 53,334 | | | | – 0 | – | | | – 0 | – | | | – 0 | – | | | 53,334 | |
JPMorgan Chase Bank NA | | | 24,330 | | | | – 0 | – | | | – 0 | – | | | – 0 | – | | | 24,330 | |
Morgan Stanley Capital Services LLC | | | 5,753 | | | | – 0 | – | | | – 0 | – | | | – 0 | – | | | 5,753 | |
Royal Bank of Scotland PLC | | | 68,664 | | | | (68,664 | ) | | | – 0 | – | | | – 0 | – | | | – 0 | – |
Societe Generale | | | 87,756 | | | | (87,756 | ) | | | – 0 | – | | | – 0 | – | | | – 0 | – |
Standard Chartered Bank | | | 335,935 | | | | (222,486 | ) | | | – 0 | – | | | – 0 | – | | | 113,449 | |
| | | | | | | | | | | | | | | | | | | | |
Total | | $ | 1,068,783 | | | $ | (670,729 | ) | | $ | – 0 | – | | $ | – 0 | – | | $ | 398,054 | ^ |
| | | | | | | | | | | | | | | | | | | | |
| ^ | | Net amount represents the net unrealized receivable/payable that would be due from/to the counterparty in the event of default or termination. The net amount from OTC financial derivative instruments can only be netted across transactions governed under the same master agreement with the same counterparty. |
2. Currency Transactions
The Fund may invest in non-U.S. Dollar-denominated securities on a currency hedged or unhedged basis. The Fund may seek investment opportunities by taking long or short positions in currencies through the use of currency-related derivatives, including forward currency exchange contracts, futures and options on futures, swaps, and other options. The Fund may enter into transactions for investment opportunities when it anticipates that a foreign currency will appreciate or depreciate in value but securities denominated in that currency are not held by the Fund and do not present attractive investment opportunities. Such transactions may also be used when the Adviser believes that it may be more efficient than a direct investment in a foreign currency-denominated security. The Fund may also conduct currency exchange contracts on a spot basis (i.e., for cash at the spot rate prevailing in the currency exchange market for buying or selling currencies).
NOTE E
Securities Lending
The Fund may enter into securities lending transactions. Under the Fund’s securities lending program, all loans of securities will be collateralized continually by cash. The Fund will be compensated for the loan from a portion of the net return from the income earned on cash collateral after a rebate is paid to the borrower (in some cases, this rebate
| | |
| 36 | | • AB GLOBAL REAL ESTATE INVESTMENT FUND |
Notes to Financial Statements
may be a “negative rebate” or fee paid by the borrower to the Fund in connection with the loan), and payments are made for fees of the securities lending agent and for certain other administrative expenses. It is the policy of the Fund to receive collateral consisting of cash in an amount exceeding the value of the securities loaned. The Fund will have the right to call a loan and obtain the securities loaned at any time on notice to the borrower within the normal and customary settlement time for the securities. While the securities are on loan, the borrower is obligated to pay the Fund amounts equal to any income or other distributions from the securities. The Fund will not be able to exercise voting rights with respect to any securities during the existence of a loan, but will have the right to regain ownership of loaned securities in order to exercise voting or other ownership rights. The lending agent has agreed to indemnify the Fund in the case of default of any securities borrower. Collateral received and securities loaned are marked to market daily to ensure that the securities loaned are secured by collateral. The lending agent currently invests the cash collateral received in Government Money Market Portfolio, an eligible money market vehicle, in accordance with the investment restrictions of the Fund, and as approved by the Board. Prior to June 20, 2016, such cash collateral received was invested in AB Exchange Reserves. The collateral received on securities loaned is recorded as an asset as well as a corresponding liability in the statement of assets and liabilities. When the Fund lends securities, its investment performance will continue to reflect changes in the value of the securities loaned. At November 30, 2016, the Fund had no securities on loan. The cash collateral will be adjusted on the next business day to maintain the required collateral amount. The Fund earned securities lending income of $19,361, $3,693, and $2,475 from the borrowers, AB Exchange Reserves and Government Money Market Portfolio, respectively, for the year ended November 30, 2016; these amounts are reflected in the statement of operations. In connection with the cash collateral investment by the Fund in the Government Money Market Portfolio, the Adviser has agreed to waive a portion of the Fund’s share of the advisory fees of Government Money Market Portfolio, as borne indirectly by the Fund as an acquired fund fee and expense. For the year ended November 30, 2016, such waiver amounted to $1,431. A principal risk of lending portfolio securities is that the borrower may fail to return the loaned securities upon termination of the loan and that the collateral will not be sufficient to replace the loaned securities. A summary of the Fund’s transactions in shares of AB Exchange Reserves for the period December 1, 2015 to June 20, 2016 is as follows:
| | | | | | | | | | | | | | |
Market Value
November 30, 2015
(000) | | | Purchases
at Cost
(000) | | | Sales
Proceeds
(000) | | | Market Value
June 20, 2016
(000) | |
| $ | 1,434 | | | $ | 18,967 | | | $ | 20,401 | | | $ | – 0 – | |
| | | | |
| AB GLOBAL REAL ESTATE INVESTMENT FUND • | | | 37 | |
Notes to Financial Statements
A summary of the Fund’s transactions in shares of Government Money Market Portfolio for the period June 21, 2016 to November 30, 2016 is as follows:
| | | | | | | | | | | | | | |
Market Value
June 21, 2016
(000) | | | Purchases
at Cost
(000) | | | Sales
Proceeds
(000) | | | Market Value
November 30, 2016
(000) | |
| $ | – 0 – | | | $ | 14,742 | | | $ | 14,742 | | | $ | – 0 – | |
NOTE F
Capital Stock
Each class consists of 3,000,000,000 authorized shares. Transactions in capital shares for each class were as follows:
| | | | | | | | | | | | | | | | | | | | | | | | |
| | | | | | | | | | | | | | | | | | | | | | | | |
| | | Shares | | | | | | Amount | | | | |
| | | Year Ended
November 30,
2016 | | | Year Ended
November 30,
2015 | | | | | | Year Ended
November 30,
2016 | | | Year Ended
November 30,
2015 | | | | |
| | | | | | | | |
| Class A | | | | | | | | | | | | | | | | | | | | | | | | |
Shares sold | | | 733,515 | | | | 745,575 | | | | | | | $ | 10,275,853 | | | $ | 10,685,087 | | | | | |
| | | | | |
Shares issued in reinvestment of dividends | | | 162,851 | | | | 268,377 | | | | | | | | 2,287,451 | | | | 3,777,314 | | | | | |
| | | | | |
Shares converted from Class B | | | 19,517 | | | | 38,116 | | | | | | | | 278,568 | | | | 550,425 | | | | | |
| | | | | |
Shares redeemed | | | (1,149,322 | ) | | | (2,803,694 | ) | | | | | | | (16,232,098 | ) | | | (39,937,318 | ) | | | | |
| | | | | |
Net decrease | | | (233,439 | ) | | | (1,751,626 | ) | | | | | | $ | (3,390,226 | ) | | $ | (24,924,492 | ) | | | | |
| | | | | |
| | | | | | | | | | | | | | | | | | | | | | | | |
| Class B | | | | | | | | | | | | | | | | | | | | | | | | |
Shares sold | | | 5,141 | | | | 8,356 | | | | | | | $ | 72,278 | | | $ | 119,173 | | | | | |
| | | | | |
Shares issued in reinvestment of dividends | | | 2,020 | | | | 3,420 | | | | | | | | 27,988 | | | | 47,643 | | | | | |
| | | | | |
Shares converted to Class A | | | (19,736 | ) | | | (38,568 | ) | | | | | | | (278,568 | ) | | | (550,425 | ) | | | | |
| | | | | |
Shares redeemed | | | (11,096 | ) | | | (18,022 | ) | | | | | | | (156,245 | ) | | | (249,924 | ) | | | | |
| | | | | |
Net decrease | | | (23,671 | ) | | | (44,814 | ) | | | | | | $ | (334,547 | ) | | $ | (633,533 | ) | | | | |
| | | | | |
| | |
| 38 | | • AB GLOBAL REAL ESTATE INVESTMENT FUND |
Notes to Financial Statements
| | | | | | | | | | | | | | | | | | | | | | | | |
| | | | | | | | | | | | | | | | | | | | | | | | |
| | | Shares | | | | | | Amount | | | | |
| | | Year Ended
November 30,
2016 | | | Year Ended
November 30,
2015 | | | | | | Year Ended
November 30,
2016 | | | Year Ended
November 30,
2015 | | | | |
| | | | | | | | | | | | | | | | | | | | | | | | |
| Class C | | | | | | | | | | | | | | | | | | | | | | | | |
Shares sold | | | 307,886 | | | | 191,915 | | | | | | | $ | 4,190,664 | | | $ | 2,728,115 | | | | | |
| | | | | |
Shares issued in reinvestment of dividends | | | 36,752 | | | | 43,680 | | | | | | | | 509,999 | | | | 608,673 | | | | | |
| | | | | |
Shares redeemed | | | (277,010 | ) | | | (252,194 | ) | | | | | | | (3,869,318 | ) | | | (3,579,986 | ) | | | | |
| | | | | |
Net increase (decrease) | | | 67,628 | | | | (16,599 | ) | | | | | | $ | 831,345 | | | $ | (243,198 | ) | | | | |
| | | | | |
| | | | | | | | | | | | | | | | | | | | | | | | |
| Advisor Class | | | | | | | | | | | | | | | | | | | | | | | | |
Shares sold | | | 1,874,806 | | | | 894,847 | | | | | | | $ | 25,989,953 | | | $ | 12,763,085 | | | | | |
| | | | | |
Shares issued in reinvestment of dividends | | | 60,114 | | | | 56,036 | | | | | | | | 840,332 | | | | 781,537 | | | | | |
| | | | | |
Shares redeemed | | | (1,071,547 | ) | | | (1,519,171 | ) | | | | | | | (15,121,831 | ) | | | (21,424,608 | ) | | | | |
| | | | | |
Net increase (decrease) | | | 863,373 | | | | (568,288 | ) | | | | | | $ | 11,708,454 | | | $ | (7,879,986 | ) | | | | |
| | | | | |
| | | | | | | | | | | | | | | | | | | | | | | | |
| Class R | | | | | | | | | | | | | | | | | | | | | | | | |
Shares sold | | | 177,960 | | | | 201,087 | | | | | | | $ | 2,499,084 | | | $ | 2,853,121 | | | | | |
| | | | | |
Shares issued in reinvestment of dividends | | | 22,441 | | | | 29,236 | | | | | | | | 311,491 | | | | 407,162 | | | | | |
| | | | | |
Shares redeemed | | | (251,674 | ) | | | (247,744 | ) | | | | | | | (3,488,777 | ) | | | (3,493,532 | ) | | | | |
| | | | | |
Net decrease | | | (51,273 | ) | | | (17,421 | ) | | | | | | $ | (678,202 | ) | | $ | (233,249 | ) | | | | |
| | | | | |
| | | | | | | | | | | | | | | | | | | | | | | | |
| Class K | | | | | | | | | | | | | | | | | | | | | | | | |
Shares sold | | | 133,115 | | | | 194,439 | | | | | | | $ | 1,868,010 | | | $ | 2,781,348 | | | | | |
| | | | | |
Shares issued in reinvestment of dividends | | | 26,697 | | | | 35,993 | | | | | | | | 372,092 | | | | 503,010 | | | | | |
| | | | | |
Shares redeemed | | | (210,255 | ) | | | (214,514 | ) | | | | | | | (2,923,715 | ) | | | (2,990,767 | ) | | | | |
| | | | | |
Net increase (decrease) | | | (50,443 | ) | | | 15,918 | | | | | | | $ | (683,613 | ) | | $ | 293,591 | | | | | |
| | | | | |
| | | | | | | | | | | | | | | | | | | | | | | | |
| Class I | | | | | | | | | | | | | | | | | | | | | | | | |
Shares sold | | | 78,562 | | | | 172,362 | | | | | | | $ | 1,104,688 | | | $ | 2,440,462 | | | | | |
| | | | | |
Shares issued in reinvestment of dividends | | | 12,449 | | | | 9,365 | | | | | | | | 174,461 | | | | 131,030 | | | | | |
| | | | | |
Shares redeemed | | | (51,409 | ) | | | (61,058 | ) | | | | | | | (729,839 | ) | | | (868,165 | ) | | | | |
| | | | | |
Net increase | | | 39,602 | | | | 120,669 | | | | | | | $ | 549,310 | | | $ | 1,703,327 | | | | | |
| | | | | |
| | | | |
| AB GLOBAL REAL ESTATE INVESTMENT FUND • | | | 39 | |
Notes to Financial Statements
NOTE G
Risks Involved in Investing in the Fund
Interest Rate Risk and Credit Risk—Interest rate risk is the risk that changes in interest rates will affect the value of the Fund’s investments in fixed-income debt securities such as bonds or notes. Increases in interest rates may cause the value of the Fund’s investments to decline. Credit risk is the risk that the issuer or guarantor of a debt security, or the counterparty to a derivative contract, will be unable or unwilling to make timely principal and/or interest payments, or to otherwise honor its obligations. The degree of risk for a particular security may be reflected in its credit rating. Credit risk is greater for medium quality and lower-rated securities. Lower-rated debt securities and similar unrated securities (commonly known as “junk bonds”) have speculative elements or are predominantly speculative risks.
Real Estate Risk—The Fund’s investments in the real estate market have many of the same risks as direct ownership of real estate, including the risk that the value of real estate could decline due to a variety of factors that affect the real estate market generally. Investments in REITs may have additional risks. REITs are dependent on the capability of their managers, may have limited diversification, and could be significantly affected by changes in tax laws.
Foreign (Non-U.S.) Risk—Investments in securities of non-U.S. issuers may involve more risk than those of U.S. issuers. These securities may fluctuate more widely in price and may be less liquid due to adverse market, economic, political, regulatory or other factors.
Currency Risk—Fluctuations in currency exchange rates may negatively affect the value of the Fund’s investments or reduce its returns.
Prepayment Risk—The value of mortgage-related or asset-backed securities may be particularly sensitive to changes in prevailing interest rates. Early payments of principal on some mortgage-related securities may occur during periods of falling mortgage interest rates and expose the Fund to a lower rate of return upon reinvestment of principal. Early payments associated with mortgage-related securities cause these securities to experience significantly greater price and yield volatility than is experienced by traditional fixed income securities. During periods of rising interest rates, a reduction in prepayments may increase the effective life of mortgage related securities, subjecting them to greater risk of decline in market value in response to rising interest rates. If the life of a mortgage-related security is inaccurately predicted, the Fund may not be able to realize the rate of return it expected.
| | |
| 40 | | • AB GLOBAL REAL ESTATE INVESTMENT FUND |
Notes to Financial Statements
Derivatives Risk—The Fund may enter into derivative transactions such as forwards, options, futures and swaps. Derivatives may be illiquid, difficult to price, and leveraged so that small changes may produce disproportionate losses for the Fund, and subject to counterparty risk to a greater degree than more traditional investments. Derivatives may result in significant losses, including losses that are far greater than the value of the derivatives reflected in the statement of assets and liabilities.
Leverage Risk—When the Fund borrows money or otherwise leverages its investments, its performance may be volatile because leverage tends to exaggerate the effect of any increase or decrease in the value of the Fund’s investments. The Fund may create leverage through the use of reverse repurchase arrangements, forward currency exchange contracts, forward commitments, dollar rolls or futures or by borrowing money. The use of derivative instruments by the Fund, such as forwards, futures, options and swaps, may also result in a form of leverage. Leverage may result in higher returns to the Fund than if the Fund were not leveraged, but may also adversely affect returns, particularly if the market is declining.
Indemnification Risk—In the ordinary course of business, the Fund enters into contracts that contain a variety of indemnifications. The Fund’s maximum exposure under these arrangements is unknown. However, the Fund has not had prior claims or losses pursuant to these indemnification provisions and expects the risk of loss thereunder to be remote. Therefore, the Fund has not accrued any liability in connection with these indemnification provisions.
NOTE H
Joint Credit Facility
A number of open-end mutual funds managed by the Adviser, including the Fund, participate in a $280 million revolving credit facility (the “Facility”) intended to provide short-term financing if necessary, subject to certain restrictions in connection with abnormal redemption activity. Commitment fees related to the Facility are paid by the participating funds and are included in miscellaneous expenses in the statement of operations. The Fund did not utilize the Facility during the year ended November 30, 2016.
NOTE I
Distributions to Shareholders
The tax character of distributions paid during the fiscal years ended November 30, 2016 and November 30, 2015 were as follows:
| | | | | | | | |
| | | 2016 | | | 2015 | |
Distributions paid from: | | | | | | | | |
Ordinary income | | $ | 5,571,798 | | | $ | 7,987,884 | |
| | | | | | | | |
Total taxable distributions paid | | $ | 5,571,798 | | | $ | 7,987,884 | |
| | | | | | | | |
| | | | |
| AB GLOBAL REAL ESTATE INVESTMENT FUND • | | | 41 | |
Notes to Financial Statements
As of November 30, 2016, the components of accumulated earnings/(deficit) on a tax basis were as follows:
| | | | |
Undistributed ordinary income | | $ | 2,001,268 | |
Accumulated capital and other losses | | | (43,481,968 | )(a) |
Unrealized appreciation/(depreciation) | | | 4,382,748 | (b) |
| | | | |
Total accumulated earnings/(deficit) | | $ | (37,097,952 | ) |
| | | | |
| (a) | | As of November 30, 2016, the Fund had a net capital loss carryforward of $43,481,968. During the fiscal year, the Fund utilized $1,081,115 of capital loss carryforwards to offset current year net realized gains. |
| (b) | | The differences between book-basis and tax-basis unrealized appreciation/(depreciation) are attributable primarily to the tax deferral of losses on wash sales, the tax treatment of passive foreign investment companies (PFICs), corporate restructuring, and the recognition for tax purposes of unrealized gains/losses on certain derivative instruments. |
For tax purposes, net capital losses may be carried over to offset future capital gains, if any. Funds are permitted to carry forward capital losses incurred in taxable years beginning after December 22, 2010 for an indefinite period. These post-December 22, 2010 capital losses must be utilized prior to the earlier capital losses, which are subject to expiration. Post-December 22, 2010 capital loss carryforwards will retain their character as either short-term or long-term capital losses rather than being considered short-term as under previous regulation.
As of November 30, 2016, the Fund had a net capital loss carryforward of $43,481,968 which will expire as follows:
| | | | |
Short-Term
Amount | | Long-Term
Amount | | Expiration |
| $43,536,112 | | N/A | | 2017 |
| 1,945,856 | | N/A | | 2018 |
During the current fiscal year, permanent differences primarily due to the tax treatment of a corporate restructuring, foreign currency reclassifications, the tax treatment of passive foreign investment companies (PFICs) and the tax treatment of partnership investments resulted in a net decrease in distributions in excess of net investment income and a net increase in accumulated net realized loss on investment and foreign currency transactions. These reclassifications had no effect on net assets.
NOTE J
New Accounting Pronouncement
In May 2015, the Financial Accounting Standards Board issued an Accounting Standards Update, ASU 2015-07 (the “ASU”) which removes the requirement to categorize within the fair value hierarchy all investments for which fair value is measured using the net asset value per share practical expedient. The ASU also removes the requirement to
| | |
| 42 | | • AB GLOBAL REAL ESTATE INVESTMENT FUND |
Notes to Financial Statements
make certain disclosures for investments that are eligible to be measured at fair value using the net asset value per share practical expedient but do not utilize that practical expedient. The ASU is effective for annual periods beginning after December 15, 2015 and interim periods within those annual periods. Management has evaluated the implications of these changes and there will be no impact to the financial statements.
NOTE K
Other
In October 2016, the U.S. Securities and Exchange Commission adopted new rules and amended existing rules (together, “final rules”) intended to modernize the reporting and disclosure of information by registered investment companies. In part, the final rules amend Regulation S-X and require standardized, enhanced disclosure about derivatives in investment company financial statements, as well as other amendments. The compliance date for the amendments to Regulation S-X is August 1, 2017. Management is currently evaluating the impact that the adoption of the amendments to Regulation S-X will have on the financial statements and related disclosures.
NOTE L
Subsequent Events
Management has evaluated subsequent events for possible recognition or disclosure in the financial statements through the date the financial statements are issued. Management has determined that there are no material events that would require disclosure in the Fund’s financial statements through this date.
| | | | |
| AB GLOBAL REAL ESTATE INVESTMENT FUND • | | | 43 | |
Notes to Financial Statements
FINANCIAL HIGHLIGHTS
Selected Data For A Share Of Beneficial Interest Outstanding Throughout Each Period
| | | | | | | | | | | | | | | | | | | | |
| | | Class A | |
| | | Year Ended November 30, | |
| | 2016 | | | 2015 | | | 2014 | | | 2013 | | | 2012 | |
| | | | |
| | | | | | | | | | | | | | | | | | | | |
Net asset value, beginning of period | | | $ 13.95 | | | | $ 14.65 | | | | $ 13.39 | | | | $ 12.91 | | | | $ 10.89 | |
| | | | |
Income From Investment Operations | | | | | | | | | | | | | | | | | | | | |
Net investment income(a) | | | .29 | | | | .25 | | | | .28 | | | | .28 | | | | .22 | |
Net realized and unrealized gain (loss) on investment and foreign currency transactions | | | (.12 | ) | | | (.30 | ) | | | 1.48 | | | | .98 | | | | 2.19 | |
| | | | |
Net increase (decrease) in net asset value from operations | | | .17 | | | | (.05 | ) | | | 1.76 | | | | 1.26 | | | | 2.41 | |
| | | | |
Less: Dividends | | | | | | | | | | | | | | | | | | | | |
Dividends from net investment income | | | (.51 | ) | | | (.65 | ) | | | (.50 | ) | | | (.78 | ) | | | (.39 | ) |
| | | | |
Net asset value, end of period | | | $ 13.61 | | | | $ 13.95 | | | | $ 14.65 | | | | $ 13.39 | | | | $ 12.91 | |
| | | | |
Total Return | | | | | | | | | | | | | | | | | | | | |
Total investment return based on net asset value(b) | | | 1.13 | % | | | (0.36 | )% | | | 13.68 | % | | | 10.10 | %* | | | 22.95 | % |
Ratios/Supplemental Data | | | | | | | | | | | | | | | | | | | | |
Net assets, end of period
(000’s omitted) | | | $70,984 | | | | $76,020 | | | | $105,467 | | | | $79,216 | | | | $87,013 | |
Ratio to average net assets of: | | | | | | | | | | | | | | | | | | | | |
Expenses, net of waivers/reimbursements | | | 1.29 | % | | | 1.30 | % | | | 1.37 | % | | | 1.40 | % | | | 1.50 | % |
Expenses, before waivers/reimbursements | | | 1.29 | % | | | 1.30 | % | | | 1.37 | % | | | 1.40 | % | | | 1.50 | % |
Net investment income | | | 2.04 | % | | | 1.76 | % | | | 2.01 | % | | | 2.12 | % | | | 1.84 | % |
Portfolio turnover rate | | | 83 | % | | | 73 | % | | | 90 | % | | | 115 | % | | | 108 | % |
See footnote summary on page 50.
| | |
| 44 | | • AB GLOBAL REAL ESTATE INVESTMENT FUND |
Financial Highlights
Selected Data For A Share Of Beneficial Interest Outstanding Throughout Each Period
| | | | | | | | | | | | | | | | | | | | |
| | | Class B | |
| | | Year Ended November 30, | |
| | 2016 | | | 2015 | | | 2014 | | | 2013 | | | 2012 | |
| | | | |
| | | | | | | | | | | | | | | | | | | | |
Net asset value, beginning of period | | | $ 13.79 | | | | $ 14.36 | | | | $ 13.08 | | | | $ 12.60 | | | | $ 10.62 | |
| | | | |
Income From Investment Operations | | | | | | | | | | | | | | | | | | | | |
Net investment income(a) | | | .19 | | | | .14 | | | | .18 | | | | .18 | | | | .13 | |
Net realized and unrealized gain (loss) on investment and foreign currency transactions | | | (.13 | ) | | | (.30 | ) | | | 1.45 | | | | .96 | | | | 2.14 | |
| | | | |
Net increase (decrease) in net asset value from operations | | | .06 | | | | (.16 | ) | | | 1.63 | | | | 1.14 | | | | 2.27 | |
| | | | |
Less: Dividends | | | | | | | | | | | | | | | | | | | | |
Dividends from net investment income | | | (.39 | ) | | | (.41 | ) | | | (.35 | ) | | | (.66 | ) | | | (.29 | ) |
| | | | |
Net asset value, end of period | | | $ 13.46 | | | | $ 13.79 | | | | $ 14.36 | | | | $ 13.08 | | | | $ 12.60 | |
| | | | |
Total Return | | | | | | | | | | | | | | | | | | | | |
Total investment return based on net asset value(b) | | | 0.36 | % | | | (1.15 | )% | | | 12.86 | % | | | 9.31 | %* | | | 21.91 | % |
Ratios/Supplemental Data | | | | | | | | | | | | | | | | | | | | |
Net assets, end of period
(000’s omitted) | | | $786 | | | | $1,132 | | | | $1,822 | | | | $2,531 | | | | $3,915 | |
Ratio to average net assets of: | | | | | | | | | | | | | | | | | | | | |
Expenses, net of waivers/reimbursements | | | 2.09 | % | | | 2.09 | % | | | 2.13 | % | | | 2.13 | % | | | 2.30 | % |
Expenses, before waivers/reimbursements | | | 2.09 | % | | | 2.09 | % | | | 2.13 | % | | | 2.13 | % | | | 2.30 | % |
Net investment income | | | 1.33 | % | | | 1.00 | % | | | 1.37 | % | | | 1.36 | % | | | 1.16 | % |
Portfolio turnover rate | | | 83 | % | | | 73 | % | | | 90 | % | | | 115 | % | | | 108 | % |
See footnote summary on page 50.
| | | | |
| AB GLOBAL REAL ESTATE INVESTMENT FUND • | | | 45 | |
Financial Highlights
Selected Data For A Share Of Beneficial Interest Outstanding Throughout Each Period
| | | | | | | | | | | | | | | | | | | | |
| | | Class C | |
| | | Year Ended November 30, | |
| | 2016 | | | 2015 | | | 2014 | | | 2013 | | | 2012 | |
| | | | |
| | | | | | | | | | | | | | | | | | | | |
Net asset value, beginning of period | | | $ 13.80 | | | | $ 14.41 | | | | $ 13.18 | | | | $ 12.71 | | | | $ 10.72 | |
| | | | |
Income From Investment Operations | | | | | | | | | | | | | | | | | | | | |
Net investment income(a) | | | .17 | | | | .14 | | | | .18 | | | | .19 | | | | .14 | |
Net realized and unrealized gain (loss) on investment and foreign currency transactions | | | (.11 | ) | | | (.29 | ) | | | 1.46 | | | | .96 | | | | 2.15 | |
| | | | |
Net increase (decrease) in net asset value from operations | | | .06 | | | | (.15 | ) | | | 1.64 | | | | 1.15 | | | | 2.29 | |
| | | | |
Less: Dividends | | | | | | | | | | | | | | | | | | | | |
Dividends from net investment income | | | (.40 | ) | | | (.46 | ) | | | (.41 | ) | | | (.68 | ) | | | (.30 | ) |
| | | | |
Net asset value, end of period | | | $ 13.46 | | | | $ 13.80 | | | | $ 14.41 | | | | $ 13.18 | | | | $ 12.71 | |
| | | | |
Total Return | | | | | | | | | | | | | | | | | | | | |
Total investment return based on net asset value(b) | | | 0.38 | % | | | (1.04 | )% | | | 12.89 | % | | | 9.34 | %* | | | 22.02 | % |
Ratios/Supplemental Data | | | | | | | | | | | | | | | | | | | | |
Net assets, end of period
(000’s omitted) | | | $21,627 | | | | $21,246 | | | | $22,426 | | | | $22,058 | | | | $18,989 | |
Ratio to average net assets of: | | | | | | | | | | | | | | | | | | | | |
Expenses, net of waivers/reimbursements | | | 2.04 | % | | | 2.05 | % | | | 2.08 | % | | | 2.11 | % | | | 2.23 | % |
Expenses, before waivers/reimbursements | | | 2.05 | % | | | 2.05 | % | | | 2.08 | % | | | 2.11 | % | | | 2.23 | % |
Net investment income | | | 1.22 | % | | | .99 | % | | | 1.32 | % | | | 1.46 | % | | | 1.18 | % |
Portfolio turnover rate | | | 83 | % | | | 73 | % | | | 90 | % | | | 115 | % | | | 108 | % |
See footnote summary on page 50.
| | |
| 46 | | • AB GLOBAL REAL ESTATE INVESTMENT FUND |
Financial Highlights
Selected Data For A Share Of Beneficial Interest Outstanding Throughout Each Period
| | | | | | | | | | | | | | | | | | | | |
| | | Advisor Class | |
| | | Year Ended November 30, | |
| | | 2016 | | | 2015 | | | 2014 | | | 2013 | | | 2012 | |
| | | | |
| | | | | | | | | | | | | | | | | | | | |
Net asset value, beginning of period | | | $ 13.83 | | | | $ 14.57 | | | | $ 13.33 | | | | $ 12.85 | | | | $ 10.86 | |
| | | | |
Income From Investment Operations | | | | | | | | | | | | | | | | | | | | |
Net investment income(a) | | | .32 | | | | .28 | | | | .29 | | | | .32 | | | | .26 | |
Net realized and unrealized gain (loss) on investment and foreign currency transactions | | | (.11 | ) | | | (.29 | ) | | | 1.50 | | | | .97 | | | | 2.16 | |
| | | | |
Net increase (decrease) in net asset value from operations | | | .21 | | | | (.01 | ) | | | 1.79 | | | | 1.29 | | | | 2.42 | |
| | | | |
Less: Dividends | | | | | | | | | | | | | | | | | | | | |
Dividends from net investment income | | | (.55 | ) | | | (.73 | ) | | | (.55 | ) | | | (.81 | ) | | | (.43 | ) |
| | | | |
Net asset value, end of period | | | $ 13.49 | | | | $ 13.83 | | | | $ 14.57 | | | | $ 13.33 | | | | $ 12.85 | |
| | | | |
Total Return | | | | | | | | | | | | | | | | | | | | |
Total investment return based on net asset value(b) | | | 1.42 | % | | | (0.07 | )% | | | 14.02 | % | | | 10.46 | %* | | | 23.23 | % |
Ratios/Supplemental Data | | | | | | | | | | | | | | | | | | | | |
Net assets, end of period
(000’s omitted) | | | $37,191 | | | | $26,202 | | | | $35,882 | | | | $13,274 | | | | $7,622 | |
Ratio to average net assets of: | | | | | | | | | | | | | | | | | | | | |
Expenses, net of waivers/reimbursements | | | 1.03 | % | | | 1.04 | % | | | 1.07 | % | | | 1.10 | % | | | 1.20 | % |
Expenses, before waivers/reimbursements | | | 1.03 | % | | | 1.04 | % | | | 1.07 | % | | | 1.10 | % | | | 1.20 | % |
Net investment income | | | 2.27 | % | | | 1.96 | % | | | 2.12 | % | | | 2.37 | % | | | 2.16 | % |
Portfolio turnover rate | | | 83 | % | | | 73 | % | | | 90 | % | | | 115 | % | | | 108 | % |
See footnote summary on page 50
| | | | |
| AB GLOBAL REAL ESTATE INVESTMENT FUND • | | | 47 | |
Financial Highlights
Selected Data For A Share Of Beneficial Interest Outstanding Throughout Each Period
| | | | | | | | | | | | | | | | | | | | |
| | | Class R | |
| | | Year Ended November 30, | |
| | | 2016 | | | 2015 | | | 2014 | | | 2013 | | | 2012 | |
| | | | |
| | | | | | | | | | | | | | | | | | | | |
Net asset value, beginning of period | | | $ 13.80 | | | | $ 14.46 | | | | $ 13.22 | | | | $ 12.77 | | | | $ 10.79 | |
| | | | |
Income From Investment Operations | | | | | | | | | | | | | | | | | | | | |
Net investment income(a) | | | .24 | | | | .20 | | | | .24 | | | | .25 | | | | .19 | |
Net realized and unrealized gain (loss) on investment and foreign currency transactions | | | (.13 | ) | | | (.29 | ) | | | 1.46 | | | | .96 | | | | 2.17 | |
| | | | |
Net increase (decrease) in net asset value from operations | | | .11 | | | | (.09 | ) | | | 1.70 | | | | 1.21 | | | | 2.36 | |
| | | | |
Less: Dividends | | | | | | | | | | | | | | | | | | | | |
Dividends from net investment income | | | (.46 | ) | | | (.57 | ) | | | (.46 | ) | | | (.76 | ) | | | (.38 | ) |
| | | | |
Net asset value, end of period | | | $ 13.45 | | | | $ 13.80 | | | | $ 14.46 | | | | $ 13.22 | | | | $ 12.77 | |
| | | | |
Total Return | | | | | | | | | | | | | | | | | | | | |
Total investment return based on net asset value(b) | | | 0.76 | % | | | (0.60 | )% | | | 13.41 | % | | | 9.78 | %* | | | 22.64 | % |
Ratios/Supplemental Data | | | | | | | | | | | | | | | | | | | | |
Net assets, end of period
(000’s omitted) | | | $8,654 | | | | $9,583 | | | | $10,296 | | | | $9,477 | | | | $8,904 | |
Ratio to average net assets of: | | | | | | | | | | | | | | | | | | | | |
Expenses, net of waivers/reimbursements | | | 1.60 | % | | | 1.62 | % | | | 1.65 | % | | | 1.65 | % | | | 1.74 | % |
Expenses, before waivers/reimbursements | | | 1.60 | % | | | 1.62 | % | | | 1.65 | % | | | 1.65 | % | | | 1.74 | % |
Net investment income | | | 1.72 | % | | | 1.41 | % | | | 1.74 | % | | | 1.89 | % | | | 1.66 | % |
Portfolio turnover rate | | | 83 | % | | | 73 | % | | | 90 | % | | | 115 | % | | | 108 | % |
See footnote summary on page 50.
| | |
| 48 | | • AB GLOBAL REAL ESTATE INVESTMENT FUND |
Financial Highlights
Selected Data For A Share Of Beneficial Interest Outstanding Throughout Each Period
| | | | | | | | | | | | | | | | | | | | |
| | | Class K | |
| | | Year Ended November 30, | |
| | | 2016 | | | 2015 | | | 2014 | | | 2013 | | | 2012 | |
| | | | |
| | | | | | | | | | | | | | | | | | | | |
Net asset value, beginning of period | | | $ 13.85 | | | | $ 14.55 | | | | $ 13.31 | | | | $ 12.84 | | | | $ 10.85 | |
| | | | |
Income From Investment Operations | | | | | | | | | | | | | | | | | | | | |
Net investment income(a) | | | .28 | | | | .25 | | | | .28 | | | | .30 | | | | .24 | |
Net realized and unrealized gain (loss) on investment and
foreign currency transactions | | | (.11 | ) | | | (.30 | ) | | | 1.47 | | | | .96 | | | | 2.16 | |
| | | | |
Net increase (decrease) in net asset value from operations | | | .17 | | | | (.05 | ) | | | 1.75 | | | | 1.26 | | | | 2.40 | |
| | | | |
Less: Dividends | | | | | | | | | | | | | | | | | | | | |
Dividends from net investment income | | | (.51 | ) | | | (.65 | ) | | | (.51 | ) | | | (.79 | ) | | | (.41 | ) |
| | | | |
Net asset value, end of period | | | $ 13.51 | | | | $ 13.85 | | | | $ 14.55 | | | | $ 13.31 | | | | $ 12.84 | |
| | | | |
Total Return | | | | | | | | | | | | | | | | | | | | |
Total investment return based on net asset value(b) | | | 1.13 | % | | | (0.33 | )% | | | 13.72 | % | | | 10.14 | %* | | | 22.98 | % |
Ratios/Supplemental Data | | | | | | | | | | | | | | | | | | | | |
Net assets, end of period
(000’s omitted) | | | $9,530 | | | | $10,471 | | | | $10,767 | | | | $10,083 | | | | $8,713 | |
Ratio to average net assets of: | | | | | | | | | | | | | | | | | | | | |
Expenses, net of waivers/reimbursements | | | 1.30 | % | | | 1.30 | % | | | 1.34 | % | | | 1.34 | % | | | 1.43 | % |
Expenses, before waivers/reimbursements | | | 1.30 | % | | | 1.30 | % | | | 1.34 | % | | | 1.34 | % | | | 1.43 | % |
Net investment income | | | 2.02 | % | | | 1.73 | % | | | 2.08 | % | | | 2.22 | % | | | 2.01 | % |
Portfolio turnover rate | | | 83 | % | | | 73 | % | | | 90 | % | | | 115 | % | | | 108 | % |
See footnote summary on page 50.
| | | | |
| AB GLOBAL REAL ESTATE INVESTMENT FUND • | | | 49 | |
Financial Highlights
Selected Data For A Share Of Beneficial Interest Outstanding Throughout Each Period
| | | | | | | | | | | | | | | | | | | | |
| | | Class I | |
| | | Year Ended November 30, | |
| | | 2016 | | | 2015 | | | 2014 | | | 2013 | | | 2012 | |
| | | | |
| | | | | | | | | | | | | | | | | | | | |
Net asset value, beginning of period | | | $ 13.91 | | | | $ 14.64 | | | | $ 13.39 | | | | $ 12.90 | | | | $ 10.90 | |
| | | | |
Income From Investment Operations | | | | | | | | | | | | | | | | | | | | |
Net investment income(a) | | | .33 | | | | .26 | | | | .33 | | | | .34 | | | | .28 | |
Net realized and unrealized gain (loss) on investment and
foreign currency transactions | | | (.12 | ) | | | (.26 | ) | | | 1.48 | | | | .96 | | | | 2.16 | |
| | | | |
Net increase in net asset value from operations | | | .21 | | | | .00 | (c) | | | 1.81 | | | | 1.30 | | | | 2.44 | |
| | | | |
Less: Dividends | | | | | | | | | | | | | | | | | | | | |
Dividends from net investment income | | | (.55 | ) | | | (.73 | ) | | | (.56 | ) | | | (.81 | ) | | | (.44 | ) |
| | | | |
Net asset value, end of period | | | $ 13.57 | | | | $ 13.91 | | | | $ 14.64 | | | | $ 13.39 | | | | $ 12.90 | |
| | | | |
Total Return | | | | | | | | | | | | | | | | | | | | |
Total investment return based on net asset value(b) | | | 1.47 | % | | | 0.04 | % | | | 14.11 | % | | | 10.50 | %* | | | 23.38 | % |
Ratios/Supplemental Data | | | | | | | | | | | | | | | | | | | | |
Net assets, end of period
(000’s omitted) | | | $4,477 | | | | $4,039 | | | | $2,485 | | | | $2,092 | | | | $1,976 | |
Ratio to average net assets of: | | | | | | | | | | | | | | | | | | | | |
Expenses, net of waivers/reimbursements | | | .95 | % | | | .99 | % | | | 1.01 | % | | | 1.03 | % | | | 1.10 | % |
Expenses, before waivers/reimbursements | | | .95 | % | | | .99 | % | | | 1.01 | % | | | 1.03 | % | | | 1.10 | % |
Net investment income | | | 2.34 | % | | | 1.83 | % | | | 2.38 | % | | | 2.53 | % | | | 2.36 | % |
Portfolio turnover rate | | | 83 | % | | | 73 | % | | | 90 | % | | | 115 | % | | | 108 | % |
| (a) | | Based on average shares outstanding. |
| (b) | | Total investment return is calculated assuming an initial investment made at the net asset value at the beginning of the period, reinvestment of all dividends and distributions at net asset value during the period, and redemption on the last day of the period. Initial sales charge or contingent deferred sales charge is not reflected in the calculation of total investment return. Total return does not reflect the deduction of taxes that a shareholder would pay on fund distributions or the redemption of fund shares. Total investment return for a period of less than one year is not annualized. |
| (c) | | Amount is less than $.005. |
| * | | Includes the impact of proceeds received and credited to the Fund resulting from a third party regulatory settlement, which enhanced the Fund’s performance for the year ended November 30, 2013 by 0.03%. |
See notes to financial statements.
| | |
| 50 | | • AB GLOBAL REAL ESTATE INVESTMENT FUND |
Financial Highlights
REPORT OF INDEPENDENT REGISTERED
PUBLIC ACCOUNTING FIRM
To the Board of Directors and Shareholders of AB Global Real Estate Investment Fund, Inc.
We have audited the accompanying statement of assets and liabilities, including the portfolio of investments, of AB Global Real Estate Investment Fund, Inc. (the “Fund”), as of November 30, 2016, and the related statement of operations for the year then ended, the statements of changes in net assets for each of the two years in the period then ended, and the financial highlights for each of the five years in the period then ended. These financial statements and financial highlights are the responsibility of the Fund’s management. Our responsibility is to express an opinion on these financial statements and financial highlights based on our audits.
We conducted our audits in accordance with the standards of the Public Company Accounting Oversight Board (United States). Those standards require that we plan and perform the audit to obtain reasonable assurance about whether the financial statements and financial highlights are free of material misstatement. We were not engaged to perform an audit of the Fund’s internal control over financial reporting. Our audits included consideration of internal control over financial reporting as a basis for designing audit procedures that are appropriate in the circumstances, but not for the purpose of expressing an opinion on the effectiveness of the Fund’s internal control over financial reporting. Accordingly, we express no such opinion. An audit also includes examining, on a test basis, evidence supporting the amounts and disclosures in the financial statements and financial highlights, assessing the accounting principles used and significant estimates made by management, and evaluating the overall financial statement presentation. Our procedures included confirmation of securities owned as of November 30, 2016, by correspondence with the custodian and others, or by other appropriate auditing procedures where replies from others were not received. We believe that our audits provide a reasonable basis for our opinion.
In our opinion, the financial statements and financial highlights referred to above present fairly, in all material respects, the financial position of AB Global Real Estate Investment Fund, Inc. at November 30, 2016, the results of its operations for the year then ended, the changes in its net assets for each of the two years in the period then ended, and the financial highlights for each of the five years in the period then ended, in conformity with U.S. generally accepted accounting principles.

New York, New York
January 26, 2017
| | | | |
| AB GLOBAL REAL ESTATE INVESTMENT FUND • | | | 51 | |
Report of Independent Registered Public Accounting Firm
2016 FEDERAL TAX INFORMATION
(unaudited)
For Federal income tax purposes, the following information is furnished with respect to the distributions paid by the Fund during the taxable year ended November 30, 2016. For corporate shareholders, 4.97% of dividends paid qualify for the dividends received deduction.
For the taxable year ended November 30, 2016, the Fund designates $710,244 as the maximum amount that may be considered qualified dividend income for individual shareholders.
Shareholders should not use the above information to prepare their income tax returns. The information necessary to complete your income tax returns will be included with your Form 1099-DIV which will be sent to you separately in January 2017.
| | |
| 52 | | • AB GLOBAL REAL ESTATE INVESTMENT FUND |
BOARD OF DIRECTORS
Marshall C. Turner, Jr(1) , Chairman
John H. Dobkin(1)
Michael J. Downey(1)
William H. Foulk, Jr.(1)
D. James Guzy(1)
Nancy P. Jacklin(1)
Robert M. Keith, President and Chief Executive Officer
Carol C. McMullen(1)
Garry L. Moody(1)
Earl D. Weiner(1)
OFFICERS
Philip L. Kirstein, Senior Vice President and Independent Compliance Officer
Eric J. Franco(2), Vice President
Emilie D. Wrapp, Secretary
Joseph J. Mantineo, Treasurer and Chief Financial Officer
Phyllis J. Clarke, Controller
Vincent S. Noto, Chief Compliance Officer
| | |
Custodian and Accounting Agent Brown Brothers Harriman & Co.
50 Post Office Square
Boston, MA 02110 Principal Underwriter AllianceBernstein Investments, Inc.
1345 Avenue of the Americas
New York, NY 10105 Legal Counsel Seward & Kissel LLP
One Battery Park Plaza
New York, NY 10004 | | Independent Registered Public Accounting Firm Ernst & Young LLP
5 Times Square
New York, NY 10036 Transfer Agent AllianceBernstein Investor
Services, Inc.
P.O. Box 786003
San Antonio, TX 78278-6003
Toll-Free (800) 221-5672 |
| (1) | | Member of the Audit Committee, the Governance and Nominating Committee and the Independent Directors Committee. |
| (2) | | The day-to-day management of, and investment decisions for, the Fund’s portfolio are made by the Global REIT Senior Investment Management Team. Mr. Eric J. Franco is the investment professional with the most significant responsibility for the day-to-day management of the Fund’s portfolio. |
| | | | |
| AB GLOBAL REAL ESTATE INVESTMENT FUND • | | | 53 | |
Board of Directors
MANAGEMENT OF THE FUND
Board of Directors Information
The business and affairs of the Fund are managed under the direction of the Board of Directors. Certain information concerning the Fund’s Directors is set forth below.
| | | | | | | | |
NAME, ADDRESS* AND AGE (YEAR FIRST ELECTED**) | | PRINCIPAL
OCCUPATION(S)
DURING PAST FIVE YEARS
AND OTHER INFORMATION*** | | PORTFOLIOS
IN FUND
COMPLEX
OVERSEEN BY
DIRECTOR | | | OTHER
PUBLIC COMPANY
DIRECTORSHIPS
CURRENTLY
HELD BY
DIRECTOR |
| INTERESTED DIRECTOR | | | | | | |
Robert M. Keith, +
1345 Avenue of the Americas
New York, NY 10105
56 (2010) | | Senior Vice President of AllianceBernstein L.P. (the “Adviser”) and head of AllianceBernstein Investments, Inc. (“ABI”) since July 2008; Director of ABI and President of the AB Mutual Funds. Previously, he served as Executive Managing Director of ABI from December 2006 to June 2008. Prior to joining ABI in 2006, Executive Managing Director of Bernstein Global Wealth Management, and prior thereto, Senior Managing Director and Global Head of Client Service and Sales of the Adviser’s institutional investment management business since 2004. Prior thereto, he was Managing Director and Head of North American Client Service and Sales in the Adviser’s institutional investment management business, with which he had been associated since prior to 2004. | | | 108 | | | None |
| | |
| 54 | | • AB GLOBAL REAL ESTATE INVESTMENT FUND |
Management of the Fund
| | | | | | | | |
NAME, ADDRESS* AND AGE (YEAR FIRST ELECTED**) | | PRINCIPAL
OCCUPATION(S)
DURING PAST FIVE YEARS
AND OTHER INFORMATION*** | | PORTFOLIOS
IN FUND
COMPLEX
OVERSEEN BY
DIRECTOR | | | OTHER
PUBLIC COMPANY
DIRECTORSHIPS
CURRENTLY
HELD BY
DIRECTOR |
| DISINTERESTED DIRECTORS |
Marshall C. Turner, Jr. # Chairman of the Board
75
(2005) | | Private Investor since prior to 2012. Former Chairman and CEO of Dupont Photomasks, Inc. (components of semi-conductor manufacturing). He has extensive operating leadership experience and venture capital investing experience, including five interim or full-time CEO roles, and prior service as general partner of institutional venture capital partnerships. He also has extensive non-profit board leadership experience, and currently serves on the boards of two education and science-related non-profit organizations. He has served as a director of one AB Fund since 1992, and director or trustee of multiple AB Funds since 2005. He has been Chairman of the AB Funds since January 2014, and the Chairman of the Independent Directors Committees of such AB Funds since February 2014. | | | 108 | | | Xilinx, Inc. (programmable logic semiconductors) since 2007 |
| | | | | | | | |
John H. Dobkin, # 74
(2002) | | Independent Consultant since prior to 2012. Formerly, President of Save Venice, Inc. (preservation organization) from 2001-2002, Senior Advisor from June 1999-June 2000 and President of Historic Hudson Valley (historic preservation) from December 1989-May 1999. Previously, Director of the National Academy of Design. He has served as a director or trustee of various AB Funds since 1992, and as Chairman of the Audit Committees of a number of such Funds from 2001-2008. | | | 108 | | | None |
| | | | |
| AB GLOBAL REAL ESTATE INVESTMENT FUND • | | | 55 | |
Management of the Fund
| | | | | | | | |
NAME, ADDRESS* AND AGE (YEAR FIRST ELECTED**) | | PRINCIPAL
OCCUPATION(S)
DURING PAST FIVE YEARS
AND OTHER INFORMATION*** | | PORTFOLIOS
IN FUND
COMPLEX
OVERSEEN BY
DIRECTOR | | | OTHER
PUBLIC COMPANY
DIRECTORSHIPS
CURRENTLY
HELD BY
DIRECTOR |
DISINTERESTED DIRECTORS (continued) |
Michael J. Downey, #
73
(2005) | | Private Investor since prior to 2012. Formerly, managing partner of Lexington Capital, LLC (investment advisory firm) from December 1997 until December 2003. He served as a Director of Prospect Acquisition Corp. (financial services) from 2007 until 2009. From 1987 until 1993, Chairman and CEO of Prudential Mutual Fund Management, director of the Prudential mutual funds, and member of the Executive Committee of Prudential Securities Inc. He has served as a director or trustee of the AB Funds since 2005 and is a director and Chairman of one other registered investment company. | | | 108 | | | The Asia Pacific Fund (registered investment company), Inc. since prior to 2012 |
| | | | | | | | |
William H. Foulk, Jr., #
84
(2002) | | Investment Adviser and an Independent Consultant since prior to 2012. Previously, he was Senior Manager of Barrett Associates, Inc., a registered investment adviser. He was formerly Deputy Comptroller and Chief Investment Officer of the State of New York and, prior thereto, Chief Investment Officer of the New York Bank for Savings. He has served as a director or trustee of various AB Funds since 1983, and was Chairman of the Independent Directors Committees of the AB Funds from 2003 until early February 2014. He served as Chairman of such AB Funds from 2003 through December 2013. He is also active in a number of mutual fund related organizations and committees. | | | 108 | | | None |
| | |
| 56 | | • AB GLOBAL REAL ESTATE INVESTMENT FUND |
Management of the Fund
| | | | | | | | |
NAME, ADDRESS* AND AGE (YEAR FIRST ELECTED**) | | PRINCIPAL
OCCUPATION(S)
DURING PAST FIVE YEARS
AND OTHER INFORMATION*** | | PORTFOLIOS
IN FUND
COMPLEX
OVERSEEN BY
DIRECTOR | | | OTHER
PUBLIC COMPANY
DIRECTORSHIPS
CURRENTLY
HELD BY
DIRECTOR |
DISINTERESTED DIRECTORS (continued) |
D. James Guzy, #
80
(2005) | | Chairman of the Board of SRC Computers, Inc. (semi-conductors), with which he has been associated since prior to 2012. He served as Chairman of the Board of PLX Technology (semi-conductors) since prior to 2012 until November 2013. He was a director of Intel Corporation (semi-conductors) from 1969 until 2008, and served as Chairman of the Finance Committee of such company for several years until May 2008. He has served as a director or trustee of one or more of the AB Funds since 1982. | | | 108 | | | None |
| | | | | | | | |
Nancy P. Jacklin, #
68
(2006) | | Private Investor since prior to 2012. Professorial Lecturer at the Johns Hopkins School of Advanced International Studies (2008-2015). U.S. Executive Director of the International Monetary Fund (which is responsible for ensuring the stability of the international monetary system) (December 2002-May 2006); Partner, Clifford Chance (1992-2002); Sector Counsel, International Banking and Finance, and Associate General Counsel, Citicorp (1985-1992); Assistant General Counsel (International), Federal Reserve Board of Governors (1982-1985); and Attorney Advisor, U.S. Department of the Treasury (1973-1982). Member of the Bar of the District of Columbia and of New York; and member of the Council on Foreign Relations. She has served as a director or trustee of the AB Funds since 2006 and has been Chairman of the Governance and Nominating Committees of the AB Funds since August 2014. | | | 108 | | | None |
| | | | |
| AB GLOBAL REAL ESTATE INVESTMENT FUND • | | | 57 | |
Management of the Fund
| | | | | | | | |
NAME, ADDRESS* AND AGE (YEAR FIRST ELECTED**) | | PRINCIPAL
OCCUPATION(S)
DURING PAST FIVE YEARS
AND OTHER INFORMATION*** | | PORTFOLIOS
IN FUND
COMPLEX
OVERSEEN BY
DIRECTOR | | | OTHER
PUBLIC COMPANY
DIRECTORSHIPS
CURRENTLY
HELD BY
DIRECTOR |
DISINTERESTED DIRECTORS (continued) |
Carol C. McMullen, #
61
(2016) | | Managing Director of Slalom Consulting (consulting) since 2014, private investor and member of the Partners Healthcare Investment Committee. Formerly, Director of Norfolk & Dedham Group (mutual property and casualty insurance) from 2011 until November 2016; Director of Partners Community Physicians Organization (healthcare) since 2014 until December 2016; and Managing Director of The Crossland Group (consulting) from 2012 to 2013. She has held a number of senior positions in the asset and wealth management industries, including at Eastern Bank (where her roles included President of Eastern Wealth Management), Thomson Financial (Global Head of Sales for Investment Management), and Putnam Investments (where her roles included Head of Global Investment Research). She has served on a number of private company and nonprofit boards, and as a director or trustee of the AB Funds since June 2016. | | | 108 | | | None |
| | |
| 58 | | • AB GLOBAL REAL ESTATE INVESTMENT FUND |
Management of the Fund
| | | | | | | | |
NAME, ADDRESS* AND AGE (YEAR FIRST ELECTED**) | | PRINCIPAL
OCCUPATION(S)
DURING PAST FIVE YEARS
AND OTHER INFORMATION*** | | PORTFOLIOS
IN FUND
COMPLEX
OVERSEEN BY
DIRECTOR | | | OTHER
PUBLIC COMPANY
DIRECTORSHIPS
CURRENTLY
HELD BY
DIRECTOR |
DISINTERESTED DIRECTORS (continued) |
Garry L. Moody, #
64
(2008) | | Independent Consultant. Formerly, Partner, Deloitte & Touche LLP (1995-2008) where he held a number of senior positions, including Vice Chairman, and U.S. and Global Investment Management Practice Managing Partner; President, Fidelity Accounting and Custody Services Company (1993-1995), where he was responsible for accounting, pricing, custody and reporting for the Fidelity mutual funds; and Partner, Ernst & Young LLP (1975-1993), where he served as the National Director of Mutual Fund Tax Services and Managing Partner of its Chicago Office Tax department. He is a member of the Trustee Advisory Board of BoardIQ, a biweekly publication focused on issues and news affecting directors of mutual funds. He has served as a director or trustee, and as Chairman of the Audit Committees, of the AB Funds since 2008. | | | 108 | | | None |
| | | | | | | | |
Earl D. Weiner, #
77
(2007) | | Of Counsel, and Partner prior to January 2007, of the law firm Sullivan & Cromwell LLP and is a former member of the ABA Federal Regulation of Securities Committee Task Force to draft editions of the Fund Director’s Guidebook. He also serves as a director or trustee of various non-profit organizations and has served as Chairman or Vice Chairman of a number of them. He has served as a director or trustee of the AB Funds since 2007 and served as Chairman of the Governance and Nominating Committees of the AB Funds from 2007 until August 2014. | | | 108 | | | None |
| | | | |
| AB GLOBAL REAL ESTATE INVESTMENT FUND • | | | 59 | |
Management of the Fund
| * | | The address for each of the Fund’s disinterested Directors is c/o AllianceBernstein L.P., Attention: Philip L. Kirstein, 1345 Avenue of the Americas, New York, NY 10105. |
| ** | | There is no stated term of office for the Fund’s Directors. |
| *** | | The information above includes each Director’s principal occupation during the last five years and other information relating to the experience, attributes and skills relevant to each Director’s qualifications to serve as a Director, which led to the conclusion that each Director should serve as a Director for the Fund. |
| + | | Mr. Keith is an “interested person” of the Fund, as defined in the “1940 Act”, due to his position as a Senior Vice President of the Adviser. |
| # | | Member of the Audit Committee, the Governance and Nominating Committee and the Independent Directors Committee. |
| | |
| 60 | | • AB GLOBAL REAL ESTATE INVESTMENT FUND |
Management of the Fund
Officer Information
Certain information concerning the Fund’s officers is set forth below.
| | | | |
NAME, ADDRESS,* AND AGE | | POSITION(S) HELD WITH FUND | | PRINCIPAL OCCUPATION DURING PAST 5 YEARS |
Robert M. Keith
56 | | President and Chief Executive Officer | | See biography above. |
| | | | |
Philip L. Kirstein
71 | | Senior Vice President and Independent Compliance Officer | | Senior Vice President and Independent Compliance Officer of the AB Funds, with which he has been associated since October 2004. Prior thereto, he was Of Counsel to Kirkpatrick & Lockhart, LLP from October 2003 to October 2004, and General Counsel of Merrill Lynch Investment Managers, L.P. since prior to March 2003. |
| | | | |
Eric J. Franco
56 | | Vice President | | Senior Vice President of the Adviser**, with which he has been associated since prior to 2012. |
| | | | |
Emilie D. Wrapp
61 | | Secretary | | Senior Vice President, Assistant General Counsel and Assistant Secretary of ABI**, with which she has been associated since prior to 2012. |
| | | | |
Joseph J. Mantineo
57 | | Treasurer and Chief Financial Officer | | Senior Vice President of AllianceBernstein Investor Services, Inc. (“ABIS”)**, with which he has been associated since prior to 2012. |
| | | | |
Phyllis J. Clarke
56 | | Controller | | Vice President of ABIS**, with which she has been associated since prior to 2012. |
| | | | |
Vincent S. Noto
52 | | Chief Compliance Officer | | Senior Vice President since 2015 and Mutual Fund Chief Compliance Officer of the Adviser** since 2014. Prior thereto, he was Vice President and Director of Mutual Fund Compliance of the Adviser since prior to 2012. |
| * | | The address for each of the Fund’s Officers is 1345 Avenue of the Americas, New York, NY 10105. |
| ** | | The Adviser, ABI and ABIS are affiliates of the Fund. |
| | | The Fund’s Statement of Additional Information (“SAI”) has additional information about the Fund’s Directors and Officers and is available without charge upon request. Contact your financial representative or AB at (800) 227-4618, or visit www.abfunds.com, for a free prospectus or SAI. |
| | | | |
| AB GLOBAL REAL ESTATE INVESTMENT FUND • | | | 61 | |
Management of the Fund
Information Regarding the Review and Approval of the Fund’s Advisory Agreement
The disinterested directors (the “directors”) of AB Global Real Estate Investment Fund, Inc. (the “Fund”) unanimously approved the continuance of the Advisory Agreement with the Adviser at a meeting held on May 3-5, 2016 (the “Meeting”).
Prior to approval of the continuance of the Advisory Agreement, the directors had requested from the Adviser, and received and evaluated, extensive materials. They reviewed the proposed continuance of the Advisory Agreement with the Adviser and with experienced counsel who are independent of the Adviser, who advised on the relevant legal standards. The directors also reviewed an independent evaluation prepared by the Fund’s Senior Officer (who is also the Fund’s Independent Compliance Officer) of the reasonableness of the advisory fee, in which the Senior Officer concluded that the contractual fee for the Fund was reasonable. The directors also discussed the proposed continuance in private sessions with counsel and the Fund’s Senior Officer.
The directors considered their knowledge of the nature and quality of the services provided by the Adviser to the Fund gained from their experience as directors or trustees of most of the registered investment companies advised by the Adviser, their overall confidence in the Adviser’s integrity and competence they have gained from that experience, the Adviser’s initiative in identifying and raising potential issues with the directors and its responsiveness, frankness and attention to concerns raised by the directors in the past, including the Adviser’s willingness to consider and implement organizational and operational changes designed to improve investment results and the services provided to the AB Funds. The directors noted that they have four regular meetings each year, at each of which they receive presentations from the Adviser on the investment results of the Fund and review extensive materials and information presented by the Adviser.
The directors also considered all other factors they believed relevant, including the specific matters discussed below. In their deliberations, the directors did not identify any particular information that was all-important or controlling, and different directors may have attributed different weights to the various factors. The directors determined that the selection of the Adviser to manage the Fund and the overall arrangements between the Fund and the Adviser, as provided in the Advisory Agreement, including the advisory fee, were fair and reasonable in light of the services performed, expenses incurred and such other matters as the directors considered relevant in the exercise of their
| | |
| 62 | | • AB GLOBAL REAL ESTATE INVESTMENT FUND |
business judgment. The material factors and conclusions that formed the basis for the directors’ determinations included the following:
Nature, Extent and Quality of Services Provided
The directors considered the scope and quality of services provided by the Adviser under the Advisory Agreement, including the quality of the investment research capabilities of the Adviser and the other resources it has dedicated to performing services for the Fund. They also noted the professional experience and qualifications of the Fund’s portfolio management team and other senior personnel of the Adviser. The directors also considered that the Advisory Agreement provides that the Fund will reimburse the Adviser for the cost to it of providing certain clerical, accounting, administrative and other services to the Fund by employees of the Adviser or its affiliates. Requests for these reimbursements are made on a quarterly basis and subject to approval by the directors. Reimbursements, to the extent requested and paid, result in a higher rate of total compensation from the Fund to the Adviser than the fee rate stated in the Advisory Agreement. The directors noted that the methodology used to determine the reimbursement amounts had been reviewed by an independent consultant retained by the Fund’s Senior Officer. The quality of administrative and other services, including the Adviser’s role in coordinating the activities of the Fund’s other service providers, also was considered. The directors concluded that, overall, they were satisfied with the nature, extent and quality of services provided to the Fund under the Advisory Agreement.
Costs of Services Provided and Profitability
The directors reviewed a schedule of the revenues, expenses and related notes indicating the profitability of the Fund to the Adviser for calendar years 2014 and 2015 that had been prepared with an expense allocation methodology arrived at in consultation with an independent consultant retained by the Fund’s Senior Officer. The directors noted the assumptions and methods of allocation used by the Adviser in preparing fund-specific profitability data and understood that there are a number of potentially acceptable allocation methodologies for information of this type. The directors noted that the profitability information reflected all revenues and expenses of the Adviser’s relationship with the Fund, including those relating to its subsidiaries that provide transfer agency, distribution and brokerage services to the Fund. The directors recognized that it is difficult to make comparisons of the profitability of the Advisory Agreement with the profitability of advisory contracts for unaffiliated funds because comparative information is not generally publicly available and is affected by numerous factors. The directors focused on the profitability of the Adviser’s relationship with the Fund before taxes and distribution expenses. The directors concluded that the Adviser’s level of profitability from its relationship with the Fund was not unreasonable.
| | | | |
| AB GLOBAL REAL ESTATE INVESTMENT FUND • | | | 63 | |
Fall-Out Benefits
The directors considered the other benefits to the Adviser and its affiliates from their relationships with the Fund, including, but not limited to, benefits relating to soft dollar arrangements (whereby investment advisers receive brokerage and research services from brokers that execute agency transactions for their clients); 12b-1 fees and sales charges received by the Fund’s principal underwriter (which is a wholly owned subsidiary of the Adviser) in respect of certain classes of the Fund’s shares; brokerage commissions paid by the Fund to brokers affiliated with the Adviser; and transfer agency fees paid by the Fund to a wholly owned subsidiary of the Adviser. The directors recognized that the Adviser’s profitability would be somewhat lower without these benefits. The directors understood that the Adviser also might derive reputational and other benefits from its association with the Fund.
Investment Results
In addition to the information reviewed by the directors in connection with the Meeting, the directors receive detailed performance information for the Fund at each regular Board meeting during the year.
At the Meeting, the directors reviewed information prepared by Broadridge Financial Solutions, Inc. (“Broadridge”), an analytical service that is not affiliated with the Adviser, showing the performance of the Class A Shares of the Fund against a peer group and a peer universe selected by Broadridge, and information prepared by the Adviser showing performance of the Class A Shares against a broad-based securities market index, in each case for the 1-, 3-, 5- and 10-year periods ended February 29, 2016 and (in the case of comparisons with the broad-based securities market index) the period since inception. Based on their review, the directors concluded that the Fund’s investment performance was acceptable.
Advisory Fees and Other Expenses
The directors considered the advisory fee rate paid by the Fund to the Adviser and information prepared by Broadridge concerning advisory fee rates paid by other funds in the same Broadridge category as the Fund at a common asset level. The directors recognized that it is difficult to make comparisons of advisory fees because there are variations in the services that are included in the fees paid by other funds. The directors considered the Fund’s contractual effective advisory fee rate against a peer group median and took into account the impact on the advisory fee rate of the administrative expense reimbursement paid to the Adviser in the latest fiscal year.
The directors also considered the Adviser’s fee schedule for institutional clients pursuing a similar investment style. For this purpose, they
| | |
| 64 | | • AB GLOBAL REAL ESTATE INVESTMENT FUND |
reviewed the relevant advisory fee information from the Adviser’s Form ADV and the evaluation from the Fund’s Senior Officer and noted the differences between the Fund’s fee schedule, on the one hand, and the institutional fee schedule and the schedule of fees charged to any offshore funds and any sub-advised funds, on the other. The directors noted that the Adviser may, in some cases, agree to fee rates with large institutional clients that are lower than those reviewed by the directors and that they had previously discussed with the Adviser its policies in respect of such arrangements. The directors also noted that the Adviser advises another AB Fund with a substantially similar investment style for the same fee schedule as the Fund.
The Adviser reviewed with the directors the significantly greater scope of the services it provides to the Fund relative to institutional, offshore fund and sub-advised fund clients. In light of the substantial differences in services rendered by the Adviser to institutional, offshore fund and sub-advised fund clients as compared to funds such as the Fund, the directors considered these fee comparisons inapt and did not place significant weight on them in their deliberations.
The directors also considered the total expense ratio of the Class A shares of the Fund in comparison to a peer group and a peer universe selected by Broadridge. The Class A expense ratio of the Fund was based on the Fund’s latest fiscal year. The directors noted that it was likely that the expense ratios of some of the other funds in the Fund��s Broadridge category were lowered by waivers or reimbursements by those funds’ investment advisers, which in some cases might be voluntary or temporary. The directors view expense ratio information as relevant to their evaluation of the Adviser’s services because the Adviser is responsible for coordinating services provided to the Fund by others. Based on their review, the directors concluded that the Fund’s expense ratio was acceptable.
Economies of Scale
The directors noted that the advisory fee schedule for the Fund contains breakpoints that reduce the fee rates on assets above specified levels. The directors took into consideration prior presentations by an independent consultant on economies of scale in the mutual fund industry and for the AB Funds, and by the Adviser concerning certain of its views on economies of scale. The directors also had requested and received from the Adviser certain updates on economies of scale in advance of the Meeting. The directors believe that economies of scale may be realized (if at all) by the Adviser across a variety of products and services, and not only in respect of a single fund. The directors noted that there is no established methodology for setting breakpoints that give effect to the fund-specific
| | | | |
| AB GLOBAL REAL ESTATE INVESTMENT FUND • | | | 65 | |
services provided by a fund’s adviser and to the economies of scale that an adviser may realize in its overall mutual fund business or those components of it which directly or indirectly affect a fund’s operations. The directors observed that in the mutual fund industry as a whole, as well as among funds similar to the Fund, there is no uniformity or pattern in the fees and asset levels at which breakpoints (if any) apply. The directors also noted that the advisory agreements for many funds do not have breakpoints at all. Having taken these factors into account, the directors concluded that the Fund’s shareholders would benefit from a sharing of economies of scale in the event the Fund’s net assets exceed a breakpoint in the future.
| | |
| 66 | | • AB GLOBAL REAL ESTATE INVESTMENT FUND |
THIS PAGE IS NOT PART OF THE SHAREHOLDER REPORT OR THE FINANCIAL STATEMENTS
AB FAMILY OF FUNDS
US EQUITY
US Core
Core Opportunities Fund
Select US Equity Portfolio
US Growth
Concentrated Growth Fund
Discovery Growth Fund
Growth Fund
Large Cap Growth Fund
Small Cap Growth Portfolio
US Value
Discovery Value Fund
Equity Income Fund
Relative Value Fund*
Small Cap Value Portfolio
Value Fund
INTERNATIONAL/ GLOBAL EQUITY
International/Global Core
Global Core Equity Portfolio
Global Equity & Covered Call Strategy Fund
International Portfolio
International Strategic Core Portfolio
Sustainable Global Thematic Fund*
Tax-Managed International Portfolio
International/Global Growth
International Growth Fund
International/Global Value
Asia ex-Japan Equity Portfolio
International Value Fund
FIXED INCOME
Municipal
High Income Municipal Portfolio
Intermediate California Municipal Portfolio
Intermediate Diversified Municipal Portfolio
Intermediate New York Municipal Portfolio
FIXED INCOME (continued)
Municipal Bond Inflation Strategy
Tax-Aware Fixed Income Portfolio
National Portfolio
Arizona Portfolio
California Portfolio
Massachusetts Portfolio
Minnesota Portfolio
New Jersey Portfolio
New York Portfolio
Ohio Portfolio
Pennsylvania Portfolio
Virginia Portfolio
Taxable
Bond Inflation Strategy
Global Bond Fund
High Income Fund
High Yield Portfolio
Income Fund
Intermediate Bond Portfolio
Limited Duration High Income Portfolio
Short Duration Portfolio
ALTERNATIVES
All Market Real Return Portfolio
Credit Long/Short Portfolio
Global Real Estate Investment Fund
Long/Short Multi-Manager Fund
Multi-Manager Alternative Strategies Fund
Select US Long/Short Portfolio
Unconstrained Bond Fund
MULTI-ASSET
All Market Income Portfolio
Emerging Markets Multi-Asset Portfolio
Global Risk Allocation Fund
MULTI-ASSET (continued)
Target-Date
Multi-Manager Select Retirement Allocation Fund
Multi-Manager Select 2010 Fund
Multi-Manager Select 2015 Fund
Multi-Manager Select 2020 Fund
Multi-Manager Select 2025 Fund
Multi-Manager Select 2030 Fund
Multi-Manager Select 2035 Fund
Multi-Manager Select 2040 Fund
Multi-Manager Select 2045 Fund
Multi-Manager Select 2050 Fund
Multi-Manager Select 2055 Fund
Wealth Strategies
Balanced Wealth Strategy
Conservative Wealth Strategy
Wealth Appreciation Strategy
Tax-Managed Balanced Wealth Strategy
Tax-Managed Wealth Appreciation Strategy
CLOSED-END FUNDS
AB Multi-Manager Alternative Fund
Alliance California Municipal Income Fund
AllianceBernstein Global High Income Fund
AllianceBernstein National Municipal Income Fund
We also offer Government Exchange Reserves, which serves as the money market fund exchange vehicle for the AB mutual funds. An investment in Government Exchange Reserves is not a deposit in a bank and is not insured or guaranteed by the Federal Deposit Insurance Corporation or any other government agency. Although the Fund seeks to preserve the value of your investment at $1.00 per share, it is possible to lose money by investing in the Fund.
Investors should consider the investment objectives, risks, charges and expenses of the Fund carefully before investing. For copies of our prospectus or summary prospectus, which contain this and other information, visit us online at www.abfunds.com or contact your AB representative. Please read the prospectus and/or summary prospectus carefully before investing.
* Prior to January 9, 2017, the Relative Value Fund was named Growth & Income Fund; prior to November 1, 2016, the Sustainable Global Thematic Fund was named Global Thematic Growth Fund.
| | | | |
| AB GLOBAL REAL ESTATE INVESTMENT FUND • | | | 67 | |
AB Family of Funds
NOTES
| | | | |
| AB GLOBAL REAL ESTATE INVESTMENT FUND • | | | 68 | |

AB GLOBAL REAL ESTATE INVESTMENT FUND
1345 Avenue of the Americas
New York, NY 10105
800.221.5672
GRE-0151-1116 
ITEM 2. CODE OF ETHICS.
(a) The registrant has adopted a code of ethics that applies to its principal executive officer, principal financial officer and principal accounting officer. A copy of the registrant’s code of ethics is filed herewith as Exhibit 12(a)(1).
(b) During the period covered by this report, no material amendments were made to the provisions of the code of ethics adopted in 2(a) above.
(c) During the period covered by this report, no implicit or explicit waivers to the provisions of the code of ethics adopted in 2(a) above were granted.
ITEM 3. AUDIT COMMITTEE FINANCIAL EXPERT.
The registrant’s Board of Directors has determined that independent directors Garry L. Moody, William H. Foulk, Jr. and Marshall C. Turner, Jr. qualify as audit committee financial experts.
ITEM 4. PRINCIPAL ACCOUNTANT FEES AND SERVICES.
(a) - (c) The following table sets forth the aggregate fees billed by the independent registered public accounting firm Ernst & Young LLP, for the Fund’s last two fiscal years for professional services rendered for: (i) the audit of the Fund’s annual financial statements included in the Fund’s annual report to stockholders; (ii) assurance and related services that are reasonably related to the performance of the audit of the Fund’s financial statements and are not reported under (i), which include advice and education related to accounting and auditing issues and quarterly press release review (for those Funds which issue press releases), and preferred stock maintenance testing (for those Funds that issue preferred stock); and (iii) tax compliance, tax advice and tax return preparation.
| | | | | | | | | | | | | | | | |
| | | | | | Audit Fees | | | Audit-Related
Fees | | | Tax Fees | |
AB Global REIT | | | 2015 | | | $ | 46,232 | | | $ | — | | | $ | 33,655 | |
| | | 2016 | | | $ | 47,592 | | | $ | 8 | | | $ | 34,634 | |
(d) Not applicable.
(e) (1) Beginning with audit and non-audit service contracts entered into on or after May 6, 2003, the Fund’s Audit Committee policies and procedures require the pre-approval of all audit and non-audit services provided to the Fund by the Fund’s independent registered public accounting firm. The Fund’s Audit Committee policies and procedures also require pre-approval of all audit and non-audit services provided to the Adviser and Service Affiliates to the extent that these services are directly related to the operations or financial reporting of the Fund.
(e) (2) All of the amounts for Audit Fees, Audit-Related Fees and Tax Fees in the table under Item 4 (a) – (c) are for services pre-approved by the Fund’s Audit Committee.
(f) Not applicable.
(g) The following table sets forth the aggregate non-audit services provided to the Fund, the Fund’s Adviser and entities that control, are controlled by or under common control with the Adviser that provide ongoing services to the Fund:
| | | | | | | | | | | | |
| | | | | | All Fees for
Non-Audit Services
Provided to the
Portfolio, the Adviser
and Service Affiliates | | | Total Amount of
Foregoing Column Pre-
approved by the Audit
Committee
(Portion Comprised of
Audit Related Fees)
(Portion Comprised of
Tax Fees) | |
AB Global REIT | | | 2015 | | | $ | 448,900 | | | $ | 33,655 | |
| | | | | | | | | | $ | — | |
| | | | | | | | | | $ | (33,655 | ) |
| | | 2016 | | | $ | 441,092 | | | $ | 34,642 | |
| | | | | | | | | | $ | (8 | ) |
| | | | | | | | | | $ | (34,634 | ) |
(h) The Audit Committee of the Fund has considered whether the provision of any non-audit services not pre-approved by the Audit Committee provided by the Fund’s independent registered public accounting firm to the Adviser and Service Affiliates is compatible with maintaining the auditor’s independence.
ITEM 5. AUDIT COMMITTEE OF LISTED REGISTRANTS.
Not applicable to the registrant.
ITEM 6. SCHEDULE OF INVESTMENTS.
Please see Schedule of Investments contained in the Report to Shareholders included under Item 1 of this Form N-CSR.
ITEM 7. DISCLOSURE OF PROXY VOTING POLICIES AND PROCEDURES FOR CLOSED-END MANAGEMENT INVESTMENT COMPANIES.
Not applicable to the registrant.
ITEM 8. PORTFOLIO MANAGERS OF CLOSED-END MANAGEMENT INVESTMENT COMPANIES.
Not applicable to the registrant.
ITEM 9. PURCHASES OF EQUITY SECURITIES BY CLOSED-END MANAGEMENT INVESTMENT COMPANY AND AFFILIATED PURCHASERS.
Not applicable to the registrant.
ITEM 10. SUBMISSION OF MATTERS TO A VOTE OF SECURITY HOLDERS.
There have been no material changes to the procedures by which shareholders may recommend nominees to the Fund’s Board of Directors since the Fund last provided disclosure in response to this item.
ITEM 11. CONTROLS AND PROCEDURES.
(a) The registrant’s principal executive officer and principal financial officer have concluded that the registrant’s disclosure controls and procedures (as defined in Rule 30a-3 (c) under the Investment Company Act of 1940, as amended) are effective at the reasonable assurance level based on their evaluation of these controls and procedures as of a date within 90 days of the filing date of this document.
(b) There were no changes in the registrant’s internal controls over financial reporting that occurred during the second fiscal quarter of the period that has materially affected, or is reasonably likely to materially affect, the registrant’s internal control over financial reporting.
ITEM 12. EXHIBITS.
The following exhibits are attached to this Form N-CSR:
| | |
EXHIBIT NO. | | DESCRIPTION OF EXHIBIT |
| |
| 12 (a) (1) | | Code of Ethics that is subject to the disclosure of Item 2 hereof |
| |
| 12 (b) (1) | | Certification of Principal Executive Officer Pursuant to Section 302 of the Sarbanes-Oxley Act of 2002 |
| |
| 12 (b) (2) | | Certification of Principal Financial Officer Pursuant to Section 302 of the Sarbanes-Oxley Act of 2002 |
| |
| 12 (c) | | Certification of Principal Executive Officer and Principal Financial Officer Pursuant to Section 906 of the Sarbanes-Oxley Act of 2002 |
SIGNATURES
Pursuant to the requirements of the Securities Exchange Act of 1934 and the Investment Company Act of 1940, the registrant has duly caused this report to be signed on its behalf by the undersigned, thereunto duly authorized.
(Registrant): AB Global Real Estate Investment Fund, Inc.
| | |
| |
| By: | | /s/ Robert M. Keith |
| | Robert M. Keith |
| | President |
| |
| Date: | | January 27, 2017 |
Pursuant to the requirements of the Securities Exchange Act of 1934 and the Investment Company Act of 1940, this report has been signed below by the following persons on behalf of the registrant and in the capacities and on the dates indicated.
| | |
| |
| By: | | /s/ Robert M. Keith |
| | Robert M. Keith |
| | President |
| |
| Date: | | January 27, 2017 |
| |
| By: | | /s/ Joseph J. Mantineo |
| | Joseph J. Mantineo |
| | Treasurer and Chief Financial Officer |
| |
| Date: | | January 27, 2017 |