INVESTOR PRESENTATION 2013 FIRST QUARTER
SAFE HARBOR STATEMENT UNDER THE PRIVATE SECURITIES LITIGATION REFORM ACT OF 1995 A&F cautions that any forward-looking statements (as such term is defined in the Private Securities Litigation Reform Act of 1995) contained in this presentation or made by management or spokespeople of A&F involve risks and uncertainties and are subject to change based on various important factors, many of which may be beyond the Company’s control. Words such as “estimate,” “project,” “plan,” “believe,” “expect,” “anticipate,” “intend,” and similar expressions may identify forward-looking statements. Except as may be required by applicable law, we assume no obligation to publicly update or revise our forward-looking statements. The factors included in the disclosure under the heading “FORWARD-LOOKING STATEMENTS AND RISK FACTORS” in “ITEM 1A. RISK FACTORS” of A&F’s Annual Report on Form 10-K for the fiscal year ended February 2, 2013, in some cases have affected and in the future could affect the Company’s financial performance and could cause actual results for the 2013 fiscal year and beyond to differ materially from those expressed or implied in any of the forward-looking statements included in this presentation or otherwise made by management. OTHER INFORMATION All dollar and share amounts are in 000’s unless otherwise stated. Sub-totals and totals may not foot due to rounding. Due to the fifty-third week in fiscal 2012, first quarter comparable sales are compared to the thirteen week period ended May 5, 2012. The Company changed its method of accounting for inventory from the retail method to the cost method effective February 2, 2013. Prior year figures have been restated to reflect the cost method of accounting for inventory. 2
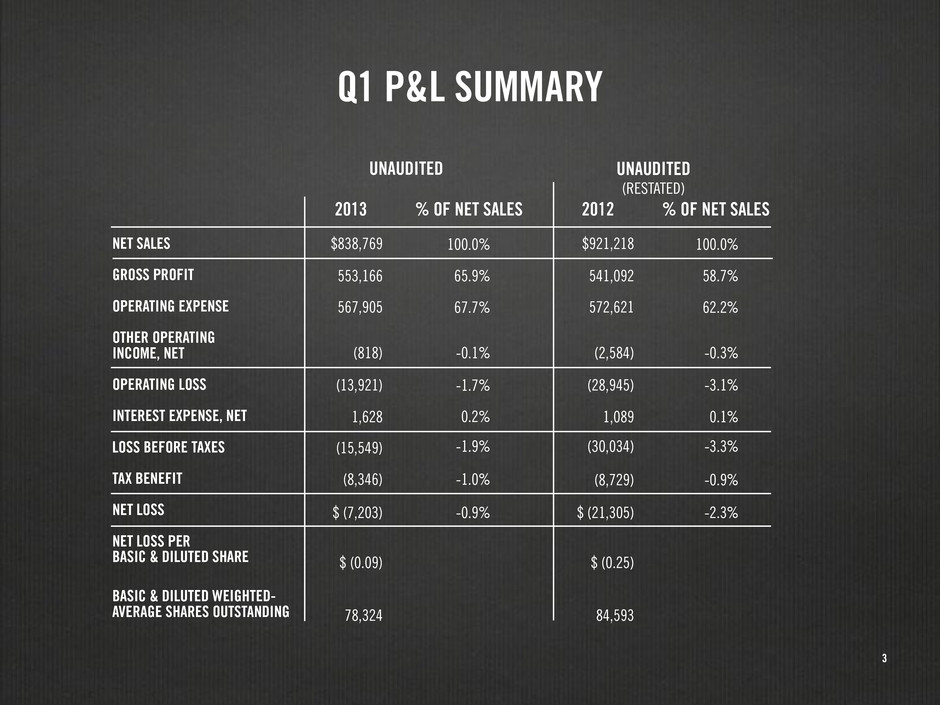
3 Q1 P&L SUMMARY 20122013 % OF NET SALES UNAUDITED UNAUDITED (RESTATED) % OF NET SALES NET SALES GROSS PROFIT OPERATING EXPENSE OTHER OPERATING INCOME, NET OPERATING LOSS INTEREST EXPENSE, NET LOSS BEFORE TAXES TAX BENEFIT NET LOSS NET LOSS PER BASIC & DILUTED SHARE BASIC & DILUTED WEIGHTED- AVERAGE SHARES OUTSTANDING $838,769 $921,218 541,092 572,621 (2,584) (28,945) 1,089 (30,034) $ (21,305) (8,729) 553,166 567,905 (818) (13,921) 1,628 (15,549) (8,346) $ (7,203) $ (0.09) $ (0.25) 78,324 84,593 100.0% 100.0% 58.7% 62.2% -0.3% -3.1% 0.1% -3.3% -2.3% -0.9% 65.9% 67.7% -0.1% -1.7% 0.2% -1.9% -1.0% -0.9%
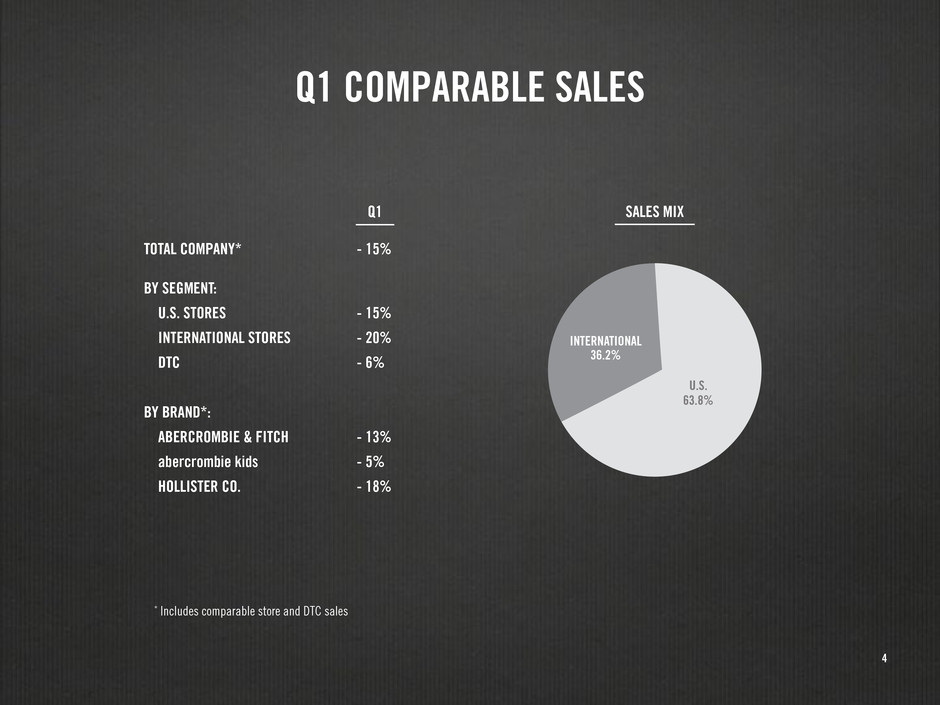
4 TOTAL COMPANY* BY SEGMENT: U.S. STORES INTERNATIONAL STORES DTC BY BRAND*: ABERCROMBIE & FITCH abercrombie kids HOLLISTER CO. - 15% - 15% - 20% - 6% - 13% - 5% - 18% Q1 COMPARABLE SALES 63.8% U.S. 36.2% INTERNATIONAL SALES MIXQ1 * Includes comparable store and DTC sales
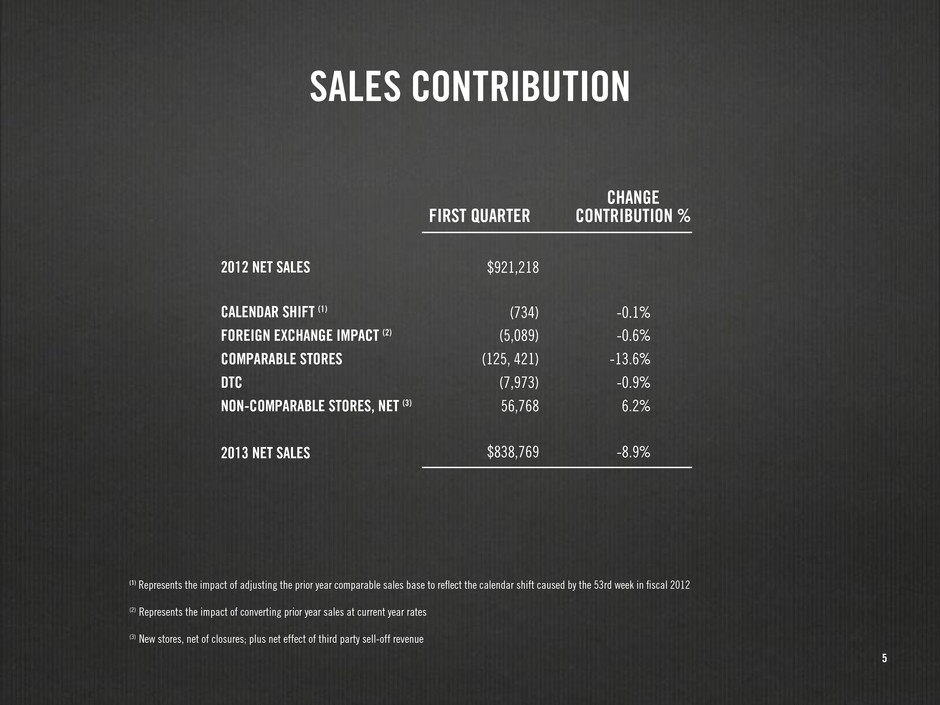
5 SALES CONTRIBUTION $921,218 (734) -0.1% -0.6% -0.9% 6.2% (5,089) (125, 421) -13.6% (7,973) 56,768 $838,769 -8.9% FIRST QUARTER CHANGE CONTRIBUTION % 2012 NET SALES CALENDAR SHIFT (1) FOREIGN EXCHANGE IMPACT (2) COMPARABLE STORES DTC NON-COMPARABLE STORES, NET (3) 2013 NET SALES (1) Represents the impact of adjusting the prior year comparable sales base to reflect the calendar shift caused by the 53rd week in fiscal 2012 (2) Represents the impact of converting prior year sales at current year rates (3) New stores, net of closures; plus net effect of third party sell-off revenue
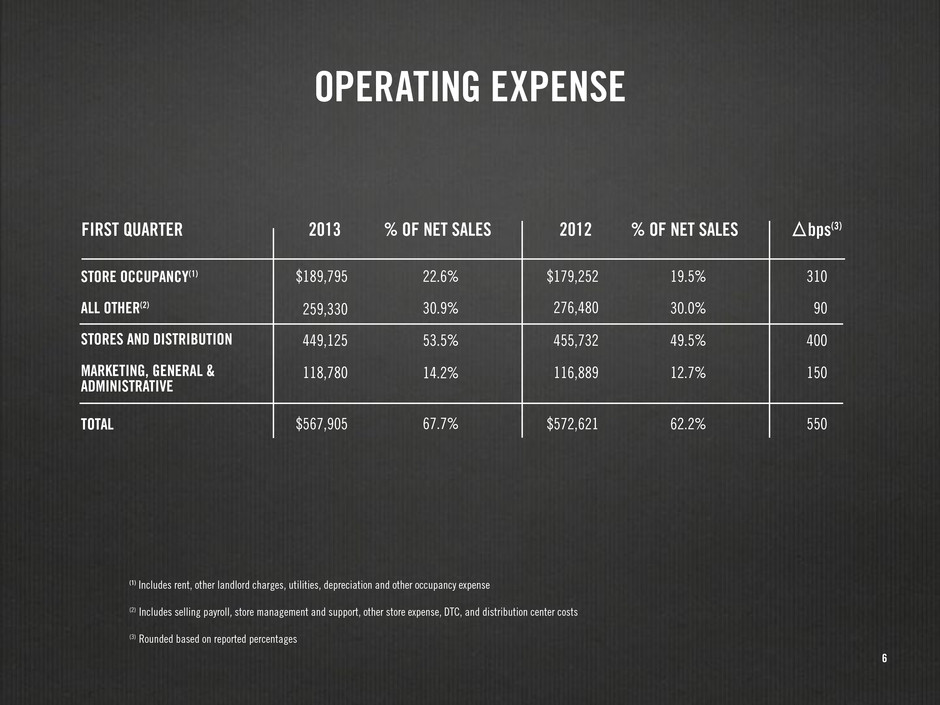
6 OPERATING EXPENSE 20122013 % OF NET SALESFIRST QUARTER % OF NET SALES bps(3) STORE OCCUPANCY(1) ALL OTHER(2) STORES AND DISTRIBUTION MARKETING, GENERAL & ADMINISTRATIVE TOTAL 276,480 455,732 116,889 $189,795 $179,252 259,330 449,125 118,780 $567,905 $572,621 19.5% 310 30.0% 90 49.5% 400 12.7% 150 62.2% 550 22.6% 30.9% 53.5% 14.2% 67.7% (1) Includes rent, other landlord charges, utilities, depreciation and other occupancy expense (2) Includes selling payroll, store management and support, other store expense, DTC, and distribution center costs (3) Rounded based on reported percentages
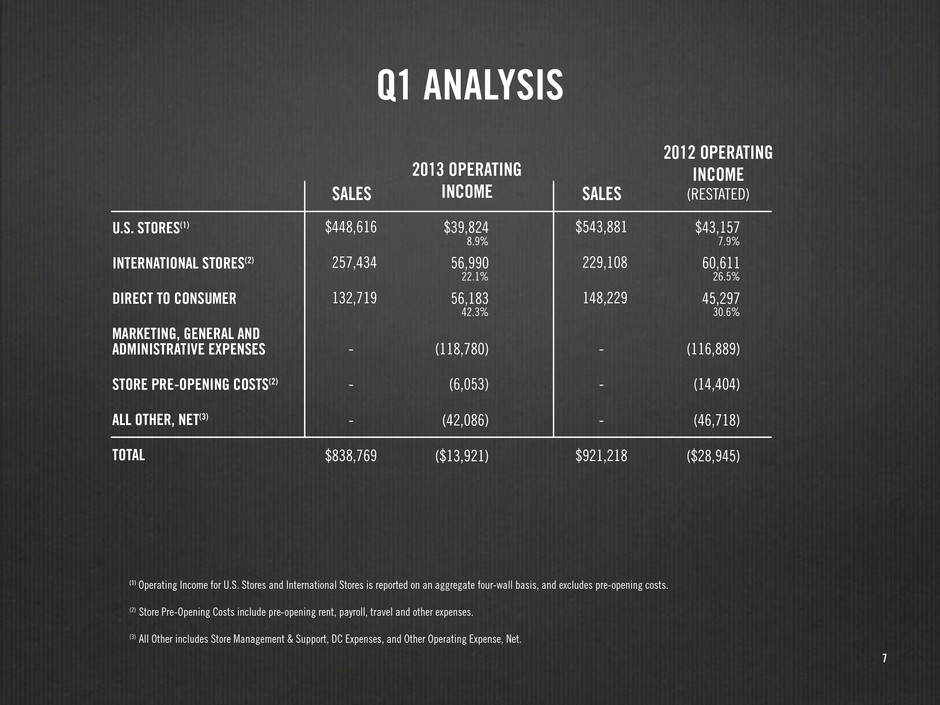
7 Q1 ANALYSIS 2013 OPERATING INCOME 2012 OPERATING INCOME (RESTATED)SALES SALES U.S. STORES(1) INTERNATIONAL STORES(2) DIRECT TO CONSUMER MARKETING, GENERAL AND ADMINISTRATIVE EXPENSES STORE PRE-OPENING COSTS(2) ALL OTHER, NET(3) TOTAL $448,616 $543,881 257,434 229,108 132,719 148,229 - - - - - - $838,769 $921,218 $39,824 $43,157 56,990 60,611 56,183 45,297 (118,780) (116,889) (6,053) (14,404) (42,086) (46,718) ($13,921) ($28,945) 8.9% 7.9% 22.1% 26.5% 42.3% 30.6% (1) Operating Income for U.S. Stores and International Stores is reported on an aggregate four-wall basis, and excludes pre-opening costs. (2) Store Pre-Opening Costs include pre-opening rent, payroll, travel and other expenses. (3) All Other includes Store Management & Support, DC Expenses, and Other Operating Expense, Net.
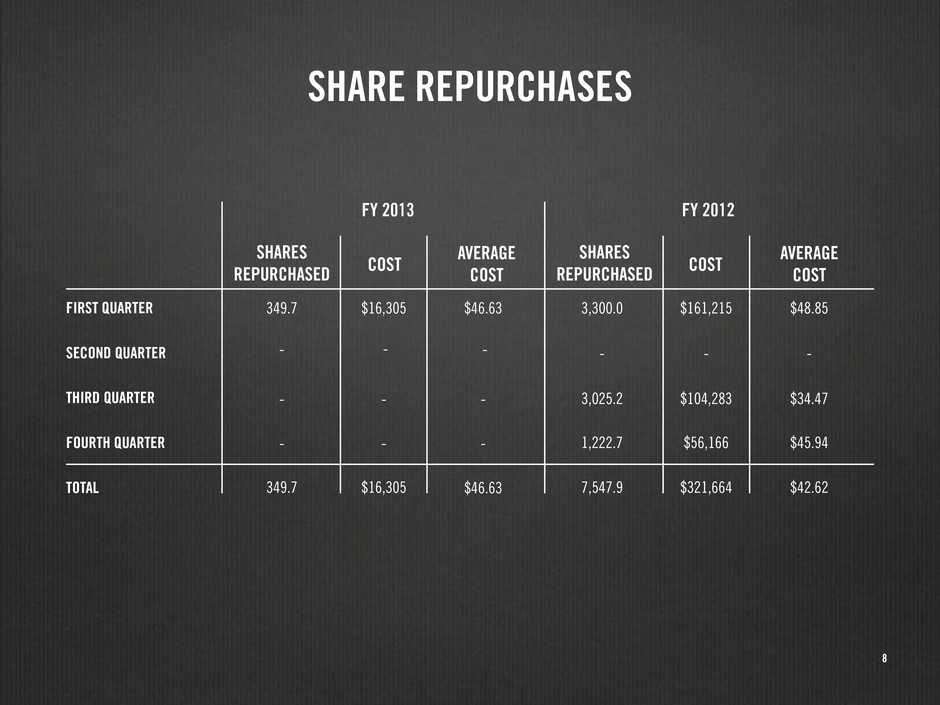
8 SHARE REPURCHASES 349.7 - - $16,305 - - $46.63 - - 3,300.0 $161,215 $48.85 - $46.63 - - $104,283 - $34.47 $56,166 $45.94 $16,305 $321,664 $42.62 - 1,222.7 349.7 7,547.9 - 3,025.2 SHARES REPURCHASED SHARES REPURCHASEDCOST COST AVERAGE COST AVERAGE COST FY 2013 FY 2012 FIRST QUARTER SECOND QUARTER THIRD QUARTER FOURTH QUARTER TOTAL
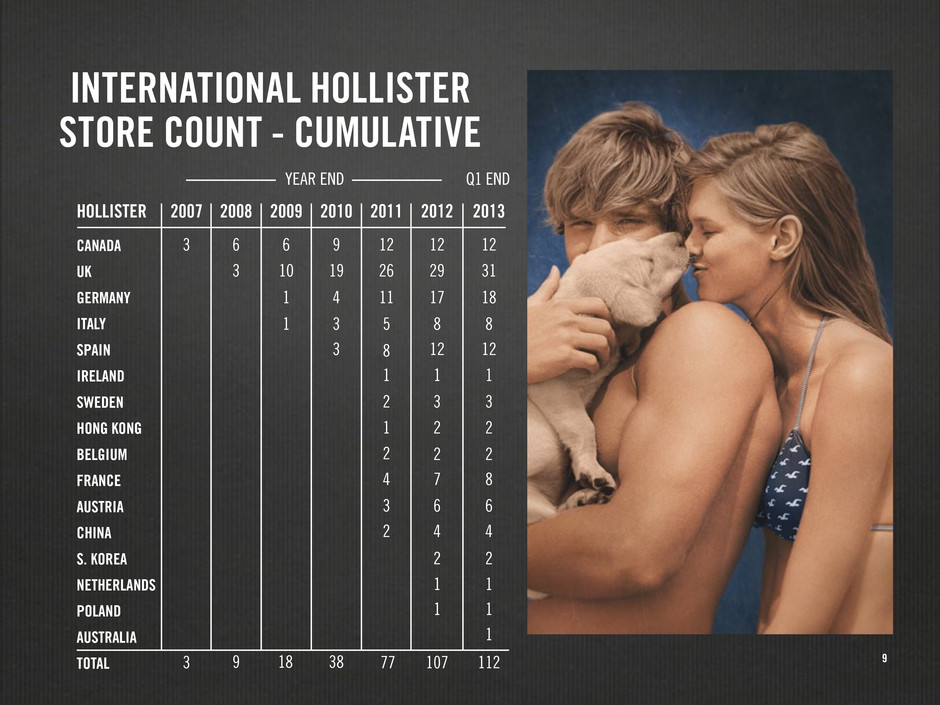
9 INTERNATIONAL HOLLISTER STORE COUNT - CUMULATIVE 2007 3 3 6 9 6 9 12 12 12 26 29 31 77 107 112 11 17 18 5 8 8 8 12 12 1 1 1 2 3 3 1 2 2 2 2 2 4 7 8 3 6 6 2 4 4 2 2 1 1 1 1 1 19 38 4 3 3 3 10 18 1 1 2008 2009 2010 2012 20132011HOLLISTER CANADA UK GERMANY ITALY SPAIN IRELAND SWEDEN HONG KONG BELGIUM FRANCE AUSTRIA CHINA S. KOREA NETHERLANDS POLAND AUSTRALIA TOTAL YEAR END Q1 END 301087_383_1_a9_G7. tif
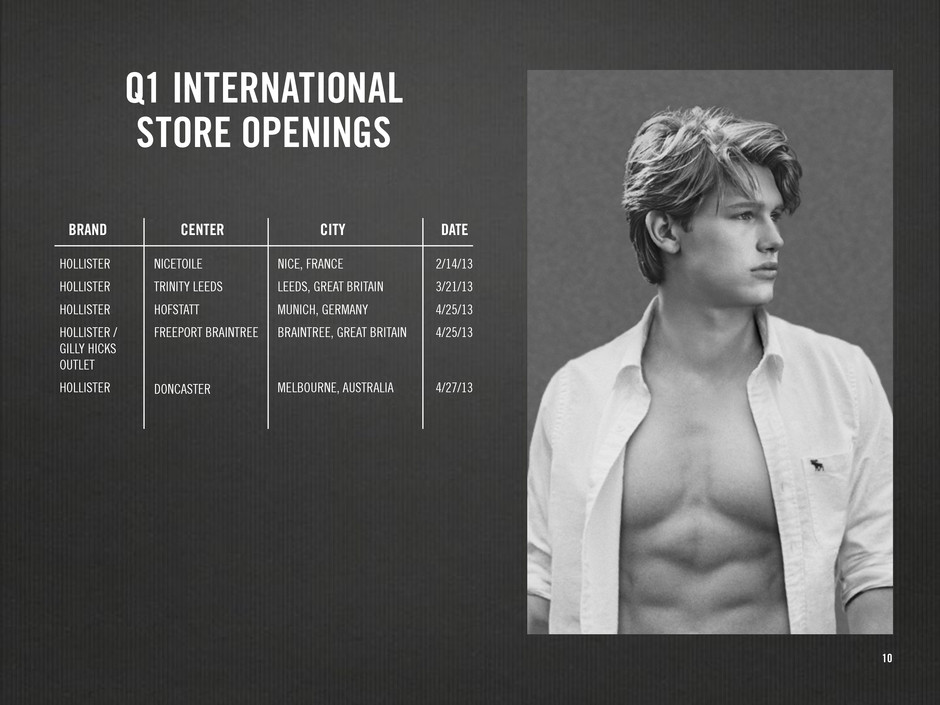
10 Q1 INTERNATIONAL STORE OPENINGS CITY DATECENTERBRAND HOLLISTER HOLLISTER HOLLISTER HOLLISTER / GILLY HICKS OUTLET HOLLISTER NICETOILE TRINITY LEEDS HOFSTATT FREEPORT BRAINTREE DONCASTER NICE, FRANCE LEEDS, GREAT BRITAIN MUNICH, GERMANY BRAINTREE, GREAT BRITAIN MELBOURNE, AUSTRALIA 2/14/13 3/21/13 4/25/13 4/25/13 4/27/13
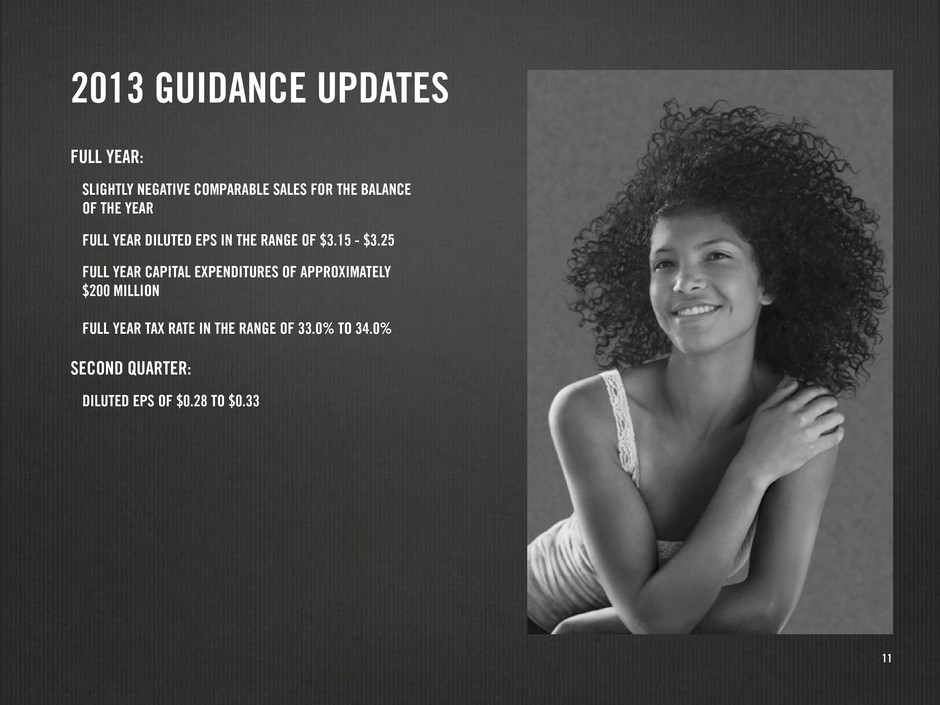
11 FULL YEAR: SLIGHTLY NEGATIVE COMPARABLE SALES FOR THE BALANCE OF THE YEAR FULL YEAR DILUTED EPS IN THE RANGE OF $3.15 - $3.25 FULL YEAR CAPITAL EXPENDITURES OF APPROXIMATELY $200 MILLION FULL YEAR TAX RATE IN THE RANGE OF 33.0% TO 34.0% SECOND QUARTER: DILUTED EPS OF $0.28 TO $0.33 2013 GUIDANCE UPDATES

12 Q1 STORE COUNT ACTIVITY * End of Q1 2013 includes 28 Gilly Hicks stores, 20 in the U.S. and eight in Europe. * Asia includes Australia TOTAL U.S. CANADA EUROPE ASIAALL BRANDS* HOLLISTER CO. ABERCROMBIE & FITCH abercrombie kids START OF Q1 2013 OPENINGS CLOSINGS END OF Q1 2013 START OF Q1 2013 OPENINGS CLOSINGS END OF Q1 2013 START OF Q1 2013 OPENINGS CLOSINGS END OF Q1 2013 START OF Q1 2013 OPENINGS CLOSINGS END OF Q1 2013 1,051 912 19 113 13 108 12 18 6 - 5 - 1 - - - - -- - - - - - - - - - - - 1 - -(4) (3) (1) (2) (1) (1)- (2) (1) (1) 1,053 909 285 150 589 482 12 4 87 9112481593 5 - 144 149 144 266 283 264 4 4 3 3 2 4 - 3 8 9 -- - 4 11 11