
1 INVESTOR PRESENTATION 2013 THIRD QUARTER
SAFE HARBOR STATEMENT UNDER THE PRIVATE SECURITIES LITIGATION REFORM ACT OF 1995 A&F cautions that any forward-looking statements (as such term is defined in the Private Securities Litigation Reform Act of 1995) contained in this presentation or made by management or spokespeople of A&F involve risks and uncertainties and are subject to change based on various important factors, many of which may be beyond the Company’s control. Words such as “estimate,” “project,” “plan,” “believe,” “expect,” “anticipate,” “intend,” and similar expressions may identify forward-looking statements. Except as may be required by applicable law, we assume no obligation to publicly update or revise our forward-looking statements. The factors included in the disclosure under the heading “FORWARD-LOOKING STATEMENTS AND RISK FACTORS” in “ITEM 1A. RISK FACTORS” of A&F’s Annual Report on Form 10-K for the fiscal year ended February 2, 2013, in some cases have affected and in the future could affect the Company’s financial performance and could cause actual results for the 2013 fiscal year and beyond to differ materially from those expressed or implied in any of the forward-looking statements included in this presentation or otherwise made by management. OTHER INFORMATION All dollar and share amounts are in thousands unless otherwise stated. Sub-totals and totals may not foot due to rounding. Due to the fifty-third week in fiscal 2012, third quarter and year-to-date comparable sales are compared to the thirteen and thirty-nine week periods ended November 3, 2012 The Company changed its method of accounting for inventory from the retail method to the cost method effective February 2, 2013. Prior year figures have been restated to reflect the cost method of accounting for inventory. 1

3 Q3 ADJUSTED P&L SUMMARY 20122013(1) % OF NET SALES UNAUDITED UNAUDITED (RESTATED) % OF NET SALES NET SALES GROSS PROFIT OPERATING EXPENSE OTHER OPERATING INCOME, NET OPERATING INCOME INTEREST EXPENSE, NET INCOME BEFORE TAXES TAX EXPENSE NET INCOME NET INCOME PER SHARE BASIC DILUTED WEIGHTED-AVERAGE SHARES OUTSTANDING BASIC DILUTED $1,033,293 76,456 81,669 $1,169,649 752,514 620,323 (1,154) 133,345 1,584 131,761 47,725 $1.03 $1.02 84,036 651,040 77,677 82,522 600,392 (9,851) 60,499 1,655 58,844 18,299 40,545 $0.53 $0.52 100.0% 100.0% 64.3% 53.0% -0.1% 11.4% 0.1% 11.3% 4.1% 7.2% 63.0% 58.1% -1.0% 5.9% 0.2% 5.7% 1.8% 3.9% 2(1) The Q3 Adjusted P&L Summary for the current period is represented on a non-GAAP basis and excludes the charges set out on page 3. A reconciliation between GAAP and non-GAAP results is included as an appendix to the presentation.

Q1 Q2 Q3 YTD2013 $44,708 $43,571 $43,571 $7,590 $10,165 $95,869 $98,444 $44,708 $2,575 $2,575 GILLY HICKS IMPAIRMENT & OTHER CHARGES OTHER IMPAIRMENT CHARGES PROFIT IMPROVEMENT INITIATIVE CHARGES TOTAL - - - - - - IMPAIRMENT & OTHER CHARGES (PRE-TAX) 3

TOTAL COMPANY* GEOGRAPHIC* US INTERNATIONAL BRAND* ABERCROMBIE & FITCH ABERCROMBIE KIDS HOLLISTER TOTAL COMPANY* GEOGRAPHIC* US INTERNATIONAL BRAND* ABERCROMBIE & FITCH ABERCROMBIE KIDS HOLLISTER -14% -14% -15% -13% -4% -16% -13% -13% -13% -11% -4% -15% Q3 COMPARABLE SALES US 65.3% US 64.1% INTERNATIONAL 34.7% INTERNATIONAL 35.9% Q3 SALES MIX YTD SALES MIX Q3 YTD 4 * Includes comparable store and DTC sales.

(1) Operating Income excludes the charges set out on page 3. A reconciliation between GAAP and non-GAAP results is included as an appendix to the presentation. (2) Operating Income for U.S. Stores and International Stores is reported on an aggregate four-wall basis, and excludes pre-opening costs. Also includes third party sell-off of excess merchandise. (3) Store Pre-Opening Costs include pre-opening rent, payroll, travel and other expenses. (4) All Other includes Store Management & Support, DC (including DC markdowns) and Other Expenses, net of Other Income. $561,788 $709,516 301,818 158,314 - $81,314 $155,965 99,373 63,935 (51,818) 14.5% 22.0% 32.9% 40.4% 76,186 25.7% 37.6% 65,616 (119,799) (123,381) (10,730)(6,276) (36,542) $60,499 $133,345 296,937 - - -- - 174,568 $1,033,293 $1,169,649 SALES SALES OPERATING INCOME(1) OPERATING INCOME 2013 2012 U.S. STORES (2) INTERNATIONAL STORES (2) DIRECT TO CONSUMER MARKETING, GENERAL AND ADMINISTRATIVE EXPENSES STORE PRE-OPENING COSTS (3) ALL OTHER, NET (4) TOTAL Q3 ADJUSTED P&L ANALYSIS 5

2013(1) 2012% OF NET SALES % OF NET SALESTHIRD QUARTER $196,610 $189,49219.0% 16.2% 280 120 400 110 510 283,982 307,45027.5% 26.3% 480,593 496,94246.5% 42.5% 119,799 123,38111.6% 10.5% $600,392 $620,32358.1% 53.0% STORE OCCUPANCY(2) ALL OTHER(3) STORES & DISTRIBUTION MARKETING, GENERAL & ADMINISTRATIVE TOTAL BPS(4) (1) Operating expense excludes the charges set out on page 3. A reconciliation between GAAP and non-GAAP results is included as an appendix to the presentation. (2) Includes rent, other landlord charges, utilities, depreciation, and other occupancy expense. (3) Includes selling payroll, store management and support, other store expense, DTC, and distribution center costs. (4) Rounded based on reported percentages. Q3 ADJUSTED OPERATING EXPENSE 6
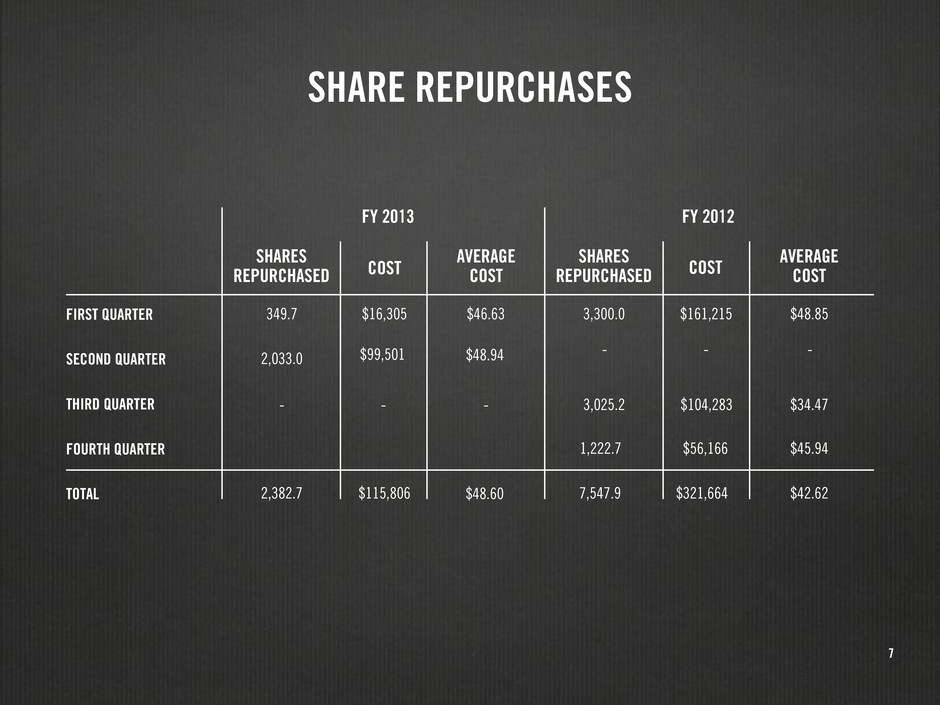
SHARE REPURCHASES 349.7 - - - - - -2,033.0 $16,305 $46.63 3,300.0 $161,215 $48.85 $48.94 $48.60 $99,501 $104,2833,025.2 $34.47 $56,166 $45.94 $115,806 $321,664 $42.62 1,222.7 2,382.7 7,547.9 SHARES REPURCHASED SHARES REPURCHASEDCOST COST AVERAGE COST AVERAGE COST FY 2013 FY 2012 FIRST QUARTER SECOND QUARTER THIRD QUARTER FOURTH QUARTER TOTAL 7
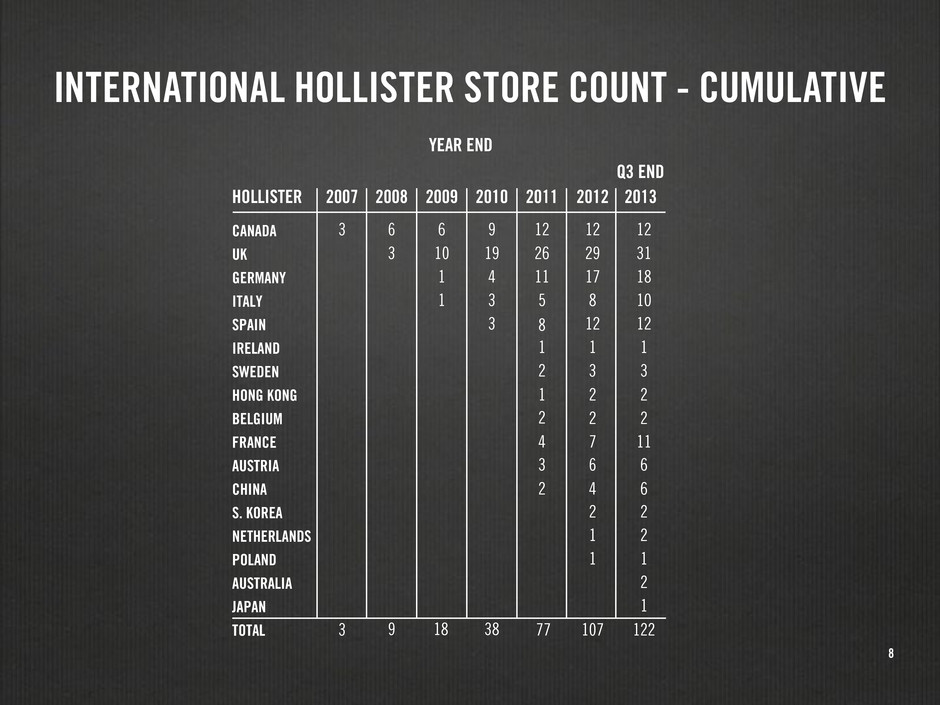
INTERNATIONAL HOLLISTER STORE COUNT - CUMULATIVE YEAR END Q3 END 2007 3 3 6 9 6 9 12 12 12 26 29 31 77 107 122 11 17 18 5 8 10 8 12 12 1 1 1 2 3 3 1 2 2 2 2 2 4 7 11 3 6 6 2 4 6 2 2 1 1 2 2 1 1 19 38 4 3 3 3 10 18 1 1 2008 2009 2010 2012 20132011HOLLISTER CANADA UK GERMANY ITALY SPAIN IRELAND SWEDEN HONG KONG BELGIUM FRANCE AUSTRIA CHINA S. KOREA NETHERLANDS POLAND AUSTRALIA JAPAN TOTAL 8

Q3 STORE OPENINGS CITY DATECENTERBRAND HOLLISTER HOLLISTER HOLLISTER A&F / KIDS HOLLISTER HOLLISTER HOLLISTER A&F PARLY 2 LALAPORT YOKOHAMA OUDE GRACHT SICILIA OUTLET VILLAGE SICILIA OUTLET VILLAGE BEAUGRENELLE ALMA CHEONGDAM-DONG LE CHESNAY, FRANCE YOKOHAMA, JAPAN UTRECHT, NETHERLANDS AGIRA ENNON, ITALY AGIRA ENNON, ITALY PARIS, FRANCE RENNES, FRANCE SEOUL, KOREA 8/30/13 9/14/13 9/28/13 10/17/13 10/17/13 10/22/13 10/23/13 10/31/13 9
*Guidance for the full year does not include charges related to the Company’s restructuring plans for the Gilly Hicks brand, other impairment and store closure charges, charges related to the implementation of the Company’s profit improvement initiative, or the effect of any additional share repurchases. PROJECTED LOW DOUBLE DIGIT DECREASE IN COMPARABLE SALES FOR THE FOURTH QUARTER SIGNIFICANT GROSS MARGIN RATE EROSION IN THE FOURTH QUARTER; GROSS MARGIN RATE APPROXIMATELY FLAT ON A FULL YEAR BASIS ADJUSTED NON-GAAP EARNINGS PER DILUTED SHARE IN THE RANGE OF $1.40 - $1.50 TAX RATE IN THE MID 30’S, INCLUDING $4.9 MILLION IN Q3 TAX BENEFITS RELATED TO CERTAIN DISCRETE TAX MATTERS 2013 GUIDANCE UPDATES 10
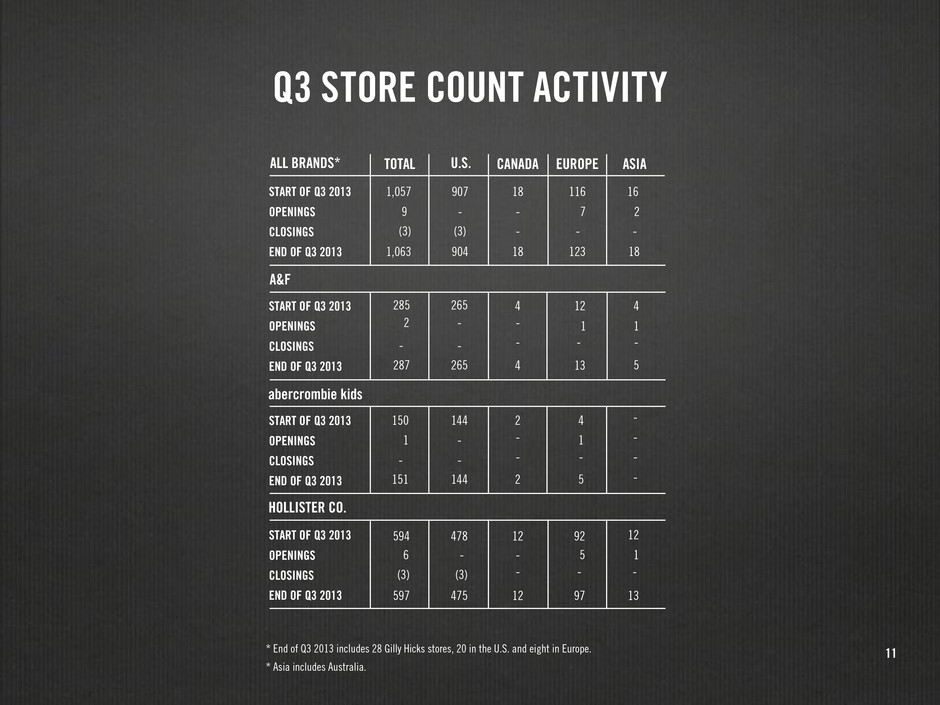
Q3 STORE COUNT ACTIVITY * End of Q3 2013 includes 28 Gilly Hicks stores, 20 in the U.S. and eight in Europe. * Asia includes Australia. TOTAL U.S. CANADA EUROPE ASIAALL BRANDS* HOLLISTER CO. A&F abercrombie kids START OF Q3 2013 OPENINGS CLOSINGS END OF Q3 2013 START OF Q3 2013 OPENINGS CLOSINGS END OF Q3 2013 START OF Q3 2013 OPENINGS CLOSINGS END OF Q3 2013 START OF Q3 2013 OPENINGS CLOSINGS END OF Q3 2013 1,057 907 18 123 18 116 16 18 9 7 - - 1 - - - -2 - - - - - - - - - - - - 2- - - -(3) - - - (3) (3) (3) - 1,063 904 285 150 594 478 12 5 92 9712475597 6 144 151 144 265 287 265 4 12 4 5 2 2 5 11 4 12 13 11 - 4 13 11
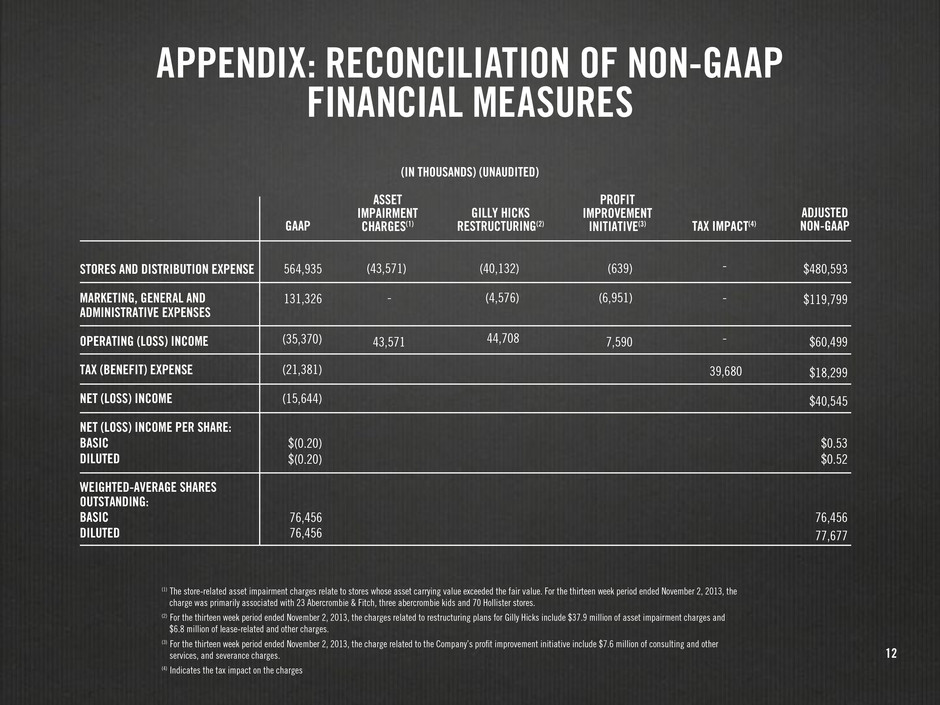
13 (1) The store-related asset impairment charges relate to stores whose asset carrying value exceeded the fair value. For the thirteen week period ended November 2, 2013, the charge was primarily associated with 23 Abercrombie & Fitch, three abercrombie kids and 70 Hollister stores. (2) For the thirteen week period ended November 2, 2013, the charges related to restructuring plans for Gilly Hicks include $37.9 million of asset impairment charges and $6.8 million of lease-related and other charges. (3) For the thirteen week period ended November 2, 2013, the charge related to the Company’s profit improvement initiative include $7.6 million of consulting and other services, and severance charges. (4) Indicates the tax impact on the charges $119,799 $480,593 $18,299 - -131,326 $60,499(35,370) 43,571 44,708 7,590 39,680 $40,545 76,456 77,677 $0.53 $0.52 - - 564,935 (43,571) (40,132) (4,576) (6,951) (639) (21,381) (15,644) $(0.20) $(0.20) 76,456 76,456 GAAP ASSET IMPAIRMENT CHARGES(1) PROFIT IMPROVEMENT INITIATIVE(3) ADJUSTED NON-GAAPTAX IMPACT(4) GILLY HICKS RESTRUCTURING(2) STORES AND DISTRIBUTION EXPENSE MARKETING, GENERAL AND ADMINISTRATIVE EXPENSES OPERATING (LOSS) INCOME TAX (BENEFIT) EXPENSE NET (LOSS) INCOME NET (LOSS) INCOME PER SHARE: BASIC DILUTED WEIGHTED-AVERAGE SHARES OUTSTANDING: BASIC DILUTED APPENDIX: RECONCILIATION OF NON-GAAP FINANCIAL MEASURES (IN THOUSANDS) (UNAUDITED) 12


