
INVESTOR PRESENTATION 2014 THIRD QUARTER
2 SAFE HARBOR STATEMENT UNDER THE PRIVATE SECURITIES LITIGATION REFORM ACT OF 1995 A&F cautions that any forward-looking statements (as such term is defined in the Private Securities Litigation Reform Act of 1995) contained in this presentation or made by management or spokespeople of A&F involve risks and uncertainties and are subject to change based on various important factors, many of which may be beyond the Company's control. Words such as "estimate," "project," "plan," "believe," "expect," "anticipate," "intend," and similar expressions may identify forward-looking statements. Except as may be required by applicable law, we assume no obligation to publicly update or revise our forward-looking statements. The factors included in the disclosure under the heading "FORWARD-LOOKING STATEMENTS AND RISK FACTORS" in "ITEM 1A. RISK FACTORS" of A&F's Annual Report on Form 10-K for the fiscal year ended February 1, 2014, in some cases have affected and in the future could affect the Company's financial performance and could cause actual results for the 2014 Fiscal year and beyond to differ materially from those expressed or implied in any of the forward-looking statements included in this presentation or otherwise made by management. OTHER INFORMATION All dollar and share amounts are in 000’s unless otherwise stated. Sub-totals and totals may not foot due to rounding.
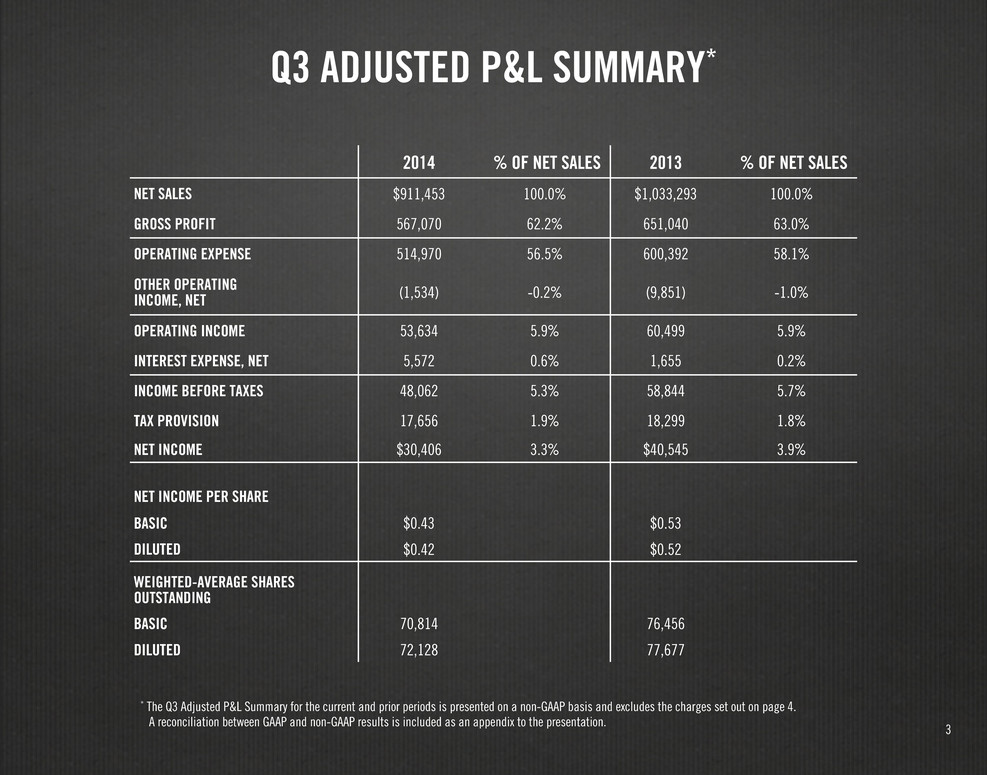
3 Q3 ADJUSTED P&L SUMMARY* * The Q3 Adjusted P&L Summary for the current and prior periods is presented on a non-GAAP basis and excludes the charges set out on page 4. A reconciliation between GAAP and non-GAAP results is included as an appendix to the presentation. 2014 % OF NET SALES 2013 % OF NET SALES NET SALES $911,453 100.0% $1,033,293 100.0% GROSS PROFIT 567,070 62.2% 651,040 63.0% OPERATING EXPENSE 514,970 56.5% 600,392 58.1% OTHER OPERATING INCOME, NET (1,534) -0.2% (9,851) -1.0% OPERATING INCOME 53,634 5.9% 60,499 5.9% INTEREST EXPENSE, NET 5,572 0.6% 1,655 0.2% INCOME BEFORE TAXES 48,062 5.3% 58,844 5.7% TAX PROVISION 17,656 1.9% 18,299 1.8% NET INCOME $30,406 3.3% $40,545 3.9% NET INCOME PER SHARE BASIC $0.43 $0.53 DILUTED $0.42 $0.52 WEIGHTED-AVERAGE SHARES OUTSTANDING BASIC 70,814 76,456 DILUTED 72,128 77,677

4 EXCLUDED CHARGES (PRE-TAX) 2014 Q1 Q2 Q3 Q4 YEAR TO DATE ASSET IMPAIRMENT, LEASE TERMINATION AND STORE CLOSURE COSTS — — $18,958 $18,958 PROFIT IMPROVEMENT AND CORPORATE GOVERANCE 9,964 1,964 1,310 13,238 GILLY HICKS RESTRUCTURING CHARGES 5,633 419 — 6,052 TOTAL $15,597 $2,383 $20,268 $38,248 2013 Q1 Q2 Q3 Q4 FULL YEAR ASSET IMPAIRMENT, LEASE TERMINATION AND STORE CLOSURE COSTS — — 43,571 3,144 46,715 PROFIT IMPROVEMENT AND CORPORATE GOVERANCE — 2,575 7,590 3,674 13,839 GILLY HICKS RESTRUCTURING CHARGES — — $44,708 $36,792 $81,500 TOTAL — $2,575 $95,869 $43,610 $142,054
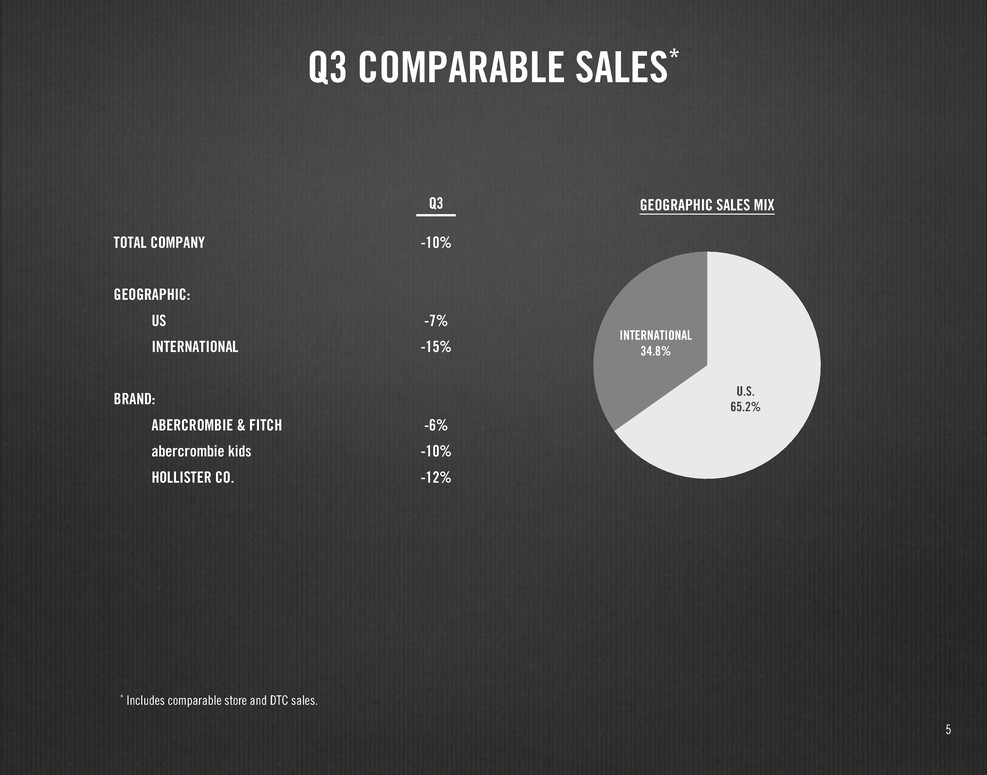
5 * Includes comparable store and DTC sales. Q3 COMPARABLE SALES* GEOGRAPHIC SALES MIXQ3 TOTAL COMPANY -10% GEOGRAPHIC: US -7% INTERNATIONAL -15% BRAND: ABERCROMBIE & FITCH -6% abercrombie kids -10% HOLLISTER CO. -12% INTERNATIONAL 34.8% U.S. 65.2%

6 * Includes comparable store and DTC sales. YEAR-TO-DATE COMPARABLE SALES* YTD TOTAL COMPANY -7% GEOGRAPHIC: US -6% INTERNATIONAL -10% BRAND: ABERCROMBIE & FITCH -3% abercrombie kids -8% HOLLISTER CO. -10% GEOGRAPHIC SALES MIX INTERNATIONAL 37.3% U.S. 62.7%

7 Q3 ADJUSTED OPERATING EXPENSE* * Third quarter adjusted operating expense excludes the charges set out on page 4. A reconciliation between GAAP and non-GAAP results is included as an appendix to the presentation. (1) Includes rent, other landlord charges, utilities, depreciation and other occupancy expense. (2) Includes selling payroll, store management and support, other store expense, direct-to-consumer expense, and distribution center costs. (3) Rounded based on reported percentages. THIRD QUARTER 2014 % OF NET SALES 2013 % OF NET SALES Δ bps (3) STORE OCCUPANCY (1) $187,459 20.6% $196,610 19.0% 160 ALL OTHER (2) 223,735 24.5% 283,983 27.5% (300) STORES AND DISTRIBUTION 411,194 45.1% 480,593 46.5% (140) MARKETING, GENERAL & ADMINISTRATIVE 103,776 11.4% 119,799 11.6% (20) TOTAL $514,970 56.5% $600,392 58.1% (160)
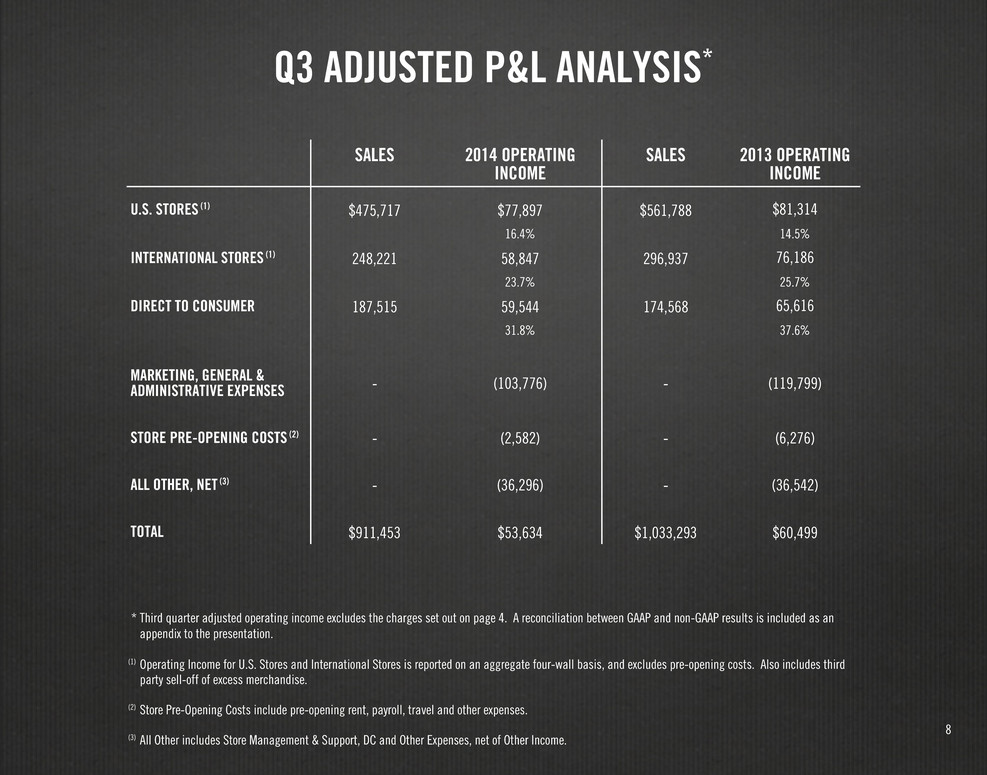
8 Q3 ADJUSTED P&L ANALYSIS* * Third quarter adjusted operating income excludes the charges set out on page 4. A reconciliation between GAAP and non-GAAP results is included as an appendix to the presentation. (1) Operating Income for U.S. Stores and International Stores is reported on an aggregate four-wall basis, and excludes pre-opening costs. Also includes third party sell-off of excess merchandise. (2) Store Pre-Opening Costs include pre-opening rent, payroll, travel and other expenses. (3) All Other includes Store Management & Support, DC and Other Expenses, net of Other Income. SALES 2014 OPERATING INCOME SALES 2013 OPERATING INCOME U.S. STORES (1) $475,717 $77,897 $561,788 $81,314 16.4% 14.5% INTERNATIONAL STORES (1) 248,221 58,847 296,937 76,186 23.7% 25.7% DIRECT TO CONSUMER 187,515 59,544 174,568 65,616 31.8% 37.6% MARKETING, GENERAL & ADMINISTRATIVE EXPENSES - (103,776) - (119,799) STORE PRE-OPENING COSTS (2) - (2,582) - (6,276) ALL OTHER, NET (3) - (36,296) - (36,542) TOTAL $911,453 $53,634 $1,033,293 $60,499
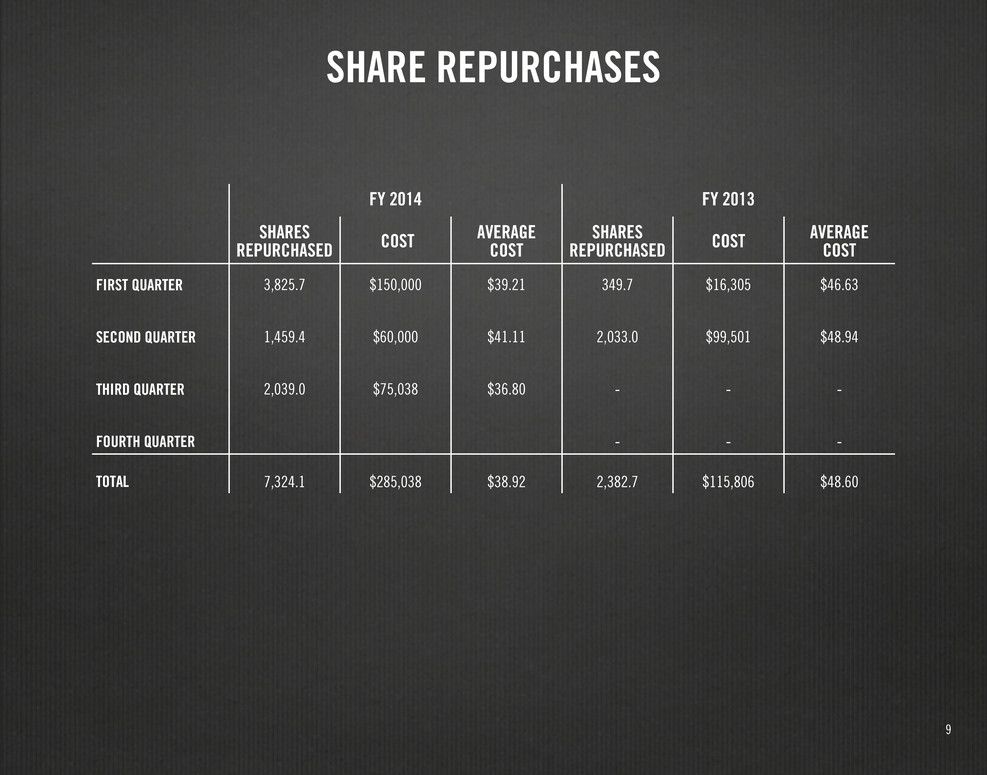
9 SHARE REPURCHASES FY 2014 FY 2013 SHARES REPURCHASED COST AVERAGE COST SHARES REPURCHASED COST AVERAGE COST FIRST QUARTER 3,825.7 $150,000 $39.21 349.7 $16,305 $46.63 SECOND QUARTER 1,459.4 $60,000 $41.11 2,033.0 $99,501 $48.94 THIRD QUARTER 2,039.0 $75,038 $36.80 - - - FOURTH QUARTER - - - TOTAL 7,324.1 $285,038 $38.92 2,382.7 $115,806 $48.60
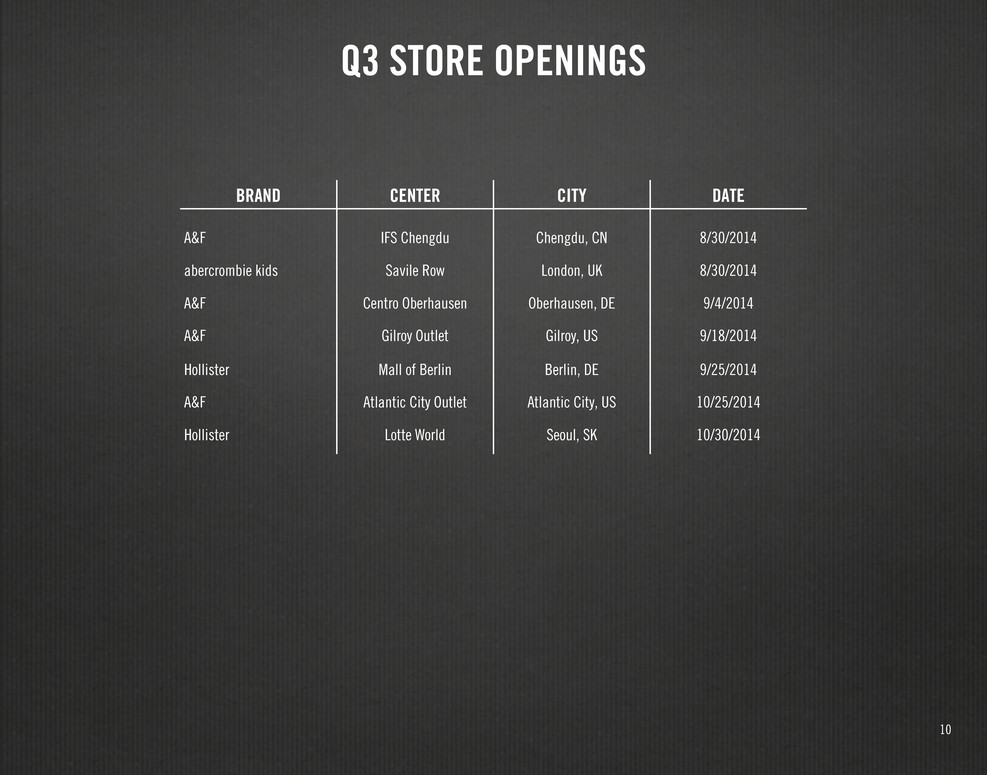
10 Q3 STORE OPENINGS BRAND CENTER CITY DATE A&F IFS Chengdu Chengdu, CN 8/30/2014 abercrombie kids Savile Row London, UK 8/30/2014 A&F Centro Oberhausen Oberhausen, DE 9/4/2014 A&F Gilroy Outlet Gilroy, US 9/18/2014 Hollister Mall of Berlin Berlin, DE 9/25/2014 A&F Atlantic City Outlet Atlantic City, US 10/25/2014 Hollister Lotte World Seoul, SK 10/30/2014
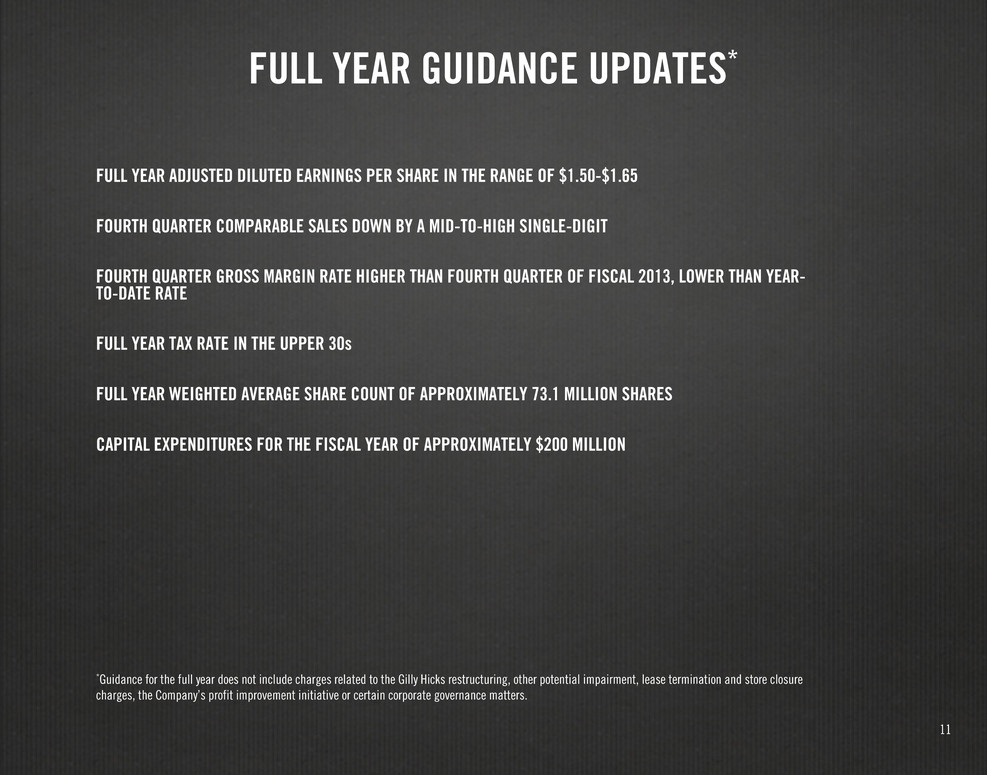
11 FULL YEAR GUIDANCE UPDATES* FULL YEAR ADJUSTED DILUTED EARNINGS PER SHARE IN THE RANGE OF $1.50-$1.65 FOURTH QUARTER COMPARABLE SALES DOWN BY A MID-TO-HIGH SINGLE-DIGIT FOURTH QUARTER GROSS MARGIN RATE HIGHER THAN FOURTH QUARTER OF FISCAL 2013, LOWER THAN YEAR- TO-DATE RATE FULL YEAR TAX RATE IN THE UPPER 30s FULL YEAR WEIGHTED AVERAGE SHARE COUNT OF APPROXIMATELY 73.1 MILLION SHARES CAPITAL EXPENDITURES FOR THE FISCAL YEAR OF APPROXIMATELY $200 MILLION *Guidance for the full year does not include charges related to the Gilly Hicks restructuring, other potential impairment, lease termination and store closure charges, the Company’s profit improvement initiative or certain corporate governance matters.
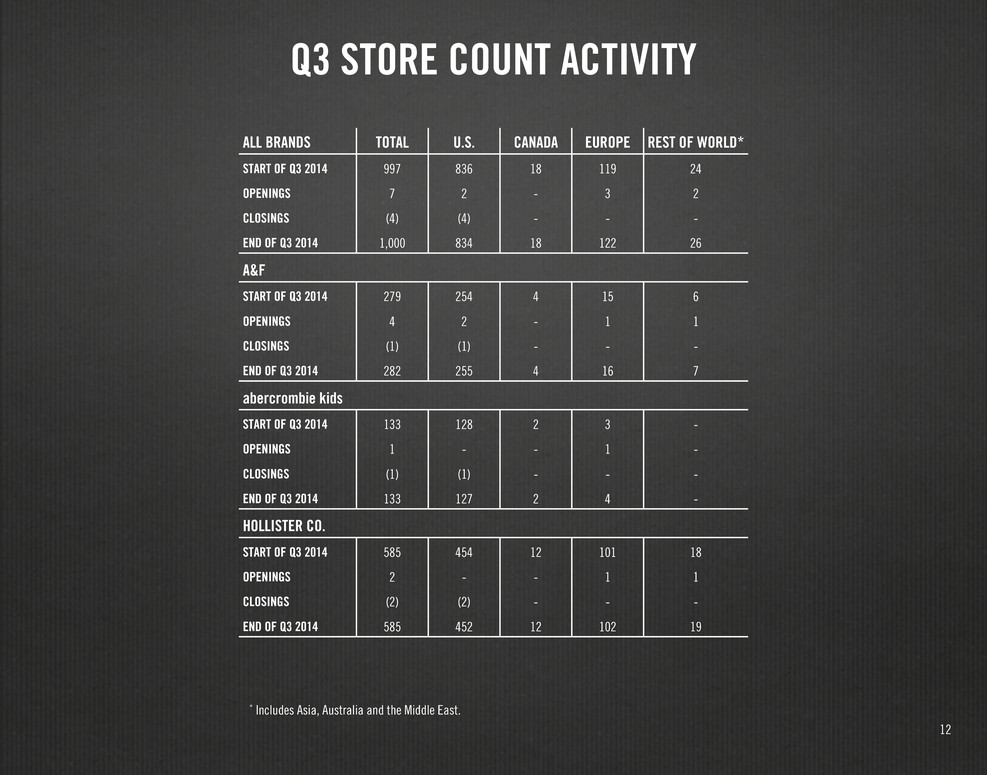
12 Q3 STORE COUNT ACTIVITY * Includes Asia, Australia and the Middle East. ALL BRANDS TOTAL U.S. CANADA EUROPE REST OF WORLD* START OF Q3 2014 997 836 18 119 24 OPENINGS 7 2 - 3 2 CLOSINGS (4) (4) - - - END OF Q3 2014 1,000 834 18 122 26 A&F START OF Q3 2014 279 254 4 15 6 OPENINGS 4 2 - 1 1 CLOSINGS (1) (1) - - - END OF Q3 2014 282 255 4 16 7 abercrombie kids START OF Q3 2014 133 128 2 3 - OPENINGS 1 - - 1 - CLOSINGS (1) (1) - - - END OF Q3 2014 133 127 2 4 - HOLLISTER CO. START OF Q3 2014 585 454 12 101 18 OPENINGS 2 - - 1 1 CLOSINGS (2) (2) - - - END OF Q3 2014 585 452 12 102 19
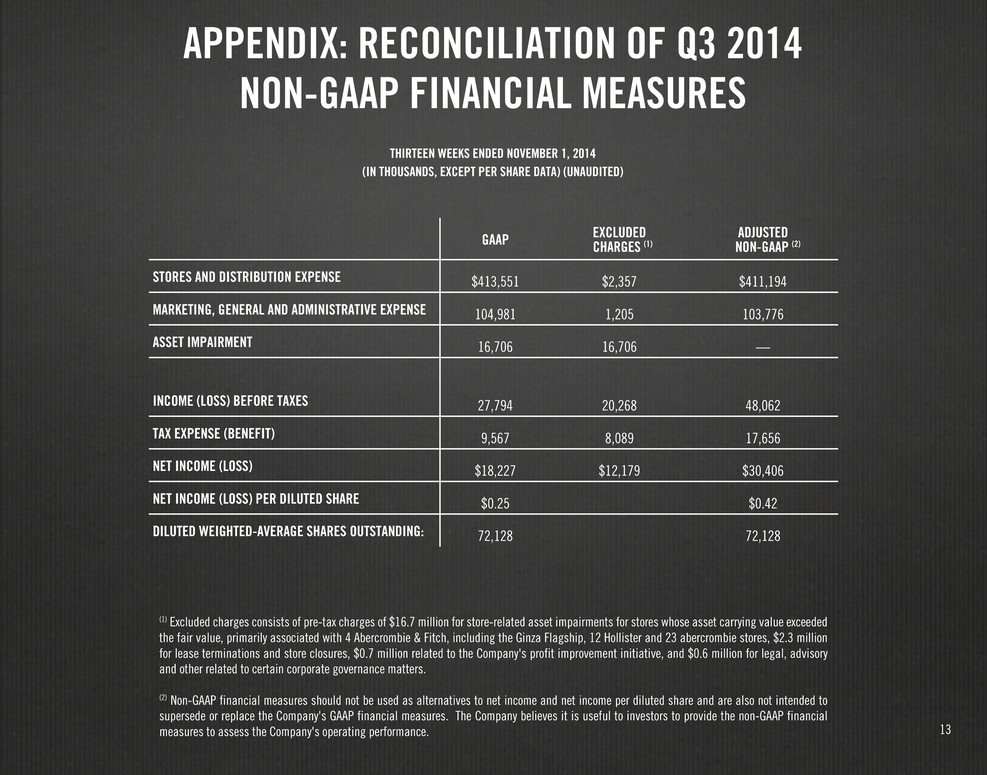
13 APPENDIX: RECONCILIATION OF Q3 2014 NON-GAAP FINANCIAL MEASURES GAAP EXCLUDED CHARGES (1) ADJUSTED NON-GAAP (2) STORES AND DISTRIBUTION EXPENSE $413,551 $2,357 $411,194 MARKETING, GENERAL AND ADMINISTRATIVE EXPENSE 104,981 1,205 103,776 ASSET IMPAIRMENT 16,706 16,706 — INCOME (LOSS) BEFORE TAXES 27,794 20,268 48,062 TAX EXPENSE (BENEFIT) 9,567 8,089 17,656 NET INCOME (LOSS) $18,227 $12,179 $30,406 NET INCOME (LOSS) PER DILUTED SHARE $0.25 $0.42 DILUTED WEIGHTED-AVERAGE SHARES OUTSTANDING: 72,128 72,128 (1) Excluded charges consists of pre-tax charges of $16.7 million for store-related asset impairments for stores whose asset carrying value exceeded the fair value, primarily associated with 4 Abercrombie & Fitch, including the Ginza Flagship, 12 Hollister and 23 abercrombie stores, $2.3 million for lease terminations and store closures, $0.7 million related to the Company's profit improvement initiative, and $0.6 million for legal, advisory and other related to certain corporate governance matters. (2) Non-GAAP financial measures should not be used as alternatives to net income and net income per diluted share and are also not intended to supersede or replace the Company's GAAP financial measures. The Company believes it is useful to investors to provide the non-GAAP financial measures to assess the Company's operating performance. THIRTEEN WEEKS ENDED NOVEMBER 1, 2014 (IN THOUSANDS, EXCEPT PER SHARE DATA) (UNAUDITED)
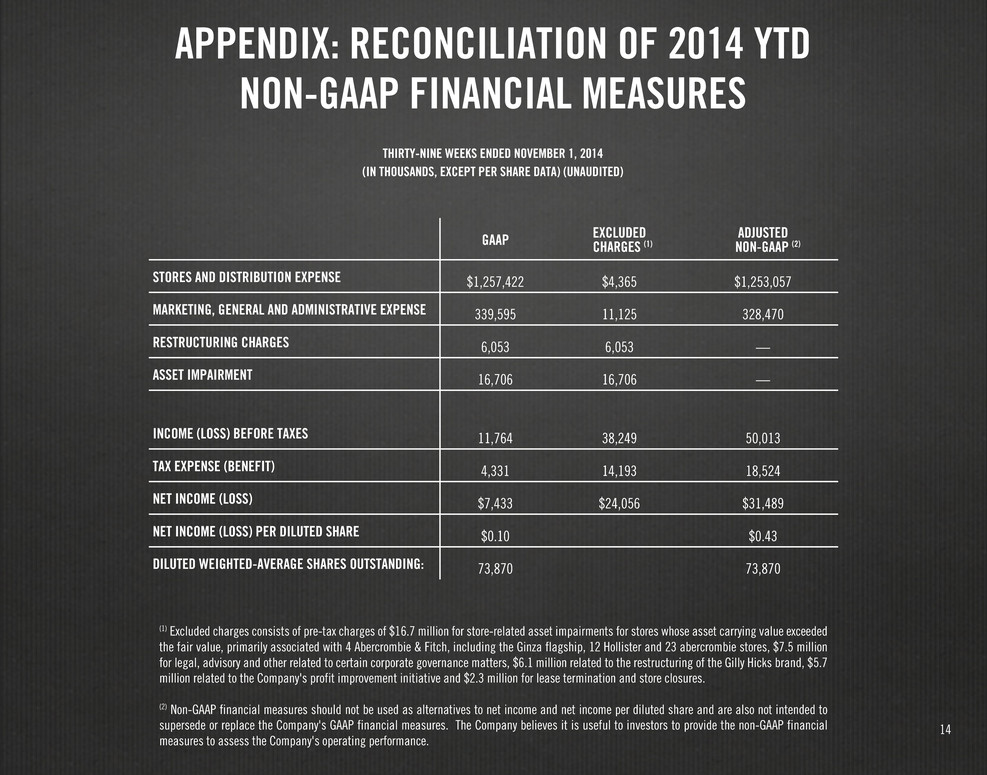
14 APPENDIX: RECONCILIATION OF 2014 YTD NON-GAAP FINANCIAL MEASURES (1) Excluded charges consists of pre-tax charges of $16.7 million for store-related asset impairments for stores whose asset carrying value exceeded the fair value, primarily associated with 4 Abercrombie & Fitch, including the Ginza flagship, 12 Hollister and 23 abercrombie stores, $7.5 million for legal, advisory and other related to certain corporate governance matters, $6.1 million related to the restructuring of the Gilly Hicks brand, $5.7 million related to the Company's profit improvement initiative and $2.3 million for lease termination and store closures. (2) Non-GAAP financial measures should not be used as alternatives to net income and net income per diluted share and are also not intended to supersede or replace the Company's GAAP financial measures. The Company believes it is useful to investors to provide the non-GAAP financial measures to assess the Company's operating performance. THIRTY-NINE WEEKS ENDED NOVEMBER 1, 2014 (IN THOUSANDS, EXCEPT PER SHARE DATA) (UNAUDITED) GAAP EXCLUDED CHARGES (1) ADJUSTED NON-GAAP (2) STORES AND DISTRIBUTION EXPENSE $1,257,422 $4,365 $1,253,057 MARKETING, GENERAL AND ADMINISTRATIVE EXPENSE 339,595 11,125 328,470 RESTRUCTURING CHARGES 6,053 6,053 — ASSET IMPAIRMENT 16,706 16,706 — INCOME (LOSS) BEFORE TAXES 11,764 38,249 50,013 TAX EXPENSE (BENEFIT) 4,331 14,193 18,524 NET INCOME (LOSS) $7,433 $24,056 $31,489 NET INCOME (LOSS) PER DILUTED SHARE $0.10 $0.43 DILUTED WEIGHTED-AVERAGE SHARES OUTSTANDING: 73,870 73,870

15 APPENDIX: RECONCILIATION OF Q3 2013 NON-GAAP FINANCIAL MEASURES (1) Excluded charges consists of pre-tax charges of $43.6 million for store-related asset impairments for stores whose asset carrying value exceeded the fair value, primarily associated with 23 Abercrombie & Fitch, 3 abercrombie and 70 Hollister stores, including the 5th Avenue flagship, $44.7 million related to the restructuring of the Gilly Hicks brand and $7.6 million related to the Company's profit improvement. (2) Non-GAAP financial measures should not be used as alternatives to net income and net income per diluted share and are also not intended to supersede or replace the Company's GAAP financial measures. The Company believes it is useful to investors to provide the non-GAAP financial measures to assess the Company's operating performance. THIRTEEN WEEKS ENDED NOVEMBER 2, 2013 (IN THOUSANDS, EXCEPT PER SHARE DATA) (UNAUDITED) GAAP EXCLUDED CHARGES (1) ADJUSTED NON-GAAP (2) STORES AND DISTRIBUTION EXPENSE $481,232 $639 $480,593 MARKETING, GENERAL AND ADMINISTRATIVE EXPENSE 126,750 6,951 119,799 RESTRUCTURING CHARGES 44,708 44,708 — ASSET IMPAIRMENT 43,571 43,571 — INCOME (LOSS) BEFORE TAXES (37,025) 95,869 58,844 TAX EXPENSE (BENEFIT) (21,381) 39,680 18,299 NET INCOME (LOSS) $(15,644) $56,189 $40,545 NET INCOME (LOSS) PER DILUTED SHARE $(0.20) $0.52 DILUTED WEIGHTED-AVERAGE SHARES OUTSTANDING: 76,456 77,677

16 APPENDIX: RECONCILIATION OF 2013 YTD NON-GAAP FINANCIAL MEASURES (1) Excluded charges consists of pre-tax charges of $43.6 million for store-related asset impairments for stores whose asset carrying value exceeded the fair value, primarily associated with 23 Abercrombie & Fitch, 3 abercrombie and 70 Hollister stores, including the 5th Avenue flagship, $44.7 million related to the restructuring of the Gilly Hicks brand and $10.1 million related to the Company's profit improvement. (2) Non-GAAP financial measures should not be used as alternatives to net income and net income per diluted share and are also not intended to supersede or replace the Company's GAAP financial measures. The Company believes it is useful to investors to provide the non-GAAP financial measures to assess the Company's operating performance. THIRTY-NINE WEEKS ENDED NOVEMBER 2, 2013 (IN THOUSANDS, EXCEPT PER SHARE DATA) (UNAUDITED) GAAP EXCLUDED CHARGES (1) ADJUSTED NON-GAAP (2) STORES AND DISTRIBUTION EXPENSE $1,402,080 $639 $1,401,441 MARKETING, GENERAL AND ADMINISTRATIVE EXPENSE 363,176 9,526 353,650 RESTRUCTURING CHARGES 44,708 44,708 — ASSET IMPAIRMENT 43,571 43,571 — INCOME (LOSS) BEFORE TAXES (35,159) 98,444 63,285 TAX EXPENSE (BENEFIT) (23,682) 40,610 16,928 NET INCOME (LOSS) $(11,477) $57,834 $46,357 NET INCOME (LOSS) PER DILUTED SHARE $(0.15) $0.59 DILUTED WEIGHTED-AVERAGE SHARES OUTSTANDING: 77,387 77,387


