UNITED STATES
SECURITIES AND EXCHANGE COMMISSION
WASHINGTON, D.C. 20549
FORM N-CSR
CERTIFIED SHAREHOLDER REPORT OF REGISTERED MANAGEMENT
INVESTMENT COMPANIES
Investment Company Act file number 811-07857
Oppenheimer Commodity Strategy Total Return Fund
(Exact name of registrant as specified in charter)
6803 South Tucson Way, Centennial, Colorado 80112-3924
(Address of principal executive offices) (Zip code)
Arthur S. Gabinet
OFI Global Asset Management, Inc.
Two World Financial Center, New York, New York 10281-1008
(Name and address of agent for service)
Registrant’s telephone number, including area code: (303) 768-3200
Date of fiscal year end: December 31
Date of reporting period: 12/31/2012
| Item 1. | Reports to Stockholders. |
ANNUAL REPORT
Oppenheimer Commodity Strategy Total Return Fund®

Table of Contents
Class A Shares
AVERAGE ANNUAL TOTAL RETURNS AT 12/31/12
| | | | | | | | | | | | |
| | | Class A Shares of the Fund | | | | |
| | | Without Sales Charge | | | With Sales Charge | | | S&P GSCI™ | |
| 1-Year | | | –1.80 | % | | | –7.44 | % | | | 0.08 | % |
| 5-Year | | | –12.35 | | | | –13.38 | | | | –8.12 | |
| 10-Year | | | 0.82 | | | | 0.23 | | | | 2.75 | |
The performance data quoted represents past performance, which does not guarantee future results. The investment return and principal value of an investment in the Fund will fluctuate so that an investor’s shares, when redeemed, may be worth more or less than their original cost. Fund returns include changes in share price, reinvested distributions, and a 5.75% maximum applicable sales charge except where “without sales charge” is indicated. Current performance may be lower or higher than the performance quoted. Returns do not consider capital gains or income taxes on an individual’s investment. For performance data current to the most recent month-end, visit oppenheimerfunds.com or call 1.800.CALL OPP (225.5677).
| | |
| 2 | | OPPENHEIMER COMMODITY STRATEGY TOTAL RETURN FUND |
Fund Performance Discussion
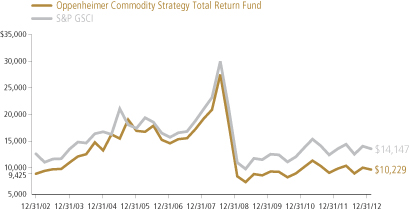
The Fund’s Class A shares (without sales charge) returned –1.80% during the period, underperforming the S&P GSCI Index (the “Index”), which returned 0.08%. The negative results of the Fund and muted results of the Index occurred over a volatile period for commodities. The Fund’s performance reflects the effects of the Fund’s business and operating expenses, which are higher relative to the Index, whose performance does not reflect transaction costs, fees, expenses and taxes, and which investors cannot directly purchase.
MARKET OVERVIEW
It was a volatile period for commodities, which were impacted by a number of macroeconomic issues throughout the reporting period. The period began during a time of improved market sentiment in which the United States managed to avoid a return to recession and European policymakers appeared to take steps to address the region’s sovereign debt and banking sector
crises. Renewed investor optimism helped produce gains across commodities and international equity markets over the first three months of 2012. The rebound gained momentum after the European Central Bank the (“ECB”) implemented dual Long-Term Refinancing Operations to enhance liquidity for troubled banks and reduce rates on newly issued sovereign debt securities.
| | | | |
| OPPENHEIMER COMMODITY STRATEGY TOTAL RETURN FUND | | | 3 | |
The second quarter was more volatile as commodity prices weakened in tandem with the global economy, and oil prices in particular saw a steep drop. The fear of contagion from the worsening European sovereign debt crisis and a recession across much of Europe drove negative market sentiment. Growth also slowed across much of the emerging world with notable declines in activity in Brazil, India and China. In the U.S., slow growth and high unemployment weighed on stocks.
Commodities performed positively over the third quarter of 2012, before declining again in the fourth quarter. Several factors combined to lift commodity prices in the third quarter, including a broad-based drop in the U.S. dollar, which typically boosts the performance of commodities. In addition, a global wave of money printing and unconventional monetary policy easing by central banks including the ECB and the Federal Reserve (the “Fed”), benefited commodities in the third quarter. The ECB moved first in early September with its announcement of an open-ended program called Outright Monetary Transactions. The Fed announced the following week that it would embark on open-ended QE3 by purchasing $40 billion of agency mortgage-backed securities monthly until further notice, with a goal of reducing unemployment. It also extended Operation Twist. These measures tend to support hard asset prices (including commodities) as investors look for ways to protect against weakening
fiat currencies and the risk of future inflation. While the dollar remained weak over the last quarter of the period, commodities lost value as a result of uncertainty over the U.S. elections and the fiscal cliff/debt ceiling, and concerns over slowing growth in the emerging markets.
FUND REVIEW
The strongest performing sectors of the Index were agriculture and precious metals, which generated returns of 6.46% and 6.21% for the Index, respectively. Industrial metals also generated a positive return of 1.37%. Energy and livestock produced negative returns of 1.37% and 3.95% for the Index, respectively.
The Fund had its largest weighting to energy, which consisted of roughly 69% of its commodity-linked investments at period end. Energy’s declines were led by natural gas and West Texas Intermediate (“WTI”) crude oil. Unleaded gasoline was the strongest performer for the sector this period, followed by Brent, heating oil and gasoil. Natural gas declined in part because of growing domestic production combined with an unusually mild winter of 2011 and a warm start to the winter of 2012. In addition, natural gas is among the most expensive commodities to store. Regarding Brent and gasoil, tight supply globally combined with geopolitical risk in the Middle East to support prices this year. The strength in unleaded gasoline was partly a function of slack demand in the U.S. being outweighed
| | |
| 4 | | OPPENHEIMER COMMODITY STRATEGY TOTAL RETURN FUND |
by numerous refinery disruptions which reduced supplies and caused domestic inventories to decline. At the same time, increasing global demand and growing exports helped to support prices. Relatively cheap WTI and extremely cheap natural gas (often used as an energy source for refinery distillation) combined in 2012 to make the U.S. a prime low-cost producer and exporter of unleaded gas, especially to Latin America.
Agriculture, with approximately 15.5% of the Fund’s commodity-linked investments at period end, was the second largest allocation for the Fund. Its positive performance was driven primarily by a strong rise in soybeans and corn. Agriculture also benefited from the performance of Kansas Wheat, Chicago Wheat and cocoa. In contrast, cotton and sugar both experienced declines, and coffee was the worst agriculture performer in the Index for the year. Regarding the grains, although the planting season in the U.S. got off to a strong start after a mild winter, severe drought in the grain belt reduced yield estimates sharply for corn, soybeans and wheat, reducing worries of oversupply this year and sending grain prices sharply higher. In fact, corn and soybeans reached all-time high prices over the summer. Wheat was a strong performer later in the year as fears of potential export reductions from Russia and Ukraine helped support prices. Sugar was negatively impacted by increased production from Brazil and India, while cotton faced the challenge of solid U.S. production plus reduced demand from China. Finally, ample
supplies of Arabica coffee from Brazil and reduced demand from recession-plagued Europe contributed to the steep price drop in that commodity.
Precious metals and industrial metals consisted of approximately 4% and 7% of the Fund’s commodity-linked investments at period end, respectively. The precious metals sector benefited from the positive performance of silver and gold. Significantly, this marked the 12th year in a row when gold generated a positive return. Central banks collectively bought more than 400 metric tons of gold in 2012, and investment demand continued to grow throughout the year. Major buyers included South Korea, the Philippines, Mexico, Kazakhstan, Russia, Ukraine, Turkey and Argentina. U.S. dollar weakness also helped precious metals pricing in 2012, as did mining disruptions (principally in South Africa) and production shortfalls. The industrial metals sector performed markedly better than it did in 2011, when it experienced significant declines. Lead and zinc were the strongest performers this period, followed by copper. Aluminum and nickel experienced declines. Expectations of growing metal demand in 2013, notably from China, and early signs of improving growth in emerging markets were key drivers of rising prices. Excess supplies of aluminum pressured that metal. Monetary easing by central banks around the world, fiscal stimulus in China and mining disruptions (principally caused by labor disputes) overcame signs of slowing growth in
| | | | |
| OPPENHEIMER COMMODITY STRATEGY TOTAL RETURN FUND | | | 5 | |
the emerging markets to help support the sector this year.
Livestock, which consisted of roughly 5% of the Fund’s commodity-linked investments at period end, produced a negative return driven by the performance of feeder cattle. Live cattle and lean hogs also experienced declines to a lesser degree. The combined impact of drought and a sharp spike in grain prices caused ranchers in the U.S. to cull their herds, which hurt livestock prices. Supplies were forced onto the market, depressing prices this year, but raising concerns about future supply. High storage costs also contributed to the negative returns.
STRATEGY & OUTLOOK
Looking forward, we are on the lookout for improving global growth expectations, continued weakness in the dollar as the Fed executes open-ended quantitative easing, fewer sovereign debt crisis-related headlines
from Europe and progress toward addressing the debt ceiling. Any of these factors could provide additional support for commodity prices. We expect volatility in the commodity complex to continue in the near term as investors react to shifting macroeconomic headlines and the market adjusts to the latest developments in Europe and the Middle East.
We maintain our expectation that short-term interest rates in the U.S. will remain anchored at extremely low levels for the foreseeable future. Virtually every central bank that can print money is printing money, and those that can’t are pursuing various forms of unconventional monetary policy easing. As long as the Fed’s accommodative policy remains in place, and the global economy continues to grow, we believe that commodities can perform well in 2013 and continue to provide diversification benefits and an inflation hedge for investors.
| | |
 | | 
Robert Baker, CFA Portfolio Manager |
| | |
 | | 
Carol Wolf Portfolio Manager |
| | |
| 6 | | OPPENHEIMER COMMODITY STRATEGY TOTAL RETURN FUND |
Top Holdings and Allocations
| | | | |
SECTOR ALLOCATION OF COMMODITY-
LINKED INVESTMENTS | |
| Energy | | | 69.07 | % |
| Agriculture | | | 15.59 | |
| Industrial Metals | | | 6.93 | |
| Livestock | | | 4.97 | |
| Precious Metals | | | 4.05 | |
Portfolio holdings and allocations are subject to change. Percentages are as of December 31, 2012, and represent the relative economic exposure, by sector, of the commodity-linked investments held by the Fund and its Wholly-Owned Subsidiary, RAF Fund Ltd., and are based on net assets. Commodity-linked investments are investments whose return is based upon the price movements (whether up or down) of a particular commodity or basket of commodities. The Fund’s allocation of its investments within each sector of the S&P GSCI may differ (at times, significantly) from the sector weightings of the S&P GSCI. The Fund is not an index fund.
| | | | |
| PORTFOLIO ALLOCATION | |
| Money Market Fund | | | 38.1 | % |
| Wholly-Owned Subsidiary | | | 23.6 | |
| Hybrid Instruments | | | 18.4 | |
| U.S. Government Obligations | | | 14.9 | |
| Short-Term Notes | | | 5.0 | |
| Mortgage-Backed Obligations | | | — | * |
*Represents less than 0.05%.
Portfolio holdings and allocations are subject to change. Percentages are as of December 31, 2012, and are based on the total market value of investments.
| | | | |
| OPPENHEIMER COMMODITY STRATEGY TOTAL RETURN FUND | | | 7 | |
Share Class Performance
AVERAGE ANNUAL TOTAL RETURNS WITHOUT SALES CHARGE AS OF 12/31/12
| | | | | | | | | | | | | | | | |
| | | Inception Date | | | 1-Year | | | 5-Year | | | 10-Year | |
| CLASS A (QRAAX) | | | 3/31/97 | | | | –1.80 | % | | | –12.35 | % | | | 0.82 | % |
| CLASS B (QRABX) | | | 3/31/97 | | | | –2.71 | % | | | –13.06 | % | | | 0.29 | % |
| CLASS C (QRACX) | | | 3/31/97 | | | | –2.45 | % | | | –13.04 | % | | | 0.02 | % |
| CLASS I (QRAIX) | | | 4/27/12 | | | | –5.16 | %* | | | N/A | | | | N/A | |
| CLASS N (QRANX) | | | 3/1/01 | | | | –2.13 | % | | | –12.61 | % | | | 0.49 | % |
| CLASS Y (QRAYX) | | | 3/31/97 | | | | –1.49 | % | | | –11.99 | % | | | 1.26 | % |
|
AVERAGE ANNUAL TOTAL RETURNS WITH SALES CHARGE AS OF 12/31/12 | |
| | | Inception Date | | | 1-Year | | | 5-Year | | | 10-Year | |
| CLASS A (QRAAX) | | | 3/31/97 | | | | –7.44 | % | | | –13.38 | % | | | 0.23 | % |
| CLASS B (QRABX) | | | 3/31/97 | | | | –7.58 | % | | | –13.37 | % | | | 0.29 | % |
| CLASS C (QRACX) | | | 3/31/97 | | | | –3.43 | % | | | –13.04 | % | | | 0.02 | % |
| CLASS I (QRAIX) | | | 4/27/12 | | | | –5.16 | %* | | | N/A | | | | N/A | |
| CLASS N (QRANX) | | | 3/1/01 | | | | –3.11 | % | | | –12.61 | % | | | 0.49 | % |
| CLASS Y (QRAYX) | | | 3/31/97 | | | | –1.49 | % | | | –11.99 | % | | | 1.26 | % |
* Shows performance since inception.
The performance data quoted represents past performance, which does not guarantee future results. The investment return and principal value of an investment in the Fund will fluctuate so that an investor’s shares, when redeemed, may be worth more or less than their original cost. Current performance may be lower or higher than the performance quoted. Returns do not consider capital gains or income taxes on an individual’s investment. For performance data current to the most recent month-end, visit oppenheimerfunds.com or call 1.800.CALL OPP (225.5677). Fund returns include changes in share price, reinvested distributions, and the applicable sales charge: for Class A shares, the current maximum initial sales charge of 5.75%; for Class B shares, the contingent deferred sales charge of 5% (1-year) and 2% (5-year); and for Class C and N shares, the contingent deferred sales charge of 1% for the 1-year period. There is no sales charge for Class I and Class Y shares. Because Class B shares convert to Class A shares 72 months after purchase, the 10-year return for Class B shares uses Class A performance for the period after conversion. Returns for periods of less than one year are cumulative and not annualized.
The Fund’s performance is compared to the performance of the S&P Goldman Sachs Commodity Index (S&P GSCI™). The S&P GSCI is a composite index of commodity sector returns representing an unleveraged, long-term investment in commodity futures. The
| | |
| 8 | | OPPENHEIMER COMMODITY STRATEGY TOTAL RETURN FUND |
Index is unmanaged and cannot be purchased directly by investors. Index performance is shown for illustrative purposes only and does not predict or depict the performance of the Fund. While index comparisons may be useful to provide a benchmark for the Fund’s performance, it must be noted that the Fund’s investments are not limited to the investments comprising the Index.
The Fund’s investment strategy and focus can change over time. The mention of specific fund holdings does not constitute a recommendation by OppenheimerFunds, Inc. or its affiliates.
Before investing in any of the Oppenheimer funds, investors should carefully consider a fund’s investment objectives, risks, charges and expenses. Fund prospectuses and summary prospectuses contain this and other information about the funds, and may be obtained by asking your financial advisor, visiting oppenheimerfunds.com, or calling 1.800.CALL OPP (225.5677). Read prospectuses and summary prospectuses carefully before investing.
Shares of Oppenheimer funds are not deposits or obligations of any bank, are not guaranteed by any bank, are not insured by the FDIC or any other agency, and involve investment risks, including the possible loss of the principal amount invested.
| | | | |
| OPPENHEIMER COMMODITY STRATEGY TOTAL RETURN FUND | | | 9 | |
Fund Expenses
Fund Expenses. As a shareholder of the Fund, you incur two types of costs: (1) transaction costs, which may include sales charges (loads) on purchase payments, contingent deferred sales charges on redemptions and (2) ongoing costs, including management fees; distribution and service fees; and other Fund expenses. These examples are intended to help you understand your ongoing costs (in dollars) of investing in the Fund and to compare these costs with the ongoing costs of investing in other mutual funds.
The examples are based on an investment of $1,000.00 invested at the beginning of the period and held for the entire 6-month period ended December 31, 2012.
Actual Expenses. The first section of the table provides information about actual account values and actual expenses. You may use the information in this section for the class of shares you hold, together with the amount you invested, to estimate the expense that you paid over the period. Simply divide your account value by $1,000.00 (for example, an $8,600.00 account value divided by $1,000.00 = 8.60), then multiply the result by the number in the first section under the heading entitled “Expenses Paid During Period” to estimate the expenses you paid on your account during this period.
Hypothetical Example for Comparison Purposes. The second section of the table provides information about hypothetical account values and hypothetical expenses based on the Fund’s actual expense ratio for each class of shares, and an assumed rate of return of 5% per year for each class before expenses, which is not the actual return. The hypothetical account values and expenses may not be used to estimate the actual ending account balance or expenses you paid for the period. You may use this information to compare the ongoing costs of investing in the Fund and other funds. To do so, compare this 5% hypothetical example for the class of shares you hold with the 5% hypothetical examples that appear in the shareholder reports of the other funds.
Please note that the expenses shown in the table are meant to highlight your ongoing costs only and do not reflect any transactional costs, such as front-end or contingent deferred sales charges (loads), or a $12.00 fee imposed annually on accounts valued at less than $500.00 (subject to exceptions described in the Statement of Additional Information). Therefore, the “hypothetical” section of the table is useful in comparing ongoing costs only, and will not help you determine the relative total costs of owning different funds. In addition, if these transactional costs were included, your costs would have been higher.
| | |
| 10 | | OPPENHEIMER COMMODITY STRATEGY TOTAL RETURN FUND |
Fund Expenses Continued
| | | | | | | | | | | | |
| Actual | | Beginning
Account
Value
July 1, 2012 | | | Ending
Account
Value
December 31, 2012 | | | Expenses
Paid During
6 Months Ended
December 31, 2012 | |
| Class A | | $ | 1,000.00 | | | $ | 1,075.40 | | | $ | 6.80 | |
| Class B | | | 1,000.00 | | | | 1,069.50 | | | | 10.82 | |
| Class C | | | 1,000.00 | | | | 1,067.10 | | | | 11.07 | |
| Class I | | | 1,000.00 | | | | 1,078.20 | | | | 3.61 | |
| Class N | | | 1,000.00 | | | | 1,073.30 | | | | 7.85 | |
| Class Y | | | 1,000.00 | | | | 1,074.90 | | | | 3.71 | |
| | | |
Hypothetical
(5% return before expenses) | | | | | | | | | |
| Class A | | | 1,000.00 | | | | 1,018.60 | | | | 6.62 | |
| Class B | | | 1,000.00 | | | | 1,014.73 | | | | 10.54 | |
| Class C | | | 1,000.00 | | | | 1,014.48 | | | | 10.79 | |
| Class I | | | 1,000.00 | | | | 1,021.67 | | | | 3.51 | |
| Class N | | | 1,000.00 | | | | 1,017.60 | | | | 7.64 | |
| Class Y | | | 1,000.00 | | | | 1,021.57 | | | | 3.61 | |
Expenses are equal to the Fund’s annualized expense ratio for that class, multiplied by the average account value over the period, multiplied by 184/366 (to reflect the one-half year period). Those annualized expense ratios, excluding indirect expenses from affiliated fund, based on the 6-month period ended December 31, 2012 are as follows:
| | | | |
| Class | | Expense Ratios | |
| Class A | | | 1.30 | % |
| Class B | | | 2.07 | |
| Class C | | | 2.12 | |
| Class I | | | 0.69 | |
| Class N | | | 1.50 | |
| Class Y | | | 0.71 | |
The expense ratios reflect voluntary waivers and/or reimbursements of expenses by the Fund’s Manager and Transfer Agent. Some of these undertakings may be modified or terminated at any time, as indicated in the Fund’s prospectus. The “Financial Highlights” tables in the Fund’s financial statements, included in this report, also show the gross expense ratios, without such waivers or reimbursements and reduction to custodian expenses, if applicable.
| | | | |
| OPPENHEIMER COMMODITY STRATEGY TOTAL RETURN FUND | | | 11 | |
STATEMENT OF INVESTMENTS December 31, 2012
| | | | | | | | |
| | | Shares | | | Value | |
| | | | | | | | | |
| Wholly-Owned Subsidiary—23.8% | |
| RAF Fund Ltd.1,2 (Cost $182,716,732) | | | 4,000,000 | | | $ | 147,439,106 | |
| | |
| | | Principal
Amount | | | | |
| Mortgage-Backed Obligations—0.0% | | | | | | | | |
NC Finance Trust, Collateralized Mtg. Obligation
Pass-Through Certificates, Series 1999-I, Cl. ECFD,
3.405%, 1/25/293,4 (Cost $398,721) | | $ | 405,715 | | | | 32,457 | |
| U.S. Government Obligations—15.0% | | | | | | | | |
U.S. Treasury Nts.:
0.25%, 5/31/14 | | | 2,000,000 | | | | 2,001,250 | |
| 0.375%, 11/15/14 | | | 3,500,000 | | | | 3,508,750 | |
| 0.50%, 10/15/13-11/15/13 | | | 14,500,000 | | | | 14,540,535 | |
| 0.625%, 1/31/13-7/15/14 | | | 16,500,000 | | | | 16,522,524 | |
| 0.75%, 8/15/13 | | | 5,000,000 | | | | 5,019,335 | |
| 1%, 7/15/13-1/15/14 | | | 10,000,000 | | | | 10,066,410 | |
| 1.25%, 4/15/14 | | | 4,000,000 | | | | 4,053,440 | |
| 1.375%, 5/15/13 | | | 10,000,000 | | | | 10,048,050 | |
| 1.75%, 4/15/13-1/31/14 | | | 8,500,000 | | | | 8,559,162 | |
| 1.875%, 2/28/14 | | | 5,500,000 | | | | 5,606,777 | |
| 2.25%, 5/31/14-1/31/15 | | | 3,000,000 | | | | 3,110,782 | |
| 2.375%, 10/31/14-2/28/15 | | | 5,700,000 | | | | 5,940,930 | |
| 4.125%, 5/15/15 | | | 3,000,000 | | | | 3,269,766 | |
| 4.25%, 8/15/14 | | | 700,000 | | |
| 745,445
|
|
| Total U.S. Government Obligations (Cost $92,759,540) | | | | 92,993,156 | |
| Hybrid Instruments—18.4% | | | | | | | | |
| Commodity-Linked Securities—18.4% | | | | | | | | |
Canadian Imperial Bank of Commerce, S&P GSCI TR Index Linked
Nts., 0.03%, 1/28/145,6,7 | | | 13,000,000 | | | | 13,185,900 | |
Cargill, Inc.:
S&P GSCI TR Index Linked Nts., 0.98%, 8/27/137 | | | 7,000,000 | | | | 6,024,019 | |
| S&P GSCI TR Index Linked Nts., 1.008%, 6/11/137 | | | 22,000,000 | | | | 29,481,842 | |
Goldman Sachs Group, Inc. (The):
S&P GSCI ER Index Linked Nts., 0.056%, 10/29/136,7 | | | 14,000,000 | | | | 12,625,423 | |
| S&P GSCI ER Index Linked Nts., 0%, 9/26/136,7,8 | | | 14,000,000 | | | | 12,356,981 | |
Morgan Stanley, S&P GSCI TR Index Linked
Nts., 0.09%, 12/17/135,6,7 | | | 8,000,000 | | | | 7,963,185 | |
UBS:
S&P GSCI Precious Metals TR Index Linked
Nts, 0.111%, 9/6/135,6,9 | | | 4,000,000 | | | | 3,970,377 | |
S&P GSCI TR Index Linked
Nts., 0.16%, 7/2/135,6,7 | | | 20,000,000 | | |
| 28,885,792
|
|
| Total Hybrid Instruments (Cost $102,000,000) | | | | 114,493,519 | |
| | |
| 12 | | OPPENHEIMER COMMODITY STRATEGY TOTAL RETURN FUND |
| | | | | | | | |
| | | Principal
Amount | | | Value | |
| | | | | | | | | |
| Short-Term Notes—5.0% | | | | | | | | |
Federal Home Loan Bank:
0.06%, 1/4/13 | | $ | 2,000,000 | | | $ | 1,999,983 | |
| 0.06%, 1/11/13 | | | 1,500,000 | | | | 1,499,946 | |
| 0.09%, 1/23/13 | | | 500,000 | | | | 499,973 | |
| 0.13%, 1/8/13 | | | 1,500,000 | | | | 1,499,962 | |
| 0.13%, 6/5/13 | | | 2,000,000 | | | | 1,999,230 | |
| 0.15%, 4/5/13 | | | 1,000,000 | | | | 999,621 | |
| 0.15%, 4/1/13 | | | 3,000,000 | | | | 2,999,556 | |
| 0.15%, 5/3/13 | | | 5,000,000 | | | | 4,998,655 | |
| 0.16%, 2/13/13 | | | 2,000,000 | | | | 1,999,630 | |
| 0.16%, 5/29/13 | | | 6,000,000 | | | | 5,998,038 | |
| 0.16%, 1/16/13 | | | 2,000,000 | | | | 1,999,867 | |
| 0.16%, 4/24/13 | | | 4,500,000 | | |
| 4,499,158
|
|
| Total Short-Term Notes (Cost $30,988,020) | | | | | | | 30,993,619 | |
| | | Shares | | | | |
| Investment Company—38.2% | | | | | | | | |
Oppenheimer Institutional Money Market Fund, Cl. E, 0.15%1,10
(Cost $237,365,983) | | | 237,365,983 | | | | 237,365,983 | |
| Total Investments, at Value (Cost $646,228,996) | | | 100.4 | % | | | 623,317,840 | |
| Liabilities in Excess of Other Assets | | | (0.4 | ) | | | (2,456,911 | ) |
| | |
|
|
|
| Net Assets | | | 100.0 | % | | $ | 620,860,929 | |
| | |
|
|
|
Footnotes to Statement of Investments
1. Is or was an affiliate, as defined in the Investment Company Act of 1940, at or during the period ended December 31, 2012, by virtue of the Fund owning at least 5% of the voting securities of the issuer or as a result of the Fund and the issuer having the same investment adviser. Transactions during the period in which the issuer was an affiliate are as follows:
| | | | | | | | | | | | | | | | | | | | |
| | | Shares
December 30, 2011a | | Gross
Additions | | Gross
Reductions | | Shares
December 31, 2012 |
| Oppenheimer Institutional Money Market Fund, Cl. E | | | | 528,337,873 | | | | | 332,986,156 | | | | | 623,958,046 | | | | | 237,365,983 | |
| RAF Fund Ltd.b | | | | 4,000,000 | | | | | — | | | | | — | | | | | 4,000,000 | |
| | | | |
| | | | | Value | | Income | | Realized
Loss |
| Oppenheimer Institutional Money Market Fund, Cl. E | | | | | | | | $ | 237,365,983 | | | | $ | 729,668 | | | | $ | — | |
| RAF Fund Ltd.b | | | | | | | | | 147,439,106 | | | | | — | | | | | 5,826,257 | |
| | | | | | | | |
|
|
|
| | | | | | | | | $ | 384,805,089 | | | | $ | 729,668 | | | | $ | 5,826,257 | |
| | | | | | | | |
|
|
|
a. December 30, 2011 represents the last business day of the Fund’s 2011 fiscal year. See Note 1 of the accompanying Notes.
b. Investment in a wholly-owned subsidiary. See Note 1 of the accompanying Notes and individual financial statements of the entity included herein.
2. Non-income producing security.
3. This security is not accruing income because the issuer has missed an interest payment on it and/or is not anticipated to make future interest and/or principal payments. The rate shown is the original contractual interest rate. See Note 1 of the accompanying Notes.
| | | | |
| OPPENHEIMER COMMODITY STRATEGY TOTAL RETURN FUND | | | 13 | |
STATEMENT OF INVESTMENTS Continued
Footnotes to Statement of Investments Continued
4. Restricted security. The aggregate value of restricted securities as of December 31, 2012 was $32,457, which represents 0.01% of the Fund’s net assets. See Note 6 of the accompanying Notes. Information concerning restricted securities is as follows:
| | | | | | | | | | | | | | | | | | | | |
| Security | | Acquisition
Date | | Cost | | Value | | Unrealized
Depreciation |
| NC Finance Trust, Collateralized Mtg. Obligation Pass-Through Certificates, Series 1999-I, Cl. ECFD, 3.405%, 1/25/29 | | | | 8/10/10 | | | | $ | 398,721 | | | | $ | 32,457 | | | | $ | 366,264 | |
5. Represents securities sold under Rule 144A, which are exempt from registration under the Securities Act of 1933, as amended. These securities have been determined to be liquid under guidelines established by the Board of Trustees. These securities amount to $54,005,254 or 8.70% of the Fund’s net assets as of December 31, 2012.
6. Represents the current interest rate for a variable or increasing rate security.
7. Security is linked to the S&P GSCI, the S&P GSCI Excess Return Index or the S&P GSCI Total Return Index. The indexes currently contain twenty-eight commodities contracts from the sectors of energy, metals, livestock and agricultural products. Individual components in the index are weighted by their respective world production values.
8. Interest rate is less than 0.0005%.
9. Security is linked to the S&P GSCI Precious Metals Total Return Index. The index currently is comprised of gold & silver.
10. Rate shown is the 7-day yield as of December 31, 2012.
See accompanying Notes to Financial Statements.
| | |
| 14 | | OPPENHEIMER COMMODITY STRATEGY TOTAL RETURN FUND |
STATEMENT OF ASSETS AND LIABILITIES December 31, 2012
| | | | |
| Assets | | | |
| Investments, at value—see accompanying statement of investments: | | | | |
| Unaffiliated companies (cost $226,146,281) | | $ | 238,512,751 | |
| Affiliated companies (cost $237,365,983) | | | 237,365,983 | |
| Wholly-owned subsidiary (cost $182,716,732) | |
| 147,439,106
|
|
| | | | 623,317,840 | |
| Cash | | | 1,158,661 | |
| Receivables and other assets: | | | | |
| Interest and dividends | | | 498,948 | |
| Other | |
| 39,736
|
|
| Total assets | | | 625,015,185 | |
| Liabilities | | | |
| Payables and other liabilities: | | | | |
| Shares of beneficial interest redeemed | | | 3,663,496 | |
| Shareholder communications | | | 221,928 | |
| Transfer and shareholder servicing agent fees | | | 115,804 | |
| Distribution and service plan fees | | | 68,120 | |
| Trustees’ compensation | | | 32,607 | |
| Other | |
| 52,301
|
|
| Total liabilities | | | 4,154,256 | |
| Net Assets | | $
| 620,860,929
|
|
| Composition of Net Assets | | | |
| Par value of shares of beneficial interest | | $ | 189,583 | |
| Additional paid-in capital | | | 1,554,162,182 | |
| Accumulated net investment loss | | | (335,744,912 | ) |
| Accumulated net realized loss on investments | | | (574,834,768 | ) |
| Net unrealized depreciation on investments | |
| (22,911,156
| )
|
| Net Assets | | $
| 620,860,929
|
|
| | | | |
| OPPENHEIMER COMMODITY STRATEGY TOTAL RETURN FUND | | | 15 | |
STATEMENT OF ASSETS AND LIABILITIES Continued
| | | | |
| Net Asset Value Per Share | | | |
| Class A Shares: | | | | |
Net asset value and redemption price per share (based on net assets of $228,223,703
and 69,628,702 shares of beneficial interest outstanding) | | $ | 3.28 | |
| Maximum offering price per share (net asset value plus sales charge of 5.75% of offering price) | | $ | 3.48 | |
| Class B Shares: | | | | |
Net asset value, redemption price (excludes applicable contingent deferred sales charge)
and offering price per share (based on net assets of $13,291,183 and 4,114,685 shares of
beneficial interest outstanding) | | $ | 3.23 | |
| Class C Shares: | | | | |
Net asset value, redemption price (excludes applicable contingent deferred sales charge)
and offering price per share (based on net assets of $64,073,754 and 20,152,417 shares of
beneficial interest outstanding) | | $ | 3.18 | |
| Class I Shares: | | | | |
Net asset value, redemption price and offering price per share (based on net assets of $7,383,336
and 2,233,514 shares of beneficial interest outstanding) | | $ | 3.31 | |
| Class N Shares: | | | | |
Net asset value, redemption price (excludes applicable contingent deferred sales charge)
and offering price per share (based on net assets of $14,102,014 and 4,380,079 shares of
beneficial interest outstanding) | | $ | 3.22 | |
| Class Y Shares: | | | | |
| Net asset value, redemption price and offering price per share (based on net assets of $293,786,939 and 89,073,746 shares of beneficial interest outstanding) | | $ | 3.30 | |
See accompanying Notes to Financial Statements.
| | |
| 16 | | OPPENHEIMER COMMODITY STRATEGY TOTAL RETURN FUND |
STATEMENT OF OPERATIONS For the Year Ended December 31, 2012
| | | | |
| Investment Income | | | |
| Interest | | $ | 1,213,118 | |
| Dividends from affiliated companies | | | 729,668 | |
| Other income | |
| 26,300
|
|
| Total investment income | | | 1,969,086 | |
| Expenses | | | |
| Management fees | | | 7,523,975 | |
| Distribution and service plan fees: | | | | |
| Class A | | | 692,426 | |
| Class B | | | 154,490 | |
| Class C | | | 738,900 | |
| Class N | | | 78,293 | |
| Transfer and shareholder servicing agent fees: | | | | |
| Class A | | | 1,221,231 | |
| Class B | | | 133,367 | |
| Class C | | | 374,684 | |
| Class I | | | 51 | |
| Class N | | | 105,122 | |
| Class Y | | | 968,697 | |
| Shareholder communications: | | | | |
| Class A | | | 251,246 | |
| Class B | | | 28,623 | |
| Class C | | | 76,051 | |
| Class N | | | 11,773 | |
| Class Y | | | 298,509 | |
| Trustees’ compensation | | | 39,188 | |
| Custodian fees and expenses | | | 31,340 | |
| Administration service fees | | | 1,500 | |
| Other | |
| 107,769
|
|
| Total expenses | | | 12,837,235 | |
| Less waivers and reimbursements of expenses | |
| (2,930,829
| )
|
| Net expenses | | | 9,906,406 | |
| Net Investment Loss | | | (7,937,320 | ) |
| | | | |
| OPPENHEIMER COMMODITY STRATEGY TOTAL RETURN FUND | | | 17 | |
STATEMENT OF OPERATIONS Continued
| | | | |
| Realized and Unrealized Gain (Loss) | | | |
| Net realized loss on: | | | | |
| Investments from unaffiliated companies | | $ | (14,940,539 | ) |
| Wholly-owned subsidiary | |
| (5,826,257
| )
|
| Net realized loss | | | (20,766,796 | ) |
| Net change in unrealized appreciation/depreciation on investments | | | 4,613,220 | |
| Net Decrease in Net Assets Resulting from Operations | | $
| (24,090,896
| )
|
See accompanying Notes to Financial Statements.
| | |
| 18 | | OPPENHEIMER COMMODITY STRATEGY TOTAL RETURN FUND |
STATEMENTS OF CHANGES IN NET ASSETS
| | | | | | | | |
| | | Year Ended
December 31,
2012 | | | Year Ended
December 30,
20111 | |
| Operations | | | | | | |
| Net investment loss | | $ | (7,937,320 | ) | | $ | (14,315,647 | ) |
| Net realized gain (loss) | | | (20,766,796 | ) | | | 50,324,167 | |
| Net change in unrealized appreciation/depreciation | |
| 4,613,220
|
| |
| (81,429,755
| )
|
| Net decrease in net assets resulting from operations | | | (24,090,896 | ) | | | (45,421,235 | ) |
| Dividends and/or Distributions to Shareholders | | | | | | |
| Dividends from net investment income: | | | | | | | | |
| Class A | | | — | | | | (19,451,404 | ) |
| Class B | | | — | | | | (925,950 | ) |
| Class C | | | — | | | | (4,505,153 | ) |
| Class I | | | — | | | | — | |
| Class N | | | — | | | | (1,026,742 | ) |
| Class Y | |
| —
|
| |
| (46,432,334
| )
|
| | | | — | | | | (72,341,583 | ) |
| Beneficial Interest Transactions | | | | | | |
| Net increase (decrease) in net assets resulting from beneficial interest transactions: | | | | | | | | |
| Class A | | | (93,283,326 | ) | | | (80,385,037 | ) |
| Class B | | | (4,334,842 | ) | | | (3,876,231 | ) |
| Class C | | | (16,644,444 | ) | | | 4,673,204 | |
| Class I | | | 7,348,634 | | | | — | |
| Class N | | | (2,618,174 | ) | | | 552,909 | |
| Class Y | |
| (430,218,541
| )
| |
| (384,660,698
| )
|
| | | | (539,750,693 | ) | | | (463,695,853 | ) |
| Net Assets | | | | | | |
| Total decrease | | | (563,841,589 | ) | | | (581,458,671 | ) |
| Beginning of period | |
| 1,184,702,518
|
| |
| 1,766,161,189
|
|
End of period (including accumulated net investment loss
of $335,744,912 and $335,716,593, respectively) | | $
| 620,860,929
|
| | $
| 1,184,702,518
|
|
1. December 30, 2011 represents the last business day of the Fund’s 2011 fiscal year. See Note 1 of the accompanying Notes.
See accompanying Notes to Financial Statements.
| | | | |
| OPPENHEIMER COMMODITY STRATEGY TOTAL RETURN FUND | | | 19 | |
FINANCIAL HIGHLIGHTS
| | | | | | | | | | | | | | | | | | | | |
| | | Year Ended
December 31, | | | Year Ended
December 30, | | | Year Ended December 31, | |
| Class A | | 2012 | | | 20111 | | | 2010 | | | 2009 | | | 2008 | |
| | | | | | | | | | | | | | | | | | | | | |
| Per Share Operating Data | | | | | | | | | | | | | | | |
| Net asset value, beginning of period | | $ | 3.34 | | | $ | 3.66 | | | $ | 3.42 | | | $ | 3.11 | | | $ | 7.51 | |
| Income (loss) from investment operations: | | | | | | | | | | | | | | | | | | | | |
| Net investment income (loss)2 | | | (.03 | ) | | | (.04 | ) | | | (.03 | ) | | | (.02 | ) | | | .17 | |
| Net realized and unrealized gain (loss) | |
| (.03
| )
| |
| (.07
| )
| |
| .32
|
| |
| .33
|
| |
| (4.29
| )
|
| Total from investment operations | | | (.06 | ) | | | (.11 | ) | | | .29 | | | | .31 | | | | (4.12 | ) |
| Dividends and/or distributions to shareholders: | | | | | | | | | | | | | | | | | | | | |
| Dividends from net investment income | | | — | | | | (.21 | ) | | | (.05 | ) | | | — | | | | (.28 | ) |
| Net asset value, end of period | | $
| 3.28
|
| | $
| 3.34
|
| | $
| 3.66
|
| | $
| 3.42
|
| | $
| 3.11
|
|
| Total Return, at Net Asset Value3 | | | (1.80 | )% | | | (2.93 | )% | | | 8.61 | % | | | 9.97 | % | | | (54.57 | )% |
| | | | | | | | | | | | | | | | | | | | | |
| Ratios/Supplemental Data | | | | | | | | | | | | | | | |
| Net assets, end of period (in thousands) | | | $228,224 | | | | $326,818 | | | | $439,204 | | | | $457,757 | | | | $320,191 | |
| Average net assets (in thousands) | | | $284,670 | | | | $424,280 | | | | $410,353 | | | | $385,924 | | | | $788,007 | |
| Ratios to average net assets:4 | | | | | | | | | | | | | | | | | | | | |
| Net investment income (loss) | | | (1.03 | )% | | | (1.00 | )% | | | (0.97 | )% | | | (0.65 | )% | | | 2.24 | % |
| Total expenses5 | | | 1.66 | % | | | 1.51 | % | | | 1.57 | % | | | 1.68 | % | | | 1.35 | % |
| Expenses after payments, waivers and/or reimbursements and reduction to custodian expenses6 | | | 1.26 | % | | | 1.20 | % | | | 1.19 | % | | | 1.23 | % | | | 1.08 | % |
| Portfolio turnover rate | | | 44 | % | | | 21 | % | | | 38 | % | | | 51 | %7 | | | 86 | %7 |
1. December 30, 2011 represents the last business day of the Fund’s 2011 fiscal year. See Note 1 of the accompanying Notes.
2. Per share amounts calculated based on the average shares outstanding during the period.
3. Assumes an initial investment on the business day before the first day of the fiscal period, with all dividends and distributions reinvested in additional shares on the reinvestment date, and redemption at the net asset value calculated on the last business day of the fiscal period. Sales charges are not reflected in the total returns. Total returns are not annualized for periods less than one full year. Returns do not reflect the deduction of taxes that a shareholder would pay on fund distributions or the redemption of fund shares.
4. Annualized for periods less than one full year.
5. Ratio including all expenses of the wholly-owned subsidiary and indirect expenses from affiliated fund were as follows:
| | | | |
| Year Ended December 31, 2012 | | | 1.94 | % |
| Year Ended December 30, 2011 | | | 1.77 | % |
| Year Ended December 31, 2010 | | | 1.84 | % |
| Year Ended December 31, 2009 | | | 1.96 | % |
| Year Ended December 31, 2008 | | | 1.61 | % |
6. Ratio including all expenses of the wholly-owned subsidiary and indirect expenses from affiliated fund were as follows:
| | | | |
| Year Ended December 31, 2012 | | | 1.54 | % |
| Year Ended December 30, 2011 | | | 1.46 | % |
| Year Ended December 31, 2010 | | | 1.46 | % |
| Year Ended December 31, 2009 | | | 1.51 | % |
| Year Ended December 31, 2008 | | | 1.34 | % |
7. The portfolio turnover rate excludes purchase and sale transactions of To Be Announced (TBA) mortgage-related securities as follows:
| | | | | | | | |
| | | Purchase Transactions | | | Sale Transactions | |
| Year Ended December 31, 2009 | | $ | 39,303,425 | | | $ | 39,062,313 | |
| Year Ended December 31, 2008 | | $ | 1,144,572,727 | | | $ | 1,165,957,394 | |
See accompanying Notes to Financial Statements.
| | |
| 20 | | OPPENHEIMER COMMODITY STRATEGY TOTAL RETURN FUND |
| | | | | | | | | | | | | | | | | | | | |
| | | Year Ended
December 31, | | | Year Ended
December 30, | | | Year Ended December 31, | |
| Class B | | 2012 | | | 20111 | | | 2010 | | | 2009 | | | 2008 | |
| | | | | | | | | | | | | | | | | | | | | |
| Per Share Operating Data | | | | | | | | | | | | | | | |
| Net asset value, beginning of period | | $ | 3.32 | | | $ | 3.63 | | | $ | 3.40 | | | $ | 3.12 | | | $ | 7.39 | |
| Income (loss) from investment operations: | | | | | | | | | | | | | | | | | | | | |
| Net investment income (loss)2 | | | (.06 | ) | | | (.07 | ) | | | (.06 | ) | | | (.04 | ) | | | .11 | |
| Net realized and unrealized gain (loss) | |
| (.03
| )
| |
| (.06
| )
| |
| .31
|
| |
| .32
|
| |
| (4.17
| )
|
| Total from investment operations | | | (.09 | ) | | | (.13 | ) | | | .25 | | | | .28 | | | | (4.06 | ) |
| Dividends and/or distributions to shareholders: | | | | | | | | | | | | | | | | | | | | |
| Dividends from net investment income | | | — | | | | (.18 | ) | | | (.02 | ) | | | — | | | | (.21 | ) |
| Net asset value, end of period | | $
| 3.23
|
| | $
| 3.32
|
| | $
| 3.63
|
| | $
| 3.40
|
| | $
| 3.12
|
|
| Total Return, at Net Asset Value3 | | | (2.71 | )% | | | (3.57 | )% | | | 7.48 | % | | | 8.97 | % | | | (54.80 | )% |
| | | | | | | | | | | | | | | | | | | | | |
| Ratios/Supplemental Data | | | | | | | | | | | | | | | |
| Net assets, end of period (in thousands) | | | $13,291 | | | | $17,965 | | | | $23,489 | | | | $28,683 | | | | $29,455 | |
| Average net assets (in thousands) | | | $15,469 | | | | $22,207 | | | | $23,528 | | | | $27,137 | | | | $78,128 | |
| Ratios to average net assets:4 | | | | | | | | | | | | | | | | | | | | |
| Net investment income (loss) | | | (1.93 | )% | | | (1.80 | )% | | | (1.75 | )% | | | (1.40 | )% | | | 1.40 | % |
| Total expenses5 | | | 2.95 | % | | | 2.77 | % | | | 2.95 | % | | | 3.01 | % | | | 2.22 | % |
| Expenses after payments, waivers and/or reimbursements and reduction to custodian expenses6 | | | 2.17 | % | | | 2.01 | % | | | 2.00 | % | | | 2.01 | % | | | 1.92 | % |
| Portfolio turnover rate | | | 44 | % | | | 21 | % | | | 38 | % | | | 51 | %7 | | | 86 | %7 |
1. December 30, 2011 represents the last business day of the Fund’s 2011 fiscal year. See Note 1 of the accompanying Notes.
2. Per share amounts calculated based on the average shares outstanding during the period.
3. Assumes an initial investment on the business day before the first day of the fiscal period, with all dividends and distributions reinvested in additional shares on the reinvestment date, and redemption at the net asset value calculated on the last business day of the fiscal period. Sales charges are not reflected in the total returns. Total returns are not annualized for periods less than one full year. Returns do not reflect the deduction of taxes that a shareholder would pay on fund distributions or the redemption of fund shares.
4. Annualized for periods less than one full year.
5. Ratio including all expenses of the wholly-owned subsidiary and indirect expenses from affiliated fund were as follows:
| | | | |
| Year Ended December 31, 2012 | | | 3.23 | % |
| Year Ended December 30, 2011 | | | 3.03 | % |
| Year Ended December 31, 2010 | | | 3.22 | % |
| Year Ended December 31, 2009 | | | 3.29 | % |
| Year Ended December 31, 2008 | | | 2.47 | % |
6. Ratio including all expenses of the wholly-owned subsidiary and indirect expenses from affiliated fund were as follows:
| | | | |
| Year Ended December 31, 2012 | | | 2.45 | % |
| Year Ended December 30, 2011 | | | 2.27 | % |
| Year Ended December 31, 2010 | | | 2.27 | % |
| Year Ended December 31, 2009 | | | 2.29 | % |
| Year Ended December 31, 2008 | | | 2.17 | % |
7. The portfolio turnover rate excludes purchase and sale transactions of To Be Announced (TBA) mortgage-related securities as follows:
| | | | | | | | |
| | | Purchase Transactions | | | Sale Transactions | |
| Year Ended December 31, 2009 | | $ | 39,303,425 | | | $ | 39,062,313 | |
| Year Ended December 31, 2008 | | $ | 1,144,572,727 | | | $ | 1,165,957,394 | |
See accompanying Notes to Financial Statements.
| | | | |
| OPPENHEIMER COMMODITY STRATEGY TOTAL RETURN FUND | | | 21 | |
FINANCIAL HIGHLIGHTS Continued
| | | | | | | | | | | | | | | | | | | | |
| | | Year Ended
December 31, | | | Year Ended
December 30, | | | Year Ended December 31, | |
| Class C | | 2012 | | | 20111 | | | 2010 | | | 2009 | | | 2008 | |
| | | | | | | | | | | | | | | | | | | | | |
| Per Share Operating Data | | | | | | | | | | | | | | | |
| Net asset value, beginning of period | | $ | 3.26 | | | $ | 3.58 | | | $ | 3.35 | | | $ | 3.08 | | | $ | 7.34 | |
| Income (loss) from investment operations: | | | | | | | | | | | | | | | | | | | | |
| Net investment income (loss)2 | | | (.06 | ) | | | (.06 | ) | | | (.06 | ) | | | (.04 | ) | | | .11 | |
| Net realized and unrealized gain (loss) | |
| (.02
| )
| |
| (.07
| )
| |
| .32
|
| |
| .31
|
| |
| (4.15
| )
|
| Total from investment operations | | | (.08 | ) | | | (.13 | ) | | | .26 | | | | .27 | | | | (4.04 | ) |
| Dividends and/or distributions to shareholders: | | | | | | | | | | | | | | | | | | | | |
| Dividends from net investment income | | | — | | | | (.19 | ) | | | (.03 | ) | | | — | | | | (.22 | ) |
| Net asset value, end of period | | $
| 3.18
|
| | $
| 3.26
|
| | $
| 3.58
|
| | $
| 3.35
|
| | $
| 3.08
|
|
| Total Return, at Net Asset Value3 | | | (2.45 | )% | | | (3.69 | )% | | | 7.74 | % | | | 8.77 | % | | | (54.84 | )% |
| | | | | | | | | | | | | | | | | | | | | |
| Ratios/Supplemental Data | | | | | | | | | | | | | | | |
| Net assets, end of period (in thousands) | | | $64,074 | | | | $82,710 | | | | $86,502 | | | | $90,170 | | | | $ 72,405 | |
| Average net assets (in thousands) | | | $74,103 | | | | $92,415 | | | | $80,967 | | | | $78,974 | | | | $177,461 | |
| Ratios to average net assets:4 | | | | | | | | | | | | | | | | | | | | |
| Net investment income (loss) | | | (1.85 | )% | | | (1.76 | )% | | | (1.73 | )% | | | (1.41 | )% | | | 1.46 | % |
| Total expenses5 | | | 2.51 | % | | | 2.33 | % | | | 2.45 | % | | | 2.59 | % | | | 2.15 | % |
| Expenses after payments, waivers and/or reimbursements and reduction to custodian expenses6 | | | 2.09 | % | | | 1.96 | % | | | 1.96 | % | | | 1.99 | % | | | 1.87 | % |
| Portfolio turnover rate | | | 44 | % | | | 21 | % | | | 38 | % | | | 51 | %7 | | | 86 | %7 |
1. December 30, 2011 represents the last business day of the Fund’s 2011 fiscal year. See Note 1 of the accompanying Notes.
2. Per share amounts calculated based on the average shares outstanding during the period.
3. Assumes an initial investment on the business day before the first day of the fiscal period, with all dividends and distributions reinvested in additional shares on the reinvestment date, and redemption at the net asset value calculated on the last business day of the fiscal period. Sales charges are not reflected in the total returns. Total returns are not annualized for periods less than one full year. Returns do not reflect the deduction of taxes that a shareholder would pay on fund distributions or the redemption of fund shares.
4. Annualized for periods less than one full year.
5. Ratio including all expenses of the wholly-owned subsidiary and indirect expenses from affiliated fund were as follows:
| | | | |
| Year Ended December 31, 2012 | | | 2.79 | % |
| Year Ended December 30, 2011 | | | 2.59 | % |
| Year Ended December 31, 2010 | | | 2.72 | % |
| Year Ended December 31, 2009 | | | 2.87 | % |
| Year Ended December 31, 2008 | | | 2.39 | % |
6. Ratio including all expenses of the wholly-owned subsidiary and indirect expenses from affiliated fund were as follows:
| | | | |
| Year Ended December 31, 2012 | | | 2.37 | % |
| Year Ended December 30, 2011 | | | 2.22 | % |
| Year Ended December 31, 2010 | | | 2.23 | % |
| Year Ended December 31, 2009 | | | 2.27 | % |
| Year Ended December 31, 2008 | | | 2.11 | % |
7. The portfolio turnover rate excludes purchase and sale transactions of To Be Announced (TBA) mortgage-related securities as follows:
| | | | | | | | |
| | | Purchase Transactions | | | Sale Transactions | |
| Year Ended December 31, 2009 | | $ | 39,303,425 | | | $ | 39,062,313 | |
| Year Ended December 31, 2008 | | $ | 1,144,572,727 | | | $ | 1,165,957,394 | |
See accompanying Notes to Financial Statements.
| | |
| 22 | | OPPENHEIMER COMMODITY STRATEGY TOTAL RETURN FUND |
| | | | |
| Class I | | Period Ended
December 31,
20121 | |
| Per Share Operating Data | | | |
| Net asset value, beginning of period | | | $ 3.49 | |
| Income (loss) from investment operations: | | | | |
| Net investment loss2 | | | (.01 | ) |
| Net realized and unrealized loss | |
| (.17
| )
|
| Total from investment operations | | | (.18 | ) |
| Dividends and/or distributions to shareholders: | | | | |
| Dividends from net investment income | | | — | |
| Net asset value, end of period | |
| $3.31
|
|
| Total Return, at Net Asset Value3 | | | (5.16 | )% |
| | | | | |
| Ratios/Supplemental Data | | | |
| Net assets, end of period (in thousands) | | | $7,383 | |
| Average net assets (in thousands) | | | $ 275 | |
| Ratios to average net assets:4 | | | | |
| Net investment loss | | | (0.48 | )% |
| Total expenses5 | | | 0.97 | % |
Expenses after payments, waivers and/or reimbursements and reduction to
custodian expenses6 | | | 0.70 | % |
| Portfolio turnover rate | | | 44 | % |
1. For the period from April 27, 2012 (inception of offering) to December 31, 2012. See Note 1 of the accompanying Notes.
2. Per share amounts calculated based on the average shares outstanding during the period.
3. Assumes an initial investment on the business day before the first day of the fiscal period, with all dividends and distributions reinvested in additional shares on the reinvestment date, and redemption at the net asset value calculated on the last business day of the fiscal period. Sales charges are not reflected in the total returns. Total returns are not annualized for periods less than one full year. Returns do not reflect the deduction of taxes that a shareholder would pay on fund distributions or the redemption of fund shares.
4. Annualized for periods less than one full year.
5. Ratio including all expenses of the wholly-owned subsidiary and indirect expenses from affiliated fund were as follows:
| | | | |
| Period Ended December 31, 2012 | | | 1.25 | % |
6. Ratio including all expenses of the wholly-owned subsidiary and indirect expenses from affiliated fund were as follows:
| | | | |
| Period Ended December 31, 2012 | | | 0.98 | % |
See accompanying Notes to Financial Statements.
| | | | |
| OPPENHEIMER COMMODITY STRATEGY TOTAL RETURN FUND | | | 23 | |
FINANCIAL HIGHLIGHTS Continued
| | | | | | | | | | | | | | | | | | | | |
| | | Year Ended
December 31, | | | Year Ended
December 30, | | | Year Ended December 31, | |
| Class N | | 2012 | | | 20111 | | | 2010 | | | 2009 | | | 2008 | |
| | | | | | | | | | | | | | | | | | | | | |
| Per Share Operating Data | | | | | | | | | | | | | | | |
| Net asset value, beginning of period | | $ | 3.29 | | | $ | 3.61 | | | $ | 3.38 | | | $ | 3.08 | | | $ | 7.43 | |
| Income (loss) from investment operations: | | | | | | | | | | | | | | | | | | | | |
| Net investment income (loss)2 | | | (.04 | ) | | | (.05 | ) | | | (.04 | ) | | | (.03 | ) | | | .15 | |
| Net realized and unrealized gain (loss) | |
| (.03
| )
| |
| (.06
| )
| |
| .32
|
| |
| .33
|
| |
| (4.23
| )
|
| Total from investment operations | | | (.07 | ) | | | (.11 | ) | | | .28 | | | | .30 | | | | (4.08 | ) |
| Dividends and/or distributions to shareholders: | | | | | | | | | | | | | | | | | | | | |
| Dividends from net investment income | | | — | | | | (.21 | ) | | | (.05 | ) | | | — | | | | (.27 | ) |
| Net asset value, end of period | | $
| 3.22
|
| | $
| 3.29
|
| | $
| 3.61
|
| | $
| 3.38
|
| | $
| 3.08
|
|
| Total Return, at Net Asset Value3 | | | (2.13 | )% | | | (3.08 | )% | | | 8.21 | % | | | 9.74 | % | | | (54.74 | )% |
| | | | | | | | | | | | | | | | | | | | | |
| Ratios/Supplemental Data | | | | | | | | | | | | | | | |
| Net assets, end of period (in thousands) | | | $14,102 | | | | $17,044 | | | | $18,176 | | | | $16,412 | | | | $12,219 | |
| Average net assets (in thousands) | | | $15,775 | | | | $18,734 | | | | $16,050 | | | | $13,661 | | | | $25,985 | |
| Ratios to average net assets:4 | | | | | | | | | | | | | | | | | | | | |
| Net investment income (loss) | | | (1.33 | )% | | | (1.25 | )% | | | (1.23 | )% | | | (0.89 | )% | | | 1.94 | % |
| Total expenses5 | | | 2.14 | % | | | 1.91 | % | | | 2.06 | % | | | 2.25 | % | | | 1.72 | % |
| Expenses after payments, waivers and/or reimbursements and reduction to custodian expenses6 | | | 1.56 | % | | | 1.44 | % | | | 1.45 | % | | | 1.47 | % | | | 1.39 | % |
| Portfolio turnover rate | | | 44 | % | | | 21 | % | | | 38 | % | | | 51 | %7 | | | 86 | %7 |
1. December 30, 2011 represents the last business day of the Fund’s 2011 fiscal year. See Note 1 of the accompanying Notes.
2. Per share amounts calculated based on the average shares outstanding during the period.
3. Assumes an initial investment on the business day before the first day of the fiscal period, with all dividends and distributions reinvested in additional shares on the reinvestment date, and redemption at the net asset value calculated on the last business day of the fiscal period. Sales charges are not reflected in the total returns. Total returns are not annualized for periods less than one full year. Returns do not reflect the deduction of taxes that a shareholder would pay on fund distributions or the redemption of fund shares.
4. Annualized for periods less than one full year.
5. Ratio including all expenses of the wholly-owned subsidiary and indirect expenses from affiliated fund were as follows:
| | | | |
| Year Ended December 31, 2012 | | | 2.42 | % |
| Year Ended December 30, 2011 | | | 2.17 | % |
| Year Ended December 31, 2010 | | | 2.33 | % |
| Year Ended December 31, 2009 | | | 2.53 | % |
| Year Ended December 31, 2008 | | | 1.97 | % |
6. Ratio including all expenses of the wholly-owned subsidiary and indirect expenses from affiliated fund were as follows:
| | | | |
| Year Ended December 31, 2012 | | | 1.84 | % |
| Year Ended December 30, 2011 | | | 1.70 | % |
| Year Ended December 31, 2010 | | | 1.72 | % |
| Year Ended December 31, 2009 | | | 1.75 | % |
| Year Ended December 31, 2008 | | | 1.64 | % |
7. The portfolio turnover rate excludes purchase and sale transactions of To Be Announced (TBA) mortgage-related securities as follows:
| | | | | | | | |
| | | Purchase Transactions | | | Sale Transactions | |
| Year Ended December 31, 2009 | | $ | 39,303,425 | | | $ | 39,062,313 | |
| Year Ended December 31, 2008 | | $ | 1,144,572,727 | | | $ | 1,165,957,394 | |
See accompanying Notes to Financial Statements.
| | |
| 24 | | OPPENHEIMER COMMODITY STRATEGY TOTAL RETURN FUND |
| | | | | | | | | | | | | | | | | | | | |
| | | Year Ended
December 31, | | | Year Ended
December 30, | | | Year Ended December 31, | |
| Class Y | | 2012 | | | 20111 | | | 2010 | | | 2009 | | | 2008 | |
| | | | | | | | | | | | | | | | | | | | | |
| Per Share Operating Data | | | | | | | | | | | | | | | |
| Net asset value, beginning of period | | $ | 3.35 | | | $ | 3.67 | | | $ | 3.43 | | | $ | 3.11 | | | $ | 7.55 | |
| Income (loss) from investment operations: | | | | | | | | | | | | | | | | | |
| Net investment income (loss)2 | | | (.02 | ) | | | (.03 | ) | | | (.02 | ) | | | (.01 | ) | | | .20 | |
| Net realized and unrealized gain (loss) | |
| (.03
| )
| |
| (.07
| )
| |
| .33
|
| |
| .33
|
| |
| (4.32
| )
|
| Total from investment operations | | | (.05 | ) | | | (.10 | ) | | | .31 | | | | .32 | | | | (4.12 | ) |
| Dividends and/or distributions to shareholders: | | | | | | | | | | | | | | | | | |
| Dividends from net investment income | | | — | | | | (.22 | ) | | | (.07 | ) | | | — | | | | (.32 | ) |
| Net asset value, end of period | | $
| 3.30
|
| | $
| 3.35
|
| | $
| 3.67
|
| | $
| 3.43
|
| | $
| 3.11
|
|
| Total Return, at Net Asset Value3 | | | (1.49 | )% | | | (2.57 | )% | | | 8.99 | % | | | 10.29 | % | | | (54.24 | )% |
| | | | | | | | | | | | | | | | | | | | | |
| Ratios/Supplemental Data | | | | | | | | | | | | | | | |
| Net assets, end of period (in thousands) | | | $293,787 | | | $ | 740,166 | | | | $1,198,790 | | | | $838,122 | | | | $364,837 | |
| Average net assets (in thousands) | | | $470,565 | | | | $1,173,253 | | | | $ 974,924 | | | | $549,032 | | | | $500,443 | |
| Ratios to average net assets:4 | | | | | | | | | | | | | | | | | | | | |
| Net investment income (loss) | | | (0.66 | )% | | | (0.66 | )% | | | (0.60 | )% | | | (0.21 | )% | | | 2.75 | % |
| Total expenses5 | | | 1.16 | % | | | 1.11 | % | | | 1.08 | % | | | 1.01 | % | | | 0.87 | % |
| Expenses after payments, waivers and/or reimbursements and reduction to custodian expenses6 | | | 0.89 | % | | | 0.85 | % | | | 0.81 | % | | | 0.73 | % | | | 0.62 | % |
| Portfolio turnover rate | | | 44 | % | | | 21 | % | | | 38 | % | | | 51 | %7 | | | 86 | %7 |
1. December 30, 2011 represents the last business day of the Fund’s 2011 fiscal year. See Note 1 of the accompanying Notes.
2. Per share amounts calculated based on the average shares outstanding during the period.
3. Assumes an initial investment on the business day before the first day of the fiscal period, with all dividends and distributions reinvested in additional shares on the reinvestment date, and redemption at the net asset value calculated on the last business day of the fiscal period. Sales charges are not reflected in the total returns. Total returns are not annualized for periods less than one full year. Returns do not reflect the deduction of taxes that a shareholder would pay on fund distributions or the redemption of fund shares.
4. Annualized for periods less than one full year.
5. Ratio including all expenses of the wholly-owned subsidiary and indirect expenses from affiliated fund were as follows:
| | | | |
| Year Ended December 31, 2012 | | | 1.44 | % |
| Year Ended December 30, 2011 | | | 1.37 | % |
| Year Ended December 31, 2010 | | | 1.35 | % |
| Year Ended December 31, 2009 | | | 1.29 | % |
| Year Ended December 31, 2008 | | | 1.13 | % |
6. Ratio including all expenses of the wholly-owned subsidiary and indirect expenses from affiliated fund were as follows:
| | | | |
| Year Ended December 31, 2012 | | | 1.17 | % |
| Year Ended December 30, 2011 | | | 1.11 | % |
| Year Ended December 31, 2010 | | | 1.08 | % |
| Year Ended December 31, 2009 | | | 1.01 | % |
| Year Ended December 31, 2008 | | | 0.88 | % |
7. The portfolio turnover rate excludes purchase and sale transactions of To Be Announced (TBA) mortgage-related securities as follows:
| | | | | | | | |
| | | Purchase Transactions | | | Sale Transactions | |
| Year Ended December 31, 2009 | | $ | 39,303,425 | | | $ | 39,062,313 | |
| Year Ended December 31, 2008 | | $ | 1,144,572,727 | | | $ | 1,165,957,394 | |
See accompanying Notes to Financial Statements.
| | | | |
| OPPENHEIMER COMMODITY STRATEGY TOTAL RETURN FUND | | | 25 | |
NOTES TO FINANCIAL STATEMENTS
1. Significant Accounting Policies
Oppenheimer Commodity Strategy Total Return Fund (the “Fund”) is registered under the Investment Company Act of 1940, as amended, as an open-end management investment company. The Fund’s investment objective is to seek total return. The Fund’s investment adviser is OppenheimerFunds, Inc. (the “Manager”). The Sub-Adviser is Oppenheimer Real Asset Management, Inc. (the “Sub-Adviser”), a wholly-owned subsidiary of the Manager.
The Fund offers Class A, Class C, Class I, Class N and Class Y shares, and previously offered Class B shares for new purchase through June 29, 2012. Subsequent to that date, no new purchases of Class B shares will be permitted, however reinvestment of dividend and/or capital gain distributions and exchanges of Class B shares into and from other Oppenheimer funds will be allowed. Class A shares are sold at their offering price, which is normally net asset value plus a front-end sales charge. Class C and Class N shares are sold, and Class B shares were sold, without a front-end sales charge but may be subject to a contingent deferred sales charge (“CDSC”). Class N shares are sold only through retirement plans. Retirement plans that offer Class N shares may impose charges on those accounts. Class I and Class Y shares are sold to certain institutional investors or intermediaries without either a front-end sales charge or a CDSC, however, the intermediaries may impose charges on their accountholders who beneficially own Class I and Class Y shares. All classes of shares have identical rights and voting privileges with respect to the Fund in general and exclusive voting rights on matters that affect that class alone. Earnings, net assets and net asset value per share may differ due to each class having its own expenses, such as transfer and shareholder servicing agent fees and shareholder communications, directly attributable to that class. Class A, B, C and N shares have separate distribution and/or service plans under which they pay fees. Class I and Class Y shares do not pay such fees. Class B shares will automatically convert to Class A shares 72 months after the date of purchase. Class I shares were first publicly offered on April 27, 2012.
The following is a summary of significant accounting policies consistently followed by the Fund.
Previous Annual Period. The last day of the Fund’s fiscal year was the last day the New York Stock Exchange was open for trading. The Fund’s financial statements have been presented through that date to maintain consistency with the Fund’s net asset value calculations used for shareholder transactions.
Hybrid Instruments. The Fund invests in hybrid instruments whose market values, interest rates and/or redemption prices are linked to the performance of underlying foreign currencies, interest rate spreads, stock market indices, prices of individual securities, commodities or other financial instruments or the occurrence of other specific events. The hybrid instruments are often leveraged, increasing the volatility of each note’s market value relative to the change in the underlying linked financial element or event. Fluctuations in value of these securities are recorded as unrealized gains and losses in the accompanying Statement of Operations. The Fund records a realized gain or loss when a hybrid instrument is sold or matures.
| | |
| 26 | | OPPENHEIMER COMMODITY STRATEGY TOTAL RETURN FUND |
Credit Risk. The Fund invests in high-yield, non-investment-grade bonds, which may be subject to a greater degree of credit risk. Credit risk relates to the ability of the issuer to meet interest or principal payments or both as they become due. The Fund may acquire securities that have missed an interest payment, and is not obligated to dispose of securities whose issuers or underlying obligors subsequently miss an interest payment. Information concerning securities not accruing interest as of December 31, 2012 is as follows:
| | | | |
| Cost | | $ | 398,721 | |
| Market Value | | $ | 32,457 | |
| Market Value as a % of Net Assets | | | 0.01 | % |
Investment in RAF Fund Ltd. The Fund may invest up to 25% of its total assets in RAF Fund Ltd., a wholly-owned and controlled Cayman Islands subsidiary (the “Subsidiary”), which is expected to invest primarily in commodity and financial futures and option contracts, as well as fixed income securities and other investments intended to serve as margin or collateral for the Subsidiary’s derivatives positions. The Fund wholly owns and controls the Subsidiary, and the Fund and Subsidiary are both managed by the Manager and the Sub-Adviser.
The Fund does not consolidate the assets, liabilities, capital or operations of the Subsidiary into its financial statements. Rather, the Subsidiary is separately presented as an investment in the Fund’s Statement of Investments. Shares of the Subsidiary are valued at their net asset value per share. Gains or losses on withdrawals of capital from the Subsidiary by the Fund are recognized on an average cost basis. Unrealized appreciation or depreciation on the Fund’s investment in the Subsidiary is recorded in the Fund’s Statement of Assets and Liabilities and the Fund’s Statement of Operations. Distributions received from the Subsidiary are recorded as income on the ex-dividend date.
For tax purposes, the Subsidiary is an exempted Cayman investment company. The Subsidiary has received an undertaking from the Government of the Cayman Islands exempting it from all local income, profits and capital gains taxes through June of 2026. No such taxes are levied in the Cayman Islands at the present time. For U.S. income tax purposes, the Subsidiary is a Controlled Foreign Corporation and as such is not subject to U.S. income tax. However, as a wholly-owned Controlled Foreign Corporation, the Subsidiary’s net income and capital gain, to the extent of its earnings and profits, will be included each year in the Fund’s investment company taxable income. For the year ended December 31, 2012, the Subsidiary has a deficit of $11,901,822 in its taxable earnings and profits. In addition, any in-kind capital contributions made by the Fund to the Subsidiary will result in the Fund recognizing taxable gain to the extent of unrealized gain, if any, on securities transferred to the Subsidiary while any unrealized losses on securities so transferred will not be recognized at the time of transfer.
Investment in Oppenheimer Institutional Money Market Fund. The Fund is permitted to invest daily available cash balances in an affiliated money market fund. The Fund may invest the available cash in Class E shares of Oppenheimer Institutional Money Market Fund (“IMMF”) to seek current income while preserving liquidity. IMMF is a registered open-end management investment company, regulated as a money market fund under the Investment
| | | | |
| OPPENHEIMER COMMODITY STRATEGY TOTAL RETURN FUND | | | 27 | |
NOTES TO FINANCIAL STATEMENTS Continued
1. Significant Accounting Policies Continued
Company Act of 1940, as amended. The Manager is also the investment adviser of IMMF. When applicable, the Fund’s investment in IMMF is included in the Statement of Investments. Shares of IMMF are valued at their net asset value per share. As a shareholder, the Fund is subject to its proportional share of IMMF’s Class E expenses, including its management fee. The Manager will waive fees and/or reimburse Fund expenses in an amount equal to the indirect management fees incurred through the Fund’s investment in IMMF.
Allocation of Income, Expenses, Gains and Losses. Income, expenses (other than those attributable to a specific class), gains and losses are allocated on a daily basis to each class of shares based upon the relative proportion of net assets represented by such class. Operating expenses directly attributable to a specific class are charged against the operations of that class.
Federal Taxes. The Fund intends to comply with provisions of the Internal Revenue Code applicable to regulated investment companies and to distribute substantially all of its investment company taxable income, including any net realized gain on investments not offset by capital loss carryforwards, if any, to shareholders. Therefore, no federal income or excise tax provision is required. The Fund files income tax returns in U.S. federal and applicable state jurisdictions. The statute of limitations on the Fund’s tax return filings generally remain open for the three preceding fiscal reporting period ends.
The tax components of capital shown in the following table represent distribution requirements the Fund must satisfy under the income tax regulations, losses the Fund may be able to offset against income and gains realized in future years and unrealized appreciation or depreciation of securities and other investments for federal income tax purposes.
| | | | | | | | | | | | |
Undistributed
Net Investment
Income | | Undistributed
Long-Term
Gain | | | Accumulated
Loss
Carryforward1,2,3 | | | Net Unrealized
Depreciation
Based on Cost of
Securities and Other
Investments for Federal
Income Tax Purposes | |
| $— | | $ | — | | | $ | 573,084,667 | | | $ | 360,321,355 | |
1. As of December 31, 2012, the Fund had $573,084,667 of net capital loss carryforwards available to offset future realized capital gains, if any, and thereby reduce future taxable gain distributions. Details of the capital loss carryforwards are included in the table below. Capital loss carryovers with no expiration, if any, must be utilized prior to those with expiration dates.
| | | | |
| Expiring | | | |
| 2015 | | $ | 183,272,671 | |
| 2017 | | | 374,871,458 | |
| No expiration | | | 14,940,538 | |
| | |
|
|
|
| Total | | $ | 573,084,667 | |
| | |
|
|
|
2. During the fiscal year ended December 31, 2012, the Fund did not utilize any capital loss carryforward.
3. During the fiscal year ended December 30, 2011, the Fund utilized $54,791,178 of capital loss carryforward to offset capital gains realized in that fiscal year.
Net investment income (loss) and net realized gain (loss) may differ for financial statement and tax purposes. The character of dividends and distributions made during the fiscal year
| | |
| 28 | | OPPENHEIMER COMMODITY STRATEGY TOTAL RETURN FUND |
from net investment income or net realized gains may differ from their ultimate characterization for federal income tax purposes. Also, due to timing of dividends and distributions, the fiscal year in which amounts are distributed may differ from the fiscal year in which the income or net realized gain was recorded by the Fund.
Accordingly, the following amounts have been reclassified for December 31, 2012. Net assets of the Fund were unaffected by the reclassifications.
| | | | |
Reduction to
Paid-in Capital | | Reduction
to Accumulated
Net Investment
Loss | |
| $7,909,001 | | $ | 7,909,001 | |
The tax character of distributions paid during the years ended December 31, 2012 and December 31, 2011 was as follows:
| | | | | | | | |
| | | Year Ended
December 31, 2012 | | | Year Ended
December 31, 2011 | |
| Distributions paid from: | | | | | | | | |
| Ordinary income | | $ | — | | | $ | 72,341,583 | |
The aggregate cost of securities and other investments and the composition of unrealized appreciation and depreciation of securities and other investments for federal income tax purposes as of December 31, 2012 are noted in the following table. The primary difference between book and tax appreciation or depreciation of securities and other investments, if applicable, is attributable to the tax deferral of losses or tax realization of financial statement unrealized gain or loss.
| | | | |
| Federal tax cost of securities | | $ | 983,639,203 | |
| | |
|
|
|
| Gross unrealized appreciation | | $ | 18,359,456 | |
| Gross unrealized depreciation | | | (378,680,811 | ) |
| | |
|
|
|
| Net unrealized depreciation | | $ | (360,321,355 | ) |
| | |
|
|
|
Trustees’ Compensation. The Board of Trustees has adopted a compensation deferral plan for independent trustees that enables trustees to elect to defer receipt of all or a portion of the annual compensation they are entitled to receive from the Fund. For purposes of determining the amount owed to the Trustee under the plan, deferred amounts are treated as though equal dollar amounts had been invested in shares of the Fund or in other Oppenheimer funds selected by the Trustee. The Fund purchases shares of the funds selected for deferral by the Trustee in amounts equal to his or her deemed investment, resulting in a Fund asset equal to the deferred compensation liability. Such assets are included as a component of “Other” within the asset section of the Statement of Assets and Liabilities. Deferral of trustees’ fees under the plan will not affect the net assets of the Fund, and will not materially affect the Fund’s assets, liabilities or net investment income per share. Amounts will be deferred until distributed in accordance with the compensation deferral plan.
| | | | |
| OPPENHEIMER COMMODITY STRATEGY TOTAL RETURN FUND | | | 29 | |
NOTES TO FINANCIAL STATEMENTS Continued
1. Significant Accounting Policies Continued
Dividends and Distributions to Shareholders. Dividends and distributions to shareholders, which are determined in accordance with income tax regulations and may differ from U.S. generally accepted accounting principles, are recorded on the ex-dividend date. Income and capital gain distributions, if any, are declared and paid annually or at other times as deemed necessary by the Manager.
Investment Income. Dividend income is recorded on the ex-dividend date or upon ex-dividend notification in the case of certain foreign dividends where the ex-dividend date may have passed. Non-cash dividends included in dividend income, if any, are recorded at the fair market value of the securities received. Interest income is recognized on an accrual basis. Discount and premium, which are included in interest income on the Statement of Operations, are amortized or accreted daily.
Custodian Fees. “Custodian fees and expenses” in the Statement of Operations may include interest expense incurred by the Fund on any cash overdrafts of its custodian account during the period. Such cash overdrafts may result from the effects of failed trades in portfolio securities and from cash outflows resulting from unanticipated shareholder redemption activity. The Fund pays interest to its custodian on such cash overdrafts, to the extent they are not offset by positive cash balances maintained by the Fund, at a rate equal to the Federal Funds Rate plus 0.50%. The “Reduction to custodian expenses” line item, if applicable, represents earnings on cash balances maintained by the Fund during the period. Such interest expense and other custodian fees may be paid with these earnings.
Security Transactions. Security transactions are recorded on the trade date. Realized gains and losses on securities sold (except for the investments in the Subsidiary) are determined on the basis of identified cost.
Indemnifications. The Fund’s organizational documents provide current and former trustees and officers with a limited indemnification against liabilities arising in connection with the performance of their duties to the Fund. In the normal course of business, the Fund may also enter into contracts that provide general indemnifications. The Fund’s maximum exposure under these arrangements is unknown as this would be dependent on future claims that may be made against the Fund. The risk of material loss from such claims is considered remote.
Other. The preparation of financial statements in conformity with accounting principles generally accepted in the United States of America requires management to make estimates and assumptions that affect the reported amounts of assets and liabilities and disclosure of contingent assets and liabilities at the date of the financial statements and the reported amounts of increases and decreases in net assets from operations during the reporting period. Actual results could differ from those estimates.
| | |
| 30 | | OPPENHEIMER COMMODITY STRATEGY TOTAL RETURN FUND |
2. Securities Valuation
The Fund calculates the net asset value of its shares as of the close of the New York Stock Exchange (the “Exchange”), normally 4:00 P.M. Eastern time, on each day the Exchange is open for trading.
The Fund’s Board has adopted procedures for the valuation of the Fund’s securities and has delegated the day-to-day responsibility for valuation determinations under those procedures to the Manager. The Manager has established a Valuation Committee which is responsible for determining a “fair valuation” for any security for which market quotations are not “readily available.” The Valuation Committee’s fair valuation determinations are subject to review, approval and ratification by the Fund’s Board at its next regularly scheduled meeting covering the calendar quarter in which the fair valuation was determined.
Valuation Methods and Inputs
Securities are valued using unadjusted quoted market prices, when available, as supplied primarily by third party pricing services or dealers.
The following methodologies are used to determine the market value or the fair value of the types of securities described below:
Securities traded on a registered U.S. securities exchange (including exchange-traded derivatives other than futures and futures options) are valued based on the last sale price of the security reported on the principal exchange on which it is traded, prior to the time when the Fund’s assets are valued. In the absence of a sale, the security is valued at the last sale price on the prior trading day, if it is within the spread of the current day’s closing “bid” and “asked” prices, and if not, at the current day’s closing bid price. A security of a foreign issuer traded on a foreign exchange but not listed on a registered U.S. securities exchange is valued based on the last sale price on the principal exchange on which the security is traded, as identified by the third party pricing service used by the Manager, prior to the time when the Fund’s assets are valued. If the last sale price is unavailable, the security is valued at the most recent official closing price on the principal exchange on which it is traded. If the last sales price or official closing price for a foreign security is not available, the security is valued at the mean between the bid and asked price per the exchange or, if not available from the exchange, obtained from two dealers. If bid and asked prices are not available from either the exchange or two dealers, the security is valued by using one of the following methodologies (listed in order of priority); (1) using a bid from the exchange, (2) the mean between the bid and asked price as provided by a single dealer, or (3) a bid from a single dealer.
Shares of a registered investment company that are not traded on an exchange are valued at that investment company’s net asset value per share.
Corporate and government debt securities (of U.S. or foreign issuers) and municipal debt securities, event-linked bonds, loans, mortgage-backed securities, collateralized mortgage obligations, and asset-backed securities are valued at the mean between the “bid” and “asked” prices utilizing evaluated prices obtained from third party pricing services or broker-dealers who may use matrix pricing methods to determine the evaluated prices.
| | | | |
| OPPENHEIMER COMMODITY STRATEGY TOTAL RETURN FUND | | | 31 | |
NOTES TO FINANCIAL STATEMENTS Continued
2. Securities Valuation Continued
Short-term money market type debt securities with a remaining maturity of sixty days or less are valued at cost adjusted by the amortization of discount or premium to maturity (amortized cost), which approximates market value. Short-term debt securities with a remaining maturity in excess of sixty days are valued at the mean between the “bid” and “asked” prices utilizing evaluated prices obtained from third party pricing services or broker-dealers.
Hybrid instruments, swaps, swaptions, and other over-the-counter derivatives are valued utilizing evaluated prices obtained from third party pricing services or broker-dealers.
A description of the standard inputs that may generally be considered by the third party pricing vendors in determining their evaluated prices is provided below.
| | |
| Security Type | | Standard inputs generally considered by third-party pricing vendors |
| Corporate debt, government debt, municipal, mortgage-backed and asset-backed securities | | Reported trade data, broker-dealer price quotations, benchmark yields, issuer spreads on comparable securities, the credit quality, yield, maturity, and other appropriate factors. |
| Loans | | Information obtained from market participants regarding reported trade data and broker-dealer price quotations. |
| Hybrid instruments | | Relevant market information such as the price of underlying financial instruments, stock market indices, foreign currencies, interest rate spreads, commodities, or the occurrence of other specific events. |
| Event-linked bonds | | Information obtained from market participants regarding reported trade data and broker-dealer price quotations. |
If a market value or price cannot be determined for a security using the methodologies described above, or if, in the “good faith” opinion of the Manager, the market value or price obtained does not constitute a “readily available market quotation,” or a significant event has occurred that would materially affect the value of the security the security is fair valued either (i) by a standardized fair valuation methodology applicable to the security type or the significant event as previously approved by the Valuation Committee and the Fund’s Board or (ii) as determined in good faith by the Manager’s Valuation Committee. The Valuation Committee considers all relevant facts that are reasonably available, through either public information or information available to the Manager, when determining the fair value of a security. Fair value determinations by the Manager are subject to review, approval and ratification by the Fund’s Board at its next regularly scheduled meeting covering the calendar quarter in which the fair valuation was determined. Those fair valuation standardized methodologies include, but are not limited to, valuing securities at the last sale price or initially at cost and subsequently adjusting the value based on: changes in company specific fundamentals, changes in an appropriate securities index, or changes in the value of similar securities which may be further adjusted for any discounts related to security-specific resale restrictions. When possible, such methodologies use observable market inputs such as unadjusted quoted prices of similar securities, observable interest rates, currency rates and yield curves. The methodologies used for valuing securities are not necessarily an indication of the risks associated with investing in those securities nor can it be assured that the Fund can obtain the fair value assigned to a security if it were to sell the security.
| | |
| 32 | | OPPENHEIMER COMMODITY STRATEGY TOTAL RETURN FUND |
To assess the continuing appropriateness of security valuations, the Manager, or its third party service provider who is subject to oversight by the Manager, regularly compares prior day prices, prices on comparable securities, and sale prices to the current day prices and challenges those prices exceeding certain tolerance levels with the third party pricing service or broker source. For those securities valued by fair valuations, whether through a standardized fair valuation methodology or a fair valuation determination, the Valuation Committee reviews and affirms the reasonableness of the valuations based on such methodologies and fair valuation determinations on a regular basis after considering all relevant information that is reasonably available.
Classifications
Each investment asset or liability of the Fund is assigned a level at measurement date based on the significance and source of the inputs to its valuation. Various data inputs are used in determining the value of each of the Fund’s investments as of the reporting period end. These data inputs are categorized in the following hierarchy under applicable financial accounting standards:
| 1) | | Level 1—unadjusted quoted prices in active markets for identical assets or liabilities (including securities actively traded on a securities exchange) |
| 2) | | Level 2—inputs other than unadjusted quoted prices that are observable for the asset or liability (such as unadjusted quoted prices for similar assets and market corroborated inputs such as interest rates, prepayment speeds, credit risks, etc.) |
| 3) | | Level 3—significant unobservable inputs (including the Manager’s own judgments about assumptions that market participants would use in pricing the asset or liability). |
The inputs used for valuing securities are not necessarily an indication of the risks associated with investing in those securities.
The table below categorizes amounts that are included in the Fund’s Statement of Assets and Liabilities as of December 31, 2012 based on valuation input level:
| | | | | | | | | | | | | | | | | | | | |
| | | Level 1—
Unadjusted
Quoted Prices | | Level 2—
Other Significant
Observable Inputs | | Level 3—
Significant
Unobservable
Inputs | | Value |
| Assets Table | | | | | | | | | | | | | | | | | | | | |
| Investments, at Value: | | | | | | | | | | | | | | | | | | | | |
| Wholly-Owned Subsidiary | | | $ | — | | | | $ | 147,439,106 | | | | $ | — | | | | $ | 147,439,106 | |
| Mortgage-Backed Obligations | | | | — | | | | | — | | | | | 32,457 | | | | | 32,457 | |
| U.S. Government Obligations | | | | — | | | | | 92,993,156 | | | | | — | | | | | 92,993,156 | |
| Hybrid Instruments | | | | — | | | | | 114,493,519 | | | | | — | | | | | 114,493,519 | |
| Short-Term Notes | | | | — | | | | | 30,993,619 | | | | | — | | | | | 30,993,619 | |
| Investment Company | | | | 237,365,983 | | | | | — | | | | | — | | | | | 237,365,983 | |
| | | |
|
|
|
| Total Assets | | | $ | 237,365,983 | | | | $ | 385,919,400 | | | | $ | 32,457 | | | | $ | 623,317,840 | |
| | | |
|
|
| | |
|
|
| | |
|
|
| | |
|
|
|
Currency contracts and forwards, if any, are reported at their unrealized appreciation/depreciation at measurement date, which represents the change in the contract’s value from trade date. Futures, if any, are reported at their variation margin at measurement date, which represents the amount due to/from the Fund at that date. All additional assets
| | | | |
| OPPENHEIMER COMMODITY STRATEGY TOTAL RETURN FUND | | | 33 | |
NOTES TO FINANCIAL STATEMENTS Continued
2. Securities Valuation Continued
and liabilities included in the above table are reported at their market value at measurement date.
The table below shows the transfers between Level 2 and Level 3. The Fund’s policy is to recognize transfers in and transfers out as of the beginning of the reporting period.
| | | | | | | | |
| | | Transfers out of
Level 2* | | | Transfers into
Level 3* | |
| Assets Table | | | | | | | | |
| Investments, at Value: | | | | | | | | |
| Mortgage-Backed Obligations | | $ | (36,514 | ) | | $ | 36,514 | |
* Transferred from Level 2 to Level 3 because of the lack of observable market data.
There have been no significant changes to the fair valuation methodologies of the Fund during the period.
The net asset value per share of the Subsidiary is determined as of the close of the Exchange, on each day the Exchange is open for trading. The net asset value per share is determined by dividing the value of the Subsidiary’s net assets by the number of shares that are outstanding. The Subsidiary values its investments in the same manner as the Fund as described above.
3. Shares of Beneficial Interest
The Fund has authorized an unlimited number of $0.001 par value shares of beneficial interest of each class. Transactions in shares of beneficial interest were as follows:
| | | | | | | | | | | | | | | | |
| | | Year Ended December 31, 20121 | | | Year Ended December 30, 2011 | |
| | | Shares | | | Amount | | | Shares | | | Amount | |
| Class A | | | | | | | | | | | | | | | | |
| Sold | | | 24,188,276 | | | $ | 82,375,226 | | | | 51,342,503 | | | $ | 194,661,347 | |
Dividends and/or
distributions reinvested | | | — | | | | — | | | | 5,529,976 | | | | 18,360,092 | |
| Redeemed | | | (52,454,085 | ) | | | (175,658,552 | ) | | | (79,095,267 | ) | | | (293,406,476 | ) |
| | |
|
|
|
| Net decrease | | | (28,265,809 | ) | | $ | (93,283,326 | ) | | | (22,222,788 | ) | | $ | (80,385,037 | ) |
| | |
|
|
|
| | | | | | | | | | | | | | | | | |
| Class B | | | | | | | | | | | | | | | | |
| Sold | | | 774,247 | | | $ | 2,608,259 | | | | 2,128,455 | | | $ | 8,119,178 | |
Dividends and/or
distributions reinvested | | | — | | | | — | | | | 261,338 | | | | 862,473 | |
| Redeemed | | | (2,072,895 | ) | | | (6,943,101 | ) | | | (3,444,448 | ) | | | (12,857,882 | ) |
| | |
|
|
|
| Net decrease | | | (1,298,648 | ) | | $ | (4,334,842 | ) | | | (1,054,655 | ) | | $ | (3,876,231 | ) |
| | |
|
|
|
| | | | | | | | | | | | | | | | | |
| Class C | | | | | | | | | | | | | | | | |
| Sold | | | 2,977,405 | | | $ | 9,742,262 | | | | 8,127,012 | | | $ | 30,333,065 | |
Dividends and/or
distributions reinvested | | | — | | | | — | | | | 1,204,709 | | | | 3,915,317 | |
| Redeemed | | | (8,158,426 | ) | | | (26,386,706 | ) | | | (8,143,463 | ) | | | (29,575,178 | ) |
| | |
|
|
|
| Net increase (decrease) | | | (5,181,021 | ) | | $ | (16,644,444 | ) | | | 1,188,258 | | | $ | 4,673,204 | |
| | |
|
|
|
| | |
| 34 | | OPPENHEIMER COMMODITY STRATEGY TOTAL RETURN FUND |
| | | | | | | | | | | | | | | | |
| | | Year Ended December 31, 20121 | | | Year Ended December 30, 2011 | |
| | | Shares | | | Amount | | | Shares | | | Amount | |
| Class I | | | | | | | | | | | | | | | | |
| Sold | | | 2,238,971 | | | $ | 7,366,643 | | | | — | | | $ | — | |
Dividends and/or
distributions reinvested | | | — | | | | — | | | | — | | | | — | |
| Redeemed | | | (5,457 | ) | | | (18,009 | ) | | | — | | | | — | |
| | |
|
|
|
| Net increase | | | 2,233,514 | | | $ | 7,348,634 | | | | — | | | $ | — | |
| | |
|
|
|
| | | | | | | | | | | | | | | | | |
| Class N | | | | | | | | | | | | | | | | |
| Sold | | | 1,249,646 | | | $ | 4,105,589 | | | | 2,181,312 | | | $ | 8,117,336 | |
Dividends and/or
distributions reinvested | | | — | | | | — | | | | 279,573 | | | | 914,205 | |
| Redeemed | | | (2,052,986 | ) | | | (6,723,763 | ) | | | (2,312,906 | ) | | | (8,478,632 | ) |
| | |
|
|
|
| Net increase (decrease) | | | (803,340 | ) | | $ | (2,618,174 | ) | | | 147,979 | | | $ | 552,909 | |
| | |
|
|
|
| | | | | | | | | | | | | | | | | |
| Class Y | | | | | | | | | | | | | | | | |
| Sold | | | 33,845,603 | | | $ | 113,280,546 | | | | 116,710,934 | | | $ | 445,205,610 | |
Dividends and/or
distributions reinvested | | | — | | | | — | | | | 12,845,626 | | | | 42,776,058 | |
| Redeemed | | | (165,951,037 | ) | | | (543,499,087 | ) | | | (235,394,424 | ) | | | (872,642,366 | ) |
| | |
|
|
|
| Net decrease | | | (132,105,434 | ) | | $ | (430,218,541 | ) | | | (105,837,864 | ) | | $ | (384,660,698 | ) |
| | |
|
|
|
1. For the year ended December 31, 2012 for Class A, Class B, Class C, Class N and Class Y shares, and for the period from April 27, 2012 (inception of offering) to December 31, 2012, for Class I shares.
4. Purchases and Sales of Securities
The aggregate cost of purchases and proceeds from sales of securities, other than short-term obligations and investments in the Subsidiary and IMMF, for the year ended December 31, 2012, were as follows:
| | | | | | | | |
| | | Purchases | | | Sales | |
| Investment securities | | $ | 85,000,000 | | | $ | 187,045,986 | |
| U.S. government and government agency obligations | | | 70,004,047 | | | | 137,542,227 | |
5. Fees and Other Transactions with Affiliates
Management Fees. Under the investment advisory agreement, the Fund pays the Manager a management fee based on the daily net assets of the Fund at an annual rate as shown in the following table:
| | | | |
| Fee Schedule | | | |
| Up to $200 million | | | 1.00 | % |
| Next $200 million | | | 0.90 | |
| Next $200 million | | | 0.85 | |
| Next $200 million | | | 0.80 | |
| Over $800 million | | | 0.75 | |
Sub-Adviser Fees. The Manager retains the Sub-Adviser to provide the day-to-day portfolio management of the Fund. Under the Sub-Advisory Agreement, the Manager
| | | | |
| OPPENHEIMER COMMODITY STRATEGY TOTAL RETURN FUND | | | 35 | |
NOTES TO FINANCIAL STATEMENTS Continued
5. Fees and Other Transactions with Affiliates Continued
pays the Sub-Adviser a fee in monthly installments, based on the daily net assets of the Fund at an annual rate as shown in the following table:
| | | | |
| Fee Schedule | | | |
| Up to $200 million | | | 0.500 | % |
| Next $200 million | | | 0.450 | |
| Next $200 million | | | 0.425 | |
| Next $200 million | | | 0.400 | |
| Over $800 million | | | 0.375 | |
Administration Service Fees. The Fund pays the Manager a fee of $1,500 per year for preparing and filing the Fund’s tax returns.
Transfer Agent Fees. OppenheimerFunds Services (“OFS”), a division of the Manager, acts as the transfer and shareholder servicing agent for the Fund. The Fund pays OFS a per account fee. For the year ended December 31, 2012, the Fund paid $2,455,313 to OFS for services to the Fund.
Additionally, Class Y shares are subject to minimum fees of $10,000 annually for assets of $10 million or more. The Class Y shares are subject to the minimum fees in the event that the per account fee does not equal or exceed the applicable minimum fees. OFS may voluntarily waive the minimum fees.
Distribution and Service Plan (12b-1) Fees. Under its General Distributor’s Agreement with the Fund, OppenheimerFunds Distributor, Inc. (the “Distributor”) acts as the Fund’s principal underwriter in the continuous public offering of the Fund’s classes of shares.
Service Plan for Class A Shares. The Fund has adopted a Service Plan (the “Plan”) for Class A shares under Rule 12b-1 of the Investment Company Act of 1940. Under the Plan, the Fund reimburses the Distributor for a portion of its costs incurred for services provided to accounts that hold Class A shares. Reimbursement is made periodically at an annual rate of up to 0.25% of the daily net assets of Class A shares of the Fund. The Distributor currently uses all of those fees to pay dealers, brokers, banks and other financial institutions periodically for providing personal service and maintenance of accounts of their customers that hold Class A shares. Any unreimbursed expenses the Distributor incurs with respect to Class A shares in any fiscal year cannot be recovered in subsequent periods. Fees incurred by the Fund under the Plan are detailed in the Statement of Operations.
Distribution and Service Plans for Class B, Class C and Class N Shares. The Fund has adopted Distribution and Service Plans (the “Plans”) for Class B, Class C and Class N shares under Rule 12b-1 of the Investment Company Act of 1940 to compensate the Distributor for its services in connection with the distribution of those shares and servicing accounts. Under the Plans, the Fund pays the Distributor an annual asset-based sales charge of 0.75% on Class B and Class C shares daily net assets and 0.25% on Class N shares daily net assets. The Distributor also receives a service fee of 0.25% per year under each plan. If either the Class B, Class C or Class N plan is terminated by the Fund or by the shareholders of a class, the Board of Trustees and its independent trustees must determine whether the
| | |
| 36 | | OPPENHEIMER COMMODITY STRATEGY TOTAL RETURN FUND |
Distributor shall be entitled to payment from the Fund of all or a portion of the service fee and/or asset-based sales charge in respect to shares sold prior to the effective date of such termination. Fees incurred by the Fund under the Plans are detailed in the Statement of Operations. The Distributor determines its uncompensated expenses under the Plans at calendar quarter ends. The Distributor’s aggregate uncompensated expenses under the Plans at December 31, 2012 were as follows:
| | | | |
| Class B | | $ | 3,331,452 | |
| Class C | | | 5,541,770 | |
| Class N | | | 671,561 | |
Sales Charges. Front-end sales charges and contingent deferred sales charges (“CDSC”) do not represent expenses of the Fund. They are deducted from the proceeds of sales of Fund shares prior to investment or from redemption proceeds prior to remittance, as applicable. The sales charges retained by the Distributor from the sale of shares and the CDSC retained by the Distributor on the redemption of shares is shown in the following table for the period indicated.
| | | | | | | | | | | | | | | | | | | | |
| Year Ended | | Class A
Front-End
Sales Charges
Retained by
Distributor | | | Class A
Contingent
Deferred
Sales Charges
Retained by
Distributor | | | Class B
Contingent
Deferred
Sales Charges
Retained by
Distributor | | | Class C
Contingent
Deferred
Sales Charges
Retained by
Distributor | | | Class N
Contingent
Deferred
Sales Charges
Retained by
Distributor | |
| December 31, 2012 | | $ | 102,919 | | | $ | 3,176 | | | $ | 43,691 | | | $ | 6,194 | | | $ | 563 | |
Waivers and Reimbursements of Expenses. The Manager has contractually agreed to waive the management fee it receives from the Fund in an amount equal to the management fee it receives from the Subsidiary. This undertaking will continue in effect for so long as the Fund invests in the Subsidiary and may not be terminated unless approved by the Fund’s Board of Trustees. During the year ended December 31, 2012, the Manager waived $1,979,521.
The Manager will waive fees and/or reimburse Fund expenses in an amount equal to the indirect management fees incurred through the Fund’s investment in IMMF. During the year ended December 31, 2012, the Manager waived fees and/or reimbursed the Fund $350,414 for IMMF management fees.
OFS has voluntarily agreed to limit transfer and shareholder servicing agent fees for Classes B, C, N and Y shares to 0.35% of average annual net assets per class; this limit also applied to Class A shares prior to March 1, 2012. Effective March 1, 2012, OFS has voluntarily agreed to limit its fees for Class A shares to 0.30% of average annual net assets of the class.
During the year ended December 31, 2012, OFS waived transfer and shareholder servicing agent fees as follows:
| | | | |
| Class A | | $ | 359,321 | |
| Class B | | | 78,795 | |
| Class C | | | 113,293 | |
| Class N | | | 49,485 | |
| | | | |
| OPPENHEIMER COMMODITY STRATEGY TOTAL RETURN FUND | | | 37 | |
NOTES TO FINANCIAL STATEMENTS Continued
5. Fees and Other Transactions with Affiliates Continued
Some of these undertakings may be modified or terminated at any time; some may not be modified or terminated until after one year from the date of the current prospectus, as indicated therein.
6. Restricted Securities
As of December 31, 2012, investments in securities included issues that are restricted. A restricted security may have a contractual restriction on its resale and is valued under methods approved by the Board of Trustees as reflecting fair value. Securities that are restricted are marked with an applicable footnote on the Statement of Investments. Restricted securities are reported on a schedule following the Statement of Investments.
7. Subsequent Event
The Board of Trustees of the Fund recently approved a series of modifications to the Fund’s investment advisory and transfer agency arrangements in connection with internal corporate restructuring efforts at OppenheimerFunds, Inc. (“OFI”). As a result of these modifications, on January 1, 2013 (the “Effective Date”), OFI Global Asset Management, Inc. (“OFI Global”), a wholly-owned subsidiary of OFI, became the investment adviser and transfer agent to the Fund under the terms of the Fund’s advisory agreement and transfer agency agreement, respectively. OFI Global, in turn, entered into a new sub-advisory agreement for the Fund, on the Effective Date, whereby OFI Global will have oversight and supervisory responsibilities and OFI will choose the Fund’s investments and provide related advisory services to the Fund. In addition, on the Effective Date, OFI Global entered into a sub-transfer agency agreement with Shareholder Services, Inc. doing business as OppenheimerFunds Services, a wholly-owned subsidiary of OFI, under which it will be responsible for providing transfer agency services to the Fund.
The realignment of advisory service responsibility between OFI Global and OFI did not result in any change in the persons managing the assets of the Fund, the level or nature of the advisory services provided to the Fund, or the fees charged to the Fund.
8. Pending Litigation
Since 2009, a number of class action lawsuits have been pending in federal courts against OppenheimerFunds, Inc., the Fund’s Adviser through December 31, 2012 and Sub-Advisor effective January 1, 2013 (the “Manager”), OppenheimerFunds Distributor, Inc., the Fund’s principal underwriter and distributor (the “Distributor”), and certain funds (but not including the Fund) advised by the Manager and distributed by the Distributor (the “Defendant Funds”). Several of these lawsuits also name as defendants certain officers and current and former trustees of the respective Defendant Funds. The lawsuits raise claims under federal securities law and allege, among other things, that the disclosure documents of the respective Defendant Funds contained misrepresentations and omissions and that the respective Defendant Funds’ investment policies were not followed. The plaintiffs in these actions seek unspecified damages, equitable relief and awards of attorneys’ fees and litigation expenses. The Defendant Funds’ Boards of Trustees have also engaged counsel to represent the Funds and the present and former Independent Trustees named in those suits.
| | |
| 38 | | OPPENHEIMER COMMODITY STRATEGY TOTAL RETURN FUND |
Other class action and individual lawsuits have been filed since 2008 in various state and federal courts against the Manager and certain of its affiliates by investors seeking to recover investments they allegedly lost as a result of the “Ponzi” scheme run by Bernard L. Madoff and his firm, Bernard L. Madoff Investment Securities, LLC (“BLMIS”). Plaintiffs in these suits allege that they suffered losses as a result of their investments in several funds managed by an affiliate of the Manager and assert a variety of claims, including breach of fiduciary duty, fraud, negligent misrepresentation, unjust enrichment, and violation of federal and state securities laws and regulations, among others. They seek unspecified damages, equitable relief and awards of attorneys’ fees and litigation expenses. Neither the Distributor, nor any of the Oppenheimer mutual funds, their independent trustees or directors are named as defendants in these lawsuits. None of the Oppenheimer mutual funds invested in any funds or accounts managed by Madoff or BLMIS. On February 28, 2011, a stipulation of partial settlement of three groups of consolidated putative class action lawsuits relating to these matters was filed in the U.S. District Court for the Southern District of New York. On August 19, 2011, the court entered an order and final judgment approving the settlement as fair, reasonable and adequate. In September 2011, certain parties filed notices of appeal from the court’s order approving the settlement. The settlement does not resolve other outstanding lawsuits against the Manager and its affiliates relating to BLMIS.
On April 16, 2010, a lawsuit was filed in New York state court against the Manager, an affiliate of the Manager and AAArdvark IV Funding Limited (“AAArdvark IV”), an entity advised by the Manager’s affiliate, in connection with investments made by the plaintiffs in AAArdvark IV. Plaintiffs allege breach of contract against the defendants and seek compensatory damages, costs and disbursements, including attorney fees. On July 15, 2011, a lawsuit was filed in New York state court against the Manager, an affiliate of the Manager and AAArdvark Funding Limited (“AAArdvark I”), an entity advised by the Manager’s affiliate, in connection with investments made by the plaintiffs in AAArdvark I. The complaint alleges breach of contract against the defendants and seeks compensatory damages, costs and disbursements, including attorney fees. On November 9, 2011, a lawsuit was filed in New York state court against the Manager, an affiliate of the Manager and AAArdvark XS Funding Limited (“AAArdvark XS”), an entity advised by the Manager’s affiliate, in connection with investments made by the plaintiffs in AAArdvark XS. The complaint alleges breach of contract against the defendants and seeks compensatory damages, costs and disbursements, including attorney fees.
The Manager believes the lawsuits and appeals described above are without legal merit and, with the exception of actions it has settled, is defending against them vigorously. While it is premature to render any opinion as to the outcome in these lawsuits, or whether any costs that the Defendant Funds may bear in defending the suits might not be reimbursed by insurance, the Manager believes that these suits should not impair the ability of the Manager or the Distributor to perform their respective duties to the Fund, and that the outcome of all of the suits together should not have any material effect on the operations of any of the Oppenheimer mutual funds.
| | | | |
| OPPENHEIMER COMMODITY STRATEGY TOTAL RETURN FUND | | | 39 | |
REPORT OF INDEPENDENT REGISTERED PUBLIC ACCOUNTING FIRM
The Board of Trustees and Shareholders of Oppenheimer Commodity Strategy Total Return Fund:
We have audited the accompanying statement of assets and liabilities of Oppenheimer Commodity Strategy Total Return Fund, including the statement of investments, as of December 31, 2012, and the related statement of operations for the year then ended, the statements of changes in net assets for each of the years in the two-year period then ended and the financial highlights for each of the years or periods in the four-year period then ended. These financial statements and financial highlights are the responsibility of the Fund’s management. Our responsibility is to express an opinion on these financial statements and financial highlights based on our audits. The accompanying financial highlights of Oppenheimer Commodity Strategy Total Return Fund for the year ended December 31, 2008 were audited by other auditors whose report dated February 11, 2009 expressed an unqualified opinion on those financial highlights.
We conducted our audits in accordance with the standards of the Public Company Accounting Oversight Board (United States). Those standards require that we plan and perform the audit to obtain reasonable assurance about whether the financial statements and financial highlights are free of material misstatement. An audit includes examining, on a test basis, evidence supporting the amounts and disclosures in the financial statements. Our procedures included confirmation of securities owned as of December 31, 2012, by correspondence with the custodian and transfer agent. An audit also includes assessing the accounting principles used and significant estimates made by management, as well as evaluating the overall financial statement presentation. We believe that our audits provide a reasonable basis for our opinion.
In our opinion, the financial statements and financial highlights referred to above present fairly, in all material respects, the financial position of Oppenheimer Commodity Strategy Total Return Fund as of December 31, 2012, the results of its operations for the year then ended, the changes in its net assets for each of the years in the two-year period then ended and the financial highlights for each of the years or periods in the four-year period then ended, in conformity with U.S. generally accepted accounting principles.
KPMGLLP
Denver, Colorado
February 19, 2013
| | |
| 40 | | OPPENHEIMER COMMODITY STRATEGY TOTAL RETURN FUND |
FEDERAL INCOME TAX INFORMATION Unaudited
In early 2013, if applicable, shareholders of record received information regarding all dividends and distributions paid to them by the Fund during calendar year 2012.
None of the dividends, if any, paid by the Fund during the fiscal year ended December 31, 2012 are eligible for the corporate dividend-received deduction.
Dividends, if any, paid by the Fund during the fiscal year ended December 31, 2012 which are not designated as capital gain distributions, may be eligible for lower individual income tax rates to the extent that the Fund has received qualified dividend income as stipulated by recent tax legislation. In early 2013, shareholders of record received information regarding the percentage of distributions that are eligible for lower individual income tax rates. The amount will be the maximum amount allowed.
The foregoing information is presented to assist shareholders in reporting distributions received from the Fund to the Internal Revenue Service. Because of the complexity of the federal regulations which may affect your individual tax return and the many variations in state and local tax regulations, we recommend that you consult your tax advisor for specific guidance.
| | | | |
| OPPENHEIMER COMMODITY STRATEGY TOTAL RETURN FUND | | | 41 | |
BOARD APPROVAL OF THE FUND’S INVESTMENT
ADVISORY AND SUB-ADVISORY AGREEMENTS Unaudited
Each year, the Board of Trustees (the “Board”), including a majority of the independent Trustees, is required to determine whether to renew the Fund’s investment advisory agreement and sub-advisory agreement (the “Agreements”). The Investment Company Act of 1940, as amended, requires that the Board request and evaluate, and that the Manager and Oppenheimer Real Asset Management, Inc., (the “Sub-Adviser”) provide, such information as may be reasonably necessary to evaluate the terms of the Agreements. The Board employs an independent consultant to prepare a report that provides information, including comparative information that the Board requests for that purpose. In addition to in-person meetings focused on this evaluation, the Board receives information throughout the year regarding Fund services, fees, expenses and performance.
The Manager and the independent consultant provided information to the Board on the following factors: (i) the nature, quality and extent of the Manager’s and Sub-Adviser’s services, (ii) the investment performance of the Fund, the Manager and the Sub-Adviser, (iii) the fees and expenses of the Fund, including comparative expense information, (iv) the profitability of the Manager and its affiliates, including an analysis of the cost of providing services, and of the Sub-Adviser and the group of affiliates in which it participates (v) whether economies of scale are realized as the Fund grows and whether fee levels reflect these economies of scale for Fund investors and (vi) other benefits to the Manager and Sub-Adviser from their relationships with the Fund. The Board was aware that there are alternatives to retaining the Manager and the Sub-Adviser.
Outlined below is a summary of the principal information considered by the Board as well as the Board’s conclusions.
Nature, Quality and Extent of Services. The Board considered information about the nature, quality and extent of the services provided to the Fund and information regarding the Manager’s and Sub-Adviser’s key personnel who provide such services. The Sub-Adviser’s duties include providing the Fund with the services of the portfolio managers and the Sub-Adviser’s investment team, who provide research, analysis and other advisory services in regard to the Fund’s investments; securities trading services; oversight of third-party service providers; monitoring compliance with applicable Fund policies and procedures and adherence to the Fund’s investment restrictions; and risk management. The Manager and Sub-Adviser are responsible for providing certain administrative services to the Fund as well. Those services include providing and supervising all administrative and clerical personnel who are necessary in order to provide effective corporate administration for the Fund; compiling and maintaining records with respect to the Fund’s operations; preparing and filing reports required by the Securities and Exchange Commission; preparing periodic reports regarding the operations of the Fund for its shareholders;
| | |
| 42 | | OPPENHEIMER COMMODITY STRATEGY TOTAL RETURN FUND |
preparing proxy materials for shareholder meetings; and preparing the registration statements required by Federal and state securities laws for the sale of the Fund’s shares. The Manager and Sub-Adviser also provide the Fund with office space, facilities and equipment.
The Board also considered the quality of the services provided and the quality of the Manager’s and Sub-Adviser’s resources that are available to the Fund. The Board took account of the fact that the Manager has had over fifty years of experience as an investment adviser and that its assets under management rank it among the top mutual fund managers in the United States. The Board evaluated the Manager’s and Sub-Adviser’s advisory, administrative, accounting, legal, compliance services and risk management, and information the Board has received regarding the experience and professional qualifications of the Manager’s and Sub-Adviser’s key personnel and the size and functions of their staff. In its evaluation of the quality of the portfolio management services provided, the Board considered the experience of Robert Baker and Carol Wolf, the portfolio managers for the Fund, and the Manager’s investment team and analysts. The Board members also considered the totality of their experiences with the Manager as directors or trustees of the Fund and other funds advised by the Manager. The Board considered information regarding the quality of services provided by affiliates of the Manager, which its members have become knowledgeable about in connection with the renewal of the Fund’s service agreements. The Board concluded, in light of the Manager’s and Sub-Adviser’s experience, reputation, personnel, operations and resources that the Fund benefits from the services provided under the Agreements.
Investment Performance of the Manager, Sub-Adviser and the Fund. Throughout the year, the Manager and Sub-Adviser provided information on the investment performance of the Fund, including comparative performance information. The Board also reviewed information, prepared by the Manager and by the independent consultant, comparing the Fund’s historical performance to relevant market indices and to the performance of other retail front-end load and no-load commodities general funds. The Board considered that Lipper does not have a performance universe for retail front-end load specialty diversified funds that, like the Fund, specialize in commodities. The Board considered the Manager’s assertion that Lipper’s performance information does not offer a good performance measurement for the Fund, since the funds in the performance universe do not invest in the same types of securities. The Board also considered management’s assertion that reviewing performance of the commodity-only portion of the Fund’s portfolio provides greater insight into the performance of the Fund with respect to active commodities management. The Board noted that the commodities-only portion of the
| | | | |
| OPPENHEIMER COMMODITY STRATEGY TOTAL RETURN FUND | | | 43 | |
BOARD APPROVAL OF THE FUND’S INVESTMENT
ADVISORY AND SUB-ADVISORY AGREEMENTS Unaudited / Continued
Fund outperformed its benchmark in the first quarter of 2011, and underperformed its benchmark in the second, third and fourth quarters of 2011. The Board considered that the Fund outperformed its performance universe median for the one-year period and equaled its performance universe median for the ten-year period, although it underperformed its performance universe median for the three- and five-year periods. The Board considered the Manager’s assertion that volatility and contango (the situation in which the price of a commodity for future delivery is higher than the expected future spot (or settlement-price) in futures for energy contracts negatively impacted the Fund’s performance for the three-year period. The Board also considered the Manager’s assertion that the Fund’s shift from the Core Plus Team to the Money Market Team in December 2008, has resulted in a more conservative approach to investing of the Fund’s cash positions.
Costs of Services by the Manager. The Board reviewed the fees paid to the Manager and the other expenses borne by the Fund. The Board noted that the Manager, not the Fund, pays the Sub-Adviser’s fee under the sub-advisory agreement. The Board also considered the comparability of the fees charged and the services provided to the Fund to the fees and services for other clients or accounts advised by the Manager. The independent consultant provided comparative data in regard to the fees and expenses of the Fund and other retail front-end load commodities general funds with comparable asset levels and distribution features. The Board noted that the Fund’s actual and contractual management fees, as well as its total expenses, were lower than its expense group median and average.
Economies of Scale and Profits Realized by the Manager and Sub-Adviser. The Board considered information regarding the Manager’s costs in serving as the Fund’s investment adviser, including the fee paid to the Sub-Adviser, the costs associated with the personnel and systems necessary to manage the Fund, and information regarding the Manager’s and Sub-Adviser’s profitability from their relationships with the Fund. The Board reviewed whether the Manager may realize economies of scale in managing and supporting the Fund. The Board noted that the Fund currently has management fee breakpoints, which are intended to share with Fund shareholders economies of scale that may exist as the Fund’s assets grow.
Other Benefits to the Manager and Sub-Adviser. In addition to considering the profits realized by the Manager and the Sub-Adviser, the Board considered information that was provided regarding the direct and indirect benefits the Manager and the Sub-Adviser receive as a result of their relationships with the Fund, including the fee paid to the Sub-Adviser, compensation paid to the Manager’s affiliates. The Board also
| | |
| 44 | | OPPENHEIMER COMMODITY STRATEGY TOTAL RETURN FUND |
considered that the Manager and Sub-Adviser must be able to pay and retain experienced professional personnel at competitive rates to provide quality services to the Fund.
Conclusions. These factors were also considered by the independent Trustees meeting separately from the full Board, assisted by experienced counsel to the Fund and to the independent Trustees. Fund counsel and the independent Trustees’ counsel are independent of the Manager and Sub-Adviser within the meaning and intent of the Securities and Exchange Commission Rules.
Based on its review of the information it received and its evaluations described above, the Board, including a majority of the independent Trustees, decided to continue the Agreement. In addition, the Board, including a majority of the Independent Trustees, approved the restructuring of the Fund’s investment advisory arrangement so that effective January 1, 2013, (i) OFI Global Asset Management, Inc. (“OFI Global”), a wholly owned subsidiary of the Manager, will serve as the investment adviser to the Fund in place of the Manager under a Restated Advisory Agreement (“Restated Advisory Agreement”), and (ii) OFI Global will enter into a Sub-Advisory Agreement (“Sub-Advisory Agreement”) with the Manager to provide investment sub-advisory services to the Fund. OFI Global will pay the Manager a percentage of the net investment advisory fee (after all applicable waivers have been deducted) that it receives from the Fund. The Agreement will continue until earlier of August 31, 2013 or the effective date of the Restated Advisory Agreement between the Fund and OFI Global. The Restated Advisory Agreement and Sub-Advisory Agreement will continue until August 31, 2013.
In arriving at its decisions, the Board did not single out any factor or factors as being more important than others, but considered all of the above information, and considered the terms and conditions of the Agreement, Restated Advisory Agreement and Sub-Advisory Agreement, including the management fees, in light of all the surrounding circumstances.
| | | | |
| OPPENHEIMER COMMODITY STRATEGY TOTAL RETURN FUND | | | 45 | |
PORTFOLIO PROXY VOTING POLICIES AND PROCEDURES;
UPDATES TO STATEMENTS OF INVESTMENTS Unaudited
The Fund has adopted Portfolio Proxy Voting Policies and Procedures under which the Fund votes proxies relating to securities (“portfolio proxies”) held by the Fund. A description of the Fund’s Portfolio Proxy Voting Policies and Procedures is available (i) without charge, upon request, by calling the Fund toll-free at 1.800.CALL OPP (225.5677), (ii) on the Fund’s website at oppenheimerfunds.com, and (iii) on the SEC’s website at www.sec.gov. In addition, the Fund is required to file Form N-PX, with its complete proxy voting record for the 12 months ended June 30th, no later than August 31st of each year. The Fund’s voting record is available (i) without charge, upon request, by calling the Fund toll-free at 1.800.CALL OPP (225.5677), and (ii) in the Form N-PX filing on the SEC’s website at www.sec.gov.
The Fund files its complete schedule of portfolio holdings with the SEC for the first quarter and the third quarter of each fiscal year on Form N-Q. The Fund’s Form N-Q filings are available on the SEC’s website at www.sec.gov. Those forms may be reviewed and copied at the SEC’s Public Reference Room in Washington, D.C. Information on the operation of the Public Reference Room may be obtained by calling 1-800-SEC-0330.
Householding—Delivery of Shareholder Documents
This is to inform you about OppenheimerFunds’ “householding” policy. If more than one member of your household maintains an account in a particular fund, OppenheimerFunds will mail only one copy of the fund’s prospectus (or, if available, the fund’s summary prospectus), annual and semiannual report and privacy policy. The consolidation of these mailings, called householding, benefits your fund through reduced mailing expense, and benefits you by reducing the volume of mail you receive from OppenheimerFunds. Householding does not affect the delivery of your account statements.
Please note that we will continue to household these mailings for as long as you remain an OppenheimerFunds shareholder, unless you request otherwise. If you prefer to receive multiple copies of these materials, please call us at 1.800.CALL-OPP (225-5677). You may also notify us in writing or via email. We will begin sending you individual copies of the prospectus (or, if available, the summary prospectus), reports and privacy policy within 30 days of receiving your request to stop householding.
| | |
| 46 | | OPPENHEIMER COMMODITY STRATEGY TOTAL RETURN FUND |
TRUSTEES AND OFFICERS Unaudited
| | |
| Name, Position(s) Held with the Fund, Length of Service, Age | | Principal Occupation(s) During the Past 5 Years; Other Trusteeships/Directorships Held; Number of Portfolios in the Fund Complex Currently Overseen |
| |
| INDEPENDENT TRUSTEES | | The address of each Trustee in the chart below is 6803 S. Tucson Way, Centennial, Colorado 80112-3924. Each Trustee serves for an indefinite term, or until his or her resignation, retirement, death or removal. |
| |
Sam Freedman, Chairman of the Board of Trustees (since 2012) and Trustee (since 1997) Age: 72 | | Director of Colorado UpLIFT (charitable organization) (since September 1984). Mr. Freedman held several positions with the Sub-Adviser and with subsidiary or affiliated companies of the Sub-Adviser (until October 1994). Oversees 36 portfolios in the OppenheimerFunds complex. Mr. Freedman has served on the Boards of certain Oppenheimer funds since 1996, during which time he has become familiar with the Fund’s (and other Oppenheimer funds’) financial, accounting, regulatory and investment matters and has contributed to the Boards’ deliberations. |
| |
Edward L. Cameron, Trustee (since 1999) Age: 74 | | Member of The Life Guard of Mount Vernon (George Washington historical site) (June 2000-June 2006); Partner of PricewaterhouseCoopers LLP (accounting firm) (July 1974-June 1999); Chairman of Price Waterhouse LLP Global Investment Management Industry Services Group (accounting firm) (July 1994-June 1998). Oversees 36 portfolios in the OppenheimerFunds complex. Mr. Cameron has served on the Boards of certain Oppenheimer funds since 1999, during which time he has become familiar with the Fund’s (and other Oppenheimer funds’) financial, accounting, regulatory and investment matters and has contributed to the Boards’ deliberations. |
| |
Jon S. Fossel, Trustee (since 1997)
Age: 70 | | Chairman of the Board (2006-December 2011) and Director (June 2002-December 2011) of UNUMProvident (insurance company); Director of Northwestern Energy Corp. (public utility corporation) (November 2004-December 2009); Director of P.R. Pharmaceuticals (October 1999-October 2003); Director of Rocky Mountain Elk Foundation (non-profit organization) (February 1998-February 2003 and February 2005-February 2007); Chairman and Director (until October 1996) and President and Chief Executive Officer (until October 1995) of the Sub-Adviser; President, Chief Executive Officer and Director of the following: Oppenheimer Acquisition Corp. (“OAC”) (parent holding company of the Sub-Adviser), Shareholders Services, Inc. and Shareholder Financial Services, Inc. (until October 1995). Oversees 36 portfolios in the OppenheimerFunds complex. Mr. Fossel has served on the Boards of certain Oppenheimer funds since 1990, during which time he has become familiar with the Fund’s (and other Oppenheimer funds’) financial, accounting, regulatory and investment matters and has contributed to the Boards’ deliberations. |
| |
Richard F. Grabish, Trustee (since 2012)
Age: 64 | | Formerly Senior Vice President and Assistant Director of Sales and Marketing (March 1997-December 2007), Director (March 1987-December 2007) and Manager of Private Client Services (June 1985-June 2005) of A.G. Edwards & Sons, Inc. (broker/dealer and investment firm); Chairman and Chief Executive Officer of A.G. Edwards Trust Company, FSB (March 2001-December 2007); President and Vice Chairman of A.G. Edwards Trust Company, FSB (investment adviser) (April 1987-March 2001); President of A.G. Edwards Trust Company, FSB (investment adviser) (June 2005-December 2007). Oversees 36 portfolios in the OppenheimerFunds complex. Mr. Grabish has served on the Boards of certain Oppenheimer funds since 2001, during which time he has become familiar with the Fund’s (and other Oppenheimer funds’) financial, accounting, regulatory and investment matters and has contributed to the Boards’ deliberations. |
| | | | |
| OPPENHEIMER COMMODITY STRATEGY TOTAL RETURN FUND | | | 47 | |
TRUSTEES AND OFFICERS Unaudited / Continued
| | |
Beverly L. Hamilton, Trustee (since 2002)
Age: 66 | | Trustee of Monterey Institute for International Studies (educational organization) (since February 2000); Board Member of Middlebury College (educational organization) (December 2005-June 2011); Chairman (since 2010) of American Funds’ Emerging Markets Growth Fund, Inc. (mutual fund); Director of The California Endowment (philanthropic organization) (April 2002-April 2008); Director (February 2002-2005) and Chairman of Trustees (2006-2007) of the Community Hospital of Monterey Peninsula; Director (October 1991-2005); Vice Chairman (2006-2009) of American Funds’ Emerging Markets Growth Fund, Inc. (mutual fund); President of ARCO Investment Management Company (February 1991-April 2000); Member of the investment committees of The Rockefeller Foundation (2001-2006) and The University of Michigan (since 2000); Advisor at Credit Suisse First Boston’s Sprout venture capital unit (venture capital fund) (1994-January 2005); Trustee of MassMutual Institutional Funds (investment company) (1996-June 2004); Trustee of MML Series Investment Fund (investment company) (April 1989-June 2004); Member of the investment committee of Hartford Hospital (2000-2003); and Advisor to Unilever (Holland) pension fund (2000-2003). Oversees 36 portfolios in the OppenheimerFunds complex. Ms. Hamilton has served on the Boards of certain Oppenheimer funds since 2002, during which time she has become familiar with the Fund’s (and other Oppenheimer funds’) financial, accounting, regulatory and investment matters and has contributed to the Boards’ deliberations. |
| |
Victoria J. Herget, Trustee (since 2012)
Age: 61 | | Independent Director of the First American Funds (mutual fund family) (2003-2011); former Managing Director (1993-2001), Principal (1985-1993), Vice President (1978-1985) and Assistant Vice President (1973-1978) of Zurich Scudder Investments (and its predecessor firms); Board Chair (2008-Present) and Director (2004-Present), United Educators (insurance company); Trustee (1992-2007), Chair of the Board of Trustees (1999-2007), Investment Committee Chair (1994-1999) and Investment Committee member (2007-2010) of Wellesley College; Trustee (since 2000) and Chair (since 2010), Newberry Library; Trustee, Mather LifeWays (since 2001); Trustee, BoardSource (2006-2009) and Chicago City Day School (1994-2005). Oversees 36 portfolios in the OppenheimerFunds complex. Ms. Herget has served on the Boards of certain Oppenheimer funds since 2012, during which time she has become familiar with the Fund’s (and other Oppenheimer funds’) financial, accounting, regulatory and investment matters and has contributed to the Boards’ deliberations. |
| |
Robert J. Malone, Trustee (since 2002)
Age: 68 | | Board of Directors of Opera Colorado Foundation (non-profit organization) (since March 2008); Director of Jones Knowledge, Inc. (2006-2010); Director of Jones International University (educational organization) (since August 2005); Chairman, Chief Executive Officer and Director of Steele Street Bank & Trust (commercial banking) (since August 2003); Director of Colorado UpLIFT (charitable organization) (1986-2010); Trustee of the Gallagher Family Foundation (non-profit organization) (since 2000); Former Chairman of U.S. Bank-Colorado (subsidiary of U.S. Bancorp and formerly Colorado National Bank) (July 1996-April 1999); Director of Commercial Assets, Inc. (real estate investment trust) (1993-2000); Director of Jones Knowledge, Inc. (2001-July 2004); Director of U.S. Exploration, Inc. (oil and gas exploration) (1997-February 2004); Chairman of the Board (1991-1994) and Trustee (1985-1994) of Regis University; and Chairman of the Board (1990-1991) and Trustee (1984-1999) of Young Presidents Organization. Oversees 36 portfolios in the OppenheimerFunds complex. Mr. Malone has served on the Boards of certain Oppenheimer funds since 2002, during which time he has become familiar with the Fund’s (and other Oppenheimer funds’) financial, accounting, regulatory and investment matters and has contributed to the Boards’ deliberations. |
| | |
| 48 | | OPPENHEIMER COMMODITY STRATEGY TOTAL RETURN FUND |
| | |
F. William Marshall, Jr., Trustee (since 2000)
Age: 70 | | Trustee Emeritus of Worcester Polytech Institute (WPI) (private university) (since 2009); Trustee of MassMutual Select Funds (formerly MassMutual Institutional Funds) (investment company) (since 1996) and MML Series Investment Fund (investment company) (since 1996) and Mass Mutual Premier Funds (investment company) (since January 2012); President and Treasurer of the SIS Funds (private charitable fund) (January 1999-March 2011); Former Trustee of WPI (1985-2008); Former Chairman of the Board (2004-2006) and Former Chairman of the Investment Committee of WPI (1994-2008); Chairman of SIS & Family Bank, F.S.B. (formerly SIS Bank) (commercial bank) (January 1999-July 1999); Executive Vice President of Peoples Heritage Financial Group, Inc. (commercial bank) (January 1999-July 1999); and Former President and Chief Executive Officer of SIS Bancorp. (1993-1999). Oversees 40 portfolios in the OppenheimerFunds complex. Mr. Marshall has served on the Boards of certain Oppenheimer funds since 2000, during which time he has become familiar with the Fund’s (and other Oppenheimer funds’) financial, accounting, regulatory and investment matters and has contributed to the Boards’ deliberations. |
| |
Karen L. Stuckey, Trustee (since 2012)
Age: 59 | | Partner (1990-2012) of PricewaterhouseCoopers LLP (held various positions 1975-1990); Trustee (1992-2006) and member of Executive, Nominating and Audit Committees and Chair of Finance Committee of Lehigh University; and member, Women’s Investment Management Forum since inception. Oversees 36 portfolios in the OppenheimerFunds complex. Ms. Stuckey has served on the Boards of certain Oppenheimer funds since 2012, during which time she has become familiar with the Fund’s (and other Oppenheimer funds’) financial, accounting, regulatory and investment matters and has contributed to the Boards’ deliberations. |
| |
James D. Vaughn, Trustee (since 2012)
Age: 67 | | Retired; former managing partner (1994-2001) of Denver office of Deloitte & Touche LLP, (held various positions 1969-1993); Trustee and Chairman of the Audit Committee of Schroder Funds (2003-2012); Board member and Chairman of Audit Committee of AMG National Trust Bank (since 2005); Trustee, Audit Committee member and Investment Committee member, University of South Dakota Foundation (since 1996); Board member, Executive Committee Member, Audit Committee Member and past Board Chair, Junior Achievement (since 1993); former Board member, Mile High United Way, Boys and Girls Clubs, Boy Scouts, Colorado Business Committee for the Arts, Economic Club of Colorado and Metro Denver Network. Oversees 36 portfolios in the OppenheimerFunds complex. Mr. Vaughn has served on the Boards of certain Oppenheimer funds since 2012, during which time he has become familiar with the Fund’s (and other Oppenheimer funds’) financial, accounting, regulatory and investment matters and has contributed to the Boards’ deliberations. |
| INTERESTED TRUSTEE AND OFFICER | | The address of Mr. Glavin is Two World Financial Center, 225 Liberty Street, 11th Floor, New York, New York 10281-1008. Mr. Glavin serves as a Trustee for an indefinite term, or until his resignation, retirement, death or removal and as an Officer for an indefinite term, or until his resignation, retirement, death or removal. Mr. Glavin is an Interested Trustee due to his positions with OppenheimerFunds, Inc. and its affiliates. |
| | | | |
| OPPENHEIMER COMMODITY STRATEGY TOTAL RETURN FUND | | | 49 | |
TRUSTEES AND OFFICERS Unaudited / Continued
| | |
William F. Glavin, Jr., Trustee, President and Principal Executive Officer (since 2009)
Age: 54 | | Chief Executive Officer of OppenheimerFunds (since January 2013); Director, Chief Executive Officer and President of the Manager (since January 2013); Chairman of the Sub-Adviser (December 2009-December 2012); Chief Executive Officer (January 2009-December 2012) and Director of the Sub-Adviser (since January 2009); President of the Sub-Adviser (May 2009-December 2012); Management Director (since June 2009), President (since December 2009) and Chief Executive Officer (since January 2011) of Oppenheimer Acquisition Corp. (“OAC”) (the Sub-Adviser’s parent holding company); Director of Oppenheimer Real Asset Management, Inc. (since March 2010); Executive Vice President (March 2006-February 2009) and Chief Operating Officer (July 2007-February 2009) of Massachusetts Mutual Life Insurance Company (OAC’s parent company); Director (May 2004-March 2006) and Chief Operating Officer and Chief Compliance Officer (May 2004-January 2005), President (January 2005-March 2006) and Chief Executive Officer (June 2005-March 2006) of Babson Capital Management LLC; Director (March 2005-March 2006), President (May 2003-March 2006) and Chief Compliance Officer (July 2005-March 2006) of Babson Capital Securities, Inc. (a broker-dealer); President (May 2003-March 2006) of Babson Investment Company, Inc.; Director (May 2004-August 2006) of Babson Capital Europe Limited; Director (May 2004-October 2006) of Babson Capital Guernsey Limited; Director (May 2004-March 2006) of Babson Capital Management LLC; Non-Executive Director (March 2005-March 2007) of Baring Asset Management Limited; Director (February 2005-June 2006) Baring Pension Trustees Limited; Director and Treasurer (December 2003-November 2006) of Charter Oak Capital Management, Inc.; Director (May 2006-September 2006) of C.M. Benefit Insurance Company; Director (May 2008-June 2009) and Executive Vice President (June 2007-July 2009) of C.M. Life Insurance Company; President (March 2006-May 2007) of MassMutual Assignment Company; Director (January 2005-December 2006), Deputy Chairman (March 2005-December 2006) and President (February 2005-March 2005) of MassMutual Holdings (Bermuda) Limited; Director (May 2008-June 2009) and Executive Vice President (June 2007-July 2009) of MML Bay State Life Insurance Company; Chief Executive Officer and President (April 2007-January 2009) of MML Distributors, LLC; and Chairman (March 2006-December 2008) and Chief Executive Officer (May 2007-December 2008) of MML Investors Services, Inc. An officer of 86 portfolios in the OppenheimerFunds complex. |
| OTHER OFFICERS OF THE FUND | | The addresses of the Officers in the chart below are as follows: for Messrs. Baker, Gabinet and Ms. Nasta, Two World Financial Center, 225 Liberty Street, New York, New York 10281-1008, for Messrs. Baum, Vandehey and Wixted, 6803 S. Tucson Way, Centennial, Colorado 80112-3924. Each Officer serves for an indefinite term or until his or her resignation, retirement, death or removal. |
| |
Robert Baker, Vice President (since 2007)
Age: 39 | | Vice President and Senior Portfolio Manager of the Sub-Adviser (since May 2007); a Chartered Financial Analyst; Assistant Vice President and Senior Research Analyst of the Sub-Adviser (January 2004-May 2007); Analyst of the Sub-Adviser (February 2001-December 2003). A portfolio manager and officer of 1 portfolio in the OppenheimerFunds complex. |
| |
Carol Wolf, Vice President (since 2008)
Age: 61 | | Senior Vice President of the Sub-Adviser (since September 2000). Senior Vice President of HarbourView Asset Management Corporation (June 2003-December 2012) and Vice President of the Sub-Adviser (June 1990-June 2000). A portfolio manager and officer of 6 portfolios in the OppenheimerFunds complex. |
| | |
| 50 | | OPPENHEIMER COMMODITY STRATEGY TOTAL RETURN FUND |
| | |
Arthur S. Gabinet, Secretary and Chief Legal Officer (since 2011)
Age: 54 | | General Counsel of OppenheimerFunds (since January 2013); Executive Vice President, Secretary and General Counsel of the Manager (since January 2013); General Counsel OFI SteelPath, Inc. (since January 2013); Executive Vice President (May 2010-December 2012) and General Counsel (since January 2011) of the Sub-Adviser; General Counsel of the Distributor (since January 2011); General Counsel of Centennial Asset Management Corporation (January 2011-December 2012); Executive Vice President (January 2011-December 2012) and General Counsel of HarbourView Asset Management Corporation (since January 2011); Assistant Secretary (since January 2011) and Director (since January 2011) of OppenheimerFunds International Ltd. and OppenheimerFunds plc; Director of Oppenheimer Real Asset Management, Inc. (January 2011-December 2012) and General Counsel (since January 2011); Executive Vice President (January 2011-December 2011) and General Counsel of Shareholder Financial Services, Inc. and Shareholder Services, Inc. (since January 2011); Executive Vice President (January 2011-December 2012) and General Counsel of OFI Private Investments Inc. (since January 2011); Vice President of OppenheimerFunds Legacy Program (January 2011-December 2011); Executive Vice President (January 2011-December 2012) and General Counsel of OFI Institutional Asset Management, Inc. (since January 2011); General Counsel, Asset Management of the Sub-Adviser (May 2010-December 2010); Principal, The Vanguard Group (November 2005-April 2010); District Administrator, U.S. Securities and Exchange Commission (January 2003-October 2005). An officer of 86 portfolios in the OppenheimerFunds complex. |
| |
Christina M. Nasta, Vice President and Chief Business Officer (since 2011)
Age: 39 | | Senior Vice President of OppenheimerFunds Distributor, Inc. (since January 2013); Senior Vice President of the Sub-Adviser (July 2010-December 2012); Vice President of the Sub-Adviser (January 2003-July 2010); Vice President of OppenheimerFunds Distributor, Inc. (January 2003-July 2010). An officer of 86 portfolios in the OppenheimerFunds complex. |
| |
Mark S. Vandehey,
Vice President and Chief Compliance Officer (since 2004) Age: 62 | | Chief Compliance Officer of OppenheimerFunds (since January 2013); Senior Vice President and Chief Compliance Officer of the Manager (since January 2013); Chief Compliance Officer of OFI SteelPath, Inc. (since January 2013); Senior Vice President of the Sub-Adviser (March 2004-December 2012); Chief Compliance Officer of the Sub-Adviser, OppenheimerFunds Distributor, Inc., OFI Trust Company, OFI Institutional Asset Management, Inc., Oppenheimer Real Asset Management, Inc., OFI Private Investments, Inc., Harborview Asset Management Corporation, Trinity Investment Management Corporation, and Shareholder Services, Inc. (since March 2004); Vice President of OppenheimerFunds Distributor, Inc., Centennial Asset Management Corporation and Shareholder Services, Inc. (June 1983-December 2012). An officer of 86 portfolios in the OppenheimerFunds complex. |
| |
Brian W. Wixted, Treasurer and Principal Financial & Accounting Officer (since 1999) Age: 53 | | Senior Vice President of the Manager (since January 2013); Treasurer of the Sub-Adviser, HarbourView Asset Management Corporation, Shareholder Financial Services, Inc., Shareholder Services, Inc., and Oppenheimer Real Asset Management, Inc. (March 1999-June 2008), OFI Private Investments, Inc. (March 2000-June 2008), OppenheimerFunds International Ltd. and OppenheimerFunds plc (since May 2000), OFI Institutional Asset Management, Inc. (November 2000-June 2008), and OppenheimerFunds Legacy Program (charitable trust program established by the Sub-Adviser) (June 2003-December 2011); Treasurer and Chief Financial Officer of OFI Trust Company (since May 2000); Assistant Treasurer of Oppenheimer Acquisition Corporation (March 1999-June 2008). An officer of 86 portfolios in the OppenheimerFunds complex. |
The Fund’s Statement of Additional Information contains additional information about the Fund’s Trustees and Officers is available without charge upon request, by calling 1.800.CALL OPP (225.5677).
| | | | |
| OPPENHEIMER COMMODITY STRATEGY TOTAL RETURN FUND | | | 51 | |
OPPENHEIMER COMMODITY STRATEGY TOTAL RETURN FUND®
| | |
| Manager | | OFI Global Asset Management, Inc. |
| Sub-Adviser | | OppenheimerFunds, Inc. |
| Distributor | | OppenheimerFunds Distributor, Inc. |
| Transfer and Shareholder Servicing Agent | | OFI Global Asset Management, Inc. |
| Sub-Transfer Agent | | Shareholder Services, Inc. DBA OppenheimerFunds Services |
Independent Registered Public Accounting Firm | | KPMGLLP |
| Counsel | | K&L Gates LLP |
©2013 OppenheimerFunds, Inc. All rights reserved.
| | |
| 52 | | OPPENHEIMER COMMODITY STRATEGY TOTAL RETURN FUND |
| | | | |
| OPPENHEIMER COMMODITY STRATEGY TOTAL RETURN FUND | | | 53 | |
RAF FUND LTD. (the “SUBSIDIARY”)
STATEMENT OF INVESTMENTS December 31, 2012
| | | | | | | | | | | | |
| | | | | | | Principal
Amount | | | Value | |
| | | | | | | | | | | | | |
| Mortgage-Backed Obligations—0.0% | | | | | | | | | | | | |
| NC Finance Trust, Collateralized Mtg. Obligation Pass-Through Certificates, Series 1999-I, Cl. ECFD, 3.405%, 1/25/291,2 (Cost $82,949) | | | | | | $ | 239,840 | | | $ | 19,187 | |
| U.S. Government Obligations—58.9% | | | | | | | | | | | | |
| U.S. Treasury Bills: | | | | | | | | | | | | |
| 0.051%, 1/10/13 | | | | | | | 1,600,000 | | | | 1,599,965 | |
| 0.076%, 1/31/13 | | | | | | | 1,400,000 | | | | 1,399,872 | |
| U.S. Treasury Nts.: | | | | | | | | | | | | |
| 0.25%, 1/31/14 | | | | | | | 1,250,000 | | | | 1,250,976 | |
| 0.375%, 7/31/13 | | | | | | | 1,000,000 | | | | 1,001,563 | |
| 0.50%, 11/15/13-10/15/14 | | | | | | | 5,350,000 | | | | 5,367,395 | |
| 0.50%, 10/15/133 | | | | | | | 16,000,000 | | | | 16,043,760 | |
| 0.625%, 1/31/13-7/15/14 | | | | | | | 10,725,000 | | | | 10,743,863 | |
| 0.75%, 8/15/13-9/15/13 | | | | | | | 5,250,000 | | | | 5,270,419 | |
| 1%, 1/15/14 | | | | | | | 1,600,000 | | | | 1,613,626 | |
| 1%, 7/15/133 | | | | | | | 7,500,000 | | | | 7,535,745 | |
| 1.25%, 2/15/14-4/15/14 | | | | | | | 2,550,000 | | | | 2,582,386 | |
| 1.375%, 2/15/13-5/15/13 | | | | | | | 9,200,000 | | | | 9,226,395 | |
| 1.75%, 1/31/14 | | | | | | | 2,000,000 | | | | 2,033,672 | |
| 1.75%, 4/15/133 | | | | | | | 7,500,000 | | | | 7,536,330 | |
| 1.875%, 2/28/14-4/30/14 | | | | | | | 1,225,000 | | | | 1,251,439 | |
| 2.25%, 5/31/14-1/31/15 | | | | | | | 6,950,000 | | | | 7,178,729 | |
| 4.125%, 5/15/15 | | | | | | | 1,800,000 | | | | 1,961,860 | |
| 4.25%, 8/15/14-8/15/15 | | | | | | | 2,950,000 | | |
| 3,234,098
|
|
| Total U.S. Government Obligations (Cost $86,652,644) | | | | | | | | | | | 86,832,093 | |
| Short-Term Notes—9.8% | | | | | | | | | | | | |
| Federal Home Loan Bank: | | | | | | | | | | | | |
| 0.04%, 1/18/13 | | | | | | | 1,350,000 | | | | 1,349,917 | |
| 0.06%, 1/11/13 | | | | | | | 800,000 | | | | 799,971 | |
| 0.07%, 2/1/13 | | | | | | | 1,000,000 | | | | 999,875 | |
| 0.07%, 1/9/13 | | | | | | | 1,750,000 | | | | 1,749,953 | |
| 0.13%, 3/1/13 | | | | | | | 325,000 | | | | 324,933 | |
| 0.13%, 1/8/13 | | | | | | | 500,000 | | | | 499,987 | |
| 0.13%, 6/21/13 | | | | | | | 500,000 | | | | 499,788 | |
| 0.14%, 1/14/13 | | | | | | | 1,500,000 | | | | 1,499,924 | |
| 0.15%, 4/5/13 | | | | | | | 500,000 | | | | 499,811 | |
| 0.15%, 5/3/13 | | | | | | | 1,200,000 | | | | 1,199,677 | |
| 0.16%, 3/27/13 | | | | | | | 450,000 | | | | 449,958 | |
| 0.16%, 5/29/13 | | | | | | | 2,200,000 | | | | 2,199,281 | |
| 0.16%, 2/22/13 | | | | | | | 1,200,000 | | | | 1,199,730 | |
| 0.16%, 1/16/13 | | | | | | | 800,000 | | | | 799,947 | |
| 0.16%, 4/24/13 | | | | | | | 400,000 | | |
| 399,923
|
|
| Total Short-Term Notes (Cost $14,471,350) | | | | | | | | | | | 14,472,675 | |
| | |
| 54 | | OPPENHEIMER COMMODITY STRATEGY TOTAL RETURN FUND |
| | | | | | | | | | | | | | | | | | | | |
| | | Expiration
Date | | Strike
Price | | Contracts | | Value |
| | | | | | | | | | | | | | | | | | | | | |
| Options Purchased—0.1% | | | | | | | | |
| Gold (100 oz.) Futures, 2/26/13 Call4 | | | | 1/29/13 | | | | $ | 1,800 | | | | | 30 | | | | $ | 3,300 | |
| Gold (100 oz.) Futures, 2/26/13 Call4 | | | | 1/29/13 | | | | | 1,850 | | | | | 32 | | | | | 1,600 | |
| Gold (100 oz.) Futures, 2/26/13 Put4 | | | | 1/29/13 | | | | | 1,450 | | | | | 30 | | | | | 1,500 | |
| Gold (100 oz.) Futures, 2/26/13 Put4 | | | | 1/29/13 | | | | | 1,500 | | | | | 62 | | | | | 6,200 | |
| Gold (100 oz.) Futures, 4/26/13 Call4 | | | | 3/26/13 | | | | | 1,750 | | | | | 30 | | | | | 54,000 | |
| Natural Gas Futures, 1/29/13 Call4 | | | | 1/29/13 | | | | | 4 | | | | | 57 | | | | | 2,850 | |
| Natural Gas Futures, 1/29/13 Call4 | | | | 1/29/13 | | | | | 4 | | | | | 96 | | | | | 2,880 | |
| Natural Gas Futures, 1/29/13 Call4 | | | | 1/29/13 | | | | | 4 | | | | | 115 | | | | | 2,300 | |
| Natural Gas Futures, 1/29/13 Call4 | | | | 1/29/13 | | | | | 5 | | | | | 211 | | | |
| 2,110
|
|
| Total Options Purchased (Cost $692,671) | | | | | | | | | | | | | | | | | | | 76,740 | |
| | | | |
| | | | | | | Shares | | |
| Investment Company—29.4% | | | | | | | | |
Oppenheimer Institutional Money Market Fund, Cl. E, 0.15%5,6 (Cost $43,436,000) | | | | | | | | | | | | | | 43,436,000 | | | | | 43,436,000 | |
| Total Investments, at Value (Cost $145,335,614) | | | | | | | | | | | | | | 98.2 | % | | | | 144,836,695 | |
| Other Assets Net of Liabilities | | | | | | | | | | | | | | 1.8 | | | | | 2,602,411 | |
| | | | | | | | | | | | | |
|
|
| | |
|
|
|
| Net Assets | | | | | | | | | | | | | | 100.0 | % | | | $ | 147,439,106 | |
| | | | | | | | | | | | | |
|
|
| | |
|
|
|
Footnotes to Statement of Investments
1. Restricted security. The aggregate value of restricted securities as of December 31, 2012 was $19,187, which represents 0.01% of the Fund’s net assets. See Note 6 of the accompanying Notes. Information concerning restricted securities is as follows:
| | | | | | | | | | | | | | | | | | | | |
| Security | | Acquisition
Date | | Cost | | Value | | Unrealized
Depreciation |
| NC Finance Trust, Collateralized Mtg. Obligation Pass-Through Certificates, Series 1999-I, Cl. ECFD, 3.405%, 1/25/29 | | | | 8/10/10 | | | | $ | 82,949 | | | | $ | 19,187 | | | | $ | 63,762 | |
2. This security is not accruing income because the issuer has missed an interest payment on it and/or is not anticipated to make future interest and/or principal payments. The rate shown is the original contractual interest rate. See Note 1 of the accompanying Notes.
3. All or a portion of the security position is held in accounts at a futures clearing merchant and pledged to cover margin requirements on open futures contracts and written options on futures, if applicable. The aggregate market value of such securities is $23,634,387. See Note 5 of the accompanying Notes.
4. Non-income producing security.
5. Is or was an affiliate, as defined in the Investment Company Act of 1940, at or during the period ended December 31, 2012, by virtue of the Fund owning at least 5% of the voting securities of the issuer or as a result of the Fund and the issuer having the same investment adviser. Transactions during the period in which the issuer was an affiliate are as follows:
| | | | | | | | | | | | | | | | | | | | |
| | | Shares
December 30, 2011a | | Gross
Additions | | Gross
Reductions | | Shares
December 31, 2012 |
| Oppenheimer Institutional Money Market Fund, Cl. E | | | | 77,100,000 | | | | | 213,865,000 | | | | | 247,529,000 | | | | | 43,436,000 | |
| | | | |
| | | | | | | Value | | Income |
| Oppenheimer Institutional Money Market Fund, Cl. E | | | | | | | | | | | | | $ | 43,436,000 | | | | $ | 135,382 | |
a. December 30, 2011 represents the last business day of the Fund’s 2011 fiscal year. See Note 1 of the accompanying Notes.
| | | | |
| OPPENHEIMER COMMODITY STRATEGY TOTAL RETURN FUND | | | 55 | |
RAF FUND LTD. (the “SUBSIDIARY”)
STATEMENT OF INVESTMENTS Continued
Footnotes to Statement of Investments Continued
6. Rate shown is the 7-day yield as of December 31, 2012.
| | | | | | | | | | | | | | | | | | | | | | | | | |
| Futures Contracts as of December 31, 2012 are as follows: |
| Contract Description | | Buy/Sell | | Number of
Contracts | | Expiration
Dates | | Value | | Unrealized
Appreciation
(Depreciation) |
| Brent Crude Oil | | | | Buy | | | | | 533 | | | | | 1/16/13-2/13/13 | | | | $ | 59,070,350 | | | | $ | 1,449,573 | |
| Cattle Feeder | | | | Buy | | | | | 21 | | | | | 3/28/13 | | | | | 1,619,888 | | | | | 6,941 | |
| Cocoa | | | | Buy | | | | | 32 | | | | | 5/15/13 | | | | | 718,720 | | | | | (39,515 | ) |
| Coffee | | | | Buy | | | | | 36 | | | | | 5/20/13 | | | | | 1,980,450 | | | | | (16,442 | ) |
| Corn | | | | Buy | | | | | 805 | | | | | 4/29/13-7/12/13 | | | | | 28,115,463 | | | | | (1,059,600 | ) |
| Corn | | | | Sell | | | | | 351 | | | | | 2/27/13 | | | | | 12,254,288 | | | | | 1,003,777 | |
| Cotton | | | | Buy | | | | | 82 | | | | | 3/6/13 | | | | | 3,080,740 | | | | | 184,135 | |
| Crude Oil | | | | Sell | | | | | 719 | | | | | 6/19/13-8/19/13 | | | | | 67,376,680 | | | | | (2,055,539 | ) |
| Gas Oil | | | | Buy | | | | | 276 | | | | | 2/12/13 | | | | | 25,881,900 | | | | | 628,404 | |
| Gold (100 oz.) | | | | Sell | | | | | 3 | | | | | 2/26/13 | | | | | 502,740 | | | | | (7,776 | ) |
| Heating Oil | | | | Buy | | | | | 130 | | | | | 1/31/13 | | | | | 16,553,628 | | | | | 149,499 | |
| Lean Hogs | | | | Sell | | | | | 7 | | | | | 2/14/13 | | | | | 240,030 | | | | | 2,293 | |
| Lean Hogs | | | | Buy | | | | | 147 | | | | | 4/12/13 | | | | | 5,217,030 | | | | | (150,591 | ) |
| Live Cattle | | | | Buy | | | | | 177 | | | | | 4/30/13 | | | | | 9,655,350 | | | | | 121,667 | |
| London Metal Exchange Aluminum | | | | Buy | | | | | 130 | | | | | 2/18/13 | | | | | 6,698,250 | | | | | (186,635 | ) |
| London Metal Exchange Copper | | | | Buy | | | | | 52 | | | | | 2/18/13 | | | | | 10,300,875 | | | | | (229,085 | ) |
| London Metal Exchange Lead | | | | Buy | | | | | 24 | | | | | 2/18/13 | | | | | 1,392,000 | | | | | 14,682 | |
| London Metal Exchange Nickel | | | | Buy | | | | | 17 | | | | | 2/18/13 | | | | | 1,737,570 | | | | | (64,360 | ) |
| London Metal Exchange Zinc | | | | Buy | | | | | 33 | | | | | 2/18/13 | | | | | 1,706,100 | | | | | (5,607 | ) |
| Natural Gas | | | | Buy | | | | | 222 | | | | | 1/29/13-3/26/13 | | | | | 7,464,700 | | | | | (124,984 | ) |
| RBOB Gasoline | | | | Buy | | | | | 134 | | | | | 1/31/13 | | | | | 15,542,848 | | | | | 364,629 | |
| Silver | | | | Sell | | | | | 1 | | | | | 3/26/13 | | | | | 151,135 | | | | | (2,747 | ) |
| Soybean | | | | Buy | | | | | 328 | | | | | 4/29/13-5/14/13 | | | | | 22,947,700 | | | | | (516,768 | ) |
| Soybean | | | | Sell | | | | | 205 | | | | | 2/27/13 | | | | | 14,447,375 | | | | | 656,056 | |
| Sugar | | | | Buy | | | | | 236 | | | | | 2/28/13 | | | | | 5,156,883 | | | | | (247,660 | ) |
| Wheat | | | | Buy | | | | | 516 | | | | | 3/14/13-4/29/13 | | | | | 20,375,413 | | | | | (2,466,270 | ) |
| Wheat | | | | Sell | | | | | 160 | | | | | 2/27/13 | | | | | 6,224,000 | | | | | 679,431 | |
| WTI Crude Oil | | | | Buy | | | | | 1,835 | | | | | 1/18/13-12/18/13 | | | | | 169,580,220 | | | | | 6,993,147 | |
| WTI Crude Oil | | | | Sell | | | | | 77 | | | | | 11/19/13 | | | | | 7,189,490 | | | | | (134,847 | ) |
| | | | | | | | | | | | | | | | | | | | | | | |
|
|
|
| | | | | | | | | | | | | | | | | | | | | | | | | $4,945,808 | |
| | | | | | | | | | | | | | | | | | | | | | | |
|
|
|
| | | | | | | | | | | | | | | | | | | | | | | | | | | | | | | | | | | |
| Written Options as of December 31, 2012 are as follows: |
| Description | | Type | | Number of
Contracts | | Exercise
Price | | Expiration
Date | | Premiums
Received | | Value | | Unrealized
Appreciation/
(Depreciation) |
| Gold (100 oz.) Futures, 2/26/13 | | | | Call | | | | | 32 | | | | $ | 2,000.000 | | | | | 1/29/13 | | | | $ | 11,089 | | | | $ | (320 | ) | | | $ | 10,769 | |
| Gold (100 oz.) Futures, 2/26/13 | | | | Call | | | | | 30 | | | | | 1,950.000 | | | | | 1/29/13 | | | | | 2,896 | | | | | (300 | ) | | | | 2,596 | |
| Gold (100 oz.) Futures, 2/26/13 | | | | Put | | | | | 62 | | | | | 1,600.000 | | | | | 1/29/13 | | | | | 50,085 | | | | | (27,280 | ) | | | | 22,805 | |
| Gold (100 oz.) Futures, 2/26/13 | | | | Put | | | | | 30 | | | | | 1,550.000 | | | | | 1/29/13 | | | | | 7,996 | | | | | (5,700 | ) | | | | 2,296 | |
| Gold (100 oz.) Futures, 4/26/13 | | | | Call | | | | | 30 | | | | | 1,900.000 | | | | | 3/26/13 | | | | | 5,896 | | | | | (9,600 | ) | | | | (3,704 | ) |
| Natural Gas Futures, 1/29/13 | | | | Call | | | | | 326 | | | | | 5.000 | | | | | 1/29/13 | | | | | 73,121 | | | | | (3,260 | ) | | | | 69,861 | |
| Natural Gas Futures, 1/29/13 | | | | Call | | | | | 211 | | | | | 5.200 | | | | | 1/29/13 | | | | | 31,413 | | | | | (2,110 | ) | | | | 29,303 | |
| | | | | | | | | | | | | | | | | | | | | | | |
|
|
| | |
|
|
| | |
|
|
|
| | | | | | | | | | | | | | | | | | | | | | | | $ | 182,496 | | | | $ | (48,570 | ) | | | $ | 133,926 | |
| | | | | | | | | | | | | | | | | | | | | | | |
|
|
| | |
|
|
| | |
|
|
|
See accompanying Notes to Financial Statements.
| | |
| 56 | | OPPENHEIMER COMMODITY STRATEGY TOTAL RETURN FUND |
RAF FUND LTD. (the “SUBSIDIARY”)
STATEMENT OF ASSETS AND LIABILITIES December 31, 2012
| | | | |
| Assets | | | |
| Investments, at value—see accompanying statement of investments: | | | | |
| Unaffiliated companies (cost $101,899,614) | | $ | 101,400,695 | |
| Affiliated companies (cost $43,436,000) | |
| 43,436,000
|
|
| | | | 144,836,695 | |
| Cash | | | 34,023 | |
| Receivables and other assets: | | | | |
| Futures margins | | | 4,369,912 | |
| Interest and dividends | | | 330,867 | |
| Other | |
| 120
|
|
| Total assets | | | 149,571,617 | |
| Liabilities | | | |
| Appreciated options written, at value (premiums received $176,600) | | | 38,970 | |
| Depreciated options written, at value (premiums received $5,896) | | | 9,600 | |
| Payables and other liabilities: | | | | |
| Futures margins | | | 2,009,558 | |
| Other | |
| 74,383
|
|
| Total liabilities | | | 2,132,511 | |
| Net Assets | | $
| 147,439,106
|
|
| Composition of Net Assets | | | |
| Par value of shares of beneficial interest | | $ | 40,000 | |
| Additional paid-in capital | | | 184,240,539 | |
| Accumulated net investment income | | | 30,925,946 | |
| Accumulated net realized loss on investments | | | (72,348,194 | ) |
| Net unrealized appreciation on investments | |
| 4,580,815
|
|
| Net Assets—applicable to 4,000,000 shares of beneficial interest outstanding | | $
| 147,439,106
|
|
| Net Asset Value, Redemption Price Per Share and Offering Price Per Share | | $ | 36.86 | |
See accompanying Notes to Financial Statements.
| | | | |
| OPPENHEIMER COMMODITY STRATEGY TOTAL RETURN FUND | | | 57 | |
RAF FUND LTD. (the “SUBSIDIARY”)
STATEMENT OF OPERATIONS For the Year Ended December 31, 2012
| | | | |
| Investment Income | | | |
| Interest | | $ | 539,079 | |
| Dividends from affiliated companies | |
| 135,382
|
|
| Total investment income | | | 674,461 | |
| Expenses | | | |
| Management fees | | | 1,979,737 | |
| Directors’ compensation | | | 12,500 | |
| Custodian fees and expenses | | | 1,189 | |
| Other | |
| 39,785
|
|
| Total expenses | | | 2,033,211 | |
| Less waivers and reimbursements of expenses | |
| (59,370
| )
|
| Net expenses | | | 1,973,841 | |
| Net Investment Loss | | | (1,299,380 | ) |
| Realized and Unrealized Gain (Loss) | | | |
| Net realized gain (loss) on: | | | | |
| Investments from unaffiliated companies (including premiums on options exercised) | | | 886,827 | |
| Closing and expiration of option contracts written | | | 393,094 | |
| Closing and expiration of futures contracts | |
| (24,020,856
| )
|
| Net realized loss | | | (22,740,935 | ) |
| Net change in unrealized appreciation/depreciation on: | | | | |
| Investments | | | (1,087,093 | ) |
| Futures contracts | | | 12,146,550 | |
| Option contracts written | |
| (6,771
| )
|
| Net change in unrealized appreciation/depreciation | | | 11,052,686 | |
| Net Decrease in Net Assets Resulting from Operations | | $
| (12,987,629
| )
|
See accompanying Notes to Financial Statements.
| | |
| 58 | | OPPENHEIMER COMMODITY STRATEGY TOTAL RETURN FUND |
RAF FUND LTD. (the “SUBSIDIARY”)
STATEMENTS OF CHANGES IN NET ASSETS
| | | | | | | | |
| | | Year Ended
December 31,
2012 | | | Year Ended
December 30,
20111 | |
| Operations | | | | | | |
| Net investment loss | | $ | (1,299,380 | ) | | $ | (2,590,994 | ) |
| Net realized gain (loss) | | | (22,740,935 | ) | | | 51,244,990 | |
| Net change in unrealized appreciation/depreciation | |
| 11,052,686
|
| |
| (42,574,654
| )
|
| Net increase (decrease) in net assets resulting from operations | | | (12,987,629 | ) | | | 6,079,342 | |
| Capital Transactions | | | | | | |
| Net decrease in net assets resulting from capital transactions | | | (98,000,000 | ) | | | (175,000,000 | ) |
| Net Assets | | | | | | |
| Total decrease | | | (110,987,629 | ) | | | (168,920,658 | ) |
| Beginning of period | |
| 258,426,735
|
| |
| 427,347,393
|
|
| End of period (including accumulated net investment income of $30,925,946 and $32,225,326, respectively) | | $
| 147,439,106
|
| | $
| 258,426,735
|
|
1. December 30, 2011 represents the last business day of the Fund’s 2011 fiscal year. See Note 1 of the accompanying Notes.
See accompanying Notes to Financial Statements.
| | | | |
| OPPENHEIMER COMMODITY STRATEGY TOTAL RETURN FUND | | | 59 | |
RAF FUND LTD. (the “SUBSIDIARY”)
NOTES TO FINANCIAL STATEMENTS
1. Significant Accounting Policies
RAF Fund Ltd. (the “Fund”) is organized as a Cayman Islands Company Limited by Shares. The Fund intends to carry on the business of an investment company and to acquire, invest in and hold by way of investment, sell and deal in commodities and interests therein including futures contracts, options and forward contracts, shares, stocks, call options, put options, debenture stock, bonds, obligations, certificates of deposit, bills of exchange and securities of all kinds. The Fund’s investment adviser is OppenheimerFunds, Inc. (the “Manager”). The Sub-Adviser is Oppenheimer Real Asset Management, Inc. (“ORAMI” or the “Sub-Adviser”), a wholly-owned subsidiary of the Manager. As of December 31, 2012, 100% of the Fund was owned by Oppenheimer Commodity Strategy Total Return Fund (“OCSTRF”). The Manager is also the investment adviser of OCSTRF and ORAMI is also the Sub-Adviser of OCSTRF.
The beneficial interest of each investor in the Fund is represented by units of participating shares. The Fund’s directors may further designate classes of participating shares and series within each class. As of December 31, 2012, the directors have not designated classes or series of outstanding participating shares. During the year ended December 31, 2012, all income, profits, losses and expenses, if any, of the Fund were allocated pro rata to all participating shares of the Fund. Issuance of additional participating shares is at the discretion of the Fund’s directors.
The following is a summary of significant accounting policies consistently followed by the Fund.
Previous Annual Period. The last day of the Fund’s fiscal year was the last day the New York Stock Exchange was open for trading. The Fund’s financial statements have been presented through that date to maintain consistency with the Fund’s net asset value calculations used for shareholder transactions.
Credit Risk. The Fund invests in high-yield, non-investment-grade bonds, which may be subject to a greater degree of credit risk. Credit risk relates to the ability of the issuer to meet interest or principal payments or both as they become due. The Fund may acquire securities that have missed an interest payment, and is not obligated to dispose of securities whose issuers or underlying obligors subsequently miss an interest payment. Information concerning securities not accruing interest as of December 31, 2012 is as follows:
| | | | |
| Cost | | $ | 82,949 | |
| Market Value | | $ | 19,187 | |
| Market Value as a % of Net Assets | | | 0.01 | % |
Investment in Oppenheimer Institutional Money Market Fund. The Fund is permitted to invest daily available cash balances in an affiliated money market fund. The Fund may invest the available cash in Class E shares of Oppenheimer Institutional Money Market Fund (“IMMF”) to seek current income while preserving liquidity. IMMF is a registered open-end management investment company, regulated as a money market fund under the Investment Company Act of 1940, as amended. The Manager is also the investment adviser of IMMF. When applicable, the Fund’s investment in IMMF is included in the
| | |
| 60 | | OPPENHEIMER COMMODITY STRATEGY TOTAL RETURN FUND |
Statement of Investments. Shares of IMMF are valued at their net asset value per share. As a shareholder, the Fund is subject to its proportional share of IMMF’s Class E expenses, including its management fee. The Manager will waive fees and/or reimburse Fund expenses in an amount equal to the indirect management fees incurred through the Fund’s investment in IMMF.
Income Taxes. The Fund has received an undertaking from the Government of the Cayman Islands exempting it from all local income, profits and capital gains taxes through June of 2026. No such taxes are levied in the Cayman Islands at the present time. The Fund is a Controlled Foreign Corporation under U.S. tax laws and as such is not subject to U.S. income tax. Therefore, the Fund is not required to record a tax provision.
Dividends and Distributions to Shareholders. Dividends and distributions to shareholders, if any, are declared and paid annually from the Fund’s tax basis earnings and profits. Distributions are recorded on ex-dividend date.
Investment Income. Dividend income is recorded on the ex-dividend date or upon ex-dividend notification in the case of certain foreign dividends where the ex-dividend date may have passed. Non-cash dividends included in dividend income, if any, are recorded at the fair market value of the securities received. Interest income is recognized on an accrual basis. Discount and premium, which are included in interest income on the Statement of Operations, are amortized or accreted daily.
Custodian Fees. “Custodian fees and expenses” in the Statement of Operations may include interest expense incurred by the Fund on any cash overdrafts of its custodian account during the period. Such cash overdrafts may result from the effects of failed trades in portfolio securities and from cash outflows resulting from unanticipated shareholder redemption activity. The Fund pays interest to its custodian on such cash overdrafts, to the extent they are not offset by positive cash balances maintained by the Fund, at a rate equal to the Federal Funds Rate plus 0.50%. The “Reduction to custodian expenses” line item, if applicable, represents earnings on cash balances maintained by the Fund during the period. Such interest expense and other custodian fees may be paid with these earnings.
Security Transactions. Security transactions are recorded on the trade date. Realized gains and losses on securities sold are determined on the basis of identified cost.
Indemnifications. The Fund’s organizational documents provide current and former trustees and officers with a limited indemnification against liabilities arising in connection with the performance of their duties to the Fund. In the normal course of business, the Fund may also enter into contracts that provide general indemnifications. The Fund’s maximum exposure under these arrangements is unknown as this would be dependent on future claims that may be made against the Fund. The risk of material loss from such claims is considered remote.
Other. The preparation of financial statements in conformity with accounting principles generally accepted in the United States of America requires management to make
| | | | |
| OPPENHEIMER COMMODITY STRATEGY TOTAL RETURN FUND | | | 61 | |
RAF FUND LTD. (the “SUBSIDIARY”)
NOTES TO FINANCIAL STATEMENTS Continued
1. Significant Accounting Policies Continued
estimates and assumptions that affect the reported amounts of assets and liabilities and disclosure of contingent assets and liabilities at the date of the financial statements and the reported amounts of increases and decreases in net assets from operations during the reporting period. Actual results could differ from those estimates.
2. Securities Valuation
The Fund calculates the net asset value of its shares as of the close of the New York Stock Exchange (the “Exchange”), normally 4:00 P.M. Eastern time, on each day the Exchange is open for trading.
The Fund’s Board has adopted procedures for the valuation of the Fund’s securities and has delegated the day-to-day responsibility for valuation determinations under those procedures to the Manager. The Manager has established a Valuation Committee which is responsible for determining a “fair valuation” for any security for which market quotations are not “readily available.” The Valuation Committee’s fair valuation determinations are subject to review, approval and ratification by the Fund’s Board at its next regularly scheduled meeting covering the calendar quarter in which the fair valuation was determined.
Valuation Methods and Inputs
Securities are valued using unadjusted quoted market prices, when available, as supplied primarily by third party pricing services or dealers.
The following methodologies are used to determine the market value or the fair value of the types of securities described below:
Securities traded on a registered U.S. securities exchange (including exchange-traded derivatives other than futures and futures options) are valued based on the last sale price of the security reported on the principal exchange on which it is traded, prior to the time when the Fund’s assets are valued. In the absence of a sale, the security is valued at the last sale price on the prior trading day, if it is within the spread of the current day’s closing “bid” and “asked” prices, and if not, at the current day’s closing bid price. A security of a foreign issuer traded on a foreign exchange but not listed on a registered U.S. securities exchange is valued based on the last sale price on the principal exchange on which the security is traded, as identified by the third party pricing service used by the Manager, prior to the time when the Fund’s assets are valued. If the last sale price is unavailable, the security is valued at the most recent official closing price on the principal exchange on which it is traded. If the last sales price or official closing price for a foreign security is not available, the security is valued at the mean between the bid and asked price per the exchange or, if not available from the exchange, obtained from two dealers. If bid and asked prices are not available from either the exchange or two dealers, the security is valued by using one of the following methodologies (listed in order of priority); (1) using a bid from the exchange, (2) the mean between the bid and asked price as provided by a single dealer, or (3) a bid from a single dealer.
| | |
| 62 | | OPPENHEIMER COMMODITY STRATEGY TOTAL RETURN FUND |
Shares of a registered investment company that are not traded on an exchange are valued at that investment company’s net asset value per share.
Corporate and government debt securities (of U.S. or foreign issuers) and municipal debt securities, event-linked bonds, loans, mortgage-backed securities, collateralized mortgage obligations, and asset-backed securities are valued at the mean between the “bid” and “asked” prices utilizing evaluated prices obtained from third party pricing services or broker-dealers who may use matrix pricing methods to determine the evaluated prices.
Short-term money market type debt securities with a remaining maturity of sixty days or less are valued at cost adjusted by the amortization of discount or premium to maturity (amortized cost), which approximates market value. Short-term debt securities with a remaining maturity in excess of sixty days are valued at the mean between the “bid” and “asked” prices utilizing evaluated prices obtained from third party pricing services or broker-dealers.
Futures contracts and futures options traded on a commodities or futures exchange will be valued at the final settlement price or official closing price on the principal exchange as reported by such principal exchange at its trading session ending at, or most recently prior to, the time when the Fund’s assets are valued.
A description of the standard inputs that may generally be considered by the third party pricing vendors in determining their evaluated prices is provided below.
| | |
| Security Type | | Standard inputs generally considered by third-party pricing vendors |
| Corporate debt, government debt, municipal, mortgage-backed and asset-backed securities | | Reported trade data, broker-dealer price quotations, benchmark yields, issuer spreads on comparable securities, the credit quality, yield, maturity, and other appropriate factors. |
| Loans | | Information obtained from market participants regarding reported trade data and broker-dealer price quotations. |
| Event-linked bonds | | Information obtained from market participants regarding reported trade data and broker-dealer price quotations. |
If a market value or price cannot be determined for a security using the methodologies described above, or if, in the “good faith” opinion of the Manager, the market value or price obtained does not constitute a “readily available market quotation,” or a significant event has occurred that would materially affect the value of the security the security is fair valued either (i) by a standardized fair valuation methodology applicable to the security type or the significant event as previously approved by the Valuation Committee and the Fund’s Board or (ii) as determined in good faith by the Manager’s Valuation Committee. The Valuation Committee considers all relevant facts that are reasonably available, through either public information or information available to the Manager, when determining the fair value of a security. Fair value determinations by the Manager are subject to review, approval and ratification by the Fund’s Board at its next regularly scheduled meeting covering the calendar quarter in which the fair valuation was determined. Those fair valuation standardized methodologies include, but are not limited to, valuing securities at the last sale price or initially at cost and subsequently adjusting the value based on: changes in company specific fundamentals, changes in an appropriate securities index, or
| | | | |
| OPPENHEIMER COMMODITY STRATEGY TOTAL RETURN FUND | | | 63 | |
RAF FUND LTD. (the “SUBSIDIARY”)
NOTES TO FINANCIAL STATEMENTS Continued
2. Securities Valuation Continued
changes in the value of similar securities which may be further adjusted for any discounts related to security-specific resale restrictions. When possible, such methodologies use observable market inputs such as unadjusted quoted prices of similar securities, observable interest rates, currency rates and yield curves. The methodologies used for valuing securities are not necessarily an indication of the risks associated with investing in those securities nor can it be assured that the Fund can obtain the fair value assigned to a security if it were to sell the security.
To assess the continuing appropriateness of security valuations, the Manager, or its third party service provider who is subject to oversight by the Manager, regularly compares prior day prices, prices on comparable securities, and sale prices to the current day prices and challenges those prices exceeding certain tolerance levels with the third party pricing service or broker source. For those securities valued by fair valuations, whether through a standardized fair valuation methodology or a fair valuation determination, the Valuation Committee reviews and affirms the reasonableness of the valuations based on such methodologies and fair valuation determinations on a regular basis after considering all relevant information that is reasonably available.
Classifications
Each investment asset or liability of the Fund is assigned a level at measurement date based on the significance and source of the inputs to its valuation. Various data inputs are used in determining the value of each of the Fund’s investments as of the reporting period end. These data inputs are categorized in the following hierarchy under applicable financial accounting standards:
| 1) | | Level 1—unadjusted quoted prices in active markets for identical assets or liabilities (including securities actively traded on a securities exchange) |
| 2) | | Level 2—inputs other than unadjusted quoted prices that are observable for the asset or liability (such as unadjusted quoted prices for similar assets and market corroborated inputs such as interest rates, prepayment speeds, credit risks, etc.) |
| 3) | | Level 3—significant unobservable inputs (including the Manager’s own judgments about assumptions that market participants would use in pricing the asset or liability). |
The inputs used for valuing securities are not necessarily an indication of the risks associated with investing in those securities.
| | |
| 64 | | OPPENHEIMER COMMODITY STRATEGY TOTAL RETURN FUND |
The table below categorizes amounts that are included in the Fund’s Statement of Assets and Liabilities as of December 31, 2012 based on valuation input level:
| | | | | | | | | | | | | | | | | | | | |
| | | Level 1—
Unadjusted
Quoted Prices | | Level 2—
Other Significant
Observable Inputs | | Level 3— Significant
Unobservable
Inputs | | Value |
| Assets Table | | | | | | | | | | | | | | | | | | | | |
| Investments, at Value: | | | | | | | | | | | | | | | | | | | | |
| Mortgage-Backed Obligations | | | $ | — | | | | $ | — | | | | $ | 19,187 | | | | $ | 19,187 | |
| U.S. Government Obligations | | | | — | | | | | 86,832,093 | | | | | — | | | | | 86,832,093 | |
| Short-Term Notes | | | | — | | | | | 14,472,675 | | | | | — | | | | | 14,472,675 | |
| Options Purchased | | | | 76,740 | | | | | — | | | | | — | | | | | 76,740 | |
| Investment Company | | | | 43,436,000 | | | | | — | | | | | — | | | | | 43,436,000 | |
| | | |
|
|
| | |
|
|
| | |
|
|
| | |
|
|
|
| Total Investments, at Value | | | | 43,512,740 | | | | | 101,304,768 | | | | | 19,187 | | | | | 144,836,695 | |
| Other Financial Instruments: | | | | | | | | | | | | | | | | | | | | |
| Futures margins | | | | 4,238,838 | | | | | 131,074 | | | | | — | | | | | 4,369,912 | |
| | | |
|
|
| | |
|
|
| | |
|
|
| | |
|
|
|
| Total Assets | | | $ | 47,751,578 | | | | $ | 101,435,842 | | | | $ | 19,187 | | | | $ | 149,206,607 | |
| | | |
|
|
| | |
|
|
| | |
|
|
| | |
|
|
|
| | | | |
| Liabilities Table | | | | | | | | | | | | | | | | | | | | |
| Other Financial Instruments: | | | | | | | | | | | | | | | | | | | | |
| Appreciated options written, at value | | | $ | (38,970 | ) | | | $ | — | | | | $ | — | | | | $ | (38,970 | ) |
| Depreciated options written, at value | | | | (9,600 | ) | | | | — | | | | | — | | | | | (9,600 | ) |
| Futures margins | | | | (2,009,558 | ) | | | | — | | | | | — | | | | | (2,009,558 | ) |
| | | |
|
|
| | |
|
|
| | |
|
|
| | |
|
|
|
| Total Liabilities | | | $ | (2,058,128 | ) | | | $ | — | | | | $ | — | | | | $ | (2,058,128 | ) |
| | | |
|
|
| | |
|
|
| | |
|
|
| | |
|
|
|
Currency contracts and forwards, if any, are reported at their unrealized appreciation/depreciation at measurement date, which represents the change in the contract’s value from trade date. Futures, if any, are reported at their variation margin at measurement date, which represents the amount due to/from the Fund at that date. All additional assets and liabilities included in the above table are reported at their market value at measurement date.
The table below shows the transfers between Level 2 and Level 3. The Fund’s policy is to recognize transfers in and transfers out as of the beginning of the reporting period.
| | | | | | | | |
| | | Transfers out of
Level 2* | | | Transfers into
Level 3* | |
| Assets Table | | | | | | | | |
| Investments, at Value: | | | | | | | | |
| Mortgage-Backed Obligations | | $ | (21,586 | ) | | $ | 21,586 | |
* Transferred from Level 2 to Level 3 because of the lack of observable market data.
There have been no significant changes to the fair valuation methodologies of the Fund during the period.
3. Capital Transactions
The Fund has authorized 5,000,000 participating shares of $0.01 par value per share. The Fund issued 4,000,000 participating shares for $500,000 on August 15, 2006 in conjunction with OCSTRF’s initial capitalization of the Fund. All subsequent capital contributions and withdrawals did not have participating shares associated with the transaction.
| | | | |
| OPPENHEIMER COMMODITY STRATEGY TOTAL RETURN FUND | | | 65 | |
RAF FUND LTD. (the “SUBSIDIARY”)
NOTES TO FINANCIAL STATEMENTS Continued
3. Capital Transactions Continued
Capital transactions were as follows:
| | | | | | | | |
| | | Year Ended
December 31, 2012 | | | Year Ended
December 30, 2011 | |
| Contributions | | $ | 25,000,000 | | | $ | — | |
| Withdrawals | | | (123,000,000 | ) | | | (175,000,000 | ) |
| | |
|
|
|
| Net decrease | | $ | (98,000,000 | ) | | $ | (175,000,000 | ) |
| | |
|
|
|
4. Expenses
Management Fees. Under the investment advisory agreement, the Fund pays the Manager a management fee based on the daily net assets of the Fund at an annual rate as shown in the following table:
| | | | |
| Fee Schedule | | | |
| Up to $200 million | | | 1.00 | % |
| Next $200 million | | | 0.90 | |
| Next $200 million | | | 0.85 | |
| Next $200 million | | | 0.80 | |
| Over $800 million | | | 0.75 | |
Sub-Adviser Fees. The Manager retains the Sub-Adviser to provide the day-to-day portfolio management of the Fund. Under the Sub-Advisory Agreement, the Manager pays the Sub-Adviser a fee in monthly installments, based on the daily net assets of the Fund at an annual rate as shown in the following table:
| | | | |
| Fee Schedule | | | |
| Up to $200 million | | | 0.500 | % |
| Next $200 million | | | 0.450 | |
| Next $200 million | | | 0.425 | |
| Next $200 million | | | 0.400 | |
| Over $800 million | | | 0.375 | |
The Fund shall bear all fees and expenses related to the business and affairs of the Fund, including among others, directors’ fees, audit fees, custodian fees and expenses in connection with the purchase and sale of securities and other Fund assets.
Waivers and Reimbursements of Expenses. The Manager will waive fees and/or reimburse Fund expenses in an amount equal to the indirect management fees incurred through the Fund’s investments in IMMF. During the year ended December 31, 2012, the Manager waived fees and/or reimbursed the Fund $59,370 for management fees.
Some of these undertakings may be modified or terminated at any time.
5. Risk Exposures and the Use of Derivative Instruments
The Fund’s investment objectives not only permit the Fund to purchase investment securities, they also allow the Fund to enter into various types of derivatives contracts, including, but not limited to, futures contracts, forward foreign currency exchange contracts, credit default swaps, interest rate swaps, total return swaps, and purchased and written options. In doing so, the Fund will employ strategies in differing combinations to
| | |
| 66 | | OPPENHEIMER COMMODITY STRATEGY TOTAL RETURN FUND |
permit it to increase, decrease, or change the level or types of exposure to market risk factors. Central to those strategies are features inherent to derivatives that make them more attractive for this purpose than equity and debt securities: they require little or no initial cash investment, they can focus exposure on only certain selected risk factors, and they may not require the ultimate receipt or delivery of the underlying security (or securities) to the contract. This may allow the Fund to pursue its objectives more quickly and efficiently than if it were to make direct purchases or sales of securities capable of effecting a similar response to market factors.
Market Risk Factors. In accordance with its investment objectives, the Fund may use derivatives to increase or decrease its exposure to one or more of the following market risk factors:
Commodity Risk. Commodity risk relates to the change in value of commodities or commodity indexes as they relate to increases or decreases in the commodities market. Commodities are physical assets that have tangible properties. Examples of these types of assets are crude oil, heating oil, metals, livestock, and agricultural products.
Credit Risk. Credit risk relates to the ability of the issuer to meet interest and principal payments, or both, as they come due. In general, lower-grade, higher-yield bonds are subject to credit risk to a greater extent than lower-yield, higher-quality bonds.
Equity Risk. Equity risk relates to the change in value of equity securities as they relate to increases or decreases in the general market.
Foreign Exchange Rate Risk. Foreign exchange rate risk relates to the change in the U.S. dollar value of a security held that is denominated in a foreign currency. The U.S. dollar value of a foreign currency denominated security will decrease as the dollar appreciates against the currency, while the U.S. dollar value will increase as the dollar depreciates against the currency.
Interest Rate Risk. Interest rate risk refers to the fluctuations in value of fixed-income securities resulting from the inverse relationship between price and yield. For example, an increase in general interest rates will tend to reduce the market value of already issued fixed-income investments, and a decline in general interest rates will tend to increase their value. In addition, debt securities with longer maturities, which tend to have higher yields, are subject to potentially greater fluctuations in value from changes in interest rates than obligations with shorter maturities.
Volatility Risk. Volatility risk refers to the magnitude of the movement, but not the direction of the movement, in a financial instrument’s price over a defined time period. Large increases or decreases in a financial instrument’s price over a relative time period typically indicate greater volatility risk, while small increases or decreases in its price typically indicate lower volatility risk.
The Fund’s actual exposures to these market risk factors during the period are discussed in further detail, by derivative type, below.
Risks of Investing in Derivatives. The Fund’s use of derivatives can result in losses due to unanticipated changes in the market risk factors and the overall market. In instances where
| | | | |
| OPPENHEIMER COMMODITY STRATEGY TOTAL RETURN FUND | | | 67 | |
RAF FUND LTD. (the “SUBSIDIARY”)
NOTES TO FINANCIAL STATEMENTS Continued
5. Risk Exposures and the Use of Derivative Instruments Continued
the Fund is using derivatives to decrease, or hedge, exposures to market risk factors for securities held by the Fund, there are also risks that those derivatives may not perform as expected resulting in losses for the combined or hedged positions.
Derivatives may have little or no initial cash investment relative to their market value exposure and therefore can produce significant gains or losses in excess of their cost. This use of embedded leverage allows the Fund to increase its market value exposure relative to its net assets and can substantially increase the volatility of the Fund’s performance.
Additional associated risks from investing in derivatives also exist and potentially could have significant effects on the valuation of the derivative and the Fund. Typically, the associated risks are not the risks that the Fund is attempting to increase or decrease exposure to, per its investment objectives, but are the additional risks from investing in derivatives. Examples of these associated risks are liquidity risk, which is the risk that the Fund will not be able to sell the derivative in the open market in a timely manner, and counterparty credit risk, which is the risk that the counterparty will not fulfill its obligation to the Fund. Associated risks can be different for each type of derivative and are discussed by each derivative type in the notes that follow.
Valuations of derivative instruments as of December 31, 2012 are as follows:
| | | | | | | | | | | | | | | | |
| | | Asset Derivatives | | | | | Liability Derivatives | |
Derivatives Not
Accounted for as
Hedging Instruments | | Statement of Assets and
Liabilities Location | | | Value | | | | | Statement of Assets and
Liabilities Location | | Value | |
| Commodity contracts | | | Futures margins | | | $ | 4,369,912 | * | | | | Futures margins | | $ | 2,009,558 | * |
| Commodity contracts | | | | | | | | | | | | Appreciated options
written, at value | | | 38,970 | |
| Commodity contracts | | | | | | | | | | | | Depreciated options
written, at value | | | 9,600 | |
| Commodity contracts | | | Investments, at value | | | | 76,740 | ** | | | | | | | | |
| | | | | | |
|
|
| | | | | |
|
|
|
| Total | | | | | | $ | 4,446,652 | | | | | | | $ | 2,058,128 | |
| | | | | | |
|
|
| | | | | |
|
|
|
*Includes only the current day’s variation margin. Prior variation margin movements have been reflected in cash on the Statement of Assets and Liabilities upon receipt or payment.
**Amounts relate to purchased options.
The effect of derivative instruments on the Statement of Operations is as follows:
| | | | | | | | | | | | | | | | |
| Amount of Realized Gain or (Loss) Recognized on Derivatives | |
Derivatives
Not Accounted
for as Hedging
Instruments | | Investments
from unaffiliated
companies
(including
premiums on
options
exercised)* | | | Closing and
expiration
of option
contracts
written | | | Closing and
expiration
of futures
contracts | | | Total | |
| Commodity contracts | | $ | 651,037 | | | $ | 393,094 | | | $ | (24,020,856 | ) | | $ | (22,976,725 | ) |
*Includes purchased option contracts, purchased swaption contracts and written option contracts exercised, if any.
| | |
| 68 | | OPPENHEIMER COMMODITY STRATEGY TOTAL RETURN FUND |
| | | | | | | | | | | | | | | | |
| Amount of Change in Unrealized Gain or (Loss) Recognized on Derivatives | |
Derivatives
Not Accounted
for as Hedging
Instruments | | Investments* | | | Option
contracts
written | | | Futures
contracts | | | Total | |
| Commodity contracts | | $ | (615,931 | ) | | $ | (6,771 | ) | | $ | 12,146,550 | | | $ | 11,523,848 | |
*Includes purchased option contracts and purchased swaption contracts, if any.
Futures Contracts
A futures contract is a commitment to buy or sell a specific amount of a commodity or financial instrument at a negotiated price on a stipulated future date. The Fund may buy and sell futures contracts that relate to broadly based securities indices (financial futures), debt securities (interest rate futures) and various commodities (commodity index futures). The Fund may also buy or write put or call options on these futures contracts.
Futures contracts traded on a commodities or futures exchange will be valued at the final settlement price or official closing price on the principal exchange as reported by such principal exchange at its trading session ending at, or most recently prior to, the time when the Fund’s assets are valued.
Upon entering into a futures contract, the Fund is required to deposit either cash or securities (initial margin) in an amount equal to a certain percentage of the contract value. Subsequent payments (variation margin) are made or received by the Fund each day. The variation margin payments are equal to the daily changes in the contract value and are recorded as unrealized gains and losses.
Futures contracts are reported on a schedule following the Statement of Investments. Securities held in collateralized accounts to cover initial margin requirements on open futures contracts are noted in the Statement of Investments. Cash held by the broker to cover initial margin requirements on open futures contracts and the receivable and/or payable for the daily mark to market for variation margin are noted in the Statement of Assets and Liabilities. The net change in unrealized appreciation (depreciation) is reported in the Statement of Operations. Realized gains (losses) are reported in the Statement of Operations at the closing or expiration of futures contracts.
The Fund has purchased futures contracts, which have values that are linked to the price movement of the related commodities, in order to increase exposure to commodity risk.
The Fund has sold futures contracts, which have values that are linked to the price movement of the related commodities, in order to decrease exposure to commodity risk.
During the year ended December 31, 2012, the Fund had an ending monthly average market value of $537,671,325 and $68,011,377 on futures contracts purchased and sold, respectively.
Additional associated risks of entering into futures contracts (and related options) include the possibility that there may be an illiquid market where the Fund is unable to liquidate the contract or enter into an offsetting position and, if used for hedging purposes, the risk that the price of the contract will correlate imperfectly with the prices of the Fund’s securities.
| | | | |
| OPPENHEIMER COMMODITY STRATEGY TOTAL RETURN FUND | | | 69 | |
RAF FUND LTD. (the “SUBSIDIARY”)
NOTES TO FINANCIAL STATEMENTS Continued
5. Risk Exposures and the Use of Derivative Instruments Continued
Option Activity
The Fund may buy and sell put and call options, or write put and call options. When an option is written, the Fund receives a premium and becomes obligated to sell or purchase the underlying security at a fixed price, upon exercise of the option.
Options are valued daily based upon the last sale price on the principal exchange on which the option is traded. The difference between the premium received or paid, and market value of the option, is recorded as unrealized appreciation or depreciation. The net change in unrealized appreciation or depreciation is reported in the Statement of Operations. When an option is exercised, the cost of the security purchased or the proceeds of the security sale are adjusted by the amount of premium received or paid. Upon the expiration or closing of the option transaction, a gain or loss is reported in the Statement of Operations.
The Fund has purchased put options on individual commodities to decrease exposure to commodity risk. A purchased put option becomes more valuable as the price of the underlying financial instrument depreciates relative to the strike price.
The Fund has purchased call options on individual commodities to increase exposure to commodity risk. A purchased call option becomes more valuable as the price of the underlying financial instrument appreciates relative to the strike price.
During the year ended December 31, 2012, the Fund had an average market value of $340,065 and $74,052 on purchased call options and purchased put options, respectively.
Options written, if any, are reported in a schedule following the Statement of Investments and as a liability in the Statement of Assets and Liabilities. Securities held in collateralized accounts to cover potential obligations with respect to outstanding written options are noted in the Statement of Investments.
The risk in writing a call option is that the Fund gives up the opportunity for profit if the market price of the security or commodity increases and the option is exercised. The risk in writing a put option is that the Fund may incur a loss if the market price of the security or commodity decreases and the option is exercised. The risk in buying an option is that the Fund pays a premium whether or not the option is exercised. The Fund also has the additional risk that there may be an illiquid market where the Fund is unable to close the contract.
The Fund has written put options on individual commodities to increase exposure to commodity risk. A written put option becomes more valuable as the price of the underlying financial instrument appreciates relative to the strike price.
The Fund has written call options on individual commodities to decrease exposure to commodity risk. A written call option becomes more valuable as the price of the underlying financial instrument depreciates relative to the strike price.
During the year ended December 31, 2012, the Fund had an ending monthly average market value of $105,285 and $39,629 on written call options and written put options, respectively.
| | |
| 70 | | OPPENHEIMER COMMODITY STRATEGY TOTAL RETURN FUND |
Additional associated risks to the Fund include counterparty credit risk for over-the-counter options and liquidity risk.
Written option activity for the year ended December 31, 2012 was as follows:
| | | | | | | | | | | | | | | | |
| | | Call Options
| | | Put Options
| |
| | | Number of Contracts | | | Amount of Premiums | | | Number of
Contracts | | | Amount of Premiums | |
| Options outstanding as of | | | | | | | | | | | | | | | | |
| December 30, 2011 | | | — | | | $ | — | | | | 150 | | | $ | 166,197 | |
| Options written | | | 3,990 | | | | 1,541,592 | | | | 1,983 | | | | 678,647 | |
| Options closed or expired | | | (3,335 | ) | | | (1,408,097 | ) | | | (2,041 | ) | | | (786,763 | ) |
| Options exercised | | | (26 | ) | | | (9,080 | ) | | | — | | | | — | |
| | |
|
|
|
| Options outstanding as of | | | | | | | | | | | | | | | | |
| December 31, 2012 | | | 629 | | | $ | 124,415 | | | | 92 | | | $ | 58,081 | |
| | |
|
|
|
6. Restricted Securities
As of December 31, 2012, investments in securities included issues that are restricted. A restricted security may have a contractual restriction on its resale and is valued under methods approved by the Board of Directors as reflecting fair value. Securities that are restricted are marked with an applicable footnote on the Statement of Investments. Restricted securities are reported on a schedule following the Statement of Investments.
| | | | |
| OPPENHEIMER COMMODITY STRATEGY TOTAL RETURN FUND | | | 71 | |
RAF FUND LTD. (the “SUBSIDIARY”)
NOTES TO FINANCIAL STATEMENTS Continued
7. Financial Highlights
The following represents certain per share data and financial ratios of the Fund for the periods noted. The computation of the net investment income and total expense ratios was based upon the daily net assets of the Fund during these periods. Unless otherwise noted, the calculations have been annualized for reporting purposes:
| | | | | | | | | | | | | | | | | | | | |
| | | Year Ended
December 31,
2012 | | | Year Ended
December 30,
2011 | | | Year Ended
December 31,
2010 | | | Year Ended
December 31,
2009 | | | Year Ended
December 31,
2008 | |
| Per Share Operating Data | | | | | | | | | | | | | | | |
| Net asset value, beginning of period | | $ | 64.61 | | | $ | 106.84 | | | $ | 87.81 | | | $ | 56.61 | | | $ | 92.33 | |
| Income (loss) from investment operations: | | | | | | | | | | | | | | | | | | | | |
| Net investment income (loss) | | | (0.32 | ) | | | (0.65 | ) | | | (0.54 | ) | | | (0.07 | ) | | | 4.20 | |
| Net realized and unrealized gain (loss) | |
| (2.92
| )
| |
| 2.17
|
| |
| 23.82
|
| |
| 15.52
|
| |
| (82.92
| )
|
| Total from investment operations | | | (3.24 | ) | | | 1.52 | | | | 23.28 | | | | 15.45 | | | | (78.72 | ) |
| Capital Transactions | | | (24.51 | ) | | | (43.75 | ) | | | (4.25 | ) | | | 15.75 | | | | 43.00 | |
| Net asset value, end of period | | $
| 36.86
|
| | $
| 64.61
|
| | $
| 106.84
|
| | $
| 87.81
|
| | $
| 56.61
|
|
| Total Return, at Net Asset Value1 | | | (10.91 | )% | | | (1.65 | )% | | | 15.38 | % | | | 9.42 | % | | | (75.33 | )% |
| | | | | | | | | | | | | | | | | | | | | |
| Ratios to Average Net Assets: | | | | | | | | | | | | | | | |
| Net investment income (loss) | | | (0.65 | )% | | | (0.66 | )% | | | (0.62 | )% | | | (0.11 | )% | | | 4.22 | % |
| Total expenses | | | 1.01 | %2 | | | 0.96 | %2 | | | 0.97 | %2 | | | 0.99 | %2 | | | 0.96 | % |
| Expenses after payments, waivers and reimbursements | | | 0.98 | % | | | 0.96 | % | | | 0.94 | % | | | 0.93 | % | | | 0.96 | % |
1. The total return was calculated based upon the daily returns of the Fund during this period. The caculation has not been annualized for periods less than one full year.
2. Total expenses including indirect expenses from affiliated fund were as follows:
| | | | |
| Year Ended December 31, 2012 | | | 1.04 | % |
| Year Ended December 30, 2011 | | | 0.96 | % |
| Year Ended December 31, 2010 | | | 1.00 | % |
| Year Ended December 31, 2009 | | | 1.05 | % |
8. Subsequent Event
The Board of Trustees of the Fund recently approved a series of modifications to the Fund’s investment advisory and transfer agency arrangements in connection with internal corporate restructuring efforts at OppenheimerFunds, Inc. (“OFI”). As a result of these modifications, on January 1, 2013 (the “Effective Date”), OFI Global Asset Management, Inc. (“OFI Global”), a wholly-owned subsidiary of OFI, became the investment adviser and transfer agent to the Fund under the terms of the Fund’s advisory agreement and transfer agency agreement, respectively. OFI Global, in turn, entered into a new sub-advisory agreement for the Fund, on the Effective Date, whereby OFI Global will have oversight and supervisory responsibilities and OFI will choose the Fund’s investments and provide related advisory services to the Fund. As of the Effective Date, ORAMI will no longer be a
| | |
| 72 | | OPPENHEIMER COMMODITY STRATEGY TOTAL RETURN FUND |
sub-adviser to the Fund. In addition, on the Effective Date, OFI Global entered into a sub-transfer agency agreement with Shareholder Services, Inc. doing business as OppenheimerFunds Services, a wholly-owned subsidiary of OFI, under which it will be responsible for providing transfer agency services to the Fund.
The realignment of advisory service responsibility between OFI Global and OFI did not result in any change in the persons managing the assets of the Fund, the level or nature of the advisory services provided to the Fund, or the fees charged to the Fund.
9. Pending Litigation
Since 2009, a number of class action lawsuits have been pending in federal courts against OppenheimerFunds, Inc., the Fund’s Adviser through December 31, 2012 and Sub-Advisor effective January 1, 2013 (the “Manager”), OppenheimerFunds Distributor, Inc., the Fund’s principal underwriter and distributor (the “Distributor”), and certain funds (but not including the Fund) advised by the Manager and distributed by the Distributor (the “Defendant Funds”). Several of these lawsuits also name as defendants certain officers and current and former trustees of the respective Defendant Funds. The lawsuits raise claims under federal securities law and allege, among other things, that the disclosure documents of the respective Defendant Funds contained misrepresentations and omissions and that the respective Defendant Funds’ investment policies were not followed. The plaintiffs in these actions seek unspecified damages, equitable relief and awards of attorneys’ fees and litigation expenses. The Defendant Funds’ Boards of Trustees have also engaged counsel to represent the Funds and the present and former Independent Trustees named in those suits.
Other class action and individual lawsuits have been filed since 2008 in various state and federal courts against the Manager and certain of its affiliates by investors seeking to recover investments they allegedly lost as a result of the “Ponzi” scheme run by Bernard L. Madoff and his firm, Bernard L. Madoff Investment Securities, LLC (“BLMIS”). Plaintiffs in these suits allege that they suffered losses as a result of their investments in several funds managed by an affiliate of the Manager and assert a variety of claims, including breach of fiduciary duty, fraud, negligent misrepresentation, unjust enrichment, and violation of federal and state securities laws and regulations, among others. They seek unspecified damages, equitable relief and awards of attorneys’ fees and litigation expenses. Neither the Distributor, nor any of the Oppenheimer mutual funds, their independent trustees or directors are named as defendants in these lawsuits. None of the Oppenheimer mutual funds invested in any funds or accounts managed by Madoff or BLMIS. On February 28, 2011, a stipulation of partial settlement of three groups of consolidated putative class action lawsuits relating to these matters was filed in the U.S. District Court for the Southern District of New York. On August 19, 2011, the court entered an order and final judgment approving the settlement as fair, reasonable and adequate. In September 2011, certain parties filed notices of appeal from the court’s order approving the settlement. The settlement does not resolve other outstanding lawsuits against the Manager and its affiliates relating to BLMIS.
| | | | |
| OPPENHEIMER COMMODITY STRATEGY TOTAL RETURN FUND | | | 73 | |
RAF FUND LTD. (the “SUBSIDIARY”)
NOTES TO FINANCIAL STATEMENTS Continued
9. Pending Litigation Continued
On April 16, 2010, a lawsuit was filed in New York state court against the Manager, an affiliate of the Manager and AAArdvark IV Funding Limited (“AAArdvark IV”), an entity advised by the Manager’s affiliate, in connection with investments made by the plaintiffs in AAArdvark IV. Plaintiffs allege breach of contract against the defendants and seek compensatory damages, costs and disbursements, including attorney fees. On July 15, 2011, a lawsuit was filed in New York state court against the Manager, an affiliate of the Manager and AAArdvark Funding Limited (“AAArdvark I”), an entity advised by the Manager’s affiliate, in connection with investments made by the plaintiffs in AAArdvark I. The complaint alleges breach of contract against the defendants and seeks compensatory damages, costs and disbursements, including attorney fees. On November 9, 2011, a lawsuit was filed in New York state court against the Manager, an affiliate of the Manager and AAArdvark XS Funding Limited (“AAArdvark XS”), an entity advised by the Manager’s affiliate, in connection with investments made by the plaintiffs in AAArdvark XS. The complaint alleges breach of contract against the defendants and seeks compensatory damages, costs and disbursements, including attorney fees.
The Manager believes the lawsuits and appeals described above are without legal merit and, with the exception of actions it has settled, is defending against them vigorously. While it is premature to render any opinion as to the outcome in these lawsuits, or whether any costs that the Defendant Funds may bear in defending the suits might not be reimbursed by insurance, the Manager believes that these suits should not impair the ability of the Manager or the Distributor to perform their respective duties to the Fund, and that the outcome of all of the suits together should not have any material effect on the operations of any of the Oppenheimer mutual funds.
| | |
| 74 | | OPPENHEIMER COMMODITY STRATEGY TOTAL RETURN FUND |
RAF FUND LTD. (the “SUBSIDIARY”)
INDEPENDENT AUDITORS’ REPORT
The Board of Directors RAF Fund, Ltd.:
We have audited the accompanying financial statements of RAF Fund Ltd., which comprise the statement of assets and liabilities, including the statement of investments, as of December 31, 2012, and the related statement of operations for the year then ended, the statements of changes in net assets for each of the years in the two-year period then ended, the financial highlights for each of the years in the four-year period then ended, and the related notes to the financial statements.
Management’s Responsibility for the Financial Statements
Management is responsible for the preparation and fair presentation of these financial statements in accordance with U.S. generally accepted accounting principles; this includes the design, implementation, and maintenance of internal control relevant to the preparation and fair presentation of financial statements that are free from material misstatement, whether due to fraud or error.
Auditors’ Responsibility
Our responsibility is to express an opinion on these financial statements based on our audits. We conducted our audits in accordance with auditing standards generally accepted in the United States of America. Those standards require that we plan and perform the audit to obtain reasonable assurance about whether the financial statements are free from material misstatement.
An audit involves performing procedures to obtain audit evidence about the amounts and disclosures in the financial statements. The procedures selected depend on the auditors’ judgment, including the assessment of the risks of material misstatement of the financial statements, whether due to fraud or error. In making those risk assessments, the auditor considers internal control relevant to the entity’s preparation and fair presentation of the financial statements in order to design audit procedures that are appropriate in the circumstances, but not for the purpose of expressing an opinion on the effectiveness of the entity’s internal control. Accordingly, we express no such opinion. An audit also includes evaluating the appropriateness of accounting policies used and the reasonableness of significant accounting estimates made by management, as well as evaluating the overall presentation of the financial statements.
We believe that the audit evidence we have obtained is sufficient and appropriate to provide a basis for our audit opinion.
Opinion
In our opinion, the financial statements referred to above present fairly in all material respects, the financial position of RAF Fund Ltd. as of December 31, 2012, the results of its
| | | | |
| OPPENHEIMER COMMODITY STRATEGY TOTAL RETURN FUND | | | 75 | |
RAF FUND LTD. (the “SUBSIDIARY”)
INDEPENDENT AUDITORS’ REPORT Continued
operations for the year then ended, the changes in its net assets for each of the years in the two-year period then ended, and its financial highlights for each of the years in the four-year period then ended, in accordance with U.S. generally accepted accounting principles.
Other Matter
The accompanying financial highlights of RAF Fund Ltd. for the year ended December 31, 2008 were audited by other auditors whose report thereon dated February 11, 2009, expressed an unmodified opinion on those financial statements.
KPMG LLP
Denver, Colorado
February 19, 2013
| | |
| 76 | | OPPENHEIMER COMMODITY STRATEGY TOTAL RETURN FUND |
PRIVACY POLICY
As an Oppenheimer fund shareholder, you are entitled to know how we protect your personal information and how we limit its disclosure.
Information Sources
We obtain nonpublic personal information about our shareholders from the following sources:
| l | | Applications or other forms |
| l | | When you create a user ID and password for online account access |
| l | | When you enroll in eDocs Direct, our electronic document delivery service |
| l | | Your transactions with us, our affiliates or others |
| l | | A software program on our website, often referred to as a “cookie,” which indicates which parts of our site you’ve visited |
| l | | When you set up challenge questions to reset your password online |
If you visit oppenheimerfunds.com and do not log on to the secure account information areas, we do not obtain any personal information about you. When you do log on to a secure area, we do obtain your user ID and password to identify you. We also use this information to provide you with products and services you have requested, to inform you about products and services that you may be interested in and assist you in other ways.
We do not collect personal information through our website unless you willingly provide it to us, either directly by email or in those areas of the website that request information. In order to update your personal information (including your mailing address, email address and phone number) you must first log on and visit your user profile.
If you have set your browser to warn you before accepting cookies, you will receive the warning message with each cookie. You can refuse cookies by turning them off in your browser. However, doing so may limit your access to certain sections of our website.
We use cookies to help us improve and manage our website. For example, cookies help us recognize new versus repeat visitors to the site, track the pages visited, and enable some special features on the website. This data helps us provide a better service for our website visitors.
Protection of Information
We do not disclose any non-public personal information (such as names on a customer list) about current or former customers to anyone, except as permitted by law.
Disclosure of Information
We send your financial advisor (as designated by you) copies of confirmations, account statements and other documents reporting activity in your fund accounts. We may also use details about you and your investments to help us, our financial service affiliates, or firms that jointly market their financial products and services with ours, to better serve your investment needs or suggest financial services or educational material that may be of interest to you. If this requires us to provide you with an opportunity to “opt in” or “opt out” of such information sharing with a firm not affiliated with us, you will receive notification on how to do so, before any such sharing takes place.
Right of Refusal
We will not disclose your personal information to unaffiliated third parties (except as permitted by law), unless we first offer you a reasonable opportunity to refuse or “opt out” of such disclosure.
Internet Security and Encryption
In general, the email services provided by our website are encrypted and provide a secure and private means of communication with us. To protect your own privacy, confidential and/or personal information should only be communicated via email when you are advised that you are using a secure website.
| | | | |
| OPPENHEIMER COMMODITY STRATEGY TOTAL RETURN FUND | | | 77 | |
PRIVACY POLICY
As a security measure, we do not include personal or account information in non-secure emails, and we advise you not to send such information to us in non-secure emails. Instead, you may take advantage of the secure features of our website to encrypt your email correspondence. To do this, you will need to use a browser that supports Secure Sockets Layer (SSL) protocol.
We do not guarantee or warrant that any part of our website, including files available for download, are free of viruses or other harmful code. It is your responsibility to take appropriate precautions, such as use of an anti-virus software package, to protect your computer hardware and software.
| l | | All transactions, including redemptions, exchanges and purchases, are secured by SSL and 128-bit encryption. SSL is used to establish a secure connection between your PC and OppenheimerFunds’ server. It transmits information in an encrypted and scrambled format. |
| l | | Encryption is achieved through an electronic scrambling technology that uses a “key” to code and then decode the data. Encryption acts like the cable converter box you may have on your television set. It scrambles data with a secret code so that no one can make sense of it while it is being transmitted. When the data reaches its destination, the same software unscrambles the data. |
| l | | You can exit the secure area by either closing your browser, or for added security, you can use the Log Out button before you close your browser. |
Other Security Measures
We maintain physical, electronic and procedural safeguards to protect your personal account information. Our employees and agents have access to that information only so that they may offer you products or provide services, for example, when responding to your account questions.
How You Can Help
You can also do your part to keep your account information private and to prevent unauthorized transactions. If you obtain a user ID and password for your account, do not allow it to be used by anyone else. Also, take special precautions when accessing your account on a computer used by others.
Who We Are
This joint notice describes the privacy policies of the Oppenheimer funds, OppenheimerFunds, Inc., and each of its financial institution subsidiaries, the trustee of OppenheimerFunds Individual Retirement Accounts (IRAs) and the custodian of the OppenheimerFunds 403(b)(7) tax sheltered custodial accounts. It applies to all Oppenheimer fund accounts you presently have, or may open in the future, using your Social Security number—whether or not you remain a shareholder of our funds. This notice was last updated November 2012. In the event it is updated or changed, we will post an updated notice on our website at oppenheimerfunds.com. If you have any questions about these privacy policies, write to us at P.O. Box 5270, Denver, CO 80217-5270, email us by clicking on the Contact Us section of our website at oppenheimerfunds.com or call us at 1.800.CALL OPP (225.5677).
| | |
| 78 | | OPPENHEIMER COMMODITY STRATEGY TOTAL RETURN FUND |
Visit us at oppenheimerfunds.com for 24-hr access to account information and transactions or call us at 1.800. CALL OPP (1.800.225.5677) for 24-hr automated information and automated transactions. Representatives also available Mon-Fri 8am-8pm ET.
RA0735.001.1212 February 22, 2013

The registrant has adopted a code of ethics that applies to the registrant’s principal executive officer, principal financial officer, principal accounting officer or controller or persons performing similar functions.
| Item 3. | Audit Committee Financial Expert. |
The Board of Trustees of the registrant has determined that F. William Marshall, Jr., the Chairman of the Board’s Audit Committee, is the audit committee financial expert and that Mr. Marshall is “independent” for purposes of this Item 3.
| Item 4. | Principal Accountant Fees and Services. |
The principal accountant for the audit of the registrant’s annual financial statements billed $42,100 in fiscal 2012 and $45,000 in fiscal 2011.
The principal accountant for the audit of the registrant’s annual financial statements billed no such fees in fiscal 2012 and no such fees in fiscal 2011.
The principal accountant for the audit of the registrant’s annual financial statements billed $264,139 in fiscal 2012 and $414,870 in fiscal 2011 to the registrant’s investment adviser or any entity controlling, controlled by, or under common control with the adviser that provides ongoing services to the registrant.
Such services include: Internal control reviews, compliance procedures, GIPS attestation procedures, internal audit training, surprise exams, and system conversion testing.
The principal accountant for the audit of the registrant’s annual financial statements billed no such fees in fiscal 2012 and $1,200 in fiscal 2011.
The principal accountant for the audit of the registrant’s annual financial statements billed $451,924 in fiscal 2012 and no such fees in fiscal 2011 to the registrant’s investment adviser or any entity controlling, controlled by, or under common control with the adviser that provides ongoing services to the registrant.
Such services include: tax compliance, tax planning and tax advice. Tax compliance generally involves preparation of original and amended tax returns, claims for a refund and tax payment-planning services. Tax planning and tax advice includes assistance with tax audits and appeals, tax advice related to mergers and acquisitions and requests for rulings or technical advice from taxing authorities.
The principal accountant for the audit of the registrant’s annual financial statements billed no such fees in fiscal 2012 and no such fees in fiscal 2011.
The principal accountant for the audit of the registrant’s annual financial statements billed no such fees in fiscal 2012 and no such fees in fiscal 2011 to the registrant’s investment adviser or any entity controlling, controlled by, or under common control with the adviser that provides ongoing services to the registrant.
Such fees would include the cost to the principal accountant of attending audit committee meetings and consultations regarding the registrant’s retirement plan with respect to its Trustees.
| (e) | (1) During its regularly scheduled periodic meetings, the registrant’s audit committee will pre-approve all audit, audit-related, tax and other services to be provided by the principal accountants of the registrant. |
The audit committee has delegated pre-approval authority to its Chairman for any subsequent new engagements that arise between regularly scheduled meeting dates provided that any fees such pre-approved are presented to the audit committee at its next regularly scheduled meeting.
Under applicable laws, pre-approval of non-audit services maybe waived provided that: 1) the aggregate amount of all such services provided constitutes no more than five percent of the total amount of fees paid by the registrant to it principal accountant during the fiscal year in which services are provided 2) such services were not recognized by the registrant at the time of engagement as non-audit services and 3) such services are promptly brought to the attention of the audit committee of the registrant and approved prior to the completion of the audit.
| (f) | Not applicable as less than 50%. |
| (g) | The principal accountant for the audit of the registrant’s annual financial statements billed $716,063 in fiscal 2012 and $416,070 in fiscal 2011 to the registrant and the registrant’s investment adviser or any entity controlling, controlled by, or under common control with the adviser that provides ongoing services to the registrant related to non-audit fees. Those billings did not include any prohibited non-audit services as defined by the Securities Exchange Act of 1934. |
| (h) | The registrant’s audit committee of the board of Trustees has considered whether the provision of non-audit services that were rendered to the registrant’s investment adviser, and any entity controlling, controlled by, or under common control with the investment adviser that provides ongoing services to the registrant that were not pre-approved pursuant to paragraph (c)(7)(ii) of Rule 2-01 of Regulation S-X is compatible with maintaining the principal accountant’s independence. No such services were rendered. |
| Item 5. | Audit Committee of Listed Registrants |
Not applicable.
| Item 6. | Schedule of Investments. |
a) Not applicable. The complete schedule of investments is included in Item 1 of this Form N-CSR.
b) Not applicable.
| Item 7. | Disclosure of Proxy Voting Policies and Procedures for Closed-End Management Investment Companies. |
Not applicable.
| Item 8. | Portfolio Managers of Closed-End Management Investment Companies. |
Not applicable.
| Item 9. | Purchases of Equity Securities by Closed-End Management Investment Company and Affiliated Purchasers. |
Not applicable.
| Item 10. | Submission of Matters to a Vote of Security Holders. |
The Fund’s Governance Committee Provisions with Respect to Nominations of Directors/Trustees to the Respective Boards
None
| Item 11. | Controls and Procedures. |
Based on their evaluation of the registrant’s disclosure controls and procedures (as defined in rule 30a-3(c) under the Investment Company Act of 1940 (17 CFR 270.30a-3(c)) as of 12/31/2012, the registrant’s principal executive officer and principal financial officer found the registrant’s disclosure controls and procedures to provide reasonable assurances that information required to be disclosed by the registrant in the reports that it files under the Securities Exchange Act of 1934 (a) is accumulated and communicated to registrant’s management, including its principal executive officer and principal financial officer, to allow timely decisions regarding required disclosure, and (b) is recorded, processed, summarized and reported, within the time periods specified in the rules and forms adopted by the U.S. Securities and Exchange Commission.
There have been no changes in the registrant’s internal controls over financial reporting that occurred during the registrant’s second fiscal quarter of the period covered by this report that have materially affected, or are reasonably likely to materially affect, the registrant’s internal control over financial reporting.
| (a) | (1) Exhibit attached hereto. |
| | (2) | Exhibits attached hereto. |
| (b) | Exhibit attached hereto. |
SIGNATURES
Pursuant to the requirements of the Securities Exchange Act of 1934 and the Investment Company Act of 1940, the registrant has duly caused this report to be signed on its behalf by the undersigned, thereunto duly authorized.
Oppenheimer Commodity Strategy Total Return Fund
| | |
| By: | | /s/ William F. Glavin, Jr. |
| | William F. Glavin, Jr. |
| | Principal Executive Officer |
Pursuant to the requirements of the Securities Exchange Act of 1934 and the Investment Company Act of 1940, this report has been signed below by the following persons on behalf of the registrant and in the capacities and on the dates indicated.
| | |
| By: | | /s/ William F. Glavin, Jr. |
| | William F. Glavin, Jr. |
| | Principal Executive Officer |
| Date: 2/11/2013 |
| | |
| By: | | /s/ Brian W. Wixted |
| | Brian W. Wixted |
| | Principal Financial Officer |
| Date: 2/11/2013 |