As filed with the Securities and Exchange Commission on March 8, 2021
SECURITIES AND EXCHANGE COMMISSION
WASHINGTON, D.C. 20549
FORM N-CSR
CERTIFIED SHAREHOLDER REPORT OF REGISTERED
MANAGEMENT INVESTMENT COMPANIES
Investment Company Act file number: 811-07717
TRANSAMERICA ASSET ALLOCATION VARIABLE FUNDS
(Exact Name of Registrant as Specified in Charter)
1801 California St., Suite 5200, Denver, Colorado 80202
(Address of Principal Executive Offices) (Zip Code)
Registrant’s Telephone Number, including Area Code: 1-888-233-4339
Erin D. Nelson, Esq., 1801 California St., Suite 5200, Denver, Colorado 80202
(Name and Address of Agent for Service)
Date of fiscal year end: December 31
Date of reporting period: December 31, 2020
| Item 1: | Report(s) to Shareholders. |
| | (a) | The Annual Report is attached. |
TRANSAMERICA VARIABLE FUNDS
TRANSAMERICA ASSET
ALLOCATION VARIABLE FUNDS
Annual Report
December 31, 2020
Table of Contents
Authorized for distribution only when accompanied or preceded by a prospectus. Investors should carefully consider a fund’s investment goals, risks, charges and expenses before investing. A prospectus contains this and other information; please read it carefully before investing.
| | |
| Transamerica Asset Allocation Variable Funds | | Annual Report 2020 |
This report is not to be construed as an offering for sale of any contracts participating in the Subaccounts (Series) of the Transamerica Variable Funds or the Transamerica Asset Allocation Variable Funds, or as a solicitation of an offer to buy contracts unless preceded by or accompanied by a current prospectus which contains complete information about charges and expenses.
This report consists of the annual report of the Transamerica Asset Allocation Variable Funds and the annual report of the Calvert VP SRI Balanced Portfolio.
Proxy Voting Policies and Procedures
A description of the proxy voting policies and procedures of the Transamerica Asset Allocation Variable Funds is included in the applicable Statements of Additional Information which are available without charge, upon request: (i) by calling 1-800-755-5801; or (ii) on the SEC’s website at www.sec.gov. In addition, the Transamerica Asset Allocation Variable Funds are required to file Form N-PX, with the complete proxy voting record for the most recent twelve months ended June 30, no later than August 31 of each year. Form N-PX for the twelve months ended June 30, 2020, is available without charge, upon request by calling 1-800-851-9777 and on the SEC’s website at http://www.sec.gov.
Quarterly Portfolio Holdings
Each fiscal quarter, Transamerica Asset Allocation Variable Funds will file with the SEC a complete schedule of their monthly portfolio holdings on Form N-PORT. The Subaccounts’ holdings as of the end of the third month of every fiscal quarter, as reported on Form N-PORT, will be publicly available on the SEC’s website at http://www.sec.gov within 60 days of the end of the fiscal quarter.
TRANSAMERICA FINANCIAL LIFE INSURANCE COMPANY
440 Mamaroneck Avenue
Harrison, New York 10528
To Contract Holders with Interests in the
Transamerica Variable Funds:
We are pleased to present the most recent annual report for the Calvert VP SRI Balanced Portfolio. As required under applicable law, we are sending this annual report to contract holders of Group Variable Annuity Contracts issued by Transamerica Financial Life Insurance Company with unit interests in the Calvert Series Subaccount of the Transamerica Variable Funds, which invests its assets in the Calvert VP SRI Balanced Portfolio, a series of Calvert Variable Series, Inc.
Please call your retirement plan administrator, Transamerica Retirement Solutions, LLC, at (800) 755-5801 if you have any questions regarding these reports.
Dear Contract Holder,
On behalf of Transamerica Asset Allocation Variable Funds, we would like to thank you for your continued support and confidence in our products as we look forward to continuing to serve you and your financial professional in the future. We value the trust you have placed in us.
This annual report is provided to you with information about the investments of your Subaccount(s) during the fiscal year. The Securities and Exchange Commission currently requires that annual and semi-annual reports be provided to all contract holders invested in the Subaccounts, and we believe it to be an important part of the investment process. This report provides detailed information about your Subaccount(s) for the 12-month period ended December 31, 2020.
We believe it is important to understand the market conditions over the last fiscal year of the Subaccounts to provide context for reading this report. The period began with U.S. equity markets having recently reached all-time highs, as U.S./China trade relations improved and expectations for stable economic growth, benign inflation and low interest rates helped to foster optimism for 2020. Throughout January, sentiment remained strong, as equity markets traded higher.
By early February, headlines about a rapidly spreading respiratory virus in China (“COVID-19”) appeared, and fears of its global transmission began to rattle markets. Even though the S&P 500® Index reached a new record high on February 19, investors became quickly immersed in angst regarding COVID-19, and as cases exploded throughout Asia and Europe, its arrival to the U.S. sparked a historic selloff across almost all asset classes. A nationwide lockdown in the U.S. quickly went into effect in mid-March, and while the U.S. Federal Reserve (“Fed”) slashed short-term rates to zero, it could not prevent widespread selling across equity and credit markets. The S&P 500® Index experienced its fastest 35% decline in its history by the final week of March, while international markets saw similar declines with the MSCI EAFE Index losing approximately one-third of its value from peak to trough. Credit spreads more than tripled, and long-term Treasury yields collapsed as the 10-year Treasury yield dropped to an all-time low of 0.54%.
Throughout the spring, the U.S. economy experienced its worst economic contraction since the Great Depression as more than twenty million jobs were lost in the month of April and second quarter gross domestic product (“GDP”) plummeted by an annualized rate of -31%. However, as the Fed quickly implemented unprecedented amounts of large-scale asset purchases and credit support, and Congress passed the Coronavirus, Aid, Relief and Stimulus Act (“CARES”) providing more than $2 trillion to businesses and families, the markets began to see a recovery on the horizon.
By June, with virus case growth having declined, most states had loosened business shutdowns and social distancing requirements, and with pent-up demand from the earlier months now being combined with lower interest rates and market liquidity, GDP came roaring back in the third quarter to reach its highest rate of growth ever. Markets reacted accordingly as the S&P 500® Index regained its pre-pandemic high by the end of August, however, volatility returned in September and October as daily COVID-19 case levels increased exponentially to numbers well above those seen earlier in the year. A contentious presidential election and the inability of Congress to pass another round of economic relief also added to investor angst, however, markets resumed their advance in November after the election of Joe Biden as America’s 46th President inferred a potentially easier path for future economic stimulus. Shortly after the election, several pharmaceutical companies released clinical trial data on their COVID-19 vaccine candidates that displayed statistically high levels of efficacy, and this further encouraged higher stock prices.
By the end of the fiscal year, stocks were again pushing toward new all-time highs, as COVID-19 vaccines were approved and began to be distributed. In addition, another round of economic stimulus was approved, and investors began to focus on the prospects of economic and corporate recoveries in 2021. International equity markets, which lagged the U.S. during the 2020 recovery and throughout most of the last decade, approached all-time highs as the year ended.
For the one-year period ended December 31, 2020, the S&P 500® Index returned 18.40% while the MSCI EAFE Index, representing international developed market equities, returned 8.28%. During the same period, the Bloomberg Barclays US Aggregate Bond Index returned 7.51%. Please keep in mind that it is important to maintain a diversified portfolio as investment returns have historically been difficult to predict.
In addition to your active involvement in the investment process, we firmly believe that a financial professional is a key resource to help you build a complete picture of your current and future financial needs. Financial professionals are familiar with the market’s history, including long-term returns and volatility of various asset classes. With your financial professional, you can develop an investment program that incorporates factors such as your goals, your investment timeline and your risk tolerance.
Please contact your financial professional if you have any questions about the contents of this report, and thanks again for the confidence you have placed in us.
Sincerely,

Marijn Smit
President & Chief Executive Officer
Transamerica Asset Allocation Variable Funds

Tom Wald, CFA
Chief Investment Officer
Transamerica Asset Allocation Variable Funds
Bloomberg Barclays US Aggregate Bond Index: Measures investment grade, U.S. dollar denominated, fixed-rate taxable bonds, including Treasuries, government-related and corporate securities, as well as both mortgage- and asset-backed securities.
MSCI EAFE Index: A free float-adjusted market capitalization index that is designed to measure the equity market performance of developed markets, excluding the U.S. and Canada.
S&P 500® Index: A market-capitalization weighted index of 500 large U.S. companies with common stock listed on the New York Stock Exchange or NASDAQ Stock Market.
The COVID-19 pandemic has caused substantial market disruption and dislocation around the world including the U.S. During periods of market disruption, which may trigger trading halts, the Subaccount’s exposure to the risks described elsewhere in the Prospectus will likely increase. As a result, whether or not the Subaccount invests in securities of issuers located in or with significant exposure to the countries directly affected, the value and liquidity of the Subaccount’s investments may be negatively affected.
The views expressed in this report reflect those of Transamerica Asset Management only and may not necessarily represent the views of Transamerica Asset Allocation Variable Funds. These views are as of the date of this report and subject to change based upon market conditions. These views should not be relied upon as investment advice and are not indicative of trading intent on behalf of Transamerica Asset Allocation Variable Funds. Investing involves risk, including potential loss of principal. The performance data presented represents past performance and does not guarantee future results. Indexes are unmanaged and it is not possible to invest directly in an index.
Disclosure of Expenses
(unaudited)
UNIT HOLDER EXPENSES
Transamerica Asset Allocation Variable Funds (each individually, a “Subaccount” and collectively, the “Subaccounts”) is a separate investment account established by Transamerica Financial Life Insurance Company, Inc. (“TFLIC”), and is used as an investment vehicle under certain tax-deferred annuity contracts issued by TFLIC. Each Subaccount invests in underlying subaccounts of Transamerica Variable Funds (“TVF”), a unit investment trust. Subaccount contract holders bear the costs of operating the Subaccount (such as the advisory fee).
The following examples are intended to help you understand your ongoing costs (in dollars and cents) of investing in the Subaccounts and to compare these costs with the ongoing costs of investing in other funds.
The examples are based on an investment of $1,000 invested at July 1, 2020, and held for the entire six-month period until December 31, 2020.
ACTUAL EXPENSES
The information in the table below provides information about actual account values and actual expenses. You may use the information in these columns, together with the amount you invested, to estimate the expenses that you paid over the period. Simply divide your account value by $1,000 (for example, an $8,600 account value divided by $1,000 = $8.60), then multiply the result by the number in the appropriate column for your share class titled “Expenses Paid During Period” to estimate the expenses you paid on your account during this period.
HYPOTHETICAL EXAMPLE FOR COMPARISON PURPOSES
The information in the table below provides information about hypothetical account values and hypothetical expenses based on the Subaccounts’ actual expense ratios and assumed rates of return of 5% per year before expenses, which are not the Subaccounts’ actual returns. The hypothetical account values and expenses may not be used to estimate the actual ending account balance or expenses you paid for the period. You may use this information to compare the ongoing costs of investing in your Subaccount versus other funds. To do so, compare this 5% hypothetical example with the 5% hypothetical examples that appear in the shareholder reports of the other funds.
| | | | | | | | | | | | | | | | | | | | | | | | |
| | | | | | Actual Expenses | | | Hypothetical Expenses (A) | | | | |
| Subaccount | | Beginning
Account Value
July 1, 2020 | | | Ending
Account Value
December 31, 2020 | | | Expenses Paid
During Period (B) | | | Ending
Account Value
December 31, 2020 | | | Expenses Paid
During Period (B) | | | Net Annualized
Expense Ratio (C) (D) | |
Transamerica Asset Allocation – Short Horizon Subaccount | | $ | 1,000.00 | | | $ | 1,052.90 | | | $ | 1.03 | | | $ | 1,024.10 | | | $ | 1.02 | | | | 0.20 | % |
Transamerica Asset Allocation – Intermediate Horizon Subaccount | | | 1,000.00 | | | | 1,147.70 | | | | 1.08 | | | | 1,024.10 | | | | 1.02 | | | | 0.20 | |
Transamerica Asset Allocation – Intermediate/Long Horizon Subaccount | | | 1,000.00 | | | | 1,191.40 | | | | 1.10 | | | | 1,024.10 | | | | 1.02 | | | | 0.20 | |
| | |
| (A) | | 5% return per year before expenses. |
| |
| (B) | | Expenses are calculated using each Subaccount’s net annualized expense ratios, as disclosed in the table, multiplied by the average account value for the period, multiplied by the number of days in the period (184 days), and divided by the number of days in the year (366 days). |
| |
| (C) | | Net annualized expense ratios, as disclosed in the table, do not include the expenses of the underlying investments in which the Subaccounts invest. The total annual expenses, as stated in the fee table of the Subaccounts’ Prospectus, may differ from the expense ratios disclosed in this report. |
| |
| (D) | | Net annualized expense ratios are reflective of applicable fee waivers and/or reimbursements and recapture, if any, and based on the most recent six-months which may differ from the net expense ratio displayed in the Financial Highlights that covers a twelve-month period. |
| | |
| Transamerica Asset Allocation Variable Funds | | Annual Report 2020 |
Page 4
Schedules of Investments Composition
At December 31, 2020
(unaudited)
| | | | |
| Transamerica Asset Allocation – Short Horizon Subaccount | |
| |
| Asset Allocation | | Percentage of Net
Assets | |
U.S. Fixed Income Funds | | | 88.9 | % |
U.S. Equity Funds | | | 8.7 | |
International Equity Fund | | | 2.2 | |
Money Market Fund | | | 0.2 | |
Net Other Assets (Liabilities) | | | (0.0 | )* |
Total | | | 100.0 | % |
| | | | |
|
| Transamerica Asset Allocation – Intermediate Horizon Subaccount | |
| |
| Asset Allocation | | Percentage of Net
Assets | |
U.S. Fixed Income Funds | | | 46.0 | % |
U.S. Equity Funds | | | 40.1 | |
International Equity Fund | | | 13.7 | |
Money Market Fund | | | 0.2 | |
Net Other Assets (Liabilities) | | | (0.0 | )* |
Total | | | 100.0 | % |
| | | | |
|
| Transamerica Asset Allocation – Intermediate/Long Horizon Subaccount | |
| |
| Asset Allocation | | Percentage of Net
Assets | |
U.S. Equity Funds | | | 54.2 | % |
U.S. Fixed Income Funds | | | 27.2 | |
International Equity Fund | | | 18.5 | |
Money Market Fund | | | 0.1 | |
Net Other Assets (Liabilities) | | | (0.0 | )* |
Total | | | 100.0 | % |
| | | | |
| * | Percentage rounds to less than 0.1% or (0.1)%. |
| | |
| Transamerica Asset Allocation Variable Funds | | Annual Report 2020 |
Page 5
Transamerica Asset Allocation – Short Horizon Subaccount
SCHEDULE OF INVESTMENTS
At December 31, 2020
| | | | | | | | |
| | | Shares | | | Value | |
| INVESTMENT COMPANIES - 100.0% | | | | | | |
| International Equity Fund - 2.2% | | | | | | |
Transamerica Variable International Equity (A) (B) | | | 5,481 | | | | $ 145,171 | |
| | | | | | | | |
| Money Market Fund - 0.2% | | | | | | |
Transamerica Variable Government Money Market (A) (B) | | | 707 | | | | 15,117 | |
| | | | | | | | |
| U.S. Equity Funds - 8.7% | | | | | | |
Transamerica Variable Large Growth (A) (B) | | | 757 | | | | 203,559 | |
Transamerica Variable Large Value Opportunities (A) (B) | | | 2,048 | | | | 214,342 | |
Transamerica Variable Small Cap Growth (A) (B) | | | 5,966 | | | | 73,323 | |
Transamerica Variable Small Cap Value (A) (B) | | | 5,557 | | | | 74,414 | |
| | | | | | | | |
| | | | | | | 565,638 | |
| | | | | | | | |
| U.S. Fixed Income Funds - 88.9% | | | | | | |
Transamerica Variable High Quality Bond (A) (B) | | | 54,394 | | | | 1,023,659 | |
| | | | | | | | |
| | | Shares | | | Value | |
| INVESTMENT COMPANIES (continued) | | | | | | |
| U.S. Fixed Income Funds (continued) | | | | | | |
Transamerica Variable High Yield Bond (A) (B) | | | 17,789 | | | | $ 697,577 | |
Transamerica Variable Inflation-Protected Securities (A) (B) | | | 33,421 | | | | 1,035,956 | |
Transamerica Variable Intermediate Bond (A) (B) | | | 57,626 | | | | 3,067,628 | |
| | | | | | | | |
| | | | | | | 5,824,820 | |
| | | | | | | | |
Total Investment Companies
(Cost $5,687,785) | | | | | | | 6,550,746 | |
| | | | | | | | |
Total Investments
(Cost $5,687,785) | | | | | | | 6,550,746 | |
Net Other Assets (Liabilities) - (0.0)% (C) | | | | | | | (1,032 | ) |
| | | | | | | | |
| | |
Net Assets - 100.0% | | | | | | | $ 6,549,714 | |
| | | | | | | | |
INVESTMENT VALUATION:
Valuation Inputs (D)
| | | | | | | | | | | | | | | | |
| | | Level 1 -
Unadjusted
Quoted Prices | | | Level 2 -
Other Significant
Observable Inputs | | | Level 3 -
Significant
Unobservable Inputs | | | Value | |
ASSETS Investments | | | | | | | | | | | | | | | | |
Investment Companies | | $ | 6,550,746 | | | $ | — | | | $ | — | | | $ | 6,550,746 | |
| | | | | | | | | | | | | | | | |
Total Investments | | $ | 6,550,746 | | | $ | — | | | $ | — | | | $ | 6,550,746 | |
| | | | | | | | | | | | | | | | |
FOOTNOTES TO SCHEDULE OF INVESTMENTS:
| | |
| (A) | | Affiliated investment of Transamerica Variable Funds. Affiliated interest income, dividend income, realized and unrealized gains (losses), if any, are broken out within the Statements of Operations. |
| (B) | | Non-income producing securities. |
| (C) | | Percentage rounds to less than 0.1% or (0.1)%. |
| (D) | | There were no transfers in or out of Level 3 during the year ended December 31, 2020. Please reference the Investment Valuation section of the Notes to Financial Statements for more information regarding investment valuation and pricing inputs. |
The Notes to Financial Statements are an integral part of this report.
| | |
| Transamerica Asset Allocation Variable Funds | | Annual Report 2020 |
Page 6
Transamerica Asset Allocation – Intermediate Horizon Subaccount
SCHEDULE OF INVESTMENTS
At December 31, 2020
| | | | | | | | |
| | | Shares | | | Value | |
| INVESTMENT COMPANIES - 100.0% | | | | | | |
| International Equity Fund - 13.7% | | | | | | |
Transamerica Variable International Equity (A) (B) | | | 89,521 | | | | $ 2,370,927 | |
| | | | | | | | |
| Money Market Fund - 0.2% | | | | | | |
Transamerica Variable Government Money Market (A) (B) | | | 1,617 | | | | 34,585 | |
| | | | | | | | |
| U.S. Equity Funds - 40.1% | | | | | | |
Transamerica Variable Large Growth (A) (B) | | | 9,566 | | | | 2,573,235 | |
Transamerica Variable Large Value Opportunities (A) (B) | | | 24,212 | | | | 2,534,138 | |
Transamerica Variable Small Cap Growth (A) (B) | | | 74,203 | | | | 911,996 | |
Transamerica Variable Small Cap Value (A) (B) | | | 68,142 | | | | 912,531 | |
| | | | | | | | |
| | | | | | | 6,931,900 | |
| | | | | | | | |
| U.S. Fixed Income Funds - 46.0% | | | | | | |
Transamerica Variable High Quality Bond (A) (B) | | | 67,434 | | | | 1,269,047 | |
| | | | | | | | |
| | | Shares | | | Value | |
| INVESTMENT COMPANIES (continued) | | | | | | |
| U.S. Fixed Income Funds (continued) | | | | | | |
Transamerica Variable High Yield Bond (A) (B) | | | 25,253 | | | | $ 990,314 | |
Transamerica Variable Inflation-Protected Securities (A) (B) | | | 61,045 | | | | 1,892,237 | |
Transamerica Variable Intermediate Bond (A) (B) | | | 71,427 | | | | 3,802,283 | |
| | | | | | | | |
| | | | | | | 7,953,881 | |
| | | | | | | | |
Total Investment Companies
(Cost $13,268,699) | | | | | | | 17,291,293 | |
| | | | | | | | |
Total Investments
(Cost $13,268,699) | | | | | | | 17,291,293 | |
Net Other Assets (Liabilities) - (0.0)% (C) | | | | | | | (2,672 | ) |
| | | | | | | | |
| | |
Net Assets - 100.0% | | | | | | | $ 17,288,621 | |
| | | | | | | | |
INVESTMENT VALUATION:
Valuation Inputs (D)
| | | | | | | | | | | | | | | | |
| | | Level 1 -
Unadjusted
Quoted Prices | | | Level 2 -
Other Significant
Observable Inputs | | | Level 3 -
Significant
Unobservable Inputs | | | Value | |
ASSETS | | | | | | | | | | | | | | | | |
Investments | | | | | | | | | | | | | | | | |
Investment Companies | | $ | 17,291,293 | | | $ | — | | | $ | — | | | $ | 17,291,293 | |
| | | | | | | | | | | | | | | | |
Total Investments | | $ | 17,291,293 | | | $ | — | | | $ | — | | | $ | 17,291,293 | |
| | | | | | | | | | | | | | | | |
FOOTNOTES TO SCHEDULE OF INVESTMENTS:
| | |
| (A) | | Affiliated investment of Transamerica Variable Funds. Affiliated interest income, dividend income, realized and unrealized gains (losses), if any, are broken out within the Statements of Operations. |
| (B) | | Non-income producing securities. |
| (C) | | Percentage rounds to less than 0.1% or (0.1)%. |
| (D) | | There were no transfers in or out of Level 3 during the year ended December 31, 2020. Please reference the Investment Valuation section of the Notes to Financial Statements for more information regarding investment valuation and pricing inputs. |
The Notes to Financial Statements are an integral part of this report.
| | |
| Transamerica Asset Allocation Variable Funds | | Annual Report 2020 |
Page 7
Transamerica Asset Allocation – Intermediate/Long Horizon Subaccount
SCHEDULE OF INVESTMENTS
At December 31, 2020
| | | | | | | | |
| | | Shares | | | Value | |
| INVESTMENT COMPANIES - 100.0% | |
| International Equity Fund - 18.5% | |
Transamerica Variable International Equity (A) (B) | | | 237,360 | | | | $ 6,286,364 | |
| | | | | | | | |
| Money Market Fund - 0.1% | |
Transamerica Variable Government Money Market (A) (B) | | | 2,275 | | | | 48,666 | |
| | | | | | | | |
| U.S. Equity Funds - 54.2% | |
Transamerica Variable Large Growth (A) (B) | | | 26,209 | | | | 7,050,339 | |
Transamerica Variable Large Value Opportunities (A) (B) | | | 62,767 | | | | 6,569,654 | |
Transamerica Variable Small Cap Growth (A) (B) | | | 191,241 | | | | 2,350,461 | |
Transamerica Variable Small Cap Value (A) (B) | | | 178,223 | | | | 2,386,715 | |
| | | | | | | | |
| | | | | | | 18,357,169 | |
| | | | | | | | |
| U.S. Fixed Income Funds - 27.2% | |
Transamerica Variable High Quality Bond (A) (B) | | | 34,210 | | | | 643,800 | |
| | | | | | | | |
| | | Shares | | | Value | |
| INVESTMENT COMPANIES (continued) | |
| U.S. Fixed Income Funds (continued) | |
Transamerica Variable High Yield Bond (A) (B) | | | 31,907 | | | | $ 1,251,216 | |
Transamerica Variable Inflation-Protected Securities (A) (B) | | | 87,187 | | | | 2,702,563 | |
Transamerica Variable Intermediate Bond (A) (B) | | | 86,607 | | | | 4,610,339 | |
| | | | | | | | |
| | | | | | | 9,207,918 | |
| | | | | | | | |
Total Investment Companies
(Cost $22,995,846) | | | | 33,900,117 | |
| | | | | | | | |
Total Investments
(Cost $22,995,846) | | | | 33,900,117 | |
Net Other Assets (Liabilities) - (0.0)% (C) | | | | | | | (5,560 | ) |
| | | | | | | | |
| | |
Net Assets - 100.0% | | | | | | | $ 33,894,557 | |
| | | | | | | | |
INVESTMENT VALUATION:
Valuation Inputs (D)
| | | | | | | | | | | | | | | | |
| | | Level 1 -
Unadjusted
Quoted Prices | | | Level 2 -
Other Significant
Observable Inputs | | | Level 3 -
Significant
Unobservable Inputs | | | Value | |
ASSETS | | | | | | | | | | | | | | | | |
Investments | | | | | | | | | | | | | | | | |
Investment Companies | | $ | 33,900,117 | | | $ | — | | | $ | — | | | $ | 33,900,117 | |
| | | | | | | | | | | | | | | | |
Total Investments | | $ | 33,900,117 | | | $ | — | | | $ | — | | | $ | 33,900,117 | |
| | | | | | | | | | | | | | | | |
FOOTNOTES TO SCHEDULE OF INVESTMENTS:
| | |
| (A) | | Affiliated investment of Transamerica Variable Funds. Affiliated interest income, dividend income, realized and unrealized gains (losses), if any, are broken out within the Statements of Operations. |
| (B) | | Non-income producing securities. |
| (C) | | Percentage rounds to less than 0.1% or (0.1)%. |
| (D) | | There were no transfers in or out of Level 3 during the year ended December 31, 2020. Please reference the Investment Valuation section of the Notes to Financial Statements for more information regarding investment valuation and pricing inputs. |
The Notes to Financial Statements are an integral part of this report.
| | |
| Transamerica Asset Allocation Variable Funds | | Annual Report 2020 |
Page 8
STATEMENTS OF ASSETS AND LIABILITIES
At December 31, 2020
| | | | | | | | | | | | |
| | | Short Horizon | | | Intermediate
Horizon | | | Intermediate/Long
Horizon | |
Assets: | | | | | | | | | | | | |
Affiliated investments, at value (A) | | $ | 6,550,746 | | | $ | 17,291,293 | | | $ | 33,900,117 | |
Cash | | | 75 | | | | 266 | | | | 146 | |
Receivables and other assets: | | | | | | | | | | | | |
Affiliated investments sold | | | 3,085 | | | | 371,271 | | | | 98,794 | |
Units sold | | | 1,512 | | | | 11,976 | | | | 51,365 | |
Total assets | | | 6,555,418 | | | | 17,674,806 | | | | 34,050,422 | |
| | | | |
Liabilities: | | | | | | | | | | | | |
Payables and other liabilities: | | | | | | | | | | | | |
Affiliated investments purchased | | | 1,512 | | | | 186,775 | | | | 51,365 | |
Units redeemed | | | 3,085 | | | | 196,473 | | | | 98,794 | |
Investment advisory fees | | | 1,107 | | | | 2,937 | | | | 5,706 | |
Total liabilities | | | 5,704 | | | | 386,185 | | | | 155,865 | |
Net assets | | $ | 6,549,714 | | | $ | 17,288,621 | | | $ | 33,894,557 | |
| | | | |
Net assets consist of: | | | | | | | | | | | | |
Costs of accumulation units | | $ | 371,437 | | | $ | (2,142,780 | ) | | $ | 4,831,008 | |
Total distributable earnings (accumulated losses) | | | 6,178,277 | | | | 19,431,401 | | | | 29,063,549 | |
Net assets | | $ | 6,549,714 | | | $ | 17,288,621 | | | $ | 33,894,557 | |
Accumulation units | | | 256,379 | | | | 519,819 | | | | 916,146 | |
Unit value | | $ | 25.55 | | | $ | 33.26 | | | $ | 37.00 | |
| | | | | | | | | | | | | |
(A) Affiliated investments, at cost | | $ | 5,687,785 | | | $ | 13,268,699 | | | $ | 22,995,846 | |
STATEMENTS OF OPERATIONS
For the year ended December 31, 2020
| | | | | | | | | | | | |
| | | Short Horizon | | | Intermediate
Horizon | | | Intermediate/Long
Horizon | |
Investment Income: | | | | | | | | | | | | |
Interest income from affiliated investments | | $ | 6 | | | $ | 23 | | | $ | 12 | |
| | | | |
Expenses: | | | | | | | | | | | | |
Investment advisory fees | | | 12,414 | | | | 32,403 | | | | 61,312 | |
| | | | |
Net investment income (loss) | | | (12,408 | ) | | | (32,380 | ) | | | (61,300 | ) |
| | | | |
Net realized gain (loss) on: | | | | | | | | | | | | |
Affiliated investments | | | 216,336 | | | | 2,030,025 | | | | 5,623,095 | |
| | | | |
Net change in unrealized appreciation (depreciation) on: | | | | | | | | | | | | |
Affiliated investments | | | 246,983 | | | | 157,767 | | | | (712,091 | ) |
Net realized and change in unrealized gain (loss) | | | 463,319 | | | | 2,187,792 | | | | 4,911,004 | |
Net increase (decrease) in net assets resulting from operations | | $ | 450,911 | | | $ | 2,155,412 | | | $ | 4,849,704 | |
The Notes to Financial Statements are an integral part of this report.
| | |
| Transamerica Asset Allocation Variable Funds | | Annual Report 2020 |
Page 9
STATEMENTS OF CHANGES IN NET ASSETS
For the years ended:
| | | | | | | | | | | | | | | | | | | | | | | | |
| | | Short Horizon | | | Intermediate Horizon | | | Intermediate/Long Horizon | |
| | | December 31,
2020 | | | December 31,
2019 | | | December 31,
2020 | | | December 31,
2019 | | | December 31,
2020 | | | December 31,
2019 | |
| From operations: | | | | | | | | | | | | | | | | | | | | | | | | |
Net investment income (loss) | | $ | (12,408 | ) | | $ | (11,760 | ) | | $ | (32,380 | ) | | $ | (32,179 | ) | | $ | (61,300 | ) | | $ | (59,467 | ) |
Net realized gain (loss) | | | 216,336 | | | | 111,653 | | | | 2,030,025 | | | | 556,513 | | | | 5,623,095 | | | | 995,234 | |
Net change in unrealized appreciation (depreciation) | | | 246,983 | | | | 387,804 | | | | 157,767 | | | | 1,703,768 | | | | (712,091 | ) | | | 4,012,901 | |
Net increase (decrease) in net assets resulting from operations | | | 450,911 | | | | 487,697 | | | | 2,155,412 | | | | 2,228,102 | | | | 4,849,704 | | | | 4,948,668 | |
| | | | | | | |
Unit transactions: | | | | | | | | | | | | | | | | | | | | | | | | |
Units sold | | | 1,292,008 | | | | 838,696 | | | | 1,528,988 | | | | 1,516,406 | | | | 2,466,468 | | | | 2,930,883 | |
Units redeemed | | | (1,169,591 | ) | | | (964,324 | ) | | | (3,083,063 | ) | | | (2,095,053 | ) | | | (5,397,715 | ) | | | (2,918,410 | ) |
Net increase (decrease) in net assets resulting from unit transactions | | | 122,417 | | | | (125,628 | ) | | | (1,554,075 | ) | | | (578,647 | ) | | | (2,931,247 | ) | | | 12,473 | |
Net increase (decrease) in net assets | | | 573,328 | | | | 362,069 | | | | 601,337 | | | | 1,649,455 | | | | 1,918,457 | | | | 4,961,141 | |
| | | | | | | |
Net assets: | | | | | | | | | | | | | | | | | | | | | | | | |
Beginning of year | | | 5,976,386 | | | | 5,614,317 | | | | 16,687,284 | | | | 15,037,829 | | | | 31,976,100 | | | | 27,014,959 | |
End of year | | $ | 6,549,714 | | | $ | 5,976,386 | | | $ | 17,288,621 | | | $ | 16,687,284 | | | $ | 33,894,557 | | | $ | 31,976,100 | |
| | | | | | | |
Unit transactions - shares: | | | | | | | | | | | | | | | | | | | | | | | | |
Units sold | | | 53,149 | | | | 36,241 | | | | 52,842 | | | | 55,097 | | | | 80,960 | | | | 98,802 | |
Units redeemed | | | (47,897 | ) | | | (41,797 | ) | | | (105,974 | ) | | | (76,117 | ) | | | (171,707 | ) | | | (99,115 | ) |
Net increase (decrease) | | | 5,252 | | | | (5,556 | ) | | | (53,132 | ) | | | (21,020 | ) | | | (90,747 | ) | | | (313 | ) |
The Notes to Financial Statements are an integral part of this report.
| | |
| Transamerica Asset Allocation Variable Funds | | Annual Report 2020 |
Page 10
FINANCIAL HIGHLIGHTS
| | | | | | | | | | | | | | | | | | | | |
| For a unit outstanding during the years indicated: | | Short Horizon | |
| | | December 31,
2020 | | | December 31,
2019 | | | December 31,
2018 | | | December 31,
2017 | | | December 31,
2016 | |
Unit value, beginning of year | | $ | 23.80 | | | $ | 21.87 | | | $ | 22.46 | | | $ | 21.56 | | | $ | 20.81 | |
| | | | | | |
Investment operations: | | | | | | | | | | | | | | | | | | | | |
Net investment income (loss) (A) | | | (0.05 | ) | | | (0.05 | ) | | | (0.04 | ) | | | (0.04 | ) | | | (0.04 | ) |
Net realized and unrealized gain (loss) | | | 1.80 | | | | 1.98 | | | | (0.55 | ) | | | 0.94 | | | | 0.79 | |
Total investment operations | | | 1.75 | | | | 1.93 | | | | (0.59 | ) | | | 0.90 | | | | 0.75 | |
| | | | | | |
Unit value, end of year | | $ | 25.55 | | | $ | 23.80 | | | $ | 21.87 | | | $ | 22.46 | | | $ | 21.56 | |
Total return | | | 7.35 | % | | | 8.80 | % | | | (2.62 | )% | | | 4.19 | % | | | 3.58 | % |
| | | | | | |
Ratio and supplemental data: | | | | | | | | | | | | | | | | | | | | |
Net assets end of year (000’s) | | $ | 6,550 | | | $ | 5,976 | | | $ | 5,614 | | | $ | 5,817 | | | $ | 5,754 | |
Expenses to average net assets (B) | | | 0.20 | % | | | 0.20 | % | | | 0.20 | % | | | 0.20 | % | | | 0.20 | % |
Net investment income (loss) to average net assets | | | (0.20 | )% | | | (0.20 | )% | | | (0.20 | )% | | | (0.20 | )% | | | (0.20 | )% |
Portfolio turnover rate | | | 58 | % | | | 36 | % | | | 44 | % | | | 34 | % | | | 33 | % |
| | |
| (A) | | Calculated based on average number of units outstanding. |
| (B) | | Does not include expenses of the underlying investments in which the Subaccount invests. |
| | | | | | | | | | | | | | | | | | | | |
| For a unit outstanding during the years indicated: | | Intermediate Horizon | |
| | | December 31,
2020 | | | December 31,
2019 | | | December 31,
2018 | | | December 31,
2017 | | | December 31,
2016 | |
Unit value, beginning of year | | $ | 29.13 | | | $ | 25.32 | | | $ | 26.91 | | | $ | 24.28 | | | $ | 23.12 | |
| | | | | | |
Investment operations: | | | | | | | | | | | | | | | | | | | | |
Net investment income (loss) (A) | | | (0.06 | ) | | | (0.06 | ) | | | (0.05 | ) | | | (0.05 | ) | | | (0.05 | ) |
Net realized and unrealized gain (loss) | | | 4.19 | | | | 3.87 | | | | (1.54 | ) | | | 2.68 | | | | 1.21 | |
Total investment operations | | | 4.13 | | | | 3.81 | | | | (1.59 | ) | | | 2.63 | | | | 1.16 | |
| | | | | | |
Unit value, end of year | | $ | 33.26 | | | $ | 29.13 | | | $ | 25.32 | | | $ | 26.91 | | | $ | 24.28 | |
Total return | | | 14.19 | % | | | 15.04 | % | | | (5.92 | )% | | | 10.84 | % | | | 5.01 | % |
| | | | | | |
Ratio and supplemental data: | | | | | | | | | | | | | | | | | | | | |
Net assets end of year (000’s) | | $ | 17,289 | | | $ | 16,687 | | | $ | 15,038 | | | $ | 17,618 | | | $ | 17,250 | |
Expenses to average net assets (B) | | | 0.20 | % | | | 0.20 | % | | | 0.20 | % | | | 0.20 | % | | | 0.20 | % |
Net investment income (loss) to average net assets | | | (0.20 | )% | | | (0.20 | )% | | | (0.20 | )% | | | (0.20 | )% | | | (0.20 | )% |
Portfolio turnover rate | | | 73 | % | | | 23 | % | | | 37 | % | | | 40 | % | | | 26 | % |
| | |
| (A) | | Calculated based on average number of units outstanding. |
| (B) | | Does not include expenses of the underlying investments in which the Subaccount invests. |
| | | | | | | | | | | | | | | | | | | | |
| For a unit outstanding during the years indicated: | | Intermediate/Long Horizon | |
| | | December 31,
2020 | | | December 31,
2019 | | | December 31,
2018 | | | December 31,
2017 | | | December 31,
2016 | |
Unit value, beginning of year | | $ | 31.76 | | | $ | 26.82 | | | $ | 29.04 | | | $ | 25.48 | | | $ | 24.13 | |
| | | | | | |
Investment operations: | | | | | | | | | | | | | | | | | | | | |
Net investment income (loss) (A) | | | (0.06 | ) | | | (0.06 | ) | | | (0.06 | ) | | | (0.05 | ) | | | (0.05 | ) |
Net realized and unrealized gain (loss) | | | 5.30 | | | | 5.00 | | | | (2.16 | ) | | | 3.61 | | | | 1.40 | |
Total investment operations | | | 5.24 | | | | 4.94 | | | | (2.22 | ) | | | 3.56 | | | | 1.35 | |
| | | | | | |
Unit value, end of year | | $ | 37.00 | | | $ | 31.76 | | | $ | 26.82 | | | $ | 29.04 | | | $ | 25.48 | |
Total return | | | 16.50 | % | | | 18.40 | % | | | (7.65 | )% | | | 13.97 | % | | | 5.60 | % |
| | | | | | |
Ratio and supplemental data: | | | | | | | | | | | | | | | | | | | | |
Net assets end of year (000’s) | | $ | 33,895 | | | $ | 31,976 | | | $ | 27,015 | | | $ | 31,431 | | | $ | 28,225 | |
Expenses to average net assets (B) | | | 0.20 | % | | | 0.20 | % | | | 0.20 | % | | | 0.20 | % | | | 0.20 | % |
Net investment income (loss) to average net assets | | | (0.20 | )% | | | (0.20 | )% | | | (0.20 | )% | | | (0.20 | )% | | | (0.20 | )% |
Portfolio turnover rate | | | 71 | % | | | 25 | % | | | 30 | % | | | 25 | % | | | 21 | % |
| | |
| (A) | | Calculated based on average number of units outstanding. |
| (B) | | Does not include expenses of the underlying investments in which the Subaccount invests. |
The Notes to Financial Statements are an integral part of this report.
| | |
| Transamerica Asset Allocation Variable Funds | | Annual Report 2020 |
Page 11
NOTES TO FINANCIAL STATEMENTS
At December 31, 2020
1. ORGANIZATION
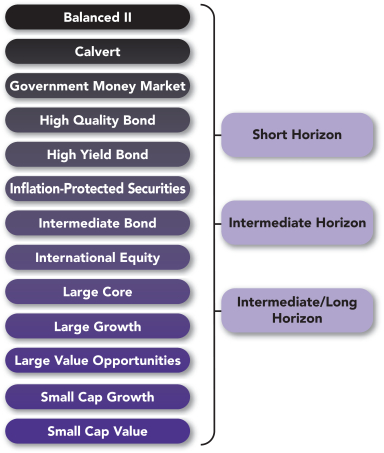
Transamerica Asset Allocation Variable Funds (the “Separate Account”), is a non-diversified separate account of Transamerica Financial Life Insurance Company (“TFLIC”), and is registered as a management investment company under the Investment Company Act of 1940, as amended. The Separate Account applies investment company accounting and reporting guidance. The Separate Account is composed of three different subaccounts (each, a “Subaccount” and collectively, the “Subaccounts”) that are separate investment funds and are as follows. Each Subaccount invests substantially all of its investable assets among certain Transamerica Variable Funds (“TVF”). Certain TVF subaccounts invest substantially all of their investable assets in underlying series of Transamerica Funds (each a “Fund” and collectively, the “Funds”).
|
| Subaccount |
Transamerica Asset Allocation – Short Horizon Subaccount (“Short Horizon”) |
Transamerica Asset Allocation – Intermediate Horizon Subaccount (“Intermediate Horizon”) |
Transamerica Asset Allocation – Intermediate/Long Horizon Subaccount (“Intermediate/Long Horizon”) |
The only shareholders of the Separate Account are contract holders of the affiliated insurance company variable life and annuity contracts.
Transamerica Asset Management, Inc. (“TAM”) serves as investment manager for the Subaccounts pursuant to an investment management agreement. TAM provides continuous and regular investment management services to the Subaccounts. TAM supervises each Subaccount’s investments, conducts its investment program and provides supervisory and management services to the Subaccounts.
TAM is responsible for all aspects of the day-to-day management of the Subaccounts.
TAM’s investment management services also include the provision of supervisory and administrative services to the Subaccounts. These services include performing certain administrative services for the Subaccounts and supervising and overseeing the administrative, clerical, recordkeeping and bookkeeping services provided to the Subaccounts by State Street Bank and Trust Company (“State Street”), to whom TAM has outsourced the provision of certain services as described below: to the extent agreed upon by TAM and the Subaccounts from time to time, monitoring and verifying the custodian’s daily calculation of the Net Asset Values (“NAV”); shareholder relations functions; compliance services; valuation services; assisting in due diligence and in the oversight and monitoring of certain activities of sub-advisers and certain aspects of Subaccount investments; assisting with Subaccount combinations and liquidations: oversight of the preparation and filing, and review, of all returns and reports, in connection with federal, state and local taxes; oversight and review of regulatory reporting; supervising and coordinating the Subaccounts’ custodian and dividend disbursing agent and monitoring their services to the Subaccounts; assisting the Subaccounts in preparing reports to shareholders; acting as liaison with the Subaccounts’ independent public accountants and providing, upon request, analyses, fiscal year summaries and other audit related services; assisting in the preparation of agendas and supporting documents for and minutes of meetings of trustees and committees of trustees; assisting in the preparation of regular communications with the trustees; and providing personnel and office space, telephones and other office equipment as necessary in order for TAM to perform supervisory and administrative services to the Subaccounts.
For each of the Funds, TAM currently acts as a “manager of managers” and hires sub-advisers to furnish day-to-day investment advice and recommendations to the Funds.
2. SIGNIFICANT ACCOUNTING POLICIES
In preparing the Subaccounts’ financial statements in accordance with Generally Accepted Accounting Principles in the United States of America (“GAAP”), estimates or assumptions (which could differ from actual results) may be used that affect reported amounts and disclosures. The following is a summary of significant accounting policies followed by the Subaccounts.
Security transactions: Security transactions are accounted for on the trade date. Security gains and losses are calculated on the specific identification basis. Net realized gain (loss) is from investments in units of investment companies.
Operating expenses: The Separate Account accounts separately for the assets, liabilities, and operations of each Subaccount. Each Subaccount will indirectly bear the fees and expenses reflected in the corresponding TVF unit value. These expenses are not reflected in the expenses within the Statements of Operations of the Subaccount and are not included in the Expenses to average net assets, and Net investment income (loss) to average net assets within the Financial Highlights.
Indemnification: In the normal course of business, the Subaccounts enter into contracts that contain a variety of representations that provide general indemnifications. The Subaccounts’ maximum exposure under these arrangements is unknown, as this would involve
| | |
| Transamerica Asset Allocation Variable Funds | | Annual Report 2020 |
Page 12
NOTES TO FINANCIAL STATEMENTS (continued)
At December 31, 2020
2. SIGNIFICANT ACCOUNTING POLICIES (continued)
future claims that may be made against the Subaccounts and/or their affiliates that have not yet occurred. However, based on experience, the Subaccounts expect the risk of loss to be remote.
3. INVESTMENT VALUATION
All investments in securities are recorded at their estimated fair value. The value of each Subaccount’s investment in a corresponding TVF subaccount is valued at the TVF unit value per share at the official close of the New York Stock Exchange (“NYSE”) each day the NYSE is open for business.
The Subaccounts utilize various methods to measure the fair value of their investments on a recurring basis. GAAP establishes a hierarchy that prioritizes inputs to valuation methods. The inputs or methodology used for valuing securities are not necessarily an indication of the risk associated with investing in those securities. The three levels (“Levels”) of inputs of the fair value hierarchy are defined as follows:
Level 1—Unadjusted quoted prices in active markets for identical securities.
Level 2—Inputs, other than quoted prices included in Level 1, which are observable, either directly or indirectly. These inputs may include quoted prices for the identical instrument on an inactive market, prices for similar instruments, interest rates, prepayment speeds, credit risk, yield curves, default rates, and similar data.
Level 3—Unobservable inputs based on the best information available in the circumstances, to the extent observable inputs are not available, which may include the Subaccounts’ own assumptions used in determining the fair value of investments.
The inputs used to measure fair value may fall into different Levels of the fair value hierarchy. In such cases, for disclosure purposes, the Level in the fair value hierarchy that is assigned to the fair value measurement of a security is determined based on the lowest Level input that is significant to the fair value measurement in its entirety. Certain investments that are measured at fair value using NAV per share, or its equivalent, using the “practical expedient” have not been classified in the fair value Levels. The hierarchy classification of inputs used to value the Subaccounts’ investments at December 31, 2020, is disclosed within the Investment Valuation section of each Subaccount’s Schedule of Investments.
The availability of observable inputs can vary from security to security and is affected by a wide variety of factors, including, but not limited to, the type of security, whether the security is new and not yet established in the marketplace, the liquidity of markets, and other characteristics particular to the security. To the extent that valuation is based on models or inputs that are less observable or unobservable in the market, the determination of fair value requires more judgment. Accordingly, the degree of judgment exercised in determining fair value is generally greatest for instruments categorized in Level 3. Due to the inherent uncertainty of valuation, the determination of values may differ significantly from values that would have been realized had a ready market for investments existed, and the differences could be material.
Fair value measurements: Each Subaccount invests substantially all of its investable assets among certain TVF subaccounts and the TVF subaccounts invest all of their investable assets in the Funds. The summary of the inputs used for valuing each Fund’s assets carried at fair value is discussed in the Investment Valuation section of the Funds’ Notes to Financial Statements. Descriptions of the valuation techniques applied to the Subaccounts’ significant categories of assets and liabilities measured at fair value on a recurring basis are as follows:
Investment companies: Certain investment companies are valued at the NAV as the practical expedient. These investment companies are not included within the fair value hierarchy. Certain other investment companies are valued at the actively traded NAV and no valuation adjustments are applied. These investment companies are categorized in Level 1 of the fair value hierarchy.
4. RISK FACTOR
Investing in the Subaccounts involves certain key risks related to the Subaccounts’ trading activity. Please reference the Subaccounts’ prospectus for a more complete discussion of the following risk(s), as well as other risks of investing in the Subaccounts.
Market risk: The market values of a Subaccount’s securities and other assets will fluctuate, sometimes sharply and unpredictably, due to changes in general market conditions, overall economic trends or events, governmental actions or interventions, actions taken by the U.S. Federal Reserve or foreign central banks, political developments, investor sentiment, public health emergencies such as a pandemic, and other factors that may or may not be related to the issuer of the security or other asset. The market prices of securities and other assets also may go down due to events or conditions that affect particular sectors, industries or issuers. Adverse market conditions may be prolonged and may not have the same impact on all types of securities or other assets.
| | |
| Transamerica Asset Allocation Variable Funds | | Annual Report 2020 |
Page 13
NOTES TO FINANCIAL STATEMENTS (continued)
At December 31, 2020
4. RISK FACTOR (continued)
Economies and financial markets throughout the world are increasingly interconnected. Economic, financial or political events, trading and tariff arrangements, public health events, terrorism, technology and data interruptions, natural disasters, and other circumstances in one or more countries or regions could be highly disruptive to, and have profound impacts on, global economies or markets. As a result, whether or not a Subaccount invests in securities of issuers located in or with significant exposure to the countries directly affected, the value and liquidity of a Subaccount’s investments may go down.
The COVID-19 pandemic has caused substantial market disruption around the world, including the U.S. There have been periods of extreme volatility, and periods where there have been no buyers for certain securities, including U.S. Treasury securities. Some sectors of the economy and individual issuers have experienced particularly large losses. The pandemic has reduced liquidity of particular investments and asset classes; resulted in significant disruptions to business operations, including business closures; strained healthcare systems; disrupted supply chains, consumer demand and employee availability; and restricted travel. These conditions may continue for an extended period of time, or worsen. The pandemic may result in a sustained domestic or global economic downturn or recession. Developing or emerging market countries may be more adversely impacted. The ultimate economic fallout from the pandemic, and the long-term impact on economies, markets, industries and individual issuers, are not known.
The U.S. government and the Federal Reserve, as well as certain foreign governments and central banks, have taken extraordinary actions to support local and global economies and the financial markets in response to the COVID-19 pandemic. These actions have resulted in significant expansion of public debt, including in the U.S. The long-term consequences of this level of public debt are not known. In addition, certain interest rates have been reduced to very low levels. This and other government intervention into the economy and financial markets to address the pandemic may not work as intended, particularly if the efforts are perceived by investors as being unlikely to achieve the desired results.
The COVID-19 pandemic could continue to adversely affect the value and liquidity of a Subaccount’s investments, impair a Subaccount’s ability to satisfy redemption requests, and negatively impact a Subaccount’s performance.
5. FEES AND OTHER AFFILIATED TRANSACTIONS
TAM, the Subaccounts’ investment manager, is directly owned by Transamerica Life Insurance Company (“TLIC”) and AUSA Holding, LLC (“AUSA”), both of which are indirect, wholly owned subsidiaries of Aegon NV. TLIC is owned by Commonwealth General Corporation (“Commonwealth”). Commonwealth and AUSA are wholly owned by Transamerica Corporation (DE). Transamerica Corporation (DE) is wholly owned by Aegon International B.V., which is wholly owned by Aegon NV, a Netherlands corporation, and a publicly traded international insurance group.
The Subaccounts purchase interests in the TVF, which in turn, purchase interests in the Funds. The net assets of the Subaccounts will reflect the investment management fee and other expenses incurred by the Funds. TAM serves as the investment manager to each Fund.
All Subaccount holdings in investment companies are considered affiliated. Realized and unrealized gains (losses) are broken out within the Statements of Operations.
Investment advisory fees: TAM provides general investment advice to each Subaccount pursuant to the investment advisory agreement. For its services, each Subaccount pays management fees accrued daily and payable monthly, at an annual rate equal to 0.20% of each Subaccount’s daily ANA.
TFLIC is the legal holder of the assets in the Subaccounts and will at all times maintain assets in the Subaccounts with a total market value of at least equal to the contract liabilities for the Subaccounts.
Certain managing board members and officers of TFLIC are also trustees, officers, or employees of TAM or its affiliates. No interested managing board member, who is deemed an interested person due to current or former service with TAM or an affiliate of TAM receives compensation from the Separate Account. Similarly, none of the Separate Account’s officers or interested trustees receive compensation from the Subaccounts. The independent board members of TFLIC are also trustees of the Funds, for which they receive fees.
Deferred compensation plan: Under a non-qualified deferred compensation plan effective January 1, 2008, (as amended and restated January 1, 2010), available to the trustees, compensation may be deferred that would otherwise be payable by the Separate Account to an independent trustee on a current basis for services rendered as trustee. Deferred compensation amounts will accumulate based on the value of the investment option, as elected by the trustee.
Brokerage commissions: The Subaccounts incurred no brokerage commissions on security transactions placed with affiliates of the investment manager or sub-adviser(s) for the year ended December 31, 2020.
| | |
| Transamerica Asset Allocation Variable Funds | | Annual Report 2020 |
Page 14
NOTES TO FINANCIAL STATEMENTS (continued)
At December 31, 2020
6. PURCHASES AND SALES OF SECURITIES
For the year ended December 31, 2020, the cost of securities purchased and proceeds from securities sold (excluding short-term securities) are as follows:
| | | | | | | | |
Subaccount
| | Purchases of
Securities | | | Sales of
Securities | |
Short Horizon | | $ | 3,742,251 | | | $ | 3,632,211 | |
Intermediate Horizon | | | 11,754,239 | | | | 13,340,682 | |
Intermediate/Long Horizon | | | 21,933,570 | | | | 24,925,961 | |
7. FEDERAL INCOME TAXES
The operations of the Separate Account form a part of, and are taxed with, the operations of TFLIC, a wholly-owned subsidiary of Aegon USA. TFLIC does not expect, based upon current tax law, to incur any income tax upon the earnings or realized capital gains attributable to the Separate Account. Based upon this expectation, no charges are currently being deducted from the Separate Account for federal income tax purposes. The Subaccounts recognize the tax benefits of uncertain tax positions only where the position is “more likely than not” to be sustained assuming examination by tax authorities. The Subaccounts’ tax returns remain subject to examination by the Internal Revenue Service and state tax authorities three years from the date of filing for federal purposes and four years from the date of filing for state purposes. Management has evaluated the Subaccounts’ tax provisions taken for all open tax years, and has concluded that no provision for income tax is required in the Subaccounts’ financial statements. If applicable, the Subaccounts recognize interest accrued related to unrecognized tax benefits in relation to interest and penalties expense in Other within the Statements of Operations. The Subaccounts identify their major tax jurisdictions as U.S. Federal, the state of Colorado, and foreign jurisdictions where the Subaccounts make significant investments; however, the Subaccounts are not aware of any tax positions for which it is reasonably possible that the total amounts of unrecognized tax benefits will change materially in the next twelve months.
8. LEGAL PROCEEDINGS
On September 30, 2020, Transamerica Asset Management, Inc. (“TAM”), the investment manager of the funds, entered into a settlement with the Securities and Exchange Commission (the “SEC”) relating to expense recaptures. The recaptures at issue, which TAM self-reported to the SEC, involved amounts previously voluntarily waived and/or reimbursed to four money market funds to prevent the funds from experiencing a negative yield. In some cases recaptures under the voluntary yield waiver arrangements exceeded contractual expense limits. The recaptured amounts were not reflected in the funds’ prospectus fee tables. The funds involved were Transamerica Government Money Market, Transamerica BlackRock Government Money Market VP, Transamerica Partners Government Money Market and Transamerica Partners Institutional Government Money Market. The two Transamerica Partners Government Money Market funds reorganized into Transamerica Government Money Market in October of 2017.
Under the settlement order, TAM agreed to pay affected fund investors approximately $5.3 million in disgorgement and approximately $690,000 in prejudgment interest. These amounts represent expenses incurred above the applicable expense limit (plus interest). TAM was also censured and ordered to cease and desist from committing or causing any violations of certain statutory provisions and SEC rules. The settlement order imposes no civil penalty on TAM based upon TAM having self-reported the matter, the prompt remedial steps taken by TAM, and TAM’s cooperation in the SEC staff’s investigation. The settlement order does not affect TAM’s ability to manage the funds.
The foregoing is only a brief summary of the settlement order. A copy of the settlement order is available on the SEC’s website at https://www.sec.gov.
The settlement had no impact on the Subaccounts’ financial statements.
| | |
| Transamerica Asset Allocation Variable Funds | | Annual Report 2020 |
Page 15
Report of Independent Registered Public Accounting Firm
To the Board of Directors of Transamerica Financial Life Insurance Company and the Contract holders of Transamerica Asset Allocation Variable Funds
Opinion on the Financial Statements
We have audited the accompanying statements of assets and liabilities of Transamerica Asset Allocation Variable Funds (the “Separate Account”) (comprising Transamerica Asset Allocation – Short Horizon Subaccount, Transamerica Asset Allocation – Intermediate Horizon Subaccount and Transamerica Asset Allocation – Intermediate/Long Horizon Subaccount) (collectively referred to as the “Subaccounts”), including the schedule of investments, as of December 31, 2020, and the related statements of operations for the year then ended, the statements of changes in net assets for each of the two years in the period then ended, the financial highlights for each of the five years in the period then ended and the related notes (collectively referred to as the “financial statements”). In our opinion, the financial statements present fairly, in all material respects, the financial position of each of the Subaccounts comprising Transamerica Asset Allocation Variable Funds at December 31, 2020, the results of their operations for the year then ended, the changes in their net assets for each of the two years in the period then ended and their financial highlights for each of the five years in the period then ended, in conformity with U.S. generally accepted accounting principles.
Basis for Opinion
These financial statements are the responsibility of the Separate Account’s management. Our responsibility is to express an opinion on the Subaccounts’ financial statements based on our audits. We are a public accounting firm registered with the Public Company Accounting Oversight Board (United States) (“PCAOB”) and are required to be independent with respect to the Separate Account in accordance with the U.S. federal securities laws and the applicable rules and regulations of the Securities and Exchange Commission and the PCAOB.
We conducted our audits in accordance with the standards of the PCAOB. Those standards require that we plan and perform the audit to obtain reasonable assurance about whether the financial statements are free of material misstatement, whether due to error or fraud. The Separate Account is not required to have, nor were we engaged to perform, an audit of the Separate Account’s internal control over financial reporting. As part of our audits, we are required to obtain an understanding of internal control over financial reporting, but not for the purpose of expressing an opinion on the effectiveness of the Separate Account’s internal control over financial reporting. Accordingly, we express no such opinion.
Our audits included performing procedures to assess the risks of material misstatement of the financial statements, whether due to error or fraud, and performing procedures that respond to those risks. Such procedures included examining, on a test basis, evidence regarding the amounts and disclosures in the financial statements. Our procedures included confirmation of securities owned as of December 31, 2020, by correspondence with the custodian and others, or by other appropriate auditing procedures where replies from others were not received. Our audits also included evaluating the accounting principles used and significant estimates made by management, as well as evaluating the overall presentation of the financial statements. We believe that our audits provide a reasonable basis for our opinion.

We have served as the auditor of one or more Transamerica investment companies since 1995.
Boston, Massachusetts
February 26, 2021
| | |
| Transamerica Asset Allocation Variable Funds | | Annual Report 2020 |
Page 16
Management of the Trust
Board Members and Officers
The members of the Board (“Board Members”) and executive officers of the Trust are listed below.
“Interested Board Member” means a board member who may be deemed an “interested person” (as that term is defined in the 1940 Act) of the Trust because of his current or former service with TAM or an affiliate of TAM. Interested Board Members may also be referred to herein as “Interested Trustees.” “Independent Board Member” means a Board Member who is not an “interested person” (as defined under the 1940 Act) of the Trust and may also be referred to herein as an “Independent Trustee.”
The Board governs each fund and is responsible for protecting the interests of the shareholders. The Board Members are experienced executives who meet periodically throughout the year to oversee the business affairs of each fund and the operation of each fund by its officers. The Board also reviews the management of each fund’s assets by the investment manager and its respective sub-adviser.
The funds are among the funds managed and sponsored by TAM (collectively, “Transamerica Fund Family”). The Transamerica Fund Family consists of (i) Transamerica Funds (“TF”); (ii) Transamerica Series Trust (“TST”); (iii) Transamerica ETF Trust (“TET”); and (iv) Transamerica Asset Allocation Variable Funds (“TAAVF”). As of the date of this Annual Report, Transamerica Fund Family consists of 121 funds. With the exception of Mr. Smit, none of the Board Members serve on the board of trustees of TET. TET is overseen by a separate board of trustees.
The mailing address of each Board Member is c/o Secretary, 1801 California Street, Suite 5200, Denver, Colorado 80202.
Further information about the Fund’s Board Members and Officers is available in the Fund’s Statement of Additional Information, which can be obtained without charge by calling 1-888-233-4339 or visiting the Fund’s website at www.transamerica.com.
The Board Members, their age, their positions with the Trust, and their principal occupations for at least the past five years (their titles may have varied during that period), the number of funds in the Transamerica Fund Family the Board oversees, and other board memberships they hold are set forth in the table below. The length of time served is provided from the date a Board Member became a member of the Board.
| | | | | | | | | | |
| Name and Age | | Position(s)
Held with
Trust | | Term of
Office and
Length
of Time
Served* | | Principal Occupation(s)
During Past Five Years | | Number of
Funds in
Complex
Overseen
by Board
Member | | Other
Directorships
Held By Board
Member
|
INTERESTED BOARD MEMBERS |
Marijn P. Smit (47) | | Chairman of the Board, President and Chief Executive Officer | | Since 2014 | | Chairman of the Board, President and Chief Executive Officer, TF, TST and TAAVF (2014 – present); Chairman of the Board, President and Chief Executive Officer, TET (2017 – present); Director, Chairman of the Board, President and Chief Executive Officer, Transamerica Asset Management, Inc. (“TAM”) and Transamerica Fund Services, Inc. (“TFS”) (2014 – present); Senior Vice President, Transamerica Retirement Solutions LLC (2012 – present); Trust Officer, Massachusetts Fidelity Trust Company
(2014 – present); Vice President, Transamerica Life Insurance Company
(2010 – 2016); | | 121 | | Director,
Massachusetts
Fidelity Trust
Company
(2014 – 2021);
Director,
Aegon Global
Funds (2016 –
present) |
| | |
| Transamerica Asset Allocation Variable Funds | | Annual Report 2020 |
Page 17
| | | | | | | | | | |
| Name and Age | | Position(s)
Held with
Trust | | Term of
Office and
Length
of Time
Served* | | Principal Occupation(s)
During Past Five Years | | Number of
Funds in
Complex
Overseen
by Board
Member | | Other
Directorships
Held By Board
Member
|
INTERESTED BOARD MEMBERS — continued |
| Marijn P. Smit (continued) | | | | | | Senior Vice President, Transamerica Financial Life Insurance Company
(2013 – 2016); Senior Vice President, Transamerica Retirement Advisors, Inc. (2013 – 2016) and President and Director, Transamerica Stable Value Solutions, Inc. (2010 – 2016). | | | | |
Alan F. Warrick (72) | | Board Member | | Since 2012 | | Board Member, TF, TST and TAAVF (2012 – present); Board Member, TPP, TPFG and TPFG II (2012 – 2018); Senior Advisor, Lovell Minnick Equity Partners (2010 – present); and Retired (2010). | | 116 | | N/A |
INDEPENDENT BOARD MEMBERS |
Sandra N. Bane (68) | | Board Member | | Since 2008 | | Retired (1999 – present); Board Member, TF, TST and TAAVF (2008 – present); Board Member, TPP, TPFG and TPFG II (2008 – 2018); and Partner, KPMG (1975 – 1999). | | 116 | | Big 5 Sporting
Goods
(2002 – present);
Southern
Company Gas
(energy services
holding
company)(2008 – present) |
Leo J. Hill (64) | | Lead Independent Board Member | | Since 2002 | | Principal, Advisor Network Solutions, LLC (business consulting) (2006 – present); Board Member, TST
(2001 – present); Board Member, TF
(2002 – present); Board Member, TAAVF
(2007 – present); Board Member, TPP, TPFG and TPFG II (2007 – 2018); Market President, Nations Bank of Sun Coast Florida
(1998 – 1999); Chairman, President and Chief Executive Officer, Barnett Banks of Treasure Coast Florida
(1994 – 1998); Executive Vice President and Senior Credit Officer, Barnett Banks of Jacksonville, Florida (1991 – 1994); and Senior Vice President and Senior Loan Administration Officer, Wachovia Bank of Georgia
(1976 – 1991). | | 116 | | Ameris Bancorp
(2013 – present);
Ameris Bank
(2013 – present) |
| | |
| Transamerica Asset Allocation Variable Funds | | Annual Report 2020 |
Page 18
| | | | | | | | | | |
| Name and Age | | Position(s)
Held with
Trust | | Term of
Office and
Length
of Time
Served* | | Principal Occupation(s)
During Past Five Years | | Number of
Funds in
Complex
Overseen
by Board
Member | | Other
Directorships
Held By Board
Member
|
INDEPENDENT BOARD MEMBERS — continued |
David W. Jennings (74) | | Board Member | | Since 2009 | | Board Member, TF, TST and TAAVF (2009 – present); Board Member, TPP, TPFG and TPFG II (2009 – 2018); Managing Director, Hilton Capital Management, LLC
(2010 – present). | | 116 | | N/A |
Fredric A. Nelson III (64) | | Board Member | | Since 2017 | | Board Member, TF, TST and TAAVF (2017 – present); Board Member, TPP, TPFG and TPFG II (2017 – 2018); Chief Investment Officer (“CIO”), Commonfund (2011 – 2015); Vice Chairman, CIO, ING Investment Management Americas (2003 – 2009); Managing Director, Head of U.S. Equity, JP Morgan Investment Management (1994 – 2003); and Managing Director, Head of Global Quantitative Investments Group, Bankers Trust Global Investment Management
(1981 – 1994). | | 116 | | N/A |
John E. Pelletier (56) | | Board Member | | Since 2017 | | Board Member, TF, TST and TAAVF (2017 – present); Board Member, TPP, TPFG and TPFG II (2017 – 2018); Director, Center for Financial Literacy, Champlain College (2010 – present); Co-Chair, Vermont Financial Literacy Commission with Vermont State Treasurer
(2015 – 2018); Chairman, Vermont Universal Children’s Higher Education Savings Account Program Advisory Committee
(2015 – present); Founder and Principal, Sterling Valley Consulting LLC (a financial services consulting firm)
(2009 – 2017); Independent Director, The Sentinel Funds and Sentinel Variable Products Trust
(2013 – 2017); Chief Legal Officer, Eaton Vance Corp. (2007 – 2008); and Executive Vice President and Chief Operating Officer
(2004 – 2007), General Counsel (1997 – 2004), Natixis Global Associates. | | 116 | | N/A |
| | |
| Transamerica Asset Allocation Variable Funds | | Annual Report 2020 |
Page 19
| | | | | | | | | | |
| Name and Age | | Position(s)
Held with
Trust | | Term of
Office and
Length
of Time
Served* | | Principal Occupation(s)
During Past Five Years | | Number of
Funds in
Complex
Overseen
by Board
Member | | Other
Directorships
Held By Board
Member
|
INDEPENDENT BOARD MEMBERS — continued |
Patricia L. Sawyer (70) | | Board Member | | Since 2007 | | Retired (2007 – present); President/Founder, Smith & Sawyer LLC (management consulting) (1989 – 2007); Board Member, TF and TST (2007 – present); Board Member, TAAVF
(1993 – present); Board Member, TPP, TPFG and TPFG II (1993 – 2018); and Trustee, Chair of Finance Committee and Chair of Nominating Committee
(1987 – 1996), Bryant University. | | 116 | | Honorary
Trustee,Bryant University
(1996 – present) |
John W. Waechter (69) | | Board Member | | Since 2005 | | Partner, Englander Fischer
(2016 – present); Attorney, Englander Fischer (2008 – 2015); Retired (2004 – 2008); Board Member, TST
(2004 – present); Board Member, TF
(2005 – present); Board Member, TAAVF
(2007 – present); Board Member, TPP, TPFG and TPFG II (2007 – 2018); Employee, RBC Dain Rauscher (securities dealer) (2004); Executive Vice President, Chief Financial Officer and Chief Compliance Officer, William R. Hough & Co. (securities dealer) (1979 – 2004); and Treasurer, The Hough Group of Funds (1993 – 2004). | | 116 | | Board Member,
Operation PAR,
Inc. (non-profit
organization)
(2008 – present);Board Member,
Remember Honor
Support, Inc.
(non-profit
organization)
(2013 – 2020); Board Member,
WRH Income
Properties, Inc.
(real estate)
(2014 – present); Board Member,
Boley PAR, Inc.
(non-profit
organization)
(2016 – present) |
| * | Each Board Member shall hold office until: 1) his or her successor is elected and qualified or 2) he or she resigns, retires or his or her term as a Board Member is terminated in accordance with the Trust’s Declaration of Trust. |
| | |
| Transamerica Asset Allocation Variable Funds | | Annual Report 2020 |
Page 20
OFFICERS
The mailing address of each officer is c/o Secretary, 1801 California Street, Suite 5200, Denver, CO 80202. The following table shows information about the officers, including their year of birth, their positions held with the Trust and their principal occupations during the past five years (their titles may have varied during that period). Each officer will hold office until his or her successor has been duly elected or appointed or until his or her earlier death, resignation or removal.
| | | | | | |
| Name and Age | | Position | | Term of Office
and Length of
Time Served* | | Principal Occupation(s) or Employment
During Past Five Years |
Marijn P. Smit (47) | | Chairman of the Board, President and Chief Executive Officer | | Since 2014 | | See Interested Board Members Table Above. |
Christopher A. Staples, CFA (50) | | Vice President and Chief Investment Officer, Advisory Services | | Since 2005 | | Vice President and Chief Investment Officer, Advisory Services, TF and TST (2007 – present); Vice President and Chief Investment Officer, TET (2017 – present); Vice President and Chief Investment Officer, Advisory Services, TAAVF (2007 – present); Vice President and Chief Investment Officer, Advisory Services, TPP, TPFG and TPFG II (2007 – 2018); Director (2005 – 2019), Senior Vice President
(2006 – present), Senior Director, Investments
(2016 – present), Chief Investment Officer, Advisory Services (2012 – 2016) and Lead Portfolio Manager (2007 – present), TAM; Director, TFS (2005 – 2019); Trust Officer, Massachusetts Fidelity Trust Company (2010 – present); Registered Representative (2007 – 2016), Transamerica Capital, Inc. (“TCI”); and Registered Representative, TFA
(2005 – present). |
Thomas R. Wald, CFA (60) | | Vice President and Chief Investment Officer | | Since 2014 | | Chief Investment Officer, TF, TST and TAAVF (2014 – present); TET (2017 – present); Chief Investment Officer, TPP, TPFG and TPFG II (2014 – 2018); Director (2017 – 2020), Akaan Transamerica, S.A. de C.V., Sociedad Operadora de Fondos de Inversión; Chief Investment Officer, Transamerica Investments & Retirement (2014 – 2020); Director, Transamerica Funds Services, Inc. (2019 – present); Director (2019 – present); Senior Vice President and Chief Investment Officer, TAM (2014 – present); Director, TFS (2019 – present); and Trust Officer, Massachusetts Fidelity Trust Company (2015 – present). |
| | |
| Transamerica Asset Allocation Variable Funds | | Annual Report 2020 |
Page 21
| | | | | | |
| Name and Age | | Position | | Term of Office
and Length of
Time Served* | | Principal Occupation(s) or Employment
During Past Five Years |
Vincent J. Toner (50) | | Vice President and Treasurer | | Since 2014 | | Vice President and Treasurer, TF, TST and TAAVF (2014 – present), Vice President and Treasurer (2017 – present), Vice President, Principal Financial Officer and Treasurer (2020 – present), TET; Vice President and Treasurer, TPP, TPFG and TPFG II (2014 – 2018); Vice President (2016 – present), Treasurer
(2016 – 2019), Vice President, Administration and Treasurer (2014 – 2016), TAM; Vice President, Administration and Treasurer
(2014 – 2019), Senior Vice President
(2019 – present), TFS; Vice President (2016 – present), TCI; and Trust Officer (2015 – present), Massachusetts Fidelity Trust Company. |
Francine J. Rosenberger (53) | | Chief Compliance Officer | | Since 2019 | | Chief Compliance Officer, TF, TST, TET and TAAVF (2019 – present); Chief Compliance Officer (2019 – present), TAM; and General Counsel, Corporate Secretary and Fund Chief Compliance Officer, Steben & Company, Inc. (2013 – 2019). |
Molly Possehl (42) | | Anti-Money Laundering Officer | | Since 2019 | | Anti-Money Laundering Officer, TF, TST, TET and TAAVF (2019 – present); Assistant General Counsel, Transamerica Life Insurance Company/Aegon USA
(2013 – present); and Anti-Money Laundering Compliance Officer and Fraud Officer, Transamerica Life Insurance Company/Aegon USA (2015 – present). |
Erin D. Nelson (43) | | Chief Legal Officer and Secretary | | Since 2019 | | Chief Legal Officer and Secretary, TF, TST, TET and TAAVF (2019 – present); Assistant General Counsel II and Assistant Secretary, TAM (2019 – present); Assistant Secretary (2019 – present), TFS; and Senior Vice President and Chief Compliance Officer, ALPS Advisors, Inc. (2015 – 2019). |
Peter Sattelmair (43) | | Assistant Treasurer | | Since 2018 | | Assistant Treasurer, TF, TST and TAAVF
(2018 – present); and Director, Fund Administration, TAM
(2014 – present). |
Timothy Bresnahan (52) | | Assistant Secretary | | Since 2020 | | Assistant Secretary, TF, TST and TAAVF
(2020 – present); Assistant Secretary (2019 – present), Secretary (2019), TET; and Senior Counsel, TAM (2008 – present). |
| * | Elected and serves at the pleasure of the Board of the Trust. |
| | |
| Transamerica Asset Allocation Variable Funds | | Annual Report 2020 |
Page 22
Appendix A
Calvert VP SRI Balanced Portfolio
(This page intentionally left blank)

Calvert
VP SRI Balanced Portfolio
Annual Report
December 31, 2020

Commodity Futures Trading Commission Registration. The Commodity Futures Trading Commission (“CFTC”) has adopted regulations that subject registered investment companies and advisers to regulation by the CFTC if a fund invests more than a prescribed level of its assets in certain CFTC-regulated instruments (including futures, certain options and swap agreements) or markets itself as providing investment exposure to such instruments. The adviser has claimed an exclusion from the definition of “commodity pool operator” under the Commodity Exchange Act with respect to its management of the Fund and the other funds it manages. Accordingly, neither the Fund nor the adviser is subject to CFTC regulation.
Fund shares are not insured by the FDIC and are not deposits or other obligations of, or guaranteed by, any depository institution. Shares are subject to investment risks, including possible loss of principal invested.
This report must be preceded or accompanied by a current summary prospectus or prospectus. Before investing, investors should consider carefully the investment objective, risks, and charges and expenses of a mutual fund. This and other important information is contained in the summary prospectus and prospectus, which can be obtained from a financial intermediary. Prospective investors should read the prospectus carefully before investing. For further information, please call 1-800-368-2745.
Annual Report December 31, 2020
Calvert
VP SRI Balanced Portfolio
Table of Contents
Calvert
VP SRI Balanced Portfolio
December 31, 2020
Management’s Discussion of Fund Performance†
Economic and Market Conditions
As the period opened in January 2020, news of a novel coronavirus outbreak in China began to raise investor concerns. As the virus —soon to be known as COVID-19 — turned into a global pandemic in February and March, it ended the longest-ever U.S. economic expansion and triggered a global economic slowdown. Economic activity declined dramatically and equity markets, along with credit markets, plunged in value amid unprecedented volatility.
In response, the U.S. Federal Reserve (the Fed) announced two emergency rate cuts in March 2020 — lowering the federal funds rate to 0.00%-0.25% — along with other measures designed to shore up equity and credit markets. At its July meeting, the Fed provided additional reassurances that it would use all the tools at its disposal to support the U.S. economy.
These actions helped calm investment markets and initiated a rally in equity and credit assets that began in April and lasted through most of the summer. As consumers started to emerge from COVID-19 lockdowns and factories gradually resumed production, stock and corporate bond prices reflected investor optimism.
Midway through August 2020, however, the bond market rally stalled, and equity prices retreated in September. Asset prices on Wall Street began to reflect the reality on Main Street, where COVID-19 cases were on the rise in nearly every state. Concerns about the economic outlook for fall and winter, uncertainties related to the presidential election, and the failure of Congress to pass additional stimulus relief weighed on asset prices throughout September and October.
But in the final two months of the period, equity and credit markets reversed course again. Joe Biden’s victory in the November presidential election eased political uncertainties that had dogged markets through much of the fall. The announcement that two COVID-19 vaccine candidates had proven more than 90% effective in late-stage trials — and the first distribution of vaccines in December — boosted investor optimism and asset prices.
For the period as a whole, the S&P 500® Index, a broad measure of U.S. stocks, returned 18.40%; the blue-chip Dow Jones Industrial Average® returned 9.72%; and the technology-laden Nasdaq Composite Index returned 44.92%, reflecting the dominance of technology stocks in the spring and summer rally. Small-cap U.S. stocks, as measured by the Russell 2000® Index, kept pace with their large-cap counterparts, as measured by the S&P 500® Index and Russell 1000® Index. As a group, growth stocks significantly outpaced value stocks, as measured by the Russell growth and value indexes.
Meanwhile, most fixed-income asset classes delivered positive returns during the period. The Bloomberg Barclays U.S. Aggregate Bond Index, a broad measure of the U.S. bond market, returned 7.51%. As corporate bonds benefited from Fed policy — which included purchases of corporate investment- grade debt and high yield ETFs — the Bloomberg Barclays U.S. Corporate Bond Index
returned 9.89%. High yield bonds, which had fared poorly early in the period, outperformed investment-grade bonds in the second half of the period, and the Bloomberg Barclays U.S. Corporate High Yield Index returned 7.11% for the period as a whole.
Fund Performance
For the 12-month period ended December 31, 2020, Calvert VP SRI Balanced Portfolio (the Fund) returned 15.26% for Class I shares at net asset value (NAV), underperforming its primary benchmark, the Russell 1000® Index (the Index), which returned 20.96%; and underperforming its blended benchmark, an internally constructed benchmark composed of a blend of 60% Russell 1000® Index and 40% Bloomberg Barclays U.S. Aggregate Bond Index, which returned 16.29%.
Stock selection in the information technology, financials, and industrials sectors in the equity portion of the Fund detracted from performance relative to the Index. Short duration positioning in the fixed-income portion of the Fund also detracted from relative performance during the period.
American International Group, Inc. (AIG), an international finance and insurance company, detracted from performance relative to the Index. AIG’s stock price fell on investor concerns over the lack of transparency in the company’s insurance business. Shares also fell on the potential for escalating liabilities in the company’s life insurance business because of deaths from COVID-19. By period-end, the stock was sold from the Fund.
The Fund’s lack of exposure to Tesla, Inc. (Tesla) also detracted from returns relative to the Index. Tesla’s stock price rose sharply on an increase in the company’s automobile sales and increasing awareness of the company’s leadership in battery technology.
In the fixed-income portion of the Fund, security selection within commercial mortgage-backed securities and mortgage-backed securities weighed on performance relative to the Index during the period. The shorter duration positioning of the fixed-income portion of the Fund also detracted from returns relative to the Index.
Sector-allocation positioning and security selection overall in the fixed-income portion of the Fund contributed to returns relative to the Index. In the equity portion of the Fund, an underweight exposure to the energy sector and stock selection in health care and communication services contributed positively to relative returns.
PayPal Holdings, Inc., the online payments company, contributed to performance relative to the Index during the period. The stock price rose as the economy shut down toward the end of March when many traditional brick-and-mortar stores closed, and e-commerce became the primary method of purchasing goods.
Amazon.com, Inc. (Amazon), the e-commerce giant, also aided relative results during the period. As the coronavirus pandemic forced consumers in U.S. and overseas markets to stay at home, Amazon benefited from an accelerating shift to online purchasing and a significant rise in subscriptions to its Amazon Prime service, which offers fast shipping and streaming online entertainment.
See Endnotes and Additional Disclosures in this report.
Past performance is no guarantee of future results. Returns are historical and are calculated by determining the percentage change in net asset value (NAV) or offering price (as applicable) with all distributions reinvested. Investment return and principal value will fluctuate so that shares, when redeemed, may be worth more or less than their original cost. Performance for periods less than or equal to one year is cumulative. Performance is for the stated time period only; due to market volatility, current Fund performance may be lower or higher than the quoted return.
2
Calvert
VP SRI Balanced Portfolio
December 31, 2020
Management’s Discussion of Fund Performance† — continued
In the fixed-income portion of the Fund, security selection within investment-grade credits and government-related securities were especially beneficial. Its overweight exposure to high yield securities and asset-backed securities also enhanced relative returns during the period.
See Endnotes and Additional Disclosures in this report.
Past performance is no guarantee of future results. Returns are historical and are calculated by determining the percentage change in net asset value (NAV) or offering price (as applicable) with all distributions reinvested. Investment return and principal value will fluctuate so that shares, when redeemed, may be worth more or less than their original cost. Performance for periods less than or equal to one year is cumulative. Performance is for the stated time period only; due to market volatility, current Fund performance may be lower or higher than the quoted return.
3
Calvert
VP SRI Balanced Portfolio
December 31, 2020
Performance
Portfolio Managers Vishal Khanduja, CFA, Brian S. Ellis, CFA and Charles B. Gaffney, each of Calvert Research and Management
| | | | | | | | | | | | | | | | | | |
| % Average Annual Total Returns1,2 | | Class Inception Date | | | Performance Inception Date | | | One Year | | | Five Years | | | Ten Years |
Class I at NAV | | | 09/02/1986 | | | | 09/02/1986 | | | | 15.26% | | | | 10.94% | | | 9.40% |
Class F at NAV | | | 10/18/2013 | | | | 09/02/1986 | | | | 14.76 | | | | 10.59 | | | 9.14 |
| | | | | |
| | | | | | | | | | | | | | | | | | |
Russell 1000® Index | | | — | | | | — | | | | 20.96% | | | | 15.58% | | | 14.00% |
Bloomberg Barclays U.S. Aggregate Bond Index | | | — | | | | — | | | | 7.51 | | | | 4.43 | | | 3.84 |
Balanced Blended Benchmark | | | — | | | | — | | | | 16.29 | | | | 11.35 | | | 10.11 |
| | | | | |
| % Total Annual Operating Expense Ratios3 | | | | | | | | | | | Class I | | | Class F |
| | | | | |
| | | | | | | | | | | | | | | 0.62% | | | 0.86% |
Growth of $10,000
This graph shows the change in value of a hypothetical investment of $10,000 in Class I of the Fund for the period indicated. For comparison, the same investment is shown in the indicated index.
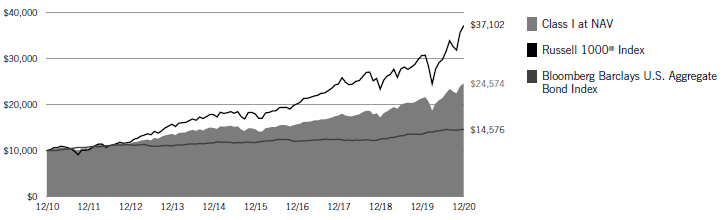
| | | | | | | | | | | | | | |
| Growth of Investment2 | | Amount Invested | | | Period Beginning | | | At NAV | | With Maximum Sales Charge | |
| | | | |
Class F | | | $10,000 | | | | 12/31/2010 | | | $24,002 | | | N.A. | |
See Endnotes and Additional Disclosures in this report.
Past performance is no guarantee of future results. Returns are historical and are calculated by determining the percentage change in net asset value (NAV) or offering price (as applicable) with all distributions reinvested. Investment return and principal value will fluctuate so that shares, when redeemed, may be worth more or less than their original cost. Performance for periods less than or equal to one year is cumulative. Performance is for the stated time period only; due to market volatility, current Fund performance may be lower or higher than the quoted return.
4
Calvert
VP SRI Balanced Portfolio
December 31, 2020
Fund Profile
Asset Allocation (% of total investments)
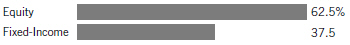
Equity Investments Sector Allocation (% of total investments)
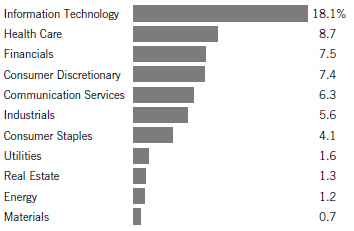
Fixed-Income Allocation (% of total investments)
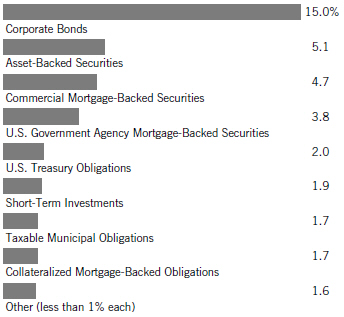
See Endnotes and Additional Disclosures in this report.
5
Calvert
VP SRI Balanced Portfolio
December 31, 2020
Endnotes and Additional Disclosures
| † | The views expressed in this report are those of the portfolio manager(s) and are current only through the date stated at the top of this page. These views are subject to change at any time based upon market or other conditions, and Calvert and the Fund(s) disclaim any responsibility to update such views. These views may not be relied upon as investment advice and, because investment decisions are based on many factors, may not be relied upon as an indication of trading intent on behalf of any Calvert fund. This commentary may contain statements that are not historical facts, referred to as “forward-looking statements.” The Fund’s actual future results may differ significantly from those stated in any forward-looking statement, depending on factors such as changes in securities or financial markets or general economic conditions, the volume of sales and purchases of Fund shares, the continuation of investment advisory, administrative and service contracts, and other risks discussed from time to time in the Fund’s filings with the Securities and Exchange Commission. |
| 1 | Russell 1000® Index is an unmanaged index of 1,000 U.S. large-cap stocks. Bloomberg Barclays U.S. Aggregate Bond Index is an unmanaged index of domestic investment-grade bonds, including corporate, government and mortgage-backed securities. The Balanced Blended Benchmark is an internally constructed benchmark comprised of a blend of 60% Russell 1000® Index and 40% Bloomberg Barclays U.S. Aggregate Bond Index, and is rebalanced monthly. Prior to 11/1/15, the fixed-income component was the Bloomberg Barclays U.S. Credit Index. Unless otherwise stated, index returns do not reflect the effect of any applicable sales charges, commissions, expenses, taxes or leverage, as applicable. It is not possible to invest directly in an index. |
| 2 | There is no sales charge. Insurance-related charges are not included in the calculation of returns. If such charges were reflected, the returns would be lower. Please refer to the report for your insurance contract for performance data reflecting insurance-related charges. |
Performance prior to the inception date of a class may be linked to the performance of an older class of the Fund. This linked performance is adjusted for any applicable sales charge, but is not adjusted for class expense differences. If adjusted for such differences, the performance would be different. The performance of Class F is linked to Class I. Performance presented in the Financial Highlights included in the financial statements is not linked.
Calvert Research and Management became the investment adviser to the Fund on December 31, 2016. Performance reflected prior to such date is that of the Fund’s former investment adviser.
| 3 | Source: Fund prospectus. The expense ratios for the current reporting period can be found in the Financial Highlights section of this report. |
Fund profile subject to change due to active management.
Additional Information
S&P 500® Index is an unmanaged index of large-cap stocks commonly used as a measure of U.S. stock market performance. Dow Jones Industrial Average® is a price-weighted average of 30 blue-chip stocks that are generally the leaders in their industry. S&P Dow Jones Indices are a product of S&P Dow Jones Indices LLC (“S&P DJI”) and have been licensed for use. S&P® and S&P 500® are registered trademarks of S&P DJI; Dow Jones® is a registered trademark of Dow Jones Trademark Holdings LLC (“Dow Jones”); S&P DJI, Dow Jones and their respective affiliates do not sponsor, endorse, sell or promote the Fund, will not have any liability with respect thereto and do not have any liability for any errors, omissions, or interruptions of the S&P Dow Jones Indices. Nasdaq Composite Index is a market capitalization-weighted index of all domestic and international securities listed on Nasdaq. Source: Nasdaq, Inc. The information is provided by Nasdaq (with its affiliates, are referred to as the “Corporations”) and Nasdaq’s third party licensors on an “as is” basis and the Corporations make no guarantees and bear no liability of any kind with respect to the information or the Fund. Russell 2000® Index is an unmanaged index of 2,000 U.S. small- cap stocks. Bloomberg Barclays U.S. Corporate Bond Index measures the performance of investment-grade U.S. corporate securities with a maturity of one year or more. Bloomberg Barclays U.S. Corporate High Yield Index measures USD-denominated, non-investment grade corporate securities.
Duration is a measure of the expected change in price of a bond — in percentage terms — given a one percent change in interest rates, all else being constant. Securities with lower durations tend to be less sensitive to interest rate changes.
6
Calvert
VP SRI Balanced Portfolio
December 31, 2020
Fund Expenses
Example
As a Fund shareholder, you incur ongoing costs, including management fees; distribution and/or service fees; and other Fund expenses. This Example is intended to help you understand your ongoing costs (in dollars) of Fund investing and to compare these costs with the ongoing costs of investing in other mutual funds. The Example is based on an investment of $1,000 invested at the beginning of the period and held for the entire period (July 1, 2020 to December 31, 2020).
Actual Expenses
The first section of the table below provides information about actual account values and actual expenses. You may use the information in this section, together with the amount you invested, to estimate the expenses that you paid over the period. Simply divide your account value by $1,000 (for example, an $8,600 account value divided by $1,000 = 8.6), then multiply the result by the number in the first section under the heading entitled “Expenses Paid During Period” to estimate the expenses you paid on your account during this period.
Hypothetical Example for Comparison Purposes
The second section of the table below provides information about hypothetical account values and hypothetical expenses based on the actual Fund expense ratio and an assumed rate of return of 5% per year (before expenses), which is not the actual Fund return. The hypothetical account values and expenses may not be used to estimate the actual ending account balance or expenses you paid for the period. You may use this information to compare the ongoing costs of investing in the Fund and other funds. To do so, compare this 5% hypothetical example with the 5% hypothetical examples that appear in the shareholder reports of the other funds.
Please note that the expenses shown in the table are meant to highlight your ongoing costs only and do not reflect expenses and charges which are, or may be imposed under the variable annuity contract or variable life insurance policy (variable contracts) (if applicable) through which your investment in the Fund is made. Therefore, the second section of the table is useful in comparing ongoing costs associated with an investment in vehicles which fund benefits under variable contracts, and will not help you determine the relative total costs of investing in the Fund through variable contracts. In addition, if these expenses and charges imposed under the variable contracts were included, your costs would have been higher.
| | | | | | | | | | | | | | | | |
| | | Beginning
Account Value
(7/1/20) | | | Ending
Account Value
(12/31/20) | | | Expenses Paid
During Period*
(7/1/20 –12/31/20) | | | Annualized
Expense
Ratio | |
Actual | | | | | | | | | | | | | | | | |
Class I | | | $1,000.00 | | | | $1,147.60 | | | | $3.29 | | | | 0.61% | |
Class F | | | $1,000.00 | | | | $1,147.60 | | | | $4.64 | | | | 0.86% | |
| | | | |
Hypothetical | | | | | | | | | | | | | | | | |
(5% return per year before expenses) | | | | | | | | | | | | | | | | |
Class I | | | $1,000.00 | | | | $1,022.07 | | | | $3.10 | | | | 0.61% | |
Class F | | | $1,000.00 | | | | $1,020.81 | | | | $4.37 | | | | 0.86% | |
| * | Expenses are equal to the Fund’s annualized expense ratio for the indicated Class, multiplied by the average account value over the period, multiplied by 184/366 (to reflect the one-half year period). The Example assumes that the $1,000 was invested at the net asset value per share determined at the close of business on June 30, 2020. Expenses shown do not include insurance-related charges. |
7
Calvert
VP SRI Balanced Portfolio
December 31, 2020
Schedule of Investments
| | | | | | |
Asset-Backed Securities — 5.3% |
| | |
| Security | | Principal
Amount
(000’s omitted) | | | Value |
| | |
Adams Outdoor Advertising, L.P., Series 2018-1, Class A, 4.81%, 11/15/48(1) | | $ | 163 | | | $ 171,901 |
| | |
Business Jet Securities, LLC, Series 2020-1A, Class A, 2.981%, 11/15/35(1) | | | 97 | | | 98,638 |
| | |
Coinstar Funding, LLC, Series 2017-1A, Class A2, 5.216%, 4/25/47(1) | | | 917 | | | 896,060 |
| | |
Conn’s Receivables Funding, LLC: | | | | | | |
| | |
Series 2019-A, Class A, 3.40%, 10/16/23(1) | | | 74 | | | 74,385 |
| | |
Series 2019-A, Class B, 4.36%, 10/16/23(1) | | | 114 | | | 114,040 |
| | |
Series 2019-B, Class A, 2.66%, 6/17/24(1) | | | 86 | | | 86,161 |
| | |
Series 2019-B, Class B, 3.62%, 6/17/24(1) | | | 135 | | | 135,475 |
| | |
Series 2020-A, Class B, 4.27%, 6/16/25(1) | | | 100 | | | 100,476 |
| | |
DB Master Finance, LLC, Series 2017-1A, Class A2II, 4.03%,
11/20/47(1) | | | 83 | | | 87,884 |
| | |
DRB Prime Student Loan Trust, Series 2016-B, Class A2, 2.89%, 6/25/40(1) | | | 50 | | | 50,884 |
| | |
Driven Brands Funding, LLC: | | | | | | |
| | |
Series 2018-1A, Class A2, 4.739%, 4/20/48(1) | | | 62 | | | 66,500 |
| | |
Series 2019-2A, Class A2, 3.981%, 10/20/49(1) | | | 139 | | | 146,082 |
| | |
ExteNet, LLC: | | | | | | |
| | |
Series 2019-1A, Class A2, 3.204%, 7/26/49(1) | | | 345 | | | 358,526 |
| | |
Series 2019-1A, Class B, 4.14%, 7/26/49(1) | | | 30 | | | 30,698 |
| | |
FOCUS Brands Funding, LLC: | | | | | | |
| | |
Series 2017-1A, Class A2I, 3.857%, 4/30/47(1) | | | 569 | | | 571,451 |
| | |
Series 2017-1A, Class A2II, 5.093%, 4/30/47(1) | | | 174 | | | 167,185 |
| | |
Hardee’s Funding, LLC, Series 2020-1A, Class A2, 3.981%, 12/20/50(1) | | | 180 | | | 185,456 |
| | |
InSite Issuer, LLC: | | | | | | |
| | |
Series 2016-1A, Class A, 2.883%, 11/15/46(1) | | | 140 | | | 144,795 |
| | |
Series 2016-1A, Class C, 6.414%, 11/15/46(1) | | | 25 | | | 26,960 |
| | |
Jack in the Box Funding, LLC, Series 2019-1A, Class A2I, 3.982%,
8/25/49(1) | | | 402 | | | 413,961 |
| | |
Jersey Mike’s Funding, Series 2019-1A, Class A2, 4.433%, 2/15/50(1) | | | 281 | | | 301,960 |
| | |
Marlette Funding Trust, Series 2020-2A, Class B, 1.83%, 9/16/30(1) | | | 175 | | | 177,006 |
| | |
Mosaic Solar Loan Trust: | | | | | | |
| | |
Series 2019-1A, Class A, 4.37%, 12/21/43(1) | | | 297 | | | 319,814 |
| | |
Series 2019-2A, Class B, 3.28%, 9/20/40(1) | | | 820 | | | 850,970 |
| | |
Series 2020-1A, Class A, 2.10%, 4/20/46(1) | | | 89 | | | 91,393 |
| | |
Series 2020-1A, Class B, 3.10%, 4/20/46(1) | | | 89 | | | 93,587 |
| | |
Series 2020-2A, Class A, 1.44%, 8/20/46(1) | | | 156 | | | 155,569 |
| | |
Series 2020-2A, Class B, 2.21%, 8/20/46(1) | | | 186 | | | 184,856 |
| | |
OneMain Financial Issuance Trust: | | | | | | |
| | |
Series 2016-3A, Class A, 3.83%, 6/18/31(1) | | | 300 | | | 306,206 |
| | |
Series 2017-1A, Class A1, 2.37%, 9/14/32(1) | | | 108 | | | 108,357 |
| | | | | | |
| | |
| Security | | Principal
Amount
(000’s omitted) | | | Value |
| | |
Oportun Funding IX, LLC, Series 2018-B, Class A, 3.91%, 7/8/24(1) | | $ | 404 | | | $ 407,138 |
| | |
Oportun Funding VIII, LLC, Series 2018-A, Class A, 3.61%, 3/8/24(1) | | | 706 | | | 706,000 |
| | |
Planet Fitness Master Issuer, LLC: | | | | | | |
| | |
Series 2018-1A, Class A2I, 4.262%, 9/5/48(1) | | | 494 | | | 494,706 |
| | |
Series 2018-1A, Class A2II, 4.666%, 9/5/48(1) | | | 68 | | | 68,480 |
| | |
Series 2019-1A, Class A2, 3.858%, 12/5/49(1) | | | 277 | | | 262,459 |
| | |
Prosper Marketplace Issuance Trust, Series 2017-1A, Class C, 5.80%, 6/15/23(1) | | | 19 | | | 18,816 |
| | |
RenewFund Receivables Trust, Series 2015-1, Class A, 3.51%, 4/15/25(1) | | | 10 | | | 10,206 |
| | |
ServiceMaster Funding, LLC: | | | | | | |
| | |
Series 2020-1, Class A2I, 2.841%, 1/30/51(1) | | | 161 | | | 165,053 |
| | |
Series 2020-1, Class A2II, 3.337%, 1/30/51(1) | | | 182 | | | 186,244 |
| | |
SERVPRO Master Issuer, LLC, Series 2019-1A, Class A2, 3.882%, 10/25/49(1) | | | 1,145 | | | 1,227,917 |
| | |
Small Business Lending Trust: | | | | | | |
| | |
Series 2019-A, Class A,
2.85%, 7/15/26(1) | | | 113 | | | 112,153 |
| | |
Series 2020-A, Class A, 2.62%, 12/15/26(1) | | | 125 | | | 124,682 |
| | |
SolarCity LMC Series I, LLC, Series 2013-1, Class A, 4.80%, 11/20/38(1) | | | 295 | | | 290,215 |
| | |
SolarCity LMC Series II, LLC, Series 2014-1, Class A, 4.59%, 4/20/44(1) | | | 184 | | | 182,735 |
| | |
SolarCity LMC Series III, LLC: | | | | | | |
| | |
Series 2014-2, Class A,
4.02%, 7/20/44(1) | | | 526 | | | 536,353 |
| | |
Series 2014-2, Class B,
5.44%, 7/20/44(1) | | | 847 | | | 867,351 |
| | |
Sonic Capital, LLC, Series 2020-1A, Class A2I, 3.845%, 1/20/50(1) | | | 717 | | | 768,967 |
| | |
SpringCastle America Funding, LLC, Series 2020-AA, Class A, 1.97%, 9/25/37(1) | | | 490 | | | 494,680 |
| | |
Spruce ABS Trust, Series 2016-E1, Class A, 4.32%, 6/15/28(1) | | | 17 | | | 17,515 |
| | |
Stack Infrastructure Issuer, LLC: | | | | | | |
| | |
Series 2019-1A, Class A2, 4.54%, 2/25/44(1) | | | 2,233 | | | 2,397,376 |
| | |
Series 2019-2A, Class A2, 3.08%, 10/25/44(1) | | | 175 | | | 182,159 |
| | |
Sunnova Sol II Issuer, LLC, Series 2020-2A, Class A, 2.73%, 11/1/55(1) | | | 575 | | | 579,941 |
| | |
Sunnova Sol Issuer, LLC, Series 2020-1A, Class A, 3.35%, 2/1/55(1) | | | 103 | | | 109,762 |
| | |
Sunrun Atlas Issuer, LLC, Series 2019-2, Class A, 3.61%, 2/1/55(1) | | | 215 | | | 230,160 |
| | |
Sunrun Callisto Issuer, LLC, Series 2015-1A, Class B, 5.38%, 7/20/45(1) | | | 316 | | | 313,273 |
| | |
Sunrun Xanadu Issuer, LLC, Series 2019-1A, Class A, 3.98%, 6/30/54(1) | | | 188 | | | 198,658 |
| | |
TES, LLC, Series 2017-1A, Class A, 4.33%, 10/20/47(1) | | | 368 | | | 378,439 |
| | |
Tesla Auto Lease Trust: | | | | | | |
| | |
Series 2018-B, Class A,
3.71%, 8/20/21(1) | | | 319 | | | 321,671 |
| | |
Series 2019-A, Class A2, 2.13%, 4/20/22(1) | | | 102 | | | 102,818 |
| | | | |
| | 8 | | See Notes to Financial Statements. |
Calvert
VP SRI Balanced Portfolio
December 31, 2020
Schedule of Investments — continued
| | | | | | |
| Security | | Principal
Amount
(000’s omitted) | | | Value |
| | |
Tesla Auto Lease Trust: (continued) | | | | | | |
| | |
Series 2019-A, Class A3, 2.16%, 10/20/22(1) | | $ | 815 | | | $ 832,929 |
| | |
Series 2019-A, Class A4, 2.20%, 11/21/22(1) | | | 170 | | | 174,316 |
| | |
Series 2020-A, Class A3, 0.68%, 12/20/23(1) | | | 65 | | | 65,406 |
| | |
Series 2020-A, Class A4, 0.78%, 12/20/23(1) | | | 81 | | | 81,598 |
| | |
United States Small Business Administration, Series 2017-20E, Class 1, 2.88%, 5/1/37 | | | 634 | | | 690,363 |
| | |
Vantage Data Centers Issuer, LLC: | | | | | | |
| | |
Series 2018-2A, Class A2, 4.196%, 11/16/43(1) | | | 78 | | | 81,472 |
| | |
Series 2019-1A, Class A2, 3.188%, 7/15/44(1) | | | 518 | | | 543,368 |
| | |
Series 2020-2A, Class A2, 1.992%, 9/15/45(1) | | | 570 | | | 576,110 |
| | |
Vivint Solar Financing VII, LLC, Series 2020-1A, Class A, 2.21%, 7/31/51(1) | | | 410 | | | 423,394 |
| | |
Willis Engine Structured Trust V, Series 2020-A, Class B, 4.212%, 3/15/45(1) | | | 237 | | | 177,359 |
| | |
Total Asset-Backed Securities
(identified cost $21,431,605) | | | | | | $21,919,478 |
|
Collateralized Mortgage-Backed Obligations — 1.7% |
| | |
| Security | | Principal
Amount
(000’s omitted) | | | Value |
| | |
Federal Home Loan Mortgage Corp. Structured Agency Credit Risk Debt Notes: | | | | | | |
| | |
Series 2015-HQ2, Class M3, 3.398%, (1 mo. USD LIBOR + 3.25%), 5/25/25(2) | | $ | 471 | | | $ 480,436 |
| | |
Series 2017-DNA3, Class M2, 2.648%, (1 mo. USD LIBOR + 2.50%), 3/25/30(2) | | | 600 | | | 608,731 |
| | |
Series 2018-DNA1, Class M2, 1.948%, (1 mo. USD LIBOR + 1.80%), 7/25/30(2) | | | 264 | | | 261,590 |
| | |
Series 2018-DNA1, Class M2AT, 1.198%, (1 mo. USD LIBOR + 1.05%), 7/25/30(2) | | | 343 | | | 342,452 |
| | |
Series 2019-DNA2, Class M2, 2.598%, (1 mo. USD LIBOR + 2.45%), 3/25/49(1)(2) | | | 67 | | | 67,288 |
| | |
Series 2019-DNA3, Class M2, 2.198%, (1 mo. USD LIBOR + 2.05%), 7/25/49(1)(2) | | | 757 | | | 752,809 |
| | |
Series 2019-DNA4, Class M2, 2.098%, (1 mo. USD LIBOR + 1.95%), 10/25/49(1)(2) | | | 319 | | | 318,699 |
| | |
Series 2019-HQA2, Class M2, 2.198%, (1 mo. USD LIBOR + 2.05%), 4/25/49(1)(2) | | | 34 | | | 33,888 |
| | |
Series 2020-DNA1, Class M1, 0.848%, (1 mo. USD LIBOR + 0.70%), 1/25/50(1)(2) | | | 47 | | | 47,140 |
| | |
Series 2020-DNA2, Class M1, 0.898%, (1 mo. USD LIBOR + 0.75%), 2/25/50(1)(2) | | | 242 | | | 242,253 |
| | |
Series 2020-DNA4, Class M1, 1.648%, (1 mo. USD LIBOR + 1.50%), 8/25/50(1)(2) | | | 102 | | | 102,872 |
| | |
Series 2020-DNA4, Class M2, 3.898%, (1 mo. USD LIBOR + 3.75%), 8/25/50(1)(2) | | | 35 | | | 35,399 |
| | |
Series 2020-DNA5, Class M1, 1.377%, (SOFR + 1.30%),
10/25/50(1)(2) | | | 165 | | | 165,834 |
| | | | | | |
| Security | | Principal
Amount
(000’s omitted) | | | Value |
| | |
Federal Home Loan Mortgage Corp. Structured Agency Credit Risk Debt Notes: (continued) | | | | | | |
| | |
Series 2020-DNA5, Class M2, 2.877%, (SOFR + 2.80%),
10/25/50(1)(2) | | $ | 130 | | | $131,709 |
| | |
Series 2020-DNA6, Class B1, 3.077%, (SOFR + 3.00%),
12/25/50(1)(2) | | | 25 | | | 25,145 |
| | |
Series 2020-DNA6, Class M2, 2.077%, (SOFR + 2.00%),
12/25/50(1)(2) | | | 280 | | | 280,409 |
| | |
Series 2020-HQA1, Class M1, 0.898%, (1 mo. USD LIBOR + 0.75%), 1/25/50(1)(2) | | | 27 | | | 27,100 |
| | |
Federal National Mortgage Association Connecticut Avenue Securities: | | | | | | |
| | |
Series 2013-C01, Class M2, 5.398%, (1 mo. USD LIBOR + 5.25%),
10/25/23(2) | | | 262 | | | 268,118 |
| | |
Series 2014-C02, Class 1M2, 2.748%, (1 mo. USD LIBOR + 2.60%), 5/25/24(2) | | | 502 | | | 489,901 |
| | |
Series 2014-C02, Class 2M2, 2.748%, (1 mo. USD LIBOR + 2.60%), 5/25/24(2) | | | 122 | | | 120,689 |
| | |
Series 2014-C03, Class 1M2, 3.148%, (1 mo. USD LIBOR + 3.00%), 7/25/24(2) | | | 304 | | | 299,101 |
| | |
Series 2014-C03, Class 2M2, 3.048%, (1 mo. USD LIBOR + 2.90%), 7/25/24(2) | | | 194 | | | 194,275 |
| | |
Series 2014-C04, Class 1M2, 5.048%, (1 mo. USD LIBOR + 4.90%), 11/25/24(2) | | | 403 | | | 414,000 |
| | |
Series 2017-C05, Class 1M2, 2.348%, (1 mo. USD LIBOR + 2.20%), 1/25/30(2) | | | 146 | | | 145,906 |
| | |
Series 2017-C06, Class 1M2, 2.798%, (1 mo. USD LIBOR + 2.65%), 2/25/30(2) | | | 238 | | | 239,792 |
| | |
Series 2018-C06, Class 1M2, 2.148%, (1 mo. USD LIBOR + 2.00%), 3/25/31(2) | | | 23 | | | 23,015 |
| | |
Series 2018-R07, Class 1M2, 2.548%, (1 mo. USD LIBOR + 2.40%), 4/25/31(1)(2) | | | 263 | | | 263,452 |
| | |
Series 2019-R02, Class 1M2, 2.448%, (1 mo. USD LIBOR + 2.30%), 8/25/31(1)(2) | | | 30 | | | 29,502 |
| | |
Series 2019-R05, Class 1M2, 2.148%, (1 mo. USD LIBOR + 2.00%), 7/25/39(1)(2) | | | 73 | | | 72,570 |
| | |
Series 2020-R01, Class 1M1, 0.948%, (1 mo. USD LIBOR + 0.80%), 1/25/40(1)(2) | | | 145 | | | 145,535 |
| | |
Federal National Mortgage Association Grantor Trust, Series 2017-T1, Class A, 2.898%, 6/25/27 | | | 274 | | | 304,051 |
| | |
Toorak Mortgage Corp., Ltd.: | | | | | | |
| | |
Series 2018-1, Class A1, 4.336% to 4/25/21, 8/25/21(1)(3) | | | 71 | | | 71,190 |
| | |
Series 2020-1, Class A1, 2.734% to 1/25/23, 3/25/23(1)(3) | | | 250 | | | 253,451 |
| | |
Total Collateralized Mortgage-Backed Obligations
(identified cost $7,288,126) | | | | | | $ 7,258,302 |
|
Commercial Mortgage-Backed Securities — 4.9% |
| | |
| Security | | Principal
Amount
(000’s omitted) | | | Value |
| | |
BAMLL Commercial Mortgage Securities Trust: | | | | | | |
| | |
Series 2019-BPR, Class DNM, 3.719%, 11/5/32(1)(4) | | $ | 695 | | | $ 593,225 |
| | | | |
| | 9 | | See Notes to Financial Statements. |
Calvert
VP SRI Balanced Portfolio
December 31, 2020
Schedule of Investments — continued
| | | | | | |
| Security | | Principal
Amount
(000’s omitted) | | | Value |
| | |
BAMLL Commercial Mortgage Securities Trust: (continued) | | | | | | |
| | |
Series 2019-BPR, Class ENM, 3.719%, 11/5/32(1)(4) | | $ | 325 | | | $ 265,788 |
| | |
Series 2019-BPR, Class FNM, 3.719%, 11/5/32(1)(4) | | | 485 | | | 357,662 |
| | |
BX Commercial Mortgage Trust: | | | | | | |
| | |
Series 2019-XL, Class A, 1.079%, (1 mo. USD LIBOR + 0.92%),
10/15/36(1)(2) | | | 660 | | | 662,478 |
| | |
Series 2019-XL, Class B, 1.239%, (1 mo. USD LIBOR + 1.08%),
10/15/36(1)(2) | | | 313 | | | 313,989 |
| | |
Citigroup Commercial Mortgage Trust, Series 2017-MDRC, Class D, 2.409%, (1 mo. USD LIBOR + 2.25%), 7/15/30(1)(2) | | | 235 | | | 218,692 |
| | |
Federal Home Loan Mortgage Corp. Multifamily Structured Pass Through Certificates: | | | | | | |
| | |
Series KG02, Class A2, 2.412%, 8/25/29 | | | 1,440 | | | 1,560,871 |
| | |
Series KG03, Class A2, 1.297%, 6/25/30(4) | | | 305 | | | 306,276 |
| | |
Series KSG1, Class A2, 1.503%, 9/25/30 | | | 278 | | | 286,797 |
| | |
Series KW06, Class A2, 3.80%, 6/25/28(4) | | | 530 | | | 623,088 |
| | |
Series W5FX, Class AFX, 3.214%, 4/25/28(4) | | | 192 | | | 215,677 |
| | |
Federal National Mortgage Association: | | | | | | |
| | |
Series 2017-M2, Class A1, 2.801%, 2/25/27(4) | | | 97 | | | 100,298 |
| | |
Series 2017-M13, Class A2, 2.939%, 9/25/27(4) | | | 675 | | | 765,796 |
| | |
Series 2018-M4, Class A2, 3.045%, 3/25/28(4) | | | 1,526 | | | 1,741,901 |
| | |
Series 2018-M8, Class A2, 3.325%, 6/25/28(4) | | | 459 | | | 530,847 |
| | |
Series 2018-M13, Class A2, 3.697%, 9/25/30(4) | | | 1,680 | | | 2,034,460 |
| | |
Series 2019-M1, Class A2, 3.555%, 9/25/28(4) | | | 785 | | | 928,446 |
| | |
Series 2019-M9, Class A2, 2.937%, 4/25/29 | | | 291 | | | 329,797 |
| | |
Series 2019-M22, Class A2, 2.522%, 8/25/29 | | | 3,100 | | | 3,439,127 |
| | |
Series 2020-M1, Class A2, 2.444%, 10/25/29 | | | 963 | | | 1,062,930 |
| | |
Series 2020-M20, Class A2, 1.435%, 10/25/29 | | | 605 | | | 622,556 |
| | |
Federal National Mortgage Association Multifamily Connecticut Avenue Securities Trust: | | | | | | |
| | |
Series 2019-01, Class M10, 3.398%, (1 mo. USD LIBOR + 3.25%), 10/15/49(1)(2) | | | 55 | | | 51,695 |
| | |
Series 2020-01, Class M10, 3.898%, (1 mo. USD LIBOR + 3.75%), 3/25/50(1)(2) | | | 395 | | | 387,483 |
| | |
JPMorgan Chase Commercial Mortgage Securities Trust: | | | | | | |
| | |
Series 2014-DSTY, Class A, 3.429%, 6/10/27(1) | | | 100 | | | 61,631 |
| | |
Series 2014-DSTY, Class B, 3.771%, 6/10/27(1) | | | 300 | | | 103,276 |
| | |
Series 2014-DSTY, Class C, 3.805%, 6/10/27(1)(4) | | | 100 | | | 20,192 |
| | |
Morgan Stanley Capital I Trust: | | | | | | |
| | |
Series 2017-CLS, Class A, 0.859%, (1 mo. USD LIBOR + 0.70%),
11/15/34(1)(2) | | | 545 | | | 545,286 |
| | |
Series 2019-BPR, Class A, 1.559%, (1 mo. USD LIBOR + 1.40%),
5/15/36(1)(2) | | | 650 | | | 627,390 |
| | |
Series 2019-BPR, Class B, 2.259%, (1 mo. USD LIBOR + 2.10%),
5/15/36(1)(2) | | | 241 | | | 205,440 |
| | | | | | |
| Security | | Principal
Amount
(000’s omitted) | | | Value |
| | |
Morgan Stanley Capital I Trust: (continued) | | | | | | |
| | |
Series 2019-BPR, Class C, 3.209%, (1 mo. USD LIBOR + 3.05%),
5/15/36(1)(2) | | $ | 100 | | | $ 73,595 |
| | |
Motel 6 Trust: | | | | | | |
| | |
Series 2017-MTL6, Class C, 1.559%, (1 mo. USD LIBOR + 1.40%),
8/15/34(1)(2) | | | 627 | | | 624,915 |
| | |
Series 2017-MTL6, Class D, 2.309%, (1 mo. USD LIBOR + 2.15%),
8/15/34(1)(2) | | | 188 | | | 187,082 |
| | |
Series 2017-MTL6, Class E, 3.409%, (1 mo. USD LIBOR + 3.25%),
8/15/34(1)(2) | | | 67 | | | 65,734 |
| | |
RETL Trust: | | | | | | |
| | |
Series 2019-RVP, Class B, 1.709%, (1 mo. USD LIBOR + 1.55%),
3/15/36(1)(2) | | | 4 | | | 4,269 |
| | |
Series 2019-RVP, Class C, 2.259%, (1 mo. USD LIBOR + 2.10%),
3/15/36(1)(2) | | | 73 | | | 70,550 |
| | |
WFLD Mortgage Trust, Series 2014-MONT, Class C, 3.755%, 8/10/31(1)(4) | | | 450 | | | 389,206 |
| | |
Total Commercial Mortgage-Backed Securities
(identified cost $19,670,223) | | | | | | $20,378,445 |
| | |
Common Stocks — 64.5% | | | | | | |
| | |
| Security | | Shares | | | Value |
| | |
Banks — 3.3% | | | | | | |
| | |
JPMorgan Chase & Co. | | | 60,000 | | | $ 7,624,200 |
| | |
PNC Financial Services Group, Inc. (The) | | | 40,700 | | | 6,064,300 |
| | |
| | | | | | | $13,688,500 |
| | |
Beverages — 1.7% | | | | | | |
| | |
PepsiCo, Inc. | | | 46,256 | | | $ 6,859,765 |
| | |
| | | | | | | $ 6,859,765 |
| | |
Biotechnology — 2.0% | | | | | | |
| | |
AbbVie, Inc. | | | 53,123 | | | $ 5,692,129 |
| | |
Vertex Pharmaceuticals, Inc.(5) | | | 11,900 | | | 2,812,446 |
| | |
| | | | | | | $ 8,504,575 |
| | |
Building Products — 1.1% | | | | | | |
| | |
Trane Technologies PLC | | | 31,700 | | | $ 4,601,572 |
| | |
| | | | | | | $ 4,601,572 |
| | |
Capital Markets — 3.6% | | | | | | |
| | |
BlackRock, Inc. | | | 7,100 | | | $ 5,122,934 |
| | |
Intercontinental Exchange, Inc. | | | 45,000 | | | 5,188,050 |
| | |
Tradeweb Markets, Inc., Class A | | | 77,403 | | | 4,833,817 |
| | |
| | | | | | | $15,144,801 |
| | | | |
| | 10 | | See Notes to Financial Statements. |
Calvert
VP SRI Balanced Portfolio
December 31, 2020
Schedule of Investments — continued
| | | | | | |
| Security | | Shares | | | Value |
| | |
Commercial Services & Supplies — 0.8% | | | | | | |
| | |
Waste Management, Inc. | | | 28,316 | | | $ 3,339,306 |
| | |
| | | | | | | $ 3,339,306 |
| | |
Communications Equipment — 0.8% | | | | | | |
| | |
Cisco Systems, Inc. | | | 72,700 | | | $ 3,253,325 |
| | |
| | | | | | | $ 3,253,325 |
| | |
Containers & Packaging — 0.7% | | | | | | |
| | |
AptarGroup, Inc. | | | 21,700 | | | $ 2,970,513 |
| | |
| | | | | | | $ 2,970,513 |
|
Diversified Telecommunication Services — 0.0%(6) |
| | |
Verizon Communications, Inc. | | | 584 | | | $ 34,310 |
| | |
| | | | | | | $ 34,310 |
| | |
Electrical Equipment — 1.3% | | | | | | |
| | |
AMETEK, Inc. | | | 44,300 | | | $ 5,357,642 |
| | |
| | | | | | | $ 5,357,642 |
| | |
Energy Equipment & Services — 1.1% | | | | | | |
| | |
Baker Hughes Co. | | | 225,100 | | | $ 4,693,335 |
| | |
| | | | | | | $ 4,693,335 |
| | |
Entertainment — 1.6% | | | | | | |
| | |
Walt Disney Co. (The)(5) | | | 36,400 | | | $ 6,594,952 |
| | |
| | | | | | | $ 6,594,952 |
|
Equity Real Estate Investment Trusts (REITs) — 1.2% |
| | |
American Tower Corp. | | | 23,100 | | | $ 5,185,026 |
| | |
| | | | | | | $ 5,185,026 |
| | |
Food & Staples Retailing — 1.5% | | | | | | |
| | |
Sysco Corp. | | | 83,800 | | | $ 6,222,988 |
| | |
| | | | | | | $ 6,222,988 |
| | |
Food Products — 1.1% | | | | | | |
| | |
Mondelez International, Inc., Class A | | | 79,212 | | | $ 4,631,526 |
| | |
| | | | | | | $ 4,631,526 |
| | |
Health Care Equipment & Supplies — 3.8% | | | | | | |
| | |
Abbott Laboratories | | | 48,500 | | | $ 5,310,265 |
| | |
Boston Scientific Corp.(5) | | | 124,600 | | | 4,479,370 |
| | |
Danaher Corp. | | | 26,400 | | | 5,864,496 |
| | |
| | | | | | | $ 15,654,131 |
| | | | | | |
| Security | | Shares | | | Value |
| | |
Health Care Providers & Services — 1.4% | | | | | | |
| | |
Anthem, Inc. | | | 18,000 | | | $ 5,779,620 |
| | |
| | | | | | | $ 5,779,620 |
| | |
Hotels, Restaurants & Leisure — 1.1% | | | | | | |
| | |
Marriott International, Inc., Class A | | | 35,100 | | | $ 4,630,392 |
| | |
| | | | | | | $ 4,630,392 |
| | |
Independent Power and Renewable Electricity Producers — 1.0% | | | | | | |
| | |
NextEra Energy Partners, L.P. | | | 60,906 | | | $ 4,083,747 |
| | |
| | | | | | | $ 4,083,747 |
| | |
Insurance — 0.8% | | | | | | |
| | |
Travelers Cos., Inc. (The) | | | 24,800 | | | $ 3,481,176 |
| | |
| | | | | | | $ 3,481,176 |
| | |
Interactive Media & Services — 3.7% | | | | | | |
| | |
Alphabet, Inc., Class C(5) | | | 7,190 | | | $ 12,596,017 |
| | |
Match Group, Inc.(5) | | | 18,872 | | | 2,853,258 |
| | |
| | | | | | | $ 15,449,275 |
| | |
Internet & Direct Marketing Retail — 4.0% | | | | | | |
| | |
Amazon.com, Inc.(5) | | | 5,129 | | | $ 16,704,794 |
| | |
| | | | | | | $ 16,704,794 |
| | |
IT Services — 6.4% | | | | | | |
| | |
Automatic Data Processing, Inc. | | | 22,600 | | | $ 3,982,120 |
| | |
Cognizant Technology Solutions Corp., Class A | | | 61,700 | | | 5,056,315 |
| | |
Fidelity National Information Services, Inc. | | | 24,200 | | | 3,423,332 |
| | |
PayPal Holdings, Inc.(5) | | | 23,100 | | | 5,410,020 |
| | |
Visa, Inc., Class A | | | 40,900 | | | 8,946,057 |
| | |
| | | | | | | $ 26,817,844 |
| | |
Life Sciences Tools & Services — 1.3% | | | | | | |
| | |
Thermo Fisher Scientific, Inc. | | | 11,518 | | | $ 5,364,854 |
| | |
| | | | | | | $ 5,364,854 |
| | |
Machinery — 1.6% | | | | | | |
| | |
Ingersoll Rand, Inc.(5) | | | 68,200 | | | $ 3,107,192 |
| | |
Stanley Black & Decker, Inc. | | | 20,800 | | | 3,714,048 |
| | |
| | | | | | | $ 6,821,240 |
| | |
Multi-Utilities — 0.7% | | | | | | |
| | |
Sempra Energy | | | 22,308 | | | $ 2,842,262 |
| | |
| | | | | | | $ 2,842,262 |
| | | | |
| | 11 | | See Notes to Financial Statements. |
Calvert
VP SRI Balanced Portfolio
December 31, 2020
Schedule of Investments — continued
| | | | | | |
| Security | | Shares | | | Value |
| | |
Pharmaceuticals — 0.7% | | | | | | |
| | |
Zoetis, Inc. | | | 16,800 | | | $ 2,780,400 |
| | |
| | | | | | | $ 2,780,400 |
| | |
Road & Rail — 1.0% | | | | | | |
| | |
Union Pacific Corp. | | | 19,100 | | | $ 3,977,002 |
| | |
| | | | | | | $ 3,977,002 |
|
Semiconductors & Semiconductor Equipment — 2.1% |
| | |
Taiwan Semiconductor Manufacturing Co., Ltd. ADR | | | 41,000 | | | $ 4,470,640 |
| | |
Texas Instruments, Inc. | | | 25,851 | | | 4,242,925 |
| | |
| | | | | | | $ 8,713,565 |
| | |
Software — 5.3% | | | | | | |
| | |
Intuit, Inc. | | | 6,652 | | | $ 2,526,762 |
| | |
Microsoft Corp. | | | 79,793 | | | 17,747,559 |
| | |
nCino, Inc.(5) | | | 25,578 | | | 1,852,103 |
| | |
| | | | | | | $ 22,126,424 |
| | |
Specialty Retail — 2.5% | | | | | | |
| | |
Lowe’s Cos., Inc. | | | 33,500 | | | $ 5,377,085 |
| | |
TJX Cos., Inc. (The) | | | 74,200 | | | 5,067,118 |
| | |
| | | | | | | $ 10,444,203 |
|
Technology Hardware, Storage & Peripherals — 4.2% |
| | |
Apple, Inc. | | | 130,588 | | | $ 17,327,722 |
| | |
| | | | | | | $ 17,327,722 |
|
Wireless Telecommunication Services — 1.1% |
| | |
T-Mobile US, Inc.(5) | | | 32,830 | | | $ 4,427,126 |
| | |
| | | | | | | $ 4,427,126 |
| | |
Total Common Stocks
(identified cost $183,700,542) | | | | | | $268,507,913 |
| | |
Convertible Bonds — 0.1% | | | | | | |
| | |
| Security | | Principal
Amount
(000’s omitted) | | | Value |
| | |
Technology — 0.1% | | | | | | |
| | |
Western Digital Corp., 1.50%, 2/1/24 | | $ | 281 | | | $ 280,704 |
| | |
Total Convertible Bonds
(identified cost $271,111) | | | | | | $ 280,704 |
| | | | | | |
Convertible Preferred Stocks — 0.0%(6) |
| | |
| Security | | Shares | | | Value |
|
Health Care Equipment & Supplies — 0.0%(6) |
| | |
Becton Dickinson and Co., Series B, 6.00%(7) | | | 500 | | | $ 27,565 |
| | |
Total Convertible Preferred Stocks
(identified cost $27,325) | | | | | | $ 27,565 |
| | |
Corporate Bonds — 15.6% | | | | | | |
| | |
| Security | |
| Principal
Amount (000’s omitted) |
* | | Value |
| | |
Basic Materials — 0.3% | | | | | | |
| | |
Ecolab, Inc., 2.125%, 8/15/50 | | | 263 | | | $ 252,262 |
| | |
LG Chem, Ltd.: | | | | | | |
| | |
3.25%, 10/15/24(1) | | | 550 | | | 595,594 |
| | |
3.625%, 4/15/29(1) | | | 250 | | | 282,236 |
| | |
| | | | | | | $ 1,130,092 |
| | |
Communications — 1.4% | | | | | | |
| | |
Alphabet, Inc., 1.10%, 8/15/30 | | | 349 | | | $ 344,138 |
| | |
AT&T, Inc.: | | | | | | |
| | |
2.30%, 6/1/27 | | | 1 | | | 1,067 |
| | |
3.10%, 2/1/43 | | | 80 | | | 81,168 |
| | |
3.30%, 2/1/52 | | | 44 | | | 43,627 |
| | |
3.65%, 6/1/51 | | | 717 | | | 750,802 |
| | |
3.65%, 9/15/59(1) | | | 53 | | | 53,264 |
| | |
3.80%, 12/1/57(1) | | | 326 | | | 339,940 |
| | |
4.30%, 2/15/30 | | | 577 | | | 689,757 |
| | |
4.90%, 6/15/42 | | | 300 | | | 374,226 |
| | |
Charter Communications Operating, LLC/Charter Communications Operating Capital, 4.80%, 3/1/50 | | | 930 | | | 1,111,511 |
| | |
Comcast Corp., 2.45%, 8/15/52 | | | 481 | | | 468,560 |
| | |
Crown Castle Towers, LLC, 3.663%, 5/15/45(1) | | | 250 | | | 269,959 |
| | |
Discovery Communications, LLC, 5.20%, 9/20/47 | | | 326 | | | 424,685 |
| | |
NBCUniversal Media, LLC, 4.45%, 1/15/43 | | | 200 | | | 262,102 |
| | |
Sprint Corp., 7.25%, 9/15/21 | | | 75 | | | 78,131 |
| | |
T-Mobile USA, Inc.: | | | | | | |
| | |
2.25%, 11/15/31(1) | | | 64 | | | 65,806 |
| | |
2.55%, 2/15/31(1) | | | 147 | | | 154,544 |
| | |
4.50%, 4/15/50(1) | | | 342 | | | 422,459 |
| | |
| | | | | | | $ 5,935,746 |
| | |
Consumer, Cyclical — 1.3% | | | | | | |
| | |
American Airlines Pass-Through Trust: | | | | | | |
| | |
4.40%, 9/22/23 | | | 107 | | | $ 81,508 |
| | |
5.25%, 1/15/24 | | | 211 | | | 179,268 |
| | |
Aptiv PLC, 5.40%, 3/15/49 | | | 58 | | | 72,464 |
| | | | |
| | 12 | | See Notes to Financial Statements. |
Calvert
VP SRI Balanced Portfolio
December 31, 2020
Schedule of Investments — continued
| | | | | | |
| Security | | Principal
Amount (000’s omitted)* | | | Value |
| | |
Consumer, Cyclical (continued) | | | | | | |
| | |
Delta Air Lines, Inc.: | | | | | | |
| | |
3.625%, 3/15/22 | | | 299 | | | $ 307,690 |
| | |
7.375%, 1/15/26 | | | 506 | | | 578,374 |
| | |
Ford Motor Credit Co., LLC: | | | | | | |
| | |
1.044%, (3 mo. USD LIBOR + 0.81%), 4/5/21(2) | | | 200 | | | 199,148 |
| | |
1.104%, (3 mo. USD LIBOR + 0.88%), 10/12/21(2) | | | 313 | | | 309,305 |
| | |
1.296%, (3 mo. USD LIBOR + 1.08%), 8/3/22(2) | | | 250 | | | 243,840 |
| | |
2.979%, 8/3/22 | | | 1,070 | | | 1,089,207 |
| | |
3.087%, 1/9/23 | | | 200 | | | 203,864 |
| | |
4.14%, 2/15/23 | | | 200 | | | 206,500 |
| | |
Macy’s Retail Holdings, LLC: | | | | | | |
| | |
2.875%, 2/15/23 | | | 480 | | | 462,000 |
| | |
3.625%, 6/1/24 | | | 160 | | | 152,544 |
| | |
3.875%, 1/15/22 | | | 321 | | | 320,198 |
| | |
Magna International, Inc., 2.45%, 6/15/30 | | | 250 | | | 269,107 |
| | |
Nordstrom, Inc.: | | | | | | |
| | |
4.375%, 4/1/30(7) | | | 360 | | | 355,291 |
| | |
5.00%, 1/15/44 | | | 453 | | | 425,342 |
| | |
Tesla, Inc., 5.30%, 8/15/25(1) | | | 56 | | | 58,450 |
| | |
| | | | | | | $ 5,514,100 |
| | |
Consumer, Non-cyclical — 1.3% | | | | | | |
| | |
Ashtead Capital, Inc., 4.25%, 11/1/29(1) | | | 384 | | | $ 421,379 |
| | |
Becton Dickinson and Co., 2.894%, 6/6/22 | | | 197 | | | 203,661 |
| | |
Block Financial, LLC,
3.875%, 8/15/30(7) | | | 386 | | | 417,098 |
| | |
Centene Corp.: | | | | | | |
| | |
3.375%, 2/15/30 | | | 199 | | | 209,677 |
| | |
4.25%, 12/15/27 | | | 208 | | | 220,962 |
| | |
4.625%, 12/15/29 | | | 36 | | | 40,014 |
| | |
Coca-Cola Femsa SAB de CV, 1.85%, 9/1/32 | | | 255 | | | 255,701 |
| | |
Conservation Fund (The), Green Bonds, 3.474%, 12/15/29 | | | 285 | | | 308,715 |
| | |
CVS Health Corp.: | | | | | | |
| | |
0.95%, (3 mo. USD LIBOR + 0.72%), 3/9/21(2) | | | 44 | | | 44,052 |
| | |
3.00%, 8/15/26 | | | 615 | | | 681,919 |
| | |
4.30%, 3/25/28 | | | 296 | | | 352,543 |
| | |
CVS Pass-Through Trust, 6.036%, 12/10/28 | | | 361 | | | 419,831 |
| | |
Doris Duke Charitable Foundation (The), 2.345%, 7/1/50 | | | 678 | | | 655,645 |
| | |
Ford Foundation (The), 2.415%, 6/1/50 | | | 435 | | | 444,685 |
| | |
Kraft Heinz Foods Co., 4.375%, 6/1/46 | | | 349 | | | 377,614 |
| | |
Royalty Pharma PLC, 3.55%, 9/2/50(1) | | | 33 | | | 35,289 |
| | |
Smithfield Foods, Inc.: | | | | | | |
| | |
3.00%, 10/15/30(1) | | | 77 | | | 81,616 |
| | |
5.20%, 4/1/29(1) | | | 45 | | | 53,601 |
| | |
| | | | | | | $ 5,224,002 |
| | | | | | |
| Security | | Principal Amount (000’s omitted)* | | | Value |
| | |
Energy — 0.4% | | | | | | |
| | |
NuStar Logistics, L.P.: | | | | | | |
| | |
5.75%, 10/1/25 | | | 46 | | | $ 49,059 |
| | |
6.00%, 6/1/26 | | | 198 | | | 214,479 |
| | |
6.375%, 10/1/30 | | | 137 | | | 155,450 |
| | |
TerraForm Power Operating, LLC: | | | | | | |
| | |
4.75%, 1/15/30(1) | | | 319 | | | 342,035 |
| | |
5.00%, 1/31/28(1) | | | 743 | | | 836,265 |
| | |
| | | | | | | $ 1,597,288 |
| | |
Financial — 7.4% | | | | | | |
| | |
AerCap Ireland Capital DAC/AerCap Global Aviation Trust: | | | | | | |
| | |
4.50%, 9/15/23 | | | 291 | | | $ 315,684 |
| | |
4.625%, 7/1/22(7) | | | 150 | | | 169,988 |
| | |
6.50%, 7/15/25 | | | 175 | | | 209,329 |
| | |
Affiliated Managers Group, Inc., 3.30%, 6/15/30 | | | 466 | | | 506,582 |
| | |
Aflac, Inc., 3.60%, 4/1/30 | | | 170 | | | 200,224 |
| | |
Air Lease Corp., 2.875%, 1/15/26 | | | 355 | | | 375,901 |
| | |
Alliance Data Systems Corp., 4.75%, 12/15/24(1) | | | 371 | | | 375,406 |
| | |
Andrew W. Mellon Foundation (The), 0.947%, 8/1/27 | | | 335 | | | 334,963 |
| | |
Australia & New Zealand Banking Group, Ltd., 2.95% to 7/22/25, 7/22/30(1)(8) | | | 458 | | | 483,444 |
| | |
Bank of America Corp.: | | | | | | |
| | |
0.981% to 9/25/24, 9/25/25(8) | | | 445 | | | 450,312 |
| | |
1.197% to 10/24/25, 10/24/26(8) | | | 646 | | | 654,759 |
| | |
1.389%, (3 mo. USD LIBOR + 1.18%), 10/21/22(2) | | | 118 | | | 118,975 |
| | |
1.898% to 7/23/30, 7/23/31(8) | | | 590 | | | 596,275 |
| | |
1.922% to 10/24/30, 10/24/31(8) | | | 412 | | | 417,571 |
| | |
2.456% to 10/22/24, 10/22/25(8) | | | 655 | | | 698,508 |
| | |
2.676% to 6/19/40, 6/19/41(8) | | | 605 | | | 631,302 |
| | |
3.499% to 5/17/21, 5/17/22(8) | | | 704 | | | 712,363 |
| | |
3.593% to 7/21/27, 7/21/28(8) | | | 690 | | | 784,009 |
| | |
Series Z, 6.50% to 10/23/24(7)(8)(9) | | | 37 | | | 42,365 |
| | |
Bank of Montreal, 2.05%, 11/1/22 | | | 822 | | | 848,697 |
| | |
Bank of Nova Scotia (The): | | | | | | |
| | |
1.625%, 5/1/23 | | | 418 | | | 430,149 |
| | |
2.375%, 1/18/23 | | | 600 | | | 625,127 |
| | |
BankUnited, Inc., 5.125%, 6/11/30 | | | 309 | | | 362,189 |
| | |
BBVA Bancomer S.A./Texas, 1.875%, 9/18/25(1) | | | 262 | | | 264,948 |
| | |
Capital One Financial Corp.: | | | | | | |
| | |
3.30%, 10/30/24 | | | 209 | | | 229,677 |
| | |
3.75%, 7/28/26 | | | 138 | | | 156,532 |
| | |
4.20%, 10/29/25 | | | 190 | | | 216,934 |
| | |
Charles Schwab Corp. (The), 4.00% to 12/1/30(8)(9) | | | 82 | | | 86,715 |
| | |
Citigroup, Inc.: | | | | | | |
| | |
0.776% to 10/30/23, 10/30/24(8) | | | 630 | | | 634,393 |
| | | | |
| | 13 | | See Notes to Financial Statements. |
Calvert
VP SRI Balanced Portfolio
December 31, 2020
Schedule of Investments — continued
| | | | | | |
| Security | |
| Principal
Amount (000’s omitted) |
* | | Value |
| | |
Financial (continued) | | | | | | |
| | |
Citigroup, Inc.: (continued) 1.296%, (3 mo. USD LIBOR + 1.07%), 12/8/21(2) | | | 150 | | | $ 151,141 |
| | |
1.678% to 5/15/23, 5/15/24(8) | | | 745 | | | 767,831 |
| | |
2.666% to 1/29/30, 1/29/31(8) | | | 760 | | | 815,877 |
| | |
3.106% to 4/8/25, 4/8/26(8) | | | 319 | | | 348,950 |
| | |
3.887% to 1/10/27, 1/10/28(8) | | | 1,081 | | | 1,242,325 |
| | |
4.00% to 12/10/25(8)(9) | | | 310 | | | 318,913 |
| | |
Citizens Bank NA, 2.55%, 5/13/21 | | | 200 | | | 201,240 |
| | |
Citizens Financial Group, Inc., 2.375%, 7/28/21 | | | 170 | | | 171,653 |
| | |
Commonwealth Bank of Australia: | | | | | | |
| | |
2.50%, 9/18/22(1) | | | 270 | | | 280,165 |
| | |
3.61% to 9/12/29, 9/12/34(1)(8) | | | 206 | | | 226,626 |
| | |
Digital Realty Trust, L.P., 4.75%, 10/1/25 | | | 260 | | | 304,619 |
| | |
Discover Bank: | | | | | | |
| | |
2.70%, 2/6/30 | | | 250 | | | 265,644 |
| | |
4.682% to 8/9/23, 8/9/28(8) | | | 270 | | | 287,230 |
| | |
Discover Financial Services: | | | | | | |
| | |
3.95%, 11/6/24 | | | 90 | | | 100,025 |
| | |
6.125% to 6/23/25(8)(9) | | | 319 | | | 360,869 |
| | |
HAT Holdings I, LLC/HAT Holdings II, LLC: | | | | | | |
| | |
5.25%, 7/15/24(1) | | | 391 | | | 407,414 |
| | |
6.00%, 4/15/25(1) | | | 228 | | | 244,245 |
| | |
Iron Mountain, Inc.: | | | | | | |
| | |
4.50%, 2/15/31(1) | | | 283 | | | 296,796 |
| | |
5.00%, 7/15/28(1) | | | 91 | | | 96,790 |
| | |
JPMorgan Chase & Co.: | | | | | | |
| | |
2.522% to 4/22/30, 4/22/31(8) | | | 530 | | | 570,073 |
| | |
2.739% to 10/15/29, 10/15/30(8) | | | 217 | | | 236,324 |
| | |
2.956% to 5/13/30, 5/13/31(8) | | | 146 | | | 160,248 |
| | |
Series S, 6.75% to 2/1/24(8)(9) | | | 112 | | | 125,778 |
| | |
KKR Group Finance Co. VII, LLC, 3.625%, 2/25/50(1) | | | 301 | | | 335,967 |
| | |
Lloyds Banking Group PLC, 2.438% to 2/5/25, 2/5/26(8) | | | 356 | | | 376,249 |
| | |
Macquarie Bank, Ltd., 3.624%, 6/3/30(1) | | | 255 | | | 279,570 |
| | |
Morgan Stanley: | | | | | | |
| | |
0.777%, (SOFR + 0.70%), 1/20/23(2) | | | 964 | | | 967,873 |
| | |
1.615%, (3 mo. USD LIBOR + 1.40%), 10/24/23(2) | | | 260 | | | 265,007 |
| | |
Series J, 4.047%, (3 mo. USD LIBOR + 3.81%) to 4/15/21(2)(9) | | | 185 | | | 184,129 |
| | |
National Australia Bank, Ltd., 3.625%, 6/20/23(7) | | | 275 | | | 297,237 |
| | |
National Bank of Canada, 0.55% to 11/15/23, 11/15/24(8) | | | 301 | | | 302,036 |
| | |
Nationwide Building Society, 3.96% to 7/18/29, 7/18/30(1)(8) | | | 293 | | | 341,570 |
| | |
Newmark Group, Inc., 6.125%, 11/15/23 | | | 110 | | | 119,709 |
| | |
PNC Financial Services Group, Inc. (The), 2.20%, 11/1/24 | | | 2,244 | | | 2,385,686 |
| | |
Radian Group, Inc.: | | | | | | |
| | |
4.875%, 3/15/27 | | | 476 | | | 523,933 |
| | | | | | |
| Security | |
| Principal
Amount (000’s omitted) |
* | | Value |
| | |
Financial (continued) | | | | | | |
| | |
Radian Group, Inc.: (continued) | | | | | | |
| | |
6.625%, 3/15/25 | | | 37 | | | $ 41,972 |
| | |
SBA Tower Trust, 3.722%, 4/9/48(1) | | | 660 | | | 678,580 |
| | |
SITE Centers Corp., 3.625%, 2/1/25 | | | 259 | | | 269,265 |
| | |
Standard Chartered PLC: | | | | | | |
| | |
1.319% to 10/14/22, 10/14/23(1)(8) | | | 203 | | | 205,304 |
| | |
6.00% to 7/26/25(1)(8)(9) | | | 233 | | | 249,601 |
| | |
Stifel Financial Corp., 4.00%, 5/15/30 | | | 390 | | | 446,286 |
| | |
Synovus Bank/Columbus, GA: | | | | | | |
| | |
2.289% to 2/10/22, 2/10/23(8) | | | 529 | | | 535,886 |
| | |
4.00% to 10/29/25, 10/29/30(8) | | | 250 | | | 264,793 |
| | |
Synovus Financial Corp.: | | | | | | |
| | |
3.125%, 11/1/22 | | | 156 | | | 162,041 |
| | |
5.90% to 2/7/24, 2/7/29(8) | | | 35 | | | 37,751 |
| | |
Truist Financial Corp., 5.10% to
3/1/30(8)(9) | | | 409 | | | 468,309 |
| | |
UBS Group AG, 1.364% to 1/30/26, 1/30/27(1)(8) | | | 200 | | | 202,340 |
| | |
UniCredit SpA, 5.459% to 6/30/30, 6/30/35(1)(8) | | | 200 | | | 220,420 |
| | |
Visa, Inc., 2.00%, 8/15/50 | | | 318 | | | 303,725 |
| | |
Welltower, Inc., 2.75%, 1/15/31 | | | 249 | | | 265,871 |
| | |
Westpac Banking Corp., 2.668% to 11/15/30, 11/15/35(8) | | | 220 | | | 226,910 |
| | |
| | | | | | | $ 30,872,117 |
|
Government - Multinational — 0.6% |
| | |
Asian Development Bank, 3.125%, 9/26/28 | | | 540 | | | $633,430 |
| | |
International Bank for Reconstruction & Development, 3.125%, 11/20/25 | | | 1,200 | | | 1,355,200 |
| | |
International Finance Corp., 7.50%, 5/9/22 | | BRL | 395 | | | 80,906 |
| | |
Nordic Investment Bank, 2.25%, 9/30/21 | | | 271 | | | 275,253 |
| | |
| | | | | | | $ 2,344,789 |
| | |
Industrial — 1.2% | | | | | | |
| | |
FedEx Corp., 4.55%, 4/1/46 | | | 290 | | | $ 373,100 |
| | |
Flowserve Corp., 3.50%, 10/1/30 | | | 194 | | | 207,139 |
| | |
Jabil, Inc.: | | | | | | |
| | |
3.00%, 1/15/31 | | | 709 | | | 755,424 |
| | |
3.60%, 1/15/30 | | | 531 | | | 591,504 |
| | |
4.70%, 9/15/22 | | | 569 | | | 606,380 |
| | |
nVent Finance S.a.r.l., 4.55%, 4/15/28 | | | 855 | | | 929,691 |
| | |
Owens Corning: | | | | | | |
| | |
3.95%, 8/15/29 | | | 669 | | | 772,021 |
| | |
4.30%, 7/15/47 | | | 101 | | | 121,607 |
| | |
4.40%, 1/30/48 | | | 10 | | | 12,063 |
| | |
SMBC Aviation Capital Finance DAC, 2.65%, 7/15/21(1) | | | 260 | | | 262,761 |
| | | | |
| | 14 | | See Notes to Financial Statements. |
Calvert
VP SRI Balanced Portfolio
December 31, 2020
Schedule of Investments — continued
| | | | | | |
| Security | | Principal
Amount (000’s omitted)* | | Value |
| | |
Industrial (continued) | | | | | | |
| | |
Valmont Industries, Inc.: | | | | | | |
| | |
5.00%, 10/1/44 | | | 55 | | | $ 63,829 |
| | |
5.25%, 10/1/54 | | | 265 | | | 312,390 |
| | |
| | | | | | | $ 5,007,909 |
| | |
Other Revenue — 0.2% | | | | | | |
| | |
BlueHub Loan Fund, Inc., 3.099%, 1/1/30 | | | 675 | | | $677,855 |
| | |
| | | | | | | $ 677,855 |
| | |
Technology — 0.5% | | | | | | |
| | |
DXC Technology Co.: | | | | | | |
| | |
4.00%, 4/15/23 | | | 340 | | | $361,878 |
| | |
4.125%, 4/15/25 | | | 266 | | | 294,222 |
| | |
4.75%, 4/15/27 | | | 84 | | | 96,208 |
| | |
Seagate HDD Cayman: | | | | | | |
| | |
3.375%, 7/15/31(1) | | | 200 | | | 201,457 |
| | |
4.091%, 6/1/29(1) | | | 354 | | | 379,946 |
| | |
4.875%, 3/1/24 | | | 235 | | | 255,775 |
| | |
5.75%, 12/1/34 | | | 180 | | | 212,358 |
| | |
Western Digital Corp., 4.75%, 2/15/26 | | | 394 | | | 435,862 |
| | |
| | | | | | | $ 2,237,706 |
| | |
Utilities — 1.0% | | | | | | |
| | |
AES Corp. (The), 2.45%, 1/15/31(1) | | | 533 | | | $540,346 |
| | |
American Water Capital Corp., 2.95%, 9/1/27 | | | 370 | | | 409,531 |
| | |
Avangrid, Inc.: | | | | | | |
| | |
3.15%, 12/1/24 | | | 667 | | | 727,698 |
| | |
3.80%, 6/1/29 | | | 590 | | | 677,311 |
| | |
Consolidated Edison Co. of New York, Inc., 3.35%, 4/1/30 | | | 171 | | | 196,159 |
| | |
Enel Finance International NV, 2.65%, 9/10/24(1) | | | 530 | | | 564,964 |
| | |
MidAmerican Energy Co.: | | | | | | |
| | |
3.15%, 4/15/50 | | | 215 | | | 247,589 |
| | |
4.25%, 7/15/49 | | | 250 | | | 335,673 |
| | |
NextEra Energy Operating Partners, L.P., 4.25%, 9/15/24(1) | | | 34 | | | 36,422 |
| | |
Niagara Mohawk Power Corp., 1.96%, 6/27/30(1) | | | 233 | | | 240,312 |
| | |
Pattern Energy Operations, L.P./Pattern Energy Operations, Inc., 4.50%, 8/15/28(1) | | | 18 | | | 19,272 |
| | |
Public Service Co. of Colorado, 3.70%, 6/15/28 | | | 258 | | | 301,103 |
| | |
Sempra Energy, 4.875% to 10/15/25(8)(9) | | | 79 | | | 84,629 |
| | |
| | | | | | | $4,381,009 |
| | |
Total Corporate Bonds
(identified cost $61,102,852) | | | | | | $64,922,613 |
| | | | | | |
Preferred Stocks — 0.4% | | | | | | |
| | |
| Security | | Shares | | | Value |
|
Mortgage Real Estate Investment Trusts (REITs) —0.0%(6) |
| | |
AGNC Investment Corp., Series F, 6.125% to 4/15/25(8) | | | 7,600 | | | $ 181,564 |
| | |
| | | | | | | $ 181,564 |
| | |
Oil, Gas & Consumable Fuels — 0.1% | | | | | | |
| | |
NuStar Energy, L.P., Series B, 7.625% to 6/15/22(8) | | | 12,563 | | | $ 225,883 |
| | |
| | | | | | | $ 225,883 |
|
Real Estate Management & Development — 0.1% |
| | |
Brookfield Property Partners, L.P.: | | | | | | |
| | |
Series A, 5.75% | | | 13,670 | | | $ 292,538 |
| | |
Series A2, 6.375% | | | 12,000 | | | 278,280 |
| | |
| | | | | | | $ 570,818 |
|
Wireless Telecommunication Services — 0.2% |
| | |
United States Cellular Corp.: | | | | | | |
| | |
5.50% | | | 23,600 | | | $ 594,956 |
| | |
6.25% | | | 2,200 | | | 58,410 |
| | |
| | | | | | | $ 653,366 |
| | |
Total Preferred Stocks
(identified cost $1,744,386) | | | | | | $ 1,631,631 |
| |
Senior Floating-Rate Loans — 0.8%(10) | | | |
| | |
| Security | | Principal
Amount
(000’s omitted) | | | Value |
| | |
Building and Development — 0.1% | | | | | | |
| | |
Cushman & Wakefield U.S. Borrower, LLC, Term Loan, 2.897%, (1 mo. USD LIBOR + 2.75%), 8/21/25 | | $ | 294 | | | $ 288,699 |
| | |
| | | | | | | $ 288,699 |
| | |
Drugs — 0.1% | | | | | | |
| | |
Jaguar Holding Company II, Term Loan, 3.50%, (1 mo. USD LIBOR + 2.50%, Floor 1.00%), 8/18/22 | | $ | 429 | | | $ 427,718 |
| | |
| | | | | | | $ 427,718 |
| | |
Electronics/Electrical — 0.2% | | | | | | |
| | |
Go Daddy Operating Company, LLC, Term Loan, 1.897%, (1 mo. USD LIBOR + 1.75%), 2/15/24 | | $ | 121 | | | $ 121,334 |
| | |
Hyland Software, Inc., Term Loan, 4.25%, (1 mo. USD LIBOR + 3.50%, Floor 0.75%), 7/1/24 | | | 207 | | | 207,995 |
| | |
MA FinanceCo., LLC, Term Loan, 2.897%, (1 mo. USD LIBOR + 2.75%), 6/21/24 | | | 19 | | | 18,324 |
| | |
Seattle Spinco, Inc., Term Loan, 2.897%, (1 mo. USD LIBOR + 2.75%), 6/21/24 | | | 125 | | | 123,748 |
| | | | |
| | 15 | | See Notes to Financial Statements. |
Calvert
VP SRI Balanced Portfolio
December 31, 2020
Schedule of Investments — continued
| | | | | | |
| Security | | Principal
Amount
(000’s omitted) | | | Value |
| | |
Electronics/Electrical (continued) | | | | | | |
| | |
SolarWinds Holdings, Inc., Term Loan, 2.897%, (1 mo. USD LIBOR + 2.75%), 2/5/24 | | $ | 78 | | | $ 75,200 |
| | |
SS&C European Holdings S.a.r.l., Term Loan, 4/16/25(11) | | | 37 | | | 36,283 |
| | |
SS&C Technologies, Inc., Term Loan, 4/16/25(11) | | | 48 | | | 47,907 |
| | |
Ultimate Software Group, Inc. (The), Term Loan, 5/4/26(11) | | | 250 | | | 250,250 |
| | |
| | | | | | | $ 881,041 |
| | |
Equipment Leasing — 0.0%(6) | | | | | | |
| | |
Avolon TLB Borrower 1 (US), LLC, Term Loan, 2.50%, (1 mo. USD LIBOR + 1.75%, Floor 0.75%), 1/15/25 | | $ | 147 | | | $ 146,200 |
| | |
| | | | | | | $ 146,200 |
| | |
Health Care — 0.1% | | | | | | |
| | |
Change Healthcare Holdings, LLC, Term Loan, 3.50%, (USD LIBOR + 2.50%, Floor 1.00%), 3/1/24(12) | | $ | 322 | | | $ 321,408 |
| | |
| | | | | | | $ 321,408 |
| | |
Insurance — 0.1% | | | | | | |
| | |
Asurion, LLC: | | | | | | |
| | |
Term Loan, 12/23/26(11) | | $ | 60 | | | $ 59,512 |
| | |
Term Loan, 3.147%, (1 mo. USD LIBOR + 3.00%), 11/3/23 | | | 120 | | | 119,480 |
| | |
USI, Inc., Term Loan, 5/16/24(11) | | | 229 | | | 226,114 |
| | |
| | | | | | | $ 405,106 |
|
Leisure Goods/Activities/Movies — 0.0%(6) |
| | |
Bombardier Recreational Products, Inc., Term Loan, 2.147%, (1 mo. USD LIBOR + 2.00%), 5/24/27 | | $ | 69 | | | $ 67,947 |
| | |
| | | | | | | $ 67,947 |
| | |
Lodging and Casinos — 0.0%(6) | | | | | | |
| | |
ESH Hospitality, Inc., Term Loan, 2.147%, (1 mo. USD LIBOR + 2.00%), 9/18/26 | | $ | 40 | | | $ 39,409 |
| | |
| | | | | | | $ 39,409 |
| | |
Telecommunications — 0.2% | | | | | | |
| | |
CenturyLink, Inc., Term Loan, 2.397%, (1 mo. USD LIBOR + 2.25%), 3/15/27 | | $ | 324 | | | $ 321,119 |
| | |
Level 3 Financing, Inc., Term Loan, 1.897%, (1 mo. USD LIBOR + 1.75%), 3/1/27 | | | 74 | | | 73,205 |
| | |
Ziggo Financing Partnership, Term Loan, 2.659%, (1 mo. USD LIBOR + 2.50%), 4/30/28 | | | 325 | | | 322,766 |
| | |
| | | | | | | $ 717,090 |
| | |
Total Senior Floating-Rate Loans
(identified cost $3,310,089) | | | | | | $ 3,294,618 |
| | | | | | |
Sovereign Government Bonds — 0.3% |
| | |
| Security | | Principal
Amount
(000’s omitted) | | | Value |
| | |
Kreditanstalt fuer Wiederaufbau: | | | | | | |
| | |
0.75%, 9/30/30 | | $ | 235 | | | $ 229,938 |
| | |
2.00%, 9/29/22 | | | 540 | | | 557,196 |
| | |
Kuntarahoitus Oyj, 1.375%, 9/21/21(1) | | | 200 | | | 201,618 |
| | |
Nederlandse Waterschapsbank NV, 2.125%, 11/15/21(1) | | | 230 | | | 233,801 |
| | |
Total Sovereign Government Bonds
(identified cost $1,226,790) | | | | | | $ 1,222,553 |
|
Taxable Municipal Obligations — 1.8% |
| | |
| Security | | Principal
Amount
(000’s omitted) | | | Value |
| | |
General Obligations — 0.5% | | | | | | |
| | |
Los Angeles Unified School District, CA, 5.75%, 7/1/34(13) | | $ | 450 | | | $ 635,445 |
| | |
Massachusetts, Green Bonds, 3.277%, 6/1/46 | | | 435 | | | 505,279 |
| | |
New York City, NY, 5.206%, 10/1/31(13) | | | 470 | | | 593,102 |
| | |
San Francisco City and County, CA, (Social Bonds - Affordable Housing, 2016), 3.921%, 6/15/39 | | | 285 | | | 321,115 |
| | |
| | | | | | | $ 2,054,941 |
| | |
Special Tax Revenue — 0.7% | | | | | | |
| | |
California Health Facilities Financing Authority, (No Place Like Home Program): | | | | | | |
| | |
2.361%, 6/1/26 | | $ | 405 | | | $ 433,087 |
| | |
2.484%, 6/1/27 | | | 290 | | | 311,683 |
| | |
2.534%, 6/1/28 | | | 360 | | | 386,607 |
| | |
2.584%, 6/1/29 | | | 200 | | | 214,936 |
| | |
2.984%, 6/1/33 | | | 220 | | | 235,924 |
| | |
Connecticut, Special Tax Revenue, 5.459%, 11/1/30(13) | | | 300 | | | 371,502 |
| | |
New York City Transitional Finance Authority, NY, Future Tax Secured Revenue Bonds, 5.767%, 8/1/36(13) | | | 600 | | | 782,574 |
| | |
| | | | | | | $ 2,736,313 |
| | |
Water and Sewer — 0.6% | | | | | | |
| | |
District of Columbia Water & Sewer Authority, Green Bonds, 4.814%, 10/1/2114 | | $ | 130 | | | $ 193,791 |
| | |
Narragansett Bay Commission, RI, Wastewater System Revenue, Green Bonds: | | | | | | |
| | |
2.094%, 9/1/30 | | | 170 | | | 179,315 |
| | |
2.184%, 9/1/31 | | | 140 | | | 144,798 |
| | |
2.264%, 9/1/32 | | | 125 | | | 128,836 |
| | |
2.344%, 9/1/33 | | | 135 | | | 139,443 |
| | |
San Diego County Water Authority, CA: | | | | | | |
| | |
Green Bonds, 1.531%, 5/1/30 | | | 145 | | | 147,971 |
| | |
Green Bonds, 1.701%, 5/1/31 | | | 130 | | | 133,388 |
| | | | |
| | 16 | | See Notes to Financial Statements. |
Calvert
VP SRI Balanced Portfolio
December 31, 2020
Schedule of Investments — continued
| | | | | | |
| Security | | Principal
Amount
(000’s omitted) | | | Value |
| | |
Water and Sewer (continued) | | | | | | |
| |
San Diego County Water Authority, CA: (continued) | | | |
| | |
Green Bonds, 1.951%, 5/1/34 | | $ | 75 | | | $ 76,370 |
| | |
San Francisco City and County Public Utilities Commission, CA, Water Revenue, Green Bonds, 3.303%, 11/1/39 | | | 1,440 | | | 1,538,323 |
| | |
| | | | | | | $ 2,682,235 |
| | |
Total Taxable Municipal Obligations
(identified cost $6,790,214) | | | | | | $ 7,473,489 |
|
U.S. Government Agencies and Instrumentalities — 0.5% |
| | |
| Security | | Principal
Amount
(000’s omitted) | | | Value |
| | |
U.S. Department of Housing and Urban Development: | | | | | | |
| | |
2.547%, 8/1/22 | | $ | 137 | | | $ 142,149 |
| | |
2.618%, 8/1/23 | | | 69 | | | 73,088 |
| | |
2.668%, 8/1/24 | | | 240 | | | 257,946 |
| | |
2.738%, 8/1/25 | | | 240 | | | 264,763 |
| | |
3.435%, 8/1/34 | | | 220 | | | 255,346 |
| | |
3.485%, 8/1/35 | | | 125 | | | 145,731 |
| | |
3.585%, 8/1/37 | | | 225 | | | 264,138 |
| | |
U.S. International Development Finance Corp.: | | | | | | |
| | |
3.22%, 9/15/29 | | | 388 | | | 434,019 |
| | |
3.52%, 9/20/32 | | | 370 | | | 426,300 |
| | |
Total U.S. Government Agencies and Instrumentalities
(identified cost $2,069,493) | | | | | | $ 2,263,480 |
|
U.S. Government Agency Mortgage-Backed Securities — 3.9% |
| | |
| Security | | Principal
Amount
(000’s omitted) | | | Value |
| | |
Federal Home Loan Mortgage Corp., 3.50%, 3/1/48 | | $ | 234 | | | $ 248,732 |
| | |
Federal National Mortgage Association: | | | | | | |
| | |
30-Year, 2.00%, TBA(14) | | | 1,547 | | | 1,608,389 |
| | |
30-Year, 2.50%, TBA(14) | | | 5,675 | | | 5,985,128 |
| | |
30-Year, 3.00%, TBA(14) | | | 6,050 | | | 6,339,497 |
| | |
Pool #AN1879, 2.65%, 6/1/26 | | | 323 | | | 352,021 |
| | |
Pool #AN1909, 2.68%, 7/1/26 | | | 350 | | | 383,155 |
| | |
Pool #BM3990, 4.00%, 3/1/48 | | | 541 | | | 580,600 |
| | |
Pool #MA3149, 4.00%, 10/1/47 | | | 741 | | | 794,292 |
| | |
Total U.S. Government Agency Mortgage-Backed Securities
(identified cost $16,151,585) | | | | | | $ 16,291,814 |
| | | | | | |
U.S. Treasury Obligations — 2.1% |
| | |
| Security | | Principal
Amount
(000’s omitted) | | | Value |
| | |
U.S. Treasury Bonds: | | | | | | |
| | |
1.125%, 8/15/40 | | $ | 99 | | | $ 93,601 |
| | |
1.375%, 8/15/50 | | | 255 | | | 238,345 |
| | |
2.00%, 2/15/50 | | | 124 | | | 134,429 |
| | |
U.S. Treasury Inflation-Protected Bond, 0.25%, 2/15/50(15) | | | 1,242 | | | 1,482,008 |
| | |
U.S. Treasury Inflation-Protected Notes: | | | | | | |
| | |
0.125%, 4/15/25(15) | | | 88 | | | 94,372 |
| | |
0.75%, 7/15/28(15) | | | 4,344 | | | 5,054,527 |
| | |
U.S. Treasury Notes: | | | | | | |
| | |
0.25%, 6/30/25 | | | 89 | | | 88,764 |
| | |
0.25%, 10/31/25 | | | 232 | | | 230,976 |
| | |
0.625%, 8/15/30 | | | 270 | | | 263,124 |
| | |
0.875%, 11/15/30 | | | 941 | | | 937,471 |
| | |
Total U.S. Treasury Obligations
(identified cost $7,905,844) | | | | | | $ 8,617,617 |
|
Short-Term Investments — 2.0% |
| | |
Other — 1.9% | | | | | | |
| | |
| Description | | Units | | | Value |
| | |
Calvert Cash Reserves Fund, LLC,
0.12%(16) | | | 7,856,022 | | | $ 7,856,807 |
| | |
Total Other
(identified cost $7,856,850) | | | | | | $ 7,856,807 |
| | |
Securities Lending Collateral — 0.1% | | | | | | |
| | |
| Security | | Shares | | | Value |
| | |
State Street Navigator Securities Lending Government Money Market Portfolio, 0.08%(17) | | | 305,813 | | | $ 305,813 |
| | |
Total Securities Lending Collateral
(identified cost $305,813) | | | | | | $ 305,813 |
| | |
Total Short-Term Investments
(identified cost $8,162,663) | | | | | | $ 8,162,620 |
| | |
Total Investments — 103.9%
(identified cost $340,852,848) | | | | | | $432,252,842 |
| | |
Other Assets, Less Liabilities — (3.9)% | | | | | | $(16,133,767) |
|
| | |
Net Assets — 100.0% | | | | | | $416,119,075 |
| | | | |
| | 17 | | See Notes to Financial Statements. |
Calvert
VP SRI Balanced Portfolio
December 31, 2020
Schedule of Investments — continued
The percentage shown for each investment category in the Schedule of Investments is based on net assets.
| * | In U.S. dollars unless otherwise indicated. |
| (1) | Security exempt from registration under Rule 144A of the Securities Act of 1933, as amended. These securities may be sold in certain transactions in reliance on an exemption from registration (normally to qualified institutional buyers). At December 31, 2020, the aggregate value of these securities is $42,007,460 or 10.1% of the Fund’s net assets. |
| (2) | Variable rate security. The stated interest rate represents the rate in effect at December 31, 2020. |
| (3) | Step coupon security. Interest rate represents the rate in effect at December 31, 2020. |
| (4) | Weighted average fixed-rate coupon that changes/updates monthly. Rate shown is the rate at December 31, 2020. |
| (5) | Non-income producing security. |
| (6) | Amount is less than 0.05%. |
| (7) | All or a portion of this security was on loan at December 31, 2020. The aggregate market value of securities on loan at December 31, 2020 was $572,495. |
| (8) | Security converts to variable rate after the indicated fixed-rate coupon period. |
| (9) | Perpetual security with no stated maturity date but may be subject to calls by the issuer. |
| (10) | Senior floating-rate loans (Senior Loans) often require prepayments from excess cash flows or permit the borrowers to repay at their election. The degree to which borrowers repay, whether as a contractual requirement or at their election, cannot be predicted with accuracy. As a result, the actual remaining maturity may be substantially less than the stated maturities shown. However, Senior Loans will typically have an expected average life of approximately two to four years. Senior Loans typically have rates of interest which are redetermined periodically by reference to a base lending rate, plus a spread. These base lending rates are primarily the London Interbank Offered Rate (“LIBOR”) and secondarily, the prime rate offered by one or more major United States banks (the “Prime Rate”). Base lending rates may be subject to a floor, or minimum rate. Senior Loans are generally subject to contractual restrictions that must be satisfied before they can be bought or sold. |
| (11) | This Senior Loan will settle after December 31, 2020, at which time the interest rate will be determined. |
| (12) | The stated interest rate represents the weighted average interest rate at December 31, 2020 of contracts within the senior loan facility. Interest rates on contracts are primarily redetermined either weekly, monthly or quarterly by reference to the indicated base lending rate and spread and the reset period. |
| (13) | Build America Bond. Represents taxable municipal obligation issued pursuant to the American Recovery and Reinvestment Act of 2009 or other legislation providing for the issuance of taxable municipal debt on which the issuer receives federal support. |
| (14) | TBA (To Be Announced) securities are purchased on a forward commitment basis with an approximate principal amount and maturity date. The actual principal amount and maturity date are determined upon settlement. |
| (15) | Inflation-linked security whose principal is adjusted for inflation based on changes in the U.S. Consumer Price Index. Interest is calculated based on the inflation-adjusted principal. |
| (16) | Affiliated investment company, available to Calvert portfolios and funds, which invests in high quality, U.S. dollar denominated money market instruments. The rate shown is the annualized seven-day yield as of December 31, 2020. |
| (17) | Represents investment of cash collateral received in connection with securities lending. |
| | | | |
| | 18 | | See Notes to Financial Statements. |
Calvert
VP SRI Balanced Portfolio
December 31, 2020
Schedule of Investments — continued
Futures Contracts
| | | | | | | | | | | | | | | | | | | | |
| Description | | Number of
Contracts | | | Position | | | Expiration
Date | | | Notional
Amount | | | Value/
Unrealized
Appreciation
(Depreciation) | |
| |
| | | | | |
Interest Rate Futures | | | | | | | | | | | | | | | | | | | | |
| | | | | |
U.S. 2-Year Treasury Note | | | 19 | | | | Long | | | | 3/31/21 | | | $ | 4,198,555 | | | $ | 4,125 | |
| | | | | |
U.S. 5-Year Treasury Note | | | 1 | | | | Long | | | | 3/31/21 | | | | 126,164 | | | | 287 | |
| | | | | |
U.S. Long Treasury Bond | | | 9 | | | | Long | | | | 3/22/21 | | | | 1,558,688 | | | | (3,736 | ) |
| | | | | |
U.S. Ultra-Long Treasury Bond | | | 29 | | | | Long | | | | 3/22/21 | | | | 6,193,313 | | | | (86,093 | ) |
| | | | | |
U.S. 5-Year Treasury Note | | | (33 | ) | | | Short | | | | 3/31/21 | | | | (4,163,414 | ) | | | (9,854 | ) |
| | | | | |
U.S. Long Treasury Bond | | | (2 | ) | | | Short | | | | 3/22/21 | | | | (346,375 | ) | | | 1,028 | |
| | | | | |
U.S. Ultra 10-Year Treasury Note | | | (168 | ) | | | Short | | | | 3/22/21 | | | | (26,268,375 | ) | | | 80,100 | |
| | | | | |
U.S. Ultra-Long Treasury Bond | | | (3 | ) | | | Short | | | | 3/22/21 | | | | (640,688 | ) | | | 4,916 | |
| |
| | | | | | | | | | | | | | | | | | $ | (9,227 | ) |
| |
| | |
| Abbreviations: |
| |
| ADR | | – American Depositary Receipt |
| |
| LIBOR | | – London Interbank Offered Rate |
| |
| SOFR | | – Secured Overnight Financing Rate |
| |
| TBA | | – To Be Announced |
|
| Currency Abbreviations: |
| |
| BRL | | – Brazilian Real |
| |
| USD | | – United States Dollar |
| | | | |
| | 19 | | See Notes to Financial Statements. |
Calvert
VP SRI Balanced Portfolio
December 31, 2020
Statement of Assets and Liabilities
| | | | |
| Assets | | December 31, 2020 | |
Investments in securities of unaffiliated issuers, at value (identified cost $332,995,998) - including $572,495 of securities on loan | | | $424,396,035 | |
Investments in securities of affiliated issuers, at value (identified cost $7,856,850) | | | 7,856,807 | |
Cash | | | 623,871 | |
Deposits at broker for futures contracts | | | 238,416 | |
Receivable for capital shares sold | | | 476,730 | |
Dividends and interest receivable | | | 979,358 | |
Dividends receivable - affiliated | | | 784 | |
Securities lending income receivable | | | 164 | |
Tax reclaims receivable | | | 25,162 | |
Directors’ deferred compensation plan | | | 65,340 | |
Total assets | | | $434,662,667 | |
| |
Liabilities | | | | |
Payable for variation margin on open futures contracts | | | $ 14,829 | |
Payable for investments purchased | | | 3,382,281 | |
Payable for when-issued/delayed delivery/forward commitment securities | | | 13,884,667 | |
Payable for capital shares redeemed | | | 540,334 | |
Deposits for securities loaned | | | 305,813 | |
Payable to affiliates: | | | | |
Investment advisory fee | | | 142,479 | |
Administrative fee | | | 41,701 | |
Distribution and service fees | | | 1,575 | |
Sub-transfer agency fee | | | 180 | |
Directors’ deferred compensation plan | | | 65,340 | |
Accrued expenses | | | 164,393 | |
Total liabilities | | | $ 18,543,592 | |
Net Assets | | | $416,119,075 | |
| |
Sources of Net Assets | | | | |
Paid-in capital | | | $306,973,870 | |
Distributable earnings | | | 109,145,205 | |
Total | | | $416,119,075 | |
| |
Class I Shares | | | | |
Net Assets | | | $408,223,209 | |
Shares Outstanding | | | 161,740,886 | |
Net Asset Value, Offering Price and Redemption Price Per Share | | | | |
(net assets ÷ shares of beneficial interest outstanding) | | | $ 2.52 | |
| |
Class F Shares | | | | |
Net Assets | | | $ 7,895,866 | |
Shares Outstanding | | | 3,127,758 | |
Net Asset Value, Offering Price and Redemption Price Per Share | | | | |
(net assets ÷ shares of beneficial interest outstanding) | | | $ 2.52 | |
| | | | |
| | 20 | | See Notes to Financial Statements. |
Calvert
VP SRI Balanced Portfolio
December 31, 2020
Statement of Operations
| | | | |
| | | Year Ended |
| Investment Income | | December 31, 2020 |
Dividend income (net of foreign taxes withheld of $ 34,042) | | | $ 3,260,176 | |
Dividend income - affiliated issuers | | | 6,824 | |
Interest and other income (net of foreign taxes withheld of $ 69) | | | 4,183,579 | |
Securities lending income, net | | | 3,989 | |
| |
Total investment income | | | $ 7,454,568 | |
| |
Expenses | | | | |
Investment advisory fee | | | $ 1,512,457 | |
Administrative fee | | | 442,670 | |
Distribution and service fees: | | | | |
Class F | |
| 15,459
|
|
Directors’ fees and expenses | | | 19,065 | |
Custodian fees | | | 13,105 | |
Transfer agency fees and expenses | | | 57,215 | |
Accounting fees | | | 144,665 | |
Professional fees | | | 41,119 | |
Reports to shareholders | | | 39,922 | |
Miscellaneous | | | 38,110 | |
| |
Total expenses | | | $ 2,323,787 | |
| |
Net investment income | | | $ 5,130,781 | |
| |
Realized and Unrealized Gain (Loss) | | | | |
Net realized gain (loss): | | | | |
Investment securities | | | $ 12,788,147 | |
Investment securities - affiliated issuers | | | 778 | |
Futures contracts | | | 68,984 | |
Foreign currency transactions | | | (3,338 | ) |
| |
Net realized gain | | | $ 12,854,571 | |
Change in unrealized appreciation (depreciation): | | | | |
Investment securities | | | $ 36,198,411 | |
Investment securities - affiliated issuers | | | (43 | ) |
Futures contracts | | | 113,820 | |
Foreign currency | | | 186 | |
| |
Net change in unrealized appreciation (depreciation) | | | $ 36,312,374 | |
| |
Net realized and unrealized gain | | | $ 49,166,945 | |
| |
Net increase in net assets from operations | | | $ 54,297,726 | |
| | | | |
| | 21 | | See Notes to Financial Statements. |
Calvert
VP SRI Balanced Portfolio
December 31, 2020
Statements of Changes in Net Assets
| | | | | | | | |
| | | Year Ended December 31, | |
Increase (Decrease) in Net Assets | | 2020 | | | 2019 | |
From operations: | | | | | | | | |
Net investment income | | $ | 5,130,781 | | | $ | 5,646,608 | |
Net realized gain | | | 12,854,571 | | | | 12,550,060 | |
Net change in unrealized appreciation (depreciation) | | | 36,312,374 | | | | 53,518,070 | |
| | |
Net increase in net assets from operations | | $ | 54,297,726 | | | $ | 71,714,738 | |
Distributions to shareholders: | | | | | | | | |
Class I | | $ | (17,095,943 | ) | | $ | (17,324,508 | ) |
Class F | | | (305,549 | ) | | | (195,158 | ) |
| | |
Total distributions to shareholders | | $ | (17,401,492 | ) | | $ | (17,519,666 | ) |
Capital share transactions: | | | | | | | | |
Class I | | $ | 9,550,261 | | | $ | 12,319,228 | |
Class F | | | 2,257,686 | | | | 2,635,364 | |
| | |
Net increase in net assets from capital share transactions | | $ | 11,807,947 | | | $ | 14,954,592 | |
| | |
Net increase in net assets | | $ | 48,704,181 | | | $ | 69,149,664 | |
| | |
Net Assets | | | | | | | | |
At beginning of year | | $ | 367,414,894 | | | $ | 298,265,230 | |
At end of year | | $ | 416,119,075 | | | $ | 367,414,894 | |
| | | | |
| | 22 | | See Notes to Financial Statements. |
Calvert
VP SRI Balanced Portfolio
December 31, 2020
Financial Highlights
| | | | | | | | | | | | | | | | | | | | |
| | | Class I | |
| | | Year Ended December 31, | |
| | | 2020 | | | 2019 | | | 2018 | | | 2017 | | | 2016 | |
Net asset value — Beginning of year | | $ | 2.29 | | | $ | 1.94 | | | $ | 2.23 | | | $ | 2.05 | | | $ | 2.00 | |
| | | | | |
Income (Loss) From Operations | | | | | | | | | | | | | | | | | | | | |
Net investment income(1) | | $ | 0.03 | | | $ | 0.04 | | | $ | 0.04 | | | $ | 0.04 | | | $ | 0.04 | |
Net realized and unrealized gain (loss) | | | 0.31 | | | | 0.43 | | | | (0.08 | ) | | | 0.20 | | | | 0.11 | |
| | | | | |
Total income (loss) from operations | | $ | 0.34 | | | $ | 0.47 | | | $ | (0.04 | ) | | $ | 0.24 | | | $ | 0.15 | |
| | | | | |
Less Distributions | | | | | | | | | | | | | | | | | | | | |
From net investment income | | $ | (0.04 | ) | | $ | (0.04 | ) | | $ | (0.04 | ) | | $ | (0.04 | ) | | $ | (0.04 | ) |
From net realized gain | | | (0.07 | ) | | | (0.08 | ) | | | (0.21 | ) | | | (0.02 | ) | | | (0.06 | ) |
| | | | | |
Total distributions | | $ | (0.11 | ) | | $ | (0.12 | ) | | $ | (0.25 | ) | | $ | (0.06 | ) | | $ | (0.10 | ) |
| | | | | |
Net asset value — End of year | | $ | 2.52 | | | $ | 2.29 | | | $ | 1.94 | | | $ | 2.23 | | | $ | 2.05 | |
| | | | | |
Total Return(2) | | | 15.26 | % | | | 24.40 | % | | | (2.67 | )% | | | 12.16 | % | | | 7.58 | % |
| | | | | |
Ratios/Supplemental Data | | | | | | | | | | | | | | | | | | | | |
Net assets, end of year (000’s omitted) | | $ | 408,223 | | | $ | 362,392 | | | $ | 296,345 | | | $ | 329,060 | | | $ | 325,638 | |
Ratios (as a percentage of average daily net assets):(3) | | | | | | | | | | | | | | | | | | | | |
Total expenses | | | 0.63 | % | | | 0.62 | % | | | 0.72 | % | | | 0.69 | % | | | 0.75 | % |
Net expenses | | | 0.63 | % | | | 0.62 | % | | | 0.70 | % | | | 0.68 | % | | | 0.70 | % |
Net investment income | | | 1.39 | % | | | 1.68 | % | | | 1.66 | % | | | 1.73 | % | | | 2.06 | % |
Portfolio Turnover | | | 104 | %(4) | | | 70 | %(4) | | | 77 | % | | | 132 | % | | | 129 | % |
| (1) | Computed using average shares outstanding. |
| (2) | Returns are historical and are calculated by determining the percentage change in net asset value with all distributions reinvested and do not reflect fees and expenses imposed by variable annuity contracts or variable life insurance policies. If included, total return would be lower. |
| (3) | Total expenses do not reflect amounts reimbursed and/or waived by the adviser and certain of its affiliates, if applicable. Net expenses are net of all reductions and represent the net expenses paid by the Fund. |
| (4) | Includes the effect of To-Be-Announced (TBA) transactions. |
| | | | |
| | 23 | | See Notes to Financial Statements. |
Calvert
VP SRI Balanced Portfolio
December 31, 2020
Financial Highlights — continued
| | | | | | | | | | | | | | | | | | | | |
| | | Class F | |
| | | Year Ended December 31, | |
| | | 2020 | | | 2019 | | | 2018 | | | 2017 | | | 2016 | |
Net asset value — Beginning of year | | $ | 2.30 | | | $ | 1.95 | | | $ | 2.24 | | | $ | 2.08 | | | $ | 2.03 | |
| | | | | |
Income (Loss) From Operations | | | | | | | | | | | | | | | | | | | | |
Net investment income(1) | | $ | 0.03 | | | $ | 0.03 | | | $ | 0.03 | | | $ | 0.03 | | | $ | 0.03 | |
Net realized and unrealized gain (loss) | | | 0.30 | | | | 0.44 | | | | (0.07 | ) | | | 0.19 | | | | 0.12 | |
| | | | | |
Total income (loss) from operations | | $ | 0.33 | | | $ | 0.47 | | | $ | (0.04 | ) | | $ | 0.22 | | | $ | 0.15 | |
| | | | | |
Less Distributions | | | | | | | | | | | | | | | | | | | | |
From net investment income | | $ | (0.04 | ) | | $ | (0.04 | ) | | $ | (0.04 | ) | | $ | (0.04 | ) | | $ | (0.04 | ) |
From net realized gain | | | (0.07 | ) | | | (0.08 | ) | | | (0.21 | ) | | | (0.02 | ) | | | (0.06 | ) |
| | | | | |
Total distributions | | $ | (0.11 | ) | | $ | (0.12 | ) | | $ | (0.25 | ) | | $ | (0.06 | ) | | $ | (0.10 | ) |
| | | | | |
Net asset value — End of year | | $ | 2.52 | | | $ | 2.30 | | | $ | 1.95 | | | $ | 2.24 | | | $ | 2.08 | |
| | | | | |
Total Return(2) | | | 14.76 | % | | | 24.28 | % | | | (2.65 | )% | | | 11.01 | % | | | 7.14 | % |
| | | | | |
Ratios/Supplemental Data | | | | | | | | | | | | | | | | | | | | |
Net assets, end of year (000’s omitted) | | $ | 7,896 | | | $ | 5,023 | | | $ | 1,920 | | | $ | 1,540 | | | $ | 588 | |
Ratios (as a percentage of average daily net assets):(3) | | | | | | | | | | | | | | | | | | | | |
Total expenses | | | 0.88 | % | | | 0.86 | % | | | 0.96 | % | | | 1.40 | % | | | 1.40 | % |
Net expenses | | | 0.88 | % | | | 0.86 | % | | | 0.96 | % | | | 1.08 | % | | | 1.10 | % |
Net investment income | | | 1.13 | % | | | 1.44 | % | | | 1.40 | % | | | 1.30 | % | | | 1.65 | % |
Portfolio Turnover | | | 104 | %(4) | | | 70 | %(4) | | | 77 | % | | | 132 | % | | | 129 | % |
| (1) | Computed using average shares outstanding. |
| (2) | Returns are historical and are calculated by determining the percentage change in net asset value with all distributions reinvested and do not reflect fees and expenses imposed by variable annuity contracts or variable life insurance policies. If included, total return would be lower. |
| (3) | Total expenses do not reflect amounts reimbursed and/or waived by the adviser and certain of its affiliates, if applicable. Net expenses are net of all reductions and represent the net expenses paid by the Fund. |
| (4) | Includes the effect of To-Be-Announced (TBA) transactions. |
| | | | |
| | 24 | | See Notes to Financial Statements. |
Calvert
VP SRI Balanced Portfolio
December 31, 2020
Notes to Financial Statements
1 Significant Accounting Policies
Calvert VP SRI Balanced Portfolio (the Fund) is a diversified series of Calvert Variable Series, Inc. (the Corporation). The Corporation is a Maryland corporation registered under the Investment Company Act of 1940, as amended (the 1940 Act), as an open-end management investment company. The investment objective of the Fund is to seek to provide a competitive total return through an actively managed portfolio of stocks, bonds and money market instruments which offer income and capital growth opportunity.
Shares of the Fund are sold without sales charge to insurance companies for allocation to certain of their variable separate accounts. The Fund offers Class I and Class F shares. Among other things, each class has different: (a) dividend rates due to differences in Distribution Plan expenses and other class-specific expenses; (b) exchange privileges; and (c) class-specific voting rights.
The Fund applies the accounting and reporting guidance in the Financial Accounting Standards Board (FASB) Accounting Standards Codification Topic 946, Financial Services – Investment Companies (ASC 946). Subsequent events, if any, through the date that the financial statements were issued have been evaluated in the preparation of the financial statements.
A Investment Valuation — Net asset value per share is determined every business day as of the close of the regular session of the New York Stock Exchange (generally 4:00 p.m. Eastern time). The Fund uses independent pricing services approved by the Board of Directors (the Board) to value its investments wherever possible. Investments for which market quotations are not available or deemed not reliable are fair valued in good faith under the direction of the Board.
U.S. generally accepted accounting principles (U.S. GAAP) establishes a disclosure hierarchy that categorizes the inputs to valuation techniques used to value assets and liabilities at measurement date. These inputs are summarized in the three broad levels listed below:
Level 1 - quoted prices in active markets for identical securities
Level 2 - other significant observable inputs (including quoted prices for similar securities, interest rates, prepayment speeds, credit risk, etc.)
Level 3 - significant unobservable inputs (including the Fund’s own assumptions in determining the fair value of investments)
The inputs or methodologies used for valuing securities are not necessarily an indication of the risk associated with investing in those securities.
Valuation techniques used to value the Fund’s investments by major category are as follows:
Equity Securities. Equity securities (including warrants and rights) listed on a U.S. securities exchange generally are valued at the last sale or closing price as reported by an independent pricing service on the primary market or exchange on which they are traded and are categorized as Level 1 in the hierarchy. Equity securities listed on the NASDAQ Global or Global Select Market are valued at the NASDAQ official closing price and are categorized as Level 1 in the hierarchy. Unlisted or listed securities for which closing sales prices or closing quotations are not available are valued at the mean between the latest available bid and ask prices and are categorized as Level 2 in the hierarchy.
Debt Securities. Debt securities are generally valued based on valuations provided by third party pricing services, as derived from such services’ pricing models. Inputs to the models may include, but are not limited to, reported trades, executable bid and ask prices, broker/dealer quotations, prices or yields of securities with similar characteristics, interest rates, anticipated prepayments, benchmark curves or information pertaining to the issuer, as well as industry and economic events. Accordingly, debt securities are generally categorized as Level 2 in the hierarchy. Short-term debt securities with a remaining maturity at time of purchase of more than sixty days are valued based on valuations provided by a third party pricing service. Such securities are generally categorized as Level 2 in the hierarchy. Short-term debt securities of sufficient credit quality purchased with remaining maturities of sixty days or less are valued at amortized cost, which approximates fair value, and are categorized as Level 2 in the hierarchy.
Senior Floating-Rate Loans. Interests in senior floating-rate loans for which reliable market quotations are readily available are valued generally at the average mean of bid and ask quotations obtained from a third party pricing service, and are categorized as Level 2 in the hierarchy.
Affiliated Fund. The Fund may invest in Calvert Cash Reserves Fund, LLC (Cash Reserves Fund), an affiliated investment company managed by Calvert Research and Management (CRM). While Cash Reserves Fund is not a registered money market mutual fund, it conducts all of its investment activities in accordance with the requirements of Rule 2a-7 under the 1940 Act. Investments in Cash Reserves Fund are valued at the closing net asset value per unit on the valuation day and are categorized as Level 2 in the hierarchy. Cash Reserves Fund generally values its investment securities based on available market quotations provided by a third party pricing service.
Other Securities. Investments in registered investment companies (including money market funds) that do not trade on an exchange are valued at the net asset value per share on the valuation day and are categorized as Level 1 in the hierarchy.
Derivatives. Futures contracts are valued at unrealized appreciation (depreciation) based on the settlement price established each day by the board of trade or exchange on which they are traded and are categorized as Level 1 in the hierarchy.
25
Calvert
VP SRI Balanced Portfolio
December 31, 2020
Notes to Financial Statements — continued
Fair Valuation. If a market value cannot be determined for a security using the methodologies described above, or if, in the good faith opinion of the Fund’s adviser, the market value does not constitute a readily available market quotation, or if a significant event has occurred that would materially affect the value of the security, the security will be fair valued as determined in good faith by or at the direction of the Board in a manner that most fairly reflects the security’s “fair value”, which is the amount that the Fund might reasonably expect to receive for the security upon its current sale in the ordinary course. Each such determination is based on a consideration of relevant factors, which are likely to vary from one pricing context to another. These factors may include, but are not limited to, the type of security, the existence of any contractual restrictions on the security’s disposition, the price and extent of public trading in similar securities of the issuer or of comparable companies or entities, quotations or relevant information obtained from broker/dealers or other market participants, information obtained from the issuer, analysts, and/or the appropriate stock exchange (for exchange-traded securities), an analysis of the company’s or entity’s financial statements, and an evaluation of the forces that influence the issuer and the market(s) in which the security is purchased and sold.
The values assigned to fair value investments are based on available information and do not necessarily represent amounts that might ultimately be realized. Further, due to the inherent uncertainty of valuations of such investments, the fair values may differ significantly from the values that would have been used had an active market existed, and the differences could be material.
The following table summarizes the market value of the Fund’s holdings as of December 31, 2020, based on the inputs used to value them:
| | | | | | | | | | | | | | | | |
| Asset Description | | Level 1 | | | Level 2 | | | Level 3 | | | Total | |
| | | | |
Asset-Backed Securities | | $ | — | | | $ | 21,919,478 | | | $ | — | | | $ | 21,919,478 | |
| | | | |
Collateralized Mortgage-Backed Obligations | | | — | | | | 7,258,302 | | | | — | | | | 7,258,302 | |
| | | | |
Commercial Mortgage-Backed Securities | | | — | | | | 20,378,445 | | | | — | | | | 20,378,445 | |
| | | | |
Common Stocks | | | 268,507,913 | (1) | | | — | | | | — | | | | 268,507,913 | |
| | | | |
Convertible Bonds | | | — | | | | 280,704 | | | | — | | | | 280,704 | |
| | | | |
Convertible Preferred Stocks | | | 27,565 | | | | — | | | | — | | | | 27,565 | |
| | | | |
Corporate Bonds | | | — | | | | 64,922,613 | | | | — | | | | 64,922,613 | |
| | | | |
Preferred Stocks | | | 1,631,631 | | | | — | | | | — | | | | 1,631,631 | |
| | | | |
Senior Floating-Rate Loans | | | — | | | | 3,294,618 | | | | — | | | | 3,294,618 | |
| | | | |
Sovereign Government Bonds | | | — | | | | 1,222,553 | | | | — | | | | 1,222,553 | |
| | | | |
Taxable Municipal Obligations | | | — | | | | 7,473,489 | | | | — | | | | 7,473,489 | |
| | | | |
U.S. Government Agencies and Instrumentalities | | | — | | | | 2,263,480 | | | | — | | | | 2,263,480 | |
| | | | |
U.S. Government Agency Mortgage-Backed Securities | | | — | | | | 16,291,814 | | | | — | | | | 16,291,814 | |
| | | | |
U.S. Treasury Obligations | | | — | | | | 8,617,617 | | | | — | | | | 8,617,617 | |
| | | | |
Short-Term Investments: | | | | | | | | | | | | | | | | |
| | | | |
Other | | | — | | | | 7,856,807 | | | | — | | | | 7,856,807 | |
| | | | |
Securities Lending Collateral | | | 305,813 | | | | — | | | | — | | | | 305,813 | |
| | | | |
Total Investments | | $ | 270,472,922 | | | $ | 161,779,920 | | | $ | — | | | $ | 432,252,842 | |
| | | | |
Futures Contracts | | $ | 90,456 | | | $ | — | | | $ | — | | | $ | 90,456 | |
| | | | |
Total | | $ | 270,563,378 | | | $ | 161,779,920 | | | $ | — | | | $ | 432,343,298 | |
| | | | |
Liability Description | | | | | | | | | | | | | | | | |
| | | | |
Futures Contracts | | $ | (99,683 | ) | | $ | — | | | $ | — | | | $ | (99,683 | ) |
| | | | |
Total | | $ | (99,683 | ) | | $ | — | | | $ | — | | | $ | (99,683 | ) |
(1) The level classification by major category of investments is the same as the category presentation in the Schedule of Investments.
Level 3 investments at the beginning and/or end of the period in relation to net assets were not significant and accordingly, a reconciliation of Level 3 assets for the year ended December 31, 2020 is not presented.
B Investment Transactions and Income — Investment transactions for financial statement purposes are accounted for on trade date. Realized gains and losses are recorded on an identified cost basis and may include proceeds from litigation. Dividend income is recorded on the ex-dividend date for dividends received in cash and/or securities or, in the case of dividends on certain foreign securities, as soon as the Fund is informed of the ex-dividend date. Non-cash dividends are recorded at the fair value of the securities received. Withholding taxes on foreign dividends and interest, if any, have been provided for in
26
Calvert
VP SRI Balanced Portfolio
December 31, 2020
Notes to Financial Statements — continued
accordance with the Fund’s understanding of the applicable country’s tax rules and rates. Distributions received that represent a return of capital are recorded as a reduction of cost of investments. Distributions received that represent a capital gain are recorded as a realized gain. Interest income, which includes amortization of premium and accretion of discount on debt securities, is accrued as earned. The Fund may earn certain fees in connection with its investments in senior floating-rate loans. These fees are in addition to interest payments earned and may include amendment fees, consent fees and prepayment fees, which are recorded to income as earned. Inflation adjustments to the principal amount of inflation-adjusted bonds and notes are reflected as interest income. Deflation adjustments to the principal amount of an inflation-adjusted bond or note are reflected as reductions to interest income to the extent of interest income previously recorded on such bond or note.
C Share Class Accounting — Realized and unrealized gains and losses and net investment income and losses, other than class-specific expenses, are allocated daily to each class of shares based upon the relative net assets of each class to the total net assets of the Fund. Expenses arising in connection with a specific class are charged directly to that class.
D Foreign Currency Transactions — The Fund’s accounting records are maintained in U.S. dollars. For valuation of assets and liabilities on each date of net asset value determination, foreign denominations are converted into U.S. dollars using the current exchange rate. Security transactions, income and expenses are translated at the prevailing rate of exchange on the date of the event. Recognized gains or losses on investment transactions attributable to changes in foreign currency exchange rates are recorded for financial statement purposes as net realized gains and losses on investments. That portion of unrealized gains and losses on investments that results from fluctuations in foreign currency exchange rates is not separately disclosed.
E Senior Floating-Rate Loans — The Fund may invest in direct debt instruments, which are interests in amounts owed to lenders or lending syndicates by corporate, governmental, or other borrowers. The Fund’s investment in loans may be in the form of participations in loans or assignments of all or a portion of loans from third parties. A loan is often administered by a bank or other financial institution (the lender) that acts as agent for all holders. The agent administers the terms of the loan, as specified in the loan agreement. The Fund may invest in multiple series or tranches of a loan, which may have varying terms and carry different associated risks. When the Fund purchases assignments from lenders, it acquires direct rights against the borrower of the loan. When investing in a loan participation, the Fund has the right to receive payments of principal, interest and any fees to which it is entitled only from the lender selling the loan agreement and only upon receipt of such payments by the lender from the borrower. The Fund generally has no right to enforce compliance by the borrower with the terms of the loan agreement. As a result, the Fund may be subject to the credit risk of both the borrower and the lender that is issuing the participation interest.
F Unfunded Loan Commitments — The Fund may enter into certain loan agreements all or a portion of which may be unfunded. The Fund is obligated to fund these commitments at the borrower’s discretion. The commitments, if any, are disclosed in the accompanying Schedule of Investments.
G Futures Contracts — The Fund may enter into futures contracts to buy or sell a financial instrument for a set price at a future date. Initial margin deposits of either cash or securities as required by the broker are made upon entering into the contract. While the contract is open, daily variation margin payments are made to or received from the broker reflecting the daily change in market value of the contract and are recorded for financial reporting purposes as unrealized gains or losses by the Fund. When a futures contract is closed, a realized gain or loss is recorded equal to the difference between the opening and closing value of the contract. The risks associated with entering into futures contracts may include the possible illiquidity of the secondary market which would limit the Fund’s ability to close out a futures contract prior to the settlement date, an imperfect correlation between the value of the contracts and the underlying financial instruments, or that the counterparty will fail to perform its obligations under the contracts’ terms. Futures contracts are designed by boards of trade, which are designated “contracts markets” by the Commodities Futures Trading Commission. Futures contracts trade on the contracts markets in a manner that is similar to the way a stock trades on a stock exchange, and the boards of trade, through their clearing corporations, guarantee the futures contracts against default. As a result, there is minimal counterparty credit risk to the Fund.
H Options Contracts — Upon the purchase of a call or put option, the premium paid by the Fund is included in the Statement of Assets and Liabilities as an investment. The amount of the investment is subsequently marked-to-market to reflect the current market value of the option purchased, in accordance with the Fund’s policies on investment valuations discussed above. Premiums paid for purchasing options that expire are treated as realized losses. Premiums paid for purchasing options that are exercised or closed are added to the amounts paid or offset against the proceeds on the underlying investment transaction to determine the realized gain or loss. As the purchaser of an index option, the Fund has the right to receive a cash payment equal to any depreciation in the value of the index below the exercise price of the option (in the case of a put) or equal to any appreciation in the value of the index over the exercise price of the option (in the case of a call) as of the valuation date of the option. The risk associated with purchasing options is limited to the premium originally paid. Purchased options traded over-the-counter involve risk that the issuer or counterparty will fail to perform its contractual obligations.
I Distributions to Shareholders — Distributions to shareholders are recorded by the Fund on ex-dividend date. The Fund distributes any net investment income and net realized capital gains at least annually. Both types of distributions are made in shares of the Fund unless an election is made on behalf of a separate account to receive some or all of the distributions in cash. Distributions are declared separately for each class of shares. Distributions are determined in accordance with income tax regulations, which may differ from U.S. GAAP; accordingly, periodic reclassifications are made within the Fund’s capital accounts to reflect income and gains available for distribution under income tax regulations.
27
Calvert
VP SRI Balanced Portfolio
December 31, 2020
Notes to Financial Statements — continued
J Estimates — The preparation of financial statements in conformity with U.S. GAAP requires management to make estimates and assumptions that affect the reported amounts of assets and liabilities and disclosure of contingent assets and liabilities at the date of the financial statements and the reported amounts of increases and decreases in net assets from operations during the reporting period. Actual results could differ from those estimates.
K Indemnifications — The Corporation’s By-Laws provide for indemnification for Directors or officers of the Corporation and certain other parties, to the fullest extent permitted by Maryland law and the 1940 Act, provided certain conditions are met. Additionally, in the normal course of business, the Fund enters into agreements with service providers that may contain indemnification clauses. The Fund’s maximum exposure under these arrangements is unknown as this would involve future claims that may be made against the Fund that have not yet occurred.
L Federal Income Taxes — No provision for federal income or excise tax is required since the Fund intends to continue to qualify as a regulated investment company under the Internal Revenue Code and to distribute substantially all of its taxable earnings.
Management has analyzed the Fund’s tax positions taken for all open federal income tax years and has concluded that no provision for federal income tax is required in the Fund’s financial statements. A Fund’s federal tax return is subject to examination by the Internal Revenue Service for a period of three years from the date of filing.
M When-Issued Securities and Delayed Delivery Transactions — The Fund may purchase or sell securities on a delayed delivery, when-issued or forward commitment basis, including TBA (To Be Announced) securities. Payment and delivery may take place after the customary settlement period for that security. At the time the transaction is negotiated, the price of the security that will be delivered is fixed. The Fund maintains cash and/or security positions for these commitments such that sufficient liquid assets will be available to make payments upon settlement. Securities purchased on a delayed delivery, when-issued or forward commitment basis are marked-to-market daily and begin earning interest on settlement date. Losses may arise due to changes in the market value of the underlying securities or if the counterparty does not perform under the contract. A forward purchase or sale commitment may be closed by entering into an offsetting commitment or delivery of securities. The Fund will realize a gain or loss on investments based on the price established when the Fund entered into the commitment.
2 Related Party Transactions
The investment advisory fee is earned by CRM, a subsidiary of Eaton Vance Management (EVM), as compensation for investment advisory services rendered to the Fund. EVM is a wholly-owned subsidiary of Eaton Vance Corp. Pursuant to the investment advisory agreement, CRM receives a fee, payable monthly, at the following annual rates of the Fund’s average daily net assets: 0.41% on the first $500 million, 0.36% on the next $500 million, and 0.325% on the excess of $1 billion. For the year ended December 31, 2020, the investment advisory fee amounted to $1,512,457 or 0.41% of the Fund’s average daily net assets. The Fund may invest its cash in Cash Reserves Fund. CRM does not currently receive a fee for advisory services provided to Cash Reserves Fund.
Prior to May 1, 2020, CRM had agreed to reimburse the Fund’s operating expenses to the extent that total annual operating expenses (relating to ordinary operating expenses only and excluding expenses such as brokerage commissions, acquired fund fees and expenses of unaffiliated funds, borrowing costs, taxes or litigation expenses) exceeded 0.70% for Class I and 0.95% for Class F of such class’s average daily net assets. Pursuant to this agreement, no operating expenses were waived or reimbursed for the year ended December 31, 2020.
The administrative fee is earned by CRM as compensation for administrative services rendered to the Fund. The fee is computed at an annual rate of 0.12% of the Fund’s average daily net assets attributable to Class I and Class F and is payable monthly. For the year ended December 31, 2020, CRM was paid administrative fees of $442,670.
The Fund has in effect a distribution plan for Class F shares (Class F Plan) pursuant to Rule 12b-1 under the 1940 Act. Pursuant to the Class F Plan, the Fund pays Eaton Vance Distributors, Inc. (EVD), an affiliate of CRM and the Fund’s principal underwriter, a distribution and service fee of 0.25% per annum of its average daily net assets attributable to Class F shares for distribution services and facilities provided to the Fund, as well as for personal and/or account maintenance services provided to the class shareholders. Distribution and service fees paid or accrued for the year ended December 31, 2020 amounted to $15,459 for Class F shares.
EVM provides sub-transfer agency and related services to the Fund pursuant to a Sub-Transfer Agency Support Services Agreement. For the year ended December 31, 2020, sub-transfer agency fees and expenses incurred to EVM amounted to $702 and are included in transfer agency fees and expenses on the Statement of Operations.
Each Director of the Fund who is not an employee of CRM or its affiliates receives an annual fee of $154,000, plus an annual Committee fee ranging from $8,500 to $16,500 depending on the Committee. The Board chair receives an additional $20,000 ($30,000 effective January 1, 2021) annual fee and Committee chairs receive an additional $6,000 annual fee. Eligible Directors may participate in a Deferred Compensation Plan (the Plan). Amounts deferred under the Plan are treated as though equal dollar amounts had been invested in shares of the Fund or other Calvert funds selected by the Directors. The Fund purchases shares of the funds selected equal to the dollar amounts deferred under the Plan, resulting in an asset equal to the deferred compensation liability. Obligations of the Plan are paid solely from the Fund’s assets. Directors’ fees are allocated to each of the Calvert funds served. Salaries and fees of officers and Directors of the Fund who are employees of CRM or its affiliates are paid by CRM. Prior to December 31, 2020, an
28
Calvert
VP SRI Balanced Portfolio
December 31, 2020
Notes to Financial Statements — continued
Advisory Council aided the Board and CRM in advancing the cause of responsible investing through original scholarship and thought leadership. The Advisory Council consisted of CRM’s Chief Executive Officer and three additional members. For the year ended December 31, 2020, each member (other than CRM’s Chief Executive Officer) was compensated $20,000 for their service on the Advisory Council. Such compensation, and any other compensation and/or expenses incurred by the Advisory Council as may be approved by the Board, is borne by the Calvert funds. For the year ended December 31, 2020, the Fund’s allocated portion of the Advisory Council compensation and fees was $518, which is included in miscellaneous expense on the Statement of Operations.
3 Shareholder Servicing Plan
The Corporation, on behalf of the Fund, has adopted a Shareholder Servicing Plan (Servicing Plan), which permits the Fund to enter into shareholder servicing agreements with intermediaries that maintain accounts in the Fund for the benefit of shareholders. These services may include, but are not limited to, processing purchase and redemption requests, processing dividend payments, and providing account information to shareholders. Under the Servicing Plan, the Fund may make payments at an annual rate of up to 0.11% of its average daily net assets. For the year ended December 31, 2020, expenses incurred under the Servicing Plan amounted to $55,405.
4 Investment Activity
During the year ended December 31, 2020, the cost of purchases and proceeds from sales of investments, other than U.S. government and agency securities and short-term securities and including maturities, paydowns and principal repayments on senior floating-rate loans, were $232,365,653 and $230,512,453, respectively. Purchases and sales of U.S. government and agency securities, including paydowns, were $160,068,718 and $156,865,386, respectively.
5 Distributions to Shareholders and Income Tax Information
The tax character of distributions declared for the years ended December 31, 2020 and December 31, 2019 was as follows:
| | | | | | | | |
| | | Year Ended December 31, | |
| | |
| | | 2020 | | | 2019 | |
| | |
Ordinary income | | $ | 10,120,796 | | | $ | 6,318,568 | |
| | |
Long-term capital gains | | $ | 7,280,696 | | | $ | 11,201,098 | |
As of December 31, 2020, the components of distributable earnings (accumulated loss) on a tax basis were as follows:
| | | | |
| | |
Undistributed ordinary income | | $ | 6,878,813 | |
| |
Undistributed long-term capital gains | | $ | 11,713,590 | |
| |
Net unrealized appreciation | | $ | 90,552,802 | |
The cost and unrealized appreciation (depreciation) of investments, including open derivative contracts, of the Fund at December 31, 2020, as determined on a federal income tax basis, were as follows:
| | | | |
| |
Aggregate cost | | $ | 341,700,249 | |
| |
Gross unrealized appreciation | | $ | 92,153,038 | |
| |
Gross unrealized depreciation | | | (1,600,445 | ) |
| |
Net unrealized appreciation | | $ | 90,552,593 | |
6 Financial Instruments
A summary of futures contracts outstanding at December 31, 2020 is included in the Schedule of Investments. During the year ended December 31, 2020, the Fund used futures contracts and options on futures contracts to hedge interest rate risk and to manage duration.
29
Calvert
VP SRI Balanced Portfolio
December 31, 2020
Notes to Financial Statements — continued
At December 31, 2020, the fair value of open derivative instruments (not considered to be hedging instruments for accounting disclosure purposes) and whose primary underlying risk exposure is interest rate risk was as follows:
| | | | | | | | | | |
| Derivative | | Statement of Assets and Liabilities Caption | | Assets | | | Liabilities | |
| |
| | | |
Futures contracts | | Distributable earnings | | | $90,456 | (1) | | | $(99,683) (1) | |
| |
| (1) | Only the current day’s variation margin is reported within the Statement of Assets and Liabilities as Receivable or Payable for variation margin on open futures contracts, as applicable. |
The effect of derivative instruments (not considered to be hedging instruments for accounting disclosure purposes) on the Statement of Operations and whose primary underlying risk exposure is interest rate risk for the year ended December 31, 2020 was as follows:
| | | | |
Statement of Operations Caption | | | | |
| |
Net realized gain (loss): | | | | |
| |
Investment securities(1) | | $ | 522 | |
| |
Futures contracts | | | 68,984 | |
| |
Total | | $ | 69,506 | |
| |
Change in unrealized appreciation (depreciation): | | | | |
| |
Futures contracts | | $ | 113,820 | |
| |
Total | | $ | 113,820 | |
(1) Relates to purchased options.
The average notional cost of futures contracts (long) and futures contracts (short) outstanding during the year ended December 31, 2020 was approximately $17,258,000 and $25,850,000, respectively. The average number of purchased options contracts outstanding during the year ended December 31, 2020 was 1 contract.
7 Securities Lending
To generate additional income, the Fund may lend its securities pursuant to a securities lending agency agreement with State Street Bank and Trust
Company (SSBT), the securities lending agent. Security loans are subject to termination by the Fund at any time and, therefore, are not considered illiquid investments. The Fund requires that the loan be continuously collateralized by either cash or securities as collateral equal at all times to at least 102% of the market value of the domestic securities loaned and 105% of the market value of the international securities loaned (if applicable). The market value of securities loaned is determined daily and any additional required collateral is delivered to the Fund on the next business day. Cash collateral is generally invested in a money market fund registered under the 1940 Act that is managed by an affiliate of SSBT. Any gain or loss in the market price of the loaned securities that might occur and any interest earned or dividends declared during the term of the loan would accrue to the account of the Fund. Income earned on the investment of collateral, net of broker rebates and other expenses incurred by the securities lending agent, is split between the Fund and the securities lending agent based on agreed upon contractual terms. Non-cash collateral, if any, is held by the lending agent on behalf of the Fund and cannot be sold or re-pledged by the Fund; accordingly, such collateral is not reflected in the Statement of Assets and Liabilities.
The risks associated with lending portfolio securities include, but are not limited to, possible delays in receiving additional collateral or in the recovery of the loaned securities, possible loss of rights to the collateral should the borrower fail financially, as well as risk of loss in the value of the collateral or the value of the investments made with the collateral. The securities lending agent shall indemnify the Fund in the case of default of any securities borrower.
At December 31, 2020, the total value of securities on loan, including accrued interest, was $576,348 and the total value of collateral received was $587,317, comprised of cash of $305,813 and U.S. government and/or agencies securities of $281,504.
The following table provides a breakdown of securities lending transactions accounted for as secured borrowings, the obligations by class of collateral pledged, and the remaining contractual maturity of those transactions as of December 31, 2020.
30
Calvert
VP SRI Balanced Portfolio
December 31, 2020
Notes to Financial Statements — continued
| | | | | | | | | | | | | | | | | | | | | | | | | |
| | | Remaining Contractual Maturity of the Transactions |
| | | | | |
| | | Overnight
and
Continuous | | <30 days | | 30 to 90
days | | >90 days | | Total |
| | | | | |
Convertible Preferred Stocks | | | $ | 27,720 | | | | $ | — | | | | $ | — | | | | $ | — | | | | $ | 27,720 | |
| | | | | |
Corporate Bonds | | | | 278,093 | | | | | — | | | | | — | | | | | — | | | | | 278,093 | |
Total | | | $ | 305,813 | | | | $ | — | | | | $ | — | | | | $ | — | | | | $ | 305,813 | |
The carrying amount of the liability for deposits for securities loaned at December 31, 2020 approximated its fair value. If measured at fair value, such liability would have been considered as Level 2 in the fair value hierarchy (see Note 1A) at December 31, 2020.
8 Line of Credit
The Fund participates with other portfolios and funds managed by EVM and its affiliates, including CRM, in an $800 million unsecured line of credit with a group of banks, which is in effect through October 26, 2021. Borrowings are made by the Fund solely for temporary purposes related to redemptions and other short-term cash needs. Interest is charged to the Fund based on its borrowings at an amount above either the Eurodollar rate or Federal Funds rate. In addition, a fee computed at an annual rate of 0.15% on the daily unused portion of the line of credit is allocated among the participating portfolios and funds at the end of each quarter. In connection with the renewal of the agreement in October 2020, an upfront fee and arrangement fee totaling $950,000 was incurred that was allocated to the participating portfolios and funds. Because the line of credit is not available exclusively to the Fund, it may be unable to borrow some or all of its requested amounts at any particular time.
The Fund had no borrowings outstanding pursuant to its line of credit at December 31, 2020. The Fund did not have any significant borrowings or allocated fees during the year ended December 31, 2020.
9 Affiliated Funds
At December 31, 2020, the value of the Fund’s investment in affiliated funds was $7,856,807, which represents 1.9% of the Fund’s net assets. Transactions in affiliated funds by the Fund for the year ended December 31, 2020 were as follows:
| | | | | | | | | | | | | | | | | | | | | | | | | | | | | | | | | | | | | | | | |
| | | | | | | | | Net | | Change in | | | | | | |
| | | Value, | | | | | | realized | | unrealized | | Value, | | | | Units, |
| | | beginning | | | | Sales | | gain | | appreciation | | end of | | Dividend | | end of |
| Name | | of period | | Purchases | | proceeds | | (loss) | | (depreciation) | | period | | income | | period |
| | | | | | | | |
Short-Term Investments | | | | | | | | | | | | | | | | | | | | | | | | | | | | | | | | | | | | | | | | |
| | | | | | | | |
Calvert Cash Reserves Fund, LLC | | | $ | — | | | | $ | 65,720,678 | | | | $ | (57,864,606 | ) | | | $ | 778 | | | | $ | (43 | ) | | | $ | 7,856,807 | | | | $ | 6,824 | | | | | 7,856,022 | |
10 Capital Shares
The Corporation may issue its shares in one or more series (such as the Fund). The authorized shares of the Fund consist of 500,000,000 common shares, $0.01 par value, for each Class.
Transactions in capital shares for the years ended December 31, 2020 and December 31, 2019 were as follows:
| | | | | | | | | | | | | | | | | | | | | | | | | | | | |
| | | Year Ended | | | | | | Year Ended | |
| | | December 31, 2020 | | | | | | December 31, 2019 | |
| | | | | | | |
| | | Shares | | | | | | Amount | | | | | | Shares | | | | | | Amount | |
| | | | | | | |
Class I | | | | | | | | | | | | | | | | | | | | | | | | | | | | |
| | | | | | | |
Shares sold | | | 13,186,923 | | | | | | | $ | 30,978,919 | | | | | | | | 12,781,947 | | | | | | | $ | 28,405,842 | |
| | | | | | | |
Reinvestment of distributions | | | 7,305,959 | | | | | | | | 17,095,943 | | | | | | | | 8,057,911 | | | | | | | | 17,324,508 | |
| | | | | | | |
Shares redeemed | | | (16,928,416 | ) | | | | | | | (38,524,601 | ) | | | | | | | (15,289,150 | ) | | | | | | | (33,411,122 | ) |
| | | | | | | |
Net increase | | | 3,564,466 | | | | | | | $ | 9,550,261 | | | | | | | | 5,550,708 | | | | | | | $ | 12,319,228 | |
31
Calvert
VP SRI Balanced Portfolio
December 31, 2020
Notes to Financial Statements — continued
| | | | | | | | | | | | | | | | | | | | | | | | | | | | | | | | | | | |
| | | Year Ended | | | | Year Ended |
| | | December 31, 2020 | | | | December 31, 2019 |
| | | | | | | |
| | | Shares | | | | Amount | | | | Shares | | | | Amount |
| | | | | | | |
Class F | | | | | | | | | | | | | | | | | | | | | | | | | | | | | | | | | | | |
| | | | | | | |
Shares sold | | | | 1,508,379 | | | | | | | | | $ | 3,492,301 | | | | | | | | | | 1,299,569 | | | | | | | | | $ | 2,854,861 | |
| | | | | | | |
Reinvestment of distributions | | | | 130,576 | | | | | | | | | | 305,549 | | | | | | | | | | 90,351 | | | | | | | | | | 195,158 | |
| | | | | | | |
Shares redeemed | | | | (698,255 | ) | | | | | | | | | (1,540,164 | ) | | | | | | | | | (186,707 | ) | | | | | | | | | (414,655 | ) |
| | | | | | | |
Net increase | | | | 940,700 | | | | | | | | | $ | 2,257,686 | | | | | | | | | | 1,203,213 | | | | | | | | | $ | 2,635,364 | |
At December 31, 2020, separate accounts of three insurance companies each owned more than 10% of the value of the outstanding shares of the Fund, aggregating 74.9%.
11 Risks and Uncertainties
Pandemic Risk
An outbreak of respiratory disease caused by a novel coronavirus was first detected in China in December 2019 and subsequently spread internationally. This coronavirus has resulted in closing borders, enhanced health screenings, changes to healthcare service preparation and delivery, quarantines, cancellations, disruptions to supply chains and customer activity, as well as general concern and uncertainty. Health crises caused by outbreaks, such as the coronavirus outbreak, may exacerbate other pre-existing political, social and economic risks and disrupt normal market conditions and operations. The impact of this outbreak has negatively affected the worldwide economy, the economies of individual countries, individual companies, and the market in general, and may continue to do so in significant and unforeseen ways, as may other epidemics and pandemics that may arise in the future. Any such impact could adversely affect the Fund’s performance, or the performance of the securities in which the Fund invests.
12 Additional Information
On October 8, 2020, Morgan Stanley and Eaton Vance Corp. (“Eaton Vance”) announced that they had entered into a definitive agreement under which Morgan Stanley would acquire Eaton Vance. Under the Investment Company Act of 1940, as amended, consummation of this transaction may be deemed to result in the automatic termination of a Calvert Fund’s investment advisory agreement and, where applicable, any related sub-advisory agreement. On December 8, 2020, the Fund’s Board approved a new investment advisory agreement. The new investment advisory agreement will be presented to Fund shareholders for approval and, if approved, would take effect upon consummation of the transaction. Shareholders of record of the Fund at the close of business on December 22, 2020 who have voting power with respect to such shares are entitled to be present and vote at a joint special meeting of shareholders to be held on February 19, 2021 and at any adjournments or postponements thereof.
32
Calvert
VP SRI Balanced Portfolio
December 31, 2020
Report of Independent Registered Public Accounting Firm
To the Shareholders and Board of Directors
Calvert Variable Series, Inc.:
Opinion on the Financial Statements
We have audited the accompanying statement of assets and liabilities of Calvert VP SRI Balanced Portfolio (the Fund), a series of Calvert Variable Series, Inc., including the schedule of investments, as of December 31, 2020, the related statement of operations for the year then ended, the statements of changes in net assets for each of the years in the two-year period then ended, and the related notes (collectively, the financial statements) and the financial highlights for each of the years in the five-year period then ended. In our opinion, the financial statements and financial highlights present fairly, in all material respects, the financial position of the Fund as of December 31, 2020, the results of its operations for the year then ended, the changes in its net assets for each of the years in the two-year period then ended, and the financial highlights for each of the years in the five-year period then ended, in conformity with U.S. generally accepted accounting principles.
Basis for Opinion
These financial statements and financial highlights are the responsibility of the Fund’s management. Our responsibility is to express an opinion on these financial statements and financial highlights based on our audits. We are a public accounting firm registered with the Public Company Accounting Oversight Board (United States) (PCAOB) and are required to be independent with respect to the Fund in accordance with the U.S. federal securities laws and the applicable rules and regulations of the Securities and Exchange Commission and the PCAOB.
We conducted our audits in accordance with the standards of the PCAOB. Those standards require that we plan and perform the audit to obtain reasonable assurance about whether the financial statements and financial highlights are free of material misstatement, whether due to error or fraud. Our audits included performing procedures to assess the risks of material misstatement of the financial statements and financial highlights, whether due to error or fraud, and performing procedures that respond to those risks. Such procedures included examining, on a test basis, evidence regarding the amounts and disclosures in the financial statements and financial highlights. Such procedures also included confirmation of securities owned as of December 31, 2020, by correspondence with the custodian, brokers, and agent banks. Our audits also included evaluating the accounting principles used and significant estimates made by management, as well as evaluating the overall presentation of the financial statements and financial highlights. We believe that our audits provide a reasonable basis for our opinion.

We have served as the auditor of one or more of the Calvert Funds since 2002.
Philadelphia, Pennsylvania
February 18, 2021
33
Calvert
VP SRI Balanced Portfolio
December 31, 2020
Federal Tax Information (Unaudited)
As required by the Internal Revenue Code and/or regulations, shareholders must be notified regarding the status of the dividends received deduction for corporations and capital gains dividends.
Dividends Received Deduction. Corporate shareholders are generally entitled to take the dividends received deduction on the portion of the Fund’s dividend distribution that qualifies under tax law. For the Fund’s fiscal 2020 ordinary income dividends, 26.04% qualifies for the corporate dividends received deduction.
Capital Gains Dividends. The Fund hereby designates as a capital gain dividend with respect to the taxable year ended December 31, 2020, $11,715,711 or, if subsequently determined to be different, the net capital gain of such year.
34
Calvert
VP SRI Balanced Portfolio
December 31, 2020
Board of Directors’ Contract Approval
Overview of the Board Evaluation Process
Even though the following description of the Board’s consideration of investment advisory and, as applicable, sub-advisory agreements covers multiple funds, for purposes of this shareholder report, the description is only relevant as to Calvert VP SRI Balanced Portfolio.
| | | | |
| Fund | | Investment Adviser | | Investment Sub-Adviser |
| Calvert VP SRI Balanced Portfolio | | Calvert Research and Management | | None |
Following the public announcement of Morgan Stanley’s planned acquisition of Eaton Vance Corp. (“EVC”) and its affiliates (the “Transaction”), the Board members who are not “interested persons” (as defined in the 1940 Act) of the Funds or CRM (the “Independent Board Members”), met on October 8, 2020 with their independent legal counsel. During that meeting, the Independent Board Members preliminarily discussed the Transaction and the implications of the Transaction on the Funds and CRM. At the request of the Independent Board Members, their counsel discussed the various actions that they and the Funds’ shareholders would be asked to take in connection with the Transaction, including requesting information from CRM and Morgan Stanley concerning the Transaction and its implications for the Funds.
On October 14, 2020, during a telephonic meeting of the Boards, senior representatives of CRM provided an overview of the Transaction and Morgan Stanley to the Independent Board Members and their counsel. The senior representatives of CRM also discussed the anticipated benefits of the Transaction to CRM and the Funds. They also indicated that they expected that the operations of CRM and the Funds would be maintained substantially in their current forms after the Closing of the Transaction.
In connection with the proposed Transaction, the Independent Board Members, assisted by their independent legal counsel, requested extensive information from CRM and Morgan Stanley regarding the proposed Transaction and its potential implications for the Funds (the “Request for Information”).
On November 18, 2020, during a telephonic meeting of the Boards, senior representatives of CRM discussed certain matters related to the Transaction with the Independent Board Members and their counsel. The senior representatives of CRM indicated that CRM and Morgan Stanley were in the process of preparing a response to the Request for Information and that senior representatives of CRM and Morgan Stanley would be prepared to discuss their response and any other matters related to the Transaction with the Independent Board Members at the Boards’ December 8, 2020 meeting.
On December 1, 2020, during a video conference meeting, the Independent Board Members reviewed CRM’s and Morgan Stanley’s response to the
Request for Information (the “Response”) and discussed the information contained in the Response amongst themselves and with their counsel. During that meeting, the Independent Board Members received advice from their independent legal counsel regarding their responsibilities in evaluating the possible Transaction and new investment advisory agreements and new investment sub-advisory agreements (the “New Agreements”). Following that meeting, the Independent Board Members, assisted by their counsel, requested additional information from CRM and Morgan Stanley regarding the proposed Transaction and its potential implications for the Funds (the “Supplemental Request for Information”).
In connection with the proposed Transaction and their consideration of the New Agreements, the Board members, including all of the Independent Board Members, met with senior representatives of EVC, CRM and Morgan Stanley at a meeting held on December 8, 2020 to discuss certain aspects of the Transaction and the expected impacts of the Transaction on the Funds and their shareholders and any remaining matters concerning the Response and CRM’s and Morgan Stanley’s response to the Supplemental Request for Information. During the meeting, senior representatives of Morgan Stanley made presentations to, and responded to questions from, the Board members. After the presentations and discussions with senior representatives of EVC, CRM and Morgan Stanley, the Independent Board Members met in executive session with their counsel to consider the Transaction, the New Agreements and related matters.
Each Board’s evaluation of the New Agreements included consideration of the information provided specifically in regard to the New Agreements as well as, where relevant, information that previously had been provided to the Board in connection with the most recent annual contract renewal of the Funds’ current contractual arrangements at a meeting held on March 4, 2020.
In the course of its deliberations regarding the New Agreements, the Board members considered the following factors, among others: the nature, extent and quality of the services to be provided by CRM, its affiliates and the Sub-Advisers, including the personnel who would be providing such services; Morgan Stanley’s financial condition; the proposed advisory and sub-advisory fees; comparative fee and expense information for the Funds and for comparable funds managed by CRM and its affiliates; the anticipated profitability of the Funds to CRM and its affiliates; the direct and indirect benefits, if any, to be derived by Morgan Stanley, CRM, and their affiliates from their relationship with the Funds; the effect of each Fund’s projected growth and size on each Fund’s performance and expenses; and CRM’s and the Sub-Advisers’ compliance programs.
In considering the nature, extent, and quality of the services to be provided to the Funds by CRM and the Sub-Advisers, as applicable, under the New Agreements, the Board members took into account information relating to CRM’s and the Sub-Advisers’ operations and personnel, including, among other information, biographical information on their investment, supervisory, and professional staff, as applicable, and descriptions of their organizational and management structure. The Board members considered the investment strategies used in managing the Funds and the performance of other funds managed by the investment teams at CRM and its affiliates that would be managing the Funds. The Board members also took into account, as applicable, CRM’s and the Sub-Advisers’ proposed staffing and overall resources. CRM’s administrative capabilities were also considered. The Board members concluded that they were satisfied with the nature, extent and quality of services to be provided to the Funds by CRM and the Sub-Advisers, as applicable, under the New Advisory Agreements.
35
Calvert
VP SRI Balanced Portfolio
December 31, 2020
Board of Directors’ Contract Approval — continued
In considering the management style and investment strategies that CRM and the Sub-Advisers, as applicable, proposed to use in managing the Funds, the Board members took into consideration certain comparative performance information for the Funds prepared by an independent data provider. The Board members also considered information regarding the financial condition of Morgan Stanley, its worldwide presence, experience as a fund sponsor and manager, commitment to maintain a high level of cooperation with, and support to, the Funds, strong client service capabilities, and relationships in the asset management industry. The Board members took into account that the Funds’ investment objectives, investment strategies and portfolio managers were not expected to change after the Closing of the Transaction. Based upon their review, the Board members concluded that CRM and the Sub-Advisers, as applicable, are qualified to manage each Fund’s assets in accordance with the Funds’ investment objectives and investment strategies and that the investment strategies continued to be appropriate for pursuing each Fund’s investment objective(s).
In considering each Fund’s proposed fees and estimated expenses, the Board members considered certain comparative fee and expense data prepared by an independent data provider. The Board members also took into account that no changes in the Funds’ current advisory and sub-advisory fees were being proposed in connection with the Transaction. The Board members further took into account that no changes in the Funds’ current expense limitations were being proposed in connection with the Transaction. Based upon their review, the Board members concluded that the proposed advisory and sub-advisory fees were reasonable in view of the quality of services to be received by the Funds from CRM and the Sub-Advisers, as applicable.
In reviewing the anticipated profitability of the advisory fees to CRM and its affiliates, the Board members considered the fact that affiliates of CRM would be providing shareholder servicing, administrative, distribution, and sub-advisory services to the Funds for which they would receive compensation. The Board also took into account whether CRM had the financial wherewithal to provide services to the Funds. The Board also considered that CRM and Morgan Stanley would likely derive benefits to their reputations and other indirect benefits from their relationship with the Funds. Because CRM will pay the Sub-Advisers’ sub-advisory fees out of its advisory fees, the anticipated profitability of the Funds to the Sub-Advisers was not a material factor in the Board’s deliberations concerning the entering into of the New Agreements. Based upon its review, the Board concluded that CRM’s and its affiliates’ anticipated level of profitability from their relationship with the Funds was reasonable.
The Board members considered the effect of each Fund’s current size and potential growth on its performance and expenses. The Board members took into account management’s discussion of the Funds’ proposed advisory and sub-advisory fees, noting that no changes in the Funds’ current advisory and sub-advisory fees were being proposed in connection with the Transaction. The Board members also noted that the advisory and sub-advisory fee schedules for certain Funds will contain one or more breakpoints that will reduce the respective advisory and sub-advisory fee rates on assets above specified levels as the applicable Fund’s assets increased and considered the necessity of adding breakpoints with respect to the Funds that did not currently have such breakpoints in their advisory and sub-advisory fee schedules. The Board members determined that adding breakpoints at specified levels to the advisory and sub-advisory fee schedules of the Funds that did not currently have breakpoints would not be appropriate at this time. Because CRM will pay the Sub-Advisers’ sub-advisory fees out of its advisory fees, the Board did not consider the potential economies of scale from the Sub-Advisers’ management of the Funds to be a material factor in the Board’s deliberations concerning the entering into of the New Agreements. The Board members noted that if a Fund’s assets increase over time, the Fund might realize other economies of scale if assets increase proportionally more than certain other expenses.
In considering the approval of the New Agreements, the Board members also considered the following matters:
i. their belief that the Transaction will benefit the Funds;
ii. CRM’s and the Sub-Advisers’ intentions to continue to manage the Funds in a manner materially consistent with each Fund’s current investment objective(s) and principal investment strategies, which, where applicable, includes continuing to manage the Fund pursuant to responsible investment criteria as described in the Fund’s prospectus;
iii. the financial condition and reputation of Morgan Stanley, its worldwide presence, experience as a fund sponsor and manager, commitment to maintain a high level of cooperation with, and support to, the Funds, strong client service capabilities, and relationships in the asset management industry;
iv. Morgan Stanley’s commitment to maintain the investment autonomy of CRM;
v. Morgan Stanley’s and CRM’s commitment to maintaining the nature, quality and extent of services provided to the Funds by CRM and its affiliates following the Closing of the Transaction;
vi. Morgan Stanley’s commitment to maintaining competitive compensation arrangements to attract and retain highly qualified personnel;
vii. confirmation that the current senior management team at CRM has indicated its strong support of the Transaction; and
viii. a commitment that Morgan Stanley would use its reasonable best efforts to ensure that it did not impose any “unfair burden” (as that term is used in section 15(f)(1)(B) of the 1940 Act) on the Funds as a result of the Transaction.
In approving the New Agreements, the Board members did not identify any single factor as controlling, and each Board member may have attributed different weight to various factors.
The Board members reached the following conclusions regarding the New Agreements, among others: (a) CRM and the Sub-Advisers have demonstrated that they possess the capability and resources to perform the duties required of them under the New Agreements; (b) CRM and the Sub-Advisers are qualified to manage the applicable Fund’s assets in accordance with such Fund’s investment objective(s) and investment strategies; (c) CRM’s and the
36
Calvert
VP SRI Balanced Portfolio
December 31, 2020
Board of Directors’ Contract Approval — continued
Sub-Advisers’ proposed investment strategies are appropriate for pursuing the applicable Fund’s investment objective(s); and (d) the proposed advisory and sub-advisory fees are reasonable in view of the quality of the services to be received by each Fund from CRM and the Sub-Advisers, as applicable. Based upon the foregoing considerations, at the meeting of the Board held on December 8, 2020, the Board members, including all of the Independent Board Members, unanimously approved the New Agreements and determined to recommend their approval to the shareholders of the Funds. In voting its approval of the New Agreements at the meeting, the Board relied on an order issued by the SEC in response to the impacts of the COVID-19 pandemic that provided temporary relief from the in-person meeting requirements under Section 15 of the 1940 Act.
37
Calvert
VP SRI Balanced Portfolio
December 31, 2020
Management and Organization
Fund Management. The Directors of Calvert Variable Series, Inc. (the Corporation) are responsible for the overall management and supervision of the Corporation’s affairs. The Directors and officers of the Corporation are listed below. Except as indicated, each individual has held the office shown or other offices in the same company for the last five years. Each Board member holds office until his or her successor is elected and qualified, or until his or her earlier death, resignation, retirement, removal or disqualification. Under the terms of the Fund’s current Board member retirement policy, an Independent Board member must retire at the end of the calendar year in which he or she turns 75. However, if such retirement would cause the Fund to be out of compliance with Section 16 of the 1940 Act or any other regulations or guidance of the SEC, then such retirement and resignation will not become effective until such time as action has been taken for the Fund to be in compliance upon a Board member’s retirement. The “Independent Directors” consist of those Directors who are not “interested persons” of the Corporation, as that term is defined under the 1940 Act. The business address of each Director and officer, with the exception of Ms. Gemma and Mr. Kirchner, is 1825 Connecticut Avenue NW, Suite 400, Washington, DC 20009. As used below, “CRM” refers to Calvert Research and Management. Each Director oversees 39 funds in the Calvert fund complex. Each officer serves as an officer of certain other Calvert funds.
| | | | | | |
| Name and Year of Birth | | Position(s)
with the
Corporation | | Position
Start Date | | Principal Occupation(s) and Directorships During Past Five Years and Other Relevant Experience |
| | | |
| Interested Director | | | | | | |
| | | |
John H. Streur(1) 1960 | | Director and President | | 2015 | | President and Chief Executive Officer of Calvert Research and Management (since December 31, 2016). President and Chief Executive Officer of Calvert Investments, Inc. (January 2015 - December 2016); Chief Executive Officer of Calvert Investment Distributors, Inc. (August 2015 - December 2016); Chief Compliance Officer of Calvert Investment Management, Inc. (August 2015 - April 2016); President and Director, Portfolio 21 Investments, Inc. (through October 2014); President, Chief Executive Officer and Director, Managers Investment Group LLC (through January 2012); President and Director, The Managers Funds and Managers AMG Funds (through January 2012). Other Directorships in the Last Five Years. Portfolio 21 Investments, Inc. (asset management) (through October 2014); Managers Investment Group LLC (asset management) (through January 2012); The Managers Funds (asset management) (through January 2012); Managers AMG Funds (asset management) (through January 2012); Calvert Impact Capital, Inc. |
| | | |
| Independent Directors | | | | | | |
| | | |
Richard L. Baird, Jr. 1948 | | Director | | 2016 | | Regional Disaster Recovery Lead, American Red Cross of Greater Pennsylvania (since 2017). Volunteer, American Red Cross (since 2015). Former President and CEO of Adagio Health Inc. (retired in 2014) in Pittsburgh, PA. Other Directorships in the Last Five Years. None. |
| | | |
Alice Gresham Bullock 1950 | | Chair and Director | | 2016 (Chair); 2008 (Director) | | Professor Emerita at Howard University School of Law. Dean Emerita of Howard University School of Law and Deputy Director of the Association of American Law Schools (1992-1994). Other Directorships in the Last Five Years. None. |
| | | |
Cari M. Dominguez 1949 | | Director | | 2016 | | Former Chair of the U.S. Equal Employment Opportunity Commission. Other Directorships in the Last Five Years. Manpower, Inc. (employment agency); Triple S Management Corporation (managed care); National Association of Corporate Directors. |
| | | |
John G. Guffey, Jr. 1948 | | Director | | 2016 | | President of Aurora Press Inc., a privately held publisher of trade paperbacks (since January 1997). Other Directorships in the Last Five Years. Calvert Impact Capital, Inc. (through December 31, 2018); Calvert Ventures, LLC. |
| | | |
Miles D. Harper, III 1962 | | Director | | 2016 | | Partner, Carr Riggs & Ingram (public accounting firm) since October 2014. Partner, Gainer Donnelly & Desroches (public accounting firm) (now Carr Riggs & Ingram), (November 1999 - September 2014). Other Directorships in the Last Five Years. Bridgeway Funds (9) (asset management). |
| | | |
Joy V. Jones 1950 | | Director | | 2016 | | Attorney. Other Directorships in the Last Five Years. Conduit Street Restaurants SUD 2 Limited; Palm Management Restaurant Corporation. |
38
Calvert
VP SRI Balanced Portfolio
December 31, 2020
Management and Organization — continued
| | | | | | |
| Name and Year of Birth | | Position(s)
with the
Corporation | | Position
Start Date | | Principal Occupation(s) and Directorships During Past Five Years and Other Relevant Experience |
| |
| Independent Directors (continued) | | |
| | | |
Anthony A. Williams 1951 | | Director | | 2016 | | CEO and Executive Director of the Federal City Council (July 2012 to present); Senior Adviser and Independent Consultant for King and Spalding LLP (September 2015 to present); Executive Director of Global Government Practice at the Corporate Executive Board (January 2010 to January 2012). Other Directorships in the Last Five Years. Freddie Mac; Evoq Properties/Meruelo Maddux Properties, Inc. (real estate management); Weston Solutions, Inc. (environmental services); Bipartisan Policy Center’s Debt Reduction Task Force; Chesapeake Bay Foundation; Catholic University of America; Urban Institute (research organization). |
| | | |
| Name and Year of Birth | | Position(s)
with the
Corporation | | Position
Start Date | | Principal Occupation(s) During Past Five Years |
|
| Principal Officers who are not Directors |
| | | |
Hope L. Brown 1973 | | Chief Compliance Officer | | 2014 | | Chief Compliance Officer of 39 registered investment companies advised by CRM (since 2014). Vice President and Chief Compliance Officer, Wilmington Funds (2012-2014). |
| | | |
Maureen A. Gemma(2) 1960 | | Vice President, Secretary and Chief Legal Officer | | 2016 | | Vice President of CRM and officer of 39 registered investment companies advised by CRM (since 2016). Also Vice President of Eaton Vance and certain of its affiliates and officer of 144 registered investment companies advised or administered by Eaton Vance. |
| | | |
James F. Kirchner(2) 1967 | | Treasurer | | 2016 | | Vice President of CRM and officer of 39 registered investment companies advised by CRM (since 2016). Also Vice President of Eaton Vance and certain of its affiliates and officer of 144 registered investment companies advised or administered by Eaton Vance. |
| (1) | Mr. Streur is an interested person of the Fund because of his positions with the Fund’s adviser and certain affiliates. |
| (2) | The business address for Ms. Gemma and Mr. Kirchner is Two International Place, Boston, MA 02110. |
The SAI for the Fund includes additional information about the Directors and officers of the Fund and can be obtained without charge on Calvert’s website at www.calvert.com or by calling 1-800-368-2745.
39
Calvert Funds
IMPORTANT NOTICES
Privacy. The Eaton Vance organization is committed to ensuring your financial privacy. Each entity listed below has adopted privacy policy and procedures (“Privacy Program”) Eaton Vance believes is reasonably designed to protect your personal information and to govern when and with whom Eaton Vance may share your personal information.
| • | At the time of opening an account, Eaton Vance generally requires you to provide us with certain information such as name, address, social security number, tax status, account numbers, and account balances. This information is necessary for us to both open an account for you and to allow us to satisfy legal requirements such as applicable anti-money laundering reviews and know-your-customer requirements. |
| • | On an ongoing basis, in the normal course of servicing your account, Eaton Vance may share your information with unaffiliated third parties that perform various services for Eaton Vance and/or your account. These third parties include transfer agents, custodians, broker/dealers and our professional advisers including auditors, accountants, and legal counsel. Eaton Vance may share your personal information with our affiliates. Eaton Vance may also share your information as required or permitted by applicable law. |
| • | We have adopted a Privacy Program we believe is reasonably designed to protect the confidentiality of your personal information and to prevent unauthorized access to your information. |
| • | We reserve the right to change our Privacy Program at any time upon proper notification to you. You may want to review our Privacy Program periodically for changes by accessing the link on our homepage: www.calvert.com. |
Our pledge of protecting your personal information applies to the following entities within the Eaton Vance organization: the Eaton Vance Family of Funds, Eaton Vance Management, Eaton Vance WaterOak Advisors, Eaton Vance Distributors, Inc., Eaton Vance Trust Company, Eaton Vance Management (International) Limited, Eaton Vance Advisers International Ltd., Eaton Vance Global Advisors Limited, Eaton Vance Management’s Real Estate Investment Group, Boston Management and Research, Calvert Research and Management, and Calvert Funds. This notice supersedes all previously issued privacy disclosures. For more information about Eaton Vance’s Privacy Program or about how your personal information may be used, please call 1-800-368-2745.
Delivery of Shareholder Documents. The Securities and Exchange Commission (SEC) permits funds to deliver only one copy of shareholder documents, including prospectuses, proxy statements and shareholder reports, to fund investors with multiple accounts at the same residential or post office box address. This practice is often called “householding” and it helps eliminate duplicate mailings to shareholders. Calvert funds, or your financial intermediary, may household the mailing of your documents indefinitely unless you instruct Calvert funds, or your financial intermediary, otherwise. If you would prefer that your Calvert fund documents not be householded, please contact Calvert funds at 1-800-368-2745, or contact your financial intermediary. Your instructions that householding not apply to delivery of your Calvert fund documents will typically be effective within 30 days of receipt by Calvert funds or your financial intermediary. Separate statements will be generated for each separate account and will be householded as described above.
Portfolio Holdings. Each Calvert fund files a schedule of portfolio holdings on Part F to Form N-PORT with the SEC. Certain information filed on Form N-PORT may be viewed on the Calvert website at www.calvert.com, by calling Calvert at 1-800-368-2745 or in the EDGAR database on the SEC’s website at www.sec.gov.
Proxy Voting. The Proxy Voting Guidelines that each Calvert fund uses to determine how to vote proxies relating to portfolio securities is provided as an Appendix to the fund’s Statement of Additional Information. The Statement of Additional Information can be obtained free of charge by calling the Calvert funds at 1-800-368-2745, by visiting the Calvert funds’ website at www.calvert.com or visiting the SEC’s website at www.sec.gov. Information regarding how a Calvert fund voted proxies relating to portfolio securities during the most recent 12-month period ended June 30 is available by calling Calvert funds, by visiting the Calvert funds’ website at www.calvert.com or by visiting the SEC’s website at www.sec.gov.
40
Investment Adviser and Administrator
Calvert Research and Management
1825 Connecticut Avenue NW, Suite 400
Washington, DC 20009
Principal Underwriter*
Eaton Vance Distributors, Inc.
Two International Place
Boston, MA 02110
(617) 482-8260
Custodian
State Street Bank and Trust Company
State Street Financial Center, One Lincoln Street
Boston, MA 02111
Transfer Agent
DST Asset Manager Solutions, Inc.
2000 Crown Colony Drive Quincy,
MA 02169
Independent Registered Public Accounting Firm
KPMG LLP
1601 Market Street
Philadelphia, PA 19103-2499
Fund Offices
1825 Connecticut Avenue NW, Suite 400
Washington, DC 20009
| * | FINRA BrokerCheck. Investors may check the background of their Investment Professional by contacting the Financial Industry Regulatory Authority (FINRA). FINRA BrokerCheck is a free tool to help investors check the professional background of current and former FINRA-registered securities firms and brokers. FINRA BrokerCheck is available by calling 1-800-289-9999 and at www.FINRA.org. The FINRA BrokerCheck brochure describing this program is available to investors at www.FINRA.org. |
Printed on recycled paper.


24217 12.31.20
TRANSAMERICA FINANCIAL LIFE INSURANCE COMPANY
c/o Transamerica Retirement Solutions
440 Mamaroneck Avenue
Harrison, NY 10528
272764 12/20
| | (a) | The Registrant has adopted a code of ethics that applies to its principal executive officer, principal financial officer, and any other officers who serve a similar function. |
| | (b) | The Registrant’s code of ethics is reasonably designed as described in this Form N-CSR. |
| | (c) | During the period covered by the report no amendments were made to the provisions of this code of ethics. |
| | (d) | During the period covered by the report, the Registrant did not grant any waivers, including implicit waivers, from the provisions of this code of ethics. |
| | (f) | The Registrant has filed this code of ethics as an exhibit pursuant to Item 13(a)(1) of Form N-CSR. |
| Item 3: | Audit Committee Financial Experts. |
The Registrant’s Board of Trustees has determined that Sandra N. Bane, and John W. Waechter are “audit committee financial experts,” as such term is defined in Item 3 of Form N-CSR. Ms. Bane, and Mr. Waechter are “independent” under the standards set forth in Item 3 of Form N-CSR. The designation of Ms. Bane, and Mr. Waechter as “audit committee financial experts” pursuant to Item 3 of Form N-CSR does not (i) impose upon them any duties, obligations, or liabilities that are greater than the duties, obligations and liabilities imposed upon them as a member of the Registrant’s audit committee or Board of Trustees in the absence of such designation; or (ii) affect the duties, obligations or liabilities of any other member of the Registrant’s audit committee or Board of Trustees.
| Item 4: | Principal Accountant Fees and Services. |
| | | | | | | | |
| | | Fiscal Year Ended 12/31
(in thousands) | |
| | | 2020 | | | 2019 | |
(a) Audit Fees | | $ | 48 | | | $ | 47 | |
(b) Audit Related Fees(1) | | $ | 0 | | | $ | 0 | |
(c) Tax Fees(2) | | $ | 0 | | | $ | 0 | |
(d) All Other Fees(3) | | $ | 0 | | | $ | 0 | |
| (1) | Audit-Related Fees represent assurance and related services provided that are reasonably related to the performance of the audit of the financial statements including review of documents and issuances of consents related to Securities and Exchange Commission Form N-3 filing of the funds comprising the Registrant. |
| (2) | Tax Fees represent tax compliance, tax planning and tax advice services provided in connection with the review of the distributions for excise tax purposes, fiscal year end taxable income calculations and certain fiscal year end shareholder reporting items on behalf of the funds comprising the Registrant. |
| (3) | All Other Fees represent permissible non-audit services for the Registrant that it believes are routine and recurring services and would not impair the independence of the accountant. |
| | (e)(1) | Audit Committee Pre-Approval Policies and Procedures. Generally, the Registrant’s Audit Committee must preapprove (i) all audit and non-audit services performed for the Registrant by the independent accountant and (ii) all non-audit services performed by the Registrant’s independent accountant for the Registrant’s investment adviser, and certain of the adviser’s affiliates that provide ongoing services to the Registrant, if the services to be provided by the accountant relate directly to the operations and financial reporting of the Registrant. |
The Audit Committee may delegate preapproval authority to one or more of its members. The member or members to whom such authority is delegated shall report any preapproval decisions to the Audit Committee at its next scheduled meeting.
In accordance with the Procedures, the annual audit services engagement terms and fees for the Registrant will be subject to the preapproval of the Audit Committee. In addition to the annual audit services engagement approved by the Audit Committee, the Audit Committee may grant preapproval for other audit services, which are those services that only the independent accountant reasonably can provide.
Requests or applications to provide services that require separate approval by the Audit Committee will be submitted to the Audit Committee by both the independent accountant and the Registrant’s treasurer, and must include a joint statement as to whether, in their view, the request or application is consistent with the Securities and Exchange Commissions’ rules on auditor independence.
Management will promptly report to the Chair of the Audit Committee any violation of this Procedure of which it becomes aware.
| | (e)(2) | The percentage of services described in paragraphs (b) through (d) of this Item that were approved by the audit committee pursuant to paragraph (c)(7)(i)(C) of Rule 2-01 of Regulation S-X for fiscal years ended 2020 and 2019 was zero. |
| | (h) | The Registrant’s Audit Committee has considered whether the provision of non-audit services that were rendered to the Registrant’s Adviser, and any entity controlling, controlled by, or under common control with the Adviser that provides ongoing services to the Registrant that were not pre-approved pursuant to paragraph (c)(7)(ii) of Rule 2-01 of Regulation S-X is compatible with maintain the principal accountant’s independence. |
| Item 5: | Audit Committee of Listed Registrants. |
The following individuals comprise the standing Audit Committee: Sandra N. Bane, Leo J. Hill, David W. Jennings, Frederic A. Nelson, John E. Pelletier, Patricia L. Sawyer and John W. Waechter.
| Item 6: | Schedule of Investments. |
| | (a) | The schedules of investments are included in the Annual Report to shareholders filed under Item 1 of this Form N-CSR. |
| Item 7: | Disclosure of Proxy Voting Policies and Procedures for Closed-End Management Investment Companies. |
Not applicable.
| Item 8: | Portfolio Managers of Closed-End Management Investment Companies. |
Not applicable.
| Item 9: | Purchases of Equity Securities by Closed-End Management Investment Company and Affiliated Purchasers. |
Not applicable.
| Item 10: | Submission of Matters to a Vote of Security Holders |
There have been no material changes to the procedures by which shareholders may recommend nominees to the Registrant’s Board of Trustees that have been implemented since the Registrant last provided disclosure in response to the requirements of this Item.
| Item 11: | Controls and Procedures. |
| | (a) | The Registrant’s principal executive officer and principal financial officer evaluated the effectiveness of the Registrant’s disclosure controls and procedures within 90 days of this filing and have concluded that the Registrant’s disclosure controls and procedures (as defined in Rule 30a-3(c) under the Investment Company Act of 1940, as amended (the “1940 Act”)) are appropriately designed to ensure that information required to be disclosed by the Registrant in the reports that it files on Form N-CSR (a) is accumulated and communicated to the Registrant’s management, including its principal executive officer and principal financial officer, to allow timely decisions regarding required disclosure, and (b) is recorded, processed, summarized and reported, within the time periods specified in the rules and forms adopted by the U.S. Securities and Exchange Commission. |
| | (b) | The Registrant’s principal executive officer and principal financial officer are aware of no change in the Registrant’s internal control over financial reporting that occurred during the Registrant’s most recent fiscal half-year that has materially affected, or is reasonably likely to materially affect, the Registrant’s internal control over financial reporting. |
| Item 12: | Disclosure of Securities Lending Activities for Closed-End Management Investment Companies. |
Not Applicable.
SIGNATURES
Pursuant to the requirements of the Securities Exchange Act of 1934 and the Investment Company Act of 1940, the Registrant has duly caused this report to be signed on its behalf by the undersigned, thereunto duly authorized.
| | |
Transamerica Asset Allocation Variable Funds |
| (Registrant) |
| |
| By: | | /s/ Marijn P. Smit |
| | Marijn P. Smit |
| | Chief Executive Officer |
| | (Principal Executive Officer) |
| Date: | | March 8, 2021 |
Pursuant to the requirements of the Securities Exchange Act of 1934 and the Investment Company Act of 1940, this report has been signed below by the following persons on behalf of the Registrant and in the capacities and on the dates indicated.
| | |
| By: | | /s/ Marijn P. Smit |
| | Marijn P. Smit |
| | Chief Executive Officer |
| | (Principal Executive Officer) |
| Date: | | March 8, 2021 |
| |
| By: | | /s/ Vincent J. Toner |
| | Vincent J. Toner |
| | Treasurer, Principal Financial Officer and Principal Accounting Officer |
| Date: | | March 8, 2021 |
EXHIBIT INDEX
| | |
Exhibit No. | | Description of Exhibit |
| |
| 13(a)(1) | | Code of Ethics for Principal Executive and Principal Financial Officers |
| |
| 13(a)(2)(i) | | Section 302 N-CSR Certification of Principal Executive Officer |
| |
| 13(a)(2)(ii) | | Section 302 N-CSR Certification of Principal Financial Officer |
| |
| 13(b) | | Section 906 N-CSR Certification of Principal Executive Officer and Principal Financial Officer |