UNITED STATES
SECURITIES AND EXCHANGE COMMISSION
Washington, D.C. 20549
FORM N-CSR
CERTIFIED SHAREHOLDER REPORT OF REGISTERED MANAGEMENT
INVESTMENT COMPANIES
Investment Company Act file number 811-07751
Nuveen Multistate Trust IV
(Exact name of registrant as specified in charter)
Nuveen Investments
333 West Wacker Drive, Chicago, IL 60606
(Address of principal executive offices) (Zip code)
Kevin J. McCarthy
Nuveen Investments
333 West Wacker Drive
Chicago, IL 60606
(Name and address of agent for service)
Registrant’s telephone number, including area code: (312) 917-7700
Date of fiscal year end: May 31
Date of reporting period: May 31, 2008
Form N-CSR is to be used by management investment companies to file reports with the Commission not later than 10 days after the transmission to stockholders of any report that is required to be transmitted to stockholders under Rule 30e-1 under the Investment Company Act of 1940 (17 CFR 270.30e-1). The Commission may use the information provided on Form N-CSR in its regulatory, disclosure review, inspection, and policy making roles.
A registrant is required to disclose the information specified by Form N-CSR, and the Commission will make this information public. A registrant is not required to respond to the collection of information contained in Form N-CSR unless the Form displays a currently valid Office of Management and Budget (“OMB”) control number. Please direct comments concerning the accuracy of the information collection burden estimate and any suggestions for reducing the burden to Secretary, Securities and Exchange Commission, 450 Fifth Street, NW, Washington, DC 20549-0609. The OMB has reviewed this collection of information under the clearance requirements of 44 U.S.C. ss.3507.
ITEM 1. REPORTS TO STOCKHOLDERS.
NUVEEN INVESTMENTS MUTUAL FUNDS
Annual Report May 31, 2008 | Dependable, tax-free income because it’s not what you earn, it’s what you keep.® | |

Nuveen Investments
Municipal Bond Funds
Nuveen Kansas Municipal Bond Fund
Nuveen Kentucky Municipal Bond Fund
Nuveen Michigan Municipal Bond Fund
Nuveen Missouri Municipal Bond Fund
Nuveen Ohio Municipal Bond Fund
Nuveen Wisconsin Municipal Bond Fund


NOW YOU CAN RECEIVE YOUR
NUVEEN INVESTMENTS FUND REPORTS FASTER.
NO MORE WAITING.
SIGN UP TODAY TO RECEIVE NUVEEN INVESTMENTS FUND INFORMATION BY E-MAIL.
It only takes a minute to sign up for E-Reports. Once enrolled, you’ll receive an e-mail as soon as your Nuveen Investments Fund information is ready — no more waiting for delivery by regular mail. Just click on the link within the e-mail to see the report, and save it on your computer if your wish.

IT’S FAST, EASY & FREE:
www.investordelivery.com
if you get your Nuveen Investments Fund dividends and statements from your financial advisor or brokerage account.
(Be sure to have the address sheet that accompanied this report handy. You’ll need it to complete the enrollment process.)
OR
www.nuveen.com/accountaccess
if you get your Nuveen Investments Fund dividends and statements directly from Nuveen Investments.

| Must be preceded by or accompanied by a prospectus. | NOT FDIC INSURED | MAY LOSE VALUE | NO BANK GUARANTEE |
Dear Fellow Shareholders,
I’d like to use my initial letter to you to accomplish several things. First, I want to report that after fourteen years of service on your Fund’s Board, including the last twelve as chairman, Tim Schwertfeger retired from the Board in June. The Board has elected me to replace him as the chairman, the first time this role has been filled by someone who is not an employee of Nuveen Investments. Electing an independent chairman marks a significant milestone in the management of your Fund, and it aligns us with what is now considered a “best practice” in the fund industry. Further, it demonstrates the independence with which your Board has always acted on your behalf.
Following Tim will not be easy. During my eleven previous years on the Nuveen Fund Board, I found that Tim always set a very high standard by combining insightful industry and market knowledge and sound, clear judgment. While the Board will miss his wise counsel, I am certain we will retain the primary commitment Tim shared with all of us – an unceasing dedication to creating and retaining value for Nuveen Fund shareholders. This focus on value over time is a touchstone that I and all the other Board members will continue to use when making decisions on your behalf.
Second, I also want to report that we are very fortunate to be welcoming two new Board members to our team. John Amboian, the current chairman and CEO of Nuveen Investments, has agreed to replace Tim as Nuveen’s representative on the Board. John’s presence will allow the independent Board members to benefit not only from his leadership role at Nuveen but also his broad understanding of the fund industry and Nuveen’s role within it. We also are adding Terry Toth as an independent director. A former CEO of the Northern Trust Company’s asset management group, Terry will bring extensive experience in the fund industry to our deliberations.
Finally, I urge you to take the time to review the Portfolio Managers’ Comments and Fund Spotlight sections of this report. All of us are grateful that you have chosen Nuveen Investments as a partner as you pursue your financial goals, and, on behalf of myself and the other members of your Fund’s Board, let me say we look forward to continuing to earn your trust in the months and years ahead.
Sincerely,

Robert P. Bremner
Chairman of the Board
July 15, 2008

Robert P. Bremner
Chairman of the Board
Annual Report Page 1
Portfolio Managers’ Comments
for the Nuveen Kansas, Kentucky, Michigan, Ohio, and Wisconsin Municipal Bond Funds
Portfolio managers Scott Romans and Daniel Close examine economic and market conditions, key investment strategies and the performance of the Nuveen Kansas, Kentucky, Michigan, Missouri, Ohio, and Wisconsin Municipal Bond Funds. Scott, who has 8 years of investment experience, began managing the Kansas, Missouri, and Wisconsin Funds in 2003. Dan who has 9 years of investment experience and began managing the Kentucky, Ohio, and Michigan Funds in March 2007.
What factors had the greatest influence on the U.S. economy and the municipal bond market during the twelve-month period ended May 31, 2008?
The U.S. economy weakened noticeably as the year progressed. In the second quarter of 2007, U.S. gross domestic product (GDP), a closely watched measure of economic performance, grew at an annual rate of 3.8 percent, followed by a surprisingly robust 4.9 percent annual growth rate in the third quarter. By the final quarter, however, GDP growth shrunk to an annualized 0.6 percent – the slowest quarterly economic expansion since late 2002. The sluggishness continued into the first three months of 2008, with annualized growth of just 1.0 percent during that time. The deteriorating housing market was one factor that had a far-ranging negative impact on the economy. Rising inflation also hurt, with increased food and energy costs weighing down consumer spending. The Consumer Price Index (CPI) rose by 4.1 percent in 2007, compared to a more-modest 2.6 percent in 2006. In May 2008 alone, the CPI grew by a surprising 0.8 percent and stood more than 4 percent higher than its level of a year earlier.
These past twelve months proved to be a remarkably volatile period for municipal bond investors. While the period began quietly enough, conditions started to become much more challenging in August 2007. Falling home values led to rising mortgage defaults and significant losses in bonds backed by sub-prime mortgages. Fixed-income investors became more concerned about risk and, in a “flight to quality,” flocked to U.S. Treasury bonds while shunning nearly every other corner of the bond market – including municipal securities, whose prices fell dramatically in August.
While the tax-exempt bond market bounced back in September 2007, conditions once again worsened later in the year and in early 2008. Various municipal bond insurers with indirect exposure to sub-prime loans were downgraded, in many cases causing substantial underperformance in the municipal bonds they guaranteed.
As nervous investors sought to reduce their risk, many began to purchase shorter-duration bonds – meaning those with less price sensitivity to changes in interest rates. These bonds performed the best over this period, aided by an aggressive series of Federal Reserve cuts in short-term interest rates. Conversely, longer-duration bonds, which carry more interest rate risk, did relatively poorly.
In general, lower-rated municipal securities significantly underperformed their higher-rated counterparts in this risk-averse environment, with the market’s high-yield segment faring the worst overall. However, most individual issuers remained financially solid, even as the prices of lower-rated bonds fell. Market conditions stabilized in the period’s final two months, especially among higher-rated bonds.
Discussions of specific investments are for illustration only and are not intended as recommendations of individual investments. The views expressed herein represent those of the portfolio managers as of the date of this report and are subject to change at any time, based on market conditions and other factors. The Funds disclaim any obligation to advise shareholders of such changes.
Annual Report Page 2
Class A Shares—
Average Annual Total Returns
as of 5/31/08
| 1-Year | 5-Year | 10-Year | ||||
Nuveen Kansas Municipal Bond Fund | ||||||
A Shares at NAV | 2.70% | 3.17% | 4.26% | |||
A Shares at Offer | -1.65% | 2.30% | 3.81% | |||
Lipper Other States Municipal Debt Funds Category Average1 | 2.10% | 2.78% | 3.91% | |||
Lehman Brothers Kansas Municipal Bond Index2 | 4.73% | 3.46% | 4.93% | |||
Lehman Brothers Municipal Bond Index3 | 3.87% | 3.67% | 5.06% | |||
Nuveen Kentucky Municipal Bond Fund | ||||||
A Shares at NAV | 2.63% | 3.52% | 4.30% | |||
A Shares at Offer | -1.67% | 2.63% | 3.86% | |||
Lipper Other States Municipal Debt Funds Category Average1 | 2.10% | 2.78% | 3.91% | |||
Lehman Brothers Kentucky Municipal Bond Index2 | 4.43% | 3.53% | 4.87% | |||
Lehman Brothers Municipal Bond Index3 | 3.87% | 3.67% | 5.06% | |||
Nuveen Michigan Municipal Bond Fund | ||||||
A Shares at NAV | 2.17% | 3.27% | 4.38% | |||
A Shares at Offer | -2.12% | 2.39% | 3.93% | |||
Lipper Michigan Municipal Debt Funds Category Average1 | 0.50% | 2.80% | 4.06% | |||
Lehman Brothers Michigan Municipal Bond Index2 | 3.99% | 3.49% | 5.06% | |||
Lehman Brothers Municipal Bond Index3 | 3.87% | 3.67% | 5.06% | |||
Nuveen Missouri Municipal Bond Fund | ||||||
A Shares at NAV | 1.59% | 3.31% | 4.31% | |||
A Shares at Offer | -2.65% | 2.42% | 3.87% | |||
Lipper Missouri Municipal Debt Funds Category Average1 | 1.38% | 2.79% | 4.12% | |||
Lehman Brothers Missouri Municipal Bond Index2 | 4.06% | 3.66% | 5.01% | |||
Lehman Brothers Municipal Bond Index3 | 3.87% | 3.67% | 5.06% | |||
| 1-Year | 5-Year | 10-Year | ||||
Nuveen Ohio Municipal Bond Fund | ||||||
A Shares at NAV | 2.47% | 3.24% | 4.25% | |||
A Shares at Offer | -1.81% | 2.35% | 3.81% | |||
Lipper Ohio Municipal Debt Funds Category Average1 | 1.37% | 2.76% | 3.97% | |||
Lehman Brothers Ohio Municipal Bond Index2 | 2.73% | 3.19% | 4.79% | |||
Lehman Brothers Municipal Bond Index3 | 3.87% | 3.67% | 5.06% | |||
Nuveen Wisconsin Municipal Bond Fund | ||||||
A Shares at NAV | 2.51% | 3.10% | 4.18% | |||
A Shares at Offer | -1.81% | 2.21% | 3.74% | |||
Lipper Other States Municipal Debt Funds Category Average1 | 2.10% | 2.78% | 3.91% | |||
Lehman Brothers Wisconsin Municipal Bond Index2 | 3.94% | 4.09% | 5.16% | |||
Lehman Brothers Municipal Bond Index3 | 3.87% | 3.67% | 5.06% | |||
Returns quoted represent past performance, which is no guarantee of future results. Returns at NAV would be lower if the sales charge were included. Current performance may be higher or lower than the performance shown. Investment returns and principal value will fluctuate so that when shares are redeemed, they may be worth more or less than their original cost. Class A shares have a 4.2 percent maximum sales charge. Returns do not reflect the deduction of taxes that a shareholder would pay on Fund distributions or the redemption of shares. For the most recent month-end performance, visit www.nuveen.com or call (800) 257-8787.
Please see each Fund’s Spotlight Page later in this report for more complete performance data and expense ratios.
| 1 | The Lipper category averages shown represent the average annualized total return for all reporting funds in the respective categories. The Lipper Michigan Municipal Debt Funds Category Average had 22, 17 and 16 funds, the Lipper Missouri Municipal Debt Funds Category Average had 15, 14 and 12 funds, the Lipper Ohio Municipal Debt Funds Category Average had 34, 29 and 24 funds, and the Lipper Other States Municipal Debt Funds Category Average had 144, 135 and 115 funds for the one-year, five year and ten-year periods ended May 31, 2008, respectively. The returns account for the effects of management fees and assume reinvestment of dividends, but do not reflect any applicable sales charges. You cannot invest directly in a Lipper Category. |
| 2 | The Lehman Brothers Kansas Municipal Bond Index is an unmanaged index comprised of investment grade, tax-exempt Kansas bonds with maturities of two years or greater. The Lehman Brothers Kentucky Municipal Bond Index is an unmanaged index comprised of investment grade, tax-exempt Kentucky bonds with maturities of two years or greater. The Lehman Brothers Michigan Municipal Bond Index is an unmanaged index comprised of investment grade, tax-exempt Michigan bonds with maturities of two years or greater. The Lehman Brothers Missouri Municipal Bond Index is an unmanaged index comprised of investment grade, tax-exempt Missouri bonds with maturities of two years or greater. The Lehman Brothers Ohio Municipal Bond Index is an unmanaged index comprised of investment grade, tax-exempt Ohio bonds with maturities of two years or greater. The Lehman Brothers Wisconsin Municipal Bond Index is an unmanaged index comprised of investment grade, tax-exempt Wisconsin bonds with maturities of two years or greater. The indexes do not reflect any initial or ongoing expenses and are not available for direct investment. |
| 3 | The Lehman Brothers Municipal Bond Index is an unmanaged index composed of a broad range of investment-grade municipal bonds and does not reflect any initial or ongoing expenses. An index is not available for direct investment. |
Annual Report Page 3
Calendar year 2007 was the third-consecutive year of very heavy municipal bond issuance. Large supplies coupled with significantly reduced demand beginning in late summer served to further depress the market for much of the period. Total new supply in 2007 exceeded $427 billion nationally – a record level that was 10 percent higher than the prior year, itself the third-highest total on record. Municipal issuance slowed markedly, however, in the first five months of 2008, with new supply of $173 billion representing a 6 percent drop compared to the same period in 2007.
Also of note in the municipal market, the U.S. Supreme Court in May 2008 ruled that individual states could continue to offer their residents special tax breaks on municipal bonds issued within their borders. The high court’s decision in Department of Revenue of the Commonwealth of Kentucky vs. Davis preserved tax rules in forty-two states, allowing them to continue to exempt from taxation the income their residents earn on in-state municipal bonds while taxing the income earned on municipal bonds issued in other states.
What type of economic environment did the six states profiled in this report experience during the period?
The Kansas economy grew by an estimated 2.8 percent in 2007, down from 4.2 percent the previous year. This growth was well above the national average of 2.0 percent and ranked 20th in the nation overall. Unemployment in Kansas stood at 4.6 percent in May 2008, higher than the state’s 4.2 percent jobless rate the previous year and also ranking 20th in the country. Kansas unemployment was well below the national average of 5.5 percent. The state saw $2.9 billion worth of municipal issuance during the twelve-month reporting period – a 7 percent year-over-year increase, compared to a 2 percent increase nationwide. Much of that supply came in 2007, however, as new Kansas issuance dropped by nearly 14 percent in the first five months of 2008.
Although the Kentucky’s fiscal situation remained solid, its economy was hampered by falling employment. Job growth in Kentucky was at its lowest level in more than three years. The state’s unemployment rate stood at 6.2 percent as of May 2008, well above the national average and 0.7 percent higher than the previous year. The Kentucky economy has slowed notably. Contracting employment in the auto manufacturing and coal mining industries outpaced more moderate growth in private-sector service jobs. Although the housing market is not expected to hurt Kentucky as much as other states because of relatively limited sub-prime lending, the state’s credit quality was worse than national trends, making individual delinquencies more likely. Kentucky’s budget for the 2008 fiscal year totaled $9.4 billion. Revenue collections were expected to grow by 2.2 percent, while spending was budgeted to rise by 7.5 percent – an increase that would reduce the state’s liquidity. On the positive side, the state’s budget stabilization fund was $231 million at the end of the 2007 fiscal year, higher than in previous years. Per-capita debt levels were relatively high at $1,211, above Moody’s median level of $787. At period end, Kentucky maintained credit ratings of AAA and Aaa from Standard & Poor’s and Moody’s, respectively. Kentucky municipal issuance was $4.9 billion during the twelve months ending May 31, 2008, reflecting an 11 percent year-over-year decline.
Michigan’s economy continued to face serious challenges, as the state struggled with manufacturing- and auto-industry-related job cuts. The difficult economic picture has provided significant demographic challenges for the state as well, with population growth remaining almost flat. In both 2007 and 2006, Michigan recorded budget deficits, forcing the state to draw down its general fund as well as the vast majority of its “rainy day” fund. Michigan’s May 2008 unemployment rate was a worst-in-the-nation 8.5 percent – a full three percentage points above the national average. Manufacturing makes up nearly 15 percent of employment in the state, compared to a national
Annual Report Page 4
average of about 10 percent. Although the manufacturing sector has been shedding jobs, the state has seen job growth among education, health care, and leisure and hospitality employers. Michigan issued $12.0 billion worth of municipal debt during the reporting period, a 2 percent increase compared to the prior year. Per-capita debt levels in Michigan stood at $739, just below Moody’s median level of $787. The state maintained credit ratings of AA-and Aa3 from Standard & Poor’s and Moody’s, respectively.
The Missouri economy has contracted as a result of the weak housing market and the national economic slowdown. The manufacturing sector remains difficult, with the 2007 closing of a large Ford plant in St. Louis providing a significant economic blow. While Missouri home prices have held up reasonably well, construction activity remains more than 50 percent below the levels seen in 2006. Positive economic factors for the state included a high level of industrial diversity, relatively attractive business costs, fairly low housing prices compared to other parts of the country, and a relatively central location that facilitates transportation. In contrast, the state continued to have significant exposure to weak manufacturing industries and has been hampered by slow population growth. New supply in the Missouri municipal market totaled $6.3 billion during the past year, a significant 31 percent year-over-year drop. The state’s unemployment rate rose to 6.0 percent in May 2008, up from 4.8 percent the previous year. Between 2006 and 2008, the state ranked 37th nationwide in employment growth, according to Moody’s. At the end of the period, Missouri held credit ratings of AAA and Aaa from Standard & Poor’s and Moody’s, respectively.
Like Michigan, Ohio’s economy was hampered by its exposure to the declining auto industry and continued to grow only slowly. However, the state’s reliance on automotive employers has declined in recent years, and other sectors – such as education, health care, and leisure and hospitality – have helped pick up the slack. Manufacturing remained a significant employment presence in the state, with the sector making up 14.6 percent of the state’s jobs, compared to a national average of 10.4 percent. In May 2008, the state’s jobless rate was above average at 6.3 percent, up from 5.6 percent a year earlier. The difficult economic circumstances have led to a net population outflow, as residents leave the state to look for employment opportunities elsewhere. Ohio’s budget for fiscal 2008–09 projected a modest decline in revenue collections. During the past twelve months, Ohio issued $16.4 billion worth of municipal debt, a 20 percent increase compared to a national rise of just 2 percent. At period end, the state’s general obligation debt was rated AA+ and Aa1 by Standard & Poor’s and Moody’s, respectively. Both ratings were reconfirmed late in the reporting period. Per-capita debt levels in the state were moderate at $862, compared to a median level of $787, according to Moody’s.
Wisconsin’s economy grew by just an estimated 1 percent in 2007, down from 1.5 percent in 2006. That performance was faster than the 0.5 percent growth for the Great Lakes region as a whole, and half of the economic expansion seen nationwide during the year. On the positive side, Wisconsin’s May 2008 unemployment rate of 4.4 percent was relatively low compared to the national average of 5.5 percent and ranked 17th in the nation. Unlike many other states, unemployment in the state actually declined by a half-percentage point over the past year. New municipal issuance in Wisconsin was $5.6 billion during the past twelve months, essentially flat compared to the prior year’s supply. Issuance picked up during the first five months of 2008, with a year-over-year increase of 15 percent during that span, compared to a national decline of 6 percent. At period end, Wisconsin’s credit ratings stood at AA- and Aa3 from Standard & Poor’s and Moody’s, respectively.
How did the Funds perform during this period?
The table on page three provides Class A share total returns for the six Funds for the one-year, five-year, and ten-year periods ending May 31, 2008. Each
Annual Report Page 5
Fund’s total returns are compared with the returns of its corresponding Lipper peer fund category and relevant Lehman Brothers indexes.
All six Funds saw their Class A shares at net asset value (NAV) outperform their respective Lipper peer groups over the twelve month period, while underperforming their respective state and the national Lehman Brothers Municipal Bond Indexes. The factors determining the performance of each Fund are discussed later in this report.
What strategies were used to manage the Funds during the period? How did these strategies influence performance?
All six Funds continued to employ the same fundamental investment strategies and tactics used in previous years, although our ability to implement those strategies depended on the individual characteristics of the six portfolios as well as market conditions within each state. Below we outline our specific approaches to managing the Kansas, Kentucky, Michigan, Missouri, Ohio, and Wisconsin Funds, as well as discuss noteworthy factors influencing each Fund’s performance.
Nuveen Kansas Municipal Bond Fund
The Kansas Fund was helped by its credit quality allocation. Specifically, the Fund was relatively overweighted in AAA-rated bonds. These performed very well in relative terms, as cautious investors steered toward higher-quality issues. In addition, the Fund had only modest exposure to municipal bond insurers whose credit ratings were downgraded during the period. This positioning further contributed to performance, as did an underweighting in non-rated securities, which were hurt by weakness in the credit market. The Fund also owned a number of higher-coupon, shorter-dated bonds that performed very well.
In contrast, the Fund was hurt in relative terms by its overexposure to housing bonds subject to the alternative minimum tax (AMT). Many of the bonds in this category tend to be lower-rated, and being overrepresented in them was a negative. However, many of the individual AMT bonds we owned were solid performers in relative terms, helping counterbalance the overall AMT-related underperformance. Another negative for the Fund was its relatively high exposure to non-AMT housing bonds – a significant portion of the Kansas municipal market. When premium-coupon housing bonds were called at their par values during the period, it led to their underperformance as the proceeds were invested in lower yielding securities.
Trading activity was relatively limited. Early in the period, we found a number of lower-rated health care issues, which enabled us to obtain slightly better yields in this sector relative to comparable structures elsewhere in the market. While we believed these bonds offered good long-term values, they underperformed shortly after we bought them, following the municipal market’s significant downturn in August 2007. As market volatility resurfaced at various points through the period, these conditions provided us with additional opportunities to add other lower-rated credits at attractive prices.
Other recent purchases included school district and other high-grade bonds that we believed could better maintain their prices, even in the volatile market environment. To fund our purchases, we primarily used the proceeds of housing bond calls, of which we experienced a significant number during the past year.
Nuveen Kentucky Municipal Bond Fund
The Kentucky Fund’s performance benefited from its duration positioning, with an underweighting in the relatively poor-performing long end of the yield curve boosting comparative results. This positioning helped compensate for a more-modest allocation to shorter-duration bonds, as owning more of these strong-performing securities would have been favorable for performance. The Fund also benefited when certain holdings were advance refunded4 – a process that resulted in significant
| 4 | Advance refundings, also known as pre-refundings or refinancings, occur when an issuer sells new bonds and uses the proceeds to fund principal and interest payments of older existing bonds. This process often results in lower borrowing costs for bond issuers. |
Annual Report Page 6
price appreciation – and from the performance of many of the portfolio’s individual higher-rated positions.
Another helpful influence was the Fund’s derivative position, which we implemented to manage the Fund’s duration (meaning its price sensitivity to changes in interest rates) within our target range. We invested small portions of the Fund in both forward swaps and U.S. Treasury futures. With these derivative positions we were able to reduce the portfolio’s volatility and manage its duration without being forced to sell positions in the portfolio that we believed were attractive. These derivative instruments outperformed the municipal market generally and added to the Fund’s total returns.
An overweight in BBB-rated bonds – which underperformed as investors became increasingly concerned about taking on credit risk – modestly hampered performance. Specifically, some of our lower-rated health care and higher education bonds lagged, as did a small position in tobacco bonds. Similarly, being relatively underexposed to tax-supported bonds – a generally higher-rated category that gained ground during the period – also detracted from overall performance.
Many of our recent purchases were bonds from higher-quality sectors, which we favored for their defensive characteristics and potential to continue to do fairly well even in a deteriorating economy. For example, we purchased higher quality school district, electric utility, higher-education, and water/sewer bonds. We also added a non-rated general obligation (GO) issue – a rare type of structure that performed well during the period – as well as a lower-rated industrial development revenue (IDR) bond. To fund purchases, we used proceeds from bond calls. We also sold some of our advance refunded bonds because we believed they offered more-limited appreciation prospects than the positions we were adding.
In addition to the derivative instruments noted earlier, we owned inverse floating rate trusts early in the period in an attempt to maintain the Fund’s duration at desired levels,. As market conditions became more volatile, however, it was becoming economically undesirable to maintain these trusts – leading us to eliminate all but one of the Fund’s floater positions in the period’s final months.
Nuveen Michigan Municipal Bond Fund
Duration positioning helped the relative performance of the Michigan Fund, with an underweighting in poor-performing longer maturities providing the most comparative advantage. Also, the Fund had positive performance from its BBB allocation. However, many of the Fund’s holdings that were rated below investment grade underperformed, as investors became more cautious about credit risk. Bonds in such predominantly lower-rated categories such as health care, charter schools, and continuing care retirement centers all lost ground. One example was the Fund’s position in North Oakland Medical Center bonds issued for Pontiac Hospital. This issuer experienced financial difficulties and saw its bonds marked down significantly.
On the positive side, certain bonds in the portfolio were advance refunded, causing significant price appreciation that added to total returns. The Fund also had a healthy overall allocation to previously advance refunded bonds as well as other AAA-rated securities – two categories that benefited greatly from their high degree of credit quality and short maturities.
Overall, our management approach was relatively defensive – a prudent strategy, in our view, given Michigan’s particular economic challenges. We continued to deemphasize issuers from the vulnerable Detroit area and largely focused new purchases on high-quality school districts in the western and central part of the state. We also invested in high-quality water/sewer bonds as well as various revenue bonds backed by high-quality Michigan taxing authorities. We were cautious about adding new lower-rated bonds to the portfolio, although the periodic dislocations in the municipal market did provide attractive opportunities to invest in selected uninsured health care issues.
Annual Report Page 7
To fund new purchases, we used the proceeds of bond calls. We also sold some of our advance refunded bonds because of their reduced future performance potential. Concerns about long-term credit quality also led us to sell one of our charter school positions, which we believed we were able to do so at a favorable price.
Another way we took advantage of volatile market conditions was to participate in the auction rate securities market, which experienced significant dislocations in the period’s final months. Because of their extremely short durations, auction rate securities have traditionally been far more popular with money market managers than municipal bond managers. But demand for these issues dried up along with the credit market, and their yields rose to unprecedented levels. We thus saw a unique opportunity to buy these bonds at extremely attractive prices and yields.
As in the Kentucky Fund, we did maintain a modest derivative position in a forward swap, as well as several inverse floating rate securities. These holdings enabled us to manage the portfolio’s volatility as well as keep our duration within our target range.
Nuveen Missouri Municipal Bond Fund
A relative overweighting in BBB-rated and non-rated bonds hampered the performance of the Missouri Fund. Further detracting from the period’s results was our under-representation in bonds with underlying AAA and AA credit ratings – the market’s best overall recent performers. In addition, the portfolio also included a relatively large allocation to bonds backed by municipal bond insurance companies Radian Group (RAAI) and ACA Capital Holdings (ACA). Both saw their ratings downgraded, causing price weakness in the bonds they insured.
On the positive side, while lower-rated bonds underperformed as a group, the Fund did benefit from certain individual lower-rated positions that did well in relative terms. In addition, the Fund benefited from owning bonds offering high levels of coupon income and short effective maturities. Specifically, these included a number of our advance refunded securities as well as single-family housing bonds with short-term call dates.
When making new purchases, we generally favored higher-quality, more-defensive issues that we believed could better withstand a return to volatile market conditions. At the same time, we were also taking advantage of opportunities to buy fundamentally sound lower-rated bonds trading at unusually attractive prices. Most of our purchases offered high coupon interest and relatively long maturities – enabling us to lock in value for an extended time. In early March, for example, we were able to obtain an investment-grade Puerto Rico bond issue yielding more than 6 percent. We felt this was an exceptionally attractive value for an investment-grade bond. To fund our purchases, we sold a variety of higher-rated bonds with lower embedded yields. These included school district bonds, which we were able to sell for good prices because of strong demand from individual investors.
After the municipal market’s August 2007 dislocation, we conducted a variety of bond transactions. We exchanged certain longer-dated holdings that had been purchased in much-lower-interest-rate environments for others offering similar structures and risk but much better yields. With these moves, we were able to increase the Fund’s income-generation ability without adding to its overall risk profile.
Nuveen Ohio Municipal Bond Fund
Credit quality allocation modestly helped the Ohio Fund’s performance. It also benefited from allocations to higher-quality categories such as utilities and advance refunded bonds, although being somewhat underrepresented in tax-supported bonds – a strong-performing sector – detracted from overall results, as did being mildly overweighted in industrial development revenue (IDR) bonds, many of which are lower-rated.
Our weakest individual performers included lower-rated continuing care retirement center bonds and
Annual Report Page 8
health care issues. Exposure to lower-rated Ohio tobacco bonds also detracted from relative performance. On the positive side, several of our holdings were advance refunded, which caused an increase in their prices. In addition, the portfolio’s higher-quality, shorter-duration bonds performed well, as these benefited from investors’ flight to quality.
Much of our investment activity during the past year consisted of buying higher-rated bonds, which we favored for their defensive characteristics. For example, we bought a number of general obligation (GO) bonds issued to fund school district projects. Other high-quality purchases included water/sewer bonds, electric utility bonds and an AA-rated health care issue. Recent lower-rated purchases included an attractively priced industrial development revenue (IDR) issue as well as Ohio tobacco bonds. The latter came to market as part of a multibillion-dollar bond issue in the first half of the period.
For most of this period, the Fund’s duration was at the lower end of its target range. Accordingly, toward the end of the period, we established a modest derivative position in a U.S. Treasury future. This addition allowed us to keep our level of interest rate sensitivity at our desired level without requiring us to sell positions we found attractive. We also owned inverse floating rate trusts for duration-management purposes, although increasingly volatile market conditions led us to eliminate these trusts from the portfolio before period end.
Nuveen Wisconsin Municipal Bond Fund
The performance of the Wisconsin Fund was greatly helped by its substantial allocation to the market’s highest-rated bonds. In addition, because of the relative lack of lower-rated bond issuance in Wisconsin, the Fund was significantly underexposed to BBB-rated and non-rated debt. Having fewer of these underperforming securities was helpful for its relative returns. Also helping was the Fund’s significant underexposure to bonds backed by downgraded municipal bond insurers as well some of very-high-coupon, short-maturity positions – including a number of bonds that had been pre-refunded in prior years.
On the negative side, the Fund’s duration positioning detracted from relative performance. Because of the type of issuance that comes to market in Wisconsin, we tended to be overweighted in long-duration bonds – those with the greatest sensitivity to interest rate changes – which performed relatively poorly. We also were underexposed to bonds with durations between three and seven years – a much-better-performing segment of the yield curve.
As we have discussed in past reports, it can be challenging for portfolio managers to find enough supply of suitable Wisconsin bonds to purchase. We did buy some shorter-dated, lower-coupon bonds in the secondary market. But generally, issuance of in-state bonds was even scarcer than usual during the past year. Once again, we looked to the Puerto Rico market to add the types of bond structures that best enabled us to achieve our portfolio management goals. (U.S. territorial bonds are generally fully tax-exempt in all fifty United States.) We purchased a number of higher-quality, premium-coupon issues with 20-to-30-year maturities. While our exposure to U.S. territorial securities increased during the twelve-month period, we remained active in looking for new opportunities in the Wisconsin market and will not hesitate to increase our exposure to in-state debt as suitable opportunities present themselves.
Dividend Information
All share classes of the Kansas Fund saw a November 2007 increase to their monthly tax-free dividend. The Class B shares of the Kentucky Fund experienced a dividend increase in May 2008, while the Fund’s Class C shares saw a dividend increase in August 2007. All share classes of the Michigan Fund had a dividend decrease in February 2008. Dividends rose for the Missouri Fund’s Class B and Class C shares in May 2008. All share classes of the Ohio Fund experienced a dividend decrease in August 2007, while all share classes of the Wisconsin Fund saw a February 2008 dividend decrease.
Annual Report Page 9
However, the Wisconsin Fund’s Class B shares also experienced a dividend increase in May 2008.
Each Fund seeks to pay dividends at a rate that reflects the past and projected performance of the Fund. To permit a Fund to maintain a more stable monthly dividend, the Fund may pay dividends at a rate that may be more or less than the amount of net investment income actually earned by the Fund during the period. If the Fund has cumulatively earned more than it has paid in dividends, it will hold the excess in reserve as undistributed net investment income (UNII) as part of the Fund’s net asset value. Conversely, if the Fund has cumulatively paid in dividends more than it has earned, the excess will constitute a negative UNII that will likewise be reflected in the Fund’s net asset value. Each Fund will, over time, pay all its net investment income as dividends to shareholders.
As of May 31, 2008, all six Funds in this report had positive UNII balances for tax purposes. The Kansas Fund had a positive UNII balance and the Kentucky, Michigan, Missouri, Ohio and Wisconsin Funds had negative UNII balances for financial statement purposes.
Recent Developments Regarding Bond Insurance Companies
The portfolios of investments reflect the ratings on certain bonds insured by ACA, AMBAC, CIFG, FGIC, MBIA, RAAI and XLCA as of May 31, 2008. During the period covered by this report, each of these insures experienced one or more rating reductions by at least one or more rating agencies. Subsequent to May 31, 2008, at least one rating agency further reduced their rating and at least one rating agency had withdrawn their rating for AMBAC-insured and MBIA-insured bonds. At the time this report was prepared, at least one rating agency has placed each of these insurers on “negative credit watch”, which may presage one or more rating reductions for such insurer or insurers in the future. If one or more insurers’ ratings are reduced by these rating agencies, it would likely reduce the effective rating of many of the bonds insured by that insurer or insurers. It is important to note that municipal bonds historically have had a very low rate of default.
Annual Report Page 10
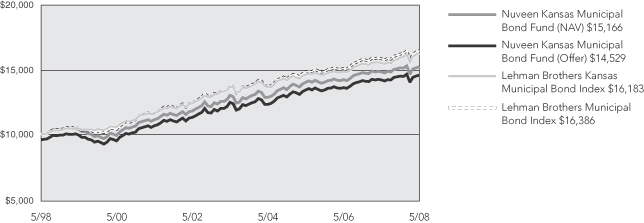
Nuveen Kansas Municipal Bond Fund
Growth of an Assumed $10,000 Investment
Nuveen Kentucky Municipal Bond Fund
Growth of an Assumed $10,000 Investment
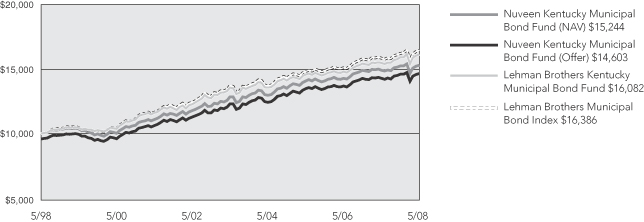
The graphs do not reflect the deduction of taxes, such as state and local income taxes or capital gains taxes, that a shareholder may pay on Fund distributions or the redemption of shares.
The index comparisons show the change in value of a $10,000 investment in the Class A shares of the Nuveen Funds compared with their relevant Lehman Brothers index. Returns would be different for the other share classes. The Lehman Brothers Kansas Municipal Bond Index is an unmanaged index comprised of investment grade, tax-exempt Kansas bonds with maturities of two years or greater. The Lehman Brothers Kentucky Municipal Bond Index is an unmanaged index comprised of investment grade, tax-exempt Kentucky bonds with maturities of two years or greater. The Lehman Brothers Municipal Bond Index is an unmanaged index composed of a broad range of investment-grade municipal bonds. The indexes do not reflect any initial or ongoing expenses and are not available for direct investment. The Nuveen Funds’ returns include reinvestment of all dividends and distributions, and the Funds’ returns at the offer price depicted in the charts reflect the initial maximum sales charge applicable to Class A shares (4.20%) and all ongoing Fund expenses. The performance data quoted represents past performance, which is not indicative of future results. Current performance may be lower or higher than the performance shown.
Annual Report Page 11
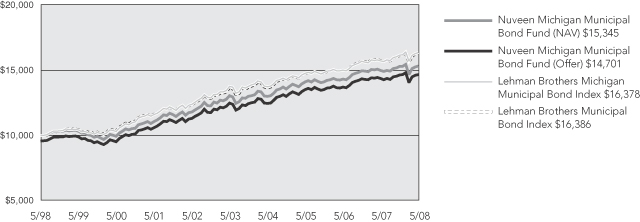
Nuveen Michigan Municipal Bond Fund
Growth of an Assumed $10,000 Investment
Nuveen Missouri Municipal Bond Fund
Growth of an Assumed $10,000 Investment

The graphs do not reflect the deduction of taxes, such as state and local income taxes or capital gains taxes, that a shareholder may pay on Fund distributions or the redemption of shares.
The index comparisons show the change in value of a $10,000 investment in the Class A shares of the Nuveen Funds compared with their relevant Lehman Brothers index. Returns would be different for the other share classes. The Lehman Brothers Michigan Municipal Bond Index is an unmanaged index comprised of investment grade, tax-exempt Michigan bonds with maturities of two years or greater. The Lehman Brothers Missouri Municipal Bond Index is an unmanaged index comprised of investment grade, tax-exempt Missouri bonds with maturities of two years or greater. The Lehman Brothers Municipal Bond Index is an unmanaged index composed of a broad range of investment-grade municipal bonds. The indexes do not reflect any initial or ongoing expenses and are not available for direct investment. The Nuveen Funds’ returns include reinvestment of all dividends and distributions, and the Funds’ returns at the offer price depicted in the charts reflect the initial maximum sales charge applicable to Class A shares (4.20%) and all ongoing Fund expenses. The performance data quoted represents past performance, which is not indicative of future results. Current performance may be lower or higher than the performance shown.
Annual Report Page 12
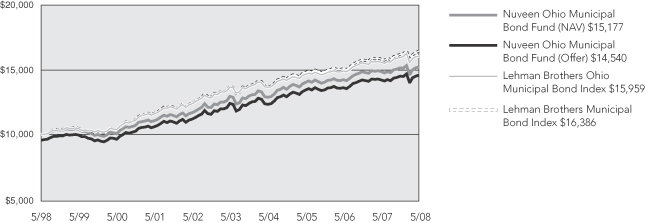
Nuveen Ohio Municipal Bond Fund
Growth of an Assumed $10,000 Investment
Nuveen Wisconsin Municipal Bond Fund
Growth of an Assumed $10,000 Investment
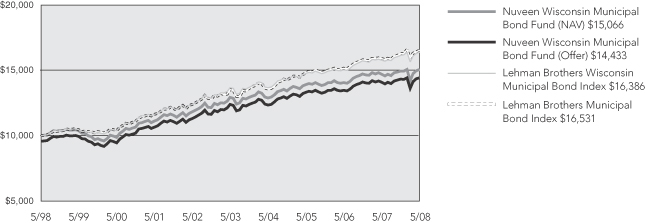
The graphs do not reflect the deduction of taxes, such as state and local income taxes or capital gains taxes, that a shareholder may pay on Fund distributions or the redemption of shares.
The index comparisons show the change in value of a $10,000 investment in the Class A shares of the Nuveen Funds compared with their relevant Lehman Brothers index. Returns would be different for the other share classes. The Lehman Brothers Ohio Municipal Bond Index is an unmanaged index comprised of investment grade, tax-exempt Ohio bonds with maturities of two years or greater. The Lehman Brothers Wisconsin Municipal Bond Index is an unmanaged index comprised of investment grade, tax-exempt Wisconsin bonds with maturities of two years or greater. The Lehman Brothers Municipal Bond Index is an unmanaged index composed of a broad range of investment-grade municipal bonds. The indexes do not reflect any initial or ongoing expenses and are not available for direct investment. The Nuveen Funds’ returns include reinvestment of all dividends and distributions, and the Funds’ returns at the offer price depicted in the charts reflect the initial maximum sales charge applicable to Class A shares (4.20%) and all ongoing Fund expenses. The performance data quoted represents past performance, which is not indicative of future results. Current performance may be lower or higher than the performance shown.
Annual Report Page 13
Fund Spotlight as of 5/31/08 Nuveen Kansas Municipal Bond Fund
| Quick Facts | ||||||||
| A Shares | B Shares1 | C Shares | I Shares1 | |||||
Fund Symbol | FKSTX | FBKSX | FCKSX | FRKSX | ||||
NAV | $10.23 | $10.14 | $10.23 | $10.27 | ||||
Latest Monthly Dividend2 | $0.0355 | $0.0290 | $0.0310 | $0.0375 | ||||
Latest Capital Gain Distribution3 | $0.0243 | $0.0243 | $0.0243 | $0.0243 | ||||
Inception Date | 1/09/92 | 2/19/97 | 2/11/97 | 2/25/97 |
Returns quoted represent past performance which is no guarantee of future results. Returns without sales charges would be lower if the sales charge were included. Current performance may be higher or lower than the performance shown. Investment returns and principal value will fluctuate so that when shares are redeemed, they may be worth more or less than their original cost. Returns do not reflect the deduction of taxes that a shareholder would pay on Fund distributions or the redemption of shares. Income is generally exempt from regular federal income taxes. Some income may be subject to state and local taxes and to the federal alternative minimum tax. Capital gains, if any, are subject to tax. For the most recent month-end performance visit www.nuveen.com or call (800) 257-8787.
Returns reflect differences in sales charges and expenses, which are primarily differences in distribution and service fees. Class A shares have a 4.2% maximum sales charge. Class A Share purchases of $1 million or more are sold at net asset value without an up-front sales charge but may be subject to a contingent deferred sales charge (CDSC), also known as a back-end sales charge, if redeemed within 18 months of purchase. Class B shares have a CDSC that begins at 5% for redemptions during the first year and declines periodically to 0% over the following five years. Class B shares automatically convert to Class A shares eight years after purchase. Class C shares have a 1% CDSC for redemptions within less than one year, which is not reflected in the one-year total return. Class I shares have no sales charge and may be purchased under limited circumstances or by specified classes of investors. Returns reflect an expense limitation by the Fund’s investment adviser.
| Average Annual Total Returns as of 5/31/08 | ||||
| A Shares | NAV | Offer | ||
1-Year | 2.70% | -1.65% | ||
5-Year | 3.17% | 2.30% | ||
10-Year | 4.26% | 3.81% | ||
| B Shares | w/o CDSC | w/CDSC | ||
1-Year | 1.95% | -1.99% | ||
5-Year | 2.41% | 2.24% | ||
10-Year | 3.64% | 3.64% | ||
| C Shares | NAV | |||
1-Year | 2.17% | |||
5-Year | 2.62% | |||
10-Year | 3.68% | |||
| I Shares | NAV | |||
1-Year | 2.83% | |||
5-Year | 3.38% | |||
10-Year | 4.46% | |||
| Tax-Free Yields | ||||
| A Shares | NAV | Offer | ||
Dividend Yield4 | 4.16% | 3.99% | ||
30-Day Yield4 | 3.85% | — | ||
SEC 30-Day Yield4,5 | — | 3.69% | ||
Taxable-Equivalent Yield5,6 | 5.71% | 5.47% | ||
| B Shares | NAV | |||
Dividend Yield4 | 3.43% | |||
30-Day Yield4 | 3.10% | |||
Taxable-Equivalent Yield6 | 4.60% | |||
| C Shares | NAV | |||
Dividend Yield4 | 3.64% | |||
30-Day Yield4 | 3.30% | |||
Taxable-Equivalent Yield6 | 4.90% | |||
| I Shares | NAV | |||
Dividend Yield4 | 4.38% | |||
SEC 30-Day Yield4 | 4.05% | |||
Taxable-Equivalent Yield6 | 6.01% | |||
| Average Annual Total Returns as of 6/30/08 | ||||
A Shares | NAV | Offer | ||
1-Year | 2.20% | -2.07% | ||
5-Year | 3.12% | 2.23% | ||
10-Year | 4.12% | 3.68% | ||
B Shares | w/o CDSC | w/CDSC | ||
1-Year | 1.54% | -2.37% | ||
5-Year | 2.37% | 2.20% | ||
10-Year | 3.50% | 3.50% | ||
C Shares | NAV | |||
1-Year | 1.67% | |||
5-Year | 2.57% | |||
10-Year | 3.55% | |||
I Shares | NAV | |||
1-Year | 2.33% | |||
5-Year | 3.32% | |||
10-Year | 4.32% | |||
| Portfolio Statistics | ||
Net Assets ($000) | $124,363 | |
Average Effective Maturity on Securities (Years) | 17.85 | |
Average Duration | 5.91 |
| Expense Ratios | ||||||
| Share Class | Gross Expense Ratios | Net Expense Ratios | As of Date | |||
Class A | 0.85% | 0.84% | 5/31/07 | |||
Class B | 1.61% | 1.59% | 5/31/07 | |||
Class C | 1.40% | 1.39% | 5/31/07 | |||
Class I | 0.65% | 0.63% | 5/31/07 | |||
The expense ratios shown factor in Total Annual Fund Operating Expenses including management fees and other fees and expenses. The Net Expense Ratios reflect a custodian fee credit from the custodian bank whereby certain fees and expenses are reduced by credits earned on the Fund’s cash on deposit with the bank. There is no guarantee that the Fund will earn such credits in the future. Absent the credit, the Net Expense Ratios would be higher and total returns would be less.
| 1 | Effective May 1, 2008 Class B Shares will only be issued upon exchange of Class B Shares from another Nuveen Fund or for purposes of dividend reinvestment. Effective December 31, 2008 the reinstatement privilege for Class B Shares will no longer be available. Effective May 1, 2008, Class R Shares were renamed Class I Shares. See the Fund’s prospectus for more information. |
| 2 | Paid June 2, 2008. This is the latest monthly tax-exempt dividend declared during the period ended May 31, 2008. |
| 3 | Paid December 5, 2007. Capital gains are subject to federal taxation. |
| 4 | Dividend Yield is the most recent dividend per share (annualized) divided by the appropriate price per share. The SEC 30-Day Yield is computed under an SEC standardized formula and is based on the maximum offer price per share. The 30-Day Yield is computed under the same formula but is based on the Net Asset Value (NAV) per share. The Dividend Yield may differ from the SEC 30-Day Yield because the Fund may be paying out more or less than it is earning and it may not include the effect of amortization of bond premium. |
| 5 | The SEC 30-Day Yield and Taxable-Equivalent Yield on A Shares at NAV applies only to A Shares purchased at no-load pursuant to the Fund’s policy permitting waiver of the A Share load in certain specified circumstances. |
| 6 | The Taxable-Equivalent Yield represents the yield that must be earned on a fully taxable investment in order to equal the yield of the Fund on an after-tax basis at a specified tax rate. With respect to investments that generate qualified dividend income that is taxable at a maximum rate of 15%, the Taxable-Equivalent Yield is lower. The Taxable-Equivalent Yield is based on the Fund’s 30-Day Yield on the indicated date and a combined federal and state income tax rate of 32.6%. |
Annual Report Page 14
Fund Spotlight as of 5/31/08 Nuveen Kansas Municipal Bond Fund
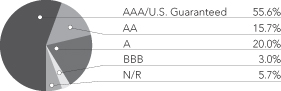
Bond Credit Quality1,2
Industries2
Tax Obligation/Limited | 26.5% | |
Health Care | 23.9% | |
Housing/Single Family | 19.8% | |
Tax Obligation/General | 8.3% | |
Water and Sewer | 6.6% | |
Other | 14.9% |
| 1 | The percentages shown in the foregoing chart may reflect the ratings on certain bonds insured by ACA, AMBAC, CIFG, FGIC, MBIA, RAAI and XLCA as of May 31, 2008. Please see the Portfolio Managers’ Commentary for an expanded discussion of the affect on the Fund of changes to the ratings of certain bonds in the portfolio resulting from changes to the ratings of the underlying insurers both during the period and after period end. |
| 2 | As a percentage of total investments as of May 31, 2008. Holdings are subject to change. |
Expense Example (Unaudited)
As a shareholder of the Fund, you incur two types of costs: (1) transaction costs, including front and back end sales charges (loads) or redemption fees, where applicable; and (2) ongoing costs, including management fees; distribution and service (12b-1) fees, where applicable; and other Fund expenses. This Example is intended to help you understand your ongoing costs (in dollars) of investing in the Fund and to compare these costs with the ongoing costs of investing in other mutual funds.
The Example below is based on an investment of $1,000 invested at the beginning of the period and held for the period.
The information under “Actual Performance,” together with the amount you invested, allows you to estimate actual expenses incurred over the reporting period. Simply divide your account value by $1,000 (for example, an $8,600 account value divided by $1,000 = 8.60) and multiply the result by the cost shown for your share class, in the row entitled “Expenses Incurred During Period” to estimate the expenses incurred on your account during this period.
The information under “Hypothetical Performance,” provides information about hypothetical account values and hypothetical expenses based on the Fund’s actual expense ratio and an assumed rate of return of 5% per year before expenses, which is not the Fund’s actual return. The hypothetical account values and expenses may not be used to estimate the actual ending account balance or expense you incurred for the period. You may use this information to compare the ongoing costs of investing in the Fund and other Funds. To do so, compare this 5% hypothetical example with the 5% hypothetical examples that appear in the shareholder reports of the other funds.
Please note that the expenses shown in the table are meant to highlight your ongoing costs only and do not reflect any transactional costs, such as front and back end sales charges (loads) or redemption fees, where applicable. Therefore, the hypothetical information is useful in comparing ongoing costs only, and will not help you determine the relative total costs of owning different funds or share classes. In addition, if these transactional costs were included, your costs would have been higher.
| Hypothetical Performance | ||||||||||||||||||||||||
| Actual Performance | (5% annualized return before expenses) | |||||||||||||||||||||||
| A Shares | B Shares | C Shares | I Shares | A Shares | B Shares | C Shares | I Shares | |||||||||||||||||
Beginning Account Value (12/01/07) | $ | 1,000.00 | $ | 1,000.00 | $ | 1,000.00 | $ | 1,000.00 | $ | 1,000.00 | $ | 1,000.00 | $ | 1,000.00 | $ | 1,000.00 | ||||||||
Ending Account Value (5/31/08) | $ | 1,005.70 | $ | 1,001.90 | $ | 1,003.10 | $ | 1,006.90 | $ | 1,020.75 | $ | 1,016.95 | $ | 1,017.95 | $ | 1,021.70 | ||||||||
Expenses Incurred During Period | $ | 4.26 | $ | 8.06 | $ | 7.06 | $ | 3.31 | $ | 4.29 | $ | 8.12 | $ | 7.11 | $ | 3.34 | ||||||||
For each class of the Fund, expenses are equal to the Fund’s annualized net expense ratio of .85%, 1.61%, 1.41% and ..66% for Classes A, B, C and I, respectively, multiplied by the average account value over the period, multiplied by 183/366 (to reflect the one-half year period).
Annual Report Page 15
Fund Spotlight as of 5/31/08 Nuveen Kentucky Municipal Bond Fund
| Quick Facts | ||||||||
| A Shares | B Shares1 | C Shares | I Shares1 | |||||
Fund Symbol | FKYTX | FKYBX | FKYCX | FKYRX | ||||
NAV | $10.78 | $10.79 | $10.79 | $10.79 | ||||
Latest Monthly Dividend2 | $0.0365 | $0.0300 | $0.0315 | $0.0380 | ||||
Latest Capital Gain and Ordinary Income Distribution3 | $0.0246 | $0.0246 | $0.0246 | $0.0246 | ||||
Inception Date | 5/04/87 | 2/05/97 | 10/04/93 | 2/07/97 |
Returns quoted represent past performance which is no guarantee of future results. Returns without sales charges would be lower if the sales charge were included. Current performance may be higher or lower than the performance shown. Investment returns and principal value will fluctuate so that when shares are redeemed, they may be worth more or less than their original cost. Returns do not reflect the deduction of taxes that a shareholder would pay on Fund distributions or the redemption of shares. Income is generally exempt from regular federal income taxes. Some income may be subject to state and local taxes and to the federal alternative minimum tax. Capital gains, if any, are subject to tax. For the most recent month-end performance visit www.nuveen.com or call (800) 257-8787.
Returns reflect differences in sales charges and expenses, which are primarily differences in distribution and service fees. Class A shares have a 4.2% maximum sales charge. Class A Share purchases of $1 million or more are sold at net asset value without an up-front sales charge but may be subject to a contingent deferred sales charge (CDSC), also known as a back-end sales charge, if redeemed within 18 months of purchase. Class B shares have a CDSC that begins at 5% for redemptions during the first year and declines periodically to 0% over the following five years. Class B shares automatically convert to Class A shares eight years after purchase. Class C shares have a 1% CDSC for redemptions within less than one year, which is not reflected in the one-year total return. Class I shares have no sales charge and may be purchased under limited circumstances or by specified classes of investors. Returns reflect an expense limitation by the Fund’s investment adviser.
| Average Annual Total Returns as of 5/31/08 | ||||
| A Shares | NAV | Offer | ||
1-Year | 2.63% | -1.67% | ||
5-Year | 3.52% | 2.63% | ||
10-Year | 4.30% | 3.86% | ||
| B Shares | w/o CDSC | w/CDSC | ||
1-Year | 1.85% | -2.09% | ||
5-Year | 2.76% | 2.59% | ||
10-Year | 3.68% | 3.68% | ||
| C Shares | NAV | |||
1-Year | 2.15% | |||
5-Year | 2.97% | |||
10-Year | 3.75% | |||
| I Shares | NAV | |||
1-Year | 2.90% | |||
5-Year | 3.75% | |||
10-Year | 4.52% | |||
| Tax-Free Yields | ||||
| A Shares | NAV | Offer | ||
Dividend Yield4 | 4.06% | 3.89% | ||
30-Day Yield4 | 3.59% | — | ||
SEC 30-Day Yield4,5 | — | 3.44% | ||
Taxable-Equivalent Yield5,6 | 5.30% | 5.08% | ||
| B Shares | NAV | |||
Dividend Yield4 | 3.34% | |||
30-Day Yield4 | 2.84% | |||
Taxable-Equivalent Yield6 | 4.19% | |||
| C Shares | NAV | |||
Dividend Yield4 | 3.50% | |||
30-Day Yield4 | 3.04% | |||
Taxable-Equivalent Yield6 | 4.49% | |||
| I Shares | NAV | |||
Dividend Yield4 | 4.23% | |||
SEC 30-Day Yield4 | 3.79% | |||
Taxable-Equivalent Yield6 | 5.60% | |||
| Average Annual Total Returns as of 6/30/08 | ||||
| A Shares | NAV | Offer | ||
1-Year | 2.05% | -2.26% | ||
5-Year | 3.33% | 2.46% | ||
10-Year | 4.16% | 3.71% | ||
| B Shares | w/o CDSC | w/CDSC | ||
1-Year | 1.37% | -2.55% | ||
5-Year | 2.57% | 2.40% | ||
10-Year | 3.54% | 3.54% | ||
| C Shares | NAV | |||
1-Year | 1.49% | |||
5-Year | 2.76% | |||
10-Year | 3.59% | |||
| I Shares | NAV | |||
1-Year | 2.32% | |||
5-Year | 3.54% | |||
10-Year | 4.36% | |||
| Portfolio Statistics | ||
Net Assets ($000) | $421,899 | |
Average Effective Maturity on Securities (Years) | 14.17 | |
Average Duration | 5.86 |
| Expense Ratios | ||||||
| Share Class | Gross Expense Ratios | Net Expense Ratios | As of Date | |||
Class A | 0.90% | 0.89% | 5/31/07 | |||
Class B | 1.65% | 1.65% | 5/31/07 | |||
Class C | 1.45% | 1.44% | 5/31/07 | |||
Class I | 0.70% | 0.69% | 5/31/07 | |||
The expense ratios shown factor in Total Annual Fund Operating Expenses including management fees and other fees and expenses. The Net Expense Ratios reflect a custodian fee credit from the custodian bank whereby certain fees and expenses are reduced by credits earned on the Fund’s cash on deposit with the bank. There is no guarantee that the Fund will earn such credits in the future. Absent the credit, the Net Expense Ratios would be higher and total returns would be less.
| 1 | Effective May 1, 2008 Class B Shares will only be issued upon exchange of Class B Shares from another Nuveen Fund or for purposes of dividend reinvestment. Effective December 31, 2008 the reinstatement privilege for Class B Shares will no longer be available. Effective May 1, 2008, Class R Shares were renamed Class I Shares. See the Fund’s prospectus for more information. |
| 2 | Paid June 2, 2008. This is the latest monthly tax-exempt dividend declared during the period ended May 31, 2008. |
| 3 | Paid December 5, 2007. Capital gains and/or ordinary income are subject to federal taxation. |
| 4 | Dividend Yield is the most recent dividend per share (annualized) divided by the appropriate price per share. The SEC 30-Day Yield is computed under an SEC standardized formula and is based on the maximum offer price per share. The 30-Day Yield is computed under the same formula but is based on the Net Asset Value (NAV) per share. The Dividend Yield may differ from the SEC 30-Day Yield because the Fund may be paying out more or less than it is earning and it may not include the effect of amortization of bond premium. |
| 5 | The SEC 30-Day Yield and Taxable-Equivalent Yield on A Shares at NAV applies only to A Shares purchased at no-load pursuant to the Fund’s policy permitting waiver of the A Share load in certain specified circumstances. |
| 6 | The Taxable-Equivalent Yield represents the yield that must be earned on a fully taxable investment in order to equal the yield of the Fund on an after-tax basis at a specified tax rate. With respect to investments that generate qualified dividend income that is taxable at a maximum rate of 15%, the Taxable-Equivalent Yield is lower. The Taxable-Equivalent Yield is based on the Fund’s 30-Day Yield on the indicated date and a combined federal and state income tax rate 32.3%. |
Annual Report Page 16
Fund Spotlight as of 5/31/08 Nuveen Kentucky Municipal Bond Fund
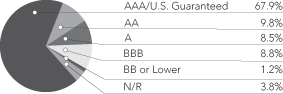
Bond Credit Quality1,2
Industries2
Tax Obligation/Limited | 24.8% | |
U.S. Guaranteed | 14.8% | |
Utilities | 11.9% | |
Water and Sewer | 11.1% | |
Health Care | 10.8% | |
Tax Obligation/General | 8.9% | |
Education and Civic Organizations | 5.3% | |
Other | 12.4% |
| 1 | The percentages shown in the foregoing chart may reflect the ratings on certain bonds insured by ACA, AMBAC, CIFG, FGIC, MBIA, RAAI and XLCA as of May 31, 2008. Please see the Portfolio Managers’ Commentary for an expanded discussion of the affect on the Fund of changes to the ratings of certain bonds in the portfolio resulting from changes to the ratings of the underlying insurers both during the period and after period end. |
| 2 | As a percentage of total investments, excluding derivative transactions, as of May 31, 2008. Holdings are subject to change. |
Expense Example (Unaudited)
As a shareholder of the Fund, you incur two types of costs: (1) transaction costs, including front and back end sales charges (loads) or redemption fees, where applicable; and (2) ongoing costs, including management fees; distribution and service (12b-1) fees, where applicable; and other Fund expenses. This Example is intended to help you understand your ongoing costs (in dollars) of investing in the Fund and to compare these costs with the ongoing costs of investing in other mutual funds.
The Example below is based on an investment of $1,000 invested at the beginning of the period and held for the period.
The information under “Actual Performance,” together with the amount you invested, allows you to estimate actual expenses incurred over the reporting period. Simply divide your account value by $1,000 (for example, an $8,600 account value divided by $1,000 = 8.60) and multiply the result by the cost shown for your share class, in the row entitled “Expenses Incurred During Period” to estimate the expenses incurred on your account during this period.
The information under “Hypothetical Performance,” provides information about hypothetical account values and hypothetical expenses based on the Fund’s actual expense ratio and an assumed rate of return of 5% per year before expenses, which is not the Fund’s actual return. The hypothetical account values and expenses may not be used to estimate the actual ending account balance or expense you incurred for the period. You may use this information to compare the ongoing costs of investing in the Fund and other Funds. To do so, compare this 5% hypothetical example with the 5% hypothetical examples that appear in the shareholder reports of the other funds.
Please note that the expenses shown in the table are meant to highlight your ongoing costs only and do not reflect any transactional costs, such as front and back end sales charges (loads) or redemption fees, where applicable. Therefore, the hypothetical information is useful in comparing ongoing costs only, and will not help you determine the relative total costs of owning different funds or share classes. In addition, if these transactional costs were included, your costs would have been higher.
| Hypothetical Performance | ||||||||||||||||||||||||
| Actual Performance | (5% annualized return before expenses) | |||||||||||||||||||||||
| A Shares | B Shares | C Shares | I Shares | A Shares | B Shares | C Shares | I Shares | |||||||||||||||||
Beginning Account Value (12/01/07) | $ | 1,000.00 | $ | 1,000.00 | $ | 1,000.00 | $ | 1,000.00 | $ | 1,000.00 | $ | 1,000.00 | $ | 1,000.00 | $ | 1,000.00 | ||||||||
Ending Account Value (5/31/08) | $ | 1,004.20 | $ | 1,000.30 | $ | 1,002.30 | $ | 1,005.90 | $ | 1,020.78 | $ | 1,017.03 | $ | 1,018.03 | $ | 1,021.78 | ||||||||
Expenses Incurred During Period | $ | 4.23 | $ | 7.97 | $ | 6.98 | $ | 3.23 | $ | 4.26 | $ | 8.04 | $ | 7.03 | $ | 3.26 | ||||||||
For each class of the Fund, expenses are equal to the Fund’s annualized net expense ratio of .84%, 1.59%, 1.39% and ..64% for Classes A, B, C and I, respectively, multiplied by the average account value over the period, multiplied by 183/366 (to reflect the one-half year period).
Annual Report Page 17
Fund Spotlight as of 5/31/08 Nuveen Michigan Municipal Bond Fund
| Quick Facts | ||||||||
| A Shares | B Shares1 | C Shares | I Shares1 | |||||
Fund Symbol | FMITX | FMIBX | FLMCX | NMMIX | ||||
NAV | $11.15 | $11.17 | $11.15 | $11.15 | ||||
Latest Monthly Dividend2 | $0.0385 | $0.0320 | $0.0335 | $0.0405 | ||||
Latest Capital Gain Distribution3 | $0.0321 | $0.0321 | $0.0321 | $0.0321 | ||||
Inception Date | 6/27/85 | 2/03/97 | 6/22/93 | 2/03/97 |
Returns quoted represent past performance which is no guarantee of future results. Returns without sales charges would be lower if the sales charge were included. Current performance may be higher or lower than the performance shown. Investment returns and principal value will fluctuate so that when shares are redeemed, they may be worth more or less than their original cost. Returns do not reflect the deduction of taxes that a shareholder would pay on Fund distributions or the redemption of shares. Income is generally exempt from regular federal income taxes. Some income may be subject to state and local taxes and to the federal alternative minimum tax. Capital gains, if any, are subject to tax. For the most recent month-end performance visit www.nuveen.com or call (800) 257-8787.
Returns reflect differences in sales charges and expenses, which are primarily differences in distribution and service fees. Class A shares have a 4.2% maximum sales charge. Class A Share purchases of $1 million or more are sold at net asset value without an up-front sales charge but may be subject to a contingent deferred sales charge (CDSC), also known as a back-end sales charge, if redeemed within 18 months of purchase. Class B shares have a CDSC that begins at 5% for redemptions during the first year and declines periodically to 0% over the following five years. Class B shares automatically convert to Class A shares eight years after purchase. Class C shares have a 1% CDSC for redemptions within less than one year, which is not reflected in the one-year total return. Class I shares have no sales charge and may be purchased under limited circumstances or by specified classes of investors. Returns reflect an expense limitation by the Fund’s investment adviser.
| Average Annual Total Returns as of 5/31/08 | ||||
| A Shares | NAV | Offer | ||
1-Year | 2.17% | -2.12% | ||
5-Year | 3.27% | 2.39% | ||
10-Year | 4.38% | 3.93% | ||
| B Shares | w/o CDSC | w/CDSC | ||
1-Year | 1.41% | -2.49% | ||
5-Year | 2.49% | 2.33% | ||
10-Year | 3.74% | 3.74% | ||
| C Shares | NAV | |||
1-Year | 1.67% | |||
5-Year | 2.72% | |||
10-Year | 3.80% | |||
| I Shares | NAV | |||
1-Year | 2.39% | |||
5-Year | 3.48% | |||
10-Year | 4.58% | |||
| Tax-Free Yields | ||||
| A Shares | NAV | Offer | ||
Dividend Yield4 | 4.14% | 3.97% | ||
30-Day Yield4 | 3.36% | — | ||
SEC 30-Day Yield4,5 | — | 3.22% | ||
Taxable-Equivalent Yield5,6 | 4.88% | 4.67% | ||
| B Shares | NAV | |||
Dividend Yield4 | 3.44% | |||
30-Day Yield4 | 2.61% | |||
Taxable-Equivalent Yield6 | 3.79% | |||
| C Shares | NAV | |||
Dividend Yield4 | 3.61% | |||
30-Day Yield4 | 2.81% | |||
Taxable-Equivalent Yield6 | 4.08% | |||
| I Shares | NAV | |||
Dividend Yield4 | 4.36% | |||
SEC 30-Day Yield4 | 3.56% | |||
Taxable-Equivalent Yield6 | 5.17% | |||
| Average Annual Total Returns as of 6/30/08 | ||||
| A Shares | NAV | Offer | ||
1-Year | 1.59% | -2.71% | ||
5-Year | 3.19% | 2.30% | ||
10-Year | 4.21% | 3.76% | ||
| B Shares | w/o CDSC | w/CDSC | ||
1-Year | 0.85% | -3.04% | ||
5-Year | 2.43% | 2.26% | ||
10-Year | 3.59% | 3.59% | ||
| C Shares | NAV | |||
1-Year | 1.10% | |||
5-Year | 2.62% | |||
10-Year | 3.65% | |||
| I Shares | NAV | |||
1-Year | 1.81% | |||
5-Year | 3.38% | |||
10-Year | 4.42% | |||
| Portfolio Statistics | ||
Net Assets ($000) | $218,690 | |
Average Effective Maturity on Securities (Years) | 15.25 | |
Average Duration | 5.89 | |
| Expense Ratios | ||||||
| Share Class | Gross Expense Ratios | Net Expense Ratios | As of Date | |||
Class A | 0.91% | 0.90% | 5/31/07 | |||
Class B | 1.67% | 1.65% | 5/31/07 | |||
Class C | 1.46% | 1.45% | 5/31/07 | |||
Class I | 0.71% | 0.70% | 5/31/07 | |||
The expense ratios shown factor in Total Annual Fund Operating Expenses including management fees and other fees and expenses. The Net Expense Ratios reflect a custodian fee credit from the custodian bank whereby certain fees and expenses are reduced by credits earned on the Fund’s cash on deposit with the bank. There is no guarantee that the Fund will earn such credits in the future. Absent the credit, the Net Expense Ratios would be higher and total returns would be less.
| 1 | Effective May 1, 2008 Class B Shares will only be issued upon exchange of Class B Shares from another Nuveen Fund or for purposes of dividend reinvestment. Effective December 31, 2008 the reinstatement privilege for Class B Shares will no longer be available. Effective May 1, 2008, Class R Shares were renamed Class I Shares. See the Fund’s prospectus for more information. |
| 2 | Paid June 2, 2008. This is the latest monthly tax-exempt dividend declared during the period ended May 31, 2008. |
| 3 | Paid December 5, 2007. Capital gains are subject to federal taxation. |
| 4 | Dividend Yield is the most recent dividend per share (annualized) divided by the appropriate price per share. The SEC 30-Day Yield is computed under an SEC standardized formula and is based on the maximum offer price per share. The 30-Day Yield is computed under the same formula but is based on the Net Asset Value (NAV) per share. The Dividend Yield may differ from the SEC 30-Day Yield because the Fund may be paying out more or less than it is earning and it may not include the effect of amortization of bond premium. |
| 5 | The SEC 30-Day Yield and Taxable-Equivalent Yield on A Shares at NAV applies only to A Shares purchased at no-load pursuant to the Fund’s policy permitting waiver of the A Share load in certain specified circumstances. |
| 6 | The Taxable-Equivalent Yield represents the yield that must be earned on a fully taxable investment in order to equal the yield of the Fund on an after-tax basis at a specified tax rate. With respect to investments that generate qualified dividend income that is taxable at a maximum rate of 15%, the Taxable-Equivalent Yield is lower. The Taxable-Equivalent Yield is based on the Fund’s 30-Day Yield on the indicated date and a combined federal and state income tax rate of 31.1%. |
Annual Report Page 18
Fund Spotlight as of 5/31/08 Nuveen Michigan Municipal Bond Fund
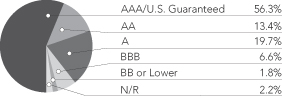
Bond Credit Quality1,2
Industries2
Tax Obligation/General | 34.6% | |
Tax Obligation/Limited | 14.8% | |
U.S. Guaranteed | 13.5% | |
Water and Sewer | 11.8% | |
Health Care | 9.3% | |
Utilities | 5.6% | |
Other | 10.4% |
| 1 | The percentages shown in the foregoing chart may reflect the ratings on certain bonds insured by ACA, AMBAC, CIFG, FGIC, MBIA, RAAI and XLCA as of May 31, 2008. Please see the Portfolio Managers’ Commentary for an expanded discussion of the affect on the Fund of changes to the ratings of certain bonds in the portfolio resulting from changes to the ratings of the underlying insurers both during the period and after period end. |
| 2 | As a percentage of total investments, excluding derivative transactions, as of May 31, 2008. Holdings are subject to change. |
Expense Example (Unaudited)
As a shareholder of the Fund, you incur two types of costs: (1) transaction costs, including front and back end sales charges (loads) or redemption fees, where applicable; and (2) ongoing costs, including management fees; distribution and service (12b-1) fees, where applicable; and other Fund expenses. This Example is intended to help you understand your ongoing costs (in dollars) of investing in the Fund and to compare these costs with the ongoing costs of investing in other mutual funds.
The Example below is based on an investment of $1,000 invested at the beginning of the period and held for the period.
The information under “Actual Performance,” together with the amount you invested, allows you to estimate actual expenses incurred over the reporting period. Simply divide your account value by $1,000 (for example, an $8,600 account value divided by $1,000 = 8.60) and multiply the result by the cost shown for your share class, in the row entitled “Expenses Incurred During Period” to estimate the expenses incurred on your account during this period.
The information under “Hypothetical Performance,” provides information about hypothetical account values and hypothetical expenses based on the Fund’s actual expense ratio and an assumed rate of return of 5% per year before expenses, which is not the Fund’s actual return. The hypothetical account values and expenses may not be used to estimate the actual ending account balance or expense you incurred for the period. You may use this information to compare the ongoing costs of investing in the Fund and other Funds. To do so, compare this 5% hypothetical example with the 5% hypothetical examples that appear in the shareholder reports of the other funds.
Please note that the expenses shown in the table are meant to highlight your ongoing costs only and do not reflect any transactional costs, such as front and back end sales charges (loads) or redemption fees, where applicable. Therefore, the hypothetical information is useful in comparing ongoing costs only, and will not help you determine the relative total costs of owning different funds or share classes. In addition, if these transactional costs were included, your costs would have been higher.
| Hypothetical Performance | ||||||||||||||||||||||||
| Actual Performance | (5% annualized return before expenses) | |||||||||||||||||||||||
| A Shares | B Shares | C Shares | I Shares | A Shares | B Shares | C Shares | I Shares | |||||||||||||||||
Beginning Account Value (12/01/07) | $ | 1,000.00 | $ | 1,000.00 | $ | 1,000.00 | $ | 1,000.00 | $ | 1,000.00 | $ | 1,000.00 | $ | 1,000.00 | $ | 1,000.00 | ||||||||
Ending Account Value (5/31/08) | $ | 1,001.50 | $ | 997.80 | $ | 999.50 | $ | 1,002.60 | $ | 1,020.75 | $ | 1,017.00 | $ | 1,018.00 | $ | 1,021.75 | ||||||||
Expenses Incurred During Period | $ | 4.25 | $ | 7.99 | $ | 7.00 | $ | 3.25 | $ | 4.29 | $ | 8.07 | $ | 7.06 | $ | 3.29 | ||||||||
For each class of the Fund, expenses are equal to the Fund’s annualized net expense ratio of .85%, 1.60%, 1.40% and ..65% for Classes A, B, C and I, respectively, multiplied by the average account value over the period, multiplied by 183/366 (to reflect the one-half year period).
Annual Report Page 19
Fund Spotlight as of 5/31/08 Nuveen Missouri Municipal Bond Fund
| Quick Facts | ||||||||
| A Shares | B Shares1 | C Shares | I Shares1 | |||||
Fund Symbol | FMOTX | FMMBX | FMOCX | FMMRX | ||||
NAV | $10.73 | $10.74 | $10.72 | $10.73 | ||||
Latest Monthly Dividend2 | $0.0375 | $0.0310 | $0.0330 | $0.0395 | ||||
Latest Capital Gain and Ordinary Income Distribution3 | $0.0198 | $0.0198 | $0.0198 | $0.0198 | ||||
Inception Date | 8/03/87 | 2/06/97 | 2/02/94 | 2/19/97 |
Returns quoted represent past performance which is no guarantee of future results. Returns without sales charges would be lower if the sales charge were included. Current performance may be higher or lower than the performance shown. Investment returns and principal value will fluctuate so that when shares are redeemed, they may be worth more or less than their original cost. Returns do not reflect the deduction of taxes that a shareholder would pay on Fund distributions or the redemption of shares. Income is generally exempt from regular federal income taxes. Some income may be subject to state and local taxes and to the federal alternative minimum tax. Capital gains, if any, are subject to tax. For the most recent month-end performance visit www.nuveen.com or call (800) 257-8787.
Returns reflect differences in sales charges and expenses, which are primarily differences in distribution and service fees. Class A shares have a 4.2% maximum sales charge. Class A Share purchases of $1 million or more are sold at net asset value without an up-front sales charge but may be subject to a contingent deferred sales charge (CDSC), also known as a back-end sales charge, if redeemed within 18 months of purchase. Class B shares have a CDSC that begins at 5% for redemptions during the first year and declines periodically to 0% over the following five years. Class B shares automatically convert to Class A shares eight years after purchase. Class C shares have a 1% CDSC for redemptions within less than one year, which is not reflected in the one-year total return. Class I shares have no sales charge and may be purchased under limited circumstances or by specified classes of investors. Returns reflect an expense limitation by the Fund’s investment adviser.
| Average Annual Total Returns as of 5/31/08 | ||||
| A Shares | NAV | Offer | ||
1-Year | 1.59% | -2.65% | ||
5-Year | 3.31% | 2.42% | ||
10-Year | 4.31% | 3.87% | ||
| B Shares | w/o CDSC | w/CDSC | ||
1-Year | 0.81% | -3.08% | ||
5-Year | 2.55% | 2.38% | ||
10-Year | 3.68% | 3.68% | ||
| C Shares | NAV | |||
1-Year | 1.03% | |||
5-Year | 2.76% | |||
10-Year | 3.74% | |||
| I Shares | NAV | |||
1-Year | 1.81% | |||
5-Year | 3.51% | |||
10-Year | 4.51% | |||
| Tax-Free Yields | ||||
| A Shares | NAV | Offer | ||
Dividend Yield4 | 4.19% | 4.02% | ||
30-Day Yield4 | 4.64% | — | ||
SEC 30-Day Yield4,5 | — | 4.44% | ||
Taxable-Equivalent Yield5,6 | 6.85% | 6.56% | ||
| B Shares | NAV | |||
Dividend Yield4 | 3.46% | |||
30-Day Yield4 | 3.89% | |||
Taxable-Equivalent Yield6 | 5.75% | |||
| C Shares | NAV | |||
Dividend Yield4 | 3.69% | |||
30-Day Yield4 | 4.09% | |||
Taxable-Equivalent Yield6 | 6.04% | |||
| I Shares | NAV | |||
Dividend Yield4 | 4.42% | |||
SEC 30-Day Yield4 | 4.84% | |||
Taxable-Equivalent Yield6 | 7.15% | |||
| Average Annual Total Returns as of 6/30/08 | ||||
A Shares | NAV | Offer | ||
1-Year | 1.00% | -3.25% | ||
5-Year | 3.20% | 2.32% | ||
10-Year | 4.15% | 3.71% | ||
B Shares | w/o CDSC | w/CDSC | ||
1-Year | 0.32% | -3.55% | ||
5-Year | 2.44% | 2.27% | ||
10-Year | 3.54% | 3.54% | ||
C Shares | NAV | |||
1-Year | 0.45% | |||
5-Year | 2.63% | |||
10-Year | 3.58% | |||
I Shares | NAV | |||
1-Year | 1.22% | |||
5-Year | 3.42% | |||
10-Year | 4.36% | |||
| Portfolio Statistics | ||
Net Assets ($000) | $225,675 | |
Average Effective Maturity on Securities (Years) | 16.09 | |
Average Duration | 6.85 | |
| Expense Ratios | ||||||
| Share Class | Gross Expense Ratios | Net Expense Ratios | As of Date | |||
Class A | 0.88% | 0.87% | 5/31/07 | |||
Class B | 1.63% | 1.61% | 5/31/07 | |||
Class C | 1.43% | 1.42% | 5/31/07 | |||
Class I | 0.68% | 0.67% | 5/31/07 | |||
The expense ratios shown factor in Total Annual Fund Operating Expenses including management fees and other fees and expenses. The Net Expense Ratios reflect a custodian fee credit from the custodian bank whereby certain fees and expenses are reduced by credits earned on the Fund’s cash on deposit with the bank. There is no guarantee that the Fund will earn such credits in the future. Absent the credit, the Net Expense Ratios would be higher and total returns would be less.
| 1 | Effective May 1, 2008 Class B Shares will only be issued upon exchange of Class B Shares from another Nuveen Fund or for purposes of dividend reinvestment. Effective December 31, 2008 the reinstatement privilege for Class B Shares will no longer be available. Effective May 1, 2008, Class R Shares were renamed Class I Shares. See the Fund’s prospectus for more information. |
| 2 | Paid June 2, 2008. This is the latest monthly tax-exempt dividend declared during the period ended May 31, 2008. |
| 3 | Paid December 5, 2007. Capital gains and/or ordinary income are subject to federal taxation. |
| 4 | Dividend Yield is the most recent dividend per share (annualized) divided by the appropriate price per share. The SEC 30-Day Yield is computed under an SEC standardized formula and is based on the maximum offer price per share. The 30-Day Yield is computed under the same formula but is based on the Net Asset Value (NAV) per share. The Dividend Yield may differ from the SEC 30-Day Yield because the Fund may be paying out more or less than it is earning and it may not include the effect of amortization of bond premium. |
| 5 | The SEC 30-Day Yield and Taxable-Equivalent Yield on A Shares at NAV applies only to A Shares purchased at no-load pursuant to the Fund’s policy permitting waiver of the A Share load in certain specified circumstances. |
| 6 | The Taxable-Equivalent Yield represents the yield that must be earned on a fully taxable investment in order to equal the yield of the Fund on an after-tax basis at a specified tax rate. With respect to investments that generate qualified dividend income that is taxable at a maximum rate of 15%, the Taxable-Equivalent Yield is lower. The Taxable-Equivalent Yield is based on the Fund’s 30-Day Yield on the indicated date and a combined federal and state income tax rate of 32.3%. |
Annual Report Page 20
Fund Spotlight as of 5/31/08 Nuveen Missouri Municipal Bond Fund
Bond Credit Quality1,2
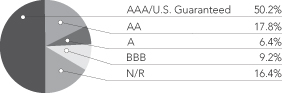
Industries2
Tax Obligation/Limited | 18.9% | |
Tax Obligation/General | 17.8% | |
Health Care | 13.0% | |
Water and Sewer | 7.4% | |
U.S. Guaranteed | 6.6% | |
Long-Term Care | 5.8% | |
Education and Civic Organizations | 5.4% | |
Housing/Single Family | 5.4% | |
Consumer Staples | 5.2% | |
Other | 14.5% |
| 1 | The percentages shown in the foregoing chart may reflect the ratings on certain bonds insured by ACA, AMBAC, CIFG, FGIC, MBIA, RAAI and XLCA as of May 31, 2008. Please see the Portfolio Managers’ Commentary for an expanded discussion of the affect on the Fund of changes to the ratings of certain bonds in the portfolio resulting from changes to the ratings of the underlying insurers both during the period and after period end. |
| 2 | As a percentage of total investments as of May 31, 2008. Holdings are subject to change. |
Expense Example (Unaudited)
As a shareholder of the Fund, you incur two types of costs: (1) transaction costs, including front and back end sales charges (loads) or redemption fees, where applicable; and (2) ongoing costs, including management fees; distribution and service (12b-1) fees, where applicable; and other Fund expenses. This Example is intended to help you understand your ongoing costs (in dollars) of investing in the Fund and to compare these costs with the ongoing costs of investing in other mutual funds.
The Example below is based on an investment of $1,000 invested at the beginning of the period and held for the period.
The information under “Actual Performance,” together with the amount you invested, allows you to estimate actual expenses incurred over the reporting period. Simply divide your account value by $1,000 (for example, an $8,600 account value divided by $1,000 = 8.60) and multiply the result by the cost shown for your share class, in the row entitled “Expenses Incurred During Period” to estimate the expenses incurred on your account during this period.
The information under “Hypothetical Performance,” provides information about hypothetical account values and hypothetical expenses based on the Fund’s actual expense ratio and an assumed rate of return of 5% per year before expenses, which is not the Fund’s actual return. The hypothetical account values and expenses may not be used to estimate the actual ending account balance or expense you incurred for the period. You may use this information to compare the ongoing costs of investing in the Fund and other Funds. To do so, compare this 5% hypothetical example with the 5% hypothetical examples that appear in the shareholder reports of the other funds.
Please note that the expenses shown in the table are meant to highlight your ongoing costs only and do not reflect any transactional costs, such as front and back end sales charges (loads) or redemption fees, where applicable. Therefore, the hypothetical information is useful in comparing ongoing costs only, and will not help you determine the relative total costs of owning different funds or share classes. In addition, if these transactional costs were included, your costs would have been higher.
| Hypothetical Performance | ||||||||||||||||||||||||
| Actual Performance | (5% annualized return before expenses) | |||||||||||||||||||||||
| A Shares | B Shares | C Shares | I Shares | A Shares | B Shares | C Shares | I Shares | |||||||||||||||||
Beginning Account Value (12/01/07) | $ | 1,000.00 | $ | 1,000.00 | $ | 1,000.00 | $ | 1,000.00 | $ | 1,000.00 | $ | 1,000.00 | $ | 1,000.00 | $ | 1,000.00 | ||||||||
Ending Account Value (5/31/08) | $ | 999.80 | $ | 995.90 | $ | 997.00 | $ | 1,000.00 | $ | 1,020.69 | $ | 1,016.94 | $ | 1,017.94 | $ | 1,021.69 | ||||||||
Expenses Incurred During Period | $ | 4.31 | $ | 8.05 | $ | 7.05 | $ | 3.31 | $ | 4.36 | $ | 8.13 | $ | 7.13 | $ | 3.35 | ||||||||
For each class of the Fund, expenses are equal to the Fund’s annualized net expense ratio of .86%, 1.61%, 1.41% and ..66% for Classes A, B, C and I, respectively, multiplied by the average account value over the period, multiplied by 183/366 (to reflect the one-half year period).
Annual Report Page 21
Fund Spotlight as of 5/31/08 Nuveen Ohio Municipal Bond Fund
| Quick Facts | ||||||||
| A Shares | B Shares1 | C Shares | I Shares1 | |||||
Fund Symbol | FOHTX | FOHBX | FOHCX | NXOHX | ||||
NAV | $10.99 | $10.97 | $10.96 | $10.97 | ||||
Latest Monthly Dividend2 | $0.0380 | $0.0310 | $0.0330 | $0.0400 | ||||
Latest Capital Gain Distribution3 | $0.0735 | $0.0735 | $0.0735 | $0.0735 | ||||
Inception Date | 6/27/85 | 2/03/97 | 8/03/93 | 2/03/97 |
Returns quoted represent past performance which is no guarantee of future results. Returns without sales charges would be lower if the sales charge were included. Current performance may be higher or lower than the performance shown. Investment returns and principal value will fluctuate so that when shares are redeemed, they may be worth more or less than their original cost. Returns do not reflect the deduction of taxes that a shareholder would pay on Fund distributions or the redemption of shares. Income is generally exempt from regular federal income taxes. Some income may be subject to state and local taxes and to the federal alternative minimum tax. Capital gains, if any, are subject to tax. For the most recent month-end performance visit www.nuveen.com or call (800) 257-8787.
Returns reflect differences in sales charges and expenses, which are primarily differences in distribution and service fees. Class A shares have a 4.2% maximum sales charge. Class A Share purchases of $1 million or more are sold at net asset value without an up-front sales charge but may be subject to a contingent deferred sales charge (CDSC), also known as a back-end sales charge, if redeemed within 18 months of purchase. Class B shares have a CDSC that begins at 5% for redemptions during the first year and declines periodically to 0% over the following five years. Class B shares automatically convert to Class A shares eight years after purchase. Class C shares have a 1% CDSC for redemptions within less than one year, which is not reflected in the one-year total return. Class I shares have no sales charge and may be purchased under limited circumstances or by specified classes of investors. Returns reflect an expense limitation by the Fund’s investment adviser.
| Average Annual Total Returns as of 5/31/08 | ||||
| A Shares | NAV |
Offer | ||
1-Year | 2.47% | -1.81% | ||
5-Year | 3.24% | 2.35% | ||
10-Year | 4.25% | 3.81% | ||
| B Shares | w/o CDSC |
w/CDSC | ||
1-Year | 1.61% | -2.29% | ||
5-Year | 2.47% | 2.30% | ||
10-Year | 3.64% | 3.64% | ||
| C Shares | NAV | |||
1-Year | 1.93% | |||
5-Year | 2.69% | |||
10-Year | 3.69% | |||
| I Shares |
NAV | |||
1-Year | 2.60% | |||
5-Year | 3.44% | |||
10-Year | 4.47% | |||
| Tax-Free Yields | ||||
| A Shares | NAV | Offer | ||
Dividend Yield4 | 4.15% | 3.98% | ||
30-Day Yield4 | 3.54% | — | ||
SEC 30-Day Yield4,5 | — | 3.39% | ||
Taxable-Equivalent Yield5,6 | 5.21% | 4.99% | ||
| B Shares | NAV | |||
Dividend Yield4 | 3.39% | |||
30-Day Yield4 | 2.79% | |||
Taxable-Equivalent Yield6 | 4.11% | |||
| C Shares | NAV | |||
Dividend Yield4 | 3.61% | |||
30-Day Yield4 | 2.99% | |||
Taxable-Equivalent Yield6 | 4.40% | |||
| I Shares | NAV | |||
Dividend Yield4 | 4.38% | |||
SEC 30-Day Yield4 | 3.75% | |||
Taxable-Equivalent Yield6 | 5.52% | |||
| Average Annual Total Returns as of 6/30/08 | ||||
A Shares | NAV | Offer | ||
1-Year | 2.07% | -2.22% | ||
5-Year | 3.18% | 2.30% | ||
10-Year | 4.12% | 3.68% | ||
B Shares | w/o CDSC | w/CDSC | ||
1-Year | 1.21% | -2.67% | ||
5-Year | 2.41% | 2.24% | ||
10-Year | 3.51% | 3.51% | ||
C Shares | NAV | |||
1-Year | 1.53% | |||
5-Year | 2.63% | |||
10-Year | 3.56% | |||
I Shares | NAV | |||
1-Year | 2.21% | |||
5-Year | 3.38% | |||
10-Year | 4.33% | |||
| Portfolio Statistics | ||
Net Assets ($000) | $517,707 | |
Average Effective Maturity on Securities (Years) | 14.74 | |
Average Duration | 5.67 | |
| Expense Ratios | ||||||
| Share Class | Gross Expense Ratios | Net Expense Ratios | As of Date | |||
Class A | 0.98% | 0.98% | 5/31/07 | |||
Class B | 1.73% | 1.73% | 5/31/07 | |||
Class C | 1.53% | 1.53% | 5/31/07 | |||
Class I | 0.78% | 0.78% | 5/31/07 | |||
The expense ratios shown factor in Total Annual Fund Operating Expenses including management fees and other fees and expenses.
| 1 | Effective May 1, 2008 Class B Shares will only be issued upon exchange of Class B Shares from another Nuveen Fund or for purposes of dividend reinvestment. Effective December 31, 2008 the reinstatement privilege for Class B Shares will no longer be available. Effective May 1, 2008, Class R Shares were renamed Class I Shares. See the Fund’s prospectus for more information. |
| 2 | Paid June 2, 2008. This is the latest monthly tax-exempt dividend declared during the period ended May 31, 2008. |
| 3 | Paid December 5, 2007. Capital gains are subject to federal taxation. |
| 4 | Dividend Yield is the most recent dividend per share (annualized) divided by the appropriate price per share. The SEC 30-Day Yield is computed under an SEC standardized formula and is based on the maximum offer price per share. The 30-Day Yield is computed under the same formula but is based on the Net Asset Value (NAV) per share. The Dividend Yield may differ from the SEC 30-Day Yield because the Fund may be paying out more or less than it is earning and it may not include the effect of amortization of bond premium. |
| 5 | The SEC 30-Day Yield and Taxable-Equivalent Yield on A Shares at NAV applies only to A Shares purchased at no-load pursuant to the Fund’s policy permitting waiver of the A Share load in certain specified circumstances. |
| 6 | The Taxable-Equivalent Yield represents the yield that must be earned on a fully taxable investment in order to equal the yield of the Fund on an after-tax basis at a specified tax rate. With respect to investments that generate qualified dividend income that is taxable at a maximum rate of 15%, the Taxable-Equivalent Yield is lower. The Taxable-Equivalent Yield is based on the Fund’s 30-Day Yield on the indicated date and a combined federal and state income tax rate of 32.1%. |
Annual Report Page 22
Fund Spotlight as of 5/31/08 Nuveen Ohio Municipal Bond Fund
Bond Credit Quality1,2
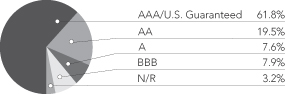
Industries2
Tax Obligation/General | 21.3% | |
U.S. Guaranteed | 20.6% | |
Tax Obligation/Limited | 13.0% | |
Health Care | 9.6% | |
Education and Civic Organizations | 8.0% | |
Utilities | 6.9% | |
Water and Sewer | 6.1% | |
Other | 14.5% |
| 1 | The percentages shown in the foregoing chart may reflect the ratings on certain bonds insured by ACA, AMBAC, CIFG, FGIC, MBIA, RAAI and XLCA as of May 31, 2008. Please see the Portfolio Managers’ Commentary for an expanded discussion of the affect on the Fund of changes to the ratings of certain bonds in the portfolio resulting from changes to the ratings of the underlying insurers both during the period and after period end. |
| 2 | As a percentage of total investments, excluding derivative transactions, as of May 31, 2008. Holdings are subject to change. |
Expense Example (Unaudited)
As a shareholder of the Fund, you incur two types of costs: (1) transaction costs, including front and back end sales charges (loads) or redemption fees, where applicable; and (2) ongoing costs, including management fees; distribution and service (12b-1) fees, where applicable; and other Fund expenses. This Example is intended to help you understand your ongoing costs (in dollars) of investing in the Fund and to compare these costs with the ongoing costs of investing in other mutual funds.
The Example below is based on an investment of $1,000 invested at the beginning of the period and held for the period.
The information under “Actual Performance,” together with the amount you invested, allows you to estimate actual expenses incurred over the reporting period. Simply divide your account value by $1,000 (for example, an $8,600 account value divided by $1,000 = 8.60) and multiply the result by the cost shown for your share class, in the row entitled “Expenses Incurred During Period” to estimate the expenses incurred on your account during this period.
The information under “Hypothetical Performance,” provides information about hypothetical account values and hypothetical expenses based on the Fund’s actual expense ratio and an assumed rate of return of 5% per year before expenses, which is not the Fund’s actual return. The hypothetical account values and expenses may not be used to estimate the actual ending account balance or expense you incurred for the period. You may use this information to compare the ongoing costs of investing in the Fund and other Funds. To do so, compare this 5% hypothetical example with the 5% hypothetical examples that appear in the shareholder reports of the other funds.
Please note that the expenses shown in the table are meant to highlight your ongoing costs only and do not reflect any transactional costs, such as front and back end sales charges (loads) or redemption fees, where applicable. Therefore, the hypothetical information is useful in comparing ongoing costs only, and will not help you determine the relative total costs of owning different funds or share classes. In addition, if these transactional costs were included, your costs would have been higher.
| Hypothetical Performance | ||||||||||||||||||||||||
| Actual Performance | (5% annualized return before expenses) | |||||||||||||||||||||||
| A Shares | B Shares | C Shares | I Shares | A Shares | B Shares | C Shares | I Shares | |||||||||||||||||
Beginning Account Value (12/01/07) | $ | 1,000.00 | $ | 1,000.00 | $ | 1,000.00 | $ | 1,000.00 | $ | 1,000.00 | $ | 1,000.00 | $ | 1,000.00 | $ | 1,000.00 | ||||||||
Ending Account Value (5/31/08) | $ | 1,004.80 | $ | 1,001.00 | $ | 1,002.10 | $ | 1,005.90 | $ | 1,020.71 | $ | 1,016.96 | $ | 1,017.96 | $ | 1,021.71 | ||||||||
Expenses Incurred During Period | $ | 4.30 | $ | 8.05 | $ | 7.05 | $ | 3.30 | $ | 4.34 | $ | 8.11 | $ | 7.11 | $ | 3.33 | ||||||||
For each class of the Fund, expenses are equal to the Fund’s annualized net expense ratio of .86%, 1.61%, 1.41% and ..66% for Classes A, B, C and I, respectively, multiplied by the average account value over the period, multiplied by 183/366 (to reflect the one-half year period).
Annual Report Page 23
Fund Spotlight as of 5/31/08 Nuveen Wisconsin Municipal Bond Fund
| Quick Facts | ||||||||
| A Shares | B Shares1 | C Shares | I Shares1 | |||||
Fund Symbol | FWIAX | FWIBX | FWICX | FWIRX | ||||
NAV | $10.09 | $10.12 | $10.11 | $10.12 | ||||
Latest Monthly Dividend2 | $0.0310 | $0.0250 | $0.0265 | $0.0330 | ||||
Latest Capital Gain and Ordinary Income Distribution3 | $0.0156 | $0.0156 | $0.0156 | $0.0156 | ||||
Inception Date | 6/01/94 | 2/25/97 | 2/25/97 | 2/25/97 |
Returns quoted represent past performance which is no guarantee of future results. Returns without sales charges would be lower if the sales charge were included. Current performance may be higher or lower than the performance shown. Investment returns and principal value will fluctuate so that when shares are redeemed, they may be worth more or less than their original cost. Returns do not reflect the deduction of taxes that a shareholder would pay on Fund distributions or the redemption of shares. Income is generally exempt from regular federal income taxes. Some income may be subject to state and local taxes and to the federal alternative minimum tax. Capital gains, if any, are subject to tax. For the most recent month-end performance visit www.nuveen.com or call (800) 257-8787.
Returns reflect differences in sales charges and expenses, which are primarily differences in distribution and service fees. Class A shares have a 4.2% maximum sales charge. Class A Share purchases of $1 million or more are sold at net asset value without an up-front sales charge but may be subject to a contingent deferred sales charge (CDSC), also known as a back-end sales charge, if redeemed within 18 months of purchase. Class B shares have a CDSC that begins at 5% for redemptions during the first year and declines periodically to 0% over the following five years. Class B shares automatically convert to Class A shares eight years after purchase. Class C shares have a 1% CDSC for redemptions within less than one year, which is not reflected in the one-year total return. Class I shares have no sales charge and may be purchased under limited circumstances or by specified classes of investors. Returns reflect an expense limitation by the Fund’s investment adviser.
| Average Annual Total Returns as of 5/31/08 | ||||
| A Shares | NAV | Offer | ||
1-Year | 2.51% | -1.81% | ||
5-Year | 3.10% | 2.21% | ||
10-Year | 4.18% | 3.74% | ||
| B Shares | w/o CDSC | w/CDSC | ||
1-Year | 1.82% | -2.13% | ||
5-Year | 2.36% | 2.18% | ||
10-Year | 3.56% | 3.56% | ||
| C Shares | NAV | |||
1-Year | 1.96% | |||
5-Year | 2.56% | |||
10-Year | 3.63% | |||
| I Shares | NAV | |||
1-Year | 2.64% | |||
5-Year | 3.31% | |||
10-Year | 4.40% | |||
| Tax-Free Yields | ||||
| A Shares | NAV | Offer | ||
Dividend Yield4 | 3.69% | 3.53% | ||
30-Day Yield4 | 3.48% | — | ||
SEC 30-Day Yield4,5 | — | 3.34% | ||
Taxable-Equivalent Yield5,6 | 5.19% | 4.98% | ||
| B Shares | NAV | |||
Dividend Yield4 | 2.96% | |||
30-Day Yield4 | 2.73% | |||
Taxable-Equivalent Yield6 | 4.07% | |||
| C Shares | NAV | |||
Dividend Yield4 | 3.15% | |||
30-Day Yield4 | 2.93% | |||
Taxable-Equivalent Yield6 | 4.37% | |||
| I Shares | NAV | |||
Dividend Yield4 | 3.91% | |||
SEC 30-Day Yield4 | 3.68% | |||
Taxable-Equivalent Yield6 | 5.48% | |||
| Average Annual Total Returns as of 6/30/08 | ||||
| A Shares | NAV | Offer | ||
1-Year | 2.17% | -2.08% | ||
5-Year | 2.98% | 2.10% | ||
10-Year | 4.04% | 3.60% | ||
| B Shares | w/o CDSC | w/CDSC | ||
1-Year | 1.39% | -2.54% | ||
5-Year | 2.20% | 2.02% | ||
10-Year | 3.43% | 3.43% | ||
| C Shares | NAV | |||
1-Year | 1.62% | |||
5-Year | 2.42% | |||
10-Year | 3.48% | |||
| I Shares | NAV | |||
1-Year | 2.61% | |||
5-Year | 3.17% | |||
10-Year | 4.25% | |||
| Portfolio Statistics | ||
Net Assets ($000) | $60,832 | |
Average Effective Maturity on Securities (Years) | 14.82 | |
Average Duration | 6.49 |
| Expense Ratios | ||||||
| Share Class | Gross Expense Ratios | Net Expense Ratios | As of Date | |||
Class A | 0.90% | 0.87% | 5/31/07 | |||
Class B | 1.65% | 1.62% | 5/31/07 | |||
Class C | 1.45% | 1.42% | 5/31/07 | |||
Class I | 0.69% | 0.66% | 5/31/07 | |||
The expense ratios shown factor in Total Annual Fund Operating Expenses including management fees and other fees and expenses. The Net Expense Ratios reflect a custodian fee credit from the custodian bank whereby certain fees and expenses are reduced by credits earned on the Fund’s cash on deposit with the bank. There is no guarantee that the Fund will earn such credits in the future. Absent the credit, the Net Expense Ratios would be higher and total returns would be less.
| .1 | Effective May 1, 2008 Class B Shares will only be issued upon exchange of Class B Shares from another Nuveen Fund or for purposes of dividend reinvestment. Effective December 31, 2008 the reinstatement privilege for Class B Shares will no longer be available. Effective May 1, 2008, Class R Shares were renamed Class I Shares. See the Fund’s prospectus for more information. |
| 2 | Paid June 2, 2008. This is the latest monthly tax-exempt dividend declared during the period ended May 31, 2008. |
| 3 | Paid December 5, 2007. Capital gains and/or ordinary income are subject to federal taxation. |
| 4 | Dividend Yield is the most recent dividend per share (annualized) divided by the appropriate price per share. The SEC 30-Day Yield is computed under an SEC standardized formula and is based on the maximum offer price per share. The 30-Day Yield is computed under the same formula but is based on the Net Asset Value (NAV) per share. The Dividend Yield may differ from the SEC 30-Day Yield because the Fund may be paying out more or less than it is earning and it may not include the effect of amortization of bond premium. |
| 5 | The SEC 30-Day Yield and Taxable-Equivalent Yield on A Shares at NAV applies only to A Shares purchased at no-load pursuant to the Fund’s policy permitting waiver of the A Share load in certain specified circumstances. |
| 6 | The Taxable-Equivalent Yield represents the yield that must be earned on a fully taxable investment in order to equal the yield of the Fund on an after-tax basis at a specified tax rate. With respect to investments that generate qualified dividend income that is taxable at a maximum rate of 15%, the Taxable-Equivalent Yield is lower. The Taxable-Equivalent Yield is based on the Fund’s 30-Day Yield on the indicated date and a combined federal and state income tax rate of 32.9%. |
Annual Report Page 24
Fund Spotlight as of 5/31/08 Nuveen Wisconsin Municipal Bond Fund
Bond Credit Quality1,2
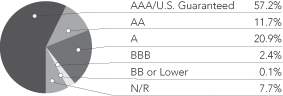
Industries2
Tax Obligation/Limited | 64.8% | |
U.S. Guaranteed | 13.6% | |
Housing/Multifamily | 7.1% | |
Utilities | 7.0% | |
Other | 7.5% |
| 1 | The percentages shown in the foregoing chart may reflect the ratings on certain bonds insured by ACA, AMBAC, CIFG, FGIC, MBIA, RAAI and XLCA as of May 31, 2008. Please see the Portfolio Managers’ Commentary for an expanded discussion of the affect on the Fund of changes to the ratings of certain bonds in the portfolio resulting from changes to the ratings of the underlying insurers both during the period and after period end. |
| 2 | As a percentage of total investments as of May 31, 2008. Holdings are subject to change. |
Expense Example (Unaudited)
As a shareholder of the Fund, you incur two types of costs: (1) transaction costs, including front and back end sales charges (loads) or redemption fees, where applicable; and (2) ongoing costs, including management fees; distribution and service (12b-1) fees, where applicable; and other Fund expenses. This Example is intended to help you understand your ongoing costs (in dollars) of investing in the Fund and to compare these costs with the ongoing costs of investing in other mutual funds.
The Example below is based on an investment of $1,000 invested at the beginning of the period and held for the period.
The information under “Actual Performance,” together with the amount you invested, allows you to estimate actual expenses incurred over the reporting period. Simply divide your account value by $1,000 (for example, an $8,600 account value divided by $1,000 = 8.60) and multiply the result by the cost shown for your share class, in the row entitled “Expenses Incurred During Period” to estimate the expenses incurred on your account during this period.
The information under “Hypothetical Performance,” provides information about hypothetical account values and hypothetical expenses based on the Fund’s actual expense ratio and an assumed rate of return of 5% per year before expenses, which is not the Fund’s actual return. The hypothetical account values and expenses may not be used to estimate the actual ending account balance or expense you incurred for the period. You may use this information to compare the ongoing costs of investing in the Fund and other Funds. To do so, compare this 5% hypothetical example with the 5% hypothetical examples that appear in the shareholder reports of the other funds.
Please note that the expenses shown in the table are meant to highlight your ongoing costs only and do not reflect any transactional costs, such as front and back end sales charges (loads) or redemption fees, where applicable. Therefore, the hypothetical information is useful in comparing ongoing costs only, and will not help you determine the relative total costs of owning different funds or share classes. In addition, if these transactional costs were included, your costs would have been higher.
| Hypothetical Performance | ||||||||||||||||||||||||
| Actual Performance | (5% annualized return before expenses) | |||||||||||||||||||||||
| A Shares | B Shares | C Shares | I Shares | A Shares | B Shares | C Shares | I Shares | |||||||||||||||||
Beginning Account Value (12/01/07) | $ | 1,000.00 | $ | 1,000.00 | $ | 1,000.00 | $ | 1,000.00 | $ | 1,000.00 | $ | 1,000.00 | $ | 1,000.00 | $ | 1,000.00 | ||||||||
Ending Account Value (5/31/08) | $ | 1,007.60 | $ | 1,004.70 | $ | 1,005.90 | $ | 1,008.80 | $ | 1,020.75 | $ | 1,017.00 | $ | 1,018.00 | $ | 1,021.75 | ||||||||
Expenses Incurred During Period | $ | 4.27 | $ | 8.02 | $ | 7.02 | $ | 3.26 | $ | 4.29 | $ | 8.07 | $ | 7.06 | $ | 3.29 | ||||||||
For each class of the Fund, expenses are equal to the Fund’s annualized net expense ratio of .85%, 1.60%, 1.40% and ..65% for Classes A, B, C and I, respectively, multiplied by the average account value over the period, multiplied by 183/366 (to reflect the one-half year period).
Annual Report Page 25
Portfolio of Investments
Nuveen Kansas Municipal Bond Fund
May 31, 2008
| Principal Amount (000) | Description (1) | Optional Call Provisions (2) | Ratings (3) | Value | ||||||
| Education and Civic Organizations – 1.8% | ||||||||||
| $ | 1,000 | Kansas Development Finance Authority, Athletic Facility Revenue Bonds, University of Kansas Athletic Corporation Project, Series 2004K, 5.000%, 6/01/19 | 6/14 at 100.00 | A1 | $ | 1,039,480 | ||||
| 1,200 | Kansas Development Finance Authority, Board of Regents, Revenue Bonds, Kansas State University Housing System, Series 2005A, 5.000%, 4/01/22 – MBIA Insured | 4/15 at 100.00 | AAA | 1,255,740 | ||||||
| 2,200 | Total Education and Civic Organizations | 2,295,220 | ||||||||
| Health Care – 23.5% | ||||||||||
| 1,005 | Coffeyville Public Building Commission, Kansas, Healthcare Facilities Revenue Bonds, Coffeyville Regional Medical Center, Series 2002, 5.000%, 8/01/18 – AMBAC Insured | 8/12 at 100.00 | AAA | 1,035,904 | ||||||
| 2,000 | Colby, Kansas, Health Facilities Revenue Refunding Bonds, Citizens Medical Center Inc., Series 1998, 5.625%, 8/15/16 | 8/08 at 100.00 | N/R | 1,884,360 | ||||||
| 1,680 | Kansas Development Finance Authority, Health Facilities Revenue Bonds, Hays Medical Center Inc., Series 2005L, 5.000%, 11/15/20 | 11/15 at 100.00 | A2 | 1,707,670 | ||||||
| 4,580 | Kansas Development Finance Authority, Health Facilities Revenue Bonds, Sisters of Charity of Leavenworth Health Services Corporation, Series 2000K, 6.500%, 12/01/16 | 6/10 at 101.00 | AA | 4,940,950 | ||||||
| 2,000 | Kansas Development Finance Authority, Health Facilities Revenue Bonds, Stormont-Vail Health Care Inc., Series 2007L, 4.750%, 11/15/36 – MBIA Insured | 11/17 at 100.00 | Aaa | 1,930,360 | ||||||
| 2,000 | Kansas Development Finance Authority, Health Facilities Revenue Bonds, Stormont-Vail Health Care Inc., Series 2008F, 5.375%, 11/15/28 | 11/17 at 100.00 | A2 | 2,019,140 | ||||||
| 1,285 | Kansas Development Finance Authority, Hospital Revenue Bonds, Susan B. Allen Memorial Hospital, Series 2002Q, 5.375%, 12/15/16 – RAAI Insured | 12/12 at 100.00 | AA | 1,331,440 | ||||||
| 1,750 | Labette County Medical Center, Kansas, Revenue Bonds, Series 2007A, 5.750%, 9/01/37 | 9/17 at 100.00 | N/R | 1,671,303 | ||||||
| 1,000 | Lawrence, Kansas, Hospital Revenue Bonds, Lawrence Memorial Hospital, Series 2006, 5.125%, 7/01/26 | 7/16 at 100.00 | A3 | 1,011,830 | ||||||
| 1,075 | Manhattan, Kansas, Hospital Revenue Bonds, Mercy Health Center, Series 2001, 5.000%, 8/15/15 – | 8/11 at 100.00 | AAA | 1,116,957 | ||||||
| Newton, Kansas, Hospital Revenue Refunding Bonds, Newton Healthcare Corporation, Series 1998A: | ||||||||||
| 1,000 | 5.700%, 11/15/18 | 11/08 at 100.00 | N/R | 994,140 | ||||||
| 1,750 | 5.750%, 11/15/24 | 11/08 at 100.00 | N/R | 1,656,480 | ||||||
| 100 | Puerto Rico Industrial, Tourist, Educational, Medical and Environmental Control Facilities Financing Authority, Hospital Revenue Bonds, Auxilio Mutuo Hospital, Series 1995A, 6.250%, 7/01/24 – | 7/08 at 100.00 | AAA | 100,848 | ||||||
| 3,000 | University of Kansas Hospital Authority, Health Facilities Revenue Bonds, KU Health System, Series 2006, 5.000%, 9/01/36 | 9/16 at 100.00 | A | 2,864,460 | ||||||
| 4,780 | Wichita, Kansas, Hospital Facilities Revenue Refunding and Improvement Bonds, Via Christi Health System Inc., Series 1999-XI, 6.250%, 11/15/24 | 11/09 at 101.00 | A+ | 4,964,843 | ||||||
| 29,005 | Total Health Care | 29,230,685 | ||||||||
| Housing/Multifamily – 2.9% | ||||||||||
| Wichita, Kansas, Multifamily Housing Revenue Refunding Bonds, Shores Apartments, Series 1994XI-A: | ||||||||||
| 1,500 | 6.700%, 4/01/19 – RAAI Insured | 4/09 at 102.00 | AA | 1,546,215 | ||||||
| 2,000 | 6.800%, 4/01/24 – RAAI Insured | 4/09 at 102.00 | AA | 2,059,480 | ||||||
| 3,500 | Total Housing/Multifamily | 3,605,695 | ||||||||
| Housing/Single Family – 19.5% | ||||||||||
| 130 | Sedgwick and Shawnee Counties, Kansas, FNMA/GNMA Mortgage-Backed Securities Program Single Family Revenue Bonds, Series 2001A, 6.300%, 12/01/32 (Alternative Minimum Tax) | 12/10 at 105.00 | Aaa | 131,968 | ||||||
| 3,135 | Sedgwick and Shawnee Counties, Kansas, FNMA/GNMA Mortgage-Backed Securities Program Single Family Revenue Bonds, Series 2002B-1, 5.950%, 12/01/33 (Alternative Minimum Tax) | 12/12 at 105.00 | Aaa | 3,268,645 | ||||||
| 2,965 | Sedgwick and Shawnee Counties, Kansas, FNMA/GNMA Mortgage-Backed Securities Program Single Family Revenue Bonds, Series 2005A, 5.550%, 6/01/37 (Alternative Minimum Tax) | 6/15 at 105.00 | Aaa | 2,949,315 | ||||||
26
| Principal Amount (000) | Description (1) | Optional Call Provisions (2) | Ratings (3) | Value | ||||||
| Housing/Single Family (continued) | ||||||||||
| $ | 170 | Sedgwick and Shawnee Counties, Kansas, GNMA Mortgage-Backed Securities Program Single Family Revenue Bonds, Series 1997A-1, 6.950%, 6/01/29 (Alternative Minimum Tax) | No Opt. Call | Aaa | $ | 179,624 | ||||
| 165 | Sedgwick and Shawnee Counties, Kansas, GNMA Mortgage-Backed Securities Program Single Family Revenue Bonds, Series 2000A-2, 7.600%, 12/01/31 – MBIA Insured (Alternative Minimum Tax) | 12/09 at 105.00 | Aaa | 168,234 | ||||||
| 4,880 | Sedgwick and Shawnee Counties, Kansas, Mortgage Backed Securities Program Single Family Mortgage Revenue Bonds, Series 2006A1, 5.500%, 12/01/38 (Alternative Minimum Tax) | 12/16 at 104.00 | Aaa | 4,827,296 | ||||||
| 4,945 | Sedgwick and Shawnee Counties, Kansas, Mortgage Backed Securities Program Single Family Mortgage Revenue Bonds, Series 2006A6, 5.550%, 6/01/38 (Alternative Minimum Tax) | 6/16 at 103.00 | Aaa | 4,962,209 | ||||||
| 3,885 | Sedgwick and Shawnee Counties, Kansas, Mortgage Backed Securities Program Single Family Mortgage Revenue Bonds, Series 2006B1, 5.300%, 12/01/38 (Alternative Minimum Tax) | 6/16 at 103.00 | Aaa | 3,807,844 | ||||||
| 3,965 | Sedgwick and Shawnee Counties, Kansas, Mortgage Backed Securities Program Single Family Mortgage Revenue Bonds, Series 2007B4, 5.550%, 12/01/38 (Alternative Minimum Tax) | 12/16 at 104.00 | Aaa | 3,972,097 | ||||||
| 24,240 | Total Housing/Single Family | 24,267,232 | ||||||||
| Industrials – 1.6% | ||||||||||
| 1,025 | Wichita Airport Authority, Kansas, Special Facilities Revenue Bonds, Cessna Citation Service Center, Series 2002A, 6.250%, 6/15/32 (Alternative Minimum Tax) | 6/12 at 101.00 | A– | 1,031,335 | ||||||
| 1,000 | Wichita, Kansas, Industrial Revenue Bonds, NMF America Inc. Series 2000-II, 5.800%, 8/01/15 (Alternative Minimum Tax) | 8/08 at 100.50 | AA | 1,011,080 | ||||||
| 2,025 | Total Industrials | 2,042,415 | ||||||||
| Long-Term Care – 1.0% | ||||||||||
| 980 | Manhattan Health Care Facility Revenue Bonds, Kansas, Meadowlarks Hills Retirement, Series 2007B, 5.125%, 5/15/42 | 5/14 at 103.00 | N/R | 794,584 | ||||||
| 500 | Sedgwick County, Kansas, Healthcare Facilities Revenue Bonds, Catholic Care Center Inc., Series 2001, 5.750%, 11/15/23 | 11/09 at 100.00 | A | 506,565 | ||||||
| 1,480 | Total Long-Term Care | 1,301,149 | ||||||||
| Materials – 3.0% | ||||||||||
| 3,700 | Ford County, Kansas, Sewage and Solid Waste Disposal Revenue Bonds, Excel Corporation/Cargill Inc. Project, Series 1998, 5.400%, 6/01/28 (Alternative Minimum Tax) | 6/08 at 102.00 | A | 3,733,485 | ||||||
| Tax Obligation/General – 8.2% | ||||||||||
| 2,500 | Butler and Sedgwick Counties Unified School District 385, Andover, Kansas, General Obligation Refunding and Improvement Bonds, Series 2000, 6.000%, 9/01/16 – FSA Insured | No Opt. Call | AAA | 2,926,100 | ||||||
| 65 | Cowley County Unified School District 465, Winfield, Kansas, General Obligation Bonds, Series 2003, 5.250%, 10/01/23 – MBIA Insured | 10/13 at 100.00 | AAA | 68,802 | ||||||
| 1,500 | Douglas County Unified School District 497, Kansas, General Obligation Bonds, Series 2006A, 5.000%, 9/01/25 – MBIA Insured | 9/16 at 100.00 | Aaa | 1,569,015 | ||||||
| 1,100 | Montgomery County Unified School District 445, Coffeyville, Kansas, General Obligation Bonds, Series 2002, 5.000%, 4/01/22 – FGIC Insured | 4/12 at 100.00 | Baa3 | 1,125,729 | ||||||
| Puerto Rico, General Obligation and Public Improvement Bonds, Series 2001A: | ||||||||||
| 1,000 | 5.500%, 7/01/20 – MBIA Insured | No Opt. Call | AAA | 1,070,700 | ||||||
| 330 | 5.375%, 7/01/28 | 7/11 at 100.00 | BBB– | 331,145 | ||||||
| 1,250 | Sedgwick County Unified School District 259, Wichita, Kansas, General Obligation Bonds, Series 2000, 3.500%, 9/01/16 | 9/10 at 100.00 | AA | 1,246,050 | ||||||
| 1,795 | Wichita, Kansas, General Obligation Bonds, Series 2002, 5.000%, 4/01/17 | 4/09 at 101.00 | AA | 1,846,247 | ||||||
| 9,540 | Total Tax Obligation/General | 10,183,788 | ||||||||
| Tax Obligation/Limited – 26.2% | ||||||||||
| 3,000 | Butler County Public Building Commission, Kansas, Improvement Revenue Bonds, Public Facilities Projects, Series 2000, 5.550%, 10/01/21 – MBIA Insured | 10/10 at 100.00 | Aaa | 3,199,920 | ||||||
27
Portfolio of Investments
Nuveen Kansas Municipal Bond Fund (continued)
May 31, 2008
| Principal Amount (000) | Description (1) | Optional Call Provisions (2) | Ratings (3) | Value | |||||||
| Tax Obligation/Limited (continued) | |||||||||||
| Kansas Department of Transportation, Highway Revenue Bonds, Series 2004A: | |||||||||||
| $ | 1,000 | 5.000%, 3/01/20 | 3/14 at 100.00 | AAA | $ | 1,059,680 | |||||
| 5,000 | 5.000%, 3/01/23 | 3/14 at 100.00 | AAA | 5,215,200 | |||||||
| 5,000 | Kansas Development Finance Authority, Board of Regents, Revenue Bonds, Scientific Research and Development Facilities Projects, Series 2003C, 5.000%, 10/01/23 – AMBAC Insured | 4/13 at 102.00 | AAA | 5,248,200 | |||||||
| 500 | Kansas Development Finance Authority, Lease Revenue Bonds, Department of Administration, State Capitol Restoration Parking Facility Project, Series 2002C, 5.000%, 10/01/21 – FSA Insured | 10/12 at 100.00 | AAA | 524,325 | |||||||
| 1,140 | Kansas Development Finance Authority, Lease Revenue Bonds, Department of Administration, State Capitol Restoration Project, Series 2004G-1, 5.125%, 4/01/21 – MBIA Insured | 4/14 at 100.00 | AAA | 1,211,774 | |||||||
| 3,900 | Kansas Development Finance Authority, Revenue Bonds, Department of Administration, Comprehensive Transportation Program, Series 2006A, 5.000%, 11/01/23 – FGIC Insured | 11/16 at 100.00 | AA | 4,074,174 | |||||||
| 1,000 | Kansas Development Finance Authority, Revenue Bonds, State Projects, Series 2001W, | 10/11 at 100.00 | AAA | 1,048,500 | |||||||
| 2,355 | Kansas Development Finance Authority, Revenue Bonds, State Projects, Series 2003J, | 8/13 at 100.00 | AAA | 2,499,573 | |||||||
| 1,155 | Kansas Development Finance Authority, Revenue Bonds, State Projects, Series 2004A, | 4/14 at 101.00 | AA | 1,210,047 | |||||||
| 5,000 | Overland Park Development Corporation, Kansas, First Tier Revenue Bonds, Overland Park Convention Center, Series 2007A, 5.250%, 1/01/32 – AMBAC Insured | 1/17 at 100.00 | AAA | 5,110,700 | |||||||
| 2,000 | Virgin Islands Public Finance Authority, Gross Receipts Taxes Loan Note, Series 1999A, 6.375%, 10/01/19 | 10/10 at 101.00 | BBB+ | 2,127,640 | |||||||
| 31,050 | Total Tax Obligation/Limited | 32,529,733 | |||||||||
| U.S. Guaranteed – 2.6% (4) | |||||||||||
| 1,800 | Overland Park Development Corporation, Kansas, First Tier Revenue Bonds, Overland Park Convention Center, Series 2001A, 7.375%, 1/01/32 (Pre-refunded 1/01/11) | 1/11 at 101.00 | N/R | (4) | 2,017,008 | ||||||
| 1,010 | Wichita, Kansas, Revenue Bonds, CSJ Health System of Wichita, Inc., Series 1985-XXV, 7.200%, 10/01/15 (ETM) | 8/08 at 100.00 | A+ | (4) | 1,194,527 | ||||||
| 2,810 | Total U.S. Guaranteed | 3,211,535 | |||||||||
| Utilities – 1.7% | |||||||||||
| 1,000 | Wyandotte County-Kansas City Unified Government, Kansas, Utility System Revenue Bonds, Series 2004B, 5.000%, 9/01/24 – FSA Insured | 9/14 at 100.00 | AAA | 1,036,850 | |||||||
| 1,000 | Wynadotte County-Kansas City Unified Government, Kansas, Industrial Revenue Bonds, Board of Public Utilities Office Building Complex, Series 2001, 5.000%, 5/01/21 – MBIA Insured | 5/11 at 100.00 | AAA | 1,030,430 | |||||||
| 2,000 | Total Utilities | 2,067,280 | |||||||||
| Water and Sewer – 6.5% | |||||||||||
| 2,300 | Kansas Development Finance Authority, Water Pollution Control Revolving Fund Leveraged Bonds, Series 2002-II, 5.000%, 11/01/23 | 11/12 at 100.00 | AAA | 2,402,672 | |||||||
| 5,500 | Wichita, Kansas, Water and Sewerage Utility Revenue Bonds, Series 2003, 5.000%, 10/01/22 – FGIC Insured | 10/13 at 100.00 | A1 | 5,684,194 | |||||||
| 7,800 | Total Water and Sewer | 8,086,866 | |||||||||
| $ | 119,350 | Total Investments (cost $121,505,174) – 98.5% | 122,555,083 | ||||||||
Other Assets Less Liabilities – 1.5% | 1,808,334 | ||||||||||
Net Assets – 100% | $ | 124,363,417 | |||||||||
28
| (1) | All percentages shown in the Portfolio of Investments are based on net assets. |
| (2) | Optional Call Provisions (not covered by the report of independent registered public accounting firm): Dates (month and year) and prices of the earliest optional call or redemption. There may be other call provisions at varying prices at later dates. Certain mortgage-backed securities may be subject to periodic principal paydowns. |
| (3) | Ratings (not covered by the report of independent registered public accounting firm): Using the higher of Standard & Poor’s Group (“Standard & Poor’s”) or Moody’s Investor Service, Inc. (“Moody’s”) rating. Ratings below BBB by Standard & Poor’s or Baa by Moody’s are considered to be below investment grade. |
| The Portfolio of Investments may reflect the ratings on certain bonds insured by ACA, AMBAC, CIFG, FGIC, MBIA, RAAI and XLCA as of May 31, 2008. Please see the Portfolio Managers’ Commentary for an expanded discussion of the affect on the Fund of changes to the ratings of certain bonds in the portfolio resulting from changes to the ratings of the underlying insurers both during the period and after period end. |
| (4) | Backed by an escrow or trust containing sufficient U.S. Government or U.S. Government agency securities which ensure the timely payment of principal and interest. Such investments are normally considered to be equivalent to AAA rated securities. |
| N/R | Not rated. |
| (ETM) | Escrowed to maturity. |
See accompanying notes to financial statements.
29
Portfolio of Investments
Nuveen Kentucky Municipal Bond Fund
May 31, 2008
| Principal Amount (000) | Description (1) | Optional Call Provisions (2) | Ratings (3) | Value | ||||||
| Consumer Staples – 1.0% | ||||||||||
| $ | 4,535 | Puerto Rico, The Children’s Trust Fund, Tobacco Settlement Asset-Backed Refunding Bonds, Series 2002, 5.375%, 5/15/33 | 5/12 at 100.00 | BBB | $ | 4,322,490 | ||||
| Education and Civic Organizations – 5.3% | ||||||||||
| 1,000 | Campbellsville, Kentucky, Revenue Bonds, Campbellsville University, Series 2005, 5.700%, 3/01/34 | 3/15 at 100.00 | N/R | 994,020 | ||||||
| 5,970 | Columbia, Kentucky, Educational Development Revenue Bonds, Lindsey Wilson College Project, Series 2001, 6.250%, 4/01/21 | 4/11 at 101.00 | BBB– | 6,151,787 | ||||||
| 1,000 | Kentucky Asset/Liability Commission, General Receipts Revenue Bonds, University of Kentucky, Series 2005, 5.000%, 10/01/16 – FGIC Insured | 10/15 at 100.00 | AA– | 1,065,080 | ||||||
| Kentucky Asset/Liability Commission, General Receipts Revenue Bonds, University of Kentucky, Series 2007A: | ||||||||||
| 1,345 | 5.000%, 10/01/20 – AMBAC Insured | 10/17 at 100.00 | AAA | 1,440,414 | ||||||
| 2,675 | 5.000%, 10/01/21 – AMBAC Insured | 10/17 at 100.00 | AAA | 2,843,605 | ||||||
| 4,435 | 5.000%, 10/01/22 – AMBAC Insured | 10/17 at 100.00 | AAA | 4,688,904 | ||||||
| 2,500 | Puerto Rico Industrial, Tourist, Educational, Medical and Environmental Control Facilities Financing Authority, Higher Education Revenue Bonds, Ana G. Mendez University System, Series 1999, 5.375%, 2/01/29 | 2/09 at 101.00 | BBB– | 2,391,625 | ||||||
| 3,000 | Puerto Rico Industrial, Tourist, Educational, Medical and Environmental Control Facilities Financing Authority, Higher Education Revenue Bonds, University of the Sacred Heart, Series 2001, 5.250%, 9/01/31 | 9/11 at 100.00 | BBB | 2,854,800 | ||||||
| 21,925 | Total Education and Civic Organizations | 22,430,235 | ||||||||
| Health Care – 11.0% | ||||||||||
| 3,260 | Clark County, Kentucky, Hospital Revenue Refunding and Improvement Bonds, Clark Regional Medical Center Project, Series 1997, 6.200%, 4/01/13 | 9/08 at 101.00 | BBB– | 3,296,447 | ||||||
| 8,880 | Kentucky Economic Development Finance Authority, Health System Revenue Bonds, Norton Healthcare Inc., Series 2000B, 0.000%, 10/01/28 – MBIA Insured | No Opt. Call | AAA | 2,899,675 | ||||||
| 9,500 | Kentucky Economic Development Finance Authority, Hospital Revenue Refunding Bonds, Pikeville, United Methodist Hospital of Kentucky Inc. Project, Series 1997, 5.700%, 2/01/28 – CONNIE LEE Insured | 8/08 at 101.00 | AAA | 9,608,395 | ||||||
| Kentucky Economic Development Finance Authority, Hospital System Revenue Refunding and Improvement Bonds, Appalachian Regional Healthcare Inc., Series 1997: | ||||||||||
| 500 | 5.600%, 10/01/08 | 8/08 at 102.00 | BB– | 499,655 | ||||||
| 3,500 | 5.850%, 10/01/17 | 10/08 at 102.00 | BB– | 3,405,360 | ||||||
| 1,500 | 5.875%, 10/01/22 | 10/08 at 102.00 | BB– | 1,413,270 | ||||||
| 6,000 | Murray Hospital Facilities, Kentucky, Revenue Bonds, Murray-Calloway County Public Hospital, Series 2007, 5.125%, 8/01/37 | 8/17 at 100.00 | Baa1 | 5,363,520 | ||||||
| 2,195 | Rockcastle County, Kentucky, First Mortgage Revenue Bonds, Rockcastle Hospital and Respiratory Care Center Inc. Project, Series 2005, 5.550%, 6/01/30 | 6/15 at 100.00 | BBB– | 2,104,654 | ||||||
| 16,500 | Russell, Kentucky, Revenue Bonds, Bon Secours Health System, Series 2002A, 5.625%, 11/15/30 | 11/12 at 100.00 | A– | 16,729,680 | ||||||
| 1,000 | Warren County, Kentucky, Hospital Facilities Revenue Bonds, Community Hospital, Series 2007A, 5.000%, 8/01/29 | 8/17 at 100.00 | BBB+ | 933,100 | ||||||
| 52,835 | Total Health Care | 46,253,756 | ||||||||
| Housing/Multifamily – 0.7% | ||||||||||
| 3,130 | Henderson, Kentucky, Senior Tax-Exempt Residential Facilities Revenue Bonds, Pleasant Pointe Project, Series 1999A, 6.125%, 5/01/29 | 5/09 at 102.00 | N/R | 3,033,064 | ||||||
| Housing/Single Family – 3.6% | ||||||||||
| 375 | Kentucky Housing Corporation, Housing Revenue Bonds, Series 1998F, 5.000%, 7/01/18 (Alternative Minimum Tax) | 1/09 at 101.00 | AAA | 380,936 | ||||||
| 9,480 | Kentucky Housing Corporation, Housing Revenue Bonds, Series 1999A, 5.200%, 1/01/31 | 4/09 at 101.00 | AAA | 9,523,892 | ||||||
30
| Principal Amount (000) | Description (1) | Optional Call Provisions (2) | Ratings (3) | Value | ||||||
| Housing/Single Family (continued) | ||||||||||
| $ | 395 | Kentucky Housing Corporation, Housing Revenue Bonds, Series 1999B, 5.250%, 1/01/28 (Alternative Minimum Tax) | 4/09 at 101.00 | AAA | $ | 391,169 | ||||
| 3,310 | Kentucky Housing Corporation, Housing Revenue Bonds, Series 2004F, 3.900%, 7/01/31 (Alternative Minimum Tax) | 1/14 at 100.00 | AAA | 3,302,917 | ||||||
| 1,760 | Kentucky Housing Corporation, Housing Revenue Bonds, Series 2005H, 4.000%, 1/01/33 (Alternative Minimum Tax) | 7/14 at 100.00 | AAA | 1,691,149 | ||||||
| 15,320 | Total Housing/Single Family | 15,290,063 | ||||||||
| Long-Term Care – 1.6% | ||||||||||
| 4,840 | Florence, Kentucky, Housing Facilities Revenue Bonds, Bluegrass RHF Housing Inc., Series 1999, 6.375%, 8/15/29 – ACA Insured | 8/09 at 101.00 | N/R | 4,855,391 | ||||||
| 2,000 | Kentucky Economic Development Finance Authority, Multifamily Housing Revenue Bonds, Christian Care Communities Projects, Series 2005, 5.250%, 11/20/25 | 11/15 at 103.00 | AAA | 2,083,400 | ||||||
| 6,840 | Total Long-Term Care | 6,938,791 | ||||||||
| Materials – 0.7% | ||||||||||
| 2,820 | Wickliffe, Kentucky, Solid Waste Disposal Facility Revenue Bonds, Westvaco Corporation, Series 1996, 6.375%, 4/01/26 (Alternative Minimum Tax) | 10/08 at 100.00 | BBB | 2,790,108 | ||||||
| Tax Obligation/General – 9.0% | ||||||||||
| Bowling Green, Kentucky, General Obligation and Special Revenue Bonds, Series 2002B: | ||||||||||
| 1,785 | 5.000%, 6/01/23 | 6/12 at 100.00 | Aa2 | 1,856,454 | ||||||
| 1,230 | 5.000%, 6/01/24 | 6/12 at 100.00 | Aa2 | 1,278,167 | ||||||
| 1,700 | 5.000%, 6/01/25 | 6/12 at 100.00 | Aa2 | 1,757,086 | ||||||
| Crittenden County, Kentucky, General Obligation Bonds, Series 2007: | ||||||||||
| 1,085 | 6.000%, 12/01/27 | 12/17 at 100.00 | N/R | 1,141,290 | ||||||
| 1,605 | 6.250%, 12/01/32 | 12/17 at 100.00 | N/R | 1,712,005 | ||||||
| 2,190 | 6.500%, 12/01/37 | 12/17 at 100.00 | N/R | 2,370,631 | ||||||
| 2,500 | Jefferson County, Kentucky, General Obligation Refunding Bonds, Series 1999C, 6.150%, 5/15/16 (Alternative Minimum Tax) | 5/09 at 100.00 | AA+ | 2,554,725 | ||||||
| Louisville and Jefferson County Metropolitan Government, Kentucky, General Obligation Bonds, Series 2004A-B: | ||||||||||
| 1,195 | 5.000%, 11/01/16 – AMBAC Insured | 11/14 at 100.00 | AAA | 1,292,440 | ||||||
| 1,000 | 5.000%, 11/01/17 – AMBAC Insured | 11/14 at 100.00 | AAA | 1,075,840 | ||||||
| 1,175 | Louisville, Kentucky, General Obligation Bonds, Series 2001A, 5.000%, 11/01/21 | 11/11 at 101.00 | AA+ | 1,232,187 | ||||||
| 3,000 | Louisville, Kentucky, General Obligation Bonds, Series 2002A, 5.000%, 10/01/23 – FGIC Insured | 10/12 at 100.00 | AA+ | 3,101,040 | ||||||
| 5,000 | Puerto Rico, General Obligation Bonds, Series 2004A, 5.250%, 7/01/21 – MBIA Insured | 7/14 at 100.00 | AAA | 5,325,050 | ||||||
| Puerto Rico, General Obligation and Public Improvement Bonds, Series 2001A: | ||||||||||
| 840 | 5.500%, 7/01/14 – FSA Insured (UB) | No Opt. Call | AAA | 921,211 | ||||||
| 2,550 | 5.500%, 7/01/16 – FSA Insured (UB) | No Opt. Call | AAA | 2,830,526 | ||||||
| 3,000 | 5.500%, 7/01/17 – FSA Insured (UB) | No Opt. Call | AAA | 3,332,670 | ||||||
| 3,440 | 5.500%, 7/01/18 – FSA Insured (UB) | No Opt. Call | AAA | 3,829,958 | ||||||
| 2,250 | 5.500%, 7/01/19 – FSA Insured (UB) | No Opt. Call | AAA | 2,503,890 | ||||||
| 35,545 | Total Tax Obligation/General | 38,115,170 | ||||||||
| Tax Obligation/Limited – 25.1% | ||||||||||
| 1,305 | Ballard County School District Finance Corporation, Kentucky, School Building Revenue Bonds, Series 2004, 5.000%, 6/01/21 – AMBAC Insured | 6/14 at 100.00 | Aaa | 1,364,247 | ||||||
| Boone County School District Finance Corporation, Kentucky, School Building Revenue Bonds, Series 2004B: | ||||||||||
| 1,460 | 5.000%, 5/01/20 – FSA Insured | 5/14 at 100.00 | Aaa | 1,546,651 | ||||||
| 2,580 | 5.000%, 5/01/21 – FSA Insured | 5/14 at 100.00 | Aaa | 2,717,204 | ||||||
| 1,465 | Boone County, Kentucky, Public Properties Corporation, First Mortgage Bonds, AOC Judicial Facility, Series 2001, 5.125%, 9/01/22 | 9/12 at 101.00 | Aa3 | 1,554,321 | ||||||
31
Portfolio of Investments
Nuveen Kentucky Municipal Bond Fund (continued)
May 31, 2008
| Principal Amount (000) | Description (1) | Optional Call Provisions (2) | Ratings (3) | Value | ||||||
| Tax Obligation/Limited (continued) | ||||||||||
| Butler County School District Finance Corporation, Kentucky, Revenue Bonds, School Buildings, Series 2004C: | ||||||||||
| $ | 1,220 | 5.000%, 6/01/20 | 6/14 at 100.00 | Aa3 | $ | 1,273,021 | ||||
| 1,255 | 5.000%, 6/01/22 | 6/14 at 100.00 | Aa3 | 1,297,017 | ||||||
| Kenton County School District Finance Corporation, Kentucky, School Building Revenue Bonds, Series 2004: | ||||||||||
| 2,115 | 5.000%, 6/01/17 – MBIA Insured | 6/14 at 100.00 | Aaa | 2,268,020 | ||||||
| 3,510 | 5.000%, 6/01/18 – MBIA Insured | 6/14 at 100.00 | Aaa | 3,743,871 | ||||||
| 3,690 | 5.000%, 6/01/19 – MBIA Insured | 6/14 at 100.00 | Aaa | 3,907,378 | ||||||
| Kentucky Area Development Districts Financing Trust, Ewing, Lease Acquisition Program Revenue Bonds, Series 2000C: | ||||||||||
| 750 | 5.850%, 6/01/20 | 6/10 at 102.00 | N/R | 768,090 | ||||||
| 1,000 | 6.000%, 6/01/30 | 6/10 at 102.00 | N/R | 1,006,170 | ||||||
| 2,000 | Kentucky Asset/Liability Commission, General Fund Revenue Project Notes, First Series 2005, 5.000%, 5/01/25 – MBIA Insured | 5/15 at 100.00 | AAA | 2,051,640 | ||||||
| 2,365 | Kentucky Local Correctional Facilities Authority, Multi-County Lease Revenue Bonds, Series 2004, 5.250%, 11/01/14 – MBIA Insured | No Opt. Call | AAA | 2,579,458 | ||||||
| Kentucky State Property and Buildings Commission, Revenue Bonds, Project 81, Series 2003: | ||||||||||
| 1,000 | 5.000%, 11/01/19 – AMBAC Insured | 11/13 at 100.00 | AAA | 1,038,780 | ||||||
| 2,845 | 5.000%, 11/01/23 – AMBAC Insured | 11/13 at 100.00 | AAA | 2,915,385 | ||||||
| 2,000 | Kentucky State Property and Buildings Commission, Revenue Bonds, Project 84, Series 2005, 5.000%, 8/01/18 – MBIA Insured | No Opt. Call | AAA | 2,167,560 | ||||||
| 5,000 | Kentucky State Property and Buildings Commission, Revenue Bonds, Project 85, Series 2005, 5.000%, 8/01/15 – FSA Insured | No Opt. Call | AAA | 5,495,950 | ||||||
| 10,000 | Kentucky Turnpike Authority, Economic Development Road Revenue Bonds, Revitalization Project, Series 2005B, 5.000%, 7/01/23 – AMBAC Insured | 7/15 at 100.00 | AAA | 10,410,900 | ||||||
| Kentucky Turnpike Authority, Economic Development Road Revenue Bonds, Revitalization Project, Series 2006B: | ||||||||||
| 5,095 | 5.000%, 7/01/15 – AMBAC Insured | No Opt. Call | AAA | 5,580,859 | ||||||
| 5,000 | 5.000%, 7/01/24 – AMBAC Insured | 7/16 at 100.00 | AAA | 5,215,900 | ||||||
| 4,000 | Kentucky Turnpike Authority, Economic Development Road Revenue Refunding Bonds, Revitalization Project, Series 2001B, 5.150%, 7/01/19 – FSA Insured | 7/11 at 100.00 | AAA | 4,192,680 | ||||||
| 2,060 | Laurel County, Kentucky, School District Finance Corporation, School Building Revenue Bonds, Series 2007, 5.000%, 6/01/27 – FSA Insured | 6/17 at 100.00 | Aaa | 2,146,396 | ||||||
| Letcher County School District Finance Corporation, Kentucky, School Building Revenue Bonds, Series 2004: | �� | |||||||||
| 1,430 | 5.000%, 6/01/18 – FSA Insured | 6/14 at 100.00 | Aaa | 1,531,630 | ||||||
| 1,585 | 5.000%, 6/01/20 – FSA Insured | 6/14 at 100.00 | Aaa | 1,679,514 | ||||||
| 1,695 | Louisville and Jefferson County Visitors and Convention Commission, Kentucky, Dedicated Tax Revenue Bonds, Series 2004A, 5.000%, 12/01/15 – FSA Insured | 6/14 at 101.00 | AAA | 1,849,872 | ||||||
| 5,100 | Oldham County School District Finance Corporation, Kentucky, School Building Revenue Bonds, Series 2001A, 5.125%, 4/01/21 | 4/11 at 101.00 | Aa3 | 5,321,136 | ||||||
| Oldham County School District Finance Corporation, Kentucky, School Building Revenue Bonds, Series 2004: | ||||||||||
| 1,230 | 5.000%, 5/01/18 – MBIA Insured | 5/14 at 100.00 | Aaa | 1,310,909 | ||||||
| 1,635 | 5.000%, 5/01/20 – MBIA Insured | 5/14 at 100.00 | Aaa | 1,719,579 | ||||||
| 1,715 | 5.000%, 5/01/21 – MBIA Insured | 5/14 at 100.00 | Aaa | 1,792,398 | ||||||
| 1,360 | Owen County School District Finance Corporation, Kentucky, School Building Revenue Bonds, Series 2001, 5.000%, 4/01/21 | 4/11 at 101.00 | Aa3 | 1,423,920 | ||||||
| 500 | Pendleton County, Kentucky, Leasing Trust Revenue Bonds, Kentucky Association of Counties, Series 1993A, 6.400%, 3/01/19 (5) | No Opt. Call | A | 582,515 | ||||||
32
| Principal Amount (000) | Description (1) | Optional Call Provisions (2) | Ratings (3) | Value | |||||||
| Tax Obligation/Limited (continued) | |||||||||||
| $ | 2,545 | Puerto Rico Highway and Transportation Authority, Highway Revenue Bonds, Series 1998A, 5.500%, 7/01/14 – AMBAC Insured | No Opt. Call | AAA | $ | 2,778,020 | |||||
| 590 | Puerto Rico Highway and Transportation Authority, Highway Revenue Bonds, Series 2002D, 5.000%, 7/01/32 – FSA Insured | 7/12 at 100.00 | AAA | 597,582 | |||||||
| 3,185 | Puerto Rico Public Buildings Authority, Guaranteed Government Facilities Revenue Bonds, Series 1993L, 5.500%, 7/01/21 – FSA Insured | No Opt. Call | AAA | 3,535,637 | |||||||
| 5,000 | Puerto Rico Public Buildings Authority, Guaranteed Government Facilities Revenue Refunding Bonds, Series 2002F, 5.250%, 7/01/21 – CIFG Insured | No Opt. Call | A+ | 5,068,350 | |||||||
| 6,000 | Puerto Rico, Highway Revenue Bonds, Highway and Transportation Authority, Series 2003AA, 5.500%, 7/01/19 – MBIA Insured | No Opt. Call | AAA | 6,429,540 | |||||||
| 1,360 | Shelby County School District Finance Corporation, Kentucky, Revenue Bonds, School Buildings, Series 2004, 5.000%, 5/01/21 – MBIA Insured | 5/14 at 100.00 | Aaa | 1,421,377 | |||||||
| 2,185 | Spencer County School District Finance Corporation, Kentucky, Revenue Bonds, School Buildings, Series 2004, 5.000%, 7/01/21 – FSA Insured | 7/14 at 100.00 | Aaa | 2,302,291 | |||||||
| 1,010 | Virgin Islands Public Finance Authority, Gross Receipts Taxes Loan Note, Series 2003, | 10/14 at 100.00 | AAA | 1,090,194 | |||||||
| 99,840 | Total Tax Obligation/Limited | 105,675,962 | |||||||||
| Transportation – 4.8% | |||||||||||
| Guam International Airport Authority, Revenue Bonds, Series 2003C: | |||||||||||
| 5,000 | 5.250%, 10/01/22 – MBIA Insured (Alternative Minimum Tax) | 10/10 at 100.00 | AAA | 5,014,850 | |||||||
| 2,195 | 5.000%, 10/01/23 – MBIA Insured (Alternative Minimum Tax) | 10/13 at 100.00 | AAA | 2,164,797 | |||||||
| 5,090 | Kenton County Airport Board, Kentucky, Airport Revenue Bonds, Cincinnati/Northern Kentucky International Airport, Series 2003B, 5.000%, 3/01/23 – MBIA Insured (Alternative Minimum Tax) | 3/13 at 100.00 | AAA | 4,849,498 | |||||||
| 1,000 | Louisville and Jefferson County Regional Airport Authority, Kentucky, Airport System Revenue Bonds, Series 2003C, 5.250%, 7/01/22 – FSA Insured (Alternative Minimum Tax) | 7/13 at 100.00 | AAA | 1,011,510 | |||||||
| 7,285 | Louisville and Jefferson County Regional Airport Authority, Kentucky, Special Facilities Revenue Bonds, Airis Louisville LLC Project, Series 1999A, 5.500%, 3/01/19 (Alternative Minimum Tax) | 3/09 at 101.00 | Baa3 | 7,199,984 | |||||||
| 20,570 | Total Transportation | 20,240,639 | |||||||||
| U.S. Guaranteed – 15.0% (4) | |||||||||||
| 1,875 | Bell County Public Properties Corporation, Kentucky, First Mortgage Revenue Bonds, Judicial Center Project, Series 2000, 5.850%, 9/01/28 (Pre-refunded 3/01/11) – AMBAC Insured | 3/11 at 102.00 | AAA | 2,069,081 | |||||||
| 5,085 | Campbellsville, Kentucky, Industrial Building Revenue Bonds, Campbellsville University Project, Series 1999, 5.500%, 3/01/29 (Pre-refunded 3/01/09) | 3/09 at 102.00 | BBB– | (4) | 5,319,368 | ||||||
| Fayette County School District Finance Corporation, Kentucky, School Building Revenue Bonds, Series 2000: | |||||||||||
| 1,665 | 5.500%, 6/01/18 (Pre-refunded 6/01/10) | 6/10 at 101.00 | AA– | (4) | 1,784,197 | ||||||
| 2,795 | 5.500%, 6/01/20 (Pre-refunded 6/01/10) | 6/10 at 101.00 | AA– | (4) | 2,995,094 | ||||||
| 2,000 | Jefferson County Collegiate Housing Foundation, Kentucky, Student Housing Revenue Bonds, University of Louisville Project, Series 1999A, 7.125%, 9/01/29 (Pre-refunded 9/01/09) | 9/09 at 102.00 | N/R | (4) | 2,158,280 | ||||||
| 5,930 | Jefferson County, Kentucky, College Revenue Bonds, Bellarmine College Project, Series 1999, | 5/09 at 101.00 | N/R | (4) | 6,155,874 | ||||||
| 4,500 | Kenton County Public Properties Corporation, Kentucky, First Mortgage Revenue Bonds, Courthouse Facilities Project, Series 1998A, 5.000%, 3/01/29 (Pre-refunded 3/01/09) | 3/09 at 101.00 | Aa3 | (4) | 4,648,095 | ||||||
| 1,500 | Kentucky Economic Development Finance Authority, College Revenue Refunding and Improvement Bonds, Centre College Project, Series 2002, 5.000%, 4/01/32 (Pre-refunded 10/01/12) – FSA Insured | 10/12 at 100.00 | AAA | 1,616,955 | |||||||
| 1,000 | Kentucky Economic Development Finance Authority, Revenue Bonds, Catholic Health Initiatives, Series 2001, 5.250%, 9/01/21 (Pre-refunded 9/01/11) | 9/11 at 100.00 | AA | (4) | 1,078,050 | ||||||
| 400 | Kentucky State Property and Buildings Commission, Agency Fund Revenue Bonds, Project 66A, Series 2000, 5.750%, 5/01/20 (Pre-refunded 5/01/10) – MBIA Insured | 5/10 at 100.00 | AAA | 425,776 | |||||||
33
Portfolio of Investments
Nuveen Kentucky Municipal Bond Fund (continued)
May 31, 2008
| Principal Amount (000) | Description (1) | Optional Call Provisions (2) | Ratings (3) | Value | |||||||
| U.S. Guaranteed (4) (continued) | |||||||||||
| Kentucky State Property and Buildings Commission, Revenue Bonds, Project 85, Series 2005: | |||||||||||
| $ | 2,795 | 5.000%, 8/01/22 (Pre-refunded 8/01/15) – FSA Insured | 8/15 at 100.00 | AAA | $ | 3,093,590 | |||||
| 5,085 | 5.000%, 8/01/25 (Pre-refunded 8/01/15) – FSA Insured | 8/15 at 100.00 | AAA | 5,628,231 | |||||||
| 3,860 | Kentucky State Property and Buildings Commission, Revenue Refunding Bonds, Project 72, Series 2001, 5.375%, 10/01/19 (Pre-refunded 10/01/11) – MBIA Insured | 10/11 at 100.00 | AAA | 4,181,384 | |||||||
| 5,000 | Kentucky State Property and Buildings Commission, Revenue Refunding Bonds, Project 79, Series 2003, 5.000%, 10/01/22 (Pre-refunded 10/01/13) – MBIA Insured | 10/13 at 100.00 | AAA | 5,459,850 | |||||||
| 6,000 | Lexington-Fayette Urban County Government, Kentucky, First Mortgage Bonds, Public Facilities Corporation, Series 1998, 5.125%, 10/01/31 (Pre-refunded 7/15/08) – FSA Insured | 7/08 at 102.00 | AAA | 6,143,700 | |||||||
| 650 | Magoffin County School District Finance Corporation, Kentucky, School Building Revenue Bonds, Series 2000, 5.750%, 6/01/20 (Pre-refunded 6/01/10) | 6/10 at 101.00 | Aa3 | (4) | 699,699 | ||||||
| 410 | Puerto Rico Highway and Transportation Authority, Highway Revenue Bonds, Series 2002D, | 7/12 at 100.00 | Aaa | 443,354 | |||||||
| Puerto Rico Public Finance Corporation, Commonwealth Appropriation Bonds, Series 2002E: | |||||||||||
| 245 | 6.000%, 8/01/26 – AGC Insured (ETM) | No Opt. Call | AAA | 292,814 | |||||||
| 2,755 | 6.000%, 8/01/26 – AGC Insured (ETM) | No Opt. Call | AAA | 3,292,666 | |||||||
| 2,600 | Puerto Rico, General Obligation and Public Improvement Bonds, Series 2000, 5.750%, 7/01/26 | 7/10 at 100.00 | AAA | 2,773,108 | |||||||
| 2,760 | Russell, Kentucky, Health System Revenue Bonds, Franciscan Health Partnership Inc. – Our Lady of Bellefonte Hospital, Series 1997, 5.500%, 7/01/15 (Pre-refunded 1/01/10) | 1/10 at 100.00 | Baa2 | (4) | 2,892,535 | ||||||
| 58,910 | Total U.S. Guaranteed | 63,151,701 | |||||||||
| Utilities – 12.1% | |||||||||||
| 1,175 | Boone County, Kentucky, Collateralized Pollution Control Revenue Bonds, Dayton Power & Light Company, Series 2005A, 4.700%, 1/01/28 – FGIC Insured | 7/15 at 100.00 | A2 | 1,127,847 | |||||||
| Kentucky Municipal Power Agency, Power Supply System Revenue Bonds, Series 2007A: | |||||||||||
| 4,000 | 5.000%, 9/01/37 – MBIA Insured | 9/17 at 100.00 | AAA | 4,005,560 | |||||||
| 4,500 | 5.250%, 9/01/42 – MBIA Insured | 9/17 at 100.00 | AAA | 4,573,170 | |||||||
| Owensboro, Kentucky, Electric Light and Power System Revenue Bonds, Series 1991B: | |||||||||||
| 7,100 | 0.000%, 1/01/11 – AMBAC Insured | No Opt. Call | AAA | 6,555,714 | |||||||
| 6,475 | 0.000%, 1/01/12 – AMBAC Insured | No Opt. Call | AAA | 5,727,526 | |||||||
| 5,810 | 0.000%, 1/01/15 – AMBAC Insured | No Opt. Call | AAA | 4,499,206 | |||||||
| 7,900 | 0.000%, 1/01/17 – AMBAC Insured | No Opt. Call | AAA | 5,491,764 | |||||||
| 13,300 | 0.000%, 1/01/18 – AMBAC Insured | No Opt. Call | AAA | 8,730,253 | |||||||
| 3,000 | Puerto Rico Electric Power Authority, Power Revenue Bonds, Series 2003NN, 5.250%, 7/01/23 – MBIA Insured | No Opt. Call | AAA | 3,196,830 | |||||||
| 5,000 | Puerto Rico Electric Power Authority, Power Revenue Bonds, Series 2005RR, 5.000%, 7/01/24 – FGIC Insured | 7/15 at 100.00 | A3 | 4,939,950 | |||||||
| 2,000 | Puerto Rico Electric Power Authority, Power Revenue Bonds, Series 2005SS, 5.000%, 7/01/17 – MBIA Insured | 7/15 at 100.00 | AAA | 2,111,300 | |||||||
| 60,260 | Total Utilities | 50,959,120 | |||||||||
| Water and Sewer – 11.2% | |||||||||||
| 3,795 | Campbell & Kenton Counties Sanitation District 1, Kentucky, Revenue Bonds, Series 2007, 5.000%, 8/01/24 (WI/DD, Settling 6/12/08) – MBIA Insured | 8/17 at 100.00 | AAA | 3,991,391 | |||||||
| 1,405 | Christian County Water District, Kentucky, Waterworks Revenue Bonds, Series 1999, | 10/09 at 101.00 | Aaa | 1,459,669 | |||||||
| 1,000 | Kentucky Rural Water Finance Corporation, Multimodal Public Projects Revenue Bonds, Flexible Term Program, Series 2001A, 5.375%, 2/01/20 | 2/11 at 102.00 | AA– | 1,034,250 | |||||||
| 4,990 | Louisville and Jefferson County Metropolitan Government Board of Water Works, Kentucky, Water System Revenue Bonds, Series 2006, 5.000%, 11/15/29 | 11/16 at 100.00 | AA+ | 5,203,023 | |||||||
34
| Principal Amount (000) | Description (1) | Optional Call Provisions (2) | Ratings (3) | Value | ||||||
| Water and Sewer (continued) | ||||||||||
| $ | 3,200 | Louisville and Jefferson County Metropolitan Sewer District, Kentucky, Sewer and Drainage System Revenue Bonds, Series 1998A, 5.000%, 5/15/30 – FGIC Insured | 5/10 at 100.00 | AA– | $ | 3,204,640 | ||||
| 16,000 | Louisville and Jefferson County Metropolitan Sewer District, Kentucky, Sewer and Drainage System Revenue Bonds, Series 2001A, 5.500%, 5/15/34 – MBIA Insured | 11/11 at 101.00 | AAA | 16,764,958 | ||||||
| Louisville and Jefferson County Metropolitan Sewer District, Kentucky, Sewer and Drainage System Revenue Bonds, Series 2004A: | ||||||||||
| 7,365 | 5.250%, 5/15/37 – FGIC Insured | 5/14 at 101.00 | AA– | 7,494,182 | ||||||
| 750 | 5.000%, 5/15/38 – FGIC Insured | 5/14 at 101.00 | AA– | 750,960 | ||||||
| 7,225 | Northern Kentucky Water District, Revenue Refunding Bonds, Series 2002A, | 2/12 at 100.00 | A2 | 7,338,144 | ||||||
| 45,730 | Total Water and Sewer | 47,241,217 | ||||||||
| $ | 428,260 | Total Investments (cost $417,810,280) – 101.1% | 426,442,316 | |||||||
Floating Rate Obligations – (1.8)% | (7,680,000) | |||||||||
Other Assets Less Liabilities – 0.7% | 3,136,529 | |||||||||
Net Assets – 100% | $ | 421,898,845 | ||||||||
Forward Swaps outstanding at May 31, 2008:
| Counterparty | Notional Amount | Fund Pay/Receive Floating Rate | Floating Rate Index | Fixed Rate (Annualized) | Fixed Rate Payment Frequency | Effective Date (6) | Termination Date | Unrealized Appreciation (Depreciation) | |||||||||||
| Royal Bank of Canada | $ | 5,300,000 | Pay | SIFM | 4.335 | % | Quarterly | 8/06/08 | 8/06/37 | $ | 336,570 | ||||||||
| SIFM – | The daily arithmetic average of the weekly Securities Industry and Financial Markets (SIFM) Municipal Swap Index, previously referred to as the Bond Market Association or BMA. |
Futures Contracts outstanding at May 31, 2008:
| Type | Contract Position | Number of Contracts | Contract Expiration | Value at May 31, 2008 | Unrealized Appreciation (Depreciation) | ||||||||
| U.S. Treasury Bond | Long | 74 | 9/08 | $ | 8,399,000 | $ | (23,058 | ) | |||||
| (1) | All percentages shown in the Portfolio of Investments are based on net assets. |
| (2) | Optional Call Provisions (not covered by the report of independent registered public accounting firm): Dates (month and year) and prices of the earliest optional call or redemption. There may be other call provisions at varying prices at later dates. Certain mortgage-backed securities may be subject to periodic principal paydowns. |
| (3) | Ratings (not covered by the report of independent registered public accounting firm): Using the higher of Standard & Poor’s Group (“Standard & Poor’s”) or Moody’s Investor Service, Inc. (“Moody’s”) rating. Ratings below BBB by Standard & Poor’s or Baa by Moody’s are considered to be below investment grade. |
| The Portfolio of Investments may reflect the ratings on certain bonds insured by ACA, AMBAC, CIFG, FGIC, MBIA, RAAI and XLCA as of May 31, 2008. Please see the Portfolio Managers’ Commentary for an expanded discussion of the affect on the Fund of changes to the ratings of certain bonds in the portfolio resulting from changes to the ratings of the underlying insurers both during the period and after period end. |
| (4) | Backed by an escrow or trust containing sufficient U.S. Government or U.S. Government agency securities which ensure the timely payment of principal and interest. Such investments are normally considered to be equivalent to AAA rated securities. |
| (5) | The issuer has received a formal adverse determination from the Internal Revenue Service (the “IRS”) regarding the tax-exempt status of the bonds’ coupon payments. The Fund will continue to treat coupon payments as tax-exempt income until such time that it is formally determined that the interest on the bonds should be treated as taxable. |
| (6) | Effective date represents the date on which both the Fund and counterparty commence interest payment accruals on each forward swap contract. |
| N/R | Not rated. |
| (ETM) | Escrowed to maturity. |
| WI/DD | Purchased on a when-issued or delayed delivery basis. |
| (UB) | Underlying bond of an inverse floating rate trust reflected as a financing transaction pursuant to the provisions of SFAS No. 140. |
See accompanying notes to financial statements.
35
Portfolio of Investments
Nuveen Michigan Municipal Bond Fund
May 31, 2008
| Principal Amount (000) | Description (1) | Optional Call Provisions (2) | Ratings (3) | Value | ||||||
| Consumer Staples – 0.4% | ||||||||||
| $ | 840 | Puerto Rico, The Children’s Trust Fund, Tobacco Settlement Asset-Backed Refunding Bonds, Series 2002, 5.375%, 5/15/33 | 5/12 at 100.00 | BBB | $ | 800,638 | ||||
| Education and Civic Organizations – 4.5% | ||||||||||
| 630 | Chandler Park Academy, Michigan, Public School Academy Charter School Revenue Bonds, Series 2005, 5.125%, 11/01/35 | 11/15 at 100.00 | BBB– | 537,182 | ||||||
| Michigan Technological University, General Revenue Bonds, Series 2004A: | ||||||||||
| 1,230 | 5.000%, 10/01/24 – MBIA Insured | 10/13 at 100.00 | AAA | 1,268,228 | ||||||
| 1,850 | 5.000%, 10/01/29 – MBIA Insured | 10/13 at 100.00 | AAA | 1,872,330 | ||||||
| 6,150 | Wayne State University, Michigan, General Revenue Bonds, Series 1999, 5.125%, 11/15/29 – FGIC Insured | 11/09 at 101.00 | AA– | 6,231,241 | ||||||
| 9,860 | Total Education and Civic Organizations | 9,908,981 | ||||||||
| Health Care – 8.7% | ||||||||||
| 1,440 | Kent Hospital Finance Authority, Michigan, Revenue Bonds, Metropolitan Hospital, Series 2005A, 5.250%, 7/01/30 | 7/15 at 100.00 | BBB | 1,336,925 | ||||||
| 2,600 | Michigan Hospital Financing Authority, Revenue Bonds, Oakwood Obligated Group, Series 2007A, 5.000%, 7/15/37 | 7/17 at 100.00 | A | 2,471,820 | ||||||
| 1,000 | Michigan State Hospital Finance Authority, Hospital Revenue Bonds, Michigan Community Hospital, Series 1996, 6.250%, 10/01/27 | 10/08 at 100.00 | BBB– | 1,001,920 | ||||||
| 1,475 | Michigan State Hospital Finance Authority, Hospital Revenue Refunding Bonds, Chelsea Community Hospital, Series 1998, 5.375%, 5/15/19 | 11/08 at 101.00 | BBB | 1,476,446 | ||||||
| 1,000 | Michigan State Hospital Finance Authority, Hospital Revenue Refunding Bonds, Crittenton Hospital, Series 2002A, 5.625%, 3/01/27 | 3/12 at 101.00 | A+ | 1,022,670 | ||||||
| 1,000 | Michigan State Hospital Finance Authority, Revenue Bonds, Chelsea Community Hospital, Series 2005, 5.000%, 5/15/37 | 5/15 at 100.00 | BBB | 848,900 | ||||||
| 1,400 | Michigan State Hospital Finance Authority, Revenue Bonds, Marquette General Hospital, Series 2005A, 5.000%, 5/15/26 | 5/15 at 100.00 | Baa3 | 1,274,560 | ||||||
| 2,000 | Michigan State Hospital Finance Authority, Revenue Bonds, Sparrow Obligated Group, Series 2005, 5.000%, 11/15/36 – MBIA Insured | 5/15 at 100.00 | AAA | 2,005,780 | ||||||
| 3,755 | Michigan State Hospital Finance Authority, Revenue Refunding Bonds, Detroit Medical Center Obligated Group, Series 1993A, 6.500%, 8/15/18 | 8/08 at 100.00 | BB– | 3,756,690 | ||||||
| 800 | Monroe County Hospital Finance Authority, Michigan, Mercy Memorial Hospital Corporation Revenue Bonds, Series 2006, 5.375%, 6/01/26 | 6/16 at 100.00 | Baa3 | 670,400 | ||||||
| 1,600 | Pontiac Hospital Finance Authority, Michigan, Hospital Revenue Refunding Bonds, NOMC Obligated Group, Series 1993, 6.000%, 8/01/23 (4) | 8/08 at 100.00 | C | 157,760 | ||||||
| Royal Oak Hospital Finance Authority, Michigan, Hospital Revenue Bonds, William Beaumont Hospital, Series 2001M: | ||||||||||
| 1,000 | 5.250%, 11/15/31 – MBIA Insured | 11/11 at 100.00 | AAA | 1,012,570 | ||||||
| 2,000 | 5.250%, 11/15/35 – MBIA Insured | 11/11 at 100.00 | AAA | 2,021,400 | ||||||
| 21,070 | Total Health Care | 19,057,841 | ||||||||
| Housing/Multifamily – 2.2% | ||||||||||
| 1,200 | Michigan Housing Development Authority, Rental Housing Revenue Bonds, Series 2006D, 5.125%, 4/01/31 – FSA Insured (Alternative Minimum Tax) | 7/15 at 100.00 | AAA | 1,170,732 | ||||||
| 5,745 | Michigan Housing Development Authority, Section 8 Assisted Mortgage Revenue Bonds, Series 1983I, 0.000%, 4/01/14 | No Opt. Call | AA | 3,646,581 | ||||||
| 6,945 | Total Housing/Multifamily | 4,817,313 | ||||||||
| Industrials – 0.9% | ||||||||||
| 2,000 | Michigan Strategic Fund, Solid Waste Disposal Limited Obligation Revenue Bonds, Waste Management Inc., Series 2004, 4.500%, 12/01/13 (Alternative Minimum Tax) | No Opt. Call | BBB | 1,929,580 | ||||||
36
| Principal Amount (000) | Description (1) | Optional Call Provisions (2) | Ratings (3) | Value | ||||||
| Long-Term Care – 1.8% | ||||||||||
| $ | 1,000 | Michigan State Hospital Finance Authority, Revenue Bonds, Presbyterian Villages of Michigan Obligated Group, Series 2005, 5.250%, 11/15/25 | 5/15 at 100.00 | N/R | $ | 877,240 | ||||
| 2,695 | Michigan Strategic Fund, Limited Obligation Revenue Bonds, Clark Retirement Community Inc., Series 1998, 5.250%, 6/01/18 | 6/08 at 100.00 | BBB– | 2,686,699 | ||||||
| Michigan Strategic Fund, Limited Obligation Revenue Refunding Bonds, Porter Hills Presbyterian Village, Series 1998: | ||||||||||
| 140 | 5.300%, 7/01/18 | 7/08 at 101.00 | BBB | 139,023 | ||||||
| 260 | 5.375%, 7/01/28 | 7/08 at 101.00 | BBB | 245,944 | ||||||
| 4,095 | Total Long-Term Care | 3,948,906 | ||||||||
| Materials – 0.7% | ||||||||||
| 1,750 | Dickinson County Economic Development Corporation, Michigan, Pollution Control Revenue Bonds, International Paper Company, Series 2004A, 4.800%, 11/01/18 | 11/14 at 100.00 | BBB | 1,639,348 | ||||||
| Tax Obligation/General – 35.0% | ||||||||||
| 660 | Ann Arbor Public School District, Washtenaw County, Michigan, General Obligation Bonds, Series 2008, 5.000%, 5/01/23 | 5/18 at 100.00 | AA+ | 696,967 | ||||||
| 1,435 | Bay City, Michigan, General Obligation Bonds, Series 2008B, 5.500%, 4/01/28 (WI/DD, Settling 6/09/08) – FSA Insured | 4/18 at 100.00 | AAA | 1,555,066 | ||||||
| 1,020 | Caledonia Community Schools, Kent, Allegan and Barry Counties, Michigan, General Obligation Bonds, Series 2003, 5.250%, 5/01/22 | 5/13 at 100.00 | AA– | 1,078,262 | ||||||
| Caledonia Community Schools, Kent, Allegan and Barry Counties, Michigan, General Obligation Bonds, Series 2005: | ||||||||||
| 1,000 | 5.000%, 5/01/23 – MBIA Insured | 5/15 at 100.00 | AAA | 1,042,690 | ||||||
| 2,085 | 5.000%, 5/01/24 – MBIA Insured | 5/15 at 100.00 | AAA | 2,168,942 | ||||||
| 1,000 | 5.000%, 5/01/25 – MBIA Insured | 5/15 at 100.00 | AAA | 1,037,840 | ||||||
| 1,220 | Caledonia Community Schools, Kent, Allegan and Barry Counties, Michigan, General Obligation Bonds, Tender Option Bond Trust 2008-1096, 10.165%, 5/01/32 – MBIA Insured (IF) | 5/17 at 100.00 | AA | 1,227,796 | ||||||
| 1,850 | Chippewa Valley Schools, Macomb County, Michigan, General Obligation Bonds, Series 2005, 5.000%, 5/01/24 – MBIA Insured | 5/15 at 100.00 | AAA | 1,924,481 | ||||||
| 4,085 | Detroit, Michigan, General Obligation Bonds, Series 2004A-1, 5.250%, 4/01/20 – AMBAC Insured | 4/14 at 100.00 | AAA | 4,187,370 | ||||||
| 11,000 | Detroit-Wayne County Stadium Authority, Michigan, Limited Tax General Obligation Building Authority Stadium Bonds, Series 1997, 5.250%, 2/01/27 – FGIC Insured | 8/08 at 101.00 | A | 11,084,919 | ||||||
| 1,245 | Edwardsburg Public School, Cass County, Michigan, General Obligation Bonds, Series 2004, 5.000%, 5/01/24 – FSA Insured | 5/14 at 100.00 | AAA | 1,288,762 | ||||||
| 4,350 | Hartland Consolidated School District, Livingston County, Michigan, General Obligation Refunding Bonds, Series 2001, 5.125%, 5/01/29 | 5/11 at 100.00 | AA– | 4,419,035 | ||||||
| 1,675 | Hopkins Public Schools, Allegan County, Michigan, General Obligation Bonds, Series 2007, 5.000%, 5/01/25 – MBIA Insured | 5/17 at 100.00 | AAA | 1,753,457 | ||||||
| 2,000 | Howell Public Schools, Livingston County, Michigan, General Obligation Bonds, Series 2003, 5.000%, 5/01/24 | 11/13 at 100.00 | AA– | 2,078,720 | ||||||
| 1,000 | Jackson Public Schools, Jackson County, Michigan, General Obligation School Building and Site Bonds, Series 2004, 5.000%, 5/01/22 – FSA Insured | 5/14 at 100.00 | AAA | 1,047,600 | ||||||
| 1,215 | Kalamazoo Public Schools, Michigan, General Obligation Bonds, Series 2006, 5.000%, 5/01/25 – FSA Insured | 5/16 at 100.00 | AAA | 1,266,565 | ||||||
| 1,030 | Kent County, Michigan, General Obligation Bonds, Series 2004A, 5.000%, 12/01/22 | 12/14 at 100.00 | AAA | 1,091,852 | ||||||
| 1,300 | Lansing Community College, Michigan, General Obligation Bonds, Series 2003, 5.000%, 5/01/20 – MBIA Insured | 5/13 at 100.00 | AAA | 1,363,349 | ||||||
| 840 | Lowell Area Schools, Counties of Ionia and Kent, Michigan, General Obligation Bonds, Series 2007, 5.000%, 5/01/37 – FSA Insured | 5/17 at 100.00 | AAA | 861,848 | ||||||
37
Portfolio of Investments
Nuveen Michigan Municipal Bond Fund (continued)
May 31, 2008
| Principal Amount (000) | Description (1) | Optional Call Provisions (2) | Ratings (3) | Value | ||||||
| Tax Obligation/General (continued) | ||||||||||
| $ | 2,800 | Michigan Municipal Bond Authority, Local Government Loan Program Revenue Bonds, Pontiac School District, Series 1991C, 0.000%, 6/15/08 – FSA Insured | No Opt. Call | AAA | $ | 2,797,452 | ||||
| 3,250 | Michigan, General Obligation Bonds, Environmental Protection Program, Series 2003A, 5.250%, 5/01/21 | 5/13 at 100.00 | AA– | 3,472,300 | ||||||
| 545 | Oakland Intermediate School District, Oakland County, Michigan, General Obligation Bonds, Series 2007, 5.000%, 5/01/36 – FSA Insured | 5/17 at 100.00 | AAA | 559,579 | ||||||
| 1,370 | Oakridge Public Schools, Muskegon County, Michigan, General Obligation Bonds, Series 2005, 5.000%, 5/01/24 – MBIA Insured | 5/15 at 100.00 | AAA | 1,425,156 | ||||||
| Okemos Public School District, Ingham County, Michigan, General Obligation Refunding Bonds, Series 1993: | ||||||||||
| 1,000 | 0.000%, 5/01/17 – MBIA Insured | No Opt. Call | AAA | 685,840 | ||||||
| 1,020 | 0.000%, 5/01/18 – MBIA Insured | No Opt. Call | AAA | 660,899 | ||||||
| 4,000 | Ottawa County, Michigan, Water Supply System, General Obligation Bonds, Series 2007, 5.000%, 8/01/30 – MBIA Insured | 8/17 at 100.00 | Aaa | 4,130,440 | ||||||
| 905 | Parchment School District, Kalamazoo County, Michigan, General Obligation Bonds, Tender Option Bond Trust 2836, 10.157%, 5/01/36 – FSA Insured (IF) | 5/17 at 100.00 | AAA | 901,597 | ||||||
| 1,400 | South Redford School District, Wayne County, Michigan, General Obligation Bonds, Series 2004, 5.000%, 5/01/21 – FGIC Insured | 11/14 at 100.00 | AA– | 1,468,026 | ||||||
| 1,370 | Thornapple Kellogg School District, Barry County, Michigan, General Obligation Bonds, Series 2007, 5.000%, 5/01/32 – MBIA Insured | 5/17 at 100.00 | AAA | 1,409,675 | ||||||
| 1,675 | Trenton Public Schools District, Michigan, General Obligation Bonds, Series 2008, 5.000%, 5/01/34 (WI/DD, Settling 6/19/08) – FSA Insured | 5/18 at 100.00 | AAA | 1,726,473 | ||||||
| 1,500 | Wayland Union School District, Allegan County, Michigan, General Obligation Bonds, Series 2008, 5.000%, 5/01/28 (WI/DD, Settling 6/17/08) – FSA Insured | 5/18 at 100.00 | AAA | 1,560,645 | ||||||
| 1,150 | Wayne Westland Community Schools, Michigan, General Obligation Bonds, Series 2004, 5.000%, 5/01/17 – FSA Insured | 11/14 at 100.00 | AAA | 1,245,830 | ||||||
| 1,915 | West Bloomfield School District, Oakland County, Michigan, General Obligation Bonds, Series 2005, 5.000%, 5/01/20 – FSA Insured | 5/15 at 100.00 | AAA | 2,029,096 | ||||||
| 3,270 | West Ottawa Public School District, Ottawa County, Michigan, General Obligation Refunding Bonds, Series 1992, 0.000%, 5/01/17 – FGIC Insured | No Opt. Call | A1 | 2,175,237 | ||||||
| 5,175 | Williamston Community School District, Michigan, Unlimited Tax General Obligation QSBLF Bonds, Series 1996, 5.500%, 5/01/25 – MBIA Insured | No Opt. Call | AAA | 5,804,797 | ||||||
| 3,170 | Zeeland Public Schools, Ottawa and Allegan Counties, Michigan, General Obligation Bonds, Series 2005, 5.000%, 5/01/22 – FGIC Insured | 5/15 at 100.00 | A | 3,311,128 | ||||||
| 75,525 | Total Tax Obligation/General | 76,539,691 | ||||||||
| Tax Obligation/Limited – 15.0% | ||||||||||
| 930 | Detroit, Michigan, Building Authority Revenue Bonds, District Court Madison Center, Series 1996A, 6.150%, 2/01/11 | 8/08 at 100.00 | A+ | 933,162 | ||||||
| Grand Rapids Downtown Development Authority, Michigan, Tax Increment Revenue Bonds, Series 1994: | ||||||||||
| 3,985 | 0.000%, 6/01/17 – MBIA Insured | No Opt. Call | AAA | 2,720,081 | ||||||
| 3,295 | 0.000%, 6/01/18 – MBIA Insured | No Opt. Call | AAA | 2,124,913 | ||||||
| 1,650 | 6.875%, 6/01/24 – MBIA Insured | 6/08 at 100.00 | AAA | 1,717,139 | ||||||
| 3,955 | Kalkaska County Hospital Authority, Michigan, Hospital Revenue Bonds, Series 2007, 5.125%, 5/01/14 | No Opt. Call | N/R | 3,936,886 | ||||||
| Michigan Building Authority, Revenue Bonds, Series 2006IA: | ||||||||||
| 3,000 | 0.000%, 10/15/27 – FGIC Insured | 10/16 at 58.27 | AAA | 1,076,580 | ||||||
| 1,500 | 0.000%, 10/15/28 – FGIC Insured | 10/16 at 55.35 | AAA | 507,420 | ||||||
| 3,960 | 5.000%, 10/15/36 – FGIC Insured | 10/16 at 100.00 | A+ | 3,941,903 | ||||||
| 1,230 | Michigan Municipal Bond Authority, AMBAC Insured Bonds, Series 2007B-A, 5.000%, 12/01/34 – | 6/17 at 100.00 | AAA | 1,236,199 | ||||||
38
| Principal Amount (000) | Description (1) | Optional Call Provisions (2) | Ratings (3) | Value | |||||||
| Tax Obligation/Limited (continued) | |||||||||||
| Michigan State Building Authority, Revenue Bonds, Facilities Program, Series 2001I: | |||||||||||
| $ | 2,720 | 5.500%, 10/15/19 | 10/11 at 100.00 | A+ | $ | 2,892,965 | |||||
| 5,000 | 5.000%, 10/15/24 | 10/11 at 100.00 | A+ | 5,151,399 | |||||||
| 4,400 | Michigan State Building Authority, Revenue Bonds, Facilities Program, Series 2005II, 5.000%, 10/15/30 – AMBAC Insured | 10/15 at 100.00 | AAA | 4,442,988 | |||||||
| 2,000 | Michigan State Building Authority, Revenue Refunding Bonds, Facilities Program, Series 2003II, 5.000%, 10/15/22 – MBIA Insured | 10/13 at 100.00 | AAA | 2,078,120 | |||||||
| 37,625 | Total Tax Obligation/Limited | 32,759,755 | |||||||||
| U.S. Guaranteed – 13.6% (5) | |||||||||||
| 1,175 | Birmingham, Michigan, General Obligation Bonds, Series 2002, 5.000%, 10/01/21 (Pre-refunded 10/01/12) | 10/12 at 100.50 | AAA | 1,276,250 | |||||||
| 295 | Cedar Springs Public School District, Kent and Newaygo Counties, Michigan, General Obligation Bonds, Series 2003, 5.125%, 5/01/32 (Pre-refunded 5/01/13) | 5/13 at 100.00 | AA– | (5) | 322,223 | ||||||
| 250 | Detroit City School District, Wayne County, Michigan, Unlimited Tax School Building and Site Improvement Bonds, Series 2001A, 5.125%, 5/01/31 (Pre-refunded 5/01/12) – FSA Insured | 5/12 at 100.00 | AAA | 269,963 | |||||||
| 3,000 | Detroit, Michigan, Senior Lien Sewerage Disposal System Revenue Bonds, Series 2001A, 5.125%, 7/01/31 (Pre-refunded 7/01/11) – FGIC Insured | 7/11 at 100.00 | A+ | (5) | 3,215,340 | ||||||
| 2,505 | Detroit, Michigan, Senior Lien Water Supply System Revenue Bonds, Series 2003A, 5.000%, 7/01/25 | 7/13 at 100.00 | AAA | 2,726,693 | |||||||
| 3,750 | Kent Hospital Finance Authority, Michigan, Revenue Bonds, Spectrum Health, Series 2001A, 5.500%, 1/15/31 (Pre-refunded 7/15/11) | 7/11 at 101.00 | AA | (5) | 4,077,638 | ||||||
| 1,000 | Livonia Municipal Building Authority, Wayne County, Michigan, General Obligation Bonds, Series 2001, 5.000%, 5/01/27 (Pre-refunded 5/01/10) – FGIC Insured | 5/10 at 100.00 | AA | (5) | 1,050,430 | ||||||
| 6,000 | Michigan House of Representatives, Certificates of Participation, Series 1998, 0.000%, 8/15/23 – AMBAC Insured (ETM) | No Opt. Call | AAA | 2,877,780 | |||||||
| 75 | Michigan South Central Power Agency, Power Supply System Revenue Bonds, Series 2000, 6.000%, 5/01/12 (ETM) | No Opt. Call | A3 | (5) | 81,480 | ||||||
| 5,000 | Michigan State Hospital Finance Authority, Hospital Revenue Bonds, Ascension Health Credit Group, Series 1999A, 6.125%, 11/15/26 (Pre-refunded 11/15/09) | 11/09 at 101.00 | AAA | 5,323,299 | |||||||
| 2,200 | Michigan State Hospital Finance Authority, Hospital Revenue Bonds, Henry Ford Health System, Series 1999A, 6.000%, 11/15/24 (Pre-refunded 11/15/09) | 11/09 at 101.00 | A1 | (5) | 2,336,356 | ||||||
| 3,000 | Michigan State Hospital Finance Authority, Hospital Revenue Refunding Bonds, Henry Ford Health System, Series 2003A, 5.625%, 3/01/17 (Pre-refunded 3/01/13) | 3/13 at 100.00 | A1 | (5) | 3,315,300 | ||||||
| 1,500 | Michigan, Certificates of Participation, Series 2000, 5.500%, 6/01/20 (Pre-refunded 6/01/10) – AMBAC Insured | 6/10 at 100.00 | AAA | 1,593,060 | |||||||
| 1,235 | Rochester Community School District, Oakland and Macomb Counties, Michigan, General Obligation Bonds, Series 2000I, 5.750%, 5/01/19 (Pre-refunded 5/01/10) – FGIC Insured | 5/10 at 100.00 | AA– | (5) | 1,314,583 | ||||||
| 30,985 | Total U.S. Guaranteed | 29,780,395 | |||||||||
| Utilities – 5.7% | |||||||||||
| 1,000 | Lansing Board of Water and Light, Michigan, Steam and Electric Utility System Revenue Bonds, Series 2003A, 5.000%, 7/01/21 – FSA Insured | 7/13 at 100.00 | AAA | 1,048,160 | |||||||
| 2,130 | Lansing Board of Water and Light, Michigan, Steam and Electric Utility System Revenue Bonds, Series 2008A, 5.000%, 7/01/32 | 7/18 at 100.00 | AA– | 2,189,384 | |||||||
| 1,000 | Michigan Public Power Agency, Revenue Bonds, Combustion Turbine 1 Project, Series 2001A, 5.250%, 1/01/27 – AMBAC Insured | 1/12 at 100.00 | AAA | 1,020,890 | |||||||
| 925 | Michigan South Central Power Agency, Power Supply System Revenue Bonds, Series 2000, 6.000%, 5/01/12 | No Opt. Call | A3 | 973,803 | |||||||
| 3,300 | Michigan Strategic Fund, Collateralized Limited Obligation Pollution Control Revenue Refunding Bonds, Fixed Rate Conversion, Detroit Edison Company, Series 1999C, 5.650%, 9/01/29 – XLCA Insured (Alternative Minimum Tax) | 9/11 at 100.00 | A– | 3,330,855 | |||||||
39
Portfolio of Investments
Nuveen Michigan Municipal Bond Fund (continued)
May 31, 2008
| Principal Amount (000) | Description (1) | Optional Call Provisions (2) | Ratings (3) | Value | ||||||
| Utilities (continued) | ||||||||||
| $ | 1,000 | Monroe County Economic Development Corporation, Michigan, Collateralized Limited Obligation Revenue Refunding Bonds, Detroit Edison Company, Series 1992AA, 6.950%, 9/01/22 – FGIC Insured | No Opt. Call | A3 | $ | 1,271,960 | ||||
| 4,000 | Puerto Rico Electric Power Authority, Power Revenue Refunding Bonds, Series 1989O, 0.000%, 7/01/17 – MBIA Insured | No Opt. Call | AAA | 2,643,680 | ||||||
| 13,355 | Total Utilities | 12,478,732 | ||||||||
| Water and Sewer – 11.9% | ||||||||||
| 5,000 | Detroit Water Supply System, Michigan, Water Supply System Revenue Bonds, Series 2006A, 5.000%, 7/01/34 – FSA Insured | 7/16 at 100.00 | AAA | 5,113,250 | ||||||
| 2,500 | Detroit, Michigan, Senior Lien Water Supply System Revenue Bonds, Series 2001A, 5.000%, 7/01/30 – FGIC Insured | 7/11 at 100.00 | A+ | 2,460,475 | ||||||
| 2,495 | Detroit, Michigan, Senior Lien Water Supply System Revenue Bonds, Series 2003A, 5.000%, 7/01/25 – MBIA Insured | 7/13 at 100.00 | AAA | 2,522,794 | ||||||
| 4,455 | Detroit, Michigan, Sewerage Disposal System Revenue Bonds, Series 1999A, 0.000%, 7/01/19 – FGIC Insured | No Opt. Call | A+ | 2,609,026 | ||||||
| 4,000 | Grand Rapids, Michigan, Sanitary Sewer System Revenue Bonds, Series 2005, 5.000%, 1/01/30 – MBIA Insured | 7/15 at 100.00 | AAA | 4,105,400 | ||||||
| 1,625 | Lansing, Michigan, Sewerage Disposal System Revenue Bonds, Series 2003, 5.000%, 5/01/21 – FGIC Insured | 5/14 at 100.00 | AA– | 1,698,515 | ||||||
| 2,075 | Michigan Municipal Bond Authority, Clean Water Revolving Fund Revenue Bonds, Series 2005, 5.000%, 10/01/19 | 10/15 at 100.00 | AAA | 2,231,351 | ||||||
| 4,055 | Michigan Municipal Bond Authority, Drinking Water Revolving Fund Revenue Bonds, Series 2004, 5.000%, 10/01/24 | 10/14 at 100.00 | AAA | 4,229,000 | ||||||
| 1,000 | Michigan Municipal Bond Authority, Water Revolving Fund Revenue Bonds, Series 2007, 5.000%, 10/01/23 | 10/17 at 100.00 | AAA | 1,063,590 | ||||||
| 27,205 | Total Water and Sewer | 26,033,401 | ||||||||
| $ | 231,255 | Total Long-Term Investments (cost $213,925,965) – 100.4% | 219,694,581 | |||||||
| Short-Term Investments – 0.7% | ||||||||||
| $ | 1,500 | Royal Oak Hospital Finance Authority, Michigan, Hospital Revenue Bonds, William Beaumont Hospital, Series 2006S, Variable Rate Demand Obligatons, 1.850%, 6/15/40 – AMBAC Insured (6) | AA3 | 1,500,000 | ||||||
Total Short-Term Investments (cost $1,500,000) | 1,500,000 | |||||||||
Total Investments (cost $215,425,965) – 101.1% | 221,194,581 | |||||||||
Other Assets Less Liabilities – (1.1)% | (2,504,940) | |||||||||
Net Assets – 100% | $ | 218,689,641 | ||||||||
40
Forward Swaps outstanding at May 31, 2008:
| Counterparty | Notional Amount | Fund Pay/Receive Floating Rate | Floating Rate Index | Fixed Rate (Annualized) | Fixed Rate Payment Frequency | Effective Date (7) | Termination Date | Unrealized Appreciation (Depreciation) | |||||||||||
| Royal Bank of Canada | $ | 2,600,000 | Pay | SIFM | 4.335 | % | Quarterly | 8/06/08 | 8/06/37 | $ | 165,110 | ||||||||
| SIFM – | The daily arithmetic average of the weekly Securities Industry and Financial Markets (SIFM) Municipal Swap Index, previously referred to as the Bond Market Association or BMA. |
| (1) | All percentages shown in the Portfolio of Investments are based on net assets. |
| (2) | Optional Call Provisions (not covered by the report of independent registered public accounting firm): Dates (month and year) and prices of the earliest optional call or redemption. There may be other call provisions at varying prices at later dates. Certain mortgage-backed securities may be subject to periodic principal paydowns. |
| (3) | Ratings (not covered by the report of independent registered public accounting firm): Using the higher of Standard & Poor’s Group (“Standard & Poor’s��) or Moody’s Investor Service, Inc. (“Moody’s”) rating. Ratings below BBB by Standard & Poor’s or Baa by Moody’s are considered to be below investment grade. |
| The Portfolio of Investments may reflect the ratings on certain bonds insured by ACA, AMBAC, CIFG, FGIC, MBIA, RAAI and XLCA as of May 31, 2008. Please see the Portfolio Managers’ Commentary for an expanded discussion of the affect on the Fund of changes to the ratings of certain bonds in the portfolio resulting from changes to the ratings of the underlying insurers both during the period and after period end. |
| (4) | On April 14, 2008, the Adviser concluded that the issuer was not likely to meet its interest payment obligations and directed the custodian to cease accruing additional income and “write-off” any remaining recorded balances on the Fund’s records. |
| (5) | Backed by an escrow or trust containing sufficient U.S. Government or U.S. Government agency securities which ensure the timely payment of principal and interest. Such investments are normally considered to be equivalent to AAA rated securities. |
| (6) | Investment has a maturity of more than one year, but has variable rate and demand features which qualify it as a short-term investment. The rate disclosed is that in effect at the end of the reporting period. This rate changes periodically based on market conditions or a specified market index. |
| (7) | Effective date represents the date on which both the Fund and counterparty commence interest payment accruals on each forward swap contract. |
| N/R | Not rated. |
| WI/DD | Purchased on a when-issued or delayed delivery basis. |
| (ETM) | Escrowed to maturity. |
| (IF) | Inverse floating rate investment. |
See accompanying notes to financial statements.
41
Portfolio of Investments
Nuveen Missouri Municipal Bond Fund
May 31, 2008
| Principal Amount (000) | Description (1) | Optional Call Provisions (2) | Ratings (3) | Value | ||||||
| Consumer Discretionary – 1.1% | ||||||||||
| $ | 3,225 | St. Louis Industrial Development Authority, Missouri, Senior Lien Revenue Bonds, St. Louis Convention Center Headquarters Hotel, Series 2000A, 0.000%, 7/15/15 – AMBAC Insured | No Opt. Call | AAA | $ | 2,374,697 | ||||
| Consumer Staples – 5.2% | ||||||||||
| 3,000 | Cape Girardeau County Industrial Development Authority, Missouri, Solid Waste Disposal Revenue Bonds, Procter & Gamble Products Company Project, Series 1998, 5.300%, 5/15/28 (Alternative Minimum Tax) | 11/08 at 101.00 | AA– | 3,004,350 | ||||||
| 8,555 | Missouri Development Finance Board, Solid Waste Disposal Revenue Bonds, Procter and Gamble Inc., Series 1999, 5.200%, 3/15/29 (Alternative Minimum Tax) | No Opt. Call | AA– | 8,796,335 | ||||||
| 11,555 | Total Consumer Staples | 11,800,685 | ||||||||
| Education and Civic Organizations – 5.4% | ||||||||||
| 1,000 | Lincoln University, Missouri, Auxillary System Revenue Bonds, Series 2007, 5.125%, 6/01/37 – | 6/17 at 100.00 | AAA | 1,026,690 | ||||||
| 1,100 | Missouri Health and Educational Facilities Authority, Revenue Bonds, Barstow School, Series 1998, 5.250%, 10/01/23 | 10/08 at 100.00 | N/R | 1,055,714 | ||||||
| 900 | Missouri Health and Educational Facilities Authority, Revenue Bonds, Stephens College, Series 1999, 6.000%, 6/01/24 | 6/08 at 102.00 | A1 | 918,828 | ||||||
| 1,000 | Missouri Health and Educational Facilities Authority, Revenue Bonds, Washington University, Series 2001A, 5.500%, 6/15/16 | No Opt. Call | AAA | 1,134,840 | ||||||
| 1,360 | Missouri Health and Educational Facilities Authority, Revenue Bonds, Webster University, Series 2001, 5.500%, 4/01/18 – MBIA Insured | 4/11 at 100.00 | Aaa | 1,429,564 | ||||||
| 2,000 | Missouri Health and Educational Facilities Authority, Washington University Revenue Bonds, Series 2007B, 4.500%, 1/15/36 | 1/17 at 100.00 | AAA | 1,956,560 | ||||||
| 2,590 | Missouri State University, Auxiliary Enterprise System Revenue Bonds, Series 2007A, 5.000%, 4/01/24 – XLCA Insured | 4/17 at 100.00 | A | 2,637,993 | ||||||
| 2,060 | Southeast Missouri State University, System Facilities Revenue Refunding and Improvement Bonds, Series 2001, 5.000%, 4/01/26 – MBIA Insured | 4/11 at 100.00 | Aaa | 2,088,098 | ||||||
| 12,010 | Total Education and Civic Organizations | 12,248,287 | ||||||||
| Energy – 1.3% | ||||||||||
| 3,000 | Missouri Environmental Improvement and Energy Resources Authority, Revenue Bonds, Kansas City Power & Light Company Project, Series 2008, 4.900%, 5/01/38 (Mandatory put 7/01/13) | No Opt. Call | A3 | 2,984,550 | ||||||
| Health Care – 13.0% | ||||||||||
| Cape Girardeau County Industrial Development Authority, Missouri, Health Facilities Revenue Bonds, Southeast Missouri Hospital Association, Series 2007: | ||||||||||
| 1,290 | 5.000%, 6/01/27 | 6/17 at 100.00 | N/R | 1,184,620 | ||||||
| 2,500 | 5.000%, 6/01/36 | 6/17 at 100.00 | N/R | 2,153,875 | ||||||
| 2,520 | Cass County, Missouri, Hospital Revenue Bonds, Series 2007, 5.625%, 5/01/38 | 11/16 at 100.00 | N/R | 2,375,906 | ||||||
| 2,520 | Clinton County Industrial Development Authority, Missouri, Revenue Bonds, Cameron Regional Medical Center, Series 2007, 5.000%, 12/01/37 | 12/17 at 100.00 | N/R | 2,041,956 | ||||||
| 1,250 | Joplin Industrial Development Authority, Missouri, Health Facilities Revenue Bonds, Freeman Health System, Series 2004, 5.500%, 2/15/29 | 2/15 at 102.00 | BBB+ | 1,255,038 | ||||||
| 1,000 | Missouri Health & Educational Facilities Authority, Saint Lukes Episcopal– Presbyterian Hospitals Revenue Bonds, Series 2001, 5.250%, 12/01/26 – FSA Insured | 6/11 at 101.00 | AAA | 1,022,420 | ||||||
| 1,000 | Missouri Health and Educational Facilities Authority, Revenue Bonds, BJC Health System, Series 2003, 5.125%, 5/15/25 | 5/13 at 100.00 | AA | 1,013,290 | ||||||
| 1,000 | Missouri Health and Educational Facilities Authority, Revenue Bonds, BJC Health System, Series 2005A, 5.000%, 5/15/22 | 5/15 at 100.00 | AA | 1,021,780 | ||||||
| 500 | Missouri Health and Educational Facilities Authority, Revenue Bonds, Capital Region Medical Center, Series 1998, 5.250%, 11/01/23 | 11/08 at 100.00 | BBB | 495,290 | ||||||
42
| Principal Amount (000) | Description (1) | Optional Call Provisions (2) | Ratings (3) | Value | ||||||
| Health Care (continued) | ||||||||||
| Missouri Health and Educational Facilities Authority, Revenue Bonds, Freeman Health System, Series 1998: | ||||||||||
| $ | 1,500 | 5.250%, 2/15/18 | 8/08 at 102.00 | BBB+ | $ | 1,507,650 | ||||
| 1,300 | 5.250%, 2/15/28 | 8/08 at 102.00 | BBB+ | 1,273,324 | ||||||
| 2,750 | Missouri Health and Educational Facilities Authority, Revenue Bonds, Lake Regional Health System, Series 2003, 5.700%, 2/15/34 | 2/14 at 100.00 | BBB+ | 2,759,020 | ||||||
| Missouri Health and Educational Facilities Authority, Revenue Bonds, Lester E. Cox Medical Center, Series 1992H: | ||||||||||
| 2,650 | 0.000%, 9/01/17 – MBIA Insured | No Opt. Call | AAA | 1,790,738 | ||||||
| 4,740 | 0.000%, 9/01/21 – MBIA Insured | No Opt. Call | AAA | 2,526,657 | ||||||
| 6,300 | 0.000%, 9/01/22 – MBIA Insured | No Opt. Call | AAA | 3,178,980 | ||||||
| 1,000 | New Liberty Hospital District, Missouri, Revenue Bonds, Series 2001, 5.000%, 12/01/21 – | 12/11 at 100.00 | AAA | 1,014,810 | ||||||
| 2,880 | Taney County Industrial Development Authority, Missouri, Hospital Revenue Bonds, Skaggs Community Hospital Association, Series 1998, 5.400%, 5/15/28 | 11/08 at 101.00 | BBB | 2,833,632 | ||||||
| 36,700 | Total Health Care | 29,448,986 | ||||||||
| Housing/Multifamily – 3.0% | ||||||||||
| 1,320 | Clay County Industrial Development Authority, Missouri, GNMA Multifamily Housing Revenue Bonds, Oak Creek Apartments, Series 2002, 6.125%, 7/20/25 (Alternative Minimum Tax) | 7/13 at 105.00 | AAA | 1,369,328 | ||||||
| Missouri Housing Development Commission, GNMA Collateralized Multifamily Housing Revenue Bonds, JB Hughes Apartments I and II, Series 2002G: | ||||||||||
| 230 | 6.200%, 5/20/19 | 5/12 at 105.00 | Aaa | 248,823 | ||||||
| 975 | 6.300%, 5/20/37 | 5/12 at 105.00 | Aaa | 999,122 | ||||||
| 2,285 | Missouri Housing Development Commission, Multifamily Housing Revenue Bonds, Mansion Apartments II, Series 1999, 6.125%, 4/01/22 (Alternative Minimum Tax) | 10/08 at 102.00 | N/R | 2,298,139 | ||||||
| 1,805 | St. Louis County Industrial Development Authority, Missouri, GNMA Collateralized Subordinate Lien Housing Revenue Refunding Bonds, Southfield and Oak Forest II Apartments, Series 2002A, 5.200%, 1/20/36 | 1/09 at 105.00 | AAA | 1,808,375 | ||||||
| 6,615 | Total Housing/Multifamily | 6,723,787 | ||||||||
| Housing/Single Family – 5.4% | ||||||||||
| Missouri Housing Development Commission, GNMA Single Family Remarketed Mortgage Revenue Bonds, Homeownership Loan Program, Series 1995B: | ||||||||||
| 230 | 6.375%, 9/01/20 (Alternative Minimum Tax) | 9/08 at 100.00 | N/R | 233,091 | ||||||
| 185 | 6.450%, 9/01/27 (Alternative Minimum Tax) | 9/08 at 100.00 | N/R | 187,547 | ||||||
| 75 | Missouri Housing Development Commission, GNMA/FNMA Single Family Mortgage Revenue Bonds, Homeownership Loan Program, Series 1996D, 6.125%, 3/01/28 (Alternative Minimum Tax) | 7/08 at 101.00 | AAA | 76,883 | ||||||
| 20 | Missouri Housing Development Commission, Single Family Mortgage Revenue Bonds, Homeownership Loan Program, Series 1995C, 7.250%, 9/01/26 (Alternative Minimum Tax) | 9/08 at 103.00 | AAA | 20,352 | ||||||
| 95 | Missouri Housing Development Commission, Single Family Mortgage Revenue Bonds, Homeownership Loan Program, Series 1998B-2, 6.400%, 3/01/29 (Alternative Minimum Tax) | 9/08 at 105.00 | AAA | 98,019 | ||||||
| 250 | Missouri Housing Development Commission, Single Family Mortgage Revenue Bonds, Homeownership Loan Program, Series 2000A-1, 6.300%, 9/01/25 (Alternative Minimum Tax) | 9/09 at 100.00 | AAA | 253,305 | ||||||
| 175 | Missouri Housing Development Commission, Single Family Mortgage Revenue Bonds, Homeownership Loan Program, Series 2000B-1, 6.200%, 9/01/25 (Alternative Minimum Tax) | 3/10 at 100.00 | AAA | 181,468 | ||||||
| 2,210 | Missouri Housing Development Commission, Single Family Mortgage Revenue Bonds, Homeownership Loan Program, Series 2005A-1, 5.900%, 9/01/35 (Alternative Minimum Tax) | 9/14 at 100.00 | AAA | 2,270,245 | ||||||
| 4,135 | Missouri Housing Development Commission, Single Family Mortgage Revenue Bonds, Homeownership Loan Program, Series 2006E-1, 5.600%, 3/01/37 (Alternative Minimum Tax) | 3/16 at 104.50 | AAA | 4,186,273 | ||||||
| 2,315 | Missouri Housing Development Commission, Single Family Mortgage Revenue Bonds, Homeownership Loan Program, Series 2007A-1, 4.700%, 9/01/27 (Alternative Minimum Tax) | 9/16 at 100.00 | AAA | 2,145,843 | ||||||
43
Portfolio of Investments
Nuveen Missouri Municipal Bond Fund (continued)
May 31, 2008
| Principal Amount (000) | Description (1) | Optional Call Provisions (2) | Ratings (3) | Value | ||||||
| Housing/Single Family (continued) | ||||||||||
| $ | 2,675 | Missouri Housing Development Commission, Single Family Mortgage Revenue Bonds, Homeownership Loan Program, Series 2007E-1, 5.200%, 9/01/38 (Alternative Minimum Tax) | No Opt. Call | AAA | $ | 2,583,863 | ||||
| 12,365 | Total Housing/Single Family | 12,236,889 | ||||||||
| Long-Term Care – 5.8% | ||||||||||
| 1,000 | Cole County Industrial Development Authority, Missouri, Revenue Bonds, Lutheran Senior Services – Heisinger Project, Series 2004, 5.500%, 2/01/35 | 2/14 at 100.00 | N/R | 984,790 | ||||||
| 4,250 | Kansas City Industrial Development Authority, Missouri, Retirement Center Revenue Refunding and Improvement Bonds, Kingswood Project, Series 1998A, 5.875%, 11/15/29 | 11/08 at 102.00 | N/R | 3,838,132 | ||||||
| 2,525 | Lees Summit Industrial Development Authority, Missouri, Revenue Bonds, John Knox Village Obligated Group, Series 2007A, 5.125%, 8/15/32 | 8/17 at 100.00 | N/R | 2,136,655 | ||||||
| 1,285 | Missouri Development Finance Board, Healthcare Facilities Revenue Bonds, Lutheran Home for the Aged, Series 2001A, 5.600%, 11/01/21 | 11/11 at 100.00 | A2 | 1,308,901 | ||||||
| 2,000 | Missouri Health and Educational Facilities Authority, Revenue Bonds, Lutheran Senior Services, Series 2007A, 4.875%, 2/01/37 | 2/17 at 100.00 | N/R | 1,708,200 | ||||||
| 1,200 | St. Louis County Industrial Development Authority, Missouri, GNMA Collateralized Healthcare Facilities Revenue Bonds, Mary, Queen and Mother Association, Series 2001, 5.400%, 9/20/34 | 3/10 at 102.00 | AAA | 1,216,764 | ||||||
| 2,000 | St. Louis County Industrial Development Authority, Missouri, Revenue Bonds, Friendship Village of West County, Series 2007A, 5.500%, 9/01/28 | 9/17 at 100.00 | N/R | 1,887,940 | ||||||
| 14,260 | Total Long-Term Care | 13,081,382 | ||||||||
| Materials – 0.4% | ||||||||||
| 1,000 | Sugar Creek, Missouri, Industrial Development Revenue Bonds, Lafarge North America Inc., Series 2003A, 5.650%, 6/01/37 (Alternative Minimum Tax) | 6/13 at 101.00 | BBB | 900,820 | ||||||
| Tax Obligation/General – 17.8% | ||||||||||
| 2,000 | Cass County Reorganized School District R-II, Raymore and Peculiar, Missouri, General Obligation Bonds, Series 2002, 5.250%, 3/01/20 – FSA Insured | 3/12 at 100.00 | AAA | 2,145,560 | ||||||
| 540 | Clay County Public School District 53, Liberty, Missouri, General Obligation Bonds, Series 2001C, 5.200%, 3/01/21 | 3/12 at 100.00 | AA+ | 569,171 | ||||||
| 1,280 | Clay County Public School District 53, Liberty, Missouri, General Obligation Bonds, Series 2002B, 5.000%, 3/01/22 – FSA Insured | 3/12 at 100.00 | AAA | 1,329,997 | ||||||
| 1,000 | Greene County Reorganized School District R8, Missouri, General Obligation Bonds, Series 2002, 5.250%, 3/01/20 – FSA Insured | 3/12 at 100.00 | AAA | 1,072,780 | ||||||
| 2,500 | Hickman Mills C-1 School District, Jackson County, Missouri, General Obligation Bonds, Series 2003, 5.000%, 3/01/21 – FSA Insured | 3/13 at 100.00 | AAA | 2,620,425 | ||||||
| 1,450 | Jackson County Reorganized School District R-7, Lees Summit, Missouri, General Obligation Bonds, Series 2004, 5.000%, 3/01/21 – MBIA Insured | 3/14 at 100.00 | Aaa | 1,524,835 | ||||||
| 3,000 | Kansas City, Missouri, General Obligation Bonds, Series 2004F, 5.000%, 2/01/24 | 2/14 at 100.00 | AA | 3,121,320 | ||||||
| 2,000 | Miller County School District R-2, Osage, Missouri, General Obligation Bonds, Series 2006, 5.000%, 3/01/24 – FSA Insured | 3/16 at 100.00 | AAA | 2,090,000 | ||||||
| Missouri School Boards Association, Lease Participation Certificates, Clay County School District 53 Liberty, Series 2007: | ||||||||||
| 1,070 | 5.250%, 3/01/26 – FSA Insured | 3/17 at 100.00 | AAA | 1,139,400 | ||||||
| 625 | 5.250%, 3/01/27 – FSA Insured | 3/17 at 100.00 | AAA | 664,138 | ||||||
| 1,250 | Nixa Reorganized School District R 02, Missouri, General Obligation Bonds, Series 2006, 5.250%, 3/01/24 – FSA Insured | 3/16 at 100.00 | AAA | 1,336,850 | ||||||
| 1,240 | North Kansas City School District 74, Clay County, Missouri, General Obligation Bonds, Direct Deposit Program, Series 2007, 5.000%, 3/01/27 | 3/18 at 100.00 | AA+ | 1,302,422 | ||||||
| 4,500 | North Kansas City School District 74, Clay County, Missouri, General Obligation Bonds, Series 2005, 5.000%, 3/01/25 | 3/15 at 100.00 | AA+ | 4,690,664 | ||||||
44
| Principal Amount (000) | Description (1) | Optional Call Provisions (2) | Ratings (3) | Value | ||||||
| Tax Obligation/General (continued) | ||||||||||
| $ | 1,000 | Pevely, Missouri, General Obligation Bonds, Series 2004, 5.250%, 3/01/24 – RAAI Insured | 3/13 at 100.00 | AA | $ | 1,009,960 | ||||
| 2,275 | Platte County Reorganized School District R3, Missouri, General Obligation Bonds, Series 2004, 5.000%, 3/01/20 – MBIA Insured | 3/14 at 100.00 | AAA | 2,406,563 | ||||||
| 750 | Polk County R-1 School District, Bolivar, Missouri, General Obligation Bonds, Missouri Direct Deposit Program, Series 2000, 5.700%, 3/01/20 | 3/10 at 100.00 | AA+ | 790,965 | ||||||
| Springfield School District R12, Missouri, General Obligation Bonds, Series 2003: | ||||||||||
| 2,875 | 5.125%, 3/01/20 – FGIC Insured | 3/13 at 100.00 | AA+ | 3,032,004 | ||||||
| 3,000 | 5.000%, 3/01/22 – FGIC Insured | 3/13 at 100.00 | AA+ | 3,106,170 | ||||||
| 1,250 | 5.000%, 3/01/23 – FGIC Insured | 3/13 at 100.00 | AA+ | 1,291,125 | ||||||
| 1,605 | St. Louis Board of Education, Missouri, General Obligation Refunding Bonds, Series 2003A, 5.000%, 4/01/20 – FSA Insured | 4/13 at 100.00 | AAA | 1,691,092 | ||||||
| 1,345 | St. Louis County Pattonville School District R3, Missouri, General Obligation Bonds, Series 2000, 6.500%, 3/01/14 – FGIC Insured | No Opt. Call | AA– | 1,567,988 | ||||||
| 1,450 | St. Louis County Pattonville School District R3, Missouri, General Obligation Bonds, Series 2004, 5.250%, 3/01/20 – FSA Insured | 3/14 at 100.00 | AAA | 1,568,538 | ||||||
| 38,005 | Total Tax Obligation/General | 40,071,967 | ||||||||
| Tax Obligation/Limited – 18.9% | ||||||||||
| 260 | Brentwood, Missouri, Tax Increment Refunding Bonds, Promenade Project, Series 2002, 4.700%, 4/01/19 – RAAI Insured | 4/09 at 100.00 | AA | 265,980 | ||||||
| 1,290 | Cape Girardeau County Building Corporation, Missouri, Leasehold Revenue Bonds, Reorganized School District R-02, Jackson R-II School District High School Project, Series 2005, 5.250%, 3/01/21 – | 3/16 at 100.00 | AAA | 1,367,800 | ||||||
| 1,875 | Christian County Public Building Corporation, Missouri, Leasehold Revenue Bonds, Justice Center Project, Series 2000, 5.450%, 6/01/15 – RAAI Insured | 6/10 at 100.00 | AA | 1,957,950 | ||||||
| 420 | Cottleville, Missouri, Certificates of Participation, Series 2006, 5.250%, 8/01/31 | 8/14 at 100.00 | N/R | 395,825 | ||||||
| 1,035 | Dunklin County, Missouri, Certificates of Participation, Series 2004, 5.000%, 12/01/19 – FGIC Insured | 12/14 at 100.00 | Baa3 | 1,107,936 | ||||||
| 2,445 | Fenton, Missouri, Tax Increment Revenue Bonds, Gravois Bluffs Redevelopment Project, Series 2006, 4.500%, 4/01/21 | 4/14 at 100.00 | N/R | 2,438,961 | ||||||
| 1,685 | Fulton, Missouri, Tax Increment Revenue Bonds, Fulton Commons Redevelopment Project, Series 2006, 5.000%, 6/01/28 | 6/16 at 100.00 | N/R | 1,428,509 | ||||||
| 3,000 | Harrisonville, Missouri, Lease Participation Certificates, Series 2003, 5.000%, 12/01/22 – XLCA Insured | 12/13 at 100.00 | A– | 3,053,370 | ||||||
| 2,525 | Kansas City Tax Increment Financing District, Missouri, Tax Increment Revenue Bonds, Briarcliff West Project, Series 2006A, 5.400%, 6/01/24 | 6/14 at 102.00 | N/R | 2,273,258 | ||||||
| 500 | Kansas City Tax Increment Financing District, Missouri, Tax Increment Revenue Bonds, Maincor Project, Series 2007A, 5.250%, 3/01/18 | No Opt. Call | N/R | 486,755 | ||||||
| 3,885 | Missouri Association of Rural Education, Pulaski County, Certificates of Participation, Waynesville School District R-6, Series 2004, 5.100%, 3/01/24 – MBIA Insured | 3/09 at 100.00 | AAA | 3,926,802 | ||||||
| 2,335 | Missouri Development Finance Board, Independence, Infrastructure Facilities Revenue Bonds, Crackerneck Creek Project, Series 2006C, 5.000%, 3/01/28 | 3/16 at 100.00 | A+ | 2,320,336 | ||||||
| 1,920 | Missouri Development Finance Board, Infrastructure Facilities Revenue Bonds, Branson Landing Project, Series 2005A, 5.000%, 6/01/35 | 6/15 at 100.00 | BBB+ | 1,705,747 | ||||||
| 450 | Monarch-Chesterfield Levee District, St. Louis County, Missouri, Levee District Improvement Bonds, Series 1999, 5.750%, 3/01/19 – MBIA Insured | 3/10 at 101.00 | AAA | 473,598 | ||||||
| 1,705 | O’Fallon, Missouri, Certificates of Participation, Series 2002, 5.250%, 2/01/15 – MBIA Insured | 2/12 at 100.00 | Aaa | 1,804,231 | ||||||
| 1,000 | Osage Beach, Missouri, Tax Increment Revenue Bonds, Prewitts Point Transportation Development District, Series 2006, 5.000%, 5/01/23 | 5/12 at 102.00 | N/R | 879,350 | ||||||
| 3,000 | Puerto Rico Public Buildings Authority, Guaranteed Government Facilities Revenue Bonds, Series 1993L, 5.500%, 7/01/21 | No Opt. Call | BBB– | 3,342,960 | ||||||
45
Portfolio of Investments
Nuveen Missouri Municipal Bond Fund (continued)
May 31, 2008
| Principal Amount (000) | Description (1) | Optional Call Provisions (2) | Ratings (3) | Value | |||||||
| Tax Obligation/Limited (continued) | |||||||||||
| $ | 1,050 | Riverside Industrial Development Authority, Missouri, Industrial Development Revenue Bonds, Riverside Horizon, Series 2007A, 5.000%, 5/01/27 – ACA Insured | 5/17 at 100.00 | BBB | $ | 977,256 | |||||
| 1,170 | Riverside, Missouri, L-385 Levee Redevelopment Plan Tax Increment Revenue Bonds, Series 2004, 5.250%, 5/01/20 | 5/15 at 100.00 | BBB | 1,164,314 | |||||||
| 1,945 | Springfield Center City Development Corporation, Missouri, Lease Revenue Bonds, Jordan Valley Park Exposition Center, Series 2002A, 5.000%, 6/01/27 – AMBAC Insured | 6/12 at 100.00 | Aaa | 1,975,984 | |||||||
| 2,950 | Springfield Public Building Corporation, Missouri, Lease Revenue Bonds, Jordan Valley Park Projects, Series 2000A, 6.125%, 6/01/21 – AMBAC Insured | 6/10 at 100.00 | AAA | 3,115,230 | |||||||
| 2,500 | Springfield Public Building Corporation, Missouri, Lease Revenue Bonds, Series 2004, 5.000%, 3/01/24 – AMBAC Insured | 3/14 at 100.00 | Aaa | 2,580,475 | |||||||
| St. Joseph Industrial Development Authority, Missouri, Tax Increment Bonds, Shoppes at North Village Project, Series 2005A: | |||||||||||
| 660 | 5.375%, 11/01/24 | 11/14 at 100.00 | N/R | 604,052 | |||||||
| 1,600 | 5.500%, 11/01/27 | 11/14 at 100.00 | N/R | 1,458,480 | |||||||
| 1,800 | St. Joseph Industrial Development Authority, Missouri, Tax Increment Bonds, Shoppes at North Village Project, Series 2005B, 5.500%, 11/01/27 | 11/14 at 100.00 | N/R | 1,640,790 | |||||||
| 43,005 | Total Tax Obligation/Limited | 42,745,949 | |||||||||
| Transportation – 4.5% | |||||||||||
| 2,000 | Kansas City, Missouri, Passenger Facility Charge Revenue Bonds, Kansas City International Airport, Series 2001, 5.000%, 4/01/23 – AMBAC Insured (Alternative Minimum Tax) | 4/11 at 101.00 | AAA | 1,973,080 | |||||||
| St. Louis Land Clearance Redevelopment Authority, Missouri, Revenue Refunding and Improvement Bonds, LCRA Parking Facilities, Series 1999C: | |||||||||||
| 1,000 | 7.000%, 9/01/19 | 9/09 at 102.00 | N/R | 1,017,380 | |||||||
| 2,400 | 7.050%, 9/01/24 | 9/09 at 102.00 | N/R | 2,418,624 | |||||||
| St. Louis, Missouri, Airport Revenue Refunding Bonds, Series 2003A: | |||||||||||
| 3,450 | 5.250%, 7/01/16 – FSA Insured | 7/13 at 100.00 | AAA | 3,677,631 | |||||||
| 1,000 | 5.250%, 7/01/18 – FSA Insured | 7/13 at 100.00 | AAA | 1,054,150 | |||||||
| 9,850 | Total Transportation | 10,140,865 | |||||||||
| U.S. Guaranteed – 6.6% (4) | |||||||||||
| 4,500 | Cape Girardeau County, Missouri, Single Family Mortgage Revenue Bonds, Series 1983, 0.000%, 12/01/14 (ETM) | No Opt. Call | Aaa | 3,562,065 | |||||||
| 1,025 | Excelsior Springs School District, Missouri, Leasehold Revenue Bonds, Series 1994, 0.000%, 3/01/14 – FSA Insured (ETM) | No Opt. Call | AAA | 836,687 | |||||||
| 2,500 | Fenton, Missouri, Tax Increment Refunding and Improvement Revenue Bonds, Gravois Bluffs Redevelopment Project, Series 2002, 6.125%, 10/01/21 (Pre-refunded 10/01/12) | 10/12 at 100.00 | N/R | (4) | 2,801,800 | ||||||
| 770 | Jefferson City School District, Missouri, General Obligation Bonds, Series 1991A, 6.700%, 3/01/11 (ETM) | No Opt. Call | Aa2 | (4) | 823,746 | ||||||
| 1,500 | Lees Summit Industrial Development Authority, Missouri, Health Facilities Revenue Bonds, John Knox Village, Series 2002, 5.700%, 8/15/22 (Pre-refunded 8/15/12) | 8/12 at 101.00 | N/R | (4) | 1,650,870 | ||||||
| 2,000 | Missouri Development Finance Board, Infrastructure Facilities Revenue Bonds, Riverside-Quindaro Bend Levee District L-385, Series 2001, 5.800%, 3/01/20 (Pre-refunded 3/01/10) | 3/10 at 100.00 | N/R | (4) | 2,107,540 | ||||||
| 2,000 | Missouri Health and Educational Facilities Authority, Revenue Bonds, St. Anthony’s Medical Center, Series 2000, 6.250%, 12/01/30 (Pre-refunded 12/01/10) | 12/10 at 101.00 | A | (4) | 2,199,200 | ||||||
| 750 | Texas County, Missouri, Hospital Revenue Bonds, Texas County Memorial Hospital, Series 2000, 7.250%, 6/15/25 (Pre-refunded 6/15/10) | 6/10 at 100.00 | N/R | (4) | 820,343 | ||||||
| 15,045 | Total U.S. Guaranteed | 14,802,251 | |||||||||
| Utilities – 4.2% | |||||||||||
| 2,710 | Columbia, Missouri, Water and Electric Revenue Bonds, Series 2002A, 5.000%, 10/01/26 – | 10/12 at 100.00 | AAA | 2,773,387 | |||||||
46
| Principal Amount (000) | Description (1) | Optional Call Provisions (2) | Ratings (3) | Value | ||||||
| Utilities (continued) | ||||||||||
| $ | 1,195 | Nixa, Missouri, Electric System Revenue Bonds, Series 2005, 5.000%, 4/01/25 – XLCA Insured | 4/13 at 100.00 | A– | $ | 1,178,868 | ||||
| 2,000 | Puerto Rico Electric Power Authority, Power Revenue Bonds, Series 2003NN, 5.250%, 7/01/23 – MBIA Insured | No Opt. Call | AAA | 2,131,220 | ||||||
| 3,030 | Sikeston, Missouri, Electric System Revenue Refunding Bonds, Series 1996, 6.000%, 6/01/14 – MBIA Insured | No Opt. Call | AAA | 3,412,295 | ||||||
| 8,935 | Total Utilities | 9,495,770 | ||||||||
| Water and Sewer – 7.4% | ||||||||||
| 1,825 | Kansas City, Missouri, Sewerage System Revenue Bonds, Series 2002D-1, 5.375%, 1/01/22 | 1/12 at 100.00 | AA | 1,922,327 | ||||||
| 3,385 | Metropolitan St. Louis Sewerage District, Missouri, Revenue Bonds, Wastewater System, Series 2004A, 5.000%, 5/01/20 – MBIA Insured | 5/14 at 100.00 | AAA | 3,582,582 | ||||||
| 1,600 | Missouri Development Finance Board, Independence, Infrastructure Facilities Revenue Bonds, Water System Improvement Projects, Series 2004, 5.000%, 11/01/24 – AMBAC Insured | 11/14 at 100.00 | AAA | 1,638,736 | ||||||
| 2,965 | Missouri Environmental Improvement and Energy Resources Authority, Water Facility Revenue Bonds, Missouri-American Water Company, Series 2006, 4.600%, 12/01/36 – AMBAC Insured (Alternative Minimum Tax) (UB) | 12/16 at 100.00 | AAA | 2,634,580 | ||||||
| 1,635 | Missouri Environmental Improvement and Energy Resources Authority, Water Facility Revenue Refunding Bonds, Tri-County Water Authority, Series 1999, 6.000%, 4/01/22 – RAAI Insured | 4/09 at 100.00 | AA | 1,658,544 | ||||||
| 1,000 | Missouri Environmental Improvement and Energy Resources Authority, Water Pollution Control and Drinking Water Revenue Bonds, State Revolving Fund Program, Series 2005A, 5.000%, 7/01/25 | 7/15 at 100.00 | Aaa | 1,046,060 | ||||||
| 1,270 | Puerto Rico Aqueduct and Sewerage Authority, Revenue Bonds, Senior Lien Series 2008A, 6.000%, 7/01/38 | 7/18 at 100.00 | BBB– | 1,345,832 | ||||||
| St. Charles County Public Water Supply District 2, Missouri, Certificates of Participation, Series 2002A: | ||||||||||
| 750 | 5.000%, 12/01/26 – MBIA Insured | 12/11 at 100.00 | Aaa | 755,963 | ||||||
| 1,000 | 5.250%, 12/01/28 – MBIA Insured | 12/11 at 100.00 | Aaa | 1,025,030 | ||||||
| 1,000 | West Plains, Missouri, Sewerage System Revenue Bonds, Series 2004, 5.125%, 7/01/24 – FSA Insured | 7/12 at 100.00 | AAA | 1,051,220 | ||||||
| 16,430 | Total Water and Sewer | 16,660,874 | ||||||||
| $ | 232,000 | Total Investments (cost $223,339,131) – 100.0% | 225,717,759 | |||||||
Floating Rate Obligations – (1.0)% | (2,225,000) | |||||||||
Other Assets Less Liabilities – 1.0% | 2,182,209 | |||||||||
Net Assets – 100% | $ | 225,674,968 | ||||||||
| (1) | All percentages shown in the Portfolio of Investments are based on net assets. |
| (2) | Optional Call Provisions (not covered by the report of independent registered public accounting firm): Dates (month and year) and prices of the earliest optional call or redemption. There may be other call provisions at varying prices at later dates. Certain mortgage-backed securities may be subject to periodic principal paydowns. |
| (3) | Ratings (not covered by the report of independent registered public accounting firm): Using the higher of Standard & Poor’s Group (“Standard & Poor’s”) or Moody’s Investor Service, Inc. (“Moody’s”) rating. Ratings below BBB by Standard & Poor’s or Baa by Moody’s are considered to be below investment grade. |
| The Portfolio of Investments may reflect the ratings on certain bonds insured by ACA, AMBAC, CIFG, FGIC, MBIA, RAAI and XLCA as of May 31, 2008. Please see the Portfolio Managers’ Commentary for an expanded discussion of the affect on the Fund of changes to the ratings of certain bonds in the portfolio resulting from changes to the ratings of the underlying insurers both during the period and after period end. |
| (4) | Backed by an escrow or trust containing sufficient U.S. Government or U.S. Government agency securities which ensure the timely payment of principal and interest. Such investments are normally considered to be equivalent to AAA rated securities. |
| N/R | Not rated. |
| (ETM) | Escrowed to maturity. |
| (UB) | Underlying bond of an inverse floating rate trust reflected as a financing transaction pursuant to the provisions of SFAS No. 140. |
See accompanying notes to financial statements.
47
Portfolio of Investments
Nuveen Ohio Municipal Bond Fund
May 31, 2008
| Principal Amount (000) | Description (1) | Optional Call Provisions (2) | Ratings (3) | Value | ||||||
| Consumer Staples – 3.2% | ||||||||||
| $ | 12,805 | Buckeye Tobacco Settlement Financing Authority, Ohio, Tobacco Settlement Asset-Backed Revenue Bonds, Senior Lien, Series 2007A-2, 5.875%, 6/01/47 | 6/17 at 100.00 | BBB | $ | 10,992,322 | ||||
| 5,990 | Puerto Rico, The Children’s Trust Fund, Tobacco Settlement Asset-Backed Refunding Bonds, Series 2002, 5.375%, 5/15/33 | 5/12 at 100.00 | BBB | 5,709,309 | ||||||
| 18,795 | Total Consumer Staples | 16,701,631 | ||||||||
| Education and Civic Organizations – 7.9% | ||||||||||
| 4,090 | Cleveland State University, Ohio, General Receipts Bonds, Series 2003A, 5.000%, 6/01/23 – FGIC Insured | 6/13 at 100.00 | A | 4,193,600 | ||||||
| Ohio Higher Education Facilities Commission, General Revenue Bonds, Case Western Reserve University, Series 2004A: | ||||||||||
| 2,310 | 5.000%, 12/01/16 – AMBAC Insured | 12/13 at 100.00 | AAA | 2,462,668 | ||||||
| 2,825 | 5.000%, 12/01/17 – AMBAC Insured | 12/13 at 100.00 | AAA | 2,996,647 | ||||||
| 2,975 | 5.000%, 12/01/18 – AMBAC Insured | 12/13 at 100.00 | AAA | 3,136,126 | ||||||
| 3,850 | Ohio Higher Education Facilities Commission, General Revenue Bonds, Kenyon College, Series 2006, 5.000%, 7/01/41 | 7/16 at 100.00 | A+ | 3,843,648 | ||||||
| 1,750 | Ohio Higher Education Facilities Commission, General Revenue Bonds, Oberlin College, Series 2003, 5.125%, 10/01/24 | 10/13 at 100.00 | AA | 1,807,208 | ||||||
| 910 | Ohio Higher Education Facilities Commission, Revenue Bonds, Case Western Reserve University, Series 1990B, 6.500%, 10/01/20 | No Opt. Call | AA– | 1,096,941 | ||||||
| Ohio Higher Education Facilities Commission, Revenue Bonds, Wittenberg University, Series 2005: | ||||||||||
| 1,000 | 5.000%, 12/01/24 | 12/15 at 100.00 | Baa2 | 950,900 | ||||||
| 1,000 | 5.000%, 12/01/29 | 12/15 at 100.00 | Baa2 | 924,940 | ||||||
| 2,730 | Ohio Higher Educational Facilities Commission, Revenue Bonds, Denison University, Series 2004, 5.000%, 11/01/20 | 11/14 at 100.00 | AA | 2,855,116 | ||||||
| Ohio Higher Educational Facilities Commission, Revenue Bonds, University of Dayton, Series 2004: | ||||||||||
| 1,315 | 5.000%, 12/01/25 – AMBAC Insured | 12/14 at 100.00 | AAA | 1,342,050 | ||||||
| 1,060 | 5.000%, 12/01/27 – AMBAC Insured | 12/14 at 100.00 | AAA | 1,075,858 | ||||||
| Ohio Higher Educational Facilities Commission, Revenue Bonds, Wittenberg University, Series 2001: | ||||||||||
| 1,200 | 5.500%, 12/01/21 | 12/11 at 100.00 | Baa2 | 1,206,252 | ||||||
| 2,075 | 5.000%, 12/01/26 | 12/11 at 100.00 | Baa2 | 1,954,339 | ||||||
| 2,000 | Ohio State Higher Education Facilities, Revenue Bonds, Case Western Reserve University, Series 2006, 5.000%, 12/01/44 – MBIA Insured | 12/16 at 100.00 | AAA | 2,041,660 | ||||||
| Ohio University at Athens, Subordinate Lien General Receipts Bonds, Series 2004: | ||||||||||
| 1,855 | 5.000%, 12/01/21 – MBIA Insured | 6/14 at 100.00 | AAA | 1,949,178 | ||||||
| 1,900 | 5.000%, 12/01/23 – MBIA Insured | 6/14 at 100.00 | AAA | 1,955,537 | ||||||
| 1,675 | University of Cincinnati, Ohio, General Receipts Bonds, Series 2004A, 5.000%, 6/01/21 – AMBAC Insured | 6/14 at 100.00 | AAA | 1,739,153 | ||||||
| University of Cincinnati, Ohio, General Receipts Bonds, Series 2004D: | ||||||||||
| 1,325 | 5.000%, 6/01/24 – AMBAC Insured | 6/14 at 100.00 | AAA | 1,360,205 | ||||||
| 1,005 | 5.000%, 6/01/26 – AMBAC Insured | 6/14 at 100.00 | AAA | 1,026,407 | ||||||
| 1,025 | University of Cincinnati, Ohio, General Receipts Bonds, Series 2004E, 5.000%, 6/01/21 – AMBAC Insured | 12/14 at 100.00 | AAA | 1,067,097 | ||||||
| 39,875 | Total Education and Civic Organizations | 40,985,530 | ||||||||
| Health Care – 9.1% | ||||||||||
| 7,000 | Akron, Bath and Copley Joint Township Hospital District, Ohio, Hospital Facilities Revenue Bonds, Summa Health System, Series 1998A, 5.375%, 11/15/24 | 11/09 at 101.00 | Baa1 | 7,031,780 | ||||||
| 1,065 | Akron, Bath and Copley Joint Township Hospital District, Ohio, Hospital Revenue Bonds, Children’s Hospital Medical Center, Series 2003, 5.250%, 11/15/25 – FSA Insured | 11/13 at 100.00 | Aaa | 1,098,579 | ||||||
| 1,000 | Cuyahoga County, Ohio, Hospital Revenue Refunding and Improvement Bonds, MetroHealth System, Series 1997, 5.625%, 2/15/17 – MBIA Insured | 8/08 at 101.00 | AAA | 1,012,310 | ||||||
| 4,400 | Cuyahoga County, Ohio, Revenue Refunding Bonds, Cleveland Clinic Health System, Series 2003A, 6.000%, 1/01/32 | 7/13 at 100.00 | AA– | 4,599,232 | ||||||
48
| Principal Amount (000) | Description (1) | Optional Call Provisions (2) | Ratings (3) | Value | ||||||
| Health Care (continued) | ||||||||||
| $ | 6,000 | Erie County, Ohio, Hospital Facilities Revenue Bonds, Firelands Regional Medical Center Project, Series 2006, 5.250%, 8/15/46 | 8/16 at 100.00 | A | $ | 5,721,600 | ||||
| 2,500 | Erie County, Ohio, Hospital Facilities Revenue Bonds, Firelands Regional Medical Center, Series 2002A, 5.625%, 8/15/32 | 8/12 at 101.00 | A | 2,526,150 | ||||||
| 130 | Franklin County, Ohio, Hospital Revenue Bonds, Holy Cross Health System Corporation, Series 1996, 5.800%, 6/01/16 | 6/08 at 100.00 | AA | 130,208 | ||||||
| 3,000 | Franklin County, Ohio, Hospital Revenue Bonds, Nationwide Children’s Hospital Project, Series 2005, 5.000%, 11/01/40 | 11/18 at 100.00 | Aa2 | 2,978,910 | ||||||
| 785 | Lorain County, Ohio, Hospital Revenue Bonds, Catholic Healthcare Partners, Series 1997B, 5.500%, 9/01/27 – MBIA Insured | 9/08 at 101.00 | AAA | 799,774 | ||||||
| 2,000 | Miami County, Ohio, Hospital Facilities Revenue Refunding Bonds, Upper Valley Medical Center Inc., Series 2006, 5.250%, 5/15/26 | 5/16 at 100.00 | A– | 1,956,740 | ||||||
| 4,000 | Middleburg Heights, Ohio, Hospital Improvement Revenue Refunding Bonds, Southwest General Hospital, Series 1995, 5.625%, 8/15/15 – FSA Insured | 8/08 at 102.00 | AAA | 4,103,600 | ||||||
| 7,000 | Montgomery County, Ohio, Hospital Facilities Revenue Refunding and Improvement Bonds, Kettering Medical Center, Series 1996, 6.250%, 4/01/20 – MBIA Insured | No Opt. Call | AAA | 8,140,020 | ||||||
| 2,520 | Montgomery County, Ohio, Revenue Bonds, Catholic Health Initiatives, Series 2004A, 5.000%, 5/01/32 | No Opt. Call | AA | 2,505,964 | ||||||
| 665 | Richland County, Ohio, Hospital Facilities Revenue Improvement Bonds, MedCentral Health System Obligated Group, Series 2000B, 6.375%, 11/15/22 | 11/10 at 101.00 | A– | 690,057 | ||||||
| 2,700 | Richland County, Ohio, Hospital Revenue Bonds, MidCentral Health System Group, Series 2006, | 11/16 at 100.00 | A– | 2,547,936 | ||||||
| 1,200 | Tuscarawas County, Ohio, Hospital Facilities Revenue Bonds, Union Hospital Project, Series 2001, 5.250%, 10/01/31 – RAAI Insured | 10/11 at 101.00 | AA | 1,182,444 | ||||||
| 45,965 | Total Health Care | 47,025,304 | ||||||||
| Housing/Multifamily – 3.5% | ||||||||||
| 1,035 | Clark County, Ohio, Multifamily Housing Revenue Bonds, Church of God Retirement Home, Series 1998, 6.250%, 11/01/30 (Alternative Minimum Tax) | 11/08 at 103.00 | N/R | 949,385 | ||||||
| 3,045 | Franklin County, Ohio, GNMA Collateralized Multifamily Housing Mortgage Revenue Bonds, Carriage House Apartments Project, Series 2002, 5.400%, 3/20/37 | 9/11 at 102.00 | Aaa | 3,072,679 | ||||||
| 2,705 | Henry County, Ohio, GNMA Collateralized Healthcare Facility Revenue Bonds, Alpine Village Project, Series 1999, 6.375%, 2/20/41 | 8/09 at 102.00 | Aaa | 2,800,865 | ||||||
| 1,805 | Montgomery County, Ohio, GNMA Guaranteed Multifamily Housing Revenue Bonds, Canterbury Court Project, Series 2007, 5.500%, 10/20/42 (Alternative Minimum Tax) | 10/18 at 101.00 | Aaa | 1,769,387 | ||||||
| 4,285 | Ohio Capital Corporation for Housing, FHA-Insured Section 8 Assisted Mortgage Loan Revenue Refunding Bonds, Series 1999D, 5.950%, 2/01/23 | 2/09 at 102.00 | Aa2 | 4,400,824 | ||||||
| 2,370 | Summit County Port Authority, Ohio, Multifamily Housing Revenue Bonds, Callis Tower Apartments Project, Series 2007, 5.250%, 9/20/47 (Alternative Minimum Tax) | 9/17 at 102.00 | AAA | 2,229,293 | ||||||
| 3,000 | Trumbull County, Ohio, Multifamily Housing Revenue Bonds, Royal Mall Apartments, Series 2007, 5.000%, 5/20/49 (Alternative Minimum Tax) | 11/17 at 102.00 | Aaa | 2,698,770 | ||||||
| 18,245 | Total Housing/Multifamily | 17,921,203 | ||||||||
| Housing/Single Family – 0.6% | ||||||||||
| 1,100 | Ohio Housing Finance Agency, GNMA Mortgage-Backed Securities Program Residential Mortgage Revenue Bonds, Series 1998A-1, 5.300%, 9/01/19 – FSA Insured (Alternative Minimum Tax) | 9/08 at 101.50 | Aaa | 1,104,334 | ||||||
| 10 | Ohio Housing Finance Agency, GNMA Mortgage-Backed Securities Program Residential Mortgage Revenue Bonds, Series 1999C, 5.750%, 9/01/30 (Alternative Minimum Tax) | 7/09 at 100.00 | Aaa | 10,108 | ||||||
| 2,000 | Ohio Housing Finance Agency, Single Family Mortgage Revenue Bonds, Series 2006H, 5.000%, 9/01/31 (Alternative Minimum Tax) | 9/15 at 100.00 | Aaa | 1,909,880 | ||||||
| 3,110 | Total Housing/Single Family | 3,024,322 | ||||||||
49
Portfolio of Investments
Nuveen Ohio Municipal Bond Fund (continued)
May 31, 2008
| Principal Amount (000) | Description (1) | Optional Call Provisions (2) | Ratings (3) | Value | ||||||
| Industrials – 2.3% | ||||||||||
| $ | 370 | Cleveland-Cuyahoga County Port Authority, Ohio, Development Revenue Bonds, Bond Fund Program – Columbia National Group Project, Series 2005D, 5.000%, 5/15/20 (Alternative Minimum Tax) | 11/15 at 100.00 | N/R | $ | 347,297 | ||||
| 2,100 | Cleveland-Cuyahoga County Port Authority, Ohio, Development Revenue Bonds, Jergens Inc., Series 1998A, 5.375%, 5/15/18 (Alternative Minimum Tax) | 11/08 at 102.00 | N/R | 2,066,610 | ||||||
| 7,050 | Dayton, Ohio, Special Facilities Revenue Refunding Bonds, Emery Air Freight Corporation and Emery Worldwide Airlines Inc. – Guarantors, Series 1998A, 5.625%, 2/01/18 | 8/08 at 102.00 | AA– | 7,200,236 | ||||||
| Ohio, Economic Development Revenue Bonds, Enterprise Bond Fund Loan Pool, Series 2002-4: | ||||||||||
| 475 | 5.000%, 6/01/15 (Alternative Minimum Tax) | 6/12 at 102.00 | AA– | 491,844 | ||||||
| 675 | 5.450%, 6/01/22 (Alternative Minimum Tax) | 6/12 at 102.00 | AA– | 692,057 | ||||||
| 1,020 | Ohio, Economic Development Revenue Bonds, Enterprise Bond Fund Loan Pool, Series 2002-7, 5.850%, 12/01/22 (Alternative Minimum Tax) | No Opt. Call | AA– | 1,058,638 | ||||||
| 11,690 | Total Industrials | 11,856,682 | ||||||||
| Long-Term Care – 1.9% | ||||||||||
| 3,120 | Franklin County, Ohio, Healthcare Facilities Revenue Bonds, Heinzerling Foundation, Series 1995, 6.200%, 11/01/20 | 11/08 at 100.00 | Aa2 | 3,124,649 | ||||||
| 2,000 | Franklin County, Ohio, Healthcare Facilities Revenue Bonds, Presbyterian Retirement Services, Series 2002A, 5.125%, 7/01/22 – RAAI Insured | 7/12 at 100.00 | AA | 2,011,980 | ||||||
| 3,930 | Hamilton County, Ohio, Health Care Revenue Refunding Bonds, Life Enriching Communities Project, Series 2006A, 5.000%, 1/01/37 | 1/17 at 100.00 | BBB | 3,338,928 | ||||||
| 1,275 | Napoleon, Ohio, FHA-Insured Healthcare Facilities Mortgage Revenue Refunding Bonds, Lutheran Orphans and Old Folks Home Society, Series 1994, 6.875%, 8/01/23 | 8/08 at 100.00 | Aa2 | 1,277,397 | ||||||
| 10,325 | Total Long-Term Care | 9,752,954 | ||||||||
| Materials – 0.6% | ||||||||||
| 1,000 | Toledo-Lucas County Port Authority, Ohio, Port Revenue Bonds, Cargill Inc., Series 2004A, 4.800%, 3/01/22 | 3/14 at 101.00 | A | 995,950 | ||||||
| 2,000 | Toledo-Lucas County Port Authority, Ohio, Port Revenue Bonds, Cargill Inc., Series 2004B, 4.500%, 12/01/15 | No Opt. Call | A | 2,076,740 | ||||||
| 3,000 | Total Materials | 3,072,690 | ||||||||
| Tax Obligation/General – 21.0% | ||||||||||
| Adams County Valley School District, Adams and Highland Counties, Ohio, Unlimited Tax School Improvement General Obligation Bonds, Series 1995: | ||||||||||
| 6,000 | 7.000%, 12/01/15 – MBIA Insured | No Opt. Call | AAA | 6,987,720 | ||||||
| 9,500 | 5.250%, 12/01/21 – MBIA Insured | 6/08 at 100.00 | AAA | 9,514,725 | ||||||
| 600 | Anthony Wayne Local School District, Lucas, Wood and Fulton Counties, Ohio, School Facilities Construction and Improvement Bonds, Series 1995, 0.000%, 12/01/13 – FGIC Insured | No Opt. Call | A2 | 485,718 | ||||||
| 2,105 | Buckeye Valley Local School District, Ohio, Unlimited Tax General Obligation Bonds, Series 1995A, 6.850%, 12/01/15 – MBIA Insured | No Opt. Call | AAA | 2,389,512 | ||||||
| 1,000 | Butler County, Hamilton, Ohio, Limited Tax General Obligation Bonds, One Renaissance Center Acquisition, Series 2001, 5.375%, 11/01/17 – AMBAC Insured | 11/11 at 101.00 | Aaa | 1,076,100 | ||||||
| 2,515 | Canton City School District, Stark County, Ohio, General Obligation Bonds, Series 2005, 5.000%, 12/01/19 – MBIA Insured | 6/15 at 100.00 | AAA | 2,660,996 | ||||||
| 2,295 | Central Ohio Solid Waste Authority, General Obligation Bonds, Series 2004A, 5.000%, 12/01/15 – AMBAC Insured | 6/14 at 100.00 | AAA | 2,485,990 | ||||||
| Chesapeake-Union Exempt Village School District, Ohio, General Obligation Bonds, Series 1986: | ||||||||||
| 125 | 8.500%, 12/01/08 | No Opt. Call | N/R | 128,044 | ||||||
| 130 | 8.500%, 12/01/09 | No Opt. Call | N/R | 138,995 | ||||||
| 1,000 | Clyde-Green Springs Exempt Village School District, Summit County, Ohio, General Obligation Bonds, Series 2008, 5.000%, 12/01/27 – FSA Insured | 6/18 at 100.00 | Aaa | 1,040,730 | ||||||
| 2,675 | Cuyahoga County, Ohio, General Obligation Bonds, Series 2004, 5.000%, 12/01/22 | 12/14 at 100.00 | AA+ | 2,806,369 | ||||||
50
| Principal Amount (000) | Description (1) | Optional Call Provisions (2) | Ratings (3) | Value | ||||||
| Tax Obligation/General (continued) | ||||||||||
| $ | 1,345 | Cuyahoga County, Ohio, Limited Tax General Obligation Bonds, Series 1993, 5.650%, 5/15/18 | No Opt. Call | Aa1 | $ | 1,528,041 | ||||
| 1,000 | Cuyahoga County, Ohio, Limited Tax General Obligation Various Purpose Refunding Bonds, Series 1993B, 5.250%, 10/01/13 | No Opt. Call | AA+ | 1,062,930 | ||||||
| 1,245 | Cuyahoga Falls, Ohio, General Obligation Bonds, Series 2004, 5.000%, 12/01/18 – MBIA Insured | 6/14 at 100.00 | Aaa | 1,332,100 | ||||||
| 1,170 | Dayton, Ohio, General Obligation Bonds, Series 2004, 5.250%, 12/01/15 – AMBAC Insured | 6/14 at 100.00 | AAA | 1,278,927 | ||||||
| Delaware City School District, Delaware County, Ohio, Unlimited Tax General Obligation School Facilities Construction and Improvement Bonds, Series 1995: | ||||||||||
| 1,000 | 0.000%, 12/01/10 – FGIC Insured | No Opt. Call | N/R | 929,490 | ||||||
| 1,000 | 0.000%, 12/01/11 – FGIC Insured | No Opt. Call | N/R | 890,140 | ||||||
| 1,000 | Fairview Park, Ohio, General Obligation Bonds, Series 2005, 5.000%, 12/01/25 – MBIA Insured | 12/15 at 100.00 | Aaa | 1,039,930 | ||||||
| 1,005 | Findlay, Ohio, General Obligation Bonds, Series 2004, 5.250%, 7/01/15 – MBIA Insured | 7/14 at 100.00 | AAA | 1,100,917 | ||||||
| 3,160 | Franklin County, Ohio, General Obligation Bonds, Series 2007, 5.000%, 12/01/28 | 12/17 at 100.00 | AAA | 3,313,450 | ||||||
| 3,040 | Franklin County, Ohio, Limited Tax General Obligation Refunding Bonds, Series 1993, 5.375%, 12/01/20 | 12/08 at 102.00 | AAA | 3,133,723 | ||||||
| 325 | Geauga County, Ohio, Limited Tax General Obligation, Sewer District Improvement Bonds, Bainbridge Water Project, Series 1995, 6.850%, 12/01/10 | 6/08 at 100.00 | Aa2 | 326,209 | ||||||
| 3,810 | Greater Cleveland Regional Transit Authority, Ohio, General Obligation Bonds, Series 2004, 5.000%, 12/01/17 – MBIA Insured | 12/14 at 100.00 | Aaa | 4,101,465 | ||||||
| 2,425 | Hubbard Exempt Village School District, Trumbull County, Ohio, General Obligation Bonds, Classroom Facilities Improvements, Series 2007, 5.000%, 12/01/34 – CIFG Insured | 6/17 at 100.00 | A+ | 2,431,960 | ||||||
| 1,270 | Kenston Local School District, Geauga County, Ohio, General Obligation Bonds, Series 2003, 5.000%, 12/01/23 – MBIA Insured | 6/13 at 100.00 | Aaa | 1,320,063 | ||||||
| 1,400 | Kent City School District, Portage County, Ohio, General Obligation Library Improvement Bonds, Series 2004, 5.000%, 12/01/20 – FGIC Insured | 12/14 at 100.00 | A+ | 1,472,912 | ||||||
| 1,500 | Kettering City School District, Montgomery County, Ohio, General Obligation Bonds, Series 2007, 5.250%, 12/01/31 – FSA Insured | No Opt. Call | AAA | 1,653,375 | ||||||
| 810 | Kettering, Ohio, Limited Tax General Obligation Bonds, Series 1991, 6.650%, 12/01/12 | 6/08 at 100.00 | Aa3 | 812,884 | ||||||
| Kings Local School District, Warren County, Ohio, General Obligation School Improvement Bonds, Series 2005: | ||||||||||
| 1,000 | 5.000%, 12/01/22 – MBIA Insured | 6/15 at 100.00 | AAA | 1,048,720 | ||||||
| 1,480 | 5.000%, 12/01/24 – MBIA Insured | 6/15 at 100.00 | AAA | 1,543,892 | ||||||
| 555 | Lake County, Ohio, Limited Tax Sewer District Improvement Bonds, Series 2000, 5.600%, 12/01/20 | No Opt. Call | Aa2 | 628,299 | ||||||
| 1,725 | Lakewood City School District, Cuyahoga County, Ohio, General Obligation Bonds, Series 2007, 5.000%, 12/01/30 – FGIC Insured | 12/17 at 100.00 | AA– | 1,773,611 | ||||||
| 2,855 | Marysville Exempted School District, Union County, Ohio, General Obligation Bonds, Series 2006, 5.000%, 12/01/24 – FSA Insured | 12/15 at 100.00 | AAA | 2,996,951 | ||||||
| 1,000 | Mason City School District, Counties of Warren and Butler, Ohio, General Obligation Bonds, Series 2007, 5.000%, 12/01/31 | 6/17 at 100.00 | Aa1 | 1,035,930 | ||||||
| 1,265 | Monroe Local School District, Butler County, Ohio, General Obligation Bonds, Series 2002, 5.750%, 12/01/20 – AMBAC Insured | No Opt. Call | Aaa | 1,471,777 | ||||||
| Oak Hills Local School District, Hamilton County, Ohio, General Obligation Bonds, Series 2005: | ||||||||||
| 3,740 | 5.000%, 12/01/23 – FSA Insured | 12/15 at 100.00 | AAA | 3,925,953 | ||||||
| 1,000 | 5.000%, 12/01/25 – FSA Insured | 12/15 at 100.00 | AAA | 1,043,180 | ||||||
| 1,000 | Ohio, Common Schools Capital Facilities, General Obligation Bonds, Series 2001B, 5.000%, 9/15/21 | 9/11 at 100.00 | AA+ | 1,046,680 | ||||||
| 1,000 | Ohio, Full Faith and Credit General Obligation Infrastructure Improvement Bonds, Series 1994, 6.000%, 8/01/10 | No Opt. Call | AA+ | 1,076,060 | ||||||
| 730 | Ohio, General Obligation Bonds, Common Schools, Series 2004B, 5.000%, 3/15/21 | 3/14 at 100.00 | AA+ | 768,486 | ||||||
| 6,055 | Ohio, General Obligation Bonds, Infrastructure Improvements, Series 2003F, 5.000%, 2/01/22 | 2/13 at 100.00 | AA+ | 6,315,486 | ||||||
| 1,845 | Ohio, General Obligation Bonds, Series 2005A, 5.000%, 9/01/16 | 3/15 at 100.00 | AA+ | 2,010,755 | ||||||
51
Portfolio of Investments
Nuveen Ohio Municipal Bond Fund (continued)
May 31, 2008
| Principal Amount (000) | Description (1) | Optional Call Provisions (2) | Ratings (3) | Value | ||||||
| Tax Obligation/General (continued) | ||||||||||
| $ | 8,140 | Ohio, General Obligation Higher Education Capital Facilities Bonds, Series 2001A, 5.000%, 2/01/20 | 2/11 at 100.00 | AA+ | $ | 8,451,355 | ||||
| 1,000 | Olmsted Falls City School District, Cuyahoga County, Ohio, General Obligation Bonds, Series 2007, 5.000%, 12/01/35 – XLCA Insured | 6/17 at 100.00 | A | 1,002,150 | ||||||
| 3,315 | South Point Local School District, Lawrence County, Ohio, General Obligation Bonds, Series 2004, 5.000%, 12/01/24 – FSA Insured | 12/14 at 100.00 | AAA | 3,460,694 | ||||||
| 30 | Strongsville, Ohio, Limited Tax General Obligation Various Purpose Improvement Bonds, Series 1996, 5.950%, 12/01/21 | 6/08 at 101.00 | Aa1 | 30,370 | ||||||
| 2,315 | Summit County, Ohio, General Obligation Bonds, Series 2002R, 5.500%, 12/01/21 – FGIC Insured | No Opt. Call | AA | 2,605,162 | ||||||
| 3,755 | Toledo City School District, Lucas County, Ohio, General Obligation Bonds, Series 2003B, 5.000%, 12/01/22 – FGIC Insured | 12/13 at 100.00 | Baa3 | 3,877,000 | ||||||
| West Chester Township, Butler County, Ohio, General Obligation Bonds, Series 2003: | ||||||||||
| 1,365 | 5.250%, 12/01/19 – MBIA Insured | 12/13 at 100.00 | Aaa | 1,462,802 | ||||||
| 1,515 | 5.250%, 12/01/21 – MBIA Insured | 12/13 at 100.00 | Aaa | 1,623,550 | ||||||
| 2,000 | West Clermont Local School District, Clermont County, Ohio, General Obligation Bonds, Series 2008, 5.000%, 12/01/31 (WI/DD, Settling 6/05/08) – FSA Insured | 12/18 at 100.00 | AAA | 2,081,260 | ||||||
| 103,135 | Total Tax Obligation/General | 108,723,538 | ||||||||
| Tax Obligation/Limited – 12.8% | ||||||||||
| 5,690 | Akron, Ohio, Income Tax Revenue Bonds, Community Learning Centers, Series 2004A, 5.000%, 12/01/33 – FGIC Insured | 12/13 at 100.00 | AA+ | 5,777,455 | ||||||
| Blue Ash, Ohio, Tax Increment Financing Revenue Bonds, Duke Realty Ohio, Series 2006: | ||||||||||
| 950 | 5.000%, 12/01/25 | 12/16 at 102.00 | N/R | 891,965 | ||||||
| 1,165 | 5.000%, 12/01/30 | 12/16 at 102.00 | N/R | 1,048,686 | ||||||
| 1,150 | Cincinnati, Ohio, Economic Development Revenue Bonds, Keystone Parke Project, Series 2008A, 5.000%, 11/01/38 | 11/13 at 102.00 | AA | 1,154,336 | ||||||
| 1,850 | Cleveland-Cuyahoga County Port Authority, Ohio, Development Revenue Bonds, R.I.T.A. Project, Series 2004, 5.000%, 11/15/19 – RAAI Insured | 11/14 at 100.00 | AA | 1,878,509 | ||||||
| 1,380 | Columbus, Ohio, Tax Increment Financing Bonds, Easton Project, Series 2004A, 5.000%, 12/01/25 – AMBAC Insured | 6/14 at 100.00 | AAA | 1,395,677 | ||||||
| 5,615 | Franklin County, Ohio, Excise Tax and Lease Revenue Anticipation Bonds, Convention Facilities Authority, Series 2005, 5.000%, 12/01/25 – AMBAC Insured | 12/15 at 100.00 | AAA | 5,824,664 | ||||||
| Franklin County, Ohio, Excise Tax and Lease Revenue Refunding Anticipation Bonds, Convention Facilities Authority, Series 2007: | ||||||||||
| 2,215 | 5.000%, 12/01/26 | 12/17 at 100.00 | Aaa | 2,299,857 | ||||||
| 2,000 | 5.000%, 12/01/27 | 12/17 at 100.00 | Aaa | 2,071,940 | ||||||
| 1,210 | Groveport, Ohio, Special Obligation Income Tax Receipts Bonds, Series 2002, 5.000%, 12/01/22 – | 12/12 at 100.00 | Aaa | 1,253,258 | ||||||
| Hamilton County Convention Facilities Authority, Ohio, First Lien Revenue Bonds, Series 2004: | ||||||||||
| 2,300 | 5.000%, 12/01/20 – FGIC Insured | 6/14 at 100.00 | A+ | 2,361,617 | ||||||
| 2,535 | 5.000%, 12/01/22 – FGIC Insured | 6/14 at 100.00 | A+ | 2,584,990 | ||||||
| 10,000 | Hamilton County, Ohio, Sales Tax Bonds, Subordinate Lien, Series 2006, 5.000%, 12/01/32 – | 12/16 at 100.00 | Aaa | 10,250,600 | ||||||
| 3,300 | Hamilton County, Ohio, Sales Tax Bonds, Subordinate Series 2000B, 0.000%, 12/01/28 – | No Opt. Call | Aaa | 1,142,724 | ||||||
| 1,485 | New Albany Community Authority, Ohio, Community Facilities Revenue Refunding Bonds, Series 2001B, 5.500%, 10/01/16 – AMBAC Insured | 4/12 at 100.00 | AAA | 1,588,638 | ||||||
| 600 | Ohio Department of Transportation, Certificates of Participation, Panhandle Rail Line, Series 1992A, 6.500%, 4/15/12 – FSA Insured | 10/08 at 100.00 | AAA | 602,058 | ||||||
| 1,050 | Ohio State Building Authority, State Facilities Bonds, Administrative Building Fund Projects, Series 2002A, 5.000%, 4/01/22 – FSA Insured | 4/12 at 100.00 | AAA | 1,091,108 | ||||||
52
| Principal Amount (000) | Description (1) | Optional Call Provisions (2) | Ratings (3) | Value | |||||||
| Tax Obligation/Limited (continued) | |||||||||||
| $ | 1,900 | Ohio State Building Authority, State Facilities Bonds, Administrative Building Fund Projects, Series 2005A, 5.000%, 4/01/25 – FSA Insured | 4/15 at 100.00 | AAA | $ | 1,972,238 | |||||
| 3,135 | Ohio State Building Authority, State Facilities Bonds, Adult Correctional Building Fund Project, Series 2005A, 5.000%, 4/01/23 – FSA Insured | 4/15 at 100.00 | AAA | 3,267,391 | |||||||
| 1,490 | Ohio, State Appropriation Lease Bonds, Mental Health Capital Facilities, Series 2003B-II, 5.000%, 6/01/16 | 6/13 at 100.00 | AA | 1,603,657 | |||||||
| 1,000 | Ohio, State Appropriation Lease Bonds, Parks and Recreation Capital Facilities, Series 2004A-II, 5.000%, 12/01/15 | 12/13 at 100.00 | AA | 1,082,400 | |||||||
| 1,000 | Ohio, State Appropriation Lease Bonds, Parks and Recreation Capital Facilities, Series 2005A-II, 5.250%, 2/01/19 – FSA Insured | 2/15 at 100.00 | AAA | 1,085,950 | |||||||
| 13,100 | Puerto Rico Public Buildings Authority, Guaranteed Government Facilities Revenue Bonds, Series 1993L, 5.500%, 7/01/21 – MBIA Insured | No Opt. Call | AAA | 13,989,353 | |||||||
| 66,120 | Total Tax Obligation/Limited | 66,219,071 | |||||||||
| Transportation – 2.3% | |||||||||||
| 1,000 | Dayton, Ohio, Airport Revenue Bonds, James M. Cox International Airport, Series 2003C, 5.250%, 12/01/27 – RAAI Insured (Alternative Minimum Tax) | 12/13 at 100.00 | AA | 1,000,940 | |||||||
| 10,000 | Ohio Turnpike Commission, Revenue Refunding Bonds, Series 1998A, 5.500%, 2/15/24 – FGIC Insured | No Opt. Call | AA | 11,201,098 | |||||||
| 11,000 | Total Transportation | 12,202,038 | |||||||||
| U.S. Guaranteed – 20.3% (4) | |||||||||||
| 270 | Athens, Ohio, Sanitary Sewer System Mortgage Revenue Bonds, Series 1989, 7.300%, 12/01/14 | 12/09 at 100.00 | N/R | (4) | 286,189 | ||||||
| 700 | Buckeye Local School District, Medina County, Ohio, General Obligation Bonds, Series 2000, 5.500%, 12/01/25 (Pre-refunded 12/01/10) – FGIC Insured | 12/10 at 100.00 | A2 | (4) | 752,248 | ||||||
| Canal Winchester Local School District, Franklin and Fairfield Counties, Ohio, General Obligation Bonds, Series 2005B: | |||||||||||
| 3,420 | 5.000%, 12/01/26 (Pre-refunded 6/01/15) – MBIA Insured | 6/15 at 100.00 | Aaa | 3,780,434 | |||||||
| 3,590 | 5.000%, 12/01/27 (Pre-refunded 6/01/15) – MBIA Insured | 6/15 at 100.00 | Aaa | 3,968,350 | |||||||
| 1,255 | Cincinnati City School District, Hamilton County, Ohio, General Obligation Bonds, Series 2001, 5.375%, 12/01/17 (Pre-refunded 12/01/11) – MBIA Insured | 12/11 at 100.00 | AAA | 1,359,968 | |||||||
| 7,045 | Columbus, Ohio, General Obligation Bonds, Series 2000, 5.250%, 11/15/17 (Pre-refunded 11/15/10) (5) | 11/10 at 101.00 | Aaa | 7,583,520 | |||||||
| 11,900 | Cuyahoga County, Ohio, Hospital Revenue and Improvement Bonds, MetroHealth System, Series 1999, 6.125%, 2/15/24 (Pre-refunded 2/15/09) | 2/09 at 101.00 | A– | (4) | 12,346,248 | ||||||
| 1,235 | Dayton, Ohio, Airport Revenue Bonds, James M. Cox International Airport, Series 2005B, | No Opt. Call | A– | (4) | 1,358,636 | ||||||
| 1,000 | Evergreen Local School District, Ohio, Unlimited Tax General Obligation School Improvement Bonds, Series 1999, 5.625%, 12/01/24 (Pre-refunded 12/01/09) – FGIC Insured | 12/09 at 101.00 | A3 | (4) | 1,060,880 | ||||||
| 1,250 | Hamilton County, Ohio, Healthcare Facilities Revenue Bonds, Twin Towers, Series 1998A, | 10/08 at 101.00 | BBB | (4) | 1,275,325 | ||||||
| 1,200 | Heath City School District, Licking County, Ohio, Unlimited Tax General Obligation School Improvement Bonds, Series 2000A, 5.500%, 12/01/27 (Pre-refunded 12/01/10) – FGIC Insured | 12/10 at 100.00 | A2 | (4) | 1,288,656 | ||||||
| 3,385 | Lakota Local School District, Butler County, Ohio, Unlimited Tax General Obligation School Improvement and Refunding Bonds, Series 2001, 5.125%, 12/01/26 (Pre-refunded 6/01/11) – FGIC Insured | 6/11 at 100.00 | Aa2 | (4) | 3,622,762 | ||||||
| 565 | Lebanon, Ohio, Electric System Mortgage Revenue Bonds, Series 2001, 5.500%, 12/01/17 | 12/10 at 101.00 | AAA | 612,059 | |||||||
| 815 | Lorain, Ohio, Hospital Revenue Refunding Bonds, Lakeland Community Hospital Inc., Series 1992, 6.500%, 11/15/12 (ETM) | 11/08 at 100.00 | A1 | (4) | 859,866 | ||||||
| 1,750 | Medina City School District, Medina County, Ohio, Unlimited Tax General Obligation School Building Construction Bonds, Series 1999, 5.250%, 12/01/28 (Pre-refunded 12/01/09) – FGIC Insured | 12/09 at 100.00 | Aa3 | (4) | 1,829,940 | ||||||
| 1,950 | Montgomery County, Ohio, Health System Revenue Bonds, Franciscan Medical Center – Dayton Campus, Series 1997, 5.500%, 7/01/18 (Pre-refunded 1/01/10) | 1/10 at 100.00 | Baa2 | (4) | 2,033,519 | ||||||
53
Portfolio of Investments
Nuveen Ohio Municipal Bond Fund (continued)
May 31, 2008
| Principal Amount (000) | Description (1) | Optional Call Provisions (2) | Ratings (3) | Value | |||||||
| U.S. Guaranteed (4) (continued) | |||||||||||
| $ | 9,500 | Montgomery County, Ohio, Hospital Facilities Revenue Bonds, Kettering Medical Center, Series 1999, 6.750%, 4/01/22 (Pre-refunded 4/01/10) | 4/10 at 101.00 | A | (4) | $ | 10,336,570 | ||||
| 5,610 | Montgomery County, Ohio, Revenue Bonds, Catholic Health Initiatives, Series 2001, 5.375%, 9/01/21 (ETM) | 9/11 at 100.00 | Aa2 | (4) | 5,910,977 | ||||||
| 2,390 | Montgomery County, Ohio, Revenue Bonds, Catholic Health Initiatives, Series 2001, 5.375%, 9/01/21 (Pre-refunded 9/01/11) | 9/11 at 100.00 | Aa2 | (4) | 2,583,447 | ||||||
| North Royalton City School District, Ohio, School Improvement Bonds, Series 1994: | |||||||||||
| 2,200 | 6.000%, 12/01/14 (Pre-refunded 12/01/09) – MBIA Insured | 12/09 at 102.00 | AAA | 2,367,376 | |||||||
| 2,400 | 6.100%, 12/01/19 (Pre-refunded 12/01/09) – MBIA Insured | 12/09 at 102.00 | AAA | 2,586,120 | |||||||
| Ohio Capital Corporation for Housing, FHA-Insured Section 8 Assisted Mortgage Loan Revenue Refunding Bonds, Series 1999D: | |||||||||||
| 1,330 | 5.950%, 2/01/23 (Pre-refunded 2/01/09) | 2/09 at 102.00 | Aa2 | (4) | 1,391,499 | ||||||
| 700 | 5.950%, 2/01/23 (Pre-refunded 2/01/09) | 2/09 at 102.00 | Aa2 | (4) | 732,368 | ||||||
| 3,000 | Ohio Higher Education Facilities Commission, Revenue Bonds, Case Western Reserve University, Series 2002B, 5.500%, 10/01/22 (Pre-refunded 10/01/12) | 10/12 at 100.00 | AA– | (4) | 3,302,040 | ||||||
| 1,000 | Ohio Higher Educational Facilities Commission, Revenue Bonds, University of Dayton, Series 2000, 5.500%, 12/01/30 (Pre-refunded 12/01/10) – AMBAC Insured | 12/10 at 101.00 | �� | AAA | 1,083,290 | ||||||
| Ohio Housing Finance Agency, Single Family Mortgage Revenue Bonds, Series 1985B: | |||||||||||
| 6,460 | 0.000%, 1/15/15 (Pre-refunded 1/15/11) – FGIC Insured | 1/11 at 67.04 | AAA | 4,011,983 | |||||||
| 5,700 | 0.000%, 1/15/15 (Pre-refunded 7/15/11) – FGIC Insured | 7/11 at 70.48 | AAA | 3,664,074 | |||||||
| 5,065 | Ohio Water Development Authority, Loan Revenue Bonds, Pure Water Development, Series 1990I, 6.000%, 12/01/16 – AMBAC Insured (ETM) | No Opt. Call | AAA | 5,654,465 | |||||||
| Olentangy Local School District, Delaware and Franklin Counties, Ohio, General Obligation Bonds, Series 2004A: | |||||||||||
| 400 | 5.250%, 12/01/21 (Pre-refunded 6/01/14) – FGIC Insured | 6/14 at 100.00 | AA | (4) | 444,184 | ||||||
| 3,055 | 5.250%, 12/01/22 (Pre-refunded 6/01/14) – FGIC Insured | 6/14 at 100.00 | AA | (4) | 3,392,455 | ||||||
| Olentangy Local School District, Delaware and Franklin Counties, Ohio, Various Purpose Bonds, Series 1999: | |||||||||||
| 1,825 | 5.000%, 12/01/27 (Pre-refunded 12/01/09) | 12/09 at 101.00 | AA | (4) | 1,919,316 | ||||||
| 2,210 | 5.000%, 12/01/27 (Pre-refunded 12/01/09) | 12/09 at 101.00 | AA | (4) | 2,324,213 | ||||||
| 1,495 | Otsego Local School District, Wood, Henry and Lucas Counties, Ohio, General Obligation Bonds, Series 2004, 5.375%, 12/01/22 (Pre-refunded 12/01/14) – FSA Insured | 12/14 at 100.00 | Aaa | 1,680,051 | |||||||
| 1,250 | Parma Community General Hospital Association, Ohio, Hospital Revenue Refunding and Improvement Bonds, Series 1998, 5.350%, 11/01/18 (Pre-refunded 11/01/08) | 11/08 at 101.00 | N/R | (4) | 1,280,013 | ||||||
| 500 | Pickerington Local School District, Fairfield County, Ohio, General Obligation Bonds, Series 1993, 0.000%, 12/01/11 – AMBAC Insured (ETM) | No Opt. Call | AAA | 451,100 | |||||||
| 1,335 | Richland County, Ohio, Hospital Facilities Revenue Improvement Bonds, MedCentral Health System Obligated Group, Series 2000B, 6.375%, 11/15/22 (Pre-refunded 11/15/10) | 11/10 at 101.00 | A– | (4) | 1,467,272 | ||||||
| 1,185 | Sugarcreek Local School District, Athens County, Ohio, General Obligation Bonds, Series 2003, 5.250%, 12/01/24 (Pre-refunded 12/01/13) – MBIA Insured | 12/13 at 100.00 | Aaa | 1,309,698 | |||||||
| University of Cincinnati, Ohio, General Receipts Bonds, Series 2001A: | |||||||||||
| 1,500 | 5.750%, 6/01/18 (Pre-refunded 6/01/11) – FGIC Insured | 6/11 at 101.00 | A+ | (4) | 1,646,085 | ||||||
| 1,520 | 5.750%, 6/01/19 (Pre-refunded 6/01/11) – FGIC Insured | 6/11 at 101.00 | A+ | (4) | 1,668,033 | ||||||
| 102,960 | Total U.S. Guaranteed | 105,225,229 | |||||||||
| Utilities – 6.9% | |||||||||||
| 1,535 | Cleveland Public Power System, Ohio, First Mortgage Improvement Revenue Bonds, Series 1994A, 0.000%, 11/15/13 – MBIA Insured | No Opt. Call | AAA | 1,261,678 | |||||||
| Cleveland, Ohio, Public Power System Revenue Bonds, Series 2008B: | |||||||||||
| 4,740 | 0.000%, 11/15/34 – MBIA Insured | No Opt. Call | AAA | 1,178,554 | |||||||
| 2,000 | 5.000%, 11/15/38 – MBIA Insured | 5/18 at 100.00 | AAA | 2,031,320 | |||||||
| 7,500 | 0.000%, 11/15/38 – MBIA Insured | No Opt. Call | AAA | 1,484,250 | |||||||
54
| Principal Amount (000) | Description (1) | Optional Call Provisions (2) | Ratings (3) | Value | ||||||
| Utilities (continued) | ||||||||||
| $ | 5,000 | Ohio Air Quality Development Authority, Revenue Bonds, JMG Funding Limited Partnership Project, Series 1997, 5.625%, 1/01/23 – AMBAC Insured (Alternative Minimum Tax) | 10/08 at 101.00 | Aaa | $ | 5,023,250 | ||||
| Ohio Municipal Electric Generation Agency, Beneficial Interest Certificates, Belleville Hydroelectric Project – Joint Venture 5, Series 2004: | ||||||||||
| 1,000 | 5.000%, 2/15/20 – AMBAC Insured | 2/14 at 100.00 | AAA | 1,027,590 | ||||||
| 5,450 | 5.000%, 2/15/21 – AMBAC Insured | 2/14 at 100.00 | AAA | 5,576,113 | ||||||
| 1,465 | 5.000%, 2/15/22 – AMBAC Insured | 2/14 at 100.00 | AAA | 1,493,289 | ||||||
| 3,295 | 5.000%, 2/15/23 – AMBAC Insured | 2/14 at 100.00 | AAA | 3,348,709 | ||||||
| 7,650 | Ohio Water Development Authority, Solid Waste Disposal Revenue Bonds, Bay Shore Power, Series 1998A, 5.875%, 9/01/20 (Alternative Minimum Tax) | 9/08 at 102.00 | N/R | 7,447,505 | ||||||
| 1,545 | Puerto Rico Electric Power Authority, Power Revenue Refunding Bonds, Series 1989O, 0.000%, 7/01/17 | No Opt. Call | AAA | 1,022,033 | ||||||
| 4,460 | Puerto Rico Industrial, Tourist, Educational, Medical and Environmental Control Facilities Financing Authority, Co-Generation Facility Revenue Bonds, Series 2000A, 6.625%, 6/01/26 (Alternative Minimum Tax) | 6/10 at 101.00 | Baa3 | 4,584,122 | ||||||
| 45,640 | Total Utilities | 35,478,413 | ||||||||
| Water and Sewer – 6.0% | ||||||||||
| 1,730 | Butler County, Ohio, Sewerage System Revenue Bonds, Series 2005, 5.000%, 12/01/23 – FSA Insured | No Opt. Call | Aaa | 1,884,454 | ||||||
| 4,355 | Cincinnati, Ohio, Water System Revenue Bonds, Series 2007B, 5.000%, 12/01/32 | 12/17 at 100.00 | AA+ | 4,508,252 | ||||||
| 865 | City of Marysville, Ohio, Water System Mortgage Revenue Bonds, Series 2007, 5.000%, 12/01/32 – AMBAC Insured | 12/17 at 100.00 | Aaa | 888,710 | ||||||
| 10,325 | Cleveland, Ohio, Waterworks First Mortgage Revenue Refunding and Improvement Bonds, Series 1993G, 5.500%, 1/01/21 – MBIA Insured | No Opt. Call | AAA | 11,658,782 | ||||||
| 1,095 | Hebron, Ohio, Mortgage Revenue Bonds, Waterworks System Improvements, Series 2004, 5.875%, 12/01/25 | 6/14 at 100.00 | N/R | 1,138,986 | ||||||
| 1,260 | Lancaster, Ohio, Wastewater System Improvement Revenue Bonds, Series 2004, 5.000%, 12/01/25 – AMBAC Insured | 12/14 at 100.00 | AAA | 1,278,850 | ||||||
| 4,590 | Marysville, Ohio, Wastewater Treatement System Revenue Bonds, Series 2007, 4.750%, 12/01/47 – XLCA Insured | 12/17 at 100.00 | A– | 4,200,768 | ||||||
| 530 | Ohio Water Development Authority, Revenue Bonds, Drinking Water Assistance Fund, State Match, Series 2008, 5.000%, 6/01/28 – FSA Insured | 6/18 at 100.00 | AAA | 556,383 | ||||||
| 1,255 | Ohio Water Development Authority, Revenue Bonds, Fresh Water Development, Series 2004, 5.250%, 12/01/15 | 6/14 at 100.00 | AAA | 1,379,684 | ||||||
| 3,500 | Ohio Water Development Authority, Water Pollution Control Loan Fund Revenue Bonds, Water Quality Project, Series 2005B, 5.000%, 6/01/25 | 6/15 at 100.00 | AAA | 3,659,705 | ||||||
| 29,505 | Total Water and Sewer | 31,154,574 | ||||||||
| $ | 509,365 | Total Long-Term Investments (cost $498,153,672) – 98.4% | 509,343,179 | |||||||
| Short-Term Investments – 0.4% | ||||||||||
| $ | 2,000 | Scioto County, Ohio, Hospital Facilities Revenue Bonds, Southern Ohio Medical Center, Series 2006B, Variable Rate Demand Obligation, 3.500%, 2/15/36 – AMBAC Insured (6) | AA3 | 2,000,000 | ||||||
Total Short-Term Investments (cost $2,000,000) | 2,000,000 | |||||||||
Total Investments (cost $500,153,672) – 98.8% | 511,343,179 | |||||||||
Other Assets Less Liabilities – 1.2% | 6,364,088 | |||||||||
Net Assets – 100% | $ | 517,707,267 | ||||||||
55
Portfolio of Investments
Nuveen Ohio Municipal Bond Fund (continued)
May 31, 2008
Futures Contracts outstanding at May 31, 2008:
| Type | Contract Position | Number of Contracts | Contract Expiration | Value at May 31, 2008 | Unrealized Appreciation (Depreciation) | ||||||||
| U.S. Treasury Bond | Long | 112 | 9/08 | $ | 12,712,000 | $ | (35,297 | ) | |||||
| (1) | All percentages shown in the Portfolio of Investments are based on net assets. |
| (2) | Optional Call Provisions (not covered by the report of independent registered public accounting firm): Dates (month and year) and prices of the earliest optional call or redemption. There may be other call provisions at varying prices at later dates. Certain mortgage-backed securities may be subject to periodic principal paydowns. |
| (3) | Ratings (not covered by the report of independent registered public accounting firm): Using the higher of Standard & Poor’s Group (“Standard & Poor’s”) or Moody’s Investor Service, Inc. (“Moody’s”) rating. Ratings below BBB by Standard & Poor’s or Baa by Moody’s are considered to be below investment grade. |
| The Portfolio of Investments may reflect the ratings on certain bonds insured by ACA, AMBAC, CIFG, FGIC, MBIA, RAAI and XLCA as of May 31, 2008. Please see the Portfolio Managers’ Commentary for an expanded discussion of the affect on the Fund of changes to the ratings of certain bonds in the portfolio resulting from changes to the ratings of the underlying insurers both during the period and after period end. |
| (4) | Backed by an escrow or trust containing sufficient U.S. Government or U.S. Government agency securities which ensure the timely payment of principal and interest. Such investments are normally considered to be equivalent to AAA rated securities. |
| (5) | Portion of investment, with an aggregate market value of $247,581, has been pledged to collateralize the net payment obligations under futures contracts. |
| (6) | Investment has a maturity of more than one year, but has variable rate and demand features which qualify it as a short-term investment. The rate disclosed is that in effect at the end of the reporting period. This rate changes periodically based on market conditions or a specified market index. |
| N/R | Not rated. |
| WI/DD | Purchased on a when-issued or delayed delivery basis. |
| (ETM) | Escrowed to maturity. |
See accompanying notes to financial statements.
56
Portfolio of Investments
Nuveen Wisconsin Municipal Bond Fund
May 31, 2008
| Principal Amount (000) | Description (1) | Optional Call Provisions (2) | Ratings (3) | Value | ||||||
| Education and Civic Organizations – 1.3% | ||||||||||
| $ | 370 | Puerto Rico Industrial, Tourist, Educational, Medical and Environmental Control Facilities Financing Authority, Higher Education Revenue Bonds, Ana G. Mendez University System, Series 1999, 5.375%, 2/01/29 | 2/09 at 101.00 | BBB– | $ | 353,961 | ||||
| 200 | Puerto Rico Industrial, Tourist, Educational, Medical and Environmental Control Facilities Financing Authority, Higher Education Revenue Bonds, University of the Sacred Heart, Series 2001, 5.250%, 9/01/21 | 9/11 at 100.00 | BBB | 199,510 | ||||||
| 250 | Puerto Rico Industrial, Tourist, Educational, Medical and Environmental Control Facilities Financing Authority, Higher Education Revenue Refunding Bonds, Ana G. Mendez University System, Series 2002, 5.500%, 12/01/31 | 12/12 at 101.00 | BBB– | 240,908 | ||||||
| 820 | Total Education and Civic Organizations | 794,379 | ||||||||
| Health Care – 1.5% | ||||||||||
| 385 | Puerto Rico Industrial, Tourist, Educational, Medical and Environmental Control Facilities Financing Authority, FHA-Insured Mortgage Hospital Revenue Bonds, Doctor Pila Hospital, Series 1995A, 5.875%, 8/01/12 | 8/08 at 100.00 | AAA | 385,974 | ||||||
| 500 | Puerto Rico Industrial, Tourist, Educational, Medical and Environmental Control Facilities Financing Authority, Hospital Revenue Bonds, Auxilio Mutuo Hospital, Series 1995A, 6.250%, 7/01/24 – | 7/08 at 100.00 | AAA | 504,240 | ||||||
| 885 | Total Health Care | 890,214 | ||||||||
| Housing/Multifamily – 6.8% | ||||||||||
| 675 | Kenosha Housing Authority, Wisconsin, GNMA Collateralized Multifamily Housing Revenue Bonds, Villa Ciera Inc., Series 2000A, 5.900%, 11/20/30 | 11/08 at 102.00 | N/R | 684,167 | ||||||
| 570 | Lake Delton Community Development Agency, Wisconsin, GNMA Collateralized Multifamily Housing Revenue Bonds, Woodland Park Project, Series 2001, 5.300%, 2/20/31 (Alternative Minimum Tax) | 1/12 at 102.00 | N/R | 564,009 | ||||||
| 1,000 | Madison Community Development Authority, Wisconsin, GNMA Multifamily Housing Revenue Refunding Bonds, Greentree Glen Apartments, Series 1999A, 5.500%, 9/20/29 (Alternative Minimum Tax) | 9/08 at 100.00 | AAA | 1,000,250 | ||||||
| 200 | Milwaukee Redevelopment Authority, Wisconsin, FHA-Insured Multifamily Housing Revenue Bonds, City Hall Square Apartments, Series 1993, 6.000%, 8/01/22 (Alternative Minimum Tax) | 8/08 at 101.00 | N/R | 201,456 | ||||||
| 500 | Sheboygan Housing Authority, Wisconsin, GNMA Multifamily Revenue Refunding Bonds, Lake Shore Apartments, Series 1998A, 5.100%, 11/20/26 | 11/08 at 100.00 | AAA | 500,070 | ||||||
| 300 | Walworth County Housing Authority, Wisconsin, FHA-Insured Housing Revenue Bonds, Kiwanis Heritage Inc. Senior Apartments, Series 1997, 5.550%, 9/01/22 | 9/08 at 100.00 | N/R | 300,150 | ||||||
| 1,000 | Wisconsin Housing and Economic Development Authority, Housing Revenue Bonds, Series 2006A, 4.550%, 5/01/27 (Alternative Minimum Tax) | 5/16 at 100.00 | AA | 907,270 | ||||||
| 4,245 | Total Housing/Multifamily | 4,157,372 | ||||||||
| Housing/Single Family – 4.3% | ||||||||||
| 50 | Virgin Islands Housing Finance Corporation, GNMA Mortgage-Backed Securities Program Single Family Mortgage Revenue Refunding Bonds, Series 1995A, 6.450%, 3/01/16 (Alternative Minimum Tax) | 9/08 at 100.00 | N/R | 50,048 | ||||||
| Wisconsin Housing and Economic Development Authority, Home Ownership Revenue Bonds, Series 2005E: | ||||||||||
| 1,250 | 4.900%, 11/01/35 | 5/15 at 100.00 | AA | 1,258,263 | ||||||
| 1,300 | 4.900%, 11/01/35 – AMBAC Insured | 5/15 at 100.00 | AAA | 1,310,114 | ||||||
| 2,600 | Total Housing/Single Family | 2,618,425 | ||||||||
| Tax Obligation/General – 0.1% | ||||||||||
| 95 | Guam, General Obligation Bonds, Series 1993A, 5.400%, 11/15/18 | 11/08 at 100.00 | B | 94,960 | ||||||
| Tax Obligation/Limited – 62.5% | ||||||||||
| 1,500 | Ashwaubenon Community Development Authority, Wisconsin, Lease Revenue Refunding Bonds, Arena Project, Series 2002, 5.150%, 6/01/29 | 6/12 at 100.00 | Aa2 | 1,540,275 | ||||||
| 1,000 | De Forest Redevelopment Authority, Wisconsin, Redevelopment Lease Revenue Bonds, Series 1999B, 5.100%, 2/01/18 | 8/08 at 100.00 | N/R | 1,000,560 | ||||||
57
Portfolio of Investments
Nuveen Wisconsin Municipal Bond Fund (continued)
May 31, 2008
| Principal Amount (000) | Description (1) | Optional Call Provisions (2) | Ratings (3) | Value | ||||||
| Tax Obligation/Limited (continued) | ||||||||||
| $ | 2,000 | Glendale Community Development Authority, Wisconsin, Community Development Lease Revenue Bonds, Bayshore Public Parking Project, Series 2004A, 5.000%, 10/01/24 | 10/14 at 100.00 | A3 | $ | 2,047,840 | ||||
| 100 | Glendale Community Development Authority, Wisconsin, Community Development Lease Revenue Refunding Bonds, Tax Increment District 6, Series 2001, 5.000%, 10/01/19 | 10/11 at 100.00 | A3 | 102,414 | ||||||
| 350 | Green Bay Brown County Professional Football Stadium District, Wisconsin, Sales Tax Revenue Bonds, Lambeau Field Renovation Project, Series 2001A, 5.000%, 2/01/19 – AMBAC Insured | 2/11 at 100.00 | AAA | 360,413 | ||||||
| 500 | Jackson Community Development Authority, Wisconsin, Revenue Refunding Bonds, Series 1999, 5.100%, 12/01/17 | 12/09 at 100.00 | N/R | 499,215 | ||||||
| 960 | Madison Community Development Authority, Wisconsin, Lease Revenue Refunding Bonds, Monona Terrace, Series 2002, 4.375%, 3/01/20 | 3/12 at 100.00 | Aa2 | 964,330 | ||||||
| 675 | Milwaukee Redevelopment Authority, Wisconsin, HSI Industrial I LLC Project Revenue Bonds, Series 2008, 5.125%, 6/01/29 (WI/DD, Settling 6/20/08) | 6/16 at 100.00 | Aa3 | 679,624 | ||||||
| 2,000 | Milwaukee Redevelopment Authority, Wisconsin, Lease Revenue Bonds, Neighborhood Public Schools Initiative, Series 2002A, 4.875%, 8/01/21 – AMBAC Insured | 8/12 at 100.00 | AAA | 2,035,180 | ||||||
| 1,000 | Milwaukee Redevelopment Authority, Wisconsin, Lease Revenue Bonds, Neighborhood Public Schools Initiative, Series 2007A, 4.000%, 8/01/23 – AMBAC Insured | 8/17 at 100.00 | Aaa | 982,090 | ||||||
| 275 | Milwaukee Redevelopment Authority, Wisconsin, Lease Revenue Bonds, Public Schools, Series 2005A, 4.600%, 8/01/22 | 8/15 at 100.00 | A2 | 273,229 | ||||||
| Milwaukee Redevelopment Authority, Wisconsin, Revenue Bonds, Summerfest Project, Series 2001: | ||||||||||
| 400 | 4.850%, 8/01/17 | 8/11 at 100.00 | A | 411,096 | ||||||
| 1,000 | 4.950%, 8/01/20 | 8/11 at 100.00 | A | 1,017,110 | ||||||
| 1,500 | Neenah Community Development Authority, Wisconsin, Lease Revenue Bonds, Series 2004A, 5.000%, 12/01/26 | 12/14 at 100.00 | A1 | 1,538,475 | ||||||
| 1,000 | Onalaska Community Development Authority, Wisconsin, Community Development Lease Revenue Bonds, Series 2003, 4.875%, 10/01/27 | 10/13 at 100.00 | A2 | 1,036,750 | ||||||
| 1,500 | Puerto Rico Highway and Transportation Authority, Highway Revenue Bonds, Series 2004-I, 5.000%, 7/01/23 – FGIC Insured | 7/14 at 100.00 | AA | 1,526,700 | ||||||
| Puerto Rico Highway and Transportation Authority, Highway Revenue Bonds, Series 2007N: | ||||||||||
| 2,500 | 5.500%, 7/01/25 – AGC Insured | No Opt. Call | AAA | 2,770,425 | ||||||
| 2,000 | 5.250%, 7/01/33 – MBIA Insured | No Opt. Call | AAA | 2,115,280 | ||||||
| 1,000 | Puerto Rico Infrastructure Financing Authority, Special Tax Revenue Bonds, Series 2005C, 5.500%, 7/01/27 – AMBAC Insured | No Opt. Call | AAA | 1,078,980 | ||||||
| Saint Francis Community Development Authority, Wisconsin, Lease Revenue Bonds, Series 2007: | ||||||||||
| 400 | 4.150%, 3/01/20 | 3/17 at 100.00 | A3 | 404,904 | ||||||
| 300 | 4.350%, 3/01/22 | 3/17 at 100.00 | A3 | 301,719 | ||||||
| 280 | 4.500%, 3/01/24 | 3/17 at 100.00 | A3 | 281,999 | ||||||
| 520 | 4.600%, 3/01/27 | 3/17 at 100.00 | A3 | 523,921 | ||||||
| Southeast Wisconsin Professional Baseball Park District, Sales Tax Revenue Refunding Bonds, Series 1998A: | ||||||||||
| 850 | 5.500%, 12/15/18 – MBIA Insured | No Opt. Call | AAA | 970,726 | ||||||
| 400 | 5.500%, 12/15/19 – MBIA Insured | No Opt. Call | AAA | 455,464 | ||||||
| 2,195 | 5.500%, 12/15/20 – MBIA Insured | No Opt. Call | AAA | 2,496,242 | ||||||
| 500 | 5.500%, 12/15/26 – MBIA Insured | No Opt. Call | AAA | 554,525 | ||||||
| 1,220 | Sturgeon Bay Waterfront Redevelopment Authority, Wisconsin, Lease Revenue Bonds, Series 2006A, 4.500%, 10/01/21 | 10/16 at 100.00 | N/R | 1,191,232 | ||||||
| 1,305 | Sun Prairie Community Development Authority, Wisconsin, Lease Revenue Bonds, Tax Increment District 8, Series 2006, 4.250%, 8/01/25 | 8/16 at 100.00 | A2 | 1,218,439 | ||||||
| 600 | Virgin Islands Public Finance Authority, Senior Lien Revenue Refunding Bonds, Matching Fund Loan Note, Series 1998A, 5.625%, 10/01/25 | 10/08 at 101.00 | BBB | 604,050 | ||||||
| 1,000 | Weston Community Development Authority, Wisconsin, Lease Revenue Bonds, Series 2004A, 5.250%, 10/01/21 | 10/14 at 100.00 | A3 | 1,047,060 | ||||||
58
| Principal Amount (000) | Description (1) | Optional Call Provisions (2) | Ratings (3) | Value | |||||||
| Tax Obligation/Limited (continued) | |||||||||||
| $ | 1,000 | Weston Community Development Authority, Wisconsin, Lease Revenue Bonds, Series 2005A, 5.000%, 10/01/21 | 10/15 at 100.00 | A3 | $ | 1,025,420 | |||||
| Wisconsin Center District, Junior Dedicated Tax Revenue Refunding Bonds, Series 1999: | |||||||||||
| 3,400 | 5.250%, 12/15/23 – FSA Insured | No Opt. Call | AAA | 3,706,337 | |||||||
| 500 | 5.250%, 12/15/27 – FSA Insured | No Opt. Call | AAA | 537,760 | |||||||
| 2,000 | Wisconsin Center District, Senior Dedicated Tax Revenue Refunding Bonds, Series 2003A, 0.000%, 12/15/28 – FSA Insured | No Opt. Call | AAA | 719,420 | |||||||
| 37,730 | Total Tax Obligation/Limited | 38,019,204 | |||||||||
| U.S. Guaranteed – 13.1% (4) | |||||||||||
| Ashwaubenon Community Development Authority, Wisconsin, Lease Revenue Bonds, Arena Project, Series 1999A: | |||||||||||
| 1,000 | 5.700%, 6/01/24 (Pre-refunded 6/01/09) | 6/09 at 100.00 | Aa2 | (4) | 1,037,110 | ||||||
| 700 | 5.800%, 6/01/29 (Pre-refunded 6/01/09) | 6/09 at 100.00 | Aa2 | (4) | 726,670 | ||||||
Green Bay Redevelopment Authority, Wisconsin, Lease Revenue Bonds, Convention Center Project, Series 1999A: | |||||||||||
| 1,300 | 5.250%, 6/01/24 (Pre-refunded 6/01/09) | 6/09 at 100.00 | Aa2 | (4) | 1,342,458 | ||||||
| 1,150 | 5.100%, 6/01/29 (Pre-refunded 6/01/09) | 6/09 at 100.00 | Aa2 | (4) | 1,185,857 | ||||||
| Milwaukee Redevelopment Authority, Wisconsin, Lease Revenue Bonds, Public Schools, Series 2003A: | |||||||||||
| 2,000 | 5.125%, 8/01/21 (Pre-refunded 8/01/13) – AMBAC Insured | 8/13 at 100.00 | AAA | 2,188,200 | |||||||
| 1,000 | 5.125%, 8/01/22 (Pre-refunded 8/01/13) – AMBAC Insured | 8/13 at 100.00 | AAA | 1,094,100 | |||||||
| 375 | Sturgeon Bay Waterfront Redevelopment Authority, Wisconsin, Lease Revenue Bonds, Series 1998A, 5.200%, 10/01/21 (Pre-refunded 10/01/08) | 10/08 at 100.00 | N/R | (4) | 378,878 | ||||||
| 7,525 | Total U.S. Guaranteed | 7,953,273 | |||||||||
| Utilities – 6.8% | |||||||||||
| 1,000 | Puerto Rico Electric Power Authority, Power Revenue Bonds, Series 2003NN, 5.250%, 7/01/23 – MBIA Insured | No Opt. Call | AAA | 1,065,610 | |||||||
| 2,000 | Puerto Rico Electric Power Authority, Power Revenue Bonds, Series 2007TT, 5.000%, 7/01/24 – MBIA Insured | 7/17 at 100.00 | AAA | 2,063,280 | |||||||
| 1,000 | Puerto Rico Electric Power Authority, Power Revenue Bonds, Series 2007VV, 5.250%, 7/01/24 – FGIC Insured | No Opt. Call | A3 | 1,004,270 | |||||||
| 4,000 | Total Utilities | 4,133,160 | |||||||||
| $ | 57,900 | Total Investments (cost $58,269,260) – 96.4% | 58,660,987 | ||||||||
Other Assets Less Liabilities – 3.6% | 2,171,215 | ||||||||||
Net Assets – 100% | $ | 60,832,202 | |||||||||
| (1) | All percentages shown in the Portfolio of Investments are based on net assets. |
| (2) | Optional Call Provisions (not covered by the report of independent registered public accounting firm): Dates (month and year) and prices of the earliest optional call or redemption. There may be other call provisions at varying prices at later dates. Certain mortgage-backed securities may be subject to periodic principal paydowns. |
| (3) | Ratings (not covered by the report of independent registered public accounting firm): Using the higher of Standard & Poor’s Group (“Standard & Poor’s”) or Moody’s Investor Service, Inc. (“Moody’s”) rating. Ratings below BBB by Standard & Poor’s or Baa by Moody’s are considered to be below investment grade. |
| The Portfolio of Investments may reflect the ratings on certain bonds insured by ACA, AMBAC, CIFG, FGIC, MBIA, RAAI and XLCA as of May 31, 2008. Please see the Portfolio Managers’ Commentary for an expanded discussion of the affect on the Fund of changes to the ratings of certain bonds in the portfolio resulting from changes to the ratings of the underlying insurers both during the period and after period end. |
| (4) | Backed by an escrow or trust containing sufficient U.S. Government or U.S. Government agency securities which ensure the timely payment of principal and interest. Such investments are normally considered to be equivalent to AAA rated securities. |
| N/R | Not rated. |
| WI/DD | Purchased on a when-issued or delayed delivery basis. |
See accompanying notes to financial statements.
59
Statement of Assets and Liabilities
May 31, 2008
| Kansas | Kentucky | Michigan | Missouri | Ohio | Wisconsin | |||||||||||||||||||
Assets | ||||||||||||||||||||||||
Investments, at value (cost $121,505,174, $417,810,280, $215,425,965, $223,339,131, $500,153,672 and $58,269,260, respectively) | $ | 122,555,083 | $ | 426,442,316 | $ | 221,194,581 | $ | 225,717,759 | $ | 511,343,179 | $ | 58,660,987 | ||||||||||||
Cash | — | — | — | — | — | 1,415,068 | ||||||||||||||||||
Unrealized appreciation on forward swaps | — | 336,570 | 165,110 | — | — | — | ||||||||||||||||||
Receivables: | ||||||||||||||||||||||||
Interest | 1,938,161 | 5,476,567 | 1,960,314 | 3,072,448 | 9,441,268 | 980,759 | ||||||||||||||||||
Investments sold | 340,000 | 6,180,800 | 891,554 | 2,569,063 | 2,070,000 | 508,889 | ||||||||||||||||||
Shares sold | 70,514 | 205,140 | 309,331 | 336,322 | 963,030 | 89,972 | ||||||||||||||||||
Variation margin on futures contracts | — | 38,156 | — | — | 57,750 | — | ||||||||||||||||||
Other assets | 203 | 47,513 | 26,844 | 13,783 | 58,816 | 2,365 | ||||||||||||||||||
Total assets | 124,903,961 | 438,727,062 | 224,547,734 | 231,709,375 | 523,934,043 | 61,658,040 | ||||||||||||||||||
Liabilities | ||||||||||||||||||||||||
Cash overdraft | 94,005 | 3,272,564 | 59,621 | 3,145,869 | 2,344,531 | — | ||||||||||||||||||
Floating rate obligations | — | 7,680,000 | — | 2,225,000 | — | — | ||||||||||||||||||
Payables: | ||||||||||||||||||||||||
Investments purchased | — | 4,033,609 | 4,844,969 | — | 2,071,000 | 675,000 | ||||||||||||||||||
Shares redeemed | 110,185 | 762,489 | 323,964 | 58,082 | 480,247 | 4,221 | ||||||||||||||||||
Accrued expenses: | ||||||||||||||||||||||||
Management fees | 56,591 | 187,087 | 98,605 | 101,573 | 227,968 | 27,404 | ||||||||||||||||||
12b-1 distribution and service fees | 33,291 | 99,100 | 53,414 | 51,589 | 98,838 | 14,264 | ||||||||||||||||||
Other | 39,783 | 144,040 | 84,405 | 73,611 | 179,389 | 24,019 | ||||||||||||||||||
Dividends payable | 206,689 | 649,328 | 393,115 | 378,683 | 824,803 | 80,930 | ||||||||||||||||||
Total liabilities | 540,544 | 16,828,217 | 5,858,093 | 6,034,407 | 6,226,776 | 825,838 | ||||||||||||||||||
Net assets | $ | 124,363,417 | $ | 421,898,845 | $ | 218,689,641 | $ | 225,674,968 | $ | 517,707,267 | $ | 60,832,202 | ||||||||||||
Class A Shares | ||||||||||||||||||||||||
Net assets | $ | 94,258,596 | $ | 362,733,883 | $ | 159,695,541 | $ | 195,691,075 | $ | 338,770,314 | $ | 50,640,156 | ||||||||||||
Shares outstanding | 9,213,343 | 33,635,868 | 14,322,852 | 18,241,452 | 30,817,728 | 5,017,909 | ||||||||||||||||||
Net asset value per share | $ | 10.23 | $ | 10.78 | $ | 11.15 | $ | 10.73 | $ | 10.99 | $ | 10.09 | ||||||||||||
Offering price per share (net asset value per share plus | $ | 10.68 | $ | 11.25 | $ | 11.64 | $ | 11.20 | $ | 11.47 | $ | 10.53 | ||||||||||||
Class B Shares | ||||||||||||||||||||||||
Net assets | $ | 4,721,147 | $ | 9,685,498 | $ | 4,080,381 | $ | 5,785,195 | $ | 11,576,978 | $ | 2,174,241 | ||||||||||||
Shares outstanding | 465,473 | 897,382 | 365,149 | 538,621 | 1,054,867 | 214,938 | ||||||||||||||||||
Net asset value and offering price per share | $ | 10.14 | $ | 10.79 | $ | 11.17 | $ | 10.74 | $ | 10.97 | $ | 10.12 | ||||||||||||
Class C Shares | ||||||||||||||||||||||||
Net assets | $ | 21,090,359 | $ | 46,588,350 | $ | 35,813,576 | $ | 21,541,334 | $ | 50,641,794 | $ | 6,511,730 | ||||||||||||
Shares outstanding | 2,061,842 | 4,319,268 | 3,213,280 | 2,009,963 | 4,620,429 | 644,296 | ||||||||||||||||||
Net asset value and offering price per share | $ | 10.23 | $ | 10.79 | $ | 11.15 | $ | 10.72 | $ | 10.96 | $ | 10.11 | ||||||||||||
Class I Shares(1) | ||||||||||||||||||||||||
Net assets | $ | 4,293,315 | $ | 2,891,114 | $ | 19,100,143 | $ | 2,657,364 | $ | 116,718,181 | $ | 1,506,075 | ||||||||||||
Shares outstanding | 417,943 | 268,055 | 1,713,297 | 247,596 | 10,635,955 | 148,847 | ||||||||||||||||||
Net asset value and offering price per share | $ | 10.27 | $ | 10.79 | $ | 11.15 | $ | 10.73 | $ | 10.97 | $ | 10.12 | ||||||||||||
Net Assets Consist of: | ||||||||||||||||||||||||
Capital paid-in | $ | 123,255,186 | $ | 412,785,733 | $ | 212,900,452 | $ | 222,147,716 | $ | 505,927,343 | $ | 60,509,644 | ||||||||||||
Undistributed (Over-distribution of) net investment income | 88,875 | (733,880 | ) | (203,264 | ) | (1,480 | ) | (217,369 | ) | (74,609 | ) | |||||||||||||
Accumulated net realized gain (loss) from investments and derivative transactions | (30,553 | ) | 901,444 | 58,727 | 1,150,104 | 843,083 | 5,440 | |||||||||||||||||
Net unrealized appreciation (depreciation) of investments and derivative transactions | 1,049,909 | 8,945,548 | 5,933,726 | 2,378,628 | 11,154,210 | 391,727 | ||||||||||||||||||
Net assets | $ | 124,363,417 | $ | 421,898,845 | $ | 218,689,641 | $ | 225,674,968 | $ | 517,707,267 | $ | 60,832,202 | ||||||||||||
| (1) | Effective May 1, 2008, Class R Shares were renamed Class I Shares. |
See accompanying notes to financial statements.
60
Statement of Operations
Year Ended May 31, 2008
| Kansas | Kentucky | Michigan | Missouri | Ohio | Wisconsin | |||||||||||||||||||
Investment Income | $ | 6,237,959 | $ | 21,475,454 | $ | 11,230,968 | $ | 12,219,624 | $ | 26,667,953 | $ | 2,542,548 | ||||||||||||
Expenses | ||||||||||||||||||||||||
Management fees | 669,370 | 2,265,630 | 1,188,843 | 1,284,040 | 2,716,015 | 295,351 | ||||||||||||||||||
12b-1 service fees – Class A | 191,243 | 751,191 | 327,795 | 425,487 | 683,340 | 90,963 | ||||||||||||||||||
12b-1 distribution and service fees – Class B | 48,809 | 103,707 | 41,648 | 62,746 | 128,318 | 21,152 | ||||||||||||||||||
12b-1 distribution and service fees – Class C | 157,498 | 344,664 | 275,297 | 159,084 | 366,654 | 45,367 | ||||||||||||||||||
Shareholders’ servicing agent fees and expenses | 62,182 | 197,652 | 121,280 | 98,311 | 278,495 | 28,085 | ||||||||||||||||||
Interest expense on floating rate obligations | — | 272,452 | 11,922 | 67,477 | 461,141 | — | ||||||||||||||||||
Custodian’s fees and expenses | 52,585 | 139,478 | 60,451 | 104,465 | 187,114 | 16,592 | ||||||||||||||||||
Trustees’ fees and expenses | 2,701 | 8,745 | 4,727 | 5,111 | 11,242 | 1,025 | ||||||||||||||||||
Professional fees | 14,500 | 62,519 | 19,542 | 20,380 | 33,007 | 10,468 | ||||||||||||||||||
Shareholders’ reports – printing and mailing expenses | 18,218 | 57,231 | 38,517 | 28,134 | 79,448 | 8,606 | ||||||||||||||||||
Federal and state registration fees | 11,463 | 14,278 | 17,066 | 16,387 | 14,563 | 13,183 | ||||||||||||||||||
Other expenses | 2,888 | 11,542 | 6,310 | 7,799 | 12,860 | 2,802 | ||||||||||||||||||
Total expenses before custodian fee credit | 1,231,457 | 4,229,089 | 2,113,398 | 2,279,421 | 4,972,197 | 533,594 | ||||||||||||||||||
Custodian fee credit | (8,389 | ) | (22,795 | ) | (15,128 | ) | (18,141 | ) | (43,681 | ) | (10,106 | ) | ||||||||||||
Net expenses | 1,223,068 | 4,206,294 | 2,098,270 | 2,261,280 | 4,928,516 | 523,488 | ||||||||||||||||||
Net investment income | 5,014,891 | 17,269,160 | 9,132,698 | 9,958,344 | 21,739,437 | 2,019,060 | ||||||||||||||||||
Realized and Unrealized Gain (Loss) | ||||||||||||||||||||||||
Net realized gain (loss) from: | ||||||||||||||||||||||||
Investments | 159,653 | 1,236,154 | 807,050 | 1,133,166 | 3,284,990 | 5,579 | ||||||||||||||||||
Forward swaps | — | 172,852 | (107,121 | ) | — | — | — | |||||||||||||||||
Futures | — | (45,316 | ) | — | — | (89,407 | ) | — | ||||||||||||||||
Change in net unrealized appreciation (depreciation) of: | ||||||||||||||||||||||||
Investments | (2,028,472 | ) | (8,318,930 | ) | (5,591,169 | ) | (7,408,671 | ) | (12,303,422 | ) | (663,813 | ) | ||||||||||||
Forward swaps | — | 681,583 | 387,285 | — | — | — | ||||||||||||||||||
Futures | — | (23,058 | ) | — | — | (35,297 | ) | — | ||||||||||||||||
Net realized and unrealized gain (loss) | (1,868,819 | ) | (6,296,715 | ) | (4,503,955 | ) | (6,275,505 | ) | (9,143,136 | ) | (658,234 | ) | ||||||||||||
Net increase (decrease) in net assets from operations | $ | 3,146,072 | $ | 10,972,445 | $ | 4,628,743 | $ | 3,682,839 | $ | 12,596,301 | $ | 1,360,826 | ||||||||||||
See accompanying notes to financial statements.
61
Statement of Changes in Net Assets
| Kansas | Kentucky | |||||||||||||||
| Year Ended 5/31/08 | Year Ended 5/31/07 | Year Ended 5/31/08 | Year Ended 5/31/07 | |||||||||||||
Operations | ||||||||||||||||
Net investment income | $ | 5,014,891 | $ | 5,116,315 | $ | 17,269,160 | $ | 18,212,102 | ||||||||
Net realized gain (loss) from: | ||||||||||||||||
Investments | 159,653 | 1,642,173 | 1,236,154 | 1,028,495 | ||||||||||||
Forward swaps | — | — | 172,852 | — | ||||||||||||
Futures | — | — | (45,316 | ) | — | |||||||||||
Change in net unrealized appreciation (depreciation) of: | ||||||||||||||||
Investments | (2,028,472 | ) | (1,467,120 | ) | (8,318,930 | ) | 659,410 | |||||||||
Forward swaps | — | — | 681,583 | (345,013 | ) | |||||||||||
Futures | — | — | (23,058 | ) | — | |||||||||||
Net increase (decrease) in net assets from operations | 3,146,072 | 5,291,368 | 10,972,445 | 19,554,994 | ||||||||||||
Distributions to Shareholders | ||||||||||||||||
From net investment income: | ||||||||||||||||
Class A | (3,898,113 | ) | (3,948,267 | ) | (15,125,455 | ) | (16,229,555 | ) | ||||||||
Class B | (171,165 | ) | (216,685 | ) | (354,402 | ) | (516,334 | ) | ||||||||
Class C | (746,135 | ) | (762,069 | ) | (1,594,319 | ) | (1,622,289 | ) | ||||||||
Class I(1) | (150,553 | ) | (85,404 | ) | (124,292 | ) | (112,352 | ) | ||||||||
From accumulated net realized gains: | ||||||||||||||||
Class A | (222,644 | ) | — | (846,835 | ) | (804,235 | ) | |||||||||
Class B | (11,930 | ) | — | (24,032 | ) | (31,411 | ) | |||||||||
Class C | (48,489 | ) | — | (103,359 | ) | (94,175 | ) | |||||||||
Class I(1) | (7,651 | ) | — | (6,179 | ) | (5,293 | ) | |||||||||
Decrease in net assets from distributions to shareholders | (5,256,680 | ) | (5,012,425 | ) | (18,178,873 | ) | (19,415,644 | ) | ||||||||
Fund Share Transactions | ||||||||||||||||
Proceeds from sale of shares | 15,985,702 | 13,983,839 | 28,462,533 | 32,298,305 | ||||||||||||
Proceeds from shares issued to shareholders due | 2,766,399 | 2,398,985 | 10,811,242 | 10,557,770 | ||||||||||||
| 18,752,101 | 16,382,824 | 39,273,775 | 42,856,075 | |||||||||||||
Cost of shares redeemed | (20,626,797 | ) | (20,116,563 | ) | (65,614,415 | ) | (52,943,992 | ) | ||||||||
Net increase (decrease) in net assets from Fund share transactions | (1,874,696 | ) | (3,733,739 | ) | (26,340,640 | ) | (10,087,917 | ) | ||||||||
Net increase (decrease) in net assets | (3,985,304 | ) | (3,454,796 | ) | (33,547,068 | ) | (9,948,567 | ) | ||||||||
Net assets at the beginning of year | 128,348,721 | 131,803,517 | 455,445,913 | 465,394,480 | ||||||||||||
Net assets at the end of year | $ | 124,363,417 | $ | 128,348,721 | $ | 421,898,845 | $ | 455,445,913 | ||||||||
Undistributed (Over-distribution of) net investment income at the | $ | 88,875 | $ | 40,834 | $ | (733,880 | ) | $ | (804,166 | ) | ||||||
| (1) | Effective May 1, 2008, Class R Shares were renamed Class I Shares. |
See accompanying notes to financial statements.
62
| Michigan | Missouri | |||||||||||||||
| Year Ended 5/31/08 | Year Ended 5/31/07 | Year Ended 5/31/08 | Year Ended 5/31/07 | |||||||||||||
Operations | ||||||||||||||||
Net investment income | $ | 9,132,698 | $ | 9,509,739 | $ | 9,958,344 | $ | 10,664,912 | ||||||||
Net realized gain (loss) from: | ||||||||||||||||
Investments | 807,050 | 1,756,860 | 1,133,166 | 746,850 | ||||||||||||
Forward swaps | (107,121 | ) | — | — | — | |||||||||||
Futures | — | — | — | — | ||||||||||||
Change in net unrealized appreciation (depreciation) of: | ||||||||||||||||
Investments | (5,591,169 | ) | (423,093 | ) | (7,408,671 | ) | 289,259 | |||||||||
Forward swaps | 387,285 | (222,175 | ) | — | — | |||||||||||
Futures | — | — | — | — | ||||||||||||
Net increase (decrease) in net assets from operations | 4,628,743 | 10,621,331 | 3,682,839 | 11,701,021 | ||||||||||||
Distributions to Shareholders | ||||||||||||||||
From net investment income: | ||||||||||||||||
Class A | (6,824,038 | ) | (7,050,365 | ) | (8,773,478 | ) | (9,368,335 | ) | ||||||||
Class B | (149,335 | ) | (190,942 | ) | (221,642 | ) | (266,196 | ) | ||||||||
Class C | (1,316,103 | ) | (1,360,169 | ) | (764,474 | ) | (752,948 | ) | ||||||||
Class I(1) | (863,423 | ) | (938,703 | ) | (107,073 | ) | (56,661 | ) | ||||||||
From accumulated net realized gains: | ||||||||||||||||
Class A | (464,003 | ) | (1,448,384 | ) | (385,340 | ) | (141,487 | ) | ||||||||
Class B | (12,411 | ) | (47,098 | ) | (11,873 | ) | (4,826 | ) | ||||||||
Class C | (103,052 | ) | (322,755 | ) | (37,270 | ) | (13,104 | ) | ||||||||
Class I(1) | (55,534 | ) | (184,060 | ) | (4,173 | ) | (837 | ) | ||||||||
Decrease in net assets from distributions to shareholders | (9,787,899 | ) | (11,542,476 | ) | (10,305,323 | ) | (10,604,394 | ) | ||||||||
Fund Share Transactions | ||||||||||||||||
Proceeds from sale of shares | 27,724,194 | 21,356,189 | 13,915,200 | 16,104,993 | ||||||||||||
Proceeds from shares issued to shareholders due | 4,740,621 | 5,074,689 | 5,536,884 | 5,559,873 | ||||||||||||
| 32,464,815 | 26,430,878 | 19,452,084 | 21,664,866 | |||||||||||||
Cost of shares redeemed | (40,986,096 | ) | (30,224,021 | ) | (45,350,476 | ) | (26,794,995 | ) | ||||||||
Net increase (decrease) in net assets from Fund share transactions | (8,521,281 | ) | (3,793,143 | ) | (25,898,392 | ) | (5,130,129 | ) | ||||||||
Net increase (decrease) in net assets | (13,680,437 | ) | (4,714,288 | ) | (32,520,876 | ) | (4,033,502 | ) | ||||||||
Net assets at the beginning of year | 232,370,078 | 237,084,366 | 258,195,844 | 262,229,346 | ||||||||||||
Net assets at the end of year | $ | 218,689,641 | $ | 232,370,078 | $ | 225,674,968 | $ | 258,195,844 | ||||||||
Undistributed (Over-distribution of) net investment income at the | $ | (203,264 | ) | $ | (180,464 | ) | $ | (1,480 | ) | $ | (74,680 | ) | ||||
| (1) | Effective May 1, 2008, Class R Shares were renamed Class I Shares. |
See accompanying notes to financial statements.
63
Statement of Changes in Net Assets (continued)
| Ohio | Wisconsin | |||||||||||||||
| Year Ended 5/31/08 | Year Ended 5/31/07 | Year Ended 5/31/08 | Year Ended 5/31/07 | |||||||||||||
Operations | ||||||||||||||||
Net investment income | $ | 21,739,437 | $ | 22,190,729 | $ | 2,019,060 | $ | 1,775,461 | ||||||||
Net realized gain (loss) from: | ||||||||||||||||
Investments | 3,284,990 | 2,589,633 | 5,579 | 83,300 | ||||||||||||
Forward swaps | — | — | — | — | ||||||||||||
Futures | (89,407 | ) | — | — | — | |||||||||||
Change in net unrealized appreciation (depreciation) of: | ||||||||||||||||
Investments | (12,303,422 | ) | (1,708,475 | ) | (663,813 | ) | 104,085 | |||||||||
Forward swaps | — | — | — | — | ||||||||||||
Futures | (35,297 | ) | — | — | — | |||||||||||
Net increase (decrease) in net assets from operations | 12,596,301 | 23,071,887 | 1,360,826 | 1,962,846 | ||||||||||||
Distributions to Shareholders | ||||||||||||||||
From net investment income: | ||||||||||||||||
Class A | (14,068,873 | ) | (14,370,357 | ) | (1,730,913 | ) | (1,455,199 | ) | ||||||||
Class B | (452,727 | ) | (621,821 | ) | (67,666 | ) | (88,548 | ) | ||||||||
Class C | (1,758,809 | ) | (1,721,241 | ) | (197,970 | ) | (186,557 | ) | ||||||||
Class I(1) | (5,218,539 | ) | (5,527,424 | ) | (59,646 | ) | (26,261 | ) | ||||||||
From accumulated net realized gains: | ||||||||||||||||
Class A | (2,246,642 | ) | (994,096 | ) | (70,460 | ) | (80,032 | ) | ||||||||
Class B | (88,049 | ) | (52,377 | ) | (3,205 | ) | (6,401 | ) | ||||||||
Class C | (321,871 | ) | (137,036 | ) | (9,120 | ) | (11,840 | ) | ||||||||
Class I(1) | (787,894 | ) | (363,710 | ) | (2,416 | ) | (1,745 | ) | ||||||||
Decrease in net assets from distributions to shareholders | (24,943,404 | ) | (23,788,062 | ) | (2,141,396 | ) | (1,856,583 | ) | ||||||||
Fund Share Transactions | ||||||||||||||||
Proceeds from sale of shares | 54,114,008 | 43,834,813 | 14,979,855 | 10,443,529 | ||||||||||||
Proceeds from shares issued to shareholders due | 14,585,776 | 12,663,124 | 1,333,633 | 1,047,561 | ||||||||||||
| 68,699,784 | 56,497,937 | 16,313,488 | 11,491,090 | |||||||||||||
Cost of shares redeemed | (75,202,035 | ) | (62,384,790 | ) | (6,449,792 | ) | (5,391,370 | ) | ||||||||
Net increase (decrease) in net assets from Fund share transactions | (6,502,251 | ) | (5,886,853 | ) | 9,863,696 | 6,099,720 | ||||||||||
Net increase (decrease) in net assets | (18,849,354 | ) | (6,603,028 | ) | 9,083,126 | 6,205,983 | ||||||||||
Net assets at the beginning of year | 536,556,621 | 543,159,649 | 51,749,076 | 45,543,093 | ||||||||||||
Net assets at the end of year | $ | 517,707,267 | $ | 536,556,621 | $ | 60,832,202 | $ | 51,749,076 | ||||||||
Undistributed (Over-distribution of) net investment income at the | $ | (217,369 | ) | $ | (445,112 | ) | $ | (74,609 | ) | $ | (37,474 | ) | ||||
| (1) | Effective May 1, 2008, Class R Shares were renamed Class I Shares. |
See accompanying notes to financial statements.
64
Notes to Financial Statements
1. General Information and Significant Accounting Policies
The Nuveen Multistate Trust IV (the “Trust”) is an open-end investment company registered under the Investment Company Act of 1940, as amended. The Trust is comprised of Nuveen Kansas Municipal Bond Fund (“Kansas”), Nuveen Kentucky Municipal Bond Fund (“Kentucky”), Nuveen Michigan Municipal Bond Fund (“Michigan”), Nuveen Missouri Municipal Bond Fund (“Missouri”), Nuveen Ohio Municipal Bond Fund (“Ohio”) and Nuveen Wisconsin Municipal Bond Fund (“Wisconsin”) (collectively, the “Funds”). The Trust was organized as a Massachusetts business trust on July 1, 1996. The Funds were each organized as a series of predecessor trusts or corporations prior to that date.
The Funds seek to provide high levels of tax-free income and preservation of capital through investing primarily in diversified portfolios of quality municipal bonds. Effective October 21, 2007, each Fund may invest up to 20% of their net assets in below investment grade (“high yield” or “junk”) municipal bonds.
On March 31, 2008, the Nuveen Mutual Funds announced the following policy changes applicable to the Funds, effective May 1, 2008:
| • | For Class A Share purchases at net asset value of $1 million or more that are subject to a contingent deferred sales charge (“CDSC”), the period over which the CDSC will apply has been reduced from 18 months to 12 months for all purchases occurring on or after May 1, 2007. Class A Shares purchased prior to May 1, 2007 that have not been redeemed are no longer be subject to a CDSC; |
| • | Class B Shares will only be issued (i) upon the exchange of Class B Shares from another Nuveen fund, (ii) for purposes of dividend reinvestment, and (iii) through December 31, 2008, for defined contribution plans and investors using automatic investment plans with investments in Class B shares as of March 31, 2008. The reinstatement privilege for Class B Shares will no longer be available as of December 31, 2008. |
| • | Class R Shares have been renamed Class I Shares and are available for (i) purchases of $1 million or more, (ii) purchases using dividends and capital gains distributions on Class I Shares and (iii) purchase by limited categories of investors. |
The following is a summary of significant accounting policies followed by the Funds in the preparation of their financial statements in accordance with accounting principles generally accepted in the United States.
Investment Valuation
The prices of municipal bonds in each Fund’s investment portfolio are provided by a pricing service approved by the Fund’s Board of Trustees. When market price quotes are not readily available (which is usually the case for municipal securities), the pricing service may establish fair value based on yields or prices of municipal bonds of comparable quality, type of issue, coupon, maturity and rating, indications of value from securities dealers, evaluations of anticipated cash flows or collateral and general market conditions. Prices of forward swap contracts are also provided by an independent pricing service approved by each Fund’s Board of Trustees. Futures contracts are valued using the closing settlement price, or, in the absence of such a price, at the mean of the bid and asked prices. If the pricing service is unable to supply a price for a municipal bond, forward swap or futures contract, each Fund may use market quotes provided by major broker/dealers in such investments. If it is determined that the market price for an investment or derivative instrument is unavailable or inappropriate, the Board of Trustees of the Funds, or its designee, may establish fair value in accordance with procedures established in good faith by the Board of Trustees. Temporary investments in securities that have variable rate and demand features qualifying them as short-term investments are valued at amortized cost, which approximates market value.
Investment Transactions
Investment transactions are recorded on a trade date basis. Realized gains and losses from transactions are determined on the specific identification method. Investments purchased on a when-issued/delayed delivery basis may have extended settlement periods. Any investments so purchased are subject to market fluctuation during this period. The Funds have instructed the custodian to segregate assets with a current value at least equal to the amount of the when-issued/delayed delivery purchase commitments. At May 31, 2008, Kentucky, Michigan, Ohio and Wisconsin had outstanding when issued/delayed delivery purchase commitments of $4,033,609, $4,844,969, $2,071,000 and $675,000, respectively. There were no such outstanding purchase commitments in Kansas or Missouri.
Investment Income
Interest income, which includes the amortization of premiums and accretion of discounts for financial reporting purposes, is recorded on an accrual basis. Investment income also includes paydown gains and losses, if any.
Professional Fees
Professional fees presented in the Statement of Operations consist of legal fees incurred in the normal course of operations, audit fees, tax consulting fees and, in some cases, workout expenditures. Workout expenditures are incurred in an attempt to protect or enhance an investment, or to pursue other claims or legal actions on behalf of Fund shareholders.
65
Notes to Financial Statements (continued)
Income Taxes
Each Fund is a separate taxpayer for federal income tax purposes. Each Fund intends to distribute substantially all of its net investment income and net capital gains to shareholders and to otherwise comply with the requirements of Subchapter M of the Internal Revenue Code applicable to regulated investment companies. Therefore, no federal income tax provision is required. Furthermore, each Fund intends to satisfy conditions which will enable interest from municipal securities, which is exempt from regular federal and designated state income taxes, to retain such tax-exempt status when distributed to shareholders of the Funds. Net realized capital gains and ordinary income distributions paid by the Funds are subject to federal taxation.
Effective November 30, 2007, the Funds adopted Financial Accounting Standards Board (FASB) Interpretation No. 48 “Accounting for Uncertainty in Income Taxes” (FIN 48). FIN 48 provides guidance for how uncertain tax positions should be recognized, measured, presented and disclosed in the financial statements. FIN 48 requires the affirmative evaluation of tax positions taken or expected to be taken in the course of preparing the Funds’ tax returns to determine whether it is “more-likely-than-not” (i.e., a greater than 50 percent likelihood) of being sustained by the applicable tax authority. Tax positions not deemed to meet the more-likely-than-not threshold may result in a tax benefit or expense in the current year.
Implementation of FIN 48 required management of the Funds to analyze all open tax years, as defined by the statute of limitations, for all major jurisdictions, which includes federal and certain states. Open tax years are those that are open for examination by taxing authorities (i.e., generally the last four tax year ends and the interim tax period since then). The Funds have no examinations in progress.
For all open tax years and all major taxing jurisdictions through the end of the reporting period, management of the Funds has reviewed all tax positions taken or expected to be taken in the preparation of the Funds’ tax returns and concluded the adoption of FIN 48 resulted in no impact to the Funds’ net assets or results of operations as of and during the fiscal year ended May 31, 2008.
The Funds are also not aware of any tax positions for which it is reasonably possible that the total amounts of unrecognized tax benefits will significantly change in the next twelve months.
Dividends and Distributions to Shareholders
Tax-exempt net investment income is declared monthly as a dividend. Generally, payment is made or reinvestment is credited to shareholder accounts on the first business day after month-end. Net realized capital gains from investment transactions, if any, are declared and distributed to shareholders at least annually. Furthermore, capital gains are distributed only to the extent they exceed available capital loss carryforwards.
Distributions to shareholders of tax-exempt net investment income, net realized capital gains and/or market discount, if any, are recorded on the ex-dividend date. The amount and timing of distributions are determined in accordance with federal income tax regulations, which may differ from accounting principles generally accepted in the United States.
Flexible Sales Charge Program
During the period June 1, 2007 through April 30, 2008, each Fund offered Class A, B, C and I Shares. Class A Shares are generally sold with an up-front sales charge and incur a .20% annual 12b-1 service fee. Class A Share purchases of $1 million or more are sold at net asset value without an up-front sales charge but may be subject to a contingent deferred sales charge (“CDSC”) if redeemed within twelve months of purchase. Class B Shares are sold without an up-front sales charge but incur a .75% annual 12b-1 distribution fee and a .20% annual 12b-1 service fee. Class B Shares are subject to a CDSC of up to 5% depending upon the length of time the shares are held by the investor (CDSC is reduced to 0% at the end of six years). Class B Shares convert to Class A Shares eight years after purchase. Class C Shares are sold without an up-front sales charge but incur a .55% annual 12b-1 distribution fee and a .20% annual 12b-1 service fee. Class C Shares are subject to a CDSC of 1% if redeemed within one year of purchase. Class I Shares are not subject to any sales charge or 12b-1 distribution or service fees.
Inverse Floating Rate Securities
Each Fund is authorized to invest in inverse floating rate securities. An inverse floating rate security is created by depositing a municipal bond, typically with a fixed interest rate, into a special purpose trust created by a broker-dealer. In turn, this trust (a) issues floating rate certificates, in face amounts equal to some fraction of the deposited bond’s par amount or market value, that typically pay short-term tax-exempt interest rates to third parties, and (b) issues to a long-term investor (such as one of the Funds) an inverse floating rate certificate (sometimes referred to as an “inverse floater”) that represents all remaining or residual interest in the trust. The income received by the inverse floater holder varies inversely with the short-term rate paid to the floating rate certificates’ holders, and in most circumstances the inverse floater holder bears substantially all of the underlying bond’s downside investment risk and also benefits disproportionately from any potential appreciation of the underlying bond’s value. The price of an inverse floating rate security will be more volatile than that of the underlying bond because the interest rate is dependent on not only the fixed coupon rate of the underlying bond but also on the short-term interest paid on the floating rate certificates, and because the inverse floating rate security essentially bears the risk of loss of the greater face value of the underlying bond.
A Fund may purchase an inverse floating rate security in a secondary market transaction without first owning the underlying bond (referred to as an “externally-deposited inverse floater”), or instead by first selling a fixed-rate bond to a broker-dealer for deposit into the special purpose trust and receiving in turn the residual interest in the trust (referred to as a “self-deposited inverse floater”).
66
A Fund may also enter into shortfall and forbearance agreements (sometimes referred to as a “recourse trust” or “credit recovery swap”) with a broker-dealer by which a Fund agrees to reimburse the broker-dealer, in certain circumstances, for the difference between the liquidation value of the fixed-rate bond held by the trust and the liquidation value of the floating rate certificates, as well as any shortfalls in interest cash flows. The inverse floater held by a Fund gives the Fund the right (a) to cause the holders of the floating rate certificates to tender their notes at par, and (b) to have the broker transfer the fixed-rate bond held by the trust to the Fund, thereby collapsing the trust. An investment in an externally-deposited inverse floater is identified in the Portfolio of Investments as an “Inverse floating rate investment”. An investment in a self-deposited inverse floater, recourse trust or credit recovery swap is accounted for as a financing transaction in accordance with Statement of Financial Accounting Standards (SFAS) No. 140 “Accounting for Transfers and Servicing of Financial Assets and Extinguishment of Liabilities”. In such instances, a fixed-rate bond deposited into a special purpose trust is identified in the Portfolio of Investments as an “Underlying bond of an inverse floating rate trust”, with the Fund accounting for the short-term floating rate certificates issued by the trust as “Floating rate obligations” on the Statement of Assets and Liabilities. In addition, the Fund reflects in Investment Income the entire earnings of the underlying bond and accounts for the related interest paid to the holders of the short-term floating rate certificates as “Interest expense on floating rate obligations” in the Statement of Operations.
During the fiscal year ended May 31, 2008, Kentucky, Michigan, Missouri and Ohio invested in externally deposited inverse floaters and/or self-deposited inverse floaters. Kansas and Wisconsin did not invest in any such instruments during the fiscal year ended May 31, 2008.
The average floating rate obligations outstanding and average annual interest rate and fees related to self-deposited inverse floaters during the fiscal year ended May 31, 2008, were as follows:
| Kentucky | Michigan | Missouri | Ohio | |||||||||
Average floating rate obligations | $ | 8,248,989 | $ | 306,011 | $ | 2,106,831 | $ | 12,696,175 | ||||
Average annual interest rate and fees | 3.30% | 3.90% | 3.20% | 3.63% | ||||||||
Forward Swap Transactions
Each Fund is authorized to invest in forward interest rate swap transactions. Each Fund’s use of forward interest rate swap transactions is intended to help the Fund manage its overall interest rate sensitivity, either shorter or longer, generally to more closely align the Fund’s interest rate sensitivity with that of the broader municipal market. Forward interest rate swap transactions involve each Fund’s agreement with a counterparty to pay, in the future, a fixed or variable rate payment in exchange for the counterparty paying the Fund a variable or fixed rate payment, the accruals for which would begin at a specified date in the future (the “effective date”). The amount of the payment obligation is based on the notional amount of the forward swap contract and the termination date of the swap (which is akin to a bond’s maturity). The value of the Fund’s swap commitment would increase or decrease based primarily on the extent to which long-term interest rates for bonds having a maturity of the swap’s termination date increases or decreases. The Funds may terminate a swap contract prior to the effective date, at which point a realized gain or loss is recognized. When a forward swap is terminated, it ordinarily does not involve the delivery of securities or other underlying assets or principal, but rather is settled in cash on a net basis. Each Fund intends, but is not obligated, to terminate its forward swaps before the effective date. Accordingly, the risk of loss with respect to the swap counterparty on such transactions is limited to the credit risk associated with a counterparty failing to honor its commitment to pay any realized gain to the Fund upon termination. To reduce such credit risk, all counterparties are required to pledge collateral daily (based on the daily valuation of each swap) on behalf of each Fund with a value approximately equal to the amount of any unrealized gain above a pre-determined threshold. Reciprocally, when any of the Funds have an unrealized loss on a swap contract, the Funds have instructed the custodian to pledge assets of the Funds as collateral with a value approximately equal to the amount of the unrealized loss above a pre-determined threshold. Collateral pledges are monitored and subsequently adjusted if and when the swap valuations fluctuate, either up or down, by at least the predetermined threshold amount. Kentucky and Michigan were the only Funds to invest in forward interest rate swap transactions during the fiscal year ended May 31, 2008.
Futures Contracts
Each Fund is authorized to invest in futures contracts. Upon entering into a futures contract, a Fund is required to deposit with the broker an amount of cash or liquid securities equal to a specified percentage of the contract amount. This is known as the “initial margin.” Subsequent payments (“variation margin”) are made or received by a Fund each day, depending on the daily fluctuation of the value of the contract.
During the period the futures contract is open, changes in the value of the contract are recognized as an unrealized gain or loss by “marking-to-market” on a daily basis to reflect the changes in market value of the contract. When the contract is closed or expired, a Fund records a realized gain or loss equal to the difference between the value of the contract on the closing date and value of the contract when originally entered into. Cash held by the broker to cover initial margin requirements on open futures contracts, if any, is recognized in the Statement of Assets and Liabilities. Additionally, the Statement of Assets and Liabilities reflects a receivable or payable for the variation margin, when applicable. Kentucky and Ohio were the only Funds to invest in futures contracts during the fiscal year ended May 31, 2008.
67
Notes to Financial Statements (continued)
An investment included within Receivables from investments sold on the Statement of Assets and Liabilities of Kentucky, with an aggregate market value of $161,600, has been pledged to collateralize the net payment obligations under futures contracts.
Risks of investments in futures contracts include the possible adverse movement of the securities or indices underlying the contracts, the possibility that there may not be a liquid secondary market for the contracts and/or that a change in the value of the contract may not correlate with a change in the value of the underlying securities or indices.
Zero Coupon Securities
Each Fund is authorized to invest in zero coupon securities. A zero coupon security does not pay a regular interest coupon to its holders during the life of the security. Tax-exempt income to the holder of the security comes from accretion of the difference between the original purchase price of the security at issuance and the par value of the security at maturity and is effectively paid at maturity. Such securities are included in the Portfolios of Investments with a 0.000% coupon rate in their description. The market prices of zero coupon securities generally are more volatile than the market prices of securities that pay interest periodically.
Expense Allocation
Expenses of the Funds that are not directly attributable to a specific class of shares are prorated among the classes based on the relative net assets of each class. Expenses directly attributable to a class of shares, which presently only include 12b-1 distribution and service fees, are recorded to the specific class.
Custodian Fee Credit
Each Fund has an arrangement with the custodian bank whereby certain custodian fees and expenses are reduced by net credits earned on each Fund’s cash on deposit with the bank. Such deposit arrangements are an alternative to overnight investments. Credits for cash balances may be offset by charges for any days on which a Fund overdraws its account at the custodian bank.
Indemnifications
Under the Trust’s organizational documents, its Officers and Trustees are indemnified against certain liabilities arising out of the performance of their duties to the Trust. In addition, in the normal course of business, the Trust enters into contracts that provide general indemnifications to other parties. The Trust’s maximum exposure under these arrangements is unknown as this would involve future claims that may be made against the Trust that have not yet occurred. However, the Trust has not had prior claims or losses pursuant to these contracts and expects the risk of loss to be remote.
Use of Estimates
The preparation of financial statements in conformity with accounting principles generally accepted in the United States requires management to make estimates and assumptions that affect the reported amounts of assets and liabilities at the date of the financial statements and the reported amounts of increases and decreases in net assets from operations during the reporting period. Actual results may differ from those estimates.
2. Fund Shares
Transactions in Fund shares were as follows:
| Kansas | ||||||||||||||
| Year Ended 5/31/08 | Year Ended 5/31/07 | |||||||||||||
| Shares | Amount | Shares | Amount | |||||||||||
Shares sold: | ||||||||||||||
Class A | 1,010,280 | $ | 10,442,515 | 738,883 | $ | 7,727,761 | ||||||||
Class A – automatic conversion of Class B shares | 30,371 | 313,454 | 137,621 | 1,443,319 | ||||||||||
Class B | 17,029 | 174,237 | 38,040 | 394,448 | ||||||||||
Class C | 326,896 | 3,378,206 | 257,845 | 2,706,471 | ||||||||||
Class I | 163,363 | 1,677,290 | 162,706 | 1,711,840 | ||||||||||
Shares issued to shareholders due to reinvestment | ||||||||||||||
Class A | 212,746 | 2,192,803 | 181,556 | 1,902,123 | ||||||||||
Class B | 9,055 | 92,608 | 9,902 | 102,898 | ||||||||||
Class C | 42,141 | 434,332 | 36,570 | 383,271 | ||||||||||
Class I | 4,515 | 46,656 | 1,016 | 10,693 | ||||||||||
| 1,816,396 | 18,752,101 | 1,564,139 | 16,382,824 | |||||||||||
Shares redeemed: | ||||||||||||||
Class A | (1,411,249 | ) | (14,547,592 | ) | (1,333,549 | ) | (13,953,264 | ) | ||||||
Class B | (96,205 | ) | (987,602 | ) | (59,717 | ) | (619,173 | ) | ||||||
Class B – automatic conversion to Class A shares | (30,632 | ) | (313,454 | ) | (138,795 | ) | (1,443,319 | ) | ||||||
Class C | (399,577 | ) | (4,125,958 | ) | (391,534 | ) | (4,090,957 | ) | ||||||
Class I | (62,422 | ) | (652,191 | ) | (936 | ) | (9,850 | ) | ||||||
| (2,000,085 | ) | (20,626,797 | ) | (1,924,531 | ) | (20,116,563 | ) | |||||||
Net increase (decrease) | (183,689 | ) | $ | (1,874,696 | ) | (360,392 | ) | $ | (3,733,739 | ) | ||||
68
| Kentucky | ||||||||||||||
| Year Ended 5/31/08 | Year Ended 5/31/07 | |||||||||||||
| Shares | Amount | Shares | Amount | |||||||||||
Shares sold: | ||||||||||||||
Class A | 1,872,810 | $ | 20,386,170 | 2,039,116 | $ | 22,523,441 | ||||||||
Class A – automatic conversion of Class B shares | 117,432 | 1,281,429 | 241,274 | 2,668,451 | ||||||||||
Class B | 14,742 | 160,002 | 32,888 | 364,317 | ||||||||||
Class C | 583,345 | 6,334,100 | 552,350 | 6,112,283 | ||||||||||
Class I | 27,826 | 300,832 | 57,059 | 629,813 | ||||||||||
Shares issued to shareholders due to reinvestment of distributions: | ||||||||||||||
Class A | 862,730 | 9,368,364 | 829,319 | 9,183,661 | ||||||||||
Class B | 25,975 | 282,368 | 28,813 | 319,218 | ||||||||||
Class C | 98,125 | 1,065,450 | 87,326 | 966,833 | ||||||||||
Class I | 8,758 | 95,060 | 7,955 | 88,058 | ||||||||||
| 3,611,743 | 39,273,775 | 3,876,100 | 42,856,075 | |||||||||||
Shares redeemed: | ||||||||||||||
Class A | (4,996,193 | ) | (54,349,957 | ) | (3,696,333 | ) | (40,846,673 | ) | ||||||
Class B | (253,445 | ) | (2,757,000 | ) | (269,743 | ) | (2,975,210 | ) | ||||||
Class B – automatic conversion to Class A shares | (117,397 | ) | (1,281,429 | ) | (241,139 | ) | (2,668,451 | ) | ||||||
Class C | (616,907 | ) | (6,697,468 | ) | (575,593 | ) | (6,356,515 | ) | ||||||
Class I | (48,488 | ) | (528,561 | ) | (8,831 | ) | (97,143 | ) | ||||||
| (6,032,430 | ) | (65,614,415 | ) | (4,791,639 | ) | (52,943,992 | ) | |||||||
Net increase (decrease) | (2,420,687 | ) | $ | (26,340,640 | ) | (915,539 | ) | $ | (10,087,917 | ) | ||||
| Michigan | ||||||||||||||
| Year Ended 5/31/08 | Year Ended 5/31/07 | |||||||||||||
| Shares | Amount | Shares | Amount | |||||||||||
Shares sold: | ||||||||||||||
Class A | 2,038,746 | $ | 22,978,961 | 1,330,719 | $ | 15,346,047 | ||||||||
Class A – automatic conversion of Class B shares | 10,060 | 114,165 | 70,452 | 816,002 | ||||||||||
Class B | 25,413 | 287,094 | 27,284 | 316,820 | ||||||||||
Class C | 304,327 | 3,434,514 | 335,428 | 3,867,578 | ||||||||||
Class I | 81,171 | 909,460 | 87,324 | 1,009,742 | ||||||||||
Shares issued to shareholders due to reinvestment of distributions: | ||||||||||||||
Class A | 296,174 | 3,335,734 | 302,979 | 3,507,082 | ||||||||||
Class B | 6,283 | 70,963 | 8,249 | 95,647 | ||||||||||
Class C | 56,567 | 636,792 | 58,027 | 671,298 | ||||||||||
Class I | 61,902 | 697,132 | 69,176 | 800,662 | ||||||||||
| 2,880,643 | 32,464,815 | 2,289,638 | 26,430,878 | |||||||||||
Shares redeemed: | ||||||||||||||
Class A | (2,872,765 | ) | (32,348,827 | ) | (1,723,501 | ) | (19,856,476 | ) | ||||||
Class B | (80,367 | ) | (907,452 | ) | (133,306 | ) | (1,540,545 | ) | ||||||
Class B – automatic conversion to Class A shares | (10,036 | ) | (114,165 | ) | (70,285 | ) | (816,002 | ) | ||||||
Class C | (461,900 | ) | (5,211,995 | ) | (412,809 | ) | (4,755,624 | ) | ||||||
Class I | (213,874 | ) | (2,403,657 | ) | (282,197 | ) | (3,255,374 | ) | ||||||
| (3,638,942 | ) | (40,986,096 | ) | (2,622,098 | ) | (30,224,021 | ) | |||||||
Net increase (decrease) | (758,299 | ) | $ | (8,521,281 | ) | (332,460 | ) | $ | (3,793,143 | ) | ||||
69
Notes to Financial Statements (continued)
| Missouri | ||||||||||||||
| Year Ended 5/31/08 | Year Ended 5/31/07 | |||||||||||||
| Shares | Amount | Shares | Amount | |||||||||||
Shares sold: | ||||||||||||||
Class A | 844,808 | $ | 9,215,168 | 1,004,766 | $ | 11,149,451 | ||||||||
Class A – automatic conversion of Class B shares | 20,668 | 226,551 | 52,346 | 583,774 | ||||||||||
Class B | 6,292 | 68,725 | 16,927 | 187,643 | ||||||||||
Class C | 326,347 | 3,532,621 | 249,446 | 2,770,206 | ||||||||||
Class I | 79,579 | 872,135 | 127,152 | 1,413,919 | ||||||||||
Shares issued to shareholders due to reinvestment of distributions: | ||||||||||||||
Class A | 459,748 | 4,984,678 | 456,186 | 5,072,942 | ||||||||||
Class B | 14,228 | 154,396 | 13,700 | 152,481 | ||||||||||
Class C | 34,880 | 377,709 | 29,242 | 324,944 | ||||||||||
Class I | 1,854 | 20,101 | 851 | 9,506 | ||||||||||
| 1,788,404 | 19,452,084 | 1,950,616 | 21,664,866 | |||||||||||
Shares redeemed: | ||||||||||||||
Class A | (3,706,773 | ) | (40,359,989 | ) | (1,959,287 | ) | (21,743,896 | ) | ||||||
Class B | (127,318 | ) | (1,381,458 | ) | (92,027 | ) | (1,024,836 | ) | ||||||
Class B – automatic conversion to Class A shares | (20,649 | ) | (226,551 | ) | (52,310 | ) | (583,774 | ) | ||||||
Class C | (281,372 | ) | (3,049,318 | ) | (297,607 | ) | (3,299,155 | ) | ||||||
Class I | (30,387 | ) | (333,160 | ) | (12,855 | ) | (143,334 | ) | ||||||
| (4,166,499 | ) | (45,350,476 | ) | (2,414,086 | ) | (26,794,995 | ) | |||||||
Net increase (decrease) | (2,378,095 | ) | $ | (25,898,392 | ) | (463,470 | ) | $ | (5,130,129 | ) | ||||
| Ohio | ||||||||||||||
| Year Ended 5/31/08 | Year Ended 5/31/07 | |||||||||||||
| Shares | Amount | Shares | Amount | |||||||||||
Shares sold: | ||||||||||||||
Class A | 3,814,941 | $ | 42,363,851 | 2,723,205 | $ | 30,926,754 | ||||||||
Class A – automatic conversion of Class B shares | 129,281 | 1,441,097 | 143,718 | 1,640,005 | ||||||||||
Class B | 16,736 | 186,273 | 49,844 | 566,896 | ||||||||||
Class C | 753,868 | 8,353,604 | 723,663 | 8,211,429 | ||||||||||
Class I | 159,843 | 1,769,183 | 219,836 | 2,489,729 | ||||||||||
Shares issued to shareholders due to reinvestment | ||||||||||||||
Class A | 763,250 | 8,478,810 | 631,048 | 7,181,835 | ||||||||||
Class B | 26,244 | 291,409 | 29,323 | 333,258 | ||||||||||
Class C | 86,839 | 961,774 | 68,970 | 783,102 | ||||||||||
Class I | 437,624 | 4,853,783 | 384,028 | 4,364,929 | ||||||||||
| 6,188,626 | 68,699,784 | 4,973,635 | 56,497,937 | |||||||||||
Shares redeemed: | ||||||||||||||
Class A | (4,658,244 | ) | (51,809,147 | ) | (3,629,878 | ) | (41,190,056 | ) | ||||||
Class B | (293,633 | ) | (3,262,361 | ) | (322,419 | ) | (3,654,426 | ) | ||||||
Class B – automatic conversion to Class A shares | (129,513 | ) | (1,441,097 | ) | (143,960 | ) | (1,640,005 | ) | ||||||
Class C | (593,349 | ) | (6,584,562 | ) | (540,584 | ) | (6,124,905 | ) | ||||||
Class I | (1,088,409 | ) | (12,104,868 | ) | (862,463 | ) | (9,775,398 | ) | ||||||
| (6,763,148 | ) | (75,202,035 | ) | (5,499,304 | ) | (62,384,790 | ) | |||||||
Net increase (decrease) | (574,522 | ) | $ | (6,502,251 | ) | (525,669 | ) | $ | (5,886,853 | ) | ||||
70
| Wisconsin | ||||||||||||||
| Year Ended 5/31/08 | Year Ended 5/31/07 | |||||||||||||
| Shares | Amount | Shares | Amount | |||||||||||
Shares sold: | ||||||||||||||
Class A | 1,212,481 | $ | 12,229,534 | 784,243 | $ | 8,107,651 | ||||||||
Class A – automatic conversion of Class B shares | 9,563 | 97,565 | 54,287 | 560,644 | ||||||||||
Class B | 8,755 | 88,111 | 4,417 | 45,765 | ||||||||||
Class C | 195,701 | 1,996,742 | 87,112 | 904,057 | ||||||||||
Class I | 55,776 | 567,903 | 79,132 | 825,412 | ||||||||||
Shares issued to shareholders due to reinvestment | ||||||||||||||
Class A | 107,255 | 1,083,809 | 81,274 | 840,644 | ||||||||||
Class B | 5,002 | 50,689 | 5,445 | 56,427 | ||||||||||
Class C | 13,605 | 137,742 | 12,058 | 124,976 | ||||||||||
Class I | 6,058 | 61,393 | 2,454 | 25,514 | ||||||||||
| 1,614,196 | 16,313,488 | 1,110,422 | 11,491,090 | |||||||||||
Shares redeemed: | ||||||||||||||
Class A | (439,662 | ) | (4,416,336 | ) | (380,887 | ) | (3,938,916 | ) | ||||||
Class B | (29,396 | ) | (301,573 | ) | (37,804 | ) | (392,419 | ) | ||||||
Class B – automatic conversion to Class A shares | (9,544 | ) | (97,565 | ) | (54,177 | ) | (560,644 | ) | ||||||
Class C | (147,304 | ) | (1,498,302 | ) | (47,123 | ) | (488,321 | ) | ||||||
Class I | (13,255 | ) | (136,016 | ) | (1,074 | ) | (11,070 | ) | ||||||
| (639,161 | ) | (6,449,792 | ) | (521,065 | ) | (5,391,370 | ) | |||||||
Net increase (decrease) | 975,035 | $ | 9,863,696 | 589,357 | $ | 6,099,720 | ||||||||
3. Investment Transactions
Purchases and sales (including maturities but excluding short-term investments and derivative transactions) during the fiscal year ended May 31, 2008, were as follows:
| Kansas | Kentucky | Michigan | Missouri | Ohio | Wisconsin | |||||||||||||
Purchases | $ | 19,325,425 | $ | 34,524,958 | $ | 30,924,168 | $ | 33,513,987 | $ | 104,314,507 | $ | 9,669,496 | ||||||
Sales and maturities | 22,950,779 | 63,720,467 | 45,105,165 | 60,901,325 | 135,287,110 | 1,655,000 | ||||||||||||
4. Income Tax Information
The following information is presented on an income tax basis. Differences between amounts for financial statement and federal income tax purposes are primarily due to timing differences in recognizing taxable market discount, timing differences in recognizing certain gains and losses on investment transactions and the treatment of investments in inverse floating rate transactions subject to SFAS No. 140. To the extent that differences arise that are permanent in nature, such amounts are reclassified within the capital accounts on the Statement of Assets and Liabilities presented in the annual report, based on their federal tax basis treatment; temporary differences do not require reclassification. Temporary and permanent differences do not impact the net asset values of the Funds.
At May 31, 2008, the cost of investments was as follows:
| Kansas | Kentucky | Michigan | Missouri | Ohio | Wisconsin | |||||||||||||
Cost of investments | $ | 121,502,970 | $ | 410,135,591 | $ | 215,483,859 | $ | 221,085,994 | $ | 499,577,481 | $ | 58,264,325 | ||||||
Gross unrealized appreciation and gross unrealized depreciation of investments at May 31, 2008, were as follows:
| Kansas | Kentucky | Michigan | Missouri | Ohio | Wisconsin | |||||||||||||||||||
Gross unrealized: | ||||||||||||||||||||||||
Appreciation | $ | 2,947,742 | $ | 12,987,442 | $ | 8,916,421 | $ | 6,975,929 | $ | 17,364,046 | $ | 1,130,107 | ||||||||||||
Depreciation | (1,895,629 | ) | (4,356,664 | ) | (3,205,699 | ) | (4,568,621 | ) | (5,598,348 | ) | (733,445 | ) | ||||||||||||
Net unrealized appreciation (depreciation) of investments | $ | 1,052,113 | $ | 8,630,778 | $ | 5,710,722 | $ | 2,407,308 | $ | 11,765,698 | $ | 396,662 | ||||||||||||
71
Notes to Financial Statements (continued)
The tax components of undistributed net tax-exempt income, net ordinary income and net long-term capital gains at May 31, 2008, the Funds’ tax year end, were as follows:
| Kansas | Kentucky | Michigan | Missouri | Ohio | Wisconsin | |||||||||||||
Undistributed net tax-exempt income* | $ | 487,066 | $ | 633,547 | $ | 390,445 | $ | 745,258 | $ | 985,260 | $ | 103,069 | ||||||
Undistributed net ordinary income** | — | 142,527 | — | — | 69,663 | — | ||||||||||||
Undistributed net long-term capital gains | — | 768,725 | 261,564 | 1,150,105 | 738,121 | 5,442 | ||||||||||||
* Undistributed net tax-exempt income (on a tax basis) has not been reduced for the dividend declared on May 9, 2008, paid on June 2, 2008.
** Net ordinary income consists of taxable market discount income and net short-term capital gains, if any.
The tax character of distributions paid during the Funds’ tax years ended May 31, 2008 and May 31, 2007, was designated for purposes of the dividends paid deduction as follows:
| 2008 | Kansas | Kentucky | Michigan | Missouri | Ohio | Wisconsin | ||||||||||||
Distributions from net tax-exempt income*** | $ | 4,960,322 | $ | 17,282,866 | $ | 9,202,754 | $ | 9,947,694 | $ | 21,567,276 | $ | 2,033,655 | ||||||
Distributions from net ordinary income** | — | 15,941 | — | 8,048 | — | 3,277 | ||||||||||||
Distributions from net long-term capital gains**** | 289,831 | 964,464 | 635,000 | 438,656 | 3,444,456 | 81,923 | ||||||||||||
| 2007 | Kansas | Kentucky | Michigan | Missouri | Ohio | Wisconsin | ||||||||||||
Distributions from net tax-exempt income | $ | 5,024,864 | $ | 18,597,774 | $ | 9,530,565 | $ | 10,456,421 | $ | 22,291,164 | $ | 1,737,468 | ||||||
Distributions from net ordinary income** | — | — | 19,811 | — | — | — | ||||||||||||
Distributions from net long-term capital gains | — | 935,114 | 2,002,297 | 160,254 | 1,547,219 | 100,018 | ||||||||||||
| ** | Net ordinary income consists of taxable market discount income and net short-term capital gains, if any. |
| *** | The Funds hereby designate these amounts paid during the fiscal year ended May 31, 2008, as Exempt Interest Dividends. |
| **** | The Funds designated as a long-term capital gain dividend, pursuant to the Internal Revenue Code Section (852)(b)(3), the amount necessary to reduce earnings and profits of the Funds related to net capital gain to zero to the tax year ended May 31, 2008. |
The following Fund has elected to defer net realized losses from investments incurred from November 1, 2007 through May 31, 2008, the Fund’s tax year end, (“post-October losses”) in accordance with federal income tax regulations. Post-October losses are treated as having arisen on the first day of the following fiscal year:
| Kansas | |||
| $ | 11,461 | ||
5. Management Fees and Other Transactions with Affiliates
Each Fund’s management fee is separated into two components – a complex-level component, based on the aggregate amount of all fund assets managed by Nuveen Asset Management (the “Adviser”), a wholly owned subsidiary of Nuveen Investments, Inc. (“Nuveen”), and a specific fund-level component, based only on the amount of assets within each individual Fund. This pricing structure enables Nuveen fund shareholders to benefit from growth in the assets within each individual fund as well as from growth in the amount of complex-wide assets managed by the Adviser.
The annual fund-level fee, payable monthly, for each Fund is based upon the average daily net assets of each Fund as follows:
| Average Daily Net Assets | Fund-Level Fee Rate | ||
For the first $125 million | .3500 | % | |
For the next $125 million | .3375 | ||
For the next $250 million | .3250 | ||
For the next $500 million | .3125 | ||
For the next $1 billion | .3000 | ||
For the next $3 billion | .2750 | ||
For net assets over $5 billion | .2500 |
The annual complex-level fee, payable monthly, which is additive to the fund-level fee, for all Nuveen sponsored funds in the U.S., is based on the aggregate amount of total fund assets managed as stated in the tables below. As of May 31, 2008, the complex-level fee rate was .1851%.
Effective August 20, 2007, the complex-level fee schedule is as follows:
| Complex-Level Asset Breakpoint Level (1) | Effective Rate at Breakpoint Level | ||
$55 billion | .2000 | % | |
$56 billion | .1996 | ||
$57 billion | .1989 | ||
$60 billion | .1961 | ||
$63 billion | .1931 | ||
$66 billion | .1900 | ||
$71 billion | .1851 | ||
$76 billion | .1806 | ||
$80 billion | .1773 | ||
$91 billion | .1691 | ||
$125 billion | .1599 | ||
$200 billion | .1505 | ||
$250 billion | .1469 | ||
$300 billion | .1445 |
| (1) | The complex-level fee component of the management fee for the funds is calculated based upon the aggregate Managed Assets (“Managed Assets” means the average daily net assets of each fund including assets attributable to preferred stock issued by or borrowings by the Nuveen funds) of Nuveen-sponsored funds in the U.S. |
72
Prior to August 20, 2007, the complex-level fee schedule was as follows:
| Complex-Level Asset Breakpoint Level (1) | Effective Rate at Breakpoint Level | ||
$55 billion | .2000 | % | |
$56 billion | .1996 | ||
$57 billion | .1989 | ||
$60 billion | .1961 | ||
$63 billion | .1931 | ||
$66 billion | .1900 | ||
$71 billion | .1851 | ||
$76 billion | .1806 | ||
$80 billion | .1773 | ||
$91 billion | .1698 | ||
$125 billion | .1617 | ||
$200 billion | .1536 | ||
$250 billion | .1509 | ||
$300 billion | .1490 |
| (1) | The complex-level fee component of the management fee for the funds is calculated based upon the aggregate Managed Assets (“Managed Assets” means the average daily net assets of each fund including assets attributable to preferred stock issued by or borrowings by the Nuveen funds) of Nuveen-sponsored funds in the U.S. |
The management fee compensates the Adviser for overall investment advisory and administrative services and general office facilities. The Trust pays no compensation directly to those of its Trustees who are affiliated with the Adviser or to its Officers, all of whom receive remuneration for their services to the Trust from the Adviser or its affiliates. The Board of Trustees has adopted a deferred compensation plan for independent Trustees that enables Trustees to elect to defer receipt of all or a portion of the annual compensation they are entitled to receive from certain Nuveen advised funds. Under the plan, deferred amounts are treated as though equal dollar amounts had been invested in shares of select Nuveen advised funds.
The Adviser has agreed to waive part of its management fees or reimburse certain expenses of Ohio in order to limit total expenses (excluding 12b-1 distribution and service fees, interest expense, taxes, fees incurred in acquiring and disposing of portfolio securities and extraordinary expenses) from exceeding .75% of the average daily net assets. The Adviser may also voluntarily reimburse additional expenses from time to time in any of the Funds. Voluntary reimbursements may be terminated at any time at the Adviser’s discretion.
During the fiscal year ended May 31, 2008, Nuveen Investments, LLC (the “Distributor”), a wholly owned subsidiary of Nuveen, collected sales charges on purchases of Class A Shares, the majority of which were paid out as concessions to financial intermediaries as follows:
| Kansas | Kentucky | Michigan | Missouri | Ohio | Wisconsin | |||||||||||||
Sales charges collected (Unaudited) | $ | 137,343 | $ | 404,312 | $ | 167,509 | $ | 194,057 | $ | 322,345 | $ | 112,380 | ||||||
Paid to financial intermediaries (Unaudited) | 120,907 | 347,861 | 150,227 | 166,423 | 275,986 | 96,575 | ||||||||||||
The Distributor also received 12b-1 service fees on Class A Shares, substantially all of which were paid to compensate financial intermediaries for providing services to shareholders relating to their investments.
During the fiscal year ended May 31, 2008, the Distributor compensated financial intermediaries directly with commission advances at the time of purchase as follows:
| Kansas | Kentucky | Michigan | Missouri | Ohio | Wisconsin | |||||||||||||
Commission advances (Unaudited) | $ | 55,737 | $ | 67,621 | $ | 79,792 | $ | 32,077 | $ | 97,903 | $ | 30,774 | ||||||
To compensate for commissions advanced to financial intermediaries, all 12b-1 service fees collected on Class B Shares during the first year following a purchase, all 12b-1 distribution fees collected on Class B Shares, and all 12b-1 service and distribution fees collected on Class C Shares during the first year following a purchase are retained by the Distributor. During the fiscal year ended May 31, 2008, the Distributor retained such 12b-1 fees as follows:
| Kansas | Kentucky | Michigan | Missouri | Ohio | Wisconsin | |||||||||||||
12b-1 fees retained (Unaudited) | $ | 52,477 | $ | 112,326 | $ | 67,031 | $ | 68,991 | $ | 151,499 | $ | 23,717 | ||||||
The remaining 12b-1 fees charged to the Funds were paid to compensate financial intermediaries for providing services to shareholders relating to their investments.
The Distributor also collected and retained CDSC on share redemptions during the fiscal year ended May 31, 2008, as follows:
| Kansas | Kentucky | Michigan | Missouri | Ohio | Wisconsin | |||||||||||||
CDSC retained (Unaudited) | $ | 10,072 | $ | 35,674 | $ | 31,105 | $ | 12,099 | $ | 31,241 | $ | 17,007 | ||||||
73
Notes to Financial Statements (continued)
Agreement and Plan of Merger
On June 20, 2007, Nuveen Investments announced that it had entered into a definitive Agreement and Plan of Merger (“Merger Agreement”) with Windy City Investments, Inc. (“Windy City”), a corporation formed by investors led by Madison Dearborn Partners, LLC (“Madison Dearborn”), pursuant to which Windy City would acquire Nuveen Investments. Madison Dearborn is a private equity investment firm based in Chicago, Illinois. The merger was consummated on November 13, 2007.
The consummation of the merger was deemed to be an “assignment” (as that term is defined in the Investment Company Act of 1940) of the investment management agreement between each Fund and the Adviser, and resulted in the automatic termination of each Fund’s agreement. The Board of Trustees of each Fund considered and approved a new investment management agreement with the Adviser on the same terms as the previous agreements. Each new ongoing agreement, was approved by the shareholders of each Fund and took effect on November 13, 2007.
The investors led by Madison Dearborn includes an affiliate of Merrill Lynch. As a result, Merrill Lynch is an indirect “affiliated person” (as that term is defined in the Investment Company Act of 1940) of each Fund. Certain conflicts of interest may arise as a result of such indirect affiliation. For example, the Funds are generally prohibited from entering into principal transactions with Merrill Lynch and its affiliates. The Adviser does not believe that any such prohibitions or limitations as a result of Merrill Lynch’s affiliation will significantly impact the ability of the Funds to pursue their investment objectives and policies.
6. New Accounting Pronouncements
Financial Accounting Standards Board Statement of Financial Accounting Standards No. 157
In September 2006, FASB issued SFAS No. 157, “Fair Value Measurements.” This standard establishes a single authoritative definition of fair value, sets out a framework for measuring fair value and requires additional disclosures about fair value measurements. SFAS No. 157 applies to fair value measurements already required or permitted by existing standards. SFAS No. 157 is effective for financial statements issued for fiscal years beginning after November 15, 2007, and interim periods within those fiscal years. The changes to current generally accepted accounting principles from the application of this standard relate to the definition of fair value, the methods used to measure fair value, and the expanded disclosures about fair value measurements. As of May 31, 2008, management does not believe the adoption of SFAS No. 157 will impact the financial statement amounts; however, additional disclosures may be required about the inputs used to develop the measurements and the effect of certain of the measurements included within the Statement of Operations for the period.
Financial Accounting Standards Board Statement of Financial Accounting Standards No. 161
In March 2008, the FASB issued SFAS No. 161, “Disclosures about Derivative Instruments and Hedging Activities.” This standard is intended to enhance financial statement disclosures for derivative instruments and hedging activities and enable investors to understand: a) how and why a fund uses derivative instruments, b) how derivative instruments and related hedge items are accounted for, and c) how derivative instruments and related hedge items affect a fund’s financial position, results of operations and cash flows. SFAS No. 161 is effective for financial statements issued for fiscal years and interim periods beginning after November 15, 2008. As of May 31, 2008, management does not believe the adoption of SFAS No. 161 will impact the financial statement amounts; however, additional footnote disclosures may be required about the use of derivative instruments and hedging items.
7. Subsequent Events
Distributions to Shareholders
The Funds declared dividend distributions from their tax-exempt net investment income which were paid on July 1, 2008, to shareholders of record on June 27, 2008, as follows:
| Kansas | Kentucky | Michigan | Missouri | Ohio | Wisconsin | |||||||||||||
Dividend per share: | ||||||||||||||||||
Class A | $ | .0355 | $ | .0365 | $ | .0385 | $ | .0375 | $ | .0380 | $ | .0310 | ||||||
Class B | .0290 | .0300 | .0320 | .0310 | .0310 | .0250 | ||||||||||||
Class C | .0310 | .0315 | .0335 | .0330 | .0330 | .0265 | ||||||||||||
Class I | .0375 | .0380 | .0405 | .0395 | .0400 | .0330 | ||||||||||||
74
Financial Highlights
Selected data for a share outstanding throughout each period:
| Class (Commencement Date) | ||||||||||||||||||||||||||||||||||||||||||||||||||||||||
| Investment Operations | Less Distributions | Ratios/Supplemental Data | ||||||||||||||||||||||||||||||||||||||||||||||||||||||
| KANSAS | Ratios to Average Net Assets Before Credit/ Reimbursement | Ratios to Average Net Assets After Reimbursement(c) | Ratios to Average Net Assets After Credit/ Reimbursement(d) | |||||||||||||||||||||||||||||||||||||||||||||||||||||
| Year Ended May 31, | Beginning Net Asset Value | Net Invest- ment Income(a) | Net Realized/ Unrealized Gain (Loss) | Total | Net Invest- ment Income | Capital Gains | Total | Ending Net Asset Value | Total Return(b) | Ending Net Assets (000) | Expenses | Net Invest- ment Income | Expenses | Net Invest- ment Income | Expenses | Net Invest- ment Income | Portfolio Turnover Rate | |||||||||||||||||||||||||||||||||||||||
| Class A (1/92) | ||||||||||||||||||||||||||||||||||||||||||||||||||||||||
2008 | $ | 10.40 | $ | .43 | $ | (.16 | ) | $ | .27 | $ | (.42 | ) | $ | (.02 | ) | $ | (.44 | ) | $ | 10.23 | 2.70 | % | $ | 94,259 | .87 | % | 4.12 | % | .87 | % | 4.12 | % | .86 | % | 4.12 | % | 16 | % | ||||||||||||||||||
2007 | 10.38 | .42 | .01 | .43 | (.41 | ) | — | (.41 | ) | 10.40 | 4.22 | 97,477 | .85 | 4.03 | .85 | 4.03 | .84 | 4.04 | 22 | |||||||||||||||||||||||||||||||||||||
2006 | 10.66 | .42 | (.29 | ) | .13 | (.41 | ) | — | (.41 | ) | 10.38 | 1.28 | 100,128 | .86 | 4.02 | .86 | 4.02 | .84 | 4.03 | 18 | ||||||||||||||||||||||||||||||||||||
2005 | 10.20 | .44 | .46 | .90 | (.44 | ) | — | (.44 | ) | 10.66 | 8.95 | 97,861 | .88 | 4.17 | .88 | 4.17 | .87 | 4.18 | 21 | |||||||||||||||||||||||||||||||||||||
2004 | 10.77 | .46 | (.57 | ) | (.11 | ) | (.46 | ) | — | (.46 | ) | 10.20 | (1.02 | ) | 91,744 | .90 | 4.36 | .90 | 4.36 | .89 | 4.37 | 11 | ||||||||||||||||||||||||||||||||||
| Class B (2/97) | ||||||||||||||||||||||||||||||||||||||||||||||||||||||||
2008 | 10.31 | .35 | (.16 | ) | .19 | (.34 | ) | (.02 | ) | (.36 | ) | 10.14 | 1.95 | 4,721 | 1.62 | 3.37 | 1.62 | 3.37 | 1.61 | 3.37 | 16 | |||||||||||||||||||||||||||||||||||
2007 | 10.30 | .34 | .01 | .35 | (.34 | ) | — | (.34 | ) | 10.31 | 3.38 | 5,840 | 1.61 | 3.28 | 1.61 | 3.28 | 1.59 | 3.29 | 22 | |||||||||||||||||||||||||||||||||||||
2006 | 10.58 | .34 | (.28 | ) | .06 | (.34 | ) | — | (.34 | ) | 10.30 | .54 | 7,379 | 1.61 | 3.26 | 1.61 | 3.26 | 1.59 | 3.28 | 18 | ||||||||||||||||||||||||||||||||||||
2005 | 10.12 | .36 | .46 | .82 | (.36 | ) | — | (.36 | ) | 10.58 | 8.21 | 10,031 | 1.63 | 3.42 | 1.63 | 3.42 | 1.61 | 3.43 | 21 | |||||||||||||||||||||||||||||||||||||
2004 | 10.69 | .38 | (.57 | ) | (.19 | ) | (.38 | ) | — | (.38 | ) | 10.12 | (1.77 | ) | 11,001 | 1.64 | 3.61 | 1.64 | 3.61 | 1.64 | 3.62 | 11 | ||||||||||||||||||||||||||||||||||
| Class C (2/97) | ||||||||||||||||||||||||||||||||||||||||||||||||||||||||
2008 | 10.40 | .37 | (.15 | ) | .22 | (.37 | ) | (.02 | ) | (.39 | ) | 10.23 | 2.17 | 21,090 | 1.42 | 3.57 | 1.42 | 3.57 | 1.41 | 3.57 | 16 | |||||||||||||||||||||||||||||||||||
2007 | 10.38 | .37 | .01 | .38 | (.36 | ) | — | (.36 | ) | 10.40 | 3.69 | 21,767 | 1.40 | 3.48 | 1.40 | 3.48 | 1.39 | 3.50 | 22 | |||||||||||||||||||||||||||||||||||||
2006 | 10.67 | .37 | (.30 | ) | .07 | (.36 | ) | — | (.36 | ) | 10.38 | .67 | 22,736 | 1.41 | 3.47 | 1.41 | 3.47 | 1.39 | 3.48 | 18 | ||||||||||||||||||||||||||||||||||||
2005 | 10.21 | .38 | .46 | .84 | (.38 | ) | — | (.38 | ) | 10.67 | 8.39 | 22,836 | 1.43 | 3.62 | 1.43 | 3.62 | 1.42 | 3.63 | 21 | |||||||||||||||||||||||||||||||||||||
2004 | 10.78 | .40 | (.56 | ) | (.16 | ) | (.41 | ) | — | (.41 | ) | 10.21 | (1.53 | ) | 23,656 | 1.45 | 3.81 | 1.45 | 3.81 | 1.44 | 3.82 | 11 | ||||||||||||||||||||||||||||||||||
| Class I (2/97)(e) | ||||||||||||||||||||||||||||||||||||||||||||||||||||||||
2008 | 10.45 | .45 | (.16 | ) | .29 | (.45 | ) | (.02 | ) | (.47 | ) | 10.27 | 2.83 | 4,293 | .67 | 4.31 | .67 | 4.31 | .66 | 4.32 | 16 | |||||||||||||||||||||||||||||||||||
2007 | 10.42 | .45 | .02 | .47 | (.44 | ) | — | (.44 | ) | 10.45 | 4.54 | 3,264 | .65 | 4.23 | .65 | 4.23 | .63 | 4.25 | 22 | |||||||||||||||||||||||||||||||||||||
2006 | 10.71 | .45 | (.30 | ) | .15 | (.44 | ) | — | (.44 | ) | 10.42 | 1.41 | 1,560 | .66 | 4.22 | .66 | 4.22 | .64 | 4.23 | 18 | ||||||||||||||||||||||||||||||||||||
2005 | 10.24 | .46 | .47 | .93 | (.46 | ) | — | (.46 | ) | 10.71 | 9.26 | 1,449 | .68 | 4.37 | .68 | 4.37 | .67 | 4.38 | 21 | |||||||||||||||||||||||||||||||||||||
2004 | 10.82 | .48 | (.58 | ) | (.10 | ) | (.48 | ) | — | (.48 | ) | 10.24 | (.89 | ) | 1,204 | .70 | 4.56 | .70 | 4.56 | .69 | 4.57 | 11 | ||||||||||||||||||||||||||||||||||
| (a) | Per share Net Investment Income is calculated using the average daily shares method. |
| (b) | Total return is the combination of changes in net asset value without any sales charge, reinvested dividend income at net asset value and reinvested capital gains distributions at net asset value, if any. Total returns are not annualized. |
| (c) | After expense reimbursement from the Adviser, where applicable. |
| (d) | After custodian fee credit and expense reimbursement, where applicable. |
| (e) | Effective May 1, 2008, Class R Shares were renamed Class I Shares. |
See accompanying notes to financial statements.
75
Financial Highlights (continued)
Selected data for a share outstanding throughout each period:
| Class (Commencement Date) | |||||||||||||||||||||||||||||||||||||||||||||||||||||||
| Investment Operations | Less Distributions | Ratios/Supplemental Data | |||||||||||||||||||||||||||||||||||||||||||||||||||||
| KENTUCKY | Ratios to Average Net Assets Before Credit/ Reimbursement | Ratios to Average Net Assets After Reimbursement(c) | Ratios to Average Net Assets After Credit/ Reimbursement(d) | ||||||||||||||||||||||||||||||||||||||||||||||||||||
| Year Ended May 31, | Beginning Net Asset Value | Net Invest- ment Income(a) | Net Gain | Total | Net | Capital Gains | Total | Ending Net Asset Value | Total Return(b) | Ending Net Assets (000) | Expenses(e) | Net Invest- ment Income | Expenses(e) | Net Invest- ment Income | Expenses(e) | Net Invest- ment Income | Portfolio Turnover Rate | ||||||||||||||||||||||||||||||||||||||
| Class A (5/87) | |||||||||||||||||||||||||||||||||||||||||||||||||||||||
2008 | $ | 10.96 | $ | .44 | $ | (.16 | ) | $ | .28 | $ | (.44 | ) | $ | (.02 | ) | $ | (.46 | ) | $ | 10.78 | 2.63 | % | $ | 362,734 | .89 | % | 4.04 | % | .89 | % | 4.04 | % | .89 | % | 4.04 | % | 8 | % | |||||||||||||||||
2007 | 10.96 | .44 | .03 | .47 | (.45 | ) | (.02 | ) | (.47 | ) | 10.96 | 4.35 | 392,262 | .90 | 4.00 | .90 | 4.00 | .89 | 4.01 | 9 | |||||||||||||||||||||||||||||||||||
2006 | 11.30 | .46 | (.30 | ) | .16 | (.46 | ) | (.04 | ) | (.50 | ) | 10.96 | 1.38 | 398,636 | .82 | 4.09 | .82 | 4.09 | .81 | 4.10 | 13 | ||||||||||||||||||||||||||||||||||
2005 | 10.88 | .48 | .43 | .91 | (.48 | ) | (.01 | ) | (.49 | ) | 11.30 | 8.51 | 427,106 | .83 | 4.35 | .83 | 4.35 | .82 | 4.36 | 15 | |||||||||||||||||||||||||||||||||||
2004 | 11.35 | .51 | (.42 | ) | .09 | (.52 | ) | (.04 | ) | (.56 | ) | 10.88 | .90 | 410,109 | .84 | 4.58 | .84 | 4.58 | .83 | 4.58 | 16 | ||||||||||||||||||||||||||||||||||
| Class B (2/97) | |||||||||||||||||||||||||||||||||||||||||||||||||||||||
2008 | 10.97 | .36 | (.17 | ) | .19 | (.35 | ) | (.02 | ) | (.37 | ) | 10.79 | 1.85 | 9,685 | 1.64 | 3.29 | 1.64 | 3.29 | 1.64 | 3.29 | 8 | ||||||||||||||||||||||||||||||||||
2007 | 10.97 | .36 | .03 | .39 | (.37 | ) | (.02 | ) | (.39 | ) | 10.97 | 3.56 | 13,466 | 1.65 | 3.26 | 1.65 | 3.26 | 1.65 | 3.26 | 9 | |||||||||||||||||||||||||||||||||||
2006 | 11.31 | .37 | (.30 | ) | .07 | (.37 | ) | (.04 | ) | (.41 | ) | 10.97 | .62 | 18,388 | 1.57 | 3.34 | 1.57 | 3.34 | 1.56 | 3.35 | 13 | ||||||||||||||||||||||||||||||||||
2005 | 10.88 | .40 | .44 | .84 | (.40 | ) | (.01 | ) | (.41 | ) | 11.31 | 7.80 | 21,216 | 1.57 | 3.60 | 1.57 | 3.60 | 1.57 | 3.61 | 15 | |||||||||||||||||||||||||||||||||||
2004 | 11.35 | .43 | (.42 | ) | .01 | (.44 | ) | (.04 | ) | (.48 | ) | 10.88 | .14 | 20,874 | 1.59 | 3.83 | 1.59 | 3.83 | 1.58 | 3.83 | 16 | ||||||||||||||||||||||||||||||||||
| Class C (10/93) | |||||||||||||||||||||||||||||||||||||||||||||||||||||||
2008 | 10.96 | .38 | (.15 | ) | .23 | (.38 | ) | (.02 | ) | (.40 | ) | 10.79 | 2.15 | 46,588 | 1.44 | 3.49 | 1.44 | 3.49 | 1.44 | 3.49 | 8 | ||||||||||||||||||||||||||||||||||
2007 | 10.96 | .38 | .02 | .40 | (.38 | ) | (.02 | ) | (.40 | ) | 10.96 | 3.73 | 46,650 | 1.45 | 3.45 | 1.45 | 3.45 | 1.44 | 3.46 | 9 | |||||||||||||||||||||||||||||||||||
2006 | 11.29 | .39 | (.29 | ) | .10 | (.39 | ) | (.04 | ) | (.43 | ) | 10.96 | .88 | 45,919 | 1.37 | 3.54 | 1.37 | 3.54 | 1.36 | 3.55 | 13 | ||||||||||||||||||||||||||||||||||
2005 | 10.87 | .42 | .43 | .85 | (.42 | ) | (.01 | ) | (.43 | ) | 11.29 | 7.91 | 46,160 | 1.37 | 3.80 | 1.37 | 3.80 | 1.37 | 3.81 | 15 | |||||||||||||||||||||||||||||||||||
2004 | 11.34 | .45 | (.42 | ) | .03 | (.46 | ) | (.04 | ) | (.50 | ) | 10.87 | .35 | 45,303 | 1.39 | 4.03 | 1.39 | 4.03 | 1.38 | 4.03 | 16 | ||||||||||||||||||||||||||||||||||
| Class I (2/97)(f) | |||||||||||||||||||||||||||||||||||||||||||||||||||||||
2008 | 10.96 | .46 | (.15 | ) | .31 | (.46 | ) | (.02 | ) | (.48 | ) | 10.79 | 2.90 | 2,891 | .69 | 4.24 | .69 | 4.24 | .69 | 4.24 | 8 | ||||||||||||||||||||||||||||||||||
2007 | 10.96 | .47 | .02 | .49 | (.47 | ) | (.02 | ) | (.49 | ) | 10.96 | 4.52 | 3,069 | .70 | 4.20 | .70 | 4.20 | .69 | 4.21 | 9 | |||||||||||||||||||||||||||||||||||
2006 | 11.29 | .48 | (.30 | ) | .18 | (.47 | ) | (.04 | ) | (.51 | ) | 10.96 | 1.64 | 2,451 | .62 | 4.29 | .62 | 4.29 | .61 | 4.30 | 13 | ||||||||||||||||||||||||||||||||||
2005 | 10.87 | .51 | .42 | .93 | (.50 | ) | (.01 | ) | (.51 | ) | 11.29 | 8.70 | 1,581 | .63 | 4.54 | .63 | 4.54 | .62 | 4.55 | 15 | |||||||||||||||||||||||||||||||||||
2004 | 11.33 | .53 | (.41 | ) | .12 | (.54 | ) | (.04 | ) | (.58 | ) | 10.87 | 1.15 | 1,285 | .64 | 4.78 | .64 | 4.78 | .63 | 4.78 | 16 | ||||||||||||||||||||||||||||||||||
| (a) | Per share Net Investment Income is calculated using the average daily shares method. |
| (b) | Total return is the combination of changes in net asset value without any sales charge, reinvested dividend income at net asset value and reinvested capital gains distributions at net asset value, if any. Total returns are not annualized. |
| (c) | After expense reimbursement from the Adviser, where applicable. |
| (d) | After custodian fee credit and expense reimbursement, where applicable. |
| (e) | The expense ratios in the above table reflect, among other things, the interest expense deemed to have been paid by the Fund on the floating rate certificates issued by the special purpose trusts for the self-deposited inverse floaters held by the Fund, as described in Footnote 1 – Inverse Floating Rate Securities. The amount of this deemed interest expense for such periods expressed as a percentage of average net assets for each share class was as follows: |
| Interest Expense on Floating Rate Obligations to Average Net Assets | |||
Year Ended May 31, | |||
2008 | .06 | % | |
2007 | .08 | ||
2006 | — | ||
2005 | — | ||
2004 | — | ||
| (f) | Effective May 1, 2008, Class R Shares were renamed Class I Shares. |
See accompanying notes to financial statements.
76
| Class (Commencement Date) | ||||||||||||||||||||||||||||||||||||||||||||||||||||||||
| Investment Operations | Less Distributions | Ratios/Supplemental Data | ||||||||||||||||||||||||||||||||||||||||||||||||||||||
| MICHIGAN | Ratios to Average Net Assets Before Credit/ Reimbursement | Ratios to Average Net Assets After Reimbursement(c) | Ratios to Average Net Assets After Credit/ Reimbursement(d) | |||||||||||||||||||||||||||||||||||||||||||||||||||||
| Year Ended May 31, | Beginning Net Asset Value | Net Invest- ment Income(a) | Net Realized/ Unrealized Gain (Loss) | Total | Net Invest- ment Income | Capital Gains | Total | Ending Net Asset Value | Total Return(b) | Ending Net Assets (000) | Expenses(e) | Net Invest- ment Income | Expenses(e) | Net Invest- ment Income | Expenses(e) | Net Invest- ment Income | Portfolio Turnover Rate | |||||||||||||||||||||||||||||||||||||||
| Class A (6/85) | ||||||||||||||||||||||||||||||||||||||||||||||||||||||||
2008 | $ | 11.41 | $ | .47 | $ | (.23 | ) | $ | .24 | $ | (.47 | ) | $ | (.03 | ) | $ | (.50 | ) | $ | 11.15 | 2.17 | % | $ | 159,696 | .86 | % | 4.14 | % | .86 | % | 4.14 | % | .85 | % | 4.15 | % | 14 | % | ||||||||||||||||||
2007 | 11.45 | .47 | .07 | .54 | (.48 | ) | (.10 | ) | (.58 | ) | 11.41 | 4.70 | 169,395 | .91 | 4.09 | .91 | 4.09 | .90 | 4.10 | 12 | ||||||||||||||||||||||||||||||||||||
2006 | 11.89 | .49 | (.32 | ) | .17 | (.48 | ) | (.13 | ) | (.61 | ) | 11.45 | 1.48 | 170,278 | .86 | 4.16 | .86 | 4.16 | .85 | 4.17 | 11 | |||||||||||||||||||||||||||||||||||
2005 | 11.45 | .51 | .45 | .96 | (.51 | ) | (.01 | ) | (.52 | ) | 11.89 | 8.48 | 181,302 | .86 | 4.32 | .86 | 4.32 | .86 | 4.33 | 16 | ||||||||||||||||||||||||||||||||||||
2004 | 12.16 | .54 | (.58 | ) | (.04 | ) | (.55 | ) | (.12 | ) | (.67 | ) | 11.45 | (.27 | ) | 179,956 | .87 | 4.61 | .87 | 4.61 | .86 | 4.61 | 9 | |||||||||||||||||||||||||||||||||
| Class B (2/97) | ||||||||||||||||||||||||||||||||||||||||||||||||||||||||
2008 | 11.43 | .38 | (.22 | ) | .16 | (.39 | ) | (.03 | ) | (.42 | ) | 11.17 | 1.41 | 4,080 | 1.61 | 3.40 | 1.61 | 3.40 | 1.60 | 3.40 | 14 | |||||||||||||||||||||||||||||||||||
2007 | 11.48 | .39 | .05 | .44 | (.39 | ) | (.10 | ) | (.49 | ) | 11.43 | 3.85 | 4,845 | 1.67 | 3.35 | 1.67 | 3.35 | 1.65 | 3.36 | 12 | ||||||||||||||||||||||||||||||||||||
2006 | 11.92 | .40 | (.32 | ) | .08 | (.39 | ) | (.13 | ) | (.52 | ) | 11.48 | .71 | 6,794 | 1.61 | 3.41 | 1.61 | 3.41 | 1.60 | 3.41 | 11 | |||||||||||||||||||||||||||||||||||
2005 | 11.47 | .42 | .46 | .88 | (.42 | ) | (.01 | ) | (.43 | ) | 11.92 | 7.73 | 8,938 | 1.61 | 3.57 | 1.61 | 3.57 | 1.60 | 3.58 | 16 | ||||||||||||||||||||||||||||||||||||
2004 | 12.18 | .45 | (.58 | ) | (.13 | ) | (.46 | ) | (.12 | ) | (.58 | ) | 11.47 | (1.03 | ) | 10,112 | 1.62 | 3.86 | 1.62 | 3.86 | 1.61 | 3.86 | 9 | |||||||||||||||||||||||||||||||||
| Class C (6/93) | ||||||||||||||||||||||||||||||||||||||||||||||||||||||||
2008 | 11.40 | .41 | (.23 | ) | .18 | (.40 | ) | (.03 | ) | (.43 | ) | 11.15 | 1.67 | 35,814 | 1.41 | 3.59 | 1.41 | 3.59 | 1.40 | 3.60 | 14 | |||||||||||||||||||||||||||||||||||
2007 | 11.44 | .41 | .06 | .47 | (.41 | ) | (.10 | ) | (.51 | ) | 11.40 | 4.11 | 37,779 | 1.46 | 3.54 | 1.46 | 3.54 | 1.45 | 3.56 | 12 | ||||||||||||||||||||||||||||||||||||
2006 | 11.88 | .42 | (.32 | ) | .10 | (.41 | ) | (.13 | ) | (.54 | ) | 11.44 | .91 | 38,141 | 1.41 | 3.61 | 1.41 | 3.61 | 1.40 | 3.62 | 11 | |||||||||||||||||||||||||||||||||||
2005 | 11.43 | .44 | .46 | .90 | (.44 | ) | (.01 | ) | (.45 | ) | 11.88 | 7.98 | 38,386 | 1.41 | 3.77 | 1.41 | 3.77 | 1.40 | 3.78 | 16 | ||||||||||||||||||||||||||||||||||||
2004 | 12.14 | .48 | (.58 | ) | (.10 | ) | (.49 | ) | (.12 | ) | (.61 | ) | 11.43 | (.83 | ) | 36,912 | 1.42 | 4.06 | 1.42 | 4.06 | 1.41 | 4.06 | 9 | |||||||||||||||||||||||||||||||||
| Class I (2/97)(f) | ||||||||||||||||||||||||||||||||||||||||||||||||||||||||
2008 | 11.41 | .49 | (.23 | ) | .26 | (.49 | ) | (.03 | ) | (.52 | ) | 11.15 | 2.39 | 19,100 | .66 | 4.34 | .66 | 4.34 | .65 | 4.35 | 14 | |||||||||||||||||||||||||||||||||||
2007 | 11.45 | .50 | .06 | .56 | (.50 | ) | (.10 | ) | (.60 | ) | 11.41 | 4.92 | 20,351 | .71 | 4.29 | .71 | 4.29 | .70 | 4.30 | 12 | ||||||||||||||||||||||||||||||||||||
2006 | 11.89 | .51 | (.32 | ) | .19 | (.50 | ) | (.13 | ) | (.63 | ) | 11.45 | 1.69 | 21,871 | .66 | 4.36 | .66 | 4.36 | .65 | 4.36 | 11 | |||||||||||||||||||||||||||||||||||
2005 | 11.45 | .53 | .45 | .98 | (.53 | ) | (.01 | ) | (.54 | ) | 11.89 | 8.70 | 23,675 | .66 | 4.52 | .66 | 4.52 | .66 | 4.53 | 16 | ||||||||||||||||||||||||||||||||||||
2004 | 12.16 | .57 | (.58 | ) | (.01 | ) | (.58 | ) | (.12 | ) | (.70 | ) | 11.45 | (.07 | ) | 23,618 | .67 | 4.81 | .67 | 4.81 | .66 | 4.81 | 9 | |||||||||||||||||||||||||||||||||
| (a) | Per share Net Investment Income is calculated using the average daily shares method. |
| (b) | Total return is the combination of changes in net asset value without any sales charge, reinvested dividend income at net asset value and reinvested capital gains distributions at net asset value, if any. Total returns are not annualized. |
| (c) | After expense reimbursement from the Adviser, where applicable. |
| (d) | After custodian fee credit and expense reimbursement, where applicable. |
| (e) | The expense ratios in the above table reflect, among other things, the interest expense deemed to have been paid by the Fund on the floating rate certificates issued by the special purpose trusts for the self-deposited inverse floaters held by the Fund, as described in Footnote 1 – Inverse Floating Rate Securities. The amount of this deemed interest expense for such periods expressed as a percentage of average net assets for each share class was as follows: |
| Interest Expense on Floating Rate Obligations to Average Net Assets | |||
Year Ended May 31, | |||
2008 | .01 | % | |
2007 | .07 | ||
2006 | — | ||
2005 | — | ||
2004 | — | ||
| (f) | Effective May 1, 2008, Class R Shares were renamed Class I Shares. |
See accompanying notes to financial statements.
77
Financial Highlights (continued)
Selected data for a share outstanding throughout each period:
| Class (Commencement Date) | ||||||||||||||||||||||||||||||||||||||||||||||||||||||||
| Investment Operations | Less Distributions | Ratios/Supplemental Data | ||||||||||||||||||||||||||||||||||||||||||||||||||||||
| MISSOURI | Ratios to Average Net Assets Before Credit/ Reimbursement | Ratios to Average Net Assets After Reimbursement(c) | Ratios to Average Net Assets After Credit/ Reimbursement(d) | |||||||||||||||||||||||||||||||||||||||||||||||||||||
| Year Ended May 31, | Beginning Net Asset Value | Net Invest- ment Income(a) | Net Realized/ Unrealized Gain (Loss) | Total | Net Invest- ment Income | Capital Gains | Total | Ending Net Asset Value | Total Return(b) | Ending Net Assets (000) | Expenses(e) | Net Invest- ment Income | Expenses(e) | Net Invest- ment Income | Expenses(e) | Net Invest- ment Income | Portfolio Turnover Rate | |||||||||||||||||||||||||||||||||||||||
| Class A (8/87) | ||||||||||||||||||||||||||||||||||||||||||||||||||||||||
2008 | $ | 11.03 | $ | .45 | $ | (.28 | ) | $ | .17 | $ | (.45 | ) | $ | (.02 | ) | $ | (.47 | ) | $ | 10.73 | 1.59 | % | $ | 195,691 | .87 | % | 4.16 | % | .87 | % | 4.16 | % | .87 | % | 4.16 | % | 14 | % | ||||||||||||||||||
2007 | 10.98 | .46 | .05 | .51 | (.45 | ) | (.01 | ) | (.46 | ) | 11.03 | 4.66 | 227,412 | .88 | 4.13 | .88 | 4.13 | .87 | 4.14 | 16 | ||||||||||||||||||||||||||||||||||||
2006 | 11.25 | .47 | (.26 | ) | .21 | (.48 | ) | — | (.48 | ) | 10.98 | 1.88 | 231,378 | .83 | 4.23 | .83 | 4.23 | .82 | 4.24 | 12 | ||||||||||||||||||||||||||||||||||||
2005 | 10.78 | .48 | .47 | .95 | (.48 | ) | — | (.48 | ) | 11.25 | 8.97 | 232,171 | .84 | 4.35 | .84 | 4.35 | .83 | 4.35 | 16 | |||||||||||||||||||||||||||||||||||||
2004 | 11.30 | .50 | (.53 | ) | (.03 | ) | (.49 | ) | — | (.49 | ) | 10.78 | (.28 | ) | 221,955 | .85 | 4.50 | .85 | 4.50 | .85 | 4.51 | 13 | ||||||||||||||||||||||||||||||||||
| Class B (2/97) | ||||||||||||||||||||||||||||||||||||||||||||||||||||||||
2008 | 11.04 | .37 | (.28 | ) | .09 | (.37 | ) | (.02 | ) | (.39 | ) | 10.74 | .81 | 5,785 | 1.62 | 3.41 | 1.62 | 3.41 | 1.62 | 3.41 | 14 | |||||||||||||||||||||||||||||||||||
2007 | 10.99 | .38 | .05 | .43 | (.37 | ) | (.01 | ) | (.38 | ) | 11.04 | 3.87 | 7,351 | 1.63 | 3.38 | 1.63 | 3.38 | 1.61 | 3.39 | 16 | ||||||||||||||||||||||||||||||||||||
2006 | 11.26 | .39 | (.27 | ) | .12 | (.39 | ) | — | (.39 | ) | 10.99 | 1.12 | 8,570 | 1.58 | 3.48 | 1.58 | 3.48 | 1.57 | 3.49 | 12 | ||||||||||||||||||||||||||||||||||||
2005 | 10.79 | .40 | .47 | .87 | (.40 | ) | — | (.40 | ) | 11.26 | 8.15 | 9,197 | 1.58 | 3.60 | 1.58 | 3.60 | 1.58 | 3.60 | 16 | |||||||||||||||||||||||||||||||||||||
2004 | 11.30 | .41 | (.52 | ) | (.11 | ) | (.40 | ) | — | (.40 | ) | 10.79 | (.95 | ) | 9,532 | 1.60 | 3.75 | 1.60 | 3.75 | 1.60 | 3.75 | 13 | ||||||||||||||||||||||||||||||||||
| Class C (2/94) | ||||||||||||||||||||||||||||||||||||||||||||||||||||||||
2008 | 11.02 | .39 | (.28 | ) | .11 | (.39 | ) | (.02 | ) | (.41 | ) | 10.72 | 1.03 | 21,541 | 1.42 | 3.61 | 1.42 | 3.61 | 1.42 | 3.62 | 14 | |||||||||||||||||||||||||||||||||||
2007 | 10.97 | .40 | .05 | .45 | (.39 | ) | (.01 | ) | (.40 | ) | 11.02 | 4.10 | 21,263 | 1.43 | 3.58 | 1.43 | 3.58 | 1.42 | 3.59 | 16 | ||||||||||||||||||||||||||||||||||||
2006 | 11.24 | .41 | (.26 | ) | .15 | (.42 | ) | — | (.42 | ) | 10.97 | 1.34 | 21,387 | 1.38 | 3.68 | 1.38 | 3.68 | 1.37 | 3.69 | 12 | ||||||||||||||||||||||||||||||||||||
2005 | 10.77 | .42 | .47 | .89 | (.42 | ) | — | (.42 | ) | 11.24 | 8.39 | 19,955 | 1.39 | 3.80 | 1.39 | 3.80 | 1.38 | 3.81 | 16 | |||||||||||||||||||||||||||||||||||||
2004 | 11.29 | .44 | (.53 | ) | (.09 | ) | (.43 | ) | — | (.43 | ) | 10.77 | (.84 | ) | 21,402 | 1.40 | 3.95 | 1.40 | 3.95 | 1.40 | 3.95 | 13 | ||||||||||||||||||||||||||||||||||
| Class I (2/97)(f) | ||||||||||||||||||||||||||||||||||||||||||||||||||||||||
2008 | 11.03 | .47 | (.28 | ) | .19 | (.47 | ) | (.02 | ) | (.49 | ) | 10.73 | 1.81 | 2,657 | .68 | 4.36 | .68 | 4.36 | .67 | 4.37 | 14 | |||||||||||||||||||||||||||||||||||
2007 | 10.99 | .48 | .04 | .52 | (.47 | ) | (.01 | ) | (.48 | ) | 11.03 | 4.79 | 2,169 | .68 | 4.31 | .68 | 4.31 | .67 | 4.33 | 16 | ||||||||||||||||||||||||||||||||||||
2006 | 11.26 | .49 | (.26 | ) | .23 | (.50 | ) | — | (.50 | ) | 10.99 | 2.10 | 895 | .63 | 4.44 | .63 | 4.44 | .62 | 4.45 | 12 | ||||||||||||||||||||||||||||||||||||
2005 | 10.79 | .50 | .47 | .97 | (.50 | ) | — | (.50 | ) | 11.26 | 9.20 | 561 | .64 | 4.54 | .64 | 4.54 | .64 | 4.55 | 16 | |||||||||||||||||||||||||||||||||||||
2004 | 11.31 | .52 | (.53 | ) | (.01 | ) | (.51 | ) | — | (.51 | ) | 10.79 | (.10 | ) | 483 | .65 | 4.70 | .65 | 4.70 | .65 | 4.71 | 13 | ||||||||||||||||||||||||||||||||||
| (a) | Per share Net Investment Income is calculated using the average daily shares method. |
| (b) | Total return is the combination of changes in net asset value without any sales charge, reinvested dividend income at net asset value and reinvested capital gains distributions at net asset value, if any. Total returns are not annualized. |
| (c) | After expense reimbursement from the Adviser, where applicable. |
| (d) | After custodian fee credit and expense reimbursement, where applicable. |
| (e) | The expense ratios in the above table reflect, among other things, the interest expense deemed to have been paid by the Fund on the floating rate certificates issued by the special purpose trusts for the self-deposited inverse floaters held by the Fund, as described in Footnote 1 – Inverse Floating Rate Securities. The amount of this deemed interest expense for such periods expressed as a percentage of average net assets for each share class was as follows: |
| Interest Expense on Floating Rate Obligations to Average Net Assets | |||
Year Ended May 31, | |||
2008 | .03 | % | |
2007 | .04 | ||
2006 | — | ||
2005 | — | ||
2004 | — | ||
| (f) | Effective May 1, 2008, Class R Shares were renamed Class I Shares. |
See accompanying notes to financial statements.
78
| Class (Commencement Date) | ||||||||||||||||||||||||||||||||||||||||||||||||||||||||
| Investment Operations | Less Distributions | Ratios/Supplemental Data | ||||||||||||||||||||||||||||||||||||||||||||||||||||||
| OHIO | Ratios to Average Net Assets Before Credit/ Reimbursement | Ratios to Average Net Assets After Reimbursement(c) | Ratios to Average Net Assets After Credit/ Reimbursement(d) | |||||||||||||||||||||||||||||||||||||||||||||||||||||
| Year Ended May 31, | Beginning Net Asset Value | Net Invest- ment Income(a) | Net Realized/ Unrealized Gain (Loss) | Total | Net Invest- ment Income | Capital Gains | Total | Ending Net Asset Value | Total Return(b) | Ending Net Assets (000) | Expenses(e) | Net Invest- ment Income | Expenses(e) | Net Invest- ment Income | Expenses(e) | Net Invest- ment Income | Portfolio Turnover Rate | |||||||||||||||||||||||||||||||||||||||
| Class A (6/85) | ||||||||||||||||||||||||||||||||||||||||||||||||||||||||
2008 | $ | 11.25 | $ | .46 | $ | (.19 | ) | $ | .27 | $ | (.46 | ) | $ | (.07 | ) | $ | (.53 | ) | $ | 10.99 | 2.47 | % | $ | 338,770 | .93 | % | 4.16 | % | .93 | % | 4.16 | % | .92 | % | 4.17 | % | 20 | % | ||||||||||||||||||
2007 | 11.27 | .47 | .01 | .48 | (.47 | ) | (.03 | ) | (.50 | ) | 11.25 | 4.30 | 346,298 | .98 | 4.11 | .98 | 4.11 | .98 | 4.12 | 10 | ||||||||||||||||||||||||||||||||||||
2006 | 11.65 | .48 | (.34 | ) | .14 | (.48 | ) | (.04 | ) | (.52 | ) | 11.27 | 1.30 | 348,198 | .83 | 4.21 | .83 | 4.21 | .83 | 4.21 | 13 | |||||||||||||||||||||||||||||||||||
2005 | 11.17 | .51 | .48 | .99 | (.51 | ) | — | (.51 | ) | 11.65 | 9.00 | 358,529 | .84 | 4.43 | .84 | 4.43 | .83 | 4.44 | 11 | |||||||||||||||||||||||||||||||||||||
2004 | 11.78 | .53 | (.60 | ) | (.07 | ) | (.54 | ) | — | (.54 | ) | 11.17 | (.62 | ) | 347,733 | .85 | 4.65 | .85 | 4.65 | .85 | 4.65 | 12 | ||||||||||||||||||||||||||||||||||
| Class B (2/97) | ||||||||||||||||||||||||||||||||||||||||||||||||||||||||
2008 | 11.24 | .38 | (.21 | ) | .17 | (.37 | ) | (.07 | ) | (.44 | ) | 10.97 | 1.61 | 11,577 | 1.67 | 3.42 | 1.67 | 3.42 | 1.67 | 3.42 | 20 | |||||||||||||||||||||||||||||||||||
2007 | 11.25 | .38 | .02 | .40 | (.38 | ) | (.03 | ) | (.41 | ) | 11.24 | 3.64 | 16,125 | 1.73 | 3.36 | 1.73 | 3.36 | 1.73 | 3.37 | 10 | ||||||||||||||||||||||||||||||||||||
2006 | 11.64 | .40 | (.35 | ) | .05 | (.40 | ) | (.04 | ) | (.44 | ) | 11.25 | .47 | 20,504 | 1.58 | 3.45 | 1.58 | 3.45 | 1.58 | 3.46 | 13 | |||||||||||||||||||||||||||||||||||
2005 | 11.16 | .42 | .48 | .90 | (.42 | ) | — | (.42 | ) | 11.64 | 8.22 | 25,621 | 1.58 | 3.69 | 1.58 | 3.69 | 1.58 | 3.69 | 11 | |||||||||||||||||||||||||||||||||||||
2004 | 11.77 | .45 | (.61 | ) | (.16 | ) | (.45 | ) | — | (.45 | ) | 11.16 | (1.34 | ) | 26,057 | 1.60 | 3.90 | 1.60 | 3.90 | 1.60 | 3.90 | 12 | ||||||||||||||||||||||||||||||||||
| Class C (8/93) | ||||||||||||||||||||||||||||||||||||||||||||||||||||||||
2008 | 11.22 | .40 | (.19 | ) | .21 | (.40 | ) | (.07 | ) | (.47 | ) | 10.96 | 1.93 | 50,642 | 1.48 | 3.61 | 1.48 | 3.61 | 1.47 | 3.62 | 20 | |||||||||||||||||||||||||||||||||||
2007 | 11.24 | .40 | .02 | .42 | (.41 | ) | (.03 | ) | (.44 | ) | 11.22 | 3.77 | 49,084 | 1.53 | 3.56 | 1.53 | 3.56 | 1.53 | 3.57 | 10 | ||||||||||||||||||||||||||||||||||||
2006 | 11.63 | .42 | (.35 | ) | .07 | (.42 | ) | (.04 | ) | (.46 | ) | 11.24 | .68 | 46,325 | 1.38 | 3.66 | 1.38 | 3.66 | 1.38 | 3.66 | 13 | |||||||||||||||||||||||||||||||||||
2005 | 11.15 | .45 | .48 | .93 | (.45 | ) | — | (.45 | ) | 11.63 | 8.45 | 45,791 | 1.38 | 3.88 | 1.38 | 3.88 | 1.38 | 3.89 | 11 | |||||||||||||||||||||||||||||||||||||
2004 | 11.76 | .47 | (.60 | ) | (.13 | ) | (.48 | ) | — | (.48 | ) | 11.15 | (1.14 | ) | 44,575 | 1.40 | 4.10 | 1.40 | 4.10 | 1.40 | 4.10 | 12 | ||||||||||||||||||||||||||||||||||
| Class I (2/97)(f) | ||||||||||||||||||||||||||||||||||||||||||||||||||||||||
2008 | 11.24 | .49 | (.21 | ) | .28 | (.48 | ) | (.07 | ) | (.55 | ) | 10.97 | 2.60 | 116,718 | .73 | 4.36 | .73 | 4.36 | .72 | 4.37 | 20 | |||||||||||||||||||||||||||||||||||
2007 | 11.25 | .49 | .02 | .51 | (.49 | ) | (.03 | ) | (.52 | ) | 11.24 | 4.53 | 125,050 | .78 | 4.31 | .78 | 4.31 | .78 | 4.32 | 10 | ||||||||||||||||||||||||||||||||||||
2006 | 11.64 | .50 | (.34 | ) | .16 | (.51 | ) | (.04 | ) | (.55 | ) | 11.25 | 1.51 | 128,133 | .63 | 4.41 | .63 | 4.41 | .63 | 4.41 | 13 | |||||||||||||||||||||||||||||||||||
2005 | 11.16 | .53 | .48 | 1.01 | (.53 | ) | — | (.53 | ) | 11.64 | 9.24 | 139,017 | .64 | 4.64 | .64 | 4.64 | .64 | 4.64 | 11 | |||||||||||||||||||||||||||||||||||||
2004 | 11.77 | .56 | (.61 | ) | (.05 | ) | (.56 | ) | — | (.56 | ) | 11.16 | (.41 | ) | 139,762 | .65 | 4.85 | .65 | 4.85 | .65 | 4.85 | 12 | ||||||||||||||||||||||||||||||||||
| (a) | Per share Net Investment Income is calculated using the average daily shares method. |
| (b) | Total return is the combination of changes in net asset value without any sales charge, reinvested dividend income at net asset value and reinvested capital gains distributions at net asset value, if any. Total returns are not annualized. |
| (c) | After expense reimbursement from the Adviser, where applicable. |
| (d) | After custodian fee credit and expense reimbursement, where applicable. |
| (e) | The expense ratios in the above table reflect, among other things, the interest expense deemed to have been paid by the Fund on the floating rate certificates issued by the special purpose trusts for the self-deposited inverse floaters held by the Fund, as described in Footnote 1 – Inverse Floating Rate Securities. The amount of this deemed interest expense for such periods expressed as a percentage of average net assets for each share class was as follows: |
| Interest Expense on Floating Rate Obligations to Average Net Assets | |||
Year Ended May 31, | |||
2008 | .09 | % | |
2007 | .15 | ||
2006 | — | ||
2005 | — | ||
2004 | — | ||
| (f) | Effective May 1, 2008, Class R Shares were renamed Class I Shares. |
See accompanying notes to financial statements.
79
Financial Highlights (continued)
Selected data for a share outstanding throughout each period:
| Class (Commencement Date) | ||||||||||||||||||||||||||||||||||||||||||||||||||||||||
| Investment Operations | Less Distributions | Ratios/Supplemental Data | ||||||||||||||||||||||||||||||||||||||||||||||||||||||
| WISCONSIN | Ratios to Average Net Assets Before Credit/ Reimbursement | Ratios to Average Net Assets After Reimbursement(c) | Ratios to Average Net Assets After Credit/ Reimbursement(d) | |||||||||||||||||||||||||||||||||||||||||||||||||||||
| Year Ended May 31, | Beginning Net Asset Value | Net Invest- ment Income(a) | Net Realized/ Unrealized Gain (Loss) | Total | Net Invest- ment Income | Capital Gains | Total | Ending Net Asset Value | Total Return(b) | Ending Net Assets (000) | Expenses | Net Invest- ment Income | Expenses | Net Invest- ment Income | Expenses | Net Invest- ment Income | Portfolio Turnover Rate | |||||||||||||||||||||||||||||||||||||||
| Class A (6/94) | ||||||||||||||||||||||||||||||||||||||||||||||||||||||||
2008 | $ | 10.24 | $ | .38 | $ | (.13 | ) | $ | .25 | $ | (.38 | ) | $ | (.02 | ) | $ | (.40 | ) | $ | 10.09 | 2.51 | % | $ | 50,640 | .88 | % | 3.72 | % | .88 | % | 3.72 | % | .86 | % | 3.74 | % | 3 | % | ||||||||||||||||||
2007 | 10.20 | .39 | .06 | .45 | (.39 | ) | (.02 | ) | (.41 | ) | 10.24 | 4.46 | 42,279 | .90 | 3.78 | .90 | 3.78 | .87 | 3.82 | 10 | ||||||||||||||||||||||||||||||||||||
2006 | 10.54 | .40 | (.28 | ) | .12 | (.41 | ) | (.05 | ) | (.46 | ) | 10.20 | 1.11 | 36,624 | .92 | 3.84 | .92 | 3.84 | .89 | 3.88 | 11 | |||||||||||||||||||||||||||||||||||
2005 | 10.16 | .42 | .37 | .79 | (.41 | ) | — | (.41 | ) | 10.54 | 7.94 | 36,325 | .92 | 3.99 | .92 | 3.99 | .90 | 4.00 | 15 | |||||||||||||||||||||||||||||||||||||
2004 | 10.62 | .43 | (.45 | ) | (.02 | ) | (.44 | ) | — | (.44 | ) | 10.16 | (.33 | ) | 39,033 | .92 | 4.12 | .92 | 4.12 | .91 | 4.13 | 21 | ||||||||||||||||||||||||||||||||||
| Class B (2/97) | ||||||||||||||||||||||||||||||||||||||||||||||||||||||||
2008 | 10.26 | .30 | (.11 | ) | .19 | (.31 | ) | (.02 | ) | (.33 | ) | 10.12 | 1.82 | 2,174 | 1.63 | 2.98 | 1.63 | 2.98 | 1.61 | 3.00 | 3 | |||||||||||||||||||||||||||||||||||
2007 | 10.22 | .32 | .05 | .37 | (.31 | ) | (.02 | ) | (.33 | ) | 10.26 | 3.67 | 2,464 | 1.65 | 3.04 | 1.65 | 3.04 | 1.62 | 3.07 | 10 | ||||||||||||||||||||||||||||||||||||
2006 | 10.57 | .32 | (.29 | ) | .03 | (.33 | ) | (.05 | ) | (.38 | ) | 10.22 | .26 | 3,295 | 1.67 | 3.09 | 1.67 | 3.09 | 1.64 | 3.12 | 11 | |||||||||||||||||||||||||||||||||||
2005 | 10.18 | .34 | .39 | .73 | (.34 | ) | — | (.34 | ) | 10.57 | 7.25 | 4,600 | 1.67 | 3.24 | 1.67 | 3.24 | 1.66 | 3.25 | 15 | |||||||||||||||||||||||||||||||||||||
2004 | 10.65 | .35 | (.46 | ) | (.11 | ) | (.36 | ) | — | (.36 | ) | 10.18 | (1.01 | ) | 4,568 | 1.67 | 3.37 | 1.67 | 3.37 | 1.66 | 3.38 | 21 | ||||||||||||||||||||||||||||||||||
| Class C (2/97) | ||||||||||||||||||||||||||||||||||||||||||||||||||||||||
2008 | 10.26 | .32 | (.12 | ) | .20 | (.33 | ) | (.02 | ) | (.35 | ) | 10.11 | 1.96 | 6,512 | 1.43 | 3.17 | 1.43 | 3.17 | 1.41 | 3.19 | 3 | |||||||||||||||||||||||||||||||||||
2007 | 10.23 | .34 | .05 | .39 | (.34 | ) | (.02 | ) | (.36 | ) | 10.26 | 3.91 | 5,975 | 1.45 | 3.24 | 1.45 | 3.24 | 1.42 | 3.27 | 10 | ||||||||||||||||||||||||||||||||||||
2006 | 10.57 | .35 | (.29 | ) | .06 | (.35 | ) | (.05 | ) | (.40 | ) | 10.23 | .49 | 5,422 | 1.47 | 3.29 | 1.47 | 3.29 | 1.44 | 3.33 | 11 | |||||||||||||||||||||||||||||||||||
2005 | 10.18 | .36 | .39 | .75 | (.36 | ) | — | (.36 | ) | 10.57 | 7.47 | 4,797 | 1.47 | 3.44 | 1.47 | 3.44 | 1.45 | 3.45 | 15 | |||||||||||||||||||||||||||||||||||||
2004 | 10.65 | .37 | (.46 | ) | (.09 | ) | (.38 | ) | — | (.38 | ) | 10.18 | (.84 | ) | 4,632 | 1.47 | 3.57 | 1.47 | 3.57 | 1.46 | 3.58 | 21 | ||||||||||||||||||||||||||||||||||
| Class I (2/97)(e) | ||||||||||||||||||||||||||||||||||||||||||||||||||||||||
2008 | 10.28 | .40 | (.13 | ) | .27 | (.41 | ) | (.02 | ) | (.43 | ) | 10.12 | 2.64 | 1,506 | .68 | 3.92 | .68 | 3.92 | .66 | 3.94 | 3 | |||||||||||||||||||||||||||||||||||
2007 | 10.25 | .42 | .04 | .46 | (.41 | ) | (.02 | ) | (.43 | ) | 10.28 | 4.59 | 1,031 | .69 | 3.97 | .69 | 3.97 | .66 | 4.00 | 10 | ||||||||||||||||||||||||||||||||||||
2006 | 10.59 | .42 | (.28 | ) | .14 | (.43 | ) | (.05 | ) | (.48 | ) | 10.25 | 1.34 | 202 | .72 | 4.04 | .72 | 4.04 | .68 | 4.07 | 11 | |||||||||||||||||||||||||||||||||||
2005 | 10.20 | .44 | .39 | .83 | (.44 | ) | — | (.44 | ) | 10.59 | 8.25 | 63 | .72 | 4.21 | .72 | 4.21 | .71 | 4.22 | 15 | |||||||||||||||||||||||||||||||||||||
2004 | 10.67 | .45 | (.46 | ) | (.01 | ) | (.46 | ) | — | (.46 | ) | 10.20 | (.10 | ) | 177 | .72 | 4.32 | .72 | 4.32 | .71 | 4.33 | 21 | ||||||||||||||||||||||||||||||||||
| (a) | Per share Net Investment Income is calculated using the average daily shares method. |
| (b) | Total return is the combination of changes in net asset value without any sales charge, reinvested dividend income at net asset value and reinvested capital gains distributions at net asset value, if any. Total returns are not annualized. |
| (c) | After expense reimbursement from the Adviser, where applicable. |
| (d) | After custodian fee credit and expense reimbursement, where applicable. |
| (e) | Effective May 1, 2008, Class R Shares were renamed Class I Shares. |
See accompanying notes to financial statements.
80
Report of Independent Registered Public Accounting Firm
To the Board of Trustees and Shareholders of
Nuveen Multistate Trust IV:
In our opinion, the accompanying statements of assets and liabilities, including the portfolios of investments, and the related statements of operations, of changes in net assets and the financial highlights present fairly, in all material respects, the financial position of Nuveen Kansas Municipal Bond Fund, Nuveen Kentucky Municipal Bond Fund, Nuveen Michigan Municipal Bond Fund, Nuveen Missouri Municipal Bond Fund, Nuveen Ohio Municipal Bond Fund and Nuveen Wisconsin Municipal Bond Fund (each a series of the Nuveen Multistate Trust IV, hereafter referred to as the “Funds”) at May 31, 2008, the results of their operations for the year then ended, the changes in their net assets for each of the two years in the period then ended and the financial highlights for each of the five years in the period then ended in conformity with accounting principles generally accepted in the United States of America. These financial statements and financial highlights (hereafter referred to as “financial statements”) are the responsibility of the Funds’ management; our responsibility is to express an opinion on these financial statements based on our audits. We conducted our audits of these financial statements in accordance with the standards of the Public Company Accounting Oversight Board (United States). Those standards require that we plan and perform the audit to obtain reasonable assurance about whether the financial statements are free of material misstatement. An audit includes examining, on a test basis, evidence supporting the amounts and disclosures in the financial statements, assessing the accounting principles used and significant estimates made by management, and evaluating the overall financial statement presentation. We believe that our audits, which included confirmation of securities at May 31, 2008 by correspondence with the custodian and brokers, provide a reasonable basis for our opinion.
PricewaterhouseCoopers LLP
Chicago, IL
July 23, 2008
81
Annual Investment Management Agreement Approval Process
The Investment Company Act of 1940, as amended (the “1940 Act”), provides, in substance, that each investment advisory agreement between a fund and its investment adviser will continue in effect from year to year only if its continuance is approved at least annually by the fund’s board members, including by a vote of a majority of the board members who are not parties to the advisory agreement or “interested persons” of any parties (the “Independent Board Members”), cast in person at a meeting called for the purpose of considering such approval. In connection with such approvals, the fund’s board members must request and evaluate, and the investment adviser is required to furnish, such information as may be reasonably necessary to evaluate the terms of the advisory agreement. Accordingly, at a meeting held on May 28-29, 2008 (the “May Meeting”), the Boards of Trustees or Directors (as the case may be)(each a “Board” and each Trustee or Director, a “Board Member”) of the Funds, including a majority of the Independent Board Members, considered and approved the continuation of the advisory agreement (each, an “Advisory Agreement”) between each Fund and Nuveen Asset Management (“NAM”) for an additional one-year period. In preparation for their considerations at the May Meeting, the Board also held a separate meeting on April 23, 2008 (the “April Meeting”). Accordingly, the factors considered and determinations made regarding the renewals by the Independent Board Members include those made at the April Meeting.
In addition, in evaluating the Advisory Agreements, as described in further detail below, the Independent Board Members reviewed a broad range of information relating to the Funds and NAM, including absolute performance, fee and expense information for the Funds as well as comparative performance, fee and expense information for a comparable peer group of funds, the performance information of recognized benchmarks (as applicable), the profitability of Nuveen for its advisory activities (which includes its wholly owned subsidiaries), and other information regarding the organization, personnel, and services provided by NAM. The Independent Board Members also met quarterly as well as at other times as the need arose during the year and took into account the information provided at such meetings and the knowledge gained therefrom. Prior to approving the renewal of the Advisory Agreements, the Independent Board Members reviewed the foregoing information with their independent legal counsel and with management, reviewed materials from independent legal counsel describing applicable law and their duties in reviewing advisory contracts, and met with independent legal counsel in private sessions without management present. The Independent Board Members considered the legal advice provided by independent legal counsel and relied upon their knowledge of NAM, its services and the Funds resulting from their meetings and other interactions throughout the year and their own business judgment in determining the factors to be considered in evaluating the Advisory Agreements. Each Board Member may have accorded different weight to the various factors in reaching his or her conclusions with respect to a Fund’s Advisory Agreement. The Independent Board Members did not identify any single factor as all-important or controlling. The Independent Board Members considerations were instead based on a comprehensive consideration of all the information presented. The principal factors considered by the Board and its conclusions are described below.
A. Nature, Extent and Quality of Services
In considering renewal of the Advisory Agreements, the Independent Board Members considered the nature, extent and quality of NAM’s services, including advisory services and administrative services. The Independent Board Members reviewed materials outlining, among other things, NAM’s organization and business; the types of services that NAM or its affiliates provide and are expected to provide to the Funds; the performance record of the applicable Fund (as described in further detail below); and any initiatives Nuveen had taken for the applicable fund product line. With respect to personnel, the Independent Board Members evaluated the background, experience and track record of NAM’s investment personnel. In this regard, the Independent Board Members considered the additional investment in personnel to support Nuveen fund advisory activities, including in operations, product management and marketing as well as related fund support functions, including sales, executive, finance, human resources and information technology. The Independent Board Members also reviewed information regarding portfolio manager compensation arrangements to evaluate NAM’s ability to attract and retain high quality investment personnel.
In evaluating the services of NAM, the Independent Board Members also considered NAM’s ability to supervise the Fund’s other service providers and given the importance of compliance, NAM’s compliance program. Among other things, the Independent Board Members considered the report of the chief compliance officer regarding the Funds’ compliance policies and procedures.
In addition to advisory services, the Independent Board Members considered the quality of administrative services provided by NAM and its affiliates including product management, fund administration, oversight of service providers, shareholder services, administration of Board relations, regulatory and portfolio compliance and legal support.
Based on their review, the Independent Board Members found that, overall, the nature, extent and quality of services provided (and expected to be provided) to the respective Funds under the Advisory Agreements were satisfactory.
B. The Investment Performance of the Funds and NAM
The Board considered the investment performance of each Fund, including the Fund’s historic performance as well as its performance compared to funds with similar investment objectives (the “Performance Peer Group”) based on data provided by an independent third party (as described below). The Independent Board Members also reviewed portfolio level performance (which does not reflect fund level fees and expenses), as described in further detail below.
In evaluating the performance information, the Board considered whether the Fund has operated within its investment objectives and parameters and the impact that the investment mandates may have had on performance. In addition, in comparing a Fund’s performance with that of its Performance Peer Group, the Independent Board Members took into account that the closest
82
Performance Peer Group in certain instances may not adequately reflect the respective Fund’s investment objectives and strategies thereby hindering a meaningful comparison of the Fund’s performance with that of the Performance Peer Group. These Performance Peer Groups include those for the Nuveen Intermediate Duration Municipal Bond Fund (NMBF) (although this fund has been reclassified in more appropriate peer group in 2007).
With respect to state specific municipal funds, the Independent Board Members also recognized that certain funds lack comparable peers in which case their performance is measured against a more general municipal category for various states. The open-end state municipal funds that utilize the more general category are the Nuveen New Mexico Municipal Bond Fund and the Nuveen Wisconsin Municipal Bond Fund.
With respect to municipal funds, the Independent Board Members reviewed performance information including, among other things, total return information compared with the Fund’s Performance Peer Group and recognized benchmarks for the one-, three- and five-year periods (as applicable) ending December 31, 2007 and with the Performance Peer Group for the quarter and same yearly periods ending March 31, 2008. The Independent Board Members also reviewed the Fund’s portfolio level performance (which does not reflect fund level fees and expenses) compared to recognized benchmarks for the one- three, and five-year periods ending December 31, 2007 (as applicable). The analysis was used to assess the efficacy of investment decisions against appropriate measures of risk and total return, within specific market segments. This information supplemented the Fund performance information provided to the Board at each of its quarterly meetings. Based on their review, the Independent Board Members determined that each Fund’s investment performance over time had been satisfactory.
C. Fees, Expenses and Profitability
1. Fees and Expenses
The Board evaluated the management fees and expenses of each Fund reviewing, among other things, such Fund’s gross management fees (which take into account breakpoints), net management fees (which take into account fee waivers or reimbursements) and total expense ratios (before and after expense reimbursements and/or waivers) in absolute terms as well as compared to the gross management fees, net management fees (after waivers and/or reimbursements) and total expense ratios (before and after waivers) of a comparable universe of unaffiliated funds based on data provided by an independent data provider (the “Peer Universe”) and/or a more focused subset of funds therein (the “Peer Group”). The Independent Board Members further reviewed data regarding the construction of Peer Groups as well as the methods of measurement for the fee and expense analysis and the performance analysis. In reviewing the comparisons of fee and expense information, the Independent Board Members took into account that in certain instances various factors such as the size of the Fund relative to peers, the size and particular composition of the Peer Group, the investment objectives of the peers, expense anomalies, and the timing of information used may impact the comparative data, thereby limiting the ability to make a meaningful comparison. The Independent Board Members considered the differences in the use of insurance as well as the states reflected in a respective Peer Group for the state municipal funds (such as the use of a general “other states” category for uninsured open-end state municipal funds (other than New York and California)). In reviewing the fee schedule for a Fund, the Independent Board Members also considered the fund-level and complex-wide breakpoint schedules (described in further detail below) and any fee waivers and reimbursements provided by Nuveen. Based on their review of the fee and expense information provided, the Independent Board Members determined that each Fund’s management fees and net total expense ratio were reasonable in light of the nature, extent and quality of services provided to the Fund.
2. Comparisons with the Fees of Other Clients
The Independent Board Members further reviewed information regarding the nature of services and fee rates offered by NAM to other clients. With respect to municipal funds, such other clients include NAM’s municipal separately managed accounts. In evaluating the comparisons of fees, the Independent Board Members noted that the fee rates charged to the Funds and other clients vary, among other things, because of the different services involved and the additional regulatory and compliance requirements associated with registered investment companies, such as the Funds. Accordingly, the Independent Board Members considered the differences in the product types, including, but not limited to, the services provided, the structure and operations, product distribution and costs thereof, portfolio investment policies, investor profiles, account sizes and regulatory requirements. The Independent Board Members noted, in particular, that the range of services provided to the Funds (as discussed above) is much more extensive than that provided to separately managed accounts. Given the inherent differences in the products, particularly the extensive services provided to the Funds, the Independent Board Members believe such facts justify the different levels of fees.
3. Profitability of Nuveen
In conjunction with its review of fees, the Independent Board Members also considered the profitability of Nuveen for its advisory activities (which incorporated Nuveen’s wholly-owned affiliated sub-advisers) and its financial condition. The Independent Board Members reviewed the revenues and expenses of Nuveen’s advisory activities for the last two years and the allocation methodology used in preparing the profitability data. The Independent Board Members noted this information supplemented the profitability information requested and received during the year to help keep them apprised of developments affecting profitability (such as changes in fee waivers and expense reimbursement commitments). In this regard, the Independent Board Members noted that they had also appointed an Independent Board Member as a point person to review and keep them apprised of changes to the profitability analysis and/or methodologies during the year. The Independent Board Members considered Nuveen’s
83
Annual Investment Management Agreement Approval Process (continued)
profitability compared with other fund sponsors prepared by two independent third party service providers as well as comparisons of the revenues, expenses and profit margins of various unaffiliated management firms with similar amounts of assets under management prepared by Nuveen.
In reviewing profitability, the Independent Board Members recognized the subjective nature of determining profitability which may be affected by numerous factors including the allocation of expenses. Further, the Independent Board Members recognized the difficulties in making comparisons as the profitability of other advisers generally is not publicly available and the profitability information that is available for certain advisers or management firms may not be representative of the industry and may be affected by, among other things, the adviser’s particular business mix, capital costs, types of funds managed and expense allocations.
Notwithstanding the foregoing, the Independent Board Members reviewed Nuveen’s methodology and assumptions for allocating expenses across product lines to determine profitability. In reviewing profitability, the Independent Board Members recognized Nuveen’s investment in its fund business.
Based on its review, the Independent Board Members concluded that Nuveen’s level of profitability for its advisory activities was reasonable in light of the services provided.
In evaluating the reasonableness of the compensation, the Independent Board Members also considered other amounts paid to NAM by the Funds as well as any indirect benefits (such as soft dollar arrangements, if any) NAM and its affiliates receive, or are expected to receive, that are directly attributable to the management of the Funds, if any. See Section E below for additional information on indirect benefits NAM may receive as a result of its relationship with the Funds. Based on their review of the overall fee arrangements of each Fund, the Independent Board Members determined that the advisory fees and expenses of the respective Fund were reasonable.
D. Economies of Scale and Whether Fee Levels Reflect These Economies of Scale
With respect to economies of scale, the Independent Board Members recognized the potential benefits resulting from the costs of a Fund being spread over a larger asset base. The Independent Board Members therefore considered whether the Funds have appropriately benefited from any economies of scale and whether there is potential realization of any further economies of scale. In considering economies of scale, the Independent Board Members have recognized that economies of scale are difficult to measure and predict with precision, particularly on a fund-by-fund basis. Notwithstanding the foregoing, one method to help ensure the shareholders share in these benefits is to include breakpoints in the advisory fee schedule. Accordingly, the Independent Board Members reviewed and considered the fund-level breakpoints in the advisory fee schedules that reduce advisory fees.
In addition to fund-level advisory fee breakpoints, the Board also considered the Funds’ complex-wide fee arrangement. Pursuant to the complex-wide fee arrangement, the fees of the funds in the Nuveen complex, including the Funds, are reduced as the assets in the fund complex reach certain levels. In evaluating the complex-wide fee arrangement, the Independent Board Members recognized that the complex-wide fee schedule was recently revised in 2007 to provide for additional fee savings to shareholders and considered the amended schedule. The Independent Board Members further considered that the complex-wide fee arrangement seeks to provide the benefits of economies of scale to fund shareholders when total fund complex assets increase, even if assets of a particular Fund are unchanged or have decreased. The approach reflects the notion that some of Nuveen’s costs are attributable to services provided to all its Funds in the complex and therefore all Funds benefit if these costs are spread over a larger asset base. Based on their review, the Independent Board Members concluded that the breakpoint schedule and complex-wide fee arrangement were acceptable and desirable in providing benefits from economies of scale to shareholders.
E. Indirect Benefits
In evaluating fees, the Independent Board Members received and considered information regarding potential “fall out” or ancillary benefits NAM or its affiliates may receive as a result of its relationship with each Fund. In this regard, the Independent Board Members considered, among other things, any sales charges, distribution fees and shareholder services fees received and retained by the Funds’ principal underwriter, an affiliate of NAM, which includes fees received pursuant to any 12b-1 plan. The Independent Board Members, therefore, considered the 12b-1 fees retained by Nuveen during the last calendar year.
In addition to the above, the Independent Board Members considered whether NAM received any benefits from soft dollar arrangements whereby a portion of the commissions paid by a Fund for brokerage may be used to acquire research that may be useful to NAM in managing the assets of the Funds and other clients. The Independent Board Members noted that NAM does not currently have any soft dollar arrangements; however, to the extent certain bona fide agency transactions that occur on markets that traditionally trade on a principal basis and riskless principal transactions are considered as generating “commissions,” NAM intends to comply with the applicable safe harbor provisions.
Based on their review, the Independent Board Members concluded that any indirect benefits received by NAM as a result of its relationship with the Funds were reasonable and within acceptable parameters.
F. Other Considerations
The Independent Board Members did not identify any single factor discussed previously as all-important or controlling. The Board Members, including the Independent Board Members, unanimously concluded that the terms of the Advisory Agreements are fair and reasonable, that NAM’s fees are reasonable in light of the services provided to each Fund and that the Advisory Agreements be renewed.
84
Notes
85
Notes
86
Notes
87
Trustees and Officers
The management of the Funds, including general supervision of the duties performed for the Funds by the Adviser, is the responsibility of the Board of Trustees of the Funds. The number of trustees of the Funds is currently set at nine. None of the trustees who are not “interested” persons of the Funds (referred to herein as “independent trustees”) has ever been a director or employee of, or consultant to, Nuveen or its affiliates. The names and business addresses of the trustees and officers of the Funds, their principal occupations and other affiliations during the past five years, the number of portfolios each oversees and other directorships they hold are set forth below.
The Funds’ Statement of Additional Information (“SAI”) includes more information about the trustees. To request a free copy, call Nuveen Investments at (800) 257-8787 or visit the Funds’ website at www.nuveen.com.
Name, Birthdate and Address | Position(s) Held with the Funds | Year First Elected or Appointed (1) | Principal Occupation(s) Including other Directorships During Past 5 Years | Number of Portfolios in Fund Complex Overseen by Trustee | ||||
| Independent Trustees: | ||||||||
Robert P. Bremner 8/22/40 333 W. Wacker Drive Chicago, IL 60606 | Chairman of the Board and Trustee | 1997 | Private Investor and Management Consultant. | 186 | ||||
Jack B. Evans 10/22/48 333 W. Wacker Drive Chicago, IL 60606 | Trustee | 1999 | President, The Hall-Perrine Foundation, a private philanthropic corporation (since 1996); Director and Vice Chairman, United Fire Group, a publicly held company; Member of the Board of Regents for the State of Iowa University System; Director, Gazette Companies; Life Trustee of Coe College and Iowa College Foundation; Member of the Advisory Council of the Department of Finance in the Tippie College of Business, University of lowa; formerly, Director, Alliant Energy; formerly, Director, Federal Reserve Bank of Chicago; formerly, President and Chief Operating Officer, SCI Financial Group, Inc., a regional financial services firm. | 186 | ||||
William C. Hunter 3/6/48 333 W. Wacker Drive Chicago, IL 60606 | Trustee | 2004 | Dean, Tippie College of Business, University of Iowa (since July 2006); formerly, Dean and Distinguished Professor of Finance, School of Business at the University of Connecticut (2003-2006); previously, Senior Vice President and Director of Research at the Federal Reserve Bank of Chicago (1995-2003); Director (since 1997), Credit Research Center at George Washington University; Director (since 2004) of Xerox Corporation; Director (since 2005), Beta Gamma Sigma International Honor Society; Director, SS&C Technologies, Inc. (May 2005-October 2005). | 186 | ||||
David J. Kundert 10/28/42 333 W. Wacker Drive Chicago, IL 60606 | Trustee | 2005 | Director, Northwestern Mutual Wealth Management Company; Retired (since 2004) as Chairman, JPMorgan Fleming Asset Management, President and CEO, Banc One Investment Advisors Corporation, and President, One Group Mutual Funds; prior thereto, Executive Vice President, Banc One Corporation and Chairman and CEO, Banc One Investment Management Group; Member, Board of Regents, Luther College; member of the Wisconsin Bar Association; member of Board of Directors, Friends of Boerner Botanical Gardens; member of Investment Committee, Greater Milwaukee Foundation. | 186 | ||||
William J. Schneider 9/24/44 333 W. Wacker Drive Chicago, IL 60606 | Trustee | 1997 | Chairman, formerly, Senior Partner and Chief Operating Officer (retired, 2004) of Miller-Valentine Partners Ltd., a real estate investment company; Director, Dayton Development Coalition; formerly, Member, Business Advisory Council, Cleveland Federal Reserve Bank. | 186 | ||||
Judith M. Stockdale 12/29/47 333 W. Wacker Drive Chicago, IL 60606 | Trustee | 1997 | Executive Director, Gaylord and Dorothy Donnelley Foundation (since 1994); prior thereto, Executive Director, Great Lakes Protection Fund (from 1990 to 1994). | 186 | ||||
88
Name, Birthdate and Address | Position(s) Held with the Funds | Year First Elected or Appointed (1) | Principal Occupation(s) Including other Directorships During Past 5 Years | Number of Portfolios in Fund Complex Overseen by Trustee | ||||
Carole E. Stone 6/28/47 333 W. Wacker Drive Chicago, IL 60606 | Trustee | 2007 | Director, Chicago Board Options Exchange (since 2006); Chair New York Racing Association Oversight Board (2005-12/2007); Commissioner, New York State Commission on Public Authority Reform (since 2005); formerly Director, New York State Division of the Budget (2000-2004), Chair, Public Authorities Control Board (2000-2004) and Director, Local Government Assistance Corporation (2000-2004). | 186 | ||||
Terence J. Toth (2) 9/29/59 333 W. Wacker Drive Chicago, IL 60606 | Trustee | 2008 | Private Investor (since 2007); CEO and President, Northern Trust Investments (2004-2007); Executive Vice President, Quantitative Management & Securities Lending (2000-2004); prior thereto, various positions with Northern Trust Company (since 1994); Member: Goodman Theatre Board (since 2004); Chicago Fellowship Board (since 2005), University of Illinois Leadership Council Board (since 2007) and Catalyst Schools of Chicago Board (since 2008); formerly Member: Northern Trust Mutual Funds Board (2005-2007), Northern Trust Japan Board (2004-2007), Northern Trust Securities Inc. Board (2003-2007) and Northern Trust Hong Kong Board (1997-2004). | 174 (4) | ||||
| Interested Trustee: | ||||||||
John P. Amboian (2)(3) 6/14/61 333 W. Wacker Drive Chicago, IL 60606 | Trustee | 2008 | Chief Executive Officer (since July 2007) and Director (since 1999) of Nuveen Investments, Inc.; Chief Executive Officer (since 2007) of Nuveen Asset Management, Rittenhouse Asset Management, Nuveen Investments Advisors, Inc. formerly, President (1999-2004) of Nuveen Advisory Corp. and Nuveen Institutional Advisory Corp. | 174 (4) | ||||
Name, Birthdate and Address | Position(s) Held with the Funds | Year First Elected or Appointed (5) | Principal Occupation(s) During Past 5 Years | Number of Portfolios in Fund Complex Overseen by Officer | ||||
| Officers of the Funds: | ||||||||
Gifford R. Zimmerman 9/9/56 333 W. Wacker Drive Chicago, IL 60606 | Chief Administrative Officer | 1988 | Managing Director (since 2002), Assistant Secretary and Associate General Counsel, formerly, Vice President and Assistant General Counsel, of Nuveen Investments, LLC; Managing Director (since 2002), Associate General Counsel and Assistant Secretary, of Nuveen Asset Management; Vice President and Assistant Secretary of NWQ Investment Management Company, LLC. (since 2002), Nuveen Investments Advisers Inc. (since 2002); Symphony Asset Management LLC, and NWQ Investment Management Company, LLC (since 2003), Tradewinds Global Investors, LLC, and Santa Barbara Asset Management, LLC (since 2006); Nuveen HydePark Group LLC and Richards & Tierney, Inc. (since 2007); Managing Director, Associate General Counsel and Assistant Secretary of Rittenhouse Asset Management, Inc. (since 2003); Managing Director (since 2004) and Assistant Secretary (since 1994) of Nuveen Investments, Inc.; formerly, Managing Director (2002-2004), General Counsel (1998-2004) and Assistant Secretary of Nuveen Advisory Corp. and Nuveen Institutional Advisory Corp.(6); Chartered Financial Analyst. | 186 | ||||
Michael T. Atkinson 2/3/66 333 W. Wacker Drive Chicago, IL 60606 | Vice President and Assistant Secretary | 2000 | Vice President (since 2002) of Nuveen Investments, LLC. | 186 | ||||
Alan A. Brown 8/1/62 333 W. Wacker Drive Chicago, IL 60606 | Vice President | 2007 | Executive Vice President, Mutual Funds, Nuveen Investments, LLC, (since 2005), previously, Managing Director and Chief Marketing Officer (2001-2005). | 66 | ||||
89
Trustees and Officers (continued)
Name, Birthdate and Address | Position(s) Held with the Funds | Year First Elected or Appointed (5) | Principal Occupation(s) Including other Directorships During Past 5 Years | Number of Portfolios in Fund Complex Overseen by Officer | ||||
Lorna C. Ferguson 10/24/45 333 W. Wacker Drive Chicago, IL 60606 | Vice President | 1998 | Managing Director (since 2004), formerly, Vice President of Nuveen Investments, LLC, Managing Director (2004) formerly, Vice President (1998-2004) of Nuveen Advisory Corp. and Nuveen Institutional Advisory Corp.(6); Managing Director (since 2005) of Nuveen Asset Management. | 186 | ||||
Stephen D. Foy 5/31/54 333 W. Wacker Drive Chicago, IL 60606 | Vice President and Controller | 1998 | Vice President (since 1993) and Funds Controller (since 1998) of Nuveen Investments, LLC; Vice President (since 2005) of Nuveen Asset Management; formerly, Vice President and Funds Controller (1998-2004) of Nuveen Investments, Inc.; Certified Public Accountant. | 186 | ||||
Walter M. Kelly 2/24/70 333 W. Wacker Drive Chicago, IL 60606 | Chief Compliance Officer and Vice President | 2003 | Senior Vice President (since 2008), Vice President (2006- 2008) formerly, Assistant Vice President and Assistant General Counsel (2003-2006) of Nuveen Investments, LLC; Vice President (since 2006) and Assistant Secretary (since 2003) of Nuveen Asset Management. | 186 | ||||
David J. Lamb 3/22/63 333 W. Wacker Drive Chicago, IL 60606 | Vice President | 2000 | Vice President (since 2000) of Nuveen Investments, LLC; Certified Public Accountant. | 186 | ||||
Tina M. Lazar 8/27/61 333 W. Wacker Drive Chicago, IL 60606 | Vice President | 2002 | Vice President of Nuveen Investments, LLC (since 1999). | 186 | ||||
Larry W. Martin 7/27/51 333 W. Wacker Drive Chicago, IL 60606 | Vice President and Assistant Secretary | 1988 | Vice President, Assistant Secretary and Assistant General Counsel of Nuveen Investments, LLC; formerly, Vice President and Assistant Secretary of Nuveen Advisory Corp. and Nuveen Institutional Advisory Corp.(4); Vice President (since 2005) and Assistant Secretary of Nuveen Investments, Inc.; Vice President (since 2005) and Assistant Secretary (since 1997) of Nuveen Asset Management; Vice President (since 2000), Assistant Secretary and Assistant General Counsel (since 1998) of Rittenhouse Asset Management, Inc.; Vice President and Assistant Secretary of Nuveen Investments Advisers Inc. (since 2002); NWQ Investment Management Company, LLC (since 2002), Symphony Asset Management LLC (since 2003), Tradewinds NWQ Global Investors, LLC, Santa Barbara Asset Management, LLC (since 2006) and of Nuveen HydePark Group, LLC and Richards & Tierney, Inc. (since 2007); formerly, Vice President and Assistant Secretary of Nuveen Advisory Corp. and Nuveen Institutional Advisory Corp.(6) | 186 | ||||
Kevin J. McCarthy 3/26/66 333 W. Wacker Drive Chicago, IL 60606 | Vice President and Secretary | 2007 | Managing Director (since 2008), formerly, Vice President (2007-2008), Nuveen Investments, LLC; Managing Director (since 2008) Vice President and Assistant Secretary (since 2007), Nuveen Asset Management, Rittenhouse Asset Management, Inc., Nuveen Investment Advisers Inc., Nuveen Investment Institutional Services Group LLC, NWQ Investment Management Company, LLC, Tradewinds Global Investors LLC, NWQ Holdings, LLC, Symphony Asset Management LLC, Santa Barbara Asset Management LLC, Nuveen HydePark Group, LLC and Richards & Tierney, Inc, (since 2007); Managing Director (since 2008), Vice President (2007-2008) and Assistant General Counsel, Nuveen Investments, Inc., prior thereto, Partner, Bell, Boyd & Lloyd LLP (1997-2007). | 186 | ||||
90
Name, Birthdate and Address | Position(s) Held with the Funds | Year First Elected or Appointed (5) | Principal Occupation(s) Including other Directorships During Past 5 Years | Number of Portfolios in Fund Complex Overseen by Officer | ||||
John V. Miller 4/10/67 333 W. Wacker Drive Chicago, IL 60606 | Vice President | 2007 | Managing Director (since 2007), formerly, Vice President (2002-2007) of Nuveen Investments, LLC; Chartered Financial Analyst. | 186 | ||||
Christopher M. Rohrbacher 8/1/71 333 W. Wacker Drive Chicago, IL 60606 | Vice President and Assistant Secretary | 2008 | Vice President, Nuveen Investments, LLC (since 2008); Vice President and Assistant Secretary, Nuveen Asset Management (since 2008); Vice President and Assistant General Counsel, Nuveen Investments, Inc. (since 2008); prior thereto, Associate, Skadden, Arps, Slate Meagher & Flom LLP (2002-2008) | 186 | ||||
James F. Ruane 7/3/62 333 W. Wacker Drive Chicago, IL 60606 | Vice President and Assistant Secretary | 2007 | Vice President, Nuveen Investments (since 2007); prior thereto, Partner, Deloitte & Touche USA LLP (since 2005), formerly, senior tax manager (since 2002); Certified Public Accountant. | 186 | ||||
John S. White 5/12/67 333 W. Wacker Drive Chicago, IL 60606 | Vice President | 2007 | Vice President (since 2006) of Nuveen Investments, LLC, formerly, Assistant Vice President (since 2002); Lieutenant Colonel (since 2007), United States Marine Corps Reserve, formerly, Major (since 2001). | 66 | ||||
Mark L. Winget 12/21/68 333 W. Wacker Drive Chicago, IL 60606 | Vice President and Assistant Secretary | 2008 | Vice President, Nuveen Investments, LLC (since 2008); Vice President and Assistant Secretary, Nuveen Asset Management (since 2008); Vice President and Assistant General Counsel, Nuveen Investments Inc. (since 2008); prior thereto, Counsel, VedderPrice P.C. (1997-2007). | 186 | ||||
| (1) | Trustees serve an indefinite term until his/her successor is elected or appointed. The year first elected or appointed represents the year in which the trustee was first elected or appointed to any fund in the Nuveen Fund Complex. |
| (2) | Mr. Amboian and Mr. Toth were appointed to the Board of Trustees of certain Nuveen Funds, effective July 1, 2008. In connection with the appointment of Mr. Amboian as trustee, Timothy R. Schwertfeger, an interested trustee, resigned from the Board of Trustees, effective July 1, 2008. |
| (3) | Mr. Amboian is an interested trustee because of his position with Nuveen Investments, Inc. and certain of its subsidiaries, which are affiliates of the Nuveen Funds. |
| (4) | Mr. Amboian and Mr. Toth are standing for election to the Boards of twelve Nuveen closed-end funds whose annual meeting on June 30, 2008 was adjourned to July 29, 2008. |
| (5) | Officers serve one year terms through July of each year. The year first elected or appointed represents the year in which the officer was first elected or appointed to any fund in the Nuveen Fund Complex. |
| (6) | Nuveen Advisory Corp. and Nuveen Institutional Advisory Corp. were reorganized into Nuveen Asset Management, effective January 1, 2005. |
91
Glossary of Terms Used in this Report
Auction Rate Bond: An auction rate bond is a security whose interest payments are adjusted periodically through an auction process, which process typically also serves as a means for buying and selling the bond. Auctions that fail to attract enough buyers for all the shares offered for sale are deemed to have “failed”, with current holders receiving a formula-based interest rate until the next scheduled auction.
Advance Refundings: Advance refundings, also known as pre-refundings or refinancings, occur when an issuer sells new bonds and uses the proceeds to fund principal and interest payments of older existing bonds. This process often results in lower borrowing costs for bond issuers.
Average Annual Total Return: This is a commonly used method to express an investment’s performance over a particular, usually multi-year time period. It expresses the return that would have been necessary each year to equal the investment’s actual cumulative performance (including change in NAV or offer price and reinvested dividends and capital gains distributions, if any) over the time period being considered.
Average Effective Maturity: The average of the number of years to maturity of the bonds in a Fund’s portfolio, computed by weighting each bond’s time to maturity (the date the security comes due) by the market value of the security. This figure does not account for the likelihood of prepayments or the exercise of call provisions unless an escrow account has been established to redeem the bond before maturity. The market value weighting for an investment in an inverse floating rate security is the value of the portfolio’s residual interest in the inverse floating rate trust, and does not include the value of the floating rate securities issued by the trust.
Average Duration: Duration is a measure of the expected period over which a bond’s principal and interest will be paid, and consequently is a measure of the sensitivity of a bond’s (or bond fund’s) value to changes when market interest rates change. Generally, the longer a bond or Fund’s duration, the more the price of the bond or Fund will change as interest rates change.
Dividend Yield (also known as Market Yield or Current Yield): An investment’s current annualized dividend divided by its current offering price.
Inverse Floaters: Inverse floating rate securities are created by depositing a municipal bond, typically with a fixed interest rate, into a special purpose trust created by a broker-dealer. This trust, in turn, (a) issues floating rate certificates typically paying short-term tax-exempt interest rates to third parties in amounts equal to some fraction of the deposited bond’s par amount or market value, and (b) issues an inverse floating rate certificate (sometimes referred to as an “inverse floater”) to an investor (such as a Fund) interested in gaining investment exposure to a long-term municipal bond. The income received by the holder of the inverse floater varies inversely with the short-term rate paid to the floating rate certificates’ holders, and in most circumstances the holder of the inverse floater bears substantially all of the underlying bond’s downside investment risk. The holder of the inverse floater typically also benefits disproportionately from any potential appreciation of the underlying bond’s value. Hence, an inverse floater essentially represents an investment in the underlying bond on a leveraged basis.
Net Asset Value (NAV): A Fund’s NAV is the dollar value of one share in the Fund. It is calculated by subtracting the liabilities of the Fund from its total assets and then dividing the remainder by the number of shares outstanding. Fund NAVs are calculated at the end of each business day.
SEC 30-Day Yield: A standardized measure of a Fund’s yield that accounts for the future amortization of premiums or discounts of bonds held in the Fund’s portfolio.
Taxable-Equivalent Yield: The yield necessary from a fully taxable investment to equal, on an after-tax basis at a specified assumed tax rate, the yield of a municipal bond investment.
Zero Coupon Bond: A zero coupon bond does not pay a regular interest coupon to its holders during the life of the bond. Tax-exempt income to the holder of the bond comes from accretion of the difference between the original purchase price of the bond at issuance and the par value of the bond at maturity and is effectively paid at maturity. The market prices of zero coupon bonds generally are more volatile than the market prices of bonds that pay interest periodically.
92
Fund Information
Fund Manager Nuveen Asset Management 333 West Wacker Drive Chicago, IL 60606 | Legal Counsel Chapman and Cutler LLP Chicago, IL
Independent Registered Public Accounting Firm PricewaterhouseCoopers LLP Chicago, IL
Custodian State Street Bank & Trust Company Boston, MA | Transfer Agent and Shareholder Services Boston Financial Data Services, Inc.
Nuveen Investor Services P.O. Box 8530 Boston, MA 02266-8530 (800) 257-8787 | ||
Quarterly Portfolio of Investments and Proxy Voting Information: You may obtain (i) each Fund’s quarterly portfolio of investments, (ii) information regarding how the Funds voted proxies relating to portfolio securities held during the most recent twelve-month period ended June 30, 2007, and (iii) a description of the policies and procedures that the Funds used to determine how to vote proxies relating to portfolio securities without charge, upon request, by calling Nuveen Investments at (800) 257-8787 or on Nuveen’s website at www.nuveen.com. You may also obtain this and other Fund information directly from the Securities and Exchange Commission (“SEC”). The SEC may charge a copying fee for this information. Visit the SEC on-line at http://www.sec.gov or in person at the SEC’s Public Reference Room in Washington, D.C. Call the SEC at (202) 942-8090 for room hours and operation. You may also request Fund information by sending an e-mail request to publicinfo@sec.gov or by writing to the SEC’s Public Reference Section at 100 F Street NE, Washington, D.C. 20549.
The Financial Industry Regulatory Authority (FINRA) provides a Public Disclosure Program which supplies certain information regarding the disciplinary history of FINRA members and their associated persons in response to either telephone inquiries at (800) 289-9999 or written inquiries at www.finra.org. Financial Industry Regulatory Authority also provides an investor brochure that includes information describing the Public Disclosure Program.
93
Learn more
about Nuveen Funds at
www.nuveen.com/mf
Nuveen Investments:
SERVING Investors
For GENERATIONS
Since 1898, financial advisors and their clients have relied on Nuveen Investments to provide dependable investment solutions. Over this time, Nuveen Investments has adhered to the belief that the best approach to investing is to apply conservative risk-management principles to help minimize volatility.
Building on this tradition, we today offer a range of high quality equity and fixed-income solutions that can be integral parts of a well-diversified core portfolio. Our clients have come to appreciate this diversity, as well as our continued adherence to proven, long-term investing principles.
We offer many different investing solutions for our clients’ different needs.
Managing approximately $153 billion in assets as of March 31, 2008, Nuveen Investments offers access to a number of different asset classes and investing solutions through a variety of products. Nuveen Investments markets its capabilities under six distinct brands: NWQ, specializing in value-style equities; Nuveen, managing fixed-income investments; Santa Barbara, committed to growth equities; Tradewinds, specializing in global value equities; Rittenhouse, focused on “blue-chip” growth equities; and Symphony, with expertise in alternative investments as well as equity and income portfolios.
Find out how we can help you reach your financial goals.
An investor should carefully consider the Fund’s objectives, risks, charges and expenses before investing. For a prospectus containing this and other information about the Fund, please contact your financial advisor or Nuveen Investments at (800) 257-8787. Read the prospectus carefully before you invest or send money.
| • | Share prices |
| • | Fund details |
| • | Daily financial news |
| • | Investor education |
MAN-MS6-0508D
ITEM 2. CODE OF ETHICS.
As of the end of the period covered by this report, the registrant has adopted a code of ethics that applies to the registrant’s principal executive officer, principal financial officer, principal accounting officer or controller, or persons performing similar functions. There were no amendments to or waivers from the code during the period covered by this report. The registrant has posted the code of ethics on its website at www.nuveen.com/mf. (To view the code, click on the Shareholder Resources drop down menu box, click on Fund Governance and then click on Code of Conduct.)
ITEM 3. AUDIT COMMITTEE FINANCIAL EXPERT.
The registrant’s Board of Trustees determined that the registrant has at least one “audit committee financial expert” (as defined in Item 3 of Form N-CSR) serving on its Audit Committee. The registrant’s audit committee financial expert is Jack B. Evans, Chairman of the Audit Committee, who is “independent” for purposes of Item 3 of Form N-CSR.
Mr. Evans was formerly President and Chief Operating Office of SCI Financial Group, Inc., a full service registered broker-dealer and registered investment adviser (“SCI”). As part of his role as President and Chief Operating Officer, Mr. Evans actively supervised the Chief Financial Officer (the “CFO”) and actively supervised the CFO’s preparation of financial statements and other filings with various regulatory authorities. In such capacity, Mr. Evans was actively involved in the preparation of SCI’s financial statements and the resolution of issues raised in connection therewith. Mr. Evans has also served on the audit committee of various reporting companies. At such companies, Mr. Evans was involved in the oversight of audits, audit plans, and the preparation of financial statements. Mr. Evans also formerly chaired the audit committee of the Federal Reserve Bank of Chicago.
ITEM 4. PRINCIPAL ACCOUNTANT FEES AND SERVICES.
The following tables show the amount of fees that PricewaterhouseCoopers LLP, the Trust’s auditor, billed to the Trust during the Trust’s last two full fiscal years. The Audit Committee approved in advance all audit services and non-audit services that PricewaterhouseCoopers LLP provided to the Trust, except for those non-audit services that were subject to the pre-approval exception under Rule 2-01 of Regulation S-X (the “pre-approval exception”). The pre-approval exception for services provided directly to the Trust waives the pre-approval requirement for services other than audit, review or attest services if: (A) the aggregate amount of all such services provided constitutes no more than 5% of the total amount of revenues paid by the Trust during the fiscal year in which the services are provided; (B) the Trust did not recognize the services as non-audit services at the time of the engagement; and (C) the services are promptly brought to the Audit Committee’s attention, and the Committee (or its delegate) approves the services before the audit is completed.
The Audit Committee has delegated certain pre-approval responsibilities to its Chairman (or, in his absence, any other member of the Audit Committee).
SERVICES THAT THE TRUST’S AUDITOR BILLED TO THE TRUST
Fiscal Year Ended May 30, 2008 | Audit Fees Billed to Funds 1 | Audit-Related Fees Billed to Funds 2 | Tax Fees Billed to Funds 3 | All Other Fees Billed to Funds 4 | ||||||||
Name of Series | ||||||||||||
Kansas Municipal Bond Fund | 10,157 | 0 | 1,045 | 0 | ||||||||
Kentucky Municipal Bond Fund | 17,337 | 0 | 2,424 | 0 | ||||||||
Michigan Municipal Bond Fund | 12,504 | 0 | 1,487 | 0 | ||||||||
Missouri Municipal Bond Fund | 12,802 | 0 | 1,589 | 0 | ||||||||
Ohio Municipal Bond Fund | 19,587 | 0 | 2,762 | 0 | ||||||||
Wisconsin Bond Fund | 8,590 | 0 | 717 | 0 | ||||||||
Total | $ | 80,977 | $ | 0 | $ | 10,023 | $ | 0 | ||||
1 | “Audit Fees” are the aggregate fees billed for professional services for the audit of the Fund’s annual financial statements and services provided in connection with statutory and regulatory filings or engagements. |
2 | “Audit Related Fees” are the aggregate fees billed for assurance and related services reasonably related to the performance of the audit or review of financial statements and are not reported under “Audit Fees”. |
3 | “Tax Fees” are the aggregate fees billed for professional services for tax advice, tax compliance, and tax planning. |
4 | “All Other Fees” are the aggregate fees billed for products and services other than “Audit Fees”, “Audit Related Fees”, and “Tax Fees”. |
| Percentage Approved Pursuant to Pre-approval Exception | ||||||||||||
| Audit Fees Billed to Funds | Audit-Related Fees Billed to Funds | Tax Fees Billed to Funds | All Other Fees Billed to Funds | |||||||||
Name of Series | ||||||||||||
Kansas Municipal Bond Fund | 0 | 0 | 0 | 0 | ||||||||
Kentucky Municipal Bond Fund | 0 | 0 | 0 | 0 | ||||||||
Michigan Municipal Bond Fund | 0 | 0 | 0 | 0 | ||||||||
Missouri Municipal Bond Fund | 0 | 0 | 0 | 0 | ||||||||
Ohio Municipal Bond Fund | 0 | 0 | 0 | 0 | ||||||||
Wisconsin Bond Fund | 0 | 0 | 0 | 0 | ||||||||
Fiscal Year Ended May 31, 2007 | Audit Fees Billed to Funds 1 | Audit-Related Fees Billed to Funds 2 | Tax Fees Billed to Funds 3 | All Other Fees Billed to Funds 4 | ||||||||
Name of Series | ||||||||||||
Kansas Municipal Bond Fund | 9,742 | 0 | 588 | 0 | ||||||||
Kentucky Municipal Bond Fund | 16,612 | 0 | 2,094 | 0 | ||||||||
Michigan Municipal Bond Fund | 11,964 | 0 | 1,066 | 0 | ||||||||
Missouri Municipal Bond Fund | 12,452 | 0 | 1,184 | 0 | ||||||||
Ohio Municipal Bond Fund | 18,330 | 0 | 2,437 | 0 | ||||||||
Wisconsin Bond Fund | 8,073 | 0 | 212 | 0 | ||||||||
Total | $ | 77,173 | $ | 0 | $ | 7,581 | $ | 0 | ||||
1 | “Audit Fees” are the aggregate fees billed for professional services for the audit of the Fund’s annual financial statements and services provided in connection with statutory and regulatory filings or engagements. |
2 | “Audit Related Fees” are the aggregate fees billed for assurance and related services reasonably related to the performance of the audit or review of financial statements and are not reported under “Audit Fees”. |
3 | “Tax Fees” are the aggregate fees billed for professional services for tax advice, tax compliance, and tax planning. |
4 | “All Other Fees” are the aggregate fees billed for products and services other than “Audit Fees”, “Audit Related Fees”, and “Tax Fees”. |
| Percentage Approved Pursuant to Pre-approval Exception | ||||||||
| Audit Fees Billed to Funds | Audit-Related Fees Billed to Funds | Tax Fees Billed to Funds | All Other Fees Billed to Funds | |||||
Name of Series | ||||||||
Kansas Municipal Bond Fund | 0 | 0 | 0 | 0 | ||||
Kentucky Municipal Bond Fund | 0 | 0 | 0 | 0 | ||||
Michigan Municipal Bond Fund | 0 | 0 | 0 | 0 | ||||
Missouri Municipal Bond Fund | 0 | 0 | 0 | 0 | ||||
Ohio Municipal Bond Fund | 0 | 0 | 0 | 0 | ||||
Wisconsin Bond Fund | 0 | 0 | 0 | 0 | ||||
SERVICES THAT THE TRUST’S AUDITOR BILLED TO THE
ADVISER AND AFFILIATED FUND SERVICE PROVIDERS
The following tables show the amount of fees billed by PricewaterhouseCoopers LLP to Nuveen Asset Management (“NAM” or the “Adviser”), and any entity controlling, controlled by or under common control with NAM that provides ongoing services to the Trust (“Affiliated Fund Service Provider”), for engagements directly related to the Trust’s operations and financial reporting, during the Trust’s last two full fiscal years.
Fiscal Year Ended May 30, 2008 | Audit-Related Fees Billed to Adviser and Affiliated Fund Service Providers | Tax Fees Billed to Adviser and Affiliated Fund Service Providers | All Other Fees Billed to Adviser and Affiliated Fund Service Providers | |||||||||
Nuveen Multistate Trust IV | $ | 0 | $ | 0 | $ | 0 | ||||||
| Percentage Approved Pursuant to Pre-approval Exception | ||||||||||||
| Audit-Related Fees Billed to Adviser and Affiliated Fund Service Providers | Tax Fees Billed to Adviser and Affiliated Fund Service Providers | All Other Fees Billed to Adviser and Affiliated Fund Service Providers | ||||||||||
| 0 | % | 0 | % | 0 | % | |||||||
Fiscal Year Ended May 31, 2007 | Audit-Related Fees Billed to Adviser and Affiliated Fund Service Providers | Tax Fees Billed to Adviser and Affiliated Fund Service Providers | All Other Fees Billed to Adviser and Affiliated Fund Service Providers | |||||||||
Nuveen Multistate Trust IV | $ | 0 | $ | 0 | $ | 0 | ||||||
| Percentage Approved Pursuant to Pre-approval Exception | ||||||||||||
| Audit-Related Fees Billed to Adviser and Affiliated Fund Service Providers | Tax Fees Billed to Adviser and Affiliated Fund Service Providers | All Other Fees Billed to Adviser and Affiliated Fund Service Providers | ||||||||||
| 0 | % | 0 | % | 0 | % | |||||||
The tables also show the percentage of fees subject to the pre-approval exception. The pre-approval exception for services provided to the Adviser and any Affiliated Fund Service Provider (other than audit, review or attest services) waives the pre-approval requirement if: (A) the aggregate amount of all such services provided constitutes no more than 5% of the total amount of revenues paid to PricewaterhouseCoopers LLP by the Trust, the Adviser and Affiliated Fund Service Providers during the fiscal year in which the services are provided that would have to be pre-approved by the Audit Committee; (B) the Trust did not recognize the services as non-audit services at the time of the engagement; and (C) the services are promptly brought to the Audit Committee’s attention, and the Committee (or its delegate) approves the services before the Trust’s audit is completed.
NON-AUDIT SERVICES
Fiscal Year Ended May 30, 2008 | Total Non-Audit Fees Billed to Trust | Total Non-Audit Fees billed to Adviser and Affiliated Fund Service Providers (engagements related directly to the operations and financial reporting of the Trust) | Total Non-Audit Fees billed to Adviser and Affiliated Fund Service Providers (all other engagements) | Total | ||||||||
Name of Series | ||||||||||||
Kansas Municipal Bond Fund | 1,045 | 0 | 0 | 1,045 | ||||||||
Kentucky Municipal Bond Fund | 2,424 | 0 | 0 | 2,424 | ||||||||
Michigan Municipal Bond Fund | 1,487 | 0 | 0 | 1,487 | ||||||||
Missouri Municipal Bond Fund | 1,589 | 0 | 0 | 1,589 | ||||||||
Ohio Municipal Bond Fund | 2,762 | 0 | 0 | 2,762 | ||||||||
Wisconsin Bond Fund | 717 | 0 | 0 | 717 | ||||||||
Total | $ | 10,023 | $ | 0 | $ | 0 | $ | 10,023 | ||||
“Non-Audit Fees billed to Adviser” for both fiscal year ends represent “Tax Fees” billed to Adviser in their respective amounts from the previous table.
Fiscal Year Ended May 31, 2007 | Total Non-Audit Fees Billed to Trust | Total Non-Audit Fees billed to Adviser and Affiliated Fund Service Providers (engagements related directly to the operations and financial reporting of the Trust) | Total Non-Audit Fees billed to Adviser and Affiliated Fund Service Providers (all other engagements) | Total | ||||||||
Name of Series | ||||||||||||
Kansas Municipal Bond Fund | 588 | 0 | 0 | 588 | ||||||||
Kentucky Municipal Bond Fund | 2,094 | 0 | 0 | 2,094 | ||||||||
Michigan Municipal Bond Fund | 1,066 | 0 | 0 | 1,066 | ||||||||
Missouri Municipal Bond Fund | 1,184 | 0 | 0 | 1,184 | ||||||||
Ohio Municipal Bond Fund | 2,437 | 0 | 0 | 2,437 | ||||||||
Wisconsin Bond Fund | 212 | 0 | 0 | 212 | ||||||||
Total | $ | 7,581 | $ | 0 | $ | 0 | $ | 7,581 | ||||
“Non-Audit Fees billed to Adviser” for both fiscal year ends represent “Tax Fees” billed to Adviser in their respective amounts from the previous table.
Audit Committee Pre-Approval Policies and Procedures. Generally, the Audit Committee must approve (i) all non-audit services to be performed for the Trust by the Trust’s independent accountants and (ii) all audit and non-audit services to be performed by the Trust’s independent accountants for the Affiliated Fund Service Providers with respect to the operations and financial reporting of the Trust. Regarding tax and research projects conducted by the independent accountants for the Trust and Affiliated Fund Service Providers (with respect to operations and financial reports of the Trust), such engagements will be (i) pre-approved by the Audit Committee if they are expected to be for amounts greater than $10,000; (ii) reported to the Audit Committee Chairman for his verbal approval prior to engagement if they are expected to be for amounts under $10,000 but greater than $5,000; and (iii) reported to the Audit Committee at the next Audit Committee meeting if they are expected to be for an amount under $5,000.
ITEM 5. AUDIT COMMITTEE OF LISTED REGISTRANTS
Not applicable to this registrant.
ITEM 6. SCHEDULE OF INVESTMENTS
See Portfolio of Investments in Item 1
ITEM 7. DISCLOSURE OF PROXY VOTING POLICIES AND PROCEDURES FOR CLOSED-END
MANAGEMENT INVESTMENT COMPANIES
Not applicable to this registrant.
ITEM 8. PORTFOLIO MANAGERS OF CLOSED-END MANAGEMENT INVESTMENT COMPANIES
Not applicable to this registrant.
ITEM 9. PURCHASES OF EQUITY SECURITIES BY CLOSED-END MANAGEMENT INVESTMENT COMPANY AND AFFILIATED PURCHASERS
Not applicable to this registrant.
ITEM 10. SUBMISSION OF MATTERS TO A VOTE OF SECURITY HOLDERS
There have been no material changes to the procedures by which shareholders may recommend nominees to the registrant’s Board of Trustees implemented after the registrant last provided disclosure in response to this Item.
ITEM 11. CONTROLS AND PROCEDURES.
(a) | The registrant’s principal executive and principal financial officers, or persons performing similar functions, have concluded that the registrant’s disclosure controls and procedures (as defined in Rule 30a-3(c) under the Investment Company Act of 1940, as amended (the “1940 Act”) (17 CFR 270.30a-3(c))) are effective, as of a date within 90 days of the filing date of this report that includes the disclosure required by this paragraph, based on their evaluation of the controls and procedures required by Rule 30a-3(b) under the 1940 Act (17 CFR 270.30a-3(b)) and Rules 13a-15(b) or 15d-15(b) under the Securities Exchange Act of 1934, as amended (the “Exchange Act”) (17 CFR 240.13a-15(b) or 240.15d-15(b)). |
(b) | There were no changes in the registrant’s internal control over financial reporting (as defined in Rule 30a-3(d) under the 1940 Act (17 CFR 270.30a-3(d)) that occurred during the second fiscal quarter of the period covered by this report that has materially affected, or is reasonably likely to materially affect, the registrant’s internal control over financial reporting. |
ITEM 12. EXHIBITS
File the exhibits listed below as part of this Form.
| (a)(1) | Any code of ethics, or amendment thereto, that is the subject of the disclosure required by Item 2, to the extent that the registrant intends to satisfy the Item 2 requirements through filing of an exhibit: Not applicable because the code is posted on registrant’s website at www.nuveen.com/mf and there were no amendments during the period covered by this report. (To view the code, click on the Shareholder Resources drop down menu box, click on Fund Governance and then Code of Conduct.) | |
| (a)(2) | A separate certification for each principal executive officer and principal financial officer of the registrant as required by Rule 30a-2(a) under the 1940 Act (17 CFR 270.30a-2(a)) in the exact form set forth below: See EX-99.CERT attached hereto. | |
| (a)(3) | Any written solicitation to purchase securities under Rule 23c-1 under the 1940 Act (17 CFR 270.23c-1) sent or given during the period covered by the report by or on behalf of the registrant to 10 or more persons: Not applicable to this registrant. | |
| (b) | If the report is filed under Section 13(a) or 15(d) of the Exchange Act, provide the certifications required by Rule 30a-2(b) under the 1940 Act (17 CFR 270.30a-2(b)), Rule 13a-14(b) or Rule 15d-14(b) under the Exchange Act (17 CFR 240.13a-14(b) or 240.15d-14(b)), and Section 1350 of Chapter 63 of Title 18 of the United States Code (18 U.S.C. 1350) as an Exhibit. A certification furnished pursuant to this paragraph will not be deemed “filed” for purposes of Section 18 of the Exchange Act (15 U.S.C. 78r), or otherwise subject to the liability of that section. Such certification will not be deemed to be incorporated by reference into any filing under the Securities Act of 1933 or the Exchange Act, except to the extent that the registration specifically incorporates it by reference: See EX-99.906 CERT attached hereto. | |
SIGNATURES
Pursuant to the requirements of the Securities Exchange Act of 1934 and the Investment Company Act of 1940, the registrant has duly caused this report to be signed on its behalf by the undersigned, thereunto duly authorized.
(Registrant) Nuveen Multistate Trust IV
By (Signature and Title)
| /s/ Kevin J. McCarthy | |
| Kevin J. McCarthy | ||
| Vice President and Secretary | ||
Date August 7, 2008
Pursuant to the requirements of the Securities Exchange Act of 1934 and the Investment Company Act of 1940, this report has been signed below by the following persons on behalf of the registrant and in the capacities and on the dates indicated.
By (Signature and Title)
| /s/ Gifford R. Zimmerman | |
| Gifford R. Zimmerman | ||
| Chief Administrative Officer | ||
| (principal executive officer) | ||
Date August 7, 2008
| By (Signature and Title) | /s/ Stephen D. Foy | |
| Stephen D. Foy | ||
| Vice President and Controller | ||
| (principal financial officer) | ||
Date August 7, 2008