As filed with the Securities and Exchange Commission on December 9, 2011
File No. 333-
SECURITIES AND EXCHANGE COMMISSION
Washington, D.C. 20549
FORM N-14
REGISTRATION STATEMENT
UNDER
THE SECURITIES ACT OF 1933
¨ Pre-Effective Amendment No.
¨ Post-Effective Amendment No.
NUVEEN MULTISTATE TRUST IV
(Exact Name of Registrant as Specified in Charter)
333 West Wacker Drive
Chicago, Illinois 60606
(Address of Principal Executive Offices, Zip Code)
Registrant’s Telephone Number, including Area Code (312) 917-7700
Kevin J. McCarthy
Vice President and Secretary
333 West Wacker Drive
Chicago, Illinois 60606
(Name and Address of Agent for Service)
Copy to:
Deborah Bielicke Eades Vedder Price P.C. 222 North LaSalle Street Chicago, Illinois 60601 | Eric F. Fess Chapman and Cutler LLP 111 West Monroe Street Chicago, Illinois 60603 |
Approximate date of proposed public offering: As soon as practicable after the effective date of this Registration Statement.
TITLE OF SECURITIES BEING REGISTERED: Shares of Beneficial Interest (par value $0.01 per share) of the Registrant.
No filing fee is required because of reliance on Section 24(f) and an indefinite number of shares have previously been registered pursuant to Rule 24f-2 under the Investment Company Act of 1940.
It is proposed that this filing will become effective on January 8, 2012 pursuant to Rule 488 under the Securities Act of 1933.

Important Information for
Nuveen Missouri Tax Free Fund Shareholders
At a special meeting of shareholders of Nuveen Missouri Tax Free Fund (the “Acquired Fund”), a series of Nuveen Investment Funds, Inc. (the “Corporation”), you will be asked to vote upon an important change affecting your fund. The purpose of the special meeting is to allow you to vote on a reorganization of your fund into Nuveen Missouri Municipal Bond Fund (the “Acquiring Fund”). If the reorganization is approved and completed, you will become a shareholder of the Acquiring Fund. The Acquired Fund and the Acquiring Fund are collectively referred to herein as the “Funds.”
Although we recommend that you read the complete Proxy Statement/Prospectus, for your convenience, we have provided the following brief overview of the issue to be voted on.
| Q. | Why am I receiving this Proxy Statement/Prospectus? |
| A. | In December of 2010, Nuveen Investments, Inc. and certain of its affiliates (“Nuveen”) completed a strategic combination with U.S. Bank National Association and its wholly-owned subsidiary, FAF Advisors, Inc., the investment adviser to the First American Funds. Pursuant to this transaction, Nuveen acquired a portion of the investment advisory business of FAF Advisors, Inc., including assets related to the non-money market open-end funds in the First American family of funds. Effective January 1, 2011, these former First American Funds became part of the Nuveen family of funds and were re-branded as Nuveen Funds. As part of its efforts to integrate the portfolio management teams and investment products it offers following the closing of the transaction, Nuveen has recommended a number of reorganizations between funds with similar investment objectives and policies. The reorganization of the Acquired Fund into the Acquiring Fund has been proposed as part of this initiative. |
| Q. | What advantages will the reorganization produce for Acquired Fund shareholders? |
| A. | Nuveen Fund Advisors, Inc. (“Nuveen Fund Advisors”), the Funds’ investment adviser, and the Board of Directors of the Corporation (the “Board”) believe that shareholders of the Acquired Fund will benefit from operational efficiencies and economies of scale that are expected to arise as a result of the larger net asset size of the Acquiring Fund following the reorganization. These operational efficiencies and economies of scale, together with the Acquiring Fund’s lower management fee (described in further detail below), are expected to result in lower gross and net expenses for all shareholders. |
| Q. | What are the similarities between the investment policies of the Funds? |
| A. | The investment objective of the Acquired Fund is to provide maximum current income that is exempt from both federal income tax and Missouri state income tax to the extent consistent with prudent investment risk. The investment objective of the Acquiring Fund is to provide investors with as high a level of current interest income exempt from regular federal, Missouri state and, in some cases, Missouri local income taxes as is consistent with preservation of capital. Each Fund has similar principal investment strategies and risks. While there are differences in the current portfolio compositions of the Funds because they were formerly managed by different investment advisers, the Funds currently have the same portfolio manager and are expected to be managed in |
| a similar manner going forward. A more detailed comparison of the investment objectives, policies and risks of the Funds is contained in the Proxy Statement/Prospectus. |
| Q. | What will happen if shareholders do not approve the reorganization? |
| A. | If the reorganization is not approved by shareholders, the Board will take such actions as it deems to be in the best interests of the Acquired Fund, which may include additional solicitation or continuing to operate the Fund as a stand-alone fund. |
| Q. | Will Acquired Fund shareholders receive new shares in exchange for their current shares? |
| A. | Yes. If shareholders approve the reorganization and it is completed, each Acquired Fund shareholder will receive shares of the Acquiring Fund in an amount equal in total value to the total value of the Acquired Fund shares surrendered by such shareholder. |
| Q. | Will this reorganization create a taxable event for me? |
| A. | No. The reorganization is intended to qualify as a tax-free reorganization for federal income tax purposes. It is expected that you will recognize no gain or loss for federal income tax purposes as a direct result of the reorganization. Prior to the closing of the reorganization, the Acquired Fund expects to distribute all of its net investment income and net capital gains, if any. Except to the extent that this distribution is designated as an exempt-interest dividend, it will be taxable to the Acquired Fund’s shareholders for federal income tax purposes. All or a portion of this distribution may be subject to the federal alternative minimum tax. |
| Q. | How do total operating expenses compare between the two Funds? |
| A. | In light of the Acquiring Fund’s lower management fee, the gross and net expenses of the Acquiring Fund immediately following the reorganization are expected to be lower than the gross and net expenses of the Acquired Fund for all share classes. |
| Q. | Who will bear the costs of the reorganization? |
| A. | The reorganization is expected to result in cost savings for each Fund. In light of these anticipated cost savings, the costs of the reorganization will be allocated between the Funds ratably up to each Fund’s projected cost savings during the first year following the reorganization. Nuveen Fund Advisors estimates that reorganization costs will be approximately $126,000 and that the cost savings during the first year following the reorganization will be approximately $150,000 for the Acquired Fund and approximately $36,000 for the Acquiring Fund. As a result, the Acquired Fund is expected to be charged approximately $102,000, and the Acquiring Fund is expected to be charged approximately $24,000. Because the payment by the Acquired Fund of any portion of these costs would cause the Acquired Fund to exceed its expense cap currently in effect, Nuveen will reimburse all expenses charged to the Acquired Fund and none of the expenses charged to the Acquiring Fund. The Acquiring Fund is expected to recover its costs of the reorganization within the first year following the reorganization assuming that annual cost savings occur at the level shown above. If the reorganization is not approved or completed, Nuveen will pay all such reorganization expenses. |
| Q. | What is the timetable for the reorganization? |
| A. | If approved by shareholders on February 16, 2012, the reorganization is expected to occur at the close of business on February 24, 2012. |
| Q. | Whom do I call if I have questions? |
| A. | If you need any assistance, or have any questions regarding the proposal or how to vote your shares, please call Computershare Fund Services, your proxy solicitor, at (866) 612-5814 from 8 a.m. to 10 p.m. Central time on Monday through Friday or 11 a.m. to 5 p.m. Central time on Saturday. Please have your proxy material available when you call. |
| Q. | How do I vote my shares? |
| A. | You may vote by mail, telephone or over the Internet: |
| • | To vote by mail, please mark, sign, date and mail the enclosed proxy card. No postage is required if mailed in the United States. |
| • | To vote by telephone, please call the toll-free number located on your proxy card and follow the recorded instructions, using your proxy card as a guide. |
| • | To vote over the Internet, go to the Internet address provided on your proxy card and follow the instructions, using your proxy card as a guide. |
| Q. | Will Nuveen contact me? |
| A. | You may receive a call from representatives of Computershare Fund Services, the proxy solicitation firm retained by Nuveen, to verify that you received your proxy materials and to answer any questions you may have about the reorganization. |
| Q. | How does the Board suggest that I vote? |
| A. | After careful consideration, the Board has agreed unanimously that the reorganization is in the best interests of your Fund and recommends that you vote “FOR” the reorganization. |
, 2012
Dear Shareholders:
We are pleased to invite you to the special meeting of shareholders of Nuveen Missouri Tax Free Fund (the “Special Meeting”). The Special Meeting is scheduled for February 16, 2012, at [2:00] p.m., Central time, at the offices of Nuveen Investments, Inc., 333 West Wacker Drive, Chicago, Illinois 60606.
At the Special Meeting, you will be asked to consider and approve a very important proposal. Subject to shareholder approval, Nuveen Missouri Municipal Bond Fund (the “Acquiring Fund”) will acquire all the assets and liabilities of Nuveen Missouri Tax Free Fund (the “Acquired Fund”) in exchange solely for shares of the Acquiring Fund, which will be distributed in complete liquidation of the Acquired Fund to the shareholders of the Acquired Fund (the “Reorganization”).
Nuveen Fund Advisors, Inc. (“Nuveen Fund Advisors”), each Fund’s investment adviser, has proposed the Reorganization involving the Acquired Fund, as well as a number of other reorganizations involving other funds advised by Nuveen Fund Advisors, to eliminate certain redundancies among the products it offers and in an effort to achieve certain operating efficiencies.
The Reorganization is being proposed because Nuveen Fund Advisors and the Board of Directors of Nuveen Investment Funds, Inc. (the “Board”) believe that the shareholders of the Acquired Fund will benefit from potential operating efficiencies and economies of scale that may be achieved by combining the Funds pursuant to the Reorganization. Following the Reorganization, the Acquiring Fund is expected to have lower gross and net expenses than the Acquired Fund had prior to the Reorganization. The Board believes the Reorganization is in the best interests of the Acquired Fund, and recommends that you vote “For” the proposed Reorganization.
The attached Proxy Statement/Prospectus has been prepared to give you information about this proposal.
All shareholders are cordially invited to attend the Special Meeting. In order to avoid delay and additional expense, and to assure that your shares are represented, please vote as promptly as possible, whether or not you plan to attend the Special Meeting. You may vote by mail, telephone or over the Internet.
| • | To vote by mail, please mark, sign, date and mail the enclosed proxy card. No postage is required if mailed in the United States. |
| • | To vote by telephone, please call the toll-free number located on your proxy card and follow the recorded instructions, using your proxy card as a guide. |
| • | To vote over the Internet, go to the Internet address provided on your proxy card and follow the instructions, using your proxy card as a guide. |
We appreciate your continued support and confidence in Nuveen and our family of funds.
Very truly yours,
Kevin J. McCarthy
Vice President and Secretary
, 2012
NUVEEN MISSOURI TAX FREE FUND
NOTICE OF SPECIAL MEETING OF SHAREHOLDERS
TO BE HELD ON FEBRUARY 16, 2012
To the Shareholders:
Notice is hereby given that a special meeting of shareholders of Nuveen Missouri Tax Free Fund (the “Acquired Fund”), a series of Nuveen Investment Funds, Inc. (the “Corporation”), a Maryland corporation, will be held at the offices of Nuveen Investments, Inc., 333 West Wacker Drive, Chicago, Illinois 60606, on February 16, 2012 at [2:00] p.m., Central time (the “Special Meeting”), for the following purposes:
1. To approve an Agreement and Plan of Reorganization (and the related transactions) which provides for (i) the transfer of all the assets of the Acquired Fund to Nuveen Missouri Municipal Bond Fund (the “Acquiring Fund”) in exchange solely for voting shares of beneficial interest of the Acquiring Fund and the assumption by the Acquiring Fund of all the liabilities of the Acquired Fund; and (ii) the distribution by the Acquired Fund of Class A, Class A and Class I shares of the Acquiring Fund to the holders of Class A, Class C1 and Class I shares, respectively, of the Acquired Fund in complete liquidation and termination of the Acquired Fund (the “Reorganization”). A vote in favor of the Reorganization will be considered a vote in favor of an amendment to the Corporation’s Articles of Incorporation effecting the Reorganization.
2. To transact such other business as may properly come before the Special Meeting.
Only shareholders of record as of the close of business on December 20, 2011 are entitled to vote at the Special Meeting or any adjournments or postponements thereof.
All shareholders are cordially invited to attend the Special Meeting. In order to avoid delay and additional expense, and to assure that your shares are represented, please vote as promptly as possible, whether or not you plan to attend the Special Meeting. You may vote by mail, telephone or over the Internet.
| • | To vote by mail, please mark, sign, date and mail the enclosed proxy card. No postage is required if mailed in the United States. |
| • | To vote by telephone, please call the toll-free number located on your proxy card and follow the recorded instructions, using your proxy card as a guide. |
| • | To vote over the Internet, go to the Internet address provided on your proxy card and follow the instructions, using your proxy card as a guide. |
Kevin J. McCarthy
Vice President and Secretary
Proxy Statement/Prospectus
Dated , 2012
Relating to the Acquisition of the Assets and Liabilities of NUVEEN MISSOURI TAX FREE FUND by NUVEEN MISSOURI MUNICIPAL BOND FUND
This Proxy Statement/Prospectus is being furnished to shareholders of Nuveen Missouri Tax Free Fund (the “Acquired Fund”), a series of Nuveen Investment Funds, Inc. (the “Corporation”), a Maryland corporation and an open-end investment company registered under the Investment Company Act of 1940, as amended (the “1940 Act”), and relates to the special meeting of shareholders of the Acquired Fund to be held at the offices of Nuveen Investments, Inc., 333 West Wacker Drive, Chicago, Illinois 60606, on February 16, 2012 at [2:00] p.m., Central time and at any and all adjournments and postponements thereof (the “Special Meeting”). This Proxy Statement/Prospectus is provided in connection with the solicitation by the Board of Directors of the Corporation of proxies to be voted at the Special Meeting, and any and all adjournments or postponements thereof. The purpose of the Special Meeting is to consider the proposed reorganization (the “Reorganization”) of the Acquired Fund into Nuveen Missouri Municipal Bond Fund (the “Acquiring Fund”), a series of Nuveen Multistate Trust IV (the “Trust”), a Massachusetts business trust and an open-end investment company registered under the 1940 Act. The Acquired Fund and the Acquiring Fund are referred to herein collectively as the “Funds” and individually as a “Fund.” The Board of Directors of the Corporation and the Board of Trustees of the Trust, which are made up of the same individuals, are referred to herein as the “Board.” If shareholders approve the Reorganization and it is completed, shareholders of Class A, Class C1 and Class I shares of the Acquired Fund will receive Class A, Class A and Class I shares, respectively, of the Acquiring Fund with the same total value as the total value of the Acquired Fund shares surrendered by such shareholders. The Board has determined that the Reorganization is in the best interests of the Acquired Fund. The address, principal executive office and telephone number of the Funds, the Trust and the Corporation is 333 West Wacker Drive, Chicago, Illinois 60606, (800) 257-8787.
A vote in favor of the Reorganization will be considered a vote in favor of an amendment to the Corporation’s Articles of Incorporation effecting the Reorganization.
The enclosed proxy and this Proxy Statement/Prospectus are first being sent to shareholders of the Acquired Fund on or about , 2012. Shareholders of record as of the close of business on December 20, 2011 are entitled to vote at the Special Meeting and any adjournments or postponements thereof.
The Securities and Exchange Commission has not approved or disapproved these securities or determined whether the information in this Proxy Statement/Prospectus is truthful or complete. Any representation to the contrary is a criminal offense.
This Proxy Statement/Prospectus concisely sets forth the information shareholders of the Acquired Fund should know before voting on the Reorganization (in effect, investing in Class A and Class I shares of the Acquiring Fund) and constitutes an offering of Class A and Class I shares of beneficial interest, par value $0.01 per share, of the Acquiring Fund. Please read it carefully and retain it for future reference.
The following documents have been filed with the Securities and Exchange Commission (“SEC”) and are incorporated into this Proxy Statement/Prospectus by reference and also accompany this Proxy Statement/Prospectus:
| (i) | the Trust’s prospectus dated September 30, 2011, as supplemented through the date of this Proxy Statement/Prospectus, relating to the Acquiring Fund; and |
| (ii) | the audited financial statements contained in the Trust’s Annual Report relating to the Acquiring Fund for the fiscal year ended May 31, 2011. |
The following documents contain additional information about the Acquired Fund and Acquiring Fund, have been filed with the SEC and are incorporated into this Proxy Statement/Prospectus by reference:
| (i) | the Statement of Additional Information relating to the proposed Reorganization, dated , 2012 (the “Reorganization SAI”); |
| (ii) | the Corporation’s prospectus dated September 30, 2011, as supplemented through the date of this Proxy Statement/Prospectus, relating to the Acquired Fund; |
| (iii) | the Corporation’s statement of additional information dated September 30, 2011, as supplemented through the date of this Proxy Statement/Prospectus, relating to the Acquired Fund; |
| (iv) | the audited financial statements contained in the Corporation’s Annual Report relating to the Acquired Fund for the fiscal year ended May 31, 2011; and |
| (v) | the Trust’s statement of additional information dated September 30, 2011, as supplemented through the date of this Proxy Statement/Prospectus, relating to the Acquiring Fund. |
No other parts of the documents referenced above are incorporated by reference herein.
Copies of the foregoing may be obtained without charge by calling or writing the Funds at the telephone number or address shown above. If you wish to request the Reorganization SAI, please ask for the “Reorganization SAI.” In addition, the Acquiring Fund will furnish, without charge, a copy of its most recent annual report and subsequent semi-annual report to a shareholder upon request. Any such request should be directed to the Acquiring Fund by calling (800) 257-8787 or by writing the Acquiring Fund at 333 West Wacker Drive, Chicago, Illinois 60606.
The Corporation and the Trust are subject to the informational requirements of the Securities Exchange Act of 1934, as amended, and the 1940 Act, and in accordance therewith file reports and other information with the SEC. Reports, proxy statements, registration statements and other information filed by the Corporation or the Trust (including the Registration Statement relating to the Acquiring Fund on Form N-14 of which this Proxy Statement/Prospectus is a part) may be inspected without charge and copied (for a duplication fee at prescribed rates) at the SEC’s Public Reference Room at 100 F Street, N.E., Washington, D.C. 20549 or at the SEC’s Northeast Regional Office (3 World Financial Center, New York, New York 10281) or Midwest Regional Office (175 W. Jackson Boulevard, Suite 900, Chicago, Illinois 60604). You may call the SEC at (202) 551-8090 for information about the operation of the Public Reference Room. You may obtain copies of this
information, with payment of a duplication fee, by electronic request at the following e-mail address: publicinfo@sec.gov, or by writing the SEC’s Public Reference Branch, Office of Consumer Affairs and Information Services, Securities and Exchange Commission, Washington, D.C. 20549. You may also access reports and other information about the Funds on the EDGAR database on the SEC’s Internet site at http://www.sec.gov.
i
(continued)
| Page | ||||
| 30 | ||||
| 30 | ||||
| 31 | ||||
| 31 | ||||
| 31 | ||||
| 31 | ||||
| 32 | ||||
| 32 | ||||
| 32 | ||||
| 33 | ||||
| I-1 | ||||
ii
The following is a summary of, and is qualified by reference to, the more complete information contained in this Proxy Statement/Prospectus and the information attached hereto or incorporated herein by reference, including the Agreement and Plan of Reorganization. As discussed more fully below and elsewhere in this Proxy Statement/Prospectus, the Board believes the proposed Reorganization is in the best interests of each Fund and that the interests of each Fund’s existing shareholders would not be diluted as a result of the Reorganization. If the Reorganization is approved and completed, shareholders of the Acquired Fund will become shareholders of the Acquiring Fund and will cease to be shareholders of the Acquired Fund.
Shareholders should read the entire Proxy Statement/Prospectus carefully together with the Acquiring Fund’s Prospectus that accompanies this Proxy Statement/Prospectus, which is incorporated herein by reference. This Proxy Statement/Prospectus constitutes an offering of Class A and Class I shares of the Acquiring Fund only.
On December 31, 2010, Nuveen Investments, Inc. and certain of its affiliates (“Nuveen”) completed a strategic combination with U.S. Bank National Association (“U.S. Bank”) and its wholly owned subsidiary, FAF Advisors, Inc. (“FAF Advisors”), the investment adviser to the First American Funds. As part of that transaction, U.S. Bank received a 9.5% ownership interest in Nuveen and cash consideration in exchange for Nuveen’s acquisition of a portion of FAF Advisors’ investment advisory business, including assets relating to the non-money market open-end funds in the First American family of funds (the “FAF Transaction”). Shareholders of these funds received a proxy statement in connection with the FAF Transaction pursuant to which Nuveen Fund Advisors, Inc. (“Nuveen Fund Advisors” or the “Adviser”) was appointed as the investment adviser to the funds and Nuveen Asset Management, LLC (“Nuveen Asset Management”) was appointed as the subadviser to the funds. Effective January 1, 2011, these former First American Funds became part of the Nuveen family of funds, and were re-branded as Nuveen Funds. Key investment and other personnel of FAF Advisors have become employees of Nuveen Fund Advisors and Nuveen Asset Management. The Reorganization is one of several reorganizations being proposed as part of Nuveen’s ongoing efforts to integrate the portfolio management teams and investment products it offers following the FAF Transaction. The proposed reorganizations seek to combine portfolios with similar objectives and investment strategies within the combined organization.
This Proxy Statement/Prospectus is being furnished to shareholders of the Acquired Fund in connection with the proposed combination of the Acquired Fund with and into the Acquiring Fund pursuant to the terms and conditions of the Agreement and Plan of Reorganization dated [ ] by the Corporation, on behalf of the Acquired Fund, the Trust, on behalf of the Acquiring Fund, and Nuveen Fund Advisors (the “Agreement”). The Agreement provides for (i) the transfer of all the assets of the Acquired Fund to the Acquiring Fund in exchange solely for Class A and Class I voting shares of beneficial interest, par value $0.01 per share, of the Acquiring Fund and the assumption by the Acquiring Fund of all the liabilities of the Acquired Fund; and (ii) the distribution by the Acquired Fund of Class A, Class A and Class I shares of the Acquiring Fund to the shareholders of Class A, Class C1 and Class I shares, respectively, of the Acquired Fund in complete liquidation and termination of the Acquired Fund as soon as practicable following the Closing Date (as defined herein).
1
If shareholders approve the Reorganization and it is completed, Acquired Fund shareholders will become shareholders of the Acquiring Fund. The Board has determined that the Reorganization is in the best interests of the Acquired Fund and that the interests of existing shareholders will not be diluted as a result of the Reorganization. The Board unanimously approved the Reorganization and the Agreement at a meeting held on September 20, 2011. The Board recommends a vote “FOR” the Reorganization.
If shareholders approve the Reorganization, each of the Acquired Fund and Acquiring Fund will be charged for expenses incurred in connection with the Reorganization based on its portion of the projected cost savings to the Funds during the first year following the Reorganization. Nuveen Fund Advisors estimates that Reorganization costs will be approximately $126,000 and that the cost savings during the first year following the Reorganization will be approximately $150,000 for the Acquired Fund and approximately $36,000 for the Acquiring Fund. As a result, the Acquired Fund is expected to be charged approximately $102,000, and the Acquiring Fund is expected to be charged approximately $24,000. To the extent that the payment of these expenses would cause the Acquired Fund’s expenses to exceed the expense cap then in effect, Nuveen would reimburse such expenses to the extent necessary to operate within the cap. Based on current expense levels, it is anticipated that Nuveen will reimburse all expenses charged to the Acquired Fund and none of the expenses charged to the Acquiring Fund. Nuveen will absorb any costs in excess of the estimated Reorganization costs. If the Reorganization is not approved or completed, Nuveen will pay all such Reorganization expenses.
The Board is asking shareholders of the Acquired Fund to approve the Reorganization at the Special Meeting to be held on February 16, 2012. Approval of the Reorganization requires the affirmative vote of the holders of a majority of the total number of shares outstanding and entitled to vote. See “Voting Information and Requirements” below.
If shareholders of the Acquired Fund approve the Reorganization, it is expected that the Reorganization will occur at the close of business on February 24, 2012 (the “Closing Date”), but it may be at a different time as described herein. If the Reorganization is not approved, the Board will take such action as it deems to be in the best interests of the Acquired Fund. The Closing Date may be delayed and the Reorganization may be abandoned at any time by the mutual agreement of the parties. In addition, either Fund may at its option terminate the Agreement at or before the Closing Date due to (i) a breach by any other party of any representation, warranty, or agreement contained in the Agreement to be performed at or before the Closing Date, if not cured within 30 days, (ii) a condition precedent to the obligations of the terminating party that has not been met and it reasonably appears that it will not or cannot be met, or (iii) a determination by the Board that the consummation of the transactions contemplated by the Agreement is not in the best interests of a Fund.
Reasons for the Proposed Reorganization
The Board believes that the proposed Reorganization would be in the best interests of each Fund. In approving the Reorganization, the Board considered a number of principal factors in reaching its determination, including the following:
| • | the similarities and differences in the Funds’ investment objectives and principal investment strategies; |
| • | the Funds’ relative risks; |
2
| • | the Funds’ relative sizes; |
| • | the relative investment performance of the Funds and portfolio managers; |
| • | the relative fees and expense ratios of the Funds, including caps on the Funds’ expenses agreed to by the Adviser; |
| • | the anticipated tax-free nature of the Reorganization; |
| • | the expected costs of the Reorganization and the extent to which the Funds would bear any such costs; |
| • | the terms of the Reorganization and whether the Reorganization would dilute the interests of shareholders of the Funds; |
| • | the effect of the Reorganization on shareholder services and shareholder rights; |
| • | alternatives to the Reorganization; and |
| • | any potential benefits of the Reorganization to the Adviser and its affiliates as a result of the Reorganization. |
For a more detailed discussion of the Board’s considerations regarding the approval of the Reorganization, see “The Board’s Approval of the Reorganization.”
Distribution, Purchase, Redemption, Exchange of Shares and Dividends
The Funds have substantially similar procedures for purchasing, exchanging and redeeming shares and for making distributions. The Funds’ procedures were harmonized in connection with the FAF Transaction. The Acquired Fund offers three classes of shares: Class A, Class C1 and Class I Shares. The Acquiring Fund offers four classes of shares: Class A, Class B, Class C and Class I Shares. Class A and Class I shares of the Acquired Fund have the same investment eligibility criteria as Class A and Class I shares, respectively, of the Acquiring Fund. Class C1 shareholders of the Acquired Fund will receive Class A shares of the Acquiring Fund in the Reorganization. Class C1 shares of the Acquired Fund are not available for new accounts or additional investment into existing accounts, but Class C1 shares may be issued for purposes of dividend reinvestment. See “Comparison of the Funds—Distribution, Purchase, Redemption, Exchange of Shares and Dividends” below for a more detailed discussion.
Material Federal Income Tax Consequences of the Reorganization
As a condition to closing, the Funds will receive an opinion from Vedder Price P.C. (which will be based on certain factual representations and certain customary assumptions and exclusions) substantially to the effect that the Reorganization will qualify as a tax-free reorganization under Section 368(a)(1) of the Internal Revenue Code of 1986, as amended (the “Code”). Accordingly, it is expected that no Fund will recognize gain or loss for federal income tax purposes as a direct result of the Reorganization. In connection with the Reorganization, a portion of the Acquired Fund’s portfolio assets may be sold prior to the Reorganization, which could result in the Acquired Fund declaring taxable distributions to its shareholders on or prior to the Closing Date. However, it is not expected that any material portfolio sales (i.e., more than 5% of the Acquired Fund assets) will occur in connection with the Reorganization. For a more detailed discussion of the federal income tax consequences of the Reorganization, please see “The Proposed Reorganization—Material Federal Income Tax Consequences” below.
3
The Funds have similar investment objectives. The investment objective of the Acquired Fund is to provide maximum current income that is exempt from both federal income tax and Missouri state income tax to the extent consistent with prudent investment risk. The investment objective of the Acquiring Fund is to provide investors with as high a level of current interest income exempt from regular federal, Missouri state and, in some cases, Missouri local income taxes as is consistent with preservation of capital. The investment objective of the Acquired Fund may be changed without shareholder approval upon providing notice at least 60 days in advance. The Acquiring Fund’s investment objective may not be changed without shareholder approval.
The Acquired Fund and the Acquiring Fund also have similar principal investment strategies and risks. The similarities and differences of the principal investment strategies of the Funds are:
Acquired Fund | Acquiring Fund | |
• Under normal market conditions, the Fund invests at least 80% of its net assets (plus the amount of any borrowings for investment purposes) in municipal securities that pay interest that is exempt from federal and Missouri income tax, including the federal alternative minimum tax (“AMT”). | • Under normal market conditions, the Fund invests at least 80% of its net assets in municipal bonds that pay interest that is exempt from regular federal and Missouri personal income tax. | |
• The Fund invests mainly in securities that, at the time of purchase, are either rated investment grade or are unrated and determined to be of comparable quality by the Fund’s sub-adviser.
• The Fund normally may invest up to 20% of its net assets in taxable obligations, including obligations the interest on which is subject to the federal AMT. | • The Fund invests at least 80% of its net assets in investment grade municipal bonds, which are those rated BBB/Baa or higher at the time of purchase by at least one independent rating agency, or, if unrated, judged by the Fund’s sub-adviser to be of comparable quality. | |
• The Fund may invest up to 20% of its total assets in securities that, at the time of purchase, are rated lower than investment grade or are unrated and of comparable quality (securities commonly referred to as “high-yield” securities or “junk bonds”). | • The Fund may invest up to 20% of its net assets in below investment grade municipal bonds, commonly referred to as “high yield” or “junk” bonds. | |
• The Fund may utilize futures contracts and options on futures contracts in an attempt to manage market risk, credit risk and yield curve risk, and to manage the effective maturity or duration of securities in the Fund’s portfolio. | • The Fund may invest up to 15% of its net assets in municipal securities whose interest payments vary inversely with changes in short-term tax-exempt interest rates (“inverse floaters”). | |
• The Fund will attempt to maintain the weighted average maturity of its portfolio securities at ten to twenty-five years under normal market conditions. | ||
4
Comparison of Principal Investment Strategies
The Acquired Fund and the Acquiring Fund have similar principal investment strategies and risks. However, there are some differences. The Acquired Fund has a limit of investing 20% of its net assets in taxable obligations, including those subject to the federal AMT, while the Acquiring Fund does not have a limitation on investing in obligations subject to the federal AMT. Also, the Acquiring Fund may invest up to 15% of its net assets in inverse floaters as a principal investment strategy; whereas, the Acquired Fund may invest in inverse floaters, but it is not a principal investment strategy of the Fund. In addition, the Acquired Fund may utilize futures contracts and options on futures contracts as a principal investment strategy and has a principal investment strategy of maintaining a weighted average maturity of its portfolio securities of ten to twenty-five years, while the Acquiring Fund does not have similar principal investment strategies. The Acquiring Fund, however, may utilize futures contracts, swap contracts, options on futures and swaps and other derivatives as a non-principal strategy. In addition, the Acquiring Fund generally maintains, under normal market conditions, a weighted average maturity of its portfolio securities of 15 to 30 years as a non-principal strategy. Also, the Acquiring Fund is a diversified fund, while the Acquired Fund is non-diversified, which means that the Acquiring Fund may not invest more than 5% of its net assets in securities of any one issuer (except U.S. government securities or with respect to 25% of its assets).
In evaluating the Reorganization, each Acquired Fund shareholder should consider the risks of investing in the Acquiring Fund. The principal risks of investing in the Acquiring Fund are described in the section below entitled “Risk Factors.”
The Reorganization may result in one-time brokerage costs for the Acquired Fund to the extent it is necessary for the Acquired Fund to sell holdings prior to the Reorganization so that the Acquiring Fund’s portfolio immediately following the Reorganization remains in compliance with its investment policies and restrictions. If the Reorganization had occurred as of November 30, 2011, the Acquiring Fund would not have been required to dispose of securities of the Acquired Fund in order to comply with its investment policies and restrictions, and would not have sold any material portion (i.e., more than 5% of its assets) of the securities in the Acquired Fund’s portfolio solely as a result of the Reorganization.
The tables below provide information about the fees and expenses attributable to each class of shares of the Funds, and the pro forma fees and expenses of the combined fund. You may qualify for sales charge discounts on purchases of Class A shares if you and your family invest, or agree to invest in the future, at least $50,000 in a Fund or other Nuveen mutual funds. Shareholder fees reflect the fees currently in effect for each Fund. Annual Fund Operating Expenses for the Acquired Fund have been restated to take into account the new fee and expense structure adopted by the Fund as of January 1, 2011 following the closing of the FAF Transaction. The fees and expenses for the Acquired Fund are estimated based on the actual fees and expenses incurred by the Fund from January 1, 2011 through May 31, 2011, which have been annualized. Annual Fund Operating Expenses for the Acquiring Fund reflect the Fund’s fees and expenses as of its fiscal year ended May 31, 2011. The pro forma fees and expenses are based on the amounts shown in the table for each Fund, assuming the Reorganization occurred as of May 31, 2011. Note that Class C1 shareholders of the Acquired Fund will receive Class A shares of the Acquiring Fund in the Reorganization.
5
Shareholder Fees
(paid directly from your investment)
| Acquired Fund | Acquiring Fund | Combined Fund Pro Forma | ||||||||||
Maximum Sales Charge (Load) Imposed on Purchases (as a percentage of offering price) | ||||||||||||
Class A | 4.20% | 4.20% | 4.20% | |||||||||
Class C1 | None | N/A | N/A | |||||||||
Class I | None | None | None | |||||||||
Maximum Deferred Sales Charge (Load) (as a percentage of the lesser of purchase price or redemption proceeds) | ||||||||||||
Class A | None | None | None | |||||||||
Class C11 | 1.00% | N/A | N/A | |||||||||
Class I | None | None | None | |||||||||
Maximum Sales Charge (Load) Imposed on Reinvested Dividends | ||||||||||||
Class A | None | None | None | |||||||||
Class C1 | None | N/A | N/A | |||||||||
Class I | None | None | None | |||||||||
Exchange Fees | ||||||||||||
Class A | None | None | None | |||||||||
Class C1 | None | N/A | N/A | |||||||||
Class I | None | None | None | |||||||||
Annual Low Balance Account fee (for accounts under $1,000)2 | ||||||||||||
Class A | $15 | $15 | $15 | |||||||||
Class C1 | $15 | N/A | N/A | |||||||||
Class I | $15 | $15 | $15 | |||||||||
| 1 | The CDSC on Class C1 shares applies only to redemptions within 12 months of purchase. |
| 2 | Fee applies to the following types of accounts held directly with the Fund: accounts established pursuant to the Uniform Transfers to Minors Act (UTMA) or Uniform Gifts to Minors Act (UGMA). |
Annual Fund Operating Expenses
(expenses that you pay each year as a percentage of the value of your investment)
| Acquired Fund | Acquiring Fund | Combined Fund Pro Forma1 | ||||||||||
Management Fees | ||||||||||||
Class A | 0.65 | % | 0.53% | 0.53% | ||||||||
Class C1 | 0.65 | % | N/A | N/A | ||||||||
Class I | 0.65 | % | 0.53% | 0.53% | ||||||||
Distribution and Service (12b-1) Fees | ||||||||||||
Class A | 0.20 | % | 0.20% | 0.20% | ||||||||
Class C1 | 0.65 | % | N/A | N/A | ||||||||
Class I | 0.00 | % | 0.00% | 0.00% | ||||||||
Other Expenses | ||||||||||||
Class A | 0.09 | % | 0.09% | 0.08% | ||||||||
Class C1 | 0.09 | % | N/A | N/A | ||||||||
Class I | 0.09 | % | 0.09% | 0.08% | ||||||||
6
| Acquired Fund | Acquiring Fund | Combined Fund Pro Forma1 | ||||||||||
Total Annual Fund Operating Expenses | ||||||||||||
Class A | 0.94% | 0.82% | 0.81% | |||||||||
Class C1 | 1.39% | N/A | N/A | |||||||||
Class I | 0.74% | 0.62% | 0.61% | |||||||||
Fee Waivers and/or Expense Reimbursements | ||||||||||||
Class A | (0.04% | )2 | (0.00)% | (0.00)% | ||||||||
Class C1 | (0.04% | )2 | N/A | N/A | ||||||||
Class I | (0.04% | )2 | (0.00)% | (0.00)% | ||||||||
Total Annual Fund Operating Expenses–After Fee Waivers and/or Expense Reimbursements | ||||||||||||
Class A | 0.90% | 0.82% | 0.81% | |||||||||
Class C1 | 1.35% | N/A | N/A | |||||||||
Class I | 0.70% | 0.62% | 0.61% | |||||||||
| 1 | Pro forma expenses do not include the expenses to be charged to the Funds in connection with the Reorganization. See “The Proposed Reorganization—Reorganization Expenses” for additional information about these expenses. |
| 2 | Nuveen Fund Advisors has agreed to waive fees and reimburse expenses for the Acquired Fund through March 31, 2013 so that Total Annual Fund Operating Expenses, after fee waivers and/or expense reimbursements and excluding Acquired Fund Fees and Expenses, do not exceed 0.90%, 1.35% and 0.70% for Class A, Class C1 and Class I, respectively. Fee waivers and expense reimbursements will not be terminated prior to that time without approval of the Board. |
Example
The example below is intended to help you compare the cost of investing in each Fund and the pro forma cost of investing in the combined fund. The example assumes you invest $10,000 in a Fund for the time periods indicated (based on information in the tables above) and then either redeem or do not redeem your shares at the end of a period. The example assumes that your investment has a 5% return each year and that a Fund’s expenses remain at the level shown in the table above. Expense caps are taken into account for the periods stated in the table above. Although your actual costs may be higher or lower, based on these assumptions your costs would be:
| Acquired Fund | Acquiring Fund | Combined Fund Pro Forma | ||||||||||
1 Year | ||||||||||||
Assuming you sold your shares at the end of each period | ||||||||||||
Class A | $ | 508 | $ | 500 | $ | 499 | ||||||
Class C1 | $ | 137 | N/A | N/A | ||||||||
Class I | $ | 72 | $ | 63 | $ | 62 | ||||||
Assuming you kept your shares | ||||||||||||
Class A | $ | 508 | $ | 500 | $ | 499 | ||||||
Class C1 | $ | 137 | N/A | N/A | ||||||||
Class I | $ | 72 | $ | 63 | $ | 62 | ||||||
7
| Acquired Fund | Acquiring Fund | Combined Fund Pro Forma | ||||||||||
3 Years | ||||||||||||
Assuming you sold your shares at the end of each period | ||||||||||||
Class A | $ | 703 | $ | 671 | $ | 668 | ||||||
Class C1 | $ | 436 | N/A | N/A | ||||||||
Class I | $ | 233 | $ | 199 | $ | 195 | ||||||
Assuming you kept your shares | ||||||||||||
Class A | $ | 703 | $ | 671 | $ | 668 | ||||||
Class C1 | $ | 436 | N/A | N/A | ||||||||
Class I | $ | 233 | $ | 199 | $ | 195 | ||||||
5 Years | ||||||||||||
Assuming you sold your shares at the end of each period | ||||||||||||
Class A | $ | 915 | $ | 856 | $ | 851 | ||||||
Class C1 | $ | 757 | N/A | N/A | ||||||||
Class I | $ | 408 | $ | 346 | $ | 340 | ||||||
Assuming you kept your shares | ||||||||||||
Class A | $ | 915 | $ | 856 | $ | 851 | ||||||
Class C1 | $ | 757 | N/A | N/A | ||||||||
Class I | $ | 408 | $ | 346 | $ | 340 | ||||||
10 Years | ||||||||||||
Assuming you sold your shares at the end of each period | ||||||||||||
Class A | $ | 1,523 | $ | 1,391 | $ | 1,380 | ||||||
Class C1 | $ | 1,665 | N/A | N/A | ||||||||
Class I | $ | 915 | $ | 774 | $ | 762 | ||||||
Assuming you kept your shares | ||||||||||||
Class A | $ | 1,523 | $ | 1,391 | $ | 1,380 | ||||||
Class C1 | $ | 1,665 | N/A | N/A | ||||||||
Class I | $ | 915 | $ | 774 | $ | 762 | ||||||
Each Fund pays transaction costs, such as commissions, when it buys and sells securities (or “turns over” its portfolio). A higher portfolio turnover rate may indicate higher transaction costs and may result in higher taxes when Fund shares are held in a taxable account. These costs, which are not reflected in annual fund operating expenses or in the example, affect each Fund’s performance. During their most recent fiscal periods for which audited financial statements are available, the Funds had the following portfolio turnover rates:
Fund | Fiscal Period | Rate | ||
Acquired Fund | Eleven months ended 5/31/11 | 10% | ||
Acquiring Fund | Twelve months ended 5/31/11 | 6% |
After the Reorganization is completed, the portfolio manager of the Acquiring Fund may, in his discretion, sell securities acquired from the Acquired Fund. To the extent that the portfolio manager chooses to sell a significant percentage of such securities, the Acquiring Fund’s portfolio turnover rate and brokerage costs may be higher than they otherwise would have been.
8
In evaluating the Reorganization, you should consider carefully the risks of the Acquiring Fund to which you will be subject if the Reorganization is approved and completed. Investing in a mutual fund involves risk, including the risk that you may receive little or no return on your investment or even that you may lose part or all of your investment. Because of these and other risks, you should consider an investment in the Acquiring Fund to be a long-term investment. An investment in the Acquiring Fund may not be appropriate for all shareholders. For a complete description of the risks of an investment in the Acquiring Fund, see the section in the Acquiring Fund’s Prospectus entitled “Principal Risks.”
Because the Funds have similar investment strategies, the principal risks of each Fund are similar. The principal risks of investing in the Acquiring Fund are described below. An investment in the Acquired Fund is also subject to each of these risks; however, as noted above, the Acquiring Fund may invest more of its assets in securities subject to the federal AMT and in inverse floating rate securities. In addition, the principal risks of the Acquired Fund include futures contract risk and non-diversification risk.
Alternative Minimum Tax Risk. The Fund has no limit as to the amount that can be invested in bonds subject to the federal AMT; therefore, all or a portion of the Fund’s otherwise exempt-interest dividends may be taxable to those shareholders subject to the federal AMT.
Call Risk. If an issuer calls higher-yielding bonds held by the Fund, performance could be adversely impacted.
Credit Risk. Credit risk is the risk that an issuer of a municipal bond may be unable or unwilling to make interest and principal payments when due and the related risk that the value of a bond may decline because of concerns about the issuer’s ability or willingness to make such payments. In addition, parties to other financial contracts with the Fund could default on their obligations.
High Yield Securities Risk. High yield securities generally are less liquid, have more volatile prices, and have greater credit risk than investment grade securities.
Income Risk. The Fund’s income could decline during periods of falling interest rates. Also, if the Fund invests in inverse floaters, the Fund’s income may decrease if short-term interest rates rise.
Interest Rate Risk. Interest rate risk is the risk that the value of the Fund’s portfolio will decline because of rising interest rates. Interest rate risk may be increased by the Fund’s investment in inverse floaters because of the leveraged nature of these investments.
Inverse Floaters Risk. The use of inverse floaters by the Fund creates effective leverage. Due to the leveraged nature of these investments, they will typically be more volatile and involve greater risk than the fixed rate municipal bonds underlying the inverse floaters. In other words, the value of an inverse floater will fluctuate to a significantly greater extent than the values of the fixed rate municipal bonds underlying the inverse floaters in response to changes in market interest rates or credit quality. Distributions on inverse floaters bear an inverse relationship to short-term municipal bond interest rates. Thus, distributions paid to the Fund on its inverse floaters will be reduced or even eliminated as short-term municipal interest rates rise and will increase when short-term municipal interest rates fall. Inverse floaters generally will underperform the market for fixed rate municipal bonds in a rising
9
interest rate environment. An investment in inverse floaters typically will involve greater risk than an investment in a fixed rate municipal bond, including, in the case of certain inverse floaters, the risk that the Fund may lose more than its original principal investment.
Market Risk. The market values of municipal bonds owned by the Fund may decline, at times sharply and unpredictably.
State Concentration Risk. Because the Fund primarily purchases municipal bonds from Missouri, the Fund is more susceptible to adverse economic, political or regulatory changes affecting municipal bond issuers in that state.
Tax Risk. Income from municipal bonds held by the Fund could be declared taxable because of unfavorable changes in tax laws, adverse interpretations by the Internal Revenue Service or state tax authorities, or noncompliant conduct of a bond issuer. On September 12, 2011, President Obama submitted to Congress the American Jobs Act of 2011 (the “Jobs Act”). If enacted in its proposed form, the Jobs Act generally would limit the exclusion from gross income of tax-exempt interest (which includes exempt-interest dividends received from the Fund) for individuals whose adjusted gross income for federal income tax purposes exceeds certain thresholds for taxable years beginning on or after January 1, 2013 in order to provide a tax benefit not greater than 28% of such interest. Such proposal could affect the value of the municipal bonds owned by the Fund. The likelihood of the Jobs Act being enacted in the form introduced or in some other form cannot be predicted. Shareholders should consult their own tax advisors regarding the potential consequences of the Jobs Act on their investment in the Fund.
Fundamental Investment Restrictions
The Funds have similar fundamental investment restrictions that cannot be changed without shareholder approval, with the exception that the Acquired Fund’s investment objective may be changed by the Board without shareholder approval. In accordance with federal securities laws, each Fund’s policy to invest at least 80% of its net assets in municipal bonds that pay interest that is exempt from regular federal and Missouri state income tax and, in the case of the Acquired Fund, the federal AMT is fundamental. Also, both Funds have adopted a policy of not concentrating their investments in any industry, except that state or municipal governments and their political subdivisions are not considered members of any industry. The Acquiring Fund is a diversified fund, and the Acquired Fund is a non-diversified fund.
The total returns of the Funds for the periods ended December 31, 2010, based on historical fees and expenses for each period, are set forth in the chart and tables below.
The bar chart below illustrates annual calendar year returns for the Acquired Fund’s Class I shares and the Acquiring Fund’s Class A shares. The bar chart and highest/lowest quarterly returns that follow do not reflect Class A’s sales charge, and if this charge were reflected, the returns would be less than those shown. The tables below illustrate average annual returns for the periods ended December 31, 2010 for each Fund. The tables also show how each Fund’s performance compares with the returns of a broad measure of market performance and an index of funds with similar investment objectives. This information is intended to help you assess the variability of Fund returns (and consequently, the potential risks of a Fund investment).
10
All after-tax returns are calculated using the historical highest individual federal marginal income tax rates and do not reflect the impact of state and local taxes. For the Acquired Fund, after-tax returns are shown for Class I shares only; after-tax returns for Class A and Class C1 shares will vary. For the Acquiring Fund, after-tax returns are shown for Class A shares only; after-tax returns for Class I shares will vary. Returns for market indices do not include expenses, which are deducted from Fund returns, or taxes.
Your own actual after-tax returns will depend on your specific tax situation and may differ from what is shown here.
Performance reflects fee waivers, if any, in effect during the periods presented. If any such waivers were not in place, performance would be reduced. Past performance (before and after taxes) does not necessarily indicate future performance. Updated performance information is available at www.nuveen.com or by calling (800) 257-8787.
Acquired Fund – Class I Annual Total Return
During the periods shown in the bar chart, the Acquired Fund’s Class I highest and lowest calendar quarter returns were 8.16% and -3.98%, respectively, for the quarters ended September 30, 2009 and September 30, 2008. The Acquired Fund’s Class I year-to-date return through September 30, 2011 was 9.08%.
Acquiring Fund – Class A Total Return
During the periods shown in the bar chart, the Acquiring Fund’s Class A highest and lowest calendar quarter returns were 8.87% and -4.83%, respectively, for the quarters ended September 30,
11
2009 and December 31, 2008. The Acquiring Fund’s Class A year-to-date return through September 30, 2011 was 9.16%.
| Average Annual Total Returns for the Periods Ended December 31, 2010 | ||||||||||||||||
Acquired Fund | 1 Year | 5 Years | 10 Years | Since Inception (Class C1) | ||||||||||||
Class A (return before taxes) | (1.61 | )% | 2.57 | % | 3.62 | % | N/A | |||||||||
Class C1 (return before taxes) (Inception Date 9/24/01) | 2.22 | % | 3.01 | % | N/A | 3.44 | % | |||||||||
Class I (return before taxes) | 2.88 | % | 3.68 | % | 4.32 | % | N/A | |||||||||
Class I (return after taxes on distributions) | 2.84 | % | 3.61 | % | 4.24 | % | N/A | |||||||||
Class I (return after taxes on distributions and sale of fund shares) | 3.39 | % | 3.75 | % | 4.30 | % | N/A | |||||||||
Barclays Capital Municipal Bond Index (reflects no deduction for fees, expenses or taxes) | 2.38 | % | 4.09 | % | 4.83 | % | 3.44 | % | ||||||||
Lipper Other States Municipal Debt Funds Category | 1.11 | % | 2.90 | % | 3.81 | % | 3.60 | % | ||||||||
| Average Annual Total Returns for the Periods Ended December 31, 2010 | ||||||||||||
Acquiring Fund | 1 Year | 5 Years | 10 Years | |||||||||
Class A (return before taxes) | (1.42 | )% | 2.41 | % | 3.97 | % | ||||||
Class A (return after taxes on distributions) | (1.42 | )% | 2.39 | % | 3.95 | % | ||||||
Class A (return after taxes on distributions and sale of fund shares) | 0.58 | % | 2.67 | % | 4.04 | % | ||||||
Class I (return before taxes) | 3.27 | % | 3.49 | % | 4.62 | % | ||||||
Standard & Poor’s National Municipal Bond Index (reflects no deduction for fees, expenses or taxes) | 2.45 | % | 3.83 | % | 4.82 | % | ||||||
Standard & Poor’s Missouri Municipal Bond Index (reflects no deduction for fees, expenses or taxes) | 2.40 | % | 3.92 | % | 4.96 | % | ||||||
Lipper Peer Group (reflects no deduction for taxes or certain expenses) | 1.11 | % | 2.90 | % | 3.81 | % | ||||||
Investment Adviser and Sub-Adviser
Both Funds are managed by Nuveen Fund Advisors, which offers advisory and investment management services to a broad range of mutual fund clients. Nuveen Fund Advisors has overall responsibility for management of the Funds, oversees the management of the Funds’ portfolios, manages the Funds’ business affairs and provides certain clerical, bookkeeping and other administrative services. Nuveen Fund Advisors is located at 333 West Wacker Drive, Chicago, Illinois 60606. Nuveen Fund Advisors is a subsidiary of Nuveen Investments, Inc. (“Nuveen Investments”). On November 13, 2007, Nuveen Investments was acquired by investors led by Madison Dearborn Partners, LLC, which is a private equity investment firm based in Chicago, Illinois. The Nuveen family of advisers has been providing advice to investment companies since 1976.
Nuveen Fund Advisors has selected its affiliate, Nuveen Asset Management, located at 333 West Wacker Drive, Chicago, Illinois 60606, to serve as a sub-adviser to each of the Funds. Nuveen Asset Management manages the investment of the Funds’ assets on a discretionary basis, subject to the supervision of Nuveen Fund Advisors.
Prior to the FAF Transaction, the Acquired Fund was advised by FAF Advisors, a wholly-owned subsidiary of U.S. Bank National Association.
12
The Funds have been managed by the same portfolio manager since the FAF Transaction. Christopher L. Drahn, CFA, is the portfolio manager for the Funds. He has served as the portfolio manager for the Acquired Fund since December 2002 and the Acquiring Fund since January 2011. He entered the financial services industry when he joined FAF in 1980. He joined Nuveen Asset Management on January 1, 2011 in connection with the FAF Transaction and currently serves as a senior vice president. As of October 31, 2011, he manages 6 state-specific Nuveen-sponsored municipal bond funds, with a total of approximately $796 million under management.
For a complete description of the advisory services provided to the Acquiring Fund, see the section of the Fund’s Prospectus entitled “Who Manages the Funds” and the section of the Fund’s Statement of Additional Information entitled “Adviser and Sub-Adviser.”
Pursuant to investment management agreements between Nuveen Fund Advisors and the Corporation, on behalf of the Acquired Fund, and Nuveen Fund Advisors and the Trust, on behalf of the Acquiring Fund, each Fund pays Nuveen Fund Advisors fund-level fees, payable monthly, at the annual rates set forth below:
Acquired Fund - Management Fee | Acquiring Fund - Management Fee | |||||||||
Average Daily Net Assets | Fee Rate | Average Daily Net Assets | Fee Rate | |||||||
For the first $125 million | 0.4500% | For the first $125 million | 0.3500% | |||||||
For the next $125 million | 0.4375% | For the next $125 million | 0.3375% | |||||||
For the next $250 million | 0.4250% | For the next $250 million | 0.3250% | |||||||
For the next $500 million | 0.4125% | For the next $500 million | 0.3125% | |||||||
For the next $1 billion | 0.4000% | For the next $1 billion | 0.3000% | |||||||
For net assets over $2 billion | 0.3750% | For the next $3 billion | 0.2750% | |||||||
| For net assets over $5 billion | 0.2500% | |||||||||
In addition to the fund-level fee, each Fund pays a complex-level fee. The maximum complex-level fee is 0.20% of the Fund’s average daily net assets, based upon complex-level “eligible assets” of $55 billion. Therefore, the maximum management fee rate for each Fund is the fund-level fee rate plus 0.20%. As complex-level eligible assets increase, the complex-level fee rate decreases pursuant to a breakpoint schedule. Each Fund’s individual complex-level fee rate is determined by taking the current overall complex-level fee rate, which is based on the aggregate amount of the “eligible assets” of all Nuveen funds, and making an upward adjustment to that rate (subject to the maximum 0.20% rate noted above) based upon the percentage of the Fund’s assets, if any, that are not “eligible assets.”
Nuveen Fund Advisors has agreed to waive fees and reimburse expenses for the Acquired Fund through March 31, 2013 so that total annual fund operating expenses, after fee waivers and/or expense reimbursements and excluding the fees and expenses of other investment companies in which the Acquired Fund invests, do not exceed 0.90%, 1.35% and 0.70% for Class A, Class C1 and Class I, respectively. The Acquired Fund fee waivers and expense reimbursement will not be terminated prior to that time without approval of the Board.
13
For the Acquired Fund’s annualized five-month period ended May 31, 2011 and for the Acquiring Fund’s fiscal year ended May 31, 2011, each Fund paid Nuveen Fund Advisors the following management fees (net of fee waivers and expense reimbursements, where applicable) as a percentage of average net assets:
| Management Fee Rate | ||||
Acquired Fund | 0.59 | % | ||
Acquiring Fund | 0.53 | % | ||
Each Fund has adopted a distribution and service plan (the “Plans”) pursuant to Rule 12b-1 under the 1940 Act. Under the Plans, Class C1 shares are subject to a distribution fee, and Class A shares and Class C1 shares are subject to a service fee. Class I shares are not subject to either distribution or service fees.
Under the Plans, (a) for each Fund, Class A shares are subject to an annual service fee of 0.20% of the average daily net assets of Class A shares and (b) for the Acquired Fund, Class C1 shares are subject to (i) an annual distribution fee of 0.40% of the average daily net assets of Class C1 shares and (ii) an annual service fee of 0.25% of the average daily net assets of Class C1 shares. For a complete description of these arrangements for the Acquiring Fund, see the section of the Fund’s Prospectus entitled “What Share Classes We Offer” and the section of the Fund’s Statement of Additional Information entitled “Distributor.”
As of the closing of the FAF Transaction, the same individuals constitute the Board of each Fund, and the Corporation and the Trust have the same officers. The management of each Fund, including general oversight of the duties performed by Nuveen Fund Advisors under the Investment Management Agreement for each Fund, is the responsibility of the Board. There are currently ten members of the Board, one of whom is an “interested person” (as defined in the 1940 Act) and nine of whom are not interested persons (the “independent board members”). The names and business addresses of the board members and officers of the Acquiring Fund and their principal occupations and other affiliations during the past five years are set forth under “Directors and Executive Officers” in the Statement of Additional Information for the Acquiring Fund incorporated herein by reference.
Distribution, Purchase, Redemption, Exchange of Shares and Dividends
The Acquired Fund offers three classes of shares: Class A, Class C1 and Class I shares. The Acquiring Fund offers four classes of shares: Class A, Class B, Class C and Class I shares. You may purchase, redeem or exchange shares of the Funds on any business day, which is any day the New York Stock Exchange is open for business. You may purchase, redeem or exchange shares of each Fund through a financial advisor or other financial intermediary or directly from such Fund. Class C1 shares of the Acquired Fund are not available for new accounts or additional investment into existing accounts, but Class C1 shares may be issued for purposes of dividend reinvestment. The Acquiring Fund’s initial and subsequent investment minimums generally are as follows, although the Fund may reduce or waive the minimums in some cases. The Acquired Fund’s investment minimums for Class A and Class I shares are identical to the Acquiring Fund’s investment minimums for Class A and Class I shares, respectively.
14
| Class A | Class I | |||||
Eligibility and Minimum Initial Investment | $3,000 | Available only through fee-based programs and to other limited categories of investors as described in the prospectus.
$100,000 for all accounts except:
• $250 for clients of financial intermediaries and family offices that have accounts holding Class I shares with an aggregate value of at least $100,000 (or that are expected to reach this level).
• No minimum for certain other categories of eligible investors as described in the prospectus. | ||||
Minimum Additional Investment | $100 | No minimum. | ||||
No initial sales charge or contingent deferred sales charges will be imposed on shares of the Acquiring Fund received or shares of the Acquired Fund exchanged in connection with the Reorganization.
For a complete description of purchase, redemption and exchange options, see the section of the Acquiring Fund’s Prospectus entitled “How You Can Buy and Sell Shares” and “General Information” and the section of the Acquiring Fund’s Statement of Additional Information entitled “Purchase and Redemption of Fund Shares.”
Each Fund declares dividends daily and pays such dividends monthly. Each Fund declares and pays any taxable capital gains or other taxable distributions once a year at year end. If the Reorganization is approved by the shareholders of the Acquired Fund, the Acquired Fund intends to distribute to its shareholders, prior to the closing of the Reorganization, all its net investment income and net capital gains, if any, for the period ending on the Closing Date.
The Funds intend to make distributions that are exempt from regular federal and Missouri state income tax. All or a portion of all distributions, however, may be subject to the federal AMT. The Funds’ distributions that are not designated as exempt-interest dividends are generally taxed as ordinary income or capital gains for regular federal income tax purposes.
Payments to Broker-Dealers and Other Financial Intermediaries
If you purchase shares of a Fund through a broker-dealer or other financial intermediary (such as a bank or financial advisor), the Fund, its distributor or its investment adviser may pay the intermediary for the sale of Fund shares and related services. These payments may create a conflict of interest by influencing the broker-dealer or other financial intermediary and your salesperson to recommend the Fund over another investment. Ask your financial advisor or visit your financial intermediary’s website for more information.
15
Additional information concerning the Acquiring Fund and Acquired Fund is contained in this Proxy Statement/Prospectus and additional information regarding the Acquiring Fund is contained in the accompanying Acquiring Fund prospectus. The cover page of this Proxy Statement/Prospectus describes how you may obtain further information.
The proposed Reorganization will be governed by the Agreement, which is attached as Appendix I. The Agreement provides that the Acquired Fund will transfer all its assets to the Acquiring Fund solely in exchange for the issuance of full and fractional voting shares of the Acquiring Fund and the assumption by the Acquiring Fund of all the liabilities of the Acquired Fund. The closing of the Reorganization will take place at the close of business on the Closing Date. The following discussion of the Agreement is qualified in its entirety by the full text of the Agreement.
The Acquired Fund will transfer all its assets to the Acquiring Fund, and in exchange, the Acquiring Fund will assume all the liabilities of the Acquired Fund and deliver to the Acquired Fund a number of full and fractional shares of the Acquiring Fund having a net asset value equal to the value of the assets of the Acquired Fund less the liabilities of the Acquired Fund assumed by the Acquiring Fund. At the designated time on the Closing Date as set forth in the Agreement, the Acquired Fund will distribute in complete liquidation of the Acquired Fund, pro rata to its shareholders of record, all Acquiring Fund shares received by the Acquired Fund. This distribution will be accomplished by the transfer of the Acquiring Fund shares credited to the account of the Acquired Fund on the books of the Acquiring Fund to open accounts on the share records of the Acquiring Fund in the name of the Acquired Fund shareholders, and representing the respective pro rata number of Acquiring Fund shares due such shareholders. All issued and outstanding shares of the Acquired Fund will simultaneously be canceled on the books of the Acquired Fund. As a result of the proposed Reorganization, each Acquired Fund Class A, Class C1 and Class I shareholder will receive a number of Acquiring Fund Class A, Class A and Class I shares, respectively, equal in value, as of the close of regular trading on the New York Stock Exchange on the Closing Date, to the value of the Acquired Fund Class A, Class C1 or Class I shares surrendered by such shareholder.
The Board has determined that the proposed Reorganization is in the best interests of each Fund and that the interests of shareholders will not be diluted as a result of the transactions contemplated by the Agreement.
The consummation of the Reorganization is subject to the terms and conditions of, and the representations and warranties being true as set forth in, the Agreement. The Agreement may be terminated by mutual agreement of the Funds. In addition, either Fund may at its option terminate the Agreement at or before the Closing Date due to (i) a breach by any other party of any representation, warranty, or agreement to be performed at or before the Closing Date, if not cured within 30 days, (ii) a condition precedent to the obligations of the terminating party that has not been met and it reasonably appears that it will not or cannot be met, or (iii) a determination by the Board that the consummation of the transactions contemplated by the Agreement is not in the best interests of a Fund.
The Acquired Fund will, within a reasonable period of time before the Closing Date, furnish the Acquiring Fund with a list of the Acquired Fund’s portfolio securities and other investments. The
16
Acquiring Fund will, within a reasonable period of time before the Closing Date, furnish the Acquired Fund with a list of the securities, if any, on the Acquired Fund’s list referred to above that do not conform to the Acquiring Fund’s investment objective, policies, and restrictions. The Acquired Fund, if requested by the Acquiring Fund, will dispose of securities on the Acquiring Fund’s list before the Closing Date. In addition, if it is determined that the portfolios of the Funds, when aggregated, would contain investments exceeding certain percentage limitations imposed upon the Acquiring Fund with respect to such investments, the Acquired Fund, if requested by the Acquiring Fund, will dispose of a sufficient amount of such investments as may be necessary to avoid violating such limitations as of the Closing Date. The sale of such investments could result in taxable distributions to shareholders of the Acquired Fund prior to the Reorganization. Notwithstanding the foregoing, nothing in the Agreement will require the Acquired Fund to dispose of any investments or securities if, in the reasonable judgment of the Board or the Adviser, such disposition would adversely affect the tax-free nature of the Reorganization for federal income tax purposes or would otherwise not be in the best interests of the Acquired Fund. See “Material Federal Income Tax Consequences” below. However, it is not expected that any material portfolio sales (i.e., more than 5% of the Acquired Fund’s net assets) will occur in connection with the Reorganization.
As noted above, if the Reorganization had occurred as of November 30, 2011, the Acquiring Fund would not have been required to dispose of securities of the Acquired Fund in order to comply with its investment policies and restrictions, and would not have sold any material portion (i.e., more than 5% of its net assets) of the securities in the Acquired Fund’s portfolio solely as a result of the Reorganization.
Description of Securities to be Issued
Shares of Beneficial Interest. The Acquiring Fund has established and designated four classes of shares, par value $0.01 per share, including Class A and Class I shares. The Trust’s declaration of trust (the “Declaration of Trust”) permits the Board, in its sole discretion, and subject to compliance with the 1940 Act, to further subdivide the shares of the Acquiring Fund into one or more other classes of shares.
Voting Rights of Shareholders. Holders of shares of the Acquiring Fund are entitled to one vote per share on matters as to which they are entitled to vote, with fractional shares voting proportionally. The Acquiring Fund operates as a series of the Trust, an open-end management investment company registered with the SEC under the 1940 Act. The Trust currently has six series, including the Acquiring Fund, and the Board may, in its sole discretion, create additional series from time to time. Separate votes generally are taken by each series on matters affecting an individual series. In addition to the specific voting rights described above, shareholders of the Acquiring Fund are entitled, under current law, to vote with respect to certain other matters, including changes in fundamental investment policies and restrictions. Moreover, shareholders owning at least 10% of the outstanding shares entitled to vote may request that the Board call a shareholders’ meeting.
Continuation of Shareholder Accounts and Plans; Change in Exchange Privileges; Share Certificates
If the Reorganization is approved, the Acquiring Fund will establish an account for each Acquired Fund shareholder containing the appropriate number of shares of the appropriate class of the Acquiring Fund. Shareholders of the Acquired Fund who are accumulating shares through systematic investing,
17
or who are receiving payments under the systematic withdrawal plan, will retain the same rights and privileges after the Reorganization through plans maintained by the Acquiring Fund. The shareholder services and shareholder programs of the Funds are substantially similar, and services provided to shareholders generally are not expected to change, except to the extent services differ because the Funds have different transfer agents. Both Funds currently have exchange procedures that provide that shareholders may exchange their shares into the same class of another Nuveen mutual fund provided that such funds utilize the same transfer agent. Accordingly, because the Acquiring Fund and Acquired Fund utilize different transfer agents, if the Reorganization is approved and completed, the eligible exchange options for Acquired Fund shareholders will change. No certificates for Acquiring Fund shares will be issued as part of the Reorganization.
U.S. Bank National Association serves as the custodian for the assets of the Acquired Fund and State Street Bank & Trust Company serves as the custodian for the assets of the Acquiring Fund. U.S. Bancorp Fund Services, LLC serves as transfer agent for the Acquired Fund and Boston Financial Data Services, LLC serves as transfer agent for the Acquiring Fund. Ernst & Young LLP serves as the independent auditors for the Acquired Fund and PricewaterhouseCoopers LLP serves as independent auditors for the Acquiring Fund.
Material Federal Income Tax Consequences
As a condition to each Fund’s obligation to consummate the Reorganization, each Fund will receive a tax opinion from Vedder Price P.C. (which opinion will be based on certain factual representations and certain customary assumptions and exclusions) substantially to the effect that, on the basis of the existing provisions of the Internal Revenue Code of 1986, as amended (the “Code”), current administrative rules and court decisions, for federal income tax purposes:
| 1. | The transfer of all the assets of the Acquired Fund to the Acquiring Fund in exchange solely for Acquiring Fund shares and the assumption by the Acquiring Fund of all the liabilities of the Acquired Fund, followed by the pro rata distribution to the Acquired Fund shareholders of all the Acquiring Fund shares received by the Acquired Fund in complete liquidation of the Acquired Fund, will constitute a “reorganization” within the meaning of Section 368(a) of the Code, and the Acquiring Fund and the Acquired Fund will each be a “party to a reorganization” within the meaning of Section 368(b) of the Code with respect to the Reorganization. |
| 2. | No gain or loss will be recognized by the Acquiring Fund upon the receipt of all the assets of the Acquired Fund solely in exchange for Acquiring Fund shares and the assumption by the Acquiring Fund of all the liabilities of the Acquired Fund. |
| 3. | No gain or loss will be recognized by the Acquired Fund upon the transfer of all the Acquired Fund’s assets to the Acquiring Fund solely in exchange for Acquiring Fund shares and the assumption by the Acquiring Fund of all the liabilities of the Acquired Fund or upon the distribution (whether actual or constructive) of all such Acquiring Fund shares to the Acquired Fund shareholders solely in exchange for such shareholders’ shares of the Acquired Fund in complete liquidation of the Acquired Fund. |
18
| 4. | No gain or loss will be recognized by Acquired Fund shareholders upon the exchange of their Acquired Fund shares solely for Acquiring Fund shares pursuant to the Reorganization. |
| 5. | The aggregate basis of the Acquiring Fund shares received by each Acquired Fund shareholder pursuant to the Reorganization will be the same as the aggregate basis of the Acquired Fund shares exchanged therefor by such shareholder. The holding period of the Acquiring Fund shares received by each Acquired Fund shareholder will include the period during which the Acquired Fund shares exchanged therefor were held by such shareholder, provided such Acquired Fund shares are held as capital assets at the effective time of the Reorganization. |
| 6. | The basis of the Acquired Fund’s assets acquired by the Acquiring Fund will be the same as the basis of such assets to the Acquired Fund immediately before the Reorganization. The holding period of the assets of the Acquired Fund in the hands of the Acquiring Fund will include the period during which those assets were held by the Acquired Fund. |
No opinion will be expressed as to (1) the effect of the Reorganization on (A) the Acquired Fund or the Acquiring Fund with respect to any asset as to which any unrealized gain or loss is required to be recognized for federal income tax purposes at the end of a taxable year (or on the termination thereof) under a mark-to-market system of accounting, (B) any Acquired Fund shareholder that is required to recognize unrealized gains and losses for U.S. federal income tax purposes under a mark-to-market system of accounting, or (C) the Acquired Fund or the Acquiring Fund with respect to any stock held in a passive foreign investment company as defined in Section 1297(a) of the Code or (2) any other federal tax issues (except those set forth above) and all state, local or foreign tax issues of any kind.
Prior to the closing of the Reorganization, the Acquired Fund will declare a distribution to its shareholders, which together with all previous distributions, will have the effect of distributing to shareholders all its net investment income and realized net capital gains (after reduction by any available capital loss carryforwards), if any, through the closing of the Reorganization. Except to the extent that this distribution is designated as an exempt-interest dividend, it will be taxable to shareholders for regular federal income tax purposes and may include net capital gains resulting from the sale of portfolio assets discussed below. All or a portion of this distribution may be subject to the federal AMT. Additional distributions may be made if necessary. All dividends and distributions will be reinvested in additional shares of the Acquired Fund unless a shareholder has made an election to receive dividends and distributions in cash. Dividends and distributions are treated the same for federal income tax purposes whether received in cash or additional shares.
To the extent that a portion of the Acquired Fund’s portfolio assets are sold prior to the Reorganization, the federal income tax effect of such sales would depend on the holding periods of such assets and the difference between the price at which such portfolio assets were sold and the Fund’s basis in such assets. Any net capital gains (net long-term capital gain in excess of any net short-term capital loss) recognized in these sales, after the application of any available capital loss carryforwards (capital losses from prior taxable years that may be used to offset future capital gains), would be distributed to the Acquired Fund’s shareholders as capital gain dividends. Any net short-term capital gains (in excess of any net long-term capital loss and after application of any available capital loss carryforwards) would be distributed as ordinary dividends. All such distributions would be made during or with respect to the Acquired Fund’s taxable year in which the sale occurs and would be taxable to shareholders for federal income tax purposes.
19
After the Reorganization, the Acquiring Fund’s ability to use its pre-Reorganization capital losses, if any, may be limited under certain federal income tax rules applicable to reorganizations of this type. Therefore, in certain circumstances, shareholders may pay federal income tax sooner, or may pay more federal income taxes, than they would have had the Reorganization not occurred. The effect of these potential limitations, however, will depend on a number of factors, including the amount of the losses, the amount of gains to be offset, the exact timing of the Reorganization and the amount of unrealized capital gains in the Funds at the time of the Reorganization.
In addition, shareholders of the Acquired Fund will receive a proportionate share of any taxable income and gains realized by the Acquiring Fund and not distributed to its shareholders prior to the Reorganization when such income and gains are eventually distributed by the Acquiring Fund. As a result, shareholders of the Acquired Fund may receive a greater amount of taxable distributions than they would have had the Reorganization not occurred.
This description of the federal income tax consequences of the Reorganization is made without regard to the particular facts and circumstances of any shareholder. Shareholders are urged to consult their own tax advisors as to the specific consequences to them of the Reorganization, including the applicability and effect of state, local, non-U.S. and other tax laws.
The Acquired Fund, the Acquiring Fund and Nuveen will each be responsible for a portion of the expenses associated with the Reorganization, including, but not limited to, legal and auditing fees, the costs of printing and distributing this Proxy Statement/Prospectus, and the solicitation expenses discussed below, if the Reorganization is approved. Nuveen Fund Advisors estimates that expenses for the Reorganization will be approximately $126,000. It is anticipated that these expenses will be offset over time by the lower operating expenses of the Acquiring Fund that are expected to result after the Reorganization. Each of the Acquired Fund and Acquiring Fund will be responsible for expenses incurred in connection with the Reorganization ratably up to each Fund’s projected cost savings during the first year following the Reorganization. If the Reorganization had been completed on May 31, 2011, Nuveen Fund Advisors estimates that Acquired Fund shareholders, as shareholders of the Acquiring Fund, would save approximately $150,000 in the first year after the Reorganization and that Acquiring Fund shareholders would save approximately $36,000 in the first year after the Reorganization. As a result, the Acquired Fund is expected to be charged approximately $102,000, and the Acquiring Fund is expected to be charged approximately $24,000. Because the payment by the Acquired Fund of any portion of these costs would cause the Acquired Fund to exceed its expense cap currently in effect, Nuveen will reimburse all expenses charged to the Acquired Fund and none of the expenses charged to the Acquiring Fund. The Acquiring Fund is expected to recover its costs of the Reorganization within the first year following the Reorganization assuming that annual cost savings occur at the level shown above. If the Reorganization is not approved or completed, Nuveen will pay all costs associated with the Reorganization.
The Acquired Fund has engaged Computershare Fund Services to assist in the solicitation of proxies at an estimated cost of $5,500, which is included in the expense estimate above.
20
Comparison of Massachusetts Business Trusts and Maryland Corporations
The following description is based on relevant provisions of applicable Massachusetts law and the Maryland General Corporation Law (the “MGCL”) and each Fund’s operative documents. This summary does not purport to be complete and we refer you to applicable Massachusetts law, the MGCL and each Fund’s operative documents.
In General
The Acquiring Fund is a series of a Massachusetts business trust. A fund organized as a series of a Massachusetts business trust is governed by the trust’s declaration of trust or similar instrument. Massachusetts law allows the trustees of a business trust to set the terms of a fund’s governance in its declaration. All power and authority to manage the fund and its affairs generally reside with the trustees, and shareholder voting and other rights are limited to those provided to the shareholders in the declaration. Because Massachusetts law governing business trusts provides more flexibility compared to typical state corporate statutes, the Massachusetts business trust has become a common form of organization for mutual funds. However, some consider it less desirable than other entities because it relies on the terms of the applicable declaration and judicial interpretations rather than statutory provisions for substantive issues, such as the personal liability of shareholders and trustees, and does not provide the level of certitude that corporate laws like those of Maryland, or newer statutory trust laws, such as those of Delaware, provide.
The Acquired Fund is a series of a Maryland corporation. A fund organized as a series of a Maryland corporation is governed both by the MGCL and the Maryland corporation’s charter and bylaws. For a Maryland corporation, unlike a Massachusetts trust, the MGCL prescribes many aspects of corporate governance.
Shareholders of a Maryland corporation generally are shielded from personal liability for the corporation’s debts or obligations. Shareholders of a Massachusetts business trust, on the other hand, are not afforded the statutory limitation of personal liability generally afforded to shareholders of a corporation from the trust’s liabilities. Instead, the declaration of trust of a fund organized as a Massachusetts business trust typically provides that a shareholder will not be personally liable, and further provides for indemnification to the extent that a shareholder is found personally liable, for the fund’s acts or obligations. The Trust’s declaration of trust (the “Declaration of Trust”) contains such provisions.
Similarly, the trustees of a Massachusetts business trust are not afforded statutory protection from personal liability for the obligations of the trust. The directors of a Maryland corporation, on the other hand, generally are shielded from personal liability for the corporation’s acts or obligations by the MGCL. Courts in Massachusetts have, however, recognized limitations of a trustee’s personal liability in contract actions for the obligations of a trust contained in the trust’s declaration, and declarations may also provide that trustees may be indemnified out of the assets of the trust to the extent held personally liable. The Declaration of Trust contains such provisions.
Massachusetts Business Trusts
The Acquiring Fund is governed by the Declaration of Trust and the Trust’s amended and restated by-laws (the “By-Laws”). Under the Declaration of Trust, any determination as to what is in the interests of the Trust made by the trustees in good faith is conclusive, and in construing the provisions
21
of the Declaration of Trust, there is a presumption in favor of a grant of power to the trustees. Further, the Declaration of Trust provides that certain determinations made in good faith by the trustees are binding upon the Trust and all shareholders, and shares are issued and sold on the condition and understanding, evidenced by the purchase of shares, that any and all such determinations shall be so binding. The following is a summary of some of the key provisions of the Acquiring Fund’s governing documents.
Shareholder Voting
The 1940 Act requires a vote of shareholders on matters that Congress has determined might have a material effect on shareholders and their investments. For example, shareholder consent is required under the 1940 Act to approve new investment advisory agreements in many cases, an increase in an advisory fee or a 12b-1 fee, changes to fundamental policies, the election of directors or trustees in certain circumstances, and the merger or reorganization of a fund in certain circumstances, particularly where the merger or consolidation involves an affiliated party. The Declaration of Trust requires a shareholder vote on matters in addition to those required under the 1940 Act, such as certain mergers, consolidations and sales of assets, derivative actions (to the same extent as shareholders of a Massachusetts business corporation) and certain amendments to the Declaration of Trust. Shareholders have no power to vote on any matter except as required by applicable law, the governing documents, or as otherwise determined by the trustees.
There are ordinarily no annual meetings of shareholders, but special meetings may be called by the Trustees or certain officers and by the written request of shareholders owning at least 10% of the outstanding shares entitled to vote. The By-Laws provide that the holders of a majority of the voting power of the shares of beneficial interest of the Acquiring Fund entitled to vote at a meeting shall constitute a quorum for the transaction of business. Except as may otherwise be required by the 1940 Act, the Declaration of Trust or the By-Laws, the Declaration of Trust provides that the affirmative vote of the holders of a majority, except in the case of the election of trustees which shall only require a plurality, of the shares present in person or by proxy and entitled to vote at a meeting of shareholders at which a quorum is present is required to approve a matter.
Election and Removal of Trustees
The Declaration of Trust provides that the trustees determine the size of the Board, subject to a minimum of two and a maximum of twelve, and to set and alter the terms of office of the trustees, and may make their terms of unlimited duration. It also provides that vacancies on the Board may be filled by the remaining trustees, except when election by the shareholders is required under the 1940 Act. Therefore, there will normally be no meetings of shareholders for the purpose of electing trustees unless and until such time as required by law. Trustees are then elected by a plurality vote of the shareholders. A trustee may only be removed for cause by action of at least two-thirds of the remaining trustees or by action of at least two-thirds of the outstanding shares.
Issuance of Shares
Under the Declaration of Trust, the trustees are permitted to issue an unlimited number of shares for such consideration and on such terms as the trustees may determine. Shares are subject to such other preferences, conversion, exchange or similar rights, as the trustees may determine.
22
Series and Classes
The Declaration of Trust gives broad authority to the trustees to establish series and classes in addition to those currently established and to determine the rights and preferences, conversion rights, voting powers, restrictions, limitations, qualifications or terms or conditions of redemptions of the shares of the series and classes. The trustees are also authorized to merge or terminate a series or a class without a vote of shareholders under certain circumstances.
Amendments to Declaration of Trust
Amendments to the Declaration of Trust generally require the consent of shareholders owning more than 50% of shares entitled to vote, voting in the aggregate and not by class except to the extent that applicable law may require voting by class, although certain amendments may be made by the trustees without a shareholder vote.
Shareholder, Trustee and Officer Liability
The Declaration of Trust provides that shareholders have no personal liability for any debt or obligation of the Trust and requires the Trust to indemnify a shareholder from any loss or expense arising solely by reason of his or her being or having been a shareholder and not because of his or her acts or omissions or for some other reasons. In addition, the Trust will assume the defense of any claim against a shareholder for personal liability at the request of the shareholder. Similarly, the Declaration of Trust provides that any person who is a trustee, officer or employee of the Trust is not personally liable to any person in connection with the affairs of the Trust, other than to the Trust and its shareholders arising from bad faith, willful misfeasance, gross negligence or reckless disregard for his or her duty. The Declaration of Trust further provides for indemnification of such persons and advancement of the expenses of defending any such actions for which indemnification might be sought. The Declaration of Trust also provides that the trustees may rely in good faith on expert advice.
Preemptive Rights
Pursuant to the Declaration of Trust, shareholders of the Acquiring Fund have no preemptive rights or other rights to subscribe to additional shares.
Derivative Actions
Massachusetts has what is commonly referred to as a “universal demand statute,” which requires that a shareholder make a written demand on the board, requesting the board members to bring an action, before the shareholder is entitled to bring or maintain a court action or claim on behalf of the entity.
Maryland Corporations
A Maryland corporation is governed by the MGCL, its charter and bylaws. Some of the key provisions of the MGCL are summarized below.
Shareholder Voting
Under the MGCL, a Maryland corporation generally cannot dissolve, amend its charter, or engage in a statutory share exchange, merger or consolidation unless approved by a vote of shareholders.
23
Depending on the circumstances and the charter of the corporation, there may be various exceptions to these votes. Shareholders of Maryland corporations are generally entitled to one vote per share and fractional votes for fractional shares held. The Corporation’s charter (the “Charter”) and bylaws contain such provisions.
Election and Removal of Directors
Shareholders of a Maryland corporation generally are entitled to elect and remove directors. Shareholders of the Corporation may elect directors at any annual meeting or a special meeting in lieu thereof. Provided the charter or bylaws so provide, the MGCL does not require a corporation registered as an open-end investment company to hold an annual meeting in any year in which the election of directors is not required by the 1940 Act. The Charter contains such a provision. Under the bylaws of the Corporation, a special meeting of shareholders shall be called upon the written request of the holders of shares entitled to cast not less than 10% of all votes entitled to vote at such meeting. The bylaws of the Corporation provide that shareholders may, at any meeting of shareholders duly called and at which a quorum is present, by the affirmative vote of the holders of a majority of the votes entitled to be cast thereon, remove any director or directors from office and may select a successor or successors to fill any resulting vacancies.
Amendments to the Charter
Under the MGCL, shareholders of corporations generally are entitled to vote on amendments to the charter. However, the board of directors of a Maryland corporation is authorized, without a vote of the shareholders, to amend the charter to change the name of the corporation, to change the name or other designation of any class or series of stock and to change the par value of any class or series of stock. Under the MGCL, generally a change in the name or other designation of a class or series of stock, however, may not change the preferences, conversion or other rights, voting powers, restrictions, limitations as to dividends, or terms or conditions of redemption. The board of directors of a Maryland corporation may, however, if permitted by the charter, without a vote of the shareholders, classify or reclassify any unissued stock by setting or changing the preferences, conversion or other rights, voting powers, restrictions, limitations as to dividends, qualifications, or terms or conditions of redemption. The Charter permits the Board to do so. The MGCL permits the board of directors of an open-end investment company to supplement the charter without a vote of the shareholders to increase the aggregate number of authorized shares or the number of shares in any class or series, unless prohibited by the charter. The Charter does not prohibit the Board from doing so.
Issuance of Shares
The board of directors of a Maryland corporation has the power to authorize the issuance of stock and, prior to issuance of shares of each class or series, the board of directors of a Maryland corporation is required by Maryland law to set the terms, preferences, conversion or other rights, voting powers, restrictions, limitations as to dividends or other distributions, qualifications and terms or conditions of redemption for each class or series.
Shareholder, Director and Officer Liability
Under Maryland law, shareholders generally are not personally liable for debts or obligations of a corporation. Maryland law provides that a director who has met his or her statutory standard of conduct has no liability for reason of being or having been a director. Maryland law provides that a corporation
24
may indemnify and advance expenses to its directors for acts and omissions in their official capacity, subject to certain exceptions, and the Charter requires the Corporation to do so. The indemnification provisions and the limitation on liability are both subject to any limitations of the 1940 Act, which generally provides that no director or officer shall be protected from liability to the corporation or its shareholders by reason of willful misfeasance, bad faith, gross negligence or reckless disregard of the duties involved in the conduct of his or her office. The provisions governing the advance of expenses are subject to applicable requirements of the 1940 Act or rules thereunder.
Preemptive Rights
Pursuant to the Charter, shareholders of the Acquired Fund have no preemptive rights.
Derivative Actions
Under Maryland law, applicable case law at the time of a particular derivative action will establish any requirements or limitations with respect to shareholder derivative actions.
The foregoing is only a summary of certain rights of shareholders under the governing documents of the Trust and the Corporation and under applicable state law, and is not a complete description of provisions contained in those sources. Shareholders should refer to the provisions of those documents and state law directly for a more thorough description.
The following table sets forth the capitalization of the Acquired Fund and the Acquiring Fund as of May 31, 2011, and the pro forma capitalization of the combined fund as if the Reorganization had occurred on that date. These numbers may differ at the Closing Date.
Capitalization Table as of May 31, 2011 (Unaudited)
| Acquired Fund | Acquiring Fund | Pro Forma Adjustments | Pro Forma Combined Fund | |||||||||||||
Net Assets | ||||||||||||||||
Class A | $22,951,610 | $187,843,697 | $1,578,972 | (a) | $212,374,279 | (a) | ||||||||||
Class B | N/A | 1,117,032 | (118 | )(a) | 1,116,914 | (a) | ||||||||||
Class C | N/A | 26,957,537 | (2,850 | )(a) | 26,954,687 | (a) | ||||||||||
Class C1 | 1,660,889 | N/A | (1,660,889 | )(a) | N/A(a) | |||||||||||
Class I | 134,609,690 | 11,115,082 | (340,592 | )(a) | 145,384,180 | (a) | ||||||||||
|
|
|
|
|
|
|
| |||||||||
Total | $159,222,189 | $227,033,348 | $(425,477 | ) | $385,830,060 | |||||||||||
|
|
|
|
|
|
|
| |||||||||
Shares Outstanding | ||||||||||||||||
Class A | 1,958,451 | 17,556,844 | 336,403 | (b) | 19,851,698 | (b) | ||||||||||
Class B | N/A | 104,319 | — | 104,319 | ||||||||||||
Class C | N/A | 2,523,656 | — | 2,523,656 | ||||||||||||
Class C1 | 142,109 | N/A | (142,109 | )(b) | N/A | |||||||||||
Class I | 11,483,629 | 1,039,208 | 1,071,339 | (b) | 13,594,176 | (b) | ||||||||||
|
|
|
|
|
|
|
| |||||||||
Total | 13,584,189 | 21,224,027 | 1,265,633 | 36,073,849 | ||||||||||||
|
|
|
|
|
|
|
| |||||||||
25
| Acquired Fund | Acquiring Fund | Pro Forma Adjustments | Pro Forma Combined Fund | |||||||||||
Net Asset Value Per Share | ||||||||||||||
Class A | $11.72 | $10.70 | $10.70 | |||||||||||
Class B | N/A | $10.71 | $10.71 | |||||||||||
Class C | N/A | $10.68 | $10.68 | |||||||||||
Class C1 | $11.69 | N/A | N/A | |||||||||||
Class I | $11.72 | $10.70 | $10.69 | |||||||||||
Shares Authorized | ||||||||||||||
Class A | 2 billion | Unlimited | Unlimited | |||||||||||
Class B | N/A | Unlimited | Unlimited | |||||||||||
Class C | N/A | Unlimited | Unlimited | |||||||||||
Class C1 | 2 billion | N/A | N/A | |||||||||||
Class I | 2 billion | Unlimited | Unlimited | |||||||||||
| (a) | Figures reflect the costs associated with the proposed Reorganization, estimated to be approximately $126,000, of which $102,000 will be charged to the Acquired Fund and $24,000 will be charged to the Acquiring Fund if the Reorganization is approved. To the extent that payment of these expenses would cause the Acquired Fund to exceed its expense cap, Nuveen will reimburse the portion of the expenses necessary for the Fund to operate within the cap. Based on current expense levels, it is anticipated that Nuveen will reimburse the $102,000 that would be borne by the Acquired Fund. The $24,000 attributable to the Acquiring Fund would be allocated among the Acquiring Fund’s share classes based on relative net assets. Furthermore, figures assume the Acquired Fund distributes its undistributed net investment income of $318,138 and accumulated net realized gains of $83,339 to its shareholders prior to the Reorganization. |
| (b) | Figures reflect the issuance by the Acquiring Fund of approximately 2,139,993 Class A shares, 154,860 Class A shares and 12,554,968 Class I shares to Class A, Class C1 and Class I shareholders, respectively, of the Acquired Fund in connection with the proposed Reorganization. |
Certain legal matters concerning the issuance of Class A and Class I shares of the Acquiring Fund will be passed on by Vedder Price P.C., and the federal income tax consequences of the Reorganization will be passed on by Vedder Price P.C., 222 North LaSalle Street, Chicago, Illinois 60601.
Information Filed with the Securities and Exchange Commission
This Proxy Statement/Prospectus and the related Statement of Additional Information do not contain all the information set forth in the registration statements and the exhibits relating thereto and the annual and semi-annual reports which the Funds have filed with the SEC pursuant to the requirements of the Securities Act of 1933, as amended, and the 1940 Act, to which reference is hereby made. The SEC file number for the registration statement containing the current Prospectus and Statement of Additional Information for the Acquired Fund is Registration No. 811-05309 and the SEC file number for the registration statement containing the current Prospectus and Statement of Additional Information for the Acquiring Fund is Registration No. 811-07751. Such Prospectuses and Statements of Additional Information relating to the Funds are incorporated herein by reference.
26
THE BOARD’S APPROVAL OF THE REORGANIZATION
Based on the considerations described below, the Board of each Fund has determined that the Reorganization would be in the best interests of each Fund and that the interests of each Fund’s existing shareholders would not be diluted as a result of the Reorganization. The Board has approved the Reorganization and recommends that the Acquired Fund shareholders vote in favor of the Reorganization.
In preparation for the meeting of the Board held on September 20, 2011 (the “Meeting”) at which the Reorganization was considered, the Adviser provided the Board with information regarding the proposed Reorganization, including the rationale therefor and alternatives considered to the Reorganization of the Funds. Prior to approving the Reorganization, the independent board members reviewed the foregoing information with their independent legal counsel and with management, reviewed with independent legal counsel applicable law and their duties in considering such matters, and met with independent legal counsel in a private session without management present. In approving the Reorganization, the Board considered a number of principal factors in reaching its determination, including the following:
| • | the similarities and differences in the Funds’ investment objectives and principal investment strategies; |
| • | the Funds’ relative risks; |
| • | the Funds’ relative sizes; |
| • | the relative investment performance of the Funds and portfolio managers; |
| • | the relative fees and expense ratios of the Funds, including caps on the Funds’ expenses agreed to by the Adviser; |
| • | the anticipated tax-free nature of the Reorganization; |
| • | the expected costs of the Reorganization and the extent to which the Funds would bear any such costs; |
| • | the terms of the Reorganization and whether the Reorganization would dilute the interests of shareholders of the Funds; |
| • | the effect of the Reorganization on shareholder services and shareholder rights; |
| • | alternatives to the Reorganization; and |
| • | any potential benefits of the Reorganization to the Adviser and its affiliates as a result of the Reorganization. |
Investment Similarities and Differences
Based on the information presented, the Board noted that the investment objectives of the Funds were similar. In this regard, the investment objective of the Acquiring Fund is to provide as high a level of current interest income exempt from regular federal, Missouri state and in some cases,
27
Missouri local income taxes as is consistent with preservation of capital. The investment objective of the Acquired Fund is to provide maximum current income that is exempt from both federal income tax and Missouri state income tax to the extent consistent with prudent investment risk. The Board further noted that the principal investment strategies of the Acquired Fund and Acquiring Fund appear similar, subject to certain differences. Under normal market conditions, the Acquiring Fund invests at least 80% of its net assets in municipal bonds that pay interest that is exempt from regular federal and Missouri personal income tax, and the Acquired Fund invests at least 80% of its net assets (plus the amount of any borrowings for investment purposes) in municipal securities that pay interest that is exempt from federal and Missouri income tax. Three principal distinctions in their investment strategies, however, include (a) the Acquiring Fund invests in inverse floaters as a principal investment strategy and the Acquired Fund may invest in inverse floaters, but not as a principal investment strategy, (b) the Acquiring Fund has no limit on investments in bonds that may be subject to the federal alternative minimum tax (“AMT bonds”), whereas the Acquired Fund may not invest more than 20% of its net assets in taxable obligations, including AMT bonds, and (c) the Acquiring Fund operates as a diversified fund and the Acquired Fund operates as a non-diversified fund.
The Board noted that because the Funds’ investment strategies are similar, the principal risks of investing in the Funds are also similar, subject to certain differences, including the following. As noted above, the Acquiring Fund is subject to leverage securities risk because it invests in inverse floaters to produce effective leverage as part of a principal investment strategy. The Acquired Fund may also invest in inverse floaters, but it is not a principal investment strategy for the Fund. In addition, because the Acquiring Fund has no limit on investments in AMT bonds, the Acquiring Fund may generate more income that is subject to the federal alternative minimum tax than the Acquired Fund. Further, although the Acquiring Fund is a diversified fund, the Acquired Fund is non-diversified and subject to non-diversification risk.
The Board noted that the Acquiring Fund is significantly larger than the Acquired Fund and that combining the Funds should provide additional benefits to shareholders of both Funds as fixed operating expenses of the Acquiring Fund following the Reorganization will be spread over a larger asset base. The Adviser further believes that the Acquiring Fund may experience trading efficiencies when purchasing bonds in the market due to the size of the Acquiring Fund following the Reorganization. The Reorganization may therefore lower the total expense ratio borne by shareholders of the Funds as noted in more detail below.
Investment Performance and Portfolio Managers
The Board considered the investment performance of each Fund over various periods. In reviewing past performance, the Board observed that until recently, the Funds were managed by different portfolio managers. The current portfolio manager of the Funds has managed or co-managed the Acquired Fund since December 2002 but has managed the Acquiring Fund since January 2011. The Acquiring Fund also has had multiple portfolio managers during the past ten years so past performance of that Fund is not of a single manager. The Board noted that the Acquiring Fund outperformed the Acquired Fund over the ten-year period ended June 30, 2011 but underperformed over such one-, three- and five-year periods. The Board also considered the differences in yields between the Acquiring Fund and Acquired Fund noting that the SEC, embedded and distribution yields
28
of the Acquiring Fund were higher than those of the Acquired Fund as of June 30, 2011. In addition, the Board noted that the estimated SEC yield of the Acquiring Fund following the Reorganization was above the SEC yield average for its Lipper category although slightly lower than its SEC yield as of June 30, 2011. The Board also considered the factors that caused the differences in the yields, including differences in credit quality, sector allocation and leverage.
The Board considered the fees and expense ratios of each class of the Funds (including estimated expenses of the Acquiring Fund following the Reorganization) and the impact of expense caps, if any. The Board noted that the management fees of the Acquiring Fund are lower than for the Acquired Fund. In addition, the Board considered the estimated net expense of each class of the Acquiring Fund following the Reorganization. In this regard, the Board noted that the proposed Reorganization is expected to result in a decrease in gross and net expenses for all share classes of both funds. With respect to Class C1 shares of the Acquired Fund, the Board noted that under the Reorganization, Class C1 shareholders, which are subject to distribution and service fees of 0.65% would be receiving Class A shares of the Acquiring Fund, which are subject to distribution and service fees of 0.20%. The Class C1 shareholders of the Acquired Fund therefore would experience a significant decrease in net and gross expenses as Class A shareholders of the Acquiring Fund.
The Board also considered any expense limitation agreements for the Funds. The Board noted that the Acquired Fund has a temporary expense cap for its shares, whereas the Acquiring Fund does not have an expense cap.
The Board also recognized that the management fees for the Funds are comprised of fund-level and complex-level fees. Pursuant to the complex-wide fee arrangement, the fees of funds in the Nuveen complex are reduced as assets in the fund complex reach certain levels. The complex-wide fee arrangement seeks to provide the benefits of economies of scale to fund shareholders when total fund complex assets increase, even if assets of a particular fund are unchanged or decrease. The complex-level fees are lower for the Acquiring Fund than for the Acquired Fund because when the Acquired Fund became part of the Nuveen complex, a portion of Acquired Fund’s assets were deemed ineligible for purposes of calculating the effective complex-wide fee rate, whereas none of the assets of the Acquiring Fund are ineligible. After the Reorganization, a portion of the assets of the Acquired Fund will retain their “ineligible asset” status for purposes of calculating the complex-wide level fee. Accordingly, the combined fund will participate in complex-wide fee savings to a slightly lesser degree than the Acquiring Fund since a percentage of the combined fund’s assets will be excluded from the complex-wide fee calculation. However, the impact of excluding these assets is not expected to be significant and, as noted, the management fees of the Acquiring Fund are estimated to remain the same following the Reorganization.
Tax Consequences of the Reorganization
The Board noted that the Reorganization will be structured with the intention that it qualify as a tax-free reorganization for federal income tax purposes. The Board further recognized that with fund reorganizations, applicable tax laws could impose limits on the amount of capital loss carryforwards that an acquiring fund may use in any one year. The Board noted that this negative potential tax consequence is not anticipated to be a concern in this case because the Acquired Fund had no capital loss carryforwards. The Board further noted that there may be some gains or losses resulting from portfolio realignment related to the Reorganization.
29
The Board considered the projected cost savings in net expenses of each Fund following the Reorganization. The Board considered that the costs of the Reorganization would be allocated between the Funds ratably up to the respective Fund’s projected cost savings during the first year following the Reorganization (subject to expense cap limitations) with Nuveen absorbing the remaining Reorganization costs. Based on current expense limitations, it is anticipated that the Acquiring Fund would absorb the costs allocated to it and Nuveen would absorb the remaining costs. If the Reorganization is not ultimately completed, Nuveen will bear all costs of the proposed Reorganization.
The terms of the Reorganization are intended to avoid dilution of the interests of the shareholders of the Funds. In this regard, shareholders of Class A and Class I shares of the Acquired Fund will receive the same class of shares in the Acquiring Fund equal in value to the shares of the respective class of the Acquired Fund held. As noted above, shareholders of Class C1 shares of the Acquired Fund will receive Class A shares in the Acquiring Fund equal in value to the Class C1 shares of the Acquired Fund held.
Effect on Shareholder Services and Shareholder Rights
The Board noted that it was anticipated that the services provided to shareholders generally would not change, except to the extent services differed because the Funds have different transfer agents. In this regard, the eligible exchange options for Acquired Fund shareholders will change as a result of the change in the Fund’s transfer agent. Shareholders of Class A and Class I shares of the Acquired Fund will receive the same class of shares as they held in the Acquiring Fund, which are subject to the same distribution and service fees. Shareholders of Class C1 shares of the Acquired Fund will receive Class A shares of the Acquiring Fund, which are subject to lower distribution and service fees.
The Board also considered that the Acquired Fund is a series of a Maryland corporation, whereas the Acquiring Fund is a series of a Massachusetts business trust. As a result, the rights of shareholders between the Funds differ. In this regard, Acquired Fund shareholders’ rights will be slightly diminished after the Reorganization. Notwithstanding the foregoing, the principal attributes of a share in each Fund are comparable as a share in both Funds is entitled to one vote per share held and fractional votes for fractional shares held.
Alternatives to the Reorganization
The Board could have decided to continue the two Funds in their present form managed by the same portfolio manager or to liquidate one of the overlapping Funds, but did not believe either alternative would be in the best interests of shareholders. The Board recognized that continuing to offer two very similar overlapping Funds may cause confusion among the distribution network and sales team and dilute their selling efforts. As a result, one or both Funds may be unable to continue to grow assets, potentially increasing investor overall expenses if assets decrease. With the proposed Reorganization, Nuveen’s distribution and marketing efforts can focus on one fund. The shareholders of both Funds can therefore benefit from the potential of greater sales and economies of scale that could be achieved in one combined fund rather than diluted between two very similar Funds. The Board also could have decided to liquidate a Fund; however, the Board did not believe this option was in the best interests of shareholders of the liquidating fund as liquidation is a taxable event which could
30
result in the realization of taxable capital gains at both the Fund, and depending on the shareholders’ cost basis, the shareholder level. Further, shareholders of the non-liquidating or acquiring fund would be prevented from experiencing the benefits provided by an increase in assets.
Potential Benefits to Nuveen Fund Advisors and Affiliates
The Board recognized that the Reorganization may result in some benefits and economies for the Adviser and its affiliates. These may include, for example, a reduction in the level of operational expenses incurred for administrative, compliance and portfolio management services as a result of the elimination of the Acquired Fund as a separate Fund in the Nuveen complex. The Board, however, noted that it was anticipated based on pro-forma projections that the dollar amount of management fees earned from the Acquiring Fund after the Reorganization would be less than the dollar amount of fees earned if the Funds continued to operate separately. In addition, it is expected that Nuveen will bear some of the costs of the Reorganization.
The Board, including the independent board members, approved the Reorganization, concluding that the Reorganization is in the best interests of both Funds and that the interests of existing shareholders of the Funds will not be diluted as a result of the Reorganization.
The following tables set forth the percentage of ownership of each person who, as of December 20, 2011, the record date with respect to the Special Meeting, owns of record, or is known by the Funds to own of record or beneficially, 5% or more of any class of shares of either Fund. The tables also set forth the estimated percentage of shares of the combined fund that would have been owned by such parties if the Reorganization had occurred on December 20, 2011. These amounts may differ on the Closing Date. Shareholders who have the power to vote a larger percentage of shares (at least 25% of the voting shares) of a Fund can control the Fund and determine the outcome of a shareholder meeting.
| Acquired Fund | ||||||
| Class | Name and Address of Owner | Percentage of Ownership | Estimated Pro Forma Percentage of Ownership of the Combined Fund After the Reorganization | |||
Class Shares | . % | . % | ||||
| Acquiring Fund | ||||||
| Class | Name and Address of Owner | Percentage of Ownership | Estimated Pro Forma Percentage of Ownership of the Combined Fund After the Reorganization | |||
Class Shares | . % | . % | ||||
31
[At the close of business on December 20, 2011, there were Class A shares, Class C1 shares and Class I shares of the Acquired Fund outstanding. As of December 20, 2011, the board members and officers of the Acquired Fund as a group owned less than 1% of the total outstanding shares of the Acquired Fund and as a group owned less than 1% of each class of shares of the Acquired Fund.
At the close of business on December 20, 2011, there were Class A shares, Class B shares, Class C shares and Class I shares of the Acquiring Fund outstanding. As of December 20, 2011, the board members and officers of the Acquiring Fund as a group owned less than 1% of the total outstanding shares of the Acquiring Fund and as a group owned less than 1% of each class of shares of the Acquiring Fund.]
The Funds generally do not hold annual shareholders’ meetings, but will hold special meetings as required or deemed desirable. Because the Funds do not hold regular meetings of shareholders, the anticipated date of the next shareholder meeting cannot be provided. To be considered for inclusion in the proxy statement for any meeting of shareholders, a shareholder proposal must be submitted a reasonable time before the proxy statement for the meeting is mailed. Whether a proposal is included in the proxy statement will be determined in accordance with applicable federal and state laws. The timely submission of a proposal does not guarantee its inclusion. Shareholders wishing to submit proposals for inclusion in a proxy statement for a shareholder meeting should send their written proposal to the respective Fund at 333 West Wacker Drive, Chicago, Illinois 60606.
Shareholders who want to communicate with the Board or any individual board member should write to their Fund, to the attention of Lorna Ferguson, Manager of Fund Board Relations, Nuveen Investments, 333 West Wacker Drive, Chicago, Illinois 60606. The letter should indicate that you are a Fund shareholder, and identify the Fund (or Funds). If the communication is intended for a specific board member and so indicates, it will be sent only to that board member. If a communication does not indicate a specific board member, it will be sent to the chair of the nominating and governance committee and to the Board’s independent legal counsel for further distribution as deemed appropriate by such persons.
Proxy Statement/Prospectus Delivery
Please note that only one Proxy Statement/Prospectus may be delivered to two or more shareholders of the Acquired Fund who share an address, unless the Fund has received instructions to the contrary. To request a separate copy of the Proxy Statement/Prospectus, or for instructions as to how to request a separate copy of such document or as to how to request a single copy if multiple copies of such document are received, shareholders should contact the Acquired Fund at 333 West Wacker Drive, Chicago, Illinois 60606 or by calling (800) 257-8787.
32
VOTING INFORMATION AND REQUIREMENTS
Holders of shares of the Acquired Fund are entitled to one vote per share on matters as to which they are entitled to vote, with fractional shares voting proportionally.
Approval of the Reorganization will require the affirmative vote of the holders of a majority of the total number of shares outstanding and entitled to vote of the Acquired Fund.
Each valid proxy given by a shareholder of the Acquired Fund will be voted by the persons named in the proxy in accordance with the instructions marked thereon and as the persons named in the proxy may determine on such other business as may come before the Special Meeting on which shareholders are entitled to vote. If no designation is made, the proxy will be voted by the persons named in the proxy, as recommended by the Board, “FOR” approval of the Reorganization. Abstentions and broker non-votes (i.e., shares held by brokers or nominees, typically in “street name,” as to which (i) instructions have not been received from beneficial owners or persons entitled to vote and (ii) the broker or nominee does not have discretionary voting power on a particular matter) count as present for purposes of determining quorum but do not count as votes “FOR” the proposal and have the same effect as a vote “AGAINST” the proposal. The presence in person or by proxy of the holders of ten percent (10%) of the shares of the Acquired Fund issued and outstanding and entitled to vote at the Special Meeting shall constitute a quorum for the transaction of any business. Abstentions and broker non-votes will be deemed present for quorum purposes.
Shareholders who execute proxies may revoke them at any time before they are voted by filing with the Acquired Fund a written notice of revocation, by delivering a duly executed proxy bearing a later date, or by attending the Special Meeting and voting in person. The giving of a proxy will not affect your right to vote in person if you attend the Special Meeting and wish to do so.
It is not anticipated that any action will be asked of the shareholders of the Acquired Fund other than as indicated above, but if other matters are properly brought before the Special Meeting, it is intended that the persons named in the proxy will vote in accordance with their judgment.
If a quorum is not obtained or if a quorum is present but sufficient votes in favor of a proposal are not received by the scheduled time of the Special Meeting, the holders of a majority of shares present in person or by proxy and entitled to vote shall have the power to adjourn the Special Meeting to permit further solicitation of proxies. The Special Meeting may be adjourned without notice other than announcement at the Special Meeting for not more than 120 days after the Record Date for the Special Meeting. At such adjourned meeting at which the requisite shares entitled to vote thereat shall be represented, any business may be transacted which could have been transacted at the meeting as originally notified. Prior to being convened, the Special Meeting may be postponed for not more than 120 days after the Record Date for the Special Meeting.
Proxies of shareholders of the Acquired Fund are solicited by the Board. Additional solicitation may be made by mail, telephone, telegraph or personal interview by representatives of the Adviser or Nuveen, or by dealers or their representatives.
, 2012
Please sign and return your proxy promptly.
Your vote is important and your participation
in the affairs of your Fund does make a difference.
33
AGREEMENT AND PLAN OF REORGANIZATION
THIS AGREEMENT AND PLAN OF REORGANIZATION (the “Agreement”) is made as of this day of , 2011 by Nuveen Multistate Trust IV, a Massachusetts business trust (the “Trust”), on behalf of Nuveen Missouri Municipal Bond Fund, a series of the Trust (the “Acquiring Fund”), and Nuveen Investment Funds, Inc., a Maryland corporation (the “Corporation”), on behalf of Nuveen Missouri Tax Free Fund, a series of the Corporation (the “Acquired Fund” and, together with the Acquiring Fund, the “Funds”), and Nuveen Fund Advisors, Inc., the investment adviser to the Funds (the “Adviser”) (for purposes of Section 9.1 of the Agreement only).
This Agreement is intended to be, and is adopted as, a plan of reorganization within the meaning of Section 368 of the Internal Revenue Code of 1986, as amended (the “Code”), and the Treasury Regulations promulgated thereunder. The reorganization will consist of: (i) the transfer of all the assets of the Acquired Fund to the Acquiring Fund in exchange solely for Class A and Class I voting shares of beneficial interest, par value $0.01 per share, of the Acquiring Fund (“Acquiring Fund Shares”) and the assumption by the Acquiring Fund of all the liabilities of the Acquired Fund; and (ii) the pro rata distribution of all the Acquiring Fund Shares to the shareholders of each corresponding class of the Acquired Fund, in complete liquidation and termination of the Acquired Fund as provided herein, all upon the terms and conditions set forth in this Agreement (the “Reorganization”). The foregoing will be effected pursuant to this Agreement and to an amendment to the Corporation’s Amended and Restated Articles of Incorporation (“Articles of Incorporation”) in substantially the form attached hereto as Exhibit A (the “Amendment”) to be adopted in accordance with the Maryland General Corporation Law.
WHEREAS, the Acquired Fund is a separate series of the Corporation and the Acquiring Fund is a separate series of the Trust, and the Corporation and the Trust are each an open-end, management investment company registered under the Investment Company Act of 1940, as amended (the “1940 Act”), and the Acquired Fund owns securities that generally are assets of the character in which the Acquiring Fund is permitted to invest;
WHEREAS, the Acquiring Fund is authorized to issue the Acquiring Fund Shares; and
WHEREAS, the Board of Directors of the Corporation (the “Acquired Fund Board”) and the Board of Trustees of the Trust (the “Acquiring Fund Board”) have made the determinations required by Rule 17a-8 under the 1940 Act with respect to the Acquired Fund and Acquiring Fund, respectively.
NOW, THEREFORE, in consideration of the premises and of the covenants and agreements hereinafter set forth, the parties hereto covenant and agree as follows:
ARTICLE I
TRANSFER OF ASSETS OF THE ACQUIRED FUND IN EXCHANGE FOR
ACQUIRING FUND SHARES AND THE ASSUMPTION OF THE ACQUIRED FUND LIABILITIES AND TERMINATION AND LIQUIDATION OF THE ACQUIRED FUND
1.1 THE EXCHANGE. Subject to the terms and conditions contained herein and on the basis of the representations and warranties contained herein, the Acquired Fund agrees to transfer all of
I-1
its assets, as set forth in Section 1.2, to the Acquiring Fund. In consideration therefor, the Acquiring Fund agrees: (i) to deliver to the Acquired Fund the number of full and fractional Class A and Class I Acquiring Fund Shares, computed in the manner set forth in Section 2.3 herein; and (ii) to assume all the liabilities of the Acquired Fund, as set forth in Section 1.3. All Acquiring Fund Shares delivered to the Acquired Fund shall be delivered at net asset value without a sales load, commission or other similar fee being imposed. In the event that Class A shares of the Acquiring Fund are transferred in the Reorganization to former holders of Class A shares of the Acquired Fund with respect to which the front-end sales charge was waived due to a purchase of $1 million or more, the Acquiring Fund agrees that in determining whether a deferred sales charge is payable upon the sale of such Class A shares of the Acquiring Fund it shall give credit for the period during which the holder thereof held such Acquired Fund shares. Such transactions shall take place at the closing provided for in Section 3.1 (the “Closing”).
1.2 ASSETS TO BE TRANSFERRED. The Acquired Fund shall transfer all of its assets to the Acquiring Fund, including, without limitation, all cash, securities, commodities, interests in futures, dividends or interest receivables owned by the Acquired Fund and any deferred or prepaid expenses shown as an asset on the books of the Acquired Fund on the Closing Date as such term is defined in Section 3.1.
The Acquired Fund will, within a reasonable period of time before the Closing Date, furnish the Acquiring Fund with a list of the Acquired Fund’s portfolio securities and other investments. The Acquiring Fund will, within a reasonable period of time before the Closing Date, furnish the Acquired Fund with a list of the securities, if any, on the Acquired Fund’s list referred to above that do not conform to the Acquiring Fund’s investment objective, policies, and restrictions. The Acquired Fund, if requested by the Acquiring Fund, will dispose of securities on the Acquiring Fund’s list before the Closing Date. In addition, if it is determined that the portfolios of the Acquired Fund and the Acquiring Fund, when aggregated, would contain investments exceeding certain percentage limitations imposed upon the Acquiring Fund with respect to such investments, the Acquired Fund, if requested by the Acquiring Fund, will dispose of a sufficient amount of such investments as may be necessary to avoid violating such limitations as of the Closing Date. Notwithstanding the foregoing, nothing herein will require the Acquired Fund to dispose of any investments or securities if, in the reasonable judgment of the Acquired Fund Board or the Adviser, such disposition would adversely affect the status of the Reorganization as a “reorganization” as such term is used in the Code or would otherwise not be in the best interests of the Acquired Fund.
1.3 LIABILITIES TO BE ASSUMED. The Acquired Fund will endeavor to discharge all of its known liabilities and obligations to the extent possible before the Closing Date. Notwithstanding the foregoing, any liabilities not so discharged shall be assumed by the Acquiring Fund, which assumed liabilities shall include all of the Acquired Fund’s liabilities, debts, obligations, and duties of whatever kind or nature, whether absolute, accrued, contingent, or otherwise, whether or not arising in the ordinary course of business, whether or not determinable at the Closing Date, and whether or not specifically referred to in this Agreement.
1.4 LIQUIDATING DISTRIBUTION. As of the Effective Time, the Acquired Fund will make a liquidating distribution of the Acquiring Fund Shares received pursuant to Section 1.1 to its shareholders of record with respect to each class of shares, determined as of the close of business on the Closing Date, as such term is defined in Section 3.1 (the “Acquired Fund Shareholders”), on a pro rata basis within each class, (i) Acquiring Fund Class A Shares to Acquired Fund Class A
I-2
Shareholders, (ii) Acquiring Fund Class A Shares to Acquired Fund Class C1 Shareholders, and (iii) Acquiring Fund Class I Shares to Acquired Fund Class I Shareholders. Such distribution will be accomplished with respect to each class of shares of the Acquired Fund by the transfer of the Acquiring Fund Shares of the corresponding class then credited to the account of the Acquired Fund on the books of the Acquiring Fund to open accounts on the share records of the Acquiring Fund in the names of Acquired Fund Shareholders of such class. The Acquiring Fund shall not issue certificates representing Acquiring Fund Shares in connection with such transfer. As of the Effective Time, all issued and outstanding shares of the Acquired Fund shall be cancelled on the books of the Acquired Fund and retired.
1.5 OWNERSHIP OF SHARES. Ownership of Acquiring Fund Shares will be shown on the books of the Acquiring Fund’s transfer agent. Acquiring Fund Shares will be issued simultaneously to the Acquired Fund, in an amount computed in the manner set forth in Section 2.3.
1.6 TRANSFER TAXES. Any transfer taxes payable upon the issuance of Acquiring Fund Shares in a name other than the registered holder of the Acquired Fund shares on the books of the Acquired Fund as of that time shall, as a condition of such issuance and transfer, be paid by the person to whom such Acquiring Fund Shares are to be issued and transferred.
1.7 LIQUIDATION AND TERMINATION. The Acquired Fund shall completely liquidate and be dissolved, terminated and have its affairs wound up in accordance with Maryland state law, promptly following the Closing Date and the making of all distributions pursuant to Section 1.4, but in no event later than 12 months following the Closing Date.
1.8 BOARD REPORTING. Any reporting responsibility of the Acquired Fund including, without limitation, the responsibility for filing of regulatory reports, tax returns or other documents with the Securities and Exchange Commission (the “Commission”), any state securities commission and any federal, state or local tax authorities or any other relevant regulatory authority, is and shall remain the responsibility of the Acquired Fund.
1.9 BOOKS AND RECORDS. All books and records of the Acquired Fund, including all books and records required to be maintained under the 1940 Act, and the rules and regulations thereunder, shall be available to the Acquiring Fund from and after the Closing Date and shall be turned over to the Acquiring Fund as soon as practicable following the Closing Date.
ARTICLE II
VALUATION
2.1 VALUATION OF ASSETS. The value of the Acquired Fund’s assets and liabilities shall be computed as of the close of regular trading on the New York Stock Exchange (“NYSE”) on the Closing Date (such time and date being hereinafter called the “Valuation Time”), using the valuation procedures set forth in the Acquiring Fund’s Prospectus and Statement of Additional Information (in effect as of the Closing Date) or such other valuation procedures as shall be mutually agreed upon by the parties.
2.2 VALUATION OF SHARES. The net asset value per share per class of Acquiring Fund Shares shall be the net asset value per share for such class computed as of the Valuation Time, using the valuation procedures set forth in Section 2.1.
I-3
2.3 SHARES TO BE ISSUED. The number of Acquiring Fund Shares to be issued (including fractional shares, if any) in consideration for the net assets as described in Article I, shall be determined with respect to each class by dividing the value of the assets net of liabilities with respect to each class of shares of the Acquired Fund determined in accordance with Section 2.1 by the net asset value of an Acquiring Fund share of the corresponding class determined in accordance with Section 2.2.
2.4 EFFECT OF SUSPENSION IN TRADING. In the event that on the Closing Date, either: (a) the NYSE or another primary exchange on which the portfolio securities of the Acquiring Fund or the Acquired Fund are purchased or sold shall be closed to trading or trading on such exchange shall be restricted; or (b) trading or the reporting of trading on the NYSE or elsewhere shall be disrupted so that accurate appraisal of the value of the net assets of the Acquiring Fund or the Acquired Fund is impracticable, the Closing Date shall be postponed until the first business day when trading is fully resumed and reporting is restored.
ARTICLE III
CLOSING AND CLOSING DATE
3.1 CLOSING DATE. The Closing shall occur on , 2012 or such other date as the parties may agree (the “Closing Date”). Unless otherwise provided, all acts taking place at the Closing shall be deemed to take place as of immediately after the Valuation Time on the Closing Date (the “Effective Time”). The Closing shall be held as of the close of business at the offices of Vedder Price P.C. in Chicago, Illinois or at such other time and/or place as the parties may agree.
3.2 CUSTODIAN’S CERTIFICATE. The Acquired Fund shall cause U.S. Bank National Association, as custodian for the Acquired Fund (the “Custodian”), to deliver to the Acquiring Fund at the Closing a certificate of an authorized officer stating that: (a) the Acquired Fund’s portfolio securities, cash, and any other assets shall have been delivered in proper form to the Acquiring Fund on the Closing Date; and (b) all necessary taxes, including all applicable federal and state stock transfer stamps, if any, shall have been paid, or provision for payment shall have been made, in conjunction with the delivery of portfolio securities by the Acquired Fund.
3.3 TRANSFER AGENT’S CERTIFICATE. The Acquired Fund shall cause U.S. Bancorp Fund Services, LLC as transfer agent for the Acquired Fund, to deliver to the Acquiring Fund at the Closing a certificate of an authorized officer stating that its records contain the names and addresses of all the Class A, Class C1 and Class I Acquired Fund Shareholders, and the number and percentage ownership of outstanding shares per class owned by each such shareholder immediately prior to the Closing. The Acquiring Fund shall issue and deliver or cause Boston Financial Data Services, Inc., its transfer agent, to issue and deliver to the Acquired Fund a confirmation evidencing the Class A and Class I Acquiring Fund Shares to be credited on the Closing Date to the Secretary of the Corporation or provide evidence satisfactory to the Acquired Fund that such Acquiring Fund Shares have been credited to the Acquired Fund’s account on the books of the Acquiring Fund.
3.4 DELIVERY OF ADDITIONAL ITEMS. At the Closing, each party shall deliver to the other such bills of sale, checks, assignments, share certificates, receipts and other documents, if any, as such other party or its counsel may reasonably request to effect the transactions contemplated by this Agreement.
I-4
ARTICLE IV
REPRESENTATIONS AND WARRANTIES
4.1 REPRESENTATIONS OF THE ACQUIRED FUND. The Corporation, on behalf of the Acquired Fund, represents and warrants as follows:
(a) The Corporation is a corporation duly organized, validly existing and in good standing under the laws of the State of Maryland.
(b) The Acquired Fund is a separate series of the Corporation duly authorized in accordance with the applicable provisions of the Corporation’s Articles of Incorporation.
(c) The Corporation is registered as an open-end management investment company under the 1940 Act, and such registration is in full force and effect.
(d) The Acquired Fund is not, and the execution, delivery, and performance of this Agreement (subject to shareholder approval) will not result, in the violation of any provision of the Corporation’s Articles of Incorporation or By-Laws or of any material agreement, indenture, instrument, contract, lease, or other undertaking to which the Acquired Fund is a party or by which it is bound.
(e) Except as otherwise disclosed in writing to and accepted by the Acquiring Fund, the Acquired Fund has no material contracts or other commitments that will be terminated with liability to it before the Closing Date.
(f) No litigation, administrative proceeding, or investigation of or before any court or governmental body is presently pending or to its knowledge threatened against the Acquired Fund or any of its properties or assets, which, if adversely determined, would materially and adversely affect its financial condition, the conduct of its business, or the ability of the Acquired Fund to carry out the transactions contemplated by this Agreement. The Acquired Fund knows of no facts that might form the basis for the institution of such proceedings and is not a party to or subject to the provisions of any order, decree, or judgment of any court or governmental body that materially and adversely affects its business or its ability to consummate the transactions contemplated herein.
(g) The financial statements of the Acquired Fund as of May 31, 2011, and for the eleven-month period then ended have been prepared in accordance with generally accepted accounting principles, and such statements (copies of which have been furnished to the Acquiring Fund) fairly reflect the financial condition of the Acquired Fund as of May 31, 2011, and there are no known contingent liabilities of the Acquired Fund as of such date that are not disclosed in such statements.
(h) Since the date of the financial statements referred to in subsection (g) above, there have been no material adverse changes in the Acquired Fund’s financial condition, assets, liabilities or business (other than changes occurring in the ordinary course of business) and there are no known contingent liabilities of the Acquired Fund arising after such date. For the purposes of this subsection (h), a decline in the net asset value of the Acquired Fund shall not constitute a material adverse change.
I-5
(i) All federal, state, local and other tax returns and reports of the Acquired Fund required by law to be filed by it (taking into account permitted extensions for filing) have been timely filed and are complete and correct in all material respects. All federal, state, local and other taxes of the Acquired Fund required to be paid (whether or not shown on any such return or report) have been paid, or provision shall have been made for the payment thereof and any such unpaid taxes are properly reflected on the financial statements referred to in subsection (g) above. To the best of the Acquired Fund’s knowledge, no tax authority is currently auditing or preparing to audit the Acquired Fund, and no assessment for taxes, interest, additions to tax or penalties has been asserted against the Acquired Fund.
(j) All issued and outstanding shares of the Acquired Fund are, and as of the Closing Date will be, duly and validly issued and outstanding, fully paid and non-assessable by the Acquired Fund. All the issued and outstanding shares of the Acquired Fund will, at the time of the Closing, be held by the persons and in the amounts set forth in the records of the Acquired Fund’s transfer agent as provided in Section 3.3. The Acquired Fund has no outstanding options, warrants or other rights to subscribe for or purchase any shares of the Acquired Fund, and has no outstanding securities convertible into shares of the Acquired Fund.
(k) At the Closing, the Acquired Fund will have good and marketable title to the Acquired Fund’s assets to be transferred to the Acquiring Fund pursuant to Section 1.2, and full right, power, and authority to sell, assign, transfer, and deliver such assets, and the Acquiring Fund will acquire good and marketable title thereto, subject to no restrictions on the full transfer thereof, including such restrictions as might arise under the Securities Act of 1933, as amended (the “1933 Act”), except those restrictions as to which the Acquiring Fund has received notice and necessary documentation at or prior to the Closing.
(l) The execution, delivery and performance of this Agreement have been duly authorized by all necessary action on the part of the Acquired Fund including the determinations of the Acquired Fund Board required by Rule 17a-8(a) of the 1940 Act. Subject to approval by the Acquired Fund shareholders, this Agreement constitutes a valid and binding obligation of the Acquired Fund, enforceable in accordance with its terms, subject as to enforcement, to bankruptcy, insolvency, reorganization, moratorium, and other laws relating to or affecting creditors’ rights and to general equity principles.
(m) The information to be furnished by the Acquired Fund for use in no-action letters, applications for orders, registration statements, proxy materials and other documents that may be necessary in connection with the transactions contemplated herein shall be accurate and complete in all material respects and shall comply in all material respects with federal securities and other laws and regulations.
(n) From the effective date of the Registration Statement (as defined in Section 5.7), through the time of the meeting of the Acquired Fund shareholders and on the Closing Date, any written information furnished by the Corporation with respect to the Acquired Fund for use in the Proxy Materials (as defined in Section 5.7), or any other materials provided in connection with the Reorganization, does not and will not contain any untrue statement of a material fact or omit to state a material fact required to be stated or necessary to make the statements, in light of the circumstances under which such statements were made, not misleading.
I-6
(o) For each taxable year of its operations (including the taxable year ending on the Closing Date), the Acquired Fund has been treated as a separate corporation for federal income tax purposes pursuant to Section 851(g) of the Code, has met the requirements of Subchapter M of the Code for qualification as a regulated investment company and has elected to be treated as such, has been eligible to compute and has computed its federal income tax under Section 852 of the Code, and will have distributed on or prior to the Closing Date all its investment company taxable income (determined without regard to the deduction for dividends paid), the excess of its interest income excludable from gross income under Section 103(a) of the Code over its deductions disallowed under Sections 265 and 171(a)(2) of the Code, and its net capital gain (as such terms are defined in the Code) that has accrued or will accrue on or prior to the Closing Date.
4.2 REPRESENTATIONS OF THE ACQUIRING FUND. The Trust, on behalf of the Acquiring Fund, represents and warrants as follows:
(a) The Trust is a business trust duly organized, validly existing and in good standing under the laws of the Commonwealth of Massachusetts.
(b) The Acquiring Fund is a separate series of the Trust duly authorized in accordance with the applicable provisions of the Trust’s Declaration of Trust, as amended (“Declaration of Trust”).
(c) The Trust is registered as an open-end management investment company under the 1940 Act, and such registration is in full force and effect.
(d) The Acquiring Fund is not, and the execution, delivery and performance of this Agreement will not result, in a violation of the Trust’s Declaration of Trust or By-Laws or of any material agreement, indenture, instrument, contract, lease, or other undertaking to which the Acquiring Fund is a party or by which it is bound.
(e) No litigation, administrative proceeding or investigation of or before any court or governmental body is presently pending or to its knowledge threatened against the Acquiring Fund or any of its properties or assets, which, if adversely determined, would materially and adversely affect its financial condition, the conduct of its business or the ability of the Acquiring Fund to carry out the transactions contemplated by this Agreement. The Acquiring Fund knows of no facts that might form the basis for the institution of such proceedings and it is not a party to or subject to the provisions of any order, decree, or judgment of any court or governmental body that materially and adversely affects its business or its ability to consummate the transaction contemplated herein.
(f) The financial statements of the Acquiring Fund as of May 31, 2011 and for the fiscal year then ended have been prepared in accordance with generally accepted accounting principles and have been audited by independent auditors, and such statements (copies of which have been furnished to the Acquired Fund) fairly reflect the financial condition of the Acquiring Fund as of May 31, 2011, and there are no known contingent liabilities of the Acquiring Fund as of such date that are not disclosed in such statements.
(g) Since the date of the financial statements referred to in subsection (f) above, there have been no material adverse changes in the Acquiring Fund’s financial condition, assets, liabilities or business (other than changes occurring in the ordinary course of business) and there are no known contingent liabilities of the Acquiring Fund arising after such date. For the purposes of this subsection (g), a decline in the net asset value of the Acquiring Fund shall not constitute a material adverse change.
I-7
(h) All federal, state, local and other tax returns and reports of the Acquiring Fund required by law to be filed by it (taking into account permitted extensions for filing) have been timely filed and are complete and correct in all material respects. All federal, state, local and other taxes of the Acquiring Fund required to be paid (whether or not shown on any such return or report) have been paid or provision shall have been made for their payment and any such unpaid taxes are properly reflected on the financial statements referred to in subsection (f) above. To the best of the Acquiring Fund’s knowledge, no tax authority is currently auditing or preparing to audit the Acquiring Fund, and no assessment for taxes, interest, additions to tax or penalties has been asserted against the Acquiring Fund.
(i) All issued and outstanding shares of the Acquiring Fund are, and, as of the Closing Date will be, duly and validly issued and outstanding, fully paid and non-assessable by the Acquiring Fund (recognizing that under Massachusetts law, Acquiring Fund shareholders, under certain circumstances, could be held personally liable for the obligations of the Acquiring Fund). The Acquiring Fund has no outstanding options, warrants, or other rights to subscribe for or purchase shares of the Acquiring Fund, and there are no outstanding securities convertible into shares of the Acquiring Fund.
(j) The execution, delivery and performance of this Agreement have been duly authorized by all necessary action on the part of the Acquiring Fund, including the determination of the Acquiring Fund Board required pursuant to Rule 17a-8(a) of the 1940 Act. This Agreement constitutes a valid and binding obligation of the Acquiring Fund, enforceable in accordance with its terms, subject as to enforcement, to bankruptcy, insolvency, reorganization, moratorium, and other laws relating to or affecting creditors’ rights and to general equity principles.
(k) The Acquiring Fund Shares to be issued and delivered to the Acquired Fund for the account of the Acquired Fund Shareholders pursuant to the terms of this Agreement will, at the Closing Date, have been duly authorized. When so issued and delivered, such shares will be duly and validly issued shares of the Acquiring Fund, and will be fully paid and non-assessable.
(l) The information to be furnished by the Acquiring Fund for use in no-action letters, applications for orders, registration statements, proxy materials, and other documents that may be necessary in connection with the transactions contemplated herein shall be accurate and complete in all material respects and shall comply in all material respects with federal securities and other laws and regulations.
(m) From the effective date of the Registration Statement (as defined in Section 5.7), through the time of the meeting of the Acquired Fund shareholders and on the Closing Date, any written information furnished by the Trust with respect to the Acquiring Fund for use in the Proxy Materials (as defined in Section 5.7), or any other materials provided in connection with the Reorganization, does not and will not contain any untrue statement of a material fact or omit to state a material fact required to be stated or necessary to make the statements, in light of the circumstances under which such statements were made, not misleading.
(n) For each taxable year of its operation, the Acquiring Fund has been treated as a separate corporation for federal income tax purposes pursuant to Section 851(g) of the Code, has met the requirements of Subchapter M of the Code for qualification as a regulated investment company and has elected to be treated as such, has been eligible to compute and has computed its federal income tax under Section 852 of the Code. In addition, the Acquiring Fund will satisfy each of the foregoing with respect to its taxable year that includes the Closing Date.
I-8
(o) The Acquiring Fund agrees to use all reasonable efforts to obtain the approvals and authorizations required by the 1933 Act, the 1940 Act, and any state securities laws as it may deem appropriate in order to continue its operations after the Closing Date.
ARTICLE V
COVENANTS OF THE FUNDS
5.1 OPERATION IN ORDINARY COURSE. Subject to Sections 1.2 and 8.5, each of the Acquiring Fund and the Acquired Fund will operate its respective business in the ordinary course between the date of this Agreement and the Closing Date, it being understood that such ordinary course of business will include customary dividends and distributions, any other distribution necessary or desirable to avoid federal income or excise taxes, and shareholder purchases and redemptions.
5.2 APPROVAL OF SHAREHOLDERS. The Corporation will call a special meeting of the Acquired Fund shareholders to consider and act upon this Agreement (or transactions contemplated thereby) and to take all other appropriate action necessary to obtain approval of the transactions contemplated herein.
5.3 INVESTMENT REPRESENTATION. The Acquired Fund covenants that the Acquiring Fund Shares to be issued pursuant to this Agreement are not being acquired for the purpose of making any distribution, other than in connection with the Reorganization and in accordance with the terms of this Agreement.
5.4 ADDITIONAL INFORMATION. The Acquired Fund will assist the Acquiring Fund in obtaining such information as the Acquiring Fund reasonably requests concerning the beneficial ownership of the Acquired Fund’s shares.
5.5 FURTHER ACTION. Subject to the provisions of this Agreement, each Fund will take or cause to be taken, all action, and do or cause to be done, all things reasonably necessary, proper or advisable to consummate and make effective the transactions contemplated by this Agreement, including any actions required to be taken after the Closing Date.
5.6 STATEMENT OF EARNINGS AND PROFITS. As promptly as practicable, but in any case within 60 days after the Closing Date, the Acquired Fund shall furnish the Acquiring Fund, in such form as is reasonably satisfactory to the Acquiring Fund and which shall be certified by the Corporation’s Controller or Treasurer, a statement of the earnings and profits of the Acquired Fund for federal income tax purposes, as well as any net operating loss carryovers and capital loss carryovers, that will be carried over to the Acquiring Fund pursuant to Section 381 of the Code.
5.7 PREPARATION OF REGISTRATION STATEMENT AND PROXY MATERIALS. The Trust will prepare and file with the Commission a registration statement on Form N-14 relating to the Acquiring Fund Shares to be issued to the Acquired Fund Shareholders (the “Registration Statement”). The Registration Statement shall include a proxy statement of the Acquired Fund and a prospectus of the Acquiring Fund relating to the transaction contemplated by this Agreement. The Registration Statement shall be in compliance with the 1933 Act, the Securities Exchange Act of 1934, as amended (the “1934 Act”), and the 1940 Act, as applicable. Each party will provide the other party with the materials and information necessary to prepare the proxy statement
I-9
and related materials (the “Proxy Materials”), for inclusion therein, in connection with the meeting of the Acquired Fund’s shareholders to consider the approval of this Agreement and the transactions contemplated herein.
5.8 TAX STATUS OF REORGANIZATION. The intention of the parties is that the Reorganization will qualify as a reorganization within the meaning of Section 368(a) of the Code. None of the Acquired Fund, the Corporation, the Acquiring Fund or the Trust shall take any action, or cause any action to be taken (including, without limitation, the filing of any tax return), that is inconsistent with such treatment or results in the failure of the transaction to qualify as a reorganization within the meaning of Section 368(a) of the Code. At or prior to the Closing Date, the Acquired Fund, the Corporation, the Acquiring Fund and the Trust will take such action, or cause such action to be taken, as is reasonably necessary to enable counsel to render the tax opinion contemplated herein in Section 8.9.
ARTICLE VI
CONDITION PRECEDENT TO OBLIGATIONS OF THE ACQUIRED FUND
The obligations of the Acquired Fund to consummate the transactions provided for herein shall be subject to the following condition:
6.1 All representations, covenants, and warranties of the Acquiring Fund contained in this Agreement shall be true and correct in all material respects as of the date hereof and as of the Closing Date, with the same force and effect as if made on and as of the Closing Date. The Acquiring Fund shall have delivered to the Acquired Fund a certificate executed in the Acquiring Fund’s name by the Trust’s President or Vice President and its Controller, in form and substance satisfactory to the Acquired Fund and dated as of the Closing Date, to such effect and as to such other matters as the Acquired Fund shall reasonably request.
ARTICLE VII
CONDITIONS PRECEDENT TO OBLIGATIONS OF THE ACQUIRING FUND
The obligations of the Acquiring Fund to consummate the transactions provided for herein shall be subject to the following conditions:
7.1 All representations, covenants, and warranties of the Acquired Fund contained in this Agreement shall be true and correct in all material respects as of the date hereof and as of the Closing Date, with the same force and effect as if made on and as of the Closing Date. The Acquired Fund shall have delivered to the Acquiring Fund on the Closing Date a certificate executed in the Acquired Fund’s name by the Corporation’s President or Vice President and the Controller or Treasurer, in form and substance satisfactory to the Acquiring Fund and dated as of the Closing Date, to such effect and as to such other matters as the Acquiring Fund shall reasonably request.
7.2 The Acquired Fund shall have delivered to the Acquiring Fund a statement of the Acquired Fund’s assets and liabilities, together with a list of the Acquired Fund’s portfolio securities showing the tax basis of such securities by lot and the holding periods of such securities, as of the Closing Date, certified by the Controller or Treasurer of the Corporation.
I-10
ARTICLE VIII
FURTHER CONDITIONS PRECEDENT
The obligations of the Acquired Fund and the Acquiring Fund hereunder shall also be subject to the following:
8.1 This Agreement and the transactions contemplated herein, with respect to the Acquired Fund, shall have been approved by the requisite vote of the holders of the outstanding shares of the Acquired Fund in accordance with applicable law and the provisions of the Corporation’s Articles of Incorporation and By-Laws. Notwithstanding anything herein to the contrary, neither the Acquiring Fund nor the Acquired Fund may waive the conditions set forth in this Section 8.1.
8.2 On the Closing Date, the Commission shall not have issued an unfavorable report under Section 25(b) of the 1940 Act, or instituted any proceeding seeking to enjoin the consummation of the transactions contemplated by this Agreement under Section 25(c) of the 1940 Act. Furthermore, no action, suit or other proceeding shall be threatened or pending before any court or governmental agency in which it is sought to restrain or prohibit, or obtain damages or other relief in connection with this Agreement or the transactions contemplated herein.
8.3 All required consents of other parties and all other consents, orders, and permits of federal, state and local regulatory authorities (including those of the Commission and of state securities authorities, including any necessary “no-action” positions and exemptive orders from such federal and state authorities) to permit consummation of the transactions contemplated herein shall have been obtained.
8.4 The Registration Statement shall have become effective under the 1933 Act, and no stop orders suspending the effectiveness thereof shall have been issued. To the best knowledge of the parties to this Agreement, no investigation or proceeding for that purpose shall have been instituted or be pending, threatened or contemplated under the 1933 Act.
8.5 The Acquired Fund shall have declared and paid a dividend or dividends which, together with all previous such dividends, shall have the effect of distributing to its shareholders all of the Acquired Fund’s investment company taxable income for all taxable periods ending on or before the Closing Date (computed without regard to any deduction for dividends paid), if any, plus the excess of its interest income excludible from gross income under Section 103(a) of the Code, if any, over its deductions disallowed under Sections 265 and 171(a)(2) of the Code for all taxable periods ending on or before the Closing Date and all of its net capital gains realized in all taxable periods ending on or before the Closing Date (after reduction for any available capital loss carry forward).
8.6 The Acquired Fund shall have delivered to the Acquiring Fund on the Closing Date a certificate executed in its name by the Corporation’s President or Senior Vice President, in a form reasonably satisfactory to the Acquiring Fund and dated as of the Closing Date, to the effect that the representations and warranties of the Corporation, on behalf of the Acquired Fund, made in this Agreement are true and correct on and as of the Closing Date and as to such other matters as the Acquiring Fund shall reasonably request. The Acquiring Fund shall have delivered to the Acquired Fund on the Closing Date a certificate executed in its name by the Trust’s President or Senior Vice President, in a form reasonably satisfactory to the Acquired Fund and dated as of the Closing Date, to the effect that the representations and warranties of the Trust, on behalf of the Acquiring Fund, made in this Agreement are true and correct on and as of the Closing Date and as to such other matters as the Acquired Fund shall reasonably request.
I-11
8.7 The Acquiring Fund shall have received on the Closing Date an opinion from counsel, dated as of the Closing Date, substantially to the effect that:
(a) The Corporation is a corporation validly existing and in good standing under the laws of the State of Maryland.
(b) The Agreement has been duly authorized, executed and delivered by the Corporation, on behalf of the Acquired Fund, and constitutes a valid and legally binding obligation of the Corporation, on behalf of the Acquired Fund, enforceable in accordance with its terms.
(c) The execution and delivery of the Agreement by the Corporation, on behalf of the Acquired Fund, did not, and the exchange of the Acquired Fund’s assets for Acquiring Fund Shares pursuant to the Agreement will not, violate the Corporation’s Articles of Incorporation or By-Laws.
(d) To the knowledge of such counsel, and without any independent investigation, (i) the Corporation is registered as an investment company with the Commission and is not subject to any stop order; and (ii) all regulatory consents, authorizations, approvals or filings required to be obtained or made by the Acquired Fund under the federal laws of the United States of America or the laws of the State of Maryland for the transfer of the Acquired Fund’s assets and liabilities for Acquiring Fund Shares pursuant to the Agreement have been obtained or made.
8.8 The Acquired Fund shall have received on the Closing Date an opinion from counsel, dated as of the Closing Date, substantially to the effect that:
(a) The Trust is a validly existing voluntary association with transferable shares of beneficial interest under the laws of the Commonwealth of Massachusetts.
(b) The Agreement has been duly authorized, executed and delivered by the Trust, on behalf of the Acquiring Fund, and constitutes a valid and legally binding obligation of the Trust, on behalf of the Acquiring Fund, enforceable in accordance with its terms.
(c) The execution and delivery of the Agreement by the Trust, on behalf of the Acquiring Fund, did not, and the issuance of Acquiring Fund Shares pursuant to the Agreement will not, violate the Trust’s Declaration of Trust or By-Laws.
(d) To the knowledge of such counsel, and without any independent investigation, (i) the Trust is registered as an investment company with the Commission and is not subject to any stop order; and (ii) all regulatory consents, authorizations, approvals or filings required to be obtained or made by the Acquiring Fund under the federal laws of the United States of America or the laws of the Commonwealth of Massachusetts for the issuance of Acquiring Fund Shares pursuant to the Agreement have been obtained or made.
8.9 The Funds shall have received an opinion of Vedder Price P.C. addressed to the Acquiring Fund and the Acquired Fund substantially to the effect that for federal income tax purposes:
(a) The transfer of all the Acquired Fund’s assets to the Acquiring Fund in exchange solely for Acquiring Fund Shares and the assumption by the Acquiring Fund of all the liabilities of the Acquired Fund followed by the pro rata distribution to the Acquired Fund Shareholders of all the Acquiring Fund Shares received by the Acquired Fund in complete liquidation of the Acquired Fund
I-12
will constitute a “reorganization” within the meaning of Section 368(a) of the Code and the Acquiring Fund and the Acquired Fund will each be a “party to a reorganization,” within the meaning of Section 368(b) of the Code, with respect to the Reorganization.
(b) No gain or loss will be recognized by the Acquiring Fund upon the receipt of all the assets of the Acquired Fund solely in exchange for Acquiring Fund Shares and the assumption by the Acquiring Fund of all the liabilities of the Acquired Fund.
(c) No gain or loss will be recognized by the Acquired Fund upon the transfer of all the Acquired Fund’s assets to the Acquiring Fund solely in exchange for Acquiring Fund Shares and the assumption by the Acquiring Fund of all the liabilities of the Acquired Fund or upon the distribution (whether actual or constructive) of such Acquiring Fund Shares to the Acquired Fund Shareholders solely in exchange for such shareholders’ shares of the Acquired Fund in complete liquidation of the Acquired Fund.
(d) No gain or loss will be recognized by the Acquired Fund Shareholders upon the exchange of their Acquired Fund shares solely for Acquiring Fund Shares in the Reorganization.
(e) The aggregate basis of the Acquiring Fund Shares received by each Acquired Fund Shareholder pursuant to the Reorganization will be the same as the aggregate basis of the Acquired Fund shares exchanged therefor by such shareholder. The holding period of the Acquiring Fund Shares received by each Acquired Fund Shareholder will include the period during which the Acquired Fund shares exchanged therefor were held by such shareholder, provided such Acquired Fund shares are held as capital assets at the time of the Reorganization.
(f) The basis of the Acquired Fund’s assets transferred to the Acquiring Fund will be the same as the basis of such assets to the Acquired Fund immediately before the Reorganization. The holding period of the assets of the Acquired Fund in the hands of the Acquiring Fund will include the period during which those assets were held by the Acquired Fund.
No opinion will be expressed as to (1) the effect of the Reorganization on (A) the Acquired Fund or the Acquiring Fund with respect to any asset as to which any unrealized gain or loss is required to be recognized for federal income tax purposes at the end of a taxable year (or on the termination thereof) under a mark-to-market system of accounting, (B) any Acquired Fund shareholder that is required to recognize unrealized gains and losses for federal income tax purposes under a mark-to-market system of accounting, or (C) the Acquired Fund or the Acquiring Fund with respect to any stock held in a passive foreign investment company as defined in Section 1297(a) of the Code or (2) any other federal tax issues (except those set forth above) and all state, local or foreign tax issues of any kind.
Such opinion shall be based on customary assumptions and such representations as Vedder Price P.C. may reasonably request of the Funds, and the Acquired Fund and the Acquiring Fund will cooperate to make and certify the accuracy of such representations. Notwithstanding anything herein to the contrary, neither the Acquiring Fund nor the Acquired Fund may waive the conditions set forth in this Section 8.9.
I-13
ARTICLE IX
EXPENSES
9.1 Each of Acquired Fund and Acquiring Fund will pay expenses incurred in connection with the Reorganization based on its portion of the projected annual costs savings during the first year following the Reorganization. Reorganization expenses include, without limitation: (a) expenses associated with the preparation and filing of the Registration Statement and other Proxy Materials; (b) postage; (c) printing; (d) accounting fees; (e) legal fees incurred by each Fund; (f) solicitation costs of the transaction; and (g) other related administrative or operational costs. To the extent that the payment of Reorganization expenses would cause the Acquired Fund or the Acquiring Fund to exceed its expense cap then in effect, the Adviser or an affiliate will reimburse the portion of expenses necessary for the Fund to operate within its cap. The Adviser or an affiliate will pay the expenses incurred in connection with the Reorganization to the extent such expenses exceed the projected cost savings. If the Reorganization is not consummated, the Adviser or an affiliate will bear the expenses incurred in connection with the Reorganization.
9.2 Each party represents and warrants to the other that there is no person or entity entitled to receive any broker’s fees or similar fees or commission payments in connection with the transactions provided for herein.
9.3 Notwithstanding the foregoing, expenses will in any event be paid by the party directly incurring such expenses if and to the extent that the payment by the other party of such expenses would result in the disqualification of the Acquired Fund or the Acquiring Fund, as the case may be, as a regulated investment company within the meaning of Section 851 of the Code.
ARTICLE X
ENTIRE AGREEMENT; SURVIVAL OF WARRANTIES
10.1 The parties agree that no party has made to the other parties any representation, warranty and/or covenant not set forth herein, and that this Agreement constitutes the entire agreement between and among the parties.
10.2 The representations, warranties, and covenants contained in this Agreement or in any document delivered pursuant to or in connection with this Agreement shall not survive the consummation of the transactions contemplated hereunder.
ARTICLE XI
TERMINATION
11.1 This Agreement may be terminated by the mutual agreement of the parties and such termination may be effected by the Corporation’s President or Vice President and the Trust’s President or Vice President without further action by the Acquired Fund Board or Acquiring Fund Board. In addition, either Fund may at its option terminate this Agreement at or before the Closing Date due to:
(a) a breach by any other party of any representation, warranty, or agreement contained herein to be performed at or before the Closing Date, if not cured within 30 days;
(b) a condition precedent to the obligations of the terminating party that has not been met and it reasonably appears that it will not or cannot be met; or
I-14
(c) a determination by the Acquired Fund Board or Acquiring Fund Board that the consummation of the transactions contemplated herein is not in the best interests of the Acquired Fund or Acquiring Fund, respectively.
11.2 In the event of any such termination, in the absence of willful default, there shall be no liability for damages on the part of the Corporation, the Directors, the Acquired Fund, the Trust, the Trustees, the Acquiring Fund, the Adviser, or the Corporation’s, Trust’s or Adviser’s officers.
ARTICLE XII
AMENDMENTS
12.1 This Agreement may be amended, modified, or supplemented in such manner as may be mutually agreed upon in writing by the officers of the Corporation and officers of the Trust as specifically authorized by the Acquired Fund Board or Acquiring Fund Board; provided, however, that following the meeting of the Acquired Fund shareholders called by the Acquired Fund pursuant to Section 5.2 of this Agreement, no such amendment may have the effect of changing the provisions for determining the number of Acquiring Fund Shares to be issued to the Acquired Fund Shareholders under this Agreement to the detriment of such shareholders without their further approval.
ARTICLE XIII
HEADINGS; COUNTERPARTS; GOVERNING LAW; ASSIGNMENT;
LIMITATION OF LIABILITY
13.1 The article and section headings contained in this Agreement are for reference purposes only and shall not affect in any way the meaning or interpretation of this Agreement.
13.2 This Agreement may be executed in any number of counterparts, each of which shall be deemed an original.
13.3 This Agreement shall be governed by and construed in accordance with the laws of the Commonwealth of Massachusetts.
13.4 This Agreement shall bind and inure to the benefit of the parties hereto and their respective successors and assigns, but, except as provided in this section, no assignment or transfer hereof or of any rights or obligations hereunder shall be made by any party without the written consent of the other parties. Nothing herein expressed or implied is intended or shall be construed to confer upon or give any person, firm, or corporation, other than the parties hereto and their respective successors and assigns, any rights or remedies under or by reason of this Agreement.
13.5 It is expressly agreed that the obligations of the Acquiring Fund hereunder shall not be binding upon any of the Trustees, shareholders, nominees, officers, agents, or employees of the Trust personally, but shall bind only the property of the Acquiring Fund, as provided in the Trust’s Declaration of Trust. The execution and delivery of this Agreement have been authorized by the Trustees of the Trust, on behalf of the Acquiring Fund, and signed by authorized officers of the Trust acting as such. Neither the authorization by such Trustees nor the execution and delivery by such officers shall be deemed to have been made by any of them individually or to impose any liability on any of them personally, but shall bind only the property of the Acquiring Fund as provided in the Trust’s Declaration of Trust.
[SIGNATURE PAGE FOLLOWS]
I-15
IN WITNESS WHEREOF, the parties have duly executed this Agreement, all as of the date first written above.
NUVEEN INVESTMENT FUNDS, INC., on behalf of Nuveen Missouri Tax Free Fund | ||
By: |
| |
Name: |
| |
Title: |
| |
ACKNOWLEDGED:
By: |
| |
Name: |
| |
Title: |
|
NUVEEN MULTISTATE TRUST IV, on behalf of Nuveen Missouri Municipal Bond Fund | ||
By: |
| |
Name: |
| |
Title: |
| |
ACKNOWLEDGED:
By: |
| |
Name: |
| |
Title: |
|
| The undersigned is a party to this Agreement for the purposes of Section 9.1 only: | ||
| NUVEEN FUND ADVISORS, INC., | ||
By: |
| |
Name: |
| |
Title: |
| |
ACKNOWLEDGED:
By: |
| |
Name: |
| |
Title: |
|
I-16
EXHIBIT A TO AGREEMENT AND PLAN OF REORGANIZATION
ARTICLES OF AMENDMENT
TO
AMENDED AND RESTATED ARTICLES OF INCORPORATION
OF
NUVEEN INVESTMENT FUNDS, INC.
The undersigned officer of Nuveen Investment Funds, Inc. (the “Corporation”), a Maryland corporation, hereby certifies that the following amendments to the Corporation’s Amended and Restated Articles of Incorporation have been advised by the Corporation’s Board of Directors and approved by the Corporation’s stockholders in the manner required by the Maryland General Corporation Law:
WHEREAS, the Corporation is registered as an open-end management investment company (i.e., a mutual fund) under the Investment Company Act of 1940 and offers its shares to the public in several classes (i.e., series), each of which represents a separate and distinct portfolio of assets;
WHEREAS, it is desirable and in the best interests of the holders of the Class AAA shares of the Corporation (also known as “Nuveen Missouri Tax Free Fund”) that the assets belonging to such class be transferred to Nuveen Missouri Municipal Bond Fund, a series of Nuveen Multistate Trust IV, a Massachusetts business trust, in exchange for Class A and Class I shares of Nuveen Missouri Municipal Bond Fund, which are to be delivered to former Nuveen Missouri Tax Free Fund holders;
WHEREAS, Nuveen Missouri Tax Free Fund and Nuveen Missouri Municipal Bond Fund have entered into an Agreement and Plan of Reorganization providing for the foregoing transactions; and
WHEREAS, in order to bind all holders of shares of Nuveen Missouri Tax Free Fund to the foregoing transactions and as set forth in the Agreement and Plan of Reorganization (the “Plan”), and in particular to bind such holders to the exchange of their shares of Nuveen Missouri Tax Free Fund for Class A and Class I shares of Nuveen Missouri Municipal Bond Fund shares, it is necessary to adopt an amendment to the Corporation’s Amended and Restated Articles of Incorporation.
NOW, THEREFORE, BE IT RESOLVED, that effective as of the Effective Time referred to below, the Corporation’s Amended and Restated Articles of Incorporation be, and the same hereby are, amended to add the following Article IV(AA) immediately following Article IV(Z) thereof:
Article IV(AA). (a) For purposes of this Article IV(AA), the following terms shall have the following meanings:
“Corporation” means this corporation.
“Acquired Fund” means the Corporation’s Nuveen Missouri Tax Free Fund, which is represented by the Corporation’s Class AAA shares.
A-1
“Class A Acquired Fund Shares” means the Corporation’s Class AAA Common Shares.
“Class C1 Acquired Fund Shares” means the Corporation’s Class AAA, Series 3 Common Shares.
“Class I Acquired Fund Shares” means the Corporation’s Class AAA, Series 2 Common Shares.
“Acquiring Fund” means Nuveen Missouri Municipal Bond Fund, which is a series of Nuveen Multistate Trust IV.
“Class A Acquiring Fund Shares” means Nuveen Missouri Municipal Bond Fund’s Class A Shares of Beneficial Interest.
“Class I Acquiring Funds Shares” means Nuveen Missouri Municipal Bond Fund’s Class I Shares of Beneficial Interest.
“Closing” means the occurrence of the transactions set forth in (b) and (c) below on the Closing Date.
“Closing Date” means .
“Effective Time” means immediately after the Valuation Time on the Closing Date.
“Valuation Time” means the close of regular trading on the New York Stock Exchange on the Closing Date.
(b) As of the Effective Time, the Acquired Fund will transfer all of its assets to the Acquiring Fund, including, without limitation, all cash, securities, commodities, interests in futures, dividends or interest receivables owned by the Acquired Fund and any deferred or prepaid expenses shown as an asset on the books of the Acquired Fund on the Closing Date.
(c) As of the Effective Time, the Acquiring Fund will: (i) deliver to the Acquired Fund the number of full and fractional Class A and Class I Acquiring Fund Shares, computed in the manner set forth in (d) below; and (ii) assume all the liabilities of the Acquired Fund not discharged by the Acquired Fund, which assumed liabilities shall include all of the Acquired Fund’s liabilities, debts, obligations, and duties of whatever kind or nature, whether absolute, accrued, contingent, or otherwise, whether or not arising in the ordinary course of business, whether or not determinable at the Closing Date, and whether or not specifically referred to in the Plan or herein.
(d) The number of Class A, Class A and Class I Acquiring Fund Shares to be delivered to holders of Class A Acquired Fund Shares, Class C1 Acquired Fund Shares and Class I Acquired Fund Shares, respectively, shall be determined as follows:
(i) Acquiring Fund Shares to be issued (including fractional shares, if any) in consideration for the Acquired Fund’s net assets as described (b) and (c) above, shall be determined with respect to Class A, Class C1 and Class I of the Acquired Fund Shares by dividing the value of the assets net of liabilities with respect to each such class of shares determined in accordance with (ii) below by the net asset value of an Acquiring Fund share of the corresponding class determined in accordance with (iii) below.
A-2
(ii) The value of the Acquired Fund’s assets and liabilities shall be computed as of the Valuation Time, using the valuation procedures set forth in the Acquiring Fund’s Prospectus and Statement of Additional Information (in effect as of the Closing Date) or such other valuation procedures as shall be mutually agreed upon by the parties.
(iii) As of the Effective Time, the Acquired Fund will distribute the Acquiring Fund Shares received pursuant to (c) above to its shareholders of record with respect to each class of shares, determined as of the close of business on the Closing Date (the “Acquired Fund Shareholders”), on a pro rata basis within each class, (A) Class A Acquiring Fund Shares to Class A Acquired Fund Shareholders, (B) Class A Acquiring Fund Shares to Class C1 Acquired Fund Shareholders, and (C) Class I Acquiring Fund Shares to Class I Acquired Fund Shareholders. Such distribution will be accomplished with respect to Class A, Class C1 and Class I Acquired Fund Shares by the transfer of the Acquiring Fund Shares of the corresponding class then credited to the account of the Acquired Fund on the books of the Acquiring Fund to open accounts on the share records of the Acquiring Fund in the names of Acquired Fund Shareholders of such class. The Acquiring Fund shall not issue certificates representing Acquiring Fund Shares in connection with such transfer. As of the Effective Time, all issued and outstanding shares of the Acquired Fund shall be cancelled on the books of the Acquired Fund and retired.
(iv) As soon as practicable after the Closing Date and the making of the foregoing distribution, the Acquired Fund will thereupon proceed to completely liquidate and be dissolved, terminated and have its affairs wound up in accordance with Maryland state law.
(e) From and after the Effective Time, the Acquired Fund shares cancelled and retired pursuant to paragraph (d)(iii) above shall have the status of authorized and unissued Class AAA common shares of the Corporation, without designation as to series.
The undersigned officer of the Corporation hereby acknowledges, in the name and on behalf of the Corporation, the foregoing Articles of Amendment to be the corporate act of the Corporation and further certifies that, to the best of his or her knowledge, information and belief, the matters and facts set forth therein with respect to the approval thereof are true in all material respects, under the penalties of perjury.
IN WITNESS WHEREOF, the Corporation has caused these Articles of Amendment to be signed in its name and on its behalf by its President or a Vice President and witnessed by its Secretary or an Assistant Secretary on [ ], 2012.
| NUVEEN INVESTMENT FUNDS, INC. | ||
| By: | ||
| [ ] | ||
| Its | Vice President | |
| Witness: |
| Secretary |
A-3
[FORM OF]
EVERY SHAREHOLDER’S VOTE IS IMPORTANT
| EASY VOTING OPTIONS: | ||||
| VOTE ON THE INTERNET Log on to: www.proxy-direct.com Follow the on-screen instructions available 24 hours | |||
VOTE BY PHONE Call 1-800-337-3503 Follow the recorded instructions available 24 hours | ||||
VOTE BY MAIL Vote, sign and date this Proxy Card and return in the postage-paid envelope | ||||
VOTE IN PERSON Attend Shareholder Meeting 333 West Wacker Dr. Chicago, IL 60606 on February 16, 2012 | ||||

Please detach at perforation before mailing.
| PROXY | PROXY | |||
NUVEEN MISSOURI TAX FREE FUND SPECIAL MEETING OF SHAREHOLDERS TO BE HELD ON FEBRUARY 16, 2012 |
THIS PROXY IS BEING SOLICITED BY THE BOARD OF TRUSTEES. The undersigned shareholder(s) of the Nuveen Missouri Tax Free Fund, revoking previous proxies, hereby appoints Kevin J. McCarthy, Kathleen Prudhomme and Christopher Rohrbacher, or any one of them true and lawful attorneys with power of substitution of each, to vote all shares of Nuveen Missouri Tax Free Fund which the undersigned is entitled to vote, at the Special Meeting of Shareholders to be held on February 16, 2012, at [2:00] p.m. Central time, at the offices of Nuveen Investments, 333 West Wacker Drive, Chicago, Illinois, 60606, and at any adjournment or postponement thereof as indicated on the reverse side. In their discretion, the proxy holders named above are authorized to vote upon such other matters as may properly come before the meeting.
Receipt of the Notice of the Special Meeting and the accompanying Proxy Statement/Prospectus is hereby acknowledged. The shares of Nuveen Missouri Tax Free Fund represented hereby will be voted as indicated or FOR the proposal if no choice is indicated.
VOTE VIA THE INTERNET: www.proxy-direct.com VOTE VIA THE TELEPHONE: 1-800-337-3503 | ||||
| ||||
Note: Please sign exactly as your name(s) appear(s) on this card. When signing as attorney, executor, administrator, trustee, guardian or as custodian for a minor, please sign your name and give your full title as such. If signing on behalf of a corporation, please sign the full corporate name and your name and indicate your title. If you are a partner signing for a partnership, please sign the partnership name, your name and indicate your title. Joint owners should each sign these instructions. Please sign, date and return. | ||||
| ||||
Signature and Title, if applicable | ||||
| ||||
Signature (if held jointly) | ||||
| ||||
Date | XXX_23114_111611 | |||
EVERY SHAREHOLDER’S VOTE IS IMPORTANT
Important Notice Regarding the Availability of Proxy Materials for the
Nuveen Missouri Tax Free Fund
Shareholders Meeting to Be Held on February 16, 2012.
The Proxy Statement and Proxy Card for this meeting are available at:
www.proxy-direct.com/nuv23206
IF YOU VOTE ON THE INTERNET OR BY TELEPHONE,
YOU NEED NOT RETURN THIS PROXY CARD
Please detach at perforation before mailing.
The Board of Trustees recommends a vote “FOR” the following proposal.
| TO VOTE, MARK BLOCKS BELOW IN BLUE OR BLACK INK. Example: | n | |||
| FOR | AGAINST | ABSTAIN | ||||||
1. | To approve an Agreement and Plan of Reorganization (and the related transactions) which provides for (i) the transfer of all the assets of Nuveen Missouri Tax Free Fund (the “Acquired Fund”) to Nuveen Missouri Municipal Bond Fund (the “Acquiring Fund”) in exchange solely for voting shares of beneficial interest of the Acquiring Fund and the assumption by the Acquiring Fund of all the liabilities of the Acquired Fund; and (ii) the distribution by the Acquired Fund of all the shares of each class of the Acquiring Fund to the holders of shares of the corresponding class of the Acquired Fund in complete liquidation and termination of the Acquired Fund (the “Reorganization”). A vote in favor of the Reorganization will be considered a vote in favor of an amendment to the Corporation’s Articles of Incorporation effecting the Reorganization. | ¨ | ¨ | ¨ | ||||
2. | To transact such other business as may properly come before the Special Meeting or any adjournment or postponement thereof.
| |||||||
PLEASE SIGN AND DATE ON THE REVERSE SIDE
XXX_23114_120911
Mutual Funds
Prospectus
September 30, 2011
Nuveen Municipal Bond Funds
Dependable, tax-free income because it’s not what you earn, it’s what you keep.®
| Class / Ticker Symbol | ||||||||
| Fund Name | Class A | Class B | Class C | Class I | ||||
Nuveen Kansas Municipal Bond Fund | FKSTX | FBKSX | FCKSX | FRKSX | ||||
Nuveen Kentucky Municipal Bond Fund | FKYTX | FKYBX | FKYCX | FKYRX | ||||
Nuveen Michigan Municipal Bond Fund | FMITX | FMIBX | FLMCX | NMMIX | ||||
Nuveen Missouri Municipal Bond Fund | FMOTX | FMMBX | FMOCX | FMMRX | ||||
Nuveen Ohio Municipal Bond Fund | FOHTX | FOHBX | FOHCX | NXOHX | ||||
Nuveen Wisconsin Municipal Bond Fund | FWIAX | FWIBX | FWICX | FWIRX | ||||
The Securities and Exchange Commission has not approved or disapproved these securities or passed upon the adequacy of this prospectus. Any representation to the contrary is a criminal offense.

| Section 1 Fund Summaries | ||||
| Nuveen Kansas Municipal Bond Fund | 2 | |||
| Nuveen Kentucky Municipal Bond Fund | 6 | |||
| Nuveen Michigan Municipal Bond Fund | 10 | |||
| Nuveen Missouri Municipal Bond Fund | 14 | |||
| Nuveen Ohio Municipal Bond Fund | 18 | |||
| Nuveen Wisconsin Municipal Bond Fund | 22 | |||
| Section 2 How We Manage Your Money | ||||
| Who Manages the Funds | 26 | |||
| More About Our Investment Strategies | 28 | |||
| How We Select Investments | 31 | |||
| What the Risks Are | 31 | |||
| Section 3 How You Can Buy and Sell Shares | ||||
| What Share Classes We Offer | 35 | |||
| How to Reduce Your Sales Charge | 37 | |||
| How to Buy Shares | 38 | |||
| Special Services | 40 | |||
| How to Sell Shares | 41 | |||
| Section 4 General Information | ||||
| Dividends, Distributions and Taxes | 44 | |||
| Distribution and Service Plans | 46 | |||
| Net Asset Value | 47 | |||
| Frequent Trading | 48 | |||
| Fund Service Providers | 49 | |||
| Section 5 Financial Highlights | 50 | |||
| Section 6 Glossary of Investment Terms | 56 | |||
NOT FDIC OR GOVERNMENT INSURED MAY LOSE VALUE NO BANK GUARANTEE
Nuveen Kansas Municipal Bond Fund
Investment Objective
The investment objective of the fund is to provide you with as high a level of current interest income exempt from regular federal, Kansas state and, in some cases, Kansas local income taxes as is consistent with preservation of capital.
Fees and Expenses of the Fund
This table describes the fees and expenses that you may pay if you buy and hold shares of the fund. You may qualify for sales charge discounts if you and your family invest, or agree to invest in the future, at least $50,000 in the fund or in other Nuveen Mutual Funds. More information about these and other discounts, as well as eligibility requirements for each share class, is available from your financial advisor and in “What Share Classes We Offer” on page 35 of the fund’s prospectus, “How to Reduce Your Sales Charge” on page 37 of the prospectus and “Purchase and Redemption of Fund Shares” on page S-53 of the fund’s statement of additional information.
Shareholder Fees
(fees paid directly from your investment)
| Class A | Class B | Class C | Class I | |||||||||||||
| Maximum Sales Charge (Load) Imposed on Purchases (as a percentage of offering price) | 4.20% | None | None | None | ||||||||||||
| Maximum Deferred Sales Charge (Load) (as a percentage of the lesser of purchase price or redemption proceeds) | None | 5.00% | 1.00% | None | ||||||||||||
| Maximum Sales Charge (Load) Imposed on Reinvested Dividends | None | None | None | None | ||||||||||||
| Exchange Fee | None | None | None | None | ||||||||||||
| Annual Low Balance Account Fee (for accounts under $1,000)1 | $15 | $15 | $15 | $15 | ||||||||||||
Annual Fund Operating Expenses
(expenses that you pay each year as a percentage of the value of your investment)
| Class A | Class B | Class C | Class I | |||||||||||||
| Management Fees | 0.53% | 0.53% | 0.53% | 0.53% | ||||||||||||
| Distribution and Service (12b-1) Fees | 0.20% | 0.95% | 0.75% | 0.00% | ||||||||||||
| Total Other Expenses: | 0.10% | 0.10% | 0.10% | 0.10% | ||||||||||||
Interest and Related Expenses from Inverse Floaters | 0.01% | 0.01% | 0.01% | 0.01% | ||||||||||||
Other Expenses | 0.09% | 0.09% | 0.09% | 0.09% | ||||||||||||
| Total Annual Fund Operating Expenses | 0.83% | 1.58% | 1.38% | 0.63% | ||||||||||||
| 1 | Fee applies to the following types of accounts held directly with the fund: accounts established pursuant to the Uniform Transfers to Minors Act (UTMA) or Uniform Gifts to Minors Act (UGMA). |
Example
The following example is intended to help you compare the cost of investing in the fund with the cost of investing in other mutual funds. The example assumes that you invest $10,000 in the fund for the time periods indicated and then either redeem or do not redeem your shares at the end of a period. The example also assumes that your investment has a 5% return each year and that the fund’s operating expenses remain the same. Although your actual costs may be higher or lower, based on these assumptions your costs would be:
| Redemption | No Redemption | |||||||||||||||||||||||||||||||||||
| A | B | C | I | A | B | C | I | |||||||||||||||||||||||||||||
| 1 Year | $ | 501 | $ | 561 | $ | 140 | $ | 64 | $ | 501 | $ | 161 | $ | 140 | $ | 64 | ||||||||||||||||||||
| 3 Years | $ | 674 | $ | 799 | $ | 437 | $ | 202 | $ | 674 | $ | 499 | $ | 437 | $ | 202 | ||||||||||||||||||||
| 5 Years | $ | 861 | $ | 960 | $ | 755 | $ | 351 | $ | 861 | $ | 860 | $ | 755 | $ | 351 | ||||||||||||||||||||
| 10 Years | $ | 1,402 | $ | 1,677 | $ | 1,657 | $ | 786 | $ | 1,402 | $ | 1,677 | $ | 1,657 | $ | 786 | ||||||||||||||||||||
Portfolio Turnover
The fund pays transaction costs, such as commissions, when it buys and sells securities (or “turns over” its portfolio). A higher portfolio turnover rate may indicate higher transaction costs and may result in higher taxes when fund shares
2
Section 1 Fund Summaries
are held in a taxable account. These costs, which are not reflected in annual fund operating expenses or in the example, affect the fund’s performance. During the most recent fiscal year, the fund’s portfolio turnover rate was 16% of the average value of its portfolio.
Principal Investment Strategies
Under normal market conditions, the fund invests at least 80% of its net assets in municipal bonds that pay interest that is exempt from regular federal and Kansas personal income tax. The fund invests at least 80% of its net assets in investment grade municipal bonds, which are those rated BBB/Baa or higher at the time of purchase by at least one independent rating agency, or, if unrated, judged by the fund’s sub-adviser to be of comparable quality. The fund may invest up to 20% of its net assets in below investment grade municipal bonds, commonly referred to as “high yield” or “junk” bonds. The fund may invest up to 15% of its net assets in municipal securities whose interest payments vary inversely with changes in short-term tax-exempt interest rates (“inverse floaters”). The fund’s sub-adviser uses a value-oriented strategy and looks for higher-yielding and undervalued long-term municipal bonds that offer above-average total return. The sub-adviser may choose to sell municipal bonds with deteriorating credit or limited upside potential compared to other available bonds.
Principal Risks
The price and yield of this fund will change daily due to changes in interest rates and other factors, which means you could lose money. An investment in the fund is not a deposit of a bank and is not insured or guaranteed by the Federal Deposit Insurance Corporation or any other governmental agency. The principal risks of investing in this fund are described below:
Alternative Minimum Tax Risk—The fund has no limit as to the amount that can be invested in alternative minimum tax bonds; therefore, all or a portion of the fund’s otherwise exempt-interest dividends may be taxable to those shareholders subject to the federal alternative minimum tax.
Call Risk—If an issuer calls higher-yielding bonds held by the fund, performance could be adversely impacted.
Credit Risk—Credit risk is the risk that an issuer of a municipal bond may be unable or unwilling to make interest and principal payments when due and the related risk that the value of a bond may decline because of concerns about the issuer’s ability or willingness to make such payments. In addition, parties to other financial contracts with the fund could default on their obligations.
High Yield Securities Risk—High yield securities generally are less liquid, have more volatile prices, and have greater credit risk than investment grade securities.
Income Risk—The fund’s income could decline during periods of falling interest rates. Also, if the fund invests in inverse floaters, the fund’s income may decrease if short-term interest rates rise.
Interest Rate Risk—Interest rate risk is the risk that the value of the fund’s portfolio will decline because of rising interest rates. Interest rate risk may be increased by the fund’s investment in inverse floaters because of the leveraged nature of these investments.
Inverse Floaters Risk—The use of inverse floaters by the fund creates effective leverage. Due to the leveraged nature of these investments, they will typically be more volatile and involve greater risk than the fixed rate municipal bonds underlying the inverse floaters. An investment in certain inverse floaters will involve the risk that the fund could lose more than its original principal investment. Distributions on inverse floaters bear an inverse relationship to short-term municipal bond interest rates. Thus, distributions paid to the fund on its inverse floaters will be reduced or even eliminated as short-term municipal interest rates rise and will increase when short-term municipal interest rates fall. Inverse floaters generally will underperform the market for fixed rate municipal bonds in a rising interest rate environment.
Market Risk—The market values of municipal bonds owned by the fund may decline, at times sharply and unpredictably.
Non-Diversification Risk—As a non-diversified fund, the fund may invest a larger portion of its assets in the securities of a limited number of issuers and may be more sensitive to any single economic, political or regulatory occurrence than a diversified fund.
Section 1 Fund Summaries
3
State Concentration Risk—Because the fund primarily purchases municipal bonds from Kansas, the fund is more susceptible to adverse economic, political or regulatory changes affecting municipal bond issuers in that state.
Fund Performance
The following bar chart and table provide some indication of the potential risks of investing in the fund. The fund’s past performance (before and after taxes) is not necessarily an indication of how the fund will perform in the future. Updated performance information is available at www.nuveen.com/MF/products/performancesummary.aspx or by calling (800) 257-8787.
The bar chart below shows the variability of the fund’s performance from year to year for Class A shares. The performance of the other share classes will differ due to their different expense structures. The bar chart and highest/lowest quarterly returns that follow do not reflect sales charges, and if these charges were reflected, the returns would be less than those shown.
Class A Annual Total Return*
| * | Class A year-to-date total return as of June 30, 2011 was 4.53%. |
During the ten-year period ended December 31, 2010, the fund’s highest and lowest quarterly returns were 6.77% and -4.35%, respectively, for the quarters ended March 31,2009 and December 31, 2010.
The table below shows the variability of the fund’s average annual returns and how they compare over the time periods indicated with those of broad measures of market performance and an index of funds with similar investment objectives. All after-tax returns are calculated using the historical highest individual federal marginal income tax rates and do not reflect the impact of state and local taxes. After-tax returns are shown for Class A shares only; after-tax returns for other share classes will vary. Your own actual after-tax returns will depend on your specific tax situation and may differ from what is shown here.
Both the bar chart and the table assume that all distributions have been reinvested. Performance reflects fee waivers, if any, in effect during the periods presented. If any such waivers were not in place, returns would be reduced.
| Average Annual Total Returns for the Periods Ended December 31, 2010 | ||||||||||||
| 1 Year | 5 Year | 10 Year | ||||||||||
| Class Returns Before Taxes: | ||||||||||||
Class A | (2.31 | )% | 2.61 | % | 3.95 | % | ||||||
Class B | (2.82 | )% | 2.54 | % | 3.78 | % | ||||||
Class C | 1.41 | % | 2.93 | % | 3.83 | % | ||||||
Class I | 2.16 | % | 3.71 | % | 4.61 | % | ||||||
| Class A Returns After Taxes: | ||||||||||||
On Distributions | (2.31 | )% | 2.60 | % | 3.95 | % | ||||||
On Distributions and Sales of Shares | (0.10 | )% | 2.82 | % | 4.01 | % | ||||||
4
Section 1 Fund Summaries
| Average Annual Total Returns for the Periods Ended December 31, 2010 | ||||||||||||
| 1 Year | 5 Year | 10 Year | ||||||||||
| Standard & Poor’s (S&P) National Municipal Bond Index (reflects no deduction for fees, expenses or taxes) | 2.45 | % | 3.83 | % | 4.82 | % | ||||||
| Standard & Poor’s (S&P) Kansas Municipal Bond Index (reflects no deduction for fees, expenses or taxes) | 3.80 | % | 4.19 | % | 5.03 | % | ||||||
| Lipper Peer Group (reflects no deduction for taxes or certain expenses) | 1.11 | % | 2.90 | % | 3.81 | % | ||||||
Management
Investment Adviser
Nuveen Fund Advisors, Inc.
Sub-Adviser
Nuveen Asset Management, LLC
Portfolio Manager
Name | Title | Portfolio Manager of Fund Since | ||
| Steven M. Hlavin | Vice President | January 2011 |
Purchase and Sale of Fund Shares
You may purchase, redeem or exchange shares of the fund on any business day, which is any day the New York Stock Exchange is open for business. You may purchase, redeem or exchange shares of the fund either through a financial advisor or other financial intermediary or directly from the fund. Class B shares are available only through exchanges and dividend reinvestments by current Class B shareholders. The fund’s initial and subsequent investment minimums generally are as follows, although the fund may reduce or waive the minimums in some cases:
| Class A and Class C | Class I | |||
| Eligibility and Minimum Initial Investment | $3,000 | Available only through fee-based programs and to other limited categories of investors as described in the prospectus.
$100,000 for all accounts except:
• $250 for clients of financial intermediaries and family offices that have accounts holding Class I shares with an aggregate value of at least $100,000 (or that are expected to reach this level).
• No minimum for certain other categories of eligible investors as described in the prospectus. | ||
| Minimum Additional Investment | $100 | No minimum. |
Tax Information
The fund intends to make distributions that are exempt from regular federal and Kansas state income tax. A portion of these distributions, however, may be subject to the federal alternative minimum tax.
Payments to Broker-Dealers and Other Financial Intermediaries
If you purchase shares of the fund through a broker-dealer or other financial intermediary (such as a bank or financial advisor), the fund, its distributor or its investment adviser may pay the intermediary for the sale of fund shares and related services. These payments may create a conflict of interest by influencing the broker-dealer or other financial intermediary and your salesperson to recommend the fund over another investment. Ask your financial advisor or visit your financial intermediary’s website for more information.
Section 1 Fund Summaries
5
Nuveen Kentucky Municipal Bond Fund
Investment Objective
The investment objective of the fund is to provide you with as high a level of current interest income exempt from regular federal, Kentucky state and, in some cases, Kentucky local income taxes as is consistent with preservation of capital.
Fees and Expenses of the Fund
This table describes the fees and expenses that you may pay if you buy and hold shares of the fund. You may qualify for sales charge discounts if you and your family invest, or agree to invest in the future, at least $50,000 in the fund or in other Nuveen Mutual Funds. More information about these and other discounts, as well as eligibility requirements for each share class, is available from your financial advisor and in “What Share Classes We Offer” on page 35 of the fund’s prospectus, “How to Reduce Your Sales Charge” on page 37 of the prospectus and “Purchase and Redemption of Fund Shares” on page S-53 of the fund’s statement of additional information.
Shareholder Fees
(fees paid directly from your investment)
| Class A | Class B | Class C | Class I | |||||||||||||
| Maximum Sales Charge (Load) Imposed on Purchases (as a percentage of offering price) | 4.20% | None | None | None | ||||||||||||
| Maximum Deferred Sales Charge (Load) (as a percentage of the lesser of purchase price or redemption proceeds) | None | 5.00% | 1.00% | None | ||||||||||||
| Maximum Sales Charge (Load) Imposed on Reinvested Dividends | None | None | None | None | ||||||||||||
| Exchange Fee | None | None | None | None | ||||||||||||
| Annual Low Balance Account Fee (for accounts under $1,000)1 | $15 | $15 | $15 | $15 | ||||||||||||
Annual Fund Operating Expenses
(expenses that you pay each year as a percentage of the value of your investment)
| Class A | Class B | Class C | Class I | |||||||||||||
| Management Fees | 0.52% | 0.52% | 0.52% | 0.52% | ||||||||||||
| Distribution and Service (12b-1) Fees | 0.20% | 0.95% | 0.75% | 0.00% | ||||||||||||
| Other Expenses | 0.08% | 0.08% | 0.08% | 0.08% | ||||||||||||
| Total Annual Fund Operating Expenses | 0.80% | 1.55% | 1.35% | 0.60% | ||||||||||||
| 1 | Fee applies to the following types of accounts held directly with the fund: accounts established pursuant to the Uniform Transfers to Minors Act (UTMA) or Uniform Gifts to Minors Act (UGMA). |
Example
The following example is intended to help you compare the cost of investing in the fund with the cost of investing in other mutual funds. The example assumes that you invest $10,000 in the fund for the time periods indicated and then either redeem or do not redeem your shares at the end of a period. The example also assumes that your investment has a 5% return each year and that the fund’s operating expenses remain the same. Although your actual costs may be higher or lower, based on these assumptions your costs would be:
| Redemption | No Redemption | |||||||||||||||||||||||||||||||||||
| A | B | C | I | A | B | C | I | |||||||||||||||||||||||||||||
| 1 Year | $ | 498 | $ | 558 | $ | 137 | $ | 61 | $ | 498 | $ | 158 | $ | 137 | $ | 61 | ||||||||||||||||||||
| 3 Years | $ | 665 | $ | 790 | $ | 428 | $ | 192 | $ | 665 | $ | 490 | $ | 428 | $ | 192 | ||||||||||||||||||||
| 5 Years | $ | 846 | $ | 945 | $ | 739 | $ | 335 | $ | 846 | $ | 845 | $ | 739 | $ | 335 | ||||||||||||||||||||
| 10 Years | $ | 1,368 | $ | 1,643 | $ | 1,624 | $ | 750 | $ | 1,368 | $ | 1,643 | $ | 1,624 | $ | 750 | ||||||||||||||||||||
Portfolio Turnover
The fund pays transaction costs, such as commissions, when it buys and sells securities (or “turns over” its portfolio). A higher portfolio turnover rate may indicate higher transaction costs and may result in higher taxes when fund shares are
6
Section 1 Fund Summaries
held in a taxable account. These costs, which are not reflected in annual fund operating expenses or in the example, affect the fund’s performance. During the most recent fiscal year, the fund’s portfolio turnover rate was 7% of the average value of its portfolio.
Principal Investment Strategies
Under normal market conditions, the fund invests at least 80% of its net assets in municipal bonds that pay interest that is exempt from regular federal and Kentucky personal income tax. The fund invests at least 80% of its net assets in investment grade municipal bonds, which are those rated BBB/Baa or higher at the time of purchase by at least one independent rating agency, or, if unrated, judged by the fund’s sub-adviser to be of comparable quality. The fund may invest up to 20% of its net assets in below investment grade municipal bonds, commonly referred to as “high yield” or “junk” bonds. The fund may invest up to 15% of its net assets in municipal securities whose interest payments vary inversely with changes in short-term tax-exempt interest rates (“inverse floaters”). The fund’s sub-adviser uses a value-oriented strategy and looks for higher-yielding and undervalued long-term municipal bonds that offer above-average total return. The sub-adviser may choose to sell municipal bonds with deteriorating credit or limited upside potential compared to other available bonds.
Principal Risks
The price and yield of this fund will change daily due to changes in interest rates and other factors, which means you could lose money. An investment in the fund is not a deposit of a bank and is not insured or guaranteed by the Federal Deposit Insurance Corporation or any other governmental agency. The principal risks of investing in this fund are described below:
Alternative Minimum Tax Risk—The fund has no limit as to the amount that can be invested in alternative minimum tax bonds; therefore, all or a portion of the fund’s otherwise exempt-interest dividends may be taxable to those shareholders subject to the federal alternative minimum tax.
Call Risk—If an issuer calls higher-yielding bonds held by the fund, performance could be adversely impacted.
Credit Risk—Credit risk is the risk that an issuer of a municipal bond may be unable or unwilling to make interest and principal payments when due and the related risk that the value of a bond may decline because of concerns about the issuer’s ability or willingness to make such payments. In addition, parties to other financial contracts with the fund could default on their obligations.
High Yield Securities Risk—High yield securities generally are less liquid, have more volatile prices, and have greater credit risk than investment grade securities.
Income Risk—The fund’s income could decline during periods of falling interest rates. Also, if the fund invests in inverse floaters, the fund’s income may decrease if short-term interest rates rise.
Interest Rate Risk—Interest rate risk is the risk that the value of the fund’s portfolio will decline because of rising interest rates. Interest rate risk may be increased by the fund’s investment in inverse floaters because of the leveraged nature of these investments.
Inverse Floaters Risk—The use of inverse floaters by the fund creates effective leverage. Due to the leveraged nature of these investments, they will typically be more volatile and involve greater risk than the fixed rate municipal bonds underlying the inverse floaters. An investment in certain inverse floaters will involve the risk that the fund could lose more than its original principal investment. Distributions on inverse floaters bear an inverse relationship to short-term municipal bond interest rates. Thus, distributions paid to the fund on its inverse floaters will be reduced or even eliminated as short-term municipal interest rates rise and will increase when short-term municipal interest rates fall. Inverse floaters generally will underperform the market for fixed rate municipal bonds in a rising interest rate environment.
Market Risk—The market values of municipal bonds owned by the fund may decline, at times sharply and unpredictably.
State Concentration Risk—Because the fund primarily purchases municipal bonds from Kentucky, the fund is more susceptible to adverse economic, political or regulatory changes affecting municipal bond issuers in that state.
Section 1 Fund Summaries
7
Fund Performance
The following bar chart and table provide some indication of the potential risks of investing in the fund. The fund’s past performance (before and after taxes) is not necessarily an indication of how the fund will perform in the future. Updated performance information is available at www.nuveen.com/MF/products/performancesummary.aspx or by calling (800) 257-8787.
The bar chart below shows the variability of the fund’s performance from year to year for Class A shares. The performance of the other share classes will differ due to their different expense structures. The bar chart and highest/lowest quarterly returns that follow do not reflect sales charges, and if these charges were reflected, the returns would be less than those shown.
Class A Annual Total Return*
| * | Class A year-to-date return as of June 30, 2011 was 3.82%. |
During the ten-year period ended December 31, 2010, the fund’s highest and lowest quarterly returns were 6.84% and -3.82%,respectively, for the quarters ended September 30, 2009 and December 31, 2010.
The table below shows the variability of the fund’s average annual returns and how they compare over the time periods indicated with those of broad measures of market performance and an index of funds with similar investment objectives. All after-tax returns are calculated using the historical highest individual federal marginal income tax rates and do not reflect the impact of state and local taxes. After-tax returns are shown for Class A shares only; after-tax returns for other share classes will vary. Your own actual after-tax returns will depend on your specific tax situation and may differ from what is shown here.
Both the bar chart and the table assume that all distributions have been reinvested. Performance reflects fee waivers, if any, in effect during the periods presented. If any such waivers were not in place, returns would be reduced.
| Average Annual Total Returns for the Periods Ended December 31, 2010 | ||||||||||||
| 1 Year | 5 Year | 10 Year | ||||||||||
| Class Returns Before Taxes: | ||||||||||||
Class A | (1.67 | )% | 2.45 | % | 3.95 | % | ||||||
Class B | (2.02 | )% | 2.39 | % | 3.78 | % | ||||||
Class C | 2.19 | % | 2.77 | % | 3.83 | % | ||||||
Class I | 2.86 | % | 3.54 | % | 4.59 | % | ||||||
| Class A Returns After Taxes: | ||||||||||||
On Distributions | (1.67 | )% | 2.41 | % | 3.92 | % | ||||||
On Distributions and Sales of Shares | 0.32 | % | 2.67 | % | 4.01 | % | ||||||
8
Section 1 Fund Summaries
| Average Annual Total Returns for the Periods Ended December 31, 2010 | ||||||||||||
| 1 Year | 5 Year | 10 Year | ||||||||||
| Standard & Poor’s (S&P) National Municipal Bond Index (reflects no deduction for fees, expenses or taxes) | 2.45 | % | 3.83 | % | 4.82 | % | ||||||
| Standard & Poor’s (S&P) Kentucky Municipal Bond Index (reflects no deduction for fees, expenses or taxes) | 2.66 | % | 3.18 | % | 4.36 | % | ||||||
| Lipper Peer Group (reflects no deduction for taxes or certain expenses) | 1.11 | % | 2.90 | % | 3.81 | % | ||||||
Management
Investment Adviser
Nuveen Fund Advisors, Inc.
Sub-Adviser
Nuveen Asset Management, LLC
Portfolio Manager
Name | Title | Portfolio Manager of Fund Since | ||
| Daniel J. Close, CFA | Senior Vice President | 2007 |
Purchase and Sale of Fund Shares
You may purchase, redeem or exchange shares of the fund on any business day, which is any day the New York Stock Exchange is open for business. You may purchase, redeem or exchange shares of the fund either through a financial advisor or other financial intermediary or directly from the fund. Class B shares are available only through exchanges and dividend reinvestments by current Class B shareholders. The fund’s initial and subsequent investment minimums generally are as follows, although the fund may reduce or waive the minimums in some cases:
| Class A and Class C | Class I | |||
| Eligibility and Minimum Initial Investment | $3,000 | Available only through fee-based programs and to other limited categories of investors as described in the prospectus.
$100,000 for all accounts except:
• $250 for clients of financial intermediaries and family offices that have accounts holding Class I shares with an aggregate value of at least $100,000 (or that are expected to reach this level).
• No minimum for certain other categories of eligible investors as described in the prospectus. | ||
| Minimum Additional Investment | $100 | No minimum. |
Tax Information
The fund intends to make distributions that are exempt from regular federal and Kentucky state income tax. A portion of these distributions, however, may be subject to the federal alternative minimum tax.
Payments to Broker-Dealers and Other Financial Intermediaries
If you purchase shares of the fund through a broker-dealer or other financial intermediary (such as a bank or financial advisor), the fund, its distributor or its investment adviser may pay the intermediary for the sale of fund shares and related services. These payments may create a conflict of interest by influencing the broker-dealer or other financial intermediary and your salesperson to recommend the fund over another investment. Ask your financial advisor or visit your financial intermediary’s website for more information.
Section 1 Fund Summaries
9
Nuveen Michigan Municipal Bond Fund
Investment Objective
The investment objective of the fund is to provide you with as high a level of current interest income exempt from regular federal, Michigan state and, in some cases, Michigan local income taxes as is consistent with preservation of capital.
Fees and Expenses of the Fund
This table describes the fees and expenses that you may pay if you buy and hold shares of the fund. You may qualify for sales charge discounts if you and your family invest, or agree to invest in the future, at least $50,000 in the fund or in other Nuveen Mutual Funds. More information about these and other discounts, as well as eligibility requirements for each share class, is available from your financial advisor and in “What Share Classes We Offer” on page 35 of the fund’s prospectus, “How to Reduce Your Sales Charge” on page 37 of the prospectus and “Purchase and Redemption of Fund Shares” on page S-53 of the fund’s statement of additional information.
Shareholder Fees
(fees paid directly from your investment)
| Class A | Class B | Class C | Class I | |||||||||||||
| Maximum Sales Charge (Load) Imposed on Purchases (as a percentage of offering price) | 4.20% | None | None | None | ||||||||||||
| Maximum Deferred Sales Charge (Load) (as a percentage of the lesser of purchase price or redemption proceeds) | None | 5.00% | 1.00% | None | ||||||||||||
| Maximum Sales Charge (Load) Imposed on Reinvested Dividends | None | None | None | None | ||||||||||||
| Exchange Fee | None | None | None | None | ||||||||||||
| Annual Low Balance Account Fee (for accounts under $1,000)1 | $15 | $15 | $15 | $15 | ||||||||||||
Annual Fund Operating Expenses
(expenses that you pay each year as a percentage of the value of your investment)
| Class A | Class B | Class C | Class I | |||||||||||||
| Management Fees | 0.53% | 0.53% | 0.53% | 0.53% | ||||||||||||
| Distribution and Service (12b-1) Fees | 0.20% | 0.95% | 0.75% | 0.00% | ||||||||||||
| Other Expenses | 0.11% | 0.11% | 0.11% | 0.11% | ||||||||||||
| Total Annual Fund Operating Expenses | 0.84% | 1.59% | 1.39% | 0.64% | ||||||||||||
| 1 | Fee applies to the following types of accounts held directly with the fund: accounts established pursuant to the Uniform Transfers to Minors Act (UTMA) or Uniform Gifts to Minors Act (UGMA). |
Example
The following example is intended to help you compare the cost of investing in the fund with the cost of investing in other mutual funds. The example assumes that you invest $10,000 in the fund for the time periods indicated and then either redeem or do not redeem your shares at the end of a period. The example also assumes that your investment has a 5% return each year and that the fund’s operating expenses remain the same. Although your actual costs may be higher or lower, based on these assumptions your costs would be:
| Redemption | No Redemption | |||||||||||||||||||||||||||||||||||
| A | B | C | I | A | B | C | I | |||||||||||||||||||||||||||||
| 1 Year | $ | 502 | $ | 562 | $ | 142 | $ | 65 | $ | 502 | $ | 162 | $ | 142 | $ | 65 | ||||||||||||||||||||
| 3 Years | $ | 677 | $ | 802 | $ | 440 | $ | 205 | $ | 677 | $ | 502 | $ | 440 | $ | 205 | ||||||||||||||||||||
| 5 Years | $ | 866 | $ | 966 | $ | 761 | $ | 357 | $ | 866 | $ | 866 | $ | 761 | $ | 357 | ||||||||||||||||||||
| 10 Years | $ | 1,414 | $ | 1,688 | $ | 1,669 | $ | 798 | $ | 1,414 | $ | 1,688 | $ | 1,669 | $ | 798 | ||||||||||||||||||||
Portfolio Turnover
The fund pays transaction costs, such as commissions, when it buys and sells securities (or “turns over” its portfolio). A higher portfolio turnover rate may indicate higher transaction costs and may result in higher taxes when fund shares
10
Section 1 Fund Summaries
are held in a taxable account. These costs, which are not reflected in annual fund operating expenses or in the example, affect the fund’s performance. During the most recent fiscal year, the fund’s portfolio turnover rate was 6% of the average value of its portfolio.
Principal Investment Strategies
Under normal market conditions, the fund invests at least 80% of its net assets in municipal bonds that pay interest that is exempt from regular federal and Michigan personal income tax. The fund invests at least 80% of its net assets in investment grade municipal bonds, which are those rated BBB/Baa or higher at the time of purchase by at least one independent rating agency, or, if unrated, judged by the fund’s sub-adviser to be of comparable quality. The fund may invest up to 20% of its net assets in below investment grade municipal bonds, commonly referred to as “high yield” or “junk” bonds. The fund may invest up to 15% of its net assets in municipal securities whose interest payments vary inversely with changes in short-term tax-exempt interest rates (“inverse floaters”). The fund’s sub-adviser uses a value-oriented strategy and looks for higher-yielding and undervalued long-term municipal bonds that offer above-average total return. The sub-adviser may choose to sell municipal bonds with deteriorating credit or limited upside potential compared to other available bonds.
Principal Risks
The price and yield of this fund will change daily due to changes in interest rates and other factors, which means you could lose money. An investment in the fund is not a deposit of a bank and is not insured or guaranteed by the Federal Deposit Insurance Corporation or any other governmental agency. The principal risks of investing in this fund are described below:
Alternative Minimum Tax Risk—The fund has no limit as to the amount that can be invested in alternative minimum tax bonds; therefore, all or a portion of the fund’s otherwise exempt-interest dividends may be taxable to those shareholders subject to the federal alternative minimum tax.
Call Risk—If an issuer calls higher-yielding bonds held by the fund, performance could be adversely impacted.
Credit Risk—Credit risk is the risk that an issuer of a municipal bond may be unable or unwilling to make interest and principal payments when due and the related risk that the value of a bond may decline because of concerns about the issuer’s ability or willingness to make such payments. In addition, parties to other financial contracts with the fund could default on their obligations.
High Yield Securities Risk—High yield securities generally are less liquid, have more volatile prices, and have greater credit risk than investment grade securities.
Income Risk—The fund’s income could decline during periods of falling interest rates. Also, if the fund invests in inverse floaters, the fund’s income may decrease if short-term interest rates rise.
Interest Rate Risk—Interest rate risk is the risk that the value of the fund’s portfolio will decline because of rising interest rates. Interest rate risk may be increased by the fund’s investment in inverse floaters because of the leveraged nature of these investments.
Inverse Floaters Risk—The use of inverse floaters by the fund creates effective leverage. Due to the leveraged nature of these investments, they will typically be more volatile and involve greater risk than the fixed rate municipal bonds underlying the inverse floaters. An investment in certain inverse floaters will involve the risk that the fund could lose more than its original principal investment. Distributions on inverse floaters bear an inverse relationship to short-term municipal bond interest rates. Thus, distributions paid to the fund on its inverse floaters will be reduced or even eliminated as short-term municipal interest rates rise and will increase when short-term municipal interest rates fall. Inverse floaters generally will underperform the market for fixed rate municipal bonds in a rising interest rate environment.
Market Risk—The market values of municipal bonds owned by the fund may decline, at times sharply and unpredictably.
State Concentration Risk—Because the fund primarily purchases municipal bonds from Michigan,the fund is more susceptible to adverse economic, political or regulatory changes affecting municipal bond issuers in that state.
Section 1 Fund Summaries
11
Fund Performance
The following bar chart and table provide some indication of the potential risks of investing in the fund. The fund’s past performance (before and after taxes) is not necessarily an indication of how the fund will perform in the future. Updated performance information is available at www.nuveen.com/MF/products/performancesummary.aspx or by calling (800) 257-8787.
The bar chart below shows the variability of the fund’s performance from year to year for Class A shares. The performance of the other share classes will differ due to their different expense structures. The bar chart and highest/lowest quarterly returns that follow do not reflect sales charges, and if these charges were reflected, the returns would be less than those shown.
Class A Annual Total Return*
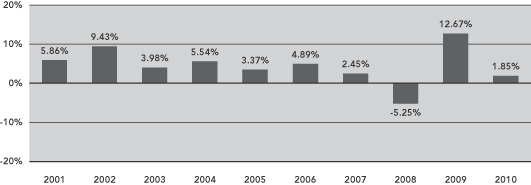
| * | Class A year-to-date return as of June 30, 2011 was 4.62%. |
During the ten-year period ended December 31, 2010, the fund’s highest and lowest quarterly returns were 6.72% and -4.08%, respectively, for the quarters ended September 30, 2009 and September 30, 2008.
The table below shows the variability of the fund’s average annual returns and how they compare over the time periods indicated with those of broad measures of market performance and an index of funds with similar investment objectives. All after-tax returns are calculated using the historical highest individual federal marginal income tax rates and do not reflect the impact of state and local taxes. After-tax returns are shown for Class A shares only; after-tax returns for other share classes will vary. Your own actual after-tax returns will depend on your specific tax situation and may differ from what is shown here.
Both the bar chart and the table assume that all distributions have been reinvested. Performance reflects fee waivers, if any, in effect during the periods presented. If any such waivers were not in place, returns would be reduced.
| Average Annual Total Returns for the Periods Ended December 31, 2010 | ||||||||||||
| 1 Year | 5 Year | 10 Year | ||||||||||
| Class Returns Before Taxes: | ||||||||||||
Class A | (2.46 | )% | 2.27 | % | 3.93 | % | ||||||
Class B | (2.87 | )% | 2.20 | % | 3.77 | % | ||||||
Class C | 1.30 | % | 2.59 | % | 3.81 | % | ||||||
Class I | 2.06 | % | 3.35 | % | 4.59 | % | ||||||
| Class A Returns After Taxes: | ||||||||||||
On Distributions | (2.46 | )% | 2.24 | % | 3.87 | % | ||||||
On Distributions and Sales of Shares | (0.18 | )% | 2.54 | % | 3.99 | % | ||||||
12
Section 1 Fund Summaries
| Average Annual Total Returns for the Periods Ended December 31, 2010 | ||||||||||||
| 1 Year | 5 Year | 10 Year | ||||||||||
| Standard & Poor’s (S&P) National Municipal Bond Index (reflects no deduction for fees, expenses or taxes) | 2.45 | % | 3.83 | % | 4.82 | % | ||||||
| Standard & Poor’s (S&P) Michigan Municipal Bond Index (reflects no deduction for fees, expenses or taxes) | 3.39% | 3.71 | % | 4.80 | % | |||||||
| Lipper Peer Group (reflects no deduction for taxes or certain expenses) | 1.44 | % | 2.93 | % | 3.97 | % | ||||||
Management
Investment Adviser
Nuveen Fund Advisors, Inc.
Sub-Adviser
Nuveen Asset Management, LLC
Portfolio Manager
Name | Title | Portfolio Manager of Fund Since | ||
| Daniel J. Close, CFA | Senior Vice President | 2007 |
Purchase and Sale of Fund Shares
You may purchase, redeem or exchange shares of the fund on any business day, which is any day the New York Stock Exchange is open for business. You may purchase, redeem or exchange shares of the fund either through a financial advisor or other financial intermediary or directly from the fund. Class B shares are available only through exchanges and dividend reinvestments by current Class B shareholders. The fund’s initial and subsequent investment minimums generally are as follows, although the fund may reduce or waive the minimums in some cases:
| Class A and Class C | Class I | |||
| Eligibility and Minimum Initial Investment | $3,000 | Available only through fee-based programs and to other limited categories of investors as described in the prospectus.
$100,000 for all accounts except:
• $250 for clients of financial intermediaries and family offices that have accounts holding Class I shares with an aggregate value of at least $100,000 (or that are expected to reach this level).
• No minimum for certain other categories of eligible investors as described in the prospectus. | ||
| Minimum Additional Investment | $100 | No minimum. |
Tax Information
The fund intends to make distributions that are exempt from regular federal and Michigan state income tax. A portion of these distributions, however, may be subject to the federal alternative minimum tax.
Payments to Broker-Dealers and Other Financial Intermediaries
If you purchase shares of the fund through a broker-dealer or other financial intermediary (such as a bank or financial advisor), the fund, its distributor or its investment adviser may pay the intermediary for the sale of fund shares and related services. These payments may create a conflict of interest by influencing the broker-dealer or other financial intermediary and your salesperson to recommend the fund over another investment. Ask your financial advisor or visit your financial intermediary’s website for more information.
Section 1 Fund Summaries
13
Nuveen Missouri Municipal Bond Fund
Investment Objective
The investment objective of the fund is to provide you with as high a level of current interest income exempt from regular federal, Missouri state and, in some cases, Missouri local income taxes as is consistent with preservation of capital.
Fees and Expenses of the Fund
This table describes the fees and expenses that you may pay if you buy and hold shares of the fund. You may qualify for sales charge discounts if you and your family invest, or agree to invest in the future, at least $50,000 in the fund or in other Nuveen Mutual Funds. More information about these and other discounts, as well as eligibility requirements for each share class, is available from your financial advisor and in “What Share Classes We Offer” on page 35 of the fund’s prospectus, “How to Reduce Your Sales Charge” on page 37 of the prospectus and “Purchase and Redemption of Fund Shares” on page S-53 of the fund’s statement of additional information.
Shareholder Fees
(fees paid directly from your investment)
| Class A | Class B | Class C | Class I | |||||||||||||
| Maximum Sales Charge (Load) Imposed on Purchases (as a percentage of offering price) | 4.20% | None | None | None | ||||||||||||
| Maximum Deferred Sales Charge (Load) (as a percentage of the lesser of purchase price or redemption proceeds) | None | 5.00% | 1.00% | None | ||||||||||||
| Maximum Sales Charge (Load) Imposed on Reinvested Dividends | None | None | None | None | ||||||||||||
| Exchange Fee | None | None | None | None | ||||||||||||
| Annual Low Balance Account Fee (for accounts under $1,000)1 | $15 | $15 | $15 | $15 | ||||||||||||
Annual Fund Operating Expenses
(expenses that you pay each year as a percentage of the value of your investment)
| Class A | Class B | Class C | Class I | |||||||||||||
| Management Fees | 0.53% | 0.53% | 0.53% | 0.53% | ||||||||||||
| Distribution and Service (12b-1) Fees | 0.20% | 0.95% | 0.75% | 0.00% | ||||||||||||
| Other Expenses | 0.09% | 0.09% | 0.09% | 0.09% | ||||||||||||
| Total Annual Fund Operating Expenses | 0.82% | 1.57% | 1.37% | 0.62% | ||||||||||||
| 1 | Fee applies to the following types of accounts held directly with the fund: accounts established pursuant to the Uniform Transfers to Minors Act (UTMA) or Uniform Gifts to Minors Act (UGMA). |
Example
The following example is intended to help you compare the cost of investing in the fund with the cost of investing in other mutual funds. The example assumes that you invest $10,000 in the fund for the time periods indicated and then either redeem or do not redeem your shares at the end of a period. The example also assumes that your investment has a 5% return each year and that the fund’s operating expenses remain the same. Although your actual costs may be higher or lower, based on these assumptions your costs would be:
| Redemption | No Redemption | |||||||||||||||||||||||||||||||||||
| A | B | C | I | A | B | C | I | |||||||||||||||||||||||||||||
| 1 Year | $ | 500 | $ | 560 | $ | 139 | $ | 63 | $ | 500 | $ | 160 | $ | 139 | $ | 63 | ||||||||||||||||||||
| 3 Years | $ | 671 | $ | 796 | $ | 434 | $ | 199 | $ | 671 | $ | 496 | $ | 434 | $ | 199 | ||||||||||||||||||||
| 5 Years | $ | 856 | $ | 955 | $ | 750 | $ | 346 | $ | 856 | $ | 855 | $ | 750 | $ | 346 | ||||||||||||||||||||
| 10 Years | $ | 1,391 | $ | 1,666 | $ | 1,646 | $ | 774 | $ | 1,391 | $ | 1,666 | $ | 1,646 | $ | 774 | ||||||||||||||||||||
Portfolio Turnover
The fund pays transaction costs, such as commissions, when it buys and sells securities (or “turns over” its portfolio). A higher portfolio turnover rate may indicate higher transaction costs and may result in higher taxes when fund shares
14
Section 1 Fund Summaries
are held in a taxable account. These costs, which are not reflected in annual fund operating expenses or in the example, affect the fund’s performance. During the most recent fiscal year, the fund’s portfolio turnover rate was 6% of the average value of its portfolio.
Principal Investment Strategies
Under normal market conditions, the fund invests at least 80% of its net assets in municipal bonds that pay interest that is exempt from regular federal and Missouri personal income tax. The fund invests at least 80% of its net assets in investment grade municipal bonds, which are those rated BBB/Baa or higher at the time of purchase by at least one independent rating agency, or, if unrated, judged by the fund’s sub-adviser to be of comparable quality. The fund may invest up to 20% of its net assets in below investment grade municipal bonds, commonly referred to as “high yield” or “junk” bonds. The fund may invest up to 15% of its net assets in municipal securities whose interest payments vary inversely with changes in short-term tax-exempt interest rates (“inverse floaters”). The fund’s sub-adviser uses a value-oriented strategy and looks for higher-yielding and undervalued long-term municipal bonds that offer above-average total return. The sub-adviser may choose to sell municipal bonds with deteriorating credit or limited upside potential compared to other available bonds.
Principal Risks
The price and yield of this fund will change daily due to changes in interest rates and other factors, which means you could lose money. An investment in the fund is not a deposit of a bank and is not insured or guaranteed by the Federal Deposit Insurance Corporation or any other governmental agency. The principal risks of investing in this fund are described below:
Alternative Minimum Tax Risk—The fund has no limit as to the amount that can be invested in alternative minimum tax bonds; therefore, all or a portion of the fund’s otherwise exempt-interest dividends may be taxable to those shareholders subject to the federal alternative minimum tax.
Call Risk—If an issuer calls higher-yielding bonds held by the fund, performance could be adversely impacted.
Credit Risk—Credit risk is the risk that an issuer of a municipal bond may be unable or unwilling to make interest and principal payments when due and the related risk that the value of a bond may decline because of concerns about the issuer’s ability or willingness to make such payments. In addition, parties to other financial contracts with the fund could default on their obligations.
High Yield Securities Risk—High yield securities generally are less liquid, have more volatile prices, and have greater credit risk than investment grade securities.
Income Risk—The fund’s income could decline during periods of falling interest rates. Also, if the fund invests in inverse floaters, the fund’s income may decrease if short-term interest rates rise.
Interest Rate Risk—Interest rate risk is the risk that the value of the fund’s portfolio will decline because of rising interest rates. Interest rate risk may be increased by the fund’s investment in inverse floaters because of the leveraged nature of these investments.
Inverse Floaters Risk—The use of inverse floaters by the fund creates effective leverage. Due to the leveraged nature of these investments, they will typically be more volatile and involve greater risk than the fixed rate municipal bonds underlying the inverse floaters. An investment in certain inverse floaters will involve the risk that the fund could lose more than its original principal investment. Distributions on inverse floaters bear an inverse relationship to short-term municipal bond interest rates. Thus, distributions paid to the fund on its inverse floaters will be reduced or even eliminated as short-term municipal interest rates rise and will increase when short-term municipal interest rates fall. Inverse floaters generally will underperform the market for fixed rate municipal bonds in a rising interest rate environment.
Market Risk—The market values of municipal bonds owned by the fund may decline, at times sharply and unpredictably.
State Concentration Risk—Because the fund primarily purchases municipal bonds from Missouri, the fund is more susceptible to adverse economic, political or regulatory changes affecting municipal bond issuers in that state.
Section 1 Fund Summaries
15
Fund Performance
The following bar chart and table provide some indication of the potential risks of investing in the fund. The fund’s past performance (before and after taxes) is not necessarily an indication of how the fund will perform in the future. Updated performance information is available at www.nuveen.com/MF/products/performancesummary.aspx or by calling (800) 257-8787.
The bar chart below shows the variability of the fund’s performance from year to year for Class A shares. The performance of the other share classes will differ due to their different expense structures. The bar chart and highest/lowest quarterly returns that follow do not reflect sales charges, and if these charges were reflected, the returns would be less than those shown.
Class A Annual Total Return*
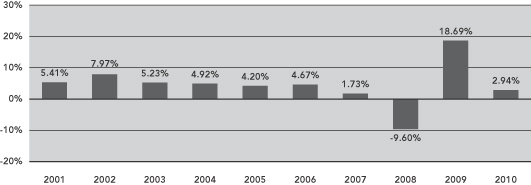
| * | Class A year-to-date total return as of June 30, 2011 was 5.07%. |
During the ten-year period ended December 31, 2010, the fund’s highest and lowest quarterly returns were 8.87% and
-4.83%, respectively, for the quarters ended September 30, 2009 and December 31, 2008.
The table below shows the variability of the fund’s average annual returns and how they compare over the time periods indicated with those of broad measures of market performance and an index of funds with similar investment objectives. All after-tax returns are calculated using the historical highest individual federal marginal income tax rates and do not reflect the impact of state and local taxes. After-tax returns are shown for Class A shares only; after-tax returns for other share classes will vary. Your own actual after-tax returns will depend on your specific tax situation and may differ from what is shown here.
Both the bar chart and the table assume that all distributions have been reinvested. Performance reflects fee waivers, if any, in effect during the periods presented. If any such waivers were not in place, returns would be reduced.
| Average Annual Total Returns for the Periods Ended December 31, 2010 | ||||||||||||
| 1 Year | 5 Year | 10 Year | ||||||||||
| Class Returns Before Taxes: | ||||||||||||
Class A | (1.42 | )% | 2.41 | % | 3.97 | % | ||||||
Class B | (1.74 | )% | 2.36 | % | 3.79 | % | ||||||
Class C | 2.41 | % | 2.73 | % | 3.83 | % | ||||||
Class I | 3.27 | % | 3.49 | % | 4.62 | % | ||||||
| Class A Returns After Taxes: | ||||||||||||
On Distributions | (1.42 | )% | 2.39 | % | 3.95 | % | ||||||
On Distributions and Sales of Shares | 0.58 | % | 2.67 | % | 4.04 | % | ||||||
16
Section 1 Fund Summaries
| Average Annual Total Returns for the Periods Ended December 31, 2010 | ||||||||||||
| 1 Year | 5 Year | 10 Year | ||||||||||
| Standard & Poor’s (S&P) National Municipal Bond Index (reflects no deduction for fees, expenses or taxes) | 2.45 | % | 3.83 | % | 4.82 | % | ||||||
| Standard & Poor’s (S&P) Missouri Municipal Bond Index (reflects no deduction for fees, expenses or taxes) | 2.40% | 3.92 | % | 4.96 | % | |||||||
| Lipper Peer Group (reflects no deduction for taxes or certain expenses) | 1.11 | % | 2.90 | % | 3.81 | % | ||||||
Management
Investment Adviser
Nuveen Fund Advisors, Inc.
Sub-Adviser
Nuveen Asset Management, LLC
Portfolio Manager
Name | Title | Portfolio Manager of Fund Since | ||
| Christopher L. Drahn | Senior Vice President | January 2011 |
Purchase and Sale of Fund Shares
You may purchase, redeem or exchange shares of the fund on any business day, which is any day the New York Stock Exchange is open for business. You may purchase, redeem or exchange shares of the fund either through a financial advisor or other financial intermediary or directly from the fund. Class B shares are available only through exchanges and dividend reinvestments by current Class B shareholders. The fund’s initial and subsequent investment minimums generally are as follows, although the fund may reduce or waive the minimums in some cases:
| Class A and Class C | Class I | |||
| Eligibility and Minimum Initial Investment | $3,000 | Available only through fee-based programs and to other limited categories of investors as described in the prospectus.
$100,000 for all accounts except:
• $250 for clients of financial intermediaries and family offices that have accounts holding Class I shares with an aggregate value of at least $100,000 (or that are expected to reach this level).
• No minimum for certain other categories of eligible investors as described in the prospectus. | ||
| Minimum Additional Investment | $100 | No minimum. |
Tax Information
The fund intends to make distributions that are exempt from regular federal and Missouri state income tax. A portion of these distributions, however, may be subject to the federal alternative minimum tax.
Payments to Broker-Dealers and Other Financial Intermediaries
If you purchase shares of the fund through a broker-dealer or other financial intermediary (such as a bank or financial advisor), the fund, its distributor or its investment adviser may pay the intermediary for the sale of fund shares and related services. These payments may create a conflict of interest by influencing the broker-dealer or other financial intermediary and your salesperson to recommend the fund over another investment. Ask your financial advisor or visit your financial intermediary’s website for more information.
Section 1 Fund Summaries
17
Nuveen Ohio Municipal Bond Fund
Investment Objective
The investment objective of the fund is to provide you with as high a level of current interest income exempt from regular federal, Ohio state and, in some cases, Ohio local income taxes as is consistent with preservation of capital.
Fees and Expenses of the Fund
This table describes the fees and expenses that you may pay if you buy and hold shares of the fund. You may qualify for sales charge discounts if you and your family invest, or agree to invest in the future, at least $50,000 in the fund or in other Nuveen Mutual Funds. More information about these and other discounts, as well as eligibility requirements for each share class, is available from your financial advisor and in “What Share Classes We Offer” on page 35 of the fund’s prospectus, “How to Reduce Your Sales Charge” on page 37 of the prospectus and “Purchase and Redemption of Fund Shares” on page S-53 of the fund’s statement of additional information.
Shareholder Fees
(fees paid directly from your investment)
| Class A | Class B | Class C | Class I | |||||||||||||
| Maximum Sales Charge (Load) Imposed on Purchases (as a percentage of offering price) | 4.20% | None | None | None | ||||||||||||
| Maximum Deferred Sales Charge (Load) (as a percentage of the lesser of purchase price or redemption proceeds) | None | 5.00% | 1.00% | None | ||||||||||||
| Maximum Sales Charge (Load) Imposed on Reinvested Dividends | None | None | None | None | ||||||||||||
| Exchange Fee | None | None | None | None | ||||||||||||
| Annual Low Balance Account Fee (for accounts under $1,000)1 | $15 | $15 | $15 | $15 | ||||||||||||
Annual Fund Operating Expenses
(expenses that you pay each year as a percentage of the value of your investment)
| Class A | Class B | Class C | Class I | |||||||||||||
| Management Fees | 0.52% | 0.52% | 0.52% | 0.52% | ||||||||||||
| Distribution and Service (12b-1) Fees | 0.20% | 0.95% | 0.75% | 0.00% | ||||||||||||
| Other Expenses | 0.10% | 0.10% | 0.10% | 0.10% | ||||||||||||
| Total Annual Fund Operating Expenses | 0.82% | 1.57% | 1.37% | 0.62% | ||||||||||||
| 1 | Fee applies to the following types of accounts held directly with the fund: accounts established pursuant to the Uniform Transfers to Minors Act (UTMA) or Uniform Gifts to Minors Act (UGMA). |
Example
The following example is intended to help you compare the cost of investing in the fund with the cost of investing in other mutual funds. The example assumes that you invest $10,000 in the fund for the time periods indicated and then either redeem or do not redeem your shares at the end of a period. The example also assumes that your investment has a 5% return each year and that the fund’s operating expenses remain the same. Although your actual costs may be higher or lower, based on these assumptions your costs would be:
| Redemption | No Redemption | |||||||||||||||||||||||||||||||||||
| A | B | C | I | A | B | C | I | |||||||||||||||||||||||||||||
| 1 Year | $ | 500 | $ | 560 | $ | 139 | $ | 63 | $ | 500 | $ | 160 | $ | 139 | $ | 63 | ||||||||||||||||||||
| 3 Years | $ | 671 | $ | 796 | $ | 434 | $ | 199 | $ | 671 | $ | 496 | $ | 434 | $ | 199 | ||||||||||||||||||||
| 5 Years | $ | 856 | $ | 955 | $ | 750 | $ | 346 | $ | 856 | $ | 855 | $ | 750 | $ | 346 | ||||||||||||||||||||
| 10 Years | $ | 1,391 | $ | 1,666 | $ | 1,646 | $ | 774 | $ | 1,391 | $ | 1,666 | $ | 1,646 | $ | 774 | ||||||||||||||||||||
Portfolio Turnover
The fund pays transaction costs, such as commissions, when it buys and sells securities (or “turns over” its portfolio). A higher portfolio turnover rate may indicate higher transaction costs and may result in higher taxes when fund shares
18
Section 1 Fund Summaries
are held in a taxable account. These costs, which are not reflected in annual fund operating expenses or in the example, affect the fund’s performance. During the most recent fiscal year, the fund’s portfolio turnover rate was 10% of the average value of its portfolio.
Principal Investment Strategies
Under normal market conditions, the fund invests at least 80% of its net assets in municipal bonds that pay interest that is exempt from regular federal and Ohio personal income tax. The fund invests at least 80% of its net assets in investment grade municipal bonds, which are those rated BBB/Baa or higher at the time of purchase by at least one independent rating agency, or, if unrated, judged by the fund’s sub-adviser to be of comparable quality. The fund may invest up to 20% of its net assets in below investment grade municipal bonds, commonly referred to as “high yield” or “junk” bonds. The fund may invest up to 15% of its net assets in municipal securities whose interest payments vary inversely with changes in short-term tax-exempt interest rates (“inverse floaters”). The fund’s sub-adviser uses a value-oriented strategy and looks for higher-yielding and undervalued long-term municipal bonds that offer above-average total return. The sub-adviser may choose to sell municipal bonds with deteriorating credit or limited upside potential compared to other available bonds.
Principal Risks
The price and yield of this fund will change daily due to changes in interest rates and other factors, which means you could lose money. An investment in the fund is not a deposit of a bank and is not insured or guaranteed by the Federal Deposit Insurance Corporation or any other governmental agency. The principal risks of investing in this fund are described below:
Alternative Minimum Tax Risk—The fund has no limit as to the amount that can be invested in alternative minimum tax bonds; therefore, all or a portion of the fund’s otherwise exempt-interest dividends may be taxable to those shareholders subject to the federal alternative minimum tax.
Call Risk—If an issuer calls higher-yielding bonds held by the fund, performance could be adversely impacted.
Credit Risk—Credit risk is the risk that an issuer of a municipal bond may be unable or unwilling to make interest and principal payments when due and the related risk that the value of a bond may decline because of concerns about the issuer’s ability or willingness to make such payments. In addition, parties to other financial contracts with the fund could default on their obligations.
High Yield Securities Risk—High yield securities generally are less liquid, have more volatile prices, and have greater credit risk than investment grade securities.
Income Risk—The fund’s income could decline during periods of falling interest rates. Also, if the fund invests in inverse floaters, the fund’s income may decrease if short-term interest rates rise.
Interest Rate Risk—Interest rate risk is the risk that the value of the fund’s portfolio will decline because of rising interest rates. Interest rate risk may be increased by the fund’s investment in inverse floaters because of the leveraged nature of these investments.
Inverse Floaters Risk—The use of inverse floaters by the fund creates effective leverage. Due to the leveraged nature of these investments, they will typically be more volatile and involve greater risk than the fixed rate municipal bonds underlying the inverse floaters. An investment in certain inverse floaters will involve the risk that the fund could lose more than its original principal investment. Distributions on inverse floaters bear an inverse relationship to short-term municipal bond interest rates. Thus, distributions paid to the fund on its inverse floaters will be reduced or even eliminated as short-term municipal interest rates rise and will increase when short-term municipal interest rates fall. Inverse floaters generally will underperform the market for fixed rate municipal bonds in a rising interest rate environment.
Market Risk—The market values of municipal bonds owned by the fund may decline, at times sharply and unpredictably.
State Concentration Risk—Because the fund primarily purchases municipal bonds from Ohio, the fund is more susceptible to adverse economic, political or regulatory changes affecting municipal bond issuers in that state.
Section 1 Fund Summaries
19
Fund Performance
The following bar chart and table provide some indication of the potential risks of investing in the fund. The fund’s past performance (before and after taxes) is not necessarily an indication of how the fund will perform in the future. Updated performance information is available at www.nuveen.com/MF/products/performancesummary.aspx or by calling (800) 257-8787.
The bar chart below shows the variability of the fund’s performance from year to year for Class A shares. The performance of the other share classes will differ due to their different expense structures. The bar chart and highest/lowest quarterly returns that follow do not reflect sales charges, and if these charges were reflected, the returns would be less than those shown.
Class A Annual Total Return*
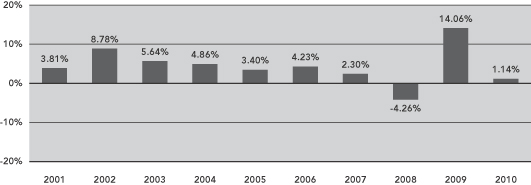
| * | Class A year-to-date total return as of June 30, 2011 was 4.82%. |
During the ten-year period ended December 31, 2010, the fund’s highest and lowest quarterly returns were 8.00% and
-4.22%, respectively, for the quarters ended September 30, 2009 and December 31, 2010.
The table below shows the variability of the fund’s average annual returns and how they compare over the time periods indicated with those of broad measures of market performance and an index of funds with similar investment objectives. All after-tax returns are calculated using the historical highest individual federal marginal income tax rates and do not reflect the impact of state and local taxes. After-tax returns are shown for Class A shares only; after-tax returns for other share classes will vary. Your own actual after-tax returns will depend on your specific tax situation and may differ from what is shown here.
Both the bar chart and the table assume that all distributions have been reinvested. Performance reflects fee waivers, if any, in effect during the periods presented. If any such waivers were not in place, returns would be reduced.
| Average Annual Total Returns for the Periods Ended December 31, 2010 | ||||||||||||
| 1 Year | 5 Year | 10 Year | ||||||||||
| Class Returns Before Taxes: | ||||||||||||
Class A | (3.13 | )% | 2.45 | % | 3.85 | % | ||||||
Class B | (3.49 | )% | 2.38 | % | 3.68 | % | ||||||
Class C | 0.51 | % | 2.74 | % | 3.73 | % | ||||||
Class I | 1.27 | % | 3.52 | % | 4.50 | % | ||||||
| Class A Returns After Taxes: | ||||||||||||
On Distributions | (3.15 | )% | 2.39 | % | 3.82 | % | ||||||
On Distributions and Sales of Shares | (0.63 | )% | 2.68 | % | 3.93 | % | ||||||
20
Section 1 Fund Summaries
| Average Annual Total Returns for the Periods Ended December 31, 2010 | ||||||||||||
| 1 Year | 5 Year | 10 Year | ||||||||||
| Standard & Poor’s (S&P) National Municipal Bond Index (reflects no deduction for fees, expenses or taxes) | 2.45 | % | 3.83 | % | 4.82 | % | ||||||
| Standard & Poor’s (S&P) Ohio Municipal Bond Index (reflects no deduction for fees, expenses or taxes) | 0.68% | 3.14 | % | 4.44 | % | |||||||
| Lipper Peer Group (reflects no deduction for taxes or certain expenses) | 0.95 | % | 2.95 | % | 3.77 | % | ||||||
Management
Investment Adviser
Nuveen Fund Advisors, Inc.
Sub-Adviser
Nuveen Asset Management, LLC
Portfolio Manager
Name | Title | Portfolio Manager of Fund Since | ||
| Daniel J. Close, CFA | Senior Vice President | 2007 |
Purchase and Sale of Fund Shares
You may purchase, redeem or exchange shares of the fund on any business day, which is any day the New York Stock Exchange is open for business. You may purchase, redeem or exchange shares of the fund either through a financial advisor or other financial intermediary or directly from the fund. Class B shares are available only through exchanges and dividend reinvestments by current Class B shareholders. The fund’s initial and subsequent investment minimums generally are as follows, although the fund may reduce or waive the minimums in some cases:
| Class A and Class C | Class I | |||
| Eligibility and Minimum Initial Investment | $3,000 | Available only through fee-based programs and to other limited categories of investors as described in the prospectus.
$100,000 for all accounts except:
• $250 for clients of financial intermediaries and family offices that have accounts holding Class I shares with an aggregate value of at least $100,000 (or that are expected to reach this level).
• No minimum for certain other categories of eligible investors as described in the prospectus. | ||
| Minimum Additional Investment | $100 | No minimum. |
Tax Information
The fund intends to make distributions that are exempt from regular federal and Ohio state income tax. A portion of these distributions, however, may be subject to the federal alternative minimum tax.
Payments to Broker-Dealers and Other Financial Intermediaries
If you purchase shares of the fund through a broker-dealer or other financial intermediary (such as a bank or financial advisor), the fund, its distributor or its investment adviser may pay the intermediary for the sale of fund shares and related services. These payments may create a conflict of interest by influencing the broker-dealer or other financial intermediary and your salesperson to recommend the fund over another investment. Ask your financial advisor or visit your financial intermediary’s website for more information.
Section 1 Fund Summaries
21
Nuveen Wisconsin Municipal Bond Fund
Investment Objective
The investment objective of the fund is to provide you with as high a level of current interest income exempt from regular federal, Wisconsin state and, in some cases, Wisconsin local income taxes as is consistent with preservation of capital.
Fees and Expenses of the Fund
This table describes the fees and expenses that you may pay if you buy and hold shares of the fund. You may qualify for sales charge discounts if you and your family invest, or agree to invest in the future, at least $50,000 in the fund or in other Nuveen Mutual Funds. More information about these and other discounts, as well as eligibility requirements for each share class, is available from your financial advisor and in “What Share Classes We Offer” on page 35 of the fund’s prospectus, “How to Reduce Your Sales Charge” on page 37 of the prospectus and “Purchase and Redemption of Fund Shares” on page S-53 of the fund’s statement of additional information.
Shareholder Fees
(fees paid directly from your investment)
| Class A | Class B | Class C | Class I | |||||||||||||
| Maximum Sales Charge (Load) Imposed on Purchases (as a percentage of offering price) | 4.20% | None | None | None | ||||||||||||
| Maximum Deferred Sales Charge (Load) (as a percentage of the lesser of purchase price or redemption proceeds) | None | 5.00% | 1.00% | None | ||||||||||||
| Maximum Sales Charge (Load) Imposed on Reinvested Dividends | None | None | None | None | ||||||||||||
| Exchange Fee | None | None | None | None | ||||||||||||
| Annual Low Balance Account Fee (for accounts under $1,000)1 | $15 | $15 | $15 | $15 | ||||||||||||
Annual Fund Operating Expenses
(expenses that you pay each year as a percentage of the value of your investment)
| Class A | Class B | Class C | Class I | |||||||||||||
| Management Fees | 0.53% | 0.53% | 0.53% | 0.53% | ||||||||||||
| Distribution and Service (12b-1) Fees | 0.20% | 0.95% | 0.75% | 0.00% | ||||||||||||
| Other Expenses | 0.14% | 0.14% | 0.14% | 0.14% | ||||||||||||
| Total Annual Fund Operating Expenses | 0.87% | 1.62% | 1.42% | 0.67% | ||||||||||||
| 1 | Fee applies to the following types of accounts held directly with the fund: accounts established pursuant to the Uniform Transfers to Minors Act (UTMA) or Uniform Gifts to Minors Act (UGMA). |
Example
The following example is intended to help you compare the cost of investing in the fund with the cost of investing in other mutual funds. The example assumes that you invest $10,000 in the fund for the time periods indicated and then either redeem or do not redeem your shares at the end of a period. The example also assumes that your investment has a 5% return each year and that the fund’s operating expenses remain the same. Although your actual costs may be higher or lower, based on these assumptions your costs would be:
| Redemption | No Redemption | |||||||||||||||||||||||||||||||||||
| A | B | C | I | A | B | C | I | |||||||||||||||||||||||||||||
| 1 Year | $ | 505 | $ | 565 | $ | 145 | $ | 68 | $ | 505 | $ | 165 | $ | 145 | $ | 68 | ||||||||||||||||||||
| 3 Years | $ | 686 | $ | 811 | $ | 449 | $ | 214 | $ | 686 | $ | 511 | $ | 449 | $ | 214 | ||||||||||||||||||||
| 5 Years | $ | 882 | $ | 981 | $ | 776 | $ | 373 | $ | 882 | $ | 881 | $ | 776 | $ | 373 | ||||||||||||||||||||
| 10 Years | $ | 1,448 | $ | 1,721 | $ | 1,702 | $ | 835 | $ | 1,448 | $ | 1,721 | $ | 1,702 | $ | 835 | ||||||||||||||||||||
Portfolio Turnover
The fund pays transaction costs, such as commissions, when it buys and sells securities (or “turns over” its portfolio). A higher portfolio turnover rate may indicate higher transaction costs and may result in higher taxes when fund shares are
22
Section 1 Fund Summaries
held in a taxable account. These costs, which are not reflected in annual fund operating expenses or in the example, affect the fund’s performance. During the most recent fiscal year, the fund’s portfolio turnover rate was 14% of the average value of its portfolio.
Principal Investment Strategies
Under normal market conditions, the fund invests at least 80% of its net assets in municipal bonds that pay interest that is exempt from regular federal and Wisconsin personal income tax. The fund invests at least 80% of its net assets in investment grade municipal bonds, which are those rated BBB/Baa or higher at the time of purchase by at least one independent rating agency, or, if unrated, judged by the fund’s sub-adviser to be of comparable quality. The fund may invest up to 20% of its net assets in below investment grade municipal bonds, commonly referred to as “high yield” or “junk” bonds. The fund may invest up to 15% of its net assets in municipal securities whose interest payments vary inversely with changes in short-term tax-exempt interest rates (“inverse floaters”). The fund’s sub-adviser uses a value-oriented strategy and looks for higher-yielding and undervalued long-term municipal bonds that offer above-average total return. The sub-adviser may choose to sell municipal bonds with deteriorating credit or limited upside potential compared to other available bonds.
Principal Risks
The price and yield of this fund will change daily due to changes in interest rates and other factors, which means you could lose money. An investment in the fund is not a deposit of a bank and is not insured or guaranteed by the Federal Deposit Insurance Corporation or any other governmental agency. The principal risks of investing in this fund are described below:
Alternative Minimum Tax Risk—The fund has no limit as to the amount that can be invested in alternative minimum tax bonds; therefore, all or a portion of the fund’s otherwise exempt-interest dividends may be taxable to those shareholders subject to the federal alternative minimum tax.
Call Risk—If an issuer calls higher-yielding bonds held by the fund, performance could be adversely impacted.
Credit Risk—Credit risk is the risk that an issuer of a municipal bond may be unable or unwilling to make interest and principal payments when due and the related risk that the value of a bond may decline because of concerns about the issuer’s ability or willingness to make such payments. In addition, parties to other financial contracts with the fund could default on their obligations.
High Yield Securities Risk—High yield securities generally are less liquid, have more volatile prices, and have greater credit risk than investment grade securities.
Income Risk—The fund’s income could decline during periods of falling interest rates. Also, if the fund invests in inverse floaters, the fund’s income may decrease if short-term interest rates rise.
Interest Rate Risk—Interest rate risk is the risk that the value of the fund’s portfolio will decline because of rising interest rates. Interest rate risk may be increased by the fund’s investment in inverse floaters because of the leveraged nature of these investments.
Inverse Floaters Risk—The use of inverse floaters by the fund creates effective leverage. Due to the leveraged nature of these investments, they will typically be more volatile and involve greater risk than the fixed rate municipal bonds underlying the inverse floaters. An investment in certain inverse floaters will involve the risk that the fund could lose more than its original principal investment. Distributions on inverse floaters bear an inverse relationship to short-term municipal bond interest rates. Thus, distributions paid to the fund on its inverse floaters will be reduced or even eliminated as short-term municipal interest rates rise and will increase when short-term municipal interest rates fall. Inverse floaters generally will underperform the market for fixed rate municipal bonds in a rising interest rate environment.
Market Risk—The market values of municipal bonds owned by the fund may decline, at times sharply and unpredictably.
Non-Diversification Risk—As a non-diversified fund, the fund may invest a larger portion of its assets in the securities of a limited number of issuers and may be more sensitive to any single economic, political or regulatory occurrence than a diversified fund.
Section 1 Fund Summaries
23
State Concentration Risk—Because the fund primarily purchases municipal bonds from Wisconsin, the fund is more susceptible to adverse economic, political or regulatory changes affecting municipal bond issuers in that state.
Fund Performance
The following bar chart and table provide some indication of the potential risks of investing in the fund. The fund’s past performance (before and after taxes) is not necessarily an indication of how the fund will perform in the future. Updated performance information is available at www.nuveen.com/MF/products/performancesummary.aspx or by calling (800) 257-8787.
The bar chart below shows the variability of the fund’s performance from year to year for Class A shares. The performance of the other share classes will differ due to their different expense structures. The bar chart and highest/lowest quarterly returns that follow do not reflect sales charges, and if these charges were reflected, the returns would be less than those shown.
Class A Annual Total Return*
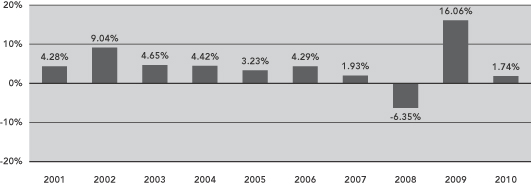
| * | Class A year-to-date return as of June 30, 2011 was 5.07%. |
During the ten-year period ended December 31, 2010, the fund’s highest and lowest quarterly returns were 7.86% and
-5.23%, respectively, for the quarters ended September 30, 2009 and September 30, 2008.
The table below shows the variability of the fund’s average annual returns and how they compare over the time periods indicated with those of broad measures of market performance and an index of funds with similar investment objectives. All after-tax returns are calculated using the historical highest individual federal marginal income tax rates and do not reflect the impact of state and local taxes. After-tax returns are shown for Class A shares only; after-tax returns for other share classes will vary. Your own actual after-tax returns will depend on your specific tax situation and may differ from what is shown here.
Both the bar chart and the table assume that all distributions have been reinvested. Performance reflects fee waivers, if any, in effect during the periods presented. If any such waivers were not in place, returns would be reduced.
| Average Annual Total Returns for the Periods Ended December 31, 2010 | ||||||||||||
| 1 Year | 5 Year | 10 Year | ||||||||||
| Class Returns Before Taxes: | ||||||||||||
Class A | (2.56 | )% | 2.41 | % | 3.74 | % | ||||||
Class B | (2.90 | )% | 2.34 | % | 3.57 | % | ||||||
Class C | 1.21 | % | 2.69 | % | 3.62 | % | ||||||
Class I | 2.07 | % | 3.47 | % | 4.40 | % | ||||||
| Class A Returns After Taxes: | ||||||||||||
On Distributions | (2.56 | )% | 2.40 | % | 3.73 | % | ||||||
On Distributions and Sales of Shares | (0.38 | )% | 2.60 | % | 3.78 | % | ||||||
24
Section 1 Fund Summaries
| Average Annual Total Returns for the Periods Ended December 31, 2010 | ||||||||||||
| 1 Year | 5 Year | 10 Year | ||||||||||
| Standard & Poor’s (S&P) National Municipal Bond Index (reflects no deduction for fees, expenses or taxes) | 2.45 | % | 3.83 | % | 4.82 | % | ||||||
| Standard & Poor’s (S&P) Wisconsin Municipal Bond Index (reflects no deduction for fees, expenses or taxes) | 3.01% | 4.63 | % | 5.55 | % | |||||||
| Lipper Peer Group (reflects no deduction for taxes or certain expenses) | 1.11 | % | 2.90 | % | 3.81 | % | ||||||
Management
Investment Adviser
Nuveen Fund Advisors, Inc.
Sub-Adviser
Nuveen Asset Management, LLC
Portfolio Manager
Name | Title | Portfolio Manager of Fund Since | ||
| Steven M. Hlavin | Vice President | January 2011 |
Purchase and Sale of Fund Shares
You may purchase, redeem or exchange shares of the fund on any business day, which is any day the New York Stock Exchange is open for business. You may purchase, redeem or exchange shares of the fund either through a financial advisor or other financial intermediary or directly from the fund. Class B shares are available only through exchanges and dividend reinvestments by current Class B shareholders. The fund’s initial and subsequent investment minimums generally are as follows, although the fund may reduce or waive the minimums in some cases:
| Class A and Class C | Class I | |||
| Eligibility and Minimum Initial Investment | $3,000 | Available only through fee-based programs and to other limited categories of investors as described in the prospectus.
$100,000 for all accounts except:
• $250 for clients of financial intermediaries and family offices that have accounts holding Class I shares with an aggregate value of at least $100,000 (or that are expected to reach this level).
• No minimum for certain other categories of eligible investors as described in the prospectus. | ||
| Minimum Additional Investment | $100 | No minimum. |
Tax Information
The fund intends to make distributions that are exempt from regular federal and Wisconsin state income tax. A portion of these distributions, however, may be subject to the federal and state alternative minimum tax.
Payments to Broker-Dealers and Other Financial Intermediaries
If you purchase shares of the fund through a broker-dealer or other financial intermediary (such as a bank or financial advisor), the fund, its distributor or its investment adviser may pay the intermediary for the sale of fund shares and related services. These payments may create a conflict of interest by influencing the broker-dealer or other financial intermediary and your salesperson to recommend the fund over another investment. Ask your financial advisor or visit your financial intermediary’s website for more information.
Section 1 Fund Summaries
25
Section 2 How We Manage Your Money
To help you better understand the funds, this section includes a detailed discussion of the funds’ investment and risk management strategies. For a more complete discussion of these matters, please see the statement of additional information, which is available by calling (800) 257-8787 or by visiting Nuveen’s website at www.nuveen.com.

Nuveen Fund Advisors, Inc. (“Nuveen Fund Advisors”), the funds’ investment adviser, offers advisory and investment management services to a broad range of mutual fund clients. Nuveen Fund Advisors has overall responsibility for management of the funds, oversees the management of the funds’ portfolios, manages the funds’ business affairs and provides certain clerical, bookkeeping and other administrative services. Nuveen Fund Advisors is located at 333 West Wacker Drive, Chicago, Illinois 60606. Nuveen Fund Advisors is a subsidiary of Nuveen Investments, Inc. (“Nuveen Investments”). On November 13, 2007, Nuveen Investments was acquired by investors led by Madison Dearborn Partners, LLC, which is a private equity investment firm based in Chicago, Illinois. The Nuveen family of advisers has been providing advice to investment companies since 1976.
Nuveen Fund Advisors has selected its affiliate, Nuveen Asset Management, LLC (“Nuveen Asset Management”), located at 333 West Wacker Drive, Chicago, Illinois 60606, to serve as sub-adviser to each of the funds. Nuveen Asset Management manages the investment of the funds’ assets on a discretionary basis, subject to the supervision of Nuveen Fund Advisors. Nuveen Fund Advisors and Nuveen Asset Management retain the right to reallocate investment advisory responsibilities and fees between themselves in the future.
The portfolio manager for Nuveen Kansas Municipal Bond Fund and Nuveen Wisconsin Municipal Bond Fund is Steven M. Hlavin. The portfolio manager for Nuveen Kentucky Municipal Bond Fund, Nuveen Michigan Municipal Bond Fund and Nuveen Ohio Municipal Bond Fund is Daniel J. Close. The portfolio manager for Nuveen Missouri Municipal Bond Fund is Christopher L. Drahn.
| • | Daniel J. Close, CFA, joined Nuveen in 2000 as a member of the product management and development team, where he was responsible for the oversight and development of the firm’s mutual fund product line. He then served as a research analyst for Nuveen Asset Management, covering corporate-backed, energy, transportation and utility credits, and assumed certain portfolio management duties in 2007. He manages investments for 27 Nuveen-sponsored investment companies with a total of approximately $5 billion under management. |
| • | Christopher L. Drahn entered the financial services industry with FAF Advisors, Inc. (“FAF”) in 1980, and joined Nuveen Asset Management on January 1, 2011 in connection with the firm’s acquisition of a portion of FAF’s asset management business. He manages investments for 10 Nuveen-sponsored investment companies with a total of approximately $2.6 billion under management. |
26
Section 2 How We Manage Your Money
| • | Steven M. Hlavin joined Nuveen in 2003 as a performance analyst, was promoted to senior analyst responsible for the firm’s risk management and performance reporting process, and then assumed certain portfolio management duties in 2006. He manages investments for four Nuveen-sponsored municipal bond funds with a total of approximately $600 million under management. |
Additional information about the portfolio managers’ compensation, other accounts managed by the portfolio managers and the portfolio managers’ ownership of securities in the funds is provided in the statement of additional information.
Management Fees
The management fee schedule for each fund consists of two components: a fund-level fee, based only on the amount of assets within a fund, and a complex-level fee, based on the aggregate amount of all eligible fund assets managed by Nuveen Fund Advisors.
The annual fund-level fee, payable monthly, is based upon the average daily net assets of each fund as follows:
| Average Daily Net Assets | Nuveen Kansas Municipal Bond Fund | Nuveen Kentucky Municipal Bond Fund | Nuveen Michigan Municipal Bond Fund | Nuveen Missouri Municipal Bond Fund | ||||||||||||
| For the first $125 million | 0.3500 | % | 0.3500 | % | 0.3500 | % | 0.3500 | % | ||||||||
| For the next $125 million | 0.3375 | % | 0.3375 | % | 0.3375 | % | 0.3375 | % | ||||||||
| For the next $250 million | 0.3250 | % | 0.3250 | % | 0.3250 | % | 0.3250 | % | ||||||||
| For the next $500 million | 0.3125 | % | 0.3125 | % | 0.3125 | % | 0.3125 | % | ||||||||
| For the next $1 billion | 0.3000 | % | 0.3000 | % | 0.3000 | % | 0.3000 | % | ||||||||
| For the next $3 billion | 0.2750 | % | 0.2750 | % | 0.2750 | % | 0.2750 | % | ||||||||
| For net assets over $5 billion | 0.2500 | % | 0.2500 | % | 0.2500 | % | 0.2500 | % | ||||||||
| Average Daily Net Assets | Nuveen Bond Fund | Nuveen Wisconsin Municipal Bond Fund | ||||||
| For the first $125 million | 0.3500 | % | 0.3500 | % | ||||
| For the next $125 million | 0.3375 | % | 0.3375 | % | ||||
| For the next $250 million | 0.3250 | % | 0.3250 | % | ||||
| For the next $500 million | 0.3125 | % | 0.3125 | % | ||||
| For the next $1 billion | 0.3000 | % | 0.3000 | % | ||||
| For the next $3 billion | 0.2750 | % | 0.2750 | % | ||||
| For net assets over $5 billion | 0.2500 | % | 0.2500 | % | ||||
The complex-level fee is the same for each fund. It begins at a maximum rate of 0.2000% of each fund’s average daily net assets, based upon complex-level assets of $55 billion, with breakpoints for eligible assets above that level. Therefore, the maximum management fee rate for each fund is the fund-level fee plus 0.2000%. As of June 30, 2011, the effective complex-level fee for each fund was 0.1774% of the fund’s average daily net assets.
For the most recent fiscal year, each fund paid Nuveen Fund Advisors the following management fees (net of fee waivers and expense reimbursements, where applicable) as a percentage of average daily net assets:
| Nuveen Kansas Municipal Bond Fund | 0.53 | % | ||
| Nuveen Kentucky Municipal Bond Fund | 0.52 | % | ||
| Nuveen Michigan Municipal Bond Fund | 0.53 | % |
Section 2 How We Manage Your Money
27
| Nuveen Missouri Municipal Bond Fund | 0.53 | % | ||
| Nuveen Ohio Municipal Bond Fund | 0.52 | % | ||
| Nuveen Wisconsin Municipal Bond Fund | 0.53 | % |
Nuveen Fund Advisors has agreed to waive fees or reimburse expenses so that total annual fund operating expenses (excluding 12b-1 distribution and service fees, interest expenses, taxes, fees incurred in acquiring and disposing of portfolio securities, and extraordinary expenses) for Nuveen Ohio Municipal Bond Fund do not exceed 0.75% of the average daily net assets of any class of fund shares. This expense limitation may be terminated or modified only with the approval of shareholders of the fund.
Information regarding the Board of Trustees’ approval of investment management agreements is currently available in the funds’ annual report for the fiscal year ended May 31, 2011.

Each fund’s investment objective may not be changed without shareholder approval. The funds’ investment policies may be changed by the Board of Trustees without shareholder approval unless otherwise noted in this prospectus or the statement of additional information.
Municipal Obligations
States, local governments and municipalities and other issuing authorities issue municipal bonds to raise money for various public purposes such as building public facilities, refinancing outstanding obligations and financing general operating expenses. These bonds include general obligation bonds, which are backed by the full faith and credit of the issuer and may be repaid from any revenue source, and revenue bonds, which may be repaid only from the revenue of a specific facility or source.
The funds may purchase municipal bonds that represent lease obligations. These carry special risks because the issuer of the bonds may not be obligated to appropriate money annually to make payments under the lease. In order to reduce this risk, the funds will, in making purchase decisions, take into consideration the issuer’s incentive to continue making appropriations until maturity.
In evaluating municipal bonds of different credit qualities or maturities, Nuveen Asset Management takes into account the size of yield spreads. Yield spread is the additional return the funds may earn by taking on additional credit risk or interest rate risk. For example, yields on low quality bonds are higher than yields on high quality bonds because investors must be compensated for incurring the higher credit risk associated with low quality bonds. If yield spreads do not provide adequate compensation for the additional risk associated with low quality bonds, the funds may buy bonds of relatively higher quality. Similarly, in evaluating bonds of different maturities, Nuveen Asset Management evaluates the comparative yield available on these bonds. If yield spreads on long-term bonds do not compensate the funds adequately for the additional interest rate risk the funds must assume, the funds may buy bonds of relatively shorter maturity. In addition, municipal bonds in a particular industry may provide higher yields relative to their risk compared to bonds in other industries. If that occurs, the funds may buy more bonds from issuers in that industry.
28
Section 2 How We Manage Your Money
If suitable municipal bonds from a specific state are not available at attractive prices and yields, a fund may invest in municipal bonds of U.S. territories (such as Puerto Rico and Guam), which are exempt from regular federal, state and local income taxes. For diversification purposes or when after-tax yields merit, the funds may invest up to 20% of their net assets in municipal securities that are not exempt from state and local personal income tax. Income received from the funds’ bonds may be subject to the federal alternative minimum tax.
Credit Quality
Under normal market conditions, the funds invest at least 80% of their net assets in investment grade municipal bonds, which are those rated BBB/Baa or higher at the time of purchase by at least one independent rating agency, or, if unrated, judged by Nuveen Asset Management to be of comparable quality. The funds may invest up to 20% of their net assets in below investment grade municipal bonds, commonly referred to as “high yield” or “junk” bonds. High yield bonds typically offer higher yields than investment grade bonds with similar maturities but involve greater risks, including the possibility of default or bankruptcy, and increased market price volatility.
Portfolio Maturity
Maturity measures the time until a bond makes its final payment. Each fund buys municipal bonds with different maturities in pursuit of its investment objective, but will generally maintain, under normal market conditions, an investment portfolio with an overall weighted average maturity of 15 to 30 years.
Inverse Floaters
Each fund may invest up to 15% of its net assets in inverse floaters issued in tender option bond (“TOB”) transactions. In a TOB transaction, one or more highly-rated municipal bonds are deposited into a special purpose trust that issues floating rate securities (“floaters”) to outside parties and inverse floaters to long-term investors like the funds. The floaters pay interest at a rate that is reset periodically (generally weekly) to reflect current short-term tax-exempt interest rates. Holders of the floaters have the right to tender such securities back to the TOB trust for par plus accrued interest (the “put option”), typically on seven days’ notice. Holders of the floaters are paid from the proceeds of a successful remarketing of the floaters or by a liquidity provider in the event of a failed remarketing. The inverse floaters pay interest at a rate equal to (a) the interest accrued on the underlying bonds, minus (b) the sum of the interest payable on the floaters and fees payable in connection with the TOB. Thus, the interest payments on the inverse floaters will vary inversely with the short-term rates paid on the floaters. Holders of the inverse floaters typically have the right to simultaneously (a) cause the holders of the floaters to tender those floaters to the TOB trust at par plus accrued interest and (b) purchase the municipal bonds from the TOB trust.
Because holders of the floaters have the right to tender their securities to the TOB trust at par plus accrued interest, holders of the inverse floaters are exposed to all of the gains or losses on the underlying municipal bonds, despite the fact that their net cash investment is significantly less than the value of those bonds. This multiplies the positive or negative impact of the underlying bonds’ price movements on the value of the inverse floaters, thereby creating effective leverage. The effective leverage created by any TOB transaction depends on the value of the securities deposited in the TOB trust relative to the value of the floaters it issues. The higher the
Section 2 How We Manage Your Money
29
percentage of the TOB trust’s total value represented by the floaters, the greater the effective leverage. For example, if municipal bonds worth $100 are deposited in a TOB trust and the TOB trust issues floaters worth $75 and inverse floaters worth $25, the TOB trust will have a leverage ratio of 3:1 and the inverse floaters will exhibit price movements at a rate that is four times that of the underlying bonds deposited into the trust. If that same TOB trust were to issue only $50 of floaters, the leverage ratio would be 1:1 and the inverse floaters would exhibit price movements at a rate that is only two times that of the underlying bonds.
Short-Term Investments
Under normal market conditions, each fund may invest up to 20% of its net assets in short-term investments, except when made for defensive purposes, such as short-term, high quality municipal bonds or tax-exempt money market funds. The funds may invest in short-term, high quality taxable securities or shares of taxable money market funds if suitable short-term municipal bonds or shares of tax-exempt money market funds are not available at reasonable prices and yields. If the funds invest in taxable securities, they may not be able to achieve their investment objectives. For more information on eligible short-term investments, see the statement of additional information.
When-Issued, Delayed-Delivery and Forward Commitment Transactions
Each fund may enter into contracts to purchase securities for a specified price at a future date later than the normal settlement date. These transactions involve an additional element of risk because, although the fund will not have made any cash outlay prior to the settlement date, the value of the security to be purchased may decline before that settlement date.
Municipal “forwards” pay higher interest rates after settlement than standard bonds to compensate the buyer for bearing market risk but deferring income during the settlement period, and can often be bought at attractive prices and yields. For instance, if a fund knows that a portfolio bond will, or is likely to, be called or mature on a specific future date, the fund may buy a forward settling on or about that date to replace the called or maturing bond and “lock in” a currently attractive interest rate.
Portfolio Holdings
A description of the funds’ policies and procedures with respect to the disclosure of the funds’ portfolio holdings for each fund is available in the funds’ statement of additional information. Certain portfolio holdings information is available on the funds’ website—www.nuveen.com—by clicking the “Our Products—Mutual Funds” section on the home page and following the applicable link for your fund in the “Search Mutual Fund Family” section. By following these links, you can obtain a list of your fund’s top ten holdings and a complete list of holdings for your fund as of the end of the most recent month. The holdings information is generally made available on the funds’ website approximately five business days following the end of each most recent month. This information will remain available on the website until the funds file with the Securities and Exchange Commission their annual, semi-annual or quarterly holdings report for the fiscal period that includes the date(s) as of which the website information is current.
30
Section 2 How We Manage Your Money

Investment Philosophy
Nuveen Asset Management believes that the tax treatment of municipal securities and the structural characteristics in the municipal securities market create opportunities to enhance the after-tax total return and diversification of the investment portfolios of taxable investors. Nuveen Asset Management follows a disciplined, research-driven investment approach to find securities that combine exceptional relative value with above-average return potential.
Investment Process
Nuveen Asset Management believes that a value-oriented investment strategy that seeks to identify underrated and undervalued securities and sectors is positioned to capture the opportunities inherent in the municipal securities market and potentially outperform the general municipal securities market over time. The primary elements of Nuveen Asset Management’s investment process are:
| • | Credit Analysis and Surveillance |
| • | Sector Analysis |
| • | Limited Industry Concentration |
| • | Trading Strategies |
| • | Sell Discipline |
| • | Yield Curve and Structural Analysis |

Risk is inherent in all investing. Investing in a mutual fund—even the most conservative—involves risk, including the risk that you may receive little or no return on your investment or even that you may lose part or all of your investment. Therefore, before investing you should consider carefully the principal risks for each fund and the other risks listed below that you assume when you invest in the funds. Because of these risks, you should consider an investment in the funds to be a long-term investment.
Principal Risks
Alternative minimum tax risk: Each fund has no limit as to the amount that can be invested in alternative minimum tax bonds, therefore, all or a portion of a fund’s otherwise exempt-interest dividends may be taxable to those shareholders subject to the federal alternative minimum tax.
Call risk: Many municipal bonds may be redeemed at the option of the issuer, or “called,” before their stated maturity date. In general, an issuer will call its bonds if they can be refinanced by issuing new bonds which bear a lower interest rate. The funds are subject to the possibility that during periods of falling interest rates, a municipal bond issuer will call its high-yielding bonds. A fund would then be forced to invest the unanticipated proceeds at lower interest rates, resulting in a decline in the fund’s income.
Credit risk: The funds are subject to the risk that the issuers of debt securities held by the funds will not make payments on the securities. There is also the risk that an issuer could suffer adverse changes in financial condition that could lower the credit quality of a security. This could lead to greater volatility in the price of the security and in shares of the fund. Also, a change
Section 2 How We Manage Your Money
31
in the credit quality rating of a bond could affect the bond’s liquidity and make it more difficult for a fund to sell. When a fund purchases unrated securities, it will depend on the sub-adviser’s analysis of credit risk without the assessment of an independent rating organization, such as Moody’s or Standard & Poor’s.
High yield securities risk: Each fund may invest in high yield securities, which usually offer higher yields than investment grade securities, but also involve more risk. High yield securities may be more susceptible to real or perceived adverse economic conditions than investment grade securities. In addition, the secondary trading market may be less liquid, meaning that it may be more difficult to sell or buy a security at a favorable price or time. Consequently, these funds may have to accept a lower price to sell a security, sell other securities to raise cash, or give up an investment opportunity, any of which could have a negative effect on a fund’s performance. High yield securities generally have more volatile prices and carry more risk to principal than investment grade securities.
Income risk: Each fund’s income could decline due to falling market interest rates. This is because, in a falling interest rate environment, a fund generally will have to invest the proceeds from sales of fund shares, as well as the proceeds from maturing portfolio securities (or portfolio securities that have been called, see “Call risk” above), in lower-yielding securities. Also, if a fund invests in inverse floating rate securities, whose income payments vary inversely with changes in short-term market rates, the fund’s income may decrease if short-term interest rates rise.
Interest rate risk: Debt securities in the funds will fluctuate in value with changes in interest rates. In general, debt securities will increase in value when interest rates fall and decrease in value when interest rates rise. Longer-term debt securities are generally more sensitive to interest rate changes. The funds may invest in zero coupon securities, which do not pay interest on a current basis and which may be highly volatile as interest rates rise or fall. Interest rate risk may be increased by a fund’s investment in inverse floating rate securities and forward commitments because of the leveraged nature of these investments.
Inverse floaters risk: Each fund may invest in inverse floaters. The use of inverse floaters by a fund creates effective leverage. Due to the leveraged nature of these investments, their values will be significantly more volatile than those of the underlying bonds in the TOB trust. In other words, the value of an inverse floater will increase and decrease to a significantly greater extent than the values of the TOB trust’s underlying municipal bonds in responses to changes in market interest rates or credit quality. An investment in inverse floaters typically will involve greater risk than an investment in a fixed rate municipal bond, including, in the case of recourse inverse floaters (discussed below), the risk that the fund may lose more than its original principal investment.
Distributions on inverse floaters bear an inverse relationship to short-term municipal bond interest rates. Thus, distributions paid to a fund on its inverse floaters will be reduced or even eliminated as short-term municipal interest rates rise and will increase when short-term municipal interest rates fall. The greater the amount of floaters sold by a TOB trust relative to the inverse floaters (i.e., the greater the effective leverage of the inverse floaters), the more volatile the distributions on the inverse floaters will be. Inverse floaters generally will underperform the market for fixed rate municipal bonds in a rising interest rate environment.
32
Section 2 How We Manage Your Money
Each fund may invest in recourse inverse floaters. In that case, the fund may have to reimburse the liquidity provider of a TOB trust for the difference between the purchase price of any floaters and the proceeds realized from the sale of the municipal bonds in the TOB trust in the event the floaters cannot be successfully remarketed, which could cause the fund to lose money in excess of its investment.
A TOB trust may be terminated without the respective fund’s consent upon the occurrence of certain events, such as the bankruptcy or default of the issuer of the securities in the trust. If that happens, the floaters will be redeemed at par (plus accrued interest) out of the proceeds from the sale of securities in the TOB trust, and the fund will be entitled to the remaining proceeds, if any. Thus, if there is a decrease in the value of the securities held in the TOB trust, the fund may lose some or all of the principal amount of its investment in the inverse floaters. As noted above, in the case of recourse inverse floaters, the fund could lose money in excess of its investment.
Market risk: Market risk is the risk that the market values of municipal bonds owned by the funds will decline, at times sharply and unpredictably. Market values of municipal bonds are affected by a number of different factors, including changes in interest rates, the credit quality of bond issuers, and general economic and market conditions.
Non-diversification risk: Nuveen Kansas Municipal Bond Fund and Nuveen Wisconsin Municipal Bond Fund are non-diversified funds and may invest a larger portion of their assets in a fewer number of issuers than a diversified fund. Because a relatively high percentage of a fund’s assets may be invested in the securities of a limited number of issuers, the fund’s portfolio may be more susceptible to any single economic, political or regulatory occurrence than the portfolio of a diversified fund.
Political and economic risks: The values of municipal securities may be adversely affected by local political and economic conditions and developments. Adverse conditions in an industry significant to a local economy could have a correspondingly adverse effect on the financial condition of local issuers. Other factors that could affect municipal securities include a change in the local, state, or national economy, demographic factors, ecological or environmental concerns, statutory limitations on the issuer’s ability to increase taxes, and other developments generally affecting the revenue of issuers (for example, legislation or court decisions reducing state aid to local governments or mandating additional services). The value of municipal securities also may be adversely affected by future changes in federal or state income tax laws, including rate reductions, the imposition of a flat tax, or the loss of a current state income tax exemption.
To the extent a fund invests in the securities of issuers located in a single state, it will be disproportionately affected by political and economic conditions and developments in that state.
Other Risks
Borrowing risk: Each fund may borrow for temporary or emergency purposes, including to meet redemption requests, pay dividends, repurchase its shares, or clear portfolio transactions. Borrowing may exaggerate changes in the net asset value of a fund’s shares and may affect a fund’s net income. When a fund borrows money, it must pay interest and other fees, which will reduce the fund’s returns if such costs exceed the returns on the portfolio securities purchased or retained with such borrowings. Any such borrowings
Section 2 How We Manage Your Money
33
are intended to be temporary. However, under certain market conditions, including periods of low demand or decreased liquidity in the municipal bond market, such borrowings might be outstanding for longer periods of time.
Inflation risk: The value of assets or income from investments may be less in the future as inflation decreases the value of money. As inflation increases, the value of a fund’s assets can decline, as can the value of a fund’s distributions.
Municipal lease obligations risk: Each fund may purchase participation interests in municipal leases. These are undivided interests in a lease, installment purchase contract, or conditional sale contract entered into by a state or local government unit to acquire equipment or facilities. Participation interests in municipal leases pose special risks because many leases and contracts contain “non-appropriation” clauses that provide that the governmental issuer has no obligation to make future payments under the lease or contract unless money is appropriated for this purpose by the appropriate legislative body. Although these kinds of obligations are secured by the leased equipment or facilities, it might be difficult and time consuming to dispose of the equipment or facilities in the event of non-appropriation, and a fund might not recover the full principal amount of the obligation.
Tax risk: Income from municipal bonds held by the funds could be declared taxable because of unfavorable changes in tax laws, adverse interpretations by the Internal Revenue Service or state tax authorities, or noncompliant conduct of a bond issuer. In addition, a portion of a fund’s otherwise exempt-interest dividends may be taxable to those shareholders subject to the federal and/or state alternative minimum tax.
34
Section 2 How We Manage Your Money
Section 3 How You Can Buy and Sell Shares
The funds offer multiple classes of shares, each with a different combination of sales charges, fees, eligibility requirements and other features. Your financial advisor can help you determine which class is best for you. For further details, please see the statement of additional information.

Class A Shares
You can purchase Class A shares at the offering price, which is the net asset value per share plus an up-front sales charge. You may qualify for a reduced sales charge, or the sales charge may be waived, as described in “How to Reduce Your Sales Charge.” Class A shares are also subject to an annual service fee of 0.20% of your fund’s average daily net assets, which compensates your financial advisor or other financial intermediary for providing ongoing service to you. Nuveen Securities, LLC (the “Distributor”), a subsidiary of Nuveen Investments and the distributor of the funds, retains the up-front sales charge and the service fee on accounts with no financial intermediary of record. The up-front Class A sales charges for the funds are as follows:
| Amount of Purchase | Sales Charge as % of Public Offering Price | Sales Charge as % of Net Amount Invested | Maximum Financial Intermediary | |||||||||
| Less than $50,000 | 4.20 | % | 4.38 | % | 3.70 | % | ||||||
| $50,000 but less than $100,000 | 4.00 | 4.18 | 3.50 | |||||||||
| $100,000 but less than $250,000 | 3.50 | 3.63 | 3.00 | |||||||||
| $250,000 but less than $500,000 | 2.50 | 2.56 | 2.00 | |||||||||
| $500,000 but less than $1,000,000 | 2.00 | 2.04 | 1.50 | |||||||||
| $1,000,000 and over* | — | — | 1.00 | |||||||||
| * | You can purchase $1 million or more of Class A shares at net asset value without an up-front sales charge. The Distributor pays financial intermediaries of record a commission equal to 1% of the first $2.5 million, plus 0.75% of the next $2.5 million, plus 0.50% of the amount over $5 million. Unless you are eligible for a waiver, you may be assessed a contingent deferred sales charge (“CDSC”) of 1% if you redeem any of your shares within 6 months of purchase, 0.75% if you redeem any of your shares within 12 months of purchase and 0.50% if you redeem any of your shares within 18 months of purchase. See “How to Sell Shares—Contingent Deferred Sales Charge” below for more information. |
Class B Shares
The funds will issue Class B shares upon the exchange of Class B shares from another Nuveen Mutual Fund for which Boston Financial Data Services serves as transfer agent or for purposes of dividend reinvestment, but Class B shares are not available for new accounts or for additional investment into existing accounts.
Class B shares are subject to annual distribution and service fees of 0.95% of your fund’s average daily net assets. The annual 0.20% service fee compensates your financial advisor or other financial intermediary for providing ongoing service to you. The annual 0.75% distribution fee compensates the Distributor for paying your financial advisor or other financial intermediary a 4% up-front sales commission, which includes an advance of the first year’s service fee. The Distributor retains the service and distribution fees on accounts with no financial intermediary of record. If you redeem your shares within six years of purchase, you will normally pay a
Section 3 How You Can Buy and Sell Shares
35
CDSC as shown in the schedule below. The CDSC is based on your purchase price or redemption proceeds, whichever is lower. You do not pay a CDSC on any Class B shares you purchase by reinvesting dividends.
| Years Since Purchase | 0-1 | 1-2 | 2-3 | 3-4 | 4-5 | 5-6 | Over 6 | |||||||||||||||||||||
| CDSC | 5 | % | 4 | % | 4 | % | 3 | % | 2 | % | 1 | % | None | |||||||||||||||
Class B shares automatically convert to Class A shares eight years after you buy them so that the distribution fees you pay over the life of your investment are limited. You will continue to pay an annual service fee on any converted Class B shares.
Class C Shares
You can purchase Class C shares at the offering price, which is the net asset value per share without any up-front sales charge. Class C shares are subject to annual distribution and service fees of 0.75% of your fund’s average daily net assets. The annual 0.20% service fee compensates your financial advisor or other financial intermediary for providing ongoing service to you. The annual 0.55% distribution fee compensates the Distributor for paying your financial advisor or other financial intermediary an ongoing sales commission as well as an advance of the first year’s service and distribution fees. The Distributor retains the service and distribution fees on accounts with no financial intermediary of record. If you redeem your shares within 12 months of purchase, you will normally pay a 1% CDSC which is calculated on the lower of your purchase price or redemption proceeds. You do not pay a CDSC on any Class C shares you purchase by reinvesting dividends. Class C shares do not convert.
The funds have established a limit to the amount of Class C shares that may be purchased by an individual investor. See the statement of additional information for more information.
Class I Shares
You can purchase Class I shares at the offering price, which is the net asset value per share without any up-front sales charge. As Class I shares are not subject to sales charges or ongoing service or distribution fees, they have lower ongoing expenses than the other classes.
Class I shares are available for purchase by clients of financial intermediaries who charge such clients an ongoing fee for advisory, investment, consulting or related services. Such clients may include individuals, corporations, endowments and foundations. The minimum initial investment for such clients is $100,000, but this minimum will be lowered to $250 for clients of financial intermediaries that have accounts holding Class I shares with an aggregate value of at least $100,000. The Distributor may also lower the minimum to $250 for clients of financial intermediaries anticipated to reach this Class I share holdings level.
Class I shares are also available for purchase by family offices and their clients. A family office is a company that provides certain financial and other services to a high net worth family or families. The minimum initial investment for family offices and their clients is $100,000, but this minimum will be lowered to $250 for clients of family offices that have accounts holding Class I shares with an aggregate value of at least $100,000. The Distributor may also lower the minimum to $250 for clients of family offices anticipated to reach this Class I share holdings level.
36
Section 3 How You Can Buy and Sell Shares
Class I shares are also available for purchase, with no minimum initial investment, by the following categories of investors:
| • | Certain bank or broker-affiliated trust departments. |
| • | Advisory accounts of Nuveen Fund Advisors and its affiliates. |
| • | Trustees/directors and former trustees/directors of any Nuveen Fund, and their immediate family members (as defined in the statement of additional information). |
| • | Officers, directors and former directors of Nuveen Investments and its affiliates, and their immediate family members. |
| • | Full-time and retired employees of Nuveen Investments and its affiliates, and their immediate family members. |
| • | Certain financial intermediary personnel, and their immediate family members. |
Please refer to the statement of additional information for more information about Class A, Class B, Class C and Class I shares, including more detailed program descriptions and eligibility requirements. Additional information is also available from your financial advisor, who can also help you prepare any necessary application forms.

The funds offer a number of ways to reduce or eliminate the up-front sales charge on Class A shares. Nuveen Mutual Funds currently utilize two transfer agents, and the ability to use the methods described below to reduce your sales charge is limited to aggregating values or purchases of funds that have the same transfer agent. See “What Share Classes We Offer” (above) for a discussion of eligibility requirements for purchasing Class I shares.
Class A Sales Charge Reductions
| • | Rights of Accumulation. In calculating the appropriate sales charge on a purchase of Class A shares of a fund, you may be able to add the amount of your purchase to the value, based on the current net asset value per share, of all of your prior purchases of any Nuveen Mutual Fund. |
| • | Letter of Intent. Subject to certain requirements, you may purchase Class A shares of a fund at the sales charge rate applicable to the total amount of the purchases you intend to make over a 13-month period. |
For purposes of calculating the appropriate sales charge as described under Rights of Accumulation and Letter of Intent above, you may include purchases by (i) you, (ii) your spouse or domestic partner and children under the age of 21 years, and (iii) a corporation, partnership or sole proprietorship that is 100% owned by any of the persons in (i) or (ii). In addition, a trustee or other fiduciary can count all shares purchased for a single trust, estate or other single fiduciary account that has multiple accounts (including one or more employee benefit plans of the same employer).
Class A Sales Charge Waivers
Class A shares of a fund may be purchased at net asset value without a sales charge as follows:
| • | Purchases of $1,000,000 or more. |
| • | Monies representing reinvestment of Nuveen Defined Portfolio and Nuveen Mutual Fund distributions. |
Section 3 How You Can Buy and Sell Shares
37
| • | Employees of Nuveen Investments and its affiliates. Purchases by full-time and retired employees of Nuveen Investments and its affiliates and such employees’ immediate family members (as defined in the statement of additional information). |
| • | Current and former trustees/directors of the Nuveen Funds. |
| • | Financial intermediary personnel. Purchases by any person who, for at least the last 90 days, has been an officer, director, or bona fide employee of any financial intermediary or any such person’s immediate family member. |
| • | Certain trust departments. Purchases by bank or broker-affiliated trust departments investing funds over which they exercise exclusive discretionary investment authority and that are held in a fiduciary, agency, advisory, custodial or similar capacity. |
| • | Additional categories of investors. Purchases made by: (i) investors purchasing on a periodic fee, asset-based fee or no transaction fee basis through a broker-dealer sponsored mutual fund purchase program; and (ii) clients of investment advisers, financial planners or other financial intermediaries that charge periodic or asset-based fees for their services. |
In order to obtain a sales charge reduction or waiver, it may be necessary at the time of purchase for you to inform the funds or your financial advisor of the existence of other accounts in which there are holdings eligible to be aggregated for such purposes. You may need to provide the funds or your financial advisor information or records, such as account statements, in order to verify your eligibility for a sales charge reduction or waiver. This may include account statements of family members and information regarding Nuveen Mutual Fund shares held in accounts with other financial advisors. You or your financial advisor must notify the Distributor at the time of each purchase if you are eligible for any of these programs. The funds may modify or discontinue these programs at any time.

Fund shares may be purchased on any business day, which is any day the New York Stock Exchange (the “NYSE”) is open for business. Generally, the NYSE is closed on weekends and national holidays. The share price you pay depends on when the Distributor receives your order. Orders received before the close of trading on a business day (normally, 4:00 p.m. New York time) will receive that day’s closing share price; otherwise, you will receive the next business day’s price.
You may purchase fund shares (1) through a financial advisor or (2) directly from the funds.
Through a Financial Advisor
You may buy shares through your financial advisor, who can handle all the details for you, including opening a new account. Financial advisors can also help you review your financial needs and formulate long-term investment goals and objectives. In addition, financial advisors generally can help you develop a customized financial plan, select investments and monitor and review your portfolio on an ongoing basis to help assure your investments continue to meet your needs as circumstances change. Financial advisors (including brokers or agents) are paid for providing ongoing investment advice and services, either from fund sales charges and fees or by charging you a separate fee in lieu of a sales charge.
38
Section 3 How You Can Buy and Sell Shares
Financial advisors or other dealer firms may charge their customers a processing or service fee in connection with the purchase or redemption of fund shares. The amount and applicability of such a fee is determined and disclosed to customers by each individual dealer. Processing or service fees typically are fixed, nominal dollar amounts and are in addition to the sales and other charges described in this prospectus and the statement of additional information. Your dealer will provide you with specific information about any processing or service fees you will be charged. Shares you purchase through your financial advisor or other intermediary will normally be held with that firm. For more information, please contact your financial advisor.
Directly from the Funds
Eligible investors may purchase shares directly from the funds.
| • | By wire. You can purchase shares by making a wire transfer from your bank. Before making an initial investment by wire, you must submit a new account form to a fund. After receiving your form, a service representative will contact you with your account number and wiring instructions. Your order will be priced at the next closing share price based on the share class of your fund, calculated after the fund’s custodian receives your payment by wire. Wired funds must be received prior to 4:00 p.m. New York time to be eligible for same day pricing. Neither your fund nor the transfer agent are responsible for the consequences of delays resulting from the banking or Federal Reserve wire system, or from incomplete wiring instructions. Before making any additional purchases by wire, you should call Nuveen Investor Services at (800) 257-8787. You cannot purchase shares by wire on days when federally chartered banks are closed. |
| • | By mail. You may open an account directly with the funds and buy shares by completing an application and mailing it along with your check to: Nuveen Investor Services, P.O. Box 8530, Boston, Massachusetts 02266-8530. Applications may be obtained at www.nuveen.com or by calling (800) 257-8787. No third party checks will be accepted. |
The funds do not consider the U.S. Postal Service or other independent delivery services to be their agents. Therefore, deposit in the mail or with such services, or receipt at the post office box above, of purchase orders or redemption requests does not constitute receipt by the transfer agent of the funds.
| • | On-line. Existing shareholders with direct accounts may process certain account transactions on-line. You may purchase additional shares or exchange shares between existing, identically registered direct accounts. You can also look up your account balance, history and dividend information, as well as order duplicate account statements and tax forms from the funds’ website. To access your account, follow the links under “Our Products” on www.nuveen.com to “Mutual Funds” and choose “Account Access” under the “Shareholder Resources” tab. The system will walk you through the log-in process. To purchase shares on-line, you must have established Fund Direct privileges on your account prior to the requested transaction. See “Special Services—Fund Direct” below. |
| • | By telephone. Existing shareholders with direct accounts may also process account transactions via the funds’ automated information line. Simply call (800) 257-8787, press 1 for mutual funds and the voice menu will walk you through the process. To purchase shares by telephone, you must have established Fund Direct privileges on your account prior to the requested transaction. See “Special Services—Fund Direct” below. |
Section 3 How You Can Buy and Sell Shares
39

To help make your investing with us easy and efficient, we offer you the following services at no extra cost. Your financial advisor can help you complete the forms for these services, or you can call Nuveen Investor Services at (800) 257-8787 for copies of the necessary forms.
Systematic Investing
Once you have opened an account satisfying the applicable investment minimum, systematic investing allows you to make regular additional investments through automatic deductions from your bank account, directly from your paycheck, or from exchanging shares from another mutual fund account. The minimum automatic deduction is $100 per month. There is no charge to participate in your fund’s systematic investment plan. You can stop the deductions at any time by notifying your fund in writing.
| • | From your bank account. You can make systematic investments of $100 or more per month by authorizing your fund to draw pre-authorized checks on your bank account. |
| • | From your paycheck. With your employer’s consent, you can make systematic investments each pay period (collectively meeting the monthly minimum of $100) by authorizing your employer to deduct monies from your paycheck. |
| • | Systematic exchanging. You can make systematic investments by authorizing the Distributor to exchange shares from one Nuveen Mutual Fund account into another identically registered Nuveen Mutual Fund account of the same share class. |
Systematic Withdrawal
If the value of your fund account is at least $10,000, you may request to have $50 or more withdrawn automatically from your account. You may elect to receive payments monthly, quarterly, semi-annually or annually, and may choose to receive a check, have the monies transferred directly into your bank account (see “Fund Direct” below), paid to a third party or sent payable to you at an address other than your address of record. You must complete the appropriate section of the account application or Account Update Form to participate in each fund’s systematic withdrawal plan.
You should not establish systematic withdrawals if you intend to make concurrent purchases of Class A or Class C shares because you may unnecessarily pay a sales charge or CDSC on these purchases.
Exchanging Shares
Nuveen Mutual Funds currently utilize two transfer agents. Until November 30, 2011, you may exchange fund shares into an identically registered account for the same class of another Nuveen Mutual Fund available in your state. Your exchange must meet the minimum purchase requirements of the fund into which you are exchanging, and, if your shares are held with a financial intermediary, the financial intermediary must have the operational capability to support exchanges. You may also, under certain limited circumstances, exchange between certain classes of shares of the same fund, subject to the payment of any applicable CDSC. Please consult the statement of additional information for details.
Effective December 1, 2011, you may exchange fund shares into an identically registered account for the same class of another Nuveen Mutual Fund available in your state provided that the funds have the same transfer
40
Section 3 How You Can Buy and Sell Shares
agent. Exchanges between funds with different transfer agents will not be allowed. Your exchange must meet the minimum purchase requirements of the fund into which you are exchanging. You may also, under certain limited circumstances, exchange between certain classes of shares of the same fund, subject to the payment of any applicable CDSC. Please consult the statement of additional information for details.
Each fund reserves the right to revise or suspend the exchange privilege, limit the amount or number of exchanges, or reject any exchange. Shareholders will be provided with at least 60 days’ notice of any material revision to or termination of the exchange privilege.
Because an exchange between funds is treated for tax purposes as a purchase and sale, any gain may be subject to tax. An exchange between classes of shares of the same fund may not be considered a taxable event. You should consult your tax advisor about the tax consequences of exchanging your shares.
Fund DirectSM
The Fund Direct Program allows you to link your fund account to your bank account, transfer money electronically between these accounts and perform a variety of account transactions, including purchasing shares by telephone and investing through a systematic investment plan. You may also have dividends, distributions, redemption payments or systematic withdrawal plan payments sent directly to your bank account.
Reinstatement Privilege
If you redeem fund shares, you may reinvest all or part of your redemption proceeds up to one year later without incurring any additional charges. You may only reinvest into the same share class you redeemed. If you paid a CDSC, your fund will refund your CDSC and reinstate your holding period for purposes of calculating the CDSC. You may use this reinstatement privilege only once for any redemption. The reinstatement privilege is not available for Class B shares. Nuveen Mutual Funds currently utilize two transfer agents. The reinstatement privilege is limited to reinvestment in a fund which has the same transfer agent as the fund from which you redeemed.

You may sell (redeem) your shares on any business day. You will receive the share price next determined after your fund has received your properly completed redemption request. Your redemption request must be received before the close of trading on the NYSE (normally, 4:00 p.m. New York Time) for you to receive that day’s price. The fund will normally mail your check the next business day after a redemption request is received, but in no event more than seven days after your request is received. If you are selling shares purchased recently with a check, your redemption proceeds will not be mailed until your check has cleared, which may take up to ten days from your purchase date.
You may sell your shares (1) through a financial advisor or (2) directly to the funds.
Through a Financial Advisor
You may sell your shares through your financial advisor, who can prepare the necessary documentation. Your financial advisor may charge for this service.
Section 3 How You Can Buy and Sell Shares
41
Directly to the Funds
| • | By mail. You can sell your shares at any time by sending a written request to the appropriate fund, c/o Nuveen Investor Services, P.O. Box 8530, Boston, Massachusetts 02266-8530. Your request must include the following information: |
| • | The fund’s name; |
| • | Your name and account number; |
| • | The dollar or share amount you wish to redeem; |
| • | The signature of each owner exactly as it appears on the account; |
| • | The name of the person to whom you want your redemption proceeds paid (if other than to the shareholder of record); |
| • | The address where you want your redemption proceeds sent (if other than the address of record); |
| • | Any certificates you have for the shares; and |
| • | Any required signature guarantees. |
After you have established your account, signatures on a written request must be guaranteed if:
| • | You would like redemption proceeds payable or sent to any person, address, or bank account other than that on record; |
| • | You have changed the address on your fund’s records within the last 30 days; |
| • | Your redemption request is in excess of $50,000; or |
| • | You are requesting a change in ownership on your account. |
Non-financial transactions, including establishing or modifying certain services such as changing bank information on an account, will require a signature guarantee or signature verification from a Medallion Signature Guarantee Program member or other acceptable form of authentication from a financial institution source. In addition to the situations described above, the funds reserve the right to require a signature guarantee, or another acceptable form of signature verification, in other instances based on the circumstances of a particular situation.
A signature guarantee assures that a signature is genuine and protects shareholders from unauthorized account transfers. Banks, savings and loan associations, trust companies, credit unions, broker-dealers and member firms of a national securities exchange may guarantee signatures. Call your financial intermediary to determine if it has this capability. A notary public is not an acceptable signature guarantor. Proceeds from a written redemption request will be sent to you by check unless another form of payment is requested.
| • | On-line. You may redeem shares or exchange shares between existing, identically registered accounts on-line. To access your account, follow the links under “Our Products” on www.nuveen.com to “Mutual Funds” and choose “Account Access” under the “Shareholder Resources” tab. The system will walk you through the log-in process. On-line redemptions are not available for shares owned in certificate form and, with respect to redemptions where the proceeds are payable by check, may not exceed $50,000. Checks will only be issued to you as shareholder of record and mailed to your address of record. If you have established Fund Direct privileges, you may have redemption proceeds transferred electronically to your bank account. |
42
Section 3 How You Can Buy and Sell Shares
An Important Note About Telephone Transactions
Although Nuveen Investor Services has certain safeguards and procedures to confirm the identity of callers, it will not be liable for losses resulting from following telephone instructions it reasonably believes to be genuine. Also, you should verify your trade confirmations immediately upon receipt.
| • | By telephone. If your account is held with your fund and not in your brokerage account, and you have authorized telephone redemption privileges, call (800) 257-8787 to redeem your shares, press 1 for mutual funds and the voice menu will walk you through the process. Telephone redemptions are not available for shares owned in certificate form and, with respect to redemptions where the proceeds are payable by check, may not exceed $50,000. Checks will only be issued to you as the shareholder of record and mailed to your address of record, normally the next business day after the redemption request is received. If you have established Fund Direct privileges, you may have redemption proceeds transferred electronically to your bank account. In this case, the redemption proceeds will be transferred to your bank on the next business day after the redemption request is received. You should contact your bank for further information concerning the timing of the credit of the redemption proceeds in your bank account. |
Contingent Deferred Sales Charge
If you redeem Class A, Class B or Class C shares that are subject to a CDSC, you may be assessed a CDSC upon redemption. When you redeem Class A, Class B or Class C shares subject to a CDSC, your fund will first redeem any shares that are not subject to a CDSC, and then redeem the shares you have owned for the longest period of time, unless you ask the fund to redeem your shares in a different order. No CDSC is imposed on shares you buy through the reinvestment of dividends and capital gains. The CDSC holding period is calculated on a monthly basis and begins on the first day of the month in which the purchase was made. When you redeem shares subject to a CDSC, the CDSC is calculated on the lower of your purchase price or redemption proceeds, deducted from your redemption proceeds, and paid to the Distributor. The CDSC may be waived under certain special circumstances as described in the statement of additional information.
Accounts with Low Balances
The funds reserve the right to liquidate or assess a low balance fee on any account held directly with the funds that has a balance that has fallen below the account balance minimum of $1,000 for any reason, including market fluctuations.
If a fund elects to exercise this right, then annually the fund will assess a $15 low balance account fee on certain accounts with balances under the account balance minimum that are accounts established pursuant to the UTMA or UGMA. At the same time, other accounts with balances under the account balance minimum will be liquidated, with proceeds being mailed to the address of record. Prior to the assessment of any low balance fee or liquidation of low balance accounts, affected shareholders will receive a communication notifying them of the pending action, thereby providing time to ensure that balances are at or above the account balance minimum prior to any fee assessment or account liquidation. You will not be assessed a CDSC if your account is liquidated.
Redemptions In-Kind
The funds generally pay redemption proceeds in cash. Under unusual conditions that make cash payment unwise and for the protection of existing shareholders, the funds may pay all or a portion of your redemption proceeds in securities or other fund assets. Although it is unlikely that your shares would be redeemed in-kind, you would probably have to pay brokerage costs to sell the securities distributed to you, as well as taxes on any capital gains from that sale.
Section 3 How You Can Buy and Sell Shares
43
To help you understand the tax implications of investing in the funds, this section includes important details about how the funds make distributions to shareholders. We discuss some other fund policies as well.

The funds declare dividends daily and pay such dividends monthly, usually on the first business day of the month. Your account will begin to accrue dividends on the business day after the day when the monies used to purchase your shares are collected by the transfer agent. Each fund seeks to pay monthly tax-exempt dividends at a level rate that reflects the past and projected net income of the fund. To help maintain more stable monthly distributions, the distribution paid by a fund for any particular monthly period may be more or less than the amount of net income actually earned by the fund during such period, and any such under- (or over-) distribution of income is reflected in each fund’s net asset value. This policy is designed to result in the distribution of substantially all of a fund’s net income over time. The funds declare and pay any taxable capital gains or other taxable distributions once a year at year end.
Payment and Reinvestment Options
The funds automatically reinvest your dividends in additional fund shares unless you request otherwise. You may request to have your dividends paid to you by check, sent via electronic funds transfer through Automated Clearing House network or reinvested in shares of another Nuveen Mutual Fund. For further information, contact your financial advisor or call Nuveen Investor Services at (800) 257-8787. If you request that your distributions be paid by check but those distributions cannot be delivered because of an incorrect mailing address, or if a distribution check remains uncashed for six months, the undelivered or uncashed distributions and all future distributions will be reinvested in fund shares at the current net asset value.
Taxes and Tax Reporting
Because the funds invest primarily in municipal bonds from a particular state, the regular monthly dividends you, as a taxpayer in that state, receive will generally be exempt from regular federal and state income tax. A portion of these dividends, however, may be subject to the federal alternative minimum tax.
Generally the funds do not seek to realize taxable income or capital gains. However, the funds may realize and distribute taxable income or capital gains from time to time as a result of each fund’s normal investment activities. The funds’ distributions of these amounts are taxed as ordinary income or capital gains and are taxable whether received in cash or reinvested in additional shares. Dividends from the funds’ long-term capital gains are taxable as capital gains, while dividends from short-term capital gains and net investment income are generally taxable as ordinary income. The funds’ taxable dividends are not expected to qualify for a dividends received deduction if you are a corporate shareholder or for the lower tax rates on qualified dividend income.
44
Section 4 General Information
Early in each year, you will receive a statement detailing the amount and nature of all dividends and capital gains that you were paid during the prior year. If you hold your investment at the firm where you purchased your fund shares, you will receive the statement from that firm. If you hold your shares directly with the fund, the Distributor will send you the statement. The tax status of your dividends is the same whether you reinvest your dividends or elect to receive them in cash.
If you receive social security or railroad retirement benefits, you should consult your tax advisor about how an investment in the funds may affect the taxation of your benefits.
Each sale or exchange of fund shares may be a taxable event. When you exchange shares of one Nuveen Mutual Fund for shares of a different Nuveen Mutual Fund, the exchange is treated the same as a sale for tax purposes. A sale may result in capital gain or loss to you. The gain or loss generally will be treated as short-term if you held the shares for 12 months or less and long-term if you held the shares for more than 12 months at the time of disposition.
Please note that if you do not furnish the funds with your correct social security number or employer identification number, you fail to provide certain certifications to the funds, you fail to certify whether you are a U.S. citizen or a U.S. resident alien, or the Internal Revenue Service notifies the funds to withhold, federal law requires the funds to withhold federal income tax from your distributions and redemption proceeds at the applicable withholding rate.
Please consult the statement of additional information and your tax advisor for more information about taxes.
Buying or Selling Shares Close to a Record Date
Buying fund shares shortly before the record date for a taxable income or capital gain distribution is commonly known as “buying the dividend.” The entire distribution may be taxable to you even though a portion of the distribution effectively represents a return of your purchase price.
Taxable Equivalent Yields
The taxable equivalent yield is the current yield you would need to earn on a taxable investment in order to equal a stated federal tax-free yield on a municipal investment. To assist you in comparing municipal investments like the funds with fully taxable alternative investments, the table below presents the taxable equivalent yields for a range of hypothetical federal tax-free yields and tax rates:
| Taxable Equivalents of Tax-Free Yields | To Equal a Tax-Free Yield of: | |||||||||||||||
| 2.00 | % | 3.00 | % | 4.00 | % | 5.00 | % | |||||||||
| Tax Bracket: | A Taxable Investment Would Need to Yield: | |||||||||||||||
| 25% | 2.67 | % | 4.00 | % | 5.33 | % | 6.67 | % | ||||||||
| 28% | 2.78 | % | 4.17 | % | 5.56 | % | 6.94 | % | ||||||||
| 33% | 2.99 | % | 4.48 | % | 5.97 | % | 7.46 | % | ||||||||
| 35% | 3.08 | % | 4.62 | % | 6.15 | % | 7.69 | % | ||||||||
The yields and tax rates shown above are hypothetical and do not predict your actual returns or effective tax rate. For more detailed information, see the statement of additional information or consult your tax advisor.
Section 4 General Information
45

The Distributor serves as the selling agent and distributor of the funds’ shares. In this capacity, the Distributor manages the offering of the funds’ shares and is responsible for all sales and promotional activities. In order to reimburse the Distributor for its costs in connection with these activities, including compensation paid to financial intermediaries, each fund has adopted a distribution and service plan under Rule 12b-1 under the 1940 Act. See “How You Can Buy and Sell Shares—What Share Classes We Offer” for a description of the distribution and service fees paid under this plan.
Under the plan, the Distributor receives a distribution fee for Class B and Class C shares primarily for providing compensation to financial intermediaries, including the Distributor, in connection with the distribution of shares. The Distributor receives a service fee for Class A, Class B, and Class C shares to compensate financial intermediaries, including the Distributor, for providing ongoing account services to shareholders. These services may include establishing and maintaining shareholder accounts, answering shareholder inquiries and providing other personal services to shareholders. These fees also compensate the Distributor for other expenses, including printing and distributing prospectuses to persons other than shareholders, and preparing, printing, and distributing advertising, sales literature and reports to shareholders used in connection with the sale of shares. Because these fees are paid out of the funds’ assets on an ongoing basis, over time these fees will increase the cost of your investment and may cost you more than paying other types of sales charges. Long-term holders of Class C shares may pay more in distribution and service fees and CDSCs than the economic equivalent of the maximum front-end sales charge permitted under the Financial Industry Regulatory Authority Conduct Rules.
Other Payments to Financial Intermediaries
In addition to the sales commissions and certain payments from distribution and service fees to financial intermediaries as previously described, the Distributor may from time to time make additional payments, out of its own resources, to certain financial intermediaries that sell shares of Nuveen Mutual Funds in order to promote the sales and retention of fund shares by those firms and their customers. The amounts of these payments vary by financial intermediary and, with respect to a given firm, are typically calculated by reference to the amount of the firm’s recent gross sales of Nuveen Mutual Fund shares and/or total assets of Nuveen Mutual Funds held by the firm’s customers. The level of payments that the Distributor is willing to provide to a particular financial intermediary may be affected by, among other factors, the firm’s total assets held in and recent net investments into Nuveen Mutual Funds, the firm’s level of participation in Nuveen Mutual Fund sales and marketing programs, the firm’s compensation program for its registered representatives who sell fund shares and provide services to fund shareholders, and the asset class of the Nuveen Mutual Funds for which these payments are provided. For 2010, these payments in the aggregate were approximately 0.035% to 0.040% of the assets in the Nuveen Mutual Funds, although payments to particular financial intermediaries can be significantly higher. The statement of additional information contains additional information about these payments, including the names of the firms to which payments are made. The Distributor may also make payments to financial intermediaries in connection with sales meetings, due diligence meetings, prospecting seminars and other meetings at which the Distributor promotes its products and services.
46
Section 4 General Information
In connection with the availability of Nuveen Mutual Funds within selected mutual fund no-transaction fee institutional platforms and fee-based wrap programs (together, “Platform Programs”) at certain financial intermediaries, the Distributor also makes payments out of its own assets to those firms as compensation for certain recordkeeping, shareholder communications and other account administration services provided to Nuveen Mutual Fund shareholders who own their fund shares in these Platform Programs. These payments are in addition to the service fee and any applicable omnibus sub-accounting fees paid to these firms with respect to these services by the Nuveen Mutual Funds out of fund assets.
The amounts of payments to a financial intermediary could be significant, and may create an incentive for the intermediary or its representatives to recommend or offer shares of the funds to you. The intermediary may elevate the prominence or profile of the funds within the intermediary’s organization by, for example, placing the funds on a list of preferred or recommended funds and/or granting the Distributor and/or its affiliates preferential or enhanced opportunities to promote the funds in various ways within the intermediary’s organization.

The price you pay for your shares is based on each fund’s net asset value per share, which is determined as of the close of trading (normally 4:00 p.m. New York time) on each day the NYSE is open for business. Net asset value is calculated for each class of each fund by taking the value of the class’ total assets, including interest or dividends accrued but not yet collected, less all liabilities, and dividing by the total number of shares outstanding. The result, rounded to the nearest cent, is the net asset value per share. All valuations are subject to review by the funds’ Board of Trustees or its designee.
In determining net asset value, portfolio instruments generally are valued using prices provided by independent pricing services or obtained from other sources, such as broker-dealer quotations, all as approved by the Board of Trustees. Independent pricing services typically value non-equity portfolio instruments utilizing a range of market-based inputs and assumptions, including readily available market quotations obtained from broker-dealers making markets in such instruments, cash flows, and transactions for comparable instruments. In pricing certain securities, particularly less liquid and lower quality securities, the pricing services may consider information about a security, its issuer, or market activity provided by the fund’s investment adviser or sub-adviser.
If a price cannot be obtained from a pricing service or other pre-approved source, or if Nuveen Fund Advisors deems such price to be unreliable, a portfolio instrument may be valued by a fund at its fair value as determined in good faith by the Board of Trustees or its designee. As a general principle, the fair value of a portfolio instrument is the amount that an owner might reasonably expect to receive upon the instrument’s current sale. A range of factors and analysis may be considered when determining fair value, including relevant market data, interest rates, credit considerations and/or issuer-specific news. A fund may rely on an independent fair valuation service in making any such fair value determinations.
Section 4 General Information
47

The funds are intended for long-term investment and should not be used for excessive trading. Excessive trading in the funds’ shares can disrupt portfolio management, lead to higher operating costs, and cause other operating inefficiencies for the funds. However, the funds are also mindful that shareholders may have valid reasons for periodically purchasing and redeeming fund shares.
Accordingly, the funds have adopted a Frequent Trading Policy that seeks to balance the funds’ need to prevent excessive trading in fund shares while offering investors the flexibility in managing their financial affairs to make periodic purchases and redemptions of fund shares.
The funds’ Frequent Trading Policy generally limits an investor to four “round trip” trades in a 12-month period. A “round trip” is the purchase and subsequent redemption of fund shares, including by exchange. Each side of a round trip may be comprised of either a single transaction or a series of closely-spaced transactions. The funds may also suspend the trading privileges of any investor who makes a round trip within a 30-day period if the purchase and redemption are of substantially similar dollar amounts and represent at least 25% of the value of the investor’s account.
The funds primarily receive share purchase and redemption orders through third-party financial intermediaries, some of whom rely on the use of omnibus accounts. An omnibus account typically includes multiple investors and provides the funds only with a net purchase or redemption amount on any given day where multiple purchases, redemptions and exchanges of shares occur in the account. The identity of individual purchasers, redeemers and exchangers whose orders are aggregated in omnibus accounts, and the size of their orders, will generally not be known by the funds. Despite the funds’ efforts to detect and prevent frequent trading, the funds may be unable to identify frequent trading because the netting effect in omnibus accounts often makes it more difficult to identify frequent traders. The Distributor has entered into agreements with financial intermediaries that maintain omnibus accounts with the funds’ transfer agent. Under the terms of these agreements, the financial intermediaries undertake to cooperate with the Distributor in monitoring purchase, exchange and redemption orders by their customers in order to detect and prevent frequent trading in the funds through such accounts. Technical limitations in operational systems at such intermediaries or at the Distributor may also limit the funds’ ability to detect and prevent frequent trading. In addition, the funds may permit certain financial intermediaries, including broker-dealer and retirement plan administrators, among others, to enforce their own internal policies and procedures concerning frequent trading. Such policies may differ from the funds’ Frequent Trading Policy and may be approved for use in instances where the funds reasonably believe that the intermediary’s policies and procedures effectively discourage inappropriate trading activity. Shareholders holding their accounts with such intermediaries may wish to contact the intermediary for information regarding its frequent trading policy. Although the funds do not knowingly permit frequent trading, they cannot guarantee that they will be able to identify and restrict all frequent trading activity.
The funds reserve the right in their sole discretion to waive unintentional or minor violations (including transactions below certain dollar thresholds) if they determine that doing so would not harm the interests of fund
48
Section 4 General Information
shareholders. In addition, certain categories of redemptions may be excluded from the application of the Frequent Trading Policy, as described in more detail in the statement of additional information. These include, among others, redemptions pursuant to systematic withdrawal plans, redemptions in connection with the total disability or death of the investor, involuntary redemptions by operation of law, redemptions in payment of account or plan fees, and certain redemptions by retirement plans, including redemptions in connection with qualifying loans or hardship withdrawals, termination of plan participation, return of excess contributions, and required minimum distributions. The funds may also modify or suspend the Frequent Trading Policy without notice during periods of market stress or other unusual circumstances.
The funds reserve the right to impose restrictions on purchases or exchanges that are more restrictive than those stated above if they determine, in their sole discretion, that a transaction or a series of transactions involves market timing or excessive trading that may be detrimental to fund shareholders. The funds also reserve the right to reject any purchase order, including exchange purchases, for any reason. For example, a fund may refuse purchase orders if the fund would be unable to invest the proceeds from the purchase order in accordance with the fund’s investment policies and/or objective, or if the fund would be adversely affected by the size of the transaction, the frequency of trading in the account or various other factors. For more information about the funds’ Frequent Trading Policy and its enforcement, see “Purchase and Redemption of Fund Shares—Frequent Trading Policy” in the statement of additional information.

The custodian of the assets of the funds is State Street Bank & Trust Company, P.O. Box 5043, Boston, Massachusetts 02206-5043. The custodian also provides certain accounting services to the funds. The funds’ transfer, shareholder services and dividend paying agent, Boston Financial Data Services, Inc., P.O. Box 8530, Boston, Massachusetts 02266-8530, performs bookkeeping, data processing and administrative services for the maintenance of shareholder accounts.
Section 4 General Information
49
Section 5 Financial Highlights
The financial highlights table is intended to help you understand a fund’s financial performance for the past five fiscal years. Certain information reflects financial results for a single fund share. The total returns in the table represent the rate that an investor would have earned (or lost) on an investment in a fund (assuming reinvestment of all dividends and distributions). The information for each of the last five fiscal years has been audited by PricewaterhouseCoopers LLP, whose report for the most recent fiscal year, along with the funds’ financial statements, are included in the annual report, which is available upon request.
Nuveen Kansas Municipal Bond Fund
Class (Commencement Date) | Investment Operations | Less Distributions | Ratios/Supplemental Data | |||||||||||||||||||||||||||||||||||||||||||||||||
Year Ended May 31, | Beginning Net Asset Value | Net Investment Income (Loss)(a) | Net Realized/ Unrealized Gain (Loss) | Total | Net Investment Income | Capital Gains(b) | Total | Ending Net Asset Value | Total Return(c) | Ending Net Assets (000) | Ratios of Expenses to Average Net Assets(d)(e) | Ratios of Net Investment Income to Average Net Assets(d) | Portfolio Turnover Rate | |||||||||||||||||||||||||||||||||||||||
| Class A (1/92) | ||||||||||||||||||||||||||||||||||||||||||||||||||||
| 2011 | $ | 10.48 | $ | .43 | $ | (.11 | ) | $ | .32 | $ | (.43 | ) | $ | — | $ | (.43 | ) | $ | 10.37 | 3.10 | % | $ | 122,629 | .83 | % | 4.12 | % | 16 | % | |||||||||||||||||||||||
| 2010 | 10.03 | .44 | .44 | .88 | (.43 | ) | — | (.43 | ) | 10.48 | 8.67 | 120,162 | .84 | 4.27 | 18 | |||||||||||||||||||||||||||||||||||||
| 2009 | 10.23 | .43 | (.20 | ) | .23 | (.43 | ) | — | (.43 | ) | 10.03 | 2.62 | 110,130 | .85 | 4.38 | 13 | ||||||||||||||||||||||||||||||||||||
| 2008 | 10.40 | .43 | (.16 | ) | .27 | (.42 | ) | (.02 | ) | (.44 | ) | 10.23 | 2.70 | 94,259 | .87 | 4.12 | 16 | |||||||||||||||||||||||||||||||||||
| 2007 | 10.38 | .42 | .01 | .43 | (.41 | ) | — | (.41 | ) | 10.40 | 4.22 | 97,477 | .85 | 4.03 | 22 | |||||||||||||||||||||||||||||||||||||
| Class B (2/97) | ||||||||||||||||||||||||||||||||||||||||||||||||||||
| 2011 | 10.39 | .34 | (.10 | ) | .24 | (.35 | ) | — | (.35 | ) | 10.28 | 2.35 | 895 | 1.58 | 3.35 | 16 | ||||||||||||||||||||||||||||||||||||
| 2010 | 9.94 | .36 | .44 | .80 | (.35 | ) | — | (.35 | ) | 10.39 | 7.92 | 2,089 | 1.59 | 3.53 | 18 | |||||||||||||||||||||||||||||||||||||
| 2009 | 10.14 | .35 | (.20 | ) | .15 | (.35 | ) | — | (.35 | ) | 9.94 | 1.82 | 3,389 | 1.60 | 3.62 | 13 | ||||||||||||||||||||||||||||||||||||
| 2008 | 10.31 | .35 | (.16 | ) | .19 | (.34 | ) | (.02 | ) | (.36 | ) | 10.14 | 1.95 | 4,721 | 1.62 | 3.37 | 16 | |||||||||||||||||||||||||||||||||||
| 2007 | 10.30 | .34 | .01 | .35 | (.34 | ) | — | (.34 | ) | 10.31 | 3.38 | 5,840 | 1.61 | 3.28 | 22 | |||||||||||||||||||||||||||||||||||||
| Class C (2/97) | ||||||||||||||||||||||||||||||||||||||||||||||||||||
| 2011 | 10.48 | .37 | (.12 | ) | .25 | (.37 | ) | — | (.37 | ) | 10.36 | 2.47 | 36,864 | 1.38 | 3.58 | 16 | ||||||||||||||||||||||||||||||||||||
| 2010 | 10.03 | .38 | .44 | .82 | (.37 | ) | — | (.37 | ) | 10.48 | 8.10 | 33,948 | 1.39 | 3.71 | 18 | |||||||||||||||||||||||||||||||||||||
| 2009 | 10.23 | .38 | (.21 | ) | .17 | (.37 | ) | — | (.37 | ) | 10.03 | 2.05 | 25,570 | 1.40 | 3.83 | 13 | ||||||||||||||||||||||||||||||||||||
| 2008 | 10.40 | .37 | (.15 | ) | .22 | (.37 | ) | (.02 | ) | (.39 | ) | 10.23 | 2.17 | 21,090 | 1.42 | 3.57 | 16 | |||||||||||||||||||||||||||||||||||
| 2007 | 10.38 | .37 | .01 | .38 | (.36 | ) | — | (.36 | ) | 10.40 | 3.69 | 21,767 | 1.40 | 3.48 | 22 | |||||||||||||||||||||||||||||||||||||
| Class I (2/97)(f) | ||||||||||||||||||||||||||||||||||||||||||||||||||||
| 2011 | 10.53 | .45 | (.11 | ) | .34 | (.45 | ) | — | (.45 | ) | 10.42 | 3.32 | 10,648 | .63 | 4.29 | 16 | ||||||||||||||||||||||||||||||||||||
| 2010 | 10.07 | .46 | .45 | .91 | (.45 | ) | — | (.45 | ) | 10.53 | 8.96 | 7,960 | .64 | 4.47 | 18 | |||||||||||||||||||||||||||||||||||||
| 2009 | 10.27 | .45 | (.20 | ) | .25 | (.45 | ) | — | (.45 | ) | 10.07 | 2.82 | 5,069 | .65 | 4.58 | 13 | ||||||||||||||||||||||||||||||||||||
| 2008 | 10.45 | .45 | (.16 | ) | .29 | (.45 | ) | (.02 | ) | (.47 | ) | 10.27 | 2.83 | 4,293 | .67 | 4.31 | 16 | |||||||||||||||||||||||||||||||||||
| 2007 | 10.42 | .45 | .02 | .47 | (.44 | ) | — | (.44 | ) | 10.45 | 4.54 | 3,264 | .65 | 4.23 | 22 | |||||||||||||||||||||||||||||||||||||
| (a) | Per share Net Investment Income (Loss) is calculated using the average daily shares method. |
| (b) | Distributions from Capital Gains include short-term capital gains, if any. |
| (c) | Total Return is the combination of changes in net asset value without any sales charge, reinvested dividend income at net asset value and reinvested capital gains distributions at net asset value, if any. Total Return is not annualized. |
| (d) | Ratios do not reflect the effect of custodian fee credits earned on the Fund’s net cash on deposit with the custodian bank, where applicable. |
| (e) | The expense ratios reflect, among other things, the interest expense deemed to have been paid by the Fund on the floating rate certificates issued by the special purpose trusts for the self-deposited inverse floaters held by the Fund, where applicable, as described in Footnote 1—General Information and Significant Accounting Policies, Inverse Floating Rate Securities, in the most recent shareholder report. |
| (f) | Effective May 1, 2008, Class R Shares were renamed Class I Shares. |
50
Section 5 Financial Highlights
Nuveen Kentucky Municipal Bond Fund
Class (Commencement Date) | Investment Operations | Less Distributions | Ratios/Supplemental Data | |||||||||||||||||||||||||||||||||||||||||||||||||
Year Ended May 31, | Beginning Net Asset Value | Net Investment Income (Loss)(a) | Net Realized/ Unrealized Gain (Loss) | Total | Net Investment Income | Capital Gains(b) | Total | Ending Net Asset Value | Total Return(c) | Ending Net Assets (000) | Ratios of Expenses to Average Net Assets(d)(e) | Ratios of Net Investment Income to Average Net Assets(d) | Portfolio Turnover Rate | |||||||||||||||||||||||||||||||||||||||
| Class A (5/87) | ||||||||||||||||||||||||||||||||||||||||||||||||||||
| 2011 | $ | 10.85 | $ | .46 | $ | (.18 | ) | $ | .28 | $ | (.44 | ) | $ | — | $ | (.44 | ) | $ | 10.69 | 2.68 | % | $ | 334,809 | .80 | % | 4.26 | % | 7 | % | |||||||||||||||||||||||
| 2010 | 10.39 | .44 | .46 | .90 | (.44 | ) | — | * | (.44 | ) | 10.85 | 8.81 | 376,621 | .81 | 4.15 | 9 | ||||||||||||||||||||||||||||||||||||
| 2009 | 10.78 | .44 | (.32 | ) | .12 | (.44 | ) | (.07 | ) | (.51 | ) | 10.39 | 1.33 | 346,849 | .85 | 4.28 | 19 | |||||||||||||||||||||||||||||||||||
| 2008 | 10.96 | .44 | (.16 | ) | .28 | (.44 | ) | (.02 | ) | (.46 | ) | 10.78 | 2.63 | 362,734 | .89 | 4.04 | 8 | |||||||||||||||||||||||||||||||||||
| 2007 | 10.96 | .44 | .03 | .47 | (.45 | ) | (.02 | ) | (.47 | ) | 10.96 | 4.35 | 392,262 | .90 | 4.00 | 9 | ||||||||||||||||||||||||||||||||||||
| Class B (2/97) | ||||||||||||||||||||||||||||||||||||||||||||||||||||
| 2011 | 10.85 | .38 | (.16 | ) | .22 | (.37 | ) | — | (.37 | ) | 10.70 | 2.03 | 2,465 | 1.55 | 3.49 | 7 | ||||||||||||||||||||||||||||||||||||
| 2010 | 10.40 | .36 | .45 | .81 | (.36 | ) | — | * | (.36 | ) | 10.85 | 7.91 | 5,119 | 1.56 | 3.40 | 9 | ||||||||||||||||||||||||||||||||||||
| 2009 | 10.79 | .36 | (.32 | ) | .04 | (.36 | ) | (.07 | ) | (.43 | ) | 10.40 | .56 | 7,289 | 1.60 | 3.52 | 19 | |||||||||||||||||||||||||||||||||||
| 2008 | 10.97 | .36 | (.17 | ) | .19 | (.35 | ) | (.02 | ) | (.37 | ) | 10.79 | 1.85 | 9,685 | 1.64 | 3.29 | 8 | |||||||||||||||||||||||||||||||||||
| 2007 | 10.97 | .36 | .03 | .39 | (.37 | ) | (.02 | ) | (.39 | ) | 10.97 | 3.56 | 13,466 | 1.65 | 3.26 | 9 | ||||||||||||||||||||||||||||||||||||
| Class C (10/93) | ||||||||||||||||||||||||||||||||||||||||||||||||||||
| 2011 | 10.85 | .40 | (.16 | ) | .24 | (.39 | ) | — | (.39 | ) | 10.70 | 2.22 | 51,820 | 1.35 | 3.71 | 7 | ||||||||||||||||||||||||||||||||||||
| 2010 | 10.39 | .38 | .46 | .84 | (.38 | ) | — | * | (.38 | ) | 10.85 | 8.20 | 55,515 | 1.36 | 3.59 | 9 | ||||||||||||||||||||||||||||||||||||
| 2009 | 10.79 | .38 | (.33 | ) | .05 | (.38 | ) | (.07 | ) | (.45 | ) | 10.39 | .64 | 47,428 | 1.40 | 3.73 | 19 | |||||||||||||||||||||||||||||||||||
| 2008 | 10.96 | .38 | (.15 | ) | .23 | (.38 | ) | (.02 | ) | (.40 | ) | 10.79 | 2.15 | 46,588 | 1.44 | 3.49 | 8 | |||||||||||||||||||||||||||||||||||
| 2007 | 10.96 | .38 | .02 | .40 | (.38 | ) | (.02 | ) | (.40 | ) | 10.96 | 3.73 | 46,650 | 1.45 | 3.45 | 9 | ||||||||||||||||||||||||||||||||||||
| Class I (2/97)(f) | ||||||||||||||||||||||||||||||||||||||||||||||||||||
| 2011 | 10.85 | .48 | (.16 | ) | .32 | (.47 | ) | — | (.47 | ) | 10.70 | 3.01 | 10,967 | .60 | 4.46 | 7 | ||||||||||||||||||||||||||||||||||||
| 2010 | 10.39 | .47 | .45 | .92 | (.46 | ) | — | * | (.46 | ) | 10.85 | 9.00 | 7,453 | .61 | 4.35 | 9 | ||||||||||||||||||||||||||||||||||||
| 2009 | 10.79 | .46 | (.33 | ) | .13 | (.46 | ) | (.07 | ) | (.53 | ) | 10.39 | 1.41 | 3,394 | .65 | 4.48 | 19 | |||||||||||||||||||||||||||||||||||
| 2008 | 10.96 | .46 | (.15 | ) | .31 | (.46 | ) | (.02 | ) | (.48 | ) | 10.79 | 2.90 | 2,891 | .69 | 4.24 | 8 | |||||||||||||||||||||||||||||||||||
| 2007 | 10.96 | .47 | .02 | .49 | (.47 | ) | (.02 | ) | (.49 | ) | 10.96 | 4.52 | 3,069 | .70 | 4.20 | 9 | ||||||||||||||||||||||||||||||||||||
| (a) | Per share Net Investment Income (Loss) is calculated using the average daily shares method. |
| (b) | Distributions from Capital Gains include short-term capital gains, if any. |
| (c) | Total Return is the combination of changes in net asset value without any sales charge, reinvested dividend income at net asset value and reinvested capital gains distributions at net asset value, if any. Total Return is not annualized. |
| (d) | Ratios do not reflect the effect of custodian fee credits earned on the Fund’s net cash on deposit with the custodian bank, where applicable. |
| (e) | The expense ratios reflect, among other things, the interest expense deemed to have been paid by the Fund on the floating rate certificates issued by the special purpose trusts for the self-deposited inverse floaters held by the Fund, where applicable, as described in Footnote 1—General Information and Significant Accounting Policies, Inverse Floating Rate Securities, in the most recent shareholder report. |
| (f) | Effective May 1, 2008, Class R Shares were renamed Class I Shares. |
| * | Rounds to less than $.01 per share. |
Section 5 Financial Highlights
51
Nuveen Michigan Municipal Bond Fund
| Class (Commencement Date) | Investment Operations | Less Distributions | Ratios/Supplemental Data | |||||||||||||||||||||||||||||||||||||||||||||||||
Year Ended May 31, | Beginning Net Asset Value | Net Investment Income (Loss)(a) | Net Realized/ Unrealized Gain (Loss) | Total | Net Investment Income | Capital Gains(b) | Total | Ending Net Asset Value | Total Return(c) | Ending Net Assets (000) | Ratios of Expenses to Average Net Assets(d)(e) | Ratios of Net Investment Income to Average Net Assets(d) | Portfolio Turnover Rate | |||||||||||||||||||||||||||||||||||||||
| Class A (6/85) | ||||||||||||||||||||||||||||||||||||||||||||||||||||
| 2011 | $ | 11.19 | $ | .47 | $ | (.12 | ) | $ | .35 | $ | (.46 | ) | $ | — | $ | (.46 | ) | $ | 11.08 | 3.16 | % | $ | 148,020 | .84 | % | 4.22 | % | 6 | % | |||||||||||||||||||||||
| 2010 | 10.83 | .46 | .36 | .82 | (.46 | ) | — | (.46 | ) | 11.19 | 7.73 | 159,191 | .85 | 4.18 | 11 | |||||||||||||||||||||||||||||||||||||
| 2009 | 11.15 | .47 | (.32 | ) | .15 | (.46 | ) | (.01 | ) | (.47 | ) | 10.83 | 1.59 | 151,852 | .86 | 4.45 | 9 | |||||||||||||||||||||||||||||||||||
| 2008 | 11.41 | .47 | (.23 | ) | .24 | (.47 | ) | (.03 | ) | (.50 | ) | 11.15 | 2.17 | 159,696 | .86 | 4.14 | 14 | |||||||||||||||||||||||||||||||||||
| 2007 | 11.45 | .47 | .07 | .54 | (.48 | ) | (.10 | ) | (.58 | ) | 11.41 | 4.70 | 169,395 | .91 | 4.09 | 12 | ||||||||||||||||||||||||||||||||||||
| Class B (2/97) | ||||||||||||||||||||||||||||||||||||||||||||||||||||
| 2011 | 11.21 | .38 | (.12 | ) | .26 | (.37 | ) | — | (.37 | ) | 11.10 | 2.41 | 964 | 1.59 | 3.47 | 6 | ||||||||||||||||||||||||||||||||||||
| 2010 | 10.86 | .38 | .35 | .73 | (.38 | ) | — | (.38 | ) | 11.21 | 6.86 | 1,674 | 1.60 | 3.44 | 11 | |||||||||||||||||||||||||||||||||||||
| 2009 | 11.17 | .40 | (.32 | ) | .08 | (.38 | ) | (.01 | ) | (.39 | ) | 10.86 | .94 | 2,858 | 1.61 | 3.70 | 9 | |||||||||||||||||||||||||||||||||||
| 2008 | 11.43 | .38 | (.22 | ) | .16 | (.39 | ) | (.03 | ) | (.42 | ) | 11.17 | 1.41 | 4,080 | 1.61 | 3.40 | 14 | |||||||||||||||||||||||||||||||||||
| 2007 | 11.48 | .39 | .05 | .44 | (.39 | ) | (.10 | ) | (.49 | ) | 11.43 | 3.85 | 4,845 | 1.67 | 3.35 | 12 | ||||||||||||||||||||||||||||||||||||
| Class C (6/93) | ||||||||||||||||||||||||||||||||||||||||||||||||||||
| 2011 | 11.18 | .41 | (.11 | ) | .30 | (.40 | ) | — | (.40 | ) | 11.08 | 2.70 | 29,681 | 1.39 | 3.67 | 6 | ||||||||||||||||||||||||||||||||||||
| 2010 | 10.83 | .40 | .35 | .75 | (.40 | ) | — | (.40 | ) | 11.18 | 7.05 | 30,655 | 1.40 | 3.63 | 11 | |||||||||||||||||||||||||||||||||||||
| 2009 | 11.15 | .42 | (.33 | ) | .09 | (.40 | ) | (.01 | ) | (.41 | ) | 10.83 | 1.04 | 32,068 | 1.41 | 3.90 | 9 | |||||||||||||||||||||||||||||||||||
| 2008 | 11.40 | .41 | (.23 | ) | .18 | (.40 | ) | (.03 | ) | (.43 | ) | 11.15 | 1.67 | 35,814 | 1.41 | 3.59 | 14 | |||||||||||||||||||||||||||||||||||
| 2007 | 11.44 | .41 | .06 | .47 | (.41 | ) | (.10 | ) | (.51 | ) | 11.40 | 4.11 | 37,779 | 1.46 | 3.54 | 12 | ||||||||||||||||||||||||||||||||||||
| Class I (2/97)(f) | ||||||||||||||||||||||||||||||||||||||||||||||||||||
| 2011 | 11.18 | .49 | (.11 | ) | .38 | (.48 | ) | — | (.48 | ) | 11.08 | 3.46 | 19,397 | .64 | 4.42 | 6 | ||||||||||||||||||||||||||||||||||||
| 2010 | 10.83 | .48 | .36 | .84 | (.49 | ) | — | (.49 | ) | 11.18 | 7.87 | 19,888 | .65 | 4.38 | 11 | |||||||||||||||||||||||||||||||||||||
| 2009 | 11.15 | .50 | (.32 | ) | .18 | (.49 | ) | (.01 | ) | (.50 | ) | 10.83 | 1.82 | 18,297 | .66 | 4.65 | 9 | |||||||||||||||||||||||||||||||||||
| 2008 | 11.41 | .49 | (.23 | ) | .26 | (.49 | ) | (.03 | ) | (.52 | ) | 11.15 | 2.39 | 19,100 | .66 | 4.34 | 14 | |||||||||||||||||||||||||||||||||||
| 2007 | 11.45 | .50 | .06 | .56 | (.50 | ) | (.10 | ) | (.60 | ) | 11.41 | 4.92 | 20,351 | .71 | 4.29 | 12 | ||||||||||||||||||||||||||||||||||||
| (a) | Per share Net Investment Income (Loss) is calculated using the average daily shares method. |
| (b) | Distributions from Capital Gains include short-term capital gains, if any. |
| (c) | Total Return is the combination of changes in net asset value without any sales charge, reinvested dividend income at net asset value and reinvested capital gains distributions at net asset value, if any. Total Return is not annualized. |
| (d) | Ratios do not reflect the effect of custodian fee credits earned on the Fund’s net cash on deposit with the custodian bank, where applicable. |
| (e) | The expense ratios reflect, among other things, the interest expense deemed to have been paid by the Fund on the floating rate certificates issued by the special purpose trusts for the self-deposited inverse floaters held by the Fund, where applicable, as described in Footnote 1—General Information and Significant Accounting Policies, Inverse Floating Rate Securities, in the most recent shareholder report. |
| (f) | Effective May 1, 2008, Class R Shares were renamed Class I Shares. |
52
Section 5 Financial Highlights
Nuveen Missouri Municipal Bond Fund
| Class (Commencement Date) | Investment Operations | Less Distributions | Ratios/Supplemental Data | |||||||||||||||||||||||||||||||||||||||||||||||||
Year Ended May 31, | Beginning Net Asset Value | Net Investment Income (Loss)(a) | Net Realized/ Unrealized Gain (Loss) | Total | Net Investment Income | Capital Gains(b) | Total | Ending Net Asset Value | Total Return(c) | Ending Net Assets (000) | Ratios of Expenses to Average Net Assets(d)(e) | Ratios of Net Investment Income to Average Net Assets(d) | Portfolio Turnover Rate | |||||||||||||||||||||||||||||||||||||||
| Class A (8/87) | ||||||||||||||||||||||||||||||||||||||||||||||||||||
| 2011 | $ | 10.82 | $ | .48 | $ | (.13 | ) | $ | .35 | $ | (.47 | ) | $ | — | $ | (.47 | ) | $ | 10.70 | 3.30 | % | $ | 187,844 | .82 | % | 4.48 | % | 6 | % | |||||||||||||||||||||||
| 2010 | 10.14 | .48 | .66 | 1.14 | (.46 | ) | — | (.46 | ) | 10.82 | 11.49 | 196,974 | .83 | 4.52 | 6 | |||||||||||||||||||||||||||||||||||||
| 2009 | 10.73 | .47 | (.56 | ) | (.09 | ) | (.45 | ) | (.05 | ) | (.50 | ) | 10.14 | (.52 | ) | 183,868 | .86 | 4.68 | 12 | |||||||||||||||||||||||||||||||||
| 2008 | 11.03 | .45 | (.28 | ) | .17 | (.45 | ) | (.02 | ) | (.47 | ) | 10.73 | 1.59 | 195,691 | .87 | 4.16 | 14 | |||||||||||||||||||||||||||||||||||
| 2007 | 10.98 | .46 | .05 | .51 | (.45 | ) | (.01 | ) | (.46 | ) | 11.03 | 4.66 | 227,412 | .88 | 4.13 | 16 | ||||||||||||||||||||||||||||||||||||
| Class B (2/97) | ||||||||||||||||||||||||||||||||||||||||||||||||||||
| 2011 | 10.83 | .40 | (.13 | ) | .27 | (.39 | ) | — | (.39 | ) | 10.71 | 2.55 | 1,117 | 1.57 | 3.71 | 6 | ||||||||||||||||||||||||||||||||||||
| 2010 | 10.15 | .40 | .67 | 1.07 | (.39 | ) | — | (.39 | ) | 10.83 | 10.69 | 2,439 | 1.58 | 3.79 | 6 | |||||||||||||||||||||||||||||||||||||
| 2009 | 10.74 | .39 | (.55 | ) | (.16 | ) | (.38 | ) | (.05 | ) | (.43 | ) | 10.15 | (1.26 | ) | 3,533 | 1.61 | 3.90 | 12 | |||||||||||||||||||||||||||||||||
| 2008 | 11.04 | .37 | (.28 | ) | .09 | (.37 | ) | (.02 | ) | (.39 | ) | 10.74 | .81 | 5,785 | 1.62 | 3.41 | 14 | |||||||||||||||||||||||||||||||||||
| 2007 | 10.99 | .38 | .05 | .43 | (.37 | ) | (.01 | ) | (.38 | ) | 11.04 | 3.87 | 7,351 | 1.63 | 3.38 | 16 | ||||||||||||||||||||||||||||||||||||
| Class C (2/94) | ||||||||||||||||||||||||||||||||||||||||||||||||||||
| 2011 | 10.80 | .42 | (.13 | ) | .29 | (.41 | ) | — | (.41 | ) | 10.68 | 2.74 | 26,958 | 1.37 | 3.93 | 6 | ||||||||||||||||||||||||||||||||||||
| 2010 | 10.13 | .42 | .66 | 1.08 | (.41 | ) | — | (.41 | ) | 10.80 | 10.83 | 26,957 | 1.38 | 3.97 | 6 | |||||||||||||||||||||||||||||||||||||
| 2009 | 10.72 | .41 | (.55 | ) | (.14 | ) | (.40 | ) | (.05 | ) | (.45 | ) | 10.13 | (1.06 | ) | 22,120 | 1.41 | 4.13 | 12 | |||||||||||||||||||||||||||||||||
| 2008 | 11.02 | .39 | (.28 | ) | .11 | (.39 | ) | (.02 | ) | (.41 | ) | 10.72 | 1.03 | 21,541 | 1.42 | 3.61 | 14 | |||||||||||||||||||||||||||||||||||
| 2007 | 10.97 | .40 | .05 | .45 | (.39 | ) | (.01 | ) | (.40 | ) | 11.02 | 4.10 | 21,263 | 1.43 | 3.58 | 16 | ||||||||||||||||||||||||||||||||||||
| Class I (2/97)(f) | ||||||||||||||||||||||||||||||||||||||||||||||||||||
| 2011 | 10.82 | .50 | (.13 | ) | .37 | (.49 | ) | — | (.49 | ) | 10.70 | 3.52 | 11,115 | .62 | 4.67 | 6 | ||||||||||||||||||||||||||||||||||||
| 2010 | 10.14 | .50 | .67 | 1.17 | (.49 | ) | — | (.49 | ) | 10.82 | 11.74 | 9,235 | .63 | 4.72 | 6 | |||||||||||||||||||||||||||||||||||||
| 2009 | 10.73 | .49 | (.55 | ) | (.06 | ) | (.48 | ) | (.05 | ) | (.53 | ) | 10.14 | (.29 | ) | 6,224 | .67 | 4.90 | 12 | |||||||||||||||||||||||||||||||||
| 2008 | 11.03 | .47 | (.28 | ) | .19 | (.47 | ) | (.02 | ) | (.49 | ) | 10.73 | 1.81 | 2,657 | .68 | 4.36 | 14 | |||||||||||||||||||||||||||||||||||
| 2007 | 10.99 | .48 | .04 | .52 | (.47 | ) | (.01 | ) | (.48 | ) | 11.03 | 4.79 | 2,169 | .68 | 4.31 | 16 | ||||||||||||||||||||||||||||||||||||
| (a) | Per share Net Investment Income (Loss) is calculated using the average daily shares method. |
| (b) | Distributions from Capital Gains include short-term capital gains, if any. |
| (c) | Total Return is the combination of changes in net asset value without any sales charge, reinvested dividend income at net asset value and reinvested capital gains distributions at net asset value, if any. Total Return is not annualized. |
| (d) | Ratios do not reflect the effect of custodian fee credits earned on the Fund’s net cash on deposit with the custodian bank, where applicable. |
| (e) | The expense ratios reflect, among other things, the interest expense deemed to have been paid by the Fund on the floating rate certificates issued by the special purpose trusts for the self-deposited inverse floaters held by the Fund, where applicable, as described in Footnote 1—General Information and Significant Accounting Policies, Inverse Floating Rate Securities, in the most recent shareholder report. |
| (f) | Effective May 1, 2008, Class R Shares were renamed Class I Shares. |
Section 5 Financial Highlights
53
Nuveen Ohio Municipal Bond Fund
| Class (Commencement Date) | Investment Operations | Less Distributions | Ratios/Supplemental Data | |||||||||||||||||||||||||||||||||||||||||||||||||
Year Ended May 31, | Beginning Net Asset Value | Net Investment Income (Loss)(a) | Net Realized/ Unrealized Gain (Loss) | Total | Net Investment Income | Capital Gains(b) | Total | Ending Net Asset Value | Total Return(c) | Ending Net Assets (000) | Ratios of Expenses to Average Net Assets(d)(e) | Ratios of Net Investment Income to Average Net Assets(d) | Portfolio Turnover Rate | |||||||||||||||||||||||||||||||||||||||
| Class A (6/85) | ||||||||||||||||||||||||||||||||||||||||||||||||||||
| 2011 | $ | 11.18 | $ | .48 | $ | (.18 | ) | $ | .30 | $ | (.47 | ) | $ | — | $ | (.47 | ) | $ | 11.01 | 2.75 | % | $ | 292,694 | .82 | % | 4.40 | % | 10 | % | |||||||||||||||||||||||
| 2010 | 10.77 | .48 | .39 | .87 | (.46 | ) | — | (.46 | ) | 11.18 | 8.18 | 330,410 | .82 | 4.33 | 10 | |||||||||||||||||||||||||||||||||||||
| 2009 | 10.99 | .47 | (.19 | ) | .28 | (.46 | ) | (.04 | ) | (.50 | ) | 10.77 | 2.75 | 321,253 | .84 | 4.40 | 9 | |||||||||||||||||||||||||||||||||||
| 2008 | 11.25 | .46 | (.19 | ) | .27 | (.46 | ) | (.07 | ) | (.53 | ) | 10.99 | 2.47 | 338,770 | .93 | 4.16 | 20 | |||||||||||||||||||||||||||||||||||
| 2007 | 11.27 | .47 | .01 | .48 | (.47 | ) | (.03 | ) | (.50 | ) | 11.25 | 4.30 | 346,298 | .98 | 4.11 | 10 | ||||||||||||||||||||||||||||||||||||
| Class B (2/97) | ||||||||||||||||||||||||||||||||||||||||||||||||||||
| 2011 | 11.16 | .40 | (.19 | ) | .21 | (.39 | ) | — | (.39 | ) | 10.98 | 1.90 | 2,821 | 1.57 | 3.64 | 10 | ||||||||||||||||||||||||||||||||||||
| 2010 | 10.75 | .39 | .40 | .79 | (.38 | ) | — | (.38 | ) | 11.16 | 7.41 | 5,034 | 1.58 | 3.58 | 10 | |||||||||||||||||||||||||||||||||||||
| 2009 | 10.97 | .39 | (.19 | ) | .20 | (.38 | ) | (.04 | ) | (.42 | ) | 10.75 | 1.97 | 7,790 | 1.58 | 3.64 | 9 | |||||||||||||||||||||||||||||||||||
| 2008 | 11.24 | .38 | (.21 | ) | .17 | (.37 | ) | (.07 | ) | (.44 | ) | 10.97 | 1.61 | 11,577 | 1.67 | 3.42 | 20 | |||||||||||||||||||||||||||||||||||
| 2007 | 11.25 | .38 | .02 | .40 | (.38 | ) | (.03 | ) | (.41 | ) | 11.24 | 3.64 | 16,125 | 1.73 | 3.36 | 10 | ||||||||||||||||||||||||||||||||||||
| Class C (8/93) | ||||||||||||||||||||||||||||||||||||||||||||||||||||
| 2011 | 11.15 | .42 | (.19 | ) | .23 | (.41 | ) | — | (.41 | ) | 10.97 | 2.11 | 60,016 | 1.37 | 3.85 | 10 | ||||||||||||||||||||||||||||||||||||
| 2010 | 10.74 | .42 | .39 | .81 | (.40 | ) | — | (.40 | ) | 11.15 | 7.62 | 63,181 | 1.37 | 3.78 | 10 | |||||||||||||||||||||||||||||||||||||
| 2009 | 10.96 | .41 | (.19 | ) | .22 | (.40 | ) | (.04 | ) | (.44 | ) | 10.74 | 2.19 | 52,693 | 1.39 | 3.85 | 9 | |||||||||||||||||||||||||||||||||||
| 2008 | 11.22 | .40 | (.19 | ) | .21 | (.40 | ) | (.07 | ) | (.47 | ) | 10.96 | 1.93 | 50,642 | 1.48 | 3.61 | 20 | |||||||||||||||||||||||||||||||||||
| 2007 | 11.24 | .40 | .02 | .42 | (.41 | ) | (.03 | ) | (.44 | ) | 11.22 | 3.77 | 49,084 | 1.53 | 3.56 | 10 | ||||||||||||||||||||||||||||||||||||
| Class I (2/97)(f) | ||||||||||||||||||||||||||||||||||||||||||||||||||||
| 2011 | 11.15 | .51 | (.19 | ) | .32 | (.49 | ) | — | (.49 | ) | 10.98 | 2.98 | 109,802 | .62 | 4.60 | 10 | ||||||||||||||||||||||||||||||||||||
| 2010 | 10.75 | .50 | .38 | .88 | (.48 | ) | — | (.48 | ) | 11.15 | 8.33 | 115,162 | .62 | 4.54 | 10 | |||||||||||||||||||||||||||||||||||||
| 2009 | 10.97 | .49 | (.19 | ) | .30 | (.48 | ) | (.04 | ) | (.52 | ) | 10.75 | 2.99 | 109,553 | .64 | 4.60 | 9 | |||||||||||||||||||||||||||||||||||
| 2008 | 11.24 | .49 | (.21 | ) | .28 | (.48 | ) | (.07 | ) | (.55 | ) | 10.97 | 2.60 | 116,718 | .73 | 4.36 | 20 | |||||||||||||||||||||||||||||||||||
| 2007 | 11.25 | .49 | .02 | .51 | (.49 | ) | (.03 | ) | (.52 | ) | 11.24 | 4.53 | 125,050 | .78 | 4.31 | 10 | ||||||||||||||||||||||||||||||||||||
| (a) | Per share Net Investment Income (Loss) is calculated using the average daily shares method. |
| (b) | Distributions from Capital Gains include short-term capital gains, if any. |
| (c) | Total Return is the combination of changes in net asset value without any sales charge, reinvested dividend income at net asset value and reinvested capital gains distributions at net asset value, if any. Total Return is not annualized. |
| (d) | Ratios do not reflect the effect of custodian fee credits earned on the Fund’s net cash on deposit with the custodian bank, where applicable. |
| (e) | The expense ratios reflect, among other things, the interest expense deemed to have been paid by the Fund on the floating rate certificates issued by the special purpose trusts for the self-deposited inverse floaters held by the Fund, where applicable, as described in Footnote 1—General Information and Significant Accounting Policies, Inverse Floating Rate Securities, in the most recent shareholder report. |
| (f) | Effective May 1, 2008, Class R Shares were renamed Class I Shares. |
54
Section 5 Financial Highlights
Nuveen Wisconsin Municipal Bond Fund
| Class (Commencement Date) | Investment Operations | Less Distributions | Ratios/Supplemental Data | |||||||||||||||||||||||||||||||||||||||||||||||||
| Year Ended May 31, | Beginning Net Asset Value | Net Investment Income (Loss)(a) | Net Realized/ Unrealized Gain (Loss) | Total | Net Investment Income | Capital Gains(b) | Total | Ending Net Asset Value | Total Return(c) | Ending Net Assets (000) | Ratios of Expenses to Average Net Assets(d)(e) | Ratios of Net Investment Income to Average Net Assets(d) | Portfolio Turnover Rate | |||||||||||||||||||||||||||||||||||||||
| Class A (6/94) | ||||||||||||||||||||||||||||||||||||||||||||||||||||
| 2011 | $ | 10.39 | $ | .39 | $ | (.12 | ) | $ | .27 | $ | (.38 | ) | $ | — | $ | (.38 | ) | $ | 10.28 | 2.71 | % | $ | 45,101 | .87 | % | 3.81 | % | 14 | % | |||||||||||||||||||||||
| 2010 | 9.95 | .38 | .44 | .82 | (.38 | ) | — | (.38 | ) | 10.39 | 8.42 | 50,270 | .90 | 3.75 | 6 | |||||||||||||||||||||||||||||||||||||
| 2009 | 10.09 | .39 | (.14 | ) | .25 | (.38 | ) | (.01 | ) | (.39 | ) | 9.95 | 2.61 | 46,933 | .89 | 4.02 | 12 | |||||||||||||||||||||||||||||||||||
| 2008 | 10.24 | .38 | (.13 | ) | .25 | (.38 | ) | (.02 | ) | (.40 | ) | 10.09 | 2.51 | 50,640 | .88 | 3.72 | 3 | |||||||||||||||||||||||||||||||||||
| 2007 | 10.20 | .39 | .06 | .45 | (.39 | ) | (.02 | ) | (.41 | ) | 10.24 | 4.46 | 42,279 | .90 | 3.78 | 10 | ||||||||||||||||||||||||||||||||||||
| Class B (2/97) | ||||||||||||||||||||||||||||||||||||||||||||||||||||
| 2011 | 10.41 | .31 | (.10 | ) | .21 | (.31 | ) | — | (.31 | ) | 10.31 | 2.05 | 548 | 1.62 | 2.99 | 14 | ||||||||||||||||||||||||||||||||||||
| 2010 | 9.97 | .31 | .44 | .75 | (.31 | ) | — | (.31 | ) | 10.41 | 7.64 | 1,383 | 1.65 | 3.00 | 6 | |||||||||||||||||||||||||||||||||||||
| 2009 | 10.12 | .32 | (.16 | ) | .16 | (.30 | ) | (.01 | ) | (.31 | ) | 9.97 | 1.74 | 1,598 | 1.63 | 3.27 | 12 | |||||||||||||||||||||||||||||||||||
| 2008 | 10.26 | .30 | (.11 | ) | .19 | (.31 | ) | (.02 | ) | (.33 | ) | 10.12 | 1.82 | 2,174 | 1.63 | 2.98 | 3 | |||||||||||||||||||||||||||||||||||
| 2007 | 10.22 | .32 | .05 | .37 | (.31 | ) | (.02 | ) | (.33 | ) | 10.26 | 3.67 | 2,464 | 1.65 | 3.04 | 10 | ||||||||||||||||||||||||||||||||||||
| Class C (2/97) | ||||||||||||||||||||||||||||||||||||||||||||||||||||
| 2011 | 10.41 | .33 | (.11 | ) | .22 | (.33 | ) | — | (.33 | ) | 10.30 | 2.17 | 9,105 | 1.42 | 3.26 | 14 | ||||||||||||||||||||||||||||||||||||
| 2010 | 9.96 | .33 | .45 | .78 | (.33 | ) | — | (.33 | ) | 10.41 | 7.94 | 9,329 | 1.45 | 3.19 | 6 | |||||||||||||||||||||||||||||||||||||
| 2009 | 10.11 | .34 | (.16 | ) | .18 | (.32 | ) | (.01 | ) | (.33 | ) | 9.96 | 1.93 | 6,907 | 1.44 | 3.46 | 12 | |||||||||||||||||||||||||||||||||||
| 2008 | 10.26 | .32 | (.12 | ) | .20 | (.33 | ) | (.02 | ) | (.35 | ) | 10.11 | 1.96 | 6,512 | 1.43 | 3.17 | 3 | |||||||||||||||||||||||||||||||||||
| 2007 | 10.23 | .34 | .05 | .39 | (.34 | ) | (.02 | ) | (.36 | ) | 10.26 | 3.91 | 5,975 | 1.45 | 3.24 | 10 | ||||||||||||||||||||||||||||||||||||
| Class I (2/97)(f) | ||||||||||||||||||||||||||||||||||||||||||||||||||||
| 2011 | 10.42 | .42 | (.12 | ) | .30 | (.41 | ) | — | (.41 | ) | 10.31 | 2.92 | 18,236 | .67 | 4.14 | 14 | ||||||||||||||||||||||||||||||||||||
| 2010 | 9.97 | .40 | .46 | .86 | (.41 | ) | — | (.41 | ) | 10.42 | 8.73 | 2,605 | .70 | 3.94 | 6 | |||||||||||||||||||||||||||||||||||||
| 2009 | 10.12 | .41 | (.15 | ) | .26 | (.40 | ) | (.01 | ) | (.41 | ) | 9.97 | 2.72 | 1,573 | .69 | 4.20 | 12 | |||||||||||||||||||||||||||||||||||
| 2008 | 10.28 | .40 | (.13 | ) | .27 | (.41 | ) | (.02 | ) | (.43 | ) | 10.12 | 2.64 | 1,506 | .68 | 3.92 | 3 | |||||||||||||||||||||||||||||||||||
| 2007 | 10.25 | .42 | .04 | .46 | (.41 | ) | (.02 | ) | (.43 | ) | 10.28 | 4.59 | 1,031 | .69 | 3.97 | 10 | ||||||||||||||||||||||||||||||||||||
| (a) | Per share Net Investment Income (Loss) is calculated using the average daily shares method. |
| (b) | Distributions from Capital Gains include short-term capital gains, if any. |
| (c) | Total Return is the combination of changes in net asset value without any sales charge, reinvested dividend income at net asset value and reinvested capital gains distributions at net asset value, if any. Total Return is not annualized. |
| (d) | Ratios do not reflect the effect of custodian fee credits earned on the Fund’s net cash on deposit with the custodian bank, where applicable. |
| (e) | The expense ratios reflect, among other things, the interest expense deemed to have been paid by the Fund on the floating rate certificates issued by the special purpose trusts for the self-deposited inverse floaters held by the Fund, where applicable, as described in Footnote 1—General Information and Significant Accounting Policies, Inverse Floating Rate Securities, in the most recent shareholder report. |
| (f) | Effective May 1, 2008, Class R Shares were renamed Class I Shares. |
Section 5 Financial Highlights
55
Section 6 Glossary of Investment Terms
| • | Derivatives: Financial instruments whose performance is derived from the performance of an underlying asset, security or index. Derivatives may be used to hedge risk, to exchange a floating rate of return for fixed rate of return or to gain investment exposure. Derivatives include futures, options and swaps, among other instruments. |
| • | Futures: Derivative contracts obligating buyers to purchase an asset or sellers to sell an asset at a predetermined future date and price. Futures contracts detail the quality and quantity of the underlying asset; they are standardized to facilitate trading on a futures exchange. |
| • | Lipper Michigan Municipal Debt Funds Average: Represents the average annualized total return for all reporting funds in the Lipper Michigan Municipal Debt Fund category. |
| • | Lipper Missouri Municipal Debt Funds Average: Represents the average annualized total return for all reporting funds in the Lipper Missouri Municipal Debt Fund category. |
| • | Lipper Ohio Municipal Debt Funds Average: Represents the average annualized total return for all reporting funds in the Lipper Ohio Municipal Debt Fund category. |
| • | Lipper Other States Municipal Debt Funds Average: Represents the average annualized total return for all reporting funds in the Lipper Other States Municipal Debt Fund category. The performance of the Lipper Other States Average represents the overall average of returns for funds from ten different states with a wide variety of municipal market conditions, making direct comparisons less meaningful. |
| • | Options: Derivative contracts giving buyers the right to buy or to sell shares of a specified stock at a specified price on or before a given date. There are also options on currencies and other financial assets. |
| • | Standard & Poor’s (S&P) Kansas Municipal Bond Index: An unleveraged, market value-weighted index designed to measure the performance of the tax-exempt, investment-grade Kansas municipal bond market. |
| • | Standard & Poor’s (S&P) Kentucky Municipal Bond Index: An unleveraged, market value-weighted index designed to measure the performance of the tax-exempt, investment-grade Kentucky municipal bond market. |
| • | Standard & Poor’s (S&P) Michigan Municipal Bond Index: An unleveraged, market value-weighted index designed to measure the performance of the tax-exempt, investment-grade Michigan municipal bond market. |
| • | Standard & Poor’s (S&P) Missouri Municipal Bond Index: An unleveraged, market value-weighted index designed to measure the performance of the tax-exempt, investment-grade Missouri municipal bond market. |
| • | Standard & Poor’s (S&P) National Municipal Bond Index: An unleveraged, market value-weighted index designed to measure the performance of the tax-exempt, investment-grade U.S. municipal bond market. |
56
Section 6 Glossary of Investment Terms
| • | Standard & Poor’s (S&P) Ohio Municipal Bond Index: An unleveraged, market value-weighted index designed to measure the performance of the tax-exempt, investment-grade Ohio municipal bond market. |
| • | Standard & Poor’s (S&P) Wisconsin Municipal Bond Index: An unleveraged, market value-weighted index designed to measure the performance of the tax-exempt, investment-grade Wisconsin municipal bond market. |
| • | Swaps: Derivative contracts in which two parties agree to exchange one stream of cash flows for another stream. Swap agreements define the dates when the cash flows will be paid and how the cash flows are calculated. |
Section 6 Glossary of Investment Terms
57
Nuveen Mutual Funds
Nuveen offers a variety of mutual funds designed to help you reach your financial goals. The funds below are grouped by category.
Municipal-National
All-American Municipal Bond
High Yield Municipal Bond
Inflation Protected Municipal Bond
Intermediate Duration Municipal Bond
Intermediate Tax Free*
Limited Term Municipal Bond
Municipal Bond
Municipal Bond 2
Short Term Municipal Bond*
Tax Free*
Municipal-State
Arizona Municipal Bond
California High Yield Municipal Bond
California Municipal Bond
California Municipal Bond 2
California Tax Free*
Colorado Municipal Bond
Colorado Tax Free*
Connecticut Municipal Bond
Georgia Municipal Bond
Kansas Municipal Bond
Kentucky Municipal Bond
Louisiana Municipal Bond
Maryland Municipal Bond
Massachusetts Municipal Bond
Massachusetts Municipal Bond 2
Michigan Municipal Bond
Minnesota Intermediate Municipal Bond*
Municipal-State (continued)
Minnesota Municipal Bond*
Missouri Municipal Bond
Missouri Tax Free*
Nebraska Municipal Bond*
New Jersey Municipal Bond
New Mexico Municipal Bond
New York Municipal Bond
New York Municipal Bond 2
North Carolina Municipal Bond
Ohio Municipal Bond
Ohio Tax Free*
Oregon Intermediate Municipal Bond*
Pennsylvania Municipal Bond
Tennessee Municipal Bond
Virginia Municipal Bond
Wisconsin Municipal Bond
Taxable Fixed Income
Core Bond*
High Income Bond*
High Yield Bond
Inflation Protected Securities*
Intermediate Government Bond*
Intermediate Term Bond*
Multi-Strategy Core Bond
Preferred Securities
Short Duration Bond
Short Term Bond*
Symphony Credit Opportunities
Symphony Floating Rate Income
Total Return Bond*
Global/International
International*
International Select*
Santa Barbara Global Growth
Santa Barbara International Growth
Symphony International Equity
Tradewinds Emerging Markets
Tradewinds Global All-Cap
Tradewinds Global All-Cap Plus
Tradewinds Global Flexible Allocation
Tradewinds Global Resources
Tradewinds International Value
Tradewinds Japan
Tradewinds Small-Cap Opportunities
Value
Equity Income*
Large Cap Value*
Mid Cap Value*
Multi-Manager Large-Cap Value
NWQ Large-Cap Value
NWQ Multi-Cap Value
NWQ Small-Cap Value
NWQ Small-Mid Cap Value
Small Cap Value*
Symphony Large-Cap Value
Tradewinds Value Opportunities
Growth
Large Cap Growth Opportunities*
Mid Cap Growth Opportunities*
Santa Barbara Growth
Small Cap Growth Opportunities*
Growth (continued)
Symphony Large-Cap Growth
Winslow Large-Cap Growth
Core
Large Cap Select*
Mid Cap Select*
Santa Barbara Dividend Growth
Small Cap Select*
Symphony Mid-Cap Core
Symphony Optimized Alpha
Symphony Small-Mid Cap Core
Real Assets
Global Infrastructure*
Real Estate Securities*
Asset Allocation
Conservative Allocation
Growth Allocation
Moderate Allocation
Strategy Aggressive Growth Allocation*
Strategy Balanced Allocation*
Strategy Conservative Allocation*
Strategy Growth Allocation*
Tactical Market Opportunities*
Quantitative/Enhanced
Quantitative Enhanced Core Equity*
Index
Equity Index*
Mid Cap Index*
Small Cap Index*
*Former First American Fund.
Several additional sources of information are available to you, including the codes of ethics adopted by the funds, Nuveen Investments, Nuveen Fund Advisors and Nuveen Asset Management. The statement of additional information, incorporated by reference into this prospectus, contains detailed information on the policies and operation of the funds included in this prospectus. Additional information about the funds’ investments is available in the annual and semi-annual reports to shareholders. In the funds’ annual reports, you will find a discussion of the market conditions and investment strategies that significantly affected the funds’ performance during their last fiscal year. The funds’ most recent statement of additional information, annual and semi-annual reports and certain other information are available, free of charge, by calling Nuveen Investor Services at (800) 257-8787, on the funds’ website at www.nuveen.com, or through your financial advisor. Shareholders may call the toll free number above with any inquiries.
You may also obtain this and other fund information directly from the Securities and Exchange Commission (“SEC”). Reports and other information about the funds are available on the EDGAR Database on the SEC’s website at http://www.sec.gov or in person at the SEC’s Public Reference Room in Washington, D.C. Call the SEC at (202) 551-8090 for room hours and operation. You may also request fund information by sending an e-mail request to publicinfo@sec.gov or by writing to the SEC’s Public Reference Section at 100 F Street, NE, Washington, D.C. 20549-1520. The SEC may charge a copying fee for this information.
The funds are series of Nuveen Multistate Trust IV, whose Investment Company Act file number is 811-07751.
Distributed by Nuveen Securities, LLC 333 West Wacker Drive Chicago, Illinois 60606 (800) 257-8787 www.nuveen.com |
MPR-MS6-0911P
NUVEEN COLORADO TAX FREE FUND
NUVEEN MISSOURI TAX FREE FUND
NUVEEN OHIO TAX FREE FUND
SUPPLEMENT DATED NOVEMBER 8, 2011
TO THE PROSPECTUS DATED
SEPTEMBER 30, 2011
Proposed Reorganizations of
Nuveen Colorado Tax Free Fund into Nuveen Colorado Municipal Bond Fund
Nuveen Missouri Tax Free Fund into Nuveen Missouri Municipal Bond Fund
Nuveen Ohio Tax Free Fund into Nuveen Ohio Municipal Bond Fund
The Board of Trustees/Directors of Nuveen Multistate Trust I (“NMT I”), Nuveen Multistate Trust IV (“NMT IV”) and Nuveen Investment Funds, Inc. (“NIF”) has approved the reorganization of (a) Nuveen Colorado Tax Free Fund, a series of NIF, into Nuveen Colorado Municipal Bond Fund, a series of NMT I, (b) Nuveen Missouri Tax Free Fund, a series of NIF, into Nuveen Missouri Municipal Bond Fund, a series of NMT IV, and (c) Nuveen Ohio Tax Free Fund, a series of NIF, into Nuveen Ohio Municipal Bond Fund, a series of NMT IV. Each of Nuveen Colorado Tax Free Fund, Nuveen Missouri Tax Free Fund and Nuveen Ohio Tax Free Fund is referred to as an “Acquired Fund” and each of Nuveen Colorado Municipal Bond Fund, Nuveen Missouri Municipal Bond Fund and Nuveen Ohio Municipal Bond Fund is referred to as an “Acquiring Fund.” Each reorganization is subject to approval by the shareholders of the Acquired Fund in that reorganization.
For each reorganization, if the Acquired Fund’s shareholders approve the reorganization, the Acquired Fund will transfer all of its assets and liabilities to the Acquiring Fund in exchange for Acquiring Fund shares of equal value. These Acquiring Fund shares will then be distributed to Acquired Fund shareholders and the Acquired Fund will be terminated. As a result of these transactions, Acquired Fund shareholders will become shareholders of the Acquiring Fund and will cease to be shareholders of the Acquired Fund. Each Acquired Fund shareholder will receive Acquiring Fund shares with a total value equal to the total value of that shareholder’s Acquired Fund shares immediately prior to the closing of the reorganization.
For each reorganization, a special meeting of the Acquired Fund’s shareholders for the purpose of voting on the reorganization is expected to be held in mid-February 2012. If the required approval is obtained, it is anticipated that the reorganization will be consummated shortly after the special shareholder meeting. Further information regarding the proposed reorganizations will be contained in proxy materials that are expected to be sent to shareholders of each Acquired Fund in mid-January 2012.
Each Acquired Fund will continue sales and redemptions of its shares as described in the prospectus until shortly before its reorganization. However, holders of shares purchased after the record date set for an Acquired Fund’s special meeting of shareholders will not be entitled to vote those shares at the special meeting.
PLEASE KEEP THIS WITH YOUR PROSPECTUS
FOR FUTURE REFERENCE
MGN-FTFIP-1111P
Mutual Funds
Prospectus
September 30, 2011
Nuveen Municipal Bond Funds
Dependable, tax-free income because it’s not what you earn, it’s what you keep.®
| Class / Ticker Symbol | ||||||||
| Fund Name | Class A | Class C | Class C1 | Class I | ||||
Nuveen Colorado Tax Free Fund | FCOAX | — | FCCOX | FCOYX | ||||
Nuveen Minnesota Intermediate Municipal Bond Fund | FAMAX | NIBMX | FACMX | FAMTX | ||||
Nuveen Minnesota Municipal Bond Fund | FJMNX | NMBCX | FCMNX | FYMNX | ||||
Nuveen Missouri Tax Free Fund | ARMOX | — | FFMCX | ARMIX | ||||
Nuveen Nebraska Municipal Bond Fund | FNTAX | NCNBX | FNTCX | FNTYX | ||||
Nuveen Ohio Tax Free Fund | FOFAX | — | FOTCX | FOTYX | ||||
Nuveen Oregon Intermediate Municipal Bond Fund | FOTAX | NIMOX | — | FORCX | ||||
The Securities and Exchange Commission has not approved or disapproved these securities or passed upon the adequacy of this prospectus. Any representation to the contrary is a criminal offense.
Table of Contents
| Section 1 Fund Summaries | ||||
| Nuveen Colorado Tax Free Fund | 2 | |||
| Nuveen Minnesota Intermediate Municipal Bond Fund | 7 | |||
| Nuveen Minnesota Municipal Bond Fund | 12 | |||
| Nuveen Missouri Tax Free Fund | 17 | |||
| Nuveen Nebraska Municipal Bond Fund | 22 | |||
| Nuveen Ohio Tax Free Fund | 27 | |||
| Nuveen Oregon Intermediate Municipal Bond Fund | 32 | |||
| Section 2 How We Manage Your Money | ||||
| Who Manages the Funds | 37 | |||
| More About Our Investment Strategies | 40 | |||
| What the Risks Are | 41 | |||
| Section 3 How You Can Buy and Sell Shares | ||||
| What Share Classes We Offer | 44 | |||
| How to Reduce Your Sales Charge | 46 | |||
| How to Buy Shares | 48 | |||
| Special Services | 49 | |||
| How to Sell Shares | 51 | |||
| Section 4 General Information | ||||
| Dividends, Distributions and Taxes | 54 | |||
| Distribution and Service Plans | 56 | |||
| Net Asset Value | 57 | |||
| Frequent Trading | 58 | |||
| Fund Service Providers | 59 | |||
| Section 5 Financial Highlights | 60 | |||
| Section 6 Glossary of Investment Terms | 67 | |||
NOT FDIC OR GOVERNMENT INSURED MAY LOSE VALUE NO BANK GUARANTEE
Investment Objective
The investment objective of the fund is to provide maximum current income that is exempt from both federal income tax and Colorado state income tax to the extent consistent with prudent investment risk.
Fees and Expenses of the Fund
This table describes the fees and expenses that you may pay if you buy and hold shares of the fund. You may qualify for sales charge discounts if you and your family invest, or agree to invest in the future, at least $50,000 in the fund or in other Nuveen Mutual Funds. More information about these and other discounts, as well as eligibility requirements for each share class, is available from your financial advisor and in “What Share Classes We Offer” on page 44 of the fund’s prospectus, “How to Reduce Your Sales Charge” on page 46 of the prospectus and “Purchase and Redemption of Fund Shares” on page S-71 of the fund’s statement of additional information.
Shareholder Fees
(fees paid directly from your investment)
| Class A | Class C1 | Class I | ||||||||||
| Maximum Sales Charge (Load) Imposed on Purchases (as a percentage of offering price) | 4.20% | None | None | |||||||||
| Maximum Deferred Sales Charge (Load) (as a percentage of the lesser of purchase price or redemption proceeds)1 | None | 1.00% | None | |||||||||
| Maximum Sales Charge (Load) Imposed on Reinvested Dividends | None | None | None | |||||||||
| Exchange Fee | None | None | None | |||||||||
| Annual Low Balance Account Fee (for accounts under $1,000)2 | $15 | $15 | $15 | |||||||||
Annual Fund Operating Expenses
(expenses that you pay each year as a percentage of the value of your investment)
| Class A | Class C1 | Class I | ||||||||||
| Management Fees | 0.65% | 0.65% | 0.65% | |||||||||
| Distribution and Service (12b-1) Fees | 0.20% | 0.65% | 0.00% | |||||||||
| Other Expenses | 0.13% | 0.13% | 0.13% | |||||||||
| Acquired Fund Fees and Expenses | 0.01% | 0.01% | 0.01% | |||||||||
| Total Annual Fund Operating Expenses3 | 0.99% | 1.44% | 0.79% | |||||||||
| Fee Waivers and/or Expense Reimbursements | (0.08)% | (0.08)% | (0.08)% | |||||||||
| Total Annual Fund Operating Expenses After Fee Waivers and/or Expense Reimbursements4 | 0.91% | 1.36% | 0.71% | |||||||||
| 1 | The CDSC on Class C1 shares applies only to redemptions within 12 months of purchase. |
| 2 | Fee applies to the following types of accounts held directly with the fund: accounts established pursuant to the Uniform Transfers to Minors Act (UTMA) or Uniform Gifts to Minors Act (UGMA). |
| 3 | Expenses have been restated to reflect current contractual fees and estimated other expenses. |
| 4 | The fund’s investment adviser has contractually agreed to waive fees and reimburse other fund expenses through March 31, 2013 so that total annual fund operating expenses, after fee waivers and/or expense reimbursements and excluding Acquired Fund Fees and Expenses, do not exceed 0.90%, 1.35%, and 0.70% for Class A, Class C1, and Class I shares, respectively. Fee waivers and expense reimbursements will not be terminated prior to that time without the approval of the fund’s board of directors. |
2
Section 1 Fund Summaries
Example
The following example is intended to help you compare the cost of investing in the fund with the cost of investing in other mutual funds. The example assumes that you invest $10,000 in the fund for the time periods indicated and then either redeem or do not redeem your shares at the end of a period. The example also assumes that your investment has a 5% return each year, that the fund’s operating expenses remain the same, and the contractual fee waivers currently in place are not renewed beyond March 31, 2013. Although your actual costs may be higher or lower, based on these assumptions your costs would be:
| Redemption | No Redemption | |||||||||||||||||||||||||||
| A | C1 | I | A | C1 | I | |||||||||||||||||||||||
| 1 Year | $ | 509 | $ | 138 | $ | 73 | $ | 509 | $ | 138 | $ | 73 | ||||||||||||||||
| 3 Years | $ | 710 | $ | 444 | $ | 240 | $ | 710 | $ | 444 | $ | 240 | ||||||||||||||||
| 5 Years | $ | 933 | $ | 775 | $ | 427 | $ | 933 | $ | 775 | $ | 427 | ||||||||||||||||
| 10 Years | $ | 1,571 | $ | 1,714 | $ | 967 | $ | 1,571 | $ | 1,714 | $ | 967 | ||||||||||||||||
Portfolio Turnover
The fund pays transaction costs, such as commissions, when it buys and sells securities (or “turns over” its portfolio). A higher portfolio turnover rate may indicate higher transaction costs and may result in higher taxes when fund shares are held in a taxable account. These costs, which are not reflected in annual fund operating expenses or in the example, affect the fund’s performance. For the fiscal period July 1, 2010 through May 31, 2011, the fund’s portfolio turnover rate was 20% of the average value of its portfolio.
Principal Investment Strategies
Under normal market conditions, as a fundamental policy, the fund invests at least 80% of its net assets (plus the amount of any borrowings for investment purposes) in municipal securities that pay interest that is exempt from federal and Colorado income tax, including the federal and state alternative minimum tax.
The fund normally may invest up to 20% of its net assets in taxable obligations, including obligations the interest on which is subject to the federal and state alternative minimum tax.
The fund may invest in:
| • | “general obligation” bonds; |
| • | “revenue” bonds; |
| • | participation interests in municipal leases; and |
| • | zero coupon municipal securities. |
The fund invests mainly in securities that, at the time of purchase, are either rated investment grade or are unrated and determined to be of comparable quality by the fund’s sub-adviser. However, the fund may invest up to 20% of its total assets in securities that, at the time of purchase, are rated lower than investment grade or are unrated and of comparable quality (securities commonly referred to as “high yield” securities or “junk bonds”). If the rating of a security is reduced or discontinued after purchase, the fund is not required to sell the security, but may consider doing so.
In selecting securities for the fund, the fund’s sub-adviser first determines its economic outlook and the direction in which inflation and interest rates are expected to move. In selecting individual securities consistent with this outlook, the sub-adviser evaluates factors such as credit quality, yield, maturity, liquidity, and portfolio diversification. The sub-adviser conducts research on potential and current holdings in the fund to determine whether the fund should purchase or retain a security. This is a continuing process, the focus of which changes according to market conditions, the availability of various permitted investments, and cash flows into and out of the fund.
The fund will attempt to maintain the weighted average maturity of its portfolio securities at ten to twenty-five years under normal market conditions.
Section 1 Fund Summaries
3
The fund may utilize futures contracts and options on futures contracts in an attempt to manage market risk, credit risk and yield curve risk, and to manage the effective maturity or duration of securities in the fund’s portfolio. The fund may not use such instruments to gain exposure to a security or type of security that it would be prohibited by its investment restrictions from purchasing directly.
Principal Risks
The price and yield of this fund will change daily due to changes in interest rates and other factors, which means you could lose money. An investment in the fund is not a deposit of a bank and is not insured or guaranteed by the Federal Deposit Insurance Corporation or any other governmental agency. The principal risks of investing in this fund are described below:
Call Risk—If an issuer calls higher-yielding bonds held by the fund, performance could be adversely impacted.
Credit Risk—Credit risk is the risk that an issuer of a municipal bond may be unable or unwilling to make interest and principal payments when due and the related risk that the value of a bond may decline because of concerns about the issuer’s ability or willingness to make such payments. In addition, parties to other financial contracts with the fund could default on their obligations.
Futures Contract Risk—The use of futures contracts involves additional risks and transaction costs which could leave the fund in a worse position than if it had not used these instruments. Futures contracts may entail investment exposures that are greater than their cost would suggest. As a result, a small investment in futures contracts could have a large impact on performance.
High Yield Securities Risk—High yield securities generally are less liquid, have more volatile prices, and have greater credit risk than investment grade securities.
Income Risk—The fund’s income could decline during periods of falling interest rates.
Interest Rate Risk—Interest rate risk is the risk that the value of the fund’s portfolio will decline because of rising interest rates.
Market Risk—The market values of municipal bonds owned by the fund may decline, at times sharply and unpredictably.
Non-Diversification Risk—As a non-diversified fund, the fund may invest a larger portion of its assets in the securities of a limited number of issuers and may be more sensitive to any single economic, political or regulatory occurrence than a diversified fund.
State Concentration Risk—Because the fund primarily purchases municipal bonds from Colorado, the fund is more susceptible to adverse economic, political or regulatory changes affecting municipal bond issuers in that state.
Fund Performance
The following bar chart and table provide some indication of the potential risks of investing in the fund. The fund’s past performance (before and after taxes) is not necessarily an indication of how the fund will perform in the future. Updated performance information is available at www.nuveen.com/MF/products/performancesummary.aspx or by calling (800) 257-8787.
4
Section 1 Fund Summaries
The bar chart below shows the variability of the fund’s performance from year to year for Class A shares. The performance of the other share classes will differ due to their different expense structures. The bar chart and highest/lowest quarterly returns that follow do not reflect sales charges, and if these charges were reflected, the returns would be less than those shown.
Class A Annual Total Return*
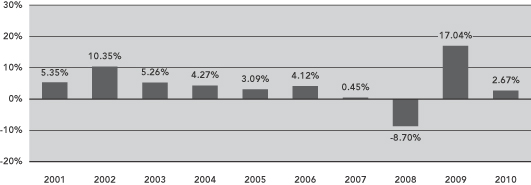
| * | Class A year-to-date total return as of June 30, 2011 was 5.33%. |
During the ten-year period ended December 31, 2010, the fund’s highest and lowest quarterly returns were 8.00% and
-5.34%, respectively, for the quarters ended September 30, 2009 and December 31, 2008.
The table below shows the variability of the fund’s average annual returns and how they compare over the time periods indicated with those of a broad measure of market performance and an index of funds with similar investment objectives. All after-tax returns are calculated using the historical highest individual federal marginal income tax rates and do not reflect the impact of state and local taxes. After-tax returns are shown for Class A shares only; after-tax returns for other share classes will vary. Your own actual after-tax returns will depend on your specific tax situation and may differ from what is shown here.
Both the bar chart and the table assume that all distributions have been reinvested. Performance reflects fee waivers, if any, in effect during the periods presented. If any such waivers were not in place, returns would be reduced.
| Average Annual Total Returns for the Periods Ended December 31, 2010 | ||||||||||||||||
Inception Date | 1 Year | 5 Years | 10 Years | |||||||||||||
| Nuveen Colorado Tax Free Fund: | ||||||||||||||||
Class A (return before taxes) | 2/1/00 | (1.66 | )% | 1.91 | % | 3.75 | % | |||||||||
Class A (return after taxes on distributions) | (1.82 | )% | 1.77 | % | 3.60 | % | ||||||||||
Class A (return after taxes on distributions and sales of fund shares) | 0.56 | % | 2.22 | % | 3.81 | % | ||||||||||
Class C1 (return before taxes) | 2/1/00 | 2.17 | % | 2.37 | % | 3.78 | % | |||||||||
Class I (return before taxes) | 2/1/00 | 2.92 | % | 3.07 | % | 4.47 | % | |||||||||
| Barclays Capital Municipal Bond Index (reflects no deduction for fees, expenses or taxes) | 2.38 | % | 4.09 | % | 4.83 | % | ||||||||||
| Lipper Colorado Municipal Debt Funds Category Average (reflects no deduction for fees, expenses or taxes) | 1.44 | % | 2.79 | % | 4.00 | % | ||||||||||
Section 1 Fund Summaries
5
Management
Investment Adviser
Nuveen Fund Advisors, Inc.
Sub-Adviser
Nuveen Asset Management, LLC
Portfolio Manager
Name | Title | Portfolio Manager of Fund Since | ||
| Christopher L. Drahn, CFA | Senior Vice President | February 2000 |
Purchase and Sale of Fund Shares
You may purchase, redeem or exchange shares of the fund on any business day, which is any day the New York Stock Exchange is open for business. You may purchase, redeem or exchange shares of the fund either through a financial advisor or other financial intermediary or directly from the fund. Class C1 shares are available only through dividend reinvestments by current Class C1 shareholders. The fund’s initial and subsequent investment minimums generally are as follows, although the fund may reduce or waive the minimums in some cases:
| Class A | Class I | |||
| Eligibility and Minimum Initial Investment | $3,000 | Available only through fee-based programs and to other limited categories of investors as described in the prospectus.
$100,000 for all accounts except:
• $250 for clients of financial intermediaries and family offices that have accounts holding Class I shares with an aggregate value of at least $100,000 (or that are expected to reach this level).
• No minimum for certain other categories of eligible investors as described in the prospectus. | ||
| Minimum Additional Investment | $100 | No minimum. |
Tax Information
The fund intends to make distributions that are exempt from regular federal and Colorado state income tax. A portion of these distributions, however, may be subject to the federal and state alternative minimum tax.
Payments to Broker-Dealers and Other Financial Intermediaries
If you purchase shares of the fund through a broker-dealer or other financial intermediary (such as a bank or financial advisor), the fund, its distributor or its investment adviser may pay the intermediary for the sale of fund shares and related services. These payments may create a conflict of interest by influencing the broker-dealer or other financial intermediary and your salesperson to recommend the fund over another investment. Ask your financial advisor or visit your financial intermediary’s website for more information.
6
Section 1 Fund Summaries
Nuveen Minnesota Intermediate Municipal Bond Fund
Investment Objective
The investment objective of the fund is to provide maximum current income that is exempt from both federal income tax and Minnesota state income tax to the extent consistent with prudent investment risk.
Fees and Expenses of the Fund
This table describes the fees and expenses that you may pay if you buy and hold shares of the fund. You may qualify for sales charge discounts if you and your family invest, or agree to invest in the future, at least $50,000 in the fund or in other Nuveen Mutual Funds. More information about these and other discounts, as well as eligibility requirements for each share class, is available from your financial advisor and in “What Share Classes We Offer” on page 44 of the fund’s prospectus, “How to Reduce Your Sales Charge” on page 46 of the prospectus and “Purchase and Redemption of Fund Shares” on page S-71 of the fund’s statement of additional information.
Shareholder Fees
(fees paid directly from your investment)
| Class A | Class C | Class C1 | Class I | |||||||||||||
| Maximum Sales Charge (Load) Imposed on Purchases (as a percentage of offering price) | 3.00% | None | None | None | ||||||||||||
| Maximum Deferred Sales Charge (Load) (as a percentage of the lesser of purchase price or redemption proceeds)1 | None | 1.00% | 1.00% | None | ||||||||||||
| Maximum Sales Charge (Load) Imposed on Reinvested Dividends | None | None | None | None | ||||||||||||
| Exchange Fee | None | None | None | None | ||||||||||||
| Annual Low Balance Account Fee (for accounts under $1,000)2 | $15 | $15 | $15 | $15 | ||||||||||||
Annual Fund Operating Expenses
(expenses that you pay each year as a percentage of the value of your investment)
| Class A | Class C | Class C1 | Class I | |||||||||||||
| Management Fees | 0.54% | 0.54% | 0.54% | 0.54% | ||||||||||||
| Distribution and Service (12b-1) Fees | 0.20% | 0.75% | 0.65% | 0.00% | ||||||||||||
| Other Expenses | 0.07% | 0.07% | 0.07% | 0.07% | ||||||||||||
| Total Annual Fund Operating Expenses3 | 0.81% | 1.36% | 1.26% | 0.61% | ||||||||||||
| 1 | The CDSC on Class C and Class C1 shares applies only to redemptions within 12 months of purchase. |
| 2 | Fee applies to the following types of accounts held directly with the fund: accounts established pursuant to the Uniform Transfers to Minors Act (UTMA) or Uniform Gifts to Minors Act (UGMA). |
| 3 | Expenses have been restated to reflect current contractual fees and estimated other expenses. |
Section 1 Fund Summaries
7
Example
The following example is intended to help you compare the cost of investing in the fund with the cost of investing in other mutual funds. The example assumes that you invest $10,000 in the fund for the time periods indicated and then either redeem or do not redeem your shares at the end of a period. The example also assumes that your investment has a 5% return each year and that the fund’s operating expenses remain the same. Although your actual costs may be higher or lower, based on these assumptions your costs would be:
| Redemption | No Redemption | |||||||||||||||||||||||||||||||||||
| A | C | C1 | I | A | C | C1 | I | |||||||||||||||||||||||||||||
| 1 Year | $ | 380 | $ | 138 | $ | 128 | $ | 62 | $ | 380 | $ | 138 | $ | 128 | $ | 62 | ||||||||||||||||||||
| 3 Years | $ | 551 | $ | 431 | $ | 400 | $ | 195 | $ | 551 | $ | 431 | $ | 400 | $ | 195 | ||||||||||||||||||||
| 5 Years | $ | 736 | $ | 745 | $ | 692 | $ | 340 | $ | 736 | $ | 745 | $ | 692 | $ | 340 | ||||||||||||||||||||
| 10 Years | $ | 1,272 | $ | 1,635 | $ | 1,523 | $ | 762 | $ | 1,272 | $ | 1,635 | $ | 1,523 | $ | 762 | ||||||||||||||||||||
Portfolio Turnover
The fund pays transaction costs, such as commissions, when it buys and sells securities (or “turns over” its portfolio). A higher portfolio turnover rate may indicate higher transaction costs and may result in higher taxes when fund shares are held in a taxable account. These costs, which are not reflected in annual fund operating expenses or in the example, affect the fund’s performance. For the fiscal period July 1, 2010 through May 31, 2011, the fund’s portfolio turnover rate was 12% of the average value of its portfolio.
Principal Investment Strategies
Under normal market conditions, as a fundamental policy, the fund invests at least 80% of its net assets (plus the amount of any borrowings for investment purposes) in municipal securities that pay interest that is exempt from federal and Minnesota income tax, including the federal and state alternative minimum tax.
The fund normally may invest up to 20% of its net assets in taxable obligations, including obligations the interest on which is subject to the federal and state alternative minimum tax.
The fund may invest in:
| • | “general obligation” bonds; |
| • | “revenue” bonds; |
| • | participation interests in municipal leases; and |
| • | zero coupon municipal securities. |
The fund invests mainly in securities that, at the time of purchase, are either rated investment grade or are unrated and determined to be of comparable quality by the fund’s sub-adviser. However, the fund may invest up to 20% of its total assets in securities that, at the time of purchase, are rated lower than investment grade or are unrated and of comparable quality (securities commonly referred to as “high yield” securities or “junk bonds”). If the rating of a security is reduced or discontinued after purchase, the fund is not required to sell the security, but may consider doing so.
In selecting securities for the fund, the fund’s sub-adviser first determines its economic outlook and the direction in which inflation and interest rates are expected to move. In selecting individual securities consistent with this outlook, the sub-adviser evaluates factors such as credit quality, yield, maturity, liquidity, and portfolio diversification. The sub-adviser conducts research on potential and current holdings in the fund to determine whether the fund should purchase or retain a security. This is a continuing process, the focus of which changes according to market conditions, the availability of various permitted investments, and cash flows into and out of the fund.
The fund will attempt to maintain the weighted average maturity of its portfolio securities at three to ten years under normal market conditions.
8
Section 1 Fund Summaries
The fund may utilize futures contracts and options on futures contracts in an attempt to manage market risk, credit risk and yield curve risk, and to manage the effective maturity or duration of securities in the fund’s portfolio. The fund may not use such instruments to gain exposure to a security or type of security that it would be prohibited by its investment restrictions from purchasing directly.
Principal Risks
The price and yield of this fund will change daily due to changes in interest rates and other factors, which means you could lose money. An investment in the fund is not a deposit of a bank and is not insured or guaranteed by the Federal Deposit Insurance Corporation or any other governmental agency. The principal risks of investing in this fund are described below:
Call Risk—If an issuer calls higher-yielding bonds held by the fund, performance could be adversely impacted.
Credit Risk—Credit risk is the risk that an issuer of a municipal bond may be unable or unwilling to make interest and principal payments when due and the related risk that the value of a bond may decline because of concerns about the issuer’s ability or willingness to make such payments. In addition, parties to other financial contracts with the fund could default on their obligations.
Futures Contract Risk—The use of futures contracts involves additional risks and transaction costs which could leave the fund in a worse position than if it had not used these instruments. Futures contracts may entail investment exposures that are greater than their cost would suggest. As a result, a small investment in futures contracts could have a large impact on performance.
High Yield Securities Risk—High yield securities generally are less liquid, have more volatile prices, and have greater credit risk than investment grade securities.
Income Risk—The fund’s income could decline during periods of falling interest rates.
Interest Rate Risk—Interest rate risk is the risk that the value of the fund’s portfolio will decline because of rising interest rates.
Market Risk—The market values of municipal bonds owned by the fund may decline, at times sharply and unpredictably.
Non-Diversification Risk—As a non-diversified fund, the fund may invest a larger portion of its assets in the securities of a limited number of issuers and may be more sensitive to any single economic, political or regulatory occurrence than a diversified fund.
State Concentration Risk—Because the fund primarily purchases municipal bonds from Minnesota, the fund is more susceptible to adverse economic, political or regulatory changes affecting municipal bond issuers in that state.
Fund Performance
The following bar chart and table provide some indication of the potential risks of investing in the fund. The fund’s past performance (before and after taxes) is not necessarily an indication of how the fund will perform in the future. Updated performance information is available at www.nuveen.com/MF/products/performancesummary.aspx or by calling (800) 257-8787.
Section 1 Fund Summaries
9
The bar chart below shows the variability of the fund’s performance from year to year for Class A shares. The performance of the other share classes will differ due to their different expense structures. The bar chart and highest/lowest quarterly returns that follow do not reflect sales charges, and if these charges were reflected, the returns would be less than those shown.
Class A Annual Total Return*
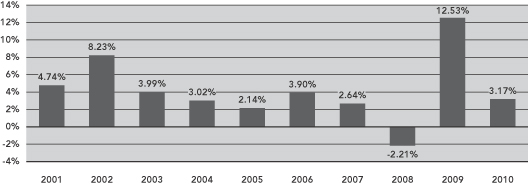
| * | Class A year-to-date total return as of June 30, 2011 was 4.20%. |
During the ten-year period ended December 31, 2010, the fund’s highest and lowest quarterly returns were 5.42% and -2.76%, respectively, for the quarters ended September 30, 2009 and December 31, 2010.
The table below shows the variability of the fund’s average annual returns and how they compare over the time periods indicated with those of a broad measure of market performance and an index of funds with similar investment objectives. All after-tax returns are calculated using the historical highest individual federal marginal income tax rates and do not reflect the impact of state and local taxes. After-tax returns are shown for Class A shares only; after-tax returns for other share classes will vary. Your own actual after-tax returns will depend on your specific tax situation and may differ from what is shown here.
Both the bar chart and the table assume that all distributions have been reinvested. Performance reflects fee waivers, if any, in effect during the periods presented. If any such waivers were not in place, returns would be reduced.
Performance is not shown for Class C shares, which have not been offered for a full calendar year.
| Average Annual Total Returns for the Periods Ended December 31, 2010 | ||||||||||||||||||||
| Inception Date | 1 Year | 5 Years | 10 Years | Since Inception (Class C1) | ||||||||||||||||
| Nuveen Minnesota Intermediate Municipal Bond Fund: | ||||||||||||||||||||
Class A (return before taxes) | 2/25/94 | 0.07 | % | 3.28 | % | 3.84 | % | N/A | ||||||||||||
Class A (return after taxes on distributions) | 0.07 | % | 3.24 | % | 3.79 | % | N/A | |||||||||||||
Class A (return after taxes on distributions and sales of fund shares) | 1.28 | % | 3.34 | % | 3.83 | % | N/A | |||||||||||||
Class C1 (return before taxes) | 10/28/09 | 2.55 | % | N/A | N/A | 3.34 | % | |||||||||||||
Class I (return before taxes) | 2/25/94 | 3.24 | % | 3.99 | % | 4.26 | % | N/A | ||||||||||||
| Barclays Capital 1-15 Year Blend Municipal Bond Index (reflects no deduction for fees, expenses or taxes) | 2.97 | % | 4.55 | % | 4.78 | % | 3.58 | % | ||||||||||||
| Lipper Other States Intermediate Municipal Debt Funds Category Average (reflects no deduction for fees, expenses or taxes) | 1.90 | % | 3.32 | % | 3.70 | % | 2.56 | % | ||||||||||||
10
Section 1 Fund Summaries
Management
Investment Adviser
Nuveen Fund Advisors, Inc.
Sub-Adviser
Nuveen Asset Management, LLC
Portfolio Manager
Name | Title | Portfolio Manager of Fund Since | ||
| Christopher L. Drahn, CFA | Senior Vice President | February 1994 |
Purchase and Sale of Fund Shares
You may purchase, redeem or exchange shares of the fund on any business day, which is any day the New York Stock Exchange is open for business. You may purchase, redeem or exchange shares of the fund either through a financial advisor or other financial intermediary or directly from the fund. Class C1 shares are available only through dividend reinvestments by current Class C1 shareholders. The fund’s initial and subsequent investment minimums generally are as follows, although the fund may reduce or waive the minimums in some cases:
| Class A and Class C | Class I | |||
| Eligibility and Minimum Initial Investment | $3,000 | Available only through fee-based programs and to other limited categories of investors as described in the prospectus.
$100,000 for all accounts except:
• $250 for clients of financial intermediaries and family offices that have accounts holding Class I shares with an aggregate value of at least $100,000 (or that are expected to reach this level).
• No minimum for certain other categories of eligible investors as described in the prospectus. | ||
| Minimum Additional Investment | $100 | No minimum. |
Tax Information
The fund intends to make distributions that are exempt from regular federal and Minnesota state income tax. A portion of these distributions, however, may be subject to the federal and state alternative minimum tax.
Payments to Broker-Dealers and Other Financial Intermediaries
If you purchase shares of the fund through a broker-dealer or other financial intermediary (such as a bank or financial advisor), the fund, its distributor or its investment adviser may pay the intermediary for the sale of fund shares and related services. These payments may create a conflict of interest by influencing the broker-dealer or other financial intermediary and your salesperson to recommend the fund over another investment. Ask your financial advisor or visit your financial intermediary’s website for more information.
Section 1 Fund Summaries
11
Nuveen Minnesota Municipal Bond Fund
Investment Objective
The investment objective of the fund is to provide maximum current income that is exempt from both federal income tax and Minnesota state income tax to the extent consistent with prudent investment risk.
Fees and Expenses of the Fund
This table describes the fees and expenses that you may pay if you buy and hold shares of the fund. You may qualify for sales charge discounts if you and your family invest, or agree to invest in the future, at least $50,000 in the fund or in other Nuveen Mutual Funds. More information about these and other discounts, as well as eligibility requirements for each share class, is available from your financial advisor and in “What Share Classes We Offer” on page 44 of the fund’s prospectus, “How to Reduce Your Sales Charge” on page 46 of the prospectus and “Purchase and Redemption of Fund Shares” on page S-71 of the fund’s statement of additional information.
Shareholder Fees
(fees paid directly from your investment)
| Class A | Class C | Class C1 | Class I | |||||||||||||
| Maximum Sales Charge (Load) Imposed on Purchases (as a percentage of offering price) | 4.20% | None | None | None | ||||||||||||
| Maximum Deferred Sales Charge (Load) (as a percentage of the lesser of purchase price or redemption proceeds)1 | None | 1.00% | 1.00% | None | ||||||||||||
| Maximum Sales Charge (Load) Imposed on Reinvested Dividends | None | None | None | None | ||||||||||||
| Exchange Fee | None | None | None | None | ||||||||||||
| Annual Low Balance Account Fee (for accounts under $1,000)2 | $15 | $15 | $15 | $15 | ||||||||||||
Annual Fund Operating Expenses
(expenses that you pay each year as a percentage of the value of your investment)
| Class A | Class C | Class C1 | Class I | |||||||||||||
| Management Fees | 0.54% | 0.54% | 0.54% | 0.54% | ||||||||||||
| Distribution and Service (12b-1) Fees | 0.20% | 0.75% | 0.65% | 0.00% | ||||||||||||
| Other Expenses | 0.11% | 0.11% | 0.11% | 0.11% | ||||||||||||
| Acquired Fund Fees and Expenses | 0.01% | 0.01% | 0.01% | 0.01% | ||||||||||||
| Total Annual Fund Operating Expenses3 | 0.86% | 1.41% | 1.31% | 0.66% | ||||||||||||
| 1 | The CDSC on Class C and Class C1 shares applies only to redemptions within 12 months of purchase. |
| 2 | Fee applies to the following types of accounts held directly with the fund: accounts established pursuant to the Uniform Transfers to Minors Act (UTMA) or Uniform Gifts to Minors Act (UGMA). |
| 3 | Expenses have been restated to reflect current contractual fees and estimated other expenses. |
12
Section 1 Fund Summaries
Example
The following example is intended to help you compare the cost of investing in the fund with the cost of investing in other mutual funds. The example assumes that you invest $10,000 in the fund for the time periods indicated and then either redeem or do not redeem your shares at the end of a period. The example also assumes that your investment has a 5% return each year and that the fund’s operating expenses remain the same. Although your actual costs may be higher or lower, based on these assumptions your costs would be:
| Redemption | No Redemption | |||||||||||||||||||||||||||||||||||
| A | C | C1 | I | A | C | C1 | I | |||||||||||||||||||||||||||||
| 1 Year | $ | 504 | $ | 144 | $ | 133 | $ | 67 | $ | 504 | $ | 144 | $ | 133 | $ | 67 | ||||||||||||||||||||
| 3 Years | $ | 683 | $ | 446 | $ | 415 | $ | 211 | $ | 683 | $ | 446 | $ | 415 | $ | 211 | ||||||||||||||||||||
| 5 Years | $ | 877 | $ | 771 | $ | 718 | $ | 368 | $ | 877 | $ | 771 | $ | 718 | $ | 368 | ||||||||||||||||||||
| 10 Years | $ | 1,436 | $ | 1,691 | $ | 1,579 | $ | 822 | $ | 1,436 | $ | 1,691 | $ | 1,579 | $ | 822 | ||||||||||||||||||||
Portfolio Turnover
The fund pays transaction costs, such as commissions, when it buys and sells securities (or “turns over” its portfolio). A higher portfolio turnover rate may indicate higher transaction costs and may result in higher taxes when fund shares are held in a taxable account. These costs, which are not reflected in annual fund operating expenses or in the example, affect the fund’s performance. For the fiscal period July 1, 2010 through May 31, 2011, the fund’s portfolio turnover rate was 25% of the average value of its portfolio.
Principal Investment Strategies
Under normal market conditions, as a fundamental policy, the fund invests at least 80% of its net assets (plus the amount of any borrowings for investment purposes) in municipal securities that pay interest that is exempt from federal and Minnesota income tax, including the federal and state alternative minimum tax.
The fund normally may invest up to 20% of its net assets in taxable obligations, including obligations the interest on which is subject to the federal and state alternative minimum tax.
The fund may invest in:
| • | “general obligation” bonds; |
| • | “revenue” bonds; |
| • | participation interests in municipal leases; and |
| • | zero coupon municipal securities. |
The fund invests mainly in securities that, at the time of purchase, are either rated investment grade or are unrated and determined to be of comparable quality by the fund’s sub-adviser. However, the fund may invest up to 20% of its total assets in securities that, at the time of purchase, are rated lower than investment grade or are unrated and of comparable quality (securities commonly referred to as “high yield” securities or “junk bonds”). If the rating of a security is reduced or discontinued after purchase, the fund is not required to sell the security, but may consider doing so.
In selecting securities for the fund, the fund’s sub-adviser first determines its economic outlook and the direction in which inflation and interest rates are expected to move. In selecting individual securities consistent with this outlook, the sub-adviser evaluates factors such as credit quality, yield, maturity, liquidity, and portfolio diversification. The sub-adviser conducts research on potential and current holdings in the fund to determine whether the fund should purchase or retain a security. This is a continuing process, the focus of which changes according to market conditions, the availability of various permitted investments, and cash flows into and out of the fund.
The fund will attempt to maintain the weighted average maturity of its portfolio securities at ten to twenty-five years under normal market conditions.
Section 1 Fund Summaries
13
The fund may utilize futures contracts and options on futures contracts in an attempt to manage market risk, credit risk and yield curve risk, and to manage the effective maturity or duration of securities in the fund’s portfolio. The fund may not use such instruments to gain exposure to a security or type of security that it would be prohibited by its investment restrictions from purchasing directly.
Principal Risks
The price and yield of this fund will change daily due to changes in interest rates and other factors, which means you could lose money. An investment in the fund is not a deposit of a bank and is not insured or guaranteed by the Federal Deposit Insurance Corporation or any other governmental agency. The principal risks of investing in this fund are described below:
Call Risk—If an issuer calls higher-yielding bonds held by the fund, performance could be adversely impacted.
Credit Risk—Credit risk is the risk that an issuer of a municipal bond may be unable or unwilling to make interest and principal payments when due and the related risk that the value of a bond may decline because of concerns about the issuer’s ability or willingness to make such payments. In addition, parties to other financial contracts with the fund could default on their obligations.
Futures Contract Risk—The use of futures contracts involves additional risks and transaction costs which could leave the fund in a worse position than if it had not used these instruments. Futures contracts may entail investment exposures that are greater than their cost would suggest. As a result, a small investment in futures contracts could have a large impact on performance.
High Yield Securities Risk—High yield securities generally are less liquid, have more volatile prices, and have greater credit risk than investment grade securities.
Income Risk—The fund’s income could decline during periods of falling interest rates.
Interest Rate Risk—Interest rate risk is the risk that the value of the fund’s portfolio will decline because of rising interest rates.
Market Risk—The market values of municipal bonds owned by the fund may decline, at times sharply and unpredictably.
Non-Diversification Risk—As a non-diversified fund, the fund may invest a larger portion of its assets in the securities of a limited number of issuers and may be more sensitive to any single economic, political or regulatory occurrence than a diversified fund.
State Concentration Risk—Because the fund primarily purchases municipal bonds from Minnesota, the fund is more susceptible to adverse economic, political or regulatory changes affecting municipal bond issuers in that state.
Fund Performance
The following bar chart and table provide some indication of the potential risks of investing in the fund. The fund’s past performance (before and after taxes) is not necessarily an indication of how the fund will perform in the future. Updated performance information is available at www.nuveen.com/MF/products/performancesummary.aspx or by calling (800) 257-8787.
14
Section 1 Fund Summaries
The bar chart below shows the variability of the fund’s performance from year to year for Class A shares. The performance of other share classes will differ due to their different expense structures. The bar chart and highest/lowest quarterly returns that follow do not reflect sales charges, and if these charges were reflected, the returns would be less than those shown.
Class A Annual Total Return*
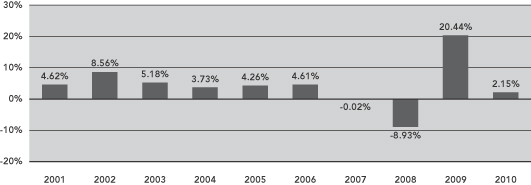
| * | Class A year-to-date total return as of June 30, 2011 was 5.07%. |
During the ten-year period ended December 31, 2010, the fund’s highest and lowest quarterly returns were 9.94% and -5.32%, respectively, for the quarters ended September 30, 2009 and December 31, 2010.
The table below shows the variability of the fund’s average annual returns and how they compare over the time periods indicated with those of a broad measure of market performance and an index of funds with similar investment objectives. All after-tax returns are calculated using the historical highest individual federal marginal income tax rates and do not reflect the impact of state and local taxes. After-tax returns are shown for Class A shares only; after-tax returns for other share classes will vary. Your own actual after-tax returns will depend on your specific tax situation and may differ from what is shown here.
Both the bar chart and the table assume that all distributions have been reinvested. Performance reflects fee waivers, if any, in effect during the periods presented. If any such waivers were not in place, returns would be reduced.
Performance is not shown for Class C shares, which have not been offered for a full calendar year.
| Average Annual Total Returns for the Periods Ended December 31, 2010 | ||||||||||||||||
| Inception Date | 1 Year | 5 Years | 10 Years | |||||||||||||
| Nuveen Minnesota Municipal Bond Fund: | ||||||||||||||||
Class A (return before taxes) | 7/11/88 | (2.15 | )% | 2.35 | % | 3.79 | % | |||||||||
Class A (return after taxes on distributions) | (2.17 | )% | 2.29 | % | 3.72 | % | ||||||||||
Class A (return after taxes on distributions and sales of fund shares) | (0.19 | )% | 2.56 | % | 3.82 | % | ||||||||||
Class C1 (return before taxes) | 2/1/99 | 1.65 | % | 2.74 | % | 3.78 | % | |||||||||
Class I (return before taxes) | 8/1/97 | 2.31 | % | 3.40 | % | 4.46 | % | |||||||||
| Barclays Capital Municipal Bond Index (reflects no deduction for fees, expenses or taxes) | 2.38 | % | 4.09 | % | 4.83 | % | ||||||||||
| Lipper Minnesota Municipal Debt Funds Category Average (reflects no deduction for fees, expenses or taxes) | 1.51 | % | 3.05 | % | 3.99 | % | ||||||||||
Section 1 Fund Summaries
15
Management
Investment Adviser
Nuveen Fund Advisors, Inc.
Sub-Adviser
Nuveen Asset Management, LLC
Portfolio Manager
Name | Title | Portfolio Manager of Fund Since | ||
| Douglas J. White, CFA | Senior Vice President | July 1988 |
Purchase and Sale of Fund Shares
You may purchase, redeem or exchange shares of the fund on any business day, which is any day the New York Stock Exchange is open for business. You may purchase, redeem or exchange shares of the fund either through a financial advisor or other financial intermediary or directly from the fund. Class C1 shares are available only through dividend reinvestments by current Class C1 shareholders. The fund’s initial and subsequent investment minimums generally are as follows, although the fund may reduce or waive the minimums in some cases:
| Class A and Class C | Class I | |||
| Eligibility and Minimum Initial Investment | $3,000 | Available only through fee-based programs and to other limited categories of investors as described in the prospectus.
$100,000 for all accounts except:
• $250 for clients of financial intermediaries and family offices that have accounts holding Class I shares with an aggregate value of at least $100,000 (or that are expected to reach this level).
• No minimum for certain other categories of eligible investors as described in the prospectus. | ||
| Minimum Additional Investment | $100 | No minimum. |
Tax Information
The fund intends to make distributions that are exempt from regular federal and Minnesota state income tax. A portion of these distributions, however, may be subject to the federal and state alternative minimum tax.
Payments to Broker-Dealers and Other Financial Intermediaries
If you purchase shares of the fund through a broker-dealer or other financial intermediary (such as a bank or financial advisor), the fund, its distributor or its investment adviser may pay the intermediary for the sale of fund shares and related services. These payments may create a conflict of interest by influencing the broker-dealer or other financial intermediary and your salesperson to recommend the fund over another investment. Ask your financial advisor or visit your financial intermediary’s website for more information.
16
Section 1 Fund Summaries
Investment Objective
The investment objective of the fund is to provide maximum current income that is exempt from both federal income tax and Missouri state income tax to the extent consistent with prudent investment risk.
Fees and Expenses of the Fund
This table describes the fees and expenses that you may pay if you buy and hold shares of the fund. You may qualify for sales charge discounts if you and your family invest, or agree to invest in the future, at least $50,000 in the fund or in other Nuveen Mutual Funds. More information about these and other discounts, as well as eligibility requirements for each share class, is available from your financial advisor and in “What Share Classes We Offer” on page 44 of the fund’s prospectus, “How to Reduce Your Sales Charge” on page 46 of the prospectus and “Purchase and Redemption of Fund Shares” on page S-71 of the fund’s statement of additional information.
Shareholder Fees
(fees paid directly from your investment)
| Class A | Class C1 | Class I | ||||||||||
| Maximum Sales Charge (Load) Imposed on Purchases (as a percentage of offering price) | 4.20% | None | None | |||||||||
| Maximum Deferred Sales Charge (Load) (as a percentage of the lesser of purchase price or redemption proceeds)1 | None | 1.00% | None | |||||||||
| Maximum Sales Charge (Load) Imposed on Reinvested Dividends | None | None | None | |||||||||
| Exchange Fee | None | None | None | |||||||||
| Annual Low Balance Account Fee (for accounts under $1,000)2 | $15 | $15 | $15 | |||||||||
Annual Fund Operating Expenses
(expenses that you pay each year as a percentage of the value of your investment)
| Class A | Class C1 | Class I | ||||||||||
| Management Fees | 0.64% | 0.64% | 0.64% | |||||||||
| Distribution and Service (12b-1) Fees | 0.20% | 0.65% | 0.00% | |||||||||
| Other Expenses | 0.08% | 0.08% | 0.08% | |||||||||
| Acquired Fund Fees and Expenses | 0.01% | 0.01% | 0.01% | |||||||||
| Total Annual Fund Operating Expenses3 | 0.93% | 1.38% | 0.73% | |||||||||
| Fee Waivers and/or Expense Reimbursements | (0.02)% | (0.02)% | (0.02)% | |||||||||
| Total Annual Fund Operating Expenses After Fee Waivers and/or Expense Reimbursements4 | 0.91% | 1.36% | 0.71% | |||||||||
| 1 | The CDSC on Class C1 shares applies only to redemptions within 12 months of purchase. |
| 2 | Fee applies to the following types of accounts held directly with the fund: accounts established pursuant to the Uniform Transfers to Minors Act (UTMA) or Uniform Gifts to Minors Act (UGMA). |
| 3 | Expenses have been restated to reflect current contractual fees and estimated other expenses. |
| 4 | The fund’s investment adviser has contractually agreed to waive fees and reimburse other fund expenses through March 31, 2013 so that total annual fund operating expenses, after fee waivers and/or expense reimbursements and excluding Acquired Fund Fees and Expenses, do not exceed 0.90%, 1.35%, and 0.70% for Class A, Class C1, and Class I shares, respectively. Fee waivers and expense reimbursements will not be terminated prior to that time without the approval of the fund’s board of directors. |
Section 1 Fund Summaries
17
Example
The following example is intended to help you compare the cost of investing in the fund with the cost of investing in other mutual funds. The example assumes that you invest $10,000 in the fund for the time periods indicated and then either redeem or do not redeem your shares at the end of a period. The example also assumes that your investment has a 5% return each year, that the fund’s operating expenses remain the same, and the contractual fee waivers currently in place are not renewed beyond March 31, 2013. Although your actual costs may be higher or lower, based on these assumptions your costs would be:
| Redemption | No Redemption | |||||||||||||||||||||||||||
| A | C1 | I | A | C1 | I | |||||||||||||||||||||||
| 1 Year | $ | 509 | $ | 138 | $ | 73 | $ | 509 | $ | 138 | $ | 73 | ||||||||||||||||
| 3 Years | $ | 701 | $ | 434 | $ | 230 | $ | 701 | $ | 434 | $ | 230 | ||||||||||||||||
| 5 Years | $ | 910 | $ | 752 | $ | 403 | $ | 910 | $ | 752 | $ | 403 | ||||||||||||||||
| 10 Years | $ | 1,512 | $ | 1,655 | $ | 904 | $ | 1,512 | $ | 1,655 | $ | 904 | ||||||||||||||||
Portfolio Turnover
The fund pays transaction costs, such as commissions, when it buys and sells securities (or “turns over” its portfolio). A higher portfolio turnover rate may indicate higher transaction costs and may result in higher taxes when fund shares are held in a taxable account. These costs, which are not reflected in annual fund operating expenses or in the example, affect the fund’s performance. For the fiscal period July 1, 2010 through May 31, 2011, the fund’s portfolio turnover rate was 10% of the average value of its portfolio.
Principal Investment Strategies
Under normal market conditions, as a fundamental policy, the fund invests at least 80% of its net assets (plus the amount of any borrowings for investment purposes) in municipal securities that pay interest that is exempt from federal and Missouri income tax, including the federal alternative minimum tax.
The fund normally may invest up to 20% of its net assets in taxable obligations, including obligations the interest on which is subject to the federal alternative minimum tax.
The fund may invest in:
| • | “general obligation” bonds; |
| • | “revenue” bonds; |
| • | participation interests in municipal leases; and |
| • | zero coupon municipal securities. |
The fund invests mainly in securities that, at the time of purchase, are either rated investment grade or are unrated and determined to be of comparable quality by the fund’s sub-adviser. However, the fund may invest up to 20% of its total assets in securities that, at the time of purchase, are rated lower than investment grade or are unrated and of comparable quality (securities commonly referred to as “high yield” securities or “junk bonds”). If the rating of a security is reduced or discontinued after purchase, the fund is not required to sell the security, but may consider doing so.
In selecting securities for the fund, the fund’s sub-adviser first determines its economic outlook and the direction in which inflation and interest rates are expected to move. In selecting individual securities consistent with this outlook, the sub-adviser evaluates factors such as credit quality, yield, maturity, liquidity, and portfolio diversification. The sub-adviser conducts research on potential and current holdings in the fund to determine whether the fund should purchase or retain a security. This is a continuing process, the focus of which changes according to market conditions, the availability of various permitted investments, and cash flows into and out of the fund.
The fund will attempt to maintain the weighted average maturity of its portfolio securities at ten to twenty-five years under normal market conditions.
18
Section 1 Fund Summaries
The fund may utilize futures contracts and options on futures contracts in an attempt to manage market risk, credit risk and yield curve risk, and to manage the effective maturity or duration of securities in the fund’s portfolio. The fund may not use such instruments to gain exposure to a security or type of security that it would be prohibited by its investment restrictions from purchasing directly.
Principal Risks
The price and yield of this fund will change daily due to changes in interest rates and other factors, which means you could lose money. An investment in the fund is not a deposit of a bank and is not insured or guaranteed by the Federal Deposit Insurance Corporation or any other governmental agency. The principal risks of investing in this fund are described below:
Call Risk—If an issuer calls higher-yielding bonds held by the fund, performance could be adversely impacted.
Credit Risk—Credit risk is the risk that an issuer of a municipal bond may be unable or unwilling to make interest and principal payments when due and the related risk that the value of a bond may decline because of concerns about the issuer’s ability or willingness to make such payments. In addition, parties to other financial contracts with the fund could default on their obligations.
Futures Contract Risk—The use of futures contracts involves additional risks and transaction costs which could leave the fund in a worse position than if it had not used these instruments. Futures contracts may entail investment exposures that are greater than their cost would suggest. As a result, a small investment in futures contracts could have a large impact on performance.
High Yield Securities Risk—High yield securities generally are less liquid, have more volatile prices, and have greater credit risk than investment grade securities.
Income Risk—The fund’s income could decline during periods of falling interest rates.
Interest Rate Risk—Interest rate risk is the risk that the value of the fund’s portfolio will decline because of rising interest rates.
Market Risk—The market values of municipal bonds owned by the fund may decline, at times sharply and unpredictably.
Non-Diversification Risk—As a non-diversified fund, the fund may invest a larger portion of its assets in the securities of a limited number of issuers and may be more sensitive to any single economic, political or regulatory occurrence than a diversified fund.
State Concentration Risk—Because the fund primarily purchases municipal bonds from Missouri, the fund is more susceptible to adverse economic, political or regulatory changes affecting municipal bond issuers in that state.
Fund Performance
The following bar chart and table provide some indication of the potential risks of investing in the fund. The fund’s past performance (before and after taxes) is not necessarily an indication of how the fund will perform in the future. Updated performance information is available at www.nuveen.com/MF/products/performancesummary.aspx or by calling (800) 257-8787.
Section 1 Fund Summaries
19
The bar chart below shows the variability of the fund’s performance from year to year for Class I shares. The performance of the other share classes will differ due to their different expense structures.
Class I Annual Total Return*
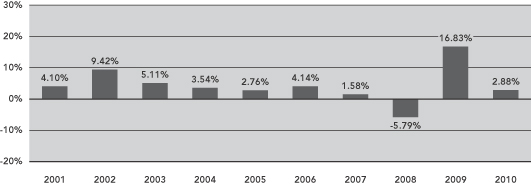
| * | Class I year-to-date total return as of June 30, 2011 was 5.02%. |
During the ten-year period ended December 31, 2010, the fund’s highest and lowest quarterly returns were 8.16% and -3.98%, respectively, for the quarters ended September 30, 2009 and September 30, 2008.
The table below shows the variability of the fund’s average annual returns and how they compare over the time periods indicated with those of a broad measure of market performance and an index of funds with similar investment objectives. All after-tax returns are calculated using the historical highest individual federal marginal income tax rates and do not reflect the impact of state and local taxes. After-tax returns are shown for Class I shares only; after-tax returns for other share classes will vary. Your own actual after-tax returns will depend on your specific tax situation and may differ from what is shown here.
Both the bar chart and the table assume that all distributions have been reinvested. Performance reflects fee waivers, if any, in effect during the periods presented. If any such waivers were not in place, returns would be reduced.
| Average Annual Total Returns for the Periods Ended December 31, 20101 | ||||||||||||||||||||
| Inception Date | 1 Year | 5 Years | 10 Years | Since Inception (Class C1) | ||||||||||||||||
| Nuveen Missouri Tax Free Fund: | ||||||||||||||||||||
Class A (return before taxes) | 9/28/90 | (1.61 | )% | 2.57 | % | 3.62 | % | N/A | ||||||||||||
Class C1 (return before taxes) | 9/24/01 | 2.22 | % | 3.01 | % | N/A | 3.44 | % | ||||||||||||
Class I (return before taxes) | 7/15/88 | 2.88 | % | 3.68 | % | 4.32 | % | N/A | ||||||||||||
Class I (return after taxes on distributions) | 2.84 | % | 3.61 | % | 4.24 | % | N/A | |||||||||||||
Class I (return after taxes on distributions and sales of fund shares) | 3.39 | % | 3.75 | % | 4.30 | % | N/A | |||||||||||||
| Barclays Capital Municipal Bond Index (reflects no deduction for fees, expenses or taxes) | 2.38 | % | 4.09 | % | 4.83 | % | 3.44 | % | ||||||||||||
| Lipper Other States Municipal Debt Funds Category Average (reflects no deduction for fees, expenses or taxes) | 1.11 | % | 2.90 | % | 3.81 | % | 3.60 | % | ||||||||||||
| 1 | Performance presented prior to 9/24/01 represents that of the Firstar Missouri Tax-Exempt Bond Fund, a series of Firstar Funds, Inc., which merged into the fund on that date. The Firstar Missouri Tax-Exempt Bond Fund was organized on 12/11/00 and, prior to that, was a separate series of Mercantile Mutual Funds, Inc. |
20
Section 1 Fund Summaries
Management
Investment Adviser
Nuveen Fund Advisors, Inc.
Sub-Adviser
Nuveen Asset Management, LLC
Portfolio Manager
Name | Title | Portfolio Manager of Fund Since | ||
| Christopher L. Drahn, CFA | Senior Vice President | December 2002 |
Purchase and Sale of Fund Shares
You may purchase, redeem or exchange shares of the fund on any business day, which is any day the New York Stock Exchange is open for business. You may purchase, redeem or exchange shares of the fund either through a financial advisor or other financial intermediary or directly from the fund. Class C1 shares are available only through dividend reinvestments by current Class C1 shareholders. The fund’s initial and subsequent investment minimums generally are as follows, although the fund may reduce or waive the minimums in some cases:
| Class A | Class I | |||
| Eligibility and Minimum Initial Investment | $3,000 | Available only through fee-based programs and to other limited categories of investors as described in the prospectus.
$100,000 for all accounts except:
• $250 for clients of financial intermediaries and family offices that have accounts holding Class I shares with an aggregate value of at least $100,000 (or that are expected to reach this level).
• No minimum for certain other categories of eligible investors as described in the prospectus. | ||
| Minimum Additional Investment | $100 | No minimum. |
Tax Information
The fund intends to make distributions that are exempt from regular federal and Missouri state income tax. A portion of these distributions, however, may be subject to the federal alternative minimum tax.
Payments to Broker-Dealers and Other Financial Intermediaries
If you purchase shares of the fund through a broker-dealer or other financial intermediary (such as a bank or financial advisor), the fund, its distributor or its investment adviser may pay the intermediary for the sale of fund shares and related services. These payments may create a conflict of interest by influencing the broker-dealer or other financial intermediary and your salesperson to recommend the fund over another investment. Ask your financial advisor or visit your financial intermediary’s website for more information.
Section 1 Fund Summaries
21
Nuveen Nebraska Municipal Bond Fund
Investment Objective
The investment objective of the fund is to provide maximum current income that is exempt from both federal income tax and Nebraska state income tax to the extent consistent with prudent investment risk.
Fees and Expenses of the Fund
This table describes the fees and expenses that you may pay if you buy and hold shares of the fund. You may qualify for sales charge discounts if you and your family invest, or agree to invest in the future, at least $50,000 in the fund or in other Nuveen Mutual Funds. More information about these and other discounts, as well as eligibility requirements for each share class, is available from your financial advisor and in “What Share Classes We Offer” on page 44 of the fund’s prospectus, “How to Reduce Your Sales Charge” on page 46 of the prospectus and “Purchase and Redemption of Fund Shares” on page S-71 of the fund’s statement of additional information.
Shareholder Fees
(fees paid directly from your investment)
| Class A | Class C | Class C1 | Class I | |||||||||||||
| Maximum Sales Charge (Load) Imposed on Purchases (as a percentage of offering price) | 4.20% | None | None | None | ||||||||||||
| Maximum Deferred Sales Charge (Load) (as a percentage of the lesser of purchase price or redemption proceeds)1 | None | 1.00% | 1.00% | None | ||||||||||||
| Maximum Sales Charge (Load) Imposed on Reinvested Dividends | None | None | None | None | ||||||||||||
| Exchange Fee | None | None | None | None | ||||||||||||
| Annual Low Balance Account Fee (for accounts under $1,000)2 | $15 | $15 | $15 | $15 | ||||||||||||
Annual Fund Operating Expenses
(expenses that you pay each year as a percentage of the value of your investment)
| Class A | Class C | Class C1 | Class I | |||||||||||||
| Management Fees | 0.55% | 0.55% | 0.55% | 0.55% | ||||||||||||
| Distribution and Service (12b-1) Fees | 0.20% | 0.75% | 0.65% | 0.00% | ||||||||||||
| Other Expenses | 0.19% | 0.19% | 0.19% | 0.19% | ||||||||||||
| Acquired Fund Fees and Expenses | 0.01% | 0.01% | 0.01% | 0.01% | ||||||||||||
| Total Annual Fund Operating Expenses3 | 0.95% | 1.50% | 1.40% | 0.75% | ||||||||||||
| Fee Waivers and/or Expense Reimbursements | (0.04)% | (0.04)% | (0.04)% | (0.04)% | ||||||||||||
| Total Annual Fund Operating Expenses After Fee Waivers and/or Expense Reimbursements4 | 0.91% | 1.46% | 1.36% | 0.71% | ||||||||||||
| 1 | The CDSC on Class C and Class C1 shares applies only to redemptions within 12 months of purchase. |
| 2 | Fee applies to the following types of accounts held directly with the fund: accounts established pursuant to the Uniform Transfers to Minors Act (UTMA) or Uniform Gifts to Minors Act (UGMA). |
| 3 | Expenses have been restated to reflect current contractual fees and estimated other expenses. |
| 4 | The fund’s investment adviser has contractually agreed to waive fees and reimburse other fund expenses through March 31, 2013 so that total annual fund operating expenses, after fee waivers and/or expense reimbursements and excluding Acquired Fund Fees and Expenses, do not exceed 0.90%, 1.45%, 1.35%, and 0.70% for Class A, Class C, Class C1, and Class I shares, respectively. Fee waivers and expense reimbursements will not be terminated prior to that time without the approval of the fund’s board of directors. |
22
Section 1 Fund Summaries
Example
The following example is intended to help you compare the cost of investing in the fund with the cost of investing in other mutual funds. The example assumes that you invest $10,000 in the fund for the time periods indicated and then either redeem or do not redeem your shares at the end of a period. The example also assumes that your investment has a 5% return each year, that the fund’s operating expenses remain the same, and the contractual fee waivers currently in place are not renewed beyond March 31, 2013. Although your actual costs may be higher or lower, based on these assumptions your costs would be:
| Redemption | No Redemption | |||||||||||||||||||||||||||||||||||
| A | C | C1 | I | A | C | C1 | I | |||||||||||||||||||||||||||||
| 1 Year | $ | 509 | $ | 149 | $ | 138 | $ | 73 | $ | 509 | $ | 149 | $ | 138 | $ | 73 | ||||||||||||||||||||
| 3 Years | $ | 704 | $ | 468 | $ | 437 | $ | 234 | $ | 704 | $ | 468 | $ | 437 | $ | 234 | ||||||||||||||||||||
| 5 Years | $ | 918 | $ | 813 | $ | 760 | $ | 411 | $ | 918 | $ | 813 | $ | 760 | $ | 411 | ||||||||||||||||||||
| 10 Years | $ | 1,532 | $ | 1,785 | $ | 1,674 | $ | 925 | $ | 1,532 | $ | 1,785 | $ | 1,674 | $ | 925 | ||||||||||||||||||||
Portfolio Turnover
The fund pays transaction costs, such as commissions, when it buys and sells securities (or “turns over” its portfolio). A higher portfolio turnover rate may indicate higher transaction costs and may result in higher taxes when fund shares are held in a taxable account. These costs, which are not reflected in annual fund operating expenses or in the example, affect the fund’s performance. For the fiscal period July 1, 2010 through May 31, 2011, the fund’s portfolio turnover rate was 21% of the average value of its portfolio.
Principal Investment Strategies
Under normal market conditions, as a fundamental policy, the fund invests at least 80% of its net assets (plus the amount of any borrowings for investment purposes) in municipal securities that pay interest that is exempt from federal and Nebraska income tax, including the federal alternative minimum tax.
The fund normally may invest up to 20% of its net assets in taxable obligations, including obligations the interest on which is subject to the federal alternative minimum tax.
The fund may invest in:
| • | “general obligation” bonds; |
| • | “revenue” bonds; |
| • | participation interests in municipal leases; and |
| • | zero coupon municipal securities. |
The fund invests mainly in securities that, at the time of purchase, are either rated investment grade or are unrated and determined to be of comparable quality by the fund’s sub-adviser. However, the fund may invest up to 20% of its total assets in securities that, at the time of purchase, are rated lower than investment grade or are unrated and of comparable quality (securities commonly referred to as “high yield” securities or “junk bonds”). If the rating of a security is reduced or discontinued after purchase, the fund is not required to sell the security, but may consider doing so.
In selecting securities for the fund, the fund’s sub-adviser first determines its economic outlook and the direction in which inflation and interest rates are expected to move. In selecting individual securities consistent with this outlook, the sub-adviser evaluates factors such as credit quality, yield, maturity, liquidity, and portfolio diversification. The sub-adviser conducts research on potential and current holdings in the fund to determine whether the fund should purchase or retain a security. This is a continuing process, the focus of which changes according to market conditions, the availability of various permitted investments, and cash flows into and out of the fund.
The fund will attempt to maintain the weighted average maturity of its portfolio securities at ten to twenty-five years under normal market conditions.
Section 1 Fund Summaries
23
The fund may utilize futures contracts and options on futures contracts in an attempt to manage market risk, credit risk and yield curve risk, and to manage the effective maturity or duration of securities in the fund’s portfolio. The fund may not use such instruments to gain exposure to a security or type of security that it would be prohibited by its investment restrictions from purchasing directly.
Principal Risks
The price and yield of this fund will change daily due to changes in interest rates and other factors, which means you could lose money. An investment in the fund is not a deposit of a bank and is not insured or guaranteed by the Federal Deposit Insurance Corporation or any other governmental agency. The principal risks of investing in this fund are described below:
Call Risk—If an issuer calls higher-yielding bonds held by the fund, performance could be adversely impacted.
Credit Risk—Credit risk is the risk that an issuer of a municipal bond may be unable or unwilling to make interest and principal payments when due and the related risk that the value of a bond may decline because of concerns about the issuer’s ability or willingness to make such payments. In addition, parties to other financial contracts with the fund could default on their obligations.
Futures Contract Risk—The use of futures contracts involves additional risks and transaction costs which could leave the fund in a worse position than if it had not used these instruments. Futures contracts may entail investment exposures that are greater than their cost would suggest. As a result, a small investment in futures contracts could have a large impact on performance.
High Yield Securities Risk—High yield securities generally are less liquid, have more volatile prices, and have greater credit risk than investment grade securities.
Income Risk—The fund’s income could decline during periods of falling interest rates.
Interest Rate Risk—Interest rate risk is the risk that the value of the fund’s portfolio will decline because of rising interest rates.
Market Risk—The market values of municipal bonds owned by the fund may decline, at times sharply and unpredictably.
Non-Diversification Risk—As a non-diversified fund, the fund may invest a larger portion of its assets in the securities of a limited number of issuers and may be more sensitive to any single economic, political or regulatory occurrence than a diversified fund.
State Concentration Risk—Because the fund primarily purchases municipal bonds from Nebraska, the fund is more susceptible to adverse economic, political or regulatory changes affecting municipal bond issuers in that state.
Fund Performance
The following bar chart and table provide some indication of the potential risks of investing in the fund. The fund’s past performance (before and after taxes) is not necessarily an indication of how the fund will perform in the future. Updated performance information is available at www.nuveen.com/MF/products/performancesummary.aspx or by calling (800) 257-8787.
24
Section 1 Fund Summaries
The bar chart below shows the variability of the fund’s performance from year to year for Class A shares. The performance of the other share classes will differ due to their different expense structures. The bar chart and highest/lowest quarterly returns that follow do not reflect sales charges, and if these charges were reflected, the returns would be less than those shown.
Class A Annual Total Return*
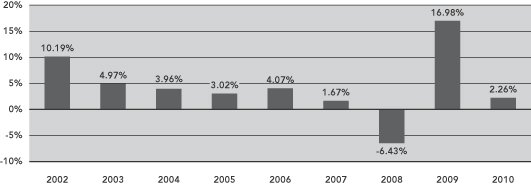
| * | Class A year-to-date total return as of June 30, 2011 was 4.17%. |
During the nine-year period ended December 31, 2010, the fund’s highest and lowest quarterly returns were 7.44% and -4.48%, respectively, for the quarters ended September 30, 2009 and September 30, 2008.
The table below shows the variability of the fund’s average annual returns and how they compare over the time periods indicated with those of a broad measure of market performance and an index of funds with similar investment objectives. All after-tax returns are calculated using the historical highest individual federal marginal income tax rates and do not reflect the impact of state and local taxes. After-tax returns are shown for Class A shares only; after-tax returns for other share classes will vary. Your own actual after-tax returns will depend on your specific tax situation and may differ from what is shown here.
Both the bar chart and the table assume that all distributions have been reinvested. Performance reflects fee waivers, if any, in effect during the periods presented. If any such waivers were not in place, returns would be reduced.
Performance is not shown for Class C shares, which have not been offered for a full calendar year.
| Average Annual Total Returns for the Periods Ended December 31, 2010 | ||||||||||||||||
| Inception Date | 1 Year | 5 Years | Since Inception | |||||||||||||
| Nuveen Nebraska Municipal Bond Fund: | ||||||||||||||||
Class A (return before taxes) | 2/28/01 | (2.04 | )% | 2.57 | % | 3.86 | % | |||||||||
Class A (return after taxes on distributions) | (2.05 | )% | 2.53 | % | 3.83 | % | ||||||||||
Class A (return after taxes on distributions and sales of fund shares) | 0.04 | % | 2.77 | % | 3.88 | % | ||||||||||
Class C1 (return before taxes) | 2/28/01 | 1.97 | % | 3.06 | % | 3.86 | % | |||||||||
Class I (return before taxes) | 2/28/01 | 2.51 | % | 3.69 | % | 4.56 | % | |||||||||
| Barclays Capital Municipal Bond Index (reflects no deduction for fees, expenses or taxes) | 2.38 | % | 4.09 | % | 4.78 | % | ||||||||||
| Lipper Other States Municipal Debt Funds Category Average (reflects no deduction for fees, expenses or taxes) | 1.11 | % | 2.90 | % | 3.78 | % | ||||||||||
Section 1 Fund Summaries
25
Management
Investment Adviser
Nuveen Fund Advisors, Inc.
Sub-Adviser
Nuveen Asset Management, LLC
Portfolio Manager
Name | Title | Portfolio Manager of Fund Since | ||
| Douglas J. White, CFA | Senior Vice President | December 2010 |
Purchase and Sale of Fund Shares
You may purchase, redeem or exchange shares of the fund on any business day, which is any day the New York Stock Exchange is open for business. You may purchase, redeem or exchange shares of the fund either through a financial advisor or other financial intermediary or directly from the fund. Class C1 shares are available only through dividend reinvestments by current Class C1 shareholders. The fund’s initial and subsequent investment minimums generally are as follows, although the fund may reduce or waive the minimums in some cases:
| Class A and Class C | Class I | |||
| Eligibility and Minimum Initial Investment | $3,000 | Available only through fee-based programs and to other limited categories of investors as described in the prospectus.
$100,000 for all accounts except:
• $250 for clients of financial intermediaries and family offices that have accounts holding Class I shares with an aggregate value of at least $100,000 (or that are expected to reach this level).
• No minimum for certain other categories of eligible investors as described in the prospectus. | ||
| Minimum Additional Investment | $100 | No minimum. |
Tax Information
The fund intends to make distributions that are exempt from regular federal and Nebraska state income tax. A portion of these distributions, however, may be subject to the federal and state alternative minimum tax.
Payments to Broker-Dealers and Other Financial Intermediaries
If you purchase shares of the fund through a broker-dealer or other financial intermediary (such as a bank or financial advisor), the fund, its distributor or its investment adviser may pay the intermediary for the sale of fund shares and related services. These payments may create a conflict of interest by influencing the broker-dealer or other financial intermediary and your salesperson to recommend the fund over another investment. Ask your financial advisor or visit your financial intermediary’s website for more information.
26
Section 1 Fund Summaries
Investment Objective
The investment objective of the fund is to provide maximum current income that is exempt from both federal income tax and Ohio state income tax to the extent consistent with prudent investment risk.
Fees and Expenses of the Fund
This table describes the fees and expenses that you may pay if you buy and hold shares of the fund. You may qualify for sales charge discounts if you and your family invest, or agree to invest in the future, at least $50,000 in the fund or in other Nuveen Mutual Funds. More information about these and other discounts, as well as eligibility requirements for each share class, is available from your financial advisor and in “What Share Classes We Offer” on page 44 of the fund’s prospectus, “How to Reduce Your Sales Charge” on page 46 of the prospectus and “Purchase and Redemption of Fund Shares” on page S-71 of the fund’s statement of additional information.
Shareholder Fees
(fees paid directly from your investment)
| Class A | Class C1 | Class I | ||||||||||
| Maximum Sales Charge (Load) Imposed on Purchases (as a percentage of offering price) | 4.20% | None | None | |||||||||
Maximum Deferred Sales Charge (Load) (as a percentage of the lesser of purchase price or redemption proceeds)1 | None | 1.00% | None | |||||||||
| Maximum Sales Charge (Load) Imposed on Reinvested Dividends | None | None | None | |||||||||
| Exchange Fee | None | None | None | |||||||||
| Annual Low Balance Account Fee (for accounts under $1,000)2 | $15 | $15 | $15 | |||||||||
Annual Fund Operating Expenses
(expenses that you pay each year as a percentage of the value of your investment)
| Class A | Class C1 | Class I | ||||||||||
| Management Fees | 0.65% | 0.65% | 0.65% | |||||||||
| Distribution and Service (12b-1) Fees | 0.20% | 0.65% | 0.00% | |||||||||
| Other Expenses | 0.15% | 0.15% | 0.15% | |||||||||
| Acquired Fund Fees and Expenses | 0.01% | 0.01% | 0.01% | |||||||||
| Total Annual Fund Operating Expenses3 | 1.01% | 1.46% | 0.81% | |||||||||
| Fee Waivers and/or Expense Reimbursements | (0.10)% | (0.10)% | (0.10)% | |||||||||
| Total Annual Fund Operating Expenses After Fee Waivers and/or Expense Reimbursements4 | 0.91% | 1.36% | 0.71% | |||||||||
| 1 | The CDSC on Class C1 shares applies only to redemptions within 12 months of purchase. |
| 2 | Fee applies to the following types of accounts held directly with the fund: accounts established pursuant to the Uniform Transfers to Minors Act (UTMA) or Uniform Gifts to Minors Act (UGMA). |
| 3 | Expenses have been restated to reflect current contractual fees and estimated other expenses. |
| 4 | The fund’s investment adviser has contractually agreed to waive fees and reimburse other fund expenses through March 31, 2013 so that total annual fund operating expenses, after fee waivers and/or expense reimbursements and excluding Acquired Fund Fees and Expenses, do not exceed 0.90%, 1.35%, and 0.70% for Class A, Class C1, and Class I shares, respectively. Fee waivers and expense reimbursements will not be terminated prior to that time without the approval of the fund’s board of directors. |
Section 1 Fund Summaries
27
Example
The following example is intended to help you compare the cost of investing in the fund with the cost of investing in other mutual funds. The example assumes that you invest $10,000 in the fund for the time periods indicated and then either redeem or do not redeem your shares at the end of a period. The example also assumes that your investment has a 5% return each year, that the fund’s operating expenses remain the same, and the contractual fee waivers currently in place are not renewed beyond March 31, 2013. Although your actual costs may be higher or lower, based on these assumptions your costs would be:
| Redemption | No Redemption | |||||||||||||||||||||||||||
| A | C1 | I | A | C1 | I | |||||||||||||||||||||||
| 1 Year | $ | 509 | $ | 138 | $ | 73 | $ | 509 | $ | 138 | $ | 73 | ||||||||||||||||
| 3 Years | $ | 714 | $ | 447 | $ | 243 | $ | 714 | $ | 447 | $ | 243 | ||||||||||||||||
| 5 Years | $ | 940 | $ | 783 | $ | 435 | $ | 940 | $ | 783 | $ | 435 | ||||||||||||||||
| 10 Years | $ | 1,591 | $ | 1,733 | $ | 988 | $ | 1,591 | $ | 1,733 | $ | 988 | ||||||||||||||||
Portfolio Turnover
The fund pays transaction costs, such as commissions, when it buys and sells securities (or “turns over” its portfolio). A higher portfolio turnover rate may indicate higher transaction costs and may result in higher taxes when fund shares are held in a taxable account. These costs, which are not reflected in annual fund operating expenses or in the example, affect the fund’s performance. For the fiscal period July 1, 2010 through May 31, 2011, the fund’s portfolio turnover rate was 9% of the average value of its portfolio.
Principal Investment Strategies
Under normal market conditions, as a fundamental policy, the fund invests at least 80% of its net assets (plus the amount of any borrowings for investment purposes) in municipal securities that pay interest that is exempt from federal and Ohio income tax, including the federal alternative minimum tax.
The fund normally may invest up to 20% of its net assets in taxable obligations, including obligations the interest on which is subject to the federal alternative minimum tax.
The fund may invest in:
| • | “general obligation” bonds; |
| • | “revenue” bonds; |
| • | participation interests in municipal leases; and |
| • | zero coupon municipal securities. |
The fund invests mainly in securities that, at the time of purchase, are either rated investment grade or are unrated and determined to be of comparable quality by the fund’s sub-adviser. However, the fund may invest up to 20% of its total assets in securities that, at the time of purchase, are rated lower than investment grade or are unrated and of comparable quality (securities commonly referred to as “high yield” securities or “junk bonds”). If the rating of a security is reduced or discontinued after purchase, the fund is not required to sell the security, but may consider doing so.
In selecting securities for the fund, the fund’s sub-adviser first determines its economic outlook and the direction in which inflation and interest rates are expected to move. In selecting individual securities consistent with this outlook, the sub-adviser evaluates factors such as credit quality, yield, maturity, liquidity, and portfolio diversification. The sub-adviser conducts research on potential and current holdings in the fund to determine whether the fund should purchase or retain a security. This is a continuing process, the focus of which changes according to market conditions, the availability of various permitted investments, and cash flows into and out of the fund.
The fund will attempt to maintain the weighted average maturity of its portfolio securities at ten to twenty-five years under normal market conditions.
28
Section 1 Fund Summaries
The fund may utilize futures contracts and options on futures contracts in an attempt to manage market risk, credit risk and yield curve risk, and to manage the effective maturity or duration of securities in the fund’s portfolio. The fund may not use such instruments to gain exposure to a security or type of security that it would be prohibited by its investment restrictions from purchasing directly.
Principal Risks
The price and yield of this fund will change daily due to changes in interest rates and other factors, which means you could lose money. An investment in the fund is not a deposit of a bank and is not insured or guaranteed by the Federal Deposit Insurance Corporation or any other governmental agency. The principal risks of investing in this fund are described below:
Call Risk—If an issuer calls higher-yielding bonds held by the fund, performance could be adversely impacted.
Credit Risk—Credit risk is the risk that an issuer of a municipal bond may be unable or unwilling to make interest and principal payments when due and the related risk that the value of a bond may decline because of concerns about the issuer’s ability or willingness to make such payments. In addition, parties to other financial contracts with the fund could default on their obligations.
Futures Contract Risk—The use of futures contracts involves additional risks and transaction costs which could leave the fund in a worse position than if it had not used these instruments. Futures contracts may entail investment exposures that are greater than their cost would suggest. As a result, a small investment in futures contracts could have a large impact on performance.
High Yield Securities Risk—High yield securities generally are less liquid, have more volatile prices, and have greater credit risk than investment grade securities.
Income Risk—The fund’s income could decline during periods of falling interest rates.
Interest Rate Risk—Interest rate risk is the risk that the value of the fund’s portfolio will decline because of rising interest rates.
Market Risk—The market values of municipal bonds owned by the fund may decline, at times sharply and unpredictably.
Non-Diversification Risk—As a non-diversified fund, the fund may invest a larger portion of its assets in the securities of a limited number of issuers and may be more sensitive to any single economic, political or regulatory occurrence than a diversified fund.
State Concentration Risk—Because the fund primarily purchases municipal bonds from Ohio, the fund is more susceptible to adverse economic, political or regulatory changes affecting municipal bond issuers in that state.
Fund Performance
The following bar chart and table provide some indication of the potential risks of investing in the fund. The fund’s past performance (before and after taxes) is not necessarily an indication of how the fund will perform in the future. Updated performance information is available at www.nuveen.com/MF/products/performancesummary.aspx or by calling (800) 257-8787.
Section 1 Fund Summaries
29
The bar chart below shows the variability of the fund’s performance from year to year for Class A shares. The performance of the other share classes will differ due to their different expense structures. The bar chart and highest/lowest quarterly returns that follow do not reflect sales charges, and if these charges were reflected, the returns would be less than those shown.
Class A Annual Total Returns*
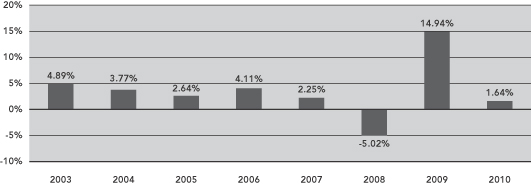
| * | Class A year-to-date total return as of June 30, 2011 was 4.52%. |
During the eight-year period ended December 31, 2010, the fund’s highest and lowest quarterly returns were 6.83% and -4.44%, respectively, for the quarters ended September 30, 2009 and December 31, 2010.
The table below shows the variability of the fund’s average annual returns and how they compare over the time periods indicated with those of a broad measure of market performance and an index of funds with similar investment objectives. All after-tax returns are calculated using the historical highest individual federal marginal income tax rates and do not reflect the impact of state and local taxes. After-tax returns are shown for Class A shares only; after-tax returns for other share classes will vary. Your own actual after-tax returns will depend on your specific tax situation and may differ from what is shown here.
Both the bar chart and the table assume that all distributions have been reinvested. Performance reflects fee waivers, if any, in effect during the periods presented. If any such waivers were not in place, returns would be reduced.
| Average Annual Total Returns for the Periods Ended December 31, 2010 | ||||||||||||||||
| Inception Date | 1 Year | 5 Years | Since Inception | |||||||||||||
| Nuveen Ohio Tax Free Fund: | ||||||||||||||||
Class A (return before taxes) | 4/30/02 | (2.61 | )% | 2.50 | % | 3.55 | % | |||||||||
Class A (return after taxes on distributions) | (2.61 | )% | 2.48 | % | 3.51 | % | ||||||||||
Class A (return after taxes on distributions and sales of fund shares) | (0.43 | )% | 2.68 | % | 3.56 | % | ||||||||||
Class C1 (return before taxes) | 4/30/02 | 1.26 | % | 2.95 | % | 3.52 | % | |||||||||
Class I (return before taxes) | 4/30/02 | 1.79 | % | 3.61 | % | 4.32 | % | |||||||||
| Barclays Capital Municipal Bond Index (reflects no deduction for fees, expenses or taxes) | 2.38 | % | 4.09 | % | 4.64 | % | ||||||||||
| Lipper Ohio Municipal Debt Funds Category Average (reflects no deduction for fees, expenses or taxes) | 0.95 | % | 2.95 | % | 3.59 | % | ||||||||||
30
Section 1 Fund Summaries
Management
Investment Adviser
Nuveen Fund Advisors, Inc.
Sub-Adviser
Nuveen Asset Management, LLC
Portfolio Manager
Name | Title | Portfolio Manager of Fund Since | ||
| Daniel J. Close, CFA | Senior Vice President | January 2011 |
Purchase and Sale of Fund Shares
You may purchase, redeem or exchange shares of the fund on any business day, which is any day the New York Stock Exchange is open for business. You may purchase, redeem or exchange shares of the fund either through a financial advisor or other financial intermediary or directly from the fund. Class C1 shares are available only through dividend reinvestments by current Class C1 shareholders. The fund’s initial and subsequent investment minimums generally are as follows, although the fund may reduce or waive the minimums in some cases:
| Class A | Class I | |||
| Eligibility and Minimum Initial Investment | $3,000 | Available only through fee-based programs and to other limited categories of investors as described in the prospectus.
$100,000 for all accounts except:
• $250 for clients of financial intermediaries and family offices that have accounts holding Class I shares with an aggregate value of at least $100,000 (or that are expected to reach this level).
• No minimum for certain other categories of eligible investors as described in the prospectus. | ||
| Minimum Additional Investment | $100 | No minimum. |
Tax Information
The fund intends to make distributions that are exempt from regular federal and Ohio state income tax. A portion of these distributions, however, may be subject to the federal alternative minimum tax.
Payments to Broker-Dealers and Other Financial Intermediaries
If you purchase shares of the fund through a broker-dealer or other financial intermediary (such as a bank or financial advisor), the fund, its distributor or its investment adviser may pay the intermediary for the sale of fund shares and related services. These payments may create a conflict of interest by influencing the broker-dealer or other financial intermediary and your salesperson to recommend the fund over another investment. Ask your financial advisor or visit your financial intermediary’s website for more information.
Section 1 Fund Summaries
31
Nuveen Oregon Intermediate Municipal Bond Fund
Investment Objective
The investment objective of the fund is to provide maximum current income that is exempt from both federal income tax and Oregon state income tax to the extent consistent with prudent investment risk.
Fees and Expenses of the Fund
This table describes the fees and expenses that you may pay if you buy and hold shares of the fund. You may qualify for sales charge discounts if you and your family invest, or agree to invest in the future, at least $50,000 in the fund or in other Nuveen Mutual Funds. More information about these and other discounts, as well as eligibility requirements for each share class, is available from your financial advisor and in “What Share Classes We Offer” on page 44 of the fund’s prospectus, “How to Reduce Your Sales Charge” on page 46 of the prospectus and “Purchase and Redemption of Fund Shares” on page S-71 of the fund’s statement of additional information.
Shareholder Fees
(fees paid directly from your investment)
| Class A | Class C | Class I | ||||||||||
| Maximum Sales Charge (Load) Imposed on Purchases (as a percentage of offering price) | 3.00% | None | None | |||||||||
| Maximum Deferred Sales Charge (Load) (as a percentage of the lesser of purchase price or redemption proceeds)1 | None | 1.00% | None | |||||||||
| Maximum Sales Charge (Load) Imposed on Reinvested Dividends | None | None | None | |||||||||
| Exchange Fee | None | None | None | |||||||||
| Annual Low Balance Account Fee (for accounts under $1,000)2 | $15 | $15 | $15 | |||||||||
Annual Fund Operating Expenses
(expenses that you pay each year as a percentage of the value of your investment)
| Class A | Class C | Class I | ||||||||||
| Management Fees | 0.55% | 0.55% | 0.55% | |||||||||
| Distribution and Service (12b-1) Fees | 0.20% | 0.75% | 0.00% | |||||||||
| Other Expenses | 0.07% | 0.07% | 0.07% | |||||||||
| Acquired Fund Fees and Expenses | 0.01% | 0.01% | 0.01% | |||||||||
| Total Annual Fund Operating Expenses3 | 0.83% | 1.38% | 0.63% | |||||||||
| 1 | The CDSC on Class C shares applies only to redemptions within 12 months of purchase. |
| 2 | Fee applies to the following types of accounts held directly with the fund: accounts established pursuant to the Uniform Transfers to Minors Act (UTMA) or Uniform Gifts to Minors Act (UGMA). |
| 3 | Expenses have been restated to reflect current contractual fees and estimated other expenses. |
32
Section 1 Fund Summaries
Example
The following example is intended to help you compare the cost of investing in the fund with the cost of investing in other mutual funds. The example assumes that you invest $10,000 in the fund for the time periods indicated and then either redeem or do not redeem your shares at the end of a period. The example also assumes that your investment has a 5% return each year and that the fund’s operating expenses remain the same. Although your actual costs may be higher or lower, based on these assumptions your costs would be:
| Redemption | No Redemption | |||||||||||||||||||||||||||
| A | C | I | A | C | I | |||||||||||||||||||||||
| 1 Year | $ | 382 | $ | 140 | $ | 64 | $ | 382 | $ | 140 | $ | 64 | ||||||||||||||||
| 3 Years | $ | 557 | $ | 437 | $ | 202 | $ | 557 | $ | 437 | $ | 202 | ||||||||||||||||
| 5 Years | $ | 747 | $ | 755 | $ | 351 | $ | 747 | $ | 755 | $ | 351 | ||||||||||||||||
| 10 Years | $ | 1,295 | $ | 1,657 | $ | 786 | $ | 1,295 | $ | 1,657 | $ | 786 | ||||||||||||||||
Portfolio Turnover
The fund pays transaction costs, such as commissions, when it buys and sells securities (or “turns over” its portfolio). A higher portfolio turnover rate may indicate higher transaction costs and may result in higher taxes when fund shares are held in a taxable account. These costs, which are not reflected in annual fund operating expenses or in the example, affect the fund’s performance. For the fiscal period July 1, 2010 through May 31, 2011, the fund’s portfolio turnover rate was 12% of the average value of its portfolio.
Principal Investment Strategies
Under normal market conditions, as a fundamental policy, the fund invests at least 80% of its net assets (plus the amount of any borrowings for investment purposes) in municipal securities that pay interest that is exempt from federal and Oregon income tax, including the federal alternative minimum tax.
The fund normally may invest up to 20% of its net assets in taxable obligations, including obligations the interest on which is subject to the federal alternative minimum tax.
The fund may invest in:
| • | “general obligation” bonds; |
| • | “revenue” bonds; |
| • | participation interests in municipal leases; and |
| • | zero coupon municipal securities. |
The fund invests mainly in securities that, at the time of purchase, are either rated investment grade or are unrated and determined to be of comparable quality by the fund’s sub-adviser. However, the fund may invest up to 20% of its total assets in securities that, at the time of purchase, are rated lower than investment grade or are unrated and of comparable quality (securities commonly referred to as “high yield” securities or “junk bonds”). If the rating of a security is reduced or discontinued after purchase, the fund is not required to sell the security, but may consider doing so.
In selecting securities for the fund, the fund’s sub-adviser first determines its economic outlook and the direction in which inflation and interest rates are expected to move. In selecting individual securities consistent with this outlook, the sub-adviser evaluates factors such as credit quality, yield, maturity, liquidity, and portfolio diversification. The sub-adviser conducts research on potential and current holdings in the fund to determine whether the fund should purchase or retain a security. This is a continuing process, the focus of which changes according to market conditions, the availability of various permitted investments, and cash flows into and out of the fund.
The fund will attempt to maintain the weighted average maturity of its portfolio securities at three to ten years under normal market conditions.
Section 1 Fund Summaries
33
The fund may utilize futures contracts and options on futures contracts in an attempt to manage market risk, credit risk and yield curve risk, and to manage the effective maturity or duration of securities in the fund’s portfolio. The fund may not use such instruments to gain exposure to a security or type of security that it would be prohibited by its investment restrictions from purchasing directly.
Principal Risks
The price and yield of this fund will change daily due to changes in interest rates and other factors, which means you could lose money. An investment in the fund is not a deposit of a bank and is not insured or guaranteed by the Federal Deposit Insurance Corporation or any other governmental agency. The principal risks of investing in this fund are described below:
Call Risk—If an issuer calls higher-yielding bonds held by the fund, performance could be adversely impacted.
Credit Risk—Credit risk is the risk that an issuer of a municipal bond may be unable or unwilling to make interest and principal payments when due and the related risk that the value of a bond may decline because of concerns about the issuer’s ability or willingness to make such payments. In addition, parties to other financial contracts with the fund could default on their obligations.
Futures Contract Risk—The use of futures contracts involves additional risks and transaction costs which could leave the fund in a worse position than if it had not used these instruments. Futures contracts may entail investment exposures that are greater than their cost would suggest. As a result, a small investment in futures contracts could have a large impact on performance.
High Yield Securities Risk—High yield securities generally are less liquid, have more volatile prices, and have greater credit risk than investment grade securities.
Income Risk—The fund’s income could decline during periods of falling interest rates.
Interest Rate Risk—Interest rate risk is the risk that the value of the fund’s portfolio will decline because of rising interest rates.
Market Risk—The market values of municipal bonds owned by the fund may decline, at times sharply and unpredictably.
Non-Diversification Risk—As a non-diversified fund, the fund may invest a larger portion of its assets in the securities of a limited number of issuers and may be more sensitive to any single economic, political or regulatory occurrence than a diversified fund.
State Concentration Risk—Because the fund primarily purchases municipal bonds from Oregon, the fund is more susceptible to adverse economic, political or regulatory changes affecting municipal bond issuers in that state.
Fund Performance
The following bar chart and table provide some indication of the potential risks of investing in the fund. The fund’s past performance (before and after taxes) is not necessarily an indication of how the fund will perform in the future. Updated performance information is available online at www.nuveen.com/MF/products/performancesummary.aspx or by calling (800) 257-8787.
34
Section 1 Fund Summaries
The bar chart below shows the variability of the fund’s performance from year to year for Class I shares. The performance of the other share classes will differ due to their different expense structures.
Class I Annual Total Return*
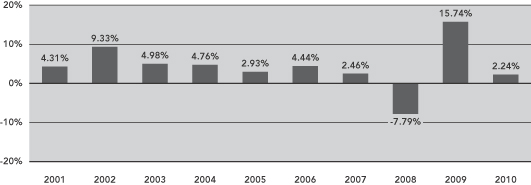
| * | Class I year-to-date total return as of June 30, 2011 was 4.24%. |
During the ten-year period ended December 31, 2010, the fund’s highest and lowest quarterly returns were 5.24% and -3.19%, respectively, for the quarters ended September 30, 2009 and December 31, 2010.
The table below shows the variability of the fund’s average annual returns and how they compare over the time periods indicated with those of a broad measure of market performance and an index of funds with similar investment objectives. All after-tax returns are calculated using the historical highest individual federal marginal income tax rates and do not reflect the impact of state and local taxes. After-tax returns are shown for Class I shares only; after-tax returns for other share classes will vary. Your own actual after-tax returns will depend on your specific tax situation and may differ from what is shown here.
Both the bar chart and the table assume that all distributions have been reinvested. Performance reflects fee waivers, if any, in effect during the periods presented. If any such waivers were not in place, returns would be reduced.
Performance is not shown for Class C shares, which have not been offered for a full calendar year.
| Average Annual Total Returns for the Periods Ended December 31, 2010 | ||||||||||||||||
| Inception Date | 1 Year | 5 Years | 10 Years | |||||||||||||
| Nuveen Oregon Intermediate Municipal Bond Fund: | ||||||||||||||||
Class A (return before taxes) | 2/1/99 | (0.97 | )% | 2.95 | % | 3.59 | % | |||||||||
Class I (return before taxes) | 10/31/86 | 2.24 | % | 3.72 | % | 4.05 | % | |||||||||
Class I (return after taxes on distributions) | 2.21 | % | 3.69 | % | 4.01 | % | ||||||||||
Class I (return after taxes on distributions and sales of fund shares) | 2.62 | % | 3.71 | % | 4.02 | % | ||||||||||
| Barclays Capital 1-15 Year Blend Municipal Bond Index (reflects no deduction for fees, expenses or taxes) | 2.97 | % | 4.55 | % | 4.78 | % | ||||||||||
| Lipper Other States Intermediate Municipal Debt Funds Category Average (reflects no deduction for fees, expenses or taxes) | 1.90 | % | 3.32 | % | 3.70 | % | ||||||||||
Section 1 Fund Summaries
35
Management
Investment Adviser
Nuveen Fund Advisors, Inc.
Sub-Adviser
Nuveen Asset Management, LLC
Portfolio Manager
Name | Title | Portfolio Manager of Fund Since | ||
| Michael S. Hamilton | Vice President | May 1997 |
Purchase and Sale of Fund Shares
You may purchase, redeem or exchange shares of the fund on any business day, which is any day the New York Stock Exchange is open for business. You may purchase, redeem or exchange shares of the fund either through a financial advisor or other financial intermediary or directly from the fund. The fund’s initial and subsequent investment minimums generally are as follows, although the fund may reduce or waive the minimums in some cases:
| Class A and Class C | Class I | |||
| Eligibility and Minimum Initial Investment | $3,000 | Available only through fee-based programs and to other limited categories of investors as described in the prospectus.
$100,000 for all accounts except:
• $250 for clients of financial intermediaries and family offices that have accounts holding Class I shares with an aggregate value of at least $100,000 (or that are expected to reach this level).
• No minimum for certain other categories of eligible investors as described in the prospectus. | ||
| Minimum Additional Investment | $100 | No minimum. |
Tax Information
The fund intends to make distributions that are exempt from regular federal and Oregon state income tax. A portion of these distributions, however, may be subject to the federal alternative minimum tax.
Payments to Broker-Dealers and Other Financial Intermediaries
If you purchase shares of the fund through a broker-dealer or other financial intermediary (such as a bank or financial advisor), the fund, its distributor or its investment adviser may pay the intermediary for the sale of fund shares and related services. These payments may create a conflict of interest by influencing the broker-dealer or other financial intermediary and your salesperson to recommend the fund over another investment. Ask your financial advisor or visit your financial intermediary’s website for more information.
36
Section 1 Fund Summaries
Section 2 How We Manage Your Money
To help you better understand the funds, this section includes a detailed discussion of the funds’ investment and risk management strategies. For a more complete discussion of these matters, please see the statement of additional information, which is available by calling (800) 257-8787 or by visiting Nuveen’s website at www.nuveen.com.
Nuveen Fund Advisors, Inc. (“Nuveen Fund Advisors”), the funds’ investment adviser, offers advisory and investment management services to a broad range of mutual fund clients. Nuveen Fund Advisors has overall responsibility for management of the funds, oversees the management of the funds’ portfolios, manages the funds’ business affairs and provides certain clerical, bookkeeping and other administrative services. Nuveen Fund Advisors is located at 333 West Wacker Drive, Chicago, Illinois 60606. Nuveen Fund Advisors is a subsidiary of Nuveen Investments, Inc. (“Nuveen Investments”). On November 13, 2007, Nuveen Investments was acquired by investors led by Madison Dearborn Partners, LLC, which is a private equity investment firm based in Chicago, Illinois. The Nuveen family of advisers has been providing advice to investment companies since 1976.
Nuveen Fund Advisors has selected its affiliate, Nuveen Asset Management, LLC (“Nuveen Asset Management”), located at 333 West Wacker Drive, Chicago, Illinois 60606, to serve as sub-adviser to each of the funds. Nuveen Asset Management manages the investment of the funds’ assets on a discretionary basis, subject to the supervision of Nuveen Fund Advisors.
The funds were formerly advised by FAF Advisors, Inc. (“FAF”), a wholly-owned subsidiary of U.S. Bank National Association (“U.S. Bank”). On December 31, 2010, pursuant to an agreement among U.S. Bank, FAF, Nuveen Investments, and certain Nuveen affiliates, Nuveen Fund Advisors acquired a portion of the asset management business of FAF (the “Transaction”).
The portfolio manager for Nuveen Ohio Tax Free Fund is Daniel J. Close. The portfolio manager for Nuveen Colorado Tax Free Fund, Nuveen Minnesota Intermediate Municipal Bond Fund and Nuveen Missouri Tax Free Fund is Christopher L. Drahn. The portfolio manager for Nuveen Oregon Intermediate Municipal Bond Fund is Michael S. Hamilton. The portfolio manager for Nuveen Minnesota Municipal Bond Fund and Nuveen Nebraska Municipal Bond Fund is Douglas J. White.
| • | Daniel J. Close, CFA, joined Nuveen in 2000 as a member of the product management and development team, where he was responsible for the oversight and development of the firm’s mutual fund product line. He then served as a research analyst for Nuveen Asset Management, covering corporate-backed, energy, transportation and utility credits, and assumed certain portfolio management duties in 2007. He manages investments for 27 Nuveen-sponsored investment companies with a total of approximately $5 billion under management. |
Section 2 How We Manage Your Money
37
| • | Christopher L. Drahn, CFA, entered the financial services industry with FAF in 1980, and joined Nuveen Asset Management on January 1, 2011 in connection with the Transaction. He manages investments for 10 Nuveen-sponsored investment companies with a total of approximately $2.6 billion under management. |
| • | Michael S. Hamilton entered the financial industry when he joined FAF in 1989 and joined Nuveen Asset Management on January 1, 2011 in connection with the Transaction. He manages investments for 17 Nuveen-sponsored investment companies with a total of approximately $1.56 billion under management. |
| • | Douglas J. White, CFA, entered the financial services industry in 1983, joined FAF in 1987, and joined Nuveen Asset Management on January 1, 2011 in connection with the Transaction. He manages investments for six Nuveen-sponsored investment companies with a total of approximately $2.7 billion under management. |
Additional information about the portfolio managers’ compensation, other accounts managed by the portfolio managers and the portfolio managers’ ownership of securities in the funds is provided in the statement of additional information.
Management Fees
The management fee schedule for each fund consists of two components: a fund-level fee, based only on the amount of assets within a fund, and a complex-level fee, based on the aggregate amount of all eligible fund assets managed by Nuveen Fund Advisors.
The annual fund-level fee, payable monthly, is based upon the average daily net assets of each fund as follows:
| Average Daily Net Assets | Nuveen Colorado Tax Free Fund | Nuveen Minnesota Intermediate Municipal Bond Fund | Nuveen Minnesota Municipal Bond Fund | |||||||||
| For the first $125 million | 0.4500 | % | 0.3500 | % | 0.3500 | % | ||||||
| For the next $125 million | 0.4375 | % | 0.3375 | % | 0.3375 | % | ||||||
| For the next $250 million | 0.4250 | % | 0.3250 | % | 0.3250 | % | ||||||
| For the next $500 million | 0.4125 | % | 0.3125 | % | 0.3125 | % | ||||||
| For the next $1 billion | 0.4000 | % | 0.3000 | % | 0.3000 | % | ||||||
| For net assets over $2 billion | 0.3750 | % | 0.2750 | % | 0.2750 | % | ||||||
| Average Daily Net Assets | Nuveen Missouri Tax Free Fund | Nuveen Nebraska Municipal Bond Fund | Nuveen Ohio Tax Free Fund | Nuveen Oregon Intermediate Municipal Bond Fund | ||||||||||||
| For the first $125 million | 0.4500 | % | 0.3500 | % | 0.4500 | % | 0.3500 | % | ||||||||
| For the next $125 million | 0.4375 | % | 0.3375 | % | 0.4375 | % | 0.3375 | % | ||||||||
| For the next $250 million | 0.4250 | % | 0.3250 | % | 0.4250 | % | 0.3250 | % | ||||||||
| For the next $500 million | 0.4125 | % | 0.3125 | % | 0.4125 | % | 0.3125 | % | ||||||||
| For the next $1 billion | 0.4000 | % | 0.3000 | % | 0.4000 | % | 0.3000 | % | ||||||||
| For net assets over $2 billion | 0.3750 | % | 0.2750 | % | 0.3750 | % | 0.2750 | % | ||||||||
Each fund’s complex-level fee rate is determined by taking the current overall complex-level fee rate, which is based on the aggregate amount of the “eligible assets” of all Nuveen funds, and making, as appropriate, an upward adjustment to that rate based upon the percentage of the particular fund’s assets that are not “eligible assets.” The maximum overall complex-level fee rate is 0.2000% of a fund’s average daily net assets, which is based
38
Section 2 How We Manage Your Money
upon complex-level eligible assets of $55 billion, with the complex-level fee rate decreasing incrementally for eligible assets above that level. Fund-specific complex-level fee rates will not exceed the maximum overall complex-level fee rate of 0.2000%. As of June 30, 2011, the funds’ complex-level fee rates were as follows:
| Complex-Level Fee Rate | ||||
| Nuveen Colorado Tax Free Fund | 0.1989 | % | ||
| Nuveen Minnesota Intermediate Municipal Bond Fund | 0.1971 | % | ||
| Nuveen Minnesota Municipal Bond Fund | 0.1975 | % | ||
| Nuveen Missouri Tax Free Fund | 0.1971 | % | ||
| Nuveen Nebraska Municipal Bond Fund | 0.1964 | % | ||
| Nuveen Ohio Tax Free Fund | 0.2000 | % | ||
| Nuveen Oregon Intermediate Municipal Bond Fund | 0.1986 | % | ||
The table below reflects management fees paid to FAF (for the period July 1, 2010 through December 31, 2010) and to Nuveen Asset Management (for the period January 1, 2011 through May 31, 2011), after taking into account any fee waivers, for the funds’ most recently completed fiscal period. FAF provided advisory services pursuant to a different management agreement with a different fee schedule. FAF did not provide any administrative services under that agreement.
| Management Fee as a % of Average Daily Net Assets | ||||
| Nuveen Colorado Tax Free Fund | 0.13 | % | ||
| Nuveen Minnesota Intermediate Municipal Bond Fund | 0.44 | % | ||
| Nuveen Minnesota Municipal Bond Fund | 0.39 | % | ||
| Nuveen Missouri Tax Free Fund | 0.44 | % | ||
| Nuveen Nebraska Municipal Bond Fund | 0.02 | % | ||
| Nuveen Ohio Tax Free Fund | 0.10 | % | ||
| Nuveen Oregon Intermediate Municipal Bond Fund | 0.43 | % | ||
Nuveen Fund Advisors has contractually agreed to reimburse Class A share 12b-1 fees through March 31, 2012 to the extent necessary so that total annual fund operating expenses, after fee waivers and/or expense reimbursements and excluding acquired fund fees and expenses, do not exceed 0.75% for Class A shares of Nuveen Minnesota Intermediate Municipal Bond Fund and 0.85% for Class A shares of each of the Nuveen Minnesota Municipal Bond Fund, Nuveen Missouri Tax Free Fund, and Nuveen Oregon Intermediate Municipal Bond Fund. These expense reimbursements will not be terminated prior to that time without the approval of the Board of Directors of the funds. In addition, the funds’ distributor has contractually agreed to limit its Class A share 12b-1 fees for Nuveen Minnesota Intermediate Municipal Bond Fund to 0.15% of average daily net assets through March 31, 2012.
Nuveen Fund Advisors has agreed to waive fees and/or reimburse expenses through March 31, 2013 so that total annual fund operating expenses (excluding acquired fund fees and expenses) for each fund set forth below do not exceed the following percentage of the average daily net assets of any class of fund shares:
| Class A | Class C | Class C1 | Class I | |||||||||||||
| Nuveen Colorado Tax Free Fund | 0.90% | N/A | 1.35% | 0.70% | ||||||||||||
| Nuveen Minnesota Intermediate Municipal Bond Fund | 0.90% | 1.45% | 1.35% | 0.70% | ||||||||||||
| Nuveen Minnesota Municipal Bond Fund | 0.90% | 1.45% | 1.35% | 0.70% | ||||||||||||
| Nuveen Missouri Tax Free Fund | 0.90% | N/A | 1.35% | 0.70% | ||||||||||||
Section 2 How We Manage Your Money
39
| Class A | Class C | Class C1 | Class I | |||||||||||||
| Nuveen Nebraska Municipal Bond Fund | 0.90% | 1.45% | 1.35% | 0.70% | ||||||||||||
| Nuveen Ohio Tax Free Fund | 0.90% | N/A | 1.35% | 0.70% | ||||||||||||
| Nuveen Oregon Intermediate Municipal Bond Fund | 0.90% | 1.45% | N/A | 0.70% | ||||||||||||
These expense limitations expiring March 31, 2013, may be terminated or modified prior to that date only with the approval of the Board of Directors of the funds.
Information regarding the Board of Directors’ approval of the investment management agreements is currently available in the funds’ annual report for the fiscal period ended May 31, 2011.
The funds’ investment objectives, which are described in the “Fund Summaries” section, may be changed without shareholder approval. If a fund’s investment objective changes, you will be notified at least 60 days in advance. The funds’ investment policies may be changed by the Board of Directors without shareholder approval unless otherwise noted in this prospectus or the statement of additional information.
The funds’ principal investment strategies are discussed in the “Fund Summaries” section. These are the strategies that the funds’ investment adviser and sub-adviser believe are most likely to be important in trying to achieve the funds’ investment objectives. This section provides more information about these strategies as well as information about some additional strategies that the funds’ sub-adviser uses, or may use, to achieve the funds’ objectives. You should be aware that each fund may also use strategies and invest in securities that are not described in this prospectus, but that are described in the statement of additional information. For a copy of the statement of additional information, call Nuveen Investor Services at (800) 257-8787.
Municipal Securities
Municipal securities are issued to finance public infrastructure projects such as streets and highways, schools, water and sewer systems, hospitals, and airports. They also may be issued to refinance outstanding obligations as well as to obtain funds for general operating expenses and for loans to other public institutions and facilities. The funds may invest in municipal securities such as “general obligation” bonds, “revenue” bonds, and participation interests in municipal leases. General obligation bonds are backed by the full faith, credit, and taxing power of the issuer. Revenue bonds are payable only from the revenues generated by a specific project or from another specific revenue source. Participation interests in municipal leases are undivided interests in a lease, installment purchase contract, or conditional sale contract entered into by a state or local government unit to acquire equipment or facilities.
The municipal securities in which the funds invest may include refunded bonds and zero coupon bonds. Refunded bonds may have originally been issued as general obligation or revenue bonds, but become “refunded” when they are secured by an escrow fund, usually consisting entirely of direct U.S. government obligations and/or U.S. government agency obligations. Zero coupon bonds are issued at substantial discounts from their value at maturity and pay no cash income to their holders until they mature. When
40
Section 2 How We Manage Your Money
held to maturity, their entire return comes from the difference between their purchase price and their maturity value.
The debt obligations in which the funds invest may have variable, floating, or fixed interest rates.
Ratings
The funds have investment strategies requiring them to invest in municipal securities that have received a particular rating from a rating service such as Moody’s or Standard & Poor’s. Any reference in this prospectus to a specific rating encompasses all gradations of that rating. For example, if the prospectus says that a fund may invest in securities rated as low as B, the fund may invest in securities rated B – .
Temporary Investments
In an attempt to respond to adverse market, economic, political, or other conditions, each fund may temporarily invest without limit in cash and in U.S. dollar-denominated high-quality money market instruments and other short-term securities, including securities which pay income that is subject to federal and state income tax. Because these investments may be taxable, and may result in a lower yield than would be available from investments with a lower quality or longer term, they may prevent a fund from achieving its investment objective.
Portfolio Holdings
A description of the funds’ policies and procedures with respect to the disclosure of the funds’ portfolio holdings is available in the funds’ statement of additional information. Certain portfolio holdings information for each fund is available on the funds’ website—www.nuveen.com—by clicking the “Our Products—Mutual Funds” section on the home page and following the applicable link for your fund in the “Search Mutual Fund Family” section. By following these links, you can obtain a list of your fund’s top ten holdings and a complete list of holdings for your fund as of the end of the most recent month. The holdings information is generally made available on the funds’ website approximately five bussiness days following the end of each most recent month. This information will remain available on the website until the funds file with the Securities and Exchange Commission their annual, semi-annual or quarterly holdings report for the fiscal period that includes the date(s) as of which the website information is current.
Risk is inherent in all investing. Investing in a mutual fund—even the most conservative—involves risk, including the risk that you may receive little or no return on your investment or even that you may lose part or all of your investment. Therefore, before investing you should consider carefully the principal risks for each fund and the other risks listed below that you assume when you invest in the funds. Because of these risks, you should consider an investment in the funds to be a long-term investment.
Principal Risks
Call risk: Many municipal bonds may be redeemed at the option of the issuer, or “called,” before their stated maturity date. In general, an issuer will call its bonds if they can be refinanced by issuing new bonds which bear a lower interest rate. The funds are subject to the possibility that
Section 2 How We Manage Your Money
41
during periods of falling interest rates, a municipal bond issuer will call its high-yielding bonds. A fund would then be forced to invest the unanticipated proceeds at lower interest rates, resulting in a decline in the fund’s income.
Credit risk: The funds are subject to the risk that the issuers of debt securities held by the funds will not make payments on the securities. There is also the risk that an issuer could suffer adverse changes in financial condition that could lower the credit quality of a security. This could lead to greater volatility in the price of the security and in shares of the fund. Also, a change in the credit quality rating of a bond could affect the bond’s liquidity and make it more difficult for a fund to sell. When a fund purchases unrated securities, it will depend on the sub-adviser’s analysis of credit risk without the assessment of an independent rating organization, such as Moody’s or Standard & Poor’s.
Futures contract risk: The use of futures contracts exposes a fund to additional risks and transaction costs. Additional risks include the risk that securities prices, index prices, or interest rates will not move in the direction that the sub-adviser anticipates; an imperfect correlation between the price of the futures contract and movements in the prices of the securities being hedged; the possible absence of a liquid secondary market for any particular instrument and possible exchange imposed price fluctuation limits, either of which may make it difficult or impossible to close out a position when desired; leverage risk, which is the risk that adverse price movements in a futures contract can result in a loss substantially greater than the fund’s initial investment in that futures contract; and the risk that the counterparty will fail to perform its obligations, which could leave the fund worse off than if it had not entered into the position. If a fund uses futures contracts and the sub-adviser’s judgment proves incorrect, the fund’s performance could be worse than if it had not used these instruments.
High yield securities risk: Each fund may invest in high yield securities, which usually offer higher yields than investment grade securities, but also involve more risk. High yield securities may be more susceptible to real or perceived adverse economic conditions than investment grade securities. In addition, the secondary trading market may be less liquid, meaning that it may be more difficult to sell or buy a security at a favorable price or time. Consequently, these funds may have to accept a lower price to sell a security, sell other securities to raise cash, or give up an investment opportunity, any of which could have a negative effect on a fund’s performance. High yield securities generally have more volatile prices and carry more risk to principal than investment grade securities.
Income risk: Each fund’s income could decline due to falling market interest rates. This is because, in a falling interest rate environment, a fund generally will have to invest the proceeds from sales of fund shares, as well as the proceeds from maturing portfolio securities (or portfolio securities that have been called, see “Call risk” above), in lower-yielding securities.
Interest rate risk: Debt securities in the funds will fluctuate in value with changes in interest rates. In general, debt securities will increase in value when interest rates fall and decrease in value when interest rates rise. Longer-term debt securities are generally more sensitive to interest rate changes. The funds may invest in zero coupon securities, which do not pay interest on a current basis and which may be highly volatile as interest rates rise or fall.
42
Section 2 How We Manage Your Money
Market risk: Market risk is the risk that the market values of municipal bonds owned by the funds will decline, at times sharply and unpredictably. Market values of municipal bonds are affected by a number of different factors, including changes in interest rates, the credit quality of bond issuers, and general economic and market conditions.
Non-diversification risk: Each of the state-specific funds is a non-diversified fund and may invest a larger portion of its assets in a fewer number of issuers than a diversified fund. Because a relatively high percentage of the fund’s assets may be invested in the securities of a limited number of issuers, the fund’s portfolio may be more susceptible to any single economic, political or regulatory occurrence than the portfolio of a diversified fund.
Political and economic risks: The values of municipal securities may be adversely affected by local political and economic conditions and developments. Adverse conditions in an industry significant to a local economy could have a correspondingly adverse effect on the financial condition of local issuers. Other factors that could affect municipal securities include a change in the local, state, or national economy, demographic factors, ecological or environmental concerns, statutory limitations on the issuer’s ability to increase taxes, and other developments generally affecting the revenue of issuers (for example, legislation or court decisions reducing state aid to local governments or mandating additional services). The value of municipal securities also may be adversely affected by future changes in federal or state income tax laws, including rate reductions, the imposition of a flat tax, or the loss of a current state income tax exemption.
To the extent a fund invests in the securities of issuers located in a single state, it will be disproportionately affected by political and economic conditions and developments in that state.
Other Risks
Inflation risk: The value of assets or income from investments may be less in the future as inflation decreases the value of money. As inflation increases, the value of a fund’s assets can decline, as can the value of a fund’s distributions.
Municipal lease obligations risk: Each fund may purchase participation interests in municipal leases. These are undivided interests in a lease, installment purchase contract, or conditional sale contract entered into by a state or local government unit to acquire equipment or facilities. Participation interests in municipal leases pose special risks because many leases and contracts contain “non-appropriation” clauses that provide that the governmental issuer has no obligation to make future payments under the lease or contract unless money is appropriated for this purpose by the appropriate legislative body. Although these kinds of obligations are secured by the leased equipment or facilities, it might be difficult and time consuming to dispose of the equipment or facilities in the event of non-appropriation, and a fund might not recover the full principal amount of the obligation.
Tax risk: Income from municipal bonds held by the funds could be declared taxable because of unfavorable changes in tax laws, adverse interpretations by the Internal Revenue Service or state tax authorities, or noncompliant conduct of a bond issuer. In addition, a portion of a fund’s otherwise exempt-interest dividends may be taxable to those shareholders subject to the federal and/or state alternative minimum tax.
Section 2 How We Manage Your Money
43
Section 3 How You Can Buy and Sell Shares
The funds offer multiple classes of shares, each with a different combination of sales charges, fees, eligibility requirements and other features. Your financial advisor can help you determine which class is best for you. For further details, please see the statement of additional information.
Class A Shares
You can purchase Class A shares at the offering price, which is the net asset value per share plus an up-front sales charge. You may qualify for a reduced sales charge, or the sales charge may be waived, as described in “How to Reduce Your Sales Charge.” Class A shares are also subject to an annual service fee of 0.20% of your fund’s average daily net assets, which compensates your financial advisor or other financial intermediary for providing ongoing service to you. Nuveen Securities, LLC (the “Distributor”), a subsidiary of Nuveen Investments and the distributor of the funds, retains the up-front sales charge and the service fee on accounts with no financial intermediary of record. The up-front Class A sales charges for the funds are as follows:
Nuveen Minnesota Intermediate Municipal Bond Fund
Nuveen Oregon Intermediate Municipal Bond Fund
| Amount of Purchase | Sales Charge as % of Public Offering Price | Sales Charge as % of Net Amount Invested | Maximum Financial Intermediary Commission as % of Public Offering Price | |||||||||
| Less than $50,000 | 3.00 | % | 3.09 | % | 2.50 | % | ||||||
| $50,000 but less than $100,000 | 2.50 | 2.56 | 2.00 | |||||||||
| $100,000 but less than $250,000 | 2.00 | 2.04 | 1.50 | |||||||||
| $250,000 but less than $500,000 | 1.50 | 1.52 | 1.25 | |||||||||
| $500,000 but less than $1,000,000 | 1.25 | 1.27 | 1.00 | |||||||||
| $1,000,000 and over* | — | — | 0.75 | |||||||||
| * | You can purchase $1 million or more of Class A shares at net asset value without an up-front sales charge. The Distributor pays financial intermediaries of record a commission equal to 0.75% of the first $2.5 million, plus 0.50% of the amount over $2.5 million. Unless you are eligible for a waiver, you may be assessed a contingent deferred sales charge (“CDSC”) of 0.75% if you redeem any of your shares within 6 months of purchase, 0.50% if you redeem any of your shares within 12 months of purchase and 0.25% if you redeem any of your shares within 18 months of purchase. See “How to Sell Shares—Contingent Deferred Sales Charge” below for more information. |
Nuveen Colorado Tax Free Fund
Nuveen Minnesota Municipal Bond Fund
Nuveen Missouri Tax Free Fund
Nuveen Nebraska Municipal Bond Fund
Nuveen Ohio Tax Free Fund
44
Section 3 How You Can Buy and Sell Shares
| Amount of Purchase | Sales Charge as % of Public Offering Price | Sales Charge as % of Net Amount Invested | Maximum Financial Intermediary Commission as % of Public Offering Price | |||||||||
| Less than $50,000 | 4.20 | % | 4.38 | % | 3.70 | % | ||||||
| $50,000 but less than $100,000 | 4.00 | 4.18 | 3.50 | |||||||||
| $100,000 but less than $250,000 | 3.50 | 3.63 | 3.00 | |||||||||
| $250,000 but less than $500,000 | 2.50 | 2.56 | 2.00 | |||||||||
| $500,000 but less than $1,000,000 | 2.00 | 2.04 | 1.50 | |||||||||
| $1,000,000 and over* | — | — | 1.00 | |||||||||
| * | You can purchase $1 million or more of Class A shares at net asset value without an up-front sales charge. The Distributor pays financial intermediaries of record a commission equal to 1.00% of the first $2.5 million, plus 0.75% of the next $2.5 million, plus 0.50% of the amount over $5 million. Unless you are eligible for a waiver, you may be assessed a contingent deferred sales charge (“CDSC”) of 1% if you redeem any of your shares within 6 months of purchase, 0.75% if you redeem any of your shares within 12 months of purchase and 0.50% if you redeem any of your shares within 18 months of purchase. See “How to Sell Shares—Contingent Deferred Sales Charge” below for more information. |
Class C Shares
Nuveen Minnesota Intermediate Municipal Bond Fund, Nuveen Minnesota Municipal Bond Fund, Nuveen Nebraska Municipal Bond Fund and Nuveen Oregon Intermediate Municipal Bond Fund issue Class C shares. You can purchase Class C shares of these funds at the offering price, which is the net asset value per share without any up-front sales charge. Class C shares are subject to annual distribution and service fees of 0.75% of your fund’s average daily net assets. The annual 0.20% service fee compensates your financial advisor or other financial intermediary for providing ongoing service to you. The annual 0.55% distribution fee compensates the Distributor for paying your financial advisor or other financial intermediary an ongoing sales commission as well as an advance of the first year’s service and distribution fees. The Distributor retains the service and distribution fees on accounts with no financial intermediary of record. If you redeem your shares within 12 months of purchase, you will normally pay a 1% CDSC which is calculated on the lower of your purchase price or redemption proceeds. You do not pay a CDSC on any Class C shares you purchase by reinvesting dividends.
The funds have established a limit to the amount of Class C shares that may be purchased by an individual investor. See the statement of additional information for more information.
Class C1 Shares
Class C1 shares are not available for new accounts or for additional investment into existing accounts, but Class C1 shares can be issued for purposes of dividend reinvestment. Class C1 shares are subject to annual distribution and service fees of 0.65% of your fund’s average daily net assets. The annual 0.25% service fee compensates your financial advisor or other financial intermediary for providing ongoing service to you. The annual 0.40% distribution fee compensates the Distributor for paying your financial advisor or other financial intermediary an ongoing sales commission as well as an advance of the first year’s service and distribution fees. The Distributor retains the service and distribution fees on accounts with no financial intermediary of record. If you redeem your shares within 12 months of purchase, you will normally pay a 1% CDSC which is calculated on the lower of your purchase price or redemption proceeds. You do not pay a CDSC on any Class C1 shares you purchase by reinvesting dividends.
Section 3 How You Can Buy and Sell Shares
45
Class I Shares
You can purchase Class I shares at the offering price, which is the net asset value per share without any up-front sales charge. As Class I shares are not subject to sales charges or ongoing service or distribution fees, they have lower ongoing expenses than the other classes.
Class I shares are available for purchase by clients of financial intermediaries who charge such clients an ongoing fee for advisory, investment, consulting or related services. Such clients may include individuals, corporations, endowments and foundations. The minimum initial investment for such clients is $100,000, but this minimum will be lowered to $250 for clients of financial intermediaries that have accounts holding Class I shares with an aggregate value of at least $100,000. The Distributor may also lower the minimum to $250 for clients of financial intermediaries anticipated to reach this Class I share holdings level.
Class I shares are also available for purchase by family offices and their clients. A family office is a company that provides certain financial and other services to a high net worth family or families. The minimum initial investment for family offices and their clients is $100,000, but this minimum will be lowered to $250 for clients of family offices that have accounts holding Class I shares with an aggregate value of at least $100,000. The Distributor may also lower the minimum to $250 for clients of family offices anticipated to reach this Class I share holdings level.
Class I shares are also available for purchase, with no minimum initial investment, by the following categories of investors:
| • | Certain bank or broker-affiliated trust departments. |
| • | Advisory accounts of Nuveen Fund Advisors and its affiliates. |
| • | Trustees/directors and former trustees/directors of any Nuveen Fund, and their immediate family members (as defined in the statement of additional information). |
| • | Officers, directors and former directors of Nuveen Investments and its affiliates, and their immediate family members. |
| • | Full-time and retired employees of Nuveen Investments and its affiliates, and their immediate family members. |
| • | Certain financial intermediary personnel, and their immediate family members. |
Please refer to the statement of additional information for more information about Class A, Class C, Class C1 and Class I shares, including more detailed program descriptions and eligibility requirements. Additional information is also available from your financial advisor, who can also help you prepare any necessary application forms.
The funds offer a number of ways to reduce or eliminate the up-front sales charge on Class A shares. Nuveen Mutual Funds currently utilize two transfer agents, and the ability to use the methods described below to reduce your sales charge is limited to aggregating values or purchases of funds that have the same transfer agent. See “What Share Classes We Offer” (above) for a discussion of eligibility requirements for purchasing Class I shares.
46
Section 3 How You Can Buy and Sell Shares
Class A Sales Charge Reductions
| • | Rights of Accumulation. In calculating the appropriate sales charge on a purchase of Class A shares of a fund, you may be able to add the amount of your purchase to the value, based on the current net asset value per share, of all of your prior purchases of any Nuveen Mutual Fund. |
| • | Letter of Intent. Subject to certain requirements, you may purchase Class A shares of a fund at the sales charge rate applicable to the total amount of the purchases you intend to make over a 13-month period. |
For purposes of calculating the appropriate sales charge as described under Rights of Accumulation and Letter of Intent above, you may include purchases by (i) you, (ii) your spouse or domestic partner and children under the age of 21 years, and (iii) a corporation, partnership or sole proprietorship that is 100% owned by any of the persons in (i) or (ii). In addition, a trustee or other fiduciary can count all shares purchased for a single trust, estate or other single fiduciary account that has multiple accounts (including one or more employee benefit plans of the same employer).
Class A Sales Charge Waivers
Class A shares of a fund may be purchased at net asset value without a sales charge as follows:
| • | Purchases of $1,000,000 or more. |
| • | Monies representing reinvestment of Nuveen Mutual Fund distributions. |
| • | Employees of Nuveen Investments and its affiliates. Purchases by full-time and retired employees of Nuveen Investments and its affiliates and such employees’ immediate family members (as defined in the statement of additional information). |
| • | Current and former trustees/directors of the Nuveen Funds. |
| • | Financial intermediary personnel. Purchases by any person who, for at least the last 90 days, has been an officer, director, or bona fide employee of any financial intermediary or any such person’s immediate family member. |
| • | Certain trust departments. Purchases by bank or broker-affiliated trust departments investing funds over which they exercise exclusive discretionary investment authority and that are held in a fiduciary, agency, advisory, custodial or similar capacity. |
| • | Additional categories of investors. Purchases made by: (i) investors purchasing on a periodic fee, asset-based fee or no transaction fee basis through a broker-dealer sponsored mutual fund purchase program; (ii) clients of investment advisers, financial planners or other financial intermediaries that charge periodic or asset-based fees for their services and (iii) through December 31, 2011, shareholders of funds not currently sub-advised by Nuveen Asset Management that were sub-advised by FAF prior to the closing of its Transaction with Nuveen Investments. |
In order to obtain a sales charge reduction or waiver, it may be necessary at the time of purchase for you to inform the funds or your financial advisor of the existence of other accounts in which there are holdings eligible to be aggregated for such purposes. You may need to provide the funds or your financial advisor information or records, such as account statements, in order to verify your eligibility for a sales charge reduction or waiver. This may include account statements of family members and information regarding Nuveen Mutual Fund shares held in accounts with other financial advisors.
Section 3 How You Can Buy and Sell Shares
47
You or your financial advisor must notify the Distributor at the time of each purchase if you are eligible for any of these programs. The funds may modify or discontinue these programs at any time.
Fund shares may be purchased on any business day, which is any day the New York Stock Exchange (the “NYSE”) is open for business. Generally, the NYSE is closed on weekends and national holidays. The share price you pay depends on when the Distributor receives your order. Orders received before the close of trading on a business day (normally, 4:00 p.m. New York time) will receive that day’s closing share price; otherwise, you will receive the next business day’s price.
You may purchase fund shares (1) through a financial advisor or (2) directly from the funds.
Through a Financial Advisor
You may buy shares through your financial advisor, who can handle all the details for you, including opening a new account. Financial advisors can also help you review your financial needs and formulate long-term investment goals and objectives. In addition, financial advisors generally can help you develop a customized financial plan, select investments and monitor and review your portfolio on an ongoing basis to help assure your investments continue to meet your needs as circumstances change. Financial advisors (including brokers or agents) are paid for providing ongoing investment advice and services, either from fund sales charges and fees or by charging you a separate fee in lieu of a sales charge.
Financial advisors or other dealer firms may charge their customers a processing or service fee in connection with the purchase or redemption of fund shares. The amount and applicability of such a fee is determined and disclosed to customers by each individual dealer. Processing or service fees typically are fixed, nominal dollar amounts and are in addition to the sales and other charges described in this prospectus and the statement of additional information. Your dealer will provide you with specific information about any processing or service fees you will be charged. Shares you purchase through your financial advisor or other intermediary will normally be held with that firm. For more information, please contact your financial advisor.
Directly from the Funds
Eligible investors may purchase shares directly from the funds.
By wire. You can purchase shares by making a wire transfer from your bank. Before making an initial investment by wire, you must submit a new account form to a fund. After receiving your form, a service representative will contact you with your account number and wiring instructions. Your order will be priced at the next closing share price based on the share class of your fund, calculated after the fund’s custodian receives your payment by wire. Wired funds must be received prior to 4:00 p.m. New York time to be eligible for same day pricing. Neither your fund nor the transfer agent are responsible for the consequences of delays resulting from the banking or Federal Reserve wire system, or from incomplete wiring instructions. Before making any additional purchases by wire, you should call Nuveen Investor Services at (800) 257-8787. You cannot purchase shares by wire on days when federally chartered banks are closed.
48
Section 3 How You Can Buy and Sell Shares
By mail. To purchase shares by mail, simply complete and sign a new account form, enclose a check made payable to the fund you wish to invest in, and mail both to:
| Regular U.S. Mail: | Overnight Express Mail: | |||
| Nuveen Mutual Funds | Nuveen Mutual Funds | |||
| P.O. Box 701 | 615 East Michigan Street | |||
| Milwaukee, WI 53201-0701 | Milwaukee, WI 53202 |
The funds do not consider the U.S. Postal Service or other independent delivery services to be their agents. Therefore, deposit in the mail or with such services, or receipt at the post office box above, of purchase orders or redemption requests does not constitute receipt by the transfer agent of the funds.
After you have established an account, you may continue to purchase shares by mailing your check to Nuveen Mutual Funds at the same address.
Please note the following:
| • | All purchases must be drawn on a bank located within the United States and payable in U.S. dollars to Nuveen Mutual Funds. |
| • | Cash, money orders, cashier’s checks in amounts less than $10,000, third-party checks, Treasury checks, credit card checks, traveler’s checks, starter checks, and credit cards will not be accepted. We are unable to accept post dated checks, post dated on-line bill pay checks, or any conditional order of payment. |
| • | If a check or ACH transaction does not clear your bank, the funds reserve the right to cancel the purchase, and you may be charged a fee of $25 per check or transaction. You could be liable for any losses or fees incurred by the fund as a result of your check or ACH transaction failing to clear. |
To help make your investing with us easy and efficient, we offer you the following services at no extra cost. Your financial advisor can help you complete the forms for these services, or you can call Nuveen Investor Services at (800) 257-8787 for copies of the necessary forms.
Systematic Investing
Once you have opened an account satisfying the applicable investment minimum, systematic investing allows you to make regular additional investments through automatic deductions from your bank account, directly from your paycheck, or from exchanging shares from another mutual fund account. The minimum automatic deduction is $100 per month. There is no charge to participate in your fund’s systematic investment plan. You can stop the deductions at any time by notifying your fund in writing.
| • | From your bank account. You can make systematic investments of $100 or more per month by authorizing your fund to draw pre-authorized checks on your bank account. |
| • | From your paycheck. With your employer’s consent, you can make systematic investments each pay period (collectively meeting the monthly minimum of $100) by authorizing your employer to deduct monies from your paycheck. |
Section 3 How You Can Buy and Sell Shares
49
| • | Systematic exchanging. You can make systematic investments by authorizing the Distributor to exchange shares from one Nuveen Mutual Fund account into another identically registered Nuveen Mutual Fund account of the same share class. |
Systematic Withdrawal
If the value of your fund account is at least $10,000, you may request to have $50 or more withdrawn automatically from your account. You may elect to receive payments monthly, quarterly, semi-annually or annually, and may choose to receive a check, have the monies transferred directly into your bank account, paid to a third party or sent payable to you at an address other than your address of record. You must complete the appropriate section of the account application or Account Update Form to participate in each fund’s systematic withdrawal plan.
You should not establish systematic withdrawals if you intend to make concurrent purchases of Class A, Class C or Class C1 shares because you may unnecessarily pay a sales charge or CDSC on these purchases.
Exchanging Shares
Nuveen Mutual Funds currently utilize two transfer agents. Until November 30, 2011, you may exchange fund shares into an identically registered account for the same class of another Nuveen Mutual Fund available in your state. Your exchange must meet the minimum purchase requirements of the fund into which you are exchanging, and, if your shares are held with a financial intermediary, the financial intermediary must have the operational capability to support exchanges. You may also, under certain limited circumstances, exchange between certain classes of shares of the same fund, subject to the payment of any applicable CDSC. Please consult the statement of additional information for details.
Effective December 1, 2011, you may exchange fund shares into an identically registered account for the same class of another Nuveen Mutual Fund available in your state provided that the funds have the same transfer agent. Exchanges between funds with different transfer agents will not be allowed. Your exchange must meet the minimum purchase requirements of the fund into which you are exchanging. You may also, under certain limited circumstances, exchange between certain classes of shares of the same fund, subject to the payment of any applicable CDSC. Please consult the statement of additional information for details.
Each fund reserves the right to revise or suspend the exchange privilege, limit the amount or number of exchanges, or reject any exchange. Shareholders will be provided with at least 60 days’ notice of any material revision to or termination of the exchange privilege.
Because an exchange between funds is treated for tax purposes as a purchase and sale, any gain may be subject to tax. An exchange between classes of shares of the same fund may not be considered a taxable event. You should consult your tax advisor about the tax consequences of exchanging your shares.
Reinstatement Privilege
If you redeem fund shares, you may reinvest all or part of your redemption proceeds up to one year later without incurring any additional charges. You may only reinvest into the same share class you redeemed. If you paid a CDSC, your fund will refund your CDSC and reinstate your holding period for purposes of calculating the CDSC. You may use this reinstatement privilege
50
Section 3 How You Can Buy and Sell Shares
only once for any redemption. Nuveen Mutual Funds currently utilize two transfer agents. The reinstatement privilege is limited to reinvestment in a fund which has the same transfer agent as the fund from which you redeemed.
You may sell (redeem) your shares on any business day. You will receive the share price next determined after your fund has received your properly completed redemption request. Your redemption request must be received before the close of trading on the NYSE (normally, 4:00 p.m. New York time) for you to receive that day’s price. The fund will normally mail your check the next business day after a redemption request is received, but in no event more than seven days after your request is received. If you are selling shares purchased recently with a check, your redemption proceeds will not be mailed until your check has cleared, which may take up to ten days from your purchase date.
You may sell your shares (1) through a financial advisor or (2) directly to the funds.
Through a Financial Advisor
You may sell your shares through your financial advisor, who can prepare the necessary documentation. Your financial advisor may charge for this service.
Directly to the Funds
By telephone. If you did not purchase shares through a financial advisor, you may redeem your shares by calling Nuveen Investor Services at (800) 257-8787. Proceeds can be wired to your bank account (if you have previously supplied your bank account information to the fund) or sent to you by check. The funds charge a $15 fee for wire redemptions, but have the right to waive this fee for shares redeemed through certain financial intermediaries and by certain accounts. Proceeds also can be sent directly to your bank or brokerage account via electronic funds transfer if your bank or brokerage firm is a member of the ACH network. Credit is usually available within two to three business days. The funds reserve the right to limit telephone redemptions to $50,000 per account per day.
If you recently purchased your shares by check or through the ACH network, proceeds from the sale of those shares may not be available until your check or ACH payment has cleared, which may take up to ten business days from the date of purchase.
By mail. To redeem shares by mail, send a written request to your financial intermediary, or to the fund at the following address:
| Regular U.S. Mail: | Overnight Express Mail: | |||
| Nuveen Mutual Funds | Nuveen Mutual Funds | |||
| P.O. Box 701 | 615 East Michigan Street | |||
| Milwaukee, WI 53201-0701 | Milwaukee, WI 53202 |
Your request should include the following information:
| • | name of the fund; |
| • | account number; |
| • | dollar amount or number of shares redeemed; |
| • | name on the account; |
Section 3 How You Can Buy and Sell Shares
51
| • | signatures of all registered account owners; and |
| • | any certificate you have for the shares. |
After you have established your account, signatures on a written request must be guaranteed if:
| • | you would like redemption proceeds payable or sent to any person, address or bank account other than that on record; |
| • | you have changed the address on the fund’s records within the last 30 days; |
| • | your redemption request is in excess of $50,000; or |
| • | you are requesting a change in ownership on your account. |
Non-financial transactions, including establishing or modifying certain services such as changing bank information on an account, will require a signature guarantee or signature verification from a Medallion Signature Guarantee Program member or other acceptable form of authentication from a financial institution source. In addition to the situations described above, the funds reserve the right to require a signature guarantee, or another acceptable form of signature verification, in other instances based on the circumstances of a particular situation.
A signature guarantee assures that a signature is genuine and protects shareholders from unauthorized account transfers. Banks, savings and loan associations, trust companies, credit unions, broker-dealers and member firms of a national securities exchange may guarantee signatures. Call your financial intermediary to determine if it has this capability. A notary public is not an acceptable signature guarantor.
Proceeds from a written redemption request will be sent to you by check unless another form of payment is requested.
By wire. You can call or write to have redemption proceeds sent to a bank account. See the policies for redeeming shares by phone or by mail. Before requesting to have redemption proceeds sent to a bank account, please make sure the funds have your bank account information on file. If the funds do not have this information, you will need to send written instructions with your bank’s name and a voided check or pre-printed savings account deposit slip. You must provide written instructions signed by all fund and bank account owners, and each individual must have their signature guaranteed.
Contingent Deferred Sales Charge
If you redeem Class A, Class C or Class C1 shares that are subject to a CDSC, you may be assessed a CDSC upon redemption. When you redeem Class A, Class C or Class C1 shares subject to a CDSC, your fund will first redeem any shares that are not subject to a CDSC, and then redeem the shares you have owned for the longest period of time, unless you ask the fund to redeem your shares in a different order. No CDSC is imposed on shares you buy through the reinvestment of dividends and capital gains. The CDSC holding period is calculated on a monthly basis and begins on the first day of the month in which the purchase was made. When you redeem shares subject to a CDSC, the CDSC is calculated on the lower of your purchase price or redemption proceeds, deducted from your redemption proceeds, and paid to the Distributor. The CDSC may be waived under certain special circumstances as described in the statement of additional information.
52
Section 3 How You Can Buy and Sell Shares
Accounts with Low Balances
The funds reserve the right to liquidate or assess a low balance fee on any account held directly with the funds that has a balance that has fallen below the account balance minimum of $1,000 for any reason, including market fluctuations.
If a fund elects to exercise this right, then annually the fund will assess a $15 low balance account fee on certain accounts with balances under the account balance minimum that are accounts established pursuant to the UTMA or UGMA. At the same time, other accounts with balances under the account balance minimum will be liquidated, with proceeds being mailed to the address of record. Prior to the assessment of any low balance fee or liquidation of low balance accounts, affected shareholders will receive a communication notifying them of the pending action, thereby providing time to ensure that balances are at or above the account balance minimum prior to any fee assessment or account liquidation. You will not be assessed a CDSC if your account is liquidated.
Redemptions In-Kind
The funds generally pay redemption proceeds in cash. Under unusual conditions that make cash payment unwise and for the protection of existing shareholders, the funds may pay all or a portion of your redemption proceeds in securities or other fund assets. Although it is unlikely that your shares would be redeemed in-kind, you would probably have to pay brokerage costs to sell the securities distributed to you, as well as taxes on any capital gains from that sale.
Section 3 How You Can Buy and Sell Shares
53
To help you understand the tax implications of investing in the funds, this section includes important details about how the funds make distributions to shareholders. We discuss some other fund policies as well.
The funds declare dividends daily and pay such dividends monthly, usually on the first business day of the month. Your account will begin to accrue dividends on the business day after the day when the monies used to purchase your shares are collected by the transfer agent. Each fund seeks to pay monthly tax-exempt dividends at a level rate that reflects the past and projected net income of the fund. To help maintain more stable monthly distributions, the distribution paid by a fund for any particular monthly period may be more or less than the amount of net income actually earned by the fund during such period, and any such under- (or over-) distribution of income is reflected in each fund’s net asset value. This policy is designed to result in the distribution of substantially all of a fund’s net income over time. The funds declare and pay any taxable capital gains or other taxable distributions once a year at year end.
Payment and Reinvestment Options
The funds automatically reinvest your dividends in additional fund shares unless you request otherwise. You may request to have your dividends paid to you by check, sent via electronic funds transfer through Automated Clearing House network or reinvested in shares of another Nuveen Mutual Fund. For further information, contact your financial advisor or call Nuveen Investor Services at (800) 257-8787. If you request that your distributions be paid by check but those distributions cannot be delivered because of an incorrect mailing address, or if a distribution check remains uncashed for six months, the undelivered or uncashed distributions and all future distributions will be reinvested in fund shares at the current net asset value.
Taxes and Tax Reporting
Because the funds invest primarily in municipal bonds from a particular state, the regular monthly dividends you, as a taxpayer in that state, receive will generally be exempt from regular federal and state income tax. A portion of these dividends, however, may be subject to the federal alternative minimum tax.
Generally the funds do not seek to realize taxable income or capital gains. However, the funds may realize and distribute taxable income or capital gains from time to time as a result of each fund’s normal investment activities. The funds’ distributions of these amounts are taxed as ordinary income or capital gains and are taxable whether received in cash or reinvested in additional shares. Dividends from the funds’ long-term capital gains are taxable as capital gains, while dividends from short-term capital gains and net investment income are generally taxable as ordinary income. The funds’ taxable dividends are not expected to qualify for a dividends received deduction if you are a corporate shareholder or for the lower tax rates on qualified dividend income.
54
Section 4 General Information
Early in each year, you will receive a statement detailing the amount and nature of all dividends and capital gains that you were paid during the prior year. If you hold your investment at the firm where you purchased your fund shares, you will receive the statement from that firm. If you hold your shares directly with the fund, the Distributor will send you the statement. The tax status of your dividends is the same whether you reinvest your dividends or elect to receive them in cash.
If you receive social security or railroad retirement benefits, you should consult your tax advisor about how an investment in the funds may affect the taxation of your benefits.
Each sale or exchange of fund shares may be a taxable event. When you exchange shares of one Nuveen Mutual Fund for shares of a different Nuveen Mutual Fund, the exchange is treated the same as a sale for tax purposes. A sale may result in capital gain or loss to you. The gain or loss generally will be treated as short-term if you held the shares for 12 months or less and long-term if you held the shares for more than 12 months at the time of disposition.
Please note that if you do not furnish the funds with your correct social security number or employer identification number, you fail to provide certain certifications to the funds, you fail to certify whether you are a U.S. citizen or a U.S. resident alien, or the Internal Revenue Service notifies the funds to withhold, federal law requires the funds to withhold federal income tax from your distributions and redemption proceeds at the applicable withholding rate.
Please consult the statement of additional information and your tax advisor for more information about taxes.
Buying or Selling Shares Close to a Record Date
Buying fund shares shortly before the record date for a taxable income or capital gain distribution is commonly known as “buying the dividend.” The entire distribution may be taxable to you even though a portion of the distribution effectively represents a return of your purchase price.
Taxable Equivalent Yields
The taxable equivalent yield is the current yield you would need to earn on a taxable investment in order to equal a stated federal tax-free yield on a municipal investment. To assist you in comparing municipal investments like the funds with fully taxable alternative investments, the table below presents the taxable equivalent yields for a range of hypothetical federal tax-free yields and tax rates:
| Taxable Equivalents of Tax-Free Yields | To Equal a Tax-Free Yield of: | |||||||||||||||
| 2.00 | % | 3.00 | % | 4.00 | % | 5.00 | % | |||||||||
| Tax Bracket: | A Taxable Investment Would Need to Yield: | |||||||||||||||
| 25% | 2.67 | % | 4.00 | % | 5.33 | % | 6.67 | % | ||||||||
| 28% | 2.78 | % | 4.17 | % | 5.56 | % | 6.94 | % | ||||||||
| 33% | 2.99 | % | 4.48 | % | 5.97 | % | 7.46 | % | ||||||||
| 35% | 3.08 | % | 4.62 | % | 6.15 | % | 7.69 | % | ||||||||
The yields and tax rates shown above are hypothetical and do not predict your actual returns or effective tax rate. For more detailed information, see the statement of additional information or consult your tax advisor.
Section 4 General Information
55
The Distributor serves as the selling agent and distributor of the funds’ shares. In this capacity, the Distributor manages the offering of the funds’ shares and is responsible for all sales and promotional activities. In order to reimburse the Distributor for its costs in connection with these activities, including compensation paid to financial intermediaries, each fund has adopted a distribution and service plan under Rule 12b-1 under the 1940 Act. See “How You Can Buy and Sell Shares—What Share Classes We Offer” for a description of the distribution and service fees paid under this plan.
Under the plan, the Distributor receives a distribution fee for Class C and Class C1 shares primarily for providing compensation to financial intermediaries, including the Distributor, in connection with the distribution of shares. The Distributor receives a service fee for Class A, Class C and Class C1 shares to compensate financial intermediaries, including the Distributor, for providing ongoing account services to shareholders. These services may include establishing and maintaining shareholder accounts, answering shareholder inquiries and providing other personal services to shareholders. These fees also compensate the Distributor for other expenses, including printing and distributing prospectuses to persons other than shareholders, and preparing, printing, and distributing advertising, sales literature and reports to shareholders used in connection with the sale of shares. Because these fees are paid out of the funds’ assets on an ongoing basis, over time these fees will increase the cost of your investment and may cost you more than paying other types of sales charges. Long-term holders of Class C and Class C1 shares may pay more in distribution and service fees and CDSCs than the economic equivalent of the maximum front-end sales charge permitted under the Financial Industry Regulatory Authority Conduct Rules.
Other Payments to Financial Intermediaries
In addition to the sales commissions and certain payments from distribution and service fees to financial intermediaries as previously described, the Distributor may from time to time make additional payments, out of its own resources, to certain financial intermediaries that sell shares of Nuveen Mutual Funds in order to promote the sales and retention of fund shares by those firms and their customers. The amounts of these payments vary by financial intermediary and, with respect to a given firm, are typically calculated by reference to the amount of the firm’s recent gross sales of Nuveen Mutual Fund shares and/or total assets of Nuveen Mutual Funds held by the firm’s customers. The level of payments that the Distributor is willing to provide to a particular financial intermediary may be affected by, among other factors, the firm’s total assets held in and recent net investments into Nuveen Mutual Funds, the firm’s level of participation in Nuveen Mutual Fund sales and marketing programs, the firm’s compensation program for its registered representatives who sell fund shares and provide services to fund shareholders, and the asset class of the Nuveen Mutual Funds for which these payments are provided. The statement of additional information contains additional information about these payments, including the names of the firms to which payments are made. The Distributor may also make payments to financial intermediaries in connection with sales meetings, due diligence meetings, prospecting seminars and other meetings at which the Distributor promotes its products and services.
56
Section 4 General Information
In connection with the availability of Nuveen Mutual Funds within selected mutual fund no-transaction fee institutional platforms and fee-based wrap programs (together, “Platform Programs”) at certain financial intermediaries, the Distributor also makes payments out of its own assets to those firms as compensation for certain recordkeeping, shareholder communications and other account administration services provided to Nuveen Mutual Fund shareholders who own their fund shares in these Platform Programs. These payments are in addition to the service fee and any applicable omnibus sub-accounting fees paid to these firms with respect to these services by the Nuveen Mutual Funds out of fund assets.
The amounts of payments to a financial intermediary could be significant, and may create an incentive for the intermediary or its representatives to recommend or offer shares of the funds to you. The intermediary may elevate the prominence or profile of the funds within the intermediary’s organization by, for example, placing the funds on a list of preferred or recommended funds and/or granting the Distributor and/or its affiliates preferential or enhanced opportunities to promote the funds in various ways within the intermediary’s organization.
The price you pay for your shares is based on each fund’s net asset value per share, which is determined as of the close of trading (normally 4:00 p.m. New York time) on each day the NYSE is open for business. Net asset value is calculated for each class of each fund by taking the value of the class’ total assets, including interest or dividends accrued but not yet collected, less all liabilities, and dividing by the total number of shares outstanding. The result, rounded to the nearest cent, is the net asset value per share. All valuations are subject to review by the funds’ Board of Directors or its designee.
In determining net asset value, portfolio instruments generally are valued using prices provided by independent pricing services or obtained from other sources, such as broker-dealer quotations, all as approved by the Board of Directors. Independent pricing services typically value non-equity portfolio instruments utilizing a range of market-based inputs and assumptions, including readily available market quotations obtained from broker-dealers making markets in such instruments, cash flows, and transactions for comparable instruments. In pricing certain securities, particularly less liquid and lower quality securities, the pricing services may consider information about a security, its issuer, or market activity provided by the fund’s investment adviser or sub-adviser.
If a price cannot be obtained from a pricing service or other pre-approved source, or if Nuveen Fund Advisors deems such price to be unreliable, a portfolio instrument may be valued by a fund at its fair value as determined in good faith by the Board of Directors or its designee. As a general principle, the fair value of a portfolio instrument is the amount that an owner might reasonably expect to receive upon the instrument’s current sale. A range of factors and analysis may be considered when determining fair value, including relevant market data, interest rates, credit considerations and/or issuer-specific news. A fund may rely on an independent fair valuation service in making any such fair value determinations.
Section 4 General Information
57
The funds are intended for long-term investment and should not be used for excessive trading. Excessive trading in the funds’ shares can disrupt portfolio management, lead to higher operating costs, and cause other operating inefficiencies for the funds. However, the funds are also mindful that shareholders may have valid reasons for periodically purchasing and redeeming fund shares.
Accordingly, the funds have adopted a Frequent Trading Policy that seeks to balance the funds’ need to prevent excessive trading in fund shares while offering investors the flexibility in managing their financial affairs to make periodic purchases and redemptions of fund shares.
The funds’ Frequent Trading Policy generally limits an investor to four “round trip” trades in a 12-month period. A “round trip” is the purchase and subsequent redemption of fund shares, including by exchange. Each side of a round trip may be comprised of either a single transaction or a series of closely-spaced transactions. The funds may also suspend the trading privileges of any investor who makes a round trip within a 30-day period if the purchase and redemption are of substantially similar dollar amounts and represent at least 25% of the value of the investor’s account.
The funds primarily receive share purchase and redemption orders through third-party financial intermediaries, some of whom rely on the use of omnibus accounts. An omnibus account typically includes multiple investors and provides the funds only with a net purchase or redemption amount on any given day where multiple purchases, redemptions and exchanges of shares occur in the account. The identity of individual purchasers, redeemers and exchangers whose orders are aggregated in omnibus accounts, and the size of their orders, will generally not be known by the funds. Despite the funds’ efforts to detect and prevent frequent trading, the funds may be unable to identify frequent trading because the netting effect in omnibus accounts often makes it more difficult to identify frequent traders. The Distributor has entered into agreements with financial intermediaries that maintain omnibus accounts with the funds’ transfer agent. Under the terms of these agreements, the financial intermediaries undertake to cooperate with the Distributor in monitoring purchase, exchange and redemption orders by their customers in order to detect and prevent frequent trading in the funds through such accounts. Technical limitations in operational systems at such intermediaries or at the Distributor may also limit the funds’ ability to detect and prevent frequent trading. In addition, the funds may permit certain financial intermediaries, including broker-dealer and retirement plan administrators, among others, to enforce their own internal policies and procedures concerning frequent trading. Such policies may differ from the funds’ Frequent Trading Policy and may be approved for use in instances where the funds reasonably believe that the intermediary’s policies and procedures effectively discourage inappropriate trading activity. Shareholders holding their accounts with such intermediaries may wish to contact the intermediary for information regarding its frequent trading policy. Although the funds do not knowingly permit frequent trading, they cannot guarantee that they will be able to identify and restrict all frequent trading activity.
The funds reserve the right in their sole discretion to waive unintentional or minor violations (including transactions below certain dollar thresholds) if they determine that doing so would not harm the interests of fund
58
Section 4 General Information
shareholders. In addition, certain categories of redemptions may be excluded from the application of the Frequent Trading Policy, as described in more detail in the statement of additional information. These include, among others, redemptions pursuant to systematic withdrawal plans, redemptions in connection with the total disability or death of the investor, involuntary redemptions by operation of law, redemptions in payment of account or plan fees, and certain redemptions by retirement plans, including redemptions in connection with qualifying loans or hardship withdrawals, termination of plan participation, return of excess contributions, and required minimum distributions. The funds may also modify or suspend the Frequent Trading Policy without notice during periods of market stress or other unusual circumstances.
The funds reserve the right to impose restrictions on purchases or exchanges that are more restrictive than those stated above if they determine, in their sole discretion, that a transaction or a series of transactions involves market timing or excessive trading that may be detrimental to fund shareholders. The funds also reserve the right to reject any purchase order, including exchange purchases, for any reason. For example, a fund may refuse purchase orders if the fund would be unable to invest the proceeds from the purchase order in accordance with the fund’s investment policies and/or objective, or if the fund would be adversely affected by the size of the transaction, the frequency of trading in the account or various other factors. For more information about the funds’ Frequent Trading Policy and its enforcement, see “Purchase and Redemption of Fund Shares—Frequent Trading Policy” in the statement of additional information.
The custodian of the assets of the funds is U.S. Bank National Association, 60 Livingston Avenue, St. Paul, MN 55101. U.S. Bancorp Fund Services, LLC, 615 East Michigan St., Milwaukee, WI 53202, acts as the funds’ transfer agent and as such performs bookkeeping and data processing for the maintenance of shareholder accounts.
Section 4 General Information
59
Section 5 Financial Highlights
The financial highlights table is intended to help you understand a fund’s financial performance for the past five fiscal years. Certain information reflects financial results for a single fund share. The total returns in the table represent the rate that an investor would have earned (or lost) on an investment in a fund (assuming reinvestment of all dividends and distributions). The information for each of the last five fiscal years has been audited by Ernst & Young LLP, whose report for the most recent fiscal year, along with the funds’ financial statements, are included in the annual report, which is available upon request.
Nuveen Colorado Tax Free Fund
| Class (Commencement Date) | Investment Operations | Less Distributions | Ratios/Supplemental Data | |||||||||||||||||||||||||||||||||||||||||||||||||
| Beginning Net Asset Value | Net Investment Income (Loss)(a) | Net Realized/ Unrealized Gain (Loss) | Total | Net Investment Income | Capital Gains(b) | Total | Ending Net Asset Value | Total Return(c) | Ending Net Assets (000) | Ratios of Expenses to Average Net Assets(d) | Ratios of Net Investment Income (Loss) to Average Net Assets(d) | Portfolio Turnover Rate | ||||||||||||||||||||||||||||||||||||||||
| Class A (2/00) | ||||||||||||||||||||||||||||||||||||||||||||||||||||
| Year Ended 5/31 | ||||||||||||||||||||||||||||||||||||||||||||||||||||
| 2011(e) | $ | 10.12 | $ | .39 | $ | — | $ | .39 | $ | (.38 | ) | $ | (.09 | ) | $ | (.47 | ) | $ | 10.04 | 3.93 | % | $ | 10,812 | .72 | %* | 4.27 | %* | 20 | % | |||||||||||||||||||||||
| Year Ended 6/30 | ||||||||||||||||||||||||||||||||||||||||||||||||||||
| 2010 | 9.60 | .43 | .60 | 1.03 | (.42 | ) | (.09 | ) | (.51 | ) | 10.12 | 10.91 | 10,811 | .75 | 4.23 | 25 | ||||||||||||||||||||||||||||||||||||
| 2009 | 10.28 | .41 | (.56 | ) | (.15 | ) | (.45 | ) | (.08 | ) | (.53 | ) | 9.60 | (1.20 | ) | 11,088 | .75 | 4.58 | 41 | |||||||||||||||||||||||||||||||||
| 2008 | 10.61 | .48 | (.33 | ) | .15 | (.45 | ) | (.03 | ) | (.48 | ) | 10.28 | 1.52 | 5,815 | .75 | 4.40 | 49 | |||||||||||||||||||||||||||||||||||
| 2007 | 10.73 | .46 | (.02 | ) | .44 | (.48 | ) | (.08 | ) | (.56 | ) | 10.61 | 4.13 | 8,788 | .75 | 4.27 | 47 | |||||||||||||||||||||||||||||||||||
| 2006(g) | 11.30 | .35 | (.26 | ) | .09 | (.34 | ) | (.32 | ) | (.66 | ) | 10.73 | .77 | 8,507 | .75 | * | 4.30 | * | 35 | |||||||||||||||||||||||||||||||||
| Year Ended 9/30 | ||||||||||||||||||||||||||||||||||||||||||||||||||||
| 2005 | 11.52 | .49 | (.11 | ) | .38 | (.51 | ) | (.09 | ) | (.60 | ) | 11.30 | 3.36 | 8,362 | .75 | 4.23 | 30 | |||||||||||||||||||||||||||||||||||
| Class C1 (2/00)(f) | ||||||||||||||||||||||||||||||||||||||||||||||||||||
| Year Ended 5/31 | ||||||||||||||||||||||||||||||||||||||||||||||||||||
| 2011(e) | 10.09 | .35 | — | .35 | (.34 | ) | (.09 | ) | (.43 | ) | 10.01 | 3.53 | 2,481 | 1.14 | * | 3.82 | * | 20 | ||||||||||||||||||||||||||||||||||
| Year Ended 6/30 | ||||||||||||||||||||||||||||||||||||||||||||||||||||
| 2010 | 9.57 | .38 | .61 | .99 | (.38 | ) | (.09 | ) | (.47 | ) | 10.09 | 10.51 | 3,172 | 1.15 | 3.83 | 25 | ||||||||||||||||||||||||||||||||||||
| 2009 | 10.26 | .41 | (.61 | ) | (.20 | ) | (.41 | ) | (.08 | ) | (.49 | ) | 9.57 | (1.70 | ) | 2,891 | 1.15 | 4.19 | 41 | |||||||||||||||||||||||||||||||||
| 2008 | 10.59 | .42 | (.31 | ) | .11 | (.41 | ) | (.03 | ) | (.44 | ) | 10.26 | 1.12 | 2,859 | 1.15 | 3.98 | 49 | |||||||||||||||||||||||||||||||||||
| 2007 | 10.71 | .42 | (.02 | ) | .40 | (.44 | ) | (.08 | ) | (.52 | ) | 10.59 | 3.72 | 2,888 | 1.15 | 3.87 | 47 | |||||||||||||||||||||||||||||||||||
| 2006(g) | 11.28 | .32 | (.27 | ) | .05 | (.30 | ) | (.32 | ) | (.62 | ) | 10.71 | .47 | 3,007 | 1.15 | * | 3.90 | * | 35 | |||||||||||||||||||||||||||||||||
| Year Ended 9/30 | ||||||||||||||||||||||||||||||||||||||||||||||||||||
| 2005 | 11.50 | .43 | (.10 | ) | .33 | (.46 | ) | (.09 | ) | (.55 | ) | 11.28 | 2.95 | 3,423 | 1.15 | 3.83 | 30 | |||||||||||||||||||||||||||||||||||
| Class I (2/00)(f) | ||||||||||||||||||||||||||||||||||||||||||||||||||||
| Year Ended 5/31 | ||||||||||||||||||||||||||||||||||||||||||||||||||||
| 2011(e) | 10.14 | .41 | .01 | .42 | (.40 | ) | (.09 | ) | (.49 | ) | 10.07 | 4.24 | 42,161 | .49 | * | 4.47 | * | 20 | ||||||||||||||||||||||||||||||||||
| Year Ended 6/30 | ||||||||||||||||||||||||||||||||||||||||||||||||||||
| 2010 | 9.62 | .45 | .61 | 1.06 | (.45 | ) | (.09 | ) | (.54 | ) | 10.14 | 11.16 | 49,244 | .50 | 4.48 | 25 | ||||||||||||||||||||||||||||||||||||
| 2009 | 10.29 | .44 | (.58 | ) | (.14 | ) | (.45 | ) | (.08 | ) | (.53 | ) | 9.62 | (.85 | ) | 51,521 | .50 | 4.81 | 41 | |||||||||||||||||||||||||||||||||
| 2008 | 10.63 | .49 | (.32 | ) | .17 | (.48 | ) | (.03 | ) | (.51 | ) | 10.29 | 1.67 | 15,889 | .50 | 4.63 | 49 | |||||||||||||||||||||||||||||||||||
| 2007 | 10.75 | .50 | (.03 | ) | .47 | (.51 | ) | (.08 | ) | (.59 | ) | 10.63 | 4.39 | 13,477 | .50 | 4.51 | 47 | |||||||||||||||||||||||||||||||||||
| 2006(g) | 11.32 | .37 | (.26 | ) | .11 | (.36 | ) | (.32 | ) | (.68 | ) | 10.75 | .96 | 10,181 | .50 | * | 4.58 | * | 35 | |||||||||||||||||||||||||||||||||
| Year Ended 9/30 | ||||||||||||||||||||||||||||||||||||||||||||||||||||
| 2005 | 11.53 | .51 | (.09 | ) | .42 | (.54 | ) | (.09 | ) | (.63 | ) | 11.32 | 3.70 | 8,363 | .50 | 4.48 | 30 | |||||||||||||||||||||||||||||||||||
| (a) | Per share Net Investment Income (Loss) is calculated using the average daily shares method. |
| (b) | Distributions from Capital Gains include short-term capital gains, if any. |
| (c) | Total Return is the combination of changes in net asset value without any sales charge, reinvested dividend income at net asset value and reinvested capital gains distributions at net asset value, if any. Total Return is not annualized. |
| (d) | After expense reimbursement, where applicable. Ratios do not reflect the effect of custodian fee credits earned on the Fund’s net cash on deposit with the custodian bank, where applicable. |
| (e) | For the eleven months ended May 31, 2011. |
| (f) | Effective January 18, 2011, Class C Shares and Class Y Shares previously offered by FAF Advisors were renamed Class C1 Shares and Class I Shares, respectively. |
| (g) | For the nine months ended June 30, 2006. |
| * | Annualized. |
60
Section 5 Financial Highlights
Nuveen Minnesota Intermediate Municipal Bond Fund
| Class (Commencement Date) | Investment Operations | Less Distributions | Ratios/Supplemental Data | |||||||||||||||||||||||||||||||||||||||||||||||||
| Beginning Net Asset Value | Net Investment Income (Loss)(a) | Net Realized/ Unrealized Gain (Loss) | Total | Net Investment Income | Capital Gains(b) | Total | Ending Net Asset Value | Total Return(c) | Ending Net Assets (000) | Ratios of Expenses to Average Net Assets(d) | Ratios of Net Investment Income (Loss) to Average Net Assets(d) | Portfolio Turnover Rate | ||||||||||||||||||||||||||||||||||||||||
| Class A (2/94) | ||||||||||||||||||||||||||||||||||||||||||||||||||||
| Year Ended 5/31 | ||||||||||||||||||||||||||||||||||||||||||||||||||||
| 2011(e) | $ | 10.12 | $ | .33 | $ | .07 | $ | .40 | $ | (.32 | ) | $ | — | $ | (.32 | ) | $ | 10.20 | 4.00 | % | $ | 37,175 | .74 | %* | 3.60 | %* | 12 | % | ||||||||||||||||||||||||
| Year Ended 6/30 | ||||||||||||||||||||||||||||||||||||||||||||||||||||
| 2010 | 9.67 | .36 | .46 | .82 | (.36 | ) | (.01 | ) | (.37 | ) | 10.12 | 8.51 | 34,957 | .75 | 3.61 | 9 | ||||||||||||||||||||||||||||||||||||
| 2009 | 9.75 | .38 | (.05 | ) | .33 | (.38 | ) | (.03 | ) | (.41 | ) | 9.67 | 3.53 | 23,019 | .75 | 4.00 | 18 | |||||||||||||||||||||||||||||||||||
| 2008 | 9.83 | .39 | (.05 | ) | .34 | (.39 | ) | (.03 | ) | (.42 | ) | 9.75 | 3.53 | 22,059 | .77 | 3.95 | 15 | |||||||||||||||||||||||||||||||||||
| 2007 | 9.88 | .39 | (.01 | ) | .38 | (.38 | ) | (.05 | ) | (.43 | ) | 9.83 | 3.87 | 21,153 | .85 | 3.86 | 18 | |||||||||||||||||||||||||||||||||||
| 2006(i) | 10.16 | .29 | (.22 | ) | .07 | (.29 | ) | (.06 | ) | (.35 | ) | 9.88 | .74 | 26,526 | .85 | * | 3.85 | * | 11 | |||||||||||||||||||||||||||||||||
| Year Ended 9/30 | ||||||||||||||||||||||||||||||||||||||||||||||||||||
| 2005 | 10.34 | .39 | (.15 | ) | .24 | (.39 | ) | (.03 | ) | (.42 | ) | 10.16 | 2.33 | 32,326 | .85 | 3.78 | 15 | |||||||||||||||||||||||||||||||||||
| Class C (1/11) | ||||||||||||||||||||||||||||||||||||||||||||||||||||
| Year Ended 5/31 | ||||||||||||||||||||||||||||||||||||||||||||||||||||
| 2011(g) | 9.77 | .11 | .36 | .47 | (.10 | ) | — | (.10 | ) | 10.14 | 4.88 | 623 | 1.37 | * | 3.14 | * | 12 | |||||||||||||||||||||||||||||||||||
| Class C1 (10/09)(f) | ||||||||||||||||||||||||||||||||||||||||||||||||||||
| Year Ended 5/31 | ||||||||||||||||||||||||||||||||||||||||||||||||||||
| 2011(e) | 10.14 | .28 | .07 | .35 | (.27 | ) | — | (.27 | ) | 10.22 | 3.46 | 6,242 | 1.31 | * | 3.05 | * | 12 | |||||||||||||||||||||||||||||||||||
| Year Ended 6/30 | ||||||||||||||||||||||||||||||||||||||||||||||||||||
| 2010(h) | 9.94 | .21 | .20 | .41 | (.20 | ) | (.01 | ) | (.21 | ) | 10.14 | 4.15 | 3,965 | 1.35 | * | 3.00 | * | 9 | ||||||||||||||||||||||||||||||||||
| Class I (2/94)(f) | ||||||||||||||||||||||||||||||||||||||||||||||||||||
| Year Ended 5/31 | ||||||||||||||||||||||||||||||||||||||||||||||||||||
| 2011(e) | 10.06 | .34 | .06 | .40 | (.33 | ) | — | (.33 | ) | 10.13 | 4.00 | 191,516 | .66 | * | 3.67 | * | 12 | |||||||||||||||||||||||||||||||||||
| Year Ended 6/30 | ||||||||||||||||||||||||||||||||||||||||||||||||||||
| 2010 | 9.62 | .36 | .45 | .81 | (.36 | ) | (.01 | ) | (.37 | ) | 10.06 | 8.50 | 193,443 | .70 | 3.66 | 9 | ||||||||||||||||||||||||||||||||||||
| 2009 | 9.69 | .39 | (.04 | ) | .35 | (.39 | ) | (.03 | ) | (.42 | ) | 9.62 | 3.71 | 172,440 | .70 | 4.04 | 18 | |||||||||||||||||||||||||||||||||||
| 2008 | 9.78 | .39 | (.05 | ) | .34 | (.40 | ) | (.03 | ) | (.43 | ) | 9.69 | 3.51 | 175,681 | .70 | 4.02 | 15 | |||||||||||||||||||||||||||||||||||
| 2007 | 9.83 | .40 | — | .40 | (.40 | ) | (.05 | ) | (.45 | ) | 9.78 | 4.05 | 168,920 | .70 | 4.01 | 18 | ||||||||||||||||||||||||||||||||||||
| 2006(i) | 10.11 | .30 | (.22 | ) | .08 | (.30 | ) | (.06 | ) | (.36 | ) | 9.83 | .85 | 175,485 | .70 | * | 4.00 | * | 11 | |||||||||||||||||||||||||||||||||
| Year Ended 9/30 | ||||||||||||||||||||||||||||||||||||||||||||||||||||
| 2005 | 10.29 | .40 | (.15 | ) | .25 | (.40 | ) | (.03 | ) | (.43 | ) | 10.11 | 2.50 | 197,251 | .70 | 3.93 | 15 | |||||||||||||||||||||||||||||||||||
| (a) | Per share Net Investment Income (Loss) is calculated using the average daily shares method. |
| (b) | Distributions from Capital Gains include short-term capital gains, if any. |
| (c) | Total Return is the combination of changes in net asset value without any sales charge, reinvested dividend income at net asset value and reinvested capital gains distributions at net asset value, if any. Total Return is not annualized. |
| (d) | After expense reimbursement, where applicable. Ratios do not reflect the effect of custodian fee credits earned on the Fund’s net cash on deposit with the custodian bank, where applicable. |
| (e) | For the eleven months ended May 31, 2011. |
| (f) | Effective January 18, 2011, Class C Shares and Class Y Shares previously offered by FAF Advisors were renamed Class C1 Shares and Class I Shares, respectively. |
| (g) | For the period January 18, 2011 (commencement of operations) through May 31, 2011. |
| (h) | For the period October 28, 2009 (commencement of operations) through June 30, 2010. |
| (i) | For the nine months ended June 30, 2006. |
| * | Annualized. |
Section 5 Financial Highlights
61
Nuveen Minnesota Municipal Bond Fund
| Class (Commencement Date) | Investment Operations | Less Distributions | Ratios/Supplemental Data | |||||||||||||||||||||||||||||||||||||||||||||||||
| Beginning Net Asset Value | Net Investment Income (Loss)(a) | Net Realized/ Unrealized Gain (Loss) | Total | Net Investment Income | Capital Gains(b) | Total | Ending Net Asset Value | Total Return(c) | Ending Net Assets (000) | Ratios of Expenses to Average Net Assets(d) | Ratios of Net Investment Income (Loss) to Average Net Assets(d) | Portfolio Turnover Rate | ||||||||||||||||||||||||||||||||||||||||
| Class A (7/88) | ||||||||||||||||||||||||||||||||||||||||||||||||||||
| Year Ended 5/31 | ||||||||||||||||||||||||||||||||||||||||||||||||||||
| 2011(e) | $ | 10.87 | $ | .39 | $ | (.08 | ) | $ | .31 | $ | (.35 | ) | $ | — | $ | (.35 | ) | $ | 10.83 | 2.94 | % | $ | 85,183 | .85 | %* | 3.94 | %* | 25 | % | |||||||||||||||||||||||
| Year Ended 6/30 | ||||||||||||||||||||||||||||||||||||||||||||||||||||
| 2010 | 9.98 | .41 | .89 | 1.30 | (.41 | ) | — | (.41 | ) | 10.87 | 13.19 | 91,922 | .85 | 3.86 | 34 | |||||||||||||||||||||||||||||||||||||
| 2009 | 10.48 | .43 | (.44 | ) | (.01 | ) | (.43 | ) | (.06 | ) | (.49 | ) | 9.98 | .07 | 87,218 | .85 | 4.32 | 28 | ||||||||||||||||||||||||||||||||||
| 2008 | 10.93 | .44 | (.38 | ) | .06 | (.45 | ) | (.06 | ) | (.51 | ) | 10.48 | .54 | 102,089 | .87 | 4.14 | 37 | |||||||||||||||||||||||||||||||||||
| 2007 | 10.97 | .46 | (.02 | ) | .44 | (.45 | ) | (.03 | ) | (.48 | ) | 10.93 | 4.05 | 106,732 | .95 | 4.10 | 20 | |||||||||||||||||||||||||||||||||||
| 2006(h) | 11.21 | .35 | (.21 | ) | .14 | (.35 | ) | (.03 | ) | (.38 | ) | 10.97 | 1.28 | 101,142 | .95 | * | 4.15 | * | 11 | |||||||||||||||||||||||||||||||||
| Year Ended 9/30 | ||||||||||||||||||||||||||||||||||||||||||||||||||||
| 2005 | 11.23 | .45 | .03 | .48 | (.45 | ) | (.05 | ) | (.50 | ) | 11.21 | 4.42 | 106,783 | .95 | 4.04 | 16 | ||||||||||||||||||||||||||||||||||||
| Class C (1/11) | ||||||||||||||||||||||||||||||||||||||||||||||||||||
| Year Ended 5/31 | ||||||||||||||||||||||||||||||||||||||||||||||||||||
| 2011(g) | 10.23 | .15 | .56 | .71 | (.12 | ) | — | (.12 | ) | 10.82 | 6.99 | 618 | 1.43 | * | 3.98 | * | 25 | |||||||||||||||||||||||||||||||||||
| Class C1 (2/99)(f) | ||||||||||||||||||||||||||||||||||||||||||||||||||||
| Year Ended 5/31 | ||||||||||||||||||||||||||||||||||||||||||||||||||||
| 2011(e) | 10.82 | .34 | (.08 | ) | .26 | (.30 | ) | — | (.30 | ) | 10.78 | 2.48 | 22,190 | 1.33 | * | 3.43 | * | 25 | ||||||||||||||||||||||||||||||||||
| Year Ended 6/30 | ||||||||||||||||||||||||||||||||||||||||||||||||||||
| 2010 | 9.94 | .36 | .88 | 1.24 | (.36 | ) | — | (.36 | ) | 10.82 | 12.58 | 26,772 | 1.35 | 3.35 | 34 | |||||||||||||||||||||||||||||||||||||
| 2009 | 10.44 | .38 | (.44 | ) | (.06 | ) | (.38 | ) | (.06 | ) | (.44 | ) | 9.94 | (.42 | ) | 20,489 | 1.35 | 3.82 | 28 | |||||||||||||||||||||||||||||||||
| 2008 | 10.89 | .40 | (.39 | ) | .01 | (.40 | ) | (.06 | ) | (.46 | ) | 10.44 | .06 | 20,061 | 1.35 | 3.63 | 37 | |||||||||||||||||||||||||||||||||||
| 2007 | 10.93 | .42 | (.02 | ) | .40 | (.41 | ) | (.03 | ) | (.44 | ) | 10.89 | 3.65 | 14,221 | 1.35 | 3.69 | 20 | |||||||||||||||||||||||||||||||||||
| 2006(h) | 11.17 | .31 | (.20 | ) | .11 | (.32 | ) | (.03 | ) | (.35 | ) | 10.93 | .98 | 10,359 | 1.35 | * | 3.75 | * | 11 | |||||||||||||||||||||||||||||||||
| Year Ended 9/30 | ||||||||||||||||||||||||||||||||||||||||||||||||||||
| 2005 | 11.19 | .41 | .03 | .44 | (.41 | ) | (.05 | ) | (.46 | ) | 11.17 | 4.02 | 9,841 | 1.35 | 3.64 | 16 | ||||||||||||||||||||||||||||||||||||
| Class I (8/97)(f) | ||||||||||||||||||||||||||||||||||||||||||||||||||||
| Year Ended 5/31 | ||||||||||||||||||||||||||||||||||||||||||||||||||||
| 2011(e) | 10.86 | .41 | (.08 | ) | .33 | (.37 | ) | — | (.37 | ) | 10.82 | 3.09 | 51,116 | .68 | * | 4.11 | * | 25 | ||||||||||||||||||||||||||||||||||
| Year Ended 6/30 | ||||||||||||||||||||||||||||||||||||||||||||||||||||
| 2010 | 9.97 | .42 | .90 | 1.32 | (.43 | ) | — | (.43 | ) | 10.86 | 13.37 | 52,639 | .70 | 4.00 | 34 | |||||||||||||||||||||||||||||||||||||
| 2009 | 10.47 | .44 | (.44 | ) | — | (.44 | ) | (.06 | ) | (.50 | ) | 9.97 | .23 | 42,093 | .70 | 4.47 | 28 | |||||||||||||||||||||||||||||||||||
| 2008 | 10.92 | .46 | (.38 | ) | .08 | (.47 | ) | (.06 | ) | (.53 | ) | 10.47 | .71 | 44,993 | .70 | 4.32 | 37 | |||||||||||||||||||||||||||||||||||
| 2007 | 10.96 | .48 | (.01 | ) | .47 | (.48 | ) | (.03 | ) | (.51 | ) | 10.92 | 4.31 | 56,181 | .70 | 4.35 | 20 | |||||||||||||||||||||||||||||||||||
| 2006(h) | 11.20 | .36 | (.20 | ) | .16 | (.37 | ) | (.03 | ) | (.40 | ) | 10.96 | 1.47 | 48,760 | .70 | * | 4.40 | * | 11 | |||||||||||||||||||||||||||||||||
| Year Ended 9/30 | ||||||||||||||||||||||||||||||||||||||||||||||||||||
| 2005 | 11.22 | .48 | .03 | .51 | (.48 | ) | (.05 | ) | (.53 | ) | 11.20 | 4.69 | 46,471 | .70 | 4.29 | 16 | ||||||||||||||||||||||||||||||||||||
| (a) | Per share Net Investment Income (Loss) is calculated using the average daily shares method. |
| (b) | Distributions from Capital Gains include short-term capital gains, if any. |
| (c) | Total Return is the combination of changes in net asset value without any sales charge, reinvested dividend income at net asset value and reinvested capital gains distributions at net asset value, if any. Total Return is not annualized. |
| (d) | After expense reimbursement, where applicable. Ratios do not reflect the effect of custodian fee credits earned on the Fund’s net cash on deposit with the custodian bank, where applicable. |
| (e) | For the eleven months ended May 31, 2011. |
| (f) | Effective January 18, 2011, Class C Shares and Class Y Shares previously offered by FAF Advisors were renamed Class C1 Shares and Class I Shares, respectively. |
| (g) | For the period January 18, 2011 (commencement of operations) through May 31, 2011. |
| (h) | For the nine months ended June 30, 2006. |
| * | Annualized. |
62
Section 5 Financial Highlights
Nuveen Missouri Tax Free Fund
| Class (Commencement Date) | Investment Operations | Less Distributions | Ratios/Supplemental Data | |||||||||||||||||||||||||||||||||||||||||||||||||
| Beginning Net Asset Value | Net Investment Income (Loss)(a) | Net Realized/ Unrealized Gain (Loss) | Total | Net Investment Income | Capital Gains(b) | Total | Ending Net Asset Value | Total Return(c) | Ending Net Assets (000) | Ratios of Expenses to Average Net Assets(d) | Ratios of Net Investment Income (Loss) to Average Net Assets(d) | Portfolio Turnover Rate | ||||||||||||||||||||||||||||||||||||||||
| Class A (9/90) | ||||||||||||||||||||||||||||||||||||||||||||||||||||
| Year Ended 5/31 | ||||||||||||||||||||||||||||||||||||||||||||||||||||
| 2011(e) | $ | 11.68 | $ | .44 | $ | .04 | $ | .48 | $ | (.42 | ) | $ | (.02 | ) | $ | (.44 | ) | $ | 11.72 | 4.18 | % | $ | 22,951 | .84 | %* | 4.11 | %* | 10 | % | |||||||||||||||||||||||
| Year Ended 6/30 | ||||||||||||||||||||||||||||||||||||||||||||||||||||
| 2010 | 11.11 | .48 | .66 | 1.14 | (.48 | ) | (.09 | ) | (.57 | ) | 11.68 | 10.41 | 23,830 | .85 | 4.14 | 15 | ||||||||||||||||||||||||||||||||||||
| 2009 | 11.40 | .47 | (.26 | ) | .21 | (.47 | ) | (.03 | ) | (.50 | ) | 11.11 | 2.01 | 22,766 | .95 | 4.25 | 17 | |||||||||||||||||||||||||||||||||||
| 2008 | 11.72 | .46 | (.29 | ) | .17 | (.46 | ) | (.03 | ) | (.49 | ) | 11.40 | 1.44 | 23,135 | .95 | 3.92 | 20 | |||||||||||||||||||||||||||||||||||
| 2007 | 11.76 | .45 | .05 | .50 | (.45 | ) | (.09 | ) | (.54 | ) | 11.72 | 4.23 | 24,945 | .95 | 3.78 | 33 | ||||||||||||||||||||||||||||||||||||
| 2006(g) | 12.14 | .34 | (.29 | ) | .05 | (.34 | ) | (.09 | ) | (.43 | ) | 11.76 | .38 | 26,972 | .95 | * | 3.74 | * | 20 | |||||||||||||||||||||||||||||||||
| Year Ended 9/30 | ||||||||||||||||||||||||||||||||||||||||||||||||||||
| 2005 | 12.32 | .45 | (.12 | ) | .33 | (.45 | ) | (.06 | ) | (.51 | ) | 12.14 | 2.74 | 30,188 | .95 | 3.65 | 19 | |||||||||||||||||||||||||||||||||||
| Class C1 (9/01)(f) | ||||||||||||||||||||||||||||||||||||||||||||||||||||
| Year Ended 5/31 | ||||||||||||||||||||||||||||||||||||||||||||||||||||
| 2011(e) | 11.65 | .38 | .05 | .43 | (.37 | ) | (.02 | ) | (.39 | ) | 11.69 | 3.72 | 1,661 | 1.34 | * | 3.62 | * | 10 | ||||||||||||||||||||||||||||||||||
| Year Ended 6/30 | ||||||||||||||||||||||||||||||||||||||||||||||||||||
| 2010 | 11.08 | .43 | .66 | 1.09 | (.43 | ) | (.09 | ) | (.52 | ) | 11.65 | 9.90 | 1,653 | 1.35 | 3.62 | 15 | ||||||||||||||||||||||||||||||||||||
| 2009 | 11.36 | .43 | (.25 | ) | .18 | (.43 | ) | (.03 | ) | (.46 | ) | 11.08 | 1.70 | 757 | 1.35 | 3.85 | 17 | |||||||||||||||||||||||||||||||||||
| 2008 | 11.69 | .41 | (.30 | ) | .11 | (.41 | ) | (.03 | ) | (.44 | ) | 11.36 | .95 | 406 | 1.35 | 3.53 | 20 | |||||||||||||||||||||||||||||||||||
| 2007 | 11.73 | .41 | .04 | .45 | (.40 | ) | (.09 | ) | (.49 | ) | 11.69 | 3.84 | 518 | 1.35 | 3.35 | 33 | ||||||||||||||||||||||||||||||||||||
| 2006(g) | 12.12 | .30 | (.30 | ) | — | (.30 | ) | (.09 | ) | (.39 | ) | 11.73 | — | 214 | 1.35 | * | 3.34 | * | 20 | |||||||||||||||||||||||||||||||||
| Year Ended 9/30 | ||||||||||||||||||||||||||||||||||||||||||||||||||||
| 2005 | 12.29 | .40 | (.11 | ) | .29 | (.40 | ) | (.06 | ) | (.46 | ) | 12.12 | 2.42 | 190 | 1.35 | 3.25 | 19 | |||||||||||||||||||||||||||||||||||
| Class I (7/88)(f) | ||||||||||||||||||||||||||||||||||||||||||||||||||||
| Year Ended 5/31 | ||||||||||||||||||||||||||||||||||||||||||||||||||||
| 2011(e) | 11.69 | .45 | .04 | .49 | (.44 | ) | (.02 | ) | (.46 | ) | 11.72 | 4.25 | 134,610 | .69 | * | 4.27 | * | 10 | ||||||||||||||||||||||||||||||||||
| Year Ended 6/30 | ||||||||||||||||||||||||||||||||||||||||||||||||||||
| 2010 | 11.12 | .50 | .66 | 1.16 | (.50 | ) | (.09 | ) | (.59 | ) | 11.69 | 10.57 | 137,049 | .70 | 4.29 | 15 | ||||||||||||||||||||||||||||||||||||
| 2009 | 11.40 | .49 | (.24 | ) | .25 | (.50 | ) | (.03 | ) | (.53 | ) | 11.12 | 2.36 | 119,522 | .70 | 4.49 | 17 | |||||||||||||||||||||||||||||||||||
| 2008 | 11.73 | .48 | (.30 | ) | .18 | (.48 | ) | (.03 | ) | (.51 | ) | 11.40 | 1.60 | 137,746 | .70 | 4.17 | 20 | |||||||||||||||||||||||||||||||||||
| 2007 | 11.76 | .48 | .06 | .54 | (.48 | ) | (.09 | ) | (.57 | ) | 11.73 | 4.58 | 130,644 | .70 | 4.03 | 33 | ||||||||||||||||||||||||||||||||||||
| 2006(g) | 12.15 | .36 | (.30 | ) | .06 | (.36 | ) | (.09 | ) | (.45 | ) | 11.76 | .49 | 138,394 | .70 | * | 3.99 | * | 20 | |||||||||||||||||||||||||||||||||
| Year Ended 9/30 | ||||||||||||||||||||||||||||||||||||||||||||||||||||
| 2005 | 12.32 | .48 | (.11 | ) | .37 | (.48 | ) | (.06 | ) | (.54 | ) | 12.15 | 3.08 | 151,710 | .70 | 3.90 | 19 | |||||||||||||||||||||||||||||||||||
| (a) | Per share Net Investment Income (Loss) is calculated using the average daily shares method. |
| (b) | Distributions from Capital Gains include short-term capital gains, if any. |
| (c) | Total Return is the combination of changes in net asset value without any sales charge, reinvested dividend income at net asset value and reinvested capital gains distributions at net asset value, if any. Total Return is not annualized. |
| (d) | After expense reimbursement, where applicable. Ratios do not reflect the effect of custodian fee credits earned on the Fund’s net cash on deposit with the custodian bank, where applicable. |
| (e) | For the eleven months ended May 31, 2011. |
| (f) | Effective January 18, 2011, Class C Shares and Class Y Shares previously offered by FAF Advisors were renamed Class C1 Shares and Class I Shares, respectively. |
| (g) | For the nine months ended June 30, 2006. |
| * | Annualized. |
Section 5 Financial Highlights
63
Nuveen Nebraska Municipal Bond Fund
| Class (Commencement Date) | Investment Operations | Less Distributions | Ratios/Supplemental Data | |||||||||||||||||||||||||||||||||||||||||||||||||
| Beginning Net Asset Value | Net Investment Income (Loss)(a) | Net Realized/ Unrealized Gain (Loss) | Total | Net Investment Income | Capital Gains(b) | Total | Ending Net Asset Value | Total Return(c) | Ending Net Assets (000) | Ratios of Expenses to Average Net Assets(d) | Ratios of Net Investment Income (Loss) to Average Net Assets(d) | Portfolio Turnover Rate | ||||||||||||||||||||||||||||||||||||||||
| Class A (2/01) | ||||||||||||||||||||||||||||||||||||||||||||||||||||
| Year Ended 5/31 | ||||||||||||||||||||||||||||||||||||||||||||||||||||
| 2011(e) | $ | 10.34 | $ | .39 | $ | (.06 | ) | $ | .33 | $ | (.39 | ) | $ | — | $ | (.39 | ) | $ | 10.28 | 3.28 | % | $ | 7,099 | .72 | %* | 4.11 | %* | 21 | % | |||||||||||||||||||||||
| Year Ended 6/30 | ||||||||||||||||||||||||||||||||||||||||||||||||||||
| 2010 | 9.84 | .41 | .49 | .90 | (.40 | ) | — | (.40 | ) | 10.34 | 9.26 | 6,333 | .75 | 4.01 | 18 | |||||||||||||||||||||||||||||||||||||
| 2009 | 10.06 | .43 | (.21 | ) | .22 | (.44 | ) | — | (.44 | ) | 9.84 | 2.33 | 5,847 | .75 | 4.41 | 34 | ||||||||||||||||||||||||||||||||||||
| 2008 | 10.30 | .42 | (.20 | ) | .22 | (.41 | ) | (.05 | ) | (.46 | ) | 10.06 | 2.19 | 5,689 | .75 | 4.06 | 22 | |||||||||||||||||||||||||||||||||||
| 2007 | 10.33 | .42 | .02 | .44 | (.42 | ) | (.05 | ) | (.47 | ) | 10.30 | 4.24 | 7,091 | .75 | 3.97 | 39 | ||||||||||||||||||||||||||||||||||||
| 2006(h) | 10.58 | .31 | (.24 | ) | .07 | (.30 | ) | (.02 | ) | (.32 | ) | 10.33 | .65 | 6,910 | .75 | * | 3.89 | * | 35 | |||||||||||||||||||||||||||||||||
| Year Ended 9/30 | ||||||||||||||||||||||||||||||||||||||||||||||||||||
| 2005 | 10.66 | .39 | (.05 | ) | .34 | (.42 | ) | — | (.42 | ) | 10.58 | 3.20 | 7,136 | .75 | 3.78 | 21 | ||||||||||||||||||||||||||||||||||||
| Class C (1/11) | ||||||||||||||||||||||||||||||||||||||||||||||||||||
| Year Ended 5/31 | ||||||||||||||||||||||||||||||||||||||||||||||||||||
| 2011(g) | 9.86 | .14 | .42 | .56 | (.14 | ) | — | (.14 | ) | 10.28 | 5.70 | 321 | 1.24 | * | 3.73 | * | 21 | |||||||||||||||||||||||||||||||||||
| Class C1 (2/01)(f) | ||||||||||||||||||||||||||||||||||||||||||||||||||||
| Year Ended 5/31 | ||||||||||||||||||||||||||||||||||||||||||||||||||||
| 2011(e) | 10.26 | .34 | (.06 | ) | .28 | (.35 | ) | — | (.35 | ) | 10.19 | 2.80 | 4,201 | 1.14 | * | 3.69 | * | 21 | ||||||||||||||||||||||||||||||||||
| Year Ended 6/30 | ||||||||||||||||||||||||||||||||||||||||||||||||||||
| 2010 | 9.76 | .38 | .48 | .86 | (.36 | ) | — | (.36 | ) | 10.26 | 8.91 | 4,181 | 1.15 | 3.62 | 18 | |||||||||||||||||||||||||||||||||||||
| 2009 | 9.99 | .39 | (.22 | ) | .17 | (.40 | ) | — | (.40 | ) | 9.76 | 1.84 | 2,585 | 1.15 | 4.02 | 34 | ||||||||||||||||||||||||||||||||||||
| 2008 | 10.23 | .38 | (.20 | ) | .18 | (.37 | ) | (.05 | ) | (.42 | ) | 9.99 | 1.81 | 1,798 | 1.15 | 3.65 | 22 | |||||||||||||||||||||||||||||||||||
| 2007 | 10.26 | .37 | .02 | .39 | (.37 | ) | (.05 | ) | (.42 | ) | 10.23 | 3.86 | 1,559 | 1.15 | 3.56 | 39 | ||||||||||||||||||||||||||||||||||||
| 2006(h) | 10.50 | .27 | (.22 | ) | .05 | (.27 | ) | (.02 | ) | (.29 | ) | 10.26 | .46 | 1,487 | 1.15 | * | 3.49 | * | 35 | |||||||||||||||||||||||||||||||||
| Year Ended 9/30 | ||||||||||||||||||||||||||||||||||||||||||||||||||||
| 2005 | 10.58 | .35 | (.06 | ) | .29 | (.37 | ) | — | (.37 | ) | 10.50 | 2.81 | 1,565 | 1.15 | 3.38 | 21 | ||||||||||||||||||||||||||||||||||||
| Class I (2/01)(f) | ||||||||||||||||||||||||||||||||||||||||||||||||||||
| Year Ended 5/31 | ||||||||||||||||||||||||||||||||||||||||||||||||||||
| 2011(e) | 10.34 | .41 | (.07 | ) | .34 | (.41 | ) | — | (.41 | ) | 10.27 | 3.39 | 31,470 | .49 | * | 4.34 | * | 21 | ||||||||||||||||||||||||||||||||||
| Year Ended 6/30 | ||||||||||||||||||||||||||||||||||||||||||||||||||||
| 2010 | 9.83 | .44 | .50 | .94 | (.43 | ) | — | (.43 | ) | 10.34 | 9.65 | 31,757 | .50 | 4.26 | 18 | |||||||||||||||||||||||||||||||||||||
| 2009 | 10.06 | .45 | (.22 | ) | .23 | (.46 | ) | — | (.46 | ) | 9.83 | 2.48 | 30,689 | .50 | 4.67 | 34 | ||||||||||||||||||||||||||||||||||||
| 2008 | 10.30 | .44 | (.19 | ) | .25 | (.44 | ) | (.05 | ) | (.49 | ) | 10.06 | 2.45 | 29,533 | .50 | 4.31 | 22 | |||||||||||||||||||||||||||||||||||
| 2007 | 10.33 | .44 | .02 | .46 | (.44 | ) | (.05 | ) | (.49 | ) | 10.30 | 4.51 | 32,502 | .50 | 4.22 | 39 | ||||||||||||||||||||||||||||||||||||
| 2006(h) | 10.58 | .32 | (.23 | ) | .09 | (.32 | ) | (.02 | ) | (.34 | ) | 10.33 | .85 | 31,347 | .50 | * | 4.14 | * | 35 | |||||||||||||||||||||||||||||||||
| Year Ended 9/30 | ||||||||||||||||||||||||||||||||||||||||||||||||||||
| 2005 | 10.66 | .43 | (.07 | ) | .36 | (.44 | ) | — | (.44 | ) | 10.58 | 3.45 | 32,418 | .50 | 4.03 | 21 | ||||||||||||||||||||||||||||||||||||
| (a) | Per share Net Investment Income (Loss) is calculated using the average daily shares method. |
| (b) | Distributions from Capital Gains include short-term capital gains, if any. |
| (c) | Total Return is the combination of changes in net asset value without any sales charge, reinvested dividend income at net asset value and reinvested capital gains distributions at net asset value, if any. Total Return is not annualized. |
| (d) | After expense reimbursement, where applicable. Ratios do not reflect the effect of custodian fee credits earned on the Fund’s net cash on deposit with the custodian bank, where applicable. |
| (e) | For the eleven months ended May 31, 2011. |
| (f) | Effective January 18, 2011, Class C Shares and Class Y Shares previously offered by FAF Advisors were renamed Class C1 Shares and Class I Shares, respectively. |
| (g) | For the period January 18, 2011 (commencement of operations) through May 31, 2011. |
| (h) | For the nine months ended June 30, 2006. |
| * | Annualized. |
64
Section 5 Financial Highlights
Nuveen Ohio Tax Free Fund
| Class (Commencement Date) | Investment Operations | Less Distributions | Ratios/Supplemental Data | |||||||||||||||||||||||||||||||||||||||||||||||||
| Beginning Net Asset Value | Net Investment Income (Loss)(a) | Net Realized/ Unrealized Gain (Loss) | Total | Net Investment Income | Capital Gains(b) | Total | Ending Net Asset Value | Total Return(c) | Ending Net Assets (000) | Ratios of Expenses to Average Net Assets(d) | Ratios of Net Investment Income (Loss) to Average Net Assets(d) | Portfolio Turnover Rate | ||||||||||||||||||||||||||||||||||||||||
| Class A (4/02) | ||||||||||||||||||||||||||||||||||||||||||||||||||||
| Year Ended 5/31 | ||||||||||||||||||||||||||||||||||||||||||||||||||||
| 2011(e) | $ | 10.42 | $ | .37 | $ | (.10 | ) | $ | .27 | $ | (.36 | ) | $ | — | $ | (.36 | ) | $ | 10.33 | 2.69 | % | $ | 1,642 | .72 | %* | 3.89 | %* | 9 | % | |||||||||||||||||||||||
| Year Ended 6/30 | ||||||||||||||||||||||||||||||||||||||||||||||||||||
| 2010 | 9.90 | .38 | .51 | .89 | (.37 | ) | — | (.37 | ) | 10.42 | 9.12 | 1,899 | .75 | 3.72 | 14 | |||||||||||||||||||||||||||||||||||||
| 2009 | 10.02 | .40 | (.12 | ) | .28 | (.40 | ) | — | (.40 | ) | 9.90 | 2.99 | 1,048 | .75 | 4.09 | 12 | ||||||||||||||||||||||||||||||||||||
| 2008 | 10.20 | .39 | (.15 | ) | .24 | (.39 | ) | (.03 | ) | (.42 | ) | 10.02 | 2.38 | 635 | .75 | 3.81 | 12 | |||||||||||||||||||||||||||||||||||
| 2007 | 10.17 | .38 | .05 | .43 | (.38 | ) | (.02 | ) | (.40 | ) | 10.20 | 4.28 | 808 | .75 | 3.70 | 33 | ||||||||||||||||||||||||||||||||||||
| 2006(g) | 10.42 | .29 | (.25 | ) | .04 | (.28 | ) | (.01 | ) | (.29 | ) | 10.17 | .40 | 841 | .75 | * | 3.60 | * | 11 | |||||||||||||||||||||||||||||||||
| Year Ended 9/30 | ||||||||||||||||||||||||||||||||||||||||||||||||||||
| 2005 | 10.52 | .36 | (.06 | ) | .30 | (.36 | ) | (.04 | ) | (.40 | ) | 10.42 | 2.86 | 988 | .75 | 3.41 | 13 | |||||||||||||||||||||||||||||||||||
| Class C1 (4/02)(f) | ||||||||||||||||||||||||||||||||||||||||||||||||||||
| Year Ended 5/31 | ||||||||||||||||||||||||||||||||||||||||||||||||||||
| 2011(e) | 10.27 | .33 | (.10 | ) | .23 | (.32 | ) | — | (.32 | ) | 10.18 | 2.31 | 1,681 | 1.14 | * | 3.52 | * | 9 | ||||||||||||||||||||||||||||||||||
| Year Ended 6/30 | ||||||||||||||||||||||||||||||||||||||||||||||||||||
| 2010 | 9.76 | .35 | .49 | .84 | (.33 | ) | — | (.33 | ) | 10.27 | 8.72 | 1,347 | 1.15 | 3.34 | 14 | |||||||||||||||||||||||||||||||||||||
| 2009 | 9.89 | .37 | (.13 | ) | .24 | (.37 | ) | — | (.37 | ) | 9.76 | 2.52 | 399 | 1.15 | 3.68 | 12 | ||||||||||||||||||||||||||||||||||||
| 2008 | 10.07 | .35 | (.15 | ) | .20 | (.35 | ) | (.03 | ) | (.38 | ) | 9.89 | 2.00 | 255 | 1.15 | 3.39 | 12 | |||||||||||||||||||||||||||||||||||
| 2007 | 10.05 | .33 | .05 | .38 | (.34 | ) | (.02 | ) | (.36 | ) | 10.07 | 3.81 | 187 | 1.15 | 3.29 | 33 | ||||||||||||||||||||||||||||||||||||
| 2006(g) | 10.32 | .25 | (.26 | ) | (.01 | ) | (.25 | ) | (.01 | ) | (.26 | ) | 10.05 | (.08 | ) | 209 | 1.15 | * | 3.22 | * | 11 | |||||||||||||||||||||||||||||||
| Year Ended 9/30 | ||||||||||||||||||||||||||||||||||||||||||||||||||||
| 2005 | 10.41 | .32 | (.05 | ) | .27 | (.32 | ) | (.04 | ) | (.36 | ) | 10.32 | 2.58 | 174 | 1.15 | 3.01 | 13 | |||||||||||||||||||||||||||||||||||
| Class I (4/02)(f) | ||||||||||||||||||||||||||||||||||||||||||||||||||||
| Year Ended 5/31 | ||||||||||||||||||||||||||||||||||||||||||||||||||||
| 2011(e) | 10.42 | .39 | (.10 | ) | .29 | (.39 | ) | — | (.39 | ) | 10.32 | 2.81 | 47,169 | .49 | * | 4.11 | * | 9 | ||||||||||||||||||||||||||||||||||
| Year Ended 6/30 | ||||||||||||||||||||||||||||||||||||||||||||||||||||
| 2010 | 9.90 | .41 | .51 | .92 | (.40 | ) | — | (.40 | ) | 10.42 | 9.39 | 59,528 | .50 | 3.97 | 14 | |||||||||||||||||||||||||||||||||||||
| 2009 | 10.01 | .42 | (.10 | ) | .32 | (.43 | ) | — | �� | (.43 | ) | 9.90 | 3.36 | 44,783 | .50 | 4.35 | 12 | |||||||||||||||||||||||||||||||||||
| 2008 | 10.19 | .41 | (.15 | ) | .26 | (.41 | ) | (.03 | ) | (.44 | ) | 10.01 | 2.63 | 48,510 | .50 | 4.06 | 12 | |||||||||||||||||||||||||||||||||||
| 2007 | 10.17 | .41 | .04 | .45 | (.41 | ) | (.02 | ) | (.43 | ) | 10.19 | 4.44 | 42,223 | .50 | 3.94 | 33 | ||||||||||||||||||||||||||||||||||||
| 2006(g) | 10.43 | .30 | (.25 | ) | .05 | (.30 | ) | (.01 | ) | (.31 | ) | 10.17 | .49 | 40,606 | .50 | * | 3.85 | * | 11 | |||||||||||||||||||||||||||||||||
| Year Ended 9/30 | ||||||||||||||||||||||||||||||||||||||||||||||||||||
| 2005 | 10.53 | .38 | (.05 | ) | .33 | (.39 | ) | (.04 | ) | (.43 | ) | 10.43 | 3.12 | 41,104 | .50 | 3.66 | 13 | |||||||||||||||||||||||||||||||||||
| (a) | Per share Net Investment Income (Loss) is calculated using the average daily shares method. |
| (b) | Distributions from Capital Gains include short-term capital gains, if any. |
| (c) | Total Return is the combination of changes in net asset value without any sales charge, reinvested dividend income at net asset value and reinvested capital gains distributions at net asset value, if any. Total Return is not annualized. |
| (d) | After expense reimbursement, where applicable. Ratios do not reflect the effect of custodian fee credits earned on the Fund’s net cash on deposit with the custodian bank, where applicable. |
| (e) | For the eleven months ended May 31, 2011. |
| (f) | Effective January 18, 2011, Class C Shares and Class Y Shares previously offered by FAF Advisors were renamed Class C1 Shares and Class I Shares, respectively. |
| (g) | For the nine months ended June 30, 2006. |
| * | Annualized. |
Section 5 Financial Highlights
65
Nuveen Oregon Intermediate Municipal Bond Fund
| Class (Commencement Date) | Investment Operations | Less Distributions | Ratios/Supplemental Data | |||||||||||||||||||||||||||||||||||||||||||||||||
| Beginning Net Asset Value | Net Investment Income (Loss)(a) | Net Realized/ Unrealized Gain (Loss) | Total | Net Investment Income | Capital Gains(b) | Total | Ending Net Asset Value | Total Return(c) | Ending Net Assets (000) | Ratios of Expenses to Average Net Assets(d) | Ratios of Net Investment Income (Loss) to Average Net Assets(d) | Portfolio Turnover Rate | ||||||||||||||||||||||||||||||||||||||||
| Class A (2/99) | ||||||||||||||||||||||||||||||||||||||||||||||||||||
| Year Ended 5/31 | ||||||||||||||||||||||||||||||||||||||||||||||||||||
| 2011(e) | $ | 10.11 | $ | .29 | $ | .05 | $ | .34 | $ | (.28 | ) | $ | — | $ | (.28 | ) | $ | 10.17 | 3.46 | % | $ | 31,399 | .82 | %* | 3.18 | %* | 12 | % | ||||||||||||||||||||||||
| Year Ended 6/30 | ||||||||||||||||||||||||||||||||||||||||||||||||||||
| 2010 | 9.77 | .35 | .33 | .68 | (.34 | ) | — | (.34 | ) | 10.11 | 7.05 | 31,043 | .85 | 3.37 | 19 | |||||||||||||||||||||||||||||||||||||
| 2009 | 9.68 | .36 | .09 | .45 | (.36 | ) | — | (.36 | ) | 9.77 | 4.77 | 10,963 | .85 | 3.70 | 19 | |||||||||||||||||||||||||||||||||||||
| 2008 | 9.72 | .35 | (.02 | ) | .33 | (.36 | ) | (.01 | ) | (.37 | ) | 9.68 | 3.39 | 5,967 | .85 | 3.64 | 15 | |||||||||||||||||||||||||||||||||||
| 2007 | 9.78 | .37 | (.02 | ) | .35 | (.37 | ) | (.04 | ) | (.41 | ) | 9.72 | 3.54 | 7,895 | .85 | 3.71 | 43 | |||||||||||||||||||||||||||||||||||
| 2006(h) | 10.07 | .27 | (.25 | ) | .02 | (.27 | ) | (.04 | ) | (.31 | ) | 9.78 | .16 | 9,456 | .85 | * | 3.62 | * | 13 | |||||||||||||||||||||||||||||||||
| Year Ended 9/30 | ||||||||||||||||||||||||||||||||||||||||||||||||||||
| 2005 | 10.30 | .36 | (.19 | ) | .17 | (.36 | ) | (.04 | ) | (.40 | ) | 10.07 | 1.67 | 9,356 | .85 | 3.56 | 20 | |||||||||||||||||||||||||||||||||||
| Class C (1/11) | ||||||||||||||||||||||||||||||||||||||||||||||||||||
| Year Ended 5/31 | ||||||||||||||||||||||||||||||||||||||||||||||||||||
| 2011(g) | 9.78 | .09 | .40 | .49 | (.12 | ) | — | (.12 | ) | 10.15 | 5.04 | 632 | 1.36 | * | 2.53 | * | 12 | |||||||||||||||||||||||||||||||||||
| Class I (8/97)(f) | ||||||||||||||||||||||||||||||||||||||||||||||||||||
| Year Ended 5/31 | ||||||||||||||||||||||||||||||||||||||||||||||||||||
| 2011(e) | 10.11 | .31 | .05 | .36 | (.30 | ) | — | (.30 | ) | 10.17 | 3.62 | 113,827 | .65 | * | 3.35 | * | 12 | |||||||||||||||||||||||||||||||||||
| Year Ended 6/30 | ||||||||||||||||||||||||||||||||||||||||||||||||||||
| 2010 | 9.77 | .35 | .35 | .70 | (.36 | ) | — | (.36 | ) | 10.11 | 7.21 | 133,816 | .70 | 3.52 | 19 | |||||||||||||||||||||||||||||||||||||
| 2009 | 9.68 | .37 | .10 | .47 | (.38 | ) | — | (.38 | ) | 9.77 | 4.92 | 119,959 | .70 | 3.84 | 19 | |||||||||||||||||||||||||||||||||||||
| 2008 | 9.72 | .37 | (.03 | ) | .34 | (.37 | ) | (.01 | ) | (.38 | ) | 9.68 | 3.54 | 120,800 | .70 | 3.78 | 15 | |||||||||||||||||||||||||||||||||||
| 2007 | 9.78 | .38 | (.02 | ) | .36 | (.38 | ) | (.04 | ) | (.42 | ) | 9.72 | 3.70 | 109,357 | .70 | 3.86 | 43 | |||||||||||||||||||||||||||||||||||
| 2006(h) | 10.07 | .28 | (.25 | ) | .03 | (.28 | ) | (.04 | ) | (.32 | ) | 9.78 | .28 | 111,344 | .70 | * | 3.77 | * | 13 | |||||||||||||||||||||||||||||||||
| Year Ended 9/30 | ||||||||||||||||||||||||||||||||||||||||||||||||||||
| 2005 | 10.30 | .38 | (.19 | ) | .19 | (.38 | ) | (.04 | ) | (.42 | ) | 10.07 | 1.82 | 133,613 | .70 | 3.71 | 20 | |||||||||||||||||||||||||||||||||||
| (a) | Per share Net Investment Income (Loss) is calculated using the average daily shares method. |
| (b) | Distributions from Capital Gains include short-term capital gains, if any. |
| (c) | Total Return is the combination of changes in net asset value without any sales charge, reinvested dividend income at net asset value and reinvested capital gains distributions at net asset value, if any. Total Return is not annualized. |
| (d) | After expense reimbursement, where applicable. Ratios do not reflect the effect of custodian fee credits earned on the Fund’s net cash on deposit with the custodian bank, where applicable. |
| (e) | For the eleven months ended May 31, 2011. |
| (f) | Effective January 18, 2011, Class Y Shares previously offered by FAF Advisors were renamed Class I Shares. |
| (g) | For the period January 18, 2011 (commencement of operations) through May 31, 2011. |
| (h) | For the nine months ended June 30, 2006. |
| * | Annualized. |
66
Section 5 Financial Highlights
Section 6 Glossary of Investment Terms
| • | Barclays Capital Municipal Bond Index: The Barclays Capital Municipal Bond Index is an unmanaged index comprised of fixed-rate, investment-grade tax-exempt bonds with remaining maturities of one year or more. |
| • | Barclays Capital 1-15 Year Blend Municipal Bond Index: The Barclays Capital 1-15 Year Blend Municipal Bond Index is an unmanaged index comprised of fixed-rate investment-grade tax-exempt bonds with remaining maturities between one and seventeen years. |
| • | Derivatives: Financial instruments whose performance is derived from the performance of an underlying asset, security or index. Derivatives may be used to hedge risk, to exchange a floating rate of return for a fixed rate of return or to gain investment exposure. Derivatives include futures, options and swaps, among other instruments. |
| • | Futures: Derivative contracts obligating buyers to purchase an asset or sellers to sell an asset at a predetermined future date and price. Futures contracts detail the quality and quantity of the underlying asset; they are standardized to facilitate trading on a futures exchange. |
| • | Lipper Colorado Municipal Debt Funds Category Average: The Lipper Colorado Municipal Debt Funds Category Average represents funds that invest primarily in those securities that provide income that is exempt from taxation in Colorado. |
| • | Lipper Minnesota Municipal Debt Funds Category Average: The Lipper Minnesota Municipal Debt Funds Category Average represents funds that invest primarily in those securities that provide income that is exempt from taxation in Minnesota. |
| • | Lipper Ohio Municipal Debt Funds Category Average: The Lipper Ohio Municipal Debt Funds Category Average represents funds that invest primarily in those securities that provide income that is exempt from taxation in Ohio. |
| • | Lipper Other States Intermediate Municipal Debt Funds Category Average: The Lipper Other States Intermediate Municipal Debt Funds Category Average represents funds that invest primarily in municipal debt issues with dollar-weighted average maturities of five to ten years that are exempt from taxation on a specified state basis. |
| • | Options: Derivative contracts giving buyers the right to buy or to sell shares of a specified stock at a specified price on or before a given date. There are also options on currencies and other financial assets. |
| • | Swaps: Derivative contracts in which two parties agree to exchange one stream of cash flows for another stream. Swap agreements define the dates when the cash flows will be paid and how the cash flows are calculated. |
Section 6 Glossary of Investment Terms
67
Nuveen Mutual Funds
Nuveen offers a variety of mutual funds designed to help you reach your financial goals. The funds below are grouped by category.
Municipal-National
All-American Municipal Bond
High Yield Municipal Bond
Inflation Protected Municipal Bond
Intermediate Duration Municipal Bond
Intermediate Tax Free*
Limited Term Municipal Bond
Municipal Bond
Municipal Bond 2
Short Term Municipal Bond*
Tax Free*
Municipal-State
Arizona Municipal Bond
California High Yield Municipal Bond
California Municipal Bond
California Municipal Bond 2
California Tax Free*
Colorado Municipal Bond
Colorado Tax Free*
Connecticut Municipal Bond
Georgia Municipal Bond
Kansas Municipal Bond
Kentucky Municipal Bond
Louisiana Municipal Bond
Maryland Municipal Bond
Massachusetts Municipal Bond
Massachusetts Municipal Bond 2
Michigan Municipal Bond
Minnesota Intermediate Municipal Bond*
Municipal-State (continued)
Minnesota Municipal Bond*
Missouri Municipal Bond
Missouri Tax Free*
Nebraska Municipal Bond*
New Jersey Municipal Bond
New Mexico Municipal Bond
New York Municipal Bond
New York Municipal Bond 2
North Carolina Municipal Bond
Ohio Municipal Bond
Ohio Tax Free*
Oregon Intermediate Municipal Bond*
Pennsylvania Municipal Bond
Tennessee Municipal Bond
Virginia Municipal Bond
Wisconsin Municipal Bond
Taxable Fixed Income
Core Bond*
High Income Bond*
High Yield Bond
Inflation Protected Securities*
Intermediate Government Bond*
Intermediate Term Bond*
Multi-Strategy Core Bond
Preferred Securities
Short Duration Bond
Short Term Bond*
Symphony Credit Opportunities
Symphony Floating Rate Income
Total Return Bond*
Global/International
International*
International Select*
Santa Barbara Global Growth
Santa Barbara International Growth
Symphony International Equity
Tradewinds Emerging Markets
Tradewinds Global All-Cap
Tradewinds Global All-Cap Plus
Tradewinds Global Flexible Allocation
Tradewinds Global Resources
Tradewinds International Value
Tradewinds Japan
Tradewinds Small-Cap Opportunities
Value
Equity Income*
Large Cap Value*
Mid Cap Value*
Multi-Manager Large-Cap Value
NWQ Large-Cap Value
NWQ Multi-Cap Value
NWQ Small-Cap Value
NWQ Small-Mid Cap Value
Small Cap Value*
Symphony Large-Cap Value
Tradewinds Value Opportunities
Growth
Large Cap Growth Opportunities*
Mid Cap Growth Opportunities*
Santa Barbara Growth
Small Cap Growth Opportunities*
Growth (continued)
Symphony Large-Cap Growth
Winslow Large-Cap Growth
Core
Large Cap Select*
Mid Cap Select*
Santa Barbara Dividend Growth
Small Cap Select*
Symphony Mid-Cap Core
Symphony Optimized Alpha
Symphony Small-Mid Cap Core
Real Assets
Global Infrastructure*
Real Estate Securities*
Asset Allocation
Conservative Allocation
Growth Allocation
Moderate Allocation
Strategy Aggressive Growth Allocation*
Strategy Balanced Allocation*
Strategy Conservative Allocation*
Strategy Growth Allocation*
Tactical Market Opportunities*
Quantitative/Enhanced
Quantitative Enhanced Core Equity*
Index
Equity Index*
Mid Cap Index*
Small Cap Index*
*Former First American Fund.
Several additional sources of information are available to you, including the codes of ethics adopted by the funds, Nuveen Investments, Nuveen Fund Advisors and Nuveen Asset Management. The statement of additional information, incorporated by reference into this prospectus, contains detailed information on the policies and operation of the funds included in this prospectus. Additional information about the funds’ investments is available in the annual and semi-annual reports to shareholders. In the funds’ annual reports, you will find a discussion of the market conditions and investment strategies that significantly affected the funds’ performance during their last fiscal year. The funds’ most recent statement of additional information, annual and semi-annual reports and certain other information are available, free of charge, by calling Nuveen Investor Services at (800) 257-8787, on the funds’ website at www.nuveen.com, or through your financial advisor. Shareholders may call the toll free number above with any inquiries.
You may also obtain this and other fund information directly from the Securities and Exchange Commission (“SEC”). Reports and other information about the fund are available on the EDGAR Database on the SEC’s website at http://www.sec.gov or in person at the SEC’s Public Reference Room in Washington, D.C. Call the SEC at (202) 551-8090 for room hours and operation. You may also request fund information by sending an e-mail request to publicinfo@sec.gov or by writing to the SEC’s Public Reference Section at 100 F Street, NE, Washington, D.C. 20549-1520. The SEC may charge a copying fee for this information.
The funds are series of Nuveen Investment Funds, Inc., whose Investment Company Act file number is 811-05309.
Distributed by
Nuveen Securities, LLC
333 West Wacker Drive
Chicago, Illinois 60606
(800) 257-8787
www.nuveen.com
MPR-FTFI-0911P
STATEMENT OF ADDITIONAL INFORMATION
NUVEEN MISSOURI MUNICIPAL BOND FUND
Relating to the Acquisition of the Assets and Liabilities of
NUVEEN MISSOURI TAX FREE FUND
333 West Wacker Dr.
Chicago, Illinois 60606
Telephone: (312) 917-7700
This Statement of Additional Information (“SAI”) is not a prospectus but should be read in conjunction with the Proxy Statement/Prospectus dated , 2012 for use in connection with the special meeting of shareholders (the “Special Meeting”) of Nuveen Missouri Tax Free Fund (the “Acquired Fund”), a series of Nuveen Investment Funds, Inc. (the “Corporation”), to be held on February 16, 2012. At the Special Meeting, shareholders of the Acquired Fund will be asked to approve the reorganization (the “Reorganization”) of the Acquired Fund into Nuveen Missouri Municipal Bond Fund (the “Acquiring Fund”; the Acquired Fund and the Acquiring Fund are collectively referred to as the “Funds”) as described in the Proxy Statement/Prospectus. Copies of the Proxy Statement/Prospectus may be obtained at no charge by writing to the Trust at the address shown above or by calling (800) 257-8787.
Further information about the Funds is contained in the Acquired Fund’s Statement of Additional Information dated September 30, 2011, as supplemented through the date of this SAI, and the Acquiring Fund’s Statement of Additional Information dated September 30, 2011, as supplemented through the date of this SAI, each of which is incorporated herein by reference only insofar as it relates to the Acquired Fund or Acquiring Fund, respectively. No other parts are incorporated by reference herein.
The unaudited pro forma financial information, attached hereto as Appendix A, is intended to present the financial condition and related results of operations of the Acquiring Fund as if the Reorganization had been consummated on May 31, 2011.
The audited financial statements and related independent registered public accounting firm’s report for the Acquired Fund are contained in the Fund’s Annual Report for the fiscal year ended May 31, 2011 and are incorporated herein by reference only insofar as they relate to the Fund. No other parts of the Annual Report are incorporated by reference herein.
The audited financial statements and related independent registered public accounting firm’s report for the Acquiring Fund are contained in the Fund’s Annual Report for the fiscal year ended May 31, 2011 and are incorporated herein by reference only insofar as they relate to the Fund. No other parts of the Annual Report are incorporated by reference herein.
The date of this Statement of Additional Information is , 2012.
1
Appendix A
Pro Forma Financial Information
The unaudited pro forma financial information set forth below is for informational purposes only and does not purport to be indicative of the financial condition that actually would have resulted if the Reorganization had been consummated. These pro forma numbers have been estimated in good faith based on information regarding the Acquired Fund and Acquiring Fund as of May 31, 2011, using the fees and expenses information shown in the Proxy Statement/Prospectus. The unaudited pro forma financial information should be read in conjunction with the historical financial statements of the Acquired Fund and Acquiring Fund, which are available in their respective annual shareholder reports.
Narrative Description of the Pro Forma Effects of the Reorganization
Note 1 — Reorganization
The unaudited pro forma information has been prepared to give effect to the proposed reorganization of the Acquired Fund into the Acquiring Fund pursuant to an Agreement and Plan of Reorganization (the “Plan”) as if the Reorganization occurred on May 31, 2011.
Acquired Fund | Acquiring Fund | |
| Nuveen Missouri Tax Free Fund | Nuveen Missouri Municipal Bond Fund |
Note 2 — Basis of Pro Forma
The Reorganization will be accounted for as a tax-free reorganization for federal income tax purposes; therefore, no gain or loss will be recognized by the Acquiring Fund or its shareholders as a direct result of the Reorganization. The Acquired Fund and the Acquiring Fund are both registered open-end management investment companies. The Reorganization would be accomplished by the acquisition of all of the assets and the assumption of all of the liabilities of the Acquired Fund by the Acquiring Fund in exchange for shares of the Acquiring Fund and the distribution of such shares to Acquired Fund shareholders in complete liquidation of the Acquired Fund. The pro forma financial information has been adjusted to reflect the assumption that the Acquired Fund distributes its undistributed net investment income of $318,138 and accumulated net realized gains of $83,339 to its shareholders prior to the Reorganization. The table below shows the class and shares that Acquired Fund shareholders would have received if the Reorganization were to have taken place on the period ended date in Note 1.
Acquired Fund Share Class | Acquiring Fund Shares Issued | Acquiring Fund Share Class | ||
Class A | 2,139,993 | Class A | ||
Class C1 | 154,860 | Class A | ||
Class I | 12,554,968 | Class I |
Under accounting principles generally accepted in the United States of America, the historical cost of investment securities will be carried forward to the surviving entity, the Acquiring Fund, and the results of operations of the Acquiring Fund for pre-reorganization periods will not be restated.
A-1
Fund | Net Assets | As-of Date | ||||||
Nuveen Missouri Tax Free Fund (Acquired Fund) | $ | 159,222,189 | May 31, 2011 | |||||
Nuveen Missouri Municipal Bond Fund (Acquiring Fund) | $ | 227,033,348 | May 31, 2011 | |||||
Nuveen Missouri Municipal Bond Fund (Pro Forma Combined Fund) | $ | 385,830,060 | May 31, 2011 | |||||
Note 3 — Pro Forma Expense Adjustments
The table below reflects adjustments to annual expenses made to the Pro Forma Combined Fund financial information as if the Reorganization had taken place on the first day of the period as disclosed in Note 1 using the fees and expenses information shown in the Proxy Statement/Prospectus. The pro forma information has been derived from the books and records used in calculating daily net asset values of the Acquired Fund and Acquiring Fund and has been prepared in accordance with accounting principles generally accepted in the United States of America which require management to make estimates and assumptions that affect this information. Percentages presented below are the increase (decrease) in expenses divided by the Pro Forma Combined Fund net assets presented in Note 2. Actual results could differ from those estimates.
| Increase (Decrease) | ||||||||
Expense Category | Dollar Amount | Percentage | ||||||
Management fees1 | $ | (190,366 | ) | (0.05%) | ||||
Shareholders’ reports – printing and mailing expenses2 | $ | (24,374 | ) | (0.01%) | ||||
Professional fees2 | $ | (19,090 | ) | (0.00%) | 3 | |||
Custodian’s fees and expenses2 | $ | (15,794 | ) | (0.00%) | 3 | |||
Federal and state registration fees2 | $ | (1,833 | ) | (0.00%) | 3 | |||
| (1) | Reflects the impact of applying the Acquiring Fund’s fund-level management fee rates following the Reorganization to the combined fund’s average net assets. |
| (2) | Reflects the anticipated reduction of certain duplicative expenses eliminated as a result of the Reorganization. |
| (3) | Rounds to less than (0.01%). |
As a result of the anticipated decrease in expenses presented above, Nuveen Fund Advisors, Inc. (“Nuveen Fund Advisors”) anticipates a corresponding decrease in the required fee waiver and/or expense reimbursement of $79,865.
No significant accounting policies will change as a result of the Reorganization, specifically policies regarding security valuation or compliance with Subchapter M of the Code.
Note 4 — Reorganization Costs
Nuveen Fund Advisors estimates that expenses for the Reorganization will be approximately $126,000. The Acquired Fund is expected to be charged an estimated $102,000 in Reorganization costs. These costs represent the estimated nonrecurring expenses of the Acquired Fund carrying out its obligations under the Plan and consist of management’s estimate of professional services fees, printing costs and mailing charges related to the proposed Reorganization to be borne by the Acquired Fund. The Acquiring Fund is expected to be charged approximately $24,000 of expenses in connection with the Reorganization. To the extent that payment of these costs would cause the Acquired Fund to exceed its expense cap, Nuveen will reimburse the portion of the expenses necessary for the Fund to operate
A-2
within the cap. Based on current expense levels, it is anticipated that Nuveen will reimburse all expenses charged to the Acquired Fund and none of the expenses charged to the Acquiring Fund. The pro forma financial information included in Note 2 has been adjusted for any costs related to the Reorganization to be borne by the Funds. Nuveen will absorb any costs in excess of the estimated Reorganization costs. Nuveen will bear 100% of these costs and expenses if the Reorganization is not consummated.
If the Reorganization had occurred as of May 31, 2011, the Acquiring Fund would not have been required to dispose of securities of the Acquired Fund in order to comply with its investment policies and restrictions, and would have not sold any material portion of the securities in the Acquired Fund’s portfolio solely as a result of the Reorganization.
Note 5 — Accounting Survivor
The Acquiring Fund will be the accounting survivor. The surviving fund will have the portfolio management team, portfolio composition, strategies, investment objective, expense structure and policies/restrictions of the Acquiring Fund.
Note 6 — Capital Loss Carryforward
At May 31, 2011, the Acquired Fund did not have capital loss carryforwards. At May 31, 2011, the Acquiring Fund had capital loss carryforwards of approximately $1.3 million. For additional information regarding capital loss carryforward limitations, please see the section entitled “The Proposed Reorganization—Material Federal Income Tax Consequences” in the Proxy Statement/Prospectus.
A-3
September 30, 2011,
Nuveen Kansas Municipal Bond Fund
Ticker Symbols: Class A—FKSTX, Class B—FBKSX, Class C—FCKSX, Class I—FRKSX
Nuveen Kentucky Municipal Bond Fund
Ticker Symbols: Class A—FKYTX, Class B—FKYBX, Class C—FKYCX, Class I—FKYRX
Nuveen Michigan Municipal Bond Fund
Ticker Symbols: Class A—FMITX, Class B—FMIBX, Class C—FLMCX, Class I—NMMIX
Nuveen Missouri Municipal Bond Fund
Ticker Symbols: Class A—FMOTX, Class B—FMMBX, Class C—FMOCX, Class I—FMMRX
Nuveen Ohio Municipal Bond Fund
Ticker Symbols: Class A—FOHTX, Class B—FOHBX, Class C—FOHCX, Class I—NXOHX
Nuveen Wisconsin Municipal Bond Fund
Ticker Symbols: Class A—FWIAX, Class B—FWIBX, Class C—FWICX, Class I—FWIRX
STATEMENT OF ADDITIONAL INFORMATION
This Statement of Additional Information is not a prospectus. This Statement of Additional Information relates to, and should be read in conjunction with, the Prospectus for Nuveen Kansas Municipal Bond Fund, Nuveen Kentucky Municipal Bond Fund, Nuveen Michigan Municipal Bond Fund, Nuveen Missouri Municipal Bond Fund, Nuveen Ohio Municipal Bond Fund and Nuveen Wisconsin Municipal Bond Fund, (each individually a “Fund,” and collectively the “Funds”), each a series of Nuveen Multistate Trust IV, dated September 30, 2011. A Prospectus may be obtained without charge from certain securities representatives, banks and other financial institutions that have entered into sales agreements with Nuveen Securities, LLC (the “Distributor”), or from a Fund, by written request to the applicable Fund, c/o Nuveen Investor Services, P.O. Box 8530, Boston, Massachusetts 02266-8530, or by calling (800) 257-8787.
The audited financial statements for each Fund’s most recent fiscal year appear in the Fund’s Annual Report dated May 31, 2011; each is incorporated herein by reference and is available without charge by calling (800) 257-8787.
| Page | ||
| S-2 | ||
| S-2 | ||
| S-4 | ||
| S-14 | ||
| S-40 | ||
| S-45 | ||
| S-46 | ||
| S-46 | ||
| S-53 | ||
| S-66 | ||
| S-68 | ||
Independent Registered Public Accounting Firm, Custodian and Transfer Agent | S-70 | |
| S-70 | ||
| S-70 | ||
| A-1 | ||
Appendix B—Description of Derivatives and Hedging Techniques | B-1 | |
The Funds, except Nuveen Kansas Municipal Bond Fund and Nuveen Wisconsin Municipal Bond Fund, are diversified series of Nuveen Multistate Trust IV, formerly Nuveen Flagship Multistate Trust IV (the “Trust”), an open-end investment company organized as a Massachusetts business trust on July 1, 1996. Nuveen Kansas Municipal Bond Fund was formerly named Nuveen Flagship Kansas Municipal Bond Fund and Flagship Kansas Triple Tax Exempt Fund, a series of Flagship Tax Exempt Funds Trust. Nuveen Kentucky Municipal Bond Fund was formerly named Nuveen Flagship Kentucky Municipal Bond Fund and Flagship Kentucky Triple Tax Exempt Fund, a series of Flagship Tax Exempt Funds Trust. Nuveen Michigan Municipal Bond Fund was formerly named Nuveen Flagship Michigan Municipal Bond Fund and Flagship Michigan Triple Tax Exempt Fund, a series of Flagship Tax Exempt Funds Trust. Nuveen Missouri Municipal Bond Fund was formerly named Nuveen Flagship Missouri Municipal Bond Fund and Flagship Missouri Double Tax Exempt Fund, a series of Flagship Tax Exempt Funds Trust. Nuveen Ohio Municipal Bond Fund was formerly named Nuveen Flagship Ohio Municipal Bond Fund and Flagship Ohio Double Tax Exempt Fund, a series of Flagship Tax Exempt Funds Trust. Nuveen Wisconsin Municipal Bond Fund was formerly named Nuveen Flagship Wisconsin Municipal Bond Fund and Flagship Wisconsin Double Tax Exempt Fund, a series of Flagship Tax Exempt Funds Trust. The Funds’ investment adviser is Nuveen Fund Advisors, Inc. (“Nuveen Fund Advisors” or the “Adviser”). The Funds’ sub-adviser is Nuveen Asset Management, LLC (“Nuveen Asset Management”).
Certain matters under the Investment Company Act of 1940, as amended (the “1940 Act”), which must be submitted to a vote of the holders of the outstanding voting securities of a series, shall not be deemed to have been effectively acted upon unless approved by the holders of a majority of the outstanding voting shares of each series affected by such matter.
The investment objective and certain fundamental investment policies of each Fund are described in the Prospectus for that Fund. A Fund, as a fundamental policy, may not, without the approval of the holders of a majority of the Fund’s outstanding voting shares:
(1) Invest in securities other than Municipal Obligations and short-term securities, as described in the Prospectus, except each Fund may invest up to 5% of its assets in tax-exempt or taxable fixed-income or equity securities for the purpose of acquiring control of an issuer whose municipal bonds (a) the Fund already owns and (b) have deteriorated or are expected shortly to deteriorate significantly in credit quality, provided Nuveen Asset Management, each Fund’s sub-adviser, determines such investment should enable the Fund to better maximize its existing investment in such issuer. Municipal Obligations are municipal bonds that pay interest that is exempt from regular federal, state and, in some cases, local income taxes.
(2) Invest more than 5% of its total assets in securities of any one issuer, except this limitation shall not apply to securities of the U.S. Government, and to the investment of 25% of such Fund’s assets. This limitation shall not apply to the Nuveen Kansas Municipal Bond Fund and the Nuveen Wisconsin Municipal Bond Fund.
(3) Borrow money except as permitted by the 1940 Act and exemptive orders granted thereunder.
(4) Pledge, mortgage or hypothecate its assets, except that, to secure borrowings permitted by subparagraph (3) above, it may pledge securities having a market value at the time of pledge not exceeding 10% of the value of the Fund’s total assets.
(5) Issue senior securities as defined in the 1940 Act, except to the extent such issuance might be involved with respect to borrowings described under item (3) above or with respect to transactions involving futures contracts or the writing of options within the limits described in the Prospectus and this Statement of Additional Information.
(6) Underwrite any issue of securities, except to the extent that the purchase or sale of Municipal Obligations in accordance with its investment objective, policies and limitations may be deemed to be an underwriting.
S-2
(7) Purchase or sell real estate, but this shall not prevent any Fund from investing in Municipal Obligations secured by real estate or interests therein or foreclosing upon and selling such security.
(8) Purchase or sell commodities or commodities contracts or oil, gas or other mineral exploration or development programs, except for transactions involving futures contracts within the limits described in the Prospectus and this Statement of Additional Information.
(9) Make loans except as permitted by the 1940 Act and exemptive orders granted thereunder.
(10) Make short sales of securities or purchase any securities on margin, except for such short-term credits as are necessary for the clearance of transactions.
(11) Write or purchase put or call options, except to the extent that the purchase of a stand-by commitment may be considered the purchase of a put, and except for transactions involving options within the limits described in the Prospectus and this Statement of Additional Information.
(12) Invest more than 25% of its total assets in securities of issuers in any one industry; provided, however, that such limitations shall not be applicable to Municipal Obligations issued by governments or political subdivisions of governments, and obligations issued or guaranteed by the U.S. Government, its agencies or instrumentalities.
(13) Purchase or retain the securities of any issuer other than the securities of the Fund if, to the Fund’s knowledge, those trustees of the Trust, or those officers and directors of the Adviser who individually own beneficially more than 1/2 of 1% of the outstanding securities of such issuer, together own beneficially more than 5% of such outstanding securities.
For the purpose of applying the limitations set forth in paragraphs (2) and (12) above, an issuer shall be deemed the sole issuer of a security when its assets and revenues are separate from other governmental entities and its securities are backed only by its assets and revenues. Similarly, in the case of a non-governmental user, such as an industrial corporation or a privately owned or operated hospital, if the security is backed only by the assets and revenues of the non-governmental user, then such non-governmental user would be deemed to be the sole issuer. Where a security is also backed by the enforceable obligation of a superior or unrelated governmental entity or other entity (other than a bond insurer), it shall also be included in the computation of securities owned that are issued by such governmental or other entity.
Where a security is guaranteed by a governmental entity or some other facility, such as a bank guarantee or letter of credit, such a guarantee or letter of credit would be considered a separate security and would be treated as an issue of such government, other entity or bank.
The foregoing restrictions and limitations, as well as a Fund’s policies as to ratings of portfolio investments, will apply only at the time of purchase of securities, and the percentage limitations will not be considered violated unless an excess or deficiency occurs or exists immediately after and as a result of an acquisition of securities, unless otherwise indicated.
Except with respect to paragraph (3) above, the foregoing fundamental investment policies, together with the investment objective of each of the Funds and certain other policies specifically identified in the Prospectus, cannot be changed without approval by holders of a “majority of the Fund’s outstanding voting shares.” As defined in the 1940 Act, this means the vote of (i) 67% or more of the Fund’s shares present at a meeting, if the holders of more than 50% of the Fund’s shares are present or represented by proxy, or (ii) more than 50% of the Fund’s shares, whichever is less.
In addition to the foregoing fundamental investment policies, each Fund is also subject to the following non-fundamental restrictions and policies, which may be changed by the Board of Trustees. A Fund may not:
(1) Invest more than 15% of its net assets in “illiquid” securities, including repurchase agreements maturing in more than seven days.
(2) Invest more than 15% of its net assets in inverse floating rate securities.
S-3
(3) Purchase securities when borrowings exceed 5% of its total assets. If due to market fluctuations or other reasons, the value of the Fund’s assets falls below 300% of its borrowings, the Fund will reduce its borrowings within 3 business days.
Under normal market conditions, Nuveen Kansas Municipal Bond Fund invests at least 80% of its net assets in municipal bonds that pay interest that is exempt from regular federal and Kansas personal income tax. Under normal market conditions, Nuveen Kentucky Municipal Bond Fund invests at least 80% of its net assets in municipal bonds that pay interest that is exempt from regular federal and Kentucky personal income tax. Under normal market conditions, Nuveen Michigan Municipal Bond Fund invests at least 80% of its net assets in municipal bonds that pay interest that is exempt from regular federal and Michigan personal income tax. Under normal market conditions, Nuveen Missouri Municipal Bond Fund invests at least 80% of its net assets in municipal bonds that pay interest that is exempt from regular federal and Missouri personal income tax. Under normal market conditions, Nuveen Ohio Municipal Bond Fund invests at least 80% of its net assets in municipal bonds that pay interest that is exempt from regular federal and Ohio personal income tax. Under normal market conditions, Nuveen Wisconsin Municipal Bond Fund invests at least 80% of its net assets in municipal bonds that pay interest that is exempt from regular federal and Wisconsin personal income tax. A policy has been adopted by each Fund to provide shareholders with at least 60 days’ notice in the event of a planned change to this investment strategy. Such notice to shareholders will meet the requirements of Rule 35d-1(c) of the 1940 Act.
INVESTMENT POLICIES AND TECHNIQUES
The following information supplements the discussion of the Funds’ investment objectives, policies and techniques that appears in the Prospectus for the Funds.
Portfolio Securities
As described in the Prospectus, under normal market conditions each Fund invests at least 80% of its net assets in a portfolio of Municipal Obligations free from regular federal, state and, in some cases, local income tax in each Fund’s respective state or U.S. territories (such as Puerto Rico and Guam). Which generally will be Municipal Obligations issued within the Fund’s respective state. In general, Municipal Obligations include debt obligations issued by states, cities and local authorities to obtain funds for various public purposes, including construction of a wide range of public facilities such as airports, bridges, highways, hospitals, housing, mass transportation, schools, streets and water and sewer works. Industrial development bonds and pollution control bonds that are issued by or on behalf of public authorities to finance various privately-rated facilities are included within the term Municipal Obligations if the interest paid thereon is exempt from federal income tax. For diversification purposes or when after-tax yields merit, each Fund may invest up to 20% of its net assets in Municipal Obligations that are not exempt from state or local tax.
Under normal market conditions, each Fund invests at least 80% of its net assets in Municipal Obligations rated BBB/Baa or higher at the time of purchase by Moody’s Investors Service, Inc. (“Moody’s”), Standard & Poor’s Corporation (“S&P”) or Fitch, Inc. (“Fitch”), or, if unrated, judged by Nuveen Asset Management to be of comparable quality. Each Fund may invest up to 20% of its net assets in Municipal Obligations rated below BBB/Baa by Moody’s, S&P or Fitch. See Appendix A for more information about ratings by Moody’s, S&P, and Fitch.
As described in the Prospectus, each Fund may invest in Municipal Obligations that constitute participations in a lease obligation or installment purchase contract obligation (hereafter collectively called “lease obligations”) of a municipal authority or entity. Although lease obligations do not constitute general obligations of the municipality for which the municipality’s taxing power is pledged, a lease obligation is ordinarily backed by the municipality’s covenant to budget for, appropriate and make the payments due under the lease obligation. However, certain lease obligations contain “non-appropriation” clauses, which provide that the municipality has no obligation to make lease or installment purchase payments in future years unless money is appropriated for such purpose on a yearly basis. Although non-appropriation lease obligations are secured by the leased property, disposition of the property in the event of foreclosure might prove difficult. In evaluating securities for purchase, a Fund will take into account the incentive of the issuer to appropriate under the lease,
S-4
among other factors. Some lease obligations may be illiquid under certain circumstances. Lease obligations normally provide a premium interest rate which along with regular amortization of the principal may make them attractive for a portion of the assets of the Funds.
Obligations of issuers of Municipal Obligations are subject to the provisions of bankruptcy, insolvency and other laws affecting the rights and remedies of creditors. In addition, the obligations of such issuers may become subject to the laws enacted in the future by Congress, state legislatures or referenda extending the time for payment of principal and/or interest, or imposing other constraints upon enforcement of such obligations or upon municipalities to levy taxes. There is also the possibility that, as a result of legislation or other conditions, the power or ability of any issuer to pay, when due, the principal of and interest on its Municipal Obligations may be materially affected.
Investments in Inverse Floating Rate Securities
The Funds may invest in inverse floating rate municipal securities or “inverse floaters,” whose rates vary inversely to interest rates on a specified short-term municipal bond index or on another instrument. Such securities involve special risks as compared to conventional fixed-rate bonds. Should short-term interest rates rise, a Fund’s investment in inverse floaters likely would adversely affect the Fund’s earnings and distributions to shareholders. Also, because changes in the interest rate on the other index or other instrument inversely affect the rate of interest received on an inverse floater, and because inverse floaters essentially represent a leveraged investment in a long-term bond, the value of an inverse floater is generally more volatile than that of a conventional fixed-rate bond having similar credit quality, redemption provisions and maturity. Although volatile in value, inverse floaters typically offer the potential for yields substantially exceeding the yields available on conventional fixed-rate bonds with comparable credit quality, coupon, call provisions and maturity. The markets for inverse floating rate securities may be less developed and have less liquidity than the markets for conventional securities. The Funds will only invest in inverse floating rate securities whose underlying bonds are rated A or higher.
Portfolio Trading and Turnover
The Funds will make changes in their investment portfolio from time to time in order to take advantage of opportunities in the municipal market and to limit exposure to market risk. The Funds may also engage to a limited extent in short-term trading consistent with their investment objective. Securities may be sold in anticipation of market decline or purchased in anticipation of market rise and later sold. In addition, a security may be sold and another of comparable quality purchased at approximately the same time to take advantage of what Nuveen Asset Management believes to be a temporary disparity in the normal yield relationship between the two securities. Each Fund may make changes in its investment portfolio in order to limit its exposure to changing market conditions. Changes in a Fund’s investments are known as “portfolio turnover.”
The portfolio turnover rates for the 2010 and 2011 fiscal year-ends of the Funds were:
| Fiscal Year | ||||||||
| 2010 | 2011 | |||||||
Nuveen Kansas Municipal Bond Fund | 18 | % | 16 | % | ||||
Nuveen Kentucky Municipal Bond Fund | 9 | 7 | ||||||
Nuveen Michigan Municipal Bond Fund | 11 | 6 | ||||||
Nuveen Missouri Municipal Bond Fund | 6 | 6 | ||||||
Nuveen Ohio Municipal Bond Fund | 10 | 10 | ||||||
Nuveen Wisconsin Municipal Bond Fund | 6 | 14 | ||||||
When-Issued or Delayed-Delivery Securities
Each Fund may purchase and sell Municipal Obligations on a when-issued or delayed-delivery basis. When-issued and delayed-delivery transactions arise when securities are purchased or sold with payment and delivery beyond the regular settlement date. (When-issued transactions normally settle
S-5
within 15-45 days.) On such transactions the payment obligation and the interest rate are fixed at the time the buyer enters into the commitment. The commitment to purchase securities on a when-issued or delayed-delivery basis may involve an element of risk because the value of the securities is subject to market fluctuation, no interest accrues to the purchaser prior to settlement of the transaction, and at the time of delivery the market value may be less than cost. At the time a Fund makes the commitment to purchase a Municipal Obligation on a when-issued or delayed-delivery basis, it will record the transaction and reflect the amount due and the value of the security in determining its net asset value. Likewise, at the time a Fund makes the commitment to sell a Municipal Obligation on a delayed-delivery basis, it will record the transaction and include the proceeds to be received in determining its net asset value; accordingly, any fluctuations in the value of the Municipal Obligation sold pursuant to a delayed-delivery commitment are ignored in calculating net asset value so long as the commitment remains in effect. The Funds will maintain designated readily marketable assets at least equal in value to commitments to purchase when-issued or delayed-delivery securities, such assets to be designated or segregated by the custodian specifically for the settlement of such commitments, if necessary. The Funds will only make commitments to purchase Municipal Obligations on a when-issued or delayed-delivery basis with the intention of actually acquiring the securities, but the Funds reserve the right to sell these securities before the settlement date if it is deemed advisable. If a when-issued security is sold before delivery any gain or loss would not be tax-exempt. The Funds commonly engage in when-issued transactions in order to purchase or sell newly-issued Municipal Obligations, and may engage in delayed-delivery transactions in order to manage its operations more effectively.
Each Fund also may buy when-issued and delayed-delivery securities that settle more than 60 days after purchase. These transactions are called “forwards.” Municipal “forwards” pay higher interest after settlement than standard bonds, to compensate the buyer for bearing market risk and deferring income during the settlement period, and can often be bought at attractive prices and yields. If a Fund knows that a portfolio bond will, or is likely to, be called or mature on a specific future date, the Fund may buy forwards settling on or about that date to replace the called or maturing bond and “lock in” a currently attractive interest rate.
Zero Coupon Bonds
The Funds may invest in zero coupon bonds. Zero coupon bonds make no periodic interest payments, but are sold at a deep discount from their face value. The buyer recognizes a rate of return determined by the gradual appreciation of the security, which is redeemed at face value on a specified maturity date. The discount varies depending on the time remaining until maturity, market interest rates, and the issuer’s perceived credit quality. The discount, in the absence of financial difficulties of the issuer, typically decreases as the final maturity date approaches. If the issuer defaults, a Fund may not receive any return on its investment. Because zero coupon securities pay no coupon interest, their value is generally more volatile when interest rates change than the value of bonds of the same maturity that pay coupon interest.
Special Considerations Relating to Municipal Obligations of Designated States
Except as described in the Prospectus, each of the Funds invests at least 80% of its net assets in Municipal Obligations that are exempt from both regular federal and state income taxes, a significant portion of which generally consists of Municipal Obligations issued in its respective state. Each Fund is therefore more susceptible to political, economic or regulatory factors adversely affecting issuers of Municipal Obligations in its state. Set forth below is a summary of information that bears upon the risk of investing in Municipal Obligations issued by public authorities in the states of currently offered Funds. This information was obtained from official statements of issuers located in the respective states as well as from other publicly available official documents and statements. The Funds have not independently verified any of the information contained in such statements and documents. The information in the Prospectus and set forth below is intended only as a general summary and is not intended as a discussion of any specific factor that may affect any particular obligation or issuer.
Factors Pertaining to Kansas. The Kansas economy has stabilized and the state’s recovery is expected to accelerate in the second half of the year, though a lack of payroll expansion may continue to hinder growth. Economists expect the manufacturing sector, and machinery manufacturing in particular, to drive the state’s continued recovery in 2011. Most of the state’s manufacturing base is
S-6
centered on the economically sensitive aerospace industry which experienced significant lay-offs due to cancellations and delays in orders for new aircrafts over the economic downturn. New orders have increased modestly in recent months, but not enough to stimulate new hiring. Farm incomes in 2011 are expected to be negatively affected by the largest drought in decades in western Kansas. The state’s unemployment rate peaked at 7.6% in July 2009. Since then unemployment has fallen to 6.7% (August 2011), compared to a national rate of 9.1% for the same time period. Although the unemployment rate has been fairly stable over the past year, recent improvements are attributed to a decline in the labor force rather than a meaningful improvement in hiring.
The state’s General Fund balance peaked in FY 2007 at $820 million, a reasonable 12.8% of General Fund revenues. Revenue declines between 2008 and 2010 not paired with similar declines in spending resulted in a complete depletion of reserves. The State ended fiscal 2010 with a deficit General Fund balance of $248.3 million, or a negative 4.5% of General Fund revenues. Income and sales tax revenues performing below budget accounted for the continued decline. In FY 2010 income tax revenues were down 9.8% and sales taxes fell 5.1% from the prior year. As part of the fiscal 2011 budget Kansas adopted a temporary 3-year, 1% increase in the state sales tax rate. The increase brought in an additional $395 million for the fiscal year and helped the state achieve the first positive revenue growth in several years.
Overcoming an initial budget gap of $500 million due to statutory increases in pension contributions, replacement of federal stimulus dollars and increasing human services costs, Kansas has adopted a $13.8 billion budget for fiscal 2012. The $13.8 billion, all funds, budget is down from $14.8 billion in FY 2011. The General Fund is budgeted to increase by $346 million, or 6% to $6.07 billion. Governor Sam Brownback’s proposed budget eliminated eight state agencies and cut over 2,000 vacant positions. Significant cuts in education and social services helped close the projected deficit. Spending cuts included a $100 million drop in education spending for K-12 and an $11 million reduction in higher education funding.
The state has a statutory reserve requirement that requires the annual budget to restore reserve levels to 7.5% of budgeted expenditures. Unfortunately, the state has suspended this requirement annually since 2002 and will do so again in the upcoming fiscal year. However the adopted 2012 budget will begin to rebuild reserves as a $50 million surplus is budgeted.
Though debt levels have increased due to the issuance of pension obligation bonds as well as highway bonds to finance capital transportation projects, the state’s debt burden is moderate in relation to the state’s economic base. Despite the significant increase in debt, Kansas ranks 19th among states in net tax-supported debt per capita, and 28th in total dollar amount of net tax-supported debt outstanding, per Moody’s state debt medians.
Property taxes are a significant source of revenue for many local governments, and declines in property values caused by the housing slump may negatively impact these tax revenues. The state and its various subdivisions may also face increasing financial pressure from costs relating to pensions and other post-employment benefits. Favorably recently enacted measures requiring higher contribution rates from employees and the state should reduce unfunded liability of the state’s largest pension fund.
Factors Pertaining to Kentucky. Kentucky lags the nation in key measures such as total employment, population, and personal income growth. State per capita income is 82% of the national average, ranking Kentucky 46th in the nation. Although Kentucky felt the impact of the recent recession, it did so later than most states in part because it was not hit by the housing downturn. Kentucky is more concentrated in manufacturing, which has rebounded nicely and will remain the foundation of the Commonwealth’s recovery over the next year. Kentucky is also an energy-producing state and ranks third in the nation in terms of coal production. Coal severance taxes are currently a noted driver of the state’s positive revenue trend. The unemployment rate continues to track slightly higher at 9.5% in July 2011 than the national average of 9.1%, but has fallen from a peak of 11.1% in August 2009.
Reliance on reserves over the last biennium left the Commonwealth with a general fund balance of just 1% at the close of fiscal 2010 and limited financial flexibility. The legislature required a special session to adopt the Commonwealth’s 2011-2012 biennial budget. The $18 billion spending plan
S-7
relies on cuts across state agencies of 3.5% in fiscal 2011 and 4.5% in fiscal 2012, one-time savings from debt restructuring, and assumes receipt of federal stimulus funds of $811 million in 2011. The plan also requires the Governor to identify additional expenditure cuts that will be partially addressed through planned furlough days for state workers.
Kentucky’s retirement systems are underfunded by about 55%. The unfunded pension liability and Other Post Employment Benefit liability together total approximately $25.5 billion. Funded levels have been steadily decreasing as a result of the Commonwealth’s failure to make the full annual required contribution (ARC) to its pensions over the past several years. In 2010, the state only contributed about half of the ARC payments actuarially determined for that year.
Debt levels are moderately high in relation to the Commonwealth’s economic base. Net tax-supported debt per capita is above average at $1,685 and 5.4% of personal income, above the Moody’s medians of $936 and 2.5%, respectively. These debt levels rank Kentucky 13th among states in net tax-supported debt per capita for 2010.
Property taxes are a significant source of revenue for many local governments, and declines in property values caused by the housing slump may negatively impact these tax revenues. The State and its various subdivisions may also face increasing financial pressure from costs relating to pensions and other post-employment benefits.
Factors Pertaining to Michigan. Michigan’s economy is highly dependent on manufacturing, with 12.3% of employment in manufacturing as compared to the national average of 8.9% as of 2010. General Motors Corporation, Ford Motor Company, and Chrysler Group comprise 3 of the top 5 employers in the State. Demographic trends remain weak with per capita income at 88% of the national average based on 2010 estimates. State population continues to contract suggesting lower demand for housing and smaller consumer spending growth. Michigan was the only state to lose population in the 2010 census, losing 0.6% of its population between 2000 and 2010.
Michigan’s economic recovery is still fragile, but the outlook for the state’s economy is improving. Even after a decade of manufacturing job losses the state’s labor composition is still heavily weighted toward manufacturing. Michigan has made efforts to attract employers and transfer automotive expertise into other industries, but layoffs in the auto and related industries have left the state in a weakened financially. Economists project the state will add 60,000 manufacturing jobs between 2009 and 2015, offsetting the approximately 550,000 jobs lost since 2000. Favorably the auto industry appears to have stabilized in 2010, portending well for the state in 2011. The state’s unemployment rate has improved, but is still higher than the national average. In August 2011 unemployment fell to 11.2%, down from a high of 14% in July 2009. In comparison the U.S. unemployment rate in August was 9.1%.
Despite being severely affected by the recession, the state has managed to maintain fairly stable, though slim, reserve levels throughout the last few years. At the close of fiscal 2010 the general fund balance stood at $1.0 billion, or 3.6% of general fund revenues, down from $1.5 billion (6.3% of revenues) in FY 2006 due to its conservative budget management practices. Favorably, Michigan maintains conservative forecasts for future revenues and budgets accordingly. Tight budgetary control has enabled the State to weather its economic sluggishness without spending down its minimal reserves. Although the FY 2011 budget relied on non-recurring revenues, the year was expected to end with balanced operations. The state also maintains a small, $2.2 million budget stabilization fund.
Due to the absence of federal stimulus money and escalating Medicaid costs the structural budget gap for FY 2012 was over $1.5 billion. Positively the shortfall was closed requiring significant expenditure cuts, including reductions in funding for healthcare, human services, local schools, higher education, corrections, employee concessions and local government revenue sharing. Property taxes are a significant source of revenue for many local governments, and declines in property values caused by the housing slump may negatively impact these tax revenues. The State and its various subdivisions may also face increasing financial pressure from costs relating to pensions and other post-employment benefits.
Factors Pertaining to Missouri. Missouri’s economic recovery is gaining momentum as job growth in manufacturing and services have seen a steady improvement. Missouri’s economy has fared slightly
S-8
better than the nation as a whole recently. Unemployment in Missouri was 9.0% as of June 2011, as compared to the national average of 9.3% during the same period. The State enjoys a diversified economy in part because of its location as the geographic center of the United States. Missouri’s economy is largely centered on manufacturing and due to this industrial composition, new job prospects are limited and therefore control in-migration. Manufacturing has held up relatively well despite weakened consumer demand and supply chain disruptions from the Japanese earthquake. In order for Missouri’s economy to grow in the long term, a successful transition away from traditional manufacturing into biotechnology and alternative energy is imperative. Missouri’s economy in the long-term is expected to track closely to the national economy.
Missouri’s debt levels are considered below average. According to Moody’s 2011 State Debt Medians, Missouri’s debt burden ranked 35th in the nation on a debt per capita basis and 35th on a personal income basis. Demographic trends are below average with slow population growth, weak migration and below average wealth levels, which could negatively affect the State’s economy in the long run.
The Fiscal Year 2012 enacted budget totals $23.2 billion in overall spending, which is essentially the same size as the Fiscal Year 2011 budget. The General Fund Spending is essentially held flat at $7.9 billion. The budget was balanced in part through spending cuts for colleges and universities, the use of remaining unspent federal stimulus funds but spared K-12 education. The budget includes no tax increases and maintains the 3% appropriations in the Reserve. Additionally, the state kept intact its constitutionally mandated rainy day fund at 7.5% of the previous year’s net general revenue collections.
Property taxes are a significant source of revenue for many local governments, and declines in property values caused by the housing slump may negatively impact these tax revenues. The State and its various subdivisions may also face increasing financial pressure from costs relating to pensions and other post employment benefits.
Factors Pertaining to Ohio. Ohio’s recession was earlier and deeper than the nation’s in part due to weakness in its manufacturing base. Manufacturing accounts for 12.3% of employment in the State as compared to the national average of 8.9% as of 2010. State unemployment rates remain high, most recently at 9.2% in July 2011, just above the national mark of 9.1%. Demographic trends remain weak and socioeconomic indicators are below average.
The State’s 2012-2013 biennial General Fund budget totals $55.77 billion—$27.07 billion for fiscal year 2012, up 3.12 over FY2011, and $28.7 billion for fiscal year 2013, up 6.09% over 2012. The new budget included a rebalancing of spending priorities and reforms of programs, including Medicaid, in order to balance the budget. For example, approximately two thirds of state agencies saw reduced appropriations in the current biennium and aid to local governments and educational institutions was reduced. Also, as in prior years, non-recurring revenue sources such as debt restructuring were also part of the budget balancing effort.
While local governments will be impacted by state aid cuts, most local governments in Ohio are not predominately reliant upon state funding for their own budgets. The primary General Fund revenue sources for most Ohio cities, counties and schools are income taxes, sales taxes and property taxes, respectively. While state aid cuts will place further strain on local governments’ budgets over the biennium, it doesn’t impact their primary revenue sources.
Factors Pertaining to Wisconsin. Wisconsin’s economic recovery is underway led by employment growth in manufacturing, which is responsible for half of all jobs created in the state since the downturn. Manufacturing accounts for 15.8% of employment in the State as compared to the national average of 8.9% in 2010. Metal and machinery manufacturing have been the strongest sectors, helping to drive down the state’s unemployment rate to 7.9% in August 2011, below the national average of 9.1% for the same time period.
The state continues to have a negative fund balance and has depleted its rainy day fund due to its minimal reserve funding requirements. For the 2009-2011 biennial budget the state closed a $6.3 billion budget gap, which represented approximately 25% of total estimated revenues for the two year period, with expenditure cuts, approximately $1.5 billion in new revenues and federal stimulus dollars. A subsequent mid-year budget shortfall prompted a budget-repair plan centered on debt restructuring. As a result of the restructuring, the state was able to end the fiscal 2011 with a modest $86.8 billion surplus.
S-9
Earlier this year the state adopted a $28.4 billion budget for the 2012-2013 biennium, closing a $3.4 billion shortfall primarily with expenditure cuts and a small debt restructuring component. Spending reductions were quite broad, affecting administration, local government aid, public school funding and healthcare. State government layoffs in the second half of 2011 are expected to depress state employment levels. In comparison to past budgets the 2012-2013 budget relied less on non-recurring revenues, moving toward structural balance.
Debt levels remain above average. Wisconsin is ranked 14th among states with tax supported debt per capita at $1,795, above the national median of $1,066. Debt as a percentage of personal income is 4.8%, also above the national median of 2.8%. Wisconsin’s high debt ratios are partially attributed to its issuance of $1.8 billion in 2003 to fund the State’s pension liability. As a result, the state has no unfunded pension liability. The State’s Other Post Employment Benefit obligation is estimated to be $1.3 billion and is completely unfunded.
Property taxes are a significant source of revenue for many local governments, and declines in property values caused by the housing slump may negatively impact these tax revenues. The State and its various subdivisions may also face increasing financial pressure from costs relating to pensions and other post employment benefits.
Illiquid Securities
Each Fund may invest in illiquid securities (i.e., securities that are not readily marketable). For purposes of this restriction, illiquid securities include, but are not limited to, restricted securities (securities the disposition of which is restricted under the federal securities laws), securities that may only be resold pursuant to Rule 144A under the Securities Act of 1933, as amended (the “Securities Act”), but that are deemed to be illiquid; and repurchase agreements with maturities in excess of seven days. However, no Fund will acquire illiquid securities if, as a result, such securities would comprise more than 15% of the value of the Fund’s net assets. The Board of Trustees or its delegate has the ultimate authority to determine, to the extent permissible under the federal securities laws, which securities are liquid or illiquid for purposes of this 15% limitation. The Board of Trustees has delegated to the Adviser the day-to-day determination of the illiquidity of any portfolio security, although it has retained oversight over and ultimate responsibility for such determinations. The Adviser works with and to a large extent relies on the expertise and advice of Nuveen Asset Management in making those liquidity determinations. Although no definitive liquidity criteria are used, the Board of Trustees has directed Nuveen Asset Management to look to such factors as (i) the nature of the market for a security (including the institutional private resale market; the frequency of trades and quotes for the security; the number of dealers willing to purchase or sell the security; and the amount of time normally needed to dispose of the security, the method of soliciting offers and the mechanics of transfer), (ii) the terms of certain securities or other instruments allowing for the disposition to a third party or the issuer thereof (e.g., certain repurchase obligations and demand instruments), and (iii) other permissible relevant facts.
Restricted securities may be sold only in privately negotiated transactions or in a public offering with respect to which a registration statement is in effect under the Securities Act. Where registration is required, a Fund may be obligated to pay all or part of the registration expenses and a considerable period may elapse between the time of the decision to sell and the time the Fund may be permitted to sell a security under an effective registration statement. If, during such a period, adverse market conditions were to develop, the Fund might obtain a less favorable price than that which prevailed when it decided to sell. Illiquid securities will be priced at fair value as determined in good faith by the Board of Trustees or its delegate. If, through the appreciation of illiquid securities or the depreciation of liquid securities, a Fund should be in a position where more than 15% of the value of its net assets are invested in illiquid securities, including restricted securities which are not readily marketable, the Fund will take such steps as is deemed advisable, if any, to protect liquidity.
Derivative Transactions, Hedging and Other Defensive Actions
Each Fund may enter into derivative transactions to reduce, increase or otherwise alter the Fund’s risk profile, including hedging transactions. Hedging is a term used for various methods of seeking to reduce relative risk by offsetting price changes in one investment through making another investment whose price should tend to move in the opposite direction. It may be desirable and possible in various market environments to partially hedge a Fund’s portfolio against fluctuations in market value
S-10
caused by market interest rate fluctuations, credit events or other market changes by investing in such instruments as financial futures and index futures as well as related put and call options on such instruments, or by entering into interest rate swap, credit default swap, or total return swap transactions or options on such swaps, or other forms of derivatives. The Funds may also use such investments or techniques to alter its portfolio’s investment characteristics (e.g., duration, yield curve positioning and credit quality) to achieve desired positioning. Such investments or techniques may operate to increase absolute levels of risk, as well as to hedge risk.
When a Fund enters into an index or financial futures contract it is required to post an initial deposit of 1% to 5% of the total contract price. Typically, futures or option on futures holders enter into offsetting closing transactions to enable settlement in cash rather than taking delivery of the underlying security in the future. Each Fund will only sell covered futures contracts, which means that the Fund segregates assets equal to the amount of the obligations.
These transactions present certain risks. In particular, the imperfect correlation between price movements in the instrument used in a risk-reducing hedge and price movements in the securities being hedged creates the possibility that losses on the hedge by a Fund may be greater than gains in the value of the securities in the Fund’s portfolio being hedged, or that the gain on the hedge may be less than the losses on the Fund’s portfolio securities. Likewise, such imperfect price correlation may mean that the desired non-hedging adjustment to portfolio characteristics (such as lengthening duration) does not lead to the desired risk/return result. In addition, the markets for futures, swaps and options may not be liquid in all circumstances. As a result, in volatile markets, a Fund may not be able to close out the hedging transaction without incurring losses substantially greater than the initial deposit. Finally, the potential daily deposit requirements in futures or swap contracts or options sold on futures or swap contracts create an ongoing greater potential financial risk than do purchasing option transactions, where the exposure is limited to the cost of the initial premium. Losses due to certain hedging transactions may reduce yield. Net gains, if any, from hedging and other portfolio transactions will be distributed as taxable ordinary income or capital gains distributions to shareholders.
No Fund will make any hedging investment (whether an initial premium or deposit or a subsequent deposit) other than as necessary to close a prior investment if, immediately after such investment, the sum of the amount of its premiums and deposits, with respect to all currently effective hedging investments, would exceed 5% of such series’ net assets. Each Fund will invest in these instruments only in markets believed by Nuveen Asset Management to be active and sufficiently liquid. For further information regarding these investment strategies and risks presented thereby, see Appendix B to this Statement of Additional Information.
Each Fund reserves the right for liquidity or defensive purposes (such as thinness in the market for municipal securities or an expected substantial decline in value of long-term obligations) to invest temporarily up to 20% of its assets in obligations issued or guaranteed by the U.S. Government and its agencies or instrumentalities. Interest on each instrument is taxable for federal income tax purposes and would reduce the amount of tax-free interest payable to shareholders.
Short-Term Investments
The Prospectus discusses briefly the ability of the Funds to invest a portion of their assets in federally tax-exempt or taxable short-term securities or shares of money market funds (“short-term investments”). Short-term investments will not exceed 20% of a Fund’s assets except when made for defensive purposes. The Funds will invest only in taxable short-term investments that are either U.S. Government securities or are rated within the highest grade by Moody’s, S&P, or Fitch and mature within one year from the date of purchase or carry a variable or floating rate of interest. See Appendix A for more information about ratings by Moody’s, S&P, and Fitch.
The Funds may invest in the following federally tax-exempt short-term investments:
Bond Anticipation Notes (BANs) are usually general obligations of state and local governmental issuers, which are sold to obtain interim financing for projects that will eventually be funded through the sale of long-term debt obligations or bonds. The ability of an issuer to meet its obligations on its BANs is primarily dependent on the issuer’s access to the long-term municipal bond market and the likelihood that the proceeds of such bond sales will be used to pay the principal and interest on the BANs.
S-11
Tax Anticipation Notes (TANs) are issued by state and local governments to finance the current operations of such governments. Repayment is generally to be derived from specific future tax revenues. Tax anticipation notes are usually general obligations of the issuer. A weakness in an issuer’s capacity to raise taxes due to, among other things, a decline in its tax base or a rise in delinquencies, could adversely affect the issuer’s ability to meet its obligations on outstanding TANs.
Revenue Anticipation Notes (RANs) are issued by governments or governmental bodies with the expectation that future revenues from a designated source will be used to repay the notes. In general, they also constitute general obligations of the issuer. A decline in the receipt of projected revenues, such as anticipated revenues from another level of government, could adversely affect an issuer’s ability to meet its obligations on outstanding RANs. In addition, the possibility that the revenues would, when received, be used to meet other obligations could affect the ability of the issuer to pay the principal and interest on RANs.
Construction Loan Notes are issued to provide construction financing for specific projects. Frequently, these notes are redeemed with funds obtained from the Federal Housing Administration.
Bank Notes are notes issued by local government bodies and agencies as those described above to commercial banks as evidence of borrowings. The purposes for which the notes are issued are varied, but they are frequently issued to meet short-term working capital or capital-project needs. These notes may have risks similar to the risks associated with TANs and RANs.
Tax-Exempt Commercial Paper (Municipal Paper) represents very short-term unsecured, negotiable promissory notes, issued by states, municipalities and their agencies. Payment of principal and interest on issues of municipal paper may be made from various sources, to the extent the funds are available therefrom. Maturities of municipal paper generally will be shorter than the maturities of TANs, BANs or RANs. There is a limited secondary market for issues of municipal paper.
Certain Municipal Obligations may carry variable or floating rates of interest whereby the rate of interest is not fixed, but varies with changes in specified market rates or indices, such as a bank prime rate or a tax-exempt money market index.
While these various types of notes as a group represent the major portion of the tax-exempt note market, other types of notes are occasionally available in the marketplace and each Fund may invest in such other types of notes to the extent permitted under its investment objective, policies and limitations. Such notes may be issued for different purposes and may be secured differently from those mentioned above.
Municipal Money Market Funds that pay interest income exempt from regular federal and, in some cases, state and local income taxes. The Funds will bear their proportionate share of the money market fund’s fees and expenses.
The Funds may also invest in the following taxable short-term investments:
Certificates of Deposit (CDs)—A certificate of deposit is a negotiable interest bearing instrument with a specific maturity. CDs are issued by banks in exchange for the deposit of funds and normally can be traded in the secondary market, prior to maturity. The Funds will only invest in U.S. dollar denominated CDs issued by U.S. banks with assets of $1 billion or more.
Commercial Paper—Commercial paper is the term used to designate unsecured short-term promissory notes issued by corporations. Maturities on these issues vary from a few days to nine months. Commercial paper may be purchased from U.S. corporations.
Taxable Money Market Funds—These funds pay interest income that is taxable on the federal and state levels. The Funds will bear their proportionate share of the money market fund’s fees and expenses.
U.S. Government Direct Obligations are issued by the United States Treasury and include bills, notes and bonds.
| —Treasury | bills are issued with maturities of up to one year. They are issued in bearer form, are sold on a discount basis and are payable at par value at maturity. |
S-12
| —Treasury | notes are longer-term interest bearing obligations with original maturities of one to seven years. |
| —Treasury | bonds are longer-term interest-bearing obligations with original maturities from five to thirty years. |
U.S. Government Agencies Securities—Certain federal agencies have been established as instrumentalities of the U.S. government to supervise and finance certain types of activities. These agencies include, but are not limited to, the Bank for Cooperatives, Federal Land Banks, Federal Intermediate Credit Banks, Federal Home Loan Banks, Federal National Mortgage Association, Government National Mortgage Association, Export-Import Bank of the United States, and Tennessee Valley Authority. Issues of these agencies, while not direct obligations of the U.S. government, are either backed by the full faith and credit of the United States or are guaranteed by the Treasury or supported by the issuing agencies’ right to borrow from the Treasury. There can be no assurance that the U.S. government itself will pay interest and principal on securities as to which it is not legally so obligated.
Other Corporate Obligations—The Funds may purchase notes, bonds and debentures issued by corporations if at the time of purchase there is less than one year remaining until maturity or if they carry a variable or floating rate of interest.
Repurchase Agreements—A repurchase agreement is a contractual agreement whereby the seller of securities (U.S. government or Municipal Obligations) agrees to repurchase the same security at a specified price on a future date agreed upon by the parties. The agreed upon repurchase price determines the yield during a Fund’s holding period. Repurchase agreements are considered to be loans collateralized by the underlying security that is the subject of the repurchase contract. The Funds will only enter into repurchase agreements with dealers, domestic banks or recognized financial institutions that in the opinion of Nuveen Asset Management present minimal credit risk. The risk to the Funds is limited to the ability of the issuer to pay the agreed-upon repurchase price on the delivery date; however, although the value of the underlying collateral at the time the transaction is entered into always equals or exceeds the agreed-upon repurchase price, if the value of the collateral subsequently declines there is a risk of loss of both principal and interest. In the event of default, the collateral may be sold but a Fund might incur a loss if the value of the collateral declines, and might incur disposition costs or experience delays in connection with liquidating the collateral. In addition, if bankruptcy proceedings are commenced with respect to the seller of the security, realization upon the collateral by a Fund may be delayed or limited. Nuveen Asset Management will monitor the value of collateral at the time the transaction is entered into and at all times subsequent during the term of the repurchase agreement in an effort to determine that the value always equals or exceeds the agreed upon price. In the event the value of the collateral declined below the repurchase price, Nuveen Asset Management will demand additional collateral from the issuer to increase the value of the collateral to at least that of the repurchase price. Each of the Funds will not invest more than 10% of its assets in repurchase agreements maturing in more than seven days.
Making of Loans to Issuers of Bonds Already In the Portfolio
A Fund may make a loan to (as opposed to investing in a bond issued by) an entity whose bonds that Fund already owns in its portfolio, in instances where Nuveen Asset Management believes that doing so will enhance the value of the Fund’s total investments (both bonds and loans) in obligations of that entity. Typically, such loans will be made to entities suffering severe economic distress, oftentimes in or near bankruptcy. Making a loan to such an entity may enable the entity to remain a “going concern” and enable the entity to both repay the loan as well as be better able to pay interest and principal on the pre-existing bonds, instead of forcing the Fund to liquidate the entity’s assets, which can reduce recovery value. It is generally much more time-consuming and expensive for a troubled entity to issue additional bonds, instead of borrowing, as a means of obtaining liquidity in times of severe financial need.
S-13
The management of the Trust, including general supervision of the duties performed for the Funds by the Adviser under the Investment Management Agreement, is the responsibility of the Board of Trustees. The number of trustees of the Trust is ten, one of whom is an “interested person” (as the term is defined in the 1940 Act) and nine of whom are not interested persons (referred to herein as “independent trustees”). None of the independent trustees has ever been a trustee, director or employee of, or consultant to, the Adviser or its affiliates. The names, business addresses and birthdates of the trustees and officers of the Funds, their principal occupations and other affiliations during the past five years, the number of portfolios each oversees and other directorships they hold are set forth below. The trustees of the Trust are directors or trustees, as the case may be, of 114 Nuveen-sponsored open-end funds (the “Nuveen Mutual Funds”) and 133 Nuveen-sponsored closed-end funds (collectively with the Nuveen Mutual Funds, the “Nuveen Funds”).
Name, Business Address | Position(s) | Term of Office | Principal Occupation(s) | Number of | Other | |||||
Independent Trustees: | ||||||||||
Robert P. Bremner* 333 West Wacker Drive Chicago, IL 60606 (8/22/40) | Chairman of the Board and Trustee | Term—Indefinite** Length of Service— Since 1996 | Private Investor and Management Consultant; Treasurer and Director Humanities Council of Washington D.C.; Board Member, Independent Directors Council affiliated with the Investment Company Institute. | 247 | N/A | |||||
Jack B. Evans 333 West Wacker Drive Chicago, IL 60606 (10/22/48) | Trustee | Term—Indefinite** Length of Service— Since 2003 | President, The Hall-Perrine Foundation, a private philanthropic corporation (since 1996); Member, Board of Regents for the State of Iowa University System; Director, Source Media Group; Life Trustee of Coe College and the Iowa College Foundation; formerly, Director, Federal Reserve Bank of Chicago; formerly, President and Chief Operating Officer, SCI Financial Group, Inc., a regional financial services firm. | 247 | Director and Chairman, United Fire Group, a publicly held company; formerly, Director, Alliant Energy. | |||||
S-14
Name, Business Address | Position(s) | Term of Office | Principal Occupation(s) | Number of | Other | |||||
William C. Hunter 333 West Wacker Drive Chicago, IL 60606 (3/6/48) | Trustee | Term—Indefinite** Length of Service— Since 2004 | Dean (since 2006), Tippie College of Business, University of Iowa; Director (since 2005), Beta Gamma Sigma International Honor Society; Director of Wellmark, Inc. (since 2009); formerly, Director (1997-2007), Credit Research Center at Georgetown University; formerly, Dean and Distinguished Professor of Finance, School of Business at the University of Connecticut (2003-2006); previously, Senior Vice President and Director of Research at the Federal Reserve Bank of Chicago (1995-2003). | 247 | Director (since 2004) of Xerox Corporation. | |||||
David J. Kundert* 333 West Wacker Drive Chicago, IL 60606 (10/28/42) | Trustee | Term—Indefinite** Length of Service— | Director, Northwestern Mutual Wealth Management Company; retired (since 2004) as Chairman, JPMorgan Fleming Asset Management, President and CEO, Banc One Investment Advisors Corporation, and President, One Group Mutual Funds; prior thereto, Executive Vice President, Bank One Corporation and Chairman and CEO, Banc One Investment Management Group; Member, Board of Regents, Luther College; Member of the Wisconsin Bar Association; Member of Board of Directors, Friends of Boerner Botanical Gardens; Member of Board of Directors and Chair of Investment Committee, Greater Milwaukee Foundation. | 247 | N/A | |||||
S-15
Name, Business Address | Position(s) | Term of Office | Principal Occupation(s) | Number of | Other | |||||
William J. Schneider* 333 West Wacker Drive Chicago, IL 60606 (9/24/44) | Trustee | Term—Indefinite** Length of Service— Since 1996 | Chairman of Miller-Valentine Partners Ltd., a real estate investment company; Member, Mid-America Health System Board; Member, University of Dayton Business School Advisory Council; formerly, Senior Partner and Chief Operating Officer (retired, 2004) of Miller-Valentine Group; formerly, Member, Dayton Philharmonic Orchestra Association; formerly, Director, Dayton Development Coalition; formerly, Member, Business Advisory Council, Cleveland Federal Reserve Bank. | 247 | N/A | |||||
Judith M. Stockdale 333 West Wacker Drive Chicago, IL 60606 (12/29/47) | Trustee | Term—Indefinite** Length of Service— Since 1996 | Executive Director, Gaylord and Dorothy Donnelley Foundation (since 1994); prior thereto, Executive Director, Great Lakes Protection Fund (1990-1994). | 247 | N/A | |||||
Carole E. Stone* 333 West Wacker Drive Chicago, IL 60606 (6/28/47) | Trustee | Term—Indefinite** Length of | Director, C2 Options Exchange, Incorporated (since 2009); formerly, Commissioner, New York State Commission on Public Authority Reform (2005-2010); formerly, Chair, New York Racing Association Oversight Board (2005-2007). | 247 | Director, Chicago Board Options Exchange (since 2006). | |||||
S-16
Name, Business Address | Position(s) | Term of Office | Principal Occupation(s) | Number of | Other | |||||
Virginia L. Stringer 333 West Wacker Drive Chicago, IL 60606 (8/16/44) | Trustee | Term—Indefinite** Length of Service— Since 2011 | Board Member, Mutual Fund Directors Forum; Member, Governing Board, Investment Company Institute’s Independent Directors Council; Governance consultant and non-profit board member; former Owner and President, Strategic Management Resources, Inc., a management consulting firm; previously, held several executive positions in general management, marketing and human resources at IBM and The Pillsbury Company. | 247 | Previously, Independent Director (1987-2010) and Chair (1997-2010), First American Fund Complex. | |||||
Terence J. Toth* 333 West Wacker Drive Chicago, IL 60606 (9/29/59) | Trustee | Term—Indefinite** Length of | Director, Legal & General Investment Management America, Inc. (since 2008); Managing Partner, Promus Capital (since 2008); formerly, CEO and President, Northern Trust Global Investments (2004-2007); Executive Vice President, Quantitative Management & Securities Lending (2000-2004); prior thereto, various positions with Northern Trust Company (since 1994); Member: Goodman Theatre Board (since 2004); Chicago Fellowship Board (since 2005) and Catalyst Schools of Chicago Board (since 2008); formerly, Member: Northern Trust Mutual Funds Board (2005-2007), Northern Trust Global Investments Board (2004-2007), Northern Trust Japan Board (2004-2007), Northern Trust Securities Inc. Board (2003-2007) and Northern Trust Hong Kong Board (1997-2004). | 247 | N/A | |||||
S-17
Name, Business Address | Position(s) | Term of Office | Principal Occupation(s) | Number of | Other | |||||
Interested Trustee: | ||||||||||
John P. Amboian*** 333 West Wacker Drive Chicago, IL 60606 (6/14/61) | Trustee | Term—Indefinite** Length of | Chief Executive Officer and Chairman (since 2007) and Director (since 1999) of Nuveen Investments, Inc.; formerly, President (1999-2007); Chief Executive Officer (since 2007) of Nuveen Investments Advisers, Inc.; Director (since 1998), formerly, Chief Executive Officer (2007-2010) of Nuveen Fund Advisors, Inc. | 247 | N/A | |||||
| * | Also serves as a trustee of the Nuveen Diversified Commodity Fund, an exchange-traded commodity pool managed by Nuveen Commodities Asset Management, LLC, an affiliate of the Adviser. |
| ** | Each trustee serves an indefinite term until his or her successor is elected. |
| *** | Mr. Amboian is an “interested person” of the Trust, as defined in the 1940 Act, by reason of his positions with Nuveen Investments, Inc. (“Nuveen Investments”) and certain of its subsidiaries. |
S-18
Name, Business Address | Position(s) Held | Term of | Principal Occupation(s) | Number of | ||||
Officers of the Trust: | ||||||||
Gifford R. Zimmerman 333 West Wacker Drive Chicago, IL 60606 (9/9/56) | Chief Administrative Officer | Term—Until August 2012 Length of Service— Since 1996 | Managing Director (since 2002), Assistant Secretary and Associate General Counsel of Nuveen Securities, LLC; Managing Director (since 2002), Assistant Secretary (since 1997) and Co-General Counsel (since 2011) of Nuveen Fund Advisors, Inc.; Managing Director, Assistant Secretary and Associate General Counsel of Nuveen Asset Management, LLC (since 2011); Managing Director (since 2004) and Assistant Secretary (since 1994) of Nuveen Investments, Inc.; Vice President and Assistant Secretary of NWQ Investment Management Company, LLC (since 2002); Vice President and Assistant Secretary of Nuveen Investments Advisers Inc. (since 2002); Managing Director, Associate General Counsel and Assistant Secretary of Symphony Asset Management LLC (since 2003); Vice President and Assistant Secretary of Tradewinds Global Investors, LLC and Santa Barbara Asset Management, LLC (since 2006), Nuveen HydePark Group, LLC and Nuveen Investment Solutions, Inc. (since 2006) and of Winslow Capital Management, Inc. (since 2010); Chief Administrative Officer and Chief Compliance Officer (since 2006) of Nuveen Commodities Asset Management, LLC; Chartered Financial Analyst. | 247 | ||||
Margo L. Cook 333 West Wacker Drive Chicago, IL 60606 (4/11/64) | Vice President | Term—Until August 2012 Length of Service—Since 2009 | Executive Vice President (since 2008) of Nuveen Investments, Inc. and Nuveen Fund Advisors, Inc. (since 2011); Managing Director—Investment Services of Nuveen Commodities Asset Management, LLC (since August 2011); previously, Head of Institutional Asset Management (2007-2008) of Bear Stearns Asset Management; Head of Institutional Asset Management (1986-2007) of Bank of NY Mellon; Chartered Financial Analyst. | 247 | ||||
Lorna C. Ferguson 333 West Wacker Drive Chicago, IL 60606 (10/24/45) | Vice President | Term—Until August 2012 Length of Service— Since 1998 | Managing Director (since 2004) of Nuveen Securities, LLC; Managing Director (since 2005) of Nuveen Fund Advisors, Inc. | 247 | ||||
Stephen D. Foy 333 West Wacker Drive Chicago, IL 60606 (5/31/54) | Vice President and Controller | Term—Until August 2012 Length of Service— Since 1997 | Senior Vice President (since 2010), formerly, Vice President (2004-2010) and Funds Controller of Nuveen Securities, LLC; Vice President of Nuveen Fund Advisors, Inc. (since 2005); Chief Financial Officer (since 2010) of Nuveen Commodities Asset Management, LLC; Certified Public Accountant. | 247 | ||||
S-19
Name, Business Address | Position(s) Held | Term of | Principal Occupation(s) | Number of | ||||
Scott S. Grace 333 West Wacker Drive (8/20/70) | Vice President and Treasurer | Term—Until August 2012 Length of Service— Since 2009 | Managing Director, Corporate Finance & Development, Treasurer (since 2009) of Nuveen Securities, LLC; Managing Director and Treasurer (since 2009) of Nuveen Investment Solutions, Inc., Nuveen Investments Advisers, Inc., Nuveen Investments Holdings, Inc., Nuveen Fund Advisors, Inc., and (since 2011) Nuveen Asset Management, LLC; Vice President and Treasurer of NWQ Investment Management Company, LLC, Tradewinds Global Investors, LLC, Symphony Asset Management LLC and Winslow Capital Management, Inc.; Vice President of Santa Barbara Asset Management, LLC; formerly, Treasurer (2006-2009), Senior Vice President (2008-2009), previously, Vice President (2006-2008) of Janus Capital Group, Inc.; formerly, Senior Associate in Morgan Stanley’s Global Financial Services Group (2000-2003); Chartered Accountant. | 247 | ||||
Walter M. Kelly 333 West Wacker Drive Chicago, IL 60606 (2/24/70) | Vice President and Chief Compliance Officer | Term—Until August 2012 Length of Service— Since 2004 | Senior Vice President (since 2008) and Assistant Secretary (since 2003) of Nuveen Fund Advisors, Inc. | 247 | ||||
Tina M. Lazar 333 West Wacker Drive Chicago, IL 60606 (8/27/61) | Vice President | Term—Until August 2012 Length of Service— Since 2000 | Senior Vice President (since 2010), formerly, Vice President (2005-2010) of Nuveen Fund Advisors, Inc. | 247 | ||||
Larry W. Martin 333 West Wacker Drive Chicago, IL 60606 (7/27/51) | Vice President and Assistant Secretary | Term—Until August 2012 Length of Service— Since 1997 | Senior Vice President (since 2010), formerly, Vice President (1993-2010), Assistant Secretary and Assistant General Counsel of Nuveen Securities, LLC; Senior Vice President (since 2011) of Nuveen Asset Management, LLC; Senior Vice President (since 2010), formerly, Vice President (2005-2010) and Assistant Secretary of Nuveen Investments, Inc.; Senior Vice President (since 2010), formerly, Vice President (2005-2010) and Assistant Secretary (since 1997) of Nuveen Fund Advisors, Inc.; Vice President and Assistant Secretary of Nuveen Investments Advisers Inc. (since 2002), NWQ Investment Management Company, LLC, Symphony Asset Management, LLC (since 2003), Tradewinds Global Investors, LLC, Santa Barbara Asset Management, LLC (since 2006), Nuveen HydePark Group, LLC, Nuveen Investment Solutions, Inc. (since 2007) and Winslow Capital Management, Inc. (since 2010); Vice President and Assistant Secretary of Nuveen Commodities Asset Management, LLC (since 2010). | 247 | ||||
S-20
Name, Business Address | Position(s) Held | Term of | Principal Occupation(s) | Number of | ||||
Kevin J. McCarthy 333 West Wacker Drive Chicago, IL 60606 (3/26/66) | Vice President and Secretary | Term—Until August 2012 Length of Service—Since 2007 | Managing Director (since 2008), formerly, Vice President (2007-2008) of Nuveen Securities, LLC; Managing Director (since 2008), Vice President and Assistant Secretary (since 2007) and Co-General Counsel (since 2011) of Nuveen Fund Advisors, Inc.; Managing Director, Assistant Secretary and Associate General Counsel (since 2011) of Nuveen Asset Management, LLC; Vice President and Assistant Secretary of Nuveen Investment Advisers Inc., NWQ Investment Management Company, LLC, Tradewinds Global Investors, LLC, NWQ Holdings, LLC, Symphony Asset Management LLC, Santa Barbara Asset Management, LLC, Nuveen HydePark Group, LLC, Nuveen Investment Solutions, Inc. and of Winslow Capital Management, Inc. (since 2010); Vice President and Secretary (since 2010) of Nuveen Commodities Asset Management, LLC; prior thereto, Partner, Bell, Boyd & Lloyd LLP (1997-2007). | 247 | ||||
Kathleen L. Prudhomme 901 Marquette Avenue Minneapolis, MN 55402 (3/30/53) | Vice President and Assistant Secretary | Term—Until August 2012 Length of Service— Since 2011 | Managing Director and Assistant Secretary of Nuveen Securities, LLC (since 2011); Managing Director, Assistant Secretary and Co-General Counsel (since 2011) of Nuveen Fund Advisors, Inc.; Managing Director, Assistant Secretary and Associate General Counsel (since 2011) of Nuveen Asset Management, LLC; formerly, Deputy General Counsel, FAF Advisors, Inc. (2004-2010). | 247 | ||||
Jeffrey M. Wilson 333 West Wacker Drive Chicago, IL 60606 (3/13/56) | Vice President | Term—Until August 2012 Length of Service— Since 2011 | Senior Vice President of Nuveen Securities, LLC (since 2011) formerly, Senior Vice President of FAF Advisors, Inc. (2000-2010). | 114 | ||||
S-21
Board Leadership Structure and Risk Oversight
The Board of Directors or the Board of Trustees (as the case may be, each is referred to hereafter as the “Board” or “Board of Trustees” and the directors or trustees of the Nuveen Funds, as applicable, are each referred to herein as “trustees”) oversees the operations and management of the Nuveen Funds, including the duties performed for the Nuveen Funds by the Adviser. The Board has adopted a unitary board structure. A unitary board consists of one group of directors who serve on the board of every fund in the complex. In adopting a unitary board structure, the trustees seek to provide effective governance through establishing a board, the overall composition of which will, as a body, possess the appropriate skills, independence and experience to oversee the Nuveen Funds’ business. With this overall framework in mind, when the Board, through its Nominating and Governance Committee discussed below, seeks nominees for the Board, the trustees consider, not only the candidate’s particular background, skills and experience, among other things, but also whether such background, skills and experience enhance the Board’s diversity and at the same time complement the Board given its current composition and the mix of skills and experiences of the incumbent trustees. The Nominating and Governance Committee believes that the Board generally benefits from diversity of background, experience and views among its members, and considers this a factor in evaluating the composition of the Board, but has not adopted any specific policy on diversity or any particular definition of diversity.
The Board believes the unitary board structure enhances good and effective governance, particularly given the nature of the structure of the investment company complex. Funds in the same complex generally are served by the same service providers and personnel and are governed by the same regulatory scheme which raises common issues that must be addressed by the directors across the fund complex (such as compliance, valuation, liquidity, brokerage, trade allocation or risk management). The Board believes it is more efficient to have a single board review and oversee common policies and procedures which increases the Board’s knowledge and expertise with respect to the many aspects of fund operations that are complex-wide in nature. The unitary structure also enhances the Board’s influence and oversight over the investment adviser and other service providers.
In an effort to enhance the independence of the Board, the Board also has a Chairman that is an independent trustee. The Board recognizes that a chairman can perform an important role in setting the agenda for the Board, establishing the boardroom culture, establishing a point person on behalf of the Board for fund management, and reinforcing the Board’s focus on the long-term interests of shareholders. The Board recognizes that a chairman may be able to better perform these functions without any conflicts of interests arising from a position with fund management. Accordingly, the trustees have elected Robert P. Bremner as the independent Chairman of the Board. Specific responsibilities of the Chairman include: (i) presiding at all meetings of the Board and of the shareholders; (ii) seeing that all orders and resolutions of the trustees are carried into effect; and (iii) maintaining records of and, whenever necessary, certifying all proceedings of the trustees and the shareholders.
Although the Board has direct responsibility over various matters (such as advisory contracts, underwriting contracts and fund performance), the Board also exercises certain of its oversight responsibilities through several committees that it has established and which report back to the full Board. The Board believes that a committee structure is an effective means to permit trustees to focus on particular operations or issues affecting the Nuveen Funds, including risk oversight. More specifically, with respect to risk oversight, the Board has delegated matters relating to valuation and compliance to certain committees (as summarized below) as well as certain aspects of investment risk. In addition, the Board believes that the periodic rotation of trustees among the different committees allows the trustees to gain additional and different perspectives of a Nuveen Fund’s operations. The Board has established five standing committees: the Executive Committee, the Dividend Committee, the Audit Committee, the Compliance, Risk Management and Regulatory Oversight Committee and the Nominating and Governance Committee. The Board may also from time to time create ad hoc committees to focus on particular issues as the need arises. The membership and functions of the standing committees are summarized below.
The Executive Committee, which meets between regular meetings of the Board, is authorized to exercise all of the powers of the Board. The members of the Executive Committee are Robert P. Bremner, Chair, Judith M. Stockdale and John P. Amboian. During the fiscal year ended May 31, 2011, the Executive Committee did not meet.
S-22
The Audit Committee assists the Board in the oversight and monitoring of the accounting and reporting policies, processes and practices of the Nuveen Funds, and the audits of the financial statements of the Nuveen Funds; the quality and integrity of the financial statements of the Nuveen Funds; the Nuveen Funds’ compliance with legal and regulatory requirements relating to the Nuveen Funds’ financial statements; the independent auditors’ qualifications, performance and independence; and the pricing procedures of the Nuveen Funds and the Adviser’s internal valuation group. It is the responsibility of the Audit Committee to select, evaluate and replace any independent auditors (subject only to Board and, if applicable, shareholder ratification) and to determine their compensation. The Audit Committee is also responsible for, among other things, overseeing the valuation of securities comprising the Nuveen Funds’ portfolios. Subject to the Board’s general supervision of such actions, the Audit Committee addresses any valuation issues, oversees the Nuveen Funds’ pricing procedures and actions taken by the Adviser’s internal valuation group which provides regular reports to the committee, reviews any issues relating to the valuation of the Nuveen Funds’ securities brought to its attention and considers the risks to the Nuveen Funds in assessing the possible resolutions to these matters. The Audit Committee may also consider any financial risk exposures for the Nuveen Funds in conjunction with performing its functions.
To fulfill its oversight duties, the Audit Committee receives annual and semi-annual reports and has regular meetings with the external auditors for the Nuveen Funds and the Adviser’s internal audit group. The Audit Committee also may review in a general manner the processes the Board or other Board committees have in place with respect to risk assessment and risk management as well as compliance with legal and regulatory matters relating to the Nuveen Funds’ financial statements. The committee operates under a written charter adopted and approved by the Board. Members of the Audit Committee shall be independent (as set forth in the charter) and free of any relationship that, in the opinion of the trustees, would interfere with their exercise of independent judgment as an Audit Committee member. The members of the Audit Committee are Robert P. Bremner, David J. Kundert, Chair, William J. Schneider, Carole E. Stone and Terence J. Toth, each of whom is an independent trustee of the Nuveen Funds. During the fiscal year ended May 31, 2011, the Audit Committee met times.
The Nominating and Governance Committee is responsible for seeking, identifying and recommending to the Board qualified candidates for election or appointment to the Board. In addition, the Nominating and Governance Committee oversees matters of corporate governance, including the evaluation of Board performance and processes, the assignment and rotation of committee members, and the establishment of corporate governance guidelines and procedures, to the extent necessary or desirable, and matters related thereto. Although the unitary and committee structure has been developed over the years and the Nominating and Governance Committee believes the structure has provided efficient and effective governance, the committee recognizes that as demands on the Board evolve over time (such as through an increase in the number of funds overseen or an increase in the complexity of the issues raised), the committee must continue to evaluate the Board and committee structures and their processes and modify the foregoing as may be necessary or appropriate to continue to provide effective governance. Accordingly, the Nominating and Governance Committee has a separate meeting each year to, among other things, review the Board and committee structures, their performance and functions, and recommend any modifications thereto or alternative structures or processes that would enhance the Board’s governance of the Nuveen Funds.
In addition, the Nominating and Governance Committee, among other things, makes recommendations concerning the continuing education of trustees; monitors performance of legal counsel and other service providers; establishes and monitors a process by which security holders are able to communicate in writing with members of the Board; and periodically reviews and makes recommendations about any appropriate changes to trustee compensation. In the event of a vacancy on the Board, the Nominating and Governance Committee receives suggestions from various sources, including shareholders as to suitable candidates. Suggestions should be sent in writing to Lorna Ferguson, Manager of Fund Board Relations, Nuveen Investments, 333 West Wacker Drive, Chicago, IL 60606. The Nominating and Governance Committee sets appropriate standards and requirements for nominations for new trustees and reserves the right to interview any and all candidates and to make the final selection of any new trustees. In considering a candidate’s qualifications, each
S-23
candidate must meet certain basic requirements, including relevant skills and experience, time availability (including the time requirements for due diligence site visits to sub-advisers and service providers) and, if qualifying as an independent trustee candidate, independence from the Adviser, sub-advisers, the Distributor and other service providers, including any affiliates of these entities. These skill and experience requirements may vary depending on the current composition of the Board, since the goal is to ensure an appropriate range of skills, diversity and experience, in the aggregate. Accordingly, the particular factors considered and weight given to these factors will depend on the composition of the Board and the skills and backgrounds of the incumbent trustees at the time of consideration of the nominees. All candidates, however, must meet high expectations of personal integrity, independence, governance experience and professional competence. All candidates must be willing to be critical within the Board and with management and yet maintain a collegial and collaborative manner toward other Board members. The committee operates under a written charter adopted and approved by the Board. This committee is composed of the independent trustees of the Nuveen Funds. Accordingly, the members of the Nominating and Governance Committee are Robert P. Bremner, Chair, Jack B. Evans, William C. Hunter, David J. Kundert, William J. Schneider, Judith M. Stockdale, Carole E. Stone, Virginia L. Stringer and Terence J. Toth. During the fiscal year ended May 31, 2011, the Nominating and Governance Committee met six times.
The Dividend Committee is authorized to declare distributions on the Nuveen Funds’ shares, including, but not limited to, regular and special dividends, capital gains and ordinary income distributions. The members of the Dividend Committee are Jack B. Evans, Chair, Judith M. Stockdale and Terence J. Toth. During the fiscal year ended May 31, 2011, the Dividend Committee met four times.
The Compliance, Risk Management and Regulatory Oversight Committee (the “Compliance Committee”) is responsible for the oversight of compliance issues, risk management and other regulatory matters affecting the Nuveen Funds that are not otherwise the jurisdiction of the other committees. The Board has adopted and periodically reviews policies and procedures designed to address the Nuveen Funds’ compliance and risk matters. As part of its duties, the Compliance Committee reviews the policies and procedures relating to compliance matters and recommends modifications thereto as necessary or appropriate to the full Board; develops new policies and procedures as new regulatory matters affecting the Nuveen Funds arise from time to time; evaluates or considers any comments or reports from examinations from regulatory authorities and responses thereto; and performs any special reviews, investigations or other oversight responsibilities relating to risk management, compliance and/or regulatory matters as requested by the Board.
In addition, the Compliance Committee is responsible for risk oversight, including, but not limited to, the oversight of risks related to investments and operations. Such risks include, among other things, exposures to particular issuers, market sectors, or types of securities; risks related to product structure elements, such as leverage; and techniques that may be used to address those risks, such as hedging and swaps. In assessing issues brought to the committee’s attention or in reviewing a particular policy, procedure, investment technique or strategy, the Compliance Committee evaluates the risks to the Nuveen Funds in adopting a particular approach compared to the anticipated benefits to the Nuveen Funds and their shareholders. In fulfilling its obligations, the Compliance Committee meets on a quarterly basis, and at least once a year in person. The Compliance Committee receives written and oral reports from the Nuveen Funds’ Chief Compliance Officer (“CCO”) and meets privately with the CCO at each of its quarterly meetings. The CCO also provides an annual report to the full Board regarding the operations of the Nuveen Funds’ and other service providers’ compliance programs as well as any recommendations for modifications thereto. The Compliance Committee also receives reports from the Adviser’s investment services group regarding various investment risks. Notwithstanding the foregoing, the full Board also participates in discussions with management regarding certain matters relating to investment risk, such as the use of leverage and hedging. The investment services group therefore also reports to the full Board at its quarterly meetings regarding, among other things, fund performance and the various drivers of such performance. Accordingly, the Board directly and/or in conjunction with the Compliance Committee oversees matters relating to investment risks. Matters not addressed at the committee level are addressed directly by the full Board. The committee operates under a written charter adopted and approved by the Board. The members of the Compliance Committee are Jack B. Evans, William C. Hunter, William J. Schneider, Judith M. Stockdale, Chair, and Virginia L. Stringer. During the fiscal year ended May 31, 2011, the Compliance, Risk Management and Regulatory Oversight Committee met five times.
S-24
Board Diversification and Trustee Qualifications
In determining that a particular trustee was qualified to serve on the Board, the Board has considered each trustee’s background, skills, experience and other attributes in light of the composition of the Board with no particular factor controlling. The Board believes that trustees need to have the ability to critically review, evaluate, question and discuss information provided to them, and to interact effectively with Fund management, service providers and counsel, in order to exercise effective business judgment in the performance of their duties, and the Board believes each trustee satisfies this standard. An effective trustee may achieve this ability through his or her educational background; business, professional training or practice; public service or academic positions; experience from service as a board member or executive of investment funds, public companies or significant private or not-for-profit entities or other organizations; and or/other life experiences. Accordingly, set forth below is a summary of the experiences, qualifications, attributes, and skills that led to the conclusion, as of the date of this document, that each trustee should continue to serve in that capacity. References to the experiences, qualifications, attributes and skills of trustees are pursuant to requirements of the Securities and Exchange Commission, do not constitute holding out of the Board or any trustee as having any special expertise or experience and shall not impose any greater responsibility or liability on any such person or on the Board by reason thereof.
John P. Amboian
Mr. Amboian, an interested trustee of the Nuveen Funds, joined Nuveen Investments in June 1995 and became Chief Executive Officer in July 2007 and Chairman in November 2007. Prior to this, since 1999, he served as President with responsibility for the firm’s product, marketing, sales, operations and administrative activities. Mr. Amboian initially served Nuveen Investments as Executive Vice President and Chief Financial Officer. Prior to joining Nuveen Investments, Mr. Amboian held key management positions with two consumer product firms affiliated with the Phillip Morris Companies. He served as Senior Vice President of Finance, Strategy and Systems at Miller Brewing Company. Mr. Amboian began his career in corporate and international finance at Kraft Foods, Inc., where he eventually served as Treasurer. He received a Bachelor’s degree in economics and a Masters of Business Administration (“MBA”) from the University of Chicago. Mr. Amboian serves on the Board of Directors of Nuveen Investments and is a Board Member or Trustee of the Investment Company Institute Board of Governors, Boys and Girls Clubs of Chicago, Children’s Memorial Hospital and Foundation, the Council on the Graduate School of Business (University of Chicago), and the North Shore Country Day School Foundation. He is also a member of the Civic Committee of the Commercial Club of Chicago and the Economic Club of Chicago.
Robert P. Bremner
Mr. Bremner, the Nuveen Funds’ Independent Chairman, is a private investor and management consultant in Washington, D.C. His biography of William McChesney Martin, Jr., a former chairman of the Federal Reserve Board, was published by Yale University Press in November 2004. From 1994 to 1997, he was a Senior Vice President at Samuels International Associates, an international consulting firm specializing in governmental policies, where he served in a part-time capacity. Previously, Mr. Bremner was a partner in the LBK Investors Partnership and was chairman and majority stockholder with ITC Investors Inc., both private investment firms. He currently serves on the Board and as Treasurer of the Humanities Council of Washington D.C. and is a Board Member of the Independent Directors Council affiliated with the Investment Company Institute. From 1984 to 1996, Mr. Bremner was an independent Trustee of the Flagship Funds, a group of municipal open-end funds. He began his career at the World Bank in Washington D.C. He graduated with a Bachelor of Science degree from Yale University and received his MBA from Harvard University.
Jack B. Evans
President of the Hall-Perrine Foundation, a private philanthropic corporation, since 1996, Mr. Evans was formerly President and Chief Operating Officer of the SCI Financial Group, Inc., a regional financial services firm headquartered in Cedar Rapids, Iowa. Formerly, he was a member of the Board of the Federal Reserve Bank of Chicago as well as a Director of Alliant Energy. Mr. Evans is Chairman of the Board of United Fire Group, sits on the Board of the Source Media Group, is a member of the Board of
S-25
Regents for the State of Iowa University System, is a Life Trustee of Coe College and is a member of the Advisory Council of the Department of Finance in the Tippie College of Business, University of Iowa. He has a Bachelor of Arts degree from Coe College and an MBA from the University of Iowa.
William C. Hunter
Mr. Hunter was appointed Dean of the Henry B. Tippie College of Business at the University of Iowa effective July 1, 2006. He had been Dean and Distinguished Professor of Finance at the University of Connecticut School of Business since June 2003. From 1995 to 2003, he was the Senior Vice President and Director of Research at the Federal Reserve Bank of Chicago. While there he served as the Bank’s Chief Economist and was an Associate Economist on the Federal Reserve System’s Federal Open Market Committee (FOMC). In addition to serving as a Vice President in charge of financial markets and basic research at the Federal Reserve Bank in Atlanta, he held faculty positions at Emory University, Atlanta University, the University of Georgia and Northwestern University. A past Director of the Credit Research Center at Georgetown University, SS&C Technologies, Inc. (2005) and past President of the Financial Management Association International, he has consulted with numerous foreign central banks and official agencies in Western Europe, Central and Eastern Europe, Asia, Central America and South America. From 1990 to 1995, he was a U.S. Treasury Advisor to Central and Eastern Europe. He has been a Director of the Xerox Corporation since 2004 and Wellmark, Inc. since 2009. He is President-Elect of Beta Gamma Sigma, Inc., the International Business Honor Society.
David J. Kundert
Mr. Kundert retired in 2004 as Chairman of JPMorgan Fleming Asset Management, and as President and CEO of Banc One Investment Advisors Corporation, and as President of One Group Mutual Funds. Prior to the merger between Bank One Corporation and JPMorgan Chase and Co., he was Executive Vice President, Bank One Corporation and, since 1995, the Chairman and CEO, Banc One Investment Management Group. From 1988 to 1992, he was President and CEO of Bank One Wisconsin Trust Company. Currently, Mr. Kundert is a Director of the Northwestern Mutual Wealth Management Company. He started his career as an attorney for Northwestern Mutual Life Insurance Company. Mr. Kundert has served on the Board of Governors of the Investment Company Institute and he is currently a member of the Wisconsin Bar Association. He is on the Board of the Greater Milwaukee Foundation and chairs its Investment Committee. He received his Bachelor of Arts degree from Luther College, and his Juris Doctor from Valparaiso University.
William J. Schneider
Mr. Schneider is currently Chairman, formerly Senior Partner and Chief Operating Officer (retired, December 2004) of Miller-Valentine Partners Ltd., a real estate investment company. He was formerly a Director and Past Chair of the Dayton Development Coalition. He was formerly a member of the Community Advisory Board of the National City Bank in Dayton as well as a former member of the Business Advisory Council of the Cleveland Federal Reserve Bank. Mr. Schneider is a member of the Business Advisory Council for the University of Dayton College of Business. Mr. Schneider was an independent Trustee of the Flagship Funds, a group of municipal open-end funds. He also served as Chair of the Miami Valley Hospital and as Chair of the Finance Committee of its parent holding company. Mr. Schneider has a Bachelor of Science in Community Planning from the University of Cincinnati and a Masters of Public Administration from the University of Dayton.
Judith M. Stockdale
Ms. Stockdale is currently Executive Director of the Gaylord and Dorothy Donnelley Foundation, a private foundation working in land conservation and artistic vitality in the Chicago region and the Low country of South Carolina. Her previous positions include Executive Director of the Great Lakes Protection Fund, Executive Director of Openlands, and Senior Staff Associate at the Chicago Community Trust. She has served on the Boards of the Land Trust Alliance, the National Zoological Park, the Governor’s Science Advisory Council (Illinois), the Nancy Ryerson Ranney Leadership Grants Program, Friends of Ryerson Woods and the Donors Forum. Ms. Stockdale, a native of the United Kingdom, has a Bachelor of Science degree in geography from the University of Durham (UK) and a Master of Forest Science degree from Yale University.
S-26
Carole E. Stone
Ms. Stone retired from the New York State Division of the Budget in 2004, having served as its Director for nearly five years and as Deputy Director from 1995 through 1999. Ms. Stone is currently on the Board of Directors of the Chicago Board Options Exchange, CBOE Holdings, Inc. and C2 Options Exchange, Incorporated. She has also served as the Chair of the New York Racing Association Oversight Board, as Chair of the Public Authorities Control Board, as a Commissioner on the New York State Commission on Public Authority Reform and as a member of the Boards of Directors of several New York State public authorities. Ms. Stone has a Bachelor of Arts from Skidmore College in Business Administration.
Virginia L. Stringer
Ms. Stringer served as the independent chair of the Board of the First American Fund Complex from 1997 to 2010, having joined such Board in 1987. Ms. Stringer serves on the Governing Board of the Investment Company Institute’s Independent Directors Council and on the board of the Mutual Fund Directors Forum. She is a recipient of the Outstanding Corporate Director award from Twin Cities Business Monthly and the Minnesota Chapter of the National Association of Corporate Directors. Ms. Stringer is the immediate past board chair of the Oak Leaf Trust, director and immediate past board chair of the Saint Paul Riverfront Corporation and is immediate past President of the Minneapolis Club’s Governing Board. She is a director and former board chair of the Minnesota Opera and a Life Trustee and former board of the Voyageur Outward Bound School. She also served as a trustee of Outward Bound USA. She was appointed by the Governor of Minnesota Board on Judicial Standards and recently served on a Minnesota Supreme Court Judicial Advisory Committee to reform the state’s judicial disciplinary process. She is a member of the International Women’s Forum and attended the London Business School as an International Business Fellow. Ms. Stringer also served as board chair of the Human Resource Planning Society, the Minnesota Women’s Campaign Fund and the Minnesota Women’s Economic Roundtable. Ms. Stringer is the retired founder of Strategic Management Resources, a consulting practice focused on corporate governance, strategy and leadership. She has twenty five years of corporate experience having held executive positions in general management, marketing and human resources with IBM and the Pillsbury Company.
Terence J. Toth
Mr. Toth is a Director, Legal & General Investment Management America, Inc. (since 2008) and a Managing Partner, Promus Capital (since 2008). From 2004 to 2007, he was Chief Executive Officer and President of Northern Trust Global Investments, and Executive Vice President of Quantitative Management & Securities Lending from 2000 to 2004. He also formerly served on the Board of the Northern Trust Mutual Funds. He joined Northern Trust in 1994 after serving as Managing Director and Head of Global Securities Lending at Bankers Trust (1986 to 1994) and Head of Government Trading and Cash Collateral Investment at Northern Trust from 1982 to 1986. He currently serves on the Boards of the Goodman Theatre and Chicago Fellowship, and is Chairman of the Board of Catalyst Schools of Chicago. Mr. Toth graduated with a Bachelor of Science degree from the University of Illinois, and received his MBA from New York University. In 2005, he graduated from the CEO Perspectives Program at Northwestern University.
Board Compensation
The following table shows, for each independent trustee, (1) the aggregate compensation paid by the Trust for the fiscal year ended May 31, 2011, (2) the amount of total compensation paid by the Trust that has been deferred, and (3) the total compensation paid to each trustee by the Nuveen Funds during the fiscal year ended May 31, 2011.
Name of Trustee | Aggregate Compensation From Trust1 | Amount of Total Compensation that Has Been Deferred2 | Total Compensation from Fund and Fund Complex3 | |||||||||
Robert P. Bremner | $ | 5,520 | $ | 753 | $ | 296,672 | ||||||
Jack B. Evans | 4,672 | 1,084 | 246,194 | |||||||||
William C. Hunter | 4,200 | 3,639 | 218,232 | |||||||||
David J. Kundert | 4,859 | 4,209 | 261,192 | |||||||||
William J. Schneider | 5,009 | 3,436 | 264,031 | |||||||||
S-27
Name of Trustee | Aggregate Compensation From Trust1 | Amount of Total Compensation that Has Been Deferred2 | Total Compensation from Fund and Fund Complex3 | |||||||||
Judith M. Stockdale | 4,381 | 2,023 | 227,717 | |||||||||
Carole E. Stone | 3,923 | — | 211,400 | |||||||||
Virginia L. Stringer4 | 925 | — | 57,000 | |||||||||
Terence J. Toth | 4,650 | 696 | 245,882 | |||||||||
| 1 | The compensation paid, including deferred amounts, to the independent trustees for the fiscal year ended May 31, 2011 for services to the Trust. |
| 2 | Pursuant to a deferred compensation agreement with the Trust, deferred amounts are treated as though an equivalent dollar amount has been invested in shares of one or more eligible Nuveen Funds. The amounts provided are the total deferred fees (including the return from the assumed investment in the eligible Nuveen Funds) payable from the Trust. |
| 3 | Based on the compensation paid (including any amounts deferred) to the trustees for the one year period ended May 31, 2011 for services to the Nuveen Funds. |
| 4 | Ms. Stringer was appointed to the Board of Trustees of the Nuveen Funds effective January 1, 2011. |
Prior to January 1, 2011, independent trustees received a $100,000 annual retainer plus (a) a fee of $3,250 per day for attendance in person or by telephone at a regularly scheduled meeting of the Board of Trustees; (b) a fee of $2,500 per meeting for attendance in person where such in-person attendance was required and $1,500 per meeting for attendance by telephone or in person where in-person attendance was not required at a special, non-regularly scheduled board meeting; (c) a fee of $2,000 per meeting for attendance in person or by telephone at an Audit Committee meeting; (d) a fee of $2,000 per meeting for attendance in person or by telephone at a regularly scheduled Compliance, Risk Management and Regulatory Oversight Committee meeting where in-person attendance was required and $1,000 per meeting for attendance by telephone or in person where in-person attendance was not required; (e) a fee of $1,000 per meeting for attendance in person or by telephone for a meeting of the Dividend Committee; and (f) a fee of $500 per meeting for attendance in person at all other committee meetings ($1,000 for shareholder meetings) on a day on which no regularly scheduled board meeting was held in which in-person attendance was required and $250 per meeting for attendance by telephone or in person at such committee meetings (excluding shareholder meetings) where in-person attendance was not required and $100 per meeting when the Executive Committee acted as pricing committee for IPOs, plus, in each case, expenses incurred in attending such meetings. In addition to the payments described above, the Chairman of the Board of Trustees received $50,000, the chairpersons of the Audit Committee, the Dividend Committee and the Compliance, Risk Management and Regulatory Oversight Committee received $7,500 and the chairperson of the Nominating and Governance Committee received $5,000 as additional retainers. Independent trustees also received a fee of $2,500 per day for site visits to entities that provide services to the Nuveen Funds on days on which no regularly scheduled board meeting was held. When ad hoc committees are organized, the Nominating and Governance Committee at the time of formation determined compensation to be paid to the members of such committee; however, in general, such fees were $1,000 per meeting for attendance in person at any ad hoc committee meeting where in-person attendance was required and $500 per meeting for attendance by telephone or in person at such meetings where in-person attendance was not required. The annual retainer, fees and expenses are allocated among the Nuveen Funds on the basis of relative net assets, although fund management may, in its discretion, establish a minimum amount to be allocated to each fund.
Effective January 1, 2011, independent trustees receive a $120,000 annual retainer plus (a) a fee of $4,500 per day for attendance in person or by telephone at regularly scheduled meetings of the Board; (b) a fee of $3,000 per meeting for attendance in person or by telephone at special, non-regularly scheduled Board meetings where in-person attendance is required and $2,000 per meeting for attendance by telephone or in person at such meetings where in-person attendance is not required; (c) a fee of $2,500 per meeting for attendance in person or by telephone at Audit Committee meetings where in-person attendance is required and $2,000 per meeting for attendance
S-28
by telephone or in person at such meetings where in-person attendance is not required; (d) a fee of $2,500 per meeting for attendance in person or by telephone at Compliance, Risk Management and Regulatory Oversight Committee meetings where in-person attendance is required and $2,000 per meeting for attendance by telephone or in person at such meetings where in-person attendance is not required; (e) a fee of $1,000 per meeting for attendance in person or by telephone at Dividend Committee meetings; and (f) a fee of $500 per meeting for attendance in person or by telephone at all other committee meetings ($1,000 for shareholder meetings) where in-person attendance is required and $250 per meeting for attendance by telephone or in person at such committee meetings (excluding shareholder meetings) where in-person attendance is not required, and $100 per meeting when the Executive Committee acts as pricing committee for IPOs, plus, in each case, expenses incurred in attending such meetings, provided that no fees are received for meetings held on days on which regularly scheduled Board meetings are held. In addition to the payments described above, the Chairman of the Board receives $75,000, the chairpersons of the Audit Committee, the Dividend Committee and the Compliance, Risk Management and Regulatory Oversight Committee receive $10,000 each and the chairperson of the Nominating and Governance Committee receives $5,000 as additional retainers. Independent trustees also receive a fee of $3,000 per day for site visits to entities that provide services to the Nuveen Funds on days on which no Board meeting is held. When ad hoc committees are organized, the Nominating and Governance Committee will at the time of formation determine compensation to be paid to the members of such committee; however, in general, such fees will be $1,000 per meeting for attendance in person or by telephone at ad hoc committee meetings where in-person attendance is required and $500 per meeting for attendance by telephone or in person at such meetings where in-person attendance is not required. The annual retainer, fees and expenses are allocated among the Nuveen Funds on the basis of relative net assets, although management may, in its discretion, establish a minimum amount to be allocated to each Fund.
The Trust does not have a retirement or pension plan. The Trust has a deferred compensation plan (the “Deferred Compensation Plan”) that permits any independent trustee to elect to defer receipt of all or a portion of his or her compensation as an independent trustee. The deferred compensation of a participating trustee is credited to a book reserve account of the Trust when the compensation would otherwise have been paid to the trustee. The value of the trustee’s deferral account at any time is equal to the value that the account would have had if contributions to the account had been invested and reinvested in shares of one or more of the eligible Nuveen Funds. At the time for commencing distributions from a trustee’s deferral account, the independent trustee may elect to receive distributions in a lump sum or over a period of five years. The Trust will not be liable for any other fund’s obligations to make distributions under the Deferred Compensation Plan.
The Funds have no employees. The officers of the Trust and the trustee of the Trust who is not an independent trustee serve without any compensation from the Funds.
Share Ownership
The following table sets forth the dollar range of equity securities beneficially owned by each trustee as of May 31, 2011:
| Dollar Range of Equity Securities in the Funds | Aggregate Dollar Range of Equity Securities in All Registered Investment Companies Overseen by Trustee in Family of Investment Companies | |||||||||||||
Name of Trustee | Nuveen Kansas Municipal Bond Fund | Nuveen Kentucky Municipal Bond Fund | Nuveen Michigan Municipal Bond Fund | Nuveen Missouri Municipal Bond Fund | Nuveen Ohio Municipal Bond Fund | Nuveen Wisconsin Municipal Bond Fund | ||||||||
John P. Amboian | $0 | $0 | $0 | $0 | $0 | $0 | Over $100,000 | |||||||
Robert P. Bremner | $0 | $0 | $0 | $0 | $0 | $0 | Over $100,000 | |||||||
Jack B. Evans | $0 | $0 | $0 | $0 | $0 | $0 | Over $100,000 | |||||||
William C. Hunter | $0 | $0 | $0 | $0 | $0 | $0 | Over $100,000 | |||||||
David J. Kundert | $0 | $0 | $0 | $0 | $0 | $0 | Over $100,000 | |||||||
William J. Schneider | $0 | $0 | $0 | $0 | Over $100,000* | $0 | Over $100,000 | |||||||
Judith M. Stockdale | $0 | $0 | $0 | $0 | $0 | $0 | Over $100,000 | |||||||
Carole E. Stone | $0 | $0 | $0 | $0 | $0 | $0 | Over $100,000 | |||||||
S-29
| Dollar Range of Equity Securities in the Funds | Aggregate Dollar Range of Equity Securities in All Registered Investment Companies Overseen by Trustee in Family of Investment Companies | |||||||||||||
Name of Trustee | Nuveen Kansas Municipal Bond Fund | Nuveen Kentucky Municipal Bond Fund | Nuveen Michigan Municipal Bond Fund | Nuveen Missouri Municipal Bond Fund | Nuveen Ohio Municipal Bond Fund | Nuveen Wisconsin Municipal Bond Fund | ||||||||
Virginia L. Stringer1 | $0 | $0 | $0 | $0 | $0 | $0 | Over $100,000 | |||||||
Terence J. Toth | $0 | $0 | $0 | $0 | $0 | $0 | Over $100,000 | |||||||
| 1 | Ms. Stringer was appointed to the Board effective January 1, 2011. |
| * | Represents shares in Ohio Municipal Bond Fund which are held by Mr. Schneider (1% ownership) and his children (99% ownership). |
As of September 1, 2011, the officers and trustees of the Trust in the aggregate, owned less than 1% of the shares of each of the Funds.
The following table sets forth the percentage ownership of each person, who, as of September 1, 2011, owned of record, or is known by the Trust to have owned of record or beneficially, 5% or more of any class of a Fund’s shares.
Name of Fund and Class | Name and Address of Owner | Percentage of Ownership | ||||
Nuveen Kansas Municipal Bond Fund | Special Custody Account for the exclusive benefit of Customer 2801 Market St. St. Louis, MO 63103-2523 | | 23.86% | | ||
Edward D. Jones & Co. Attn: Mutual Fund Shareholder Accounting 201 Progress Pkwy Maryland Hts, MO 63043 | 17.88% | |||||
MLPF&S for its Customers Attn: Fund Admin. Sec. 97D0 4800 Deer Lake Drive E. 3rd Floor Jacksonville, FL 32246-6484 | 12.93% | |||||
Nuveen Kansas Municipal Bond Fund | Edward D. Jones & Co. Attn: Mutual Fund Shareholder Accounting 201 Progress Pkwy Maryland Hts, MO 63043 |
| 42.13% |
| ||
First Clearing, LLC Special Custody Account for the exclusive benefit of Customer 2801 Market St. St. Louis, MO 63103-2523 | 12.73% | |||||
American Enterprise Investment Serv FBO Customer P.O. Box 9446 Minneapolis, MN 55440-9446 | 6.20% | |||||
S-30
Name of Fund and Class | Name and Address of Owner | Percentage of Ownership | ||||
Morgan Stanley Smith Barney Harborside Financial Center Attn: Mutual Funds Operations Plaza Two, 3rd Floor Jersey City, NJ 07311 | 5.36% | |||||
Nuveen Kansas Municipal Bond Fund | MLPF&S for the Sole Benefit of its Customers Attn: Fund Admin. Sec. 97NE0 4800 Deer Lake Drive E. 3rd Floor Jacksonville, FL 32246-6484 |
| 26.11% |
| ||
First Clearing, LLC Special Custody Account for the exclusive benefit of Customer 2801 Market St. St. Louis, MO 63103-2523 | 17.68% | |||||
Edward D. Jones & Co. Attn: Mutual Fund Shareholder Accounting 201 Progress Parkway Maryland Hts., MO 63043 | 7.60% | |||||
UBS WM USA Attn Department Manager 499 Washington Blvd., FL 9 Jersey City, NJ 07310-2055 | 6.28% | |||||
Nuveen Kansas Municipal Bond Fund | MLPF&S for the benefit of its customers Attn Fund Admn 4800 Deer Lake Dr FL 3 Jacksonville, FL 32246-6484 |
| 33.67% |
| ||
First Clearing, LLC Special Custody Account for the exclusive benefit of Customer 2801 Market St. St. Louis, MO 63103-2523 | 21.13% | |||||
LPL Financial Services 9785 Towne Centre Drive San Diego, CA 92121-1968 | 15.16% | |||||
Mori & Co c/o Commerce Bank NA Attn IMG OPS 911 Main St. Ste 201 Kansas City, MO 64105-5304 | 8.17% | |||||
S-31
Name of Fund and Class | Name and Address of Owner | Percentage of Ownership | ||||
ROGCO c/o RCB Bank Attn Trust Dept P.O. Box 1047 Arkansas City, KS 67005-1047 | 7.41% | |||||
Nuveen Kentucky Municipal Bond Fund | Edward D. Jones & Co. Attn: Mutual Fund Shareholder Accounting 201 Progress Pkwy Maryland Hts, MO 63043-3009 |
| 16.77% |
| ||
MLPF&S for the Sole Benefit of its Customers Attn: Fund Admin. Sec. 971X8 4800 Deer Lake Drive E. 3rd Floor Jacksonville, FL 32246-6484 | 7.29% | |||||
First Clearing, LLC Special Custody Account for the exclusive benefit of Customer 2801 Market St. St. Louis, MO 63103-2523 | 7.22% | |||||
Nuveen Kentucky Municipal Bond Fund | Charles Schwab & Co., Inc. for the Benefit of Their Customers 4500 Cherry Creek Dr. S Denver, CO 80018 |
| 11.74% |
| ||
Edward D. Jones & Co. Attn: Mutual Fund Shareholder Accounting 201 Progress Pkwy Maryland Hts, MO 63043-3009 |
| 11.51% |
| |||
MLPF&S for the Sole Benefit of its Customers Attn: Fund Admin. Sec. 97NC4 4800 Deer Lake Drive E. 3rd Floor Jacksonville, FL 32246-6484 | | 8.95% | | |||
Joyce M. Wood 1210 Leathers Ln Frankfort, KY 40601-7629 | 5.04% | |||||
LPL Financial 9785 Towne Centre Dr. San Diego, CA 92121-1968 | 5.02% | |||||
S-32
Name of Fund and Class | Name and Address of Owner | Percentage of Ownership | ||||
Nuveen Kentucky Municipal Bond Fund | MLPF&S for the Sole Benefit of its Customers Attn: Fund Admin. Sec. 97CM9 4800 Deer Lake Drive E. 3rd Floor Jacksonville, FL 32246-6484 |
| 16.82% |
| ||
First Clearing, LLC Special Custody Account for the exclusive benefit of Customer 2801 Market St. St. Louis, MO 63103-2523 | 10.71% | |||||
Citigroup Global Markets Inc., House Account Attn: Peter Booth, 7th Floor 333 West 34th Street New York, NY 10001-2402 | 8.06% | |||||
UBS WM USA Attn Department Manager 499 Washington Blvd., FL 9 Jersey City, NJ 07310-2055 | 6.36% | |||||
Nuveen Kentucky Municipal Bond Fund | First Clearing, LLC Special Custody Account for the 2801 Market St. St. Louis, MO 63103-2523 |
| 23.80% |
| ||
NFS LLC FEBO US Bank National Association Omnibus CASH/CASH 1555 N. Rivercenter Dr., Ste 302 Milwaukee, WI 53212-3958 | 19.00% | |||||
MLPF&S for the benefit of its customers ATTN Fund Admn 4800 Deer Lake Dr FL 3 Jacksonville, FL 32246-6484 | 12.51% | |||||
Citigroup Global Markets Inc. 333 West 34th St., 3rd FL New York, NY 10001 | 5.46% | |||||
LPL Financial 9785 Towne Centre Dr San Diego, CA 92121-1968 | 5.09% | |||||
S-33
Name of Fund and Class | Name and Address of Owner | Percentage of Ownership | ||||
Nuveen Michigan Municipal Bond Fund | MLPF&S for the Sole Benefit of its Customers Attn: Fund Admin. Sec. 97E75 4800 Deer Lake Drive E. 3rd Floor Jacksonville, FL 32246-6484 |
| 19.76% |
| ||
First Clearing, LLC Special Custody Account for the exclusive benefit of Customer 2801 Market St. St. Louis, MO 63103-2523 | 10.81% | |||||
Citigroup Global Markets Inc., House Account Attn: Peter Booth, 7th Floor 333 West 34th Street New York, NY 10001-2402 | 7.06% | |||||
Nuveen Michigan Municipal Bond Fund | MLPF&S for the Sole Benefit of its Customers Attn: Fund Admin. Sec. 97ND4 4800 Deer Lake Drive E. 3rd Floor Jacksonville, FL 32246-6484 |
| 30.66% |
| ||
Edward D. Jones & Co. Attn: Mutual Fund Shareholder Accounting 201 Progress Pkwy Maryland Hts, MO 63043-3009 | 7.00% | |||||
Charles Schwab & Co, Inc. FBO Customers, Saint Clair Shores, MI Attn: Mutual Fund Operations 101 Montgomery St. San Francisco, CA 94101-4151 | 5.72% | |||||
Gary G. Motyl & Marc P. Motyl JTWROS 42439 Ehrke Dr. Clinton Township, MI 48038-3612 | 5.03% | |||||
Nuveen Michigan Municipal Bond Fund | MLPF&S for the Sole Benefit of its Customers Attn: Fund Admin. Sec. 97GW2 4800 Deer Lake Drive E. 3rd Floor Jacksonville, FL 32246-6484 |
| 48.24% |
| ||
S-34
Name of Fund and Class | Name and Address of Owner | Percentage of Ownership | ||||
UBS WM USA Attn Department Manager 499 Washington Blvd., FL 9 Jersey City, NJ 07310-2055 | 9.48% | |||||
First Clearing, LLC Special Custody Account for the exclusive benefit of Customer 2801 Market St. St. Louis, MO 63103 | 9.14% | |||||
Citigroup Global Markets Inc., House Account Attn: Peter Booth, 7th Floor 333 West 34th Street New York, NY 10001-2402 | 7.10% | |||||
Nuveen Michigan Municipal Bond Fund | First Clearing, LLC Special Custody Account for the exclusive benefit of Customer 2801 Market St. St. Louis, MO 63103 |
| 15.11% |
| ||
MLPF&S for the benefit of its customers ATTN Fund Admn 4800 Deer Lake Dr FL 3 Jacksonville, FL 32246-6484 | 9.66% | |||||
Citigroup Global Markets Inc., House Account Attn: Peter Booth, 7th Floor 333 West 34th Street New York, NY 10001 | | 8.79% | | |||
Nuveen Missouri Municipal Bond Fund | First Clearing, LLC Special Custody Account for the exclusive benefit of Customer 2801 Market St. St. Louis, MO 63103 |
| 16.88% |
| ||
Edward D. Jones & Co. Attn: Mutual Fund Shareholder Accounting 201 Progress Pkwy Maryland Hts, MO 63043-3009 | 13.86% | |||||
MLPF&S for the Sole Benefit of its Customers Attn: Fund Admin. Sec. 973G2 4800 Deer Lake Drive E. 3rd Floor Jacksonville, FL 32246-6484 | 11.66% | |||||
S-35
Name of Fund and Class | Name and Address of Owner | Percentage of Ownership | ||||
Nuveen Missouri Municipal Bond Fund | Edward D. Jones & Co. Attn: Mutual Fund Shareholder Accounting 201 Progress Pkwy Maryland Hts, MO 63043-3009 |
| 20.13% |
| ||
First Clearing, LLC Special Custody Account for the exclusive benefit of Customer 2801 Market St. St. Louis, MO 63103 | 17.71% | |||||
LPL Financial Services 9785 Towne Center Drive San Diego, CA 92121 | 11.79% | |||||
LPL Financial Services 9785 Towne Center Drive San Diego, CA 92121 | 9.56% | |||||
LPL Financial Services 9785 Towne Center Drive San Diego, CA 92121 | 6.54% | |||||
LPL Financial Services 9785 Towne Center Drive San Diego, CA 92121 | 5.68% | |||||
Pershing LLC PO Box 2052 Jersey City, NJ 07303 | 5.61% | |||||
Nuveen Missouri Municipal Bond Fund | MLPF&S for the Sole Benefit of its Customers Attn: Fund Admin. Sec. 97DD3 4800 Deer Lake Drive E. 3rd Floor Jacksonville, FL 32246-6484 |
| 34.04% |
| ||
First Clearing, LLC Special Custody Account for the exclusive benefit of Customer 2801 Market St. St. Louis, MO 63103 | 16.69% | |||||
Nuveen Missouri Municipal Bond Fund | LPL Financial 9785 Towne Center Drive San Diego, CA 92121 |
| 21.05% |
| ||
S-36
Name of Fund and Class | Name and Address of Owner | Percentage of Ownership | ||||
MLPF&S for the benefit of its customers ATTN Fund Admn 4800 Deer Lake Dr FL 3 Jacksonville, FL 32246-6484 | 17.08% | |||||
NFS LLC FEBO The Bank of Missouri Investment and RET Planning 3610 Buttonwood Drive, Suite 10 Columbia, MO 65201-3721 | 12.52% | |||||
First Clearing, LLC Special Custody Account for the exclusive benefit of Customer 2801 Market St. St. Louis, MO 63103-2523 | 10.20% | |||||
Citigroup Global Markets Inc., House Account Attn: Peter Booth, 7th Floor 333 West 34th St. New York, NY 10001-2402 | 7.24% | |||||
Nuveen Ohio Municipal Bond Fund | MLPF&S for the Sole Benefit of its Customers Attn: Fund Admin. Sec. 97E84 4800 Deer Lake Drive E. 3rd Floor Jacksonville, FL 32246-6484 |
| 22.15% |
| ||
UBS WM USA Attn Department Manager 499 Washington Blvd., FL 9 Jersey City, NJ 07310-2055 | | 8.70% | | |||
First Clearing, LLC Special Custody Account for the exclusive benefit of Customer 2801 Market St. St. Louis, MO 63103-2523 | 7.82% | |||||
Charles Schwab & Co, Inc. Special Custody Account FBO Customers Attn Mutual Funds 101 Montgomery St. San Francisco, CA 94104-4151 | 5.16% | |||||
Nuveen Ohio Municipal Bond Fund | UBS WM USA Attn Department Manager 499 Washington Blvd., FL 9 Jersey City, NJ 07310-2055 |
| 30.05% |
| ||
S-37
Name of Fund and Class | Name and Address of Owner | Percentage of Ownership | ||||
Charles Schwab & Co, Inc. Special Custody Account FBO Customers Attn Mutual Funds 101 Montgomery St. San Francisco, CA 94104-4151 | 10.90% | |||||
MLPF&S for the Sole Benefit of its Customers Attn: Fund Admin. Sec. 97ND5 4800 Deer Lake Drive E. 3rd Floor Jacksonville, FL 32246-6484 |
| 10.62% |
| |||
Edward D. Jones & Co. Attn: Mutual Fund Shareholder Accounting 201 Progress Parkway Maryland, Hts., MO 63043 | 6.96% | |||||
Nuveen Ohio Municipal Bond Fund | MLPF&S for the Sole Benefit of its Customers Attn: Fund Admin. Sec. 97GY8 4800 Deer Lake Drive E. 3rd Floor Jacksonville, FL 32246-6484 |
| 37.13% |
| ||
UBS WM USA Attn Department Manager 499 Washington Blvd., FL 9 Jersey City, NJ 07310-2055 | 13.12% | |||||
First Clearing, LLC Special Custody Account for the exclusive benefit of Customer 2801 Market St. St. Louis, MO 63103-2523 | 9.47% | |||||
Charles Schwab & Co, Inc. Special Custody Account FBO Customers Attn Mutual Funds 101 Montgomery St. San Francisco, CA 94104-4151 | 6.90% | |||||
Nuveen Ohio Municipal Bond Fund | MLPF&S for the benefit of its customers ATTN Fund Admn 4800 Deer Lake Dr FL 3 Jacksonville, FL 32246-6484 |
| 8.82% |
| ||
S-38
Name of Fund and Class | Name and Address of Owner | Percentage of Ownership | ||||
First Clearing, LLC Special Custody Account for the exclusive benefit of Customer 2801 Market St. St. Louis, MO 63103-2523 | 8.61% | |||||
Nuveen Wisconsin Municipal Bond Fund | First Clearing, LLC Special Custody Account for the exclusive benefit of Customer 2801 Market St. St. Louis, MO 63103-2523 |
| 16.93% |
| ||
Edward D. Jones & Co. Attn: Mutual Fund Shareholder Accounting 201 Progress Pkwy Maryland Hts, MO 63043-3009 | 16.07% | |||||
NFS LLC FEBO US Bank National Association Omnibus CASH/CASH 1555 N. Rivercenter Dr., Ste 302 Milwaukee, WI 53212-3958 | 5.41% | |||||
Nuveen Wisconsin Municipal Bond Fund | Edward D. Jones & Co. Attn: Mutual Fund Shareholder Accounting 201 Progress Pkwy Maryland Hts, MO 63043-3009 |
| 39.91% |
| ||
Pershing LLC PO Box 2052 Jersey City, NJ 07303-2052 | 10.66% | |||||
Morgan Stanley Smith Barney Attn: Mutual Funds Operations Harborside Financial Center Plaza Two, Third Floor Jersey City, NJ 07311 | 8.84% | |||||
Charles Schwab & Co, Inc. Special Custody Account FBO Customers Attn Mutual Funds 101 Montgomery St. San Francisco, CA 94104-4151 | 8.23% | |||||
Pershing LLC PO Box 2052 Jersey City, NJ 07303-2052 | 6.21% | |||||
Robert W. Baird & Co, Inc. 777 E Wisconsin Ave Milwaukee, WI 53202-5300 | 5.81% | |||||
S-39
Name of Fund and Class | Name and Address of Owner | Percentage of Ownership | ||||
Nuveen Wisconsin Municipal Bond Fund | First Clearing, LLC Special Custody Account for the exclusive benefit of Customer 2801 Market St. St. Louis, MO 63103-2523 |
| 13.30% |
| ||
MLPF&S for the Sole Benefit of its Customers Attn: Fund Admin. Sec. 97NE3 4800 Deer Lake Drive E. 3rd Floor Jacksonville, FL 32246-6484 | 8.80% | |||||
Morgan Stanley Smith Barney Attn: Mutual Funds Operations Harborside Financial Center Plaza Two, Third Floor Jersey City, NJ 07311 | 8.76% | |||||
Nuveen Wisconsin Municipal Bond Fund | US Bank National Association Omnibus/Reinvest/Reinvest 1555 N. Rivercenter Dr., Ste 302 Milwaukee WI 53212-3958 |
| 50.70% |
| ||
NFS LLC FEBO US Bank National Association Omnibus/CASH/CASH 1555 N. Rivercenter Dr., Ste 302 Milwaukee WI 53212-3958 | 25.93% | |||||
NFS LLC FEBO US Bank National Association Omnibus/CASH/REINVEST 1555 N. Rivercenter Dr., Ste 302 Milwaukee WI 53212-3958 | 13.98% | |||||
INVESTMENT ADVISER AND SUB-ADVISER
Investment Adviser
Nuveen Fund Advisors, located at 333 West Wacker Drive, Chicago, Illinois 60606, serves as the investment adviser of each Fund, with responsibility for the overall management of each Fund. The Adviser is also responsible for managing the Funds’ business affairs and providing day-to-day administrative services to the Funds. The Adviser has selected its affiliate, Nuveen Asset Management, located at 333 West Wacker Drive, Chicago, Illinois 60606, to serve as sub-adviser to manage the investment portfolios of the Funds. For additional information regarding the management services performed by the Adviser and Nuveen Asset Management, LLC, see “Who Manages the Funds” in the Prospectus.
The Adviser is an affiliate of the Distributor, which is also located at 333 West Wacker Drive, Chicago, Illinois 60606. The Distributor is the principal underwriter for the Nuveen Mutual Funds, and has served as co-managing underwriter for the shares of the Nuveen Closed-End Funds. The Adviser and the Distributor are subsidiaries of Nuveen Investments.
S-40
On November 13, 2007, Nuveen Investments was acquired by investors led by Madison Dearborn Partners, LLC, which is a private equity investment firm based in Chicago, Illinois (the “MDP Acquisition”).
Each Fund is dependent upon services and resources provided by the Adviser and therefore the Adviser’s parent, Nuveen Investments. Nuveen Investments increased its level of debt in connection with the MDP Acquisition. Nuveen Investments believes that monies generated from operations and cash on hand will be adequate to fund debt service requirements, capital expenditures and working capital requirements for the foreseeable future; however, Nuveen Investments’ ability to continue to fund these items, to service its debt and to maintain compliance with covenants in its debt agreements may be affected by general economic, financial, competitive, legislative, legal and regulatory factors and by its ability to refinance or repay outstanding indebtedness with scheduled maturities beginning in 2014. In the event that Nuveen Investments breaches certain of the covenants included in its debt agreements, the breach of such covenants may result in the accelerated payment of its outstanding debt, increase the cost of such debt or generally have an adverse effect on the financial condition of Nuveen Investments.
For the management services and facilities furnished by the Adviser, each of the Funds has agreed to pay an annual management fee at a rate set forth in the Prospectus under “Who Manages the Funds.” In addition, the Adviser has agreed to waive all or a portion of its management fee or reimburse certain expenses of the Funds. The Prospectus includes current fee waivers and expense reimbursements for the Funds.
Each Fund’s management fee is divided into two components—a complex-level fee based on the aggregate amount of all eligible Nuveen Fund assets and a specific fund-level fee based only on the amount of assets within each individual Fund. This pricing structure enables Fund shareholders to benefit from growth in the assets within each individual Fund as well as from growth in the amount of complex-wide assets managed by the Adviser. Under no circumstances will this pricing structure result in a Fund paying management fees at a rate higher than would otherwise have been applicable had the complex-wide management fee structure not been implemented.
Each Fund has agreed to pay an annual fund-level management fee, payable monthly, based upon the average daily net assets of each Fund as set forth in the Prospectus.
The annual complex-level management fee for each Fund, payable monthly, which is additive to the fund-level fee is based on the aggregate amount of total eligible assets managed for all Nuveen Funds as stated in the table below:
Complex-Level Asset | Effective Rate at Breakpoint Level | |||
$55 billion | .2000 | % | ||
$56 billion | .1996 | % | ||
$57 billion | .1989 | % | ||
$60 billion | .1961 | % | ||
$63 billion | .1931 | % | ||
$66 billion | .1900 | % | ||
$71 billion | .1851 | % | ||
$76 billion | .1806 | % | ||
$80 billion | .1773 | % | ||
$91 billion | .1691 | % | ||
$125 billion | .1599 | % | ||
$200 billion | .1505 | % | ||
$250 billion | .1469 | % | ||
$300 billion | .1445 | % | ||
| * | The complex-level fee is calculated based upon the aggregate daily “eligible assets” of all Nuveen Funds. Eligible assets do not include assets attributable to investments in other Nuveen Funds or assets in excess of $2 billion added to the Nuveen Fund complex in connection with the Adviser’s assumption of the management of the former First American Funds effective January 1, 2011. Eligible assets include closed-end fund assets managed by the Adviser that are attributable |
S-41
to financial leverage. For these purposes, financial leverage includes the closed-end funds’ use of preferred stock and borrowings and certain investments in the residual interest certificates (also called inverse floating rate securities) in tender option bond (TOB) trusts, including the portion of assets held by a TOB trust that has been effectively financed by the trust’s issuance of floating rate securities, subject to an agreement by the Adviser as to certain funds to limit the amount of such assets for determining eligible assets in certain circumstances. As of June 30, 2011, the complex-level fee rate for each of these Funds was .1774%. |
The following tables set forth the management fees (net of fee waivers and expense reimbursements) paid by the Funds and the fees waived and expenses reimbursed by the Adviser for the specified periods.
| Management Fees Net of Expense Reimbursement Paid to the Adviser for the Fiscal Year Ended | Fee Waivers and Expense Reimbursements from the Adviser for the Fiscal Year Ended | |||||||||||||||||||||||
| 5/31/09 | 5/31/10 | 5/31/11 | 5/31/09 | 5/31/10 | 5/31/11 | |||||||||||||||||||
Nuveen Kansas Municipal Bond Fund | $ | 706,414 | $ | 835,840 | $ | 922,654 | $ | — | $ | — | $ | — | ||||||||||||
Nuveen Kentucky Municipal Bond Fund | 2,112,481 | 2,247,672 | 2,220,169 | — | — | — | ||||||||||||||||||
Nuveen Michigan Municipal Bond Fund | 1,103,365 | �� | 1,122,361 | 1,067,418 | — | — | — | |||||||||||||||||
Nuveen Missouri Municipal Bond Fund | 1,146,716 | 1,220,070 | 1,229,763 | — | — | — | ||||||||||||||||||
Nuveen Ohio Municipal Bond Fund | 2,580,907 | 2,664,487 | 2,530,636 | — | — | — | ||||||||||||||||||
Nuveen Wisconsin Municipal Bond Fund | 305,842 | 323,422 | 336,308 | — | — | — | ||||||||||||||||||
In addition to the Adviser’s management fee, each Fund also pays a portion of the Trust’s general administrative expenses allocated in proportion to the net assets of each Fund. All fees and expenses are accrued daily and deducted before payment of dividends to investors.
The Funds, the other Nuveen Funds, the Adviser, Nuveen Asset Management and other related entities have adopted codes of ethics, which essentially prohibit all Nuveen Funds management personnel, including the Funds’ portfolio managers, from engaging in personal investments which compete or interfere with, or attempt to take advantage of, a Fund’s anticipated or actual portfolio transactions, and are designed to assure that the interests of shareholders are placed before the interests of Nuveen personnel in connection with personal investment transactions.
Sub-Adviser
Effective January 1, 2011, the Adviser has selected its affiliate, Nuveen Asset Management to serve as sub-adviser to manage the investment portfolio of each Fund. The Adviser pays Nuveen Asset Management a portfolio management fee equal to 45.45% of the advisory fee paid to the Adviser for its services to the Funds (net of any waivers, reimbursement payments, supermarket fees and alliance fees waived, reimbursed or paid by the Adviser in respect of the Funds).
Portfolio Managers
The following individuals have primary responsibility for the day-to-day implementation of the investment strategies of the Funds:
Name | Fund | |
Daniel J. Close | Nuveen Kentucky Municipal Bond Fund | |
| Nuveen Michigan Municipal Bond Fund | ||
| Nuveen Ohio Municipal Bond Fund | ||
Christopher L. Drahn | Nuveen Missouri Municipal Bond Fund | |
Steven M. Hlavin | Nuveen Kansas Municipal Bond Fund | |
| Nuveen Wisconsin Municipal Bond Fund |
S-42
Compensation
Portfolio manager compensation consists primarily of base pay, an annual cash bonus and long-term incentive payments.
Base pay. Base pay is determined based upon an analysis of the portfolio manager’s general performance, experience, and market levels of base pay for such position.
Annual cash bonus. The Funds’ portfolio managers are eligible for an annual cash bonus determined based upon the particular portfolio manager’s performance, experience and market levels of base pay for such position. The maximum potential annual cash bonus is equal to a multiple of base pay.
A portion of each portfolio manager’s annual cash bonus is based on his or her Fund’s investment performance, generally measured over the past one- and three-year periods unless the portfolio manager’s tenure is shorter. Investment performance for the Funds is determined by evaluating each Fund’s performance relative to its benchmark(s) and/or Lipper industry peer group.
Each portfolio manager whose performance is evaluated in part by comparing the manager’s performance to a benchmark is measured against a Fund-specific customized subset (limited to bonds in the Fund’s specific state and with certain maturity parameters) of the S&P/Investortools Municipal Bond Index, an index comprised of bonds held by managed municipal bond fund customers of Standard & Poor’s Securities Pricing, Inc. that are priced daily and whose fund holdings aggregate at least $2 million. As of June 30, 2011, the S&P/Investortools Municipal Bond Index was comprised of 56,838 securities with an aggregate current market value of $1,218 billion.
Bonus amounts can also be influenced by factors other than investment performance. These other factors are more subjective and are based on evaluations by each portfolio manager’s supervisor and reviews submitted by his or her peers. These reviews and evaluations often take into account a number of factors, including the portfolio manager’s effectiveness in communicating investment performance to shareholders and their advisors, his or her contribution to Nuveen Asset Management’s investment process and to the execution of investment strategies consistent with risk guidelines, his or her participation in asset growth, and his or her compliance with Nuveen Asset Management’s policies and procedures.
Investment performance is measured on a pre-tax basis, gross of fees for a Fund’s results and for its Lipper industry peer group.
Long-term incentive compensation. Certain key employees of Nuveen Investments and its affiliates, including certain portfolio managers, have received equity interests in the parent company of Nuveen Investments which entitle their holders to participate in the appreciation in the value of Nuveen Investments. In addition, certain key employees of Nuveen Asset Management, including certain portfolio managers, have received profits interests in Nuveen Asset Management which entitle their holders to participate in the firm’s growth over time.
There are generally no differences between the methods used to determine compensation with respect to the Funds and the Other Accounts shown in the table below.
Other Accounts Managed
In addition to the Funds, as of May 31, 2011, the portfolio managers are also primarily responsible for the day-to-day portfolio management of the following accounts:
Portfolio Manager | Type of Account Managed | Number of Accounts | Assets* | Number of Accounts with Performance Based Fees | Assets of Accounts with Performance Based Fees | |||||||||||||
Daniel J. Close | Registered Investment Companies | 25 | $4.03 billion | 0 | $0 | |||||||||||||
| Other Pooled Investment Vehicles | 0 | $0 | 0 | 0 | ||||||||||||||
| Other Accounts | 8 | $63.5 million | 0 | 0 | ||||||||||||||
S-43
Portfolio Manager | Type of Account Managed | Number of Accounts | Assets | Number of Accounts with Performance Based Fees | Assets of Accounts with Performance Based Fees | |||||||||||||
Christopher L. Drahn | Registered Investment Companies | 12 | $2.69 billion | 0 | $0 | |||||||||||||
| Other Pooled Investment Vehicles | 0 | $0 | 0 | 0 | ||||||||||||||
| Other Accounts | 4 | $214 million | 0 | 0 | ||||||||||||||
Steven M. Hlavin | Registered Investment Company | 10 | $2.78 billion | 0 | 0 | |||||||||||||
| Other Pooled Investment Vehicles | 0 | $0 | 0 | 0 | ||||||||||||||
| Other Accounts | 0 | $0 | 0 | 0 | ||||||||||||||
Conflicts of Interest
Each portfolio manager’s simultaneous management of the Funds and the other accounts noted above may present actual or apparent conflicts of interest with respect to the allocation and aggregation of securities orders placed on behalf of a Fund and the other account. Nuveen Asset Management, however, believes that such potential conflicts are mitigated by the fact that it has adopted several policies that address potential conflicts of interest, including best execution and trade allocation policies that are designed to ensure (1) that portfolio management is seeking the best price for portfolio securities under the circumstances, (2) fair and equitable allocation of investment opportunities among accounts over time and (3) compliance with applicable regulatory requirements. All accounts are to be treated in a non-preferential manner, such that allocations are not based upon account performance, fee structure or preference of the portfolio manager, although the allocation procedures may provide allocation preferences to funds with special characteristics (such as favoring state funds versus national funds for allocations of in-state bonds). In addition, Nuveen Asset Management has adopted a Code of Conduct that sets forth policies regarding conflicts of interest.
Beneficial Ownership of Securities
As of September 1, 2011, each portfolio manager beneficially owned the following dollar range of equity securities issued by the Funds and other Nuveen Funds managed by Nuveen Asset Management’s municipal investment team:
Name of Portfolio Manager | Fund | Dollar range of equity securities beneficially owned in Fund | Dollar range of equity securities beneficially owned in the remainder of Nuveen Funds managed by Nuveen Asset Management’s municipal investment team | |||||||
Daniel J. Close | Kentucky Municipal Bond Fund | $0 | $0 | |||||||
| Michigan Municipal Bond Fund | 0 | |||||||||
| Ohio Municipal Bond Fund | 0 | |||||||||
Christopher L. Drahn | Missouri Municipal Bond Fund | 0 | $10,001-$50,000 | |||||||
Steven M. Hlavin | Kansas Municipal Bond Fund | 0 | $0 | |||||||
| Wisconsin Municipal Bond Fund | 0 | |||||||||
S-44
Proxy Voting Policies
The Funds invest their assets primarily in municipal bonds and cash management securities. On rare occasions a Fund may acquire, directly or through a special purpose vehicle, equity securities of a municipal bond issuer whose bonds the Fund already owns when such bonds have deteriorated or are expected shortly to deteriorate significantly in credit quality. The purpose of acquiring equity securities generally will be to acquire control of the municipal bond issuer and to seek to prevent the credit deterioration or facilitate the liquidation or other workout of the distressed issuer’s credit problem. In the course of exercising control of a distressed municipal issuer, Nuveen Asset Management may pursue the Fund’s interests in a variety of ways, which may entail negotiating and executing consents, agreements and other arrangements, and otherwise influencing the management of the issuer. Nuveen Asset Management does not consider such activities proxy voting for purposes of Rule 206(4)-6 under the 1940 Act, but nevertheless provides reports to the Fund’s Board of Trustees on its control activities on a quarterly basis.
In the rare event that a municipal issuer were to issue a proxy or that the Funds were to receive a proxy issued by a cash management security, Nuveen Asset Management would either engage an independent third party to determine how the proxy should be voted or vote the proxy with the consent, or based on the instructions, of the Funds’ Board of Trustees or its representative. A member of Nuveen Asset Management’s legal department would oversee the administration of the voting, and ensure that records were maintained in accordance with Rule 206(4)-6, reports were filed with the Securities and Exchange Commission (“SEC”) on Form N-PX, and the results provided to the Fund’s Board of Trustees and made available to shareholders as required by applicable rules.
Nuveen Asset Management is responsible for decisions to buy and sell securities for the Funds, the negotiation of the prices to be paid or received for principal trades, and the allocation of transactions among various dealer firms. Portfolio securities will normally be purchased directly from an underwriter in a new issue offering or in the over-the-counter secondary market from the principal dealers in such securities, unless it appears that a better price or execution may be obtained elsewhere. Portfolio securities will not be purchased from Nuveen or its affiliates except in compliance with the 1940 Act.
The Funds expect that substantially all portfolio transactions will be effected on a principal (as opposed to an agency) basis and, accordingly, do not expect to pay significant amounts of brokerage commissions. Brokerage will not be allocated based on the sale of a Fund’s shares. Purchases from underwriters will include a commission or concession paid by the issuer to the underwriter, and purchases from dealers will include the spread between the bid and asked price. It is the policy of Nuveen Asset Management to seek the best execution under the circumstances of each trade. Nuveen Asset Management evaluates price as the primary consideration, with the financial condition, reputation and responsiveness of the dealer considered secondarily in determining best execution. Given the best execution obtainable, it may be Nuveen Asset Management’s practice to select dealers that, in addition, furnish research information (primarily credit analyses of issuers and general economic reports) and statistical and other services to Nuveen Asset Management. It is not possible to place a dollar value on information and statistical and other services received from dealers. Since it is only supplementary to Nuveen Asset Management’s own research efforts, the receipt of research information is not expected to reduce significantly Nuveen Asset Management’s expenses. For certain secondary market transactions where the execution capability of two brokers is judged to be of substantially similar quality, Nuveen Asset Management may randomly select one of them. While Nuveen Asset Management will be primarily responsible for the placement of the portfolio transactions of the Funds, the policies and practices of Nuveen Asset Management in this regard must be consistent with the foregoing and will, at all times, be subject to review by the Board of Trustees.
Nuveen Asset Management may manage other investment companies and investment accounts for other clients that have investment objectives similar to the Funds. Subject to applicable laws and regulations, Nuveen Asset Management seeks to allocate portfolio transactions equitably whenever
S-45
concurrent decisions are made to purchase or sell securities by a Fund and another advisory account. In making such allocations the main factors to be considered will be the respective investment objectives, the relative size of the portfolio holdings of the same or comparable securities, the availability of cash for investment or need to raise cash, and the size of investment commitments generally held. While this procedure could have a detrimental effect on the price or amount of the securities (or in the case of dispositions, the demand for securities) available to the Funds from time to time, it is the opinion of the Board of Trustees that the benefits available from the Nuveen Asset Management’s organization will outweigh any disadvantage that may arise from exposure to simultaneous transactions.
Each Fund’s net asset value per share is determined as set forth in its Prospectus under “General Information—Net Asset Value.”
Federal Income Tax Matters
This section summarizes some of the main U.S. federal income tax consequences of owning shares of a Fund. This section is current as of the date of this Statement of Additional Information. Tax laws and interpretations change frequently, and this summary does not describe all of the tax consequences to all taxpayers. For example, this summary generally does not describe your situation if you are a corporation, a non-U.S. person, a broker-dealer or other investor with special circumstances. In addition, this section does not describe your state, local or non-U.S. tax consequences. This federal income tax summary is based in part on the advice of counsel to the Funds. The Internal Revenue Service could disagree with any conclusions set forth in this section. In addition, Funds’ counsel was not asked to review, and has not reached a conclusion with respect to the federal income tax treatment of the assets to be deposited in the Funds. Consequently, this summary may not be sufficient for you to use for the purpose of avoiding penalties under federal tax law. As with any investment, you should seek advice based on your individual circumstances from your own tax professional.
Fund Status
Each Fund intends to qualify as a “regulated investment company” under the federal tax laws. If a Fund qualifies as a regulated investment company and distributes its income as required by the tax law, the Fund generally will not pay federal income taxes.
Qualification as a Regulated Investment Company
As a regulated investment company, a Fund will not be subject to federal income tax on the portion of its investment company taxable income, as that term is defined in the Code, without regard to the deduction for dividends paid and net capital gain (i.e., the excess of net long-term capital gain over net short-term capital loss) that it distributes to shareholders, provided that it distributes at least 90% of its investment company taxable income and 90% of its net tax-exempt interest income for the year (the “Distribution Requirement”) and satisfies certain other requirements of the Code that are described below. Each Fund also intends to make such distributions as are necessary to avoid the otherwise applicable 4% non-deductible excise tax on certain undistributed earnings.
In addition to satisfying the Distribution Requirement, each Fund must derive at least 90% of its gross income from (1) dividends, interest, certain payments with respect to loans of stock and securities, gains from the sale or disposition of stock, securities or non-U.S. currencies and other income (including but not limited to gains from options, futures or forward contracts) derived with respect to its business of investing in such stock, securities or currencies, and (2) net income derived from an interest in “qualified publicly traded partnerships” (as such term is defined in the Code). Each Fund must also satisfy an asset diversification test in order to qualify as a regulated investment company. Under this test, at the close of each quarter of a Fund’s taxable year, (1) 50% or more of the
S-46
value of the Fund’s assets must be represented by cash, United States government securities, securities of other regulated investment companies, and other securities, with such other securities limited, in respect of any one issuer, to an amount not greater than 5% of the value of the Fund’s assets and 10% of the outstanding voting securities of such issuer and (2) not more than 25% of the value of the Fund’s assets may be invested in securities of (a) any one issuer (other than U.S. government securities or securities of other regulated investment companies), or of two or more issuers which the Fund controls and which are engaged in the same, similar or related trades or businesses or (b) in the securities of one or more “qualified publicly traded partnerships” (as such term is defined in the Code). There are certain exceptions for failure to qualify if the failure is for reasonable cause or is de minimus, and certain corrective action is taken and certain tax payments are made by the Fund.
Distributions
After the end of each year, you will receive a tax statement that separates your Fund’s distributions into three categories, exempt-interest dividends, ordinary income distributions and capital gains dividends. Exempt-interest dividends generally are excluded from your gross income for federal income tax purposes. Some or all of the exempt-interest dividends, however, may be taken into account in determining your alternative minimum tax and may have other tax consequences (e.g., they may affect the amount of your social security benefits that are taxed). Ordinary income distributions are generally taxed at your ordinary tax rate. Generally, you will treat all capital gains dividends as long-term capital gains regardless of how long you have owned your shares. To determine your actual tax liability for your capital gains dividends, you must calculate your total net capital gain or loss for the tax year after considering all of your other taxable transactions, as described below. In addition, a Fund may make distributions that represent a return of capital for tax purposes and thus will generally not be taxable to you. The tax status of your distributions from your Fund is not affected by whether you reinvest your distributions in additional shares or receive them in cash. The income from your Fund that you must take into account for federal income tax purposes is not reduced by amounts used to pay a deferred sales fee, if any. The tax laws may require you to treat distributions made to you in January as if you had received them on December 31 of the previous year. Under the “Health Care and Education Reconciliation Act of 2010,” income from the Fund may also be subject to a new 3.8 percent “medicare tax” imposed for taxable years beginning after 2012. This tax will generally apply to your net investment income if your adjusted gross income exceeds certain threshold amounts, which are $250,000 in the case of married couples filing joint returns and $200,000 in the case of single individuals. Interest that is excluded from gross income and exempt-interest dividends from the Funds are generally not included in your net investment income for purposes of this tax.
Dividends Received Deduction
A corporation that owns shares generally will not be entitled to the dividends received deduction with respect to dividends received from the Funds because the dividends received deduction is generally not available for distributions from regulated investment companies.
If You Sell or Redeem Your Shares
If you sell or redeem your shares, you will generally recognize a taxable gain or loss. To determine the amount of this gain or loss, you must subtract your tax basis in your shares from the amount you receive in the transaction. Your tax basis in your shares is generally equal to the cost of your shares, generally including sales charges. In some cases, however, you may have to adjust your tax basis after you purchase your shares. Further, if you hold your shares for six months or less, any loss incurred by you related to the disposition of such a share will be disallowed to the extent of the exempt-interest dividends you received, except as otherwise described in the next section.
Capital Gains and Losses
If you are an individual, the maximum marginal federal tax rate for net capital gain is generally 15% (generally 0% for certain taxpayers in the 10% and 15% tax brackets). These capital gains rates are generally effective for taxable years beginning before January 1, 2013. For later periods, if you are an individual, the maximum marginal federal tax rate for net capital gain is generally 20% (10% for
S-47
certain taxpayers in the 10% and 15% tax brackets). The 20% rate is reduced to 18% for net capital gains from most property acquired after December 31, 2000 with a holding period of more than five years, and the 10% rate is reduced to 8% for net capital gains from most property (regardless of when acquired) with a holding period of more than five years.
Net capital gain equals net long-term capital gain minus net short-term capital loss for the taxable year. Capital gain or loss is long-term if the holding period for the asset is more than one year and is short-term if the holding period for the asset is one year or less. You must exclude the date you purchase your shares to determine your holding period. If you hold a share for six months or less, any loss incurred by you related to the disposition of such share will be disallowed to the extent of the exempt-interest dividends you received, except in the case of a regular dividend paid by the Fund if the Fund declares exempt-interest dividends on a daily basis in an amount equal to at least 90 percent of its net tax-exempt interest and distributes such dividends on a monthly or more frequent basis. To the extent, if any, it is not disallowed, it will be recharacterized as long-term capital loss to the extent of any capital gain dividend received. The tax rates for capital gains realized from assets held for one year or less are generally the same as for ordinary income. The Internal Revenue Code treats certain capital gains as ordinary income in special situations.
In-Kind Distributions
Under certain circumstances, as described in the Prospectus, you may receive an in-kind distribution of Fund securities when you redeem shares or when your Fund terminates. This distribution will be treated as a sale for federal income tax purposes and you will generally recognize gain or loss, generally based on the value at that time of the securities and the amount of cash received. The Internal Revenue Service could, however, assert that a loss may not be currently deducted.
Exchanges
If you exchange shares of a Fund for shares of another Nuveen Mutual Fund, the exchange would generally be considered a sale for federal income tax purposes.
Deductibility of Fund Expenses
Expenses incurred and deducted by your Fund will generally not be treated as income taxable to you. In some cases, however, you may be required to treat your portion of these Fund expenses as income. In these cases you may be able to take a deduction for these expenses. However, certain miscellaneous itemized deductions, such as investment expenses, may be deducted by individuals only to the extent that all of these deductions exceed 2% of the individual’s adjusted gross income. Further, because the Funds pay exempt-interest dividends, which are treated as exempt interest for federal income tax purposes, you will not be able to deduct some of your interest expense for debt that you incur or continue to purchase or carry your shares.
Foreign Investors
If you are a foreign investor (i.e., an investor other than a U.S. citizen or resident or a U.S. corporation, partnership, estate or trust), you should be aware that, generally, subject to applicable tax treaties, distributions from the Funds will be characterized as dividends for federal income tax purposes (other than dividends which a Fund properly reports as capital gain dividends) and, other than exempt-interest dividends, will be subject to U.S. income taxes, including withholding taxes, subject to certain exceptions described below. However, distributions received by a foreign investor from a Fund that are properly reported by the Fund as capital gain dividends may not be subject to U.S. federal income taxes, including withholding taxes, provided that the Fund makes certain elections and certain other conditions are met. In the case of dividends with respect to taxable years of a Fund beginning prior to 2012, distributions from the Fund that are properly reported by the Fund as an interest-related dividend attributable to certain interest income received by the Fund or as a short-term capital gain dividend attributable to certain net short-term capital gain income received by the Fund may not be subject to U.S. federal income taxes, including withholding taxes when received by certain foreign investors, provided that the Fund makes certain elections and certain other conditions are met. Distributions after December 31, 2012 may be subject to a U.S. withholding tax
S-48
of 30% in the case of distributions to (i) certain non-U.S. financial institutions that have not entered into an agreement with the U.S. Treasury to collect and disclose certain information and (ii) certain other non-U.S. entities that do not provide certain certifications and information about the entity’s U.S. owners.
State Tax Matters
The treatment of certain dividends from each Fund under particular state taxes is discussed below. It should be noted that this treatment may change if a Fund ever fails to qualify as a RIC for federal income tax purposes or if the exempt-interest dividends paid by a Fund are not excluded from gross income for federal income tax purposes. The discussion also assumes that each Fund will meet certain reporting and filing requirements under the applicable state laws and regulations. This discussion is based on state laws as enacted and construed on the date of this Statement of Additional Information and in certain cases is based on administrative guidance from state revenue departments. These laws and interpretations can, of course, change at any time. Only certain specific taxes are discussed below and Fund shares and Fund distributions may be subject to other state and local taxes. In addition, the discussions below are generally limited to Fund distributions attributable to certain tax-exempt interest. Generally, other distributions from a Fund are subject to all state income taxes, except that under certain circumstances, many states do provide exemptions for distributions attributable to interest on certain United States government obligations. Additionally, you may be subject to state income tax to the extent you sell or exchange Fund shares and realize a capital gain on the transaction.
Generally, unlike the federal individual income tax, state income taxes do not provide beneficial treatment of long-term capital gains, including capital gains dividends from a Fund. Further, most states restrict deductions for capital losses.
Ownership of shares in a Fund could result in other state and local income tax consequences to certain taxpayers. For example, interest expense incurred or continued to purchase or carry shares of a Fund, if the Fund distributes dividends exempt from a particular state income tax, generally is not deductible for purposes of that income tax.
Prospective investors should consult their tax advisors with respect to all state and local tax issues related to the ownership of shares in a Fund and the receipt of distributions from a Fund.
Kansas Tax Status
The assets of Nuveen Kansas Municipal Bond Fund will consist of interest bearing obligations issued by or on behalf of the State of Kansas and political subdivisions thereof (the “Kansas Bonds”) or by the government of Puerto Rico, Guam or the Virgin Islands (the “Possession Bonds,” and, collectively with the Kansas Bonds, the “Bonds”). The discussion in this section is based on the assumption that: (i) the Bonds were validly issued by the State of Kansas or a political subdivision thereof, or by the government of Puerto Rico, Guam or the Virgin Islands, as the case may be, (ii) the interest on the Bonds is excludable from gross income for federal income tax purposes, and (iii) with respect to the Possession Bonds, the Possession Bonds and the interest thereon are exempt from all state and local taxation. This disclosure does not address the taxation of persons other than full-time residents of the State of Kansas.
Exempt-interest dividends distributed by Nuveen Kansas Municipal Bond Fund that are excluded from gross income for federal income tax purposes and that are attributable to interest on (i) Kansas Bonds issued after December 31, 1987; (ii) Kansas Bonds issued prior to January 1, 1988, the interest on which is expressly exempt from income tax under Kansas law; and (iii) the Possession Bonds, are excluded from taxable income for purposes of the income tax imposed by the State of Kansas (the “Kansas Income Tax”) on individuals, fiduciaries, and corporations (other than insurance companies, national banking associations, banks, trust companies, federally chartered savings banks and savings and loan associations). Distributions from Nuveen Kansas Municipal Bond Fund, including exempt-interest dividends, may be subject to the taxes imposed by the State of Kansas on insurance companies, national banking associations, banks, trust companies, federally chartered savings banks and savings and loan associations, when received by shareholders subject to such taxes.
S-49
Distributions from Nuveen Kansas Municipal Bond Fund, other than exempt-interest dividends attributable to interest on (i) Kansas Bonds issued after December 31, 1987; (ii) Kansas Bonds issued prior to January 1, 1988, the interest on which is expressly exempt from income tax under Kansas law; and (iii) the Possession Bonds, will generally be subject to the Kansas Income Tax.
You generally will be subject to tax for purposes of the Kansas Income Tax on the gain recognized on the sale or redemption of a share of Nuveen Kansas Municipal Bond Fund.
You should be aware that, generally, interest on indebtedness incurred or continued to purchase or carry shares of Nuveen Kansas Municipal Bond Fund is not deductible for purposes of the Kansas Income Tax.
Each of the Adviser, Nuveen Asset Management and their counsel has not independently examined the Bonds or the opinions of bond counsel rendered in connection with the issuance of the Bonds. Ownership of shares in Nuveen Kansas Municipal Bond Fund may result in other Kansas consequences to certain taxpayers, and prospective investors should consult their tax advisors.
Kentucky Tax Status
The assets of Nuveen Kentucky Municipal Bond Fund will consist of interest bearing obligations issued by or on behalf of the State of Kentucky and political subdivisions of the State of Kentucky (the “Kentucky Bonds”) or by the government of Puerto Rico, Guam or the Virgin Islands (the “Possession Bonds,” and, collectively with the Kentucky Bonds, the “Bonds”). The discussion in this section is based on the assumption that: (i) the Bonds were validly issued by the State of Kentucky or its political subdivisions, or by the government of Puerto Rico, Guam or the Virgin Islands, as the case may be, (ii) the interest on the Bonds is excludable from gross income for federal income tax purposes and (iii) with respect to the Possession Bonds, the Possession Bonds and the interest thereon are exempt from all state and local taxation. This disclosure does not address the taxation of persons other than full-time residents of the State of Kentucky.
Exempt-interest dividends distributed by Nuveen Kentucky Municipal Bond Fund attributable to interest on the Bonds will be excluded from taxable income for purposes of the income tax imposed by the State of Kentucky on individuals (the “Kentucky Personal Income Tax”) and the income tax imposed by the State of Kentucky on certain corporations (the “Kentucky Corporate Income Tax”).
Distributions from Nuveen Kentucky Municipal Bond Fund, other than exempt-interest dividends attributable to interest on the Bonds, will generally be subject to the Kentucky Personal Income Tax and the Kentucky Corporate Income Tax.
You generally will be subject to tax for purposes of the Kentucky Personal Income Tax and the Kentucky Corporate Income Tax on the gain recognized on the sale or redemption of a share of Nuveen Kentucky Municipal Bond Fund.
You should be aware that, generally, interest on indebtedness incurred or continued to purchase or carry shares of Nuveen Kentucky Municipal Bond Fund is not deductible for purposes of the Kentucky Personal Income Tax and the Kentucky Corporate Income Tax.
Each of the Adviser, Nuveen Asset Management and their counsel has not independently examined the Bonds or the opinions of bond counsel rendered in connection with the issuance of the Bonds. Ownership of shares in Nuveen Kentucky Municipal Bond Fund may result in other Kentucky consequences to certain taxpayers, and prospective investors should consult their tax advisors.
Michigan Tax Status
The assets of Nuveen Michigan Municipal Bond Fund will consist of interest bearing obligations issued by or on behalf of the State of Michigan and political subdivisions of the State of Michigan (the “Michigan Bonds”) or by the government of Puerto Rico, Guam or the Virgin Islands (the “Possession Bonds,” and, collectively with the Michigan Bonds, the “Bonds”). The discussion in this section is based on the assumption that: (i) the Bonds were validly issued by the State of Michigan or its political subdivisions, or by the government of Puerto Rico, Guam or the Virgin Islands, as the case may be, (ii) the interest on the Bonds is excludable from gross income for federal income tax purposes and (iii)
S-50
with respect to the Possession Bonds, the Possession Bonds and the interest thereon are exempt from all state and local taxation. This disclosure does not address the taxation of persons other than full-time residents of the State of Michigan.
Exempt-interest dividends distributed by Nuveen Michigan Municipal Bond Fund attributable to interest on the Bonds will be excluded from taxable income for purposes of the personal income tax (the “Michigan Personal Income Tax”) imposed on individuals by the State of Michigan. Shareholders should consult their own tax advisors with respect to the treatment of distributions from Nuveen Michigan Municipal Bond Fund for purposes of the Michigan Business Tax, and for purposes of the Michigan Corporate Income Tax, which is scheduled to become applicable on January 1, 2012.
Distributions from Nuveen Michigan Municipal Bond Fund, other than exempt-interest dividends attributable to interest on the Bonds, will generally be subject to the Michigan Personal Income Tax.
You generally will be subject to tax for purposes of the Michigan Personal Income Tax on the gain recognized on the sale or redemption of a share of Nuveen Michigan Municipal Bond Fund.
You should be aware that, generally, interest on indebtedness incurred or continued to purchase or carry shares of Nuveen Michigan Municipal Bond Fund is not deductible for purposes of the Michigan Personal Income Tax.
Each of the Adviser, Nuveen Asset Management and their counsel has not independently examined the Bonds or the opinions of bond counsel rendered in connection with the issuance of the Bonds. Ownership of shares in Nuveen Michigan Municipal Bond Fund may result in other Michigan consequences to certain taxpayers, and prospective investors should consult their tax advisors.
Missouri Tax Status
The assets of Nuveen Missouri Municipal Bond Fund will consist of interest bearing obligations issued by or on behalf of the State of Missouri and political subdivisions thereof (the “Missouri Bonds”) or by the government of Puerto Rico, Guam or the Virgin Islands (the “Possession Bonds,” and, collectively with the Missouri Bonds, the “Bonds”). The discussion in this section is based on the assumption that: (i) the Bonds were validly issued by the State of Missouri or a political subdivision thereof, or by the government of Puerto Rico, Guam or the Virgin Islands, as the case may be, (ii) the interest on the Bonds is excludable from gross income for federal income tax purposes, and (iii) with respect to the Possession Bonds, the Possession Bonds and the interest thereon are exempt from all state and local taxation. This disclosure does not address the taxation of persons other than full-time residents of the State of Missouri.
Exempt-interest dividends distributed by Nuveen Missouri Municipal Bond Fund that are excluded from gross income for federal income tax purposes and that are attributable to interest on the Bonds will be excluded from taxable income for purposes of the income tax imposed by the State of Missouri on individuals, trusts and estates (the “Missouri Personal Income Tax”) and the income tax imposed by the State of Missouri on certain corporations (the “Missouri Corporate Income Tax”) (not including banking institutions, credit institutions, credit unions and savings and loan associations), provided Nuveen Missouri Municipal Bond Fund designates such dividends in an annual notice mailed to shareholders.
Distributions from Nuveen Missouri Municipal Bond Fund, other than exempt-interest dividends attributable to interest on the Bonds, will generally be subject to the Missouri Personal Income Tax and the Missouri Corporate Income Tax.
Distributions from Nuveen Missouri Municipal Bond Fund, including exempt-interest dividends attributable to interest on the Bonds, may be subject to the franchise taxes imposed on banking institutions, credit institutions, credit unions and savings and loan associations (the “Missouri Franchise Taxes”).
You generally will be subject to tax for purposes of the Missouri Personal Income Tax, the Missouri Corporate Income Tax and the Missouri Franchise Taxes on the gain recognized on the sale or redemption of a share of Nuveen Missouri Municipal Bond Fund.
S-51
You should be aware that, generally, interest on indebtedness incurred or continued to purchase or carry shares of Nuveen Missouri Municipal Bond Fund is not deductible for purposes of the Missouri Personal Income Tax and the Missouri Corporate Income Tax.
Each of the Adviser, Nuveen Asset Management and their counsel has not independently examined the Bonds or the opinions of bond counsel rendered in connection with the issuance of the Bonds. Ownership of shares in Nuveen Missouri Municipal Bond Fund may result in other Missouri consequences to certain taxpayers, and prospective investors should consult their tax advisors.
Ohio Tax Status
The assets of Nuveen Ohio Municipal Bond Fund will consist of interest bearing obligations issued by or on behalf of the State of Ohio and political subdivisions thereof (the “Ohio Bonds”) or by the government of Puerto Rico, Guam or the Virgin Islands (the “Possession Bonds,” and, collectively with the Ohio Bonds, the “Bonds”). The discussion in this section is based on the assumption that: (i) the Bonds were validly issued by the State of Ohio or a political subdivision thereof, or by the government of Puerto Rico, Guam or the Virgin Islands, as the case may be, (ii) the interest on the Bonds is excludable from gross income for federal income tax purposes, (iii) with respect to the Possession Bonds, the Possession Bonds and the interest thereon are exempt from all state and local taxation and (iv) Nuveen Ohio Municipal Bond Fund qualifies as a qualified investment trust under the Ohio Revised Code and meets the reporting requirements specified therein. This disclosure does not address the taxation of persons other than full-time residents of the State of Ohio.
Exempt-interest dividends distributed by Nuveen Ohio Municipal Bond Fund that are excluded from gross income for federal income tax purposes and that are attributable to interest on the Bonds will be excluded from taxable income for purposes of (a) the Ohio income tax imposed by the State of Ohio on individuals (the “Ohio Personal Income Tax”) and (b) the net income base (the “Ohio Corporate Net Income Tax”) used in calculating the taxes levied on those corporations subject to the corporate franchise taxes imposed by the State of Ohio under Chapter 5733 of the Ohio Revised Code.
Shares of Nuveen Ohio Municipal Bond Fund and distributions from Nuveen Ohio Municipal Bond Fund, including exempt-interest dividends attributable to interest on the Bonds will generally be included in the total asset value base (the “Ohio Corporate Net Worth Tax”) used in calculating the taxes levied on those corporations subject to the corporate franchise taxes imposed by the State of Ohio under Chapter 5733 of the Ohio Revised Code.
Based on interpretations of Ohio law by the Tax Commissioner of Ohio, capital gain dividends distributed by Nuveen Ohio Municipal Bond Fund that are attributable to capital gains on the Ohio Bonds should be excluded from taxable income for purposes of the Ohio Personal Income Tax and the Ohio Corporate Net Income Tax. Capital gain dividends attributable to capital gains on the Possession Bonds will not be excluded from taxable income for these purposes.
Distributions from Nuveen Ohio Municipal Bond Fund, other than exempt-interest dividends attributable to interest on the Bonds and other than capital gain dividends attributable to capital gains on the Ohio Bonds, generally will be subject to the Ohio Personal Income Tax and the Ohio Corporate Net Income Tax.
You generally will be subject to tax for purposes of the Ohio Personal Income Tax, the Ohio Corporate Net Income Tax and the Ohio Corporate Net Worth Tax on the gain recognized on the sale or redemption of a share of Nuveen Ohio Municipal Bond Fund.
You should be aware that, generally, interest on indebtedness incurred or continued to purchase or carry shares of Nuveen Ohio Municipal Bond Fund is not deductible for purposes of the Ohio Personal Income Tax, the Ohio Corporate Net Income Tax and the Ohio Corporate Net Worth Tax.
Each of the Adviser, Nuveen Asset Management and their counsel has not independently examined the Bonds or the opinions of bond counsel rendered in connection with the issuance of the Bonds. Ownership of shares in Nuveen Ohio Municipal Bond Fund may result in other Ohio consequences to certain taxpayers, and prospective investors should consult their tax advisors.
S-52
Wisconsin Tax Status
The assets of Nuveen Wisconsin Municipal Bond Fund will consist of certain interest bearing obligations issued by or on behalf of the State of Wisconsin, any public authority, commission, board or other agency created by the State of Wisconsin or any political subdivision of the State of Wisconsin, or political subdivisions thereof (the “Wisconsin Bonds”) or by the government of Puerto Rico, Guam or the Virgin Islands (the “Possession Bonds,” and, collectively with the Wisconsin Bonds, the “Bonds”). The discussion in this section is based on the assumption that: (i) the Bonds were validly issued by the State of Wisconsin or its municipalities, or by the government of Puerto Rico, Guam or the Virgin Islands, as the case may be, (ii) the interest on the Bonds is excludable from gross income for federal income tax purposes, (iii) the interest on the Bonds is exempt from the income tax imposed by the State of Wisconsin on individuals (the “Wisconsin Personal Income Tax”) and from the income tax imposed by the State of Wisconsin on certain corporations (the “Wisconsin Corporate Income Tax”) and (iv) with respect to the Possession Bonds, the Possession Bonds and the interest thereon are exempt from all state and local taxation. This disclosure does not address the taxation of persons other than full-time residents of the State of Wisconsin.
Exempt-interest dividends distributed by Nuveen Wisconsin Municipal Bond Fund attributable to interest on the Bonds will be excluded from taxable income for purposes of the Wisconsin Personal Income Tax and the Wisconsin Corporate Income Tax; however, these exempt-interest dividends will be subject to the Wisconsin franchise tax that is imposed on the net income of entities subject to that tax (the “Wisconsin Franchise Tax”).
Distributions from Nuveen Wisconsin Municipal Bond Fund, other than exempt-interest dividends attributable to interest on the Bonds, will generally be subject to the Wisconsin Personal Income Tax and the Wisconsin Corporate Income Tax, and all distributions from Nuveen Wisconsin Municipal Bond Fund will generally be subject to the Wisconsin Franchise Tax.
You generally will be subject to tax for purposes of the Wisconsin Personal Income Tax, the Wisconsin Corporate Income Tax and the Wisconsin Franchise Tax on the gain recognized on the sale or redemption of a share of Nuveen Wisconsin Municipal Bond Fund.
You should be aware that, generally, interest on indebtedness incurred or continued to purchase or carry shares of Nuveen Wisconsin Municipal Bond Fund is not deductible for purposes of the Wisconsin Personal Income Tax, the Wisconsin Corporate Income Tax and the Wisconsin Franchise Tax.
Each of the Adviser, Nuveen Asset Management and their counsel has not independently examined the Bonds or the opinions of bond counsel rendered in connection with the issuance of the Bonds. Ownership of shares in Nuveen Wisconsin Municipal Bond Fund may result in other Wisconsin consequences to certain taxpayers, and prospective investors should consult their tax advisors.
PURCHASE AND REDEMPTION OF FUND SHARES
As described in the Prospectus, the Funds provide you with alternative ways of purchasing Fund shares based upon your individual investment needs and preferences. The Funds are generally not a suitable investment for individuals investing through retirement plans.
Each class of shares of a Fund represents an interest in the same portfolio of investments. Each class of shares is identical in all respects except that each class bears its own class expenses, including distribution and administration expenses, and each class has exclusive voting rights with respect to any distribution or service plan applicable to its shares. As a result of the differences in the expenses borne by each class of shares, net income per share, dividends per share and net asset value per share will vary among a Fund’s classes of shares. There are no conversion, preemptive or other subscription rights, except that Class B shares automatically convert to Class A shares as described below.
Shareholders of each class will share expenses proportionately for services that are received equally by all shareholders. A particular class of shares will bear only those expenses that are directly attributable to that class, where the type or amount of services received by a class varies from one class to another. For example, class-specific expenses generally will include distribution and service fees for those classes that pay such fees.
S-53
The expenses to be borne by specific classes of shares may include (i) transfer agency fees attributable to a specific class of shares, (ii) printing and postage expenses related to preparing and distributing materials such as shareholder reports, prospectuses and proxy statements to current shareholders of a specific class of shares, (iii) SEC and state securities registration fees incurred by a specific class of shares, (iv) the expense of administrative personnel and services required to support the shareholders of a specific class of shares, (v) litigation or other legal expenses relating to a specific class of shares, (vi) trustees’ fees or expenses incurred as a result of issues relating to a specific class of shares, (vii) accounting expenses relating to a specific class of shares and (viii) any additional incremental expenses subsequently identified and determined to be properly allocated to one or more classes of shares.
Class A Shares
Class A shares may be purchased at a public offering price equal to the applicable net asset value per share plus an up-front sales charge imposed at the time of purchase as set forth in the Prospectus. Shareholders may qualify for a reduced sales charge, or the sales charge may be waived in its entirety, as described below. Nuveen Mutual Funds currently utilize two transfer agents and the ability to use the methods described below to reduce your sales charge is limited to aggregating values or purchases of funds that have the same transfer agent. Class A shares are also subject to an annual service fee of .20%. See “Distribution and Service Plan.” Set forth below is an example of the method of computing the offering price of the Class A shares of a Fund. The example assumes a purchase on May 31, 2011 of Class A shares from the Nuveen Kansas Municipal Bond Fund aggregating less than $50,000 subject to the schedule of sales charges set forth in the Prospectus at a price based upon the net asset value of the Class A shares.
Net asset value per share | $ | 10.37 | ||
Per share sales charge—4.20% of public offering price (4.34% of net asset value per share) | .45 | |||
|
| |||
Per share offering price to the public | $ | 10.82 | ||
|
|
Each Fund receives the entire net asset value of all Class A shares that are sold. The Distributor retains the full applicable sales charge from which it pays the uniform reallowances shown in the Prospectus to financial intermediaries.
Reduction or Elimination of Up-Front Sales Charge on Class A Shares
Rights of Accumulation. You may qualify for a reduced sales charge on a purchase of Class A shares of a Fund if the amount of your purchase, when added to the value that day of all of your shares of any Nuveen Mutual Fund, falls within the amounts stated in the Class A Sales Charges and Commissions table in “How You Can Buy and Sell Shares” in the Prospectus. You or your financial advisor must notify the Distributor or the Fund’s transfer agent of any cumulative discount whenever you plan to purchase Class A shares of a Fund that you wish to qualify for a reduced sales charge.
Letter of Intent. You may qualify for a reduced sales charge on a purchase of Class A shares of a Fund if you plan to purchase Class A shares of Nuveen Mutual Funds over the next 13 months and the total amount of your purchases would, if purchased at one time, qualify you for one of the reduced sales charges shown in the Class A Sales Charges and Commissions table in “How You Can Buy and Sell Shares” in the Prospectus. In order to take advantage of this option, you must complete the applicable section of the Application Form or sign and deliver to your financial advisor or other financial intermediary or to the Fund’s transfer agent a written Letter of Intent in a form acceptable to the Distributor. A Letter of Intent states that you intend, but are not obligated, to purchase over the next 13 months a stated total amount of Class A shares that would qualify you for a reduced sales charge shown above. You may count shares of all Nuveen Mutual Funds that you already own and any Class I or Class C shares of a Nuveen Mutual Fund that you purchase over the next 13 months towards completion of your investment program, but you will receive a reduced sales charge only on new Class A shares you purchase with a sales charge over the 13 months. You cannot count towards completion of your investment program Class A shares that you purchase without a sales charge through investment of distributions from a Nuveen Mutual Fund or a Nuveen Defined Portfolio, or otherwise.
S-54
By establishing a Letter of Intent, you agree that your first purchase of Class A shares of a Fund following execution of the Letter of Intent will be at least 5% of the total amount of your intended purchases. You further agree that shares representing 5% of the total amount of your intended purchases will be held in escrow pending completion of these purchases. All dividends and capital gains distributions on Class A shares held in escrow will be credited to your account. If total purchases, less redemptions, prior to the expiration of the 13 month period equal or exceed the amount specified in your Letter of Intent, the Class A shares held in escrow will be transferred to your account. If the total purchases, less redemptions, are less than the amount specified, you must pay the Distributor an amount equal to the difference between the amounts paid for these purchases and the amounts which would have been paid if the higher sales charge had been applied. If you do not pay the additional amount within 20 days after written request by the Distributor or your financial advisor, the Distributor will redeem an appropriate number of your escrowed Class A shares to meet the required payment. By establishing a Letter of Intent, you irrevocably appoint the Distributor as attorney to give instructions to redeem any or all of your escrowed shares, with full power of substitution in the premises.
You or your financial advisor must notify the Distributor or the Funds’ transfer agent whenever you make a purchase of Fund shares that you wish to be covered under the Letter of Intent option.
For purposes of determining whether you qualify for a reduced sales charge as described under Rights of Accumulation and Letter of Intent, you may include together with your own purchases those made by your spouse or domestic partner and your children under the age of 21 years, whether these purchases are made through a taxable or non-taxable account. You may also include purchases made by a corporation, partnership or sole proprietorship which is 100% owned, either alone or in combination, by any of the foregoing. In addition, a trustee or other fiduciary can count all shares purchased for a single trust, estate or other single fiduciary account that has multiple accounts (including one or more employee benefit plans of the same employer).
Reinvestment of Nuveen Defined Portfolio Distributions. You may purchase Class A shares without an up-front sales charge by reinvestment of distributions from any of the various Defined Portfolios sponsored by the Distributor. There is no initial or subsequent minimum investment requirement for such reinvestment purchases. The Distributor is no longer sponsoring new Defined Portfolios.
Also, investors will be able to buy Class A shares at net asset value by using the termination/maturity proceeds from Nuveen Defined Portfolios. You must provide the Distributor appropriate documentation that the Defined Portfolio termination/maturity occurred not more than 90 days prior to reinvestment.
Elimination of Sales Charge on Class A Shares. Class A shares of a Fund may be purchased at net asset value without a sales charge by the following categories of investors:
| • | investors purchasing $1,000,000 or more; |
| • | trustees and former trustees of the Nuveen Funds; |
| • | full-time and retired employees of Nuveen Investments, and subsidiaries thereof, or their immediate family members (immediate family members are defined as their spouses or domestic partners, parents, children, grandparents, grandchildren, parents-in-law, sons- and daughters-in-law, siblings, a sibling’s spouse and a spouse’s siblings); |
| • | any person who, for at least the last 90 days, has been an officer, director or employee of any financial intermediary, or their immediate family members; |
| • | bank or broker-affiliated trust departments investing funds over which they exercise exclusive discretionary investment authority and that are held in a fiduciary, agency, advisory, custodial or similar capacity; |
| • | investors purchasing on a periodic fee, asset-based fee or no transaction fee basis through a broker-dealer sponsored mutual fund purchase program; and |
| • | clients of investment advisers, financial planners or other financial intermediaries that charge periodic or asset-based fees for their services. |
S-55
Any Class A shares purchased pursuant to a special sales charge waiver must be acquired for investment purposes and on the condition that they will not be transferred or resold except through redemption by the Funds. You or your financial advisor must notify the Distributor or your Fund’s transfer agent whenever you make a purchase of Class A shares of any Fund that you wish to be covered under these special sales charge waivers.
Class A shares of any Fund may be issued at net asset value without a sales charge in connection with the acquisition by a Fund of another investment company. All purchases under the special sales charge waivers will be subject to minimum purchase requirements as established by the Funds.
The reduced sales charge programs may be modified or discontinued by the Funds at any time. For more information about the purchase of Class A shares or the reduced sales charge program, or to obtain the required application forms, call Nuveen Investor Services toll-free at (800) 257-8787.
Class B Shares
The Funds will only issue Class B shares (i) upon the exchange of Class B shares from another Nuveen Mutual Fund and (ii) for purposes of dividend reinvestment. Class B shares are not available for new accounts or for additional investment into existing accounts.
You may be subject to a Contingent Deferred Sales Charge (“CDSC”) if you redeem your Class B shares prior to the end of the sixth year after purchase. See “Reduction or Elimination of Contingent Deferred Sales Charge” below.
Class B shares acquired through the reinvestment of dividends are not subject to a CDSC. Any CDSC will be imposed on the lower of the redeemed shares’ cost or net asset value at the time of redemption.
Class B shares will automatically convert to Class A shares eight years after purchase. The purpose of the conversion is to limit the distribution fees you pay over the life of your investment. All conversions will be done at net asset value without the imposition of any sales load, fee, or other charge, so that the value of each shareholder’s account immediately before conversion will be the same as the value of the account immediately after conversion. Class B shares acquired through reinvestment of distributions will convert into Class A shares based on the date of the initial purchase to which such shares relate. For this purpose, Class B shares acquired through reinvestment of distributions will be attributed to particular purchases of Class B shares in accordance with such procedures as the Board of Trustees may determine from time to time. Class B shares that are converted to Class A shares will remain subject to an annual service fee that is identical in amount for both Class B shares and Class A shares. Since net asset value per share of the Class B shares and the Class A shares may differ at the time of conversion, a shareholder may receive more or fewer Class A shares than the number of Class B shares converted. Any conversion of Class B shares into Class A shares will be subject to the continuing availability of an opinion of counsel or a private letter ruling from the Internal Revenue Service to the effect that the conversion of shares would not constitute a taxable event under federal income tax law. Conversion of Class B shares into Class A shares might be suspended if such an opinion or ruling were no longer available.
Class C Shares
You may purchase Class C shares at a public offering price equal to the applicable net asset value per share without any up-front sales charge. Class C shares are subject to an annual distribution fee of 0.55% to compensate the Distributor for paying your financial advisor or other financial intermediary an ongoing sales commission. Class C shares are also subject to an annual service fee of 0.20% to compensate financial intermediaries for providing you with ongoing financial advice and other account services. The Distributor compensates financial intermediaries for sales of Class C shares at the time of the sale at a rate of 0.75% of the amount of Class C shares purchased, which represents an advance of the first year’s distribution fee of 0.55% plus an advance on the first year’s annual service fee of 0.20%. See “Distribution and Service Plans.”
Class C share purchase orders equaling or exceeding $1,000,000 will not be accepted. In addition, purchase orders for a single purchaser that, when added to the value that day of all of such purchaser’s shares of any class of any Nuveen Mutual Fund, cause the purchaser’s cumulative total of shares in Nuveen Mutual Funds to equal or exceed the aforementioned limit will not be accepted. Purchase orders
S-56
for a single purchaser equal to or exceeding the foregoing limit should be placed only for Class A shares, unless such purchase has been reviewed and approved as suitable for the client by the appropriate compliance personnel of the financial intermediary, and the Fund receives written confirmation of such approval. Class C shares do not convert.
Redemption of Class C shares within 12 months of purchase may be subject to a CDSC of 1% of the lower of the purchase price or redemption proceeds. Because Class C shares do not convert to Class A shares and continue to pay an annual distribution fee indefinitely, Class C shares should normally not be purchased by an investor who expects to hold shares for significantly longer than eight years.
Reduction or Elimination of Contingent Deferred Sales Charge
Class A shares are normally redeemed at net asset value, without any CDSC. However, in the case of Class A shares purchased at net asset value without a sales charge because the purchase amount exceeded $1 million, a CDSC is imposed on any redemption within 18 months of purchase. In the case of Class B shares redeemed within six years of purchase, a CDSC is imposed, beginning at 5% for redemptions within the first year, declining to 4% for redemptions within years two and three, and declining by 1% each year thereafter until disappearing after the sixth year. Class C shares are redeemed at net asset value, without any CDSC, except that a CDSC of 1% is imposed upon any redemption of Class C Shares that are redeemed within 12 months of purchase (except in cases where the shareholder’s financial advisor agreed to waive the right to receive an advance of the first year’s distribution and service fee).
In determining whether a CDSC is payable, each Fund will first redeem shares not subject to any charge, and then will redeem shares held for the longest period, unless the shareholder specifies another order. No CDSC is charged on shares purchased as a result of automatic reinvestment of dividends or capital gains paid. In addition, no CDSC will be charged on exchanges of shares into another Nuveen Mutual Fund. The holding period is calculated on a monthly basis and begins on the first day of the month in which the purchase was made. The CDSC is assessed on an amount equal to the lower of the then current market value or the cost of the shares being redeemed. Accordingly, no sales charge is imposed on increases of net asset value above the initial purchase price. The Distributor receives the amount of any CDSC shareholders pay.
The CDSC may be waived or reduced under the following circumstances: (i) in the event of total disability (as evidenced by a determination by the federal Social Security Administration) of the shareholder (including a registered joint owner) occurring after the purchase of the shares being redeemed; (ii) in the event of the death of the shareholder (including a registered joint owner); (iii) for redemptions made pursuant to a systematic withdrawal plan, up to 1% monthly, 3% quarterly, 6% semiannually or 12% annually of an account’s net asset value depending on the frequency of the plan as designated by the shareholder; (iv) involuntary redemptions caused by operation of law; (v) redemptions in connection with a payment of account or plan fees; (vi) redemptions in connection with the exercise of a reinstatement privilege whereby the proceeds of a redemption of a Fund’s shares subject to a sales charge are reinvested in shares of certain Funds within a specified number of days; (vii) redemptions in connection with the exercise of a Fund’s right to redeem all shares in an account that does not maintain a certain minimum balance or that the Board of Trustees has determined may have material adverse consequences to the shareholders of a Fund; (viii) in whole or in part for redemptions of shares by shareholders with accounts in excess of specified breakpoints that correspond to the breakpoints under which the up-front sales charge on Class A shares is reduced pursuant to Rule 22d-1 under the Act; (ix) redemptions of shares purchased under circumstances or by a category of investors for which Class A shares could be purchased at net asset value without a sales charge; (x) redemptions of Class A, Class B or Class C shares if the proceeds are transferred to an account managed by the Adviser and the Adviser refunds the advanced service and distribution fees to the Distributor; (xi) redemptions of Class C shares in cases where the Distributor did not advance the first year’s service and distribution fees when such shares were purchased; and (xii) redemptions of Class A shares where the Distributor did not pay a sales commission when such shares were purchased. If a Fund waives or reduces the CDSC, such waiver or reduction would be uniformly applied to all Fund shares in the particular category. In waiving or reducing a CDSC, the Funds will comply with the requirements of Rule 22d-1 under the 1940 Act.
S-57
Class I Shares
Class I shares are available for purchase by clients of financial intermediaries who charge such clients an ongoing fee for advisory, investment, consulting or related services. Such clients may include individuals, corporations, endowments and foundations. The minimum initial investment for such clients is $100,000, but this minimum will be lowered to $250 for clients of financial intermediaries that have accounts holding Class I shares with an aggregate value of at least $100,000. The Distributor may also lower the minimum to $250 for clients of financial intermediaries anticipated to reach this Class I share holdings level.
Class I shares are also available for purchase by family offices and their clients. A family office is a company that provides certain financial and other services to a high net worth family or families. The minimum initial investment for family offices and their clients is $100,000, but this minimum will be lowered to $250 for clients of family offices that have accounts holding Class I shares with an aggregate value of at least $100,000. The Distributor may also lower the minimum to $250 for clients of family offices anticipated to reach this Class I share holdings level.
Class I shares also are available for purchase, with no minimum initial investment, by the following categories of investors:
| • | bank or broker-affiliated trust departments investing funds over which they exercise exclusive discretionary investment authority and that are held in a fiduciary, agency, advisory, custodial or similar capacity; |
| • | advisory accounts of Nuveen Fund Advisors and its affiliates, including other Nuveen Mutual Funds whose investment policies permit investments in other investment companies; |
| • | trustees/directors and former trustees/directors of any Nuveen Fund, and their immediate family members (“immediate family members” are defined as spouses or domestic partners, parents, children, grandparents, grandchildren, parents-in-law, sons-in-law and daughters-in-law, siblings, a sibling’s spouse and a spouse’s siblings); |
| • | officers, directors and former directors of Nuveen Investments and its affiliates, and their immediate family members; |
| • | full-time and retired employees of Nuveen Investments and its affiliates, and their immediate family members; and |
| • | any person who, for at least the last 90 days, has been an officer, director or employee of any financial intermediary, and their immediate family members. |
Any shares purchased by investors falling within any of the last four categories listed above must be acquired for investment purposes and on the condition that they will not be transferred or resold except through redemption by a Fund.
Holders of Class I shares may purchase additional Class I shares using dividends and capital gains distributions on their shares. In addition, shareholders of Nuveen Defined Portfolios may reinvest their distributions in Class I shares, if, before September 6, 1994 (or before June 13, 1995 in the case of Nuveen Intermediate Duration Municipal Bond Fund), such shareholders had elected to reinvest distributions in Nuveen Mutual Fund shares.
If you are eligible to purchase either Class I shares or Class A shares without a sales charge at net asset value, you should be aware of the differences between these two classes of shares. Class A shares are subject to an annual service fee to compensate financial intermediaries for providing you with ongoing account services. Class I shares are not subject to a distribution or service fee and, consequently, holders of Class I shares may not receive the same types or levels of services from financial intermediaries. In choosing between Class A shares and Class I shares, you should weigh the benefits of the services to be provided by financial intermediaries against the annual service fee imposed upon the Class A shares.
S-58
Shareholder Programs
Exchange Privilege
Nuveen Mutual Funds currently utilize two transfer agents. Until November 30, 2011, if you hold shares directly with a Fund, you may exchange shares of a class of a Fund for shares of the same class of any other Nuveen Mutual Fund with reciprocal exchange privileges, at net asset value without a sales charge, by either sending a written request to the applicable Fund, c/o Nuveen Investor Services, P.O. Box 8530, Boston, Massachusetts 02266-8530, or by calling Nuveen Investor Services toll free at (800) 257-8787. If your shares are held with a financial intermediary, the financial intermediary must have the operational capability to support exchanges. The shares to be purchased through an exchange must be offered in your state of residence. The total value of exchanged shares must at least equal the minimum investment requirement of the Nuveen Mutual Fund being purchased. You may also, under certain limited circumstances, exchange between certain classes of shares of the same Fund. An exchange between classes of shares of the same Fund may not be considered a taxable event; please consult your own tax advisor for further information. An exchange between classes of shares of the same Fund may be done in writing to the address stated above.
Effective December 1, 2011, you may exchange fund shares into an identically registered account for the same class of another Nuveen Mutual Fund available in your state provided that the funds have the same transfer agent. Exchanges between funds with different transfer agents are not allowed. Your exchange must meet the minimum purchase requirements of the fund into which you are exchanging. You may also, under certain limited circumstances, exchange between certain classes of shares of the same Fund. An exchange between classes of shares of the same Fund may not be considered a taxable event; please consult your own tax advisor for further information.
If you hold your shares directly with the Fund, you will continue to be able to exchange your shares by either sending a written request to the applicable Fund, c/o Nuveen Investor Services, P.O. Box 8530, Boston, Massachusetts 02266-8530 or by calling Nuveen Investor Services toll free at (800) 257-8787.
If you exchange shares between different Nuveen Mutual Funds and your shares are subject to a CDSC, no CDSC will be charged at the time of the exchange. However, if you subsequently redeem the shares acquired through the exchange, the redemption may be subject to a CDSC, depending on when you purchased your original shares and the CDSC schedule of the fund from which you exchanged your shares. If you exchange between classes of shares of the same Fund and your original shares are subject to a CDSC, the CDSC will be assessed at the time of the exchange.
For federal income tax purposes, an exchange between different Nuveen Mutual Funds constitutes a sale and purchase of shares and may result in capital gain or loss. Before making any exchange, you should obtain the Prospectus for the Nuveen Mutual Fund you are purchasing and read it carefully. If the registration of the account for the Fund you are purchasing is not exactly the same as that of the fund account from which the exchange is made, written instructions from all holders of the account from which the exchange is being made must be received, with signatures guaranteed by a member of an approved Medallion Guarantee Program or in such other manner as may be acceptable to the Fund. You may also exchange shares by telephone if you authorize telephone exchanges by checking the applicable box on the Application Form or by calling Nuveen Investor Services toll-free at (800) 257-8787 to obtain an authorization form. Each Fund reserves the right to revise or suspend the exchange privilege, limit the amount or number of exchanges, or reject any exchange. Shareholders will be provided with at least 60 days’ notice of any material revision to or termination of the exchange privilege.
The exchange privilege is not intended to permit a Fund to be used as a vehicle for short-term trading. Excessive exchange activity may interfere with portfolio management, raise expenses and otherwise have an adverse effect on all shareholders. In order to limit excessive exchange activity and in other circumstances where Fund management believes doing so would be in the best interest of the Fund, each Fund reserves the right to revise or terminate the exchange privilege, or limit the amount or number of exchanges or reject any exchange. Shareholders would be notified of any such action to the extent required by law. See “Frequent Trading Policy” below.
S-59
Reinstatement Privilege
If you redeemed Class A or Class C shares of a Fund or any other Nuveen Mutual Fund that were subject to a sales charge or a CDSC, you have up to one year to reinvest all or part of the full amount of the redemption in the same class of shares of the Fund at net asset value. The reinstatement privilege for Class B shares is no longer available. Nuveen Mutual Funds currently utilize two transfer agents. The reinstatement privilege is limited to reinvestment in a fund which has the same transfer agent as the fund from which you redeemed. This reinstatement privilege can be exercised only once for any redemption, and reinvestment will be made at the net asset value next calculated after reinstatement of the appropriate class of Fund shares. If you reinstate shares that were subject to a CDSC, your holding period as of the redemption date also will be reinstated for purposes of calculating a CDSC and the CDSC paid at redemption will be refunded. The federal income tax consequences of any capital gain realized on a redemption will not be affected by reinstatement, but a capital loss may be disallowed in whole or in part depending on the timing, the amount of the reinvestment and the fund from which the redemption occurred.
Suspension of Right of Redemption
Each Fund may suspend the right of redemption of Fund shares or delay payment more than seven days (a) during any period when the New York Stock Exchange is closed (other than customary weekend and holiday closings), (b) when trading in the markets the Fund normally utilizes is restricted or an emergency exists as determined by the SEC so that trading of the Fund’s investments or determination of its net asset value is not reasonably practicable, or (c) for any other periods that the SEC by order may permit for protection of Fund shareholders.
Redemption In-Kind
The Funds have reserved the right to redeem in-kind (that is, to pay redemption requests in cash and portfolio securities, or wholly in portfolio securities), although the Funds have no present intention to redeem in-kind. The Funds voluntarily have committed to pay in cash all requests for redemption by any shareholder, limited as to each shareholder during any 90-day period to the lesser of $250,000 or 1% of the net asset value of a Fund at the beginning of the 90-day period.
Frequent Trading Policy
The Funds’ Frequent Trading Policy is as follows:
Nuveen Mutual Funds are intended as long-term investments and not as short-term trading vehicles. At the same time, the Funds recognize the need of investors to periodically make purchases and redemptions of Fund shares when rebalancing their portfolios and as their financial needs or circumstances change. Nuveen Mutual Funds have adopted the following Frequent Trading Policy that seeks to balance these needs against the potential for higher operating costs, portfolio management disruption and other inefficiencies that can be caused by excessive trading of Fund shares.
1. Definition of Round Trip
A Round Trip trade is the purchase and subsequent redemption of Fund shares, including by exchange. Each side of a Round Trip trade may be comprised of either a single transaction or a series of closely-spaced transactions.
2. Round Trip Trade Limitations
Nuveen Mutual Funds limit the frequency of Round Trip trades that may be placed in a Fund. Subject to certain exceptions noted below, the Funds limit an investor to four Round Trips per trailing 12-month period and may also restrict the trading privileges of an investor who makes a Round Trip within a 30-day period if the purchase and redemption are of substantially similar dollar amounts and represent at least 25% of the value of the investor’s account.
3. Enforcement
Trades placed in violation of the foregoing policies are subject to rejection or cancellation by Nuveen Mutual Funds. Nuveen Mutual Funds may also bar an investor (and/or the investor’s financial
S-60
advisor) who has violated these policies from opening new accounts with the Funds and may restrict the investor’s existing account(s) to redemptions only. Nuveen Mutual Funds reserve the right, in their sole discretion, to (a) interpret the terms and application of these policies, (b) waive unintentional or minor violations (including transactions below certain dollar thresholds) if Nuveen Mutual Funds determine that doing so does not harm the interests of Fund shareholders, and (c) exclude certain classes of redemptions from the application of the trading restrictions set forth above.
Nuveen Mutual Funds reserve the right to impose restrictions on purchases or exchanges that are more restrictive than those stated above if they determine, in their sole discretion, that a proposed transaction or series of transactions involve market timing or excessive trading that is likely to be detrimental to the Funds. The Funds may also modify or suspend the Frequent Trading Policy without notice during periods of market stress or other unusual circumstances.
The ability of Nuveen Mutual Funds to implement the Frequent Trading Policy for omnibus accounts at certain financial intermediaries may be dependent on receiving from those intermediaries sufficient shareholder information to permit monitoring of trade activity and enforcement of the Funds’ Frequent Trading Policy. In addition, the Funds may rely on a financial intermediary’s policy to restrict market timing and excessive trading if the Funds believe that the policy is reasonably designed to prevent market timing that is detrimental to the Funds. Such policy may be more or less restrictive than the Funds’ Policy. The Funds cannot ensure that these financial intermediaries will in all cases apply the Funds’ policy or their own policies, as the case may be, to accounts under their control.
Exclusions from the Frequent Trading Policy
As stated above, certain redemptions are eligible for exclusion from the Frequent Trading Policy, including: (i) redemptions or exchanges by shareholders investing through the fee-based platforms of certain financial intermediaries (where the intermediary charges an asset-based or comprehensive “wrap” fee for its services) that are effected by the financial intermediaries in connection with systematic portfolio rebalancing; (ii) when there is a verified trade error correction, which occurs when a dealer firm sends a trade to correct an earlier trade made in error and then the firm sends an explanation to the Nuveen Mutual Funds confirming that the trade is actually an error correction; (iii) in the event of total disability (as evidenced by a determination by the federal Social Security Administration) of the shareholder (including a registered joint owner) occurring after the purchase of the shares being redeemed; (iv) in the event of the death of the shareholder (including a registered joint owner); (v) redemptions made pursuant to a systematic withdrawal plan, up to 1% monthly, 3% quarterly, 6% semiannually or 12% annually of an account’s net asset value depending on the frequency of the plan as designated by the shareholder; (vi) redemptions of shares that were purchased through a systematic investment program; (vii) involuntary redemptions caused by operation of law; (viii) redemptions in connection with a payment of account or plan fees; (ix) redemptions or exchanges by any “fund of funds” advised by the Adviser; and (x) redemptions in connection with the exercise of a Fund’s right to redeem all shares in an account that does not maintain a certain minimum balance or that the applicable board has determined may have material adverse consequences to the shareholders of a Fund.
In addition, the following redemptions of shares by an employer-sponsored qualified defined contribution retirement plan are excluded from the Frequent Trading Policy: (i) partial or complete redemptions in connection with a distribution without penalty under Section 72(t) of the Code from a retirement plan: (a) upon attaining age 59 1/2; (b) as part of a series of substantially equal periodic payments; or (c) upon separation from service and attaining age 55; (ii) partial or complete redemptions in connection with a qualifying loan or hardship withdrawal; (iii) complete redemptions in connection with termination of employment, plan termination, transfer to another employer’s plan or IRA or changes in a plan’s recordkeeper; and (iv) redemptions resulting from the return of an excess contribution. Also, the following redemptions of shares held in an IRA account are excluded from the application of the Frequent Trading Policy: (i) redemptions made pursuant to an IRA systematic withdrawal based on the shareholder’s life expectancy including, but not limited to, substantially equal periodic payments described in Code Section 72(t)(A)(iv) prior to age 59 1/2; and (ii) redemptions to satisfy required minimum distributions after age 70 1/2 from an IRA account.
S-61
General Matters
The Funds have authorized one or more brokers to accept on their behalf purchase and redemption orders. Such brokers are authorized to designate other intermediaries to accept purchase and redemption orders on the Funds’ behalf. The Funds will be deemed to have received a purchase or redemption order when an authorized broker or, if applicable, a broker’s authorized designee accepts the order. Customer orders received by such broker (or their designee) will be priced at the Funds’ net asset value next computed after they are accepted by an authorized broker (or their designee). Orders accepted by an authorized broker (or their designee) before the close of regular trading on the NYSE will receive that day’s share price; orders accepted after the close of trading will receive the next business day’s share price.
If you choose to invest in a Fund, an account will be opened and maintained for you by Boston Financial Data Services (“BFDS”), the Funds’ shareholder services agent. Shares will be registered in the name of the investor or the investor’s financial advisor. A change in registration or transfer of shares held in the name of a financial advisor may only be made by an order in good standing form from the financial advisor acting on the investor’s behalf. Each Fund reserves the right to reject any purchase order and to waive or increase minimum investment requirements.
The Funds do not issue share certificates. For certificated shares previously issued, a fee of 1% of the current market value will be charged if the certificate is lost, stolen or destroyed. The fee is paid to Seaboard Surety Company for insurance of the lost, stolen or destroyed certificate.
Distribution Arrangements
The Distributor serves as the principal underwriter of the shares of the Funds pursuant to a “best efforts” arrangement as provided by a distribution agreement with the Trust (the “Distribution Agreement”). Pursuant to the Distribution Agreement, the Trust appointed the Distributor to be its agent for the distribution of the Funds’ shares on a continuous offering basis. The Distributor sells shares to or through brokers, dealers, banks or other qualified financial intermediaries (collectively referred to as “Dealers”), or others, in a manner consistent with the then effective registration statement of the Trust. Pursuant to the Distribution Agreement, the Distributor, at its own expense, finances certain activities incident to the sale and distribution of the Funds’ shares, including printing and distributing of prospectuses and statements of additional information to other than existing shareholders, the printing and distributing of sales literature, advertising and payment of compensation and giving of concessions to Dealers.
The Distributor receives for its services the excess, if any, of the sales price of a Fund’s shares less the net asset value of those shares, and reallows a majority or all of such amounts to the Dealers who sold the shares, the Distributor itself may also act as a Dealer. The Distributor also receives distribution fees pursuant to a distribution plan adopted by the Trust pursuant to Rule 12b-1 and described herein under “Distribution and Service Plans.” The Distributor also receives any CDSCs imposed on redemptions of shares, but any amounts as to which a reinstatement privilege is not exercised are set off against and reduce amounts otherwise payable to the Distributor pursuant to the distribution plan.
S-62
The following table sets forth the aggregate amounts of underwriting commissions with respect to the sale of Fund shares and the amount thereof retained by the Distributor for each of the Funds for the specified periods. All figures are to the nearest thousand.
| Fiscal Year Ended May 31, 2009 | Fiscal Year Ended May 31, 2010 | Fiscal Year Ended May 31, 2011 | ||||||||||||||||||||||||||||||||||
Fund | Amount of Underwriting Commissions | Amount Retained By the Distributor | Amount of Compensation on Redemptions and Repurchase | Amount of Underwriting Commissions | Amount Retained By the Distributor | Amount of Compensation on Redemptions and Repurchases | Amount of Underwriting Commissions | Amount Retained By the Distributor | Amount of Compensation on Redemptions and Repurchases | |||||||||||||||||||||||||||
Nuveen Kansas Municipal Bond Fund | $ | 352 | $ | 41 | $ | 6 | $ | 302 | $ | 37 | $ | 6 | $ | 548 | $ | 65 | $ | 7 | ||||||||||||||||||
Nuveen Kentucky Municipal Bond Fund | 477 | 60 | 13 | 428 | 55 | 12 | 322 | 41 | 6 | |||||||||||||||||||||||||||
Nuveen Michigan Municipal Bond Fund | 140 | 19 | 11 | 186 | 30 | 15 | 113 | 15 | 4 | |||||||||||||||||||||||||||
Nuveen Missouri Municipal Bond Fund | 267 | 32 | 36 | 309 | 40 | 8 | 391 | 51 | 3 | |||||||||||||||||||||||||||
Nuveen Ohio Municipal Bond Fund | 372 | 47 | 14 | 382 | 56 | 13 | 291 | 36 | 11 | |||||||||||||||||||||||||||
Nuveen Wisconsin Municipal Bond Fund | 88 | 13 | 5 | 109 | 13 | 1 | 82 | 11 | 23 | |||||||||||||||||||||||||||
Additional Payments to Financial Intermediaries
In addition to the sales charge payments and the distribution, service and transfer agency fees described in the Prospectus and elsewhere in this Statement of Additional Information, the Adviser and/or the Distributor may make additional payments out of its own assets to selected intermediaries that sell shares of the Nuveen Mutual Funds (such as brokers, dealers, banks, registered investment advisers, retirement plan administrators and other intermediaries; hereinafter, individually, “Intermediary,” and collectively, “Intermediaries”) under the categories described below for the purposes of promoting the sale of Fund shares, maintaining share balances and/or for sub-accounting, administrative or shareholder processing services.
The amounts of these payments could be significant and may create an incentive for an Intermediary or its representatives to recommend or offer shares of the Nuveen Mutual Funds to its customers. The Intermediary may elevate the prominence or profile of the Funds within the Intermediary’s organization by, for example, placing the Funds on a list of preferred or recommended funds and/or granting the Adviser and/or the Distributor preferential or enhanced opportunities to promote the Funds in various ways within the Intermediary’s organization.
These payments are made pursuant to negotiated agreements with Intermediaries. The payments do not change the price paid by investors for the purchase of a share or the amount a Fund will receive as proceeds from such sales. Furthermore, these payments are not reflected in the fees and expenses listed in the fee table section of the Funds’ Prospectus and described above because they are not paid by the Funds.
The categories of payments described below are not mutually exclusive, and a single Intermediary may receive payments under all categories.
Marketing Support Payments and Program Servicing Payments
The Adviser and/or the Distributor may make payments for marketing support and/or program servicing to selected Intermediaries that are registered as holders or dealers of record for accounts invested in one or more of the Nuveen Mutual Funds or that make Nuveen Mutual Fund shares available through employee benefit plans or fee-based advisory programs to compensate them for the variety of services they provide.
S-63
Marketing Support Payments. Services for which an Intermediary receives marketing support payments may include business planning assistance, advertising, educating the Intermediary’s personnel about the Nuveen Mutual Funds in connection with shareholder financial planning needs, placement on the Intermediary’s preferred or recommended fund company list, and access to sales meetings, sales representatives and management representatives of the Intermediary. In addition, Intermediaries may be compensated for enabling Nuveen representatives to participate in and/or present at conferences or seminars, sales or training programs for invited registered representatives and other employees, client and investor events and other events sponsored by the Intermediary.
The Adviser and/or the Distributor compensate Intermediaries differently depending upon, among other factors, the number or value of Nuveen Mutual Funds shares that the Intermediary sells or may sell, the value of the assets invested in the Nuveen Mutual Funds by the Intermediary’s customers, redemption rates, ability to attract and retain assets, reputation in the industry and the level and/or type of marketing assistance and educational activities provided by the Intermediary. Such payments are generally asset-based but also may include the payment of a lump sum.
Program Servicing Payments. Services for which an Intermediary receives program servicing payments typically include recordkeeping, reporting, or transaction processing, but may also include services rendered in connection with fund/investment selection and monitoring, employee enrollment and education, plan balance rollover or separation, or other similar services. An Intermediary may perform program services itself or may arrange with a third party to perform program services.
Program servicing payments typically apply to employee benefit plans, such as retirement plans, or fee-based advisory programs but may apply to retail sales and assets in certain situations. The payments are based on such factors as the type and nature of services or support furnished by the Intermediary and are generally asset-based.
Marketing Support and Program Servicing Payment Guidelines. In the case of any one Intermediary, marketing support and program servicing payments are not expected, with certain limited exceptions, to exceed, in the aggregate, 0.35% of the average net assets of Fund shares attributable to that Intermediary on an annual basis. In connection with the sale of a business by U.S. Bank N.A. (which was the parent company of a firm a portion of whose business has since been acquired by the Adviser) to Great-West Life & Annuity Insurance Company (“Great-West”), the Adviser has a services agreement with GWFS Equities, Inc., an affiliate of Great-West, which provides for payments of up to 0.60% of the average net assets of Fund shares attributable to GWFS Equities, Inc. on an annual basis.
Other Payments
From time to time, the Adviser and/or the Distributor, at their expense, may provide other compensation to Intermediaries that sell or arrange for the sale of shares of the Funds, which may be in addition to marketing support and program servicing payments described above. For example, the Adviser and/or the Distributor may: (i) compensate Intermediaries for National Securities Clearing Corporation networking system services (e.g., shareholder communication, account statements, trade confirmations, and tax reporting) on an asset-based or per account basis; (ii) compensate Intermediaries for providing Fund shareholder trading information; (iii) make one-time or periodic payments to reimburse selected Intermediaries for items such as ticket charges (i.e., fees that an Intermediary charges its representatives for effecting transactions in Fund shares) of up to $25 per purchase or exchange order, operational charges (e.g., fees that an Intermediary charges for establishing a Fund on its trading system), and literature printing and/or distribution costs; and (iv) at the direction of a retirement plan’s sponsor, reimburse or pay direct expenses of an employee benefit plan that would otherwise be payable by the plan.
When not provided for in a marketing support or program servicing agreement, the Adviser and/or the Distributor may pay Intermediaries for enabling the Adviser and/or the Distributor to participate in and/or present at conferences or seminars, sales or training programs for invited registered representatives and other Intermediary employees, client and investor events and other Intermediary- sponsored events, and for travel expenses, including lodging incurred by registered representatives and other employees in connection with prospecting, asset retention and due diligence trips. These payments may vary depending upon the nature of the event. The Adviser and/or the Distributor make
S-64
payments for such events as they deem appropriate, subject to their internal guidelines and applicable law. Wholesale representatives of the Distributor may receive additional compensation if they meet certain targets for sales of one or more Nuveen Mutual Funds.
The Adviser and/or the Distributor occasionally sponsors due diligence meetings for registered representatives during which they receive updates on various Nuveen Mutual Funds and are afforded the opportunity to speak with portfolio managers. Although invitations to these meetings are not conditioned on selling a specific number of shares, those who have shown an interest in Nuveen Mutual Funds are more likely to be considered. To the extent permitted by their firm’s policies and procedures, all or a portion of registered representatives’ expenses in attending these meetings may be covered by the Adviser and/or the Distributor.
Certain third parties, affiliates of the Adviser and employees of the Adviser or its affiliates may receive cash compensation from the Adviser and/or the Distributor in connection with establishing new client relationships with the Nuveen Mutual Funds. Such compensation may vary by product and by Intermediary. Total compensation of employees of the Adviser and its affiliates with marketing and/or sales responsibilities is based in part on their generation of new client relationships, including new client relationships with the Nuveen Mutual Funds, and such employees may receive additional compensation if they meet certain targets for sales of one or more Nuveen Mutual Funds.
Other compensation may be offered to the extent not prohibited by state laws or any self-regulatory agency, such as FINRA. Investors can ask their Intermediary for information about any payments it receives from the Adviser and/or the Distributor and the services it provides for those payments.
Investors may wish to take Intermediary payment arrangements into account when considering and evaluating any recommendations relating to Fund shares.
Intermediaries Receiving Additional Payments
The following is a list of Intermediaries receiving one or more of the types of payments discussed above as of September 9, 2011:
ADP Broker-Dealer, Inc.
American Enterprise Investment Services, Inc.
American United Life Insurance Company
Ameriprise Financial Services, Inc.
Ascensus (formerly BISYS Retirement Services, Inc.)
Banc of America Investment Services, Inc.
Benefit Plans Administrative Services, Inc.
Benefit Trust Company
Charles Schwab & Co., Inc.
Citigroup Global Markets Inc./Morgan Stanley Smith Barney LLC
Commonwealth Equity Services, LLP, DBA Commonwealth Financial Network
Country Trust Bank
CPI Qualified Plan Consultants, Inc.
Digital Retirement Solutions, Inc.
Dyatech, LLC
ExpertPlan, Inc.
Fidelity Brokerage Services LLC/National Financial Services LLC
Fidelity Investments Institutional Operations Company, Inc.
Genesis Employee Benefits, Inc. DBA America’s VEBA Solution
GWFS Equities, Inc.
Hartford Life Insurance Company
Hartford Securities Distribution Company, Inc.
Hewitt Associates LLC
ICMA Retirement Corporation
ING Institutional Plan Services, LLC/ING Investment Advisors, LLC (formerly CitiStreet LLC /
CitiStreet Advisors LLC)
S-65
ING Life Insurance and Annuity Company/ING Institutional Plan Services LLC
J.P. Morgan Retirement Plan Services, LLC
Janney Montgomery Scott LLC
Leggette Actuaries, Inc.
Lincoln Retirement Services Company LLC/AMG Service Corp.
Linsco/Private Ledger Corp.
Marshall & Ilsley Trust Company, N.A.
Massachusetts Mutual Life Insurance Company
Mercer HR Outsourcing LLC
Merrill Lynch, Pierce, Fenner & Smith Inc.
MetLife Securities, Inc.
Mid Atlantic Capital Corporation
Morgan Stanley & Co., Incorporated/Morgan Stanley Smith Barney LLC
MSCS Financial Services, LLC
Nationwide Financial Services, Inc.
Newport Retirement Services, Inc.
NYLife Distributors LLC
Pershing LLC
Princeton Retirement Group/GPC Securities, Inc.
Principal Life Insurance Company
Prudential Insurance Company of America (The)
Prudential Investment Management Services, LLC/Prudential Investments LLC
Raymond James & Associates/Raymond James Financial Services, Inc.
RBC Dain Rauscher, Inc.
Reliance Trust Company
Retirement Plan Company, LLC (The)
Robert W. Baird & Co., Inc.
Stifel, Nicolaus & Co., Inc.
T. Rowe Price Investment Services, Inc./T. Rowe Price Retirement Plan Services, Inc.
TD Ameritrade, Inc.
TD Ameritrade Trust Company (formerly Fiserv Trust Company/International Clearing Trust
Company)
TIAA-CREF Individual & Institutional Services, LLC
U.S. Bancorp Investments, Inc.
U.S. Bank, N.A.
UBS Financial Services, Inc.
Unified Trust Company, N.A.
VALIC Retirement Services Company (formerly AIG Retirement Services Company)
Vanguard Group, Inc.
Wachovia Bank, N.A.
Wachovia Securities, LLC
Wells Fargo Advisors, LLC
Wells Fargo Bank, N.A.
Wilmington Trust Company
Wilmington Trust Retirement and Institutional Services Company (formerly AST Capital Trust
Company)
Any additions, modifications or deletions to the list of Intermediaries identified above that have occurred since September 9, 2011 are not reflected in the list.
DISCLOSURE OF PORTFOLIO HOLDINGS
The Nuveen Mutual Funds have adopted a portfolio holdings disclosure policy which governs the dissemination of the Funds’ portfolio holdings. In accordance with this policy, the Funds may provide portfolio holdings information to third parties no earlier than the time a report is filed with the SEC that is required to contain such information or one day after the information is posted on the Funds’ publicly accessible website, www.nuveen.com. Currently, the portfolio holdings information is posted
S-66
monthly approximately five business days after the end of the month as of which the information is current. Additionally, the Funds publish on the website a list of its top ten holdings as of the end of each month, approximately two to five business days after the end of the month for which the information is current. This information will remain available on the website at least until the Funds file with the SEC their Forms N-CSR or Forms N-Q for the period that includes the date as of which the website information is current.
Additionally, the Funds may disclose portfolio holdings information that has not been included in a filing with the SEC or posted on the Funds’ website (i.e., non-public portfolio holdings information) only if there is a legitimate business purpose for doing so and if the recipient is required, either by explicit agreement or by virtue of the recipient’s duties to the Funds as an agent or service provider, to maintain the confidentiality of the information and to not use the information in an improper manner (e.g., personal trading). In this connection, the Funds may disclose on an ongoing basis non-public portfolio holdings information in the normal course of their investment and administrative operations to various service providers, including the Adviser and/or sub-adviser, independent registered public accounting firm, custodian, financial printer (R.R. Donnelley Financial and Financial Graphic Services), proxy voting service(s) (including RMG, ADP Investor Communication Services, and Glass, Lewis & Co.), and to the legal counsel for the Funds’ independent directors (Chapman and Cutler LLP). Also, the Adviser may transmit to Vestek Systems, Inc. daily non-public portfolio holdings information on a next-day basis to enable the Adviser to perform portfolio attribution analysis using Vestek’s systems and software programs. Vestek is also provided with non-public portfolio holdings information on a monthly basis approximately 2-3 business days after the end of each month so that Vestek may calculate and provide certain statistical information (but not the non-public holdings information itself) to its clients (including retirement plan sponsors or their consultants). The Adviser and/or sub-adviser may also provide certain portfolio holdings information to broker-dealers from time to time in connection with the purchase or sale of securities or requests for price quotations or bids on one or more securities. In providing this information, reasonable precautions are taken in an effort to avoid potential misuse of the disclosed information, including limitations on the scope of the portfolio holdings information disclosed, when appropriate.
Non-public portfolio holdings information may be provided to other persons if approved by the Funds’ Chief Administrative Officer or Secretary upon a determination that there is a legitimate business purpose for doing so, the disclosure is consistent with the interests of the Funds, and the recipient is obligated to maintain the confidentiality of the information and not misuse it.
Compliance officers of the Funds and the Adviser and sub-adviser periodically monitor overall compliance with the policy to ascertain whether portfolio holdings information is disclosed in a manner that is consistent with the Funds’ policy. Reports are made to the Funds’ Board of Directors on an annual basis.
There is no assurance that the Funds’ policies on portfolio holdings information will protect the Funds from the potential misuse of portfolio holdings information by individuals or firms in possession of such information.
The following parties currently receive non-public portfolio holdings information regarding one or more of the Nuveen Mutual Funds on an ongoing basis pursuant to the various arrangements described above:
ADP Investor Communications Services
Altrinsic Global Advisors, Inc.
Barclays Capital, Inc.
Barra
Bloomberg
BNP Paribas Prime Brokerage, Inc.
BNP Paribas Securities Corp.
Broadridge Systems
Cantor Fitzgerald & Co.
Chapman and Cutler LLP
Commerz Markets LLC
Credit Agricole Securities (USA) Inc.
S-67
Credit Suisse Securities (USA), LLC
Deutsche Bank Securities, Inc.
Ernst & Young LLP
FactSet Research Systems
Financial Graphic Services
First Clearing, LLC
Forbes
Glass, Lewis & Co.
Goldman Sachs & Co.
Hansberger Global Investors, LLC
HSBC Securities (USA), Inc.
ING Financial Markets, LLC
The Investment Company Institute
Jefferies & Company, Inc.
J.P. Morgan Clearing Corp.
J.P. Morgan Securities, Inc.
Lazard Asset Management, Inc.
Lipper Inc.
Merrill Lynch, Pierce, Fenner & Smith
Moody’s
Morgan Stanley & Co., Inc.
Morningstar, Inc.
MS Securities Services, Inc.
Newedge USA, LLC
Nuveen Asset Management, LLC
Nuveen Fund Advisors, Inc.
Pershing, LLC
PricewaterhouseCoopers
Raymond James & Associates, Inc.
RBC Capital Markets Corporation
RBS Securities, Inc.
RMG
R.R. Donnelley Financial
Scotia Capital (USA), Inc.
SG Ameritas Securities, LLC
Societe Generale, New York Branch
Standard & Poor’s
State Street Bank & Trust Co.
Strategic Insight
TD Ameritrade Clearing, Inc.
ThomsonReuters LLC
UBS Securities, LLC
U.S. Bancorp Fund Services, LLC
U.S. Bank, N.A.
Value Line
Vestek Systems, Inc.
Vickers
Wells Fargo Securities, LLC
DISTRIBUTION AND SERVICE PLANS
The Funds have adopted a plan (the “Plan”) pursuant to Rule 12b-1 under the 1940 Act, pursuant to which Class B and Class C shares are subject to an annual distribution fee and Class A, Class B and Class C shares are subject to an annual service fee. Each Fund may spend up to 0.20% per year of the average daily net assets of Class A shares as a service fee under the Plan as applicable to Class A shares. Each Fund may spend up to 0.75% per year of the average daily net assets of the Class B shares and 0.55% per year of the average daily net assets of Class C shares as a distribution fee and
S-68
up to 0.20% per year of the average daily net assets of each of the Class B and Class C shares as a service fee under the Plan as applicable to such classes. Class I shares are not subject to either distribution or service fees. Distribution and service fees collectively are referred to herein as “12b-1 fees.”
The distribution fee applicable to Class B and Class C shares under each Fund’s Plan compensates the Distributor for expenses incurred in connection with the distribution of Class B and Class C shares, respectively. These expenses include payments to financial intermediaries, including the Distributor, who are brokers of record with respect to the Class B and Class C shares, as well as, without limitation, expenses of printing and distributing Prospectuses to persons other than shareholders of each Fund, expenses of preparing, printing and distributing advertising and sales literature and reports to shareholders used in connection with the sale of Class B and Class C shares, certain other expenses associated with the distribution of Class B and Class C shares, and any other distribution-related expenses that may be authorized from time to time by the Board of Trustees.
The service fee applicable to Class A, Class B and Class C shares under each Fund’s Plan is used to compensate financial intermediaries in connection with the provision of ongoing account services to shareholders. These services may include establishing and maintaining shareholder accounts, answering shareholder inquiries and providing other personal services to shareholders.
During the fiscal year ended May 31, 2011, the Funds incurred 12b-1 fees pursuant to their respective Plan in the amounts set forth in the table below. For this period, substantially all of the 12b-1 service fees on Class A shares were paid out as compensation to financial intermediaries for providing services to shareholders relating to their investments. To compensate for commissions advanced to financial intermediaries, all 12b-1 service fees collected on Class B shares during the first year following a purchase, all 12b-1 distribution fees on Class B shares, and all 12b-1 fees on Class C shares during the first year following a purchase are retained by the Distributor. After the first year following a purchase, 12b-1 service fees on Class B shares and 12b-1 fees on Class C shares are paid to financial intermediaries.
| 12b-1 Fees Incurred by Each Fund for the Fiscal Year Ended May 31, 2011 | ||||
Nuveen Kansas Municipal Bond Fund: | ||||
Class A | $ | 244,133 | ||
Class B | 14,137 | |||
Class C | 274,563 | |||
Nuveen Kentucky Municipal Bond Fund: | ||||
Class A | $ | 720,577 | ||
Class B | 35,590 | |||
Class C | 414,634 | |||
Nuveen Michigan Municipal Bond Fund: | ||||
Class A | $ | 302,508 | ||
Class B | 11,837 | |||
Class C | 226,122 | |||
Nuveen Missouri Municipal Bond Fund: | ||||
Class A | $ | 386,714 | ||
Class B | 14,766 | |||
Class C | 207,001 | |||
Nuveen Ohio Municipal Bond Fund: | ||||
Class A | $ | 620,892 | ||
Class B | 37,274 | |||
Class C | 468,947 | |||
Nuveen Wisconsin Municipal Bond Fund: | ||||
Class A | $ | 94,530 | ||
Class B | 9,497 | |||
Class C | 70,469 | |||
S-69
Under each Fund’s Plan, the Fund will report quarterly to the Board of Trustees for its review all amounts expended per class of shares under the Plan. The Plan may be terminated at any time with respect to any class of shares, without the payment of any penalty, by a vote of the independent trustees who have no direct or indirect financial interest in the Plan or by vote of a majority of the outstanding voting securities of such class. The Plan may be renewed from year to year if approved by a vote of the Board of Trustees and a vote of the independent trustees who have no direct or indirect financial interest in the Plan cast in person at a meeting called for the purpose of voting on the Plan. The Plan may be continued only if the trustees who vote to approve such continuance conclude, in the exercise of reasonable business judgment and in light of their fiduciary duties under applicable law, that there is a reasonable likelihood that the Plan will benefit the Fund and its shareholders. The Plan may not be amended to increase materially the cost which a class of shares may bear under the Plan without the approval of the shareholders of the affected class, and any other material amendments of the Plan must be approved by the independent trustees by a vote cast in person at a meeting called for the purpose of considering such amendments. During the continuance of the Plan, the selection and nomination of the independent trustees of the Trust will be committed to the discretion of the independent trustees then in office.
INDEPENDENT REGISTERED PUBLIC ACCOUNTING FIRM, CUSTODIAN AND TRANSFER AGENT
PricewaterhouseCoopers LLP (“PWC”), One North Wacker Drive, Chicago, Illinois 60606, independent registered public accounting firm, has been selected as auditors for the Trust. In addition to audit services, PWC will provide assistance on accounting, internal control, tax and related matters.
The custodian of the assets of the Funds is State Street Bank & Trust Company, P.O. Box 5043, Boston, Massachusetts 02206-5043. The custodian performs custodial, fund accounting and portfolio accounting services.
The Funds’ transfer, shareholder services, and dividend paying agent is Boston Financial Data Services, Inc., P.O. Box 8530, Boston, Massachusetts 02266-8530.
The audited financial statements for each Fund’s most recent fiscal year appear in each Fund’s Annual Report dated May 31, 2011. Each Fund’s Annual Report is incorporated by reference into this Statement of Additional Information and is available without charge by calling (800)257-8787.
Each Fund is a series of the Trust. The Trust is an open-end management investment company under the 1940 Act. The Trust was organized as a Massachusetts business trust on July 1, 1996. The Board of Trustees of the Trust is authorized to issue an unlimited number of shares in one or more series, which may be divided into classes of shares. Currently, there are six series authorized and outstanding, each of which may be generally divided into different classes of shares designated as Class A shares, Class B shares, Class C shares and Class I shares. Each class of shares represents an interest in the same portfolio of investments of a Fund. Each class of shares has equal rights as to voting, redemption, dividends and liquidation, except that each bears different class expenses, including different distribution and service fees, and each has exclusive voting rights with respect to any distribution or service plan applicable to its shares. There are no conversion, preemptive or other subscription rights, except that Class B shares (available in only certain series) automatically convert into Class A shares. The Board of Trustees of the Trust has the right to establish additional series and classes of shares in the future, to change those series or classes and to determine the preferences, voting powers, rights and privileges thereof.
The Trust is not required and does not intend to hold annual meetings of shareholders. Shareholders owning more than 10% of the outstanding shares of a Fund have the right to call a special meeting to remove trustees or for any other purpose.
S-70
Under Massachusetts law applicable to Massachusetts business trusts, shareholders of such a trust may, under certain circumstances, be held personally liable as partners for its obligations. However, the Declaration of Trust of the Trust contains an express disclaimer of shareholder liability for acts or obligations of the Trust and requires that notice of this disclaimer be given in each agreement, obligation or instrument entered into or executed by the Trust or the trustees. The Trust’s Declaration of Trust further provides for indemnification out of the assets and property of the Trust for all losses and expenses of any shareholder held personally liable for the obligations of the Trust. Thus, the risk of a shareholder incurring financial loss on account of shareholder liability is limited to circumstances in which both inadequate insurance existed and the Trust or a Fund itself was unable to meet its obligations. The Trust believes the likelihood of the occurrence of these circumstances is remote.
S-71
RATINGS OF INVESTMENTS
Standard & Poor’s Ratings Group—A brief description of the applicable Standard & Poor’s (“S&P”) rating symbols and their meanings (as published by S&P) follows:
Issue Credit Ratings
A S&P issue credit rating is a forward looking opinion about the creditworthiness of an obligor with respect to a specific financial obligation, a specific class of financial obligations, or a specific financial program (including ratings on medium-term note programs and commercial paper programs). It takes into consideration the creditworthiness of guarantors, insurers, or other forms of credit enhancement on the obligation and takes into account the currency in which the obligation is denominated.
The opinion reflects S&P’s view of the obligor’s capacity and willingness to meet its financial commitments as they come due, and may assess terms, such as collateral security and subordination, which could affect ultimate payment in the event of default.
Issue credit ratings can be either long-term or short-term. Short-term ratings are generally assigned to those obligations considered short-term in the relevant market. In the U.S., for example, that means obligations with an original maturity of no more than 365 days—including commercial paper. Short-term ratings are also used to indicate the creditworthiness of an obligor with respect to put features on long-term obligations. The result is a dual rating, in which the short-term rating addresses the put feature, in addition to the usual long-term rating. Medium-term notes are assigned long-term ratings.
Long-Term Issue Credit Ratings
Issue credit ratings are based, in varying degrees, on the following considerations:
| 1. | Likelihood of payment—capacity and willingness of the obligor to meet its financial commitment on an obligation in accordance with the terms of the obligation; |
| 2. | Nature of and provisions of the obligation; |
| 3. | Protection afforded by, and relative position of, the obligation in the event of bankruptcy, reorganization, or other arrangement under the laws of bankruptcy and other laws affecting creditors’ rights. |
Issue rating are an assessment of default risk, but may incorporate an assessment of relative seniority or ultimate recovery in the event of default. Junior obligations are typically rated lower than senior obligations, to reflect the lower priority in bankruptcy, as noted above. (Such differentiation may apply when an entity has both senior and subordinated obligations, secured and unsecured obligations, or operating company and holding company obligations.)
| AAA | An obligation rated ‘AAA’ has the highest rating assigned by S&P. The obligor’s capacity to meet its financial commitment on the obligation is extremely strong. |
| AA | An obligation rated ‘AA’ differs from the highest rated obligations only to a small degree. The obligor’s capacity to meet its financial commitment on the obligation is very strong. |
| A | An obligation rated ‘A’ is somewhat more susceptible to the adverse effects of changes in circumstances and economic conditions than obligations in higher-rated categories. However, the obligor’s capacity to meet its financial commitment on the obligation is still strong. |
| BBB | An obligation rated ‘BBB’ exhibits adequate protection parameters. However, adverse economic conditions or changing circumstances are more likely to lead to a weakened capacity of the obligor to meet its financial commitment on the obligation. |
Obligations rated ‘BB’, ‘B’, ‘CCC’, ‘CC’ and ‘C’ are regarded as having significant speculative characteristics. ‘BB’ indicates the least degree of speculation and ‘C’ the highest. While such
A-1
obligations will likely have some quality and protective characteristics, these may be outweighed by large uncertainties or major exposures to adverse conditions.
| BB | An obligation rated ‘BB’ is less vulnerable to nonpayment than other speculative issues. However, it faces major ongoing uncertainties or exposure to adverse business, financial, or economic conditions which could lead to the obligor’s inadequate capacity to meet its financial commitment on the obligation. |
| B | An obligation rated ‘B’ is more vulnerable to nonpayment than obligations rated ‘BB’, but the obligor currently has the capacity to meet its financial commitment on the obligation. Adverse business, financial, or economic conditions will likely impair the obligor’s capacity or willingness to meet its financial commitment on the obligation. |
| CCC | An obligation rated ‘CCC’ is currently vulnerable to nonpayment, and is dependent upon favorable business, financial, and economic conditions for the obligor to meet its financial commitment on the obligation. In the event of adverse business, financial, or economic conditions, the obligor is not likely to have the capacity to meet its financial commitment on the obligation. |
| CC | An obligation rated ‘CC’ is currently highly vulnerable to nonpayment. |
| C | A ‘C’ rating is assigned to obligations that are currently highly vulnerable to nonpayment, obligations that have payment arrearages allowed by the terms of the documents, or obligations of an issuer that is the subject of a bankruptcy petition or similar action which have not experienced a payment default. Among others, the ‘C’ rating may be assigned to subordinated debt, preferred stock or other obligations on which cash payments have been suspended in accordance with the instrument’s terms or when preferred stock is the subject of a distressed exchange offer, whereby some or all of the issue is either repurchased for an amount of cash or replaced by other instruments having a total value that is less than par. |
| D | An obligation rated ‘D’ is in payment default. The ‘D’ rating category is used when payments on an obligation, including a regulatory capital instrument, are not made on the date due even if the applicable grace period has not expired, unless S&P believes that such payments will be made during such grace period. The ‘D’ rating also will be used upon the filing of a bankruptcy petition or the taking of a similar action if payments on an obligation are jeopardized. An obligation’s rating is lowered to ‘D’ upon completion of a distressed exchange offer, whereby some or all of the issue is either repurchased for an amount of cash or replaced by other instruments having a total value that is less than par. |
Plus (+) or Minus ( – ): The ratings from ‘AA’ to ‘CCC’ may be modified by the addition of a plus or minus sign to show relative standing within the major rating categories.
| NR | This indicates that no rating has been requested, that there is insufficient information on which to base a rating, or that S&P does not rate a particular obligation as a matter of policy. |
Municipal Short-Term Note Ratings
A Standard & Poor’s U.S. municipal note rating reflects Standard & Poor’s opinion about the liquidity factors and market access risks unique to the notes. Notes due in three years or less will likely receive a note rating. Notes with an original maturity of more than three years will most likely receive a long-term debt rating. In determining which type of rating, if any, to assign, Standard & Poor’s analysis will review the following considerations:
| • | Amortization schedule—the larger the final maturity relative to other maturities, the more likely it will be treated as a note; and |
| • | Source of payment—the more dependent the issue is on the market for its refinancing, the more likely it will be treated as a note. |
Note rating symbols are as follows:
| SP-1 | Strong capacity to pay principal and interest. An issue determined to possess a very strong capacity to pay debt service is given a plus (+) designation. |
A-2
| SP-2 | Satisfactory capacity to pay principal and interest, with some vulnerability to adverse financial and economic changes over the term of the notes. |
| SP-3 | Speculative capacity to pay principal and interest. |
Moody’s Investors Service, Inc.—A brief description of the applicable Moody’s Investors Service, Inc. (“Moody’s”) rating symbols and their meanings (as published by Moody’s) follows:
Long-Term Obligation Ratings
| Aaa | Obligations rated Aaa are judged to be of the highest quality, with minimal credit risk. |
| Aa | Obligations rated Aa are judged to be of high quality and are subject to very low credit risk. |
| A | Obligations rated A are considered upper-medium grade and are subject to low credit risk. |
| Baa | Obligations rated Baa are subject to moderate credit risk. They are considered medium grade and as such may possess certain speculative characteristics. |
| Ba | Obligations rated Ba are judged to have speculative elements and are subject to substantial credit risk. |
| B | Obligations rated B are considered speculative and are subject to high credit risk. |
| Caa | Obligations rated Caa are judged to be of poor standing and are subject to very high credit risk. |
| Ca | Obligations rated Ca are highly speculative and are likely in, or very near, default, with some prospect of recovery of principal and interest. |
| C | Obligations rated C are the lowest rated class and are typically in default, with little prospect for recovery of principal or interest. |
Note: Moody’s appends numerical modifiers 1, 2, and 3 to each generic rating classification from Aa through Caa. The modifier 1 indicates that the obligation ranks in the higher end of its generic rating category; the modifier 2 indicates a mid-range ranking; and the modifier 3 indicates a ranking in the lower end of that generic rating category.
Medium-Term Note Program Ratings
Moody’s assigns ratings to medium-term note (MTN) programs and to individual debt securities issued from them (referred to as drawdowns or notes). These ratings may be expressed on Moody’s general long-term or short-term rating scale, depending upon the intended tenor of the notes to be issued under the program. MTN program ratings are intended to reflect the ratings likely to be assigned to drawdowns issued from the program with the specified priority of claim (e.g. senior or subordinated). However, the rating assigned to a drawdown from a rated MTN program may differ from the program rating if the draw-down is exposed to additional credit risks besides the issuer’s default, such as links to the defaults of other issuers, or has other structural features that warrant a different rating. In some circumstances, no rating may be assigned to a drawdown.
Market participants must determine whether any particular note is rated, and if so, at what rating level. Moody’s encourages market participants to contact Moody’s Ratings Desks or visit www.moodys.com directly if they have questions regarding ratings for specific notes issued under a medium-term note program. Unrated notes issued under an MTN program may be assigned an NR (not rated) symbol.
U.S. Municipal Short-Term Debt and Demand Obligation Ratings
Short-Term Obligation Ratings
In municipal debt issuance, there are three rating categories for short-term municipal obligations that are considered investment grade. These ratings are designated as Municipal Investment Grade (MIG) and are divided into three levels—MIG 1 through MIG 3.
In addition, those short-term obligations that are of speculative quality are designated SG, or speculative grade. MIG ratings expire at the maturity of the obligation.
A-3
| MIG 1 | This designation denotes superior credit quality. Excellent protection is afforded by established cash flows, highly reliable liquidity support, or demonstrated broad-based access to the market for refinancing. |
| MIG 2 | This designation denotes strong credit quality. Margins of protection are ample, although not as large as in the preceding group. |
| MIG 3 | This designation denotes acceptable credit quality. Liquidity and cash-flow protection may be narrow, and market access for refinancing is likely to be less well-established. |
| SG | This designation denotes speculative-grade credit quality. Debt instruments in this category may lack sufficient margins of protection. |
Demand Obligation Ratings
In the case of variable rate demand obligations (VRDOs), a two-component rating is assigned; a long or short-term debt rating and a demand obligation rating. The first element represents Moody’s evaluation of the degree of risk associated with scheduled principal and interest payments. The second element represents Moody’s evaluation of the degree of risk associated with the ability to receive purchase price upon demand (“demand feature”), using a variation of the MIG rating scale, the Variable Municipal Investment Grade or VMIG rating.
When either the long-or short-term aspect of a VRDO is not rated, that piece is designated NR, e.g., Aaa/NR or NR/VMIG 1.
VMIG rating expirations are a function of each issue’s specific structural or credit features.
| VMIG 1 | This designation denotes superior credit quality. Excellent protection is afforded by the superior short-term credit strength of the liquidity provider and structural and legal protections that ensure the timely payment of purchase price upon demand. |
| VMIG 2 | This designation denotes strong credit quality. Good protection is afforded by the strong short-term credit strength of the liquidity provider and structural and legal protections that ensure the timely payment of purchase price upon demand. |
| VMIG 3 | This designation denotes acceptable credit quality. Adequate protection is afforded by the satisfactory short-term credit strength of the liquidity provider and structural and legal protections that ensure the timely payment of purchase price upon demand. |
| SG | This designation denotes speculative-grade credit quality. Demand features rated in this category may be supported by a liquidity provider that does not have an investment grade short-term rating or may lack the structural and/or legal protections necessary to ensure the timely payment of purchase price upon demand. |
Fitch Ratings—A brief description of the applicable Fitch Ratings (“Fitch”) ratings symbols and meanings (as published by Fitch) follows:
Structured, Project & Public Finance Obligations—Long-Term Rating Scales
Ratings of structured finance, project finance and public finance obligations on the long-term scale, including the financial obligations of sovereigns, consider the obligations’ relative vulnerability to default. These ratings are typically assigned to an individual security or tranche in a transaction and not to an issuer.
| AAA | Highest credit quality. ‘AAA’ ratings denote the lowest expectation of default risk. They are assigned only in cases of exceptionally strong capacity for payment of financial commitments. This capacity is highly unlikely to be adversely affected by foreseeable events. |
| AA | Very high credit quality. ‘AA’ ratings denote expectations of very low default risk. They indicate very strong capacity for payment of financial commitments. This capacity is not significantly vulnerable to foreseeable events. |
| A | High credit quality. ‘A’ ratings denote expectations of low default risk. The capacity for payment of financial commitments is considered strong. This capacity may, nevertheless, be more vulnerable to adverse business or economic conditions than is the case for higher ratings. |
A-4
| BBB | Good credit quality. ‘BBB’ ratings indicate that expectations of default risk are currently low. The capacity for payment of financial commitments is considered adequate but adverse business or economic conditions are more likely to impair this capacity. |
| BB | Speculative. ‘BB’ ratings indicate an elevated vulnerability to default risk, particularly in the event of adverse changes in business or economic conditions over time. |
| B | Highly speculative. ‘B’ ratings indicate that material default risk is present, but a limited margin of safety remains. Financial commitments are currently being met; however, capacity for continued payment is vulnerable to deterioration in the business and economic environment. |
| CCC | Substantial credit risk. Default is a real possibility. |
| CC | Very high levels of credit risk. Default of some kind appears probable. |
| C | Exceptionally high levels of credit risk. Default appears imminent or inevitable. |
| D | Default. Indicates a default. Default generally is defined as one of the following: |
| • | failure to make payment of principal and/or interest under the contractual terms of the rated obligation; |
| • | the bankruptcy filings, administration, receivership, liquidation or other winding-up or cessation of the business of an issuer/obligor; or |
| • | the coercive exchange of an obligation, where creditors were offered securities with diminished structural or |
| • | economic terms compared with the existing obligation. |
Notes: In the case of structured and project finance, while the ratings do not address the loss severity given default of the rated liability, loss severity assumptions on the underlying assets are nonetheless typically included as part of the analysis. Loss severity assumptions are used to derive pool cash flows available to service the rated liability.
The suffix “sf’’ denotes an issue that is a structured finance transaction. For an explanation of how Fitch determines structured finance ratings, please see our criteria available at www.Fitchratings.com.
In the case of public finance, the ratings do not address the loss given default of the rated liability, focusing instead on the vulnerability to default of the rated liability.
The modifiers “+” or “–” may be appended to a rating to denote relative status within major rating categories. Such suffixes are not added to the ‘AAA’ Long-Term Rating category, or categories below ‘B’.
Limitations of the Structured, Project and Public Finance Obligation Rating Scale
Specific limitations relevant to the structured, project and public finance obligation rating scale include:
| • | The ratings do not predict a specific percentage of default likelihood over any given time period. |
| • | The ratings do not opine on the market value of any issuer’s securities or stock, or the likelihood that this value may change. |
| • | The ratings do not opine on the liquidity of the issuer’s securities or stock. |
| • | The ratings do not opine on the possible loss severity on an obligation should an obligation default. |
| • | The ratings do not opine on any quality related to a transaction’s profile other than the agency’s opinion on the relative vulnerability to default of each rated tranche or security. |
A-5
Short-Term Ratings Assigned to Issuers or Obligations in Corporate, Public and Structured Finance
A short-term issuer or obligation rating is based in all cases on the short-term vulnerability to default of the rated entity or security stream and relates to the capacity to meet financial obligations in accordance with the documentation governing the relevant obligation. Short-Term Ratings are assigned to obligations whose initial maturity is viewed as “short term” based on market convention. Typically, this means up to 13 months for corporate, sovereign, and structured obligations, and up to 36 months for obligations in U.S. public finance markets.
| F1 | Highest short-term credit quality. Indicates the strongest intrinsic capacity for timely payment of financial commitments; may have an added “+” to denote any exceptionally strong credit feature. |
| F2 | Good short-term credit quality. Good intrinsic capacity for timely payment of financial commitments. |
| F3 | Fair short-term credit quality. The intrinsic capacity for timely payment of financial commitments is adequate. |
| B | Speculative short-term credit quality. Minimal capacity for timely payment of financial commitments, plus heightened vulnerability to near term adverse changes in financial and economic conditions. |
| C | High short-term default risk. Default is a real possibility. |
| RD | Restricted default. Indicates an entity that has defaulted on one or more of its financial commitments, although it continues to meet other financial obligations. Applicable to entity ratings only. |
| D | Default. Indicates a broad-based default event for an entity, or the default of a short-term obligation. |
Limitations of the Short-Term Ratings Scale
Specific limitations relevant to the Short-Term Ratings scale include:
| • | The ratings do not predict a specific percentage of default likelihood over any given time period. |
| • | The ratings do not opine on the market value of any issuer’s securities or stock, or the likelihood that this value may change. |
| • | The ratings do not opine on the liquidity of the issuer’s securities or stock. |
| • | The ratings do not opine on the possible loss severity on an obligation should an obligation default. |
| • | The ratings do not opine on any quality related to an issuer or transaction’s profile other than the agency’s opinion on the relative vulnerability to default of the rated issuer or obligation. |
Ratings assigned by Fitch Ratings articulate an opinion on discrete and specific areas of risk. The above list is not exhaustive, and is provided for the reader’s convenience.
A-6
DESCRIPTION OF DERIVATIVES AND HEDGING TECHNIQUES
Set forth below is additional information regarding the various Funds’ use of derivatives and hedging techniques, and use of repurchase agreements.
Futures and Index Transactions
Financial Futures. A financial future is an agreement between two parties to buy and sell a security for a set price on a future date. They have been designed by boards of trade that have been designated “contracts markets” by the Commodity Futures Trading Commission (“CFTC”).
The purchase of financial futures is for the purpose of hedging a Fund’s existing or anticipated holdings of long-term debt securities or for otherwise adjusting the investment characteristics of a Fund’s portfolio. When a Fund purchases a financial future, it deposits in cash or securities an “initial margin” of between 1% and 5% of the contract amount. Thereafter, the Fund’s account is either credited or debited on a daily basis in correlation with the fluctuation in price of the underlying future or other requirements imposed by the exchange in order to maintain an orderly market. The Fund must make additional payments to cover debits to its account and has the right to withdraw credits in excess of the liquidity, the Fund may close out its position at any time prior to expiration of the financial future by taking an opposite position. At closing a final determination of debits and credits is made, additional cash is paid by or to the Fund to settle the final determination and the Fund realizes a loss or gain depending on whether on a net basis it made or received such payments.
The sale of financial futures is for the purpose of hedging a Fund’s existing or anticipated holdings of long-term debt securities or for otherwise adjusting the investment characteristics of a Fund’s portfolio. For example, if a Fund owns long-term bonds and interest rates were expected to increase, it might sell financial futures. If interest rates did increase, the value of long-term bonds in the Fund’s portfolio would decline, but the value of the Fund’s financial futures would be expected to increase at approximately the same rate thereby keeping the net asset value of the Fund from declining as much as it otherwise would have.
Among the risks associated with the use of financial futures by the Funds as a hedging device, perhaps the most significant is the imperfect correlation between movements in the price of the financial futures and movements in the price of the debt securities that are the subject of the hedge. Thus, if the price of the financial future moves less or more than the price of the securities that are the subject of the hedge, the hedge will not be fully effective. To compensate for this imperfect correlation, the Fund may enter into financial futures in a greater dollar amount than the dollar amount of the securities being hedged if the historical volatility of the prices of such securities has been greater than the historical volatility of the financial futures. Conversely, the Fund may enter into fewer financial futures if the historical volatility of the price of the securities being hedged is less than the historical volatility of the financial futures.
The market prices of financial futures may also be affected by factors other than interest rates. One of these factors is the possibility that rapid changes in the volume of closing transactions, whether due to volatile markets or movements by speculators, would temporarily distort the normal relationship between the markets in the financial future and the chosen debt securities. In these circumstances as well as in periods of rapid and large price movements. The Fund might find it difficult or impossible to close out a particular transaction.
Options on Financial Futures. The Funds may also purchase or sell put or call options on financial futures that are traded on a U.S. Exchange or board of trade and enter into closing transactions with respect to such options to terminate an existing position. Currently, options can be purchased with respect to financial futures on U.S. Treasury Bonds, U.S. Treasury Notes, and/or Eurodollar futures contracts on The Chicago Board of Trade or the Chicago Mercantile Exchange. The purchase of put options on financial futures is analogous to the purchase or sale of put options by a Fund on its portfolio securities to hedge against the risk of rising or declining interest rates. As with options on debt securities, the holder of an option may terminate his position by buying or selling an option of the same type. There is no guarantee that such closing transactions can be effected.
B-1
Index Contracts
Index Futures. A tax-exempt bond index, which assigns relative values to the tax-exempt bonds included in the index, is traded on the Chicago Board of Trade. The index fluctuates with changes in the market values of all tax-exempt bonds included rather than a single bond. An index future is a bilateral agreement pursuant to which two parties agree to take or make delivery of an amount of cash—rather than any security—equal to specified dollar amount times the difference between the index value at the close of the last trading day of the contract and the price at which the index future was originally written. Thus, an index future is similar to traditional financial futures except that settlement is made in cash.
Index Options. The Funds may also purchase or sell put or call options on U.S. Government or tax-exempt bond index futures and enter into closing transactions with respect to such options to terminate an existing position. Options on index futures are similar to options on debt instruments except that an option on an index future gives the purchaser the right, in return for the premium paid, to assume a position in an index contract rather than an underlying security at a specified exercise price at any time during the period of the option. Upon exercise of the option, the delivery of the futures position by the writer of the option to the holder of the option will be accompanied by delivery of the accumulated balance of the writer’s futures margin account which represents the amount by which the market price of the index futures contract, at exercise, is less than the exercise price of the option on the index future.
Bond index futures and options transactions would be subject to risks similar to transactions in financial futures and options thereon as described above. No series will enter into transactions in index or financial futures or related options unless and until, in Nuveen Asset Management, LLC’s opinion, the market for such instruments has developed sufficiently.
Repurchase Agreements
A Fund may invest temporarily up to 5% of its assets in repurchase agreements, which are agreements pursuant to which securities are acquired by the Fund from a third party with the understanding that they will be repurchased by the seller at a fixed price on an agreed date. These agreements may be made with respect to any of the portfolio securities in which the Fund is authorized to invest. Repurchase agreements may be characterized as loans secured by the underlying securities. The Fund may enter into repurchase agreements with (i) member banks of the Federal Reserve System having total assets in excess of $500 million and (ii) securities dealers, provided that such banks or dealers meet the creditworthiness standards established by the Fund’s board of trustees (“Qualified Institutions”). Nuveen Asset Management, LLC will monitor the continued creditworthiness of Qualified Institutions, subject to the oversight of the Fund’s board of trustees.
The use of repurchase agreements involves certain risks. For example, if the seller of securities under a repurchase agreement defaults on its obligation to repurchase the underlying securities, as a result of its bankruptcy or otherwise, the Fund will seek to dispose of such securities, which action could involve costs or delays. If the seller becomes insolvent and subject to liquidation or reorganization under applicable bankruptcy or other laws, the Fund’s ability to dispose of the underlying securities may be restricted. Finally, it is possible that the Fund may not be able to substantiate its interest in the underlying securities. To minimize this risk, the securities underlying the repurchase agreement will be held by the custodian at all times in an amount at least equal to the repurchase price, including accrued interest. If the seller fails to repurchase the securities, the Fund may suffer a loss to the extent proceeds from the sale of the underlying securities are less than the repurchase price.
The resale price reflects the purchase price plus an agreed upon market rate of interest that is unrelated to the coupon rate or date of maturity of the purchased security. The collateral is marked to market daily. Such agreements permit the Fund to keep all its assets earning interest while retaining “overnight” flexibility in pursuit of investments of a longer-term nature.
Swap Agreements
Swap agreements are two-party contracts entered into primarily by institutional investors for periods ranging from a few weeks to several years. In a standard swap transaction, two parties agree
B-2
to exchange the returns (or differentials in rates of return) earned or realized on particular predetermined investments or instruments. The gross returns to be exchanged or swapped between the parties are calculated with respect to a notional amount (the amount or value of the underlying asset used in computing the particular interest rate, return, or other amount to be exchanged) in a particular foreign currency, or in a basket of securities representing a particular index. Swap agreements may include (i) interest rate caps, under which, in return for a premium, one party agrees to make payments to the other to the extent that interest rates exceed a specified rate or cap; (ii) interest rate floors, under which, in return for a premium, one party agrees to make payments to the other to the extent that interest rates fall below a specified level or floor; and (iii) interest rate collars, under which a party sells a cap and purchases a floor, or vice versa, in an attempt to protect itself against interest rate movements exceeding given minimum or maximum levels or collar amounts.
A Fund may enter into interest rate, credit default, securities index, commodity, or security and currency exchange rate swap agreements for any purpose consistent with the Fund’s investment objective, such as for the purpose of attempting to obtain, enhance, or preserve a particular desired return or spread at a lower cost to the Fund than if the Fund had invested directly in an instrument that yielded that desired return or spread. The Fund also may enter into swaps in order to protect against an increase in the price of, or the currency exchange rate applicable to, securities that the Fund anticipates purchasing at a later date.
Whether the Fund’s use of swap agreements will be successful in furthering its investment objective will depend, in part, on the ability to predict correctly whether certain types of investments are likely to produce greater returns than other investments and the changes in the future values, indices, or rates covered by the swap agreement. Swap agreements may be considered to be illiquid. Moreover, the Fund bears the risk of loss of the amount expected to be received under a swap agreement in the event of the default or bankruptcy of a swap agreement counterparty. The Fund will enter swap agreements only with counterparties that the Adviser reasonably believes are capable of performing under the swap agreements. If there is a default by the other party to such a transaction, the Fund will have to rely on its contractual remedies (which may be limited by bankruptcy, insolvency or similar laws) pursuant to the agreements related to the transaction. Certain restrictions imposed on the Fund by the Internal Revenue Code of 1986 may limit the Fund’s ability to use swap agreements. The swap market is largely unregulated.
B-3
MAI-MS4-0911P
NUVEEN INVESTMENT FUNDS, INC.
September 30, 2011
STATEMENT OF ADDITIONAL INFORMATION
Nuveen Colorado Tax Free Fund
Share Classes/Ticker Symbols: Class A—FCOAX, Class C1—FCCOX, Class I—FCOYX
Nuveen Minnesota Intermediate Municipal Bond Fund
Share Classes/Ticker Symbols: Class A—FAMAX, Class C—NIBMX, Class C1—FACMX, Class I—FAMTX
Nuveen Minnesota Municipal Bond Fund
Share Classes/Ticker Symbols: Class A—FJMNX, Class C—NMBCX, Class C1—FCMNX, Class I—FYMNX
Nuveen Missouri Tax Free Fund
Share Classes/Ticker Symbols: Class A—ARMOX, Class C1—FFMCX, Class I—ARMIX
Nuveen Nebraska Municipal Bond Fund
Share Classes/Ticker Symbols: Class A—FNTAX, Class C—NCNBX, Class C1—FNTCX, Class I—FNTYX
Nuveen Ohio Tax Free Fund
Share Classes/Ticker Symbols: Class A—FOFAX, Class C1—FOTCX, Class I—FOTYX
Nuveen Oregon Intermediate Municipal Bond Fund
Share Classes/Ticker Symbols: Class A—FOTAX, Class C—NIMOX, Class I—FORCX
This Statement of Additional Information relates to the Class A, Class C, Class C1 and Class I shares, as applicable, of the funds named above (each individually a “Fund,” and collectively the “Funds”), each of which is a series of Nuveen Investment Funds, Inc. (“NIF”). This Statement of Additional Information is not a prospectus, but should be read in conjunction with the current Prospectus dated September 30, 2011. The financial statements included as part of the Funds’ Annual Reports to shareholders for the fiscal period ended May 31, 2011 and the financial statements included as part of the Funds’ Semi-Annual Reports to shareholders for the fiscal period ended December 31, 2010 for all Funds are incorporated by reference into this Statement of Additional Information. This Statement of Additional Information is incorporated into the Funds’ Prospectus by reference. To obtain copies of the Prospectus or the Funds’ Annual Report(s) or Semi-Annual Report(s) at no charge, write the applicable Fund, c/o Nuveen Investor Services, P.O. Box 701, Milwaukee, Wisconsin 53201-0701, or call (800) 257-8787. You can also find the Funds’ Prospectus, Statement of Additional Information, and Annual Reports online at www.nuveen.com. Please retain this Statement of Additional Information for future reference.
| S-3 | ||
| S-3 | ||
| S-4 | ||
| S-4 | ||
| S-4 | ||
| S-5 | ||
| S-10 | ||
| S-12 | ||
| S-12 | ||
| S-13 | ||
| S-13 | ||
| S-14 | ||
| S-14 | ||
| S-15 | ||
| S-16 | ||
| S-16 | ||
Special Considerations Relating to Municipal Obligations of Designated States | S-16 | |
| S-20 | ||
| S-22 | ||
| S-22 | ||
| S-22 | ||
| S-25 | ||
| S-32 | ||
| S-35 | ||
| S-38 | ||
| S-38 | ||
| S-39 | ||
| S-40 | ||
| S-40 | ||
| S-40 | ||
| S-40 | ||
| S-43 | ||
| S-43 | ||
| S-46 | ||
| S-47 | ||
| S-47 | ||
| S-51 | ||
| S-52 | ||
| S-52 | ||
| S-52 | ||
| S-53 | ||
| S-53 | ||
| S-54 | ||
| S-55 | ||
| S-62 | ||
| S-63 | ||
| S-71 | ||
| S-71 | ||
Reduction or Elimination of Up-Front Sales Charge on Class A Shares | S-72 | |
| S-73 | ||
| S-74 | ||
Reduction or Elimination of Contingent Deferred Sales Charge | S-74 | |
| S-75 | ||
| S-76 | ||
| S-77 | ||
| S-79 | ||
Appendix A—Rating of Investments | A-1 | |
| B-1 | ||
S-2
Nuveen Investment Funds, Inc. was incorporated in the State of Maryland on August 20, 1987 under the name “SECURAL Mutual Funds, Inc.” The Board of Directors and shareholders, at meetings held January 10, 1991, and April 2, 1991, respectively, approved amendments to the Articles of Incorporation providing that the name “SECURAL Mutual Funds, Inc.” be changed to “First American Investment Funds, Inc.” At a meeting held February 27, 2011, the Board of Directors approved the name “First American Investment Funds, Inc.” be changed to “Nuveen Investment Funds, Inc.”
NIF is organized as a series fund and currently issues its shares in 37 series. Each series of shares represents a separate investment portfolio with its own investment objective and policies (in essence, a separate mutual fund). The series of NIF to which this Statement of Additional Information (“SAI”) relates are named on the cover. Also, when a specific Fund is discussed herein, the word “Nuveen” is dropped from the beginning of its name.
The Funds are non-diversified open-end management investment companies. The Funds were formerly advised by FAF Advisors, Inc. (“FAF”), a wholly-owned subsidiary of U.S. Bank National Association (“U.S. Bank”). On December 31, 2010, pursuant to an agreement among U.S. Bank, FAF, Nuveen Investments, Inc. (“Nuveen Investments”) and certain Nuveen affiliates, Nuveen Fund Advisors, Inc., (the “Adviser” or “Nuveen Fund Advisors”) acquired a portion of the asset management business of FAF and was selected as the investment adviser of the Funds (the “Transaction”).
Shareholders may purchase shares of each Fund through two separate classes, Class A and Class I, and may purchase Class C shares of Minnesota Intermediate Municipal Bond Fund, Minnesota Municipal Bond Fund, Nebraska Municipal Bond Fund and Oregon Intermediate Municipal Bond Fund. The Funds, other than Oregon Intermediate Municipal Bond Fund, have Class C1 shares, which are not available for new accounts or for additional investment into existing accounts, but can be issued for purposes of dividend reinvestment. The different share classes provide for variations in distribution costs, shareholder servicing fees, voting rights and dividends. To the extent permitted by the Investment Company Act of 1940, as amended (“1940 Act”), the Funds may also provide for variations in other costs among the classes. In addition, a sales load is imposed on the sale of Class A, Class C and Class C1 shares of the Funds. Except for the foregoing differences among the classes pertaining to costs and fees, each share of each Fund represents an equal proportionate interest in that Fund.
The Articles of Incorporation and Bylaws of NIF provide that meetings of shareholders be held as determined by the Board of Directors and as required by the 1940 Act. Maryland corporation law requires a meeting of shareholders to be held upon the written request of shareholders holding 10% or more of the voting shares of NIF, with the cost of preparing and mailing the notice of such meeting payable by the requesting shareholders. The 1940 Act requires a shareholder vote for, among other things, all amendments to fundamental investment policies and restrictions, for approval of investment advisory contracts and amendments thereto, and for amendments to Rule 12b-1 distribution plans.
ADDITIONAL INFORMATION CONCERNING FUND INVESTMENTS
The principal investment strategies of each Fund are set forth in the Funds’ Prospectus. Additional information concerning principal investment strategies of the Funds, and other investment strategies that may be used by the Funds, is set forth below. The Funds have attempted to identify investment strategies that will be employed in pursuing each Fund’s investment objective. Additional information concerning the Funds’ investment restrictions is set forth below under “Investment Restrictions.”
If a percentage limitation on investments by a Fund stated in this SAI or the Prospectus is adhered to at the time of an investment, a later increase or decrease in percentage resulting from changes in asset value will not be deemed to violate the limitation except in the case of the limitations on borrowing. A Fund, which is limited to investing in securities with specified ratings or of a certain
S-3
credit quality, is not required to sell a security if its rating is reduced or its credit quality declines after purchase, but may consider doing so. Descriptions of the rating categories of Standard & Poor’s Ratings Services, a division of The McGraw-Hill Companies, Inc. (“Standard & Poor’s”), Fitch, Inc. (“Fitch”) and Moody’s Investors Service, Inc. (“Moody’s”) are contained in Appendix A.
References in this section to the Adviser also apply, to the extent applicable, to the sub-adviser of the Funds.
To the extent required by Securities and Exchange Commission (“SEC”) guidelines, a Fund will only engage in transactions that expose it to an obligation to another party if it owns either (a) an offsetting position for the same type of financial asset, or (b) cash or liquid securities, designated on the Fund’s books or held in a segregated account, with a value sufficient at all times to cover its potential obligations not covered as provided in (a). Examples of transactions governed by these asset coverage requirements include, for example, options written by the Funds, futures contracts and options on futures contracts, forward currency contracts, swaps and when-issued and delayed delivery transactions. Assets used as offsetting positions, designated on a Fund’s books, or held in a segregated account cannot be sold while the positions requiring cover are open unless replaced with other appropriate assets. As a result, the commitment of a large portion of assets to be used as offsetting positions or to be designated or segregated in such a manner could impede portfolio management or the ability to meet redemption requests or other current obligations.
The Funds may invest in corporate debt securities only to the extent described below under “—Temporary Taxable Investments.” Corporate debt securities are fully taxable debt obligations issued by corporations. These securities fund capital improvements, expansions, debt refinancing or acquisitions that require more capital than would ordinarily be available from a single lender. Investors in corporate debt securities lend money to the issuing corporation in exchange for interest payments and repayment of the principal at a set maturity date. Rates on corporate debt securities are set according to prevailing interest rates at the time of the issue, the credit rating of the issuer, the length of the maturity and other terms of the security, such as a call feature. Corporate debt securities are subject to the risk of an issuer’s inability to meet principal and interest payments on the obligations and may also be subject to price volatility due to such factors as market interest rates, market perception of the creditworthiness of the issuer and general market liquidity. In addition, corporate restructurings, such as mergers, leveraged buyouts, takeovers or similar corporate transactions are often financed by an increase in a corporate issuer’s debt securities. As a result of the added debt burden, the credit quality and market value of an issuer’s existing debt securities may decline significantly.
Debt Obligations Rated Less Than Investment Grade
The Funds may invest in both investment grade and non-investment grade debt obligations as principal investment strategies. Debt obligations rated less than “investment grade” are sometimes referred to as “high yield securities” or “junk bonds.��� To be consistent with the ratings methodology used by Barclays, the provider of the benchmarks of the Funds, a debt obligation is considered to be rated “investment grade” if two of Moody’s, Standard & Poor’s and Fitch rate the security investment-grade (i.e. at least Baa, BBB and BBB, respectively). If ratings are provided by only two of those rating agencies, the more conservative rating is used to determine whether the security is investment-grade. If only one of those rating agencies provides a rating, that rating is used. The Funds may invest in non-investment grade debt obligations rated at least B by two of Standard & Poor’s, Moody’s and Fitch, unless only one of those rating agencies rates the security, in which case that rating must be at least B, or in unrated securities determined to be of comparable quality by the Adviser.
Yields on non-investment grade debt obligations will fluctuate over time. The prices of such obligations have been found to be less sensitive to interest rate changes than higher rated obligations, but more sensitive to adverse economic changes or individual corporate developments. Also, during an economic downturn or period of rising interest rates, highly leveraged issuers may experience financial stress which could adversely affect their ability to service principal and interest
S-4
payment obligations, to meet projected business goals, and to obtain additional financing. In addition, periods of economic uncertainty and changes can be expected to result in increased volatility of market prices of non-investment grade debt obligations. If the issuer of a security held by a Fund defaulted, the Fund might incur additional expenses to seek recovery.
In addition, the secondary trading market for non-investment grade debt obligations may be less developed than the market for investment grade obligations. This may make it more difficult for a Fund to value and dispose of such obligations. Adverse publicity and investor perceptions, whether or not based on fundamental analysis, may decrease the values and liquidity of non-investment grade obligations, especially in a thin secondary trading market.
Certain risks also are associated with the use of credit ratings as a method for evaluating non-investment grade debt obligations. For example, credit ratings evaluate the safety of principal and interest payments, not the market value risk of such obligations. In addition, credit rating agencies may not timely change credit ratings to reflect current events. Thus, the success of a Fund’s use of non-investment grade debt obligations may be more dependent on the Adviser’s own credit analysis than is the case with investment grade obligations.
Each Fund may use derivative instruments as a principal investment strategy, as described below. Generally, a derivative is a financial contract the value of which depends upon, or is derived from, the value of an underlying asset, reference rate or index. Derivatives generally take the form of contracts under which the parties agree to payments between them based upon the performance of a wide variety of underlying references, such as stocks, bonds, loans, commodities, interest rates, currency exchange rates, and various domestic and foreign indices. Derivative instruments that some or all of the Funds may use include options contracts, futures contracts, options on futures contracts, forward currency contracts and swap transactions, all of which are described in more detail below.
The Funds may use derivatives for a variety of reasons, including as a substitute for investing directly in securities and currencies, as an alternative to selling a security short, as part of a hedging strategy (that is, for the purpose of reducing risk to a Fund), to manage the effective duration of a Fund’s portfolio, or for other purposes related to the management of the Funds. Derivatives permit a Fund to increase or decrease the level of risk, or change the character of the risk, to which its portfolio is exposed in much the same way as the Fund can increase or decrease the level of risk, or change the character of the risk, of its portfolio by making investments in specific securities. However, derivatives may entail investment exposures that are greater than their cost would suggest. As a result, a small investment in derivatives could have a large impact on a Fund’s performance.
Derivatives can be volatile and involve various types and degrees of risk, depending upon the characteristics of the particular derivative and the portfolio as a whole. If a Fund invests in derivatives at inopportune times or judges market conditions incorrectly, such investments may lower the Fund’s return or result in a loss. A Fund also could experience losses or limit its gains if the performance of its derivatives is poorly correlated with the underlying instruments or the Fund’s other investments, or if the Fund is unable to liquidate its position because of an illiquid secondary market. The market for derivatives is, or suddenly can become, illiquid. Changes in liquidity may result in significant, rapid and unpredictable changes in the prices for derivatives.
While transactions in some derivatives may be effected on established exchanges, many other derivatives are privately negotiated and entered into in the over-the-counter market with a single counterparty. When exchange-traded derivatives are purchased and sold, a clearing agency associated with the exchange stands between each buyer and seller and effectively guarantees performance of each contract, either on a limited basis through a guaranty fund or to the full extent of the clearing agency’s balance sheet. Transactions in over-the-counter derivatives have no such protection. Each party to an over-the-counter derivative bears the risk that its direct counterparty will default. In addition, over-the-counter derivatives may be less liquid than exchange-traded derivatives since the other party to the transaction may be the only investor with sufficient understanding of the derivative to be interested in bidding for it.
S-5
Derivatives generally involve leverage in the sense that the investment exposure created by the derivative is significantly greater than the Fund’s initial investment in the derivative. As discussed above under “—Asset Coverage Requirements,” a Fund may be required to segregate permissible liquid assets, or engage in other permitted measures, to “cover” the Fund’s obligations relating to its transactions in derivatives. For example, in the case of futures contracts or forward contracts that are not contractually required to cash settle, a Fund must set aside liquid assets equal to such contracts’ full notional value (generally, the total numerical value of the asset underlying a future or forward contract at the time of valuation) while the positions are open. With respect to futures contracts or forward contracts that are contractually required to cash settle, however, a Fund is permitted to set aside liquid assets in an amount equal to the Fund’s daily mark-to-market net obligation (i.e., the Fund’s daily net liability) under the contracts, if any, rather than such contracts’ full notional value. By setting aside assets equal to only its net obligations under cash-settled futures and forward contracts, the Fund may employ leverage to a greater extent than if the Fund were required to segregate assets equal to the full notional value of such contracts.
Derivatives also may involve other types of leverage. For example, an instrument linked to the value of a securities index may return income calculated as a multiple of the price movement of the underlying index. This leverage will increase the volatility of these derivatives since they may increase or decrease in value more quickly than the underlying instruments.
The particular derivative instruments the Funds can use are described below. A Fund’s portfolio manager may decide not to employ some or all of these instruments, and there is no assurance that any derivatives strategy used by a Fund will succeed. The Funds may employ new derivative instruments and strategies when they are developed, if those investment methods are consistent with the particular Fund’s investment objective and are permissible under applicable regulations governing the Fund.
Futures and Options on Futures
The Funds may engage in futures transactions as a principal investment strategy. The Funds may buy and sell futures contracts that relate to: (1) interest rates, (2) debt securities, (3) bond indices, (4) commodities, (5) stock indices, and (6) individual stocks. The Funds also may buy and write options on the futures contracts in which they may invest (“futures options”) and may write straddles, which consist of a call and a put option on the same futures contract. The Funds will only write options and straddles which are “covered.” This means that, when writing a call option, a Fund must either segregate liquid assets with a value equal to the fluctuating market value of the optioned futures contract, or the Fund must own an option to purchase the same futures contract having an exercise price that is (i) equal to or less than the exercise price of the call written, or (ii) greater than the exercise price of the call written, provided the difference is maintained by the Fund in segregated liquid assets. When writing a put option, a Fund must segregate liquid assets in an amount not less than the exercise price, or own a put option on the same futures contract where the exercise price of the put held is (i) equal to or greater than the exercise price of the put written, or (ii) less than the exercise price of the put written, provided the difference is maintained by the Fund in segregated liquid assets. A straddle will be covered when sufficient assets are deposited to meet the Fund’s immediate obligations. A Fund may use the same liquid assets to cover both the call and put options in a straddle where the exercise price of the call and put are the same, or the exercise price of the call is higher than that of the put. In such cases, the Fund will also segregate liquid assets equivalent to the amount, if any, by which the put is “in the money.” The Funds may only enter into futures contracts and futures options which are standardized and traded on a U.S. or foreign exchange, board of trade or similar entity, or quoted on an automated quotation system.
A futures contract is an agreement between two parties to buy and sell a security, index, interest rate, currency or commodity (each a “financial instrument”) for a set price on a future date. Certain futures contracts, such as futures contracts relating to individual securities, call for making or taking delivery of the underlying financial instrument. However, these contracts generally are closed out before delivery by entering into an offsetting purchase or sale of a matching futures contract (same exchange, underlying financial instrument, and delivery month). Other futures contracts, such as futures contracts on interest rates and indices, do not call for making or taking delivery of the underlying financial instrument, but rather are agreements pursuant to which two parties agree to take
S-6
or make delivery of an amount of cash equal to the difference between the value of the financial instrument at the close of the last trading day of the contract and the price at which the contract was originally written. These contracts also may be settled by entering into an offsetting futures contract.
Unlike when a Fund purchases or sells a security, no price is paid or received by a Fund upon the purchase or sale of a futures contract. Initially, a Fund will be required to deposit with the futures broker, known as a futures commission merchant (“FCM”), an amount of cash or securities equal to a varying specified percentage of the contract amount. This amount is known as initial margin. The margin deposit is intended to ensure completion of the contract. Minimum initial margin requirements are established by the futures exchanges and may be revised. In addition, FCMs may establish margin deposit requirements that are higher than the exchange minimums. Cash held in the margin account generally is not income producing. However, coupon-bearing securities, such as Treasury securities, held in margin accounts generally will earn income. Subsequent payments to and from the FCM, called variation margin, will be made on a daily basis as the price of the underlying financial instrument fluctuates, making the futures contract more or less valuable, a process known as marking the contract to market. Changes in variation margin are recorded by a Fund as unrealized gains or losses. At any time prior to expiration of the futures contract, a Fund may elect to close the position by taking an opposite position that will operate to terminate its position in the futures contract. A final determination of variation margin is then made, additional cash is required to be paid by or released to the Fund, and the Fund realizes a gain or loss. In the event of the bankruptcy or insolvency of an FCM that holds margin on behalf of a Fund, the Fund may be entitled to the return of margin owed to it only in proportion to the amount received by the FCM’s other customers, potentially resulting in losses to the Fund. Futures transactions also involve brokerage costs and the Fund may have to segregate additional liquid assets in accordance with applicable SEC requirements. See “—Asset Coverage Requirements” above.
A futures option gives the purchaser of such option the right, in return for the premium paid, to assume a long position (call) or short position (put) in a futures contract at a specified exercise price at any time during the period of the option. Upon exercise of a call option, the purchaser acquires a long position in the futures contract and the writer is assigned the opposite short position. Upon the exercise of a put option, the opposite is true. Futures options possess many of the same characteristics as options on securities, currencies and indices (discussed below under “—Options Transactions”).
Limitations on the Use of Futures and Futures Options. The Commodities Futures Trading Commission has eliminated limitations on futures trading by certain regulated entities including registered investment companies. Consequently, registered investment companies may engage in unlimited futures transactions and options thereon provided they have claimed an exclusion from regulation as a commodity pool operator. NIF, on behalf of each of its series, has claimed such an exclusion. Thus, each Fund may use futures contracts and options thereon to the extent consistent with its investment objective. The requirements for qualification as a regulated investment company may limit the extent to which a Fund may enter into futures transactions. See “Taxation.”
Risks Associated with Futures and Futures Options. There are risks associated with the use of futures contracts and futures options. A purchase or sale of a futures contract may result in a loss in excess of the amount invested in the futures contract.
If futures are used for hedging purposes, there can be no guarantee that there will be a correlation between price movements in the futures contract and in the underlying financial instruments that are being hedged. This could result from differences between the financial instruments being hedged and the financial instruments underlying the standard contracts available for trading (e.g., differences in interest rate levels, maturities and the creditworthiness of issuers). In addition, price movements of futures contracts may not correlate perfectly with price movements of the financial instruments underlying the futures contracts due to certain market distortions.
Successful use of futures by the Funds also is subject to the Adviser’s ability to predict correctly movements in the direction of the relevant market. For example, if a Fund uses futures to hedge against the possibility of a decline in the market value of securities held in its portfolio and the prices of such securities increase instead, the Fund will lose part or all of the benefit of the increased value of
S-7
the securities which it has hedged because it will have offsetting losses in its futures positions. Furthermore, if in such circumstances the Fund has insufficient cash, it may have to sell securities to meet daily variation margin requirements. The Fund may have to sell such securities at a time when it may be disadvantageous to do so.
There can be no assurance that a liquid market will exist at a time when a Fund seeks to close out a futures or a futures option position, and the Fund would remain obligated to meet margin requirements until the position is closed. Futures exchanges may limit the amount of fluctuation permitted in certain futures contract prices during a single trading day. The daily limit establishes the maximum amount that the price of a futures contract may vary either up or down from the previous day’s settlement price at the end of the current trading session. Once the daily limit has been reached in a futures contract subject to the limit, no more trades may be made on that day at a price beyond that limit. The daily limit governs only price movements during a particular trading day and therefore does not limit potential losses because the limit may work to prevent the liquidation of unfavorable positions. For example, futures prices have occasionally moved to the daily limit for several consecutive trading days with little or no trading, thereby preventing prompt liquidation of positions and subjecting some holders of futures contracts to substantial losses.
Additional Risks Associated with Commodity Futures Contracts. There are several additional risks associated with transactions in commodity futures contracts.
Storage. Unlike the financial futures markets, in the commodity futures markets there are costs of physical storage associated with purchasing the underlying commodity. The price of the commodity futures contract will reflect the storage costs of purchasing the physical commodity, including the time value of money invested in the physical commodity. To the extent that the storage costs for an underlying commodity change while the Fund is invested in futures contracts on that commodity, the value of the futures contract may change proportionately.
Reinvestment. In the commodity futures markets, producers of the underlying commodity may decide to hedge the price risk of selling the commodity by selling futures contracts today to lock in the price of the commodity at the time of delivery. In order to induce speculators to purchase the other side of the same futures contract, the commodity producer generally must sell the futures contract at a lower price than the expected future spot price. Conversely, if most hedgers in the futures market are purchasing futures contracts to hedge against a rise in prices, then speculators will only sell the other side of the futures contract at a higher futures price than the expected future spot price of the commodity. The changing nature of the hedgers and speculators in the commodity markets will influence whether futures prices are above or below the expected future spot price. If the nature of hedgers and speculators in futures markets has shifted when it is time for the Fund to reinvest the proceeds of a maturing contract in a new futures contract, the Fund might reinvest at higher or lower futures prices, or choose to pursue other investments.
Other Economic Factors. The commodities which underlie commodity futures contracts may be subject to additional economic and non-economic variables, such as drought, floods, weather, livestock disease, embargoes, tariffs, and international economic, political and regulatory developments. These factors may have a larger impact on commodity prices and commodity-linked instruments, including futures contracts, than on traditional securities. Certain commodities are also subject to limited pricing flexibility because of supply and demand factors. Others are subject to broad price fluctuations as a result of the volatility of the prices for certain raw materials and the instability of supplies of other materials.
Options Transactions
To the extent set forth below, the Funds may purchase put and call options on interest rates, stock indices, bond indices, and commodity indices. Options on futures contracts are discussed above under “—Futures and Options on Futures.”
Options on Interest Rates and Indices. As non-principal investment strategies, the Funds may purchase put and call options on interest rates and on stock and bond indices. An option on interest rates or on an index gives the holder the right to receive, upon exercise of the option, an amount of cash if the closing value of the underlying interest rate or index is greater than, in the case of a call, or
S-8
less than, in the case of a put, the exercise price of the option. This amount of cash is equal to the difference between the exercise-settlement value of the interest rate option or the closing price of the index and the exercise price of the option expressed in dollars times a specified multiple (the “multiplier”). The writer of the option is obligated, for the premium received, to make delivery of this amount. Settlements for interest rate and index options are always in cash.
Expiration or Exercise of Options. If an option written by a Fund expires unexercised, the Fund realizes a capital gain equal to the premium received at the time the option was written. If an option purchased by a Fund expires unexercised, the Fund realizes a capital loss equal to the premium paid. Prior to the earlier of exercise or expiration, an exchange traded option may be closed out by an offsetting purchase or sale of an option of the same series (type, exchange, underlying security, currency or index, exercise price, and expiration). There can be no assurance, however, that a closing purchase or sale transaction can be effected when the Fund desires.
A Fund may sell put or call options it has previously purchased, which could result in a net gain or loss depending on whether the amount realized on the sale is more or less than the premium and other transaction costs paid on the put or call option which is sold. Prior to exercise or expiration, an option may be closed out by an offsetting purchase or sale of an option of the same series. A Fund will realize a capital gain from a closing purchase transaction if the cost of the closing option is less than the premium received from writing the option, or, if it is more, the Fund will realize a capital loss. If the premium received from a closing sale transaction is more than the premium paid to purchase the option, the Fund will realize a capital gain or, if it is less, the Fund will realize a capital loss. The principal factors affecting the market value of a put or a call option include supply and demand, interest rates, the current market price of the underlying security, currency or index in relation to the exercise price of the option, the volatility of the underlying security, currency or index, and the time remaining until the expiration date.
Risks Associated with Options Transactions. There are several risks associated with options transactions. For example, there are significant differences between the securities and options markets that could result in an imperfect correlation between these markets, causing a given transaction not to achieve its objectives. A decision as to whether, when and how to use options involves the exercise of skill and judgment, and even a well-conceived transaction may be unsuccessful to some degree because of market behavior or unexpected events.
When a Fund purchases a put or call option, it risks a total loss of the premium paid for the option, plus any transaction costs, if the price of the underlying security does not increase or decrease sufficiently to justify the exercise of such option. Also, where a put or call option on a particular security is purchased to hedge against price movements in a related security, the price of the put or call option may move more or less than the price of the related security.
There can be no assurance that a liquid market will exist when a Fund seeks to close out an option position. If a Fund were unable to close out an option that it had purchased on a security, it would have to exercise the option in order to realize any profit or the option may expire worthless. There is also a risk that, if restrictions on exercise were imposed, a Fund might be unable to exercise an option it had purchased.
Interest Rate Caps, Floors and Collars
The Funds may enter into interest rate caps, floors and collars as a non-principal investment strategy. The purchase of an interest rate floor entitles the purchaser, to the extent that a specified index falls below a predetermined interest rate, to receive payments of interest on a notional principal amount from the party selling such interest rate floor. The purchase of an interest rate cap entitles the purchaser, to the extent that a specified index rises above a predetermined interest rate, to receive payments of interest on a notional principal amount from the party selling such interest rate cap. Interest rate collars involve selling a cap and purchasing a floor or vice versa to protect a Fund against interest rate movements exceeding given minimum or maximum levels.
Risks Associated with Interest Rate Caps, Floors and Collars Transactions. The use of interest rate caps, floors and collars transactions is a highly specialized activity which involves strategies and risks different from those associated with ordinary portfolio security transactions. If the sub-adviser is
S-9
incorrect in its forecasts of default risks, market spreads or other applicable factors the investment performance of a Fund would diminish compared with what it would have been if these techniques were not used. A Fund may only close out a cap, floor or collar with its particular counterparty, and may only transfer a position with the consent of that counterparty. In addition, the price at which a Fund may close out such a two party contract may not correlate with the price change in the underlying reference asset. If the counterparty defaults, a Fund will have contractual remedies, but there can be no assurance that the counterparty will be able to meet its contractual obligations or that the Fund will succeed in enforcing its rights. It also is possible that developments in the derivatives market, including potential government regulation, could adversely affect a Fund’s ability to terminate existing agreements or to realize amounts to be received under such agreements.
Municipal Bonds and Other Municipal Obligations
The Funds invest principally in municipal bonds and other municipal obligations. These bonds and other obligations are issued by the states and by their local and special-purpose political subdivisions. The term “municipal bond” includes short-term municipal notes issued by the states and their political subdivisions, including, but not limited to, tax anticipation notes (“TANs”), bond anticipation notes (“BANs”), revenue anticipation notes (“RANs”), construction loan notes, tax free commercial paper, and tax free participation certificates.
Municipal Bonds
The two general classifications of municipal bonds are “general obligation” bonds and “revenue” bonds. General obligation bonds are secured by the governmental issuer’s pledge of its faith, credit and taxing power for the payment of principal and interest upon a default by the issuer of its principal and interest payment obligations. They are usually paid from general revenues of the issuing governmental entity. Revenue bonds, on the other hand, are usually payable only out of a specific revenue source rather than from general revenues. Revenue bonds ordinarily are not backed by the faith, credit or general taxing power of the issuing governmental entity. The principal and interest on revenue bonds for private facilities are typically paid out of rents or other specified payments made to the issuing governmental entity by a private company which uses or operates the facilities. Examples of these types of obligations are industrial revenue bond and pollution control revenue bonds. Industrial revenue bonds are issued by governmental entities to provide financing aid to community facilities such as hospitals, hotels, business or residential complexes, convention halls and sport complexes. Pollution control revenue bonds are issued to finance air, water and solids pollution control systems for privately operated industrial or commercial facilities.
Revenue bonds for private facilities usually do not represent a pledge of the credit, general revenues or taxing powers of issuing governmental entity. Instead, the private company operating the facility is the sole source of payment of the obligation. Sometimes, the funds for payment of revenue bonds come solely from revenue generated by operation of the facility. Revenue bonds which are not backed by the credit of the issuing governmental entity frequently provide a higher rate of return than other municipal obligations, but they entail greater risk than obligations which are guaranteed by a governmental unit with taxing power. Federal income tax laws place substantial limitations on industrial revenue bonds, and particularly certain specified private activity bonds issued after August 7, 1986. In the future, legislation could be introduced in Congress which could further restrict or eliminate the income tax exemption for interest on debt obligations in which the Funds may invest.
Refunded Bonds
The Funds may invest in refunded bonds. Refunded bonds may have originally been issued as general obligation or revenue bonds, but become refunded when they are secured by an escrow fund, usually consisting entirely of direct U.S. government obligations and/or U.S. government agency obligations sufficient for paying the bondholders. There are two types of refunded bonds: pre-refunded bonds and escrowed-to-maturity (“ETM”) bonds. The escrow fund for a pre-refunded municipal bond may be structured so that the refunded bonds are to be called at the first possible date or a subsequent call date established in the original bond debenture. The call price usually includes a premium from 1% to 3% above par. This type of structure usually is used for those refundings that either reduce the issuer’s interest payment expenses or change the debt maturity
S-10
schedule. In escrow funds for ETM refunded municipal bonds, the maturity schedules of the securities in the escrow funds match the regular debt-service requirements on the bonds as originally stated in the bond indentures.
Municipal Leases and Certificates of Participation
The Funds also may purchase municipal lease obligations, primarily through certificates of participation. Certificates of participation in municipal leases are undivided interests in a lease, installment purchase contract or conditional sale contract entered into by a state or local governmental unit to acquire equipment or facilities. Municipal leases frequently have special risks which generally are not associated with general obligation bonds or revenue bonds.
Municipal leases and installment purchase or conditional sales contracts (which usually provide for title to the leased asset to pass to the governmental issuer upon payment of all amounts due under the contract) have evolved as a means for governmental issuers to acquire property and equipment without meeting the constitutional and statutory requirements for the issuance of municipal debt. The debt issuance limitations are deemed to be inapplicable because of the inclusion in many leases and contracts of “non-appropriation” clauses that provide that the governmental issuer has no obligation to make future payments under the lease or contract unless money is appropriated for this purpose by the appropriate legislative body on a yearly or other periodic basis. Although these kinds of obligations are secured by the leased equipment or facilities, the disposition of the pledged property in the event of non-appropriation or foreclosure might, in some cases, prove difficult and time-consuming. In addition, disposition upon non-appropriation or foreclosure might not result in recovery by a Fund of the full principal amount represented by an obligation.
In light of these concerns, the Funds have adopted and follow procedures for determining whether municipal lease obligations purchased by the Funds are liquid and for monitoring the liquidity of municipal lease securities held in each Fund’s portfolio. These procedures require that a number of factors be used in evaluating the liquidity of a municipal lease security, including the frequency of trades and quotes for the security, the number of dealers willing to purchase or sell the security and the number of other potential purchasers, the willingness of dealers to undertake to make a market in security, the nature of the marketplace in which the security trades, and other factors which the Adviser may deem relevant. As set forth in “Investment Restrictions” below, each such Fund is subject to limitations on the percentage of illiquid securities it can hold.
Derivative Municipal Securities
The Funds may also acquire derivative municipal securities, which are custodial receipts of certificates underwritten by securities dealers or banks that evidence ownership of future interest payments, principal payments or both on certain municipal securities. The underwriter of these certificates or receipts typically purchases municipal securities and deposits them in an irrevocable trust or custodial account with a custodian bank, which then issues receipts or certificates that evidence ownership of the periodic unmatured coupon payments and the final principal payment on the obligation.
The principal and interest payments on the municipal securities underlying custodial receipts may be allocated in a number of ways. For example, payments may be allocated such that certain custodial receipts may have variable or floating interest rates and others may be stripped securities which pay only the principal or interest due on the underlying municipal securities. The Funds may invest in custodial receipts which have inverse floating interest rates and other inverse floating rate municipal obligations, as described below under “—Inverse Floating Rate Municipal Obligations.”
Tender Option Bonds (“TOBs”)
TOBs are created by municipal bond dealers who purchase long-term tax-exempt bonds in the secondary market, place the certificates in trusts, and sell interests in the trusts with puts or other liquidity guarantees attached. The credit quality of the resulting synthetic short-term instrument is based on the put provider’s short-term rating and the underlying bond’s long-term rating. There is some risk that a remarketing agent will renege on a tender option agreement if the underlying bond is downgraded or defaults. Because of this the Adviser will consider on an ongoing basis the
S-11
creditworthiness of the issuer of the underlying municipal securities, of any custodian, and of the third-party provider of the tender option. In certain instances and for certain TOBs, the option may be terminable in the event of a default in payment of principal or interest on the underlying municipal securities and for other reasons.
Variable Rate Demand Notes (“VRDNs”)
VRDNs are long-term municipal obligations that have variable or floating interest rates and provide a Fund with the right to tender the security for repurchase at its stated principal amount plus accrued interest. Such securities typically bear interest at a rate that is intended to cause the securities to trade at par. The interest rate may float or be adjusted at regular intervals (ranging from daily to annually), and is normally based on an applicable interest index or another published interest rate or interest rate index. Most VRDNs allow a Fund to demand the repurchase of the security on not more than seven days prior notice. Other notes only permit a Fund to tender the security at the time of each interest rate adjustment or at other fixed intervals. Variable interest rates generally reduce changes in the market value of municipal obligations from their original purchase prices. Accordingly, as interest rates decrease, the potential for capital appreciation is less for variable rate municipal obligations than for fixed income obligations.
Inverse Floating Rate Municipal Obligations
The Funds may invest in inverse floating rate municipal obligations. An inverse floating rate obligation entitles the holder to receive interest at a rate which changes in the opposite direction from, and in the same magnitude as, or in a multiple of, changes in a specified index rate. Although an inverse floating rate municipal obligation would tend to increase portfolio income during a period of generally decreasing market interest rates, its value would tend to decline during a period of generally increasing market interest rates. In addition, its decline in value may be greater than for a fixed-rate municipal obligation, particularly if the interest rate borne by the floating rate municipal obligation is adjusted by a multiple of changes in the specified index rate. For these reasons, inverse floating rate municipal obligations have more risk than more conventional fixed-rate and floating rate municipal obligations.
Each Fund may invest in other investment companies, such as mutual funds, closed-end funds, and exchange-traded funds (“ETFs”). Under the 1940 Act, a Fund’s investment in such securities, subject to certain exceptions, currently is limited to 3% of the total voting stock of any one investment company; 5% of the Fund’s total assets with respect to any one investment company; and 10% of a Fund’s total assets in the aggregate. The Funds will only invest in other investment companies that invest in Fund-eligible investments. A Fund’s investments in other investment companies may include money market mutual funds. Investments in money market funds are not subject to the percentage limitations set forth above.
If a Fund invests in other investment companies, Fund shareholders will bear not only their proportionate share of the Fund’s expenses, but also, indirectly, the similar expenses of the underlying investment companies. Shareholders would also be exposed to the risks associated not only to the Fund, but also to the portfolio investments of the underlying investment companies. Shares of certain closed-end funds may at times be acquired only at market prices representing premiums to their net asset values. Shares acquired at a premium to their net asset value may be more likely to subsequently decline in price, resulting in a loss to the Fund and its shareholders. The underlying securities in an ETF may not follow the price movements of the industry or sector the ETF is designed to track. Trading in an ETF may be halted if the trading in one or more of the ETF’s underlying securities is halted, which could result in the ETF being more volatile.
Payment-In-Kind Debentures and Delayed Interest Securities
The Funds, as a non-principal investment strategy, may invest in debentures the interest on which may be paid in other securities rather than cash (“PIKs”) or may be delayed (“delayed interest securities”). Typically, during a specified term prior to the debenture’s maturity, the issuer of a PIK may provide for the option or the obligation to make interest payments in debentures, common stock
S-12
or other instruments (i.e., “in kind” rather than in cash). The type of instrument in which interest may or will be paid would be known by a Fund at the time of investment. While PIKs generate income for purposes of generally accepted accounting standards, they do not generate cash flow and thus could cause a Fund to be forced to liquidate securities at an inopportune time in order to distribute cash, as required by the Internal Revenue Code (the “Code”).
Unlike PIKs, delayed interest securities do not pay interest for a specified period. Because values of securities of this type are subject to greater fluctuations than are the values of securities that distribute income regularly, they may be more speculative than such securities.
Each Fund may invest in repurchase agreements as a non-principal investment strategy. Ordinarily, a Fund does not expect its investment in repurchase agreements to exceed 10% of its total assets. However, because each Fund may invest without limit in cash and short-term securities for temporary defensive purposes, there is no limit on each Fund’s ability to invest in repurchase agreements. A repurchase agreement involves the purchase by a Fund of securities with the agreement that after a stated period of time, the original seller will buy back the same securities (“collateral”) at a predetermined price or yield. Repurchase agreements involve certain risks not associated with direct investments in securities. If the original seller defaults on its obligation to repurchase as a result of its bankruptcy or otherwise, the purchasing Fund will seek to sell the collateral, which could involve costs or delays. Although collateral (which may consist of any fixed income security which is an eligible investment for the Fund entering into the repurchase agreement) will at all times be maintained in an amount equal to the repurchase price under the agreement (including accrued interest), a Fund would suffer a loss if the proceeds from the sale of the collateral were less than the agreed-upon repurchase price. The Adviser will monitor the creditworthiness of the firms with which the Funds enter into repurchase agreements.
The Funds’ custodian will hold the securities underlying any repurchase agreement, or the securities will be part of the Federal Reserve/Treasury Book Entry System. The market value of the collateral underlying the repurchase agreement will be determined on each business day. If at any time the market value of the collateral falls below the repurchase price under the repurchase agreement (including any accrued interest), the appropriate Fund will promptly receive additional collateral (so the total collateral is an amount at least equal to the repurchase price plus accrued interest).
Short-Term Temporary Investments
In an attempt to respond to adverse market, economic, political or other conditions, each Fund may temporarily invest without limit in a variety of short-term instruments such as commercial paper and variable amount master demand notes; U.S. dollar-denominated time and savings deposits (including certificates of deposit); bankers’ acceptances; obligations of the U.S. government or its agencies or instrumentalities; repurchase agreements collateralized by eligible investments of a Fund; securities of other mutual funds that invest primarily in debt obligations with remaining maturities of 13 months or less (which investments also are subject to an advisory fee); and other similar high-quality short-term U.S. dollar-denominated obligations.
Each Fund may also invest in Eurodollar certificates of deposit issued by foreign branches of U.S. or foreign banks; Eurodollar time deposits, which are U.S. dollar-denominated deposits in foreign branches of U.S. or foreign banks; and Yankee certificates of deposit, which are U.S. dollar-denominated certificates of deposit issued by U.S. branches of foreign banks and held in the United States. In each instance, the Funds may only invest in bank instruments issued by an institution which has capital, surplus and undivided profits of more than $100 million or the deposits of which are insured by the Bank Insurance Fund or the Savings Association Insurance Fund.
S-13
Short-term investments and repurchase agreements may be entered into on a joint basis by the Funds and other funds advised by the Adviser to the extent permitted by an exemptive order issued by the SEC with respect to the Funds. A brief description of certain kinds of short-term instruments follows:
Commercial Paper
Commercial paper consists of unsecured promissory notes issued by corporations. Issues of commercial paper normally have maturities of less than nine months and fixed rates of return. Subject to the limitations described in the Prospectus, the Funds may purchase commercial paper consisting of issues rated at the time of purchase within the two highest rating categories by Standard & Poor’s, Fitch or Moody’s, or which have been assigned an equivalent rating by another nationally recognized statistical rating organization. The Funds also may invest in commercial paper that is not rated but that is determined by the Adviser to be of comparable quality to instruments that are so rated. For a description of the rating categories of Standard & Poor’s, Fitch and Moody’s, see Appendix A.
Bankers’ Acceptances
Bankers’ acceptances are credit instruments evidencing the obligation of a bank to pay a draft drawn on it by a customer. These instruments reflect the obligation both of the bank and of the drawer to pay the full amount of the instrument upon maturity.
Variable Amount Master Demand Notes
Variable amount master demand notes are unsecured demand notes that permit the indebtedness thereunder to vary and provide for periodic adjustments in the interest rate according to the terms of the instrument. Because master demand notes are direct lending arrangements between a Fund and the issuer, they are not normally traded. Although there is no secondary market in the notes, a Fund may demand payment of principal and accrued interest at any time. While the notes are not typically rated by credit rating agencies, issuers of variable amount master demand notes (which are normally manufacturing, retail, financial, and other business concerns) must satisfy the same criteria as set forth above for commercial paper. The Adviser will consider the earning power, cash flow and other liquidity ratios of the issuers of such notes and will continuously monitor their financial status and ability to meet payment on demand.
Variable Rate Demand Obligations
Variable rate demand obligations (“VRDOs”) are securities in which the interest rate is adjusted at pre-designated periodic intervals. VRDOs may include a demand feature which is a put that entitles the holder to receive the principal amount of the underlying security or securities and which may be exercised either at any time on no more than 30 days’ notice or at specified intervals not exceeding 397 calendar days on no more than 30 days’ notice.
The Funds may make temporary taxable investments. Temporary taxable investments will include only the following types of obligations maturing within 13 months from the date of purchase: (i) obligations of the U.S. government, its agencies and instrumentalities (including zero coupon securities); (ii) commercial paper rated not less than A-1 by Standard & Poor’s, F1 by Fitch or P-1 by Moody’s or which has been assigned an equivalent rating by another nationally recognized statistical rating organization; (iii) other short-term debt securities issued or guaranteed by corporations having outstanding debt rated not less than BBB- by Standard & Poor’s or Fitch or Baa3 by Moody’s or which have been assigned an equivalent rating by another nationally recognized statistical rating organization; (iv) certificates of deposit of domestic commercial banks subject to regulation by the U.S. government or any of its agencies or instrumentalities, with assets of $500 million or more based on the most recent published reports; and (v) repurchase agreements with domestic banks or securities dealers involving any of the securities which the Fund is permitted to hold.
The Funds may invest in U.S. government securities as a non-principal investment strategy. The U.S. government securities in which the Funds may invest are either issued or guaranteed by the U.S.
S-14
government, its agencies or instrumentalities. The U.S. government securities in which the Funds invest principally are:
| • | direct obligations of the U.S. Treasury, such as U.S. Treasury bills, notes, and bonds; |
| • | notes, bonds, and discount notes issued and guaranteed by U.S. government agencies and instrumentalities supported by the full faith and credit of the United States; |
| • | notes, bonds, and discount notes of U.S. government agencies or instrumentalities which receive or have access to federal funding; |
| • | notes, bonds, and discount notes of other U.S. government instrumentalities supported only by the credit of the instrumentalities; and |
| • | obligations that are issued by private issuers and guaranteed under the Federal Deposit Insurance Corporation Temporary Liquidity Guarantee Program. |
U.S. Treasury obligations include separately traded interest and principal component parts of such obligations, known as Separately Traded Registered Interest and Principal Securities (“STRIPS”), which are transferable through the Federal book-entry system. STRIPS are sold as zero coupon securities, which means that they are sold at a substantial discount and redeemed at face value at their maturity date without interim cash payments of interest or principal. This discount is accreted over the life of the security, and such accretion will constitute the income earned on the security for both accounting and tax purposes. Because of these features, such securities may be subject to greater interest rate volatility than interest paying U.S. Treasury obligations.
The government securities in which the Funds may invest are backed in a variety of ways by the U.S. government or its agencies or instrumentalities. Some of these securities, such as Government National Mortgage Association (“GNMA”) mortgage-backed securities, are backed by the full faith and credit of the U.S. government. Other securities, such as obligations of the Federal National Mortgage Association (“FNMA”) or the Federal Home Loan Mortgage Corporation (“FHLMC”) are backed by the credit of the agency or instrumentality issuing the obligations but not the full faith and credit of the U.S. government. No assurances can be given that the U.S. government will provide financial support to these other agencies or instrumentalities because it is not obligated to do so. See “—Mortgage-Backed Securities” above for a description of these securities and the Funds that may invest in them.
Variable, Floating, and Fixed Rate Debt Obligations
The debt obligations in which the Funds invest as either a principal or non-principal investment strategy may have variable, floating, or fixed interest rates. Variable rate securities provide for periodic adjustments in the interest rate. Floating rate securities are generally offered at an initial interest rate which is at or above prevailing market rates. The interest rate paid on floating rate securities is then reset periodically (commonly every 90 days) to an increment over some predetermined interest rate index. Commonly utilized indices include the three-month Treasury bill rate, the 180-day Treasury bill rate, the one-month or three-month London Interbank Offered Rate (LIBOR), the prime rate of a bank, the commercial paper rates, or the longer-term rates on U.S. Treasury securities. Variable and floating rate securities are relatively long-term instruments that often carry demand features permitting the holder to demand payment of principal at any time or at specified intervals prior to maturity. In order to most effectively use these securities, the Adviser must correctly assess probable movements in interest rates. If the Adviser incorrectly forecasts such movements, a Fund could be adversely affected by use of variable and floating rate securities.
Fixed rate securities pay a fixed rate of interest and tend to exhibit more price volatility during times of rising or falling interest rates than securities with variable or floating rates of interest. The value of fixed rate securities will tend to fall when interest rates rise and rise when interest rates fall. The value of variable or floating rate securities, on the other hand, fluctuates much less in response to market interest rate movements than the value of fixed rate securities. This is because variable and floating rate securities behave like short-term instruments in that the rate of interest they pay is subject to periodic adjustments according to a specified formula, usually with reference to some interest rate index or market interest rate. Fixed rate securities with short-term characteristics are not subject to the same price volatility as fixed rate securities without such characteristics. Therefore, they behave more like variable or floating rate securities with respect to price volatility.
S-15
When-Issued and Delayed Delivery Transactions
Each Fund may purchase securities on a when-issued or delayed delivery basis as a non-principal investment strategy. When such a transaction is negotiated, the purchase price is fixed at the time the purchase commitment is entered, but delivery of and payment for the securities take place at a later date. A Fund will not accrue income with respect to securities purchased on a when-issued or delayed delivery basis prior to their stated delivery date.
The purchase of securities on a when-issued or delayed delivery basis exposes a Fund to risk because the securities may decrease in value prior to delivery. In addition, a Fund’s purchase of securities on a when-issued or delayed delivery basis while remaining substantially fully invested could increase the amount of the Fund’s total assets that are subject to market risk, resulting in increased sensitivity of net asset value to changes in market prices. A seller’s failure to deliver securities to a Fund could prevent the Fund from realizing a price or yield considered to be advantageous.
When a Fund agrees to purchase securities on a when-issued or delayed delivery basis, the Fund will segregate cash or liquid securities in an amount sufficient to meet the Fund’s purchase commitments. It may be expected that a Fund’s net assets will fluctuate to a greater degree when it sets aside securities to cover such purchase commitments than when it sets aside cash. In addition, because a Fund will set aside cash or liquid securities to satisfy its purchase commitments, its liquidity and the ability of the Adviser to manage it might be affected in the event its commitments to purchase when-issued or delayed delivery securities ever became significant. Under normal market conditions, however, a Fund’s commitments to purchase when-issued or delayed delivery securities will not exceed 25% of the value of its total assets.
Zero Coupon and Step Coupon Securities
The Funds may invest in zero coupon and step coupon securities as a principal investment strategy. Zero coupon securities pay no cash income to their holders until they mature. When held to maturity, their entire return comes from the difference between their purchase price and their maturity value. Step coupon securities are debt securities that may not pay interest for a specified period of time and then, after the initial period, may pay interest at a series of different rates. Both zero coupon and step coupon securities are issued at substantial discounts from their value at maturity. Because interest on these securities is not paid on a current basis, the values of securities of this type are subject to greater fluctuations than are the value of securities that distribute income regularly and may be more speculative than such securities. Accordingly, the values of these securities may be highly volatile as interest rates rise or fall. In addition, while such securities generate income for purposes of generally accepted accounting standards, they do not generate cash flow and thus could cause a Fund to be forced to liquidate securities at an inopportune time in order to distribute cash, as required by the Code.
Special Considerations Relating to Municipal Obligations of Designated States
As described in their Prospectus, except during temporary defensive periods, each of the Funds will invest primarily in municipal obligations issued by the state indicated by the particular Fund’s name, and by the local and special-purpose political subdivisions of that state. Each such Fund, therefore, is more susceptible to political, economic or regulatory factors adversely affecting issuers of the applicable state’s municipal obligations. The following highlights only some of the more significant financial trends for each such state, and is based on information drawn from reports prepared by state budget officials, official statements and prospectuses relating to securities offerings of or on behalf of the respective state, its agencies, instrumentalities and political subdivisions, and other publicly available documents, as available on the date of this SAI. For each state, obligations of the local governments may be affected by budgetary pressures affecting the state and economic conditions in the state. The Funds have not independently verified any of the information contained in such statements and documents, but are not aware of any facts which would render such information inaccurate.
S-16
Factors Pertaining to Colorado. Colorado, like much of the nation, is struggling to find signs of a sustained economic recovery. Statewide employment levels have, thus far in 2011, fluctuated between 2.2 and 2.25 million people, though the unemployment rate has moderated since the beginning of the year falling from 9.15 in January to 8.5% as of July. While the northem portions of the state are seeing some investment and job growth in energy other sectors continue to show signs of stagnation or contraction.
The Taxpayer Bill of Rights (TABOR), passed in 1992, is a constitutional provision that limits increases in spending, as well as the amount of revenue that can be raised, in a given year. Any excess revenue must be refunded to taxpayers. In November 2005, the electorate approved Referendum C, which suspended the State Constitution’s spending limit through 2010. Otherwise, the State would have been forced to make deep expenditure cuts, as the spending limit would have been set using revenues collected at the recessionary low point of FY 2003.
The constitutional spending limit was reinstated for FY 2011-12 with the new limit set at the “Referendum C cap,” a less restrictive limit than under TABOR that will effectively eliminate the previous “ratchet down” effect. The Referendum C cap grows from the prior year’s cap instead of the prior year’s spending by a formula based on inflation plus population growth. In FY 11-12, the Referendum C cap will equal $10.9 billion and revenue subject to TABOR will be $1.2 billion below the cap.
Property taxes are a significant source of revenue for many local governments, and declines in property values caused by the housing slump may negatively impact these tax revenues. The State and its various subdivisions may also face increasing financial pressure from costs relating to pensions and other post-employment benefits.
Factors Pertaining to Minnesota. Minnesota’s economic recovery in 2011 has slowed and performed below initial expectations at the outset of the year. Diversity and a significant natural resource base are two important characteristics of the Minnesota economy. The state has many regional economic hubs, but is anchored by the Minneapolis-St. Paul Metro area. Historically, the structure of the State’s economy generally has paralleled the structure of the U.S. economy as a whole. The state has a comparative advantage in medical sciences, including very strong pharmaceutical and medical device manufacturing industries, favorably supported by large research institutions (University of Minnesota and Mayo Clinic). Manufacturing job growth has contributed significantly to economic growth this year, but the state is not expected to return to prerecession levels of employment until 2013. State unemployment levels are historically well below the national average. Minnesota’s Unemployment rate stood at 7.2% in August 2011, below the national average of 9.1%. The state’s unemployment rate peaked in mid-2009 at 8.5% and remained over 7% for most of 2010. Minnesota’s per capita income is consistently above the national average. The state’s per capita income was 107.3% of the U.S. in 2010 and has ranged between 105% and 109% over the last decade. The State relies heavily on a progressive individual income tax and a retail sales tax for revenue, which results in a fiscal system that is sensitive to economic conditions. Capital gains tax realizations have become an increasingly important, but volatile, share of Minnesota’s income tax base.
Revenue declines beginning in 2009 resulted in financial strain and depletion of the state’s budget reserve. General Fund revenues fell 8.7% from the prior year in FY 2009 and 2.2% in FY 2010. Consequently, the state has posted operating deficits the last three years, most recently ending fiscal 2010 with an operating deficit of $1.1 billion, pulling the General Fund balance into negative territory at a negative $886.1 million, or a negative 6% of revenues. The unreserved, undesignated General Fund balance was an even higher $1.5 billion, or -10.3% of revenues. Although the state anticipates fiscal 2011 to have ended with a positive cash balance, the state did have to undertake several short-term measures toward the end of the fiscal year. The state’s cash management strategy has been to delay payments (shifting partial payments to the following year) to school districts, local governments and the state’s university system, and to delay corporate and sales tax refunds up to 90 days.
For the 2012-2013 biennium the state faced a $5 billion budget gap, a relatively modest structural deficit in comparison to many other states. Unfortunately the governor and state legislature were unable to reach an agreement before the end of the fiscal year, resulting in a 20-day, partial
S-17
government shut-down. Governor Mark Dayton’s original budget recommendation, which included new taxes estimated to generate $3 billion in annual revenue, was met with strong opposition from the state legislature opposed to any tax increases. The compromise lawmakers eventually reached was based on nonrecurring measures and the resulting $35 billion, two-year budget is structurally imbalanced. Expenditure cuts, proceeds from a planned tobacco bond sale and further delay in school aid payments all helped to the close the budget shortfall.
Debt levels are low to moderate. Minnesota is ranked 22nd among states with tax supported debt per capita at $1,159, marginally above the national median of $1,066 in 2010. Debt as percentage of personal income is on parity with the national median at 2.8%. The state’s pension plans are relatively well funded, though the state has fallen somewhat behind in making their full annually required contribution. Cumulatively the state’s pensions were 80% as of 6/30/2010. The state’s OPEB liability is estimated to be $755 million and is funded on a pay-as-you-go basis. Limited benefits are offered to retirees.
Property taxes are a significant source of revenue for many local governments, and declines in property values caused by the housing slump may negatively impact these tax revenues. The State and its various subdivisions may also face increasing financial pressure from costs relating to pensions and other post employment benefits.
Factors Pertaining to Missouri. Missouri’s economic recovery is gaining momentum as job growth in manufacturing and services have seen a steady improvement. Missouri’s economy has fared slightly better than the nation as a whole recently. Unemployment in Missouri was 9.0% as of June 2011, as compared to the national average of 9.3% during the same period. The State enjoys a diversified economy in part because of its location as the geographic center of the United States. Missouri’s economy is largely centered on manufacturing and due to this industrial composition, new job prospects are limited and therefore control in-migration. Manufacturing has held up relatively well despite weakened consumer demand and supply chain disruptions from the Japanese earthquake. In order for Missouri’s economy to grow in the long term, a successful transition away from traditional manufacturing into biotechnology and alternative energy is imperative. Missouri’s economy in the long-term is expected to track closely to the national economy.
Missouri’s debt levels are considered below average. According to Moody’s 2011 State Debt Medians, Missouri’s debt burden ranked 35th in the nation on a debt per capita basis and 35th on a personal income basis. Demographic trends are below average with slow population growth, weak migration and below average wealth levels, which could negatively affect the State’s economy in the long run.
The Fiscal Year 2012 enacted budget totals $23.2 billion in overall spending, which is essentially the same size as the Fiscal Year 2011 budget. The General Fund Spending is essentially held flat at $7.9 billion. The budget was balanced in part through spending cuts for colleges and universities, the use of remaining unspent federal stimulus funds but spared K-12 education. The budget includes no tax increases and maintains the 3% appropriations in the Reserve. Additionally, the state kept intact its constitutionally mandated rainy day fund at 7.5% of the previous year’s net general revenue collections.
Property taxes are a significant source of revenue for many local governments, and declines in property values caused by the housing slump may negatively impact these tax revenues. The State and its various subdivisions may also face increasing financial pressure from costs relating to pensions and other post employment benefits.
Factors Pertaining to Nebraska. The economic downturn in Nebraska was much milder than the nation. As a result, Nebraska is expected to return to prerecession levels in 2011, almost a year ahead of the U.S. The state’s industry employment mix is fairly diverse with government, financial services, health and education sectors leading the way. Employment growth is pacing ahead of both the Midwest and U.S. with payrolls growing across multiple sectors led by professional services. Due to the third fastest job growth rate in the U.S., total state employment is projected to exceed prerecession levels by 2012. Residential construction still remains weak, but Nebraska has not been affected by the highs and lows of the housing market, experienced by the rest of the country.
S-18
Agriculture and food production remain important components of the state’s economy. As such, recently high corn and soybean prices and higher food prices should benefit the region. Farm incomes, which were at record levels in 2008, fell sharply during 2009. But, Nebraska farm income remained above its 10-year average in 2009, and is forecast to rise in both 2011, and 2012. The state’s unemployment rate is far below the national average at only 4.2% in July 2011, in comparison to the national average of 9.1% for the same time period.
The state’s policy is to maintain a minimum 3% budget reserve in its rainy day fund, the Cash Reserve Fund, a component of the state’s General Fund balance. The state’s formal policy is to divert any revenue that comes in above the prior consensus revenue forecast to the reserve fund. This institutionalized reserve creates a budgetary cushion for the state and is certainly a credit positive. Like many states, Nebraska operates on a biennium budget calendar. As General Fund revenues (personal income and sales taxes) came in below budget over the past few years, the state revised its forecasts downward and implemented expenditure cuts of 2.5% in fiscal 2010 and 5% in fiscal 2011, exempting funding for local school districts and Medicaid. In addition to these cuts, falling revenues also forced the state to rely on the Cash Reserve Fund to balance both the fiscal 2010 and fiscal 2011 budgets with withdrawals of $123 million and $133 million, respectively.
For the fiscal 2012-2013 biennium the state closed a $1 billion budget gap with spending cuts to state agency operations and no tax increases. Over half of the budget shortfall was attributed to the loss of federal fiscal stimulus funding, an issue faced by most states. The two-year budget, which totals approximately $7 billion, includes a modes increase in education spending and calls for only $22 million from the Cash Reserve Fund. At the close of the biennium, the state currently projects to end with a rainy day fund balance of approximately $215 million, which is approximately $3.2 million above the minimum 3% reserve requirement.
Nebraska’s constitution prohibits the issuance of general obligation debt and the state generally has very conservative financial policies. As a result, Nebraska has the lowest debt burden of any state as measured on a per-capita basis and as a percentage of per capita income. Though some larger local issuers face pension funding issues, the state’s retirement system is considered very well funded with a combined funded ratio of 84%.
Factors Pertaining to Ohio. Ohio’s recession was earlier and deeper than the nation’s in part due to weakness in its manufacturing base. Manufacturing accounts for 12.3% of employment in the State as compared to the national average of 8.9% as of 2010. State unemployment rates remain high, most recently at 9.2% in July 2011, just above the national mark of 9.1%. Demographic trends remain weak and socioeconomic indicators are below average.
The State’s 2012-2013 biennial General Fund budget totals $55.77 billion—$27.07 billion for fiscal year 2012, up 3.12 over FY2011, and $28.7 billion for fiscal year 2013, up 6.09% over 2012. The new budget included a rebalancing of spending priorities and reforms of programs, including Medicaid, in order to balance the budget. For example, approximately two thirds of state agencies saw reduced appropriations in the current biennium and aid to local governments and educational institutions was reduced. Also, as in prior years, non-recurring revenue sources such as debt restructuring were also part of the budget balancing effort.
While local governments will be impacted by state aid cuts, most local governments in Ohio are not predominately reliant upon state funding for their own budgets. The primary General Fund revenue sources for most Ohio cities, counties and schools are income taxes, sales taxes and property taxes, respectively. While state aid cuts will place further strain on local governments’ budgets over the biennium, it doesn’t impact their primary revenue sources.
Factors Pertaining to Oregon. Oregon’s economic recovery is slowing as state budget cuts have resulted in public sector layoffs which weigh heavily on job losses. Because government employees make up a larger share of total employment in Oregon than the national average, the economic impact from state and local government layoffs or furloughs weighs more heavily in Oregon than other states. The government sector accounts for 18.7% of employment in the State versus the US average of 17.2%. Second quarter job growth has slowed after a strong start to the year. However, private sector employment has improved with increases in manufacturing, retail trade, health services, and leisure and hospitality. The state’s high tech industry will see a boost with the $6 billion
S-19
investment by Intel to build a new R&D plant in Portland. Housing continues to be a drag on Oregon’s recovery but once excess inventory decreases, new construction and therefore economic growth is likely. The State’s June 2011 unemployment rate was 9.7%, down from prior year’s 10.7%. The Oregon Office of Economic Analysis forecasts mild increases in total employment in the first and second quarters of 2012 with job growth of approximately 2.5%. Oregon’s economy in the long-term is poised to outperform the nation because of its steady in-migration and population growth, energy resources and highly educated work force.
Oregon’s debt levels are high in relation to its economic base. According to Moody’s 2011 State Debt Medians, Oregon’s debt burden ranked 11th in the nation on both a debt per capita basis and on a personal income basis. The State has mixed demographic trends with above average population and in migration growth, but below average wealth levels.
Oregon’s Fiscal Year 2011-13 enacted biennium budget totals approximately $15 billion in General Fund and Lottery revenues, which is an increase of roughly 12.3% over the prior biennium. The budget was balanced in part by limiting growth to 5.5% in state personnel expenses and for K-12 education. Additionally, the state enacted a 3.5% “hold back” of general fund and lottery fund appropriations. If budget forecasts are not met, the state would be authorized to “hold back” funds beginning February 2012. If budget targets are met, those “hold back” funds would be deposited into the state’s reserves. The budget includes no tax increases or use of one time resources to balance the budget.
Property taxes are a significant source of revenue for many local governments, and declines in property values caused by the housing slump may negatively impact these tax revenues. The State and its various subdivisions may also face increasing financial pressure from costs relating to pensions and other post-employment benefits.
In addition to the investment objectives and policies set forth in the Prospectus and under the caption “Additional Information Concerning Fund Investments” above, each Fund is subject to the investment restrictions set forth below. The investment restrictions set forth in paragraphs 1 through 8 below are fundamental and cannot be changed with respect to a Fund without approval by the holders of a majority of the outstanding shares of that Fund as defined in the 1940 Act, i.e., by the lesser of the vote of (a) 67% of the shares of the Fund present at a meeting where more than 50% of the outstanding shares are present in person or by proxy, or (b) more than 50% of the outstanding shares of the Fund.
None of the Funds will:
| 1. | Concentrate its investments in a particular industry, except that any Fund with one or more industry concentrations implied by its name shall, in normal market conditions, concentrate in securities of issues within that industry or industries. For purposes of this limitation, the U.S. Government, and state or municipal governments and their political subdivisions are not considered members of any industry. Whether a Fund is concentrating in an industry shall be determined in accordance with the 1940 Act, as interpreted or modified from time to time by any regulatory authority having jurisdiction. |
| 2. | Borrow money or issue senior securities, except as permitted under the 1940 Act, as interpreted or modified from time to time by any regulatory authority having jurisdiction. |
| 3. | Invest in companies for the purpose of control or management. |
| 4. | Purchase physical commodities or contracts relating to physical commodities. |
| 5. | Purchase or sell real estate unless as a result of ownership of securities or other instruments, but this shall not prevent the Funds from investing in securities or other instruments backed by real estate or interests therein or in securities of companies that deal in real estate or mortgages. |
S-20
| 6. | Act as an underwriter of securities of other issuers, except to the extent that, in connection with the disposition of portfolio securities, it may be deemed an underwriter under applicable laws. |
| 7. | Make loans except as permitted under the 1940 Act, as interpreted or modified from time to time by any regulatory authority having jurisdiction. |
For purposes of applying the limitation set forth in number 1 above, according to the current interpretation by the SEC, a Fund would be concentrated in an industry if 25% or more of its total assets, based on current market value at the time of purchase, were invested in that industry. The Funds will use industry classifications provided by Bloomberg, Barclays, or other similar sources to determine its compliance with this limitation.
For purposes of applying the limitation set forth in number 2 above, under the 1940 Act as currently in effect, a Fund is not permitted to issue senior securities, except that the Fund may borrow from any bank if immediately after such borrowing the value of the Fund’s total assets is at least 300% of the principal amount of all of the Fund’s borrowings (i.e., the principal amount of the borrowings may not exceed 33 1/3% of the Fund’s total assets). In the event that such asset coverage shall at any time fall below 300% the Fund shall, within three days thereafter (not including Sundays and holidays), reduce the amount of its borrowings to an extent that the asset coverage of such borrowing shall be at least 300%.
For purposes of applying the limitation set forth in number 7 above, there are no limitations with respect to unsecured loans made by a Fund to an unaffiliated party.
Because each of the Funds refers to tax-free investments in its name, each has a fundamental investment policy that it will normally invest at least 80% of its assets in investments that pay interest exempt from federal and, for state-specific funds, applicable state income tax, including the federal alternative minimum tax and, for the state-specific Funds (except for Missouri Tax Free Fund, Ohio Tax Free Fund and Oregon Intermediate Municipal Bond Fund), the applicable state alternative minimum tax.
The following restrictions are non-fundamental and may be changed by NIF’s Board of Directors without a shareholder vote:
None of the Funds will:
| 1. | Invest more than 15% of its net assets in all forms of illiquid investments. |
| 2. | Borrow money in an amount exceeding 10% of the borrowing Fund’s total assets and pledge up to 15% of its total assets to secure such borrowings. None of the Funds will borrow money for leverage purposes. For the purpose of this investment restriction, the use of options and futures transactions and the purchase of securities on a when-issued or delayed delivery basis shall not be deemed the borrowing of money. No Fund will make additional investments while its borrowings exceed 5% of total assets. |
| 3. | Make short sales of securities. |
| 4. | Lend portfolio securities representing in excess of one-third of the value of its total assets. |
| 5. | Pledge any assets, except in connection with any permitted borrowing and then in amounts not in excess of one-third of the Fund’s total assets, provided that for the purposes of this restriction, margin deposits, security interests, liens and collateral arrangements with respect to options, futures contracts, options on futures contracts, and other permitted investments and techniques are not deemed to be a pledge of assets for purposes of this limitation. |
| 6. | Acquire any securities of registered open-end investment companies or registered unit investment trusts in reliance on subparagraph (F) or subparagraph (G) of Section 12(d)(1) of the 1940 Act. |
With respect to the non-fundamental restriction set forth in number 1 above, each Fund will monitor portfolio liquidity on an ongoing basis and, in the event more than 15% of a Fund’s net assets are invested in illiquid investments, the Fund will reduce its holdings of illiquid securities in an orderly fashion in order to maintain adequate liquidity.
S-21
The Board of Directors has adopted guidelines and procedures under which the Funds’ investment adviser is to determine whether the following types of securities which may be held by certain Funds are “liquid” and to report to the Board concerning its determinations: (i) securities eligible for resale pursuant to Rule 144A under the Securities Act of 1933; (ii) commercial paper issued in reliance on the “private placement” exemption from registration under Section 4(2) of the Securities Act of 1933, whether or not it is eligible for resale pursuant to Rule 144A; (iii) interest-only and principal-only, inverse floating and inverse interest-only securities issued or guaranteed by the U.S. Government or its agencies or instrumentalities; and (iv) municipal leases and securities that represent interests in municipal leases.
With respect to any Fund that has adopted an investment strategy pursuant to Rule 35d-1 of the 1940 Act, whereby at least 80% of the Fund’s net assets (plus the amount of any borrowings for investment purposes) must be invested in a strategy suggested by the Fund’s name, a policy has been adopted by the Funds to provide shareholders with at least 60 days’ notice in the event of a planned change to the investment strategy. Such notice to shareholders will meet the requirements of Rule 35d-1(c).
The Funds will make changes in their investment portfolios from time to time in order to take advantage of opportunities in the municipal market and to limit exposure to market risk. The Funds may also engage to a limited extent in short-term trading consistent with their investment objectives. Securities may be sold in anticipation of market decline or purchased in anticipation of market rise and later sold. In addition, a security may be sold and another of comparable quality purchased at approximately the same time to take advantage of what Nuveen Asset Management, LLC (the “Sub-Adviser” or “Nuveen Asset Management”) believes to be a temporary disparity in the normal yield relationship between the two securities. The Funds may make changes in their investment portfolios in order to limit their exposure to changing market conditions. Changes in the Funds’ investments are known as “portfolio turnover.”
DISCLOSURE OF PORTFOLIO HOLDINGS
The Nuveen Mutual Funds have adopted a portfolio holdings disclosure policy which governs the dissemination of the Funds’ portfolio holdings. In accordance with this policy, the Funds may provide portfolio holdings information to third parties no earlier than the time a report is filed with the SEC that is required to contain such information or one day after the information is posted on the Funds’ publicly accessible website, www.nuveen.com. Currently, the portfolio holdings information is posted monthly approximately five business days after the end of the month as of which the information is current. Additionally, the Funds publish on the website a list of its top ten holdings as of the end of each month, approximately two to five business days after the end of the month for which the information is current. This information will remain available on the website at least until the Funds file with the SEC their Forms N-CSR or Forms N-Q for the period that includes the date as of which the website information is current.
Additionally, the Funds may disclose portfolio holdings information that has not been included in a filing with the SEC or posted on the Funds’ website (i.e., non-public portfolio holdings information) only if there is a legitimate business purpose for doing so and if the recipient is required, either by explicit agreement or by virtue of the recipient’s duties to the Funds as an agent or service provider, to maintain the confidentiality of the information and to not use the information in an improper manner (e.g., personal trading). In this connection, the Funds may disclose on an ongoing basis non-public portfolio holdings information in the normal course of their investment and administrative operations to various service providers, including the Adviser and/or sub-adviser, independent registered public accounting firm, custodian, financial printer (R.R. Donnelley Financial and Financial Graphic Services), proxy voting service(s) (including RMG, ADP Investor Communication Services, and
S-22
Glass, Lewis & Co.), and to the legal counsel for the Funds’ independent directors (Chapman and Cutler LLP). Also, the Adviser may transmit to Vestek Systems, Inc. daily non-public portfolio holdings information on a next-day basis to enable the Adviser to perform portfolio attribution analysis using Vestek’s systems and software programs. Vestek is also provided with non-public portfolio holdings information on a monthly basis approximately 2-3 business days after the end of each month so that Vestek may calculate and provide certain statistical information (but not the non-public holdings information itself) to its clients (including retirement plan sponsors or their consultants). The Funds’ Adviser and/or sub-adviser may also provide certain portfolio holdings information to broker-dealers from time to time in connection with the purchase or sale of securities or requests for price quotations or bids on one or more securities. In providing this information, reasonable precautions are taken in an effort to avoid potential misuse of the disclosed information, including limitations on the scope of the portfolio holdings information disclosed, when appropriate.
Non-public portfolio holdings information may be provided to other persons if approved by the Funds’ Chief Administrative Officer or Secretary upon a determination that there is a legitimate business purpose for doing so, the disclosure is consistent with the interests of the Funds, and the recipient is obligated to maintain the confidentiality of the information and not misuse it.
Compliance officers of the Funds and the Adviser and sub-adviser periodically monitor overall compliance with the policy to ascertain whether portfolio holdings information is disclosed in a manner that is consistent with the Funds’ policy. Reports are made to the Funds’ Board of Directors on an annual basis.
There is no assurance that the Funds’ policies on portfolio holdings information will protect the Funds from the potential misuse of portfolio holdings information by individuals or firms in possession of such information.
The following parties currently receive non-public portfolio holdings information regarding one or more of the Nuveen Mutual Funds on an ongoing basis pursuant to the various arrangements described above:
ADP Investor Communications Services
Altrinsic Global Advisors, Inc.
Barclays Capital, Inc.
Barra
Bloomberg
BNP Paribas Prime Brokerage, Inc.
BNP Paribas Securities Corp.
Broadridge Systems
Cantor Fitzgerald & Co.
Chapman and Cutler LLP
Commerz Markets LLC
Credit Agricole Securities (USA) Inc.
Credit Suisse Securities (USA), LLC
Deutsche Bank Securities, Inc.
Ernst & Young LLP
FactSet Research Systems
Financial Graphic Services
First Clearing, LLC
Forbes
Glass, Lewis & Co.
Goldman Sachs & Co.
Hansberger Global Investors, LLC
HSBC Securities (USA), Inc.
ING Financial Markets, LLC
The Investment Company Institute
Jefferies & Company, Inc.
J.P. Morgan Clearing Corp.
J.P. Morgan Securities, Inc.
S-23
Lazard Asset Management, Inc.
Lipper Inc.
Merrill Lynch, Pierce, Fenner & Smith
Moody’s
Morgan Stanley & Co., Inc.
Morningstar, Inc.
MS Securities Services, Inc.
Newedge USA, LLC
Nuveen Asset Management, LLC
Nuveen Fund Advisors, Inc.
Pershing, LLC
PricewaterhouseCoopers
Raymond James & Associates, Inc.
RBC Capital Markets Corporation
RBS Securities, Inc.
RMG
R.R. Donnelley Financial
Scotia Capital (USA), Inc.
SG Ameritas Securities, LLC
Societe Generale, New York Branch
Standard & Poor’s
State Street Bank & Trust Co.
Strategic Insight
TD Ameritrade Clearing, Inc.
ThomsonReuters LLC
UBS Securities, LLC
U.S. Bancorp Fund Services, LLC
U.S. Bank, N.A.
Value Line
Vestek Systems, Inc.
Vickers
Wells Fargo Securities, LLC
S-24
The management of NIF, including general supervision of the duties performed for the Funds by the Adviser under the Management Agreement, is the responsibility of the Board of Directors. The number of directors of NIF is ten, one of whom is an “interested person” (as the term “interested person” is defined in the 1940 Act) and nine of whom are not interested persons (referred to herein as “independent directors”). None of the independent directors has ever been a trustee, director or employee of, or consultant to, the Adviser or its affiliates. The names, business addresses and birthdates of the directors and officers of the Funds, their principal occupations and other affiliations during the past five years, the number of portfolios each oversees and other directorships they hold are set forth below. The directors of NIF are directors or trustees, as the case may be, of 114 Nuveen-sponsored open-end funds (the “Nuveen Mutual Funds”) and 133 Nuveen-sponsored closed-end funds (collectively with the Nuveen Mutual Funds, the “Nuveen Funds”).
Name, Business | Position(s) | Term of Office | Principal Occupation(s) | Number of Director | Other | |||||
Independent Directors: | ||||||||||
Robert P. Bremner* 333 West Wacker Drive Chicago, IL 60606 (8/22/40) | Director | Term—Indefinite** Length of Service—Since 2011 | Private Investor and Management Consultant; Treasurer and Director, Humanities Council of Washington, D.C.; Board Member, Independent Directors Council affiliated with the Investment Company Institute. | 247 | N/A | |||||
Jack B. Evans 333 West Wacker Drive Chicago, IL 60606 (10/22/48) | Director | Term—Indefinite** Length of Service—Since 2011 | President, The Hall-Perrine Foundation, a private philanthropic corporation (since 1996); Member, Board of Regents for the State of Iowa University System; Director, Source Media Group; Life Trustee of Coe College and the Iowa College Foundation; formerly, Director, Federal Reserve Bank of Chicago; formerly, President and Chief Operating Officer, SCI Financial Group, Inc., a regional financial services firm. | 247 | Director and Chairman, United Fire Group, a publicly held company; formerly, Director, Alliant Energy. | |||||
S-25
Name, Business | Position(s) | Term of Office | Principal Occupation(s) | Number of Director | Other | |||||
William C. Hunter 333 West Wacker Drive Chicago, IL 60606 (3/6/48) | Director | Term—Indefinite** Length of Service—Since 2011 | Dean (since 2006), Tippie College of Business, University of Iowa; Director (since 2005), Beta Gamma Sigma International Honor Society; Director of Wellmark, Inc. (since 2009); formerly, Director (1997-2007), Credit Research Center at Georgetown University; formerly, Dean and Distinguished Professor of Finance, School of Business at the University of Connecticut (2003-2006); previously, Senior Vice President and Director of Research at the Federal Reserve Bank of Chicago (1995-2003). | 247 | Director (since 2004) of Xerox Corporation. | |||||
David J. Kundert* 333 West Wacker Drive Chicago, IL 60606 (10/28/42) | Director | Term—Indefinite** Length of Service—Since 2011 | Director, Northwestern Mutual Wealth Management Company; retired (since 2004) as Chairman, JPMorgan Fleming Asset Management, President and CEO, Banc One Investment Advisors Corporation, and President, One Group Mutual Funds; prior thereto, Executive Vice President, Bank One Corporation and Chairman and CEO, Banc One Investment Management Group; Member, Board of Regents, Luther College; Member of the Wisconsin Bar Association; Member of Board of Directors, Friends of Boerner Botanical Gardens; Member of Board of Directors and Chair of Investment Committee, Greater Milwaukee Foundation. | 247 | N/A | |||||
S-26
Name, Business | Position(s) | Term of Office | Principal Occupation(s) | Number of Director | Other | |||||
William J. Schneider* 333 West Wacker Drive Chicago, IL 60606 (9/24/44) | Director | Term—Indefinite** Length of Service—Since 2011 | Chairman of Miller-Valentine Partners Ltd., a real estate investment company; Member, Mid-America Health System Board; Member, University of Dayton Business School Advisory Council; formerly, Senior Partner and Chief Operating Officer (retired, 2004) of Miller-Valentine Group; formerly, Member, Dayton Philharmonic Orchestra Association; formerly, Director, Dayton Development Coalition; formerly, Member, Business Advisory Council, Cleveland Federal Reserve Bank. | 247 | N/A | |||||
Judith M. Stockdale 333 West Wacker Drive Chicago, IL 60606 (12/29/47) | Director | Term—Indefinite** Length of Service—Since 2011 | Executive Director, Gaylord and Dorothy Donnelley Foundation (since 1994); prior thereto, Executive Director, Great Lakes Protection Fund (1990-1994). | 247 | N/A | |||||
Carole E. Stone* 333 West Wacker Drive Chicago, IL 60606 (6/28/47) | Director | Term—Indefinite** Length of Service—Since 2011 | Director, C2 Options Exchange, Incorporated (since 2009); formerly, Commissioner, New York State Commission on Public Authority Reform (2005-2010); formerly, Chair, New York Racing Association Oversight Board (2005-2007). | 247 | Director, Chicago Board Options Exchange (since 2006). | |||||
Virginia L. Stringer 333 West Wacker Drive Chicago, IL 60606 (8/16/44) | Director | Term—Indefinite** Length of Service—Since 1987 | Board Member, Mutual Fund Directors Forum; Member, Governing Board, Investment Company Institute’s Independent Directors Council; Governance consultant and non-profit board member; former Owner and President, Strategic Management Resources, Inc., a management consulting firm; previously, held several executive positions in general management, marketing and human resources at IBM and The Pillsbury Company. | 247 | Previously, Independent Director (1987-2010) and Chair (1997-2010), First American Fund Complex. | |||||
S-27
Name, Business | Position(s) | Term of Office | Principal Occupation(s) | Number of Director | Other | |||||
Terence J. Toth* 333 West Wacker Drive Chicago, IL 60606 (9/29/59) | Director | Term—Indefinite** Length of Service—Since 2011 | Director, Legal & General Investment Management America, Inc. (since 2008); Managing Partner, Promus Capital (since 2008); formerly, CEO and President, Northern Trust Global Investments (2004-2007); Executive Vice President, Quantitative Management & Securities Lending (2000-2004); prior thereto, various positions with Northern Trust Company (since 1994); Member: Goodman Theatre Board (since 2004), Chicago Fellowship Board (since 2005) and Catalyst Schools of Chicago Board (since 2008); formerly, Member: Northern Trust Mutual Funds Board (2005-2007), Northern Trust Global Investments Board (2004-2007), Northern Trust Japan Board (2004-2007), Northern Trust Securities Inc. Board (2003-2007) and Northern Trust Hong Kong Board (1997-2004). | 247 | N/A | |||||
Interested Director: | ||||||||||
John P. Amboian*** 333 West Wacker Drive Chicago, IL 60606 (6/14/61) | Director | Term—Indefinite** Length of Service—Since 2011 | Chief Executive Officer and Chairman (since 2007) and Director (since 1999) of Nuveen Investments, Inc.; formerly, President (1999-2007); Chief Executive Officer (since 2007) of Nuveen Investments Advisers Inc.; Director (since 1998), formerly, Chief Executive Officer (2007-2010) of Nuveen Fund Advisors, Inc. | 247 | N/A | |||||
| * | Also serves as a trustee of Nuveen Diversified Commodity Fund, an exchange-traded commodity pool managed by Nuveen Commodities Asset Management, LLC, an affiliate of the Adviser. |
| ** | Each director serves an indefinite term until his or her successor is elected. |
| *** | Mr. Amboian is an “interested person” of NIF, as defined in the 1940 Act, by reason of his positions with Nuveen Investments, Inc. (“Nuveen Investments”) and certain of its subsidiaries. |
S-28
Name, Business Address and Birthdate | Position(s) Held | Term of | Principal Occupation(s) | Number of | ||||
Officers of NIF: | ||||||||
Gifford R. Zimmerman 333 West Wacker Drive Chicago, IL 60606 (9/9/56) | Chief Administrative Officer | Term—Until August 2012 Length of Service—Since 2011 | Managing Director (since 2002), Assistant Secretary and Associate General Counsel of Nuveen Securities, LLC; Managing Director (since 2002), Assistant Secretary (since 1997) and Co-General Counsel (since 2011) of Nuveen Fund Advisors, Inc.; Managing Director, Assistant Secretary and Associate General Counsel of Nuveen Asset Management, LLC (since 2011); Managing Director (since 2004) and Assistant Secretary (since 1994) of Nuveen Investments, Inc.; Vice President and Assistant Secretary of NWQ Investment Management Company, LLC (since 2002); Vice President and Assistant Secretary of Nuveen Investments Advisers Inc. (since 2002); Managing Director, Associate General Counsel and Assistant Secretary of Symphony Asset Management LLC (since 2003); Vice President and Assistant Secretary of Tradewinds Global Investors, LLC and Santa Barbara Asset Management, LLC (since 2006), Nuveen HydePark Group, LLC and Nuveen Investment Solutions, Inc. (since 2007), and of Winslow Capital Management, Inc. (since 2010); Chief Administrative Officer and Chief Compliance Officer (since 2010) of Nuveen Commodities Asset Management, LLC; Chartered Financial Analyst. | 247 | ||||
Margo L. Cook 333 West Wacker Drive Chicago, IL 60606 (4/11/64) | Vice President | Term—Until August 2012 Length of Service—Since 2011 | Executive Vice President (since 2008) of Nuveen Investments, Inc. and Nuveen Fund Advisors, Inc. (since 2011); Managing Director—Investment Services of Nuveen Commodities Asset Management, LLC (since August 2011); previously, Head of Institutional Asset Management (2007-2008) of Bear Stearns Asset Management; Head of Institutional Asset Management (1986-2007) of Bank of NY Mellon; Chartered Financial Analyst. | 247 | ||||
Lorna C. Ferguson 333 West Wacker Drive Chicago, IL 60606 (10/24/45) | Vice President | Term—Until August 2012 Length of Service—Since 2011 | Managing Director (since 2004) of Nuveen Securities, LLC; Managing Director (since 2005) of Nuveen Fund Advisors. | 247 | ||||
Stephen D. Foy 333 West Wacker Drive Chicago, IL 60606 (5/31/54) | Vice President and Controller | Term—Until August 2012 Length of Service—Since 2011 | Senior Vice President (since 2010), formerly, Vice President (2004-2010) and Funds Controller of Nuveen Securities, LLC; Vice President of Nuveen Fund Advisors, Inc. (since 2005); Chief Financial Officer (since 2010) of Nuveen Commodities Asset Management, LLC; Certified Public Accountant. | 247 | ||||
S-29
Name, Business Address and Birthdate | Position(s) Held | Term of | Principal Occupation(s) | Number of | ||||
Scott S. Grace 333 West Wacker Drive Chicago, IL 60606 (8/20/70) | Vice President and Treasurer | Term—Until August 2012 Length of Service—Since 2011 | Managing Director, Corporate Finance & Development, Treasurer (since 2009) of Nuveen Securities, LLC; Managing Director and Treasurer (since 2009) of Nuveen Fund Advisors, Nuveen Investment Solutions, Inc., Nuveen Investments Advisers, Inc., Nuveen Investments Holdings, Inc., Nuveen Fund Advisors, Inc., and (since 2011) Nuveen Asset Management, LLC; Vice President and Treasurer of NWQ Investment Management Company, LLC, Tradewinds Global Investors, LLC, Symphony Asset Management LLC and Winslow Capital Management, Inc.; Vice President of Santa Barbara Asset Management, LLC; formerly, Treasurer (2006-2009), Senior Vice President (2008-2009), previously, Vice President (2006-2008) of Janus Capital Group, Inc.; formerly, Senior Associate in Morgan Stanley’s Global Financial Services Group (2000-2003); Chartered Accountant. | 247 | ||||
Walter M. Kelly 333 West Wacker Drive Chicago, IL 60606 (2/24/70) | Vice President and Chief Compliance Officer | Term—Until August 2012 Length of Service—Since 2011 | Senior Vice President (since 2008) and Assistant Secretary (since 2003) of Nuveen Fund Advisors, Inc. | 247 | ||||
Tina M. Lazar 333 West Wacker Drive Chicago, IL 60606 (8/27/61) | Vice President | Term—Until August 2012 Length of Service—Since 2011 | Senior Vice President (since 2010), formerly, Vice President (2005-2010) of Nuveen Fund Advisors, Inc. | 247 | ||||
Larry W. Martin 333 West Wacker Drive Chicago, IL 60606 (7/27/51) | Vice President and Assistant Secretary | Term—Until August 2012 Length of Service—Since 2011 | Senior Vice President (since 2010), formerly, Vice President (1993-2010), Assistant Secretary and Assistant General Counsel of Nuveen Securities, LLC; Senior Vice President (since 2011) of Nuveen Asset Management, LLC; Senior Vice President (since 2010), formerly, Vice President (2005-2010) and Assistant Secretary of Nuveen Investments, Inc.; Senior Vice President (since 2010), formerly, Vice President (2005-2010) and Assistant Secretary (since 1997) of Nuveen Fund Advisors, Inc., Vice President and Assistant Secretary of Nuveen Investments Advisers Inc. (since 2002), NWQ Investment Management Company, LLC, Symphony Asset Management LLC (since 2003), Tradewinds Global Investors, LLC, Santa Barbara Asset Management, LLC (since 2006), Nuveen HydePark Group, LLC, Nuveen Investment Solutions, Inc. (since 2007) and Winslow Capital Management, Inc. (since 2010); Vice President and Assistant Secretary of Nuveen Commodities Asset Management, LLC (since 2010). | 247 | ||||
S-30
Name, Business Address and Birthdate | Position(s) Held | Term of | Principal Occupation(s) | Number of | ||||
Kevin J. McCarthy 333 West Wacker Drive Chicago, IL 60606 (3/26/66) | Vice President and Secretary | Term—Until August 2012 Length of Service—Since 2011 | Managing Director (since 2008), formerly, Vice President (2007-2008) of Nuveen Securities, LLC; Managing Director (since 2008), Vice President and Assistant Secretary (since 2007) and Co-General Counsel (since 2011) of Nuveen Fund Advisors, Inc.; Managing Director, Assistant Secretary and Associate General Counsel (since 2011) of Nuveen Asset Management, LLC; Vice President and Assistant Secretary of Nuveen Investments Advisers Inc., NWQ Investment Management Company, LLC, Tradewinds Global Investors, LLC, NWQ Holdings, LLC, Symphony Asset Management LLC, Santa Barbara Asset Management, LLC, Nuveen HydePark Group, LLC, Nuveen Investment Solutions, Inc. and Winslow Capital Management, Inc. (since 2010); Vice President and Secretary (since 2010) of Nuveen Commodities Asset Management, LLC; prior thereto, Partner, Bell, Boyd & Lloyd LLP (1997-2007). | 247 | ||||
Kathleen L. Prudhomme 901 Marquette Avenue Minneapolis, MN 55402 (3/30/53) | Vice President and Assistant Secretary | Term—Until August 2012 Length of Service—Since 2011 | Managing Director and Assistant Secretary of Nuveen Securities, LLC (since 2011); Managing Director, Assistant Secretary and Co-General Counsel (since 2011) of Nuveen Fund Advisors, Inc.; Managing Director, Assistant Secretary and Associate General Counsel (since 2011) of Nuveen Asset Management, LLC; formerly, Deputy General Counsel, FAF Advisors, Inc. (2004-2010). | 247 | ||||
Jeffrey M. Wilson 333 West Wacker Drive Chicago, IL 60606 (3/13/56) | Vice President | Term—Until August 2012 Length of Service—Since 2011 | Senior Vice President of Nuveen Securities, LLC (since 2011); formerly, Senior Vice President of FAF Advisors, Inc. (2000-2010). | 114 | ||||
S-31
Board Leadership Structure and Risk Oversight
In connection with the Transaction, the committees of the Funds and the members of the Board of Directors, referred to hereafter as the “Board” or “Board of Directors,” were changed. Each of the Committees were newly formed and constituted in connection with the Transaction. The Board of Directors oversees the operations and management of the Funds, including the duties performed for the Funds by the Adviser. The Board has adopted a unitary board structure. A unitary board consists of one group of directors who serve on the board of every fund in the Nuveen Fund complex. In adopting a unitary board structure, the directors seek to provide effective governance through establishing a board, the overall composition of which will, as a body, possess the appropriate skills, independence and experience to oversee the Nuveen Funds’ business. With this overall framework in mind, when the Board, through its Nominating and Governance Committee discussed below, seeks nominees for the Board, the directors consider, not only the candidate’s particular background, skills and experience, among other things, but also whether such background, skills and experience enhance the Board’s diversity and at the same time complement the Board given its current composition and the mix of skills and experiences of the incumbent directors. The Nominating and Governance Committee believes that the Board generally benefits from diversity of background, experience and views among its members, and considers this a factor in evaluating the composition of the Board, but has not adopted any specific policy on diversity or any particular definition of diversity.
The Board believes the unitary board structure enhances good and effective governance, particularly given the nature of the structure of the investment company complex. Funds in the same complex generally are served by the same service providers and personnel and are governed by the same regulatory scheme which raises common issues that must be addressed by the directors across the fund complex (such as compliance, valuation, liquidity, brokerage, trade allocation or risk management). The Board believes it is more efficient to have a single board review and oversee common policies and procedures which increases the Board’s knowledge and expertise with respect to the many aspects of fund operations that are complex-wide in nature. The unitary structure also enhances the Board’s influence and oversight over the investment adviser and other service providers.
In an effort to enhance the independence of the Board, the Board also has a Chairman that is an independent director. The Board recognizes that a chairman can perform an important role in setting the agenda for the Board, establishing the boardroom culture, establishing a point person on behalf of the Board for fund management, and reinforcing the Board’s focus on the long-term interests of shareholders. The Board recognizes that a chairman may be able to better perform these functions without any conflicts of interests arising from a position with fund management. Accordingly, the directors have elected Robert P. Bremner as the independent Chairman of the Board. Specific responsibilities of the Chairman include: (i) presiding at all meetings of the Board and of the shareholders; (ii) seeing that all orders and resolutions of the directors are carried into effect; and (iii) maintaining records of and, whenever necessary, certifying all proceedings of the directors and the shareholders.
Although the Board has direct responsibility over various matters (such as advisory contracts, underwriting contracts and fund performance), the Board also exercises certain of its oversight responsibilities through several committees that it has established and which report back to the full Board. The Board believes that a committee structure is an effective means to permit directors to focus on particular operations or issues affecting the Nuveen Funds, including risk oversight. More specifically, with respect to risk oversight, the Board has delegated matters relating to valuation and compliance to certain committees (as summarized below) as well as certain aspects of investment risk. In addition, the Board believes that the periodic rotation of directors among the different committees allows the directors to gain additional and different perspectives of a Nuveen Fund’s operations. The Board has established five standing committees: the Executive Committee, the Dividend Committee, the Audit Committee, the Compliance, Risk Management and Regulatory Oversight Committee and the Nominating and Governance Committee. The Board may also from time to time create ad hoc committees to focus on particular issues as the need arises. The membership and functions of the standing committees are summarized below.
The Executive Committee, which meets between regular meetings of the Board, is authorized to exercise all of the powers of the Board. The members of the Executive Committee are Robert P. Bremner, Chair, Judith M. Stockdale and John P. Amboian. During the fiscal period ended May 31, 2011, the Executive Committee did not meet.
S-32
The Audit Committee assists the Board in the oversight and monitoring of the accounting and reporting policies, processes and practices of the Nuveen Funds, and the audits of the financial statements of the Nuveen Funds; the quality and integrity of the financial statements of the Nuveen Funds; the Nuveen Funds’ compliance with legal and regulatory requirements relating to the Nuveen Funds’ financial statements; the independent auditors’ qualifications, performance and independence; and the pricing procedures of the Nuveen Funds and the Adviser’s internal valuation group. It is the responsibility of the Audit Committee to select, evaluate and replace any independent auditors (subject only to Board and, if applicable, shareholder ratification) and to determine their compensation. The Audit Committee is also responsible for, among other things, overseeing the valuation of securities comprising the Nuveen Funds’ portfolios. Subject to the Board’s general supervision of such actions, the Audit Committee addresses any valuation issues, oversees the Nuveen Funds’ pricing procedures and actions taken by the Adviser’s internal valuation group which provides regular reports to the committee, reviews any issues relating to the valuation of the Nuveen Funds’ securities brought to its attention and considers the risks to the Nuveen Funds in assessing the possible resolutions to these matters. The Audit Committee may also consider any financial risk exposures for the Nuveen Funds in conjunction with performing its functions.
To fulfill its oversight duties, the Audit Committee receives annual and semi-annual reports and has regular meetings with the external auditors for the Nuveen Funds and the Adviser’s internal audit group. The Audit Committee also may review in a general manner the processes the Board or other Board committees have in place with respect to risk assessment and risk management as well as compliance with legal and regulatory matters relating to the Nuveen Funds’ financial statements. The committee operates under a written charter adopted and approved by the Board. Members of the Audit Committee shall be independent (as set forth in the charter) and free of any relationship that, in the opinion of the directors, would interfere with their exercise of independent judgment as an Audit Committee member. The members of the Audit Committee are Robert P. Bremner, David J. Kundert, Chair, William J. Schneider, Carole E. Stone and Terence J. Toth, each of whom is an independent director of the Nuveen Funds. During the fiscal period ended May 31, 2011, the Audit Committee met one time.
The Nominating and Governance Committee is responsible for seeking, identifying and recommending to the Board qualified candidates for election or appointment to the Board. In addition, the Nominating and Governance Committee oversees matters of corporate governance, including the evaluation of Board performance and processes, the assignment and rotation of committee members, and the establishment of corporate governance guidelines and procedures, to the extent necessary or desirable, and matters related thereto. Although the unitary and committee structure has been developed over the years and the Nominating and Governance Committee believes the structure has provided efficient and effective governance, the committee recognizes that as demands on the Board evolve over time (such as through an increase in the number of funds overseen or an increase in the complexity of the issues raised), the committee must continue to evaluate the Board and committee structures and their processes and modify the foregoing as may be necessary or appropriate to continue to provide effective governance. Accordingly, the Nominating and Governance Committee has a separate meeting each year to, among other things, review the Board and committee structures, their performance and functions, and recommend any modifications thereto or alternative structures or processes that would enhance the Board’s governance of the Nuveen Funds.
In addition, the Nominating and Governance Committee, among other things, makes recommendations concerning the continuing education of directors; monitors performance of legal counsel and other service providers; establishes and monitors a process by which security holders are able to communicate in writing with members of the Board; and periodically reviews and makes recommendations about any appropriate changes to director compensation. In the event of a vacancy on the Board, the Nominating and Governance Committee receives suggestions from various sources, including shareholders, as to suitable candidates. Suggestions should be sent in writing to Lorna Ferguson, Manager of Fund Board Relations, Nuveen Investments, 333 West Wacker Drive, Chicago, IL 60606. The Nominating and Governance Committee sets appropriate standards and requirements for nominations for new directors and reserves the right to interview any and all candidates and to make the final selection of any new directors. In considering a candidate’s qualifications, each candidate must meet certain basic requirements, including relevant skills and experience, time
S-33
availability (including the time requirements for due diligence site visits to sub-advisers and service providers) and, if qualifying as an independent director candidate, independence from the Adviser, sub-advisers, the Distributor and other service providers, including any affiliates of these entities. These skill and experience requirements may vary depending on the current composition of the Board, since the goal is to ensure an appropriate range of skills, diversity and experience, in the aggregate. Accordingly, the particular factors considered and weight given to these factors will depend on the composition of the Board and the skills and backgrounds of the incumbent directors at the time of consideration of the nominees. All candidates, however, must meet high expectations of personal integrity, independence, governance experience and professional competence. All candidates must be willing to be critical within the Board and with management and yet maintain a collegial and collaborative manner toward other Board members. The committee operates under a written charter adopted and approved by the Board. This committee is composed of the independent directors of the Nuveen Funds. Accordingly, the members of the Nominating and Governance Committee are Robert P. Bremner, Chair, Jack B. Evans, William C. Hunter, David J. Kundert, William J. Schneider, Judith M. Stockdale, Carole E. Stone, Virginia L. Stringer and Terence J. Toth. During the fiscal period ended May 31, 2011, the Nominating and Governance Committee met two times.
The Dividend Committee is authorized to declare distributions on the Nuveen Funds’ shares, including, but not limited to, regular and special dividends, capital gains and ordinary income distributions. The members of the Dividend Committee are Jack B. Evans, Chair, Judith M. Stockdale and Terence J. Toth. During the fiscal period ended May 31, 2011, the Dividend Committee met two times.
The Compliance, Risk Management and Regulatory Oversight Committee (the “Compliance Committee”) is responsible for the oversight of compliance issues, risk management and other regulatory matters affecting the Nuveen Funds that are not otherwise the jurisdiction of the other committees. The Board has adopted and periodically reviews policies and procedures designed to address the Nuveen Funds’ compliance and risk matters. As part of its duties, the Compliance Committee reviews the policies and procedures relating to compliance matters and recommends modifications thereto as necessary or appropriate to the full Board; develops new policies and procedures as new regulatory matters affecting the Nuveen Funds arise from time to time; evaluates or considers any comments or reports from examinations from regulatory authorities and responses thereto; and performs any special reviews, investigations or other oversight responsibilities relating to risk management, compliance and/or regulatory matters as requested by the Board.
In addition, the Compliance Committee is responsible for risk oversight, including, but not limited to, the oversight of risks related to investments and operations. Such risks include, among other things, exposures to particular issuers, market sectors, or types of securities; risks related to product structure elements, such as leverage; and techniques that may be used to address those risks, such as hedging and swaps. In assessing issues brought to the committee’s attention or in reviewing a particular policy, procedure, investment technique or strategy, the Compliance Committee evaluates the risks to the Nuveen Funds in adopting a particular approach compared to the anticipated benefits to the Nuveen Funds and their shareholders. In fulfilling its obligations, the Compliance Committee meets on a quarterly basis, and at least once a year in person. The Compliance Committee receives written and oral reports from the Nuveen Funds’ Chief Compliance Officer (“CCO”) and meets privately with the CCO at each of its quarterly meetings. The CCO also provides an annual report to the full Board regarding the operations of the Nuveen Funds’ and other service providers’ compliance programs as well as any recommendations for modifications thereto. The Compliance Committee also receives reports from the Adviser’s investment services group regarding various investment risks. Notwithstanding the foregoing, the full Board also participates in discussions with management regarding certain matters relating to investment risk, such as the use of leverage and hedging. The investment services group therefore also reports to the full Board at its quarterly meetings regarding, among other things, fund performance and the various drivers of such performance. Accordingly, the Board directly and/or in conjunction with the Compliance Committee oversees matters relating to investment risks. Matters not addressed at the committee level are addressed directly by the full Board. The committee operates under a written charter adopted and approved by the Board. The members of the Compliance Committee are Jack B. Evans, William C. Hunter, William J. Schneider, Judith M. Stockdale, Chair, and Virginia L. Stringer. During the fiscal period ended May 31, 2011, the Compliance Committee met two times.
S-34
Prior to the Transaction, the Funds had an Audit Committee, a Pricing Committee and a Governance Committee. The following table presents the number of times each Committee met during the period from July 1, 2010 through December 31, 2010.
Committee | Number of Committee Meetings Held During NIF’s Period from July 1, 2010 through December 31, 2010 | |||
Audit Committee | 3 | |||
Pricing Committee | 2 | |||
Governance Committee | 1 | |||
Board Diversification and Director Qualifications
In determining that a particular director was qualified to serve on the Board, the Board has considered each director’s background, skills, experience and other attributes in light of the composition of the Board with no particular factor controlling. The Board believes that directors need to have the ability to critically review, evaluate, question and discuss information provided to them, and to interact effectively with Fund management, service providers and counsel, in order to exercise effective business judgment in the performance of their duties, and the Board believes each director satisfies this standard. An effective director may achieve this ability through his or her educational background; business, professional training or practice; public service or academic positions; experience from service as a board member or executive of investment funds, public companies or significant private or not-for-profit entities or other organizations; and or/other life experiences. Accordingly, set forth below is a summary of the experiences, qualifications, attributes, and skills that led to the conclusion, as of the date of this document, that each director should continue to serve in that capacity. References to the experiences, qualifications, attributes and skills of directors are pursuant to requirements of the Securities and Exchange Commission, do not constitute holding out the Board or any director as having any special expertise or experience and shall not impose any greater responsibility or liability on any such person or on the Board by reason thereof.
John P. Amboian
Mr. Amboian, an interested director of the Nuveen Funds, joined Nuveen Investments in June 1995 and became Chief Executive Officer in July 2007 and Chairman in November 2007. Prior to this, since 1999, he served as President with responsibility for the firm’s product, marketing, sales, operations and administrative activities. Mr. Amboian initially served Nuveen Investments as Executive Vice President and Chief Financial Officer. Prior to joining Nuveen Investments, Mr. Amboian held key management positions with two consumer product firms affiliated with the Phillip Morris Companies. He served as Senior Vice President of Finance, Strategy and Systems at Miller Brewing Company. Mr. Amboian began his career in corporate and international finance at Kraft Foods, Inc., where he eventually served as Treasurer. He received a Bachelor’s degree in economics and a Masters of Business Administration (“MBA”) from the University of Chicago. Mr. Amboian serves on the Board of Directors of Nuveen Investments and is a Board Member or Trustee of the Investment Company Institute Board of Governors, Boys and Girls Clubs of Chicago, Children’s Memorial Hospital and Foundation, the Council on the Graduate School of Business (University of Chicago), and the North Shore Country Day School Foundation. He is also a member of the Civic Committee of the Commercial Club of Chicago and the Economic Club of Chicago.
Robert P. Bremner
Mr. Bremner, the Nuveen Funds’ Independent Chairman, is a private investor and management consultant in Washington, D.C. His biography of William McChesney Martin, Jr., a former chairman of the Federal Reserve Board, was published by Yale University Press in November 2004. From 1994 to 1997, he was a Senior Vice President at Samuels International Associates, an international consulting firm specializing in governmental policies, where he served in a part-time capacity. Previously, Mr. Bremner was a partner in the LBK Investors Partnership and was chairman and majority stockholder with ITC Investors Inc., both private investment firms. He currently serves on the Board and as Treasurer of the Humanities Council of Washington D.C. and is a Board Member of the Independent Directors Council affiliated with the Investment Company Institute. From 1984 to 1996, Mr. Bremner was an independent Trustee of the Flagship Funds, a group of municipal open-end funds. He began his career at the World Bank in Washington D.C. He graduated with a Bachelor of Science degree from Yale University and received his MBA from Harvard University.
S-35
Jack B. Evans
President of the Hall-Perrine Foundation, a private philanthropic corporation, since 1996, Mr. Evans was formerly President and Chief Operating Officer of the SCI Financial Group, Inc., a regional financial services firm headquartered in Cedar Rapids, Iowa. Formerly, he was a member of the Board of the Federal Reserve Bank of Chicago as well as a Director of Alliant Energy. Mr. Evans is Chairman of the Board of United Fire Group, sits on the Board of Source Media Group, is a member of the Board of Regents for the State of Iowa University System, is a Life Trustee of Coe College and is a member of the Advisory Council of the Department of Finance in the Tippie College of Business, University of Iowa. He has a Bachelor of Arts degree from Coe College and an MBA from the University of Iowa.
William C. Hunter
Mr. Hunter was appointed Dean of the Henry B. Tippie College of Business at the University of Iowa effective July 1, 2006. He had been Dean and Distinguished Professor of Finance at the University of Connecticut School of Business since June 2003. From 1995 to 2003, he was the Senior Vice President and Director of Research at the Federal Reserve Bank of Chicago. While there he served as the Bank’s Chief Economist and was an Associate Economist on the Federal Reserve System’s Federal Open Market Committee (FOMC). In addition to serving as a Vice President in charge of financial markets and basic research at the Federal Reserve Bank in Atlanta, he held faculty positions at Emory University, Atlanta University, the University of Georgia and Northwestern University. A past Director of the Credit Research Center at Georgetown University, SS&C Technologies, Inc. (2005) and past President of the Financial Management Association International, he has consulted with numerous foreign central banks and official agencies in Western Europe, Central and Eastern Europe, Asia, Central America and South America. From 1990 to 1995, he was a U.S. Treasury Advisor to Central and Eastern Europe. He has been a Director of the Xerox Corporation since 2004 and Wellmark, Inc. since 2009. He is President-Elect of Beta Gamma Sigma, Inc., the International Business Honor Society.
David J. Kundert
Mr. Kundert retired in 2004 as Chairman of JPMorgan Fleming Asset Management, and as President and CEO of Banc One Investment Advisors Corporation, and as President of One Group Mutual Funds. Prior to the merger between Bank One Corporation and JPMorgan Chase and Co., he was Executive Vice President, Bank One Corporation and, since 1995, the Chairman and CEO, Banc One Investment Management Group. From 1988 to 1992, he was President and CEO of Bank One Wisconsin Trust Company. Currently, Mr. Kundert is a Director of the Northwestern Mutual Wealth Management Company. He started his career as an attorney for Northwestern Mutual Life Insurance Company. Mr. Kundert has served on the Board of Governors of the Investment Company Institute and he is currently a member of the Wisconsin Bar Association. He is on the Board of the Greater Milwaukee Foundation and chairs its Investment Committee. He received his Bachelor of Arts degree from Luther College, and his Juris Doctor from Valparaiso University.
William J. Schneider
Mr. Schneider is currently Chairman, formerly Senior Partner and Chief Operating Officer (retired, December 2004) of Miller-Valentine Partners Ltd., a real estate investment company. He was formerly a Director and Past Chair of the Dayton Development Coalition. He was formerly a member of the Community Advisory Board of the National City Bank in Dayton as well as a former member of the Business Advisory Council of the Cleveland Federal Reserve Bank. Mr. Schneider is a member of the Business Advisory Council for the University of Dayton College of Business. Mr. Schneider was an independent Trustee of the Flagship Funds, a group of municipal open-end funds. He also served as Chair of the Miami Valley Hospital and as Chair of the Finance Committee of its parent holding company. Mr. Schneider has a Bachelor of Science in Community Planning from the University of Cincinnati and a Masters of Public Administration from the University of Dayton.
Judith M. Stockdale
Ms. Stockdale is currently Executive Director of the Gaylord and Dorothy Donnelley Foundation, a private foundation working in land conservation and artistic vitality in the Chicago region and the
S-36
Low country of South Carolina. Her previous positions include Executive Director of the Great Lakes Protection Fund, Executive Director of Openlands, and Senior Staff Associate at the Chicago Community Trust. She has served on the Boards of the Land Trust Alliance, the National Zoological Park, the Governor’s Science Advisory Council (Illinois), the Nancy Ryerson Ranney Leadership Grants Program, Friends of Ryerson Woods and the Donors Forum. Ms. Stockdale, a native of the United Kingdom, has a Bachelor of Science degree in geography from the University of Durham (UK) and a Master of Forest Science degree from Yale University.
Carole E. Stone
Ms. Stone retired from the New York State Division of the Budget in 2004, having served as its Director for nearly five years and as Deputy Director from 1995 through 1999. Ms. Stone is currently on the Board of Directors of the Chicago Board Options Exchange, CBOE Holdings, Inc. and C2 Options Exchange, Incorporated. She has also served as the Chair of the New York Racing Association Oversight Board, as Chair of the Public Authorities Control Board, as a Commissioner on the New York State Commission on Public Authority Reform and as a member of the Boards of Directors of several New York State public authorities. Ms. Stone has a Bachelor of Arts from Skidmore College in Business Administration.
Virginia L. Stringer
Ms. Stringer served as the independent chair of the Board of the First American Fund Complex from 1997 to 2010, having joined such Board in 1987. Ms. Stringer serves on the Governing Board of the Investment Company Institute’s Independent Directors Council and on the board of the Mutual Fund Directors Forum. She is a recipient of the Outstanding Corporate Director award from Twin Cities Business Monthly and the Minnesota Chapter of the National Association of Corporate Directors. Ms. Stringer is the immediate past board chair of the Oak Leaf Trust, director and immediate past board chair of the Saint Paul Riverfront Corporation and is immediate past President of the Minneapolis Club’s Governing Board. She is a director and former board chair of the Minnesota Opera and a Life Trustee and former board of the Voyageur Outward Bound School. She also served as a trustee of Outward Bound USA. She was appointed by the Governor of Minnesota Board on Judicial Standards and recently served on a Minnesota Supreme Court Judicial Advisory Committee to reform the state’s judicial disciplinary process. She is a member of the International Women’s Forum and attended the London Business School as an International Business Fellow. Ms. Stringer also served as board chair of the Human Resource Planning Society, the Minnesota Women’s Campaign Fund and the Minnesota Women’s Economic Roundtable. Ms. Stringer is the retired founder of Strategic Management Resources, a consulting practice focused on corporate governance, strategy and leadership. She has twenty five years of corporate experience having held executive positions in general management, marketing and human resources with IBM and the Pillsbury Company.
Terence J. Toth
Mr. Toth is a Director, Legal & General Investment Management America, Inc. (since 2008) and a Managing Partner, Promus Capital (since 2008). From 2004 to 2007, he was Chief Executive Officer and President of Northern Trust Global Investments, and Executive Vice President of Quantitative Management & Securities Lending from 2000 to 2004. He also formerly served on the Board of the Northern Trust Mutual Funds. He joined Northern Trust in 1994 after serving as Managing Director and Head of Global Securities Lending at Bankers Trust (1986 to 1994) and Head of Government Trading and Cash Collateral Investment at Northern Trust from 1982 to 1986. He currently serves on the Boards of the Goodman Theatre and Chicago Fellowship, and is Chairman of the Board of Catalyst Schools of Chicago. Mr. Toth graduated with a Bachelor of Science degree from the University of Illinois, and received his MBA from New York University. In 2005, he graduated from the CEO Perspectives Program at Northwestern University.
S-37
Fund Shares Owned by the Directors
The information in the table below discloses the dollar ranges of (i) each Director’s beneficial ownership in each Fund, and (ii) each Director’s aggregate beneficial ownership in all funds within the Nuveen Funds complex, including in each case the value of fund shares elected by Directors in the directors’ deferred compensation plan, based on the value of fund shares as of May 31, 2011.
| Directors | ||||||||||||||||||||||||||||||||||||||||
| Bremner1 | Evans1 | Hunter1 | Kundert1 | Schneider1 | Stockdale1 | Stone1 | Stringer | Toth1 | Amboian1 | |||||||||||||||||||||||||||||||
Aggregate Holdings—Fund Complex | $ | Over 100,000 |
| $ | Over 100,000 |
| $ | Over 100,000 |
| $ | Over 100,000 |
| $ | Over 100,000 |
| $ | Over 100,000 |
| $ | Over 100,000 |
| $ | Over 100,000 |
| $ | Over 100,000 |
| $ | Over 100,000 |
| ||||||||||
Colorado Tax Free Fund | — | — | — | — | — | — | — | — | — | — | ||||||||||||||||||||||||||||||
Minnesota Municipal Bond Fund | — | — | — | — | — | — | — | — | — | — | ||||||||||||||||||||||||||||||
Minnesota Municipal Bond Fund | — | — | — | — | — | — | — | — | — | — | ||||||||||||||||||||||||||||||
Missouri Tax Free Fund | — | — | — | — | — | — | — | — | — | — | ||||||||||||||||||||||||||||||
Nebraska Municipal Bond Fund | — | — | — | — | — | — | — | — | — | — | ||||||||||||||||||||||||||||||
Ohio Tax Free Fund | — | — | — | — | — | — | — | — | — | — | ||||||||||||||||||||||||||||||
Oregon Municipal Bond Fund | — | — | — | — | — | — | — | — | — | — | ||||||||||||||||||||||||||||||
| 1 | All directors, except for Ms. Stringer, were appointed to the Board of Directors effective January 1, 2011. |
As of September 6, 2011, none of the Independent Directors or their immediate family members owned, beneficially, or of record, any securities in (i) an investment adviser or principal underwriter of the Funds or (ii) a person (other than a registered investment company) directly or indirectly controlling, controlled by, or under common control with an investment adviser or principal underwriter of the Funds.
The following table shows, for each independent director, (1) the aggregate compensation paid by the Funds for the fiscal period ended May 31, 2011, (2) the amount of total compensation paid by the Funds that has been deferred, and (3) the total compensation paid to each director by the Nuveen Funds during the fiscal period ended May 31, 2011.
Name of Director | Aggregate Compensation From Funds | Amount of Total Compensation that Has Been Deferred | Total Compensation From Nuveen Funds Paid to Director3 | |||||||||
Robert P. Bremner1 | $ | 768 | $ | — | $ | 296,672 | ||||||
Jack B. Evans1 | 562 | — | 246,194 | |||||||||
William C. Hunter1 | 518 | — | 218,232 | |||||||||
David J. Kundert1 | 604 | — | 261,192 | |||||||||
William J. Schneider1 | 599 | — | 264,031 | |||||||||
Judith M. Stockdale1 | 562 | — | 227,717 | |||||||||
Carole E. Stone1 | 580 | — | 211,400 | |||||||||
Virginia L. Stringer2 | 19,165 | — | 57,000 | |||||||||
Terence J. Toth1 | 600 | — | 245,882 | |||||||||
| 1 | All directors, except for Ms. Stringer, were appointed to the Board of Directors effective January 1, 2011. |
S-38
| 2 | Ms. Stringer was a member of the Board of Directors prior to the closing of the Transaction. |
| 3 | Does not include compensation paid for the period of July 1, 2010 to December 31, 2010 from funds that are now Nuveen Funds, but were advised by FAF prior to the closing of the Transaction. |
Independent directors receive a $120,000 annual retainer plus (a) a fee of $4,500 per day for attendance in person or by telephone at regularly scheduled meetings of the Board; (b) a fee of $3,000 per meeting for attendance in person or by telephone at special, non-regularly scheduled Board meetings where in-person attendance is required and $2,000 per meeting for attendance by telephone or in person at such meetings where in-person attendance is not required; (c) a fee of $2,500 per meeting for attendance in person or by telephone at Audit Committee meetings where in-person attendance is required and $2,000 per meeting for attendance by telephone or in person at such meetings where in-person attendance is not required; (d) a fee of $2,500 per meeting for attendance in person or by telephone at Compliance, Risk Management and Regulatory Oversight Committee meetings where in-person attendance is required and $2,000 per meeting for attendance by telephone or in person at such meetings where in-person attendance is not required; (e) a fee of $1,000 per meeting for attendance in person or by telephone at Dividend Committee meetings; and (f) a fee of $500 per meeting for attendance in person or by telephone at all other committee meetings ($1,000 for shareholder meetings) where in-person attendance is required and $250 per meeting for attendance by telephone or in person at such committee meetings (excluding shareholder meetings) where in-person attendance is not required, and $100 per meeting when the Executive Committee acts as pricing committee for IPOs, plus, in each case, expenses incurred in attending such meetings, provided that no fees are received for meetings held on days on which regularly scheduled Board meetings are held. In addition to the payments described above, the Chairman of the Board receives $75,000, the chairpersons of the Audit Committee, the Dividend Committee and the Compliance, Risk Management and Regulatory Oversight Committee receive $10,000 each and the chairperson of the Nominating and Governance Committee receives $5,000 as additional retainers. Independent directors also receive a fee of $3,000 per day for site visits to entities that provide services to the Nuveen Funds on days on which no Board meeting is held. When ad hoc committees are organized, the Nominating and Governance Committee will at the time of formation determine compensation to be paid to the members of such committee; however, in general, such fees will be $1,000 per meeting for attendance in person or by telephone at ad hoc committee meetings where in-person attendance is required and $500 per meeting for attendance by telephone or in person at such meetings where in-person attendance is not required. The annual retainer, fees and expenses are allocated among the Nuveen Funds on the basis of relative net assets, although management may, in its discretion, establish a minimum amount to be allocated to each fund.
NIF does not have a retirement or pension plan. NIF has a deferred compensation plan (the “Deferred Compensation Plan”) that permits any independent director to elect to defer receipt of all or a portion of his or her compensation as an independent director. The deferred compensation of a participating director is credited to a book reserve account of NIF when the compensation would otherwise have been paid to the director. The value of the director’s deferral account at any time is equal to the value that the account would have had if contributions to the account had been invested and reinvested in shares of one or more of the eligible Nuveen Funds. At the time for commencing distributions from a director’s deferral account, the independent director may elect to receive distributions in a lump sum or over a period of five years. NIF will not be liable for any other fund’s obligations to make distributions under the Deferred Compensation Plan.
The Funds have no employees. The officers of NIF and the director of NIF who is not an independent director serve without any compensation from the Funds.
Directors of the Funds and certain other Fund affiliates may purchase the Funds’ Class I shares. See the Funds’ Prospectus for details.
S-39
The Funds, the other Nuveen Funds, the Adviser, Nuveen Asset Management, and other related entities have adopted codes of ethics which essentially prohibit all Nuveen Funds management personnel, including the Funds’ portfolio managers, from engaging in personal investments which compete or interfere with, or attempt to take advantage of, a Fund’s anticipated or actual portfolio transactions, and are designed to assure that the interests of the shareholders are placed before the interests of Nuveen personnel in connection with personal investment transactions. Each of these codes of ethics permits personnel to invest in securities for their own accounts, including securities that may be purchased or held by the Funds. These codes of ethics are on public file with, and are available from, the SEC.
The Funds invest their assets primarily in municipal bonds and cash management securities. On rare occasions the Funds may acquire, directly or through a special purpose vehicle, equity securities of a municipal bond issuer whose bonds the Funds already own when such bonds have deteriorated or are expected shortly to deteriorate significantly in credit quality. The purpose of acquiring equity securities generally will be to acquire control of the municipal bond issuer and to seek to prevent the credit deterioration or facilitate the liquidation or other workout of the distressed issuer’s credit problem. In the course of exercising control of a distressed municipal issuer, Nuveen Asset Management may pursue the Funds’ interests in a variety of ways, which may entail negotiating and executing consents, agreements and other arrangements, and otherwise influencing the management of the issuer. Nuveen Asset Management does not consider such activities proxy voting for purposes of Rule 206(4)-6 under the 1940 Act, but nevertheless provides reports to the Funds’ Board of Directors on its control activities on a quarterly basis.
In the rare event that a municipal issuer were to issue a proxy or that the Funds were to receive a proxy issued by a cash management security, Nuveen Asset Management would either engage an independent third party to determine how the proxy should be voted or vote the proxy with the consent, or based on the instructions, of the Funds’ Board of Directors or its representative. A member of Nuveen Asset Management’s legal department would oversee the administration of the voting, and ensure that records were maintained in accordance with Rule 206(4)-6, reports were filed with the SEC on Form N-PX, and the results provided to the Funds’ Board of Directors and made available to shareholders as required by applicable rules.
The investment adviser of the Funds is Nuveen Fund Advisors, Inc. The Adviser, located at 333 West Wacker Drive, Chicago, Illinois 60606, serves as the manager of each Fund, with responsibility for the overall management of each Fund. The Adviser is also responsible for managing each Fund’s business affairs and providing day-to-day administrative services to each Fund.
The Adviser is an affiliate of the Distributor, which is also located at 333 West Wacker Drive, Chicago, Illinois 60606. The Distributor is the principal underwriter for the Nuveen Mutual Funds, and has served as co-managing underwriter for the shares of the Nuveen Closed-End Funds. The Adviser and the Distributor are subsidiaries of Nuveen Investments.
On November 13, 2007, Nuveen Investments was acquired by investors led by Madison Dearborn Partners, LLC, which is a private equity investment firm based in Chicago, Illinois (the “MDP Acquisition”).
Each Fund is dependent upon services and resources provided by the Adviser and therefore the Adviser‘s parent, Nuveen Investments. Nuveen Investments increased its level of debt in connection with the MDP Acquisition. Nuveen Investments believes that monies generated from operations and cash on hand will be adequate to fund debt service requirements, capital expenditures and working capital requirements for the foreseeable future; however, Nuveen Investments’ ability to continue to fund these items, to service its debt and to maintain compliance with covenants in its debt
S-40
agreements may be affected by general economic, financial, competitive, legislative, legal and regulatory factors and by its ability to refinance or repay outstanding indebtedness with scheduled maturities beginning in 2014. In the event that Nuveen Investments breaches certain of the covenants included in its debt agreements, the breach of such covenants may result in the accelerated payment of its outstanding debt, increase the cost of such debt or generally have an adverse effect on the financial condition of Nuveen Investments.
For the management services and facilities furnished by the Adviser, each of the Funds has agreed to pay an annual management fee at a rate set forth in the Prospectus under “Who Manages the Funds.” In addition, the Adviser has agreed to waive all or a portion of its management fee or reimburse certain expenses of the Funds. The Prospectus includes current fee waivers and expense reimbursements for the Funds.
Each Fund’s management fee is divided into two components—a complex-level fee based on the aggregate amount of all eligible Fund assets managed by the Adviser and its affiliates, and a specific fund-level fee based only on the amount of assets within each individual Fund. This pricing structure enables Fund shareholders to benefit from growth in the assets within each individual Fund as well as from growth in the amount of complex-wide assets managed by the Adviser. Under no circumstances will this pricing structure result in a Fund paying management fees at a rate higher than would otherwise have been applicable had the complex-wide management fee structure not been implemented.
Each Fund has agreed to pay an annual fund-level management fee, payable monthly, based upon the average daily net assets of each Fund as set forth in the Prospectus.
Each Fund’s complex-level fee is payable monthly and is additive to the fund-level fee. It is determined by taking the current overall complex-level fee rate, which is based on the aggregate amount of the “eligible assets” of all Nuveen Funds, and making, as appropriate, an upward adjustment to that rate based upon the percentage of the particular Fund’s assets that are not “eligible assets.” The current overall complex-level fee schedule is as follows:
Complex-Level Asset Breakpoint Level* | Effective Rate at Breakpoint Level | |||
$55 billion | 0.2000 | % | ||
$56 billion | 0.1996 | % | ||
$57 billion | 0.1989 | % | ||
$60 billion | 0.1961 | % | ||
$63 billion | 0.1931 | % | ||
$66 billion | 0.1900 | % | ||
$71 billion | 0.1851 | % | ||
$76 billion | 0.1806 | % | ||
$80 billion | 0.1773 | % | ||
$91 billion | 0.1691 | % | ||
$125 billion | 0.1599 | % | ||
$200 billion | 0.1505 | % | ||
$250 billion | 0.1469 | % | ||
$300 billion | 0.1445 | % | ||
| * | The complex-level fee is calculated based upon the aggregate daily “eligible assets” of all Nuveen Funds. Eligible assets do not include assets attributable to investments in other Nuveen Funds or assets in excess of $2 billion added to the Nuveen fund complex in connection with Nuveen Fund Advisors’ assumption of the management of the former First American Funds effective January 1, 2011. Eligible assets include closed-end fund assets managed by the Adviser that are attributable to financial leverage. For these purposes, financial leverage includes the closed-end funds’ use of preferred stock and borrowings and investments in the residual interest certificates (also called inverse floating rate securities) in tender option bond (TOB) trusts, including the portion of assets held by the TOB trust that has been effectively financed by the trust’s issuance of floating rate securities, subject to an agreement by the Adviser as to certain funds to limit the amount of such assets for determining eligible assets in certain circumstances. |
S-41
A Fund’s complex-level fee rate will not exceed the maximum overall complex-level fee rate of 0.2000%. As of June 30, 2011, the Funds’ complex-level fees were:
Fund | Complex-Level Fee Rate | |||
Nuveen Colorado Tax Free Fund | 0.1989 | % | ||
Nuveen Minnesota Intermediate Municipal Bond Fund | 0.1971 | % | ||
Nuveen Minnesota Municipal Bond Fund | 0.1975 | % | ||
Nuveen Missouri Tax Free Fund | 0.1971 | % | ||
Nuveen Nebraska Municipal Bond Fund | 0.1964 | % | ||
Nuveen Ohio Tax Free Fund | 0.2000 | % | ||
Nuveen Oregon Intermediate Municipal Bond Fund | 0.1986 | % | ||
The following table sets forth total advisory fees paid to the Adviser (for the period of January 1, 2011 through May 31, 2011) before waivers and after waivers for each Fund:
| January 1, 2011 through May 31, 2011 | ||||||||
Fund | Advisory Fee Before Waivers | Advisory Fee After Waivers1 | ||||||
| Nuveen Colorado Tax Free Fund | $ | 157,165 | $ | 83,092 | ||||
| Nuveen Minnesota Intermediate Municipal Bond Fund | 521,484 | 514,446 | ||||||
| Nuveen Minnesota Municipal Bond Fund | 352,688 | 330,852 | ||||||
| Nuveen Missouri Tax Free Fund | 419,392 | 386,352 | ||||||
| Nuveen Nebraska Municipal Bond Fund | 94,366 | 49,203 | ||||||
| Nuveen Ohio Tax Free Fund | 138,940 | 67,795 | ||||||
| Nuveen Oregon Intermediate Municipal Bond Fund | 336,475 | 328,943 | ||||||
| 1 | Advisory and certain other fees for the period were waived by the Adviser to comply with total operating expense limitations that were agreed upon by the Fund and the Adviser. |
As noted, FAF served as the Fund’s investment adviser prior to the consummation of the Transaction. The following table sets forth total advisory fees paid to FAF before waivers and after waivers for each Fund for the fiscal years ended June 30, 2009 and June 30, 2010 and the period from July 1, 2010 through December 31, 2010:
| Fiscal Year Ended June 30, 2009 | Fiscal Year Ended June 30, 2010 | July 1, 2010 through December 31, 2010 | ||||||||||||||||||||||
Fund | Advisory Fee Before Waivers | Advisory Fee After Waivers | Advisory Fee Before Waivers | Advisory Fee After Waivers | Advisory Fee Before Waivers | Advisory Fee After Waivers | ||||||||||||||||||
Nuveen Colorado Tax Free Fund | 216,673 | —1 | 323,427 | —1 | 164,198 | —1 | ||||||||||||||||||
Nuveen Minnesota Intermediate Municipal Bond Fund | 958,119 | 674,755 | 1,079,506 | 809,181 | 607,748 | 442,188 | ||||||||||||||||||
Nuveen Minnesota Municipal Bond Fund | 751,891 | 414,527 | 822,049 | 558,533 | 436,368 | 254,330 | ||||||||||||||||||
Nuveen Missouri Tax Free Fund | 738,462 | 488,324 | 753,346 | 495,429 | 418,546 | 272,466 | ||||||||||||||||||
Nuveen Nebraska Municipal Bond Fund | 187,138 | —1 | 208,457 | —1 | 108,962 | —1 | ||||||||||||||||||
Nuveen Ohio Tax Free Fund | 232,937 | —1 | 277,163 | —1 | 165,381 | —1 | ||||||||||||||||||
Nuveen Oregon Intermediate Municipal Bond Fund | 632,057 | 412,836 | 754,899 | 524,224 | 419,228 | 298,015 | ||||||||||||||||||
| 1 | Advisory and certain other fees for the period were waived by FAF to comply with total operating expense limitations that were agreed upon by the Fund and FAF. |
S-42
In addition to the Adviser‘s management fee, each Fund also pays a portion of NIF’s general expenses allocated in proportion to the net assets of the Fund. All fees and expenses are accrued daily and deducted before payment of dividends to investors.
The Adviser has selected its affiliate, Nuveen Asset Management, LLC, located at 333 West Wacker Drive, Chicago, Illinois 60606, to serve as sub-adviser to manage the investment portfolio of each of the Funds. The Adviser pays Nuveen Asset Management a portfolio management fee for each Fund equal to the percentage shown below of the advisory fee paid to the Adviser for its services to the Fund (net of any waivers, reimbursement payments, supermarket fees and alliance fees waived, reimbursed or paid by the Adviser in respect of each Fund).
Fund | Percentage of Fee to be paid by the Adviser to Nuveen Asset Management | |||
Nuveen Colorado Tax Free Fund | 38.4615 | % | ||
Nuveen Minnesota Intermediate Municipal Bond Fund | 45.4545 | % | ||
Nuveen Minnesota Municipal Bond Fund | 45.4545 | % | ||
Nuveen Missouri Tax Free Fund | 38.4615 | % | ||
Nuveen Nebraska Municipal Bond Fund | 45.4545 | % | ||
Nuveen Ohio Tax Free Fund | 38.4615 | % | ||
Nuveen Oregon Intermediate Municipal Bond Fund | 45.4545 | % | ||
Additional Payments to Financial Intermediaries
In addition to the sales charge payments and the distribution, service and transfer agency fees described in the Prospectus and elsewhere in this SAI, the Adviser and/or the Distributor may make additional payments out of its own assets to selected intermediaries that sell shares of the Nuveen Mutual Funds (such as brokers, dealers, banks, registered investment advisers, retirement plan administrators and other intermediaries; hereinafter, individually, “Intermediary,” and collectively, “Intermediaries”) under the categories described below for the purposes of promoting the sale of Fund shares, maintaining share balances and/or for sub-accounting, administrative or shareholder processing services.
The amounts of these payments could be significant and may create an incentive for an Intermediary or its representatives to recommend or offer shares of the Nuveen Mutual Funds to its customers. The Intermediary may elevate the prominence or profile of the Funds within the Intermediary’s organization by, for example, placing the Funds on a list of preferred or recommended funds and/or granting the Adviser and/or the Distributor preferential or enhanced opportunities to promote the Funds in various ways within the Intermediary’s organization.
These payments are made pursuant to negotiated agreements with Intermediaries. The payments do not change the price paid by investors for the purchase of a share or the amount a Fund will receive as proceeds from such sales. Furthermore, these payments are not reflected in the fees and expenses listed in the fee table section of the Funds’ Prospectus and described above because they are not paid by the Funds.
The categories of payments described below are not mutually exclusive, and a single Intermediary may receive payments under all categories.
Marketing Support Payments and Program Servicing Payments
The Adviser and/or the Distributor may make payments for marketing support and/or program servicing to selected Intermediaries that are registered as holders or dealers of record for accounts invested in one or more of the Nuveen Mutual Funds or that make Nuveen Mutual Fund shares available through employee benefit plans or fee-based advisory programs to compensate them for the variety of services they provide.
S-43
Marketing Support Payments. Services for which an Intermediary receives marketing support payments may include business planning assistance, advertising, educating the Intermediary’s personnel about the Nuveen Mutual Funds in connection with shareholder financial planning needs, placement on the Intermediary’s preferred or recommended fund company list, and access to sales meetings, sales representatives and management representatives of the Intermediary. In addition, Intermediaries may be compensated for enabling Nuveen representatives to participate in and/or present at conferences or seminars, sales or training programs for invited registered representatives and other employees, client and investor events and other events sponsored by the Intermediary.
The Adviser and/or the Distributor compensate Intermediaries differently depending upon, among other factors, the number or value of Nuveen Mutual Funds shares that the Intermediary sells or may sell, the value of the assets invested in the Nuveen Mutual Funds by the Intermediary’s customers, redemption rates, ability to attract and retain assets, reputation in the industry and the level and/or type of marketing assistance and educational activities provided by the Intermediary. Such payments are generally asset-based but also may include the payment of a lump sum.
Program Servicing Payments. Services for which an Intermediary receives program servicing payments typically include recordkeeping, reporting, or transaction processing, but may also include services rendered in connection with fund/investment selection and monitoring, employee enrollment and education, plan balance rollover or separation, or other similar services. An Intermediary may perform program services itself or may arrange with a third party to perform program services.
Program servicing payments typically apply to employee benefit plans, such as retirement plans, or fee-based advisory programs but may apply to retail sales and assets in certain situations. The payments are based on such factors as the type and nature of services or support furnished by the Intermediary and are generally asset-based.
Marketing Support and Program Servicing Payment Guidelines. In the case of any one Intermediary, marketing support and program servicing payments are not expected, with certain limited exceptions, to exceed, in the aggregate, 0.35% of the average net assets of Fund shares attributable to that Intermediary on an annual basis. In connection with the sale of a business by U.S. Bank N.A. (which was the parent company of a firm a portion of whose business has since been acquired by the Adviser) to Great-West Life & Annuity Insurance Company (“Great-West”), the Adviser has a services agreement with GWFS Equities, Inc., an affiliate of Great-West, which provides for payments of up to 0.60% of the average net assets of Fund shares attributable to GWFS Equities, Inc. on an annual basis.
Other Payments
From time to time, the Adviser and/or the Distributor, at their expense, may provide other compensation to Intermediaries that sell or arrange for the sale of shares of the Funds, which may be in addition to marketing support and program servicing payments described above. For example, the Adviser and/or the Distributor may: (i) compensate Intermediaries for National Securities Clearing Corporation networking system services (e.g., shareholder communication, account statements, trade confirmations, and tax reporting) on an asset-based or per account basis; (ii) compensate Intermediaries for providing Fund shareholder trading information; (iii) make one-time or periodic payments to reimburse selected Intermediaries for items such as ticket charges (i.e., fees that an Intermediary charges its representatives for effecting transactions in Fund shares) of up to $25 per purchase or exchange order, operational charges (e.g., fees that an Intermediary charges for establishing a Fund on its trading system), and literature printing and/or distribution costs; and (iv) at the direction of a retirement plan’s sponsor, reimburse or pay direct expenses of an employee benefit plan that would otherwise be payable by the plan.
When not provided for in a marketing support or program servicing agreement, the Adviser and/or the Distributor may pay Intermediaries for enabling the Adviser and/or the Distributor to participate in and/or present at conferences or seminars, sales or training programs for invited registered representatives and other Intermediary employees, client and investor events and other Intermediary-sponsored events, and for travel expenses, including lodging incurred by registered representatives and other employees in connection with prospecting, asset retention and due
S-44
diligence trips. These payments may vary depending upon the nature of the event. The Adviser and/or the Distributor make payments for such events as they deem appropriate, subject to their internal guidelines and applicable law. Wholesale representatives of the Distributor may receive additional compensation if they meet certain targets for sales of one or more Nuveen Mutual Funds.
The Adviser and/or the Distributor occasionally sponsors due diligence meetings for registered representatives during which they receive updates on various Nuveen Mutual Funds and are afforded the opportunity to speak with portfolio managers. Although invitations to these meetings are not conditioned on selling a specific number of shares, those who have shown an interest in Nuveen Mutual Funds are more likely to be considered. To the extent permitted by their firm’s policies and procedures, all or a portion of registered representatives’ expenses in attending these meetings may be covered by the Adviser and/or the Distributor.
Certain third parties, affiliates of the Adviser and employees of the Adviser or its affiliates may receive cash compensation from the Adviser and/or the Distributor in connection with establishing new client relationships with the Nuveen Mutual Funds. Such compensation may vary by product and by Intermediary. Total compensation of employees of the Adviser and its affiliates with marketing and/or sales responsibilities is based in part on their generation of new client relationships, including new client relationships with the Nuveen Mutual Funds, and such employees may receive additional compensation if they meet certain targets for sales of one or more Nuveen Mutual Funds.
Other compensation may be offered to the extent not prohibited by state laws or any self-regulatory agency, such as FINRA. Investors can ask their Intermediary for information about any payments it receives from the Adviser and/or the Distributor and the services it provides for those payments.
Investors may wish to take Intermediary payment arrangements into account when considering and evaluating any recommendations relating to Fund shares.
Intermediaries Receiving Additional Payments
The following is a list of Intermediaries receiving one or more of the types of payments discussed above as of September 9, 2011:
ADP Broker-Dealer, Inc.
American Enterprise Investment Services, Inc.
American United Life Insurance Company
Ameriprise Financial Services, Inc.
Ascensus (formerly BISYS Retirement Services, Inc.)
Banc of America Investment Services, Inc.
Benefit Plans Administrative Services, Inc.
Benefit Trust Company
Charles Schwab & Co., Inc.
Citigroup Global Markets Inc./Morgan Stanley Smith Barney LLC
Commonwealth Equity Services, LLP, DBA Commonwealth Financial Network
Country Trust Bank
CPI Qualified Plan Consultants, Inc.
Digital Retirement Solutions, Inc.
Dyatech, LLC
ExpertPlan, Inc.
Fidelity Brokerage Services LLC/National Financial Services LLC
Fidelity Investments Institutional Operations Company, Inc.
Genesis Employee Benefits, Inc. DBA America’s VEBA Solution
GWFS Equities, Inc.
Hartford Life Insurance Company
Hartford Securities Distribution Company, Inc.
Hewitt Associates LLC
ICMA Retirement Corporation
ING Institutional Plan Services, LLC/ING Investment Advisors, LLC (formerly CitiStreet LLC/ CitiStreet Advisors LLC)
S-45
ING Life Insurance and Annuity Company/ING Institutional Plan Services LLC
J.P. Morgan Retirement Plan Services, LLC
Janney Montgomery Scott LLC
Leggette Actuaries, Inc.
Lincoln Retirement Services Company LLC/AMG Service Corp.
Linsco/Private Ledger Corp.
Marshall & Ilsley Trust Company, N.A.
Massachusetts Mutual Life Insurance Company
Mercer HR Outsourcing LLC
Merrill Lynch, Pierce, Fenner & Smith Inc.
MetLife Securities, Inc.
Mid Atlantic Capital Corporation
Morgan Stanley & Co., Incorporated/Morgan Stanley Smith Barney LLC
MSCS Financial Services, LLC
Nationwide Financial Services, Inc.
Newport Retirement Services, Inc.
NYLife Distributors LLC
Pershing LLC
Princeton Retirement Group/GPC Securities, Inc.
Principal Life Insurance Company
Prudential Insurance Company of America (The)
Prudential Investment Management Services, LLC/Prudential Investments LLC
Raymond James & Associates/Raymond James Financial Services, Inc.
RBC Dain Rauscher, Inc.
Reliance Trust Company
Retirement Plan Company, LLC (The)
Robert W. Baird & Co., Inc.
Stifel, Nicolaus & Co., Inc.
T. Rowe Price Investment Services, Inc./T. Rowe Price Retirement Plan Services, Inc.
TD Ameritrade, Inc.
TD Ameritrade Trust Company (formerly Fiserv Trust Company/International Clearing Trust Company)
TIAA-CREF Individual & Institutional Services, LLC
U.S. Bancorp Investments, Inc.
U.S. Bank, N.A.
UBS Financial Services, Inc.
Unified Trust Company, N.A.
VALIC Retirement Services Company (formerly AIG Retirement Services Company)
Vanguard Group, Inc.
Wachovia Bank, N.A.
Wachovia Securities, LLC
Wells Fargo Advisors, LLC
Wells Fargo Bank, N.A.
Wilmington Trust Company
Wilmington Trust Retirement and Institutional Services Company (formerly AST Capital Trust Company)
Any additions, modifications or deletions to the list of Intermediaries identified above that have occurred since September 9, 2011 are not reflected in the list.
Prior to the Transaction, FAF served as Administrator pursuant to an Administration Agreement between FAF and NIF, dated July 1, 2006 and U.S. Bancorp Fund Services, LLC (“USBFS”), 615 East Michigan Street, Milwaukee, WI 53202, served as sub-administrator pursuant to a Sub-Administration Agreement between the FAF and USBFS dated July 1, 2005. USBFS is a subsidiary of U.S. Bancorp. As of December 31, 2010, the Funds no longer have an administrator or sub-administrator. The
S-46
following table sets forth total administrative fees, after waivers, paid by each of the Funds listed below to FAF and USBFS for the fiscal years ended June 30, 2009 and June 30, 2010 and the period from July 1, 2010 through December 31, 2010:
Fund | Fiscal Year Ended June 30, 2009 | Fiscal Year Ended June 30, 2010 | July 1, 2010 through December 31, 2010 | |||||||||
Nuveen Colorado Tax Free Fund | $ | 95,299 | $ | 142,669 | $ | 73,879 | ||||||
Nuveen Minnesota Intermediate Municipal | 416,950 | 476,475 | 273,452 | |||||||||
Nuveen Minnesota Municipal Bond Fund | 327,147 | 362,783 | 196,340 | |||||||||
Nuveen Missouri Tax Free Fund | 321,346 | 332,435 | 188,321 | |||||||||
Nuveen Nebraska Municipal Bond Fund | 81,464 | 91,975 | 49,027 | |||||||||
Nuveen Ohio Tax Free Fund | 101,395 | 122,354 | 74,412 | |||||||||
Nuveen Oregon Intermediate Municipal Bond Fund | 275,166 | 333,216 | 188,627 | |||||||||
USBFS (the “Transfer Agent”) serves as the Funds’ transfer agent pursuant to a Transfer Agent and Shareholder Servicing Agreement (the “Transfer Agent Agreement”) between the Transfer Agent and NIF dated September 19, 2006. As transfer agent, the Transfer Agent maintains records of shareholder accounts, processes purchases and redemptions of the Funds’ shares, acts as dividend and capital gain distribution disbursing agent, and performs other related transfer agent functions. The Funds pay transfer agent fees on a per shareholder account basis, at annual rates paid monthly, subject to a minimum annual fee per share class. These fees will be charged to each Fund based on the number of accounts within that Fund. The Funds will continue to reimburse the Transfer Agent for out-of-pocket expenses incurred in providing transfer agent services.
The following table sets forth transfer agent fees, excluding out-of-pocket expenses, paid by the Funds to the Transfer Agent for the fiscal years ended June 30, 2009 and June 30, 2010 and the period July 1, 2010 through May 31, 2011:
Fund | Fiscal Year Ended June 30, 2009 | Fiscal Year Ended June 30, 2010 | July 1, 2010 May 31, 2011 | |||||||||
Nuveen Colorado Tax Free Fund | $ | 72,000 | $ | 72,000 | $ | 37,934 | ||||||
Nuveen Minnesota Intermediate Municipal Bond Fund | 54,000 | 66,000 | 40,777 | |||||||||
Nuveen Minnesota Municipal Bond Fund | 72,000 | 72,000 | 47,136 | |||||||||
Nuveen Missouri Tax Free Fund | 72,000 | 72,000 | 38,882 | |||||||||
Nuveen Nebraska Municipal Bond Fund | 72,000 | 72,000 | 37,847 | |||||||||
Nuveen Ohio Tax Free Fund | 72,000 | 72,000 | 36,718 | |||||||||
Nuveen Oregon Intermediate Municipal Bond Fund | 54,000 | 54,000 | 28,959 | |||||||||
Nuveen Securities, LLC, 333 West Wacker Drive, Chicago, Illinois 60606, serves as the distributor for the Funds’ shares pursuant to a “best efforts” arrangement as provided by a Distribution Agreement dated January 1, 2011 (the “Distribution Agreement”). Pursuant to the Distribution Agreement, the Funds appointed the Distributor to be their agent for the distribution of the Funds’ shares on a continuous offering basis.
The following tables set forth the amount of underwriting commissions paid by the Funds, the amount of such commissions retained by the Distributor, and the amount of compensation on redemptions and repurchases for the period from January 1, 2011 through May 31, 2011:
| Total Underwriting Commissions | ||||
Fund | January 1, 2011 through May 31, 2011 | |||
Nuveen Colorado Tax Free Fund | $ | 7,174 | ||
Nuveen Minnesota Intermediate Municipal Bond Fund | 24,445 | |||
S-47
| Total Underwriting Commissions | ||||
Fund | January 1, 2011 through May 31, 2011 | |||
Nuveen Minnesota Municipal Bond Fund | 61,688 | |||
Nuveen Missouri Tax Free Fund | 6,918 | |||
Nuveen Nebraska Municipal Bond Fund | 12,782 | |||
Nuveen Ohio Tax Free Fund | 644 | |||
Nuveen Oregon Intermediate Municipal Bond Fund | 24,313 | |||
| Underwriting Commissions Retained by Distributor | ||||
Fund | January 1, 2011 through May 31, 2011 | |||
Nuveen Colorado Tax Free Fund | $ | 980 | ||
Nuveen Minnesota Intermediate Municipal Bond Fund | 3,047 | |||
Nuveen Minnesota Municipal Bond Fund | 7,075 | |||
Nuveen Missouri Tax Free Fund | 987 | |||
Nuveen Nebraska Municipal Bond Fund | 377 | |||
Nuveen Ohio Tax Free Fund | 84 | |||
Nuveen Oregon Intermediate Municipal Bond Fund | 2,499 | |||
| Compensation on Redemptions and Repurchases | ||||
Fund | January 1, 2011 through May 31, 2011 | |||
Nuveen Colorado Tax Free Fund | $ | 58 | ||
Nuveen Minnesota Intermediate Municipal Bond Fund | 5,398 | |||
Nuveen Minnesota Municipal Bond Fund | 6,567 | |||
Nuveen Missouri Tax Free Fund | 1,059 | |||
Nuveen Nebraska Municipal Bond Fund | — | |||
Nuveen Ohio Tax Free Fund | — | |||
Nuveen Oregon Intermediate Municipal Bond Fund | — | |||
| 1 | Fees paid by the Funds under NIF’s Rule 12b-1 Distribution and Service Plan are provided below. |
Prior to the Transaction, Quasar Distributors, LLC (“Quasar”) 615 East Michigan Street, Milwaukee, WI 53202, served as the distributor for the Funds’ shares pursuant to a Distribution Agreement dated July 1, 2007 (the “Quasar Distribution Agreement”). Quasar is a wholly owned subsidiary of U.S. Bancorp.
The following tables set forth the amount of underwriting commissions paid by the Funds and the amount of such commissions retained by Quasar during the fiscal years ended June 30, 2009 and June 30, 2010 and the period July 1, 2010 through December 31, 2010:
| Total Underwriting Commissions | ||||||||||||
Fund | Fiscal Year Ended June 30, 2009 | Fiscal Year Ended June 30, 2010 | July 1, 2010 through December 31, 2010 | |||||||||
Nuveen Colorado Tax Free Fund | $ | 15,957 | $ | 37,235 | $ | 25,448 | ||||||
Nuveen Minnesota Intermediate Municipal Bond Fund | 43,914 | 176,348 | 79,801 | |||||||||
Nuveen Minnesota Municipal Bond Fund | 297,705 | 341,089 | 127,806 | |||||||||
Nuveen Missouri Tax Free Fund | 50,118 | 105,556 | 37,274 | |||||||||
Nuveen Nebraska Municipal Bond Fund | 39,786 | 65,379 | 34,095 | |||||||||
Nuveen Ohio Tax Free Fund | 14,193 | 34,160 | 7,275 | |||||||||
Nuveen Oregon Intermediate Municipal Bond Fund | 63,744 | 229,670 | 36,445 | |||||||||
S-48
| Underwriting Commissions Retained by Quasar | ||||||||||||
Fund | Fiscal Year Ended June 30, 2009 | Fiscal Year Ended June 30, 2010 | July 1, 2010 through December 31, 2010 | |||||||||
Nuveen Colorado Tax Free Fund | $ | 3,667 | $ | 2,059 | $ | 2,269 | ||||||
Nuveen Minnesota Intermediate Municipal Bond Fund | 6,269 | 16,609 | 5,412 | |||||||||
Nuveen Minnesota Municipal Bond Fund | 11,198 | 20,468 | 6,158 | |||||||||
Nuveen Missouri Tax Free Fund | 2,881 | 7,691 | 1,485 | |||||||||
Nuveen Nebraska Municipal Bond Fund | 2,389 | 3,202 | 1,824 | |||||||||
Nuveen Ohio Tax Free Fund | 771 | 2,020 | 92 | |||||||||
Nuveen Oregon Intermediate Municipal Bond Fund | 2,046 | 17,344 | 4,353 | |||||||||
| Compensation on Redemptions and Repurchases | ||||||||||||
Fund | Fiscal Year Ended June 30, 2009 | Fiscal Year Ended June 30, 2010 | July 1, 2010 through December 31, 2010 | |||||||||
Nuveen Colorado Tax Free Fund | $ | 1,006 | $ | 41 | $ | 2,105 | ||||||
Nuveen Minnesota Intermediate Municipal Bond Fund | 846 | 3,689 | 2,308 | |||||||||
Nuveen Minnesota Municipal Bond Fund | 7,299 | 8,924 | 2,366 | |||||||||
Nuveen Missouri Tax Free Fund | 2 | 359 | 97 | |||||||||
Nuveen Nebraska Municipal Bond Fund | — | 280 | 414 | |||||||||
Nuveen Ohio Tax Free Fund | — | 116 | 96 | |||||||||
Nuveen Oregon Intermediate Municipal Bond Fund | — | 7,793 | 15,379 | |||||||||
Distribution and Service Plans
NIF has adopted a Distribution and Service Plan with respect to the Class A, Class C and Class C1 shares of the Funds pursuant to Rule 12b-1 under the 1940 Act (the “Plan”). Rule 12b-1 provides in substance that a mutual fund may not engage directly or indirectly in financing any activity which is primarily intended to result in the sale of shares, except pursuant to a plan adopted under the Rule. The Plan authorizes the Funds to pay the Distributor distribution and/or shareholder servicing fees on the Funds’ Class A, Class C and Class C1 shares as described below. The distribution fees under the Plan are used for primary purpose of compensating participating intermediaries for their sales of the Funds. The shareholder servicing fees are used primarily for the purpose of providing compensation for the ongoing servicing and/or maintenance of shareholder accounts.
The Class A shares pay to the Distributor a shareholder servicing fee at an annual rate of 0.20% of the average daily net assets of the Class A shares. The fee may be used by the Distributor to provide compensation for shareholder servicing activities with respect to the Class A shares. The shareholder servicing fee is intended to compensate the Distributor for ongoing servicing and/or maintenance of shareholder accounts and may be used by the Distributor to provide compensation to participating intermediaries through whom shareholders hold their shares for ongoing servicing and/or maintenance of shareholder accounts. This fee is calculated and paid each month based on average daily net assets of Class A shares of each Fund for that month.
The Class C and Class C1 shares pay to the Distributor a shareholder servicing fee at the annual rates of 0.20% and 0.25% of the average daily net assets of the Class C and Class C1 shares, respectively. The fee may be used by the Distributor to provide compensation for shareholder servicing activities with respect to both the Class C and Class C1 shares. This fee is calculated and paid each month based on average daily net assets of the Class C and Class C1 shares, respectively. The Class C and Class C1 shares pay to the Distributor a distribution fee at an annual rate of 0.55% and 0.40% of the average daily net assets of the Class C and Class C1 shares, respectively. The Distributor may use the distribution fee to provide compensation to participating intermediaries through which shareholders hold their shares beginning one year after purchase.
The Distributor receives no compensation for distribution of the Class I shares.
S-49
The Plan is a “compensation-type” plan under which the Distributor is entitled to receive the distribution and shareholder servicing fees regardless of whether its actual distribution and shareholder servicing expenses are more or less than the amount of the fees. It is therefore possible that the Distributor may realize a profit in a particular year as a result of these payments. The Plan recognizes that the Distributor and the Adviser, in their discretion, may from time to time use their own assets to pay for certain additional costs of distributing Class A, Class C and Class C1 shares. Any such arrangements to pay such additional costs may be commenced or discontinued by the Distributor or the Adviser at any time. With the exception of the Distributor and its affiliates, no “interested person” of NIF, as that term is defined in the 1940 Act, and no Director of NIF has a direct or indirect financial interest in the operation of the Plan or any related agreement.
Under the Plan, the Funds’ Treasurer reports the amounts expended under the Plan and the purposes for which such expenditures were made to the Board of Directors for their review on a quarterly basis. The Plan provides that it will continue in effect for a period of more than one year from the date of its execution only so long as such continuance is specifically approved at least annually by the vote of a majority of the Board members of NIF and by the vote of the majority of those Board members of NIF who are not “interested persons” (as that term is defined in the 1940 Act) of NIF and who have no direct or indirect financial interest in the operation of the Plan or in any agreement related to such plan. The Funds paid the following 12b-1 fees to Quasar for the period from July 1, 2010 through December 31, 2010 with respect to the Class A shares and Class C1 shares of the Funds. The table also describes the activities for which such payments were used. As noted above, no 12b-1 fees are paid with respect to Class I shares.
Fund | Total 12b-1 Fees Paid to Quasar | Amount Retained by Quasar1 | Compensation Paid to Participating Intermediaries | |||||||||
Nuveen Colorado Tax Free Fund | ||||||||||||
Class A | $ | 14,005 | $ | 435 | $ | 13,570 | ||||||
Class C12 | 9,929 | 1,607 | 8,322 | |||||||||
Nuveen Minnesota Intermediate Municipal Bond Fund | ||||||||||||
Class A | 9,552 | 1,418 | 8,134 | |||||||||
Class C1 | 17,869 | 17,025 | 844 | |||||||||
Nuveen Minnesota Municipal Bond Fund | ||||||||||||
Class A | 69,671 | 1,341 | 68,330 | |||||||||
Class C12 | 90,807 | 23,963 | 66,844 | |||||||||
Nuveen Missouri Tax Free Fund | ||||||||||||
Class A | 19,091 | 733 | 18,358 | |||||||||
Class C12 | 6,044 | 3,153 | 2,891 | |||||||||
Nuveen Nebraska Municipal Bond Fund | ||||||||||||
Class A | 8,506 | 62 | 8,444 | |||||||||
Class C1 | 14,500 | 4,666 | 9,834 | |||||||||
Nuveen Ohio Tax Free Fund | ||||||||||||
Class A | 2,516 | — | 2,516 | |||||||||
Class C12 | 4,967 | 3,514 | 1,453 | |||||||||
Nuveen Oregon Intermediate Municipal Bond Fund | ||||||||||||
Class A | 26,212 | 494 | 25,718 | |||||||||
| 1 | The amounts retained by Quasar were used to pay for various distribution and shareholder servicing expenses, including advertising, marketing, wholesaler support, and printing prospectuses. |
| 2 | Effective January 18, 2011 Class C Shares were renamed Class C1 Shares. |
The Funds paid the following 12b-1 fees to the Distributor for the period from January 1, 2011 through May 31, 2011 with respect to the Class A shares and Class C1 shares of the Funds. The table also describes the activities for which such payments were used. As noted above, no 12b-1 fees are paid with respect to Class I shares.
S-50
Fund | Total 12b-1 Fees Paid to Nuveen | Amount Retained by Nuveen1 | Compensation Paid to Participating Intermediaries | |||||||||
| Nuveen Colorado Tax Free Fund | ||||||||||||
Class A | $ | 9,590 | $ | 9,590 | $ | — | ||||||
Class C1 | 6,775 | 6,775 | — | |||||||||
| Nuveen Minnesota Intermediate Municipal Bond Fund | ||||||||||||
Class A | 23,264 | 23,264 | — | |||||||||
Class C2 | 736 | 736 | — | |||||||||
Class C13 | 17,506 | 17,506 | — | |||||||||
| Nuveen Minnesota Municipal Bond Fund | ||||||||||||
Class A | 68,722 | 68,722 | — | |||||||||
Class C2 | 776 | 776 | — | |||||||||
Class C13 | 62,130 | 62,130 | — | |||||||||
| Nuveen Missouri Tax Free Fund | ||||||||||||
Class A | 18,997 | 18,997 | — | |||||||||
Class C13 | 4,548 | 4,548 | — | |||||||||
| Nuveen Nebraska Municipal Bond Fund | ||||||||||||
Class A | 5,564 | 5,564 | — | |||||||||
Class C2 | 505 | 505 | — | |||||||||
Class C13 | 11,410 | 11,410 | — | |||||||||
| Nuveen Ohio Tax Free Fund | ||||||||||||
Class A | 1,420 | 1,420 | — | |||||||||
Class C13 | 4,451 | 4,451 | — | |||||||||
| Nuveen Oregon Intermediate Municipal Bond Fund | ||||||||||||
Class A | 26,294 | 26,294 | ||||||||||
Class C2 | 1,009 | 1,009 | — | |||||||||
| 1 | The amounts retained by the Distributor were used to pay for various distribution and shareholder servicing expenses, including advertising, marketing, wholesaler support, and printing prospectuses. |
| 2 | For the period January 18, 2011 (commencement of operations) through May 31, 2011. |
| 3 | Effective January 18, 2011 Class C Shares were renamed Class C1 Shares. |
If a Fund closes to new investors, it may continue to make payments under the Plan. Such payments would be made for the various services provided to existing shareholders by the Participating Intermediaries receiving such payments.
Custodian and Independent Registered Public Accounting Firm
Custodian
U.S. Bank, 60 Livingston Avenue, St. Paul, MN 55101, acts as the custodian for each Fund (the “Custodian”). U.S. Bank is a subsidiary of U.S. Bancorp. The Custodian takes no part in determining the investment policies of the Funds or in deciding which securities are purchased or sold by the Funds. All of the instruments representing the investments of the Funds and all cash are held by the Custodian. The Custodian delivers securities against payment upon sale and pays for securities against delivery upon purchase. The Custodian also remits Fund assets in payment of Fund expenses, pursuant to instructions of NIF’s officers or resolutions of the Board of Directors.
As compensation for its services as custodian to the Funds, the Custodian is paid a monthly fee calculated on an annual basis equal to 0.005% of each such Fund’s average daily net assets. In addition, the Custodian is reimbursed for its out-of-pocket expenses incurred while providing services to the Funds. The Custodian continues to serve so long as its appointment is approved at least annually by the Board of Directors including a majority of the directors who are not “interested persons” of NIF, as that term is defined in the 1940 Act.
S-51
Independent Registered Public Accounting Firm
Ernst & Young LLP, 220 South Sixth Street, Suite 1400, Minneapolis, Minnesota 55402, serves as the Funds’ independent registered public accounting firm, providing audit services, including audits of the annual financial statements.
The following table sets forth the number and total assets of the mutual funds and accounts managed by the Funds’ portfolio managers as of May 31, 2011.
Portfolio Manager | Type of Account Managed | Number of Accounts | Assets | Amount Subject to Performance-Based Fee | ||||||||
Daniel J. Close | Registered Investment Company | 28 | $ | 5.09 billion | 0 | |||||||
| Other Pooled Investment Vehicles | 0 | 0 | 0 | |||||||||
| Other Accounts | 8 | 63.5 million | 0 | |||||||||
Christopher L. Drahn | Registered Investment Company | 13 | $ | 2.9 billion | 0 | |||||||
| Other Pooled Investment Vehicles | 0 | 0 | 0 | |||||||||
| Other Accounts | 4 | 214.0 million | 0 | |||||||||
Michael S. Hamilton | Registered Investment Company | 17 | $ | 1.59 billion | 0 | |||||||
| Other Pooled Investment Vehicles | 0 | 0 | 0 | |||||||||
| Other Accounts | 2 | 197.0 million | 0 | |||||||||
Douglas J. White | Registered Investment Company | 9 | $ | 2.98 billion | 0 | |||||||
| Other Pooled Investment Vehicles | 0 | 0 | 0 | |||||||||
| Other Accounts | 4 | 31.3 million | 0 | |||||||||
Actual or apparent conflicts of interest may arise when a portfolio manager has day-to-day management responsibilities with respect to more than one account. More specifically, portfolio managers who manage multiple accounts are presented a number of potential conflicts, including, among others those discussed below.
The management of multiple accounts may result in a portfolio manager devoting unequal time and attention to the management of each account. Nuveen Asset Management seeks to manage such competing interests for the time and attention of portfolio managers by having portfolio managers focus on a particular investment discipline. Most accounts managed by a portfolio manager in a particular investment strategy are managed using the same investment models.
If a portfolio manager identifies a limited investment opportunity which may be suitable for more than one account, an account may not be able to take full advantage of that opportunity due to an allocation of filled purchase or sale orders across all eligible accounts. To deal with these situations, Nuveen Asset Management has adopted procedures for allocating limited opportunities across multiple accounts.
With respect to many of its clients’ accounts, Nuveen Asset Management determines which broker to use to execute transaction orders, consistent with its duty to seek best execution of the transaction. However, with respect to certain other accounts, Nuveen Asset Management may be limited by the client with respect to the selection of brokers or may be instructed to direct trades through a particular broker. In these cases, Nuveen Asset Management may place separate, non-simultaneous, transactions for a Fund and other accounts which may temporarily affect the market price of the security or the execution of the transaction, or both, to the detriment of the Fund or the other accounts.
Some clients are subject to different regulations. As a consequence of this difference in regulatory requirements, some clients may not be permitted to engage in all the investment techniques or transactions or to engage in these transactions to the same extent as the other accounts managed by the portfolio manager. Finally, the appearance of a conflict of interest may arise where Nuveen Asset Management has an incentive, such as a performance-based management fee, which relates to the management of some accounts, with respect to which a portfolio manager has day-to-day management responsibilities.
S-52
Nuveen Asset Management has adopted certain compliance procedures which are designed to address these types of conflicts common among investment managers. However, there is no guarantee that such procedures will detect each and every situation in which a conflict arises.
Portfolio Manager Compensation
Portfolio manager compensation consists primarily of base pay, an annual cash incentive and long term incentive payments.
Base pay. Base pay is determined based upon an analysis of the portfolio manager’s general performance, experience, and market levels of base pay for such position.
Annual cash bonus. The Funds’ portfolio managers are eligible for an annual cash bonus determined based upon the particular portfolio manager’s performance, experience and market levels of base pay for such position. The maximum potential annual cash bonus is equal to a multiple of base pay.
A portion of each portfolio manager’s annual cash bonus is based on his or her Fund’s investment performance, generally measured over the past one- and three-year periods unless the portfolio manager’s tenure is shorter. Investment performance for each Fund is determined by evaluating the Fund’s performance relative to its benchmark(s) and/or Lipper industry peer group.
Each portfolio manager whose performance is evaluated in part by comparing the manager’s performance to a benchmark is measured against a Fund-specific customized subset (limited to bonds in the Fund’s specific state and with certain maturity parameters) of the S&P/Investortools Municipal Bond Index, an index comprised of bonds held by managed municipal bond fund customers of Standard & Poor’s Securities Pricing, Inc. that are priced daily and whose fund holdings aggregate at least $2 million. As of June 30, 2011, the S&P/Investortools Municipal Bond Index was comprised of 56,838 securities with an aggregate current market value of $1,218 billion.
Bonus amounts can also be influenced by factors other than investment performance. These other factors are more subjective and are based on evaluations by each portfolio manager’s supervisor and reviews submitted by his or her peers. These reviews and evaluations often take into account a number of factors, including the portfolio manager’s effectiveness in communicating investment performance to shareholders and their advisors, his or her contribution to Nuveen Asset Management’s investment process and to the execution of investment strategies consistent with risk guidelines, his or her participation in asset growth, and his or her compliance with Nuveen Asset Management’s policies and procedures.
Investment performance is measured on a pre-tax basis, gross of fees for a Fund’s results and for its Lipper industry peer group.
Long-term incentive compensation. Certain key employees of Nuveen Investments and its affiliates, including certain portfolio managers, have received equity interests in the parent company of Nuveen Investments which entitle their holders to participate in the appreciation in the value of Nuveen Investments. In addition, certain key employees of Nuveen Asset Management, including certain portfolio managers, have received profits interests in Nuveen Asset Management which entitle their holders to participate in the firm’s growth over time.
There are generally no differences between the methods used to determine compensation with respect to the Funds and the Other Accounts shown in the table above.
The following table indicates as of May 31, 2011 the value, within the indicated range, of shares beneficially owned by the portfolio managers in each Fund they manage and in the remainder of Nuveen funds managed by Nuveen Asset Management’s municipal investment team. For purposes of this table, the following letters indicate the range listed next to each letter:
A—$0
B—$1-$10,000
C—$10,001-$50,000
D—$50,001-$100,000
S-53
E—$100,001-$500,000
F—$500,001-$1,000,000
G—More than $1 million
Portfolio Manager | Fund | Ownership in Fund | Ownership in Fund Complex | |||||||
Daniel J. Close | Nuveen Ohio Tax Free Fund | A | A | |||||||
Christopher L. Drahn | Nuveen Colorado Tax Free Fund | A | C | |||||||
| Nuveen Minnesota Intermediate Municipal Bond Fund | A | |||||||||
| Nuveen Missouri Tax Free Fund | A | |||||||||
Michael S. Hamilton | Nuveen Oregon Intermediate Municipal Bond Fund | A | D | |||||||
Douglas J. White | Nuveen Minnesota Municipal Bond Fund | A | E | |||||||
| Nuveen Nebraska Municipal Bond Fund | A | |||||||||
Nuveen Asset Management is responsible for decisions to buy and sell securities for the Funds, the negotiation of the prices to be paid or received for principal trades, and the allocation of its transactions among various dealer firms. Portfolio securities will normally be purchased directly from an underwriter in a new issue offering or in the over-the-counter secondary market from the principal dealers in such securities, unless it appears that a better price or execution may be obtained elsewhere. Portfolio securities will not be purchased from Nuveen or its affiliates except in compliance with the 1940 Act.
The Funds expect that substantially all portfolio transactions will be effected on a principal (as opposed to an agency) basis and, accordingly, do not expect to pay significant amounts of brokerage commissions. Brokerage will not be allocated based on the sale of a Fund’s shares. Purchases from underwriters will include a commission or concession paid by the issuer to the underwriter, and purchases from dealers will include the spread between the bid and asked price. It is the policy of Nuveen Asset Management to seek the best execution under the circumstances of each trade. Nuveen Asset Management evaluates price as the primary consideration, with the financial condition, reputation and responsiveness of the dealer considered secondarily in determining best execution. Given the best execution obtainable, it may be Nuveen Asset Management’s practice to select dealers that, in addition, furnish research information (primarily credit analyses of issuers and general economic reports) and statistical and other services to Nuveen Asset Management. It is not possible to place a dollar value on information and statistical and other services received from dealers. Since it is only supplementary to Nuveen Asset Management’s own research efforts, the receipt of research information is not expected to reduce significantly Nuveen Asset Management’s expenses. For certain secondary market transactions where the execution capability of two brokers is judged to be of substantially similar quality, Nuveen Asset Management may randomly select one of them. While Nuveen Asset Management will be primarily responsible for the placement of the portfolio transactions of the Funds, the policies and practices of Nuveen Asset Management in this regard must be consistent with the foregoing and will, at all times, be subject to review by the Board of Trustees.
Nuveen Asset Management may manage other investment companies and investment accounts for other clients that have investment objectives similar to the Funds. Subject to applicable laws and regulations, Nuveen Asset Management seeks to allocate portfolio transactions equitably whenever concurrent decisions are made to purchase or sell securities by a Fund and another advisory account. In making such allocations the main factors to be considered will be the respective investment objectives, the relative size of the portfolio holdings of the same or comparable securities, the availability of cash for investment or need to raise cash, and the size of investment commitments generally held. While this procedure could have a detrimental effect on the price or amount of the securities (or in the case of dispositions, the demand for securities) available to the Funds from time to time, it is the opinion of the Board of Trustees that the benefits available from the Nuveen Asset Management organization will outweigh any disadvantage that may arise from exposure to simultaneous transactions.
S-54
The following table sets forth the aggregate brokerage commissions paid by certain of the Funds during the fiscal years ended June 30, 2009, June 30, 2010 and the period July 1, 2010 through May 31, 2011:
| Aggregate Brokerage Commissions Paid by the Funds | ||||||||||||
Fund | Fiscal Year Ended June 30, 2009 | Fiscal Year Ended June 30, 2010 | July 1, 2010 through May 31, 2011 | |||||||||
Nuveen Colorado Tax Free Fund | — | — | — | |||||||||
Nuveen Minnesota Intermediate Municipal Bond Fund | — | — | — | |||||||||
Nuveen Minnesota Municipal Bond Fund | — | — | — | |||||||||
Nuveen Missouri Tax Free Fund | — | — | — | |||||||||
Nuveen Nebraska Municipal Bond Fund | — | — | — | |||||||||
Nuveen Ohio Tax Free Fund | — | — | — | |||||||||
Nuveen Oregon Intermediate Municipal Bond Fund | — | — | — | |||||||||
| – | No commissions paid. |
Each share of each Fund’s $.0001 par value common stock is fully paid, nonassessable, and transferable. Shares may be issued as either full or fractional shares. Fractional shares have pro rata the same rights and privileges as full shares. Shares of the Funds have no preemptive or conversion rights.
Each share of a Fund has one vote. On some issues, such as the election of directors, all shares of all NIF funds vote together as one series. The shares do not have cumulative voting rights. On issues affecting only a particular Fund, the shares of that Fund will vote as a separate series. Examples of such issues would be proposals to alter a fundamental investment restriction pertaining to a Fund or to approve, disapprove or alter a distribution plan.
The Bylaws of NIF provide that annual shareholders meetings are not required and that meetings of shareholders need only be held with such frequency as required under Maryland law and the 1940 Act.
As of September 6, 2011, the directors and officers of NIF as a group owned less than 1% of each Fund’s outstanding shares and the Funds were aware that the following persons owned of record 5% or more of the outstanding shares of each class of stock of the Funds:
| Percentage of Outstanding Shares | ||||||||||||
Fund | Class A | Class C | Class C1 | Class I | ||||||||
Colorado Tax Free Fund | ||||||||||||
FIRST CLEARING, LLC SPECIAL CUSTODY ACCT FOR THE EXCLUSIVE BENEFIT OF CUSTOMER 2801 MARKET ST SAINT LOUIS MO 63103-2523 | 5.97 | % | 6.77 | % | ||||||||
MERRILL LYNCH PIERCE FENNER & SMITH ATTN PHYSICAL TEAM 4800 DEER LAKE DR E JACKSONVILLE FL 32246-6484 | 7.74 | % | 19.70 | % | ||||||||
UBS WM USA OMNI ACCOUNT MF ATTN DEPARTMENT MANAGER 1000 HARBOR BLVD FL 5 WEEHAWKEN NJ 07086-6761 | 12.69 | % | 33.47 | % | ||||||||
S-55
| Percentage of Outstanding Shares | ||||||||||||||||
Fund | Class A | Class C | Class C1 | Class I | ||||||||||||
BAND & CO C/O US BANK PO BOX 1787 MILWAUKEE WI 53201-1787 | 71.65 | % | ||||||||||||||
WASHINGTON & CO C/O US BANK PO BOX 1787 MILWAUKEE WI 53201-1787 | 11.28 | % | ||||||||||||||
NFS LLC FEBO ALLIANCE BANK NA ALLIANCE BANK TRUST DEPARTMENT 160 MAIN ST ONEIDA NY 13421-1629 | 5.52 | % | ||||||||||||||
Minnesota Intermediate Municipal Bond Fund | ||||||||||||||||
FIRST CLEARING, LLC SPECIAL CUSTODY ACCT FOR THE EXCLUSIVE BENEFIT OF CUSTOMER 2801 MARKET ST SAINT LOUIS MO 63103-2523 | 5.04 | % | 8.63 | % | ||||||||||||
UBS WM USA OMNI ACCOUNT MF ATTN DEPARTMENT MANAGER 1000 HARBOR BLVD FL 5 WEEHAWKEN NJ 07086-6761 | 15.55 | % | ||||||||||||||
US BANCORP INVESTMENTS INC 60 LIVINGSTON AVE SAINT PAUL MN 55107-2292 | 5.93 | % | ||||||||||||||
US BANCORP INVESTMENTS INC 60 LIVINGSTON AVE SAINT PAUL MN 55107-2292 | 5.14 | % | ||||||||||||||
US BANKCORP INVESTMENTS INC 60 LIVINGSTON AVE SAINT PAUL MN 55107-2292 | 13.48 | % | ||||||||||||||
US BANKCORP INVESTMENTS INC 60 LIVINGSTON AVE SAINT PAUL MN 55107-2292 | 12.10 | % | ||||||||||||||
US BANKCORP INVESTMENTS INC 60 LIVINGSTON AVE SAINT PAUL MN 55107-2292 | 10.55 | % | ||||||||||||||
US BANKCORP INVESTMENTS INC 60 LIVINGSTON AVE SAINT PAUL MN 55107-2292 | 7.44 | % | ||||||||||||||
US BANKCORP INVESTMENTS INC 60 LIVINGSTON AVE SAINT PAUL MN 55107-2292 | 5.30 | % | ||||||||||||||
S-56
| Percentage of Outstanding Shares | ||||||||||||||
Fund | Class A | Class C | Class C1 | Class I | ||||||||||
NUVEEN INVESTMENTS INC ATTN DARLENE CRAMER 333 W WACKER DR FL 34 CHICAGO IL 60606-2290 | 5.47 | % | ||||||||||||
PERSHING LLC PO BOX 2052 JERSEY CITY NJ 07303-2052 | 5.47 | % | ||||||||||||
PERSHING LLC PO BOX 2052 JERSEY CITY NJ 07303-2052 | 8.77 | % | ||||||||||||
PERSHING LLC PO BOX 2052 JERSEY CITY NJ 07303-2052 | 7.05 | % | ||||||||||||
WELLS FARGO ADVISORS SPECIAL CUSTODY ACCT FOR THE EXCLUSIVE BENEFIT OF CUSTOMER 2801 MARKET STREET ST LOUIS MO 63103-2523 | 5.60 | % | ||||||||||||
BAND & CO C/O US BANK PO BOX 1787 MILWAUKEE WI 53201-1787 | 89.97 | % | ||||||||||||
Minnesota Municipal Bond Fund | ||||||||||||||
FIRST CLEARING LLC SPECIAL CUSTODY ACCOUNT FOR THE EXCLUSIVE BENEFIT OF CUSTOMER 2801 MARKET ST ST LOUIS, MO 63103 | 6.40 | % | 12.15 | % | ||||||||||
UBS WM USA OMNI ACCOUNT MF ATTN DEPARTMENT MANAGER 1000 HARBOR BLVD FL 5 WEEHAWKEN NJ 07086-6761 | 19.69 | % | ||||||||||||
HENRY W PROEHL & MARYLS M PROEHL JTWROS TOD 116 2ND ST S DUNDAS MN 55019-3904 | 5.24 | % | ||||||||||||
NUVEEN INVESTMENTS INC ATTN DARLENE CRAMER 333 W WACKER DR FL 34 CHICAGO IL 60606-2290 | 5.43 | % | ||||||||||||
S-57
| Percentage of Outstanding Shares | ||||||||||||||||
Fund | Class A | Class C | Class C1 | Class I | ||||||||||||
ARNOLD L SCHULTZ & DARYLLE G SCHULTZ JTWROS 2040 39TH ST W WEBSTER MN 55088-2407 | 8.14 | % | ||||||||||||||
PERSHING LLC PO BOX 2052 JERSEY CITY NJ 07303-2052 | 11.15 | % | ||||||||||||||
PERSHING LLC PO BOX 2052 JERSEY CITY NJ 07303-2052 | 5.00 | % | ||||||||||||||
MERRILL LYNCH PIERCE FENNER & SMITH ATTN PHYSICAL TEAM 4800 DEER LAKE DR E JACKSONVILLE FL 32246-6484 | 8.32 | % | ||||||||||||||
UBS WM USA OMNI ACCOUNT MF ATTN DEPARTMENT MANAGER 1000 HARBOR BLVD FL 5 WEEHAWKEN NJ 07086-6761 | 14.72 | % | ||||||||||||||
BAND & CO C/O US BANK PO BOX 1787 MILWAUKEE WI 53201-1787 | 90.21 | % | ||||||||||||||
Missouri Tax Free Fund | ||||||||||||||||
PERSHING LLC P O BOX 2052 JERSEY CITY NJ 07303-2052 | 6.11 | % | ||||||||||||||
PERSHING LLC P O BOX 2052 JERSEY CITY NJ 07303-2052 | 12.60 | % | ||||||||||||||
FIRST CLEARING LLC 2801 MARKET ST SAINT LOUIS MO 63103-2523 | 18.32 | % | ||||||||||||||
U.S. BANCORP INVESTMENTS INC. 60 LIVINGSTON AVE SAINT PAUL MN 55107-2292 | 16.99 | % | ||||||||||||||
U.S. BANCORP INVESTMENTS INC. 60 LIVINGSTON AVE SAINT PAUL MN 55107-2292 | 8.56 | % | ||||||||||||||
U.S. BANCORP INVESTMENTS INC. 60 LIVINGSTON AVE SAINT PAUL MN 55107-2292 | 6.95 | % | ||||||||||||||
U S BANCORP INVESTMENTS INC 60 LIVINGSTON AVE SAINT PAUL MN 55107-2292 | 6.84 | % | ||||||||||||||
S-58
| Percentage of Outstanding Shares | ||||||||||||||||
Fund | Class A | Class C | Class C1 | Class I | ||||||||||||
MERRILL LYNCH PIERCE FENNER & SMITH ATTN PHYSICAL TEAM 4800 DEER LAKE DR E JACKSONVILLE FL 32246-6484 | 5.21 | % | ||||||||||||||
BAND & CO C/O US BANK PO BOX 1787 MILWAUKEE WI 53201-1787 | 87.10 | % | ||||||||||||||
WASHINGTON & CO C/O US BANK PO BOX 1787 MILWAUKEE WI 53201-1787 | 6.09 | % | ||||||||||||||
Nebraska Municipal Bond Fund | ||||||||||||||||
RBC CAPITAL MARKETS CORP FBO J JOHN GRAINGER 2929 VAN DORN ST LINCOLN NE 68502-4261 | 12.43 | % | ||||||||||||||
NFS LLC FEBO BETTY J BENTLEY TTEE BETTY J BENTLEY FAMILY TRUST U/A 1/13/95 6210 CALIFORNIA OMAHA NE 68132-2704 | 11.49 | % | ||||||||||||||
UBS WM USA OMNI ACCOUNT MF ATTN DEPARTMENT MANAGER 1000 HARBOR BLVD FL 5 WEEHAWKEN NJ 07086-6761 | 11.27 | % | ||||||||||||||
LYNETTE K PETERSEN 1510 CO RD C SCRIBNER NE 68057-1362 | 12.87 | % | ||||||||||||||
MERLIN K PETERSEN 1510 CO RD C SCRIBNER NE 68057-1362 | 7.34 | % | ||||||||||||||
US BANKCORP INVESTMENTS INC 60 LIVINGSTON AVE SAINT PAUL MN 55107-2292 | 9.11 | % | ||||||||||||||
NUVEEN INVESTMENTS INC ATTN DARLENE CRAMER 333 W WACKER DR FL 34 CHICAGO IL 60606-2290 | 9.65 | % | ||||||||||||||
PERSHING LLC P O BOX 2052 JERSEY CITY NJ 07303-2052 | 19.34 | % | ||||||||||||||
S-59
| Percentage of Outstanding Shares | ||||||||||||||||
Fund | Class A | Class C | Class C1 | Class I | ||||||||||||
PERSHING LLC P O BOX 2052 JERSEY CITY NJ 07303-2052 | 19.18 | % | ||||||||||||||
UBS WM USA OMNI ACCOUNT MF ATTN DEPARTMENT MANAGER 1000 HARBOR BLVD FL 5 WEEHAWKEN NJ 07086-6761 | 34.20 | % | ||||||||||||||
FIRST CLEARING LLC & S A MOHANNA TRUST UAD 5/23/05 TEN COM 702 FORT CROOK RD S STE 343 BELLEVUE NE 68005-7905 | 20.10 | % | ||||||||||||||
RAYMOND JAMES & ASSOC INC FBO FRANCIS P MATTHEWS TTEE FRANCIS P & HELEN S MATTHEWS JT TRUST 220 S 216TH CIR ELKHORN NE 68022-1822 | 5.71 | % | ||||||||||||||
BAND & CO C/O US BANK PO BOX 1787 MILWAUKEE WI 53201-1787 | 63.78 | % | ||||||||||||||
CAPINCO C/O US BANK PO BOX 1787 MILWAUKEE WI 53201-1787 | 17.25 | % | ||||||||||||||
WASHINGTON & CO C/O US BANK PO BOX 1787 MILWAUKEE WI 53201-1787 | 13.23 | % | ||||||||||||||
Ohio Tax Free Fund | ||||||||||||||||
U.S. BANCORP INVESTMENTS INC. 60 LIVINGSTON AVE SAINT PAUL MN 55107-2292 | 15.22 | % | ||||||||||||||
U S BANCORP INVESTMENTS INC 60 LIVINGSTON AVE SAINT PAUL MN 55107-2292 | 7.93 | % | ||||||||||||||
U. S. BANCORP INVESTMENTS INC. 60 LIVINGSTON AVE SAINT PAUL MN 55107-2292 | 6.00 | % | ||||||||||||||
U.S. BANCORP INVESTMENTS INC. 60 LIVINGSTON AVE SAINT PAUL MN 55107-2292 | 5.19 | % | ||||||||||||||
S-60
| Percentage of Outstanding Shares | ||||||||||||||||
Fund | Class A | Class C | Class C1 | Class I | ||||||||||||
UBS WM USA OMNI ACCOUNT MF ATTN DEPARTMENT MANAGER 1000 HARBOR BLVD FL 5 | 12.46 | % | ||||||||||||||
U.S. BANCORP INVESTMENTS INC. 60 LIVINGSTON AVE SAINT PAUL MN 55107-2292 | 14.84 | % | ||||||||||||||
U.S. BANCORP INVESTMENTS INC. 60 LIVINGSTON AVE SAINT PAUL MN 55107-2292 | 5.98 | % | ||||||||||||||
U.S. BANCORP INVESTMENTS INC. 60 LIVINGSTON AVE SAINT PAUL MN 55107-2292 | 5.39 | % | ||||||||||||||
PERSHING LLC P O BOX 2052 JERSEY CITY NJ 07303-2052 | 6.18 | % | ||||||||||||||
PERSHING LLC P O BOX 2052 JERSEY CITY NJ 07303-2052 | 5.98 | % | ||||||||||||||
ROBERT W BAIRD & CO INC 777 EAST WISCONSIN AVENUE MILWAUKEE WI 53202-5300 | 5.12 | % | ||||||||||||||
BAND & CO C/O US BANK PO BOX 1787 MILWAUKEE WI 53201-1787 | 88.89 | % | ||||||||||||||
Oregon Intermediate Municipal Bond Fund | ||||||||||||||||
U S BANCORP INVESTMENTS INC. 60 LIVINGSTON AVE SAINT PAUL MN 55107-2292 | 11.82 | % | ||||||||||||||
U S BANCORP INVESTMENTS INC. 60 LIVINGSTON AVE SAINT PAUL MN 55107-2292 | 5.79 | % | ||||||||||||||
U S BANCORP INVESTMENTS INC 60 LIVINGSTON AVE SAINT PAUL MN 55107-2292 | 14.00 | % | ||||||||||||||
US BANKCORP INVESTMENTS INC 60 LIVINGSTON AVE SAINT PAUL MN 55107-2292 | 8.81 | % | ||||||||||||||
LPL FINANCIAL 9785 TOWNE CENTRE DR SAN DIEGO CA 92121-1968 | 8.51 | % | ||||||||||||||
S-61
| Percentage of Outstanding Shares | ||||||||||||
Fund | Class A | Class C | Class C1 | Class I | ||||||||
LPL FINANCIAL 9785 TOWNE CENTRE DR SAN DIEGO CA 92121-1968 | 8.46 | % | ||||||||||
LPL FINANCIAL 9785 TOWNE CENTRE DR SAN DIEGO CA 92121-1968 | 8.24 | % | ||||||||||
LPL FINANCIAL 9785 TOWNE CENTRE DR SAN DIEGO CA 92121-1968 | 7.50 | % | ||||||||||
LPL FINANCIAL 9785 TOWNE CENTRE DR SAN DIEGO CA 92121-1968 | 5.92 | % | ||||||||||
LPL FINANCIAL 9785 TOWNE CENTRE DR SAN DIEGO CA 92121-1968 | 5.63 | % | ||||||||||
BAND & CO C/O US BANK PO BOX 1787 MILWAUKEE WI 53201-1787 | 51.09 | % | ||||||||||
WASHINGTON & CO PO BOX 1787 MILWAUKEE WI 53201-1787 | 42.63 | % | ||||||||||
Each Fund’s net asset value per share is determined as set forth in its Prospectus under “General Information—Net Asset Value.”
On May 31, 2011, the net asset values per share for each class of shares of the Funds were calculated as follows.
Fund | Net Assets | Shares Outstanding | Net Asset Value Per Share | |||||||||
Nuveen Colorado Tax Free Fund | ||||||||||||
Class A | $ | 10,811,287 | 1,076,465 | $ | 10.04 | |||||||
Class C1 | 2,481,252 | 247,775 | 10.01 | |||||||||
Class I | 42,161,059 | 4,187,634 | 10.07 | |||||||||
Nuveen Minnesota Intermediate Municipal Bond Fund | ||||||||||||
Class A | $ | 37,175,017 | 3,646,158 | $ | 10.20 | |||||||
Class C | 623,121 | 61,433 | 10.14 | |||||||||
Class C1 | 6,242,224 | 611,070 | 10.22 | |||||||||
Class I | 191,515,273 | 18,902,511 | 10.13 | |||||||||
Nuveen Minnesota Municipal Bond Fund | ||||||||||||
Class A | $ | 85,182,557 | 7,863,765 | $ | 10.83 | |||||||
Class C | 618,103 | 57,103 | 10.82 | |||||||||
Class C1 | 22,189,757 | 2,057,817 | 10.78 | |||||||||
Class I | 51,116,116 | 4,725,854 | 10.82 | |||||||||
S-62
Fund | Net Assets | Shares Outstanding | Net Asset Value Per Share | |||||||||
Nuveen Missouri Tax Free Fund | ||||||||||||
Class A | $ | 22,951,610 | 1,958,451 | $ | 11.72 | |||||||
Class C1 | 1,660,889 | 142,109 | 11.69 | |||||||||
Class I | 134,609,690 | 11,483,629 | 11.72 | |||||||||
Nuveen Nebraska Municipal Bond Fund | ||||||||||||
Class A | $ | 7,098,504 | 690,863 | $ | 10.28 | |||||||
Class C | 320,924 | 31,218 | 10.28 | |||||||||
Class C1 | 4,200,760 | 412,216 | 10.19 | |||||||||
Class I | 31,470,317 | 3,064,221 | 10.27 | |||||||||
Nuveen Ohio Tax Free Fund | ||||||||||||
Class A | $ | 1,642,383 | 159,011 | $ | 10.33 | |||||||
Class C1 | 1,680,538 | 165,088 | 10.18 | |||||||||
Class I | 47,168,779 | 4,569,840 | 10.32 | |||||||||
Nuveen Oregon Intermediate Municipal Bond Fund | ||||||||||||
Class A | $ | 31,398,665 | 3,087,079 | $ | 10.17 | |||||||
Class C | 631,585 | 62,237 | 10.15 | |||||||||
Class I | 113,827,591 | 11,194,833 | 10.17 | |||||||||
The public offering price of the shares of a Fund generally equals the Fund’s net asset value plus any applicable sales charge. A summary of any applicable sales charge assessed on Fund share purchases is set forth in the Funds’ Prospectus. The public offering price of the Class A Shares of the Funds as of May 31, 2011 was as set forth below. Please note that the public offering prices of Class C, Class C1 and Class I Shares are the same as net asset value since no sales charges are imposed on the purchase of such shares.
Fund | Public Offering Price Class A | |||
Nuveen Colorado Tax Free Fund | $ | 10.48 | ||
Nuveen Minnesota Intermediate Municipal Bond Fund | 10.52 | |||
Nuveen Minnesota Municipal Bond Fund | 11.30 | |||
Nuveen Missouri Tax Free Fund | 12.23 | |||
Nuveen Nebraska Municipal Bond Fund | 10.73 | |||
Nuveen Ohio Tax Free Fund | 10.78 | |||
Nuveen Oregon Intermediate Municipal Bond Fund | 10.48 | |||
Federal Income Tax Matters
This section summarizes some of the main U.S. federal income tax consequences of owning shares of a Fund. This section is current as of the date of this Statement of Additional Information. Tax laws and interpretations change frequently, and this summary does not describe all of the tax consequences to all taxpayers. For example, this summary generally does not describe your situation if you are a corporation, a non-U.S. person, a broker-dealer or other investor with special circumstances. In addition, this section does not describe your state, local or non-U.S. tax consequences. This federal income tax summary is based in part on the advice of counsel to the Funds. The Internal Revenue Service could disagree with any conclusions set forth in this section. In addition, Funds’ counsel was not asked to review, and has not reached a conclusion with respect to the federal income tax treatment of the assets to be deposited in the Funds. Consequently, this summary may not be sufficient for you to use for the purpose of avoiding penalties under federal tax law. As with any investment, you should seek advice based on your individual circumstances from your own tax professional.
S-63
Fund Status
Each Fund intends to qualify as a “regulated investment company” under the federal tax laws. If a Fund qualifies as a regulated investment company and distributes its income as required by the tax law, the Fund generally will not pay federal income taxes.
Qualification as a Regulated Investment Company
As a regulated investment company, a Fund will not be subject to federal income tax on the portion of its investment company taxable income, as that term is defined in the Code, without regard to the deduction for dividends paid and net capital gain (i.e., the excess of net long-term capital gain over net short-term capital loss) that it distributes to shareholders, provided that it distributes at least 90% of its investment company taxable income and 90% of its net tax-exempt interest income for the year (the “Distribution Requirement”) and satisfies certain other requirements of the Code that are described below. Each Fund also intends to make such distributions as are necessary to avoid the otherwise applicable 4% non-deductible excise tax on certain undistributed earnings.
In addition to satisfying the Distribution Requirement, each Fund must derive at least 90% of its gross income from (1) dividends, interest, certain payments with respect to loans of stock and securities, gains from the sale or disposition of stock, securities or non-U.S. currencies and other income (including but not limited to gains from options, futures or forward contracts) derived with respect to its business of investing in such stock, securities or currencies, and (2) net income derived from an interest in “qualified publicly traded partnerships” (as such term is defined in the Code). Each Fund must also satisfy an asset diversification test in order to qualify as a regulated investment company. Under this test, at the close of each quarter of a Fund’s taxable year, (1) 50% or more of the value of the Fund’s assets must be represented by cash, United States government securities, securities of other regulated investment companies, and other securities, with such other securities limited, in respect of any one issuer, to an amount not greater than 5% of the value of the Fund’s assets and 10% of the outstanding voting securities of such issuer and (2) not more than 25% of the value of the Fund’s assets may be invested in securities of (a) any one issuer (other than U.S. government securities or securities of other regulated investment companies), or of two or more issuers which the Fund controls and which are engaged in the same, similar or related trades or businesses or (b) in the securities of one or more “qualified publicly traded partnerships” (as such term is defined in the Code). There are certain exceptions for failure to qualify if the failure is for reasonable cause or is de minimus, and certain corrective action is taken and certain tax payments are made by the Fund.
Distributions
After the end of each year, you will receive a tax statement that separates your Fund’s distributions into three categories, exempt-interest dividends, ordinary income distributions and capital gains dividends. Exempt-interest dividends generally are excluded from your gross income for federal income tax purposes. Some or all of the exempt-interest dividends, however, may be taken into account in determining your alternative minimum tax and may have other tax consequences (e.g., they may affect the amount of your social security benefits that are taxed). Ordinary income distributions are generally taxed at your ordinary tax rate. Generally, you will treat all capital gains dividends as long-term capital gains regardless of how long you have owned your shares. To determine your actual tax liability for your capital gains dividends, you must calculate your total net capital gain or loss for the tax year after considering all of your other taxable transactions, as described below. In addition, a Fund may make distributions that represent a return of capital for tax purposes and thus will generally not be taxable to you. The tax status of your distributions from your Fund is not affected by whether you reinvest your distributions in additional shares or receive them in cash. The income from your Fund that you must take into account for federal income tax purposes is not reduced by amounts used to pay a deferred sales fee, if any. The tax laws may require you to treat distributions made to you in January as if you had received them on December 31 of the previous year. Under the “Health Care and Education Reconciliation Act of 2010,” income from the Fund may also be subject to a new 3.8 percent “medicare tax” imposed for taxable years beginning after 2012. This tax will generally apply to your net investment income if your adjusted gross income exceeds certain threshold amounts, which are $250,000 in the case of married couples filing joint returns and
S-64
$200,000 in the case of single individuals. Interest that is excluded from gross income and exempt-interest dividends from the Funds are generally not included in your net investment income for purposes of this tax.
Dividends Received Deduction
A corporation that owns shares generally will not be entitled to the dividends received deduction with respect to dividends received from the Funds because the dividends received deduction is generally not available for distributions from regulated investment companies.
If You Sell or Redeem Your Shares
If you sell or redeem your shares, you will generally recognize a taxable gain or loss. To determine the amount of this gain or loss, you must subtract your tax basis in your shares from the amount you receive in the transaction. Your tax basis in your shares is generally equal to the cost of your shares, generally including sales charges. In some cases, however, you may have to adjust your tax basis after you purchase your shares. Further, if you hold your shares for six months or less, any loss incurred by you related to the disposition of such a share will be disallowed to the extent of the exempt-interest dividends you received, except as otherwise described in the next section.
Capital Gains and Losses
If you are an individual, the maximum marginal federal tax rate for net capital gain is generally 15% (generally 0% for certain taxpayers in the 10% and 15% tax brackets). These capital gains rates are generally effective for taxable years beginning before January 1, 2013. For later periods, if you are an individual, the maximum marginal federal tax rate for net capital gain is generally 20% (10% for certain taxpayers in the 10% and 15% tax brackets). The 20% rate is reduced to 18% for net capital gains from most property acquired after December 31, 2000 with a holding period of more than five years, and the 10% rate is reduced to 8% for net capital gains from most property (regardless of when acquired) with a holding period of more than five years.
Net capital gain equals net long-term capital gain minus net short-term capital loss for the taxable year. Capital gain or loss is long-term if the holding period for the asset is more than one year and is short-term if the holding period for the asset is one year or less. You must exclude the date you purchase your shares to determine your holding period. If you hold a share for six months or less, any loss incurred by you related to the disposition of such share will be disallowed to the extent of the exempt-interest dividends you received, except in the case of a regular dividend paid by the Fund if the Fund declares exempt-interest dividends on a daily basis in an amount equal to at least 90 percent of its net tax-exempt interest and distributes such dividends on a monthly or more frequent basis. To the extent, if any, it is not disallowed, it will be recharacterized as long-term capital loss to the extent of any capital gain dividend received. The tax rates for capital gains realized from assets held for one year or less are generally the same as for ordinary income. The Internal Revenue Code treats certain capital gains as ordinary income in special situations.
In-Kind Distributions
Under certain circumstances, as described in the Prospectus, you may receive an in-kind distribution of Fund securities when you redeem shares or when your Fund terminates. This distribution will be treated as a sale for federal income tax purposes and you will generally recognize gain or loss, generally based on the value at that time of the securities and the amount of cash received. The Internal Revenue Service could, however, assert that a loss may not be currently deducted.
Exchanges
If you exchange shares of a Fund for shares of another Nuveen Mutual Fund, the exchange would generally be considered a sale for federal income tax purposes.
Deductibility of Fund Expenses
Expenses incurred and deducted by your Fund will generally not be treated as income taxable to you. In some cases, however, you may be required to treat your portion of these Fund expenses as
S-65
income. In these cases you may be able to take a deduction for these expenses. However, certain miscellaneous itemized deductions, such as investment expenses, may be deducted by individuals only to the extent that all of these deductions exceed 2% of the individual’s adjusted gross income. Further, because the Funds pay exempt-interest dividends, which are treated as exempt interest for federal income tax purposes, you will not be able to deduct some of your interest expense for debt that you incur or continue to purchase or carry your shares.
Foreign Investors
If you are a foreign investor (i.e., an investor other than a U.S. citizen or resident or a U.S. corporation, partnership, estate or trust), you should be aware that, generally, subject to applicable tax treaties, distributions from the Funds will be characterized as dividends for federal income tax purposes (other than dividends which a Fund properly reports as capital gain dividends) and, other than exempt-interest dividends, will be subject to U.S. income taxes, including withholding taxes, subject to certain exceptions described below. However, distributions received by a foreign investor from a Fund that are properly reported by the Fund as capital gain dividends may not be subject to U.S. federal income taxes, including withholding taxes, provided that the Fund makes certain elections and certain other conditions are met. In the case of dividends with respect to taxable years of a Fund beginning prior to 2012, distributions from the Fund that are properly reported by the Fund as an interest-related dividend attributable to certain interest income received by the Fund or as a short-term capital gain dividend attributable to certain net short-term capital gain income received by the Fund may not be subject to U.S. federal income taxes, including withholding taxes when received by certain foreign investors, provided that the Fund makes certain elections and certain other conditions are met. Distributions after December 31, 2012 may be subject to a U.S. withholding tax of 30% in the case of distributions to (i) certain non-U.S. financial institutions that have not entered into an agreement with the U.S. Treasury to collect and disclose certain information and (ii) certain other non-U.S. entities that do not provide certain certifications and information about the entity’s U.S. owners.
State Tax Matters
The treatment of certain dividends from each Fund under particular state taxes is discussed below. It should be noted that this treatment may change if a Fund ever fails to qualify as a RIC for federal income tax purposes or if the exempt-interest dividends paid by a Fund are not excluded from gross income for federal income tax purposes. The discussion also assumes that each Fund will meet certain reporting and filing requirements under the applicable state laws and regulations. This discussion is based on state laws as enacted and construed on the date of this SAI and in certain cases is based on administrative guidance from state revenue departments. These laws and interpretations can, of course, change at any time. Only certain specific taxes are discussed below and Fund shares and Fund distributions may be subject to other state and local taxes. In addition, the discussions below are generally limited to Fund distributions attributable to certain tax-exempt interest. Generally, other distributions from a Fund are subject to all state income taxes, except that under certain circumstances, many states do provide exemptions for distributions attributable to interest on certain United States government obligations. Additionally, you may be subject to state income tax to the extent you sell or exchange Fund shares and realize a capital gain on the transaction.
Generally, unlike the federal individual income tax, state income taxes do not provide beneficial treatment of long-term capital gains, including capital gains dividends from a Fund. Further, most states restrict deductions for capital losses.
Ownership of shares in a Fund could result in other state and local income tax consequences to certain taxpayers. For example, interest expense incurred or continued to purchase or carry shares of a Fund, if the Fund distributes dividends exempt from a particular state income tax, generally is not deductible for purposes of that income tax.
Prospective investors should consult their tax advisors with respect to all state and local tax issues related to the ownership of shares in a Fund and the receipt of distributions from a Fund.
S-66
Colorado Tax Status
The assets of Colorado Tax Free Fund will consist of interest bearing obligations issued by or on behalf of the State of Colorado, a public authority, commission, board or other agency created by the State of Colorado or a political subdivision of the State of Colorado, or political subdivisions thereof (the “Colorado Bonds”) or by the government of Puerto Rico, Guam or the Virgin Islands (the “Possession Bonds,” and, collectively with the Colorado Bonds, the “Bonds”). The discussion in this section is based on the assumption that: (i) the Bonds were validly issued by the State of Colorado or its municipalities, or by the government of Puerto Rico, Guam or the Virgin Islands, as the case may be, (ii) the interest on the Bonds is excludable from gross income for federal income tax purposes, (iii) the interest on the Bonds is exempt from Colorado State taxes and with respect to the Colorado Bonds, such Colorado Bonds were either issued on or after May 1, 1980, or were issued before May 1, 1980 but the interest is specifically exempt from income taxation under the Colorado state laws authorizing the issuance of such obligations and (iv) with respect to the Possession Bonds, the Possession Bonds and the interest thereon are exempt from all state and local taxation. This disclosure does not address the taxation of persons other than full-time residents of the State of Colorado.
Exempt-interest dividends distributed by Colorado Tax Free Fund attributable to interest on the Bonds will be excluded from taxable income for purposes of the personal income tax imposed by the State of Colorado on individuals (the “Colorado Personal Income Tax”) and the corporate income tax imposed by the State of Colorado on certain corporations (the “Colorado Corporate Income Tax”); however, some of such exempt-interest dividends may be taken into account in determining the Colorado alternative minimum tax.
Distributions from Colorado Tax Free Fund, other than exempt-interest dividends attributable to interest on the Bonds, will generally be subject to the Colorado Personal Income Tax and the Colorado Corporate Income Tax.
You generally will be subject to tax for purposes of the Colorado Personal Income Tax and the Colorado Corporate Income Tax on the gain recognized on the sale or redemption of a share of Colorado Tax Free Fund.
You should be aware that, generally, interest on indebtedness incurred or continued to purchase or carry shares of Colorado Tax Free Fund is not deductible for purposes of the Colorado Personal Income Tax and the Colorado Corporate Income Tax.
Each of the Adviser, Nuveen Asset Management and their counsel has not independently examined the Bonds or the opinions of bond counsel rendered in connection with the issuance of the Bonds. Ownership of shares in Colorado Tax Free Fund may result in other Colorado consequences to certain taxpayers, and prospective investors should consult their tax advisors.
Minnesota Tax Status
The assets of the Minnesota Intermediate Municipal Bond Fund and Minnesota Municipal Bond Fund will consist of interest bearing obligations issued by or on behalf of the State of Minnesota and political subdivisions of the State of Minnesota (the “Minnesota Bonds”) or by the government of Puerto Rico, Guam or the Virgin Islands (the “Possession Bonds,” and, collectively with the Minnesota Bonds, the “Bonds”). The discussion in this section is based on the assumption that: (i) the Bonds were validly issued by the State of Minnesota or its political subdivisions, or by the government of Puerto Rico, Guam or the Virgin Islands, as the case may be, (ii) the interest on the Bonds is excludable from gross income for federal income tax purposes and (iii) with respect to the Possession Bonds, the Possession Bonds and the interest thereon are exempt from all state and local taxation. This disclosure does not address the taxation of persons other than full-time residents of the State of Minnesota.
Provided that Minnesota Intermediate Municipal Bond Fund and Minnesota Municipal Bond Fund meet certain requirements, including a requirement that at least 95 percent of the exempt-interest dividends from the Fund are derived from Minnesota Bonds, exempt-interest dividends distributed by Minnesota Intermediate Municipal Bond Fund and Minnesota Municipal Bond Fund attributable to
S-67
interest on the Bonds will be excluded from taxable income for purposes of the personal income tax (the “Minnesota Personal Income Tax”) imposed on individuals by the State of Minnesota; however, some of such exempt-interest dividends may be taken into account in determining the Minnesota alternative minimum tax. A “fund of funds” structure which would allow a regulated investment company to distribute exempt-interest dividends for federal income tax purposes, may not permit a fund to distribute exempt-interest dividends that are excluded from taxable income for purposes of the Minnesota Personal Income Tax.
The Minnesota state legislature has enacted a statement of intent that interest on the Minnesota Bonds should be subject to Minnesota state income taxation if it is judicially determined that the exemption provided under Minnesota law for Minnesota Bonds discriminates against interstate commerce, effective for the calendar year in which such a decision becomes final. It cannot be predicted whether a court would render such a decision or whether, as a result thereof, exempt-interest dividends distributed by Minnesota Intermediate Municipal Bond Fund and Minnesota Municipal Bond Fund would become subject to the Minnesota Personal Income Tax.
Distributions from Minnesota Intermediate Municipal Bond Fund and Minnesota Municipal Bond Fund, other than exempt-interest dividends attributable to interest on the Bonds, will generally be subject to the Minnesota Personal Income Tax. Distributions from Minnesota Intermediate Municipal Bond Fund and Minnesota Municipal Bond Fund, including exempt-interest dividends, will generally be subject to the franchise tax imposed by the state of Minnesota on certain corporations and other entities.
You generally will be subject to tax for purposes of the Minnesota Personal Income Tax on the gain recognized on the sale or redemption of a share of Minnesota Intermediate Municipal Bond Fund or Minnesota Municipal Bond Fund.
You should be aware that, generally, interest on indebtedness incurred or continued to purchase or carry shares of Minnesota Intermediate Municipal Bond Fund and Minnesota Municipal Bond Fund is not deductible for purposes of the Minnesota Personal Income Tax.
Each of the Adviser, Nuveen Asset Management and their counsel has not independently examined the Bonds or the opinions of bond counsel rendered in connection with the issuance of the Bonds. Ownership of shares in Minnesota Intermediate Municipal Bond Fund and Minnesota Municipal Bond Fund may result in other Minnesota consequences to certain taxpayers, and prospective investors should consult their tax advisors.
Missouri Tax Status
The assets of Missouri Tax Free Fund will consist of interest bearing obligations issued by or on behalf of the State of Missouri and political subdivisions thereof (the “Missouri Bonds”) or by the government of Puerto Rico, Guam or the Virgin Islands (the “Possession Bonds,” and, collectively with the Missouri Bonds, the “Bonds”). The discussion in this section is based on the assumption that: (i) the Bonds were validly issued by the State of Missouri or a political subdivision thereof, or by the government of Puerto Rico, Guam or the Virgin Islands, as the case may be, (ii) the interest on the Bonds is excludable from gross income for federal income tax purposes, and (iii) with respect to the Possession Bonds, the Possession Bonds and the interest thereon are exempt from all state and local taxation. This disclosure does not address the taxation of persons other than full-time residents of the State of Missouri.
Exempt-interest dividends distributed by Missouri Tax Free Fund that are excluded from gross income for federal income tax purposes and that are attributable to interest on the Bonds will be excluded from taxable income for purposes of the income tax imposed by the State of Missouri on individuals, trusts and estates (the “Missouri Personal Income Tax”) and the income tax imposed by the State of Missouri on certain corporations (the “Missouri Corporate Income Tax”) (not including banking institutions, credit institutions, credit unions and savings and loan associations), provided Missouri Tax Free Fund designates such dividends in an annual notice mailed to shareholders.
Distributions from Missouri Tax Free Fund, other than exempt-interest dividends attributable to interest on the Bonds, will generally be subject to the Missouri Personal Income Tax and the Missouri Corporate Income Tax.
S-68
Distributions from Missouri Tax Free Fund, including exempt-interest dividends attributable to interest on the Bonds, may be subject to the franchise taxes imposed on banking institutions, credit institutions, credit unions and savings and loan associations (the “Missouri Franchise Taxes”).
You generally will be subject to tax for purposes of the Missouri Personal Income Tax, the Missouri Corporate Income Tax and the Missouri Franchise Taxes on the gain recognized on the sale or redemption of a share of Missouri Tax Free Fund.
You should be aware that, generally, interest on indebtedness incurred or continued to purchase or carry shares of Missouri Tax Free Fund is not deductible for purposes of the Missouri Personal Income Tax and the Missouri Corporate Income Tax.
Each of the Adviser, Nuveen Asset Management and their counsel has not independently examined the Bonds or the opinions of bond counsel rendered in connection with the issuance of the Bonds. Ownership of shares in Missouri Tax Free Fund may result in other Missouri consequences to certain taxpayers, and prospective investors should consult their tax advisors.
Nebraska Tax Status
The assets of Nebraska Municipal Bond Fund will consist of interest bearing obligations issued by or on behalf of the State of Nebraska and political subdivisions thereof (the “Nebraska Bonds”) or by the government of Puerto Rico, Guam or the Virgin Islands (the “Possession Bonds,” and, collectively with the Nebraska Bonds, the “Bonds”). The discussion in this section is based on the assumption that: (i) the Bonds were validly issued by the State of Nebraska or a political subdivision thereof, or by the government of Puerto Rico, Guam or the Virgin Islands, as the case may be, (ii) the interest on the Bonds is excludable from gross income for federal income tax purposes, and (iii) with respect to the Possession Bonds, the Possession Bonds and the interest thereon are exempt from all state and local taxation. This disclosure does not address the taxation of persons other than full-time residents of the State of Nebraska.
Exempt-interest dividends distributed by Nebraska Municipal Bond Fund that are excluded from gross income for federal income tax purposes and that are attributable to and reported to shareholders as being derived from interest on the Bonds will be excluded from taxable income for purposes of the income tax imposed by the State of Nebraska on individuals (the “Nebraska Personal Income Tax”) and the income tax imposed by the State of Nebraska on certain corporations (the “Nebraska Corporate Income Tax”). However, dividends taken into account in determining a shareholder’s federal alternative minimum tax liability may affect a shareholder’s tax liability under the Nebraska Personal Income Tax.
Distributions from Nebraska Municipal Bond Fund, other than exempt-interest dividends attributable to interest on the Bonds, will generally be subject to the Nebraska Personal Income Tax and the Nebraska Corporate Income Tax.
Dividends from Nebraska Municipal Bond Fund could affect the maximum franchise tax rate imposed by the State of Nebraska on certain financial institutions.
You generally will be subject to tax for purposes of the Nebraska Personal Income Tax and the Nebraska Corporate Income Tax on the gain recognized on the sale or redemption of a share of Nebraska Municipal Bond Fund.
You should be aware that, generally, interest on indebtedness incurred or continued to purchase or carry shares of Nebraska Municipal Bond Fund is not deductible for purposes of the Nebraska Personal Income Tax and the Nebraska Corporate Income Tax.
Each of the Adviser, Nuveen Asset Management and their counsel has not independently examined the Bonds or the opinions of bond counsel rendered in connection with the issuance of the Bonds. Ownership of shares in Nebraska Municipal Bond Fund may result in other Nebraska consequences to certain taxpayers, and prospective investors should consult their tax advisors.
Ohio Tax Status
The assets of Ohio Tax Free Fund will consist of interest bearing obligations issued by or on behalf of the State of Ohio and political subdivisions thereof (the “Ohio Bonds”) or by the
S-69
government of Puerto Rico, Guam or the Virgin Islands (the “Possession Bonds,” and, collectively with the Ohio Bonds, the “Bonds”). The discussion in this section is based on the assumption that: (i) the Bonds were validly issued by the State of Ohio or a political subdivision thereof, or by the government of Puerto Rico, Guam or the Virgin Islands, as the case may be, (ii) the interest on the Bonds is excludable from gross income for federal income tax purposes, (iii) with respect to the Possession Bonds, the Possession Bonds and the interest thereon are exempt from all state and local taxation and (iv) Ohio Tax Free Fund qualifies as a qualified investment trust under the Ohio Revised Code and meets the reporting requirements specified therein. This disclosure does not address the taxation of persons other than full-time residents of the State of Ohio.
Exempt-interest dividends distributed by Ohio Tax Free Fund that are excluded from gross income for federal income tax purposes and that are attributable to interest on the Bonds will be excluded from taxable income for purposes of (a) the Ohio income tax imposed by the State of Ohio on individuals (the “Ohio Personal Income Tax”) and (b) the net income base (the “Ohio Corporate Net Income Tax”) used in calculating the taxes levied on those corporations subject to the corporate franchise taxes imposed by the State of Ohio under Chapter 5733 of the Ohio Revised Code.
Shares of Ohio Tax Free Fund and distributions from Ohio Tax Free Fund, including exempt-interest dividends attributable to interest on the Bonds will generally be included in the total asset value base (the “Ohio Corporate Net Worth Tax”) used in calculating the taxes levied on those corporations subject to the corporate franchise taxes imposed by the State of Ohio under Chapter 5733 of the Ohio Revised Code.
Based on interpretations of Ohio law by the Tax Commissioner of Ohio, capital gain dividends distributed by Ohio Tax Free Fund that are attributable to capital gains on the Ohio Bonds should be excluded from taxable income for purposes of the Ohio Personal Income Tax and the Ohio Corporate Net Income Tax. Capital gain dividends attributable to capital gains on the Possession Bonds will not be excluded from taxable income for these purposes.
Distributions from Ohio Tax Free Fund, other than exempt-interest dividends attributable to interest on the Bonds and other than capital gain dividends attributable to capital gains on the Ohio Bonds, generally will be subject to the Ohio Personal Income Tax and the Ohio Corporate Net Income Tax.
You generally will be subject to tax for purposes of the Ohio Personal Income Tax, the Ohio Corporate Net Income Tax and the Ohio Corporate Net Worth Tax on the gain recognized on the sale or redemption of a share of Ohio Tax Free Fund.
You should be aware that, generally, interest on indebtedness incurred or continued to purchase or carry shares of Ohio Tax Free Fund is not deductible for purposes of the Ohio Personal Income Tax, the Ohio Corporate Net Income Tax and the Ohio Corporate Net Worth Tax.
Each of the Adviser, Nuveen Asset Management and their counsel has not independently examined the Bonds or the opinions of bond counsel rendered in connection with the issuance of the Bonds. Ownership of shares in Ohio Tax Free Fund may result in other Ohio consequences to certain taxpayers, and prospective investors should consult their tax advisors.
Oregon Tax Status
The assets of Oregon Intermediate Municipal Bond Fund will consist of interest bearing obligations issued by or on behalf of the State of Oregon and political subdivisions of the State of Oregon (the “Oregon Bonds”) or by the government of Puerto Rico, Guam or the Virgin Islands (the “Possession Bonds,” and, collectively with the Oregon Bonds, the “Bonds”). The discussion in this section is based on the assumption that: (i) the Bonds were validly issued by the State of Oregon or its political subdivisions, or by the government of Puerto Rico, Guam or the Virgin Islands, as the case may be, (ii) the interest on the Bonds is excludable from gross income for federal income tax purposes and (iii) with respect to the Possession Bonds, the Possession Bonds and the interest thereon are exempt from all state and local taxation. This disclosure does not address the taxation of persons other than full-time residents of the State of Oregon.
Exempt-interest dividends distributed by Oregon Intermediate Municipal Bond Fund attributable to interest on the Bonds will be excluded from taxable income for purposes of the personal income tax imposed by the State of Oregon on individuals (the “Oregon Personal Income Tax”).
S-70
Distributions from Oregon Intermediate Municipal Bond Fund, other than exempt-interest dividends attributable to interest on the Bonds, will generally be subject to the Oregon Personal Income Tax. Distributions from Oregon Intermediate Municipal Bond Fund, including exempt-interest dividends, will generally be subject to the excise tax and the income tax imposed by the state of Oregon on certain corporations and other entities.
You generally will be subject to tax for purposes of the Oregon Personal Income Tax on the gain recognized on the sale or redemption of a share of Oregon Intermediate Municipal Bond Fund.
You should be aware that, generally, interest on indebtedness incurred or continued to purchase or carry shares of Oregon Intermediate Municipal Bond Fund is not deductible for purposes of the Oregon Personal Income Tax.
Each of the Adviser, Nuveen Asset Management and their counsel has not independently examined the Bonds or the opinions of bond counsel rendered in connection with the issuance of the Bonds. Ownership of shares in Oregon Intermediate Municipal Bond Fund may result in other Oregon consequences to certain taxpayers, and prospective investors should consult their tax advisors.
PURCHASE AND REDEMPTION OF FUND SHARES
As described in the Prospectus, the Funds provide you with alternative ways of purchasing Fund shares based upon your individual investment needs and preferences. The Funds are generally not a suitable investment for individuals investing through retirement plans.
Each class of shares of a Fund represents an interest in the same portfolio of investments. Each class of shares is identical in all respects except that each class bears its own class expenses, including distribution and administration expenses, and each class has exclusive voting rights with respect to any distribution or service plan applicable to its shares. As a result of the differences in the expenses borne by each class of shares, net income per share, dividends per share and net asset value per share will vary among a Fund’s classes of shares. There are no conversion, preemptive or other subscription rights.
Shareholders of each class will share expenses proportionately for services that are received equally by all shareholders. A particular class of shares will bear only those expenses that are directly attributable to that class, where the type or amount of services received by a class varies from one class to another. For example, class-specific expenses generally will include distribution and service fees for those classes that pay such fees.
The expenses to be borne by specific classes of shares may include (i) transfer agency fees attributable to a specific class of shares, (ii) printing and postage expenses related to preparing and distributing materials such as shareholder reports, prospectuses and proxy statements to current shareholders of a specific class of shares, (iii) SEC and state securities registration fees incurred by a specific class of shares, (iv) the expense of administrative personnel and services required to support the shareholders of a specific class of shares, (v) litigation or other legal expenses relating to a specific class of shares, (vi) directors’ fees or expenses incurred as a result of issues relating to a specific class of shares, (vii) accounting expenses relating to a specific class of shares and (viii) any additional incremental expenses subsequently identified and determined to be properly allocated to one or more classes of shares.
Class A shares may be purchased at a public offering price equal to the applicable net asset value per share plus an up-front sales charge imposed at the time of purchase as set forth in the Prospectus. Shareholders may qualify for a reduced sales charge, or the sales charge may be waived in its entirety, as described below. Nuveen Mutual Funds currently utilize two transfer agents and the ability to use the methods described below to reduce your sales charge is limited to aggregating values or purchases of funds that have the same transfer agent. Class A shares of the Funds are also subject to an annual service fee of 0.20%. See “Distribution and Service Plans.”
S-71
Reduction or Elimination of Up-Front Sales Charge on Class A Shares
Rights of Accumulation
You may qualify for a reduced sales charge on a purchase of Class A shares of a Fund if the amount of your purchase, when added to the value that day of all of your shares of any Nuveen Mutual Fund, falls within the amounts stated in the Class A Sales Charges and Commissions table in “How You Can Buy and Sell Shares” in the Prospectus. You or your financial advisor must notify the Distributor or the Fund’s transfer agent of any cumulative discount whenever you plan to purchase Class A shares of a Fund that you wish to qualify for a reduced sales charge.
Letter of Intent
You may qualify for a reduced sales charge on a purchase of Class A shares of a Fund if you plan to purchase Class A shares of Nuveen Mutual Funds over the next 13 months and the total amount of your purchases would, if purchased at one time, qualify you for one of the reduced sales charges shown in the Class A Sales Charges and Commissions table in “How You Can Buy and Sell Shares” in the Prospectus. In order to take advantage of this option, you must complete the applicable section of the Application Form or sign and deliver to your financial advisor or other financial intermediary or to the Fund’s transfer agent a written Letter of Intent in a form acceptable to the Distributor. A Letter of Intent states that you intend, but are not obligated, to purchase over the next 13 months a stated total amount of Class A shares that would qualify you for a reduced sales charge shown above. You may count shares of all Nuveen Mutual Funds that you already own and any Class I and Class C shares of a Nuveen Mutual Fund that you purchase over the next 13 months towards completion of your investment program, but you will receive a reduced sales charge only on new Class A shares you purchase with a sales charge over the 13 months. You cannot count towards completion of your investment program Class A shares that you purchase without a sales charge through investment of distributions from a Nuveen Mutual Fund or a Nuveen Defined Portfolio, or otherwise.
By establishing a Letter of Intent, you agree that your first purchase of Class A shares of a Fund following execution of the Letter of Intent will be at least 5% of the total amount of your intended purchases. You further agree that shares representing 5% of the total amount of your intended purchases will be held in escrow pending completion of these purchases. All dividends and capital gains distributions on Class A shares held in escrow will be credited to your account. If total purchases, less redemptions, prior to the expiration of the 13 month period equal or exceed the amount specified in your Letter of Intent, the Class A shares held in escrow will be transferred to your account. If the total purchases, less redemptions, are less than the amount specified, you must pay the Distributor an amount equal to the difference between the amounts paid for these purchases and the amounts which would have been paid if the higher sales charge had been applied. If you do not pay the additional amount within 20 days after written request by the Distributor or your financial advisor, the Distributor will redeem an appropriate number of your escrowed Class A shares to meet the required payment. By establishing a Letter of Intent, you irrevocably appoint the Distributor as attorney to give instructions to redeem any or all of your escrowed shares, with full power of substitution in the premises.
You or your financial advisor must notify the Distributor or the Funds’ transfer agent whenever you make a purchase of Fund shares that you wish to be covered under the Letter of Intent option.
For purposes of determining whether you qualify for a reduced sales charge as described under Rights of Accumulation and Letter of Intent, you may include together with your own purchases those made by your spouse or domestic partner and your children under the age of 21 years, whether these purchases are made through a taxable or non-taxable account. You may also include purchases made by a corporation, partnership or sole proprietorship which is 100% owned, either alone or in combination, by any of the foregoing. In addition, a trustee or other fiduciary can count all shares purchased for a single trust, estate or other single fiduciary account that has multiple accounts (including one or more employee benefit plans of the same employer).
S-72
Elimination of Sales Charge on Class A Shares
Class A shares of a Fund may be purchased at net asset value without a sales charge by the following categories of investors:
| • | investors purchasing $1,000,000 or more; |
| • | trustees and former trustees of the Nuveen Funds; |
| • | full-time and retired employees of Nuveen Investments, and subsidiaries thereof, or their immediate family members (immediate family members are defined as their spouses or domestic partners, parents, children, grandparents, grandchildren, parents-in-law, sons-and daughters-in-law, siblings, a sibling’s spouse and a spouse’s siblings); |
| • | any person who, for at least the last 90 days, has been an officer, director or employee of any financial intermediary, or their immediate family members; |
| • | bank or broker-affiliated trust departments investing funds over which they exercise exclusive discretionary investment authority and that are held in a fiduciary, agency, advisory, custodial or similar capacity; |
| • | investors purchasing on a periodic fee, asset-based fee or no transaction fee basis through a broker-dealer sponsored mutual fund purchase program; and |
| • | clients of investment advisers, financial planners or other financial intermediaries that charge periodic or asset-based fees for their services. |
Any Class A shares purchased pursuant to a special sales charge waiver must be acquired for investment purposes and on the condition that they will not be transferred or resold except through redemption by the Funds. You or your financial advisor must notify the Distributor or the Funds’ transfer agent whenever you make a purchase of Class A shares of any Fund that you wish to be covered under these special sales charge waivers.
Class A shares of any Fund may be issued at net asset value without a sales charge in connection with the acquisition by a Fund of another investment company. All purchases under the special sales charge waivers will be subject to minimum purchase requirements as established by the Funds.
The reduced sales charge programs may be modified or discontinued by the Funds at any time. For more information about the purchase of Class A shares or the reduced sales charge program, or to obtain the required application forms, call Nuveen Investor Services toll-free at (800) 257-8787.
You may purchase Class C shares at a public offering price equal to the applicable net asset value per share without any up-front sales charge. Class C shares are subject to an annual distribution fee of 0.55% to compensate the Distributor for paying your financial advisor or other financial intermediary an ongoing sales commission. Class C shares are also subject to an annual service fee of 0.20% to compensate financial intermediaries for providing you with ongoing financial advice and other account services. The Distributor compensates financial intermediaries for sales of Class C shares at the time of the sale at a rate of 1% of the amount of Class C shares purchased, which represents an advance of the first year’s distribution fee of 0.75% plus an advance on the first year’s annual service fee of 0.25%. See “Distribution and Service Plans.”
Class C share purchase orders equaling or exceeding $1,000,000 will not be accepted. In addition, purchase orders for a single purchaser that, when added to the value that day of all of such purchaser’s shares of any class of any Nuveen Mutual Fund, cause the purchaser’s cumulative total of shares in Nuveen Mutual Funds to equal or exceed the aforementioned limit will not be accepted. Purchase orders for a single purchaser equal to or exceeding the foregoing limit should be placed only for Class A shares, unless such purchase has been reviewed and approved as suitable for the client by the appropriate compliance personnel of the financial intermediary, and the Fund receives written confirmation of such approval.
Redemption of Class C shares within 12 months of purchase may be subject to a Contingent Deferred Sales Charge (“CDSC”) of 1% of the lower of the purchase price or redemption proceeds.
S-73
Because Class C shares do not convert to Class A shares and continue to pay an annual distribution fee indefinitely, Class C shares should normally not be purchased by an investor who expects to hold shares for significantly longer than eight years.
Class C1 shares are not available for new accounts or for additional investment into existing accounts, but Class C1 shares can be issued for purposed of dividend reinvestment. Class C1 shares are also subject to an annual service fee of 0.25% to compensate financial intermediaries for providing you with ongoing financial advice and other account services. The Distributor compensates financial intermediaries for sales of Class C1 shares at the time of the sale at a rate of 0.65% of the amount of Class C1 shares purchased, which represents an advance of the first year’s distribution fee of 0.40% plus an advance on the first year’s annual service fee of 0.25%. See “Distribution and Service Plans.”
Class C1 share purchase orders equaling or exceeding $1,000,000 will not be accepted. In addition, purchase orders for a single purchaser that, when added to the value that day of all of such purchaser’s shares of any class of any Nuveen Mutual Fund, cause the purchaser’s cumulative total of shares in Nuveen Mutual Funds to equal or exceed the aforementioned limit will not be accepted. Purchase orders for a single purchaser equal to or exceeding the foregoing limit should be placed only for Class A shares, unless such purchase has been reviewed and approved as suitable for the client by the appropriate compliance personnel of the financial intermediary, and the Fund receives written confirmation of such approval.
Redemption of Class C1 shares within 12 months of purchase may be subject to a CDSC of 1% of the lower of the purchase price or redemption proceeds. Because Class C1 shares do not convert to Class A shares and continue to pay an annual distribution fee indefinitely, Class C1 shares should normally not be purchased by an investor who expects to hold shares for significantly longer than eight years.
Reduction or Elimination of Contingent Deferred Sales Charge
Class A shares are normally redeemed at net asset value, without any CDSC. However, in the case of Class A shares purchased at net asset value without a sales charge because the purchase amount exceeded $1 million, a CDSC is imposed on any redemption within 18 months of purchase. Class C and Class C1 shares are redeemed at net asset value, without any CDSC, except that a CDSC of 1% is imposed upon any redemption within 12 months of purchase (except in cases where the shareholder’s financial advisor agreed to waive the right to receive an advance of the first year’s distribution and service fee).
In determining whether a CDSC is payable, each Fund will first redeem shares not subject to any charge and then will redeem shares held for the longest period, unless the shareholder specifies another order. No CDSC is charged on shares purchased as a result of automatic reinvestment of dividends or capital gains paid. In addition, no CDSC will be charged on exchanges of shares into another Nuveen Mutual Fund. The holding period is calculated on a monthly basis and begins on the first day of the month in which the purchase was made. The CDSC is assessed on an amount equal to the lower of the then current market value or the cost of the shares being redeemed. Accordingly, no sales charge is imposed on increases of net asset value above the initial purchase price. The Distributor receives the amount of any CDSC shareholders pay.
The CDSC may be waived or reduced under the following circumstances: (i) in the event of total disability (as evidenced by a determination by the federal Social Security Administration) of the
shareholder (including a registered joint owner) occurring after the purchase of the shares being redeemed; (ii) in the event of the death of the shareholder (including a registered joint owner); (iii) for redemptions made pursuant to a systematic withdrawal plan, up to 1% monthly, 3% quarterly, 6% semiannually or 12% annually of an account’s net asset value depending on the frequency of the plan as designated by the shareholder; (iv) involuntary redemptions caused by operation of law; (v) redemptions in connection with a payment of account or plan fees; (vi) redemptions in connection with the exercise of a reinstatement privilege whereby the proceeds of a redemption of a Fund’s shares subject to a sales charge are reinvested in shares of certain Funds within a specified number of days; (vii) redemptions in connection with the exercise of a Fund’s right to redeem all shares in an
S-74
account that does not maintain a certain minimum balance or that the Board of Directors has determined may have material adverse consequences to the shareholders of a Fund; (viii) in whole or in part for redemptions of shares by shareholders with accounts in excess of specified breakpoints that correspond to the breakpoints under which the up-front sales charge on Class A shares is reduced pursuant to Rule 22d-1 under the Act; (ix) redemptions of shares purchased under circumstances or by a category of investors for which Class A shares could be purchased at net asset value without a sales charge; (x) redemptions of Class A, Class B, Class C or Class C1 shares if the proceeds are transferred to an account managed by the Adviser and the Adviser refunds the advanced service and distribution fees to the Distributor; (xi) redemptions of Class C shares in cases where the Distributor did not advance the first year’s service and distribution fees when such shares were purchased; and (xii) redemptions of Class A shares where the Distributor did not pay a sales commission when such shares were purchased. If a Fund waives or reduces the CDSC, such waiver or reduction would be uniformly applied to all Fund shares in the particular category. In waiving or reducing a CDSC, the Funds will comply with the requirements of Rule 22d-1 under the 1940 Act.
Class I shares are available for purchase by clients of financial intermediaries who charge such clients an ongoing fee for advisory, investment, consulting or related services. Such clients may include individuals, corporations, endowments and foundations. The minimum initial investment for such clients is $100,000, but this minimum will be lowered to $250 for clients of financial intermediaries that have accounts holding Class I shares with an aggregate value of at least $100,000. The Distributor may also lower the minimum to $250 for clients of financial intermediaries anticipated to reach this Class I share holdings level.
Class I shares are also available for purchase by family offices and their clients. A family office is a company that provides certain financial and other services to a high net worth family or families. The minimum initial investment for family offices and their clients is $100,000, but this minimum will be lowered to $250 for clients of family offices that have accounts holding Class I shares with an aggregate value of at least $100,000. The Distributor may also lower the minimum to $250 for clients of family offices anticipated to reach this Class I share holdings level.
Class I shares also are available for purchase, with no minimum initial investment, by the following categories of investors:
| • | bank or broker-affiliated trust departments investing funds over which they exercise exclusive discretionary investment authority and that are held in a fiduciary, agency, advisory, custodial or similar capacity; |
| • | Advisory accounts of Nuveen Fund Advisors and its affiliates, including other Nuveen Mutual Funds whose investment policies permit investments in other investment companies; |
| • | trustees/directors and former trustees/directors of any Nuveen Fund, and their immediate family members (“immediate family members” are defined as spouses or domestic partners, parents, children, grandparents, grandchildren, parents-in-law, sons- and daughters-in-law, siblings, a sibling’s spouse and a spouse’s siblings); |
| • | officers, directors and former directors of Nuveen Investments and its affiliates, and their immediate family members; |
| • | full-time and retired employees of Nuveen Investments and its affiliates, and their immediate family members; and |
| • | any person who, for at least the last 90 days, has been an officer, director or employee of any financial intermediary, and their immediate family members. |
Any shares purchased by investors falling within any of the last four categories listed above must be acquired for investment purposes and on the condition that they will not be transferred or resold except through redemption by a Fund.
S-75
Holders of Class I shares may purchase additional Class I shares using dividends and capital gains distributions on their shares.
In addition, shareholders of Nuveen Defined Portfolios may reinvest their distributions in Class I shares, if, before September 6, 1994 (or before June 13, 1995 in the case of Nuveen Intermediate Duration Municipal Bond Fund), such shareholders had elected to reinvest distributions in Nuveen Mutual Fund shares.
If you are eligible to purchase either Class I shares or Class A shares without a sales charge at net asset value, you should be aware of the differences between these two classes of shares. Class A shares are subject to an annual service fee to compensate financial intermediaries for providing you with ongoing account services. Class I shares are not subject to a distribution or service fee and, consequently, holders of Class I shares may not receive the same types or levels of services from financial intermediaries. In choosing between Class A shares and Class I shares, you should weigh the benefits of the services to be provided by financial intermediaries against the annual service fee imposed upon the Class A shares.
Exchange Privilege
Nuveen Mutual Funds currently utilize two transfer agents. Until November 30, 2011, if you hold your shares directly with a Fund, you may exchange shares of a class of a Fund for shares of the same class of any other Nuveen Mutual Fund with reciprocal exchange privileges, at net asset value without a sales charge, by either sending a written request to the applicable Fund, c/o Nuveen Investor Services, P.O. Box 701, Milwaukee, Wisconsin 53201-0701 or by calling Nuveen Investor Services toll free at (800) 257-8787. If your shares are held with a financial intermediary, the financial intermediary must have the operational capability to support exchanges. The shares to be purchased through an exchange must be offered in your state of residence. The total value of exchanged shares must at least equal the minimum investment requirement of the Nuveen Mutual Fund being purchased. You may also, under certain limited circumstances, exchange between certain classes of shares of the same Fund. An exchange between classes of shares of the same Fund may not be considered a taxable event; please consult your own tax advisor for further information. An exchange between classes of shares of the same Fund may be done in writing to the address stated above.
Effective December 1, 2011, you may exchange fund shares into an identically registered account for the same class of another Nuveen Mutual Fund available in your state provided that the funds have the same transfer agent. Exchanges between funds with different transfer agents are not allowed. Your exchange must meet the minimum purchase requirements of the fund into which you are exchanging. You may also, under certain limited circumstances, exchange between certain classes of shares of the same Fund. An exchange between classes of shares of the same Fund may not be considered a taxable event; please consult your own tax advisor for further information.
If you hold your shares directly with the Fund, you will continue to be able to exchange your shares by either sending written request to the applicable Fund, c/o Nuveen Investor Services, P.O. Box 701, Milwaukee, Wisconsin 53201-0701 or by calling Nuveen Investor Services toll free at (800) 257-8787.
If you exchange shares between different Nuveen Mutual Funds and your shares are subject to a CDSC, no CDSC will be charged at the time of the exchange. However, if you subsequently redeem the shares acquired through the exchange, the redemption may be subject to a CDSC, depending on when you purchased your original shares and the CDSC schedule of the fund from which you exchanged your shares. If you exchange between classes of shares of the same Fund and your original shares are subject to a CDSC, the CDSC will be assessed at the time of the exchange.
For federal income tax purposes, an exchange between different Nuveen Mutual Funds constitutes a sale and purchase of shares and may result in capital gain or loss. Before making any exchange, you should obtain the Prospectus for the Nuveen Mutual Fund you are purchasing and read it carefully. If the registration of the account for the Fund you are purchasing is not exactly the same as that of the fund account from which the exchange is made, written instructions from all
S-76
holders of the account from which the exchange is being made must be received, with signatures guaranteed by a member of an approved Medallion Guarantee Program or in such other manner as may be acceptable to the Fund. You may also exchange shares by telephone if you authorize telephone exchanges by checking the applicable box on the Application Form or by calling Nuveen Investor Services toll-free at (800) 257-8787 to obtain an authorization form. Each Fund reserves the right to revise or suspend the exchange privilege, limit the amount or number of exchanges, or reject any exchange. Shareholders will be provided with at least 60 days’ notice of any material revision to or termination of the exchange privilege.
The exchange privilege is not intended to permit a Fund to be used as a vehicle for short-term trading. Excessive exchange activity may interfere with portfolio management, raise expenses and otherwise have an adverse effect on all shareholders. In order to limit excessive exchange activity and in other circumstances where Fund management believes doing so would be in the best interest of the Fund, each Fund reserves the right to revise or terminate the exchange privilege, or limit the amount or number of exchanges or reject any exchange. Shareholders would be notified of any such action to the extent required by law. See “Frequent Trading Policy” below.
Reinstatement Privilege
If you redeemed Class A, Class C or Class C1 shares of a Fund or any other Nuveen Mutual Fund that were subject to a sales charge or a CDSC, you have up to one year to reinvest all or part of the full amount of the redemption in the same class of shares of the Fund at net asset value. Nuveen Mutual Funds currently utilize two transfer agents. The reinstatement privilege is limited to reinvestment in a fund which has the same transfer agent as the fund from which you redeemed. This reinstatement privilege can be exercised only once for any redemption, and reinvestment will be made at the net asset value next calculated after reinstatement of the appropriate class of Fund shares. If you reinstate shares that were subject to a CDSC, your holding period as of the redemption date also will be reinstated for purposes of calculating a CDSC and the CDSC paid at redemption will be refunded. The federal income tax consequences of any capital gain realized on a redemption will not be affected by reinstatement, but a capital loss may be disallowed in whole or in part depending on the timing, the amount of the reinvestment and the fund from which the redemption occurred.
Suspension of Right of Redemption
Each Fund may suspend the right of redemption of Fund shares or delay payment more than seven days (a) during any period when the NYSE is closed (other than customary weekend and holiday closings), (b) when trading in the markets the Fund normally utilizes is restricted or an emergency exists as determined by the SEC so that trading of the Fund’s investments or determination of its net asset value is not reasonably practicable, or (c) for any other periods that the SEC by order may permit for protection of Fund shareholders.
Redemption In-Kind
The Funds have reserved the right to redeem in-kind (that is, to pay redemption requests in cash and portfolio securities, or wholly in portfolio securities), although the Funds have no present intention to redeem in-kind. The Funds voluntarily have committed to pay in cash all requests for redemption by any shareholder, limited as to each shareholder during any 90-day period to the lesser of $250,000 or 1% of the net asset value of a Fund at the beginning of the 90-day period.
The Funds’ Frequent Trading Policy is as follows:
Nuveen Mutual Funds are intended as long-term investments and not as short-term trading vehicles. At the same time, the Funds recognize the need of investors to periodically make purchases and redemptions of Fund shares when rebalancing their portfolios and as their financial needs or circumstances change. Nuveen Mutual Funds have adopted the following Frequent Trading Policy that seeks to balance these needs against the potential for higher operating costs, portfolio management disruption and other inefficiencies that can be caused by excessive trading of Fund shares.
S-77
1. Definition of Round Trip
A Round Trip trade is the purchase and subsequent redemption of Fund shares, including by exchange. Each side of a Round Trip trade may be comprised of either a single transaction or a series of closely-spaced transactions.
2. Round Trip Trade Limitations
Nuveen Mutual Funds limit the frequency of Round Trip trades that may be placed in a Fund. Subject to certain exceptions noted below, the Funds limit an investor to four Round Trips per trailing 12-month period and may also restrict the trading privileges of an investor who makes a Round Trip within a 30-day period if the purchase and redemption are of substantially similar dollar amounts and represent at least 25% of the value of the investor’s account.
3. Enforcement
Trades placed in violation of the foregoing policies are subject to rejection or cancellation by Nuveen Mutual Funds. Nuveen Mutual Funds may also bar an investor (and/or the investor’s financial advisor) who has violated these policies from opening new accounts with the Funds and may restrict the investor’s existing account(s) to redemptions only. Nuveen Mutual Funds reserve the right, in their sole discretion, to (a) interpret the terms and application of these policies, (b) waive unintentional or minor violations (including transactions below certain dollar thresholds) if Nuveen Mutual Funds determine that doing so does not harm the interests of Fund shareholders, and (c) exclude certain classes of redemptions from the application of the trading restrictions set forth above.
Nuveen Mutual Funds reserve the right to impose restrictions on purchases or exchanges that are more restrictive than those stated above if they determine, in their sole discretion, that a proposed transaction or series of transactions involve market timing or excessive trading that is likely to be detrimental to the Funds. The Funds may also modify or suspend the Frequent Trading Policy without notice during periods of market stress or other unusual circumstances.
The ability of Nuveen Mutual Funds to implement the Frequent Trading Policy for omnibus accounts at certain financial intermediaries may be dependent on receiving from those intermediaries sufficient shareholder information to permit monitoring of trade activity and enforcement of the Funds’ Frequent Trading Policy. In addition, the Funds may rely on a financial intermediary’s policy to restrict market timing and excessive trading if the Funds believe that the policy is reasonably designed to prevent market timing that is detrimental to the Funds. Such policy may be more or less restrictive than the Funds’ Policy. The Funds cannot ensure that these financial intermediaries will in all cases apply the Funds’ policy or their own policies, as the case may be, to accounts under their control.
Exclusions from the Frequent Trading Policy
As stated above, certain redemptions are eligible for exclusion from the Frequent Trading Policy, including: (i) redemptions or exchanges by shareholders investing through the fee-based platforms of certain financial intermediaries (where the intermediary charges an asset-based or comprehensive “wrap” fee for its services) that are effected by the financial intermediaries in connection with systematic portfolio rebalancing; (ii) when there is a verified trade error correction, which occurs when a dealer firm sends a trade to correct an earlier trade made in error and then the firm sends an explanation to the Nuveen Mutual Funds confirming that the trade is actually an error correction; (iii) in the event of total disability (as evidenced by a determination by the federal Social Security Administration) of the shareholder (including a registered joint owner) occurring after the purchase of the shares being redeemed; (iv) in the event of the death of the shareholder (including a registered joint owner); (v) redemptions made pursuant to a systematic withdrawal plan, up to 1% monthly, 3% quarterly, 6% semiannually or 12% annually of an account’s net asset value depending on the frequency of the plan as designated by the shareholder; (vi) redemptions of shares that were purchased through a systematic investment program; (vii) involuntary redemptions caused by operation of law; (viii) redemptions in connection with a payment of account or plan fees; (ix) redemptions or exchanges by any “fund of funds” advised by the Adviser; and (x) redemptions in connection with the exercise of a Fund’s right to redeem all shares in an account that does not maintain a certain minimum balance or that the applicable board has determined may have material adverse consequences to the shareholders of a Fund.
S-78
In addition, the following redemptions of shares by an employer-sponsored qualified defined contribution retirement plan are excluded from the Frequent Trading Policy: (i) partial or complete redemptions in connection with a distribution without penalty under Section 72(t) of the Code from a retirement plan: (a) upon attaining age 59 1/2; (b) as part of a series of substantially equal periodic payments; or (c) upon separation from service and attaining age 55; (ii) partial or complete redemptions in connection with a qualifying loan or hardship withdrawal; (iii) complete redemptions in connection with termination of employment, plan termination, transfer to another employer’s plan or IRA or changes in a plan’s recordkeeper; and (iv) redemptions resulting from the return of an excess contribution. Also, the following redemptions of shares held in an IRA account are excluded from the application of the Frequent Trading Policy: (i) redemptions made pursuant to an IRA systematic withdrawal based on the shareholder’s life expectancy including, but not limited to, substantially equal periodic payments described in Code Section 72(t)(A)(iv) prior to age 59 1/2; and (ii) redemptions to satisfy required minimum distributions after age 70 1/2 from an IRA account.
The financial statements of NIF included in its Annual Report to shareholders for the fiscal period ended May 31, 2011 and the financial statements included in its Semi-Annual Report to shareholders for the fiscal period ended December 31, 2010 are incorporated herein by reference.
S-79
RATING OF INVESTMENTS
Standard & Poor’s Ratings Group—A brief description of the applicable Standard & Poor’s (“S&P”) rating symbols and their meanings (as published by S&P) follows:
Issue Credit Ratings
A S&P issue credit rating is a forward looking opinion about the creditworthiness of an obligor with respect to a specific financial obligation, a specific class of financial obligations, or a specific financial program (including ratings on medium-term note programs and commercial paper programs). It takes into consideration the creditworthiness of guarantors, insurers, or other forms of credit enhancement on the obligation and takes into account the currency in which the obligation is denominated.
The opinion reflects S&P’s view of the obligor’s capacity and willingness to meet its financial commitments as they come due, and may assess terms, such as collateral security and subordination, which could affect ultimate payment in the event of default.
Issue credit ratings can be either long-term or short-term. Short-term ratings are generally assigned to those obligations considered short-term in the relevant market. In the U.S., for example, that means obligations with an original maturity of no more than 365 days-including commercial paper. Short-term ratings are also used to indicate the creditworthiness of an obligor with respect to put features on long-term obligations. The result is a dual rating, in which the short-term rating addresses the put feature, in addition to the usual long-term rating. Medium-term notes are assigned long-term ratings.
Long-Term Issue Credit Ratings
Issue credit ratings are based, in varying degrees, on the following considerations:
| 1. | Likelihood of payment—capacity and willingness of the obligor to meet its financial commitment on an obligation in accordance with the terms of the obligation; |
| 2. | Nature of and provisions of the obligation; |
| 3. | Protection afforded by, and relative position of, the obligation in the event of bankruptcy, reorganization, or other arrangement under the laws of bankruptcy and other laws affecting creditors’ rights. |
Issue rating are an assessment of default risk, but may incorporate an assessment of relative seniority or ultimate recovery in the event of default. Junior obligations are typically rated lower than senior obligations, to reflect the lower priority in bankruptcy, as noted above. (Such differentiation may apply when an entity has both senior and subordinated obligations, secured and unsecured obligations, or operating company and holding company obligations.)
| AAA | An obligation rated ‘AAA’ has the highest rating assigned by S&P. The obligor’s capacity to meet its financial commitment on the obligation is extremely strong. |
| AA | An obligation rated ‘AA’ differs from the highest rated obligations only to a small degree. The obligor’s capacity to meet its financial commitment on the obligation is very strong. |
| A | An obligation rated ‘A’ is somewhat more susceptible to the adverse effects of changes in circumstances and economic conditions than obligations in higher-rated categories. However, the obligor’s capacity to meet its financial commitment on the obligation is still strong. |
| BBB | An obligation rated ‘BBB’ exhibits adequate protection parameters. However, adverse economic conditions or changing circumstances are more likely to lead to a weakened capacity of the obligor to meet its financial commitment on the obligation. |
Obligations rated ‘BB’, ‘B’, ‘CCC’, ‘CC’ and ‘C’ are regarded as having significant speculative characteristics. ‘BB’ indicates the least degree of speculation and ‘C’ the highest. While such
A-1
obligations will likely have some quality and protective characteristics, these may be outweighed by large uncertainties or major exposures to adverse conditions.
| BB | An obligation rated ‘BB’ is less vulnerable to nonpayment than other speculative issues. However, it faces major ongoing uncertainties or exposure to adverse business, financial, or economic conditions which could lead to the obligor’s inadequate capacity to meet its financial commitment on the obligation. |
| B | An obligation rated ‘B’ is more vulnerable to nonpayment than obligations rated ‘BB’, but the obligor currently has the capacity to meet its financial commitment on the obligation. Adverse business, financial, or economic conditions will likely impair the obligor’s capacity or willingness to meet its financial commitment on the obligation. |
| CCC | An obligation rated ‘CCC’ is currently vulnerable to nonpayment, and is dependent upon favorable business, financial, and economic conditions for the obligor to meet its financial commitment on the obligation. In the event of adverse business, financial, or economic conditions, the obligor is not likely to have the capacity to meet its financial commitment on the obligation. |
| CC | An obligation rated ‘CC’ is currently highly vulnerable to nonpayment. |
| C | A ‘C’ rating is assigned to obligations that are currently highly vulnerable to nonpayment, obligations that have payment arrearages allowed by the terms of the documents, or obligations of an issuer that is the subject of a bankruptcy petition or similar action which have not experienced a payment default. Among others, the ‘C’ rating may be assigned to subordinated debt, preferred stock or other obligations on which cash payments have been suspended in accordance with the instrument’s terms or when preferred stock is the subject of a distressed exchange offer, whereby some or all of the issue is either repurchased for an amount of cash or replaced by other instruments having a total value that is less than par. |
| D | An obligation rated ‘D’ is in payment default. The ‘D’ rating category is used when payments on an obligation, including a regulatory capital instrument, are not made on the date due even if the applicable grace period has not expired, unless S&P believes that such payments will be made during such grace period. The ‘D’ rating also will be used upon the filing of a bankruptcy petition or the taking of a similar action if payments on an obligation are jeopardized. An obligation’s rating is lowered to ‘D’ upon completion of a distressed exchange offer, whereby some or all of the issue is either repurchased for an amount of cash or replaced by other instruments having a total value that is less than par. |
Plus (+) or Minus (–): The ratings from ‘AA’ to ‘CCC’ may be modified by the addition of a plus or minus sign to show relative standing within the major rating categories.
| NR | This indicates that no rating has been requested, that there is insufficient information on which to base a rating, or that S&P does not rate a particular obligation as a matter of policy. |
Municipal Short-Term Note Ratings
A Standard & Poor’s U.S. municipal note rating reflects Standard & Poor’s opinion about the liquidity factors and market access risks unique to the notes. Notes due in three years or less will likely receive a note rating. Notes with an original maturity of more than three years will most likely receive a long-term debt rating. In determining which type of rating, if any, to assign, Standard & Poor’s analysis will review the following considerations:
| • | Amortization schedule—the larger the final maturity relative to other maturities, the more likely it will be treated as a note; and |
| • | Source of payment—the more dependent the issue is on the market for its refinancing, the more likely it will be treated as a note. |
Note rating symbols are as follows:
| SP-1 | Strong capacity to pay principal and interest. An issue determined to possess a very strong capacity to pay debt service is given a plus (+) designation. |
A-2
| SP-2 | Satisfactory capacity to pay principal and interest, with some vulnerability to adverse financial and economic changes over the term of the notes. |
| SP-3 | Speculative capacity to pay principal and interest. |
Moody’s Investors Service, Inc.—A brief description of the applicable Moody’s Investors Service, Inc. (“Moody’s”) rating symbols and their meanings (as published by Moody’s) follows:
Long-Term Obligation Ratings
| Aaa | Obligations rated Aaa are judged to be of the highest quality, with minimal credit risk. |
| Aa | Obligations rated Aa are judged to be of high quality and are subject to very low credit risk. |
| A | Obligations rated A are considered upper-medium grade and are subject to low credit risk. |
| Baa | Obligations rated Baa are subject to moderate credit risk. They are considered medium grade and as such may possess certain speculative characteristics. |
| Ba | Obligations rated Ba are judged to have speculative elements and are subject to substantial credit risk. |
| B | Obligations rated B are considered speculative and are subject to high credit risk. |
| Caa | Obligations rated Caa are judged to be of poor standing and are subject to very high credit risk. |
| Ca | Obligations rated Ca are highly speculative and are likely in, or very near, default, with some prospect of recovery of principal and interest. |
| C | Obligations rated C are the lowest rated class and are typically in default, with little prospect for recovery of principal or interest. |
Note: Moody’s appends numerical modifiers 1, 2, and 3 to each generic rating classification from Aa through Caa. The modifier 1 indicates that the obligation ranks in the higher end of its generic rating category; the modifier 2 indicates a mid-range ranking; and the modifier 3 indicates a ranking in the lower end of that generic rating category.
Medium-Term Note Program Ratings
Moody’s assigns ratings to medium-term note (MTN) programs and to individual debt securities issued from them (referred to as drawdowns or notes). These ratings may be expressed on Moody’s general long-term or short-term rating scale, depending upon the intended tenor of the notes to be issued under the program. MTN program ratings are intended to reflect the ratings likely to be assigned to drawdowns issued from the program with the specified priority of claim (e.g. senior or subordinated). However, the rating assigned to a drawdown from a rated MTN program may differ from the program rating if the draw-down is exposed to additional credit risks besides the issuer’s default, such as links to the defaults of other issuers, or has other structural features that warrant a different rating. In some circumstances, no rating may be assigned to a drawdown.
Market participants must determine whether any particular note is rated, and if so, at what rating level. Moody’s encourages market participants to contact Moody’s Ratings Desks or visit www.moodys.com directly if they have questions regarding ratings for specific notes issued under a medium-term note program. Unrated notes issued under an MTN program may be assigned an NR (not rated) symbol.
U.S. Municipal Short-Term Debt and Demand Obligation Ratings
Short-Term Obligation Ratings
In municipal debt issuance, there are three rating categories for short-term municipal obligations that are considered investment grade. These ratings are designated as Municipal Investment Grade (MIG) and are divided into three levels—MIG 1 through MIG 3.
In addition, those short-term obligations that are of speculative quality are designated SG, or speculative grade. MIG ratings expire at the maturity of the obligation.
A-3
| MIG 1 | This designation denotes superior credit quality. Excellent protection is afforded by established cash flows, highly reliable liquidity support, or demonstrated broad-based access to the market for refinancing. |
| MIG 2 | This designation denotes strong credit quality. Margins of protection are ample, although not as large as in the preceding group. |
| MIG 3 | This designation denotes acceptable credit quality. Liquidity and cash-flow protection may be narrow, and market access for refinancing is likely to be less well-established. |
| SG | This designation denotes speculative-grade credit quality. Debt instruments in this category may lack sufficient margins of protection. |
Demand Obligation Ratings
In the case of variable rate demand obligations (VRDOs), a two-component rating is assigned; a long or short-term debt rating and a demand obligation rating. The first element represents Moody’s evaluation of the degree of risk associated with scheduled principal and interest payments. The second element represents Moody’s evaluation of the degree of risk associated with the ability to receive purchase price upon demand (“demand feature”), using a variation of the MIG rating scale, the Variable Municipal Investment Grade or VMIG rating.
When either the long-or short-term aspect of a VRDO is not rated, that piece is designated NR, e.g., Aaa/NR or NR/VMIG 1.
VMIG rating expirations are a function of each issue’s specific structural or credit features.
| VMIG 1 | This designation denotes superior credit quality. Excellent protection is afforded by the superior short-term credit strength of the liquidity provider and structural and legal protections that ensure the timely payment of purchase price upon demand. |
| VMIG 2 | This designation denotes strong credit quality. Good protection is afforded by the strong short-term credit strength of the liquidity provider and structural and legal protections that ensure the timely payment of purchase price upon demand. |
| VMIG 3 | This designation denotes acceptable credit quality. Adequate protection is afforded by the satisfactory short-term credit strength of the liquidity provider and structural and legal protections that ensure the timely payment of purchase price upon demand. |
| SG | This designation denotes speculative-grade credit quality. Demand features rated in this category may be supported by a liquidity provider that does not have an investment grade short-term rating or may lack the structural and/or legal protections necessary to ensure the timely payment of purchase price upon demand. |
Fitch Ratings—A brief description of the applicable Fitch Ratings (“Fitch”) ratings symbols and meanings (as published by Fitch) follows:
Structured, Project & Public Finance Obligations—Long-Term Rating Scales
Ratings of structured finance, project finance and public finance obligations on the long-term scale, including the financial obligations of sovereigns, consider the obligations’ relative vulnerability to default. These ratings are typically assigned to an individual security or tranche in a transaction and not to an issuer.
| AAA | Highest credit quality. ‘AAA’ ratings denote the lowest expectation of default risk. They are assigned only in cases of exceptionally strong capacity for payment of financial commitments. This capacity is highly unlikely to be adversely affected by foreseeable events. |
| AA | Very high credit quality. ‘AA’ ratings denote expectations of very low default risk. They indicate very strong capacity for payment of financial commitments. This capacity is not significantly vulnerable to foreseeable events. |
| A | High credit quality. ‘A’ ratings denote expectations of low default risk. The capacity for payment of financial commitments is considered strong. This capacity may, nevertheless, be more vulnerable to adverse business or economic conditions than is the case for higher ratings. |
A-4
| BBB | Good credit quality. ‘BBB’ ratings indicate that expectations of default risk are currently low. The capacity for payment of financial commitments is considered adequate but adverse business or economic conditions are more likely to impair this capacity. |
| BB | Speculative. ‘BB’ ratings indicate an elevated vulnerability to default risk, particularly in the event of adverse changes in business or economic conditions over time. |
| B | Highly speculative. ‘B’ ratings indicate that material default risk is present, but a limited margin of safety remains. Financial commitments are currently being met; however, capacity for continued payment is vulnerable to deterioration in the business and economic environment. |
| CCC | Substantial credit risk. Default is a real possibility. |
| CC | Very high levels of credit risk. Default of some kind appears probable. |
| C | Exceptionally high levels of credit risk. Default appears imminent or inevitable. |
| D | Default. Indicates a default. Default generally is defined as one of the following: |
| • | failure to make payment of principal and/or interest under the contractual terms of the rated obligation; |
| • | the bankruptcy filings, administration, receivership, liquidation or other winding-up or cessation of the business of an issuer/obligor; or |
| • | the coercive exchange of an obligation, where creditors were offered securities with diminished structural or |
| • | economic terms compared with the existing obligation. |
Notes: In the case of structured and project finance, while the ratings do not address the loss severity given default of the rated liability, loss severity assumptions on the underlying assets are nonetheless typically included as part of the analysis. Loss severity assumptions are used to derive pool cash flows available to service the rated liability.
The suffix “sf’’ denotes an issue that is a structured finance transaction. For an explanation of how Fitch determines structured finance ratings, please see our criteria available at www.Fitchratings.com.
In the case of public finance, the ratings do not address the loss given default of the rated liability, focusing instead on the vulnerability to default of the rated liability.
The modifiers “+” or “-” may be appended to a rating to denote relative status within major rating categories. Such suffixes are not added to the ‘AAA’ Long-Term Rating category, or categories below ‘B’.
Limitations of the Structured, Project and Public Finance Obligation Rating Scale
Specific limitatiopns relevant to the structured, project and public finance obligation rating scale include:
| • | The ratings do not predict a specific percentage of default likelihood over any given time period. |
| • | The ratings do not opine on the market value of any issuer’s securities or stock, or the likelihood that this value may change. |
| • | The ratings do not opine on the liquidity of the issuer’s securities or stock. |
| • | The ratings do not opine on the possible loss severity on an obligation should an obligation default. |
| • | The ratings do not opine on any quality related to a transaction’s profile other than the agency’s opinion on the relative vulnerability to default of each rated tranche or security. |
A-5
Short-Term Ratings Assigned to Issuers or Obligations in Corporate, Public and Structured Finance
A short-term issuer or obligation rating is based in all cases on the short-term vulnerability to default of the rated entity or security stream and relates to the capacity to meet financial obligations in accordance with the documentation governing the relevant obligation. Short-Term Ratings are assigned to obligations whose initial maturity is viewed as “short term” based on market convention. Typically, this means up to 13 months for corporate, sovereign, and structured obligations, and up to 36 months for obligations in U.S. public finance markets.
| F1 | Highest short-term credit quality. Indicates the strongest intrinsic capacity for timely payment of financial commitments; may have an added “+” to denote any exceptionally strong credit feature. |
| F2 | Good short-term credit quality. Good intrinsic capacity for timely payment of financial commitments. |
| F3 | Fair short-term credit quality. The intrinsic capacity for timely payment of financial commitments is adequate. |
| B | Speculative short-term credit quality. Minimal capacity for timely payment of financial commitments, plus heightened vulnerability to near term adverse changes in financial and economic conditions. |
| C | High short-term default risk. Default is a real possibility. |
| RD | Restricted default. Indicates an entity that has defaulted on one or more of its financial commitments, although it continues to meet other financial obligations. Applicable to entity ratings only. |
| D | Default. Indicates a broad-based default event for an entity, or the default of a short-term obligation. |
Limitations of the Short-Term Ratings Scale
Specific limitations relevant to the Short-Term Ratings scale include:
| • | The ratings do not predict a specific percentage of default likelihood over any given time period. |
| • | The ratings do not opine on the market value of any issuer’s securities or stock, or the likelihood that this value may change. |
| • | The ratings do not opine on the liquidity of the issuer’s securities or stock. |
| • | The ratings do not opine on the possible loss severity on an obligation should an obligation default. |
| • | The ratings do not opine on any quality related to an issuer or transaction’s profile other than the agency’s opinion on the relative vulnerability to default of the rated issuer or obligation. |
Ratings assigned by Fitch Ratings articulate an opinion on discrete and specific areas of risk. The above list is not exhaustive, and is provided for the reader’s convenience.
A-6
Nuveen Fund Advisors, Inc.
Proxy Voting Policies and Procedures
Effective Date: January 1, 2011
I. Introduction
Nuveen Fund Advisors, Inc. (“Adviser”) is an investment adviser for the Nuveen Funds (the “Funds”) and for other accounts (collectively, with the Funds, “Accounts”). As such, Accounts may confer upon Adviser complete discretion to vote proxies. It is Adviser’s duty to vote proxies in the best interests of its clients (which may involve affirmatively deciding that voting the proxies may not be in the best interests of certain clients on certain matters). In voting proxies, Adviser also seeks to enhance total investment return for its clients.
When Adviser contracts with another investment adviser to act as a sub-adviser for its Accounts, Adviser delegates proxy voting responsibility to the sub-adviser (each a “Sub-Adviser”). Where Adviser has delegated proxy voting responsibility, the Sub-Adviser will be responsible for developing and adhering to its own proxy voting policies, subject to oversight by Adviser.
II. Policies and Procedures
Consistent with its oversight responsibilities, Adviser has adopted the following Sub-Adviser oversight policies and procedures:
1. Prior to approval of any sub-advisory contract by Adviser or the Board of Directors of the Funds, as applicable, Adviser’s Compliance reviews the Sub-Adviser’s proxy voting policy (each a “Sub-Adviser Policy”) to ensure that such Sub-Adviser Policy is designed in the best interests of Adviser’s clients. Thereafter, at least annually, Adviser’s Compliance reviews and approves material changes to each Sub-Adviser Policy.
2. On a quarterly basis, Adviser’s Investment Operations will request and review reports from each Sub-Adviser reflecting any overrides of its Sub-Adviser Policy or conflicts of interest addressed during the previous quarter, and other matters Adviser’s Investment Operations deems appropriate. Any material issues arising from such review will be reported to Adviser’s management and if appropriate, the Board of Directors of the Funds.
III. Policy Owner
Chief Compliance Officer
IV. Responsible Parties
Compliance
Investment Operations
B-1
Nuveen Asset Management, LLC
Proxy Voting Policies and Procedures
Effective Date: January 1, 2011
I. General Principles
A. Nuveen Asset Management, LLC (“Adviser”) is an investment sub-adviser for certain of the Nuveen Funds (the “Funds”) and investment adviser for institutional and other separately managed accounts (collectively, with the Funds, “Client Accounts”). As such, Client Accounts may confer upon Adviser complete discretion to vote proxies. It is Adviser’s duty to vote proxies in the best interests of its clients (which may involve affirmatively deciding that voting the proxies may not be in the best interests of certain clients on certain matters1). In voting proxies, Adviser also seeks to enhance total investment return for its clients.
B. If Adviser contracts with another investment adviser to act as a sub-adviser for a Client Account, Adviser may delegate proxy voting responsibility to the sub-adviser. Where Adviser has delegated proxy voting responsibility, the sub-adviser will be responsible for developing and adhering to its own proxy voting policies, subject to oversight by Adviser.
C. Adviser’s Investment Policy Committee (“IPC”), comprised of the firm’s most senior investment professionals, is charged with oversight of the proxy voting policies and procedures. The IPC is responsible for (1) approving the proxy voting policies and procedures, and (2) oversight of the activities of Adviser’s Proxy Voting Committee (“PVC”). The PVC is responsible for providing an administrative framework to facilitate and monitor Adviser’s exercise of its fiduciary duty to vote client proxies and fulfill the obligations of reporting and recordkeeping under the federal securities laws.
II. Policies
The IPC, after reviewing and concluding that such policies are reasonably designed to vote proxies in the best interests of clients, has approved and adopted the proxy voting policies of Institutional Shareholder Services, Inc. (“ISS”), a leading national provider of proxy voting administrative and research services. As a result, such policies set forth Adviser’s positions on recurring proxy issues and criteria for addressing non-recurring issues. These policies are reviewed periodically by ISS, and therefore are subject to change. Even though it has adopted ISS policies, Adviser maintains the fiduciary responsibility for all proxy voting decisions.
III. Procedures
A. Supervision of Proxy Voting Service. The PVC shall supervise the relationship with Adviser’s proxy voting service, ISS. ISS apprises Adviser of shareholder meeting dates, provides research on proxy proposals and voting recommendations, and casts the actual proxy votes. ISS also serves as Adviser’s proxy voting record keeper and generates reports on how proxies were voted.
| 1 | Adviser may not vote proxies associated with the securities of any issuer if as a result of voting, subsequent purchases or sales of such securities would be blocked. However, Adviser may decide, on an individual security basis that it is in the best interests of its clients to vote the proxy associated with such a security, taking into account the loss of liquidity. In addition, Adviser may not to vote proxies where the voting would in Adviser’s judgment result in some other financial, legal, regulatory disability or burden to the client (such as imputing control with respect to the issuer) or subject to resolution of any conflict of interest as provided herein, to Adviser. |
B-2
B. Conflicts of Interest.
1. The following relationships or circumstances may give rise to conflicts of interest:2
| a. | The issuer or proxy proponent (e.g., a special interest group) is Madison Dearborn Partners, a private equity firm and affiliate of Adviser (“MDP”), or a company that controls, is controlled by or is under common control with MDP. |
| b. | The issuer is an entity in which an executive officer of Adviser or a spouse or domestic partner of any such executive officer is or was (within the past three years of the proxy vote) an executive officer or director. |
| c. | The issuer is a registered or unregistered fund for which Adviser or another Nuveen adviser serves as investment adviser or sub-adviser. |
| d. | Any other circumstances that Adviser is aware of where Adviser’s duty to serve its clients’ interests, typically referred to as its “duty of loyalty,” could be materially compromised. |
2. Adviser will vote proxies in the best interest of its clients regardless of such real or perceived conflicts of interest. By adopting ISS policies, Adviser believes the risk related to conflicts will be minimized.
3. To further minimize this risk, the IPC will review ISS’ conflict avoidance policy at least annually to ensure that it adequately addresses both the actual and perceived conflicts of interest the proxy voting service may face.
4. In the event that ISS faces a material conflict of interest with respect to a specific vote, the PVC shall direct ISS how to vote. The PVC shall receive voting direction from the Head of Research, who will seek voting direction from appropriate investment personnel. Before doing so, however, the PVC will confirm that Adviser faces no material conflicts of its own with respect to the specific proxy vote.
5. If the PVC concludes that a material conflict does exist, it will recommend to the IPC a course of action designed to address the conflict. Such actions could include, but are not limited to:
| a. | Obtaining instructions from the affected client(s) on how to vote the proxy; |
| b. | Disclosing the conflict to the affected client(s) and seeking their consent to permit Adviser to vote the proxy; |
| c. | Voting in proportion to the other shareholders; |
| d. | Recusing an IPC member from all discussion or consideration of the matter, if the material conflict is due to such person’s actual or potential conflict of interest; or |
| e. | Following the recommendation of a different independent third party. |
6. In addition to all of the above-mentioned and other conflicts, members of the IPC and the PVC must notify Adviser’s Chief Compliance Officer of any direct, indirect or perceived improper influence exerted by any employee, officer or director within the MDP affiliate or Fund complex with regard to how Adviser should vote proxies. The Chief Compliance Officer will investigate the allegations and will report the findings to Adviser’s President and the General Counsel. If it is determined that improper influence was attempted, appropriate action shall be taken. Such appropriate action may include disciplinary action, notification of the appropriate senior managers within the MDP affiliate, or notification of the appropriate regulatory authorities. In all cases, the IPC shall not consider any improper influence in determining how to vote proxies, and will vote in the best interests of clients.
| 2 | A conflict of interest shall not be considered material for the purposes of these Policies and Procedures in respect of a specific vote or circumstance if the matter to be voted on relates to a restructuring of the terms of existing securities or the issuance of new securities or a similar matter arising out of the holding of securities, other than common equity, in the context of a bankruptcy or threatened bankruptcy of the issuer, even if a conflict described in III.B.1a.-d is present. |
B-3
C. Proxy Vote Override. From time to time, a portfolio manager of a Client Account (a “Portfolio Manager”) may initiate action to override the ISS recommendation for a particular vote. Any such override by a NAM Portfolio Manager (but not a sub-adviser Portfolio Manager) shall be reviewed by Adviser’s Legal Department for material conflicts. If the Legal Department determines that no material conflicts exist, the approval of one investment professional on the IPC or the Head of Equity Research shall authorize the override. If a material conflict exists the conflict and, ultimately, the override recommendation will be addressed pursuant to the procedures described above under “Conflicts of Interest.”
D. Securities Lending.
1. In order to generate incremental revenue, some clients may participate in a securities lending program. If a client has elected to participate in the lending program then it will not have the right to vote the proxies of any securities that are on loan as of the shareholder meeting record date. A client, or a Portfolio Manager, may place restrictions on loaning securities and/or recall a security on loan at any time. Such actions must be affected prior to the record date for a meeting if the purpose for the restriction or recall is to secure the vote.
2. Portfolio Managers and/or analysts who become aware of upcoming proxy issues relating to any securities in portfolios they manage, or issuers they follow, will consider the desirability of recalling the affected securities that are on loan or restricting the affected securities prior to the record date for the matter. If the proxy issue is determined to be material, and the determination is made prior to the shareholder meeting record date the Portfolio Manager(s) will contact the Securities Lending Agent to recall securities on loan or restrict the loaning of any security held in any portfolio they manage, if they determine that it is in the best interest of shareholders to do so. Training regarding the process to recall securities on loan or restrict the loaning of securities is given to all Portfolio Managers and analysts.
E. Proxy Voting for ERISA Clients. If a proxy voting issue arises for an ERISA client, Adviser is prohibited from voting shares with respect to any issue advanced by a party in interest of the ERISA client.
F. Proxy Voting Records. As required by Rule 204-2 of the Investment Advisers Act of 1940, Adviser shall make and retain five types of records relating to proxy voting; (a) proxy voting policies and procedures; (b) proxy statements received for client and fund securities; (c) records of votes cast on behalf of clients and funds; (d) records of written requests for proxy voting information and written responses from the Adviser to either a written or oral request; and (e) any documents prepared by the adviser that were material to making a proxy voting decision or that memorialized the basis for the decision. Adviser may rely on ISS to make and retain on Adviser’s behalf records pertaining to the rule.
G. Fund of Funds Provision. In instances where Adviser provides investment advice to a fund of funds that acquires shares of affiliated funds or three percent or more of the outstanding voting securities of an unaffiliated fund, the acquiring fund shall vote the shares in the same proportion as the vote of all other shareholders of the acquired fund. If compliance with this policy results in a vote of any shares in a manner different than the ISS recommendation, such vote will not require compliance with the Proxy Vote Override procedures set forth above.
H. Legacy Securities. To the extent that Adviser receives proxies for securities that are transferred into a Client Account’s portfolio that were not recommended or selected by Adviser and are sold or expected to be sold promptly in an orderly manner (“legacy securities”), Adviser will generally instruct ISS to refrain from voting such proxies. In such circumstances, since legacy securities are expected to be sold promptly, voting proxies on such securities would not further Adviser’s interest in maximizing the value of client investments. Adviser may agree to an institutional Client Account’s special request to vote a legacy security proxy, and would instruct ISS to vote such proxy in accordance with its guidelines.
B-4
I. Review and Reports.
1. The PVC shall maintain a review schedule. The schedule shall include reviews for the proxy voting policy (including the policies of any sub-adviser), the proxy voting record, account maintenance, and other reviews as deemed appropriate by the PVC. The PVC shall review the schedule at least annually.
2. The PVC will report to the IPC with respect to all identified conflicts and how they were addressed. These reports will include all Client Accounts, including those that are sub-advised. With respect to the review of votes cast on behalf of investments by the Funds, such review will also be reported to the Board of Directors of the Funds at each of their regularly scheduled meetings. Adviser also shall provide the Funds that it sub-advises with information necessary for preparing Form N-PX.
K. Vote Disclosure to Clients.
Adviser’s institutional and separately managed account clients can contact their relationship manager for more information on Adviser’s policies and the proxy voting record for their account. The information available includes name of issuer, ticker/CUSIP, shareholder meeting date, description of item and Adviser’s vote.
IV. Policy Owner
IPC
V. Responsible Parties
IPC
PVC
ADV Review Team
RiskMetrics Group’s U.S. Proxy Voting Guidelines Concise Summary
(Digest of Selected Key Guidelines)
January 22, 2010
1. Routine/Miscellaneous:
Auditor Ratification
Vote FOR proposals to ratify auditors, unless any of the following apply:
| • | An auditor has a financial interest in or association with the company, and is therefore not independent; |
| • | There is reason to believe that the independent auditor has rendered an opinion which is neither accurate nor indicative of the company’s financial position; |
| • | Poor accounting practices are identified that rise to a serious level of concern, such as: fraud; misapplication of GAAP; and material weaknesses identified in Section 404 disclosures; or |
| • | Fees for non-audit services (“Other” fees) are excessive. |
Non-audit fees are excessive if:
| • | Non-audit (“other”) fees exceed audit fees + audit-related fees + tax compliance/preparation fees |
Vote CASE-BY-CASE on shareholder proposals asking companies to prohibit or limit their auditors from engaging in non-audit services.
Vote CASE-BY-CASE on shareholder proposals asking for audit firm rotation, taking into account:
| • | The tenure of the audit firm; |
| • | The length of rotation specified in the proposal; |
| • | Any significant audit-related issues at the company; |
B-5
| • | The number of Audit Committee meetings held each year; |
| • | The number of financial experts serving on the committee; and |
| • | Whether the company has a periodic renewal process where the auditor is evaluated for both audit quality and competitive price. |
2. Board of Directors:
Votes on director nominees should be determined on a CASE-BY-CASE basis.
Four fundamental principles apply when determining votes on director nominees:
Board Accountability
Board Responsiveness
Director Independence
Director Competence
Board Accountability
Problematic Takeover Defenses
VOTE WITHHOLD/AGAINST1 the entire board of directors (except new nominees2, who should be considered on a CASE-by-CASE basis), if:
| • | The board is classified, and a continuing director responsible for a problematic governance issue at the board/committee level that would warrant a withhold/against vote recommendation is not up for election—any or all appropriate nominees (except new) may be held accountable; |
| • | The company’s poison pill has a “dead-hand” or “modified dead-hand” feature. Vote withhold/against every year until this feature is removed; |
| • | The board adopts a poison pill with a term of more than 12 months (“long-term pill”), or renews any existing pill, including any “short-term” pill (12 months or less), without shareholder approval. A commitment or policy that puts a newly-adopted pill to a binding shareholder vote may potentially offset an adverse vote recommendation. Review such companies with classified boards every year, and such companies with annually-elected boards at least once every three years, and vote AGAINST or WITHHOLD votes from all nominees if the company still maintains a non-shareholder-approved poison pill. This policy applies to all companies adopting or renewing pills after the announcement of this policy (Nov 19, 2009); |
| • | The board makes a material adverse change to an existing poison pill without shareholder approval. |
Vote CASE-By-CASE on all nominees if the board adopts a poison pill with a term of 12 months or less (“short-term pill”) without shareholder approval, taking into account the following factors:
| • | The date of the pill’s adoption relative to the date of the next meeting of shareholders- i.e. whether the company had time to put the pill on ballot for shareholder ratification given the circumstances; |
| 1 | In general, companies with a plurality vote standard use “Withhold” as the valid contrary vote option in director elections; companies with a majority vote standard use “Against”. However, it will vary by company and the proxy must be checked to determine the valid contrary vote option for the particular company. |
| 2 | A “new nominee” is any current nominee who has not already been elected by shareholders and who joined the board after the problematic action in question transpired. If RMG cannot determine whether the nominee joined the board before or after the problematic action transpired, the nominee will be considered a “new nominee” if he or she joined the board within the 12 months prior to the upcoming shareholder meeting. |
B-6
| • | The issuer’s rationale; |
| • | The issuer’s governance structure and practices; and |
| • | The issuer’s track record of accountability to shareholders. |
Problematic Audit-Related Practices
Generally, vote AGAINST or WITHHOLD from the members of the Audit Committee if:
| • | The non-audit fees paid to the auditor are excessive (see discussion under “Auditor Ratification”); |
| • | The company receives an adverse opinion on the company’s financial statements from its auditor; or |
| • | There is persuasive evidence that the audit committee entered into an inappropriate indemnification agreement with its auditor that limits the ability of the company, or its shareholders, to pursue legitimate legal recourse against the audit firm. |
Vote CASE-by-CASE on members of the Audit Committee and/or the full board if:
| • | Poor accounting practices are identified that rise to a level of serious concern, such as: fraud; misapplication of GAAP; and material weaknesses identified in Section 404 disclosures. Examine the severity, breadth, chronological sequence and duration, as well as the company’s efforts at remediation or corrective actions, in determining whether WITHHOLD/AGAINST votes are warranted. |
Problematic Compensation Practices
VOTE WITHHOLD/AGAINST the members of the Compensation Committee and potentially the full board if:
| • | There is a negative correlation between chief executive pay and company performance (see Pay for Performance Policy); |
| • | The company reprices underwater options for stock, cash, or other consideration without prior shareholder approval, even if allowed in the firm’s equity plan; |
| • | The company fails to submit one-time transfers of stock options to a shareholder vote; |
| • | The company fails to fulfill the terms of a burn rate commitment made to shareholders; |
| • | The company has problematic pay practices. Problematic pay practices may warrant withholding votes from the CEO and potentially the entire board as well. |
Other Problematic Governance Practices
VOTE WITHHOLD/AGAINST the entire board of directors (except new nominees, who should be considered on a CASE-by-CASE basis), if:
| • | The company’s proxy indicates that not all directors attended 75 percent of the aggregate board and committee meetings, but fails to provide the required disclosure of the names of the director(s) involved. If this information cannot be obtained, withhold from all incumbent directors; |
| • | The board lacks accountability and oversight, coupled with sustained poor performance relative to peers. Sustained poor performance is measured by one- and three-year total shareholder returns in the bottom half of a company’s four-digit GICS industry group (Russell 3000 companies only). Take into consideration the company’s five-year total shareholder return and five-year operational metrics. Problematic provisions include but are not limited to: |
| — | A classified board structure; |
| — | A supermajority vote requirement; |
| — | Majority vote standard for director elections with no carve out for contested elections; |
B-7
| — | The inability for shareholders to call special meetings; |
| — | The inability for shareholders to act by written consent; |
| — | A dual-class structure; and/or |
| — | A non-shareholder approved poison pill. |
Under extraordinary circumstances, vote AGAINST or WITHHOLD from directors individually, committee members, or the entire board, due to:
| • | Material failures of governance, stewardship, or fiduciary responsibilities at the company; |
| • | Failure to replace management as appropriate; or |
| • | Egregious actions related to the director(s)’ service on other boards that raise substantial doubt about his or her ability to effectively oversee management and serve the best interests of shareholders at any company. |
Board Responsiveness
Vote WITHHOLD/AGAINST the entire board of directors (except new nominees, who should be considered on a CASE-by-CASE basis), if:
| • | The board failed to act on a shareholder proposal that received approval by a majority of the shares outstanding the previous year (a management proposal with other than a FOR recommendation by management will not be considered as sufficient action taken); |
| • | The board failed to act on a shareholder proposal that received approval of the majority of shares cast for the previous two consecutive years (a management proposal with other than a FOR recommendation by management will not be considered as sufficient action taken); |
| • | The board failed to act on takeover offers where the majority of the shareholders tendered their shares; or |
| • | At the previous board election, any director received more than 50 percent withhold/against votes of the shares cast and the company has failed to address the issue(s) that caused the high withhold/against vote. |
Director Independence
Vote WITHHOLD/AGAINST Inside Directors and Affiliated Outside Directors (per the Categorization of Directors in the Summary Guidelines) when:
| • | The inside or affiliated outside director serves on any of the three key committees: audit, compensation, or nominating; |
| • | The company lacks an audit, compensation, or nominating committee so that the full board functions as that committee; |
| • | The company lacks a formal nominating committee, even if the board attests that the independent directors fulfill the functions of such a committee; or |
| • | The full board is less than majority independent. |
Director Competence
Vote AGAINST or WITHHOLD from individual directors who:
| • | Attend less than 75 percent of the board and committee meetings without a valid excuse, such as illness, service to the nation, work on behalf of the company, or funeral obligations. If the company provides meaningful public or private disclosure explaining the director’s absences, evaluate the information on a CASE-BY-CASE basis taking into account the following factors: |
| — | Degree to which absences were due to an unavoidable conflict; |
B-8
| — | Pattern of absenteeism; and |
| — | Other extraordinary circumstances underlying the director’s absence; |
| • | Sit on more than six public company boards; |
| • | Are CEOs of public companies who sit on the boards of more than two public companies besides their own—withhold only at their outside boards. |
Voting for Director Nominees in Contested Elections
Vote CASE-BY-CASE on the election of directors in contested elections, considering the following factors:
| • | Long-term financial performance of the target company relative to its industry; |
| • | Management’s track record; |
| • | Background to the proxy contest; |
| • | Qualifications of director nominees (both slates); |
| • | Strategic plan of dissident slate and quality of critique against management; |
| • | Likelihood that the proposed goals and objectives can be achieved (both slates); |
| • | Stock ownership positions. |
Independent Chair (Separate Chair/CEO)
Generally vote FOR shareholder proposals requiring that the chairman’s position be filled by an independent director, unless the company satisfies all of the following criteria:
The company maintains the following counterbalancing features:
| • | Designated lead director, elected by and from the independent board members with clearly delineated and comprehensive duties. (The role may alternatively reside with a presiding director, vice chairman, or rotating lead director; however the director must serve a minimum of one year in order to qualify as a lead director.) The duties should include, but are not limited to, the following: |
| — | presides at all meetings of the board at which the chairman is not present, including executive sessions of the independent directors; |
| — | serves as liaison between the chairman and the independent directors; |
| — | approves information sent to the board; |
| — | approves meeting agendas for the board; |
| — | approves meeting schedules to assure that there is sufficient time for discussion of all agenda items; |
| — | has the authority to call meetings of the independent directors; |
| — | if requested by major shareholders, ensures that he is available for consultation and direct communication; |
| • | Two-thirds independent board; |
| • | All independent key committees; |
| • | Established governance guidelines; |
| • | A company in the Russell 3000 universe must not have exhibited sustained poor total shareholder return (TSR) performance, defined as one- and three-year TSR in the bottom half of the company’s four-digit GICS industry group within the Russell 3000 only), unless there has been a change in the Chairman/CEO position within that time; |
B-9
| • | The company does not have any problematic governance or management issues, examples of which include, but are not limited to: |
| — | Egregious compensation practices; |
| — | Multiple related-party transactions or other issues putting director independence at risk; |
| — | Corporate and/or management scandals; |
| — | Excessive problematic corporate governance provisions; or |
| — | Flagrant board or management actions with potential or realized negative impact on shareholders. |
3. Shareholder Rights & Defenses:
Net Operating Loss (NOL) Protective Amendments
For management proposals to adopt a protective amendment for the stated purpose of protecting a company’s net operating losses (“NOLs”), the following factors should be considered on a CASE-BY-CASE basis:
| • | The ownership threshold (NOL protective amendments generally prohibit stock ownership transfers that would result in a new 5-percent holder or increase the stock ownership percentage of an existing five-percent holder); |
| • | The value of the NOLs; |
| • | Shareholder protection mechanisms (sunset provision or commitment to cause expiration of the protective amendment upon exhaustion or expiration of the NOL); |
| • | The company’s existing governance structure including: board independence, existing takeover defenses, track record of responsiveness to shareholders, and any other problematic governance concerns; and |
| • | Any other factors that may be applicable. |
Poison Pills- Shareholder Proposals to put Pill to a Vote and/or Adopt a Pill Policy
Vote FOR shareholder proposals requesting that the company submit its poison pill to a shareholder vote or redeem it UNLESS the company has: (1) A shareholder approved poison pill in place; or (2) The company has adopted a policy concerning the adoption of a pill in the future specifying that the board will only adopt a shareholder rights plan if either:
| • | Shareholders have approved the adoption of the plan; or |
| • | The board, in its exercise of its fiduciary responsibilities, determines that it is in the best interest of shareholders under the circumstances to adopt a pill without the delay in adoption that would result from seeking stockholder approval (i.e., the “fiduciary out” provision). A poison pill adopted under this fiduciary out will be put to a shareholder ratification vote within 12 months of adoption or expire. If the pill is not approved by a majority of the votes cast on this issue, the plan will immediately terminate. |
If the shareholder proposal calls for a time period of less than 12 months for shareholder ratification after adoption, vote FOR the proposal, but add the caveat that a vote within 12 months would be considered sufficient implementation.
Poison Pills- Management Proposals to Ratify Poison Pill
Vote CASE-by-CASE on management proposals on poison pill ratification, focusing on the features of the shareholder rights plan. Rights plans should contain the following attributes:
| • | No lower than a 20% trigger, flip-in or flip-over; |
| • | A term of no more than three years; |
| • | No dead-hand, slow-hand, no-hand or similar feature that limits the ability of a future board to redeem the pill; |
B-10
| • | Shareholder redemption feature (qualifying offer clause); if the board refuses to redeem the pill 90 days after a qualifying offer is announced, 10 percent of the shares may call a special meeting or seek a written consent to vote on rescinding the pill. |
In addition, the rationale for adopting the pill should be thoroughly explained by the company. In examining the request for the pill, take into consideration the company’s existing governance structure, including: board independence, existing takeover defenses, and any problematic governance concerns.
Poison Pills- Management Proposals to ratify a Pill to preserve Net Operating Losses (NOLs)
Vote CASE-BY-CASE on management proposals for poison pill ratification. For management proposals to adopt a poison pill for the stated purpose of preserving a company’s net operating losses (“NOLs”), the following factors are considered on a CASE-BY-CASE basis:
| • | The ownership threshold to transfer (NOL pills generally have a trigger slightly below 5%); |
| • | The value of the NOLs; |
| • | The term; |
| • | Shareholder protection mechanisms (sunset provision, or commitment to cause expiration of the pill upon exhaustion or expiration of NOLs); |
| • | The company’s existing governance structure including: board independence, existing takeover defenses, track record of responsiveness to shareholders, and any other problematic governance concerns; and |
| • | Any other factors that may be applicable. |
Shareholder Ability to Call Special Meetings
Vote AGAINST management or shareholder proposals to restrict or prohibit shareholders’ ability to call special meetings.
Generally vote FOR management or shareholder proposals that provide shareholders with the ability to call special meetings taking into account the following factors:
| • | Shareholders’ current right to call special meetings; |
| • | Minimum ownership threshold necessary to call special meetings (10% preferred); |
| • | The inclusion of exclusionary or prohibitive language; |
| • | Investor ownership structure; and |
| • | Shareholder support of and management’s response to previous shareholder proposals. |
Supermajority Vote Requirements
Vote AGAINST proposals to require a supermajority shareholder vote.
Vote FOR management or shareholder proposals to reduce supermajority vote requirements. However, for companies with shareholder(s) who have significant ownership levels, vote CASE-BY-CASE, taking into account:
| • | Ownership structure; |
| • | Quorum requirements; and |
| • | Supermajority vote requirements. |
4. Capital Restructuring:
Common Stock Authorization
Vote CASE-BY-CASE on proposals to increase the number of shares of common stock authorized for issuance. Take into account company-specific factors which include, at a minimum, the following:
| • | Past Board Performance: |
| — | The company’s use of authorized shares during the last three years; |
B-11
| — | One- and three-year total shareholder return; and |
| — | The board’s governance structure and practices; |
| • | The Current Request: |
| — | Disclosure in the proxy statement of the specific reasons for the proposed increase; |
| — | The dilutive impact of the request as determined through an allowable cap generated by RiskMetrics’ quantitative model, which examines the company’s need for shares and its three-year total shareholder return; and |
| — | Risks to shareholders of not approving the request. |
Vote AGAINST proposals at companies with more than one class of common stock to increase the number of authorized shares of the class that has superior voting rights.
Preferred Stock
Vote CASE-BY-CASE on proposals to increase the number of shares of preferred stock authorized for issuance. Take into account company-specific factors that include, at a minimum, the following:
| • | Past Board Performance: |
| — | The company’s use of authorized preferred shares during the last three years; |
| — | One- and three-year total shareholder return; and |
| — | The board’s governance structure and practices; |
| • | The Current Request: |
| — | Disclosure in the proxy statement of specific reasons for the proposed increase; |
| — | In cases where the company has existing authorized preferred stock, the dilutive impact of the request as determined through an allowable cap generated by RiskMetrics’ quantitative model, which examines the company’s need for shares and three-year total shareholder return; and |
| — | Whether the shares requested are blank check preferred shares, and whether they are declawed. |
Vote AGAINST proposals at companies with more than one class or series of preferred stock to increase the number of authorized shares of the class or series that has superior voting rights.
Mergers and Acquisitions
Vote CASE-BY-CASE on mergers and acquisitions. Review and evaluate the merits and drawbacks of the proposed transaction, balancing various and sometimes countervailing factors including:
| • | Valuation—Is the value to be received by the target shareholders (or paid by the acquirer) reasonable? While the fairness opinion may provide an initial starting point for assessing valuation reasonableness, emphasis is placed on the offer premium, market reaction and strategic rationale. |
| • | Market reaction—How has the market responded to the proposed deal? A negative market reaction should cause closer scrutiny of a deal. |
| • | Strategic rationale—Does the deal make sense strategically? From where is the value derived? Cost and revenue synergies should not be overly aggressive or optimistic, but reasonably achievable. Management should also have a favorable track record of successful integration of historical acquisitions. |
| • | Negotiations and process—Were the terms of the transaction negotiated at arm’s-length? Was the process fair and equitable? A fair process helps to ensure the best price for shareholders. Significant negotiation “wins” can also signify the deal makers’ competency. The comprehensiveness of the sales process (e.g., full auction, partial auction, no auction) can also affect shareholder value. |
B-12
| • | Conflicts of interest—Are insiders benefiting from the transaction disproportionately and inappropriately as compared to non-insider shareholders? As the result of potential conflicts, the directors and officers of the company may be more likely to vote to approve a merger than if they did not hold these interests. Consider whether these interests may have influenced these directors and officers to support or recommend the merger. The change-in-control figure presented in the “RMG Transaction Summary” section of this report is an aggregate figure that can in certain cases be a misleading indicator of the true value transfer from shareholders to insiders. Where such figure appears to be excessive, analyze the underlying assumptions to determine whether a potential conflict exists. |
| • | Governance—Will the combined company have a better or worse governance profile than the current governance profiles of the respective parties to the transaction? If the governance profile is to change for the worse, the burden is on the company to prove that other issues (such as valuation) outweigh any deterioration in governance. |
5. Compensation:
Executive Pay Evaluation
Underlying all evaluations are five global principles that most investors expect corporations to adhere to in designing and administering executive and director compensation programs:
1. Maintain appropriate pay-for-performance alignment, with emphasis on long-term shareholder value: This principle encompasses overall executive pay practices, which must be designed to attract, retain, and appropriately motivate the key employees who drive shareholder value creation over the long term. It will take into consideration, among other factors, the link between pay and performance; the mix between fixed and variable pay; performance goals; and equity-based plan costs;
2. Avoid arrangements that risk “pay for failure”: This principle addresses the appropriateness of long or indefinite contracts, excessive severance packages, and guaranteed compensation;
3. Maintain an independent and effective compensation committee: This principle promotes oversight of executive pay programs by directors with appropriate skills, knowledge, experience, and a sound process for compensation decision-making (e.g., including access to independent expertise and advice when needed);
4. Provide shareholders with clear, comprehensive compensation disclosures: This principle underscores the importance of informative and timely disclosures that enable shareholders to evaluate executive pay practices fully and fairly;
5. Avoid inappropriate pay to non-executive directors: This principle recognizes the interests of shareholders in ensuring that compensation to outside directors does not compromise their independence and ability to make appropriate judgments in overseeing managers‘ pay and performance. At the market level, it may incorporate a variety of generally accepted best practices.
Equity Compensation Plans
Vote CASE-BY-CASE on equity-based compensation plans. Vote AGAINST the equity plan if any of the following factors apply:
| • | The total cost of the company’s equity plans is unreasonable; |
| • | The plan expressly permits the repricing of stock options/stock appreciate rights (SARs) without prior shareholder approval; |
| • | The CEO is a participant in the proposed equity-based compensation plan and there is a disconnect between CEO pay and the company’s performance where over 50 percent of the year-over-year increase is attributed to equity awards (see Pay-for-Performance); |
| • | The company’s three year burn rate exceeds the greater of 2% or the mean plus one standard deviation of its industry group; |
| • | Liberal Change of Control Definition: The plan provides for the acceleration of vesting of equity awards even though an actual change in control may not occur (e.g., upon shareholder approval of a transaction or the announcement of a tender offer); or |
| • | The plan is a vehicle for problematic pay practices. |
B-13
Other Compensation Proposals and Policies
Advisory Votes on Executive Compensation- Management Proposals (Management Say-on-Pay)
In general, the management say on pay (MSOP) ballot item is the primary focus of voting on executive pay practices- dissatisfaction with compensation practices can be expressed by voting against the MSOP rather than withholding or voting against the compensation committee. However, if there is no MSOP on which to express the dissatisfaction, then the secondary target will be members of the compensation committee. In addition, in egregious cases, or if the board fails to respond to concerns raised by a prior MSOP proposal; then vote withhold or against compensation committee member (or, if the full board is deemed accountable, to all directors). If the negative factors impact equity-based plans, then vote AGAINST an equity-based plan proposal presented for shareholder approval.
Evaluate executive pay and practices, as well as certain aspects of outside director compensation, on a CASE-BY-CASE basis.
Vote AGAINST management say on pay (MSOP) proposals, AGAINST/WITHHOLD on compensation committee members (or, in rare cases where the full board is deemed responsible, all directors including the CEO), and/or AGAINST an equity-based incentive plan proposal if:
| • | There is a misalignment between CEO pay and company performance (pay for performance); |
| • | The company maintains problematic pay practices; |
| • | The board exhibits poor communication and responsiveness to shareholders. |
Additional CASE-BY-CASE considerations for the management say on pay (MSOP) proposals:
| • | Evaluation of performance metrics in short-term and long-term plans, as discussed and explained in the Compensation Discussion & Analysis (CD&A). Consider the measures, goals, and target awards reported by the company for executives’ short- and long-term incentive awards: disclosure, explanation of their alignment with the company’s business strategy, and whether goals appear to be sufficiently challenging in relation to resulting payouts; |
| • | Evaluation of peer group benchmarking used to set target pay or award opportunities. Consider the rationale stated by the company for constituents in its pay benchmarking peer group, as well as the benchmark targets it uses to set or validate executives’ pay (e.g., median, 75th percentile, etc.,) to ascertain whether the benchmarking process is sound or may result in pay “ratcheting” due to inappropriate peer group constituents (e.g., much larger companies) or targeting (e.g., above median); and |
| • | Balance of performance-based versus non-performance-based pay. Consider the ratio of performance-based (not including plain vanilla stock options) vs. non-performance-based pay elements reported for the CEO’s latest reported fiscal year compensation, especially in conjunction with concerns about other factors such as performance metrics/goals, benchmarking practices, and pay-for-performance disconnects. |
Pay for Performance
Evaluate the alignment of the CEO’s pay with performance over time, focusing particularly on companies that have underperformed their peers over a sustained period. From a shareholders‘ perspective, performance is predominantly gauged by the company’s stock performance over time. Even when financial or operational measures are utilized in incentive awards, the achievement related to these measures should ultimately translate into superior shareholder returns in the long-term.
Focus on companies with sustained underperformance relative to peers, considering the following key factors:
| • | Whether a company’s one-year and three-year total shareholder returns (“TSR”) are in the bottom half of its industry group (i.e., four-digit GICS—Global Industry Classification Group); and |
| • | Whether the total compensation of a CEO who has served at least two consecutive fiscal years is aligned with the company’s total shareholder return over time, including both recent and long-term periods. |
B-14
If a company falls in the bottom half of its four-digit GICS, further analysis of the CD&A is required to better understand the various pay elements and whether they create or reinforce shareholder alignment. Also assess the CEO’s pay relative to the company’s TSR over a time horizon of at least five years. The most recent year-over-year increase or decrease in pay remains a key consideration, but there will be additional emphasis on the long term trend of CEO total compensation relative to shareholder return. Also consider the mix of performance-based compensation relative to total compensation. In general, standard stock options or time-vested restricted stock are not considered to be performance-based. If a company provides performance-based incentives to its executives, the company is highly encouraged to provide the complete disclosure of the performance measure and goals (hurdle rate) so that shareholders can assess the rigor of the performance program. The use of non-GAAP financial metrics also makes it very challenging for shareholders to ascertain the rigor of the program as shareholders often cannot tell the type of adjustments being made and if the adjustments were made consistently. Complete and transparent disclosure helps shareholders to better understand the company’s pay for performance linkage.
Problematic Pay Practices
The focus is on executive compensation practices that contravene the global pay principles, including:
| • | Problematic practices related to non-performance-based compensation elements; |
| • | Incentives that may motivate excessive risk-taking; and |
| • | Options Backdating. |
Non-Performance based Compensation Elements
Companies adopt a variety of pay arrangements that may be acceptable in their particular industries, or unique for a particular situation, and all companies are reviewed on a case-by-case basis. However, there are certain adverse practices that are particularly contrary to a performance-based pay philosophy, including guaranteed pay and excessive or inappropriate non-performance-based pay elements.
While not exhaustive, this is the list of practices that carry greatest weight in this consideration and may result in negative vote recommendations on a stand-alone basis. For more details, please refer to RMG’s Compensation FAQ document: http://www.riskmetrics.com/policy/2010_compensation_FAQ:
| • | Multi-year guarantees for salary increases, non-performance based bonuses, and equity compensation; |
| • | Including additional years of unworked service that result in significant additional benefits, without sufficient justification, or including long-term equity awards in the pension calculation; |
| • | Perquisites for former and/or retired executives, and extraordinary relocation benefits (including home buyouts) for current executives; |
| • | Change-in-control payments exceeding 3 times base salary and target bonus; change-in-control payments without job loss or substantial diminution of duties (“Single Triggers”); new or materially amended agreements that provide for “modified single triggers” (under which an executive may voluntarily leave for any reason and still receive the change-in-control severance package); new or materially amended agreements that provide for an excise tax gross-up (including “modified gross-ups”); |
| • | Tax Reimbursements related to executive perquisites or other payments such as personal use of corporate aircraft, executive life insurance, bonus, etc; (see also excise tax gross-ups above) |
| • | Dividends or dividend equivalents paid on unvested performance shares or units; |
| • | Executives using company stock in hedging activities, such as “cashless” collars, forward sales, equity swaps or other similar arrangements; or |
B-15
| • | Repricing or replacing of underwater stock options/stock appreciation rights without prior shareholder approval (including cash buyouts and voluntary surrender/subsequent regrant of underwater options). |
Incentives that may Motivate Excessive Risk-Taking
Assess company policies and disclosure related to compensation that could incentivize excessive risk-taking, for example:
| • | Guaranteed bonuses; |
| • | A single performance metric used for short- and long-term plans; |
| • | Lucrative severance packages; |
| • | High pay opportunities relative to industry peers; |
| • | Disproportionate supplemental pensions; or |
| • | Mega annual equity grants that provide unlimited upside with no downside risk. |
Factors that potentially mitigate the impact of risky incentives include rigorous claw-back provisions and robust stock ownership/holding guidelines.
Options Backdating
Vote CASE-by-CASE on options backdating issues. Generally, when a company has recently practiced options backdating, WITHHOLD from or vote AGAINST the compensation committee, depending on the severity of the practices and the subsequent corrective actions on the part of the board. When deciding on votes on compensation committee members who oversaw questionable options grant practices or current compensation committee members who fail to respond to the issue proactively, consider several factors, including, but not limited to, the following:
| • | Reason and motive for the options backdating issue, such as inadvertent vs. deliberate grant date changes; |
| • | Duration of options backdating; |
| • | Size of restatement due to options backdating; |
| • | Corrective actions taken by the board or compensation committee, such as canceling or re-pricing backdated options, the recouping of option gains on backdated grants; and |
| • | Adoption of a grant policy that prohibits backdating, and creates a fixed grant schedule or window period for equity grants in the future. |
A CASE-by-CASE analysis approach allows distinctions to be made between companies that had “sloppy” plan administration versus those that acted deliberately and/or committed fraud, as well as those companies that subsequently took corrective action. Cases where companies have committed fraud are considered most egregious.
Board Communications and Responsiveness
Consider the following factors on a CASE-BY-CASE basis when evaluating ballot items related to executive pay:
| • | Poor disclosure practices, including: |
| — | Unclear explanation of how the CEO is involved in the pay setting process; |
| — | Retrospective performance targets and methodology not discussed; |
| — | Methodology for benchmarking practices and/or peer group not disclosed and explained. |
B-16
| • | Board’s responsiveness to investor input and engagement on compensation issues, for example: |
| — | Failure to respond to majority-supported shareholder proposals on executive pay topics; or |
| — | Failure to respond to concerns raised in connection with significant opposition to MSOP proposals. |
Option Exchange Programs/Repricing Options
Vote CASE-by-CASE on management proposals seeking approval to exchange/reprice options, taking into consideration:
| • | Historic trading patterns—the stock price should not be so volatile that the options are likely to be back “in-the-money” over the near term; |
| • | Rationale for the re-pricing—was the stock price decline beyond management’s control? |
| • | Is this a value-for-value exchange? |
| • | Are surrendered stock options added back to the plan reserve? |
| • | Option vesting—does the new option vest immediately or is there a black-out period? |
| • | Term of the option—the term should remain the same as that of the replaced option; |
| • | Exercise price—should be set at fair market or a premium to market; |
| • | Participants—executive officers and directors should be excluded. |
If the surrendered options are added back to the equity plans for re-issuance, then also take into consideration the company’s total cost of equity plans and its three-year average burn rate.
In addition to the above considerations, evaluate the intent, rationale, and timing of the repricing proposal. The proposal should clearly articulate why the board is choosing to conduct an exchange program at this point in time. Repricing underwater options after a recent precipitous drop in the company’s stock price demonstrates poor timing. Repricing after a recent decline in stock price triggers additional scrutiny and a potential AGAINST vote on the proposal. At a minimum, the decline should not have happened within the past year. Also, consider the terms of the surrendered options, such as the grant date, exercise price and vesting schedule. Grant dates of surrendered options should be far enough back (two to three years) so as not to suggest that repricings are being done to take advantage of short-term downward price movements. Similarly, the exercise price of surrendered options should be above the 52-week high for the stock price.
Vote FOR shareholder proposals to put option repricings to a shareholder vote.
Shareholder Proposals on Compensation
Advisory Vote on Executive Compensation (Say-on-Pay)
Generally, vote FOR shareholder proposals that call for non-binding shareholder ratification of the compensation of the Named Executive Officers and the accompanying narrative disclosure of material factors provided to understand the Summary Compensation Table.
Golden Coffins/Executive Death Benefits
Generally vote FOR proposals calling companies to adopt a policy of obtaining shareholder approval for any future agreements and corporate policies that could oblige the company to make payments or awards following the death of a senior executive in the form of unearned salary or bonuses, accelerated vesting or the continuation in force of unvested equity grants, perquisites and other payments or awards made in lieu of compensation. This would not apply to any benefit programs or equity plan proposals that the broad-based employee population is eligible.
B-17
Recoup Bonuses
Vote on a CASE-BY-CASE on proposals to recoup unearned incentive bonuses or other incentive payments made to senior executives if it is later determined that the figures upon which incentive compensation is earned later turn out to have been in error. This is line with the clawback provision in the Trouble Asset Relief Program. Many companies have adopted policies that permit recoupment in cases where fraud, misconduct, or negligence significantly contributed to a restatement of financial results that led to the awarding of unearned incentive compensation. RMG will take into consideration:
| • | If the company has adopted a formal recoupment bonus policy; |
| • | If the company has chronic restatement history or material financial problems; or |
| • | If the company’s policy substantially addresses the concerns raised by the proponent. |
Stock Ownership or Holding Period Guidelines
Generally vote AGAINST shareholder proposals that mandate a minimum amount of stock that directors must own in order to qualify as a director or to remain on the board. While RMG favors stock ownership on the part of directors, the company should determine the appropriate ownership requirement.
Vote on a CASE-BY-CASE on shareholder proposals asking companies to adopt policies requiring Named Executive Officers to retain 75% of the shares acquired through compensation plans while employed and/or for two years following the termination of their employment, and to report to shareholders regarding this policy. The following factors will be taken into account:
| • | Whether the company has any holding period, retention ratio, or officer ownership requirements in place. These should consist of: |
| — | Rigorous stock ownership guidelines, or |
| — | A holding period requirement coupled with a significant long-term ownership requirement, or |
| — | A meaningful retention ratio, |
| • | Actual officer stock ownership and the degree to which it meets or exceeds the proponent’s suggested holding period/retention ratio or the company’s own stock ownership or retention requirements. |
| • | Problematic pay practices, current and past, which may promote a short-term versus a long-term focus. |
A rigorous stock ownership guideline should be at least 10x base salary for the CEO, with the multiple declining for other executives. A meaningful retention ratio should constitute at least 50 percent of the stock received from equity awards (on a net proceeds basis) held on a long-term basis, such as the executive’s tenure with the company or even a few years past the executive’s termination with the company.
6. Social/Environmental Issues:
Overall Approach
When evaluating social and environmental shareholder proposals, RMG considers the following factors:
| • | Whether adoption of the proposal is likely to enhance or protect shareholder value; |
| • | Whether the information requested concerns business issues that relate to a meaningful percentage of the company’s business as measured by sales, assets, and earnings; |
| • | The degree to which the company’s stated position on the issues raised in the proposal could affect its reputation or sales, or leave it vulnerable to a boycott or selective purchasing; |
| • | Whether the issues presented are more appropriately/effectively dealt with through governmental or company-specific action; |
B-18
| • | Whether the company has already responded in some appropriate manner to the request embodied in the proposal; |
| • | Whether the company’s analysis and voting recommendation to shareholders are persuasive; |
| • | What other companies have done in response to the issue addressed in the proposal; |
| • | Whether the proposal itself is well framed and the cost of preparing the report is reasonable; |
| • | Whether implementation of the proposal’s request would achieve the proposal’s objectives; |
| • | Whether the subject of the proposal is best left to the discretion of the board; |
| • | Whether the requested information is available to shareholders either from the company or from a publicly available source; and |
| • | Whether providing this information would reveal proprietary or confidential information that would place the company at a competitive disadvantage. |
Board Diversity
Generally vote FOR requests for reports on the company’s efforts to diversify the board, unless:
| • | The gender and racial minority representation of the company’s board is reasonably inclusive in relation to companies of similar size and business; and |
| • | The board already reports on its nominating procedures and gender and racial minority initiatives on the board and within the company. |
Vote CASE-BY-CASE on proposals asking the company to increase the gender and racial minority representation on its board, taking into account:
| • | The degree of existing gender and racial minority diversity on the company’s board and among its executive officers; |
| • | The level of gender and racial minority representation that exists at the company’s industry peers; |
| • | The company’s established process for addressing gender and racial minority board representation; |
| • | Whether the proposal includes an overly prescriptive request to amend nominating committee charter language; |
| • | The independence of the company’s nominating committee; |
| • | The company uses an outside search firm to identify potential director nominees; and |
| • | Whether the company has had recent controversies, fines, or litigation regarding equal employment practices. |
Gender Identity, Sexual Orientation, and Domestic Partner Benefits
Generally vote FOR proposals seeking to amend a company’s EEO statement or diversity policies to prohibit discrimination based on sexual orientation and/or gender identity, unless the change would result in excessive costs for the company.
Generally vote AGAINST proposals to extend company benefits to, or eliminate benefits from domestic partners. Decisions regarding benefits should be left to the discretion of the company.
Greenhouse Gas (GHG) Emissions
Generally vote FOR proposals requesting a report on greenhouse gas (GHG) emissions from company operations and/or products and operations, unless:
| • | The company already provides current, publicly-available information on the impacts that GHG emissions may have on the company as well as associated company policies and procedures to address related risks and/or opportunities; |
B-19
| • | The company’s level of disclosure is comparable to that of industry peers; and |
| • | There are no significant, controversies, fines, penalties, or litigation associated with the company’s GHG emissions. |
Vote CASE-BY-CASE on proposals that call for the adoption of GHG reduction goals from products and operations, taking into account:
| • | Overly prescriptive requests for the reduction in GHG emissions by specific amounts or within a specific time frame; |
| • | Whether company disclosure lags behind industry peers; |
| • | Whether the company has been the subject of recent, significant violations, fines, litigation, or controversy related to GHG emissions; |
| • | The feasibility of reduction of GHGs given the company’s product line and current technology and; |
| • | Whether the company already provides meaningful disclosure on GHG emissions from its products and operations. |
Political Contributions and Trade Association Spending
Generally vote AGAINST proposals asking the company to affirm political nonpartisanship in the workplace so long as:
| • | There are no recent, significant controversies, fines or litigation regarding the company’s political contributions or trade association spending; and |
| • | The company has procedures in place to ensure that employee contributions to company-sponsored political action committees (PACs) are strictly voluntary and prohibits coercion. |
Vote AGAINST proposals to publish in newspapers and public media the company’s political contributions. Such publications could present significant cost to the company without providing commensurate value to shareholders.
Vote CASE-BY-CASE on proposals to improve the disclosure of a company’s political contributions and trade association spending, considering:
| • | Recent significant controversy or litigation related to the company’s political contributions or governmental affairs; and |
| • | The public availability of a company policy on political contributions and trade association spending including information on the types of organizations supported, the business rationale for supporting these organizations, and the oversight and compliance procedures related to such expenditures of corporate assets. |
Vote AGAINST proposals barring the company from making political contributions. Businesses are affected by legislation at the federal, state, and local level and barring political contributions can put the company at a competitive disadvantage.
Vote AGAINST proposals asking for a list of company executives, directors, consultants, legal counsels, lobbyists, or investment bankers that have prior government service and whether such service had a bearing on the business of the company. Such a list would be burdensome to prepare without providing any meaningful information to shareholders.
Labor and Human Rights Standards
Generally vote FOR proposals requesting a report on company or company supplier labor and/or human rights standards and policies unless such information is already publicly disclosed.
Vote CASE-BY-CASE on proposals to implement company or company supplier labor and/or human rights standards and policies, considering:
| • | The degree to which existing relevant policies and practices are disclosed; |
B-20
| • | Whether or not existing relevant policies are consistent with internationally recognized standards; |
| • | Whether company facilities and those of its suppliers are monitored and how; |
| • | Company participation in fair labor organizations or other internationally recognized human rights initiatives; |
| • | Scope and nature of business conducted in markets known to have higher risk of workplace labor/human rights abuse; |
| • | Recent, significant company controversies, fines, or litigation regarding human rights at the company or its suppliers; |
| • | The scope of the request; and |
| • | Deviation from industry sector peer company standards and practices. |
Sustainability Reporting
Generally vote FOR proposals requesting the company to report on its policies, initiatives, and oversight mechanisms related to social, economic, and environmental sustainability, unless:
| • | The company already discloses similar information through existing reports or policies such as an Environment, Health, and Safety (EHS) report; a comprehensive Code of Corporate Conduct; and/or a Diversity Report; or |
| • | The company has formally committed to the implementation of a reporting program based on Global Reporting Initiative (GRI) guidelines or a similar standard within a specified time frame. |
RiskMetrics Group’s International Proxy Voting Guidelines Summary
(Digest of Selected Key Guidelines)
December 31, 2009
1. Operational Items:
Financial Results/Director and Auditor Reports
Vote FOR approval of financial statements and director and auditor reports, unless:
| • | There are concerns about the accounts presented or audit procedures used; or |
| • | The company is not responsive to shareholder questions about specific items that should be publicly disclosed. |
Appointment of Auditors and Auditor Fees
Vote FOR the reelection of auditors and proposals authorizing the board to fix auditor fees, unless:
| • | There are serious concerns about the accounts presented or the audit procedures used; |
| • | The auditors are being changed without explanation; or |
| • | Non-audit-related fees are substantial or are routinely in excess of standard annual audit-related fees. |
Vote AGAINST the appointment of external auditors if they have previously served the company in an executive capacity or can otherwise be considered affiliated with the company.
Appointment of Internal Statutory Auditors
Vote FOR the appointment or reelection of statutory auditors, unless:
| • | There are serious concerns about the statutory reports presented or the audit procedures used; |
| • | Questions exist concerning any of the statutory auditors being appointed; or |
B-21
| • | The auditors have previously served the company in an executive capacity or can otherwise be considered affiliated with the company. |
Allocation of Income
Vote FOR approval of the allocation of income, unless:
| • | The dividend payout ratio has been consistently below 30 percent without adequate explanation; or |
| • | The payout is excessive given the company’s financial position. |
Stock (Scrip) Dividend Alternative
Vote FOR most stock (scrip) dividend proposals.
Vote AGAINST proposals that do not allow for a cash option unless management demonstrates that the cash option is harmful to shareholder value.
Amendments to Articles of Association
Vote amendments to the articles of association on a CASE-BY-CASE basis.
Change in Company Fiscal Term
Vote FOR resolutions to change a company’s fiscal term unless a company’s motivation for the change is to postpone its AGM.
Lower Disclosure Threshold for Stock Ownership
Vote AGAINST resolutions to lower the stock ownership disclosure threshold below 5 percent unless specific reasons exist to implement a lower threshold.
Amend Quorum Requirements
Vote proposals to amend quorum requirements for shareholder meetings on a CASE-BY-CASE basis.
Transact Other Business
Vote AGAINST other business when it appears as a voting item.
2. Board of Directors:
Director Elections
Vote FOR management nominees in the election of directors, unless:
| • | Adequate disclosure has not been provided in a timely manner; |
| • | There are clear concerns over questionable finances or restatements; |
| • | There have been questionable transactions with conflicts of interest; |
| • | There are any records of abuses against minority shareholder interests; or |
| • | The board fails to meet minimum corporate governance standards. |
Vote FOR individual nominees unless there are specific concerns about the individual, such as criminal wrongdoing or breach of fiduciary responsibilities.
Vote AGAINST individual directors if repeated absences at board meetings have not been explained (in countries where this information is disclosed).
Vote on a CASE-BY-CASE basis for contested elections of directors, e.g. the election of shareholder nominees or the dismissal of incumbent directors, determining which directors are best suited to add value for shareholders.
B-22
Vote FOR employee and/or labor representatives if they sit on either the audit or compensation committee and are required by law to be on those committees. Vote AGAINST employee and/or labor representatives if they sit on either the audit or compensation committee, if they are not required to be on those committees.
Under extraordinary circumstances, vote AGAINST or WITHHOLD from directors individually, on a committee, or the entire board, due to:
| • | Material failures of governance, stewardship, or fiduciary responsibilities at the company; or |
| • | Failure to replace management as appropriate; or |
| • | Egregious actions related to the director(s)’ service on other boards that raise substantial doubt about his or her ability to effectively oversee management and serve the best interests of shareholders at any company. |
Discharge of Directors
Generally vote FOR the discharge of directors, including members of the management board and/or supervisory board, unless there is reliable information about significant and compelling controversies that the board is not fulfilling its fiduciary duties warranted by:
| • | A lack of oversight or actions by board members which invoke shareholder distrust related to malfeasance or poor supervision, such as operating in private or company interest rather than in shareholder interest; or |
| • | Any legal issues (e.g. civil/criminal) aiming to hold the board responsible for breach of trust in the past or related to currently alleged actions yet to be confirmed (and not only the fiscal year in question), such as price fixing, insider trading, bribery, fraud, and other illegal actions; or |
| • | Other egregious governance issues where shareholders will bring legal action against the company or its directors. |
For markets which do not routinely request discharge resolutions (e.g. common law countries or markets where discharge is not mandatory), analysts may voice concern in other appropriate agenda items, such as approval of the annual accounts or other relevant resolutions, to enable shareholders to express discontent with the board.
Director Compensation
Vote FOR proposals to award cash fees to non-executive directors unless the amounts are excessive relative to other companies in the country or industry.
Vote non-executive director compensation proposals that include both cash and share-based components on a CASE-BY-CASE basis.
Vote proposals that bundle compensation for both non-executive and executive directors into a single resolution on a CASE-BY-CASE basis.
Vote AGAINST proposals to introduce retirement benefits for non-executive directors.
Director, Officer, and Auditor Indemnification and Liability Provisions
Vote proposals seeking indemnification and liability protection for directors and officers on a CASE-BY-CASE basis.
Vote AGAINST proposals to indemnify auditors.
Board Structure
Vote FOR proposals to fix board size.
Vote AGAINST the introduction of classified boards and mandatory retirement ages for directors.
Vote AGAINST proposals to alter board structure or size in the context of a fight for control of the company or the board.
B-23
3. Capital Structure:
Share Issuance Requests
General Issuances:
Vote FOR issuance requests with preemptive rights to a maximum of 100 percent over currently issued capital.
Vote FOR issuance requests without preemptive rights to a maximum of 20 percent of currently issued capital.
Specific Issuances:
Vote on a CASE-BY-CASE basis on all requests, with or without preemptive rights.
Increases in Authorized Capital
Vote FOR non-specific proposals to increase authorized capital up to 100 percent over the current authorization unless the increase would leave the company with less than 30 percent of its new authorization outstanding.
Vote FOR specific proposals to increase authorized capital to any amount, unless:
| • | The specific purpose of the increase (such as a share-based acquisition or merger) does not meet RMG guidelines for the purpose being proposed; or |
| • | The increase would leave the company with less than 30 percent of its new authorization outstanding after adjusting for all proposed issuances. |
Vote AGAINST proposals to adopt unlimited capital authorizations.
Reduction of Capital
Vote FOR proposals to reduce capital for routine accounting purposes unless the terms are unfavorable to shareholders.
Vote proposals to reduce capital in connection with corporate restructuring on a CASE-BY-CASE basis.
Capital Structures
Vote FOR resolutions that seek to maintain or convert to a one-share, one-vote capital structure.
Vote AGAINST requests for the creation or continuation of dual-class capital structures or the creation of new or additional supervoting shares.
Preferred Stock
Vote FOR the creation of a new class of preferred stock or for issuances of preferred stock up to 50 percent of issued capital unless the terms of the preferred stock would adversely affect the rights of existing shareholders.
Vote FOR the creation/issuance of convertible preferred stock as long as the maximum number of common shares that could be issued upon conversion meets RMG guidelines on equity issuance requests.
Vote AGAINST the creation of a new class of preference shares that would carry superior voting rights to the common shares.
Vote AGAINST the creation of blank check preferred stock unless the board clearly states that the authorization will not be used to thwart a takeover bid.
Vote proposals to increase blank check preferred authorizations on a CASE-BY-CASE basis.
Debt Issuance Requests
Vote non-convertible debt issuance requests on a CASE-BY-CASE basis, with or without preemptive rights.
B-24
Vote FOR the creation/issuance of convertible debt instruments as long as the maximum number of common shares that could be issued upon conversion meets RMG guidelines on equity issuance requests.
Vote FOR proposals to restructure existing debt arrangements unless the terms of the restructuring would adversely affect the rights of shareholders.
Pledging of Assets for Debt
Vote proposals to approve the pledging of assets for debt on a CASE-BY-CASE basis.
Increase in Borrowing Powers
Vote proposals to approve increases in a company’s borrowing powers on a CASE-BY-CASE basis.
Share Repurchase Plans
Generally vote FOR share repurchase programs/market repurchase authorities, provided that the proposal meets the following parameters:
| • | Maximum volume: 10 percent for market repurchase within any single authority and 10 percent of outstanding shares to be kept in treasury (“on the shelf”); |
| • | Duration does not exceed 18 months. |
For markets that either generally do not specify the maximum duration of the authority or seek a duration beyond 18 months that is allowable under market specific legislation, RMG will assess the company’s historic practice. If there is evidence that a company has sought shareholder approval for the authority to repurchase shares on an annual basis, RMG will support the proposed authority.
In addition, vote AGAINST any proposal where:
| • | The repurchase can be used for takeover defenses; |
| • | There is clear evidence of abuse; |
| • | There is no safeguard against selective buybacks; |
| • | Pricing provisions and safeguards are deemed to be unreasonable in light of market practice. |
RMG may support share repurchase plans in excess of 10 percent volume under exceptional circumstances, such as one-off company specific events (e.g. capital re-structuring). Such proposals will be assessed case-by-case based on merits, which should be clearly disclosed in the annual report, provided that following conditions are met:
| • | The overall balance of the proposed plan seems to be clearly in shareholders’ interests; |
| • | The plan still respects the 10 percent maximum of shares to be kept in treasury. |
Reissuance of Repurchased Shares
Vote FOR requests to reissue any repurchased shares unless there is clear evidence of abuse of this authority in the past.
Capitalization of Reserves for Bonus Issues/Increase in Par Value
Vote FOR requests to capitalize reserves for bonus issues of shares or to increase par value.
4. Other Items:
Reorganizations/Restructurings
Vote reorganizations and restructurings on a CASE-BY-CASE basis.
B-25
Mergers and Acquisitions
Vote CASE-BY-CASE on mergers and acquisitions taking into account the following:
For every M&A analysis, RMG reviews publicly available information as of the date of the report and evaluates the merits and drawbacks of the proposed transaction, balancing various and sometimes countervailing factors including:
| • | Valuation—Is the value to be received by the target shareholders (or paid by the acquirer) reasonable? While the fairness opinion may provide an initial starting point for assessing valuation reasonableness, RMG places emphasis on the offer premium, market reaction, and strategic rationale. |
| • | Market reaction—How has the market responded to the proposed deal? A negative market reaction will cause RMG to scrutinize a deal more closely. |
| • | Strategic rationale—Does the deal make sense strategically? From where is the value derived? Cost and revenue synergies should not be overly aggressive or optimistic, but reasonably achievable. Management should also have a favorable track record of successful integration of historical acquisitions. |
| • | Conflicts of interest—Are insiders benefiting from the transaction disproportionately and inappropriately as compared to non-insider shareholders? RMG will consider whether any special interests may have influenced these directors and officers to support or recommend the merger. |
| • | Governance—Will the combined company have a better or worse governance profile than the current governance profiles of the respective parties to the transaction? If the governance profile is to change for the worse, the burden is on the company to prove that other issues (such as valuation) outweigh any deterioration in governance. |
Vote AGAINST if the companies do not provide sufficient information upon request to make an informed voting decision.
Mandatory Takeover Bid Waivers
Vote proposals to waive mandatory takeover bid requirements on a CASE-BY-CASE basis.
Reincorporation Proposals
Vote reincorporation proposals on a CASE-BY-CASE basis.
Expansion of Business Activities
Vote FOR resolutions to expand business activities unless the new business takes the company into risky areas.
Related-Party Transactions
Vote related-party transactions on a CASE-BY-CASE basis.
In evaluating resolutions that seek shareholder approval on related party transactions (RPTs), vote on a case-by-case basis, considering factors including, but not limited to, the following:
| • | the parties on either side of the transaction; |
| • | the nature of the asset to be transferred/service to be provided; |
| • | the pricing of the transaction (and any associated professional valuation); |
| • | the views of independent directors (where provided); |
| • | the views of an independent financial adviser (where appointed); |
| • | whether any entities party to the transaction (including advisers) is conflicted; and |
| • | the stated rationale for the transaction, including discussions of timing. |
B-26
If there is a transaction that RMG deemed problematic and that was not put to a shareholder vote, RMG may recommend against the election of the director involved in the related-party transaction or the full board.
Compensation Plans
Vote compensation plans on a CASE-BY-CASE basis.
Antitakeover Mechanisms
Generally vote AGAINST all antitakeover proposals, unless they are structured in such a way that they give shareholders the ultimate decision on any proposal or offer.
Shareholder Proposals
Vote all shareholder proposals on a CASE-BY-CASE basis.
Vote FOR proposals that would improve the company’s corporate governance or business profile at a reasonable cost.
Vote AGAINST proposals that limit the company’s business activities or capabilities or result in significant costs being incurred with little or no benefit.
B-27
MAI-FINCTFI-0911D
Mutual Funds
Nuveen Municipal Bond Funds
Dependable, tax-free income because it’s not what you earn, it’s what you keep.®
Annual Report
May 31, 2011
| Share Class / Ticker Symbol | ||||||||
| Fund Name | Class A | Class B | Class C | Class I | ||||
Nuveen Kansas Municipal Bond Fund | FKSTX | FBKSX | FCKSX | FRKSX | ||||
Nuveen Kentucky Municipal Bond Fund | FKYTX | FKYBX | FKYCX | FKYRX | ||||
Nuveen Michigan Municipal Bond Fund | FMITX | FMIBX | FLMCX | NMMIX | ||||
Nuveen Missouri Municipal Bond Fund | FMOTX | FMMBX | FMOCX | FMMRX | ||||
Nuveen Ohio Municipal Bond Fund | FOHTX | FOHBX | FOHCX | NXOHX | ||||
Nuveen Wisconsin Municipal Bond Fund | FWIAX | FWIBX | FWICX | FWIRX | ||||
INVESTMENT ADVISER NAME CHANGE
Effective January 1, 2011, Nuveen Asset Management, the Funds’ investment adviser, changed its name to Nuveen Fund Advisors, Inc. (“Nuveen Fund Advisors”). Concurrently, Nuveen Fund Advisors formed a wholly-owned subsidiary, Nuveen Asset Management, LLC, to house its portfolio management capabilities.
NUVEEN INVESTMENTS COMPLETES STRATEGIC COMBINATION WITH FAF ADVISORS
On December 31, 2010, Nuveen Investments completed the strategic combination between Nuveen Asset Management, the largest investment affiliate of Nuveen Investments, and FAF Advisors. As part of this transaction, U.S. Bancorp — the parent of FAF Advisors — received cash consideration and a 9.5% stake in Nuveen Investments in exchange for the long-term investment business of FAF Advisors, including investment-management responsibilities for the non-money market mutual funds of the First American Funds family.
The approximately $27 billion of mutual fund and institutional assets managed by FAF Advisors, along with the investment professionals managing these assets and other key personnel, have become part of Nuveen Asset Management, LLC. With these additions to Nuveen Asset Management, LLC, this affiliate now manages more than $100 billion of assets across a broad range of strategies from municipal and taxable fixed income to traditional and specialized equity investments.
This combination does not affect the investment objectives or strategies of the Funds in this report. Over time, Nuveen Investments expects that the combination will provide even more ways to meet the needs of investors who work with financial advisors and consultants by enhancing the multi-boutique model of Nuveen Investments, which also includes highly respected investment teams at HydePark, NWQ Investment Management, Santa Barbara Asset Management, Symphony Asset Management, Tradewinds Global Investors and Winslow Capital. Nuveen Investments managed approximately $206 billion of assets as of March 31, 2011.
| Must be preceded by or accompanied by a prospectus. | NOT FDIC INSURED | MAY LOSE VALUE | NO BANK GUARANTEE |
| 4 | ||||
| 5 | ||||
| 15 | ||||
| 28 | ||||
| 30 | ||||
| 32 | ||||
| 34 | ||||
| 35 | ||||
| 73 | ||||
| 74 | ||||
| 75 | ||||
| 78 | ||||
| 90 | ||||
| 100 | ||||
| 104 | ||||
| 110 | ||||
| 111 | ||||
Letter to Shareholders

Dear Shareholders,
In 2010, the global economy recorded another year of recovery from the financial and economic crises of 2008, but many of the factors that caused the downturn still weigh on the prospects for continued improvement. In the U.S., ongoing weakness in housing values has put pressure on homeowners and mortgage lenders. Similarly, the strong earnings recovery for corporations and banks is only slowly being translated into increased hiring or more active lending. Globally, deleveraging by private and public borrowers has inhibited economic growth and that process is far from complete.
Encouragingly, constructive actions are being taken by governments around the world to deal with economic issues. In the U.S., the recent passage of a stimulatory tax bill relieved some of the pressure on the Federal Reserve to promote economic expansion through quantitative easing and offers the promise of sustained economic growth. A number of European governments are undertaking programs that could significantly reduce their budget deficits. Governments across the emerging markets are implementing various steps to deal with global capital flows without undermining international trade and investment.
The success of these government actions could determine whether 2011 brings further economic recovery and financial market progress. One risk associated with the extraordinary efforts to strengthen U.S. economic growth is that the debt of the U.S. government will continue to grow to unprecedented levels. Another risk is that over time there could be inflationary pressures on asset values in the U.S. and abroad, because what happens in the U.S. impacts the rest of the world economy. Also, these various actions are being taken in a setting of heightened global economic uncertainty, primarily about the supplies of energy and other critical commodities. In this challenging environment, your Nuveen investment team continues to seek sustainable investment opportunities and to remain alert to potential risks in a recovery still facing many headwinds. On your behalf, we monitor their activities to assure they maintain their investment disciplines.
As you will note elsewhere in this report, on December 31, 2010, Nuveen Investments completed a strategic combination with FAF Advisors, Inc., the manager of the First American Funds. The combination adds highly respected and distinct investment teams to meet the needs of investors and their advisors and is designed to benefit all fund shareholders by creating a fund organization with the potential for further economies of scale and the ability to draw from even greater talent and expertise to meet those investor needs.
As always, I encourage you to contact your financial consultant if you have any questions about your investment in a Nuveen Fund. On behalf of the other members of your Fund Board, we look forward to continuing to earn your trust in the months and years ahead.
Sincerely,

Robert P. Bremner
Chairman of the Board
July 21, 2011
| 4 | Nuveen Investments |
Certain statements in this report are forward-looking statements. Discussions of specific investments are for illustration only and are not intended as recommendations of individual investments. The forward-looking statements and other views expressed herein are those of the portfolio managers as of the date of this report. Actual future results or occurrences may differ significantly from those anticipated in any forward-looking statements and the views expressed herein are subject to change at any time, due to numerous market and other factors. The Funds disclaim any obligation to update publicly or revise any forward-looking statements or views expressed herein.
Any reference to credit ratings for portfolio holdings denotes the highest rating assigned by a Nationally Recognized Statistical Rating Organization (NRSRO) such as Standard & Poor’s (S&P), Moody’s or Fitch. AAA, AA, A and BBB ratings are investment grade; BB, B, CCC, CC, C and D ratings are below investment grade. Holdings and ratings may change over time.
Portfolio managers Daniel Close, CFA, Steven Hlavin and Chris Drahn, CFA, examine economic and market conditions, key investment strategies and the performance of the Nuveen Kansas Municipal Bond Fund, the Nuveen Kentucky Municipal Bond Fund, the Nuveen Michigan Municipal Bond Fund, the Nuveen Missouri Municipal Bond Fund, the Nuveen Ohio Municipal Bond Fund and the Nuveen Wisconsin Municipal Bond Fund. Dan, who has 13 years of investment experience, has managed the Kentucky, Michigan and Ohio Funds since 2007. Steve, with eight years of investment experience, has managed the Kansas and Wisconsin Funds since January 2011. Chris, who has 31 years of investment experience, has managed the Missouri Fund since January 2011.
What factors had the greatest influence on the U.S. economy and the national municipal market during the twelve-month period ending May 31, 2011?
During this period, the U.S. economy demonstrated some signs of modest improvement, supported by the efforts of both the Federal Reserve (Fed) and the federal government. For its part, the Fed continued to hold the benchmark fed funds rate in a target range of zero to 0.25% since cutting it to this record low level in December 2008. At its June
2011 meeting (following the end of this reporting period), the central bank stated that it anticipated keeping the fed funds rate at “exceptionally low levels” for an “extended period.” The Fed also completed its second round of quantitative easing with the purchase of $600 billion in longer-term U.S. Treasury bonds. The goal of this plan was to lower long-term interest rates and thereby stimulate economic activity and create jobs. The federal government continued to focus on implementing the economic stimulus package passed in early 2009 and aimed at providing job creation, tax relief, fiscal assistance to state and local governments, and expansion of unemployment benefits and other federal social welfare programs.
In the first quarter of 2011, the U.S. economy, as measured by the U.S. gross domestic product (GDP), grew at an annualized rate of 1.9%, marking the seventh consecutive quarter of positive growth. The employment situation slowly improved, with the national jobless rate registering 9.1% in May 2011, down from 9.6% a year earlier. While the Fed’s longer-term inflation expectations remained stable, inflation over this period posted its largest twelve-month gain since October 2008, as the Consumer Price Index (CPI) rose 3.6% year-over-year as of May 2011. The core CPI (which excludes food and energy) increased 1.5%, staying within the Fed’s unofficial objective of 2.0% or lower for this measure. The housing market remained a major weak spot in the economy. For the twelve months ended April 2011 (most recent data available at the time this report was prepared), the average home price in the Standard & Poor’s (S&P)/Case-Shiller Index of 20 major metropolitan areas lost 4.0%, with six of the 20 metropolitan areas hitting their lowest levels since housing prices peaked in 2006.
| Nuveen Investments | 5 |
The municipal bond market was affected by a significant decline in new tax exempt issuance during this period. One reason for the decrease in new tax-exempt supply was the heavy issuance of taxable municipal debt in 2010 under the Build America Bond (BAB) program, which was created as part of the American Recovery and Reinvestment Act of February 2009 and expired on December 31, 2010. Between the beginning of this reporting period on June 1, 2010, and the end of the BAB program, taxable BAB issuance totaled $74.5 billion, accounting for 28% of new bonds issued in the municipal market.
After rallying strongly during the first part of the period, the municipal market suffered a reversal in mid-November 2010, due largely to investor concerns about inflation, the federal deficit, and the deficit’s impact on demand for U.S. Treasury securities. Adding to this market pressure was media coverage of the strained finances of some state and local governments. As a result, money began to flow out of municipal mutual funds as yields rose and valuations declined. As we moved into the second quarter of 2011, we saw the environment in the municipal market improve.
Over the twelve months ended May 31, 2011, municipal bond issuance nationwide — both tax-exempt and taxable — totaled $335.7 billion, a decrease of 15% compared with the issuance of the twelve-month period ended May 31, 2010. For the first five months of 2011, municipal issuance nationwide was down 50% from the first five months of 2010. This decline reflects the heavy issuance of BABs at the end of 2010, as borrowers took advantage of the program’s favorable terms before its expiration at year end.
What type of economic environment did the six states profiled in this report experience?
The Kansas economy continued to struggle in the wake of the recent recession. Employment growth lagged the rest of the nation, largely due to job cuts in construction and state government. However, the Kansas unemployment rate stood at 6.6% at the end of the reporting period, comparing very favorably to a national rate of 9.1%. According to Moody’s Economy.com, manufacturing is expected to be a key to Kansas’s long-term recovery, as hiring is projected to accelerate in this high-wage industry. Moody’s also anticipates that consumer spending should pick up in the next year, as a result of the improving labor market and better household finances. Recently, Kansas has seen a rebound in tax revenues as a result of last year’s increase in the state sales tax and the rise in personal income, but spending cuts will be required to close the $550 million budget gap anticipated for the coming fiscal year. Kansas bond issuance totaled $2.6 billion for the period ended May 31, 2011, representing a 32.0% drop year over year, while issuance nationwide dropped a more modest 15.1% during the same time frame. Kansas bonds continue to boast above-average credit quality with a rating of Aa1 from Moody’s as of May 31, 2011.
Kentucky continued to face financial stress from declining revenues and a budgetary imbalance. After depleting all of its fiscal reserves in 2009 as a means to help close a budget gap, the state’s reserve levels moved into positive territory in 2010 with a slim $2.5 million at its disposal. Kentucky’s general fund ended fiscal 2010 with a net surplus of $51 million, which reflects a positive improvement over the prior year’s deficit. The $17 billion budget approved for the fiscal 2011-2012 biennium addressed a $1.5 billion
| 6 | Nuveen Investments |
projected shortfall through a mix of one-time and recurring measures, including state agency cuts. In fiscal 2011, additional spending reductions have been necessary as a $100 million budget shortfall was anticipated in November 2010, due to the state’s overestimate of Medicaid revenue. The fiscal 2011 budget is structured to result in an ending balance of $281 million, to provide for adequate resources for the fiscal 2012 budget in the absence of federal stimulus funding. Despite these budgetary challenges, Kentucky is seeing signs of economic recovery, with state tax receipts, sales taxes and corporate income tax receipts on the rise, fueled in recent months by stronger manufacturing performance, according to Moody’s Economy.com. As of May 31, 2011, Kentucky’s unemployment rate was 9.8%, higher than all but seven other states but still its lowest level in more than two years. Kentucky issued nearly $4.7 billion in municipal bonds during the reporting period, representing a 4.7% increase over the prior 12 months and significantly exceeding the 15.1% decline in national bond issuance during the same time frame. The state maintained a credit rating of AA- from S&P but was downgraded to Aa2 by Moody’s in March 2011.
Michigan’s economy may finally be seeing the light at the end of the tunnel, according to Moody’s Economy.com. After a decade of recession, Michigan is poised for recovery in tandem with the resurging U.S. automotive industry, where improving vehicle sales have resulted in more hiring and an expansion of headquarters, production and R&D facilities. Additionally, a profit-sharing program by U.S. automakers will benefit their employees financially, allowing them to shore up their household finances and pump retail sales dollars back into the local economy, while simultaneously generating tax revenue for the state. At present, however, unemployment remains high at 10.3%, among the worst in the nation and significantly above the national average of 9.1%, and the housing sector and payroll figures have yet to stabilize. The state government will continue to struggle to provide services to Michigan residents, following years of spending cuts, and a $1.8 billion shortfall is expected for fiscal 2012, primarily from the state’s general fund. Local governments are still suffering from declining property-tax revenues, most notably in the Detroit and Lansing areas. Michigan issued $5.9 billion in municipal bonds during the reporting period, a year-over-year decline of 22.0%, while national issuance dropped 15.1%. Michigan’s general obligation debt retained its ratings of Aa2 from Moody’s and AA- from S&P.
For 2010, Missouri posted GDP growth of 1.4%, compared with the national measure of 2.6%, which ranked Missouri 39th in percentage GDP growth by state. Although this represented a significant turnaround from 2009, when Missouri’s economy contracted 3.8%, the state’s heavy reliance on the manufacturing sector has hampered its ability to more fully participate in recovery. In May 2011, the jobless rate in Missouri was 8.9%, its lowest level since March 2009, down from 9.5% in May 2010. In May 2011, the Missouri legislature approved a $23.2 billion state budget for fiscal 2012 that cut funding for colleges and universities by 5.5% and held basic aid for K-12 education flat. As of May 2011, Moody’s and S&P rated Missouri general obligation debt at Aaa and AAA, respectively, with stable outlooks. During the twelve months ended May 31, 2011, municipal issuance in Missouri was down 28% from the previous twelve-month period, to $4.6 billion.
| Nuveen Investments | 7 |
Ohio’s economic recovery stumbled during the reporting period, primarily in the area of job growth. Although Ohio’s unemployment rate measured 8.6% as of May 31, 2011 — well below its level of 10.2% from one year ago and below the national average of 9.1% — the state was among the worst in the nation for job growth, as nearly all employment gains from early 2010 were wiped out. Ohio’s manufacturing sector, which accounts for 12% of all jobs in the state, has moderated due to productivity gains and rising commodity prices, but favorable domestic demand, a thriving export market and the rebound in U.S. vehicle sales suggest that prospects are improving. Although the state’s heavy reliance on jobs in the manufacturing industry has been challenging to Ohio’s economy, employment gains have been sustainable in the education/health services and leisure/hospitality services sectors. Ohio’s general obligation debt continues to carry a rating of Aa1 from Moody’s and AA+ from S&P. The state issued $12.8 billion in municipal bonds during the twelve months ending May 31, 2011, an increase of 14.7% compared to a decline of 15.1% nationwide.
Wisconsin’s unemployment rate continued to trend below national levels, measuring 7.4% at the end of the reporting period, compared to the U.S. average of 9.1%. The state’s job losses have been primarily from the manufacturing sector, where the concentration of jobs has dropped from 17% of state employment in 2009 to 15.7% in 2010, yet remained well above the national average of 8.9%. Wisconsin’s economic recovery is expected to gain ground in 2011, as the state has a high concentration of jobs in machine tools and other capital goods producers — industries that are expected to benefit from stronger business investment spending in 2011. The state’s general fund has maintained a deficit for over a decade, reaching a substantial $2.94 billion as of June 30, 2010. However, the state closed fiscal 2010 with a positive cash balance of $383 million, a significant improvement over earlier estimates. Going forward, Wisconsin faces a $3.6 billion shortfall for the 2011-13 biennium. Governor Scott Walker’s proposed budget closes the gap with reductions in spending for education, the University of Wisconsin system, Medicaid and state aid to local governments. The plan also calls for selling $1.4 billion in new debt, of which $732 million would be general obligation debt. At period end, Wisconsin’s general obligation debt carried a rating of Aa2 from Moody’s and AA from S&P. The state issued $4.6 billion in municipal bonds during the 12 months ending May 31, 2011, a decrease of 11.9% compared to a decline of 15.1% nationwide.
How did the Funds perform during the twelve-month period?
The tables in the Fund Performance and Expense Ratios section of this report provide Class A Share total returns for the Funds for the one-year, five-year and ten-year periods ending May 31, 2011. Each Fund’s total returns are compared with the performance of its corresponding market indexes and peer group averages.
During the twelve-month period, the Class A Shares at net asset value (NAV) of the Missouri Fund outpaced the Standard & Poor’s (S&P) National Municipal Bond Index, while the Kansas, Kentucky, Michigan, Ohio and Wisconsin Funds lagged the index to varying degrees. The Ohio Fund outpaced its state-specific S&P municipal bond index, while the Kansas, Kentucky, Michigan, Missouri and Wisconsin Funds lagged their corresponding state municipal bond indexes. All of the Funds beat their corresponding Lipper state-level peer group average.
| 8 | Nuveen Investments |
What strategies were used to manage the Funds during the reporting period? How did these strategies influence performance?
All of the Funds continued to employ the same fundamental investment strategies and tactics used in previous years. Nuveen municipal bond portfolios are managed with a value-oriented approach and rely upon input from Nuveen’s experienced research team. Below we highlight the specific factors influencing each Fund’s investment strategy, as well as how we managed each portfolio in light of recent market conditions.
Nuveen Kansas and Wisconsin Municipal Bond Funds
Compared with the Standard & Poor’s (S&P) National Municipal Bond Index, the Kansas Fund’s duration positioning was advantageous, meaning that the portfolio’s added interest-rate sensitivity helped as rates declined modestly on balance. Security selection was also favorable, as a number of bonds in the portfolio performed relatively well, combining to provide a measurably positive impact on performance.
Meanwhile, credit quality and sector positioning had a mixed performance impact. Returns modestly suffered from the portfolio’s overweighting in non-rated bonds, and a slight underweighting in AAA-rated bonds also hurt, as these very high-quality securities outperformed their counterparts with weaker credit ratings. The Fund, however, was helped by its increased allocation to longer-dated bonds of sub-investment-grade quality.
On a sector basis, overweighting health care, especially hospital bonds, detracted in relative terms, though the portfolio’s exposure to strong-performing housing credits was a counterbalancing positive.
Most of the new purchases for the Kansas Fund took place in the second half of the reporting period. When possible, we capitalized on depressed market conditions to buy tax-exempt securities offering what we believed were attractive income streams and selling for lower-than-deserved prices. Purchases fitting this theme included several continuing care retirement community bonds; an A-rated state university bond; A-rated public utility bonds; and BBB-rated Puerto Rico water/sewer bonds, which, like all debt issued by U.S. territories, is generally tax-exempt for residents of every state.
In March 2011 we added some tender option bond trusts to the portfolio, as we believed favorable market conditions and extremely low borrowing costs provided a good opportunity to enhance the Fund’s yield while maintaining its duration at a desirable level in range of the benchmark. With the additional income provided by these leveraged securities, we purchased AAA-rated Johnson County public improvement bonds, which we believed offered good value.
To finance other purchases, we relied on the proceeds supplied by new investments from shareholders. We also selectively engaged in health care bond swaps, exchanging some of the Fund’s hospital bonds with other credits providing higher yields and comparable risk.
Like the Kansas Fund, the Wisconsin Fund’s performance was helped by our duration positioning. Given that interest rates slightly declined during the period, the portfolio’s slightly-longer-than-benchmark duration and increased exposure to longer-maturity bonds proved beneficial. Another factor that helped performance was an underweighting in BBB-rated bonds — which lagged the index return — and an overweighting in the outperforming A-rated bond category.
| Nuveen Investments | 9 |
The Fund was meaningfully underweighted in state and local general obligation (GO) bonds which are exempt from both federal and state because these types of securities rarely come to market in Wisconsin. This left us underrepresented in the GO category compared with the national municipal bond market, hampering results as these securities generated good relative performance.
Unlike many other mutual funds, the Wisconsin Fund received substantial investment inflows during the period. With this healthy amount of cash coming into the portfolio, we had increased flexibility to diversify the Fund by purchasing bonds in a variety of sectors, and adding to certain positions in which the Fund was underexposed relative to the Wisconsin market.
During the municipal market’s downturn, with security prices low, we purchased bonds we believed offered exceptional value. These purchases included AA-rated sales tax revenue bonds and several lower-investment-grade-rated hospital bond issues. To purchase one of these latter securities, we used the proceeds generated by creating a tender option bond trust, which we established to take advantage of unusually attractive borrowing costs.
Because of the typically limited supply of fully tax-exempt Wisconsin state bonds, we continued to actively rely on U.S. territorial debt. During the period, we actively swapped out of certain Puerto Rico bonds to accomplish two management goals — diversifying the portfolio’s territorial bond exposure and increasing income without substantially adding risk. As an example, we sold intermediate-maturity Puerto Rico electric utility bonds with a 5% coupon and used the proceeds to purchase long-dated Puerto Rico water/sewer bonds with a 6% coupon. The Puerto Rico electric utility bond sales also enabled us to buy several Guam-issued bonds and broaden the range of the portfolio’s territorial bond exposure.
Nuveen Kentucky, Michigan and Ohio Municipal Bond Funds
Relative to the Standard & Poor’s (S&P) National Municipal Bond Index, the Kentucky Fund benefited from healthy exposure to intermediate-duration bonds, which were the best performers up and down the yield curve during the twelve-month reporting period ending May 31, 2011. The Fund also benefited modestly from its credit-quality positioning.
In contrast, sector allocation proved somewhat negative. A relative underweighting in corporate-backed industrial development revenue bonds detracted in light of the sector’s favorable performance. However, the Fund’s limited exposure to airport and toll-road bonds proved helpful, as those bond categories lagged the return of the national S&P municipal bond index. Also of note was the modest negative effect of individual bond selection; several of the portfolio’s long-dated zero-coupon bonds turned in weak results in a challenging environment for these types of highly interest-rate-sensitive securities.
New purchase activity for the Kentucky Fund was limited. In the first half of the twelve-month period, additions included several longer-dated, lower-rated water/sewer bonds; a housing bond issue; and a shorter-dated Kentucky transportation bond issue. As we discussed in a previous report to shareholders, we also added to our holdings in Louisville Arena Authority bonds, a credit we have long liked and whose proceeds helped fund a large basketball and multi-purpose arena in the state.
| 10 | Nuveen Investments |
Purchase activity was even more constrained in the second half of the reporting period —in large part because of investment outflows that shifted our focus away from adding many new bonds. Accordingly, new purchases were confined to a couple of A-minus-rated health care bonds as well as a public power bond issue.
To finance these portfolio additions as well as manage investment outflows, we used the proceeds of bond calls — of which there were a substantial amount throughout the period — and also sold some shorter-dated bonds for which there was good demand and whose performance potential was limited.
The Michigan Fund’s performance benefited from favorable interest-rate positioning. A helpful overweighting in the intermediate part of the yield curve boosted results, as did underweighting shorter- and longer-dated bonds, given these latter groups’ underperformance. Security selection was also helpful, especially the Fund’s holding in Detroit Medical Center bonds. These securities had been trading at a sizeable discount when they were called at their face value in early 2011 — an action that resulted in an immediate boost to the bonds’ price.
The Fund’s credit quality positioning was also positive on balance, despite some weakness from our non-rated holdings. Sector positioning further contributed positively, as the Fund’s overweighting in advance refunded bonds and underweighting in the lagging transportation bond sector helped results. However, our positioning within the utilities sector did not work well during the twelve-month reporting period.
There were relatively few additions to the Michigan portfolio throughout the past year. In the period’s first six months, we made only four new purchases — a longer-maturity AAA-rated water/sewer bond issue backed by property taxes; a shorter-maturity, lower-rated water/sewer issue backed by water revenues; a longer-dated insured health care bond issue; and BBB-rated charter school bonds. The limited activity continued throughout the period’s second half, with purchases including a couple of longer dated, health care credits and several local general obligation bonds. In addition, we took advantage of the municipal bond market’s decline in early 2011 to add Michigan tobacco bonds at what we believed were attractive prices.
We also established two inverse-floating rate trusts, using a modest amount of leverage in an environment of unusually low borrowing costs to both better align the Fund’s duration positioning and add to the Fund’s income generating capabilities.
To finance new purchases and meet investment outflows, we largely applied the proceeds of bond calls — most notably the Detroit Medical Center call we mentioned earlier. We also periodically sold some advance refunded bonds for which we found ready buyers because of the securities’ limited credit- and interest-rate risk. Other sales included industrial development revenue bonds for attractive prices, in our opinion.
Duration positioning helped the Ohio Fund’s performance relative to the S&P National Municipal Bond Index. The outperformance was driven by a useful underweighting in the shortest part of the yield curve as well as modestly overweighting the curve’s best-performing segment, its intermediate portion. Security selection also added to performance, thanks to the combined contribution of a number of positively performing bond issues.
| Nuveen Investments | 11 |
In contrast, a slight relative overweighting in bonds with BBB credit ratings hurt, given the overall underperformance of these lower-investment-grade credits. On a sector basis, underweighting the strong-performing state general obligation bond category hurt results. Having increased exposure to tobacco bonds also detracted in light of those securities’ relatively weak returns. More favorably, the Fund’s contribution from health care bonds was helpful.
We were fairly active in purchasing new bonds for the Ohio Fund. During the first half of the period, for example, we added a number of new health care issues — a combination of hospital and continuing care retirement community bonds — taking advantage of Nuveen’s substantial credit research experience in this sector. In the second half of the period, we continued to emphasize this portion of the market, adding two attractively priced health care bonds with credit ratings of AA-. Other purchases during this time included a water/sewer bond issue, a sales-tax appropriation bond issue and a local Ohio general obligation bond issue — all similarly featuring AA- credit ratings.
We also took advantage of extreme volatility in the market to buy creditworthy bonds at unusually low prices relative to their yields. As an example of this type of opportunistic purchase, we added Cleveland Clinic health care bonds when they appeared to offer exceptional value. We placed these bonds in a leveraged tender option bond trust and, capitalizing on historically low borrowing costs, added income to the portfolio that enabled us to finance additional purchases.
The Fund, like many others, encountered investment outflows amid the market’s decline. We were able to satisfy shareholder redemptions, however, largely through the proceeds of bond calls. We also engaged in limited bond sales, which included several industrial development revenue bonds whose future appreciation potential we believed was limited; bonds with structures that have typically appealed to individual investors and whose prices reflected the increased demand; and very-short-dated advance refunded bonds. We also engaged in a large Ohio tobacco bond swap, exchanging shorter-maturity holdings for longer-dated bonds by the same issuer. This enabled us to increase the portfolio’s income by locking in a higher interest rate for a longer period and also reduced the dollar price of our holdings.
Nuveen Missouri Municipal Bond Fund
Relative to the Standard & Poor’s (S&P) National Municipal Bond Index, the Missouri Fund’s performance was helped by favorable maturity positioning. Specifically, the portfolio was overweighted in intermediate-duration bonds — a segment of the yield curve that performed very well. The Fund also benefited from being underweighted in very-short-maturity bonds and very-long-maturity bonds — two segments of the yield curve that underperformed.
In contrast, the Fund’s sector positioning hampered results. Compared with the S&P index, for example, we had less exposure to state general obligation (GO) bonds — a typical stance for Nuveen, given our traditional emphasis on uncovering value from lower-rated, higher-yielding credits. But with many investors interested in limiting their exposure to risk, GO debt — which is often as perceived as less risky than many other bond types — tended to do well. The Fund was also hurt by its overweighting in the lagging
| 12 | Nuveen Investments |
health care sector, though we made up that performance gap through strong bond selection within the group.
Late in 2010 and in the first few months of 2011, as municipal bond market conditions weakened, we looked to take advantage of relatively low security prices. This effort was somewhat hampered by a lack of supply of new bonds in Missouri, but when we could, we purchased longer-dated, lower-investment-grade-rated bonds we believed offered particularly good value. One noteworthy purchase fitting this theme was of BBB-rated Rockhurst University higher-education bonds, which we believed were priced attractively and offered a good risk/reward tradeoff. We also purchased 30-year, A1-rated Puerto Rico sales-tax bonds to keep the Fund invested at a time when Missouri issuance was limited.
Financing for the Fund’s new purchases generally came from bond calls. To a lesser extent, we also sold shorter bonds that had already realized most of their performance potential and for which we could find ready buyers.
Risk Considerations
Mutual fund investing involves risk; principal loss is possible. Debt or fixed income securities are subject to credit risk and interest rate risk. The value of, and income generated by debt securities will decrease or increase based on changes in market interest rates. As interest rates rise, bond prices fall. Credit risk refers to an issuer’s ability to make interest and principal payments when due. Credit risk is heightened for below-investment grade bonds. A concentration in specific states exposes the Funds to the additional risks facing issuers in those states.
Dividend Information
All share classes of the Nuveen Kentucky Municipal Bond Fund saw a dividend increase in February 2011. The Nuveen Michigan Municipal Bond Fund’s share classes had a dividend cut in November 2010, while the Fund’s Class I Shares had an additional reduction in February 2011. The Class C and I Shares of the Nuveen Missouri Municipal Bond Fund received dividend cuts in August 2010 and February 2011, respectively, while all share classes of the Nuveen Ohio Municipal Bond Fund had their dividend increased in February 2011. The Nuveen Wisconsin Municipal Bond Fund’s Class B Shares had a dividend reduction in November 2010, and the Fund’s Class I Shares experienced a dividend cut in February 2011. The Nuveen Kansas Municipal Bond Fund did not have any changes to its monthly dividend during the twelve months ending May 31, 2011.
Each Fund seeks to pay dividends at a rate that reflects the past and projected performance of the Fund. To permit a Fund to maintain a more stable monthly dividend, the Fund may pay dividends at a rate that may be more or less than the amount of net investment income actually earned by the Fund during the period. If the Fund has cumulatively earned more than it has paid in dividends, it will hold the excess in reserve as undistributed net investment income (UNII) as part of the Fund’s net asset value. Conversely, if the Fund has cumulatively paid in dividends more than it has earned, the excess will constitute a negative UNII that will likewise be reflected in the Fund’s net asset value. Each Fund will, over time, pay all its net investment income as dividends to
| Nuveen Investments | 13 |
shareholders. As of May 31, 2011, all six Funds had positive UNII balances for tax purposes. The Kansas, Michigan, Missouri, Ohio and Wisconsin Funds had positive UNII balances, while Kentucky had a negative UNII balance for financial reporting purposes.
| 14 | Nuveen Investments |
Fund Performance and Expense Ratios (Unaudited)
The Fund Performance and Expense Ratios for each Fund are shown on the following twelve pages.
Returns quoted represent past performance, which is no guarantee of future results. Current performance may be higher or lower than the performance shown. Investment returns and principal value will fluctuate so that when shares are redeemed, they may be worth more or less than their original cost. Returns without sales charges would be lower if the sales charge were included. Returns do not reflect the deduction of taxes that a shareholder would pay on Fund distributions or the redemption of Fund shares. Income is generally exempt from regular federal income taxes. Some income may be subject to state and local income taxes and to the federal alternative minimum tax. Capital gains, if any, are subject to tax.
Returns may reflect a contractual agreement between certain Funds and the investment adviser to waive certain fees and expenses; see Notes to Financial Statements, Footnote 7 — Management Fees and Other Transactions with Affiliates for more information. In addition, returns may reflect a voluntary expense limitation by the Funds’ investment adviser that may be modified or discontinued at any time without notice. For the most recent month-end performance visit www.nuveen.com or call (800) 257-8787.
Returns reflect differences in sales charges and expenses, which are primarily differences in distribution and service fees. Fund returns assume reinvestment of dividends and capital gains.
Comparative index and benchmark return information is provided for the Funds’ Class A Shares at net asset value (NAV) only.
The expense ratios shown reflect the Funds’ total operating expenses (before fee waivers or expense reimbursements, if any) as shown in the Funds’ most recent prospectus. The expense ratios include management fees and other fees and expenses.
| Nuveen Investments | 15 |
Fund Performance and Expense Ratios (Unaudited) (continued)
Nuveen Kansas Municipal Bond Fund
Refer to the first page of this Fund Performance and Expense Ratios Section for further explanation of the information included within this page.
Fund Performance
Average Annual Total Returns as of May 31, 2011
| Average Annual | ||||||||||||
| 1-Year | 5-Year | 10-Year | ||||||||||
Class A Shares at NAV | 3.10% | 4.24% | 4.60% | |||||||||
Class A Shares at maximum Offering Price | -1.24% | 3.34% | 4.15% | |||||||||
Standard & Poor’s (S&P) Kansas Municipal Bond Index* | 4.01% | 4.72% | 5.16% | |||||||||
Standard & Poor’s (S&P) National Municipal Bond Index* | 3.17% | 4.46% | 5.02% | |||||||||
Lipper Other States Municipal Debt Funds Average* | 1.98% | 3.41% | 4.04% | |||||||||
Class B Shares w/o CDSC | 2.35% | 3.46% | 3.98% | |||||||||
Class B Shares w/CDSC | -1.61% | 3.28% | 3.98% | |||||||||
Class C Shares at NAV | 2.47% | 3.67% | 4.04% | |||||||||
Class I Shares at NAV | 3.32% | 4.47% | 4.83% | |||||||||
Latest Calendar Quarter – Average Annual Total Returns as of June 30, 2011
| Average Annual | ||||||||||||
| 1-Year | 5-Year | 10-Year | ||||||||||
Class A Shares at NAV | 3.40% | 4.42% | 4.58% | |||||||||
Class A Shares at maximum Offering Price | -0.96% | 3.53% | 4.12% | |||||||||
Class B Shares w/o CDSC | 2.55% | 3.64% | 3.95% | |||||||||
Class B Shares w/CDSC | -1.42% | 3.47% | 3.95% | |||||||||
Class C Shares at NAV | 2.76% | 3.85% | 4.00% | |||||||||
Class I Shares at NAV | 3.52% | 4.63% | 4.78% | |||||||||
Class A Shares have a maximum 4.20% sales charge (Offering Price). Class A Share purchases of $1 million or more are sold at net asset value without an up-front sales charge but may be subject to a contingent deferred sales charge (CDSC), also known as a back-end sales charge, if redeemed within eighteen months of purchase. Class B Shares have a CDSC that begins at 5% for redemptions during the first year and declines periodically until after six years when the charge becomes 0%. Class B Shares automatically convert to Class A Shares eight years after purchase. Class C Shares have a 1% CDSC for redemptions within less than twelve months, which is not reflected in the one-year total return. Class I Shares have no sales charge and may be purchased under limited circumstances or by specified classes of investors.
| Expense Ratios | ||||
| Share Class | Expense Ratios | |||
Class A | 0.84% | |||
Class B | 1.59% | |||
Class C | 1.39% | |||
Class I | 0.64% | |||
| * | Refer to the Glossary of Terms Used in the Report for definitions. |
| 16 | Nuveen Investments |
Growth of an Assumed $10,000 Investment as of May 31, 2011

The graphs do not reflect the deduction of taxes, such as state and local income taxes or capital gains taxes, that a shareholder may pay on Fund distributions or the redemption of Fund shares.
| Nuveen Investments | 17 |
Fund Performance and Expense Ratios (Unaudited) (continued)
Nuveen Kentucky Municipal Bond Fund
Refer to the first page of this Fund Performance and Expense Ratios Section for further explanation of the information included within this page.
Fund Performance
Average Annual Total Returns as of May 31, 2011
| Average Annual | ||||||||||||
| 1-Year | 5-Year | 10-Year | ||||||||||
Class A Shares at NAV | 2.68% | 3.93% | 4.54% | |||||||||
Class A Shares at maximum Offering Price | -1.67% | 3.04% | 4.09% | |||||||||
Standard & Poor’s (S&P) Kentucky Municipal Bond Index* | 3.14% | 3.85% | 4.49% | |||||||||
Standard & Poor’s (S&P) National Municipal Bond Index* | 3.17% | 4.46% | 5.02% | |||||||||
Lipper Other States Municipal Debt Funds Average* | 1.98% | 3.41% | 4.04% | |||||||||
Class B Shares w/o CDSC | 2.03% | 3.15% | 3.92% | |||||||||
Class B Shares w/CDSC | -1.91% | 2.98% | 3.92% | |||||||||
Class C Shares at NAV | 2.22% | 3.36% | 3.97% | |||||||||
Class I Shares at NAV | 3.01% | 4.13% | 4.75% | |||||||||
Latest Calendar Quarter – Average Annual Total Returns as of June 30, 2011
| Average Annual | ||||||||||||
| 1-Year | 5-Year | 10-Year | ||||||||||
Class A Shares at NAV | 3.18% | 4.10% | 4.50% | |||||||||
Class A Shares at maximum Offering Price | -1.12% | 3.21% | 4.05% | |||||||||
Class B Shares w/o CDSC | 2.34% | 3.32% | 3.88% | |||||||||
Class B Shares w/CDSC | -1.62% | 3.15% | 3.88% | |||||||||
Class C Shares at NAV | 2.53% | 3.53% | 3.92% | |||||||||
Class I Shares at NAV | 3.31% | 4.31% | 4.70% | |||||||||
Class A Shares have a maximum 4.20% sales charge (Offering Price). Class A Share purchases of $1 million or more are sold at net asset value without an up-front sales charge but may be subject to a contingent deferred sales charge (CDSC), also known as a back-end sales charge, if redeemed within eighteen months of purchase. Class B Shares have a CDSC that begins at 5% for redemptions during the first year and declines periodically until after six years when the charge becomes 0%. Class B Shares automatically convert to Class A Shares eight years after purchase. Class C Shares have a 1% CDSC for redemptions within less than twelve months, which is not reflected in the one-year total return. Class I Shares have no sales charge and may be purchased under limited circumstances or by specified classes of investors.
| Expense Ratios | ||||
| Share Class | Expense Ratios | |||
Class A | 0.81% | |||
Class B | 1.56% | |||
Class C | 1.36% | |||
Class I | 0.61% | |||
| * | Refer to the Glossary of Terms Used in the Report for definitions. |
| 18 | Nuveen Investments |
Growth of an Assumed $10,000 Investment as of May 31, 2011

The graphs do not reflect the deduction of taxes, such as state and local income taxes or capital gains taxes, that a shareholder may pay on Fund distributions or the redemption of Fund shares.
| Nuveen Investments | 19 |
-
Fund Performance and Expense Ratios (Unaudited) (continued)
Nuveen Michigan Municipal Bond Fund
Refer to the first page of this Fund Performance and Expense Ratios Section for further explanation of the information included within this page.
Fund Performance
Average Annual Total Returns as of May 31, 2011
| Average Annual | ||||||||||||
| 1-Year | 5-Year | 10-Year | ||||||||||
Class A Shares at NAV | 3.16% | 3.85% | 4.56% | |||||||||
Class A Shares at maximum Offering Price | -1.16% | 2.96% | 4.11% | |||||||||
Standard & Poor’s (S&P) Michigan Municipal Bond Index* | 3.52% | 4.31% | 4.95% | |||||||||
Standard & Poor’s (S&P) National Municipal Bond Index* | 3.17% | 4.46% | 5.02% | |||||||||
Lipper Michigan Municipal Debt Funds Average* | 1.83% | 3.44% | 4.14% | |||||||||
Class B Shares w/o CDSC | 2.41% | 3.07% | 3.94% | |||||||||
Class B Shares w/CDSC | -1.55% | 2.90% | 3.94% | |||||||||
Class C Shares at NAV | 2.70% | 3.29% | 3.99% | |||||||||
Class I Shares at NAV | 3.46% | 4.07% | 4.78% | |||||||||
Latest Calendar Quarter – Average Annual Total Returns as of June 30, 2011
| Average Annual | ||||||||||||
| 1-Year | 5-Year | 10-Year | ||||||||||
Class A Shares at NAV | 3.81% | 4.05% | 4.51% | |||||||||
Class A Shares at maximum Offering Price | -0.56% | 3.16% | 4.06% | |||||||||
Class B Shares w/o CDSC | 3.04% | 3.25% | 3.88% | |||||||||
Class B Shares w/CDSC | -0.95% | 3.08% | 3.88% | |||||||||
Class C Shares at NAV | 3.25% | 3.47% | 3.93% | |||||||||
Class I Shares at NAV | 4.01% | 4.25% | 4.72% | |||||||||
Class A Shares have a maximum 4.20% sales charge (Offering Price). Class A Share purchases of $1 million or more are sold at net asset value without an up-front sales charge but may be subject to a contingent deferred sales charge (CDSC), also known as a back-end sales charge, if redeemed within eighteen months of purchase. Class B Shares have a CDSC that begins at 5% for redemptions during the first year and declines periodically until after six years when the charge becomes 0%. Class B Shares automatically convert to Class A Shares eight years after purchase. Class C Shares have a 1% CDSC for redemptions within less than twelve months, which is not reflected in the one-year total return. Class I Shares have no sales charge and may be purchased under limited circumstances or by specified classes of investors.
| Expense Ratios | ||||
| Share Class | Expense Ratios | |||
Class A | 0.85% | |||
Class B | 1.60% | |||
Class C | 1.40% | |||
Class I | 0.65% | |||
| * | Refer to the Glossary of Terms Used in the Report for definitions. |
| 20 | Nuveen Investments |
Growth of an Assumed $10,000 Investment as of May 31, 2011

The graphs do not reflect the deduction of taxes, such as state and local income taxes or capital gains taxes, that a shareholder may pay on Fund distributions or the redemption of Fund shares.
| Nuveen Investments | 21 |
Fund Performance and Expense Ratios (Unaudited) (continued)
Nuveen Missouri Municipal Bond Fund
Refer to the first page of this Fund Performance and Expense Ratios Section for further explanation of the information included within this page.
Fund Performance
Average Annual Total Returns as of May 31, 2011
| Average Annual | ||||||||||||
| 1-Year | 5-Year | 10-Year | ||||||||||
Class A Shares at NAV | 3.30% | 4.03% | 4.61% | |||||||||
Class A Shares at maximum Offering Price | -1.00% | 3.14% | 4.17% | |||||||||
Standard & Poor’s (S&P) Missouri Municipal Bond Index* | 4.04% | 4.60% | 5.18% | |||||||||
Standard & Poor’s (S&P) National Municipal Bond Index* | 3.17% | 4.46% | 5.02% | |||||||||
Lipper Other States Municipal Debt Funds Average* | 1.98% | 3.41% | 4.04% | |||||||||
Class B Shares w/o CDSC | 2.55% | 3.25% | 3.99% | |||||||||
Class B Shares w/CDSC | -1.40% | 3.08% | 3.99% | |||||||||
Class C Shares at NAV | 2.74% | 3.45% | 4.04% | |||||||||
Class I Shares at NAV | 3.52% | 4.24% | 4.83% | |||||||||
Latest Calendar Quarter – Average Annual Total Returns as of June 30, 2011
| Average Annual | ||||||||||||
| 1-Year | 5-Year | 10-Year | ||||||||||
Class A Shares at NAV | 4.17% | 4.28% | 4.64% | |||||||||
Class A Shares at maximum Offering Price | -0.18% | 3.38% | 4.19% | |||||||||
Class B Shares w/o CDSC | 3.42% | 3.51% | 4.01% | |||||||||
Class B Shares w/CDSC | -0.57% | 3.33% | 4.01% | |||||||||
Class C Shares at NAV | 3.60% | 3.71% | 4.06% | |||||||||
Class I Shares at NAV | 4.38% | 4.49% | 4.85% | |||||||||
Class A Shares have a maximum 4.20% sales charge (Offering Price). Class A Share purchases of $1 million or more are sold at net asset value without an up-front sales charge but may be subject to a contingent deferred sales charge (CDSC), also known as a back-end sales charge, if redeemed within eighteen months of purchase. Class B Shares have a CDSC that begins at 5% for redemptions during the first year and declines periodically until after six years when the charge becomes 0%. Class B Shares automatically convert to Class A Shares eight years after purchase. Class C Shares have a 1% CDSC for redemptions within less than twelve months, which is not reflected in the one-year total return. Class I Shares have no sales charge and may be purchased under limited circumstances or by specified classes of investors.
| Expense Ratios | ||||
| Share Class | Expense Ratios | |||
Class A | 0.83% | |||
Class B | 1.58% | |||
Class C | 1.38% | |||
Class I | 0.63% | |||
| * | Refer to the Glossary of Terms Used in the Report for definitions. |
| 22 | Nuveen Investments |
Growth of an Assumed $10,000 Investment as of May 31, 2011
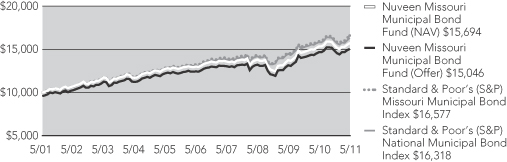
The graphs do not reflect the deduction of taxes, such as state and local income taxes or capital gains taxes, that a shareholder may pay on Fund distributions or the redemption of Fund shares.
| Nuveen Investments | 23 |
Fund Performance and Expense Ratios (Unaudited) (continued)
Nuveen Ohio Municipal Bond Fund
Refer to the first page of this Fund Performance and Expense Ratios Section for further explanation of the information included within this page.
Fund Performance
Average Annual Total Returns as of May 31, 2011
| Average Annual | ||||||||||||
| 1-Year | 5-Year | 10-Year | ||||||||||
Class A Shares at NAV | 2.75% | 4.07% | 4.58% | |||||||||
Class A Shares at maximum Offering Price | -1.56% | 3.19% | 4.13% | |||||||||
Standard & Poor’s (S&P) Ohio Municipal Bond Index* | 2.22% | 3.72% | 4.60% | |||||||||
Standard & Poor’s (S&P) National Municipal Bond Index* | 3.17% | 4.46% | 5.02% | |||||||||
Lipper Ohio Municipal Debt Funds Average* | 1.42% | 3.43% | 4.02% | |||||||||
Class B Shares w/o CDSC | 1.90% | 3.29% | 3.96% | |||||||||
Class B Shares w/CDSC | -2.03% | 3.11% | 3.96% | |||||||||
Class C Shares at NAV | 2.11% | 3.50% | 4.00% | |||||||||
Class I Shares at NAV | 2.98% | 4.27% | 4.79% | |||||||||
Latest Calendar Quarter – Average Annual Total Returns as of June 30, 2011
| Average Annual | ||||||||||||
| 1-Year | 5-Year | 10-Year | ||||||||||
Class A Shares at NAV | 3.69% | 4.35% | 4.58% | |||||||||
Class A Shares at maximum Offering Price | -0.68% | 3.46% | 4.13% | |||||||||
Class B Shares w/o CDSC | 2.94% | 3.58% | 3.96% | |||||||||
Class B Shares w/CDSC | -1.04% | 3.41% | 3.96% | |||||||||
Class C Shares at NAV | 3.14% | 3.78% | 4.01% | |||||||||
Class I Shares at NAV | 3.93% | 4.57% | 4.78% | |||||||||
Class A Shares have a maximum 4.20% sales charge (Offering Price). Class A Share purchases of $1 million or more are sold at net asset value without an up-front sales charge but may be subject to a contingent deferred sales charge (CDSC), also known as a back-end sales charge, if redeemed within eighteen months of purchase. Class B Shares have a CDSC that begins at 5% for redemptions during the first year and declines periodically until after six years when the charge becomes 0%. Class B Shares automatically convert to Class A Shares eight years after purchase. Class C Shares have a 1% CDSC for redemptions within less than twelve months, which is not reflected in the one-year total return. Class I Shares have no sales charge and may be purchased under limited circumstances or by specified classes of investors.
| Expense Ratios | ||||
| Share Class | Expense Ratios | |||
Class A | 0.82% | |||
Class B | 1.58% | |||
Class C | 1.37% | |||
Class I | 0.62% | |||
| * | Refer to the Glossary of Terms Used in the Report for definitions. |
| 24 | Nuveen Investments |
Growth of an Assumed $10,000 Investment as of May 31, 2011
The graphs do not reflect the deduction of taxes, such as state and local income taxes or capital gains taxes, that a shareholder may pay on Fund distributions or the redemption of Fund shares.
| Nuveen Investments | 25 |
Fund Performance and Expense Ratios (Unaudited) (continued)
Nuveen Wisconsin Municipal Bond Fund
Refer to the first page of this Fund Performance and Expense Ratios Section for further explanation of the information included within this page.
Fund Performance
Average Annual Total Returns as of May 31, 2011
| Average Annual | ||||||||||||
| 1-Year | 5-Year | 10-Year | ||||||||||
Class A Shares at NAV | 2.71% | 4.12% | 4.46% | |||||||||
Class A Shares at maximum Offering Price | -1.64% | 3.22% | 4.01% | |||||||||
Standard & Poor’s (S&P) Wisconsin Municipal Bond Index* | 3.64% | 5.07% | 5.66% | |||||||||
Standard & Poor’s (S&P) National Municipal Bond Index* | 3.17% | 4.46% | 5.02% | |||||||||
Lipper Other States Municipal Debt Funds Average* | 1.98% | 3.41% | 4.04% | |||||||||
Class B Shares w/o CDSC | 2.05% | 3.36% | 3.84% | |||||||||
Class B Shares w/CDSC | -1.91% | 3.19% | 3.84% | |||||||||
Class C Shares at NAV | 2.17% | 3.56% | 3.89% | |||||||||
Class I Shares at NAV | 2.92% | 4.30% | 4.66% | |||||||||
Latest Calendar Quarter – Average Annual Total Returns as of June 30, 2011
| Average Annual | ||||||||||||
| 1-Year | 5-Year | 10-Year | ||||||||||
Class A Shares at NAV | 3.61% | 4.38% | 4.45% | |||||||||
Class A Shares at maximum Offering Price | -0.71% | 3.50% | 4.01% | |||||||||
Class B Shares w/o CDSC | 2.94% | 3.62% | 3.83% | |||||||||
Class B Shares w/CDSC | -1.06% | 3.45% | 3.83% | |||||||||
Class C Shares at NAV | 3.16% | 3.82% | 3.90% | |||||||||
Class I Shares at NAV | 3.92% | 4.58% | 4.65% | |||||||||
Class A Shares have a maximum 4.20% sales charge (Offering Price). Class A Share purchases of $1 million or more are sold at net asset value without an up-front sales charge but may be subject to a contingent deferred sales charge (CDSC), also known as a back-end sales charge, if redeemed within eighteen months of purchase. Class B Shares have a CDSC that begins at 5% for redemptions during the first year and declines periodically until after six years when the charge becomes 0%. Class B Shares automatically convert to Class A Shares eight years after purchase. Class C Shares have a 1% CDSC for redemptions within less than twelve months, which is not reflected in the one-year total return. Class I Shares have no sales charge and may be purchased under limited circumstances or by specified classes of investors.
| Expense Ratios | ||||
| Share Class | Expense Ratios | |||
Class A | 0.90% | |||
Class B | 1.65% | |||
Class C | 1.45% | |||
Class I | 0.70% | |||
| * | Refer to the Glossary of Terms Used in the Report for definitions. |
| 26 | Nuveen Investments |
Growth of an Assumed $10,000 Investment as of May 31, 2011
The graphs do not reflect the deduction of taxes, such as state and local income taxes or capital gains taxes, that a shareholder may pay on Fund distributions or the redemption of Fund shares.
| Nuveen Investments | 27 |
Yields (Unaudited) as of May 31, 2011
Dividend Yield is the most recent dividend per share (annualized) divided by the offering price per share.
The SEC 30-Day Yield is a standardized measure of a Fund’s yield that accounts for the future amortization of premiums or discounts of bonds held in the Fund’s portfolio. The SEC 30-Day Yield is computed under an SEC standardized formula and is based on the maximum offer price per share. Dividend Yield may differ from the SEC 30-Day Yield because the Fund may be paying out more or less than it is earning and it may not include the effect of amortization of bond premium.
The Taxable-Equivalent Yield represents the yield that must be earned on a fully taxable investment in order to equal the yield of the Fund on an after-tax basis at a specified tax rate. With respect to investments that generate qualified dividend income that is taxable at a maximum rate of 15%, the Taxable-Equivalent Yield is lower.
Nuveen Kansas Municipal Bond Fund
| Dividend Yield | SEC 30-Day Yield | Taxable- Equivalent Yield1 | ||||||||||
Class A Shares at maximum Offering Price5 | 3.94% | 3.72% | 5.52% | |||||||||
Class B Shares at NAV | 3.39% | 3.13% | 4.64% | |||||||||
Class C Shares at NAV | 3.59% | 3.33% | 4.94% | |||||||||
Class I Shares at NAV | 4.32% | 4.04% | 5.99% | |||||||||
Nuveen Kentucky Municipal Bond Fund
| Dividend Yield | SEC 30-Day Yield | Taxable- Equivalent Yield2 | ||||||||||
Class A Shares at maximum Offering Price5 | 4.09% | 3.45% | 5.10% | |||||||||
Class B Shares at NAV | 3.53% | 2.85% | 4.21% | |||||||||
Class C Shares at NAV | 3.76% | 3.05% | 4.51% | |||||||||
Class I Shares at NAV | 4.49% | 3.81% | 5.63% | |||||||||
Nuveen Michigan Municipal Bond Fund
| Dividend Yield | SEC 30-Day Yield | Taxable- Equivalent Yield3 | ||||||||||
Class A Shares at maximum Offering Price5 | 3.89% | 3.39% | 4.92% | |||||||||
Class B Shares at NAV | 3.30% | 2.79% | 4.05% | |||||||||
Class C Shares at NAV | 3.52% | 2.99% | 4.34% | |||||||||
Class I Shares at NAV | 4.22% | 3.73% | 5.41% | |||||||||
Nuveen Missouri Municipal Bond Fund
| Dividend Yield | SEC 30-Day Yield | Taxable- Equivalent Yield4 | ||||||||||
Class A Shares at maximum Offering Price5 | 4.19% | 3.82% | 5.64% | |||||||||
Class B Shares at NAV | 3.64% | 3.23% | 4.77% | |||||||||
Class C Shares at NAV | 3.82% | 3.43% | 5.07% | |||||||||
Class I Shares at NAV | 4.54% | 4.19% | 6.19% | |||||||||
| 1 | TheTaxable-Equivalent Yield is based on the Fund’s SEC 30-Day Yield on the indicated date and a combined federal and state income tax rate of 32.6%. |
| 2 | TheTaxable-Equivalent Yield is based on the Fund’s SEC 30-Day Yield on the indicated date and a combined federal and state income tax rate of 32.3%. |
| 3 | TheTaxable-Equivalent Yield is based on the Fund’s SEC 30-Day Yield on the indicated date and a combined federal and state income tax rate of 31.1%. |
| 4 | TheTaxable-Equivalent Yield is based on the Fund’s SEC 30-Day Yield on the indicated date and a combined federal and state income tax rate of 32.3%. |
| 5 | The SEC Yield for Class A shares quoted in the table reflects the maximum sales load. Investors paying a reduced load because of volume discounts, investors paying no load because they qualify for one of the several exclusions from the load, and existing shareholders who previously paid a load but would like to know the SEC Yield applicable to their shares on a going-forward basis, should understand that the SEC Yield effectively applicable to them would be higher than the figure quoted in the table. |
| 28 | Nuveen Investments |
Nuveen Ohio Municipal Bond Fund
| Dividend Yield | SEC 30-Day Yield | Taxable- Equivalent Yield6 | ||||||||||
Class A Shares at maximum Offering Price5 | 4.07% | 3.56% | 5.23% | |||||||||
Class B Shares at NAV | 3.55% | 2.96% | 4.35% | |||||||||
Class C Shares at NAV | 3.72% | 3.17% | 4.65% | |||||||||
Class I Shares at NAV | 4.48% | 3.91% | 5.74% | |||||||||
Nuveen Wisconsin Municipal Bond Fund
| Dividend Yield | SEC 30-Day Yield | Taxable- Equivalent Yield7 | ||||||||||
Class A Shares at maximum Offering Price5 | 3.58% | 3.62% | 5.39% | |||||||||
Class B Shares at NAV | 2.97% | 3.03% | 4.52% | |||||||||
Class C Shares at NAV | 3.20% | 3.23% | 4.81% | |||||||||
Class I Shares at NAV | 3.90% | 3.99% | 5.95% | |||||||||
| 6 | The Taxable-Equivalent Yield is based on the Fund’s SEC 30-Day Yield on the indicated date and a combined federal and state income tax rate of 31.9%. |
| 7 | The Taxable-Equivalent Yield is based on the Fund’s SEC 30-Day Yield on the indicated date and a combined federal and state income tax rate of 32.9%. |
| Nuveen Investments | 29 |
Holding Summaries (Unaudited) as of May 31, 2011
This data relates to the securities held in each Fund’s portfolio of investments. It should not be construed as a measure of performance for the Fund itself.
Ratings shown are the highest of Standard & Poor’s Group, Moody’s Investor Service, Inc. or Fitch, Inc. AAA includes bonds with an implied AAA rating since they are backed by U.S. Government or agency securities. AAA, AA, A and BBB ratings are investment grade; BB, B, CCC, CC, C and D ratings are below-investment grade. Holdings designated N/R are not rated by any of these national rating agencies.
Nuveen Kansas Municipal Bond Fund
Bond Credit Quality1

Nuveen Kentucky Municipal Bond Fund
Bond Credit Quality1
Nuveen Michigan Municipal Bond Fund
Bond Credit Quality1
Nuveen Missouri Municipal Bond Fund
Bond Credit Quality1
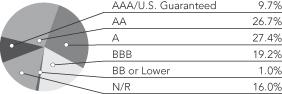
| Portfolio Composition1 | ||||
| Health Care | 22.6% | |||
| Tax Obligation/Limited | 21.9% | |||
| Tax Obligation/General | 11.8% | |||
| Utilities | 10.9% | |||
| Water and Sewer | 10.7% | |||
| Housing/Single Family | 8.5% | |||
| Other | 13.6% | |||
| Portfolio Composition1 | ||||
| Tax Obligation/Limited | 27.2% | |||
| Water and Sewer | 16.4% | |||
| Utilities | 16.0% | |||
| Health Care | 14.5% | |||
| U.S. Guaranteed | 6.4% | |||
| Education and Civic Organizations | 6.0% | |||
| Transportation | 5.1% | |||
| Other | 8.4% | |||
| Portfolio Composition1 | ||||
| Tax Obligation/General | 39.5% | |||
| Tax Obligation/Limited | 13.3% | |||
| Water and Sewer | 12.8% | |||
| Health Care | 10.5% | |||
| U.S. Guaranteed | 10.2% | |||
| Utilities | 5.2% | |||
| Other | 8.5% | |||
| Portfolio Composition1 | ||||
| Health Care | 23.6% | |||
| Tax Obligation/Limited | 20.8% | |||
| Tax Obligation/General | 10.9% | |||
| Long-Term Care | 7.2% | |||
| U.S. Guaranteed | 7.1% | |||
| Transportation | 6.7% | |||
| Utilities | 5.3% | |||
| Consumer Staples | 5.2% | |||
| Other | 13.2% | |||
| 1 | As a percentage of total investments, as of May 31, 2011. Holdings are subject to change. |
| 30 | Nuveen Investments |
Nuveen Ohio Municipal Bond Fund
Bond Credit Quality1
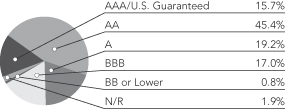
Nuveen Wisconsin Municipal Bond Fund
Bond Credit Quality1
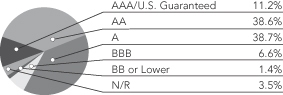
| Portfolio Composition1 | ||||
| Tax Obligation/General | 22.6% | |||
| Health Care | 17.8% | |||
| Tax Obligation/Limited | 15.2% | |||
| Education and Civic Organizations | 7.9% | |||
| U.S. Guaranteed | 7.5% | |||
| Water and Sewer | 7.4% | |||
| Utilities | 6.9% | |||
| Consumer Staples | 5.2% | |||
| Other | 9.5% | |||
| Portfolio Composition1 | ||||
| Tax Obligation/Limited | 51.5% | |||
| Health Care | 17.6% | |||
| Education and Civic Organizations | 10.0% | |||
| Utilities | 5.5% | |||
| Housing/Multifamily | 5.4% | |||
| Other | 10.0% | |||
| 1 | As a percentage of total investments, as of May 31, 2011. Holdings are subject to change. |
| Nuveen Investments | 31 |
As a shareholder of one or more of the Funds, you incur two types of costs: (1) transaction costs, including up-front and back-end sales charges (loads) or redemption fees, where applicable; and (2) ongoing costs, including management fees; distribution and service (12b-1) fees, where applicable; and other Fund expenses. The Examples below are intended to help you understand your ongoing costs (in dollars) of investing in the Funds and to compare these costs with the ongoing costs of investing in other mutual funds.
The Examples below are based on an investment of $1,000 invested at the beginning of the period and held for the period.
The information under “Actual Performance,” together with the amount you invested, allows you to estimate actual expenses incurred over the reporting period. Simply divide your account value by $1,000 (for example, an $8,600 account value divided by $1,000 = 8.60) and multiply the result by the cost shown for your share class, in the row entitled “Expenses Incurred During Period” to estimate the expenses incurred on your account during this period.
The information under “Hypothetical Performance,” provides information about hypothetical account values and hypothetical expenses based on the respective Fund’s actual expense ratio and an assumed rate of return of 5% per year before expenses, which is not the Fund’s actual return. The hypothetical account values and expenses may not be used to estimate the actual ending account balance or expense you incurred for the period. You may use this information to compare the ongoing costs of investing in the Fund and other Funds. To do so, compare this 5% hypothetical example with the 5% hypothetical examples that appear in the shareholder reports of the other funds.
Please note that the expenses shown in the tables are meant to highlight your ongoing costs only and do not reflect any transaction costs. Therefore, the hypothetical information is useful in comparing ongoing costs only, and will not help you determine the relative total costs of owning different funds or share classes. In addition, if these transaction costs were included, your costs would have been higher.
Kansas
| Hypothetical Performance | ||||||||||||||||||||||||||||||||||
| Actual Performance | (5% annualized return before expenses) | |||||||||||||||||||||||||||||||||
| A Shares | B Shares | C Shares | I Shares | A Shares | B Shares | C Shares | I Shares | |||||||||||||||||||||||||||
| Beginning Account Value (12/01/10) | $ | 1,000.00 | $ | 1,000.00 | $ | 1,000.00 | $ | 1,000.00 | $ | 1,000.00 | $ | 1,000.00 | $ | 1,000.00 | $ | 1,000.00 | ||||||||||||||||||
| Ending Account Value (5/31/11) | $ | 1,022.20 | $ | 1,018.40 | $ | 1,019.50 | $ | 1,023.30 | $ | 1,020.79 | $ | 1,017.05 | $ | 1,018.05 | $ | 1,021.79 | ||||||||||||||||||
| Expenses Incurred During Period | $ | 4.18 | $ | 7.95 | $ | 6.95 | $ | 3.18 | $ | 4.18 | $ | 7.95 | $ | 6.94 | $ | 3.18 | ||||||||||||||||||
For each class of the Fund, expenses are equal to the Fund’s annualized net expense ratio of .83%, 1.58%, 1.38% and .63% for Classes A, B, C and I, respectively, multiplied by the average account value over the period, multiplied by 182/365 (to reflect the one-half year period).
Kentucky
| Hypothetical Performance | ||||||||||||||||||||||||||||||||||
| Actual Performance | (5% annualized return before expenses) | |||||||||||||||||||||||||||||||||
| A Shares | B Shares | C Shares | I Shares | A Shares | B Shares | C Shares | I Shares | |||||||||||||||||||||||||||
| Beginning Account Value (12/01/10) | $ | 1,000.00 | $ | 1,000.00 | $ | 1,000.00 | $ | 1,000.00 | $ | 1,000.00 | $ | 1,000.00 | $ | 1,000.00 | $ | 1,000.00 | ||||||||||||||||||
| Ending Account Value (5/31/11) | $ | 1,014.90 | $ | 1,012.10 | $ | 1,013.20 | $ | 1,017.00 | $ | 1,020.89 | $ | 1,017.15 | $ | 1,018.15 | $ | 1,021.89 | ||||||||||||||||||
| Expenses Incurred During Period | $ | 4.07 | $ | 7.83 | $ | 6.83 | $ | 3.07 | $ | 4.08 | $ | 7.85 | $ | 6.84 | $ | 3.07 | ||||||||||||||||||
For each class of the Fund, expenses are equal to the Fund’s annualized net expense ratio of .81%, 1.56%, 1.36% and .61% for Classes A, B, C and I, respectively, multiplied by the average account value over the period, multiplied by 182/365 (to reflect the one-half year period).
Michigan
| Hypothetical Performance | ||||||||||||||||||||||||||||||||||
| Actual Performance | (5% annualized return before expenses) | |||||||||||||||||||||||||||||||||
| A Shares | B Shares | C Shares | I Shares | A Shares | B Shares | C Shares | I Shares | |||||||||||||||||||||||||||
| Beginning Account Value (12/01/10) | $ | 1,000.00 | $ | 1,000.00 | $ | 1,000.00 | $ | 1,000.00 | $ | 1,000.00 | $ | 1,000.00 | $ | 1,000.00 | $ | 1,000.00 | ||||||||||||||||||
| Ending Account Value (5/31/11) | $ | 1,020.90 | $ | 1,016.90 | $ | 1,018.10 | $ | 1,021.80 | $ | 1,020.69 | $ | 1,016.95 | $ | 1,017.95 | $ | 1,021.69 | ||||||||||||||||||
| Expenses Incurred During Period | $ | 4.28 | $ | 8.05 | $ | 7.04 | $ | 3.28 | $ | 4.28 | $ | 8.05 | $ | 7.04 | $ | 3.28 | ||||||||||||||||||
For each class of the Fund, expenses are equal to the Fund’s annualized net expense ratio of .85%, 1.60%, 1.40% and .65% for Classes A, B, C and I, respectively, multiplied by the average account value over the period, multiplied by 182/365 (to reflect the one-half year period).
| 32 | Nuveen Investments |
Missouri
| Hypothetical Performance | ||||||||||||||||||||||||||||||||||
| Actual Performance | (5% annualized return before expenses) | |||||||||||||||||||||||||||||||||
| A Shares | B Shares | C Shares | I Shares | A Shares | B Shares | C Shares | I Shares | |||||||||||||||||||||||||||
| Beginning Account Value (12/01/10) | $ | 1,000.00 | $ | 1,000.00 | $ | 1,000.00 | $ | 1,000.00 | $ | 1,000.00 | $ | 1,000.00 | $ | 1,000.00 | $ | 1,000.00 | ||||||||||||||||||
| Ending Account Value (5/31/11) | $ | 1,021.60 | $ | 1,017.80 | $ | 1,018.70 | $ | 1,022.50 | $ | 1,020.84 | $ | 1,017.1 | $ | 1,018.10 | $ | 1,021.84 | ||||||||||||||||||
| Expenses Incurred During Period | $ | 4.13 | $ | 7.90 | $ | 6.90 | $ | 3.13 | $ | 4.13 | $ | 7.90 | $ | 6.89 | $ | 3.13 | ||||||||||||||||||
For each class of the Fund, expenses are equal to the Fund’s annualized net expense ratio of .82%, 1.57%, 1.37% and .62% for Classes A, B, C and I, respectively, multiplied by the average account value over the period, multiplied by 182/365 (to reflect the one-half year period).
Ohio
| Hypothetical Performance | ||||||||||||||||||||||||||||||||||
| Actual Performance | (5% annualized return before expenses) | |||||||||||||||||||||||||||||||||
| A Shares | B Shares | C Shares | I Shares | A Shares | B Shares | C Shares | I Shares | |||||||||||||||||||||||||||
| Beginning Account Value (12/01/10) | $ | 1,000.00 | $ | 1,000.00 | $ | 1,000.00 | $ | 1,000.00 | $ | 1,000.00 | $ | 1,000.00 | $ | 1,000.00 | $ | 1,000.00 | ||||||||||||||||||
| Ending Account Value (5/31/11) | $ | 1,020.60 | $ | 1,016.00 | $ | 1,016.90 | $ | 1,020.90 | $ | 1,020.79 | $ | 1,017.05 | $ | 1,018.05 | $ | 1,021.79 | ||||||||||||||||||
| Expenses Incurred During Period | $ | 4.18 | $ | 7.94 | $ | 6.94 | $ | 3.17 | $ | 4.18 | $ | 7.95 | $ | 6.94 | $ | 3.18 | ||||||||||||||||||
For each class of the Fund, expenses are equal to the Fund’s annualized net expense ratio of .83%, 1.58%, 1.38% and .63% for Classes A, B, C and I, respectively, multiplied by the average account value over the period, multiplied by 182/365 (to reflect the one-half year period).
Wisconsin
| Hypothetical Performance | ||||||||||||||||||||||||||||||||||
| Actual Performance | (5% annualized return before expenses) | |||||||||||||||||||||||||||||||||
| A Shares | B Shares | C Shares | I Shares | A Shares | B Shares | C Shares | I Shares | |||||||||||||||||||||||||||
| Beginning Account Value (12/01/10) | $ | 1,000.00 | $ | 1,000.00 | $ | 1,000.00 | $ | 1,000.00 | $ | 1,000.00 | $ | 1,000.00 | $ | 1,000.00 | $ | 1,000.00 | ||||||||||||||||||
| Ending Account Value (5/31/11) | $ | 1,019.30 | $ | 1,016.30 | $ | 1,016.60 | $ | 1,020.30 | $ | 1,020.49 | $ | 1,016.75 | $ | 1,017.75 | $ | 1,021.59 | ||||||||||||||||||
| Expenses Incurred During Period | $ | 4.48 | $ | 8.24 | $ | 7.24 | $ | 3.37 | $ | 4.48 | $ | 8.25 | $ | 7.24 | $ | 3.38 | ||||||||||||||||||
For each class of the Fund, expenses are equal to the Fund’s annualized net expense ratio of .89%, 1.64%, 1.44% and .67% for Classes A, B, C and I, respectively, multiplied by the average account value over the period, multiplied by 182/365 (to reflect the one-half year period).
| Nuveen Investments | 33 |
Independent Registered
Public Accounting Firm
To the Board of Trustees and Shareholders of
Nuveen Multistate Trust IV:
In our opinion, the accompanying statements of assets and liabilities, including the portfolios of investments, and the related statements of operations and of changes in net assets and the financial highlights present fairly, in all material respects, the financial position of Nuveen Kansas Municipal Bond Fund, Nuveen Kentucky Municipal Bond Fund, Nuveen Michigan Municipal Bond Fund, Nuveen Missouri Municipal Bond Fund, Nuveen Ohio Municipal Bond Fund, and Nuveen Wisconsin Municipal Bond Fund (each a series of the Nuveen Multistate Trust IV, hereafter referred to as the “Funds”) at May 31, 2011, the results of their operations for the year then ended, the changes in their net assets for each of the two years in the period then ended and the financial highlights for each of the five years in the period then ended in conformity with accounting principles generally accepted in the United States of America. These financial statements and financial highlights (hereafter referred to as “financial statements”) are the responsibility of the Funds’ management; our responsibility is to express an opinion on these financial statements based on our audits. We conducted our audits of these financial statements in accordance with the standards of the Public Company Accounting Oversight Board (United States). Those standards require that we plan and perform the audit to obtain reasonable assurance about whether the financial statements are free of material misstatement. An audit includes examining, on a test basis, evidence supporting the amounts and disclosures in the financial statements, assessing the accounting principles used and significant estimates made by management, and evaluating the overall financial statement presentation. We believe that our audits, which included confirmation of securities at May 31, 2011 by correspondence with the custodian and brokers, provide a reasonable basis for our opinion.
PRICEWATERHOUSECOOPERS LLP
Chicago, IL
July 27, 2011
| 34 | Nuveen Investments |
Nuveen Kansas Municipal Bond Fund
May 31, 2011
| Principal Amount (000) | Description (1) | Optional Call Provisions (2) | Ratings (3) | Value | ||||||||||||||
Education and Civic Organizations – 3.3% | ||||||||||||||||||
| $ | 1,200 | Kansas Development Finance Authority, Athletic Facilities Revenue Bonds, K-State Athletics Inc Project, Series 2011-A1, 5.000%, 7/01/28 | 7/16 at 100.00 | A1 | $ | 1,226,124 | ||||||||||||
| 1,000 | Kansas Development Finance Authority, Athletic Facility Revenue Bonds, University of Kansas Athletic Corporation Project, Series 2004K, 5.000%, 6/01/19 | 6/14 at 100.00 | Aa3 | 1,055,910 | ||||||||||||||
| 1,200 | Kansas Development Finance Authority, Board of Regents, Revenue Bonds, Kansas State University Housing System, Series 2005A, 5.000%, 4/01/22 – NPFG Insured | 4/15 at 100.00 | Aa3 | 1,260,168 | ||||||||||||||
Kansas Development Finance Authority, Revenue Bonds, Kansas Board of Regents Univeristy of Kansas Medical Center Research Institute, | ||||||||||||||||||
| 675 | 5.000%, 4/01/29 | 4/20 at 100.00 | Aa1 | 710,654 | ||||||||||||||
| 1,390 | 5.000%, 4/01/30 | 4/20 at 100.00 | Aa1 | 1,453,009 | ||||||||||||||
| 5,465 | Total Education and Civic Organizations | 5,705,865 | ||||||||||||||||
Energy – 1.0% | ||||||||||||||||||
| 1,175 | Virgin Islands Public Finance Authority, Revenue Bonds, Refinery Project – Hovensa LLC, Series 2003, 6.125%, 7/01/22 (Alternative Minimum Tax) | 1/14 at 100.00 | Baa3 | 1,113,430 | ||||||||||||||
| 500 | Virgin Islands Public Finance Authority, Senior Secured Lien Revenue Bonds, Refinery Project – Hovensa LLC, Series 2004, 5.875%, 7/01/22 | 7/14 at 100.00 | Baa3 | 464,180 | ||||||||||||||
| 1,675 | Total Energy | 1,577,610 | ||||||||||||||||
Health Care – 23.4% | ||||||||||||||||||
| 1,005 | Coffeyville Public Building Commission, Kansas, Healthcare Facilities Revenue Bonds, Coffeyville Regional Medical Center, Series 2002, | 8/12 at 100.00 | N/R | 1,023,452 | ||||||||||||||
| 1,660 | Colby, Kansas, Health Facilities Revenue Refunding Bonds, Citizens Medical Center Inc., Series 1998, 5.625%, 8/15/16 | 8/11 at 100.00 | N/R | 1,625,688 | ||||||||||||||
| 8,650 | Kansas Development Finance Authority Hospital Revenue Bonds, Adventist Health System/Sunbelt Obligated Group, Series 2009C, 5.750%, 11/15/38 (UB) (5) | 11/19 at 100.00 | AA– | 9,135,426 | ||||||||||||||
| 2,400 | Kansas Development Finance Authority Hospital Revenue Bonds, Adventist Health System/Sunbelt Obligated Group, Series 2009D, 5.000%, 11/15/29 (UB) (5) | 11/17 at 100.00 | AA– | 2,463,840 | ||||||||||||||
| 1,680 | Kansas Development Finance Authority, Health Facilities Revenue Bonds, Hays Medical Center Inc., Series 2005L, 5.000%, 11/15/20 | 11/15 at 100.00 | A2 | 1,762,303 | ||||||||||||||
| 2,900 | Kansas Development Finance Authority, Health Facilities Revenue Bonds, Hays Medical Center Inc., Series 2010Q, 5.000%, 5/15/35 | 5/19 at 100.00 | A2 | 2,726,522 | ||||||||||||||
| 2,000 | Kansas Development Finance Authority, Health Facilities Revenue Bonds, Stormont-Vail Health Care Inc., Series 2007L, 4.750%, 11/15/36 – NPFG Insured | 11/17 at 100.00 | A2 | 1,860,400 | ||||||||||||||
| 2,000 | Kansas Development Finance Authority, Health Facilities Revenue Bonds, Stormont-Vail Health Care Inc., Series 2008F, 5.375%, 11/15/28 | 11/17 at 100.00 | A2 | 2,056,440 | ||||||||||||||
| 1,285 | Kansas Development Finance Authority, Hospital Revenue Bonds, Susan B. Allen Memorial Hospital, Series 2002Q, 5.375%, 12/15/16 – RAAI Insured | 12/12 at 100.00 | BBB– | 1,310,173 | ||||||||||||||
Kansas Development Finance Authority, Revenue Bonds, Sisters of Charity of Leavenworth Health Services Corporation, Series 2010A: | ||||||||||||||||||
| 2,475 | 5.000%, 1/01/23 | 1/20 at 100.00 | AA | 2,653,225 | ||||||||||||||
| 1,500 | 5.000%, 1/01/40 | No Opt. Call | AA | 1,503,045 | ||||||||||||||
| 2,850 | Labette County Medical Center, Kansas, Revenue Bonds, Series 2007A, | 9/17 at 100.00 | N/R | 2,595,467 | ||||||||||||||
Lawrence, Kansas, Hospital Revenue Bonds, Lawrence Memorial Hospital, Refunding Series 2006: | ||||||||||||||||||
| 2,500 | 5.125%, 7/01/26 | 7/16 at 100.00 | A2 | 2,509,325 | ||||||||||||||
| 500 | 5.125%, 7/01/36 | 7/16 at 100.00 | A2 | 473,325 | ||||||||||||||
| 3,000 | Neosho County, Kansas, Hospital Revenue Bonds, Neosho Memorial Regional Medical Center, Series 2006A, 5.150%, 9/01/31 | 9/14 at 100.00 | N/R | 2,442,660 | ||||||||||||||
| 1,000 | Olathe, Kansas, Health Facilities Revenue Bonds, Olathe Medical Center, | 9/19 at 100.00 | A+ | 986,540 | ||||||||||||||
| Nuveen Investments | 35 |
Portfolio of Investments
Nuveen Kansas Municipal Bond Fund (continued)
May 31, 2011
| Principal Amount (000) | Description (1) | Optional Call Provisions (2) | Ratings (3) | Value | ||||||||||||
Health Care (continued) | ||||||||||||||||
| $ | 100 | Puerto Rico Industrial, Tourist, Educational, Medical and Environmental Control Facilities Financing Authority, Hospital Revenue Bonds, Auxilio Mutuo Hospital, Series 1995A, 6.250%, 7/01/24 – NPFG Insured | 7/11 at 100.00 | A– | $ | 100,108 | ||||||||||
| 750 | Salina, Kansas, Hospital Revenue Bonds, Salina Regional Medical Center, | 4/16 at 100.00 | A1 | 711,645 | ||||||||||||
| 2,000 | Wichita, Kansas, Hospital Facilities Revenue Refunding and Improvement Bonds, Via Christi Health System Inc., Series 2001-III, 5.625%, 11/15/31 | 11/11 at 101.00 | A+ | 2,011,160 | ||||||||||||
| 40,255 | Total Health Care | 39,950,744 | ||||||||||||||
Housing/Multifamily – 2.0% | ||||||||||||||||
Wichita, Kansas, Multifamily Housing Revenue Refunding Bonds, Shores Apartments, Series 1994XI-A: | ||||||||||||||||
| 1,500 | 6.700%, 4/01/19 – RAAI Insured | 10/11 at 100.00 | N/R | 1,491,720 | ||||||||||||
| 2,000 | 6.800%, 4/01/24 – RAAI Insured | 10/11 at 100.00 | N/R | 1,936,040 | ||||||||||||
| 3,500 | Total Housing/Multifamily | 3,427,760 | ||||||||||||||
Housing/Single Family – 8.8% | ||||||||||||||||
| 2,330 | Sedgwick and Shawnee Counties, Kansas, FNMA/GNMA Mortgage-Backed Securities Program Single Family Revenue Bonds, Series 2002B-1, 5.950%, 12/01/33 (Alternative Minimum Tax) | 12/12 at 105.00 | Aaa | 2,426,159 | ||||||||||||
| 1,875 | Sedgwick and Shawnee Counties, Kansas, FNMA/GNMA Mortgage-Backed Securities Program Single Family Revenue Bonds, Series 2005A, 5.550%, 6/01/37 (Alternative Minimum Tax) | 6/15 at 105.00 | Aaa | 1,996,594 | ||||||||||||
| 90 | Sedgwick and Shawnee Counties, Kansas, GNMA Mortgage-Backed Securities Program Single Family Revenue Bonds, Series 1997A-1, 6.950%, 6/01/29 (Alternative Minimum Tax) | No Opt. Call | Aaa | 93,997 | ||||||||||||
| 2,675 | Sedgwick and Shawnee Counties, Kansas, Mortgage Backed Securities Program Single Family Mortgage Revenue Bonds, Series 2006A1, 5.500%, 12/01/38 (Alternative Minimum Tax) | 12/16 at 104.00 | Aaa | 2,855,857 | ||||||||||||
| 2,395 | Sedgwick and Shawnee Counties, Kansas, Mortgage Backed Securities Program Single Family Mortgage Revenue Bonds, Series 2006A6, 5.550%, 6/01/38 (Alternative Minimum Tax) | 6/16 at 103.00 | Aaa | 2,466,970 | ||||||||||||
| 2,050 | Sedgwick and Shawnee Counties, Kansas, Mortgage Backed Securities Program Single Family Mortgage Revenue Bonds, Series 2006B1, 5.300%, 12/01/38 (Alternative Minimum Tax) | 6/16 at 103.00 | Aaa | 2,070,603 | ||||||||||||
| 2,955 | Sedgwick and Shawnee Counties, Kansas, Mortgage Backed Securities Program Single Family Mortgage Revenue Bonds, Series 2007B4, 5.550%, 12/01/38 (Alternative Minimum Tax) | 12/16 at 104.00 | Aaa | 3,087,620 | ||||||||||||
| 14,370 | Total Housing/Single Family | 14,997,800 | ||||||||||||||
Industrials – 1.1% | ||||||||||||||||
| 1,025 | Wichita Airport Authority, Kansas, Special Facilities Revenue Bonds, Cessna | 6/12 at 101.00 | BBB– | 906,049 | ||||||||||||
| 1,000 | Wichita, Kansas, Industrial Revenue Bonds, NMF America Inc. Series 2000-II, 5.800%, 8/01/15 (Alternative Minimum Tax) | 8/11 at 100.00 | AA | 1,002,560 | ||||||||||||
| 2,025 | Total Industrials | 1,908,609 | ||||||||||||||
Long-Term Care – 4.5% | ||||||||||||||||
| 3,125 | Kansas Development Finance Authority, Revenue Bonds, Lifespace Communities, Inc., Refunding Series 2010S, 5.000%, 5/15/30 | 5/20 at 100.00 | N/R | 2,799,969 | ||||||||||||
Lenexa, Kansas, Health Care Facilities Revenue Bonds, Lakeview Village Inc, Refunding & Improvement Series 2007: | ||||||||||||||||
| 1,270 | 5.125%, 5/15/16 | No Opt. Call | N/R | 1,147,496 | ||||||||||||
| 1,000 | 5.500%, 5/15/39 | 5/17 at 100.00 | N/R | 717,220 | ||||||||||||
| 1,980 | Manhattan Health Care Facility Revenue Bonds, Kansas, Meadowlarks Hills Retirement, Series 2007B, 5.125%, 5/15/42 | 5/14 at 103.00 | N/R | 1,484,248 | ||||||||||||
| 2,000 | Olathe, Kansas, Senior Living Facility Revenue Bonds, Aberdeen Village Inc, Refunding Series 2005A, 5.600%, 5/15/28 | 11/11 at 100.00 | N/R | 1,601,120 | ||||||||||||
| 9,375 | Total Long-Term Care | 7,750,053 | ||||||||||||||
| 36 | Nuveen Investments |
| Principal Amount (000) | Description (1) | Optional Call Provisions (2) | Ratings (3) | Value | ||||||||||||
Tax Obligation/General – 12.2% | ||||||||||||||||
| $ | 2,500 | Butler and Sedgwick Counties Unified School District 385, Andover, Kansas, General Obligation Refunding and Improvement Bonds, Series 2000, 6.000%, 9/01/16 – AGM Insured | No Opt. Call | AA+ | $ | 3,022,000 | ||||||||||
| 2,000 | Butler County Unified School District 402, Kansas, General Obligation Bonds, | 9/18 at 100.00 | Aa3 | 2,069,580 | ||||||||||||
| 65 | Cowley County Unified School District 465, Winfield, Kansas, General Obligation Bonds, Series 2003, 5.250%, 10/01/23 – NPFG Insured | 10/13 at 100.00 | Baa1 | 69,776 | ||||||||||||
| 1,500 | Douglas County Unified School District 497, Kansas, General Obligation Bonds, | 9/16 at 100.00 | Aa2 | 1,599,705 | ||||||||||||
| 2,000 | Finney County Unified School District 457, Garden City, Kansas, General Obligation Bonds, Series 2009A, 5.250%, 9/01/24 – AGC Insured | 9/19 at 100.00 | AA+ | 2,324,720 | ||||||||||||
Puerto Rico, General Obligation and Public Improvement Bonds, | ||||||||||||||||
| 1,000 | 5.500%, 7/01/20 – NPFG Insured | No Opt. Call | A3 | 1,052,510 | ||||||||||||
| 330 | 5.375%, 7/01/28 | 7/11 at 100.00 | A3 | 326,891 | ||||||||||||
| 1,100 | Puerto Rico, General Obligation Bonds, Public Improvement, Refunding Series 2011C, 6.500%, 7/01/40 | 7/21 at 100.00 | A3 | 1,168,453 | ||||||||||||
| 3,000 | Sedgwick County Unified School District 262, Kansas, General Obligation Bonds, | 9/18 at 100.00 | AA+ | 3,275,340 | ||||||||||||
| 500 | Unified School District 470, Cowley County, Kansas, General Obligation Bonds, | 9/18 at 100.00 | AA+ | 574,730 | ||||||||||||
| 2,085 | Wyandotte County Unified School District 203, Piper, Kansas, General Obligation Bonds, Series 2008B, 5.500%, 9/01/28 | 9/18 at 100.00 | AA– | 2,323,733 | ||||||||||||
| 2,725 | Wyandotte County/Kansas City Unified Government, Kansas, General Obligation Bonds, Series 2010A, 5.000%, 8/01/25 | 8/20 at 100.00 | AA | 3,021,153 | ||||||||||||
| 18,805 | Total Tax Obligation/General | 20,828,591 | ||||||||||||||
Tax Obligation/Limited – 22.6% | ||||||||||||||||
| 1,000 | Dodge City, Kansas, Sales Tax Revenue Bonds, Series 2009, | 6/19 at 100.00 | AA+ | 1,032,940 | ||||||||||||
| 1,000 | Guam Government, Limited Obligation Section 30 Revenue Bonds, Series 2009A, 5.750%, 12/01/34 | 12/19 at 100.00 | BBB– | 1,001,330 | ||||||||||||
Johnson County Public Building Commission, Kansas, Lease Purchase Revenue Bonds, Series 2011A: | ||||||||||||||||
| 1,820 | 4.000%, 9/01/25 | 9/20 at 100.00 | AAA | 1,879,368 | ||||||||||||
| 2,020 | 4.000%, 9/01/26 | 9/20 at 100.00 | AAA | 2,066,218 | ||||||||||||
| 1,625 | 4.000%, 9/01/27 | 9/20 at 100.00 | AAA | 1,645,638 | ||||||||||||
| 1,220 | 4.125%, 9/01/28 | 9/20 at 100.00 | AAA | 1,236,824 | ||||||||||||
| 1,270 | 4.250%, 9/01/29 | 9/20 at 100.00 | AAA | 1,291,819 | ||||||||||||
| 1,000 | Kansas Department of Transportation, Highway Revenue Bonds, Series 2004A, | 3/14 at 100.00 | AAA | 1,093,530 | ||||||||||||
| 3,000 | Kansas Development Finance Authority, Board of Regents, Revenue Bonds, Scientific Research and Development Facilities Projects, Series 2003C, | 4/13 at 102.00 | AA | 3,162,660 | ||||||||||||
| 2,665 | Kansas Development Finance Authority, K-State Olathe Innovation Campus Inc., Johnson County Sales Tax Revenue Bonds, Series 2009L, 5.000%, 9/01/39 | 9/19 at 100.00 | AA | 2,727,201 | ||||||||||||
| 500 | Kansas Development Finance Authority, Lease Revenue Bonds, Department of Administration, State Capitol Restoration Parking Facility Project, Series 2002C, 5.000%, 10/01/21 – AGM Insured | 10/12 at 100.00 | AA+ | 521,530 | ||||||||||||
| 1,140 | Kansas Development Finance Authority, Lease Revenue Bonds, Department of Administration, State Capitol Restoration Project, Series 2004G-1, | 4/14 at 100.00 | AA | 1,222,297 | ||||||||||||
| 3,900 | Kansas Development Finance Authority, Revenue Bonds, Department of Administration, Comprehensive Transportation Program, Series 2006A, | 11/16 at 100.00 | AA | 4,193,631 | ||||||||||||
| Nuveen Investments | 37 |
Portfolio of Investments
Nuveen Kansas Municipal Bond Fund (continued)
May 31, 2011
| Principal Amount (000) | Description (1) | Optional Call Provisions (2) | Ratings (3) | Value | ||||||||||||
Tax Obligation/Limited (continued) | ||||||||||||||||
| $ | 460 | Kansas Development Finance Authority, Revenue Bonds, State Projects, Series 2001W, 5.000%, 10/01/17 – NPFG Insured | 10/11 at 100.00 | AA | $ | 465,764 | ||||||||||
| 1,155 | Kansas Development Finance Authority, Revenue Bonds, State Projects, Series 2004A, 5.000%, 4/01/22 – FGIC Insured | 4/14 at 101.00 | AA | 1,248,232 | ||||||||||||
| 5,000 | Overland Park Development Corporation, Kansas, First Tier Revenue Bonds, Overland Park Convention Center, Series 2007A, | 1/17 at 100.00 | Baa3 | 4,306,550 | ||||||||||||
Overland Park Transportation Development District, Kansas, Sales Tax Revenue Bonds, Oak Park Mall Project, Series 2010: | ||||||||||||||||
| 745 | 5.200%, 4/01/20 | No Opt. Call | BBB | 788,299 | ||||||||||||
| 1,350 | 5.900%, 4/01/32 | 4/20 at 100.00 | BBB | 1,384,412 | ||||||||||||
| 1,335 | Puerto Rico Sales Tax Financing Corporation, Sales Tax Revenue Bonds, First Subordinate Series 2010C, 5.250%, 8/01/41 | 8/20 at 100.00 | A+ | 1,276,567 | ||||||||||||
| 2,000 | Virgin Islands Public Finance Authority, Gross Receipts Taxes Loan Note, | 10/11 at 100.00 | BBB+ | 2,014,540 | ||||||||||||
| 1,865 | Wyandotte County-Kansas City Unified Government, Kansas, Sales Tax Special Obligation Bonds, Redevelopment Project Area B, Series 2005, 5.000%, 12/01/20 | 12/15 at 100.00 | N/R | 1,907,951 | ||||||||||||
| 4,000 | Wyandotte County-Kansas City Unified Government, Kansas, Sales Tax Special Obligation Capital Appreciation Revenue Bonds Redevelopment Project Area B – Major Multi-Sport Athletic Complex Project, Subordinate Lien Series 2010B, | No Opt. Call | BBB | 2,271,120 | ||||||||||||
| 40,070 | Total Tax Obligation/Limited | 38,738,421 | ||||||||||||||
U.S. Guaranteed – 2.3% (4) | ||||||||||||||||
| 540 | Kansas Development Finance Authority, Revenue Bonds, State Projects, Series 2001W, 5.000%, 10/01/17 (Pre-refunded 10/01/11) – NPFG Insured | 10/11 at 100.00 | Baa1 | (4) | 548,694 | |||||||||||
| 1,000 | Kansas Development Finance Authority, Water Pollution Control Revolving Fund Leveraged Bonds, Series 2002-II, 5.000%, 11/01/23 (Pre-refunded 11/01/12) | 11/12 at 100.00 | AAA | 1,065,390 | ||||||||||||
| 1,100 | Montgomery County Unified School District 445, Coffeyville, Kansas, General Obligation Bonds, Series 2002, 5.000%, 4/01/22 (Pre-refunded 4/01/12) – FGIC Insured | 4/12 at 100.00 | BBB | (4) | 1,141,437 | |||||||||||
| 1,010 | Wichita, Kansas, Revenue Bonds, CSJ Health System of Wichita, Inc., | 11/11 at 100.00 | A+ | (4) | 1,171,590 | |||||||||||
| 3,650 | Total U.S. Guaranteed | 3,927,111 | ||||||||||||||
Utilities – 11.2% | ||||||||||||||||
Wyandotte County-Kansas City Unified Government, Kansas, Utility System Revenue Bonds, Series 2004B: | ||||||||||||||||
| 1,000 | 5.000%, 9/01/24 – AGM Insured | 9/14 at 100.00 | AA+ | 1,036,240 | ||||||||||||
| 9,240 | 5.000%, 9/01/32 – AGM Insured | 9/14 at 100.00 | AA+ | 9,317,802 | ||||||||||||
Wyandotte County-Kansas City Unified Government, Kansas, Utility System Revenue Bonds, Series 2009A: | ||||||||||||||||
| 3,000 | 5.000%, 9/01/29 – BHAC Insured | 3/19 at 100.00 | AA+ | 3,135,960 | ||||||||||||
| 3,000 | 5.250%, 9/01/34 – BHAC Insured | 3/19 at 100.00 | AA+ | 3,100,980 | ||||||||||||
| 1,535 | Wyandotte County-Kansas City Unified Government, Kansas, Utility System Revenue Bonds, Series 2011A, 5.000%, 9/01/28 | 9/21 at 100.00 | A+ | 1,608,297 | ||||||||||||
| 1,000 | Wynadotte County-Kansas City Unified Government, Kansas, Industrial Revenue Bonds, Board of Public Utilities Office Building Complex, Series 2001, | 11/11 at 100.00 | Baa1 | 1,003,000 | ||||||||||||
| 18,775 | Total Utilities | 19,202,279 | ||||||||||||||
Water and Sewer – 11.0% | ||||||||||||||||
| 5,000 | Kansas Development Finance Authority, Water Pollution Control Revolving Fund,State Match Program, Series 2008-CW, 5.000%, 11/01/24 | 1/13 at 100.00 | AAA | 5,355,751 | ||||||||||||
| 38 | Nuveen Investments |
| Principal Amount (000) | Description (1) | Optional Call Provisions (2) | Ratings (3) | Value | ||||||||||||
Water and Sewer (continued) | ||||||||||||||||
| $ | 1,000 | Puerto Rico Aqueduct and Sewerage Authority, Revenue Bonds, Senior Lien | 7/18 at 100.00 | Baa1 | $ | 1,003,081 | ||||||||||
| 6,500 | Wichita, Kansas, Water and Sewer Utility Revenue Bonds, Series 2009A, | 10/19 at 100.00 | AA– | 6,716,516 | ||||||||||||
| 5,500 | Wichita, Kansas, Water and Sewerage Utility Revenue Bonds, Series 2003, | 10/13 at 100.00 | Aa2 | 5,770,491 | ||||||||||||
| 18,000 | Total Water and Sewer | 18,845,839 | ||||||||||||||
| $ | 175,965 | Total Investments (cost $172,436,658) – 103.4% | 176,860,682 | |||||||||||||
| Floating Rate Obligations – (4.8)% | (8,285,000) | |||||||||||||||
| Other Assets Less Liabilities – 1.4% | 2,460,997 | |||||||||||||||
| Net Assets – 100% | $ | 171,036,679 | ||||||||||||||
| (1) | All percentages shown in the Portfolio of Investments are based on net assets. |
| (2) | Optional Call Provisions (not covered by the report of independent registered public accounting firm): Dates (month and year) and prices of the earliest optional call or redemption. There may be other call provisions at varying prices at later dates. Certain mortgage-backed securities may be subject to periodic principal paydowns. |
| (3) | Ratings (not covered by the report of independent registered public accounting firm): Using the highest of Standard & Poor’s Group (“Standard & Poor’s”), Moody’s Investor Service, Inc. (“Moody’s”) or Fitch, Inc. (“Fitch”) rating. Ratings below BBB by Standard & Poor’s, Baa by Moody’s or BBB by Fitch are considered to be below investment grade. Holdings designated N/R are not rated by any of these national rating agencies. |
| (4) | Backed by an escrow or trust containing sufficient U.S. Government or U.S. Government agency securities, which ensure the timely payment of principal and interest. Such investments are normally considered to be equivalent to AAA rated securities. |
| (5) | Investment, or portion of investment, has been pledged to collateralize the net payment obligations for investments in inverse floating rate transactions. |
| N/R | Not rated. |
| (ETM) | Escrowed to maturity. |
| (UB) | Underlying bond of an inverse floating rate trust reflected as a financing transaction. See Notes to Financial Statements, Footnote 1 – General Information and Significant Accounting Policies, Inverse Floating Rate Securities for more information. |
See accompanying notes to financial statements.
| Nuveen Investments | 39 |
Portfolio of Investments
Nuveen Kentucky Municipal Bond Fund
May 31, 2011
| Principal Amount (000) | Description (1) | Optional Call Provisions (2) | Ratings (3) | Value | ||||||||||||||
Consumer Staples – 1.1% | ||||||||||||||||||
| $ | 4,935 | Puerto Rico, The Children’s Trust Fund, Tobacco Settlement Asset-Backed Refunding Bonds, Series 2002, 5.375%, 5/15/33 | 5/12 at 100.00 | BBB | $ | 4,369,153 | ||||||||||||
Education and Civic Organizations – 6.0% | ||||||||||||||||||
| 3,805 | Campbellsville, Kentucky, Industrial Building Revenue Bonds, Campbellsville University Project, Series 1999, 5.500%, 3/01/29 | 9/11 at 100.00 | N/R | 3,741,190 | ||||||||||||||
| 1,000 | Campbellsville, Kentucky, Revenue Bonds, Campbellsville University, Series 2005, 5.700%, 3/01/34 | 3/15 at 100.00 | N/R | 975,030 | ||||||||||||||
| 4,980 | Columbia, Kentucky, Educational Development Revenue Bonds, Lindsey Wilson College Project, Series 2001, 6.250%, 4/01/21 | 10/11 at 101.00 | BBB– | 5,029,999 | ||||||||||||||
| 1,000 | Kentucky Asset/Liability Commission, General Receipts Revenue Bonds, University of Kentucky, Series 2005, 5.000%, 10/01/16 – FGIC Insured | 10/15 at 100.00 | Aa2 | 1,140,200 | ||||||||||||||
Kentucky Asset/Liability Commission, General Receipts Revenue Bonds, University of Kentucky, Series 2007A: | ||||||||||||||||||
| 1,645 | 5.000%, 10/01/20 – AMBAC Insured | 10/17 at 100.00 | Aa2 | 1,830,408 | ||||||||||||||
| 2,675 | 5.000%, 10/01/21 – AMBAC Insured | 10/17 at 100.00 | Aa2 | 2,948,626 | ||||||||||||||
| 4,435 | 5.000%, 10/01/22 – AMBAC Insured | 10/17 at 100.00 | Aa2 | 4,839,516 | ||||||||||||||
| 1,500 | Louisville and Jefferson County Metropolitan Government, Kentucky, General Revenue Bonds, Bellarmine University, Series 2008A, 6.000%, 5/01/38 | 5/18 at 100.00 | Baa3 | 1,503,270 | ||||||||||||||
| 2,000 | Louisville and Jefferson County Metropolitan Government, Kentucky, Industrial Building Revenue Bonds, Sisters of Mercy of the Americas, Series 2006, 5.000%, 10/01/35 | 10/16 at 100.00 | N/R | 1,907,840 | ||||||||||||||
| 23,040 | Total Education and Civic Organizations | 23,916,079 | ||||||||||||||||
Energy – 0.3% | ||||||||||||||||||
| 1,000 | Virgin Islands Public Finance Authority, Senior Secured Lien Revenue Bonds, Refinery Project – Hovensa LLC, Series 2004, 5.875%, 7/01/22 | 7/14 at 100.00 | Baa3 | 928,360 | ||||||||||||||
Health Care – 14.4% | ||||||||||||||||||
| 3,250 | Christian County, Kentucky, Hospital Revenue Refunding Bonds, Jennie Stuart Medical Center, Series 2006A, 5.500%, 2/01/36 – AGC Insured | 2/18 at 100.00 | AA+ | 3,274,050 | ||||||||||||||
Kentucky Economic Development Finance Authority, Hospital Facilities Revenue Bonds, Owensboro Medical Health System, Series 2010A: | ||||||||||||||||||
| 165 | 6.375%, 6/01/40 | 6/20 at 100.00 | Baa2 | 162,959 | ||||||||||||||
| 3,375 | 6.500%, 3/01/45 | No Opt. Call | Baa2 | 3,369,971 | ||||||||||||||
| 7,005 | Kentucky Economic Development Finance Authority, Hospital Revenue Bonds, Baptist Healthcare System, Series 2009A, 5.625%, 8/15/27 | 8/19 at 100.00 | Aa3 | 7,409,819 | ||||||||||||||
| 5,000 | Kentucky Economic Development Finance Authority, Hospital Revenue Bonds, Saint Elizabeth Medical Center, Series 2009A, 5.500%, 5/01/39 | 5/19 at 100.00 | AA– | 5,092,850 | ||||||||||||||
Kentucky Economic Development Finance Authority, Hospital System Revenue Refunding and Improvement Bonds, Appalachian Regional Healthcare Inc., Series 1997: | ||||||||||||||||||
| 3,500 | 5.850%, 10/01/17 | 10/11 at 100.00 | BB– | 3,280,375 | ||||||||||||||
| 1,495 | 5.875%, 10/01/22 | 10/11 at 100.00 | BB– | 1,307,064 | ||||||||||||||
| 1,500 | Louisville-Jefferson County Metropolitan Government, Kentucky, Health Facilities Revenue Bonds, Jewish Hospital & Saint Mary’s HealthCare Inc. Project, Series 2008, 6.125%, 2/01/37 | 2/18 at 100.00 | A– | 1,500,255 | ||||||||||||||
| 7,000 | Murray Hospital Facilities, Kentucky, Revenue Bonds, Murray-Calloway County Public Hospital, Series 2007, 5.125%, 8/01/37 | 8/17 at 100.00 | Baa2 | 5,654,460 | ||||||||||||||
| 7,000 | Pikeville, Kentucky, Hospital Revenue Bonds, Pikeville Medical Center, Inc. Project, Improvement and Refunding Series 2011, 6.500%, 3/01/41 | 3/21 at 100.00 | A3 | 7,151,060 | ||||||||||||||
| 2,195 | Rockcastle County, Kentucky, First Mortgage Revenue Bonds, Rockcastle Hospital and Respiratory Care Center Inc. Project, Series 2005, 5.550%, 6/01/30 | 6/15 at 100.00 | BBB– | 2,018,654 | ||||||||||||||
| 16,535 | Russell, Kentucky, Revenue Bonds, Bon Secours Health System, Series 2002A, 5.625%, 11/15/30 | 11/12 at 100.00 | A– | 16,556,162 | ||||||||||||||
| 40 | Nuveen Investments |
| Principal Amount (000) | Description (1) | Optional Call Provisions (2) | Ratings (3) | Value | ||||||||||||||
Health Care (continued) | ||||||||||||||||||
| $ | 1,000 | Warren County, Kentucky, Hospital Facilities Revenue Bonds, Community Hospital, Series 2007A, 5.000%, 8/01/29 | 8/17 at 100.00 | BBB+ | $ | 933,140 | ||||||||||||
| 59,020 | Total Health Care | 57,710,819 | ||||||||||||||||
Housing/Multifamily – 0.3% | ||||||||||||||||||
| 1,190 | Kentucky Housing Corporation, Conduit Multifamily Mortgage Revenue Bonds, Florence Homes III Apartments Project, Series 2005B, | 6/15 at 102.00 | N/R | 1,194,891 | ||||||||||||||
Housing/Single Family – 3.5% | ||||||||||||||||||
| 4,505 | Kentucky Housing Corporation, Housing Revenue Bonds, Series 1999A, 5.200%, 1/01/31 | 10/11 at 100.00 | AAA | 4,505,360 | ||||||||||||||
| 1,205 | Kentucky Housing Corporation, Housing Revenue Bonds, Series 2004F, 3.900%, 7/01/31 (Alternative Minimum Tax) | 1/14 at 100.00 | AAA | 1,218,448 | ||||||||||||||
| 675 | Kentucky Housing Corporation, Housing Revenue Bonds, Series 2007K, 5.000%, 7/01/34 | 1/17 at 100.00 | AAA | 671,315 | ||||||||||||||
| 100 | Kentucky Housing Corporation, Housing Revenue Bonds, Series 2008D, 5.650%, 7/01/38 (Alternative Minimum Tax) | 7/17 at 100.00 | AAA | 101,008 | ||||||||||||||
Kentucky Housing Corporation, Housing Revenue Bonds, Series 2008E: | ||||||||||||||||||
| 50 | 5.375%, 7/01/33 | 1/18 at 100.00 | AAA | 50,899 | ||||||||||||||
| 130 | 5.450%, 7/01/38 | 1/18 at 100.00 | AAA | 129,628 | ||||||||||||||
| 995 | Kentucky Housing Corporation, Housing Revenue Bonds, Series 2009A, 5.750%, 7/01/39 | 1/19 at 100.00 | AAA | 1,033,934 | ||||||||||||||
| 5,090 | Kentucky Housing Corporation, Housing Revenue Bonds, Series 2009B, 5.150%, 7/01/39 | 1/19 at 100.00 | AAA | 5,149,655 | ||||||||||||||
| 1,350 | Kentucky Housing Corporation, Housing Revenue Bonds, Series 2010C, 4.625%, 7/01/33 | 1/20 at 100.00 | AAA | 1,316,196 | ||||||||||||||
| 14,100 | Total Housing/Single Family | 14,176,443 | ||||||||||||||||
Long-Term Care – 0.5% | ||||||||||||||||||
| 2,000 | Kentucky Economic Development Finance Authority, Multifamily Housing Revenue Bonds, Christian Care Communities Projects, Series 2005, | 11/15 at 103.00 | AAA | 2,099,400 | ||||||||||||||
Materials – 0.7% | ||||||||||||||||||
| 2,820 | Wickliffe, Kentucky, Solid Waste Disposal Facility Revenue Bonds, Westvaco Corporation, Series 1996, 6.375%, 4/01/26 (Alternative Minimum Tax) | 10/11 at 100.00 | BBB | 2,773,301 | ||||||||||||||
Tax Obligation/General – 1.9% | ||||||||||||||||||
Crittenden County, Kentucky, General Obligation Bonds, Series 2007: | ||||||||||||||||||
| 1,085 | 6.000%, 12/01/27 | 12/17 at 100.00 | N/R | 1,131,145 | ||||||||||||||
| 1,605 | 6.250%, 12/01/32 | 12/17 at 100.00 | N/R | 1,666,504 | ||||||||||||||
| 2,190 | 6.500%, 12/01/37 | 12/17 at 100.00 | N/R | 2,264,854 | ||||||||||||||
Louisville and Jefferson County Metropolitan Government, Kentucky, General Obligation Bonds, Series 2004A-B: | ||||||||||||||||||
| 1,195 | 5.000%, 11/01/16 – AMBAC Insured | 11/14 at 100.00 | AA+ | 1,332,724 | ||||||||||||||
| 1,000 | 5.000%, 11/01/17 – AMBAC Insured | 11/14 at 100.00 | AA+ | 1,113,130 | ||||||||||||||
| 7,075 | Total Tax Obligation/General | 7,508,357 | ||||||||||||||||
Tax Obligation/Limited – 27.0% | ||||||||||||||||||
| 1,305 | Ballard County School District Finance Corporation, Kentucky, School Building Revenue Bonds, Series 2004, 5.000%, 6/01/21 – AMBAC Insured | 6/14 at 100.00 | Aa3 | 1,387,724 | ||||||||||||||
Boone County School District Finance Corporation, Kentucky, School Building Revenue Bonds, Series 2004B: | ||||||||||||||||||
| 1,460 | 5.000%, 5/01/20 – AGM Insured | 5/14 at 100.00 | Aa3 | 1,559,645 | ||||||||||||||
| 2,580 | 5.000%, 5/01/21 – AGM Insured | 5/14 at 100.00 | Aa3 | 2,720,275 | ||||||||||||||
| 1,465 | Boone County, Kentucky, Public Properties Corporation, First Mortgage Bonds, AOC Judicial Facility, Series 2001, 5.125%, 9/01/22 | 9/12 at 101.00 | Aa3 | 1,536,419 | ||||||||||||||
| Nuveen Investments | 41 |
Portfolio of Investments
Nuveen Kentucky Municipal Bond Fund (continued)
May 31, 2011
| Principal Amount (000) | Description (1) | Optional Call Provisions (2) | Ratings (3) | Value | ||||||||||||||
Tax Obligation/Limited (continued) | ||||||||||||||||||
Butler County School District Finance Corporation, Kentucky, Revenue Bonds, School Buildings, Series 2004C: | ||||||||||||||||||
| $ | 1,220 | 5.000%, 6/01/20 | 6/14 at 100.00 | Aa3 | $ | 1,293,725 | ||||||||||||
| 1,255 | 5.000%, 6/01/22 | 6/14 at 100.00 | Aa3 | 1,316,784 | ||||||||||||||
Kenton County School District Finance Corporation, Kentucky, School Building Revenue Bonds, Series 2004: | ||||||||||||||||||
| 2,115 | 5.000%, 6/01/17 – NPFG Insured | 6/14 at 100.00 | Aa3 | 2,304,208 | ||||||||||||||
| 3,510 | 5.000%, 6/01/18 – NPFG Insured | 6/14 at 100.00 | Aa3 | 3,816,528 | ||||||||||||||
| 3,690 | 5.000%, 6/01/19 – NPFG Insured | 6/14 at 100.00 | Aa3 | 4,012,248 | ||||||||||||||
Kentucky Area Development Districts Financing Trust, Ewing, Lease Acquisition Program Revenue Bonds, Series 2000C: | ||||||||||||||||||
| 425 | 5.850%, 6/01/20 | 12/11 at 100.50 | AA | 429,973 | ||||||||||||||
| 895 | 6.000%, 6/01/30 | 12/11 at 100.50 | AA | 903,064 | ||||||||||||||
| 2,000 | Kentucky Asset/Liability Commission, General Fund Revenue Project Notes, First Series 2005, 5.000%, 5/01/25 – NPFG Insured | 5/15 at 100.00 | Aa3 | 2,068,980 | ||||||||||||||
Kentucky Economic Development Finance Authority, Louisville Arena Project Revenue Bonds, Louisville Arena Authority, Inc., Series 2008-A1: | ||||||||||||||||||
| 1,950 | 5.750%, 12/01/28 – AGC Insured | 6/18 at 100.00 | AA+ | 2,047,812 | ||||||||||||||
| 3,450 | 6.000%, 12/01/33 – AGC Insured | 6/18 at 100.00 | AA+ | 3,588,690 | ||||||||||||||
| 4,430 | 6.000%, 12/01/38 – AGC Insured | 6/18 at 100.00 | AA+ | 4,558,559 | ||||||||||||||
| 8,965 | 6.000%, 12/01/42 – AGC Insured | 6/18 at 100.00 | AA+ | 9,240,942 | ||||||||||||||
Kentucky Economic Development Finance Authority, Louisville Arena Project Revenue Bonds, Louisville Arena Authority, Inc., Series 2008-A2: | ||||||||||||||||||
| 35 | 0.000%, 12/01/15 – AGC Insured | No Opt. Call | AA+ | 30,629 | ||||||||||||||
| 50 | 0.000%, 12/01/16 – AGC Insured | No Opt. Call | AA+ | 41,754 | ||||||||||||||
| 3,505 | 0.000%, 12/01/22 – AGC Insured | No Opt. Call | AA+ | 2,048,778 | ||||||||||||||
| 3,750 | 0.000%, 12/01/22 – AGC Insured | No Opt. Call | AA+ | 2,048,775 | ||||||||||||||
| 5,000 | Kentucky Economic Development Finance Authority, Louisville Arena Project Revenue Bonds, Louisville Arena Authority, Inc., Tender Option Bonds | No Opt. Call | AA+ | 6,003,200 | ||||||||||||||
| 2,365 | Kentucky Local Correctional Facilities Authority, Multi-County Lease Revenue Bonds, Series 2004, 5.250%, 11/01/14 – NPFG Insured | No Opt. Call | Baa1 | 2,599,986 | ||||||||||||||
| 1,000 | Kentucky State Property and Buildings Commission, Revenue Bonds, Project 81, Series 2003, 5.000%, 11/01/19 – AMBAC Insured | 11/13 at 100.00 | A+ | 1,076,020 | ||||||||||||||
| 2,000 | Kentucky State Property and Buildings Commission, Revenue Bonds, Project 84, Series 2005, 5.000%, 8/01/18 – NPFG Insured | No Opt. Call | Aa3 | 2,300,660 | ||||||||||||||
| 2,000 | Kentucky State Property and Buildings Commission, Revenue Bonds, Project 85, Series 2005, 5.000%, 8/01/15 – AGM Insured | No Opt. Call | AA+ | 2,282,640 | ||||||||||||||
Kentucky State Property and Buildings Commission, Revenue Bonds, Project 93, Refunding Series 2009: | ||||||||||||||||||
| 2,500 | 5.250%, 2/01/28 – AGC Insured | 2/19 at 100.00 | AA+ | 2,651,050 | ||||||||||||||
| 2,500 | 5.250%, 2/01/29 – AGC Insured | 2/19 at 100.00 | AA+ | 2,629,375 | ||||||||||||||
| 3,000 | Kentucky State Property and Buildings Commission, Revenue Bonds, Project 96, Series 2009A, 5.000%, 11/01/29 | 11/19 at 100.00 | Aa3 | 3,113,610 | ||||||||||||||
| 2,000 | Kentucky Turnpike Authority, Economic Development Road Revenue Bonds, Revitalization Project, Refunding Series 2010A, 5.000%, 7/01/20 | No Opt. Call | AA+ | 2,334,100 | ||||||||||||||
Kentucky Turnpike Authority, Economic Development Road Revenue Bonds, Revitalization Project, Series 2006B: | ||||||||||||||||||
| 2,095 | 5.000%, 7/01/15 – AMBAC Insured | No Opt. Call | AA+ | 2,395,528 | ||||||||||||||
| 5,000 | 5.000%, 7/01/24 – AMBAC Insured | 7/16 at 100.00 | AA+ | 5,364,900 | ||||||||||||||
| 25 | Kentucky Turnpike Authority, Economic Development Road Revenue Bonds, Revitalization Project, Series 2008A, 5.000%, 7/01/28 | 7/18 at 100.00 | AA+ | 26,284 | ||||||||||||||
| 2,820 | Kentucky Turnpike Authority, Economic Development Road Revenue Bonds, Revitalization Project, Series 2009A, 5.000%, 7/01/29 | 7/19 at 100.00 | AA+ | 2,960,351 | ||||||||||||||
| 2,060 | Laurel County School District Finance Corporation, Kentucky, School Building Revenue Bonds, Series 2007, 5.000%, 6/01/27 – AGM Insured | 6/17 at 100.00 | Aa3 | 2,144,954 | ||||||||||||||
| 42 | Nuveen Investments |
| Principal Amount (000) | Description (1) | Optional Call Provisions (2) | Ratings (3) | Value | ||||||||||||||
Tax Obligation/Limited (continued) | ||||||||||||||||||
Letcher County School District Finance Corporation, Kentucky, School Building Revenue Bonds, Series 2004: | ||||||||||||||||||
| $ | 1,430 | 5.000%, 6/01/18 – AGM Insured | 6/14 at 100.00 | Aa3 | $ | 1,539,152 | ||||||||||||
| 1,585 | 5.000%, 6/01/20 – AGM Insured | 6/14 at 100.00 | Aa3 | 1,694,096 | ||||||||||||||
| 1,695 | Louisville and Jefferson County Visitors and Convention Commission, Kentucky, Dedicated Tax Revenue Bonds, Series 2004A, | 6/14 at 101.00 | AA+ | 1,853,940 | ||||||||||||||
Oldham County School District Finance Corporation, Kentucky, School Building Revenue Bonds, Series 2004: | ||||||||||||||||||
| 1,230 | 5.000%, 5/01/18 – NPFG Insured | 5/14 at 100.00 | Aa3 | 1,329,692 | ||||||||||||||
| 1,635 | 5.000%, 5/01/20 – NPFG Insured | 5/14 at 100.00 | Aa3 | 1,759,636 | ||||||||||||||
| 1,715 | 5.000%, 5/01/21 – NPFG Insured | 5/14 at 100.00 | Aa3 | 1,823,885 | ||||||||||||||
| 500 | Pendleton County, Kentucky, Leasing Trust Revenue Bonds, Kentucky Association of Counties, Series 1993A, 6.400%, 3/01/19 | No Opt. Call | A | 604,480 | ||||||||||||||
| 11,600 | Puerto Rico Sales Tax Financing Corporation, Sales Tax Revenue Bonds, First Subordinate Series 2009A, 0.000%, 8/01/34 | No Opt. Call | A+ | 2,537,036 | ||||||||||||||
| 26,250 | Puerto Rico Sales Tax Financing Corporation, Sales Tax Revenue Bonds, Series 2010A, 0.000%, 8/01/35 | No Opt. Call | A+ | 5,264,700 | ||||||||||||||
| 1,360 | Shelby County School District Finance Corporation, Kentucky, Revenue Bonds, School Buildings, Series 2004, 5.000%, 5/01/23 – NPFG Insured | 5/14 at 100.00 | Aa3 | 1,446,550 | ||||||||||||||
| 2,185 | Spencer County School District Finance Corporation, Kentucky, Revenue Bonds, School Buildings, Series 2004, 5.000%, 7/01/21 – AGM Insured | 7/14 at 100.00 | Aa3 | 2,314,658 | ||||||||||||||
| 1,010 | Virgin Islands Public Finance Authority, Gross Receipts Taxes Loan Note, Series 2003, 5.250%, 10/01/21 – AGM Insured | 10/14 at 100.00 | AA+ | 1,066,085 | ||||||||||||||
| 134,615 | Total Tax Obligation/Limited | 108,072,080 | ||||||||||||||||
Transportation – 5.1% | ||||||||||||||||||
Guam International Airport Authority, Revenue Bonds, Series 2003C: | ||||||||||||||||||
| 5,000 | 5.250%, 10/01/22 – NPFG Insured (Alternative Minimum Tax) | 10/11 at 100.00 | Baa1 | 5,010,800 | ||||||||||||||
| 2,195 | 5.000%, 10/01/23 – NPFG Insured (Alternative Minimum Tax) | 10/13 at 100.00 | Baa1 | 2,148,993 | ||||||||||||||
| 5,090 | Kenton County Airport Board, Kentucky, Airport Revenue Bonds, Cincinnati/Northern Kentucky International Airport, Series 2003B, 5.000%, 3/01/23 – NPFG Insured (Alternative Minimum Tax) | 3/13 at 100.00 | A– | 5,108,222 | ||||||||||||||
| 980 | Kenton County Airport Board, Kentucky, Airport Revenue Bonds, Cincinnati/Northern Kentucky International Airport, Series 2007B, 5.000%, 3/01/13 – SYNCORA GTY Insured (Alternative Minimum Tax) | No Opt. Call | A– | 1,029,627 | ||||||||||||||
| 1,000 | Louisville and Jefferson County Regional Airport Authority, Kentucky, Airport System Revenue Bonds, Series 2003C, 5.250%, 7/01/22 – AGM Insured (Alternative Minimum Tax) | 7/13 at 100.00 | AA+ | 1,020,300 | ||||||||||||||
| 6,025 | Louisville and Jefferson County Regional Airport Authority, Kentucky, Special Facilities Revenue Bonds, Airis Louisville LLC Project, Series 1999A, 5.500%, 3/01/19 (Alternative Minimum Tax) | 9/11 at 100.00 | Baa3 | 5,945,350 | ||||||||||||||
| 20,290 | Total Transportation | 20,263,292 | ||||||||||||||||
U.S. Guaranteed – 6.4% (4) | ||||||||||||||||||
Bowling Green, Kentucky, General Obligation and Special Revenue Bonds, Series 2002B: | ||||||||||||||||||
| 1,230 | 5.000%, 6/01/24 (Pre-refunded 6/01/12) | 6/12 at 100.00 | Aa2 | (4) | 1,288,585 | |||||||||||||
| 1,700 | 5.000%, 6/01/25 (Pre-refunded 6/01/12) | 6/12 at 100.00 | Aa2 | (4) | 1,780,971 | |||||||||||||
| 1,000 | Kentucky Economic Development Finance Authority, Revenue Bonds, Catholic Health Initiatives, Series 2001, 5.250%, 9/01/21 (Pre-refunded 9/01/11) | 9/11 at 100.00 | Aa2 | (4) | 1,012,570 | |||||||||||||
| 2,795 | Kentucky State Property and Buildings Commission, Revenue Bonds, Project 85, Series 2005, 5.000%, 8/01/22 (Pre-refunded 8/01/15) – AGM Insured | 8/15 at 100.00 | AA+ | (4) | 3,257,321 | |||||||||||||
| 5,000 | Kentucky State Property and Buildings Commission, Revenue Refunding Bonds, Project 79, Series 2003, 5.000%, 10/01/22 (Pre-refunded 10/01/13) – NPFG Insured | 10/13 at 100.00 | Aa3 | (4) | 5,513,250 | |||||||||||||
| Nuveen Investments | 43 |
Portfolio of Investments
Nuveen Kentucky Municipal Bond Fund (continued)
May 31, 2011
| Principal Amount (000) | Description (1) | Optional Call Provisions (2) | Ratings (3) | Value | ||||||||||||||
U.S. Guaranteed (4) (continued) | ||||||||||||||||||
| $ | 4,000 | Kentucky Turnpike Authority, Economic Development Road Revenue Refunding Bonds, Revitalization Project, Series 2001B, 5.150%, 7/01/19 | 7/11 at 100.00 | AA+ | (4) | $ | 4,016,520 | |||||||||||
| 1,175 | Louisville, Kentucky, General Obligation Bonds, Series 2001A, | 11/11 at 101.00 | AA+ | (4) | 1,210,379 | |||||||||||||
| 3,000 | Louisville, Kentucky, General Obligation Bonds, Series 2002A, | 10/12 at 100.00 | AA+ | (4) | 3,186,840 | |||||||||||||
| 410 | Puerto Rico Highway and Transportation Authority, Highway Revenue Bonds, Series 2002D, 5.000%, 7/01/32 (Pre-refunded 7/01/12) – AGM Insured | 7/12 at 100.00 | AAA | 431,353 | ||||||||||||||
Puerto Rico Public Finance Corporation, Commonwealth Appropriation Bonds, Series 2002E: | ||||||||||||||||||
| 245 | 6.000%, 8/01/26 – AGC Insured (ETM) | No Opt. Call | AA+ | (4) | 313,745 | |||||||||||||
| 2,755 | 6.000%, 8/01/26 – AGC Insured (ETM) | No Opt. Call | AAA | 3,528,025 | ||||||||||||||
| 23,310 | Total U.S. Guaranteed | 25,539,559 | ||||||||||||||||
Utilities – 15.9% | ||||||||||||||||||
| 1,175 | Boone County, Kentucky, Collateralized Pollution Control Revenue Bonds, Dayton Power & Light Company, Series 2005A, 4.700%, 1/01/28 – FGIC Insured | 7/15 at 100.00 | Aa3 | 1,176,727 | ||||||||||||||
| 6,000 | Guam Power Authority, Revenue Bonds, Series 2010A, 5.000%, 10/01/37 – AGM Insured | 10/20 at 100.00 | AA+ | 5,644,320 | ||||||||||||||
Kentucky Municipal Power Agency, Power Supply System Revenue Bonds, Prairie State Project Series 2007A: | ||||||||||||||||||
| 4,000 | 5.000%, 9/01/37 – NPFG Insured | 9/17 at 100.00 | A– | 3,905,400 | ||||||||||||||
| 4,600 | 5.250%, 9/01/42 – NPFG Insured | 9/17 at 100.00 | A– | 4,519,868 | ||||||||||||||
| 2,535 | 5.250%, 9/01/42 – NPFG Insured | 9/17 at 100.00 | AA+ | 2,592,342 | ||||||||||||||
Owensboro, Kentucky, Electric Light and Power System Revenue Bonds, Series 1991B: | ||||||||||||||||||
| 6,475 | 0.000%, 1/01/12 – AMBAC Insured | No Opt. Call | A3 | 6,408,437 | ||||||||||||||
| 3,745 | 0.000%, 1/01/15 – AMBAC Insured | No Opt. Call | A3 | 3,357,692 | ||||||||||||||
| 7,900 | 0.000%, 1/01/17 – AMBAC Insured | No Opt. Call | A3 | 6,455,327 | ||||||||||||||
| 13,300 | 0.000%, 1/01/18 – AMBAC Insured | No Opt. Call | A3 | 10,260,683 | ||||||||||||||
Paducah, Kentucky, Electric Board Revenue Bonds, Series 2009A: | ||||||||||||||||||
| 2,945 | 5.000%, 10/01/20 – AGC Insured | 4/19 at 100.00 | Aa3 | 3,337,951 | ||||||||||||||
| 45 | 5.000%, 10/01/28 – AGC Insured | 4/19 at 100.00 | Aa3 | 47,028 | ||||||||||||||
| 8,575 | 5.250%, 10/01/35 – AGC Insured | 4/19 at 100.00 | Aa3 | 8,809,783 | ||||||||||||||
| 2,975 | Puerto Rico Electric Power Authority, Power Revenue Bonds, Series 2003NN, 5.250%, 7/01/23 – NPFG Insured | No Opt. Call | A3 | 3,113,219 | ||||||||||||||
| 3,990 | Puerto Rico Electric Power Authority, Power Revenue Bonds, Series 2005RR, 5.000%, 7/01/24 – FGIC Insured | 7/15 at 100.00 | A3 | 3,994,190 | ||||||||||||||
| 68,260 | Total Utilities | 63,622,967 | ||||||||||||||||
Water and Sewer – 16.2% | ||||||||||||||||||
Campbell & Kenton Counties Sanitation District 1, Kentucky, Revenue Bonds, Series 2007: | ||||||||||||||||||
| 100 | 5.000%, 8/01/21 – NPFG Insured | 8/17 at 100.00 | AA | 111,615 | ||||||||||||||
| 3,795 | 5.000%, 8/01/24 – NPFG Insured | 8/17 at 100.00 | AA | 4,121,712 | ||||||||||||||
| 1,000 | Kentucky Rural Water Finance Corporation, Multimodal Public Projects Revenue Bonds, Flexible Term Program, Series 2001A, 5.375%, 2/01/20 | 8/11 at 102.00 | AA– | 1,021,750 | ||||||||||||||
Louisville and Jefferson County Metropolitan Government Board of Water Works, Kentucky, Water System Revenue Bonds, Series 2006: | ||||||||||||||||||
| 2,565 | 5.000%, 11/15/27 | 11/16 at 100.00 | AAA | 2,744,678 | ||||||||||||||
| 4,990 | 5.000%, 11/15/29 | 11/16 at 100.00 | AAA | 5,291,296 | ||||||||||||||
| 7,655 | Louisville and Jefferson County Metropolitan Sewer District, Kentucky, Sewer and Drainage System Revenue Bonds, Series 1998A, | 11/11 at 100.00 | AA– | 7,658,215 | ||||||||||||||
| 16,000 | Louisville and Jefferson County Metropolitan Sewer District, Kentucky, Sewer and Drainage System Revenue Bonds, Series 2001A, 5.500%, 5/15/34 – NPFG Insured | 11/11 at 101.00 | AA– | 16,399,839 | ||||||||||||||
| 44 | Nuveen Investments |
| Principal Amount (000) | Description (1) | Optional Call Provisions (2) | Ratings (3) | Value | ||||||||||||||
Water and Sewer (continued) | ||||||||||||||||||
Louisville and Jefferson County Metropolitan Sewer District, Kentucky, Sewer and Drainage System Revenue Bonds, Series 2004A: | ||||||||||||||||||
| $ | 7,365 | 5.250%, 5/15/37 – FGIC Insured | 5/14 at 101.00 | AA– | $ | 7,532,554 | ||||||||||||
| 750 | 5.000%, 5/15/38 – FGIC Insured | 5/14 at 101.00 | AA– | 758,835 | ||||||||||||||
| 2,000 | Northern Kentucky Water District, Revenue Bonds, Series 2009, 6.500%, 2/01/33 – AGM Insured | 8/18 at 100.00 | Aa3 | 2,188,100 | ||||||||||||||
| 7,225 | Northern Kentucky Water District, Revenue Refunding Bonds, Series 2002A, 5.000%, 2/01/27 – FGIC Insured | 2/12 at 100.00 | Aa3 | 7,256,790 | ||||||||||||||
| 4,740 | Owen County, Kentucky, Waterworks System Revenue Bonds, Kentucky-American Water Company Project, Series 2009A, 6.250%, 6/01/39 | 6/19 at 100.00 | BBB+ | 4,924,102 | ||||||||||||||
| 5,000 | Owen County, Kentucky, Waterworks System Revenue Bonds, Kentucky-American Water Company Project, Series 2009B, 5.625%, 9/01/39 | 9/19 at 100.00 | BBB+ | 4,926,450 | ||||||||||||||
| 63,185 | Total Water and Sewer | 64,935,936 | ||||||||||||||||
| $ | 424,840 | Total Investments (cost $387,838,087) – 99.3% | 397,110,637 | |||||||||||||||
Other Assets Less Liabilities – 0.7% | 2,950,125 | |||||||||||||||||
Net Assets – 100% | $ | 400,060,762 | ||||||||||||||||
| (1) | All percentages shown in the Portfolio of Investments are based on net assets. |
| (2) | Optional Call Provisions (not covered by the report of independent registered public accounting firm): Dates (month and year) and prices of the earliest optional call or redemption. There may be other call provisions at varying prices at later dates. Certain mortgage-backed securities may be subject to periodic principal paydowns. |
| (3) | Ratings (not covered by the report of independent registered public accounting firm): Using the highest of Standard & Poor’s Group (“Standard & Poor’s”), Moody’s Investor Service, Inc. (“Moody’s”) or Fitch, Inc. (“Fitch”) rating. Ratings below BBB by Standard & Poor’s, Baa by Moody’s or BBB by Fitch are considered to be below investment grade. Holdings designated N/R are not rated by any of these national rating agencies. |
| (4) | Backed by an escrow or trust containing sufficient U.S. Government or U.S. Government agency securities, which ensure the timely payment of principal and interest. Such investments are normally considered to be equivalent to AAA rated securities. |
| N/R | Not rated. |
| (ETM) | Escrowed to maturity. |
| (IF) | Inverse floating rate investment. |
See accompanying notes to financial statements.
| Nuveen Investments | 45 |
Portfolio of Investments
Nuveen Michigan Municipal Bond Fund
May 31, 2011
| Principal Amount (000) | Description (1) | Optional Call Provisions (2) | Ratings (3) | Value | ||||||||||||||
Consumer Staples – 3.0% | ||||||||||||||||||
| $ | 6,000 | Michigan Tobacco Settlement Finance Authority, Tobacco Settlement Asset-Backed Revenue Bonds, Series 2008A, 6.875%, 6/01/42 | 6/18 at 100.00 | Baa3 | $ | 5,285,819 | ||||||||||||
| 750 | Puerto Rico, The Children’s Trust Fund, Tobacco Settlement Asset-Backed Refunding Bonds, Series 2002, 5.375%, 5/15/33 | 5/12 at 100.00 | BBB | 664,005 | ||||||||||||||
| 6,750 | Total Consumer Staples | 5,949,824 | ||||||||||||||||
Education and Civic Organizations – 2.7% | ||||||||||||||||||
| 1,000 | Michigan Finance Authority, Public School Academy Limited Obligation Revenue Bonds, Hanley International Academy, Inc. Project, Series 2010A, 6.125%, 9/01/40 | No Opt. Call | BBB– | 835,760 | ||||||||||||||
| 500 | Michigan Finance Authority, Public School Academy Limited Obligation Revenue Bonds, Holly Academy Project, Refunding Series 2011, 7.750%, 10/01/30 | 10/21 at 100.00 | BBB– | 511,140 | ||||||||||||||
| 1,000 | Michigan State University, General Revenue Bonds, Refunding Series 2010C, 5.000%, 2/15/40 | 2/20 at 100.00 | Aa1 | 1,022,960 | ||||||||||||||
Michigan Technological University, General Revenue Bonds, Series 2004A: | ||||||||||||||||||
| 1,230 | 5.000%, 10/01/24 – NPFG Insured | 10/13 at 100.00 | Aa3 | 1,249,914 | ||||||||||||||
| 1,740 | 5.000%, 10/01/29 – NPFG Insured | 10/13 at 100.00 | Aa3 | 1,754,164 | ||||||||||||||
| 5,470 | Total Education and Civic Organizations | 5,373,938 | ||||||||||||||||
Health Care – 10.5% | ||||||||||||||||||
| 450 | Jackson County Hospital Finance Authority, Michigan, Hospital Revenue Bonds, Alligiance Health, Refunding Series 2010A, 5.000%, 6/01/37 – AGM Insured | 6/20 at 100.00 | AA+ | 431,370 | ||||||||||||||
| 3,300 | Michigan State Hospital Finance Authority, Hospital Revenue Bonds, Henry Ford Health System, Refunding Series 2009, 5.750%, 11/15/39 | 11/19 at 100.00 | A1 | 3,249,906 | ||||||||||||||
| 3,350 | Michigan State Hospital Finance Authority, Hospital Revenue Bonds, Oakwood Obligated Group, Series 2002A, 5.750%, 4/01/32 | 4/13 at 100.00 | A | 3,354,322 | ||||||||||||||
| 1,000 | Michigan State Hospital FInance Authority, Hospital Revenue Bonds, MidMichigan Obligated Group, Series 2009A, 5.875%, 6/01/39 – AGC Insured | 6/19 at 100.00 | AA+ | 1,029,290 | ||||||||||||||
| 1,000 | Michigan State Hospital Finance Authority, Hospital Revenue Refunding Bonds, Crittenton Hospital, Series 2002A, 5.625%, 3/01/27 | 3/12 at 101.00 | A | 999,980 | ||||||||||||||
| 1,500 | Michigan State Hospital Finance Authority, Hospital Revenue Refunding Bonds, Trinity Health Credit Group, Series 2002C, 5.375%, 12/01/30 | 12/12 at 100.00 | AA | 1,504,605 | ||||||||||||||
Michigan State Hospital Finance Authority, Revenue Bonds, Marquette General Hospital, Series 2005A: | ||||||||||||||||||
| 1,400 | 5.000%, 5/15/12 | No Opt. Call | Baa3 | 1,432,634 | ||||||||||||||
| 1,400 | 5.000%, 5/15/26 | 5/15 at 100.00 | Baa3 | 1,259,174 | ||||||||||||||
| 50 | 5.000%, 5/15/34 | 5/15 at 100.00 | Baa3 | 41,221 | ||||||||||||||
| 2,000 | Michigan State Hospital Finance Authority, Revenue Bonds, Sparrow Obligated Group, Series 2005, 5.000%, 11/15/36 – NPFG Insured | 5/15 at 100.00 | A+ | 1,813,060 | ||||||||||||||
| 1,500 | Royal Oak Hospital Finance Authority, Michigan, Hospital Revenue and Refunding Bonds, William Beaumont Hospital Obligated Group, Series 2009W, 6.000%, 8/01/39 | 8/19 at 100.00 | A1 | 1,491,780 | ||||||||||||||
| 1,200 | Royal Oak Hospital Finance Authority, Michigan, Hospital Revenue Bonds, William Beaumont Hospital, Refunding Series 2009V, 8.250%, 9/01/39 | 9/18 at 100.00 | A1 | 1,381,032 | ||||||||||||||
Royal Oak Hospital Finance Authority, Michigan, Hospital Revenue Bonds, William Beaumont Hospital, Series 2001M: | ||||||||||||||||||
| 1,060 | 5.250%, 11/15/31 – NPFG Insured | 11/11 at 100.00 | A1 | 984,676 | ||||||||||||||
| 2,010 | 5.250%, 11/15/35 – NPFG Insured | 11/11 at 100.00 | A1 | 1,798,970 | ||||||||||||||
| 21,220 | Total Health Care | 20,772,020 | ||||||||||||||||
Housing/Multifamily – 2.7% | ||||||||||||||||||
| 1,200 | Michigan Housing Development Authority, Rental Housing Revenue Bonds, Series 2006D, 5.125%, 4/01/31 – AGM Insured (Alternative Minimum Tax) | 7/15 at 100.00 | AA+ | 1,192,092 | ||||||||||||||
| 46 | Nuveen Investments |
| Principal Amount (000) | Description (1) | Optional Call Provisions (2) | Ratings (3) | Value | ||||||||||||||
Housing/Multifamily (continued) | ||||||||||||||||||
| $ | 2,175 | Michigan Housing Development Authority, Rental Housing Revenue Bonds, Series 2009A, 5.700%, 10/01/39 | 10/18 at 100.00 | AA | $ | 2,229,767 | ||||||||||||
| 2,275 | Michigan Housing Development Authority, Section 8 Assisted Mortgage Revenue Bonds, Series 1983I, 0.000%, 4/01/14 | No Opt. Call | AA | 1,878,786 | ||||||||||||||
| 5,650 | Total Housing/Multifamily | 5,300,645 | ||||||||||||||||
Tax Obligation/General – 39.3% | ||||||||||||||||||
| 660 | Ann Arbor Public School District, Washtenaw County, Michigan, General Obligation Bonds, Series 2008, 5.000%, 5/01/23 | 5/18 at 100.00 | AA+ | 719,994 | ||||||||||||||
| 800 | Ann Arbor, Michigan, General Obligation Bonds, Court & Police Facilities Capital Improvement Series 2008, 5.000%, 5/01/38 | 5/18 at 100.00 | AA+ | 822,320 | ||||||||||||||
| 1,435 | Bay City, Michigan, General Obligation Bonds, Series 2008B, 5.500%, 4/01/28 – AGM Insured | 4/18 at 100.00 | AA+ | 1,533,742 | ||||||||||||||
| 1,020 | Caledonia Community Schools, Kent, Allegan and Barry Counties, Michigan, General Obligation Bonds, Series 2003, 5.250%, 5/01/22 | 5/13 at 100.00 | Aa2 | 1,080,027 | ||||||||||||||
Caledonia Community Schools, Kent, Allegan and Barry Counties, Michigan, General Obligation Bonds, Series 2005: | ||||||||||||||||||
| 1,000 | 5.000%, 5/01/23 – NPFG Insured | 5/15 at 100.00 | Aa2 | 1,064,870 | ||||||||||||||
| 2,085 | 5.000%, 5/01/24 – NPFG Insured | 5/15 at 100.00 | Aa2 | 2,164,584 | ||||||||||||||
| 1,000 | 5.000%, 5/01/25 – NPFG Insured | 5/15 at 100.00 | Aa2 | 1,031,930 | ||||||||||||||
| 2,013 | Caledonia Community Schools, Kent, Allegan and Barry Counties, Michigan, General Obligation Bonds, Tender Option Bond Trust 2008-1096, 7.853%, 5/01/32 – NPFG Insured (IF) | 5/17 at 100.00 | Aa2 | 1,967,406 | ||||||||||||||
| 1,850 | Chippewa Valley Schools, Macomb County, Michigan, General Obligation Bonds, Series 2005, 5.000%, 5/01/24 – NPFG Insured | 5/15 at 100.00 | Aa2 | 1,911,790 | ||||||||||||||
| 1,450 | City of Jackson, County of Jackson, State of Michigan, Downtown Development Bonds, Series 2001, General Obligation Limited Tax, 0.000%, 6/01/21 – AGM Insured | No Opt. Call | AA+ | 850,976 | ||||||||||||||
Detroit-Wayne County Stadium Authority, Michigan, Limited Tax General Obligation Building Authority Stadium Bonds, Series 1997: | ||||||||||||||||||
| 500 | 5.500%, 2/01/17 – FGIC Insured | 2/17 at 100.00 | A– | 500,915 | ||||||||||||||
| 11,000 | 5.250%, 2/01/27 – FGIC Insured | 8/11 at 100.00 | A– | 11,003,955 | ||||||||||||||
| 1,245 | Edwardsburg Public School, Cass County, Michigan, General Obligation Bonds, Series 2004, 5.000%, 5/01/24 – AGM Insured | 5/14 at 100.00 | AA+ | 1,279,325 | ||||||||||||||
| 480 | Genesee County, Michigan, General Obligation Water Supply Bonds, Series 2003, 5.125%, 11/01/33 – NPFG Insured | 11/13 at 100.00 | A1 | 481,709 | ||||||||||||||
| 5,850 | Hartland Consolidated School District, Livingston County, Michigan, General Obligation Refunding Bonds, Series 2001, 5.125%, 5/01/29 | 11/11 at 100.00 | Aa2 | 5,868,719 | ||||||||||||||
| 50 | Holly Area School District, Oakland County, Michigan, General Obligation Bonds, Series 2006, 5.125%, 5/01/32 – NPFG Insured | 5/16 at 100.00 | Aa2 | 50,867 | ||||||||||||||
| 1,060 | Homer Community School District, Calhourn, Jackson, Hillsdale and Branch Counties, Michigan, General Obligation Bonds, School Building & Site, Series 2011B, 5.500%, 5/01/41 | 5/21 at 100.00 | AA– | 1,081,052 | ||||||||||||||
| 1,675 | Hopkins Public Schools, Allegan County, Michigan, General Obligation Bonds, Series 2007, 5.000%, 5/01/25 – NPFG Insured | 5/17 at 100.00 | Aa2 | 1,746,456 | ||||||||||||||
| 2,000 | Howell Public Schools, Livingston County, Michigan, General Obligation Bonds, Series 2003, 5.000%, 5/01/24 | 11/13 at 100.00 | Aa2 | 2,084,540 | ||||||||||||||
| 1,000 | Jackson Public Schools, Jackson County, Michigan, General Obligation School Building and Site Bonds, Series 2004, 5.000%, 5/01/22 – AGM Insured | 5/14 at 100.00 | AA+ | 1,073,940 | ||||||||||||||
| 1,215 | Kalamazoo Public Schools, Michigan, General Obligation Bonds, Series 2006, 5.000%, 5/01/25 – AGM Insured | 5/16 at 100.00 | AA+ | 1,260,575 | ||||||||||||||
| 1,300 | Lansing Community College, Michigan, General Obligation Bonds, Series 2003, 5.000%, 5/01/20 – NPFG Insured | 5/13 at 100.00 | AA | 1,382,836 | ||||||||||||||
| Nuveen Investments | 47 |
Portfolio of Investments
Nuveen Michigan Municipal Bond Fund (continued)
May 31, 2011
| Principal Amount (000) | Description (1) | Optional Call Provisions (2) | Ratings (3) | Value | ||||||||||||||
Tax Obligation/General (continued) | ||||||||||||||||||
| $ | 840 | Lowell Area Schools, Counties of Ionia and Kent, Michigan, General Obligation Bonds, Series 2007, 5.000%, 5/01/37 – AGM Insured | 5/17 at 100.00 | AA+ | $ | 847,022 | ||||||||||||
| 350 | Michigan, General Obligation Bonds, Environmental Program, Series 2009A, 5.500%, 11/01/25 | 5/19 at 100.00 | �� | Aa2 | 382,953 | |||||||||||||
| 140 | Oakland County Building Authority, Michigan, General Obligation Bonds, Refunding Series 2006, 5.000%, 6/01/27 | 6/13 at 100.00 | AAA | 143,301 | ||||||||||||||
Oakland Intermediate School District, Oakland County, Michigan, General Obligation Bonds, Series 2007: | ||||||||||||||||||
| 500 | 5.000%, 5/01/27 – AGM Insured | 5/17 at 100.00 | Aaa | 522,210 | ||||||||||||||
| 1,200 | 5.000%, 5/01/36 – AGM Insured | 5/17 at 100.00 | Aaa | 1,215,576 | ||||||||||||||
| 1,370 | Oakridge Public Schools, Muskegon County, Michigan, General Obligation Bonds, Series 2005, 5.000%, 5/01/24 – NPFG Insured | 5/15 at 100.00 | AA– | 1,450,433 | ||||||||||||||
Okemos Public School District, Ingham County, Michigan, General Obligation Refunding Bonds, Series 1993: | ||||||||||||||||||
| 1,000 | 0.000%, 5/01/17 – NPFG Insured | No Opt. Call | Aa3 | 814,270 | ||||||||||||||
| 1,020 | 0.000%, 5/01/18 – NPFG Insured | No Opt. Call | Aa3 | 784,421 | ||||||||||||||
| 1,100 | Ottawa County, Michigan, General Obligation Bonds, Sewer Disposal System, Series 2010, 5.000%, 5/01/37 | 5/20 at 100.00 | Aaa | 1,150,270 | ||||||||||||||
| 4,000 | Ottawa County, Michigan, Water Supply System, General Obligation Bonds, Series 2007, 5.000%, 8/01/30 – NPFG Insured | 8/17 at 100.00 | Aaa | 4,127,080 | ||||||||||||||
| 1,075 | Parchment School District, Kalamazoo County, Michigan, General Obligation Bonds, Tender Option Bond Trust 2836, 11.026%, 5/01/15 – AGM Insured (IF) | No Opt. Call | AA+ | 977,143 | ||||||||||||||
| 150 | South Haven, Van Buren County,Michigan, General Obligation Bonds, Capital Improvement Series 2009, 5.125%, 12/01/33 – AGC Insured | 12/19 at 100.00 | AA+ | 157,317 | ||||||||||||||
| 500 | South Redford School District, Wayne County, Michigan, General Obligation Bonds, School Building and Site, Series 2005, 5.000%, 5/01/30 – NPFG Insured | 5/15 at 100.00 | Aa2 | 507,165 | ||||||||||||||
| 1,400 | South Redford School District, Wayne County, Michigan, General Obligation Bonds, Series 2004, 5.000%, 5/01/21 – FGIC Insured | 11/14 at 100.00 | Aa2 | 1,485,624 | ||||||||||||||
| 1,405 | Thornapple Kellogg School District, Barry County, Michigan, General Obligation Bonds, Series 2007, 5.000%, 5/01/32 – NPFG Insured | 5/17 at 100.00 | Aa2 | 1,424,684 | ||||||||||||||
| 1,530 | Trenton Public Schools District, Michigan, General Obligation Bonds, Series 2008, 5.000%, 5/01/34 – AGM Insured | 5/18 at 100.00 | AA+ | 1,551,818 | ||||||||||||||
| 1,350 | Van Dyke Public Schools, Macomb County, Michigan, General Obligation Bonds, School Building and Site, Series 2008, 5.000%, 5/01/38 – AGM Insured | 5/18 at 100.00 | AA+ | 1,362,123 | ||||||||||||||
| 1,500 | Wayland Union School District, Allegan County, Michigan, General Obligation Bonds, Series 2008, 5.000%, 5/01/28 – AGM Insured | 5/18 at 100.00 | AA+ | 1,550,850 | ||||||||||||||
| 990 | Wayne Charter County, Michigan, General Obligation Bonds, Building Improvements, Series 2009A, 6.750%, 11/01/39 | 12/19 at 100.00 | A– | 1,020,621 | ||||||||||||||
| 1,150 | Wayne Westland Community Schools, Michigan, General Obligation Bonds, Series 2004, 5.000%, 5/01/17 – AGM Insured | 11/14 at 100.00 | AA+ | 1,257,192 | ||||||||||||||
| 1,915 | West Bloomfield School District, Oakland County, Michigan, General Obligation Bonds, Series 2005, 5.000%, 5/01/20 – AGM Insured | 5/15 at 100.00 | AA+ | 2,055,561 | ||||||||||||||
| 3,270 | West Ottawa Public School District, Ottawa County, Michigan, General Obligation Refunding Bonds, Series 1992, 0.000%, 5/01/17 – FGIC Insured | No Opt. Call | Aa3 | 2,662,663 | ||||||||||||||
| 5,175 | Williamston Community School District, Michigan, Unlimited Tax General Obligation QSBLF Bonds, Series 1996, 5.500%, 5/01/25 – NPFG Insured | No Opt. Call | Aa3 | 6,041,191 | ||||||||||||||
| 3,170 | Zeeland Public Schools, Ottawa and Allegan Counties, Michigan, General Obligation Bonds, Series 2005, 5.000%, 5/01/22 – FGIC Insured | 5/15 at 100.00 | Aa3 | 3,405,246 | ||||||||||||||
| 76,788 | Total Tax Obligation/General | 77,859,262 | ||||||||||||||||
| 48 | Nuveen Investments |
| Principal Amount (000) | Description (1) | Optional Call Provisions (2) | Ratings (3) | Value | ||||||||||||||
Tax Obligation/Limited – 13.2% | ||||||||||||||||||
Grand Rapids Downtown Development Authority, Michigan, Tax Increment Revenue Bonds, Series 1994: | ||||||||||||||||||
| $ | 3,985 | 0.000%, 6/01/17 – NPFG Insured | No Opt. Call | BBB | $ | 2,889,324 | ||||||||||||
| 3,295 | 0.000%, 6/01/18 – NPFG Insured | No Opt. Call | BBB | 2,214,372 | ||||||||||||||
| 2,125 | Kalkaska County Hospital Authority, Michigan, Hospital Revenue Bonds, Series 2007, 5.125%, 5/01/14 | No Opt. Call | N/R | 2,214,144 | ||||||||||||||
| 1,230 | Michigan Municipal Bond Authority, AMBAC Insured Bonds, Series 2007B-A, 5.000%, 12/01/34 – AMBAC Insured | 6/17 at 100.00 | N/R | 1,034,615 | ||||||||||||||
| 4,770 | Michigan State Building Authority, Revenue Bonds, Facilities Program, Series 2001I, 5.000%, 10/15/24 | 10/11 at 100.00 | Aa3 | 4,821,706 | ||||||||||||||
| 4,400 | Michigan State Building Authority, Revenue Bonds, Facilities Program, Series 2005II, 5.000%, 10/15/30 – AMBAC Insured | 10/15 at 100.00 | Aa3 | 4,434,936 | ||||||||||||||
Michigan State Building Authority, Revenue Bonds, Refunding Series 2006IA: | ||||||||||||||||||
| 3,000 | 0.000%, 10/15/27 – AGM Insured | 10/16 at 58.27 | AA+ | 1,163,100 | ||||||||||||||
| 1,500 | 0.000%, 10/15/28 – AGM Insured | 10/16 at 55.35 | AA+ | 537,840 | ||||||||||||||
| 3,960 | 5.000%, 10/15/36 – FGIC Insured | 10/16 at 100.00 | Aa3 | 3,867,930 | ||||||||||||||
| 2,000 | Michigan State Building Authority, Revenue Refunding Bonds, Facilities Program, Series 2003II, 5.000%, 10/15/22 – NPFG Insured | 10/13 at 100.00 | Aa3 | 2,037,200 | ||||||||||||||
| 1,000 | Virgin Islands Public Finance Authority, Matching Fund Loan Notes Revenue Bonds, Series 2009B, 5.000%, 10/01/25 | 10/19 at 100.00 | BBB | 993,360 | ||||||||||||||
| 31,265 | Total Tax Obligation/Limited | 26,208,527 | ||||||||||||||||
Transportation – 0.0% | ||||||||||||||||||
| 25 | Kent County, Michigan, Airport Revenue Bonds, Gerald R. Ford International Airport, Series 2007, 5.000%, 1/01/32 | 1/17 at 100.00 | AAA | 25,333 | ||||||||||||||
U.S. Guaranteed – 10.2% (4) | ||||||||||||||||||
| 250 | Detroit City School District, Wayne County, Michigan, Unlimited Tax School Building and Site Improvement Bonds, Series 2001A, 5.125%, 5/01/31 (Pre-refunded 5/01/12) – AGM Insured | 5/12 at 100.00 | AA+ | (4) | 261,008 | |||||||||||||
| 1,000 | Detroit, Michigan, Senior Lien Sewerage Disposal System Revenue Bonds, Series 2001A, 5.125%, 7/01/31 (Pre-refunded 7/01/11) – FGIC Insured | 7/11 at 100.00 | A+ | (4) | 1,004,130 | |||||||||||||
| 2,505 | Detroit, Michigan, Senior Lien Water Supply System Revenue Bonds, Series 2003A, 5.000%, 7/01/25 (Pre-refunded 7/01/13) – NPFG Insured | 7/13 at 100.00 | A+ | (4) | 2,731,477 | |||||||||||||
| 2,000 | Kent Hospital Finance Authority, Michigan, Revenue Bonds, Spectrum Health, Series 2001A, 5.500%, 1/15/31 (Pre-refunded 7/15/11) | 7/11 at 101.00 | AA | (4) | 2,032,900 | |||||||||||||
| 6,000 | Michigan House of Representatives, Certificates of Participation, Series 1998, 0.000%, 8/15/23 – AMBAC Insured (ETM) | No Opt. Call | N/R | (4) | 3,741,480 | |||||||||||||
| 230 | Michigan State Building Authority, Revenue Bonds, Facilities Program, Series 2001I, 5.000%, 10/15/24 (Pre-refunded 10/15/11) | 10/11 at 100.00 | A+ | (4) | 233,991 | |||||||||||||
| 3,000 | Michigan State Hospital Finance Authority, Hospital Revenue Refunding Bonds, Henry Ford Health System, Series 2003A, 5.625%, 3/01/17 (Pre-refunded 3/01/13) | 3/13 at 100.00 | A1 | (4) | 3,268,920 | |||||||||||||
| 1,000 | Michigan State Hospital Finance Authority, Revenue Bonds, Chelsea Community Hospital, Series 2005, 5.000%, 5/15/37 (Pre-refunded 5/15/15) | 5/15 at 100.00 | AAA | 1,152,860 | ||||||||||||||
| 2,250 | Michigan, General Obligation Bonds, Environmental Protection Program, Series 2003A, 5.250%, 5/01/21 (Pre-refunded 5/01/13) | 5/13 at 100.00 | Aa2 | (4) | 2,453,693 | |||||||||||||
| 4,000 | Puerto Rico Electric Power Authority, Power Revenue Refunding Bonds, Series 1989O, 0.000%, 7/01/17 – NPFG Insured (ETM) | No Opt. Call | AAA | 3,293,160 | ||||||||||||||
| 22,235 | Total U.S. Guaranteed | 20,173,619 | ||||||||||||||||
Utilities – 5.2% | ||||||||||||||||||
| 1,000 | Lansing Board of Water and Light, Michigan, Steam and Electric Utility System Revenue Bonds, Series 2003A, 5.000%, 7/01/21 – AGM Insured | 7/13 at 100.00 | AA+ | 1,041,990 | ||||||||||||||
| Nuveen Investments | 49 |
Portfolio of Investments
Nuveen Michigan Municipal Bond Fund (continued)
May 31, 2011
| Principal Amount (000) | Description (1) | Optional Call Provisions (2) | Ratings (3) | Value | ||||||||||||||
Utilities (continued) | ||||||||||||||||||
Lansing Board of Water and Light, Michigan, Steam and Electric Utility System Revenue Bonds, Series 2008A: | ||||||||||||||||||
| $ | 175 | 5.000%, 7/01/28 | 7/18 at 100.00 | AA– | $ | 181,055 | ||||||||||||
| 2,130 | 5.000%, 7/01/32 | 7/18 at 100.00 | AA– | 2,164,826 | ||||||||||||||
| 800 | �� | Lansing Board of Water and Light, Michigan, Utility System Revenue Bonds, Tender Option Bond Trust 4700, 18.111%, 7/01/37 (WI/DD, Settling 6/16/11) (IF) | 7/21 at 100.00 | AA– | 792,928 | |||||||||||||
| 1,000 | Michigan Public Power Agency, Revenue Bonds, Combustion Turbine 1 Project, Series 2001A, 5.250%, 1/01/27 – AMBAC Insured | 1/12 at 100.00 | A2 | 1,004,430 | ||||||||||||||
| 600 | Michigan South Central Power Agency, Power Supply System Revenue Bonds, Series 2000, 6.000%, 5/01/12 | No Opt. Call | A3 | 619,188 | ||||||||||||||
| 3,300 | Michigan Strategic Fund, Collateralized Limited Obligation Pollution Control Revenue Refunding Bonds, Fixed Rate Conversion, Detroit Edison Company, Series 1999C, 5.650%, 9/01/29 – SYNCORA GTY Insured (Alternative Minimum Tax) | 9/11 at 100.00 | A | 3,302,937 | ||||||||||||||
| 1,000 | Monroe County Economic Development Corporation, Michigan, Collateralized Limited Obligation Revenue Refunding Bonds, Detroit Edison Company, Series 1992AA, 6.950%, 9/01/22 – FGIC Insured | No Opt. Call | A2 | 1,238,360 | ||||||||||||||
| 10,005 | Total Utilities | 10,345,714 | ||||||||||||||||
Water and Sewer – 12.8% | ||||||||||||||||||
| 2,495 | Detroit, Michigan, Senior Lien Water Supply System Revenue Bonds, Series 2003A, 5.000%, 7/01/25 – NPFG Insured | 7/13 at 100.00 | A+ | 2,435,769 | ||||||||||||||
| 4,455 | Detroit, Michigan, Sewerage Disposal System Revenue Bonds, Series 1999A, 0.000%, 7/01/19 – FGIC Insured | No Opt. Call | A+ | 2,995,765 | ||||||||||||||
| 4,000 | Grand Rapids, Michigan, Sanitary Sewer System Revenue Bonds, Series 2005, 5.000%, 1/01/30 – NPFG Insured | 7/15 at 100.00 | AA+ | 4,087,920 | ||||||||||||||
Grand Rapids, Michigan, Sanitary Sewer System Revenue Bonds, Series 2008: | ||||||||||||||||||
| 145 | 5.000%, 1/01/28 | 1/18 at 100.00 | AA+ | 151,310 | ||||||||||||||
| 3,500 | 5.000%, 1/01/38 | 1/18 at 100.00 | AA+ | 3,545,885 | ||||||||||||||
| 2,000 | Grand Rapids, Michigan, Water Supply System Revenue Bonds, Series 2009, 5.100%, 1/01/39 – AGC Insured | 1/19 at 100.00 | AA+ | 2,058,820 | ||||||||||||||
| 1,625 | Lansing, Michigan, Sewerage Disposal System Revenue Bonds, Series 2003, 5.000%, 5/01/21 – FGIC Insured | 5/14 at 100.00 | Aa2 | 1,674,774 | ||||||||||||||
| 2,075 | Michigan Municipal Bond Authority, Clean Water Revolving Fund Revenue Bonds, Series 2005, 5.000%, 10/01/19 | 10/15 at 100.00 | AAA | 2,336,512 | ||||||||||||||
| 4,055 | Michigan Municipal Bond Authority, Drinking Water Revolving Fund Revenue Bonds, Series 2004, 5.000%, 10/01/24 | 10/14 at 100.00 | AAA | 4,353,083 | ||||||||||||||
| 1,000 | Michigan Municipal Bond Authority, Water Revolving Fund Revenue Bonds, Series 2007, 5.000%, 10/01/23 | 10/17 at 100.00 | AAA | 1,105,250 | ||||||||||||||
| 500 | Saginaw, Michigan, Water Supply System Revenue Bonds, Series 2008, 5.250%, 7/01/22 – NPFG Insured | 7/18 at 100.00 | A | 520,665 | ||||||||||||||
| 25,850 | Total Water and Sewer | 25,265,753 | ||||||||||||||||
| $ | 205,258 | Total Investments (cost $190,541,543) – 99.6% | 197,274,635 | |||||||||||||||
Other Assets Less Liabilities – 0.4% | 787,070 | |||||||||||||||||
Net Assets – 100% | $ | 198,061,705 | ||||||||||||||||
| 50 | Nuveen Investments |
| (1) | All percentages shown in the Portfolio of Investments are based on net assets. |
| (2) | Optional Call Provisions (not covered by the report of independent registered public accounting firm): Dates (month and year) and prices of the earliest optional call or redemption. There may be other call provisions at varying prices at later dates. Certain mortgage-backed securities may be subject to periodic principal paydowns. |
| (3) | Ratings (not covered by the report of independent registered public accounting firm): Using the highest of Standard & Poor’s Group (“Standard & Poor’s”), Moody’s Investor Service, Inc. (“Moody’s”) or Fitch, Inc. (“Fitch”) rating. Ratings below BBB by Standard & Poor’s, Baa by Moody’s or BBB by Fitch are considered to be below investment grade. Holdings designated N/R are not rated by any of these national rating agencies. |
| (4) | Backed by an escrow or trust containing sufficient U.S. Government or U.S. Government agency securities, which ensure the timely payment of principal and interest. Such investments are normally considered to be equivalent to AAA rated securities. |
| N/R | Not rated. |
| WI/DD | Purchased on a when-issued or delayed delivery basis. |
| (ETM) | Escrowed to maturity. |
| (IF) | Inverse floating rate investment. |
See accompanying notes to financial statements.
| Nuveen Investments | 51 |
Portfolio of Investments
Nuveen Missouri Municipal Bond Fund
May 31, 2011
| Principal Amount (000) | Description (1) | Optional Call Provisions (2) | Ratings (3) | Value | ||||||||||||||
Consumer Staples – 5.2% | ||||||||||||||||||
| $ | 3,000 | Cape Girardeau County Industrial Development Authority, Missouri, Solid Waste Disposal Revenue Bonds, Procter & Gamble Products Company Project, Series 1998, 5.300%, 5/15/28 (Alternative Minimum Tax) | 11/11 at 100.00 | AA– | $ | 3,000,870 | ||||||||||||
| 8,555 | Missouri Development Finance Board, Solid Waste Disposal Revenue Bonds, Procter and Gamble Inc., Series 1999, 5.200%, 3/15/29 (Alternative Minimum Tax) | No Opt. Call | AA– | 8,872,219 | ||||||||||||||
| 11,555 | Total Consumer Staples | 11,873,089 | ||||||||||||||||
Education and Civic Organizations – 4.4% | ||||||||||||||||||
| 1,500 | Missouri Health and Educational Facilities Authority, Revenue Bonds, Rockhurst University, Series 1999, 6.000%, 10/01/25 | 10/18 at 103.00 | BBB | 1,534,635 | ||||||||||||||
| 1,500 | Missouri Health and Educational Facilities Authority, Revenue Bonds, Rockhurst University, Series 2011A, 6.500%, 10/01/30 | 10/18 at 103.00 | BBB | 1,552,305 | ||||||||||||||
| 900 | Missouri Health and Educational Facilities Authority, Revenue Bonds, Stephens College, Series 1999, 6.000%, 6/01/24 | 12/11 at 100.00 | A1 | 901,161 | ||||||||||||||
| 1,000 | Missouri Health and Educational Facilities Authority, Revenue Bonds, Washington University, Series 2001A, 5.500%, 6/15/16 | No Opt. Call | AAA | 1,201,010 | ||||||||||||||
| 1,360 | Missouri Health and Educational Facilities Authority, Revenue Bonds, Webster University, Series 2001, 5.500%, 4/01/18 – NPFG Insured | 10/11 at 100.00 | A3 | 1,362,693 | ||||||||||||||
| 2,590 | Missouri State University, Auxiliary Enterprise System Revenue Bonds, Series 2007A, 5.000%, 4/01/24 – SYNCORA GTY Insured | 4/17 at 100.00 | A+ | 2,753,610 | ||||||||||||||
| 1,000 | Saint Louis Industrial Development Authority, Missouri, Confluence Academy Project, Series 2007A, 5.350%, 6/15/32 | 6/15 at 103.00 | N/R | 779,460 | ||||||||||||||
| 9,850 | Total Education and Civic Organizations | 10,084,874 | ||||||||||||||||
Energy – 0.6% | ||||||||||||||||||
| 500 | Virgin Islands Public Finance Authority, Senior Secured Lien Revenue Bonds, Refinery Project – Hovensa LLC, Series 2004, 5.875%, 7/01/22 | 7/14 at 100.00 | Baa3 | 464,180 | ||||||||||||||
| 1,000 | Virgin Islands, Senior Secured Revenue Bonds, Government Refinery Facilities – Hovensa LLC Coker, Series 2002, 6.500%, 7/01/21 (Alternative Minimum Tax) | 1/13 at 100.00 | Baa3 | 983,930 | ||||||||||||||
| 1,500 | Total Energy | 1,448,110 | ||||||||||||||||
Health Care – 23.6% | ||||||||||||||||||
| 2,150 | Cape Girardeau County Industrial Development Authority, Missouri, Health Facilities Revenue Bonds, Saint Francis Medical Center, Series 2009A, 5.750%, 6/01/39 | 6/19 at 100.00 | A+ | 2,187,195 | ||||||||||||||
Cape Girardeau County Industrial Development Authority, Missouri, Health Facilities Revenue Bonds, Southeast Missouri Hospital Association, Series 2007: | ||||||||||||||||||
| 1,490 | 5.000%, 6/01/27 | 6/17 at 100.00 | BBB+ | 1,355,230 | ||||||||||||||
| 2,500 | 5.000%, 6/01/36 | 6/17 at 100.00 | BBB+ | 2,124,075 | ||||||||||||||
| 5,520 | Cass County, Missouri, Hospital Revenue Bonds, Series 2007, 5.625%, 5/01/38 | 11/16 at 100.00 | BBB- | 4,735,553 | ||||||||||||||
Clinton County Industrial Development Authority, Missouri, Revenue Bonds, Cameron Regional Medical Center, Series 2007: | ||||||||||||||||||
| 1,250 | 5.000%, 12/01/32 | 12/17 at 100.00 | N/R | 889,900 | ||||||||||||||
| 3,995 | 5.000%, 12/01/37 | 12/17 at 100.00 | N/R | 2,677,888 | ||||||||||||||
| 1,250 | Joplin Industrial Development Authority, Missouri, Health Facilities Revenue Bonds, Freeman Health System, Series 2004, 5.500%, 2/15/29 | 2/15 at 102.00 | BBB+ | 1,202,038 | ||||||||||||||
| 1,000 | Missouri Health & Educational Facilities Authority, St. Luke’s Episcopal- Presbyterian Hospitals Revenue Bonds, Series 2001, 5.250%, 12/01/26 – AGM Insured | 12/11 at 101.00 | AA+ | 1,003,710 | ||||||||||||||
Missouri Health and Educational Facilities Authority, Health Facility Revenue Bonds, St. Lukes’s Health System, Series 2010A: | ||||||||||||||||||
| 2,000 | 5.000%, 11/15/30 | 11/20 at 100.00 | A+ | 2,013,440 | ||||||||||||||
| 1,000 | 5.000%, 11/15/40 | 11/20 at 100.00 | A+ | 975,880 | ||||||||||||||
| 52 | Nuveen Investments |
| Principal Amount (000) | Description (1) | Optional Call Provisions (2) | Ratings (3) | Value | ||||||||||||||
Health Care (continued) | ||||||||||||||||||
| $ | 1,000 | Missouri Health and Educational Facilities Authority, Revenue Bonds, BJC Health System, Series 2003, 5.125%, 5/15/25 | 5/13 at 100.00 | AA | $ | 1,015,290 | ||||||||||||
| 1,000 | Missouri Health and Educational Facilities Authority, Revenue Bonds, BJC Health System, Series 2005A, 5.000%, 5/15/22 | 5/15 at 100.00 | AA | 1,046,770 | ||||||||||||||
| 500 | Missouri Health and Educational Facilities Authority, Revenue Bonds, Capital Region Medical Center, Series 1998, 5.250%, 11/01/23 | 11/11 at 100.00 | A3 | 496,735 | ||||||||||||||
Missouri Health and Educational Facilities Authority, Revenue Bonds, Freeman Health System, Series 1998: | ||||||||||||||||||
| 900 | 5.250%, 2/15/18 | 8/11 at 100.00 | BBB+ | 900,612 | ||||||||||||||
| 1,300 | 5.250%, 2/15/28 | 8/11 at 100.00 | BBB+ | 1,224,041 | ||||||||||||||
| 2,750 | Missouri Health and Educational Facilities Authority, Revenue Bonds, Lake Regional Health System, Series 2003, 5.700%, 2/15/34 | 2/14 at 100.00 | BBB+ | 2,766,830 | ||||||||||||||
Missouri Health and Educational Facilities Authority, Revenue Bonds, Lester E. Cox Medical Center, Series 1992H: | ||||||||||||||||||
| 1,650 | 0.000%, 9/01/17 – NPFG Insured | No Opt. Call | A2 | 1,289,228 | ||||||||||||||
| 2,955 | 0.000%, 9/01/21 – NPFG Insured | No Opt. Call | A2 | 1,794,276 | ||||||||||||||
| 3,915 | 0.000%, 9/01/22 – NPFG Insured | No Opt. Call | A2 | 2,222,389 | ||||||||||||||
| 3,000 | Missouri Health and Educational Facilities Authority, Revenue Bonds, SSM Health Care System, Series 2010B, 5.000%, 6/01/34 | 6/20 at 100.00 | AA– | 3,023,790 | ||||||||||||||
| 7,140 | Missouri Health and Educational Facilities Authority, Revenue Refunding Bonds, CoxhHealth Systems Inc., , Series 2008A, 5.500%, 11/15/39 | 11/18 at 100.00 | A2 | 7,187,481 | ||||||||||||||
| 1,000 | New Liberty Hospital District, Missouri, Revenue Bonds, Series 2001, 5.000%, 12/01/21 – AMBAC Insured | 12/11 at 100.00 | A+ | 1,004,380 | ||||||||||||||
| 1,000 | North Carolina Medical Care Commission, Healthcare Facilities Revenue Bonds, Duke University Health System, Series 2009A, 5.000%, 6/01/39 | 6/19 at 100.00 | AA | 1,005,240 | ||||||||||||||
| 3,780 | Saline County Industrial Development Authority, Missouri, Health Facilities Revenue Bonds, John Fitzgibbon Memorial Hospital Inc., Series 2010, 5.600%, 12/01/28 | 12/20 at 100.00 | BBB- | 3,590,093 | ||||||||||||||
St. Louis County Industrial Development Authority, Missouri, Healthcare Facilities Revenue Bonds, Ranken-Jordan Project, Refunding Series 2007: | ||||||||||||||||||
| 1,320 | 5.000%, 11/15/22 | 11/16 at 100.00 | N/R | 1,170,536 | ||||||||||||||
| 1,675 | 5.000%, 11/15/27 | 11/16 at 100.00 | N/R | 1,379,681 | ||||||||||||||
| 1,300 | 5.000%, 11/15/35 | 11/16 at 100.00 | N/R | 990,158 | ||||||||||||||
| 2,880 | Taney County Industrial Development Authority, Missouri, Hospital Revenue Bonds, Skaggs Community Hospital Association, Series 1998, 5.400%, 5/15/28 | 11/11 at 100.00 | BB | 2,272,320 | ||||||||||||||
| 61,220 | Total Health Care | 53,544,759 | ||||||||||||||||
Housing/Multifamily – 2.7% | ||||||||||||||||||
| 1,205 | Clay County Industrial Development Authority, Missouri, GNMA Multifamily Housing Revenue Bonds, Oak Creek Apartments, Series 2002, 6.125%, 7/20/25 (Alternative Minimum Tax) | 7/13 at 105.00 | N/R | 1,256,803 | ||||||||||||||
| 1,870 | Jefferson County Industrial Development Authority, Missouri, Multifamily Housing Revenue Bonds, Lakewood Apartments Project, Series 2001B, 5.750%, 11/01/34 (Mandatory put 11/01/16) (Alternative Minimum Tax) | 12/11 at 100.00 | N/R | 1,871,272 | ||||||||||||||
Missouri Housing Development Commission, GNMA Collateralized Multifamily Housing Revenue Bonds, JB Hughes Apartments I and II, Series 2002G: | ||||||||||||||||||
| 182 | 6.200%, 5/20/19 | 5/12 at 105.00 | Aaa | 199,439 | ||||||||||||||
| 975 | 6.300%, 5/20/37 | 5/12 at 105.00 | Aaa | 994,559 | ||||||||||||||
| 1,965 | Missouri Housing Development Commission, Multifamily Housing Revenue Bonds, Mansion Apartments II, Series 1999, 6.125%, 4/01/22 (Alternative Minimum Tax) | 10/11 at 100.00 | N/R | 1,783,002 | ||||||||||||||
| 6,197 | Total Housing/Multifamily | 6,105,075 | ||||||||||||||||
| Nuveen Investments | 53 |
Portfolio of Investments
Nuveen Missouri Municipal Bond Fund (continued)
May 31, 2011
| Principal Amount (000) | Description (1) | Optional Call Provisions (2) | Ratings (3) | Value | ||||||||||||||
Housing/Single Family – 1.5% | ||||||||||||||||||
| $ | 130 | Missouri Housing Development Commission, Single Family Mortgage Revenue Bonds, Homeownership Loan Program, Series 2000A-1, 6.300%, 9/01/25 (Alternative Minimum Tax) | 9/11 at 100.00 | AAA | $ | 132,649 | ||||||||||||
| 100 | Missouri Housing Development Commission, Single Family Mortgage Revenue Bonds, Homeownership Loan Program, Series 2000B-1, 6.200%, 9/01/25 (Alternative Minimum Tax) | 9/11 at 100.00 | AAA | 105,736 | ||||||||||||||
| 920 | Missouri Housing Development Commission, Single Family Mortgage Revenue Bonds, Homeownership Loan Program, Series 2005A-1, 5.900%, 9/01/35 (Alternative Minimum Tax) | 9/14 at 100.00 | AAA | 935,484 | ||||||||||||||
| 865 | Missouri Housing Development Commission, Single Family Mortgage Revenue Bonds, Homeownership Loan Program, Series 2007A-1, 4.700%, 9/01/27 (Alternative Minimum Tax) | 9/16 at 100.00 | AAA | 834,431 | ||||||||||||||
| 1,490 | Missouri Housing Development Commission, Single Family Mortgage Revenue Bonds, Homeownership Loan Program, Series 2007E-1, 5.200%, 9/01/38 (Alternative Minimum Tax) | No Opt. Call | AAA | 1,460,096 | ||||||||||||||
| 3,505 | Total Housing/Single Family | 3,468,396 | ||||||||||||||||
Long-Term Care – 7.2% | ||||||||||||||||||
| 2,250 | Cole County Industrial Development Authority, Missouri, Revenue Bonds, Lutheran Senior Services – Heisinger Project, Series 2004, 5.500%, 2/01/35 | 2/14 at 100.00 | A- | 2,053,035 | ||||||||||||||
| 1,500 | Joplin Industrial Development Authority, Missouri, Revenue Bonds, Christian Homes Inc., Series 2007F, 5.750%, 5/15/31 | 5/17 at 100.00 | BBB- | 1,345,875 | ||||||||||||||
| 4,250 | Kansas City Industrial Development Authority, Missouri, Retirement Center Revenue Refunding and Improvement Bonds, Kingswood Project, Series 1998A, 5.875%, 11/15/29 | 11/11 at 100.00 | N/R | 3,385,975 | ||||||||||||||
Lees Summit Industrial Development Authority, Missouri, Revenue Bonds, John Knox Village Obligated Group, Series 2007A: | ||||||||||||||||||
| 1,500 | 5.125%, 8/15/26 | 8/17 at 100.00 | BBB- | 1,381,395 | ||||||||||||||
| 2,525 | 5.125%, 8/15/32 | 8/17 at 100.00 | BBB- | 2,201,522 | ||||||||||||||
| 1,285 | Missouri Development Finance Board, Healthcare Facilities Revenue Bonds, Lutheran Home for the Aged, Series 2001A, 5.600%, 11/01/21 | 11/11 at 100.00 | Aa2 | 1,291,721 | ||||||||||||||
| 2,000 | Missouri Health and Educational Facilities Authority, Revenue Bonds, Lutheran Senior Services, Series 2007A, 4.875%, 2/01/37 | 2/17 at 100.00 | A- | 1,646,100 | ||||||||||||||
| 1,200 | St. Louis County Industrial Development Authority, Missouri, GNMA Collateralized Healthcare Facilities Revenue Bonds, Mary, Queen and Mother Association, Series 2001, 5.400%, 9/20/34 | 9/11 at 101.00 | AA+ | 1,201,860 | ||||||||||||||
| 2,000 | St. Louis County Industrial Development Authority, Missouri, Revenue Bonds, Friendship Village of West County, Series 2007A, 5.500%, 9/01/28 | 9/17 at 100.00 | BBB | 1,827,040 | ||||||||||||||
| 18,510 | Total Long-Term Care | 16,334,523 | ||||||||||||||||
Materials – 0.5% | ||||||||||||||||||
| 1,000 | Sugar Creek, Missouri, Industrial Development Revenue Bonds, Lafarge North America Inc., Series 2003A, 5.650%, 6/01/37 (Alternative Minimum Tax) | 6/13 at 101.00 | Baa3 | 872,080 | ||||||||||||||
Tax Obligation/General – 10.9% | ||||||||||||||||||
Belton, Missouri, General Obligation Bonds, Refunding & Improvement Series 2011: | ||||||||||||||||||
| 1,120 | 5.000%, 3/01/29 | 3/21 at 100.00 | A+ | 1,179,550 | ||||||||||||||
| 565 | 5.000%, 3/01/30 | 3/21 at 100.00 | A+ | 590,465 | ||||||||||||||
| 2,000 | Cass County Reorganized School District R-II, Raymore and Peculiar, Missouri, General Obligation Bonds, Series 2002, 5.250%, 3/01/20 – AGM Insured | 3/12 at 100.00 | AA+ | 2,063,760 | ||||||||||||||
| 540 | Clay County Public School District 53, Liberty, Missouri, General Obligation Bonds, Series 2001C, 5.200%, 3/01/21 | 3/12 at 100.00 | AA+ | 555,952 | ||||||||||||||
| 1,280 | Clay County Public School District 53, Liberty, Missouri, General Obligation Bonds, Series 2002B, 5.000%, 3/01/22 – AGM Insured | 3/12 at 100.00 | AA+ | 1,310,682 | ||||||||||||||
| 1,315 | Independence School District, Jackson County, Missouri, General Obligation Bonds, Series 2010, 5.000%, 3/01/27 | 3/20 at 100.00 | AA+ | 1,444,291 | ||||||||||||||
| 54 | Nuveen Investments |
| Principal Amount (000) | Description (1) | Optional Call Provisions (2) | Ratings (3) | Value | ||||||||||||||
Tax Obligation/General (continued) | ||||||||||||||||||
| $ | 2,000 | Miller County School District R-2, Osage, Missouri, General Obligation Bonds, Series 2006, 5.000%, 3/01/24 – AGM Insured | 3/16 at 100.00 | AA+ | $ | 2,118,280 | ||||||||||||
Missouri School Boards Association, Lease Participation Certificates, Clay County School District 53 Liberty, Series 2007: | ||||||||||||||||||
| 1,070 | 5.250%, 3/01/26 – AGM Insured | 3/17 at 100.00 | AA+ | 1,139,443 | ||||||||||||||
| 625 | 5.250%, 3/01/27 – AGM Insured | 3/17 at 100.00 | AA+ | 661,938 | ||||||||||||||
| 1,250 | Nixa Reorganized School District R 02, Missouri, General Obligation Bonds, Series 2006, 5.250%, 3/01/24 – AGM Insured | 3/16 at 100.00 | AA+ | 1,358,463 | ||||||||||||||
| 1,240 | North Kansas City School District 74, Clay County, Missouri, General Obligation Bonds, Direct Deposit Program, Series 2007, 5.000%, 3/01/27 | 3/18 at 100.00 | AA+ | 1,337,365 | ||||||||||||||
| 4,500 | North Kansas City School District 74, Clay County, Missouri, General Obligation Bonds, Series 2005, 5.000%, 3/01/25 | 3/15 at 100.00 | AA+ | 4,741,830 | ||||||||||||||
Springfield School District R12, Missouri, General Obligation Bonds, Series 2003: | ||||||||||||||||||
| 1,225 | 5.125%, 3/01/20 – FGIC Insured | 3/13 at 100.00 | AA+ | 1,300,117 | ||||||||||||||
| 2,000 | 5.000%, 3/01/22 – FGIC Insured | 3/13 at 100.00 | AA+ | 2,111,140 | ||||||||||||||
| 1,250 | 5.000%, 3/01/23 – FGIC Insured | 3/13 at 100.00 | AA+ | 1,290,250 | ||||||||||||||
| 1,345 | St. Louis County Pattonville School District R3, Missouri, General Obligation Bonds, Series 2000, 6.500%, 3/01/14 – FGIC Insured | No Opt. Call | AA | 1,548,552 | ||||||||||||||
| 23,325 | Total Tax Obligation/General | 24,752,078 | ||||||||||||||||
Tax Obligation/Limited – 20.8% | ||||||||||||||||||
| 1,290 | Cape Girardeau County Building Corporation, Missouri, Leasehold Revenue Bonds, Reorganized School District R-02, Jackson R-II School District High School Project, Series 2005, 5.250%, 3/01/21 – NPFG Insured | 3/16 at 100.00 | A | 1,384,364 | ||||||||||||||
| 420 | Cottleville, Missouri, Certificates of Participation, Series 2006, 5.250%, 8/01/31 | 8/14 at 100.00 | N/R | 377,063 | ||||||||||||||
| 1,035 | Dunklin County, Missouri, Certificates of Participation, Series 2004, 5.000%, 12/01/19 – FGIC Insured | 12/14 at 100.00 | BBB | 1,074,692 | ||||||||||||||
| 790 | Fenton, Missouri, Tax Increment Revenue Bonds, Gravois Bluffs Redevelopment Project, Series 2006, 4.500%, 4/01/21 | 4/14 at 100.00 | BBB+ | 796,439 | ||||||||||||||
| 1,685 | Fulton, Missouri, Tax Increment Revenue Bonds, Fulton Commons Redevelopment Project, Series 2006, 5.000%, 6/01/28 | 6/16 at 100.00 | N/R | 1,316,524 | ||||||||||||||
| 3,000 | Harrisonville, Missouri, Lease Participation Certificates, Series 2003, 5.000%, 12/01/22 – SYNCORA GTY Insured | 12/13 at 100.00 | A+ | 3,072,990 | ||||||||||||||
| 2,525 | Kansas City Tax Increment Financing Commission, Missouri, Tax Increment Revenue Bonds, Briarcliff West Project, Series 2006A, 5.400%, 6/01/24 | 6/14 at 102.00 | N/R | 2,132,211 | ||||||||||||||
| 500 | Kansas City Tax Increment Financing Commission, Missouri, Tax Increment Revenue Bonds, Maincor Project, Series 2007A, 5.250%, 3/01/18 | No Opt. Call | N/R | 482,340 | ||||||||||||||
| 500 | Kansas City, Missouri, Industrial Development Authority, Downtown Redevelpment District Revenue Bonds, Series 2011A, 5.000%, 9/01/32 (WI/DD, Settling 6/01/11) | 9/21 at 100.00 | AA– | 486,875 | ||||||||||||||
| 2,000 | Lakeside 370 Levee District, Saint Charles, Missouri, Levee District Improvement Bonds, Series 2008, 7.000%, 4/01/28 | 4/16 at 100.00 | N/R | 1,842,380 | ||||||||||||||
| 3,885 | Missouri Association of Rural Education, Pulaski County, Certificates of Participation, Waynesville School District R-6, Series 2004, 5.100%, 3/01/24 – NPFG Insured | 3/14 at 100.00 | Baa1 | 3,885,427 | ||||||||||||||
| 4,920 | Missouri Development Finance Board, Infrastructure Facilities Revenue Bonds, Branson Landing Project, Series 2005A, 5.000%, 6/01/35 | 6/15 at 100.00 | A | 4,606,793 | ||||||||||||||
| 2,335 | Missouri Development Finance Board, Infrastructure Facilities Revenue Bonds, City of Independence, Crackerneck Creek Project, Series 2006C, 5.000%, 3/01/28 | 3/16 at 100.00 | A– | 2,311,323 | ||||||||||||||
| 450 | Monarch-Chesterfield Levee District, St. Louis County, Missouri, Levee District Improvement Bonds, Series 1999, 5.750%, 3/01/19 – NPFG Insured | 9/11 at 100.00 | Baa1 | 451,548 | ||||||||||||||
| 2,500 | Osage Beach, Missouri, Tax Increment Revenue Bonds, Prewitts Point Transportation Development District, Series 2006, 5.000%, 5/01/23 | 5/12 at 102.00 | N/R | 2,056,050 | ||||||||||||||
| Nuveen Investments | 55 |
Portfolio of Investments
Nuveen Missouri Municipal Bond Fund (continued)
May 31, 2011
| Principal Amount (000) | Description (1) | Optional Call Provisions (2) | Ratings (3) | Value | ||||||||||||||
Tax Obligation/Limited (continued) | ||||||||||||||||||
| $ | 1,000 | Pevely, Missouri, General Obligation Bonds, Series 2004, 5.250%, 3/01/24 – RAAI Insured | 3/13 at 100.00 | N/R | $ | 1,016,930 | ||||||||||||
| 3,000 | Puerto Rico Public Buildings Authority, Guaranteed Government Facilities Revenue Bonds, Series 1993L, 5.500%, 7/01/21 | No Opt. Call | A3 | 3,098,310 | ||||||||||||||
| 1,930 | Puerto Rico Sales Tax Financing Corporation, Sales Tax Revenue Bonds, First Subordinate Series 2009A, 6.000%, 8/01/42 | 8/19 at 100.00 | A+ | 1,982,419 | ||||||||||||||
| 1,170 | Riverside, Missouri, L-385 Levee Redevelopment Plan Tax Increment Revenue Bonds, Series 2004, 5.250%, 5/01/20 | 5/15 at 100.00 | A | 1,201,988 | ||||||||||||||
| 1,945 | Springfield Center City Development Corporation, Missouri, Lease Revenue Bonds, Jordan Valley Park Exposition Center, Series 2002A, 5.000%, 6/01/27 – AMBAC Insured | 6/12 at 100.00 | Aa3 | 1,957,895 | ||||||||||||||
| 2,950 | Springfield Public Building Corporation, Missouri, Lease Revenue Bonds, Jordan Valley Park Projects, Series 2000A, 6.125%, 6/01/21 – AMBAC Insured | 12/11 at 100.00 | N/R | 2,954,130 | ||||||||||||||
| 2,500 | Springfield Public Building Corporation, Missouri, Lease Revenue Bonds, Series 2004, 5.000%, 3/01/24 – AMBAC Insured | 3/14 at 100.00 | Aa2 | 2,667,200 | ||||||||||||||
St. Joseph Industrial Development Authority, Missouri, Tax Increment Bonds, Shoppes at North Village Project, Series 2005A: | ||||||||||||||||||
| 660 | 5.375%, 11/01/24 | 11/14 at 100.00 | N/R | 587,638 | ||||||||||||||
| 1,600 | 5.500%, 11/01/27 | 11/14 at 100.00 | N/R | 1,396,064 | ||||||||||||||
| 1,800 | St. Joseph Industrial Development Authority, Missouri, Tax Increment Bonds, Shoppes at North Village Project, Series 2005B, 5.500%, 11/01/27 | 11/14 at 100.00 | N/R | 1,546,686 | ||||||||||||||
| 3,225 | St. Louis Industrial Development Authority, Missouri, Senior Lien Revenue Bonds, St. Louis Convention Center Headquarters Hotel, Series 2000A, 0.000%, 7/15/15 – AMBAC Insured | No Opt. Call | A | 2,512,404 | ||||||||||||||
| 49,615 | �� | Total Tax Obligation/Limited | 47,198,683 | |||||||||||||||
Transportation – 6.7% | ||||||||||||||||||
| 2,000 | Kansas City, Missouri, Passenger Facility Charge Revenue Bonds, Kansas City International Airport, Series 2001, 5.000%, 4/01/23 – AMBAC Insured (Alternative Minimum Tax) | 10/11 at 101.00 | A | 2,011,440 | ||||||||||||||
St. Louis Land Clearance Redevelopment Authority, Missouri, Revenue Refunding and Improvement Bonds, LCRA Parking Facilities, Series 1999C: | ||||||||||||||||||
| 1,000 | 7.000%, 9/01/19 | 9/11 at 100.00 | N/R | 999,720 | ||||||||||||||
| 2,400 | 7.050%, 9/01/24 | 9/11 at 100.00 | N/R | 2,211,336 | ||||||||||||||
| 3,000 | St. Louis, Missouri, Airport Revenue Bonds, Lambert-St. Louis International Airport, Series 2005, 5.500%, 7/01/18 – NPFG Insured | No Opt. Call | A– | 3,318,120 | ||||||||||||||
| 2,000 | St. Louis, Missouri, Airport Revenue Bonds, Lambert-St. Louis International Airport, Series 2007A, 5.000%, 7/01/21 – AGM Insured | 7/17 at 100.00 | AA+ | 2,077,960 | ||||||||||||||
St. Louis, Missouri, Airport Revenue Refunding Bonds, Series 2003A: | ||||||||||||||||||
| 3,450 | 5.250%, 7/01/16 – AGM Insured | 7/13 at 100.00 | AA+ | 3,631,298 | ||||||||||||||
| 1,000 | 5.250%, 7/01/18 – AGM Insured | 7/13 at 100.00 | AA+ | 1,037,590 | ||||||||||||||
| 14,850 | Total Transportation | 15,287,464 | ||||||||||||||||
U.S. Guaranteed – 7.1% (4) | ||||||||||||||||||
| 4,500 | Cape Girardeau County, Missouri, Single Family Mortgage Revenue Bonds, Series 1983, 0.000%, 12/01/14 (ETM) (5) | No Opt. Call | Aaa | 4,290,165 | ||||||||||||||
| 2,710 | Columbia, Missouri, Water and Electric Revenue Bonds, Series 2002A, 5.000%, 10/01/26 (Pre-refunded 10/01/12) – AMBAC Insured | 10/12 at 100.00 | AA– | (4) | 2,876,909 | |||||||||||||
| 1,025 | Excelsior Springs School District, Missouri, Leasehold Revenue Bonds, Series 1994, 0.000%, 3/01/14 – AGM Insured (ETM) | No Opt. Call | AA+ | (4) | 993,748 | |||||||||||||
| 2,500 | Fenton, Missouri, Tax Increment Refunding and Improvement Revenue Bonds, Gravois Bluffs Redevelopment Project, Series 2002, 6.125%, 10/01/21 (Pre-refunded 10/01/12) | 10/12 at 100.00 | AAA | 2,678,775 | ||||||||||||||
| 56 | Nuveen Investments |
| Principal Amount (000) | Description (1) | Optional Call Provisions (2) | Ratings (3) | Value | ||||||||||||||
U.S. Guaranteed (4) (continued) | ||||||||||||||||||
| $ | 1,500 | Lees Summit Industrial Development Authority, Missouri, Health Facilities Revenue Bonds, John Knox Village, Series 2002, 5.700%, 8/15/22 (Pre-refunded 8/15/12) | 8/12 at 101.00 | AAA | $ | 1,606,080 | ||||||||||||
Missouri Health and Educational Facilities Authority, Revenue Bonds, Lester E. Cox Medical Center, Series 1992H: | ||||||||||||||||||
| 1,000 | 0.000%, 9/01/17 – NPFG Insured (ETM) | No Opt. Call | A2 | (4) | 851,750 | |||||||||||||
| 1,785 | 0.000%, 9/01/21 – NPFG Insured (ETM) | No Opt. Call | BBB | (4) | 1,241,128 | |||||||||||||
| 2,385 | 0.000%, 9/01/22 – NPFG Insured (ETM) | No Opt. Call | A2 | (4) | 1,570,761 | |||||||||||||
| 17,405 | Total U.S. Guaranteed | 16,109,316 | ||||||||||||||||
Utilities – 5.3% | ||||||||||||||||||
| 3,000 | Missouri Environmental Improvement and Energy Resources Authority, Revenue Bonds, Kansas City Power & Light Company Project, Series 2008, 4.900%, 5/01/38 (Mandatory put 7/01/13) | No Opt. Call | BBB | 3,144,450 | ||||||||||||||
| 1,000 | Missouri Joint Municipal Electric Utility Commission, Prairie State Power Project Revenue Bonds, Series 2007A, 5.000%, 1/01/42 – AMBAC Insured | 1/17 at 100.00 | A3 | 965,790 | ||||||||||||||
| 1,195 | Nixa, Missouri, Electric System Revenue Bonds, Series 2005, 5.000%, 4/01/25 – SYNCORA GTY Insured | 4/13 at 100.00 | N/R | 1,190,782 | ||||||||||||||
| 2,000 | Puerto Rico Electric Power Authority, Power Revenue Bonds, Series 2003NN, 5.250%, 7/01/23 – NPFG Insured | No Opt. Call | A3 | 2,092,920 | ||||||||||||||
| 1,560 | Puerto Rico Electric Power Authority, Power Revenue Bonds, Series 2010XX, 5.250%, 7/01/40 | 7/20 at 100.00 | A3 | 1,475,573 | ||||||||||||||
| 3,030 | Sikeston, Missouri, Electric System Revenue Refunding Bonds, Series 1996, 6.000%, 6/01/14 – NPFG Insured | No Opt. Call | Baa1 | 3,237,978 | ||||||||||||||
| 11,785 | Total Utilities | 12,107,493 | ||||||||||||||||
Water and Sewer – 3.6% | ||||||||||||||||||
| 1,000 | Carroll County Public Water Supply District 1, Missouri, Water System Revenue Bonds, Refunding Series 2009, 6.000%, 3/01/39 | 3/18 at 100.00 | A | 1,046,289 | ||||||||||||||
| 1,825 | Kansas City, Missouri, Sewerage System Revenue Bonds, Series 2002D-1, 5.375%, 1/01/22 | 1/12 at 100.00 | AA | 1,865,459 | ||||||||||||||
| 1,600 | Missouri Development Finance Board, Independence, Infrastructure Facilities Revenue Bonds, Water System Improvement Projects, Series 2004, 5.000%, 11/01/24 – AMBAC Insured | 11/14 at 100.00 | A– | 1,625,519 | ||||||||||||||
| 2,965 | Missouri Environmental Improvement and Energy Resources Authority, Water Facility Revenue Bonds, Missouri-American Water Company, Series 2006, 4.600%, 12/01/36 – AMBAC Insured (Alternative Minimum Tax) (UB) | 12/16 at 100.00 | AA+ | 2,628,532 | ||||||||||||||
| 1,000 | St. Charles County Public Water Supply District 2, Missouri, Certificates of Participation, Series 2002A, 5.250%, 12/01/28 – NPFG Insured | 12/11 at 100.00 | Baa1 | 1,004,228 | ||||||||||||||
| 8,390 | Total Water and Sewer | 8,170,027 | ||||||||||||||||
| $ | 238,707 | Total Investments (cost $224,774,105) – 100.1% | 227,355,967 | |||||||||||||||
Floating Rate Obligations – (1.0)% | (2,225,000) | |||||||||||||||||
Other Assets Less Liabilities – 0.9% | 1,902,381 | |||||||||||||||||
Net Assets – 100% | $ | 227,033,348 | ||||||||||||||||
| Nuveen Investments | 57 |
Portfolio of Investments
Nuveen Missouri Municipal Bond Fund (continued)
May 31, 2011
| (1) | All percentages shown in the Portfolio of Investments are based on net assets. |
| (2) | Optional Call Provisions (not covered by the report of independent registered public accounting firm): Dates (month and year) and prices of the earliest optional call or redemption. There may be other call provisions at varying prices at later dates. Certain mortgage-backed securities may be subject to periodic principal paydowns. |
| (3) | Ratings (not covered by the report of independent registered public accounting firm): Using the highest of Standard & Poor’s Group (“Standard & Poor’s”), Moody’s Investor Service, Inc. (“Moody’s”) or Fitch, Inc. (“Fitch”) rating. Ratings below BBB by Standard & Poor’s, Baa by Moody’s or BBB by Fitch are considered to be below investment grade. Holdings designated N/R are not rated by any of these national rating agencies. |
| (4) | Backed by an escrow or trust containing sufficient U.S. Government or U.S. Government agency securities, which ensure the timely payment of principal and interest. Such investments are normally considered to be equivalent to AAA rated securities. |
| (5) | Investment, or portion of investment, has been pledged to collateralize the net payment obligations for investments in inverse floating rate transactions. |
| N/R | Not rated. |
| WI/DD | Purchased on a when-issued or delayed delivery basis. |
| (ETM) | Escrowed to maturity. |
| (UB) | Underlying bond of an inverse floating rate trust reflected as a financing transaction. See Notes to Financial Statements, Footnote 1 – General Information and Significant Accounting Policies, Inverse Floating Rate Securities for more information. |
See accompanying notes to financial statements.
| 58 | Nuveen Investments |
Portfolio of Investments
Nuveen Ohio Municipal Bond Fund
May 31, 2011
| Principal Amount (000) | Description (1) | Optional Call Provisions (2) | Ratings (3) | Value | ||||||||||||||
Consumer Staples – 5.1% | ||||||||||||||||||
Buckeye Tobacco Settlement Financing Authority, Ohio, Tobacco Settlement Asset-Backed Revenue Bonds, Senior Lien, Series 2007A-2: | ||||||||||||||||||
| $ | 9,770 | 5.875%, 6/01/30 | 6/17 at 100.00 | Baa3 | $ | 7,154,864 | ||||||||||||
| 5,000 | 5.750%, 6/01/34 | 6/17 at 100.00 | Baa3 | 3,483,900 | ||||||||||||||
| 12,250 | 5.875%, 6/01/47 | 6/17 at 100.00 | Baa3 | 8,399,824 | ||||||||||||||
| 5,320 | Puerto Rico, The Children’s Trust Fund, Tobacco Settlement Asset-Backed Refunding Bonds, Series 2002, 5.375%, 5/15/33 | 5/12 at 100.00 | BBB | 4,710,009 | ||||||||||||||
| 32,340 | Total Consumer Staples | 23,748,597 | ||||||||||||||||
Education and Civic Organizations – 7.7% | ||||||||||||||||||
| 4,090 | Cleveland State University, Ohio, General Receipts Bonds, Series 2003A, 5.000%, 6/01/23 – FGIC Insured | 6/13 at 100.00 | A+ | 4,219,121 | ||||||||||||||
Ohio Higher Education Facilities Commission, General Revenue Bonds, Case Western Reserve University, Series 2004A: | ||||||||||||||||||
| 2,310 | 5.000%, 12/01/16 – AMBAC Insured | 12/13 at 100.00 | AA– | 2,485,860 | ||||||||||||||
| 2,825 | 5.000%, 12/01/17 – AMBAC Insured | 12/13 at 100.00 | AA– | 3,008,088 | ||||||||||||||
| 2,975 | 5.000%, 12/01/18 – AMBAC Insured | 12/13 at 100.00 | AA– | 3,143,117 | ||||||||||||||
| 1,600 | Ohio Higher Education Facilities Commission, General Revenue Bonds, Kenyon College, Series 2006, 5.000%, 7/01/41 | 7/16 at 100.00 | A+ | 1,575,456 | ||||||||||||||
| 1,750 | Ohio Higher Education Facilities Commission, General Revenue Bonds, Oberlin College, Series 2003, 5.125%, 10/01/24 | 10/13 at 100.00 | AA | 1,841,910 | ||||||||||||||
| 910 | Ohio Higher Education Facilities Commission, Revenue Bonds, Case Western Reserve University, Series 1990B, 6.500%, 10/01/20 | No Opt. Call | AA– | 1,096,168 | ||||||||||||||
Ohio Higher Education Facilities Commission, Revenue Bonds, Wittenberg University, Series 2005: | ||||||||||||||||||
| 1,000 | 5.000%, 12/01/24 | 12/15 at 100.00 | Baa2 | 940,980 | ||||||||||||||
| 1,000 | 5.000%, 12/01/29 | 12/15 at 100.00 | Baa2 | 890,190 | ||||||||||||||
Ohio Higher Educational Facilities Commission, Revenue Bonds, University of Dayton, Series 2004: | ||||||||||||||||||
| 1,315 | 5.000%, 12/01/25 – AMBAC Insured | 12/14 at 100.00 | A | 1,344,614 | ||||||||||||||
| 1,060 | 5.000%, 12/01/27 – AMBAC Insured | 12/14 at 100.00 | A | 1,075,275 | ||||||||||||||
Ohio Higher Educational Facilities Commission, Revenue Bonds, Wittenberg University, Series 2001: | ||||||||||||||||||
| 1,200 | 5.500%, 12/01/21 | 12/11 at 100.00 | Baa2 | 1,201,524 | ||||||||||||||
| 2,075 | 5.000%, 12/01/26 | 12/11 at 100.00 | Baa2 | 1,906,780 | ||||||||||||||
| 1,885 | Ohio State Higher Education Facilities, Revenue Bonds, Case Western Reserve University, Series 2006, 5.000%, 12/01/44 – NPFG Insured | 12/16 at 100.00 | AA– | 1,894,444 | ||||||||||||||
Ohio University at Athens, Subordinate Lien General Receipts Bonds, Series 2004: | ||||||||||||||||||
| 1,855 | 5.000%, 12/01/21 – NPFG Insured | 6/14 at 100.00 | Aa3 | 1,993,086 | ||||||||||||||
| 1,900 | 5.000%, 12/01/23 – NPFG Insured | 6/14 at 100.00 | Aa3 | 1,961,465 | ||||||||||||||
| 1,675 | University of Cincinnati, Ohio, General Receipts Bonds, Series 2004A, 5.000%, 6/01/21 – AMBAC Insured | 6/14 at 100.00 | A+ | 1,758,884 | ||||||||||||||
University of Cincinnati, Ohio, General Receipts Bonds, Series 2004D: | ||||||||||||||||||
| 1,325 | 5.000%, 6/01/24 – AMBAC Insured | 6/14 at 100.00 | A+ | 1,355,939 | ||||||||||||||
| 1,005 | 5.000%, 6/01/26 – AMBAC Insured | 6/14 at 100.00 | A+ | 1,022,196 | ||||||||||||||
| 1,025 | University of Cincinnati, Ohio, General Receipts Bonds, Series 2004E, 5.000%, 6/01/21 – AMBAC Insured | 12/14 at 100.00 | A+ | 1,069,700 | ||||||||||||||
| 34,780 | Total Education and Civic Organizations | 35,784,797 | ||||||||||||||||
Health Care – 17.4% | ||||||||||||||||||
| 7,130 | Akron, Bath and Copley Joint Township Hospital District, Ohio, Hospital Facilities Revenue Bonds, Summa Health System, Series 1998A, 5.375%, 11/15/24 | 11/11 at 100.00 | Baa1 | 6,963,800 | ||||||||||||||
| Nuveen Investments | 59 |
Portfolio of Investments
Nuveen Ohio Municipal Bond Fund (continued)
May 31, 2011
| Principal Amount (000) | Description (1) | Optional Call Provisions (2) | Ratings (3) | Value | ||||||||||||||
Health Care (continued) | ||||||||||||||||||
Akron, Bath and Copley Joint Township Hospital District, Ohio, Hospital Facilities Revenue Bonds, Summa Health System, Series 2004A: | ||||||||||||||||||
| $ | 1,220 | 5.250%, 11/15/31 – RAAI Insured | No Opt. Call | Baa1 | $ | 1,099,696 | ||||||||||||
| 150 | 5.500%, 11/15/34 – RAAI Insured | 11/14 at 100.00 | Baa1 | 136,074 | ||||||||||||||
| 1,065 | Akron, Bath and Copley Joint Township Hospital District, Ohio, Hospital Revenue Bonds, Children’s Hospital Medical Center, Series 2003, 5.250%, 11/15/25 –AGM Insured | 11/13 at 100.00 | Aa3 | 1,084,490 | ||||||||||||||
| 2,950 | Allen County, Ohio, Hospital Facilities Revenue Bonds, Catholic Healthcare Partners, Series 2010A, 5.250%, 6/01/38 | 6/20 at 100.00 | AA– | 2,899,850 | ||||||||||||||
| 5,000 | Butler County, Ohio, Hospital Facilities Revenue Bonds, UC Health, Series 2010, 5.500%, 11/01/40 | 11/20 at 100.00 | BBB+ | 4,307,000 | ||||||||||||||
| 1,000 | Cuyahoga County, Ohio, Hospital Revenue Refunding and Improvement Bonds, MetroHealth System, Series 1997, 5.625%, 2/15/17 – NPFG Insured | 8/11 at 100.00 | A2 | 1,001,650 | ||||||||||||||
| 3,900 | Cuyahoga County, Ohio, Revenue Refunding Bonds, Cleveland Clinic Health System, Series 2003A, 6.000%, 1/01/32 | 7/13 at 100.00 | Aa2 | 4,042,818 | ||||||||||||||
Franklin County, Ohio, Hospital Revenue Bonds, Nationwide Children’s Hospital Project, Improvement Series 2009: | ||||||||||||||||||
| 2,250 | 5.000%, 11/01/34 | 11/19 at 100.00 | Aa2 | 2,210,288 | ||||||||||||||
| 3,000 | 5.250%, 11/01/40 | 11/19 at 100.00 | Aa2 | 2,995,380 | ||||||||||||||
| 3,180 | Franklin County, Ohio, Hospital Revenue Bonds, Nationwide Children’s Hospital Project, Series 2005, 5.000%, 11/01/40 | 11/18 at 100.00 | Aa2 | 3,056,807 | ||||||||||||||
| 2,000 | Lorain County, Ohio, Hospital Revenue Refunding and Improvement Bonds, Catholic Healthcare Partners, Refunding Series 2002, 5.375%, 10/01/30 | 10/12 at 100.00 | AA– | 2,005,840 | ||||||||||||||
| 1,000 | Lorain County, Ohio, Hospital Revenue Refunding and Improvement Bonds, Catholic Healthcare Partners, Series 2001A, 5.250%, 10/01/33 | No Opt. Call | AA– | 997,320 | ||||||||||||||
Lucas County, Ohio, Hospital Revenue Bonds, ProMedica Healthcare Obligated Group, Series 1999: | ||||||||||||||||||
| 6,490 | 5.375%, 11/15/29 – AMBAC Insured | 11/11 at 100.00 | AA– | 6,496,425 | ||||||||||||||
| 480 | 5.375%, 11/15/29 – AMBAC Insured | 11/11 at 100.00 | N/R | 480,259 | ||||||||||||||
| 225 | 5.375%, 11/15/39 – AMBAC Insured | 11/11 at 100.00 | AA– | 224,831 | ||||||||||||||
| 305 | Lucas County, Ohio, Hospital Revenue Bonds, ProMedica Healthcare Obligated Group, Series 2008D, 5.125%, 11/15/40 | 11/18 at 100.00 | AA– | 293,126 | ||||||||||||||
| 2,665 | Lucas County, Ohio, Hospital Revenue Bonds, ProMedica Healthcare Obligated Group, Series 2011A, 6.000%, 11/15/41 | 11/21 at 100.00 | AA– | 2,811,015 | ||||||||||||||
| 2,000 | Miami County, Ohio, Hospital Facilities Revenue Refunding Bonds, Upper Valley Medical Center Inc., Series 2006, 5.250%, 5/15/26 | 5/16 at 100.00 | A– | 2,002,540 | ||||||||||||||
| 4,000 | Middleburg Heights, Ohio, Hospital Improvement Revenue Refunding Bonds, Southwest General Hospital, Series 1995, 5.625%, 8/15/15 – AGM Insured | 8/11 at 100.00 | AA+ | 4,013,160 | ||||||||||||||
| 7,000 | Montgomery County, Ohio, Hospital Facilities Revenue Refunding and Improvement Bonds, Kettering Medical Center, Series 1996, 6.250%, 4/01/20 –NPFG Insured | No Opt. Call | A | 8,148,839 | ||||||||||||||
| 2,270 | Montgomery County, Ohio, Revenue Bonds, Catholic Health Initiatives, Series 2004A, 5.000%, 5/01/32 | No Opt. Call | AA | 2,274,177 | ||||||||||||||
Montgomery County, Ohio, Revenue Bonds, Miami Valley Hospital, Series 2009A: | ||||||||||||||||||
| 2,000 | 6.250%, 11/15/33 | 11/14 at 100.00 | Aa3 | 2,089,340 | ||||||||||||||
| 1,125 | 6.250%, 11/15/39 | 11/14 at 100.00 | Aa3 | 1,167,649 | ||||||||||||||
| 2,480 | Ohio State Higher Educational Facilities Commission, Hospital Revenue Bonds, Summa Health System Project, Series 2010, 5.250%, 11/15/40 – AGM Insured | 5/20 at 100.00 | AA+ | 2,367,755 | ||||||||||||||
| 1,150 | Ohio State Higher Educational Facilities Commission, Hospital Revenue Bonds, University Hospitals Health System, Series 2009, 6.750%, 1/15/39 | 1/15 at 100.00 | A | 1,186,271 | ||||||||||||||
| 60 | Nuveen Investments |
| Principal Amount (000) | Description (1) | Optional Call Provisions (2) | Ratings (3) | Value | ||||||||||||||
Health Care (continued) | ||||||||||||||||||
| $ | 1,000 | Ohio State, Hospital Facility Revenue Refunding Bonds, Cleveland Clinic Health System Obligated Group, Series 2009A, 5.500%, 1/01/39 | 1/19 at 100.00 | Aa2 | $ | 1,019,810 | ||||||||||||
Ohio State, Hospital Facility Revenue Refunding Bonds, Cleveland Clinic Health System Obligated Group, Tender Option Bond Trust 3551: | ||||||||||||||||||
| 5,625 | 20.065%, 1/01/33 (IF) | 1/19 at 100.00 | Aa2 | 6,070,725 | ||||||||||||||
| 700 | 20.008%, 1/01/17 (IF) | No Opt. Call | Aa2 | 736,848 | ||||||||||||||
| 2,280 | Ohio State, Hospital Facility Revenue Refunding Bonds, Cleveland Clinic Health System Obligated Group, Tender Option Bond Trust 3591, 20.222%, 1/01/17 (IF) | No Opt. Call | Aa2 | 2,460,667 | ||||||||||||||
| 665 | Richland County, Ohio, Hospital Facilities Revenue Improvement Bonds, MedCentral Health System Obligated Group, Series 2000B, 6.375%, 11/15/22 | 11/12 at 100.00 | A– | 672,534 | ||||||||||||||
Richland County, Ohio, Hospital Revenue Bonds, MidCentral Health System Group, Series 2006: | ||||||||||||||||||
| 75 | 5.000%, 11/15/13 | No Opt. Call | A– | 79,868 | ||||||||||||||
| 2,700 | 5.250%, 11/15/36 | 11/16 at 100.00 | A– | 2,537,730 | ||||||||||||||
| 1,075 | Ross County, Ohio, Hospital Revenue Refunding Bonds, Adena Health System Series 2008, 5.750%, 12/01/35 | 12/18 at 100.00 | A | 1,078,247 | ||||||||||||||
| 80,155 | Total Health Care | 81,012,829 | ||||||||||||||||
Housing/Multifamily – 2.8% | ||||||||||||||||||
| 970 | Clark County, Ohio, Multifamily Housing Revenue Bonds, Church of God Retirement Home, Series 1998, 6.250%, 11/01/30 (Alternative Minimum Tax) | 11/11 at 100.00 | N/R | 767,998 | ||||||||||||||
| 3,045 | Franklin County, Ohio, GNMA Collateralized Multifamily Housing Mortgage Revenue Bonds, Carriage House Apartments Project, Series 2002, 5.400%, 3/20/37 | 9/11 at 102.00 | Aaa | 3,070,274 | ||||||||||||||
| 1,805 | Montgomery County, Ohio, GNMA Guaranteed Multifamily Housing Revenue Bonds, Canterbury Court Project, Series 2007, 5.500%, 10/20/42 (Alternative Minimum Tax) | 10/18 at 101.00 | Aa1 | 1,812,762 | ||||||||||||||
| 2,295 | Ohio Capital Corporation for Housing, FHA-Insured Section 8 Assisted Mortgage Loan Revenue Refunding Bonds, Series 1999D, 5.950%, 2/01/23 | 8/11 at 100.00 | Aa2 | 2,297,318 | ||||||||||||||
| 2,175 | Summit County Port Authority, Ohio, Multifamily Housing Revenue Bonds, Callis Tower Apartments Project, Series 2007, 5.250%, 9/20/47 (Alternative Minimum Tax) | 9/17 at 102.00 | AAA | 2,107,336 | ||||||||||||||
| 3,000 | Trumbull County, Ohio, Multifamily Housing Revenue Bonds, Royal Mall Apartments, Series 2007, 5.000%, 5/20/49 (Alternative Minimum Tax) | 11/17 at 102.00 | Aaa | 2,807,100 | ||||||||||||||
| 13,290 | Total Housing/Multifamily | 12,862,788 | ||||||||||||||||
Housing/Single Family – 0.1% | ||||||||||||||||||
| 1,105 | Ohio Housing Finance Agency, Single Family Mortgage Revenue Bonds, Series 2006H, 5.000%, 9/01/31 (Alternative Minimum Tax) | 9/15 at 100.00 | Aaa | 1,070,712 | ||||||||||||||
Industrials – 1.7% | ||||||||||||||||||
| 500 | Cleveland-Cuyahoga County Port Authority, Ohio, Common Bond Fund Revenue Bonds, Cleveland Christian Home Project, Series 2002C, 5.950%, 5/15/22 | 5/12 at 102.00 | BBB– | 475,475 | ||||||||||||||
| 300 | Cleveland-Cuyahoga County Port Authority, Ohio, Development Revenue Bonds, Bond Fund Program – Columbia National Group Project, Series 2005D, 5.000%, 5/15/20 (Alternative Minimum Tax) | 11/15 at 100.00 | BBB– | 266,151 | ||||||||||||||
| 1,550 | Cleveland-Cuyahoga County Port Authority, Ohio, Development Revenue Bonds, Jergens Inc., Series 1998A, 5.375%, 5/15/18 (Alternative Minimum Tax) | 11/11 at 100.00 | BBB– | 1,465,618 | ||||||||||||||
| 75 | Cleveland-Cuyahoga County Port Authority, Ohio, Development Revenue Bonds, Port Cleveland Bond Fund, Series 1997A, 5.800%, 5/15/27 (Alternative Minimum Tax) | No Opt. Call | BBB– | 66,331 | ||||||||||||||
| Nuveen Investments | 61 |
Portfolio of Investments
Nuveen Ohio Municipal Bond Fund (continued)
May 31, 2011
| Principal Amount (000) | Description (1) | Optional Call Provisions (2) | Ratings (3) | Value | ||||||||||||||
Industrials (continued) | ||||||||||||||||||
| $ | 445 | Cleveland-Cuyahoga County Port Authority, Ohio, Development Revenue Bonds, Port Cleveland Bond Fund, Series 2002A, 5.600%, 11/15/15 | 5/12 at 102.00 | BBB– | $ | 435,624 | ||||||||||||
Ohio State, Economic Development Revenue Bonds, Ohio Enterprise Bond Fund, Shearer’s Foods Inc. Project, Series 2009-5: | ||||||||||||||||||
| 1,455 | 5.000%, 6/01/22 | 12/19 at 100.00 | AA– | 1,608,182 | ||||||||||||||
| 1,645 | 5.000%, 12/01/24 | 12/19 at 100.00 | AA– | 1,767,207 | ||||||||||||||
Ohio, Economic Development Revenue Bonds, Enterprise Bond Fund Loan Pool, Series 2002-4: | ||||||||||||||||||
| 290 | 5.000%, 6/01/15 (Alternative Minimum Tax) | 6/12 at 102.00 | AA– | 300,904 | ||||||||||||||
| 675 | 5.450%, 6/01/22 (Alternative Minimum Tax) | 6/12 at 102.00 | AA– | 693,340 | ||||||||||||||
| 1,020 | Ohio, Economic Development Revenue Bonds, Enterprise Bond Fund Loan Pool, Series 2002-7, 5.850%, 12/01/22 (Alternative Minimum Tax) | No Opt. Call | AA– | 1,059,117 | ||||||||||||||
| 7,955 | Total Industrials | 8,137,949 | ||||||||||||||||
Long-Term Care – 1.2% | ||||||||||||||||||
| 1,005 | Franklin County, Ohio, Healthcare Facilities Revenue Bonds, Ohio Presbyterian Retirement Services, Improvement Series 2010A, 5.625%, 7/01/26 | 7/21 at 100.00 | BBB | 1,003,432 | ||||||||||||||
| 2,000 | Franklin County, Ohio, Healthcare Facilities Revenue Bonds, Presbyterian Retirement Services, Series 2002A, 5.125%, 7/01/22 – RAAI Insured | 7/12 at 100.00 | BBB | 1,997,400 | ||||||||||||||
| 2,580 | Montgomery County, Ohio, Health Care and Multifamily Housing Revenue Bonds, Saint Leonard, Refunding & improvement Series 2010, 6.625%, 4/01/40 | 4/20 at 100.00 | BBB– | 2,454,354 | ||||||||||||||
| 5,585 | Total Long-Term Care | 5,455,186 | ||||||||||||||||
Materials – 0.8% | ||||||||||||||||||
| 3,500 | Lorain County Port Authority, Ohio, Recovery Zone Facility Economic Development Revenue Bonds, United State Steel Corporation Project, Series 2010, 6.750%, 12/01/40 | 12/20 at 100.00 | BB | 3,547,215 | ||||||||||||||
Tax Obligation/General – 22.2% | ||||||||||||||||||
Adams County Valley School District, Adams and Highland Counties, Ohio, Unlimited Tax School Improvement General Obligation Bonds, Series 1995: | ||||||||||||||||||
| 5,185 | 7.000%, 12/01/15 – NPFG Insured | No Opt. Call | Baa1 | 5,790,867 | ||||||||||||||
| 9,500 | 5.250%, 12/01/21 – NPFG Insured | 12/11 at 100.00 | Baa1 | 9,506,174 | ||||||||||||||
| 600 | Anthony Wayne Local School District, Lucas, Wood and Fulton Counties, Ohio, School Facilities Construction and Improvement Bonds, Series 1995, 0.000%, 12/01/13 – FGIC Insured | No Opt. Call | Aa3 | 573,786 | ||||||||||||||
| 25 | Barberton City School District, Summit County, Ohio, General Obligation Bonds, School Improvement Series 2008, 5.250%, 12/01/31 | 6/18 at 100.00 | AA | 26,154 | ||||||||||||||
| 1,000 | Beavercreek City School District, Ohio, General Obligation Bonds, Series 2009, 5.000%, 12/01/36 | 6/19 at 100.00 | Aa1 | 1,026,180 | ||||||||||||||
| 1,435 | Buckeye Valley Local School District, Ohio, Unlimited Tax General Obligation Bonds, Series 1995A, 6.850%, 12/01/15 – NPFG Insured | No Opt. Call | Baa1 | 1,607,989 | ||||||||||||||
| 1,000 | Butler County, Hamilton, Ohio, Limited Tax General Obligation Bonds, One Renaissance Center Acquisition, Series 2001, 5.375%, 11/01/17 – AMBAC Insured | 11/11 at 101.00 | Aa3 | 1,029,480 | ||||||||||||||
| 2,515 | Canton City School District, Stark County, Ohio, General Obligation Bonds, Series 2005, 5.000%, 12/01/19 – NPFG Insured | 6/15 at 100.00 | A– | 2,714,590 | ||||||||||||||
| 2,295 | Central Ohio Solid Waste Authority, General Obligation Bonds, Series 2004A, 5.000%, 12/01/15 – AMBAC Insured | 6/14 at 100.00 | AAA | 2,530,352 | ||||||||||||||
| 1,000 | Clyde-Green Springs Exempt Village School District, Summit County, Ohio, General Obligation Bonds, Series 2008, 5.000%, 12/01/27 – AGM Insured | 6/18 at 100.00 | Aa2 | 1,046,540 | ||||||||||||||
| 1,000 | Columbus City School District, Franklin County, Ohio, General Obligation Bonds, Series 2006, 0.000%, 12/01/28 – AGM Insured | No Opt. Call | AA+ | 401,990 | ||||||||||||||
| 62 | Nuveen Investments |
| Principal Amount (000) | Description (1) | Optional Call Provisions (2) | Ratings (3) | Value | ||||||||||||||
Tax Obligation/General (continued) | ||||||||||||||||||
| $ | 1,000 | Columbus City School District, Franklin County, Ohio, General Obligation Bonds, Series 2009B, 5.000%, 12/01/29 | 12/19 at 100.00 | AA | $ | 1,059,990 | ||||||||||||
| 2,675 | Cuyahoga County, Ohio, General Obligation Bonds, Series 2004, 5.000%, 12/01/22 | 12/14 at 100.00 | AA+ | 2,914,760 | ||||||||||||||
| 1,345 | Cuyahoga County, Ohio, Limited Tax General Obligation Bonds, Series 1993, 5.650%, 5/15/18 | No Opt. Call | Aa1 | 1,557,456 | ||||||||||||||
| 630 | Cuyahoga County, Ohio, Limited Tax General Obligation Various Purpose Refunding Bonds, Series 1993B, 5.250%, 10/01/13 | No Opt. Call | AA+ | 656,032 | ||||||||||||||
| 1,245 | Cuyahoga Falls, Ohio, General Obligation Bonds, Series 2004, 5.000%, 12/01/18 – NPFG Insured | 6/14 at 100.00 | Aa2 | 1,357,025 | ||||||||||||||
| 1,170 | Dayton, Ohio, General Obligation Bonds, Series 2004, 5.250%, 12/01/15 – AMBAC Insured | 6/14 at 100.00 | Aa2 | 1,295,798 | ||||||||||||||
| 1,000 | Delaware City School District, Delaware County, Ohio, Unlimited Tax General Obligation School Facilities Construction and Improvement Bonds, Series 1995, 0.000%, 12/01/11 – FGIC Insured | No Opt. Call | BBB | 994,990 | ||||||||||||||
| 1,000 | Fairview Park, Ohio, General Obligation Bonds, Series 2005, 5.000%, 12/01/25 – NPFG Insured | 12/15 at 100.00 | Aa2 | 1,036,020 | ||||||||||||||
| 1,005 | Findlay, Ohio, General Obligation Bonds, Series 2004, 5.250%, 7/01/15 – NPFG Insured | 7/14 at 100.00 | AA | 1,119,610 | ||||||||||||||
| 3,160 | Franklin County, Ohio, General Obligation Bonds, Series 2007, 5.000%, 12/01/28 | 12/17 at 100.00 | AAA | 3,373,774 | ||||||||||||||
| 2,500 | Hubbard Exempt Village School District, Trumbull County, Ohio, General Obligation Bonds, Classroom Facilities Improvements, Series 2007, 5.000%, 12/01/34 – CIFG Insured | 6/17 at 100.00 | A+ | 2,523,850 | ||||||||||||||
Indian Creek Local School District, Jefferson County, Ohio, General Obligation Bonds, School Facilities Construction and Improvements, Series 2009: | ||||||||||||||||||
| 1,750 | 5.000%, 12/01/34 | No Opt. Call | Aa2 | 1,821,960 | ||||||||||||||
| 1,100 | 5.125%, 12/01/36 | No Opt. Call | Aa2 | 1,136,806 | ||||||||||||||
| 1,270 | Kenston Local School District, Geauga County, Ohio, General Obligation Bonds, Series 2003, 5.000%, 12/01/23 – NPFG Insured | 6/13 at 100.00 | Aa2 | 1,344,079 | ||||||||||||||
| 1,400 | Kent City School District, Portage County, Ohio, General Obligation Library Improvement Bonds, Series 2004, 5.000%, 12/01/20 – FGIC Insured | 12/14 at 100.00 | AA | 1,535,576 | ||||||||||||||
| 1,500 | Kettering City School District, Montgomery County, Ohio, General Obligation Bonds, Series 2007, 5.250%, 12/01/31 – AGM Insured | No Opt. Call | AA+ | 1,611,090 | ||||||||||||||
| 360 | Kettering, Ohio, Limited Tax General Obligation Bonds, Series 1991, 6.650%, 12/01/12 | 12/11 at 100.00 | Aa2 | 361,850 | ||||||||||||||
Kings Local School District, Warren County, Ohio, General Obligation School Improvement Bonds, Series 2005: | ||||||||||||||||||
| 1,000 | 5.000%, 12/01/22 – NPFG Insured | 6/15 at 100.00 | Aaa | 1,089,750 | ||||||||||||||
| 1,480 | 5.000%, 12/01/24 – NPFG Insured | 6/15 at 100.00 | Aaa | 1,590,156 | ||||||||||||||
| 555 | Lake County, Ohio, Limited Tax Sewer District Improvement Bonds, Series 2000, 5.600%, 12/01/20 | No Opt. Call | Aa1 | 686,191 | ||||||||||||||
| 1,725 | Lakewood City School District, Cuyahoga County, Ohio, General Obligation Bonds, Series 2007, 5.000%, 12/01/30 – FGIC Insured | 12/17 at 100.00 | Aa2 | 1,781,477 | ||||||||||||||
| 1,000 | Lorain, Ohio, General Obligation Bonds, Pellet Terminal Improvement Series 2008, 6.750%, 12/01/28 – AMBAC Insured | 12/12 at 100.00 | A3 | 1,086,850 | ||||||||||||||
| 2,380 | Lucas County, Ohio, General Obligation Bonds, Various Purpose Series 2010, 5.000%, 10/01/40 | 10/18 at 100.00 | Aa2 | 2,411,178 | ||||||||||||||
| 1,855 | Marysville Exempted School District, Union County, Ohio, General Obligation Bonds, Series 2006, 5.000%, 12/01/24 – AGM Insured | 12/15 at 100.00 | AA+ | 1,939,106 | ||||||||||||||
| 1,000 | Mason City School District, Counties of Warren and Butler, Ohio, General Obligation Bonds, Series 2007, 5.000%, 12/01/31 | 6/17 at 100.00 | Aaa | 1,047,170 | ||||||||||||||
| Nuveen Investments | 63 |
Portfolio of Investments
Nuveen Ohio Municipal Bond Fund (continued)
May 31, 2011
| Principal Amount (000) | Description (1) | Optional Call Provisions (2) | Ratings (3) | Value | ||||||||||||||
Tax Obligation/General (continued) | ||||||||||||||||||
| $ | 1,000 | Milford Exempted Village School District, Ohio, General Obligation Bonds, Series 2008, 5.250%, 12/01/36 | 12/18 at 100.00 | Aa3 | $ | 1,021,430 | ||||||||||||
| 1,265 | Monroe Local School District, Butler County, Ohio, General Obligation Bonds, Series 2002, 5.750%, 12/01/20 – AMBAC Insured | No Opt. Call | Aa3 | 1,504,161 | ||||||||||||||
| 530 | Newark, Ohio, General Obligation Bonds, Storm Sewer Improvement Series 2009, 5.500%, 12/01/34 | 12/19 at 100.00 | Aa3 | 566,321 | ||||||||||||||
Oak Hills Local School District, Hamilton County, Ohio, General Obligation Bonds, Refunding Series 2005: | ||||||||||||||||||
| 3,740 | 5.000%, 12/01/23 – AGM Insured | 12/15 at 100.00 | AA+ | 3,992,263 | ||||||||||||||
| 1,000 | 5.000%, 12/01/25 – AGM Insured | 12/15 at 100.00 | AA+ | 1,050,810 | ||||||||||||||
| 730 | Ohio, General Obligation Bonds, Common Schools, Series 2004B, 5.000%, 3/15/21 | 3/14 at 100.00 | AA+ | 788,123 | ||||||||||||||
| 1,845 | Ohio, General Obligation Bonds, Infrastructure Improvement Series 2005A, 5.000%, 9/01/16 | 3/15 at 100.00 | AA+ | 2,080,367 | ||||||||||||||
| 6,055 | Ohio, General Obligation Bonds, Infrastructure Improvements, Series 2003F, 5.000%, 2/01/22 | 2/13 at 100.00 | AA+ | 6,340,917 | ||||||||||||||
| 1,000 | Olmsted Falls City School District, Cuyahoga County, Ohio, General Obligation Bonds, Series 2007, 5.000%, 12/01/35 – SYNCORA GTY Insured | 6/17 at 100.00 | A+ | 1,006,440 | ||||||||||||||
| 1,500 | Pettisville Local School District, Fulton County, Ohio, General Obligation Bonds, School Facilities Construction and Improvement Bonds, Series 2009, 5.000%, 12/01/36 | No Opt. Call | Aa2 | 1,537,770 | ||||||||||||||
| 500 | Pickerington Local School District, Fairfield County, Ohio, General Obligation Bonds, Series 1993, 0.000%, 12/01/11 – AMBAC Insured | No Opt. Call | Aa2 | 496,630 | ||||||||||||||
| 3,315 | South Point Local School District, Lawrence County, Ohio, General Obligation Bonds, Series 2004, 5.000%, 12/01/24 – AGM Insured | 12/14 at 100.00 | AA+ | 3,468,352 | ||||||||||||||
| 30 | Strongsville, Ohio, Limited Tax General Obligation Various Purpose Improvement Bonds, Series 1996, 5.950%, 12/01/21 | 6/11 at 100.00 | Aaa | 30,126 | ||||||||||||||
| 2,315 | Summit County, Ohio, General Obligation Bonds, Series 2002R, 5.500%, 12/01/21 – FGIC Insured | No Opt. Call | Aa1 | 2,791,728 | ||||||||||||||
| 1,300 | Sylvania City School District, Ohio, General Obligation School Improvement Bonds, Series 1995, 5.250%, 12/01/36 – AGC Insured | 6/17 at 100.00 | AA+ | 1,330,524 | ||||||||||||||
| 735 | Symmes Township, Hamilton County, Ohio, General Obligation Bonds, Parkland Acquistion & Improvment Series 2010, 5.250%, 12/01/37 | 12/20 at 100.00 | Aa1 | 783,966 | ||||||||||||||
| 3,755 | Toledo City School District, Lucas County, Ohio, General Obligation Bonds, Series 2003B, 5.000%, 12/01/22 – FGIC Insured | 12/13 at 100.00 | Aa2 | 3,987,322 | ||||||||||||||
| 1,000 | Vandalia Butler City School District, Montgomery County, Ohio, General Obligation Bonds, School Improvment Series 2009, 5.125%, 12/01/37 | No Opt. Call | AA | 1,029,080 | ||||||||||||||
| 500 | Wadsworth City School District, Medina County, Ohio, General Obligation Bonds, School Improvement Series 2009, 5.000%, 12/01/37 – AGC Insured | 12/17 at 100.00 | AA+ | 508,880 | ||||||||||||||
West Chester Township, Butler County, Ohio, General Obligation Bonds, Series 2003: | ||||||||||||||||||
| 1,365 | 5.250%, 12/01/19 – NPFG Insured | 12/13 at 100.00 | Aaa | 1,490,839 | ||||||||||||||
| 1,515 | 5.250%, 12/01/21 – NPFG Insured | 12/13 at 100.00 | Aaa | 1,654,668 | ||||||||||||||
| 2,000 | West Clermont Local School District, Clermont County, Ohio, General Obligation Bonds, Series 2008, 5.000%, 12/01/31 – AGM Insured | 12/18 at 100.00 | AA+ | 2,089,600 | ||||||||||||||
| 97,655 | Total Tax Obligation/General | 103,136,963 | ||||||||||||||||
Tax Obligation/Limited – 14.9% | ||||||||||||||||||
| 5,690 | Akron, Ohio, Income Tax Revenue Bonds, Community Learning Centers, Series 2004A, 5.000%, 12/01/33 – FGIC Insured | 12/13 at 100.00 | AA+ | 5,713,215 | ||||||||||||||
| 64 | Nuveen Investments |
| Principal Amount (000) | Description (1) | Optional Call Provisions (2) | Ratings (3) | Value | ||||||||||||||
Tax Obligation/Limited (continued) | ||||||||||||||||||
Blue Ash, Ohio, Tax Increment Financing Revenue Bonds, Duke Realty Ohio, Series 2006: | ||||||||||||||||||
| $ | 950 | 5.000%, 12/01/25 | 12/16 at 102.00 | N/R | $ | 896,610 | ||||||||||||
| 1,165 | 5.000%, 12/01/30 | 12/16 at 102.00 | N/R | 1,005,710 | ||||||||||||||
| 650 | 5.000%, 12/01/35 | 12/16 at 102.00 | N/R | 525,200 | ||||||||||||||
| 1,150 | Cincinnati, Ohio, Economic Development Revenue Bonds, Keystone Parke Project, Series 2008A, 5.000%, 11/01/38 | 11/13 at 102.00 | AA | 1,123,941 | ||||||||||||||
| 1,850 | Cleveland-Cuyahoga County Port Authority, Ohio, Development Revenue Bonds, R.I.T.A. Project, Series 2004, 5.000%, 11/15/19 – RAAI Insured | 11/14 at 100.00 | N/R | 1,891,126 | ||||||||||||||
Columbiana Exempted Village School District, Columbiana County, Ohio, Certificates of Participation, Series 2010: | ||||||||||||||||||
| 1,400 | 5.000%, 12/01/26 – AGM Insured | 12/20 at 100.00 | AA+ | 1,486,996 | ||||||||||||||
| 1,645 | 5.000%, 12/01/28 – AGM Insured | 12/20 at 100.00 | AA+ | 1,715,768 | ||||||||||||||
| 1,380 | Columbus, Ohio, Tax Increment Financing Bonds, Easton Project, Series 2004A, 5.000%, 12/01/25 – AMBAC Insured | 6/14 at 100.00 | BBB+ | 1,403,225 | ||||||||||||||
| 3,250 | Cuyhoga County, Ohio, Economic Development Revenue Bonds, Federally Taxable Recovery Zone Facility Medical Mart-Convention Center Project, Series 2010G, 5.000%, 12/01/27 | 12/20 at 100.00 | AA | 3,414,255 | ||||||||||||||
| 1,700 | Delaware County District Library, Delaware, Franklin, Marion, Morrow and Union Counties, Ohio, Library Fund Library Facilities Special Obligation Notes, Series 2009, 5.000%, 12/01/34 | 12/19 at 100.00 | Aa2 | 1,741,378 | ||||||||||||||
| 5,615 | Franklin County Convention Facilities Authority, Ohio, Excise Tax and Lease Revenue Anticipation Bonds, Series 2005, 5.000%, 12/01/25 – AMBAC Insured | 12/15 at 100.00 | Aaa | 5,897,715 | ||||||||||||||
Franklin County Convention Facilities Authority, Ohio, Excise Tax and Lease Revenue Refunding Anticipation Bonds, Series 2007: | ||||||||||||||||||
| 2,215 | 5.000%, 12/01/26 | 12/17 at 100.00 | Aaa | 2,338,730 | ||||||||||||||
| 2,000 | 5.000%, 12/01/27 | 12/17 at 100.00 | Aaa | 2,103,540 | ||||||||||||||
| 3,810 | Greater Cleveland Regional Transit Authority, Ohio, General Obligation Bonds, Capital Improvement Refunding Series 2004, 5.000%, 12/01/17 – NPFG Insured | 12/14 at 100.00 | Aa2 | 4,154,996 | ||||||||||||||
| 1,210 | Groveport, Ohio, Special Obligation Income Tax Receipts Bonds, Series 2002, 5.000%, 12/01/22 – NPFG Insured | 12/12 at 100.00 | A1 | 1,252,035 | ||||||||||||||
Hamilton County Convention Facilities Authority, Ohio, First Lien Revenue Bonds, Series 2004: | ||||||||||||||||||
| 2,300 | 5.000%, 12/01/20 – FGIC Insured | 6/14 at 100.00 | A+ | 2,465,462 | ||||||||||||||
| 2,535 | 5.000%, 12/01/22 – FGIC Insured | 6/14 at 100.00 | A+ | 2,682,791 | ||||||||||||||
| 5,800 | Hamilton County, Ohio, Sales Tax Bonds, Subordinate Lien, Series 2006, 5.000%, 12/01/32 – AMBAC Insured | 12/16 at 100.00 | A1 | 5,806,902 | ||||||||||||||
| 3,300 | Hamilton County, Ohio, Sales Tax Bonds, Subordinate Series 2000B, 0.000%, 12/01/28 – AMBAC Insured | No Opt. Call | A1 | 1,246,806 | ||||||||||||||
| 2,635 | Mayfield City School District, Ohio, Certificates of Participation, Middle School Project, Series 2009B, 5.000%, 9/01/31 | 9/19 at 100.00 | Aa2 | 2,676,633 | ||||||||||||||
| 2,015 | Milton Union Exempt Village School District, Ohio, Special Limited Obligation Bonds, Series 2009, 5.000%, 12/01/32 | 12/19 at 100.00 | A+ | 2,069,748 | ||||||||||||||
| 1,485 | New Albany Community Authority, Ohio, Community Facilities Revenue Refunding Bonds, Series 2001B, 5.500%, 10/01/16 – AMBAC Insured | 4/12 at 100.00 | A1 | 1,514,923 | ||||||||||||||
| 265 | Ohio Department of Transportation, Certificates of Participation, Panhandle Rail Line, Series 1992A, 6.500%, 4/15/12 – AGM Insured | 10/11 at 100.00 | AA+ | 266,251 | ||||||||||||||
| 1,900 | Ohio State Building Authority, State Facilities Bonds, Administrative Building Fund Projects, Series 2005A, 5.000%, 4/01/25 – AGM Insured | 4/15 at 100.00 | AA+ | 2,009,079 | ||||||||||||||
| 3,135 | Ohio State Building Authority, State Facilities Bonds, Adult Correctional Building Fund Project, Series 2005A, 5.000%, 4/01/23 – AGM Insured | 4/15 at 100.00 | AA+ | 3,361,253 | ||||||||||||||
| 1,490 | Ohio, State Appropriation Lease Bonds, Mental Health Capital Facilities, Series 2003B-II, 5.000%, 6/01/16 | 6/13 at 100.00 | AA | 1,593,570 | ||||||||||||||
| Nuveen Investments | 65 |
Portfolio of Investments
Nuveen Ohio Municipal Bond Fund (continued)
May 31, 2011
| Principal Amount (000) | Description (1) | Optional Call Provisions (2) | Ratings (3) | Value | ||||||||||||||
Tax Obligation/Limited (continued) | ||||||||||||||||||
| $ | 1,000 | Ohio, State Appropriation Lease Bonds, Parks and Recreation Capital Facilities, Series 2004A-II, 5.000%, 12/01/15 | 12/13 at 100.00 | AA | $ | 1,089,790 | ||||||||||||
| 1,000 | Ohio, State Appropriation Lease Bonds, Parks and Recreation Capital Facilities, Series 2005A-II, 5.250%, 2/01/19 – AGM Insured | 2/15 at 100.00 | AA+ | 1,111,360 | ||||||||||||||
| 11,900 | Puerto Rico Sales Tax Financing Corporation, Sales Tax Revenue Bonds, First Subordinate Series 2009A, 0.000%, 8/01/34 | No Opt. Call | A+ | 2,602,649 | ||||||||||||||
| 18,000 | Puerto Rico Sales Tax Financing Corporation, Sales Tax Revenue Bonds, Series 2007A, 0.000%, 8/01/44 – NPFG Insured | No Opt. Call | AA | 2,029,500 | ||||||||||||||
| 400 | Puerto Rico Sales Tax Financing Corporation, Sales Tax Revenue Bonds, Series 2010A, 0.000%, 8/01/35 | No Opt. Call | A+ | 80,224 | ||||||||||||||
| 94,840 | Total Tax Obligation/Limited | 69,271,381 | ||||||||||||||||
Transportation – 2.6% | ||||||||||||||||||
| 1,025 | Dayton, Ohio, Airport Revenue Bonds, James M. Cox International Airport, Series 2003C, 5.250%, 12/01/27 – RAAI Insured (Alternative Minimum Tax) | 12/13 at 100.00 | A– | 1,022,755 | ||||||||||||||
| 10,000 | Ohio Turnpike Commission, Revenue Refunding Bonds, Series 1998A, 5.500%, 2/15/24 – FGIC Insured | No Opt. Call | AA | 11,235,599 | ||||||||||||||
| 11,025 | Total Transportation | 12,258,354 | ||||||||||||||||
U.S. Guaranteed – 7.3% (4) | ||||||||||||||||||
Canal Winchester Local School District, Franklin and Fairfield Counties, Ohio, General Obligation Bonds, Series 2005B: | ||||||||||||||||||
| 3,420 | 5.000%, 12/01/26 (Pre-refunded 6/01/15) – NPFG Insured | 6/15 at 100.00 | A1 | (4) | 3,913,096 | |||||||||||||
| 3,590 | 5.000%, 12/01/27 (Pre-refunded 6/01/15) – NPFG Insured | 6/15 at 100.00 | A1 | (4) | 4,107,606 | |||||||||||||
| 1,235 | Dayton, Ohio, Airport Revenue Bonds, James M. Cox International Airport, Series 2005B, 5.000%, 12/01/14 – SYNCORA GTY Insured (ETM) | No Opt. Call | A– | (4) | 1,420,658 | |||||||||||||
| 355 | Lorain, Ohio, Hospital Revenue Refunding Bonds, Lakeland Community Hospital Inc., Series 1992, 6.500%, 11/15/12 (ETM) | 11/11 at 100.00 | A1 | (4) | 363,971 | |||||||||||||
| 5,610 | Montgomery County, Ohio, Revenue Bonds, Catholic Health Initiatives, Series 2001, 5.375%, 9/01/21 (ETM) | 9/11 at 100.00 | AA | (4) | 5,674,347 | |||||||||||||
| 3,000 | Ohio Higher Education Facilities Commission, Revenue Bonds, Case Western Reserve University, Series 2002B, 5.500%, 10/01/22 (Pre-refunded 10/01/12) | 10/12 at 100.00 | N/R | (4) | 3,202,620 | |||||||||||||
| 3,665 | Ohio Water Development Authority, Loan Revenue Bonds, Pure Water Development, Series 1990I, 6.000%, 12/01/16 – AMBAC Insured (ETM) | No Opt. Call | Aaa | 4,093,768 | ||||||||||||||
| 530 | Ohio Water Development Authority, Revenue Bonds, Drinking Water Assistance Fund, State Match, Series 2008, 5.000%, 6/01/28 (Pre-refunded 6/01/18) – AGM Insured | 6/18 at 100.00 | AAA | 638,523 | ||||||||||||||
| 1,000 | Ohio Water Development Authority, Water Pollution Control Loan Fund Revenue Bonds, Water Quality Project, Series 2005B, 5.000%, 6/01/25 (Pre-refunded 6/01/15) | 6/15 at 100.00 | AAA | 1,157,740 | ||||||||||||||
Olentangy Local School District, Delaware and Franklin Counties, Ohio, General Obligation Bonds, Series 2004A: | ||||||||||||||||||
| 400 | 5.250%, 12/01/21 (Pre-refunded 6/01/14) – FGIC Insured | 6/14 at 100.00 | AA+ | (4) | 454,156 | |||||||||||||
| 3,055 | 5.250%, 12/01/22 (Pre-refunded 6/01/14) – FGIC Insured | 6/14 at 100.00 | AA+ | (4) | 3,468,616 | |||||||||||||
| 1,495 | Otsego Local School District, Wood, Henry and Lucas Counties, Ohio, General Obligation Bonds, Series 2004, 5.375%, 12/01/22 (Pre-refunded 12/01/14) – AGM Insured | 12/14 at 100.00 | Aa3 | (4) | 1,739,104 | |||||||||||||
| 1,545 | Puerto Rico Electric Power Authority, Power Revenue Refunding Bonds, Series 1989O, 0.000%, 7/01/17 (ETM) | No Opt. Call | AAA | 1,286,784 | ||||||||||||||
| 1,185 | Sugarcreek Local School District, Athens County, Ohio, General Obligation Bonds, Series 2003, 5.250%, 12/01/24 (Pre-refunded 12/01/13) – NPFG Insured | 12/13 at 100.00 | A1 | (4) | 1,318,952 | |||||||||||||
| 66 | Nuveen Investments |
| Principal Amount (000) | Description (1) | Optional Call Provisions (2) | Ratings (3) | Value | ||||||||||||||
U.S. Guaranteed (4) (continued) | ||||||||||||||||||
| $ | 1,200 | Tuscarawas County, Ohio, Hospital Facilities Revenue Bonds, Union Hospital Project, Series 2001, 5.250%, 10/01/31 (Pre-refunded 10/01/11) – RAAI Insured | 10/11 at 101.00 | N/R | (4) | $ | 1,230,120 | |||||||||||
| 31,285 | Total U.S. Guaranteed | 34,070,061 | ||||||||||||||||
Utilities – 6.8% | ||||||||||||||||||
| 5,000 | American Municipal Power Ohio Inc., General Revenue Bonds, Prairie State Energy Campus Project Series 2008A, 5.250%, 2/15/43 | 2/18 at 100.00 | A1 | 5,026,250 | ||||||||||||||
| 1,535 | Cleveland Public Power System, Ohio, First Mortgage Improvement Revenue Bonds, Series 1994A, 0.000%, 11/15/13 – NPFG Insured | No Opt. Call | A2 | 1,455,165 | ||||||||||||||
Cleveland, Ohio, Public Power System Revenue Bonds, Series 2008B: | ||||||||||||||||||
| 4,740 | 0.000%, 11/15/34 – NPFG Insured | No Opt. Call | A– | 1,201,448 | ||||||||||||||
| 2,000 | 5.000%, 11/15/38 – NPFG Insured | 5/18 at 100.00 | A– | 1,992,540 | ||||||||||||||
| 7,500 | 0.000%, 11/15/38 – NPFG Insured | No Opt. Call | A– | 1,466,325 | ||||||||||||||
| 4,000 | Ohio Air Quality Development Authority, Ohio, Revenue Bonds, Ohio Valley Electric Corporation Project, Series 2009E, 5.625%, 10/01/19 | No Opt. Call | BBB– | 4,193,360 | ||||||||||||||
Ohio Municipal Electric Generation Agency, Beneficial Interest Certificates, Belleville Hydroelectric Project – Joint Venture 5, Series 2004: | ||||||||||||||||||
| 1,000 | 5.000%, 2/15/20 – AMBAC Insured | 2/14 at 100.00 | A1 | 1,047,550 | ||||||||||||||
| 5,450 | 5.000%, 2/15/21 – AMBAC Insured | 2/14 at 100.00 | A1 | 5,679,500 | ||||||||||||||
| 1,515 | 5.000%, 2/15/22 – AMBAC Insured | 2/14 at 100.00 | A1 | 1,568,101 | ||||||||||||||
| 3,295 | 5.000%, 2/15/23 – AMBAC Insured | 2/14 at 100.00 | A1 | 3,399,353 | ||||||||||||||
| 4,460 | Puerto Rico Industrial, Tourist, Educational, Medical and Environmental Control Facilities Financing Authority, Co-Generation Facility Revenue Bonds, Series 2000A, 6.625%, 6/01/26 (Alternative Minimum Tax) | 12/11 at 100.00 | Baa3 | 4,463,300 | ||||||||||||||
| 40,495 | Total Utilities | 31,492,892 | ||||||||||||||||
Water and Sewer – 7.3% | ||||||||||||||||||
| 1,390 | Akron, Ohio, Waterworks System Mortgage Revenue Improvement and Refunding Bonds, Series 2009, 5.000%, 3/01/34 – AGC Insured | 3/19 at 100.00 | Aa3 | 1,394,768 | ||||||||||||||
| 1,730 | Butler County, Ohio, Sewerage System Revenue Bonds, Series 2005, 5.000%, 12/01/23 – AGM Insured | No Opt. Call | Aa3 | 1,974,518 | ||||||||||||||
| 4,355 | Cincinnati, Ohio, Water System Revenue Bonds, Series 2007B, 5.000%, 12/01/32 | 12/17 at 100.00 | AAA | 4,552,673 | ||||||||||||||
| 865 | City of Marysville, Ohio, Water System Mortgage Revenue Bonds, Series 2007, 5.000%, 12/01/32 – AMBAC Insured | 12/17 at 100.00 | A1 | 870,484 | ||||||||||||||
| 10,330 | Cleveland, Ohio, Waterworks First Mortgage Revenue Refunding and Improvement Bonds, Series 1993G, 5.500%, 1/01/21 – NPFG Insured | No Opt. Call | Aa1 | 12,086,615 | ||||||||||||||
| 1,950 | Hebron, Ohio, Mortgage Revenue Bonds, Waterworks System Improvements, Series 2004, 5.875%, 12/01/25 | 6/14 at 100.00 | N/R | 1,897,214 | ||||||||||||||
| 1,260 | Lancaster, Ohio, Wastewater System Improvement Revenue Bonds, Series 2004, 5.000%, 12/01/25 – AMBAC Insured | 12/14 at 100.00 | N/R | 1,271,063 | ||||||||||||||
| 4,590 | Marysville, Ohio, Wastewater Treatement System Revenue Bonds, Series 2007, 4.750%, 12/01/47 – SYNCORA GTY Insured | 12/17 at 100.00 | A– | 4,174,008 | ||||||||||||||
| 1,505 | Marysville, Ohio, Wastewater Treatment System Revenue Bonds, Series 2006, 5.250%, 12/01/25 – SYNCORA GTY Insured | 12/16 at 100.00 | A– | 1,560,143 | ||||||||||||||
| 105 | Ohio Water Development Authority, Revenue Bonds, Fresh Water Development, Series 2004, 5.250%, 12/01/15 | 6/14 at 100.00 | AAA | 117,272 | ||||||||||||||
Ohio Water Development Authority, Revenue Bonds, Water Development Community Assistance Program, Refunding Series 2009: | ||||||||||||||||||
| 1,405 | 5.000%, 12/01/25 | 12/19 at 100.00 | Aa1 | 1,538,995 | ||||||||||||||
| 1,475 | 5.000%, 12/01/26 | 12/19 at 100.00 | Aa1 | 1,603,104 | ||||||||||||||
| 645 | Ohio Water Development Authority, Water Pollution Control Loan Fund Revenue Bonds, Water Quality Project, Series 2005B, 5.000%, 6/01/25 | 6/15 at 100.00 | AAA | 698,548 | ||||||||||||||
| 31,605 | Total Water and Sewer | 33,739,405 | ||||||||||||||||
| $ | 485,615 | Total Investments (cost $442,434,843) – 97.9% | 455,589,129 | |||||||||||||||
Other Assets Less Liabilities – 2.1% | 9,743,746 | |||||||||||||||||
Net Assets – 100% | $ | 465,332,875 | ||||||||||||||||
| Nuveen Investments | 67 |
Portfolio of Investments
Nuveen Ohio Municipal Bond Fund (continued)
May 31, 2011
| (1) | All percentages shown in the Portfolio of Investments are based on net assets. |
| (2) | Optional Call Provisions (not covered by the report of independent registered public accounting firm): Dates (month and year) and prices of the earliest optional call or redemption. There may be other call provisions at varying prices at later dates. Certain mortgage-backed securities may be subject to periodic principal paydowns. |
| (3) | Ratings (not covered by the report of independent registered public accounting firm): Using the highest of Standard & Poor’s Group (“Standard & Poor’s”), Moody’s Investor Service, Inc. (“Moody’s”) or Fitch, Inc. (“Fitch”) rating. Ratings below BBB by Standard & Poor’s, Baa by Moody’s or BBB by Fitch are considered to be below investment grade. Holdings designated N/R are not rated by any of these national rating agencies. |
| (4) | Backed by an escrow or trust containing sufficient U.S. Government or U.S. Government agency securities, which ensure the timely payment of principal and interest. Such investments are normally considered to be equivalent to AAA rated securities. |
| N/R | Not rated. |
| (ETM) | Escrowed to maturity. |
| (IF) | Inverse floating rate investment. |
See accompanying notes to financial statements.
| 68 | Nuveen Investments |
Portfolio of Investments
Nuveen Wisconsin Municipal Bond Fund
May 31, 2011
| Principal Amount (000) | Description (1) | Optional Call Provisions (2) | Ratings (3) | Value | ||||||||||||||
Education and Civic Organizations – 9.8% | ||||||||||||||||||
| $ | 500 | Delafield Community Development Authority, Wisconsin, Redevelopment Revenue Bonds, Saint John’s Northwestern Milirary Academy, Series 2009, 4.700%, 6/01/34 | 6/19 at 100.00 | Aaa | $ | 518,940 | ||||||||||||
Madison Community Development Authority, Wisconsin, Revenue Bonds, The Wisconsin Alumni Research Foundation, Series 2009: | ||||||||||||||||||
| 1,000 | 5.000%, 10/01/22 | 10/19 at 100.00 | AAA | 1,146,620 | ||||||||||||||
| 1,000 | 5.000%, 10/01/23 | 10/19 at 100.00 | AAA | 1,132,900 | ||||||||||||||
| 125 | 5.000%, 10/01/28 | 10/19 at 100.00 | AAA | 135,855 | ||||||||||||||
| 1,000 | 5.000%, 10/01/34 | 10/19 at 100.00 | AAA | 1,049,610 | ||||||||||||||
| 1,000 | 5.000%, 10/01/39 | No Opt. Call | AAA | 1,037,530 | ||||||||||||||
Milwaukee Redevelopment Authority, Wisconsin, Revenue Bonds, Summerfest Project, Series 2001: | ||||||||||||||||||
| 400 | 4.850%, 8/01/17 | 8/11 at 100.00 | A | 401,548 | ||||||||||||||
| 1,000 | 4.950%, 8/01/20 | 8/11 at 100.00 | A | 1,002,640 | ||||||||||||||
| 370 | Puerto Rico Industrial, Tourist, Educational, Medical and Environmental Control Facilities Financing Authority, Higher Education Revenue Bonds, Ana G. Mendez University System, Series 1999, 5.375%, 2/01/29 | 8/11 at 100.00 | BBB– | 326,610 | ||||||||||||||
| 200 | Puerto Rico Industrial, Tourist, Educational, Medical and Environmental Control Facilities Financing Authority, Higher Education Revenue Bonds, University of the Sacred Heart, Series 2001, 5.250%, 9/01/21 | 9/11 at 100.00 | BBB | 200,162 | ||||||||||||||
| 250 | Puerto Rico Industrial, Tourist, Educational, Medical and Environmental Control Facilities Financing Authority, Higher Education Revenue Refunding Bonds, Ana G. Mendez University System, Series 2002, 5.500%, 12/01/31 | 12/12 at 101.00 | BBB– | 220,360 | ||||||||||||||
| 6,845 | Total Education and Civic Organizations | 7,172,775 | ||||||||||||||||
Health Care – 17.3% | ||||||||||||||||||
Monroe Redevelopment Authority, Wisconsin, Development Revenue Bonds, The Monroe Clinic, Inc., Series 2009: | ||||||||||||||||||
| 1,150 | 5.500%, 2/15/29 | 2/19 at 100.00 | A3 | 1,158,510 | ||||||||||||||
| 2,485 | 5.875%, 2/15/39 | 2/19 at 100.00 | A3 | 2,514,646 | ||||||||||||||
| 45 | Puerto Rico Industrial, Tourist, Educational, Medical and Environmental Control Facilities Financing Authority, FHA-Insured Mortgage Hospital Revenue Bonds, Doctor Pila Hospital, Series 1995A, 5.875%, 8/01/12 | 8/11 at 100.00 | AA+ | 45,160 | ||||||||||||||
| 500 | Puerto Rico Industrial, Tourist, Educational, Medical and Environmental Control Facilities Financing Authority, Hospital Revenue Bonds, Auxilio Mutuo Hospital, Series 1995A, 6.250%, 7/01/24 – NPFG Insured | 7/11 at 100.00 | A– | 500,540 | ||||||||||||||
Wisconsin Health and Educational Facilities Authority, Revenue Bonds, Aurora Health Care Inc., Series 1999A: | ||||||||||||||||||
| 1,445 | 5.600%, 2/15/29 | 8/11 at 100.00 | A3 | 1,444,971 | ||||||||||||||
| 1,000 | 5.600%, 2/15/29 – ACA Insured | 8/11 at 100.00 | A3 | 999,980 | ||||||||||||||
| 1,000 | Wisconsin Health and Educational Facilities Authority, Revenue Bonds, Froedtert Community Health, Inc. Obligated Group, Tender Option Bond Trust 3592, 17.830%, 4/01/17 (IF) (5) | No Opt. Call | AA– | 888,320 | ||||||||||||||
| 1,000 | Wisconsin Health and Educational Facilities Authority, Revenue Bonds, Meriter Hospital, Inc., Series 2011A, 5.750%, 5/01/35 (WI/DD, Settling 6/08/11) | 5/21 at 100.00 | A+ | 992,240 | ||||||||||||||
| 1,000 | Wisconsin Health and Educational Facilities Authority, Revenue Bonds, ProHealth Care, Inc. Obligated Group, Series 2009, 6.625%, 2/15/32 | 2/14 at 100.00 | A+ | 1,028,070 | ||||||||||||||
| 1,000 | Wisconsin Health and Educational Facilities Authority, Revenue Bonds, ThedaCare, Inc., Series 2009A, 5.500%, 12/15/38 | 12/19 at 100.00 | A1 | 994,360 | ||||||||||||||
| 2,000 | Wisconsin Health and Educational Facilities Authority, Revenue Bonds, Wheaton Franciscan Healthcare System, Series 2006, 5.250%, 8/15/19 | 8/16 at 100.00 | BBB+ | 2,062,700 | ||||||||||||||
| 12,625 | Total Health Care | 12,629,497 | ||||||||||||||||
Housing/Multifamily – 5.4% | ||||||||||||||||||
| 570 | Lake Delton Community Development Agency, Wisconsin, GNMA Collateralized Multifamily Housing Revenue Bonds, Woodland Park Project, Series 2001, 5.300%, 2/20/31 (Alternative Minimum Tax) | 1/12 at 102.00 | N/R | 506,092 | ||||||||||||||
| Nuveen Investments | 69 |
Portfolio of Investments
Nuveen Wisconsin Municipal Bond Fund (continued)
May 31, 2011
| Principal Amount (000) | Description (1) | Optional Call Provisions (2) | Ratings (3) | Value | ||||||||||||||
Housing/Multifamily (continued) | ||||||||||||||||||
| $ | 1,700 | Puerto Rico Housing Finance Authority, Subordinate Lien Capital Fund Program Revenue Bonds, Modernization Series 2008, 5.125%, 12/01/27 | 12/18 at 100.00 | AA– | $ | 1,716,864 | ||||||||||||
| 500 | Sheboygan Housing Authority, Wisconsin, GNMA Multifamily Revenue Refunding Bonds, Lake Shore Apartments, Series 1998A, 5.100%, 11/20/26 | 11/11 at 100.00 | AAA | 500,210 | ||||||||||||||
| 300 | Walworth County Housing Authority, Wisconsin, FHA-Insured Housing Revenue Bonds, Kiwanis Heritage Inc. Senior Apartments, Series 1997, 5.550%, 9/01/22 | 9/11 at 100.00 | N/R | 293,424 | ||||||||||||||
| 965 | Wisconsin Housing and Economic Development Authority, Housing Revenue Bonds, Series 2006A, 4.550%, 5/01/27 (Alternative Minimum Tax) | 5/16 at 100.00 | AA | 899,602 | ||||||||||||||
| 4,035 | Total Housing/Multifamily | 3,916,192 | ||||||||||||||||
Housing/Single Family – 3.1% | ||||||||||||||||||
| 30 | Virgin Islands Housing Finance Corporation, GNMA Mortgage-Backed Securities Program Single Family Mortgage Revenue Refunding Bonds, Series 1995A, 6.450%, 3/01/16 (Alternative Minimum Tax) | 9/11 at 100.00 | N/R | 30,054 | ||||||||||||||
Wisconsin Housing and Economic Development Authority, Home Ownership Revenue Bonds, Series 2005E: | ||||||||||||||||||
| 1,000 | 4.900%, 11/01/35 | 5/15 at 100.00 | AA | 974,390 | ||||||||||||||
| 1,300 | 4.900%, 11/01/35 – AMBAC Insured | 5/15 at 100.00 | AA | 1,266,707 | ||||||||||||||
| 2,330 | Total Housing/Single Family | 2,271,151 | ||||||||||||||||
Industrials – 0.5% | ||||||||||||||||||
| 460 | Milwaukee Redevelopment Authority, Wisconsin, Schlitz Park Mortgage Revenue Refunding Bonds, Series 1998A, 5.500%, 1/01/17 (Alternative Minimum Tax) | 7/11 at 100.00 | N/R | 450,473 | ||||||||||||||
Tax Obligation/General – 0.1% | ||||||||||||||||||
| 95 | Guam, General Obligation Bonds, Series 1993A, 5.400%, 11/15/18 | 11/11 at 100.00 | B+ | 92,438 | ||||||||||||||
Tax Obligation/Limited – 50.8% | ||||||||||||||||||
| 1,500 | Ashwaubenon Community Development Authority, Wisconsin, Lease Revenue Refunding Bonds, Arena Project, Series 2002, 5.150%, 6/01/29 | 6/12 at 100.00 | Aa1 | 1,520,595 | ||||||||||||||
| 2,000 | Glendale Community Development Authority, Wisconsin, Community Development Lease Revenue Bonds, Bayshore Public Parking Project, Series 2004A, 5.000%, 10/01/24 | 10/14 at 100.00 | A1 | 2,066,460 | ||||||||||||||
| 100 | Glendale Community Development Authority, Wisconsin, Community Development Lease Revenue Refunding Bonds, Tax Increment District 6, Series 2001, 5.000%, 10/01/19 | 10/11 at 100.00 | A1 | 100,608 | ||||||||||||||
| 960 | Madison Community Development Authority, Wisconsin, Lease Revenue Refunding Bonds, Monona Terrace, Series 2002, 4.375%, 3/01/20 | 3/12 at 100.00 | Aa2 | 970,118 | ||||||||||||||
| 675 | Milwaukee Redevelopment Authority, Wisconsin, HSI Industrial I LLC Project Revenue Bonds, Series 2008, 5.125%, 6/01/29 | 6/16 at 100.00 | A3 | 644,456 | ||||||||||||||
| 2,000 | Milwaukee Redevelopment Authority, Wisconsin, Lease Revenue Bonds, Neighborhood Public Schools Initiative, Series 2002A, 4.875%, 8/01/21 – AMBAC Insured | 8/12 at 100.00 | Aa3 | 2,032,840 | ||||||||||||||
| 1,050 | Milwaukee Redevelopment Authority, Wisconsin, Lease Revenue Bonds, Neighborhood Public Schools Initiative, Series 2007A, 4.000%, 8/01/23 – AMBAC Insured | 8/17 at 100.00 | Aa3 | 1,069,740 | ||||||||||||||
| 275 | Milwaukee Redevelopment Authority, Wisconsin, Lease Revenue Bonds, Public Schools, Series 2005A, 4.600%, 8/01/22 | 8/15 at 100.00 | Aa3 | 285,032 | ||||||||||||||
| 1,500 | Neenah Community Development Authority, Wisconsin, Lease Revenue Bonds, Series 2004A, 5.000%, 12/01/26 | 12/14 at 100.00 | Aa3 | 1,546,320 | ||||||||||||||
Neenah Community Development Authority, Wisconsin, Lease Revenue Bonds, Series 2008A: | ||||||||||||||||||
| 500 | 4.625%, 12/01/28 | 12/18 at 100.00 | Aa3 | 516,150 | ||||||||||||||
| 1,000 | 4.750%, 12/01/32 | 12/18 at 100.00 | Aa3 | 1,018,000 | ||||||||||||||
| 70 | Nuveen Investments |
| Principal Amount (000) | Description (1) | Optional Call Provisions (2) | Ratings (3) | Value | ||||||||||||||
Tax Obligation/Limited (continued) | ||||||||||||||||||
| $ | 1,000 | Onalaska Community Development Authority, Wisconsin, Community Development Lease Revenue Bonds, Series 2003, 4.875%, 10/01/27 | 10/13 at 100.00 | A1 | $ | 1,000,480 | ||||||||||||
| 2,500 | Oneida Tribe of Indians of Wisconsin, Retail Sales Revenue Bonds, Series 2010, 144A, 6.500%, 2/01/31 | 2/19 at 102.00 | AA– | 2,647,775 | ||||||||||||||
| 1,200 | Puerto Rico Highway and Transportation Authority, Highway Revenue Bonds, Series 2004-I, 5.000%, 7/01/23 – FGIC Insured | 7/14 at 100.00 | A3 | 1,175,976 | ||||||||||||||
| 2,000 | Puerto Rico Highway and Transportation Authority, Highway Revenue Bonds, Series 2007N, 5.250%, 7/01/33 – NPFG Insured | No Opt. Call | A3 | 1,868,620 | ||||||||||||||
| 1,000 | Puerto Rico Sales Tax Financing Corporation, Sales Tax Revenue Bonds, First Subordinate Series 2009A, 6.000%, 8/01/42 | 8/19 at 100.00 | A+ | 1,027,160 | ||||||||||||||
| 1,000 | Puerto Rico Sales Tax Financing Corporation, Sales Tax Revenue Bonds, First Subordinate Series 2010C, 6.000%, 8/01/39 | 8/20 at 100.00 | A+ | 1,029,730 | ||||||||||||||
Saint Francis Community Development Authority, Wisconsin, Lease Revenue Bonds, Series 2007: | ||||||||||||||||||
| 400 | 4.150%, 3/01/20 | 3/17 at 100.00 | A1 | 421,884 | ||||||||||||||
| 300 | 4.350%, 3/01/22 | 3/17 at 100.00 | A1 | 310,158 | ||||||||||||||
| 280 | 4.500%, 3/01/24 | 3/17 at 100.00 | A1 | 287,619 | ||||||||||||||
| 520 | 4.600%, 3/01/27 | 3/17 at 100.00 | A1 | 527,576 | ||||||||||||||
Southeast Wisconsin Professional Baseball Park District, Sales Tax Revenue Refunding Bonds, Series 1998A: | ||||||||||||||||||
| 850 | 5.500%, 12/15/18 – NPFG Insured | No Opt. Call | AA– | 1,030,192 | ||||||||||||||
| 400 | 5.500%, 12/15/19 – NPFG Insured | No Opt. Call | AA– | 484,932 | ||||||||||||||
| 2,195 | 5.500%, 12/15/20 – NPFG Insured | No Opt. Call | AA– | 2,629,522 | ||||||||||||||
| 1,500 | 5.500%, 12/15/26 – NPFG Insured | No Opt. Call | AA– | 1,630,380 | ||||||||||||||
| 1,220 | Sturgeon Bay Waterfront Redevelopment Authority, Wisconsin, Lease Revenue Bonds, Series 2006A, 4.500%, 10/01/21 | 10/16 at 100.00 | N/R | 1,240,764 | ||||||||||||||
| 1,305 | Sun Prairie Community Development Authority, Wisconsin, Lease Revenue Bonds, Tax Increment District 8, Series 2006, 4.250%, 8/01/25 | 8/16 at 100.00 | A1 | 1,282,437 | ||||||||||||||
| 1,000 | Weston Community Development Authority, Wisconsin, Lease Revenue Bonds, Series 2004A, 5.250%, 10/01/21 | 10/14 at 100.00 | A1 | 1,057,370 | ||||||||||||||
| 1,000 | Weston Community Development Authority, Wisconsin, Lease Revenue Bonds, Series 2005A, 5.000%, 10/01/21 | 10/15 at 100.00 | A1 | 1,044,430 | ||||||||||||||
Wisconsin Center District, Junior Dedicated Tax Revenue Refunding Bonds, Series 1999: | ||||||||||||||||||
| 2,900 | 5.250%, 12/15/23 – AGM Insured | No Opt. Call | AA+ | 3,235,849 | ||||||||||||||
| 525 | 5.250%, 12/15/27 – AGM Insured | No Opt. Call | AA+ | 566,360 | ||||||||||||||
| 2,000 | Wisconsin Center District, Senior Dedicated Tax Revenue Refunding Bonds, Series 2003A, 0.000%, 12/15/28 – AGM Insured | No Opt. Call | AA+ | 780,180 | ||||||||||||||
| 36,655 | Total Tax Obligation/Limited | 37,049,713 | ||||||||||||||||
U.S. Guaranteed – 3.5% (4) | ||||||||||||||||||
Milwaukee Redevelopment Authority, Wisconsin, Lease Revenue Bonds, Public Schools, Series 2003A: | ||||||||||||||||||
| 1,300 | 5.125%, 8/01/21 (Pre-refunded 8/01/13) – AMBAC Insured | 8/13 at 100.00 | Aa3 | (4) | 1,428,271 | |||||||||||||
| 1,000 | 5.125%, 8/01/22 (Pre-refunded 8/01/13) – AMBAC Insured | 8/13 at 100.00 | Aa3 | (4) | 1,098,670 | |||||||||||||
| 2,300 | Total U.S. Guaranteed | 2,526,941 | ||||||||||||||||
Utilities – 5.4% | ||||||||||||||||||
| 1,000 | Guam Power Authority, Revenue Bonds, Series 1999A, 5.125%, 10/01/29 – NPFG Insured | 10/11 at 100.00 | Baa1 | 910,150 | ||||||||||||||
| 1,000 | Puerto Rico Electric Power Authority, Power Revenue Bonds, Series 2003NN, 5.250%, 7/01/23 – NPFG Insured | No Opt. Call | A3 | 1,046,460 | ||||||||||||||
| 1,000 | Puerto Rico Electric Power Authority, Power Revenue Bonds, Series 2007VV, 5.250%, 7/01/24 – FGIC Insured | No Opt. Call | A3 | 1,026,650 | ||||||||||||||
| 1,000 | Puerto Rico Electric Power Authority, Power Revenue Bonds, Series 2010XX, 5.250%, 7/01/40 | 7/20 at 100.00 | A3 | 945,880 | ||||||||||||||
| 4,000 | Total Utilities | 3,929,140 | ||||||||||||||||
| Nuveen Investments | 71 |
Portfolio of Investments
Nuveen Wisconsin Municipal Bond Fund (continued)
May 31, 2011
| Principal Amount (000) | Description (1) | Optional Call Provisions (2) | Ratings (3) | Value | ||||||||||||||
Water and Sewer – 2.6% | ||||||||||||||||||
| $ | 1,000 | Guam Government Waterworks Authority, Water and Wastewater System Revenue Bonds, Series 2010, 5.625%, 7/01/40 | 7/20 at 100.00 | Ba2 | $ | 883,080 | ||||||||||||
| 1,000 | Puerto Rico Aqueduct and Sewerage Authority, Revenue Bonds, Senior Lien Series 2008A, 6.000%, 7/01/38 | 7/18 at 100.00 | Baa1 | 1,003,080 | ||||||||||||||
| 2,000 | Total Water and Sewer | 1,886,160 | ||||||||||||||||
| $ | 71,345 | Total Investments (cost $70,434,665) – 98.5% | 71,924,480 | |||||||||||||||
Other Assets Less Liabilities – 1.5% | 1,065,356 | |||||||||||||||||
Net Assets – 100% | $ | 72,989,836 | ||||||||||||||||
| (1) | All percentages shown in the Portfolio of Investments are based on net assets. |
| (2) | Optional Call Provisions (not covered by the report of independent registered public accounting firm): Dates (month and year) and prices of the earliest optional call or redemption. There may be other call provisions at varying prices at later dates. Certain mortgage-backed securities may be subject to periodic principal paydowns. |
| (3) | Ratings (not covered by the report of independent registered public accounting firm): Using the highest of Standard & Poor’s Group (“Standard & Poor’s”), Moody’s Investor Service, Inc. (“Moody’s”) or Fitch, Inc. (“Fitch”) rating. Ratings below BBB by Standard & Poor’s, Baa by Moody’s or BBB by Fitch are considered to be below investment grade. Holdings designated N/R are not rated by any of these national rating agencies. |
| (4) | Backed by an escrow or trust containing sufficient U.S. Government or U.S. Government agency securities, which ensure the timely payment of principal and interest. Such investments are normally considered to be equivalent to AAA rated securities. |
| (5) | Investment, or portion of investment, has been pledged to collateralize the net payment obligations for investments in inverse floating rate transactions. |
| N/R | Not rated. |
| WI/DD | Purchased on a when-issued or delayed delivery basis. |
| (IF) | Inverse floating rate investment. |
| 144A | Investment is exempt from registration under Rule 144A of the Securities Act of 1933, as amended. These investments may only be resold in transactions exempt from registration, which are normally those transactions with qualified institutional buyers. |
See accompanying notes to financial statements.
| 72 | Nuveen Investments |
Statement of Assets and Liabilities
May 31, 2011
| Kansas | Kentucky | Michigan | Missouri | Ohio | Wisconsin | |||||||||||||||||||
Assets | ||||||||||||||||||||||||
Investments, at value (cost $172,436,658, $387,838,087, $190,541,543, $224,774,105, $442,434,843, and $70,434,665, respectively) | $ | 176,860,682 | $ | 397,110,637 | $ | 197,274,635 | $ | 227,355,967 | $ | 455,589,129 | $ | 71,924,480 | ||||||||||||
Cash | — | — | 348,636 | — | 3,034,864 | 984,373 | ||||||||||||||||||
Receivables: | ||||||||||||||||||||||||
Interest | 2,111,666 | 5,143,165 | 1,863,167 | 3,141,587 | 8,987,776 | 1,197,985 | ||||||||||||||||||
Investments sold | 1,145,000 | — | — | 217,695 | 636,625 | 35,000 | ||||||||||||||||||
Shares sold | 276,796 | 159,988 | 81,973 | 399,436 | 491,243 | 68,737 | ||||||||||||||||||
Other assets | 30 | 61,106 | 33,304 | 21,547 | 74,862 | 11 | ||||||||||||||||||
Total assets | 180,394,174 | 402,474,896 | 199,601,715 | 231,136,232 | 468,814,499 | 74,210,586 | ||||||||||||||||||
Liabilities | ||||||||||||||||||||||||
Cash overdraft | 464,424 | 820,808 | — | 426,305 | — | — | ||||||||||||||||||
Floating rate obligations | 8,285,000 | — | — | 2,225,000 | — | — | ||||||||||||||||||
Payables: | ||||||||||||||||||||||||
Dividends | 195,737 | 497,904 | 307,932 | 277,603 | 667,189 | 71,370 | ||||||||||||||||||
Investments purchased | — | — | 787,964 | 486,560 | 1,612,523 | 974,590 | ||||||||||||||||||
Shares redeemed | 226,216 | 634,556 | 189,447 | 431,598 | 646,980 | 83,469 | ||||||||||||||||||
Accrued expenses: | ||||||||||||||||||||||||
Management fees | 76,130 | 175,704 | 87,858 | 100,455 | 210,355 | 32,151 | ||||||||||||||||||
12b-1 distribution and service fees | 44,856 | 92,264 | 44,704 | 50,058 | 89,466 | 13,760 | ||||||||||||||||||
Other | 65,132 | 192,898 | 122,105 | 105,305 | 255,111 | 45,410 | ||||||||||||||||||
Total liabilities | 9,357,495 | 2,414,134 | 1,540,010 | 4,102,884 | 3,481,624 | 1,220,750 | ||||||||||||||||||
Net assets | $ | 171,036,679 | $ | 400,060,762 | $ | 198,061,705 | $ | 227,033,348 | $ | 465,332,875 | $ | 72,989,836 | ||||||||||||
Class A Shares | ||||||||||||||||||||||||
Net assets | $ | 122,629,433 | $ | 334,808,887 | $ | 148,019,667 | $ | 187,843,697 | $ | 292,693,950 | $ | 45,101,400 | ||||||||||||
Shares outstanding | 11,822,075 | 31,307,916 | 13,355,060 | 17,556,844 | 26,594,441 | 4,386,075 | ||||||||||||||||||
Net asset value per share | $ | 10.37 | $ | 10.69 | $ | 11.08 | $ | 10.70 | $ | 11.01 | $ | 10.28 | ||||||||||||
Offering price per share (net asset value per share plus maximum sales charge of 4.20% of offering price) | $ | 10.82 | $ | 11.16 | $ | 11.57 | $ | 11.17 | $ | 11.49 | $ | 10.73 | ||||||||||||
Class B Shares | ||||||||||||||||||||||||
Net assets | $ | 895,091 | $ | 2,464,750 | $ | 964,067 | $ | 1,117,032 | $ | 2,821,063 | $ | 548,108 | ||||||||||||
Shares outstanding | 87,075 | 230,359 | 86,842 | 104,319 | 256,869 | 53,183 | ||||||||||||||||||
Net asset value and offering price per share | $ | 10.28 | $ | 10.70 | $ | 11.10 | $ | 10.71 | $ | 10.98 | $ | 10.31 | ||||||||||||
Class C Shares | ||||||||||||||||||||||||
Net assets | $ | 36,863,905 | $ | 51,820,436 | $ | 29,681,407 | $ | 26,957,537 | $ | 60,015,553 | $ | 9,104,611 | ||||||||||||
Shares outstanding | 3,556,586 | 4,842,781 | 2,679,714 | 2,523,656 | 5,471,362 | 884,289 | ||||||||||||||||||
Net asset value and offering price per share | $ | 10.36 | $ | 10.70 | $ | 11.08 | $ | 10.68 | $ | 10.97 | $ | 10.30 | ||||||||||||
Class I Shares | ||||||||||||||||||||||||
Net assets | $ | 10,648,250 | $ | 10,966,689 | $ | 19,396,564 | $ | 11,115,082 | $ | 109,802,309 | $ | 18,235,717 | ||||||||||||
Shares outstanding | 1,022,175 | 1,025,112 | 1,751,153 | 1,039,208 | 10,003,750 | 1,768,371 | ||||||||||||||||||
Net asset value and offering price per share | $ | 10.42 | $ | 10.70 | $ | 11.08 | $ | 10.70 | $ | 10.98 | $ | 10.31 | ||||||||||||
Net assets consist of: | ||||||||||||||||||||||||
Capital paid-in | $ | 167,737,846 | $ | 395,148,494 | $ | 194,267,915 | $ | 224,875,238 | $ | 454,978,586 | $ | 71,965,151 | ||||||||||||
Undistributed (Over-distribution of) net investment income | 293,786 | (6,132 | ) | 95,887 | 855,161 | 1,678,087 | 25,819 | |||||||||||||||||
Accumulated net realized gain (loss) | (1,418,977 | ) | (4,354,150 | ) | (3,035,189 | ) | (1,278,913 | ) | (4,478,084 | ) | (490,949 | ) | ||||||||||||
Net unrealized appreciation (depreciation) | 4,424,024 | 9,272,550 | 6,733,092 | 2,581,862 | 13,154,286 | 1,489,815 | ||||||||||||||||||
Net assets | $ | 171,036,679 | $ | 400,060,762 | $ | 198,061,705 | $ | 227,033,348 | $ | 465,332,875 | $ | 72,989,836 | ||||||||||||
Authorized shares | Unlimited | Unlimited | Unlimited | Unlimited | Unlimited | Unlimited | ||||||||||||||||||
Par value per share | $ | 0.01 | $ | 0.01 | $ | 0.01 | $ | 0.01 | $ | 0.01 | $ | 0.01 | ||||||||||||
See accompanying notes to financial statements.
| Nuveen Investments | 73 |
Year Ended May 31, 2011
| Kansas | Kentucky | Michigan | Missouri | Ohio | Wisconsin | |||||||||||||||||||
Investment Income | $ | 8,635,885 | $ | 21,690,893 | $ | 10,235,312 | $ | 12,397,005 | $ | 25,550,749 | $ | 2,968,400 | ||||||||||||
Expenses | ||||||||||||||||||||||||
Management fees | 922,654 | 2,220,169 | 1,067,418 | 1,229,763 | 2,530,636 | 336,308 | ||||||||||||||||||
12b-1 service fees – Class A | 244,133 | 720,577 | 302,508 | 386,714 | 620,892 | 94,530 | ||||||||||||||||||
12b-1 distribution and service fees – Class B | 14,137 | 35,590 | 11,837 | 14,766 | 37,274 | 9,497 | ||||||||||||||||||
12b-1 distribution and service fees – Class C | 274,563 | 414,634 | 226,122 | 207,001 | 468,947 | 70,469 | ||||||||||||||||||
Shareholders’ servicing agent fees and expenses | 66,080 | 160,651 | 104,183 | 87,800 | 243,795 | 29,034 | ||||||||||||||||||
Interest expense on floating rate obligations | 9,294 | — | — | 10,019 | — | — | ||||||||||||||||||
Custodian’s fees and expenses | 36,721 | 82,606 | 43,120 | 49,206 | 101,121 | 17,362 | ||||||||||||||||||
Trustees’ fees and expenses | 4,186 | 10,256 | 4,841 | 5,606 | 11,689 | 1,514 | ||||||||||||||||||
Professional fees | 19,501 | 28,098 | 21,282 | 21,566 | 29,883 | 16,289 | ||||||||||||||||||
Shareholders’ reports – printing and mailing expenses | 23,824 | 48,681 | 32,209 | 29,301 | 71,070 | 11,122 | ||||||||||||||||||
Federal and state registration fees | 6,624 | 5,866 | 11,744 | 8,600 | 7,574 | 12,014 | ||||||||||||||||||
Other expenses | 5,002 | 14,570 | 6,945 | 8,166 | 17,168 | 2,523 | ||||||||||||||||||
Total expenses before custodian fee credit | 1,626,719 | 3,741,698 | 1,832,209 | 2,058,508 | 4,140,049 | 600,662 | ||||||||||||||||||
Custodian fee credit | (5,933 | ) | (2,473 | ) | (1,029 | ) | (3,657 | ) | (1,125 | ) | (2,036 | ) | ||||||||||||
Net expenses | 1,620,786 | 3,739,225 | 1,831,180 | 2,054,851 | 4,138,924 | 598,626 | ||||||||||||||||||
Net investment income (loss) | 7,015,099 | 17,951,668 | 8,404,132 | 10,342,154 | 21,411,825 | 2,369,774 | ||||||||||||||||||
Realized and Unrealized Gain (Loss) | ||||||||||||||||||||||||
Net realized gain (loss) from investments | (390,853 | ) | 1,150,771 | 611,209 | 447,590 | (3,481,898 | ) | (438,486 | ) | |||||||||||||||
Change in net unrealized appreciation (depreciation) of investments | (2,096,205 | ) | (8,667,600 | ) | (2,948,195 | ) | (3,965,953 | ) | (6,209,949 | ) | (53,257 | ) | ||||||||||||
Net realized and unrealized gain (loss) | (2,487,058 | ) | (7,516,829 | ) | (2,336,986 | ) | (3,518,363 | ) | (9,691,847 | ) | (491,743 | ) | ||||||||||||
Net increase (decrease) in net assets from operations | $ | 4,528,041 | $ | 10,434,839 | $ | 6,067,146 | $ | 6,823,791 | $ | 11,719,978 | $ | 1,878,031 | ||||||||||||
See accompanying notes to financial statements.
| 74 | Nuveen Investments |
Statement of Changes in Net Assets
| Kansas | Kentucky | |||||||||||||||
| Year Ended 5/31/11 | Year Ended 5/31/10 | Year Ended 5/31/11 | Year Ended 5/31/10 | |||||||||||||
Operations | ||||||||||||||||
Net investment income (loss) | $ | 7,015,099 | $ | 6,465,176 | $ | 17,951,668 | $ | 17,392,301 | ||||||||
Net realized gain (loss) from investments | (390,853 | ) | (160,687 | ) | 1,150,771 | 325,917 | ||||||||||
Change in net unrealized appreciation (depreciation) of investments | (2,096,205 | ) | 6,712,183 | (8,667,600 | ) | 17,907,653 | ||||||||||
Net increase (decrease) in net assets from operations | 4,528,041 | 13,016,672 | 10,434,839 | 35,625,871 | ||||||||||||
Distributions to Shareholders | ||||||||||||||||
From net investment income: | ||||||||||||||||
Class A | (5,015,396 | ) | (4,821,290 | ) | (14,908,075 | ) | (14,960,317 | ) | ||||||||
Class B | (50,274 | ) | (87,681 | ) | (126,624 | ) | (203,289 | ) | ||||||||
Class C | (1,314,958 | ) | (1,073,180 | ) | (1,983,317 | ) | (1,841,966 | ) | ||||||||
Class I | (623,380 | ) | (288,438 | ) | (408,545 | ) | (258,143 | ) | ||||||||
From accumulated net realized gains: | ||||||||||||||||
Class A | — | — | — | (13,520 | ) | |||||||||||
Class B | — | — | — | (230 | ) | |||||||||||
Class C | — | — | — | �� | (1,956 | ) | ||||||||||
Class I | — | — | — | (268 | ) | |||||||||||
Decrease in net assets from distributions to shareholders | (7,004,008 | ) | (6,270,589 | ) | (17,426,561 | ) | (17,279,689 | ) | ||||||||
Fund Share Transactions | ||||||||||||||||
Proceeds from sale of shares | 43,211,178 | 34,865,833 | 36,846,739 | 56,805,397 | ||||||||||||
Proceeds from shares issued to shareholders due to reinvestment of distributions | 4,589,760 | 3,910,291 | 11,126,031 | 10,899,805 | ||||||||||||
| 47,800,938 | 38,776,124 | 47,972,770 | 67,705,202 | |||||||||||||
Cost of shares redeemed | (38,447,078 | ) | (25,521,698 | ) | (85,628,061 | ) | (46,304,534 | ) | ||||||||
Net increase (decrease) in net assets from Fund share transactions | 9,353,860 | 13,254,426 | (37,655,291 | ) | 21,400,668 | |||||||||||
Net increase (decrease) in net assets | 6,877,893 | 20,000,509 | (44,647,013 | ) | 39,746,850 | |||||||||||
Net assets at the beginning of year | 164,158,786 | 144,158,277 | 444,707,775 | 404,960,925 | ||||||||||||
Net assets at the end of year | $ | 171,036,679 | $ | 164,158,786 | $ | 400,060,762 | $ | 444,707,775 | ||||||||
Undistributed (Over-distribution of) net investment income at the end of year | $ | 293,786 | $ | 303,390 | $ | (6,132 | ) | $ | (524,576 | ) | ||||||
See accompanying notes to financial statements.
| Nuveen Investments | 75 |
Statement of Changes in Net Assets (continued)
| Michigan | Missouri | |||||||||||||||
| Year Ended 5/31/11 | Year Ended 5/31/10 | Year Ended 5/31/11 | Year Ended 5/31/10 | |||||||||||||
Operations | ||||||||||||||||
Net investment income (loss) | $ | 8,404,132 | $ | 8,605,797 | $ | 10,342,154 | $ | 10,175,321 | ||||||||
Net realized gain (loss) from investments | 611,209 | (1,088,365 | ) | 447,590 | 164,646 | |||||||||||
Change in net unrealized appreciation (depreciation) of investments | (2,948,195 | ) | 7,839,801 | (3,965,953 | ) | 14,260,142 | ||||||||||
Net increase (decrease) in net assets from operations | 6,067,146 | 15,357,233 | 6,823,791 | 24,600,109 | ||||||||||||
Distributions to Shareholders | ||||||||||||||||
From net investment income: | ||||||||||||||||
Class A | (6,219,392 | ) | (6,578,417 | ) | (8,455,392 | ) | (8,462,326 | ) | ||||||||
Class B | (42,077 | ) | (73,876 | ) | (56,348 | ) | (105,103 | ) | ||||||||
Class C | (1,077,189 | ) | (1,133,807 | ) | (1,056,040 | ) | (976,066 | ) | ||||||||
Class I | (855,791 | ) | (834,182 | ) | (513,123 | ) | (373,096 | ) | ||||||||
From accumulated net realized gains: | ||||||||||||||||
Class A | — | — | — | — | ||||||||||||
Class B | — | — | — | — | ||||||||||||
Class C | — | — | — | — | ||||||||||||
Class I | — | — | — | — | ||||||||||||
Decrease in net assets from distributions to shareholders | (8,194,449 | ) | (8,620,282 | ) | (10,080,903 | ) | (9,916,591 | ) | ||||||||
Fund Share Transactions | ||||||||||||||||
Proceeds from sale of shares | 25,750,124 | 26,755,273 | 33,628,688 | 32,749,440 | ||||||||||||
Proceeds from shares issued to shareholders due to reinvestment of distributions | 4,335,820 | 4,438,205 | 6,536,909 | 6,273,344 | ||||||||||||
| 30,085,944 | 31,193,478 | 40,165,597 | 39,022,784 | |||||||||||||
Cost of shares redeemed | (41,304,933 | ) | (31,597,977 | ) | (45,479,079 | ) | (33,847,515 | ) | ||||||||
Net increase (decrease) in net assets from Fund share transactions | (11,218,989 | ) | (404,499 | ) | (5,313,482 | ) | 5,175,269 | |||||||||
Net increase (decrease) in net assets | (13,346,292 | ) | 6,332,452 | (8,570,594 | ) | 19,858,787 | ||||||||||
Net assets at the beginning of year | 211,407,997 | 205,075,545 | 235,603,942 | 215,745,155 | ||||||||||||
Net assets at the end of year | $ | 198,061,705 | $ | 211,407,997 | $ | 227,033,348 | $ | 235,603,942 | ||||||||
Undistributed (Over-distribution of) net investment income at the end of year | $ | 95,887 | $ | (112,556 | ) | $ | 855,161 | $ | 593,934 | |||||||
See accompanying notes to financial statements.
| 76 | Nuveen Investments |
| Ohio | Wisconsin | |||||||||||||||
| Year Ended 5/31/11 | Year Ended 5/31/10 | Year Ended 5/31/11 | Year Ended 5/31/10 | |||||||||||||
Operations | ||||||||||||||||
Net investment income (loss) | $ | 21,411,825 | $ | 21,885,258 | $ | 2,369,774 | $ | 2,192,416 | ||||||||
Net realized gain (loss) from investments | (3,481,898 | ) | 594,431 | (438,486 | ) | 16,505 | ||||||||||
Change in net unrealized appreciation (depreciation) of investments | (6,209,949 | ) | 17,295,527 | (53,257 | ) | 2,551,862 | ||||||||||
Net increase (decrease) in net assets from operations | 11,719,978 | 39,775,216 | 1,878,031 | 4,760,783 | ||||||||||||
Distributions to Shareholders | ||||||||||||||||
From net investment income: | ||||||||||||||||
Class A | (13,193,242 | ) | (13,615,693 | ) | (1,769,900 | ) | (1,814,117 | ) | ||||||||
Class B | (137,109 | ) | (210,115 | ) | (29,877 | ) | (43,105 | ) | ||||||||
Class C | (2,325,318 | ) | (2,101,098 | ) | (301,821 | ) | (266,604 | ) | ||||||||
Class I | (5,073,430 | ) | (4,965,498 | ) | (220,506 | ) | (84,078 | ) | ||||||||
From accumulated net realized gains: | ||||||||||||||||
Class A | — | — | — | — | ||||||||||||
Class B | — | — | — | — | ||||||||||||
Class C | — | — | — | — | ||||||||||||
Class I | — | — | — | — | ||||||||||||
Decrease in net assets from distributions to shareholders | (20,729,099 | ) | (20,892,404 | ) | (2,322,104 | ) | (2,207,904 | ) | ||||||||
Fund Share Transactions | ||||||||||||||||
Proceeds from sale of shares | 49,983,840 | 57,755,283 | 24,383,081 | 10,855,276 | ||||||||||||
Proceeds from shares issued to shareholders due to reinvestment of distributions | 11,881,711 | 11,732,543 | 1,587,318 | 1,501,435 | ||||||||||||
| 61,865,551 | 69,487,826 | 25,970,399 | 12,356,711 | |||||||||||||
Cost of shares redeemed | (101,310,911 | ) | (65,872,407 | ) | (16,123,179 | ) | (8,334,065 | ) | ||||||||
Net increase (decrease) in net assets from Fund share transactions | (39,445,360 | ) | 3,615,419 | 9,847,220 | 4,022,646 | |||||||||||
Net increase (decrease) in net assets | (48,454,481 | ) | 22,498,231 | 9,403,147 | 6,575,525 | |||||||||||
Net assets at the beginning of year | 513,787,356 | 491,289,125 | 63,586,689 | 57,011,164 | ||||||||||||
Net assets at the end of year | $ | 465,332,875 | $ | 513,787,356 | $ | 72,989,836 | $ | 63,586,689 | ||||||||
Undistributed (Over-distribution of) net investment income at the end of year | $ | 1,678,087 | $ | 1,121,036 | $ | 25,819 | $ | (21,604 | ) | |||||||
See accompanying notes to financial statements.
| Nuveen Investments | 77 |
| Selected data for a share outstanding throughout each period: | ||||||||||||||||||||||||||||||||||||
| Class (Commencement Date) | ||||||||||||||||||||||||||||||||||||
| Investment Operations | Less Distributions | |||||||||||||||||||||||||||||||||||
| KANSAS | ||||||||||||||||||||||||||||||||||||
| Year Ended May 31, | Beginning Net Asset Value | Net Invest- ment Income (Loss)(a) | Net Realized/ Unrealized Gain (Loss) | Total | Net Invest- ment Income | Capital Gains(b) | Total | Ending Net Asset Value | Total Return(c) | |||||||||||||||||||||||||||
Class A (1/92) |
| |||||||||||||||||||||||||||||||||||
2011 | $ | 10.48 | $ | .43 | $ | (.11 | ) | $ | .32 | $ | (.43 | ) | $ | — | $ | (.43 | ) | $ | 10.37 | 3.10 | % | |||||||||||||||
2010 | 10.03 | .44 | .44 | .88 | (.43 | ) | — | (.43 | ) | 10.48 | 8.67 | |||||||||||||||||||||||||
2009 | 10.23 | .43 | (.20 | ) | .23 | (.43 | ) | — | (.43 | ) | 10.03 | 2.62 | ||||||||||||||||||||||||
2008 | 10.40 | .43 | (.16 | ) | .27 | (.42 | ) | (.02 | ) | (.44 | ) | 10.23 | 2.70 | |||||||||||||||||||||||
2007 | 10.38 | .42 | .01 | .43 | (.41 | ) | — | (.41 | ) | 10.40 | 4.22 | |||||||||||||||||||||||||
Class B (2/97) |
| |||||||||||||||||||||||||||||||||||
2011 | 10.39 | .34 | (.10 | ) | .24 | (.35 | ) | — | (.35 | ) | 10.28 | 2.35 | ||||||||||||||||||||||||
2010 | 9.94 | .36 | .44 | .80 | (.35 | ) | — | (.35 | ) | 10.39 | 7.92 | |||||||||||||||||||||||||
2009 | 10.14 | .35 | (.20 | ) | .15 | (.35 | ) | — | (.35 | ) | 9.94 | 1.82 | ||||||||||||||||||||||||
2008 | 10.31 | .35 | (.16 | ) | .19 | (.34 | ) | (.02 | ) | (.36 | ) | 10.14 | 1.95 | |||||||||||||||||||||||
2007 | 10.30 | .34 | .01 | .35 | (.34 | ) | — | (.34 | ) | 10.31 | 3.38 | |||||||||||||||||||||||||
Class C (2/97) |
| |||||||||||||||||||||||||||||||||||
2011 | 10.48 | .37 | (.12 | ) | .25 | (.37 | ) | — | (.37 | ) | 10.36 | 2.47 | ||||||||||||||||||||||||
2010 | 10.03 | .38 | .44 | .82 | (.37 | ) | — | (.37 | ) | 10.48 | 8.10 | |||||||||||||||||||||||||
2009 | 10.23 | .38 | (.21 | ) | .17 | (.37 | ) | — | (.37 | ) | 10.03 | 2.05 | ||||||||||||||||||||||||
2008 | 10.40 | .37 | (.15 | ) | .22 | (.37 | ) | (.02 | ) | (.39 | ) | 10.23 | 2.17 | |||||||||||||||||||||||
2007 | 10.38 | .37 | .01 | .38 | (.36 | ) | — | (.36 | ) | 10.40 | 3.69 | |||||||||||||||||||||||||
Class I (2/97)(f) |
| |||||||||||||||||||||||||||||||||||
2011 | 10.53 | .45 | (.11 | ) | .34 | (.45 | ) | — | (.45 | ) | 10.42 | 3.32 | ||||||||||||||||||||||||
2010 | 10.07 | .46 | .45 | .91 | (.45 | ) | — | (.45 | ) | 10.53 | 8.96 | |||||||||||||||||||||||||
2009 | 10.27 | .45 | (.20 | ) | .25 | (.45 | ) | — | (.45 | ) | 10.07 | 2.82 | ||||||||||||||||||||||||
2008 | 10.45 | .45 | (.16 | ) | .29 | (.45 | ) | (.02 | ) | (.47 | ) | 10.27 | 2.83 | |||||||||||||||||||||||
2007 | 10.42 | .45 | .02 | .47 | (.44 | ) | — | (.44 | ) | 10.45 | 4.54 | |||||||||||||||||||||||||
| 78 | Nuveen Investments |
| Ratios/Supplemental Data | ||||||||||||||||||
| Ratios to Average Net Assets(d) | ||||||||||||||||||
| Ending Net Assets (000) | Expenses Including Interest(e) | Expenses Excluding Interest | Net Invest- ment Income | Portfolio Turnover Rate | ||||||||||||||
| $ | 122,629 | .83 | % | .82 | % | 4.12 | % | 16 | % | |||||||||
| 120,162 | .84 | .84 | 4.27 | 18 | ||||||||||||||
| 110,130 | .85 | .85 | 4.38 | 13 | ||||||||||||||
| 94,259 | .87 | .87 | 4.12 | 16 | ||||||||||||||
| 97,477 | .85 | .85 | 4.03 | 22 | ||||||||||||||
| 895 | 1.58 | 1.57 | 3.35 | 16 | ||||||||||||||
| 2,089 | 1.59 | 1.59 | 3.53 | 18 | ||||||||||||||
| 3,389 | 1.60 | 1.60 | 3.62 | 13 | ||||||||||||||
| 4,721 | 1.62 | 1.62 | 3.37 | 16 | ||||||||||||||
| 5,840 | 1.61 | 1.61 | 3.28 | 22 | ||||||||||||||
| 36,864 | 1.38 | 1.37 | 3.58 | 16 | ||||||||||||||
| 33,948 | 1.39 | 1.39 | 3.71 | 18 | ||||||||||||||
| 25,570 | 1.40 | 1.40 | 3.83 | 13 | ||||||||||||||
| 21,090 | 1.42 | 1.42 | 3.57 | 16 | ||||||||||||||
| 21,767 | 1.40 | 1.40 | 3.48 | 22 | ||||||||||||||
| 10,648 | .63 | .62 | 4.29 | 16 | ||||||||||||||
| 7,960 | .64 | .64 | 4.47 | 18 | ||||||||||||||
| 5,069 | .65 | .65 | 4.58 | 13 | ||||||||||||||
| 4,293 | .67 | .67 | 4.31 | 16 | ||||||||||||||
| 3,264 | .65 | .65 | 4.23 | 22 | ||||||||||||||
| (a) | Per share Net Investment Income (Loss) is calculated using the average daily shares method. |
| (b) | Distributions from Capital Gains include short-term capital gains, if any. |
| (c) | Total return is the combination of changes in net asset value without any sales charge, reinvested dividend income at net asset value and reinvested capital gains distributions at net asset value, if any. Total returns are not annualized. |
| (d) | Ratios do not reflect the effect of custodian fee credits earned on the Fund’s net cash on deposit with the custodian bank, where applicable. |
| (e) | The expense ratios reflect, among other things, the interest expense deemed to have been paid by the Fund on the floating rate certificates issued by the special purpose trusts for the self-deposited inverse floaters held by the Fund, where applicable, as described in Footnote 1 – General Information and Significant Accounting Policies, Inverse Floating Rate Securities. |
| (f) | Effective May 1, 2008, Class R Shares were renamed Class I Shares. |
See accompanying notes to financial statements.
| Nuveen Investments | 79 |
Financial Highlights (continued)
| Selected data for a share outstanding throughout each period: | ||||||||||||||||||||||||||||||||||||
| Class (Commencement Date) | ||||||||||||||||||||||||||||||||||||
| Investment Operations | Less Distributions | |||||||||||||||||||||||||||||||||||
| KENTUCKY | ||||||||||||||||||||||||||||||||||||
| Year Ended May 31, | Beginning Net Asset Value | Net Invest- ment Income (Loss)(a) | Net Gain | Total | Net | Capital Gains(b) | Total | Ending Net Asset Value | Total Return(c) | |||||||||||||||||||||||||||
Class A (5/87) |
| |||||||||||||||||||||||||||||||||||
2011 | $ | 10.85 | $ | .46 | $ | (.18 | ) | $ | .28 | $ | (.44 | ) | $ | — | $ | (.44 | ) | $ | 10.69 | 2.68 | % | |||||||||||||||
2010 | 10.39 | .44 | .46 | .90 | (.44 | ) | — | * | (.44 | ) | 10.85 | 8.81 | ||||||||||||||||||||||||
2009 | 10.78 | .44 | (.32 | ) | .12 | (.44 | ) | (.07 | ) | (.51 | ) | 10.39 | 1.33 | |||||||||||||||||||||||
2008 | 10.96 | .44 | (.16 | ) | .28 | (.44 | ) | (.02 | ) | (.46 | ) | 10.78 | 2.63 | |||||||||||||||||||||||
2007 | 10.96 | .44 | .03 | .47 | (.45 | ) | (.02 | ) | (.47 | ) | 10.96 | 4.35 | ||||||||||||||||||||||||
Class B (2/97) |
| |||||||||||||||||||||||||||||||||||
2011 | 10.85 | .38 | (.16 | ) | .22 | (.37 | ) | — | (.37 | ) | 10.70 | 2.03 | ||||||||||||||||||||||||
2010 | 10.40 | .36 | .45 | .81 | (.36 | ) | — | * | (.36 | ) | 10.85 | 7.91 | ||||||||||||||||||||||||
2009 | 10.79 | .36 | (.32 | ) | .04 | (.36 | ) | (.07 | ) | (.43 | ) | 10.40 | .56 | |||||||||||||||||||||||
2008 | 10.97 | .36 | (.17 | ) | .19 | (.35 | ) | (.02 | ) | (.37 | ) | 10.79 | 1.85 | |||||||||||||||||||||||
2007 | 10.97 | .36 | .03 | .39 | (.37 | ) | (.02 | ) | (.39 | ) | 10.97 | 3.56 | ||||||||||||||||||||||||
Class C (10/93) |
| |||||||||||||||||||||||||||||||||||
2011 | 10.85 | .40 | (.16 | ) | .24 | (.39 | ) | — | (.39 | ) | 10.70 | 2.22 | ||||||||||||||||||||||||
2010 | 10.39 | .38 | .46 | .84 | (.38 | ) | — | * | (.38 | ) | 10.85 | 8.20 | ||||||||||||||||||||||||
2009 | 10.79 | .38 | (.33 | ) | .05 | (.38 | ) | (.07 | ) | (.45 | ) | 10.39 | .64 | |||||||||||||||||||||||
2008 | 10.96 | .38 | (.15 | ) | .23 | (.38 | ) | (.02 | ) | (.40 | ) | 10.79 | 2.15 | |||||||||||||||||||||||
2007 | 10.96 | .38 | .02 | .40 | (.38 | ) | (.02 | ) | (.40 | ) | 10.96 | 3.73 | ||||||||||||||||||||||||
Class I (2/97)(f) |
| |||||||||||||||||||||||||||||||||||
2011 | 10.85 | .48 | (.16 | ) | .32 | (.47 | ) | — | (.47 | ) | 10.70 | 3.01 | ||||||||||||||||||||||||
2010 | 10.39 | .47 | .45 | .92 | (.46 | ) | — | * | (.46 | ) | 10.85 | 9.00 | ||||||||||||||||||||||||
2009 | 10.79 | .46 | (.33 | ) | .13 | (.46 | ) | (.07 | ) | (.53 | ) | 10.39 | 1.41 | |||||||||||||||||||||||
2008 | 10.96 | .46 | (.15 | ) | .31 | (.46 | ) | (.02 | ) | (.48 | ) | 10.79 | 2.90 | |||||||||||||||||||||||
2007 | 10.96 | .47 | .02 | .49 | (.47 | ) | (.02 | ) | (.49 | ) | 10.96 | 4.52 | ||||||||||||||||||||||||
| 80 | Nuveen Investments |
| Ratios/Supplemental Data | ||||||||||||||||||
| Ratios to Average Net Assets(d) | ||||||||||||||||||
| Ending Net Assets (000) | Expenses Including Interest(e) | Expenses Excluding Interest | Net Invest- ment Income | Portfolio Turnover Rate | ||||||||||||||
| $ | 334,809 | .80 | % | .80 | % | 4.26 | % | 7 | % | |||||||||
| 376,621 | .81 | .81 | 4.15 | 9 | ||||||||||||||
| 346,849 | .85 | .82 | 4.28 | 19 | ||||||||||||||
| 362,734 | .89 | .83 | 4.04 | 8 | ||||||||||||||
| 392,262 | .90 | .82 | �� | 4.00 | 9 | |||||||||||||
| 2,465 | 1.55 | 1.55 | 3.49 | 7 | ||||||||||||||
| 5,119 | 1.56 | 1.56 | 3.40 | 9 | ||||||||||||||
| 7,289 | 1.60 | 1.57 | 3.52 | 19 | ||||||||||||||
| 9,685 | 1.64 | 1.58 | 3.29 | 8 | ||||||||||||||
| 13,466 | 1.65 | 1.57 | 3.26 | 9 | ||||||||||||||
| 51,820 | 1.35 | 1.35 | 3.71 | 7 | ||||||||||||||
| 55,515 | 1.36 | 1.36 | 3.59 | 9 | ||||||||||||||
| 47,428 | 1.40 | 1.37 | 3.73 | 19 | ||||||||||||||
| 46,588 | 1.44 | 1.38 | 3.49 | 8 | ||||||||||||||
| 46,650 | 1.45 | 1.37 | 3.45 | 9 | ||||||||||||||
| 10,967 | .60 | .60 | 4.46 | 7 | ||||||||||||||
| 7,453 | .61 | .61 | 4.35 | 9 | ||||||||||||||
| 3,394 | .65 | .62 | 4.48 | 19 | ||||||||||||||
| 2,891 | .69 | .63 | 4.24 | 8 | ||||||||||||||
| 3,069 | .70 | .62 | 4.20 | 9 | ||||||||||||||
| (a) | Per share Net Investment Income (Loss) is calculated using the average daily shares method. |
| (b) | Distributions from Capital Gains include short-term capital gains, if any. |
| (c) | Total return is the combination of changes in net asset value without any sales charge, reinvested dividend income at net asset value and reinvested capital gains distributions at net asset value, if any. Total returns are not annualized. |
| (d) | Ratios do not reflect the effect of custodian fee credits earned on the Fund’s net cash on deposit with the custodian bank, where applicable. |
| (e) | The expense ratios reflect, among other things, the interest expense deemed to have been paid by the Fund on the floating rate certificates issued by the special purpose trusts for the self-deposited inverse floaters held by the Fund, where applicable, as described in Footnote 1 – General Information and Significant Accounting Policies, Inverse Floating Rate Securities. |
| (f) | Effective May 1, 2008, Class R Shares were renamed Class I Shares. |
| * | Rounds to less than $.01 per share. |
See accompanying notes to financial statements.
| Nuveen Investments | 81 |
Financial Highlights (continued)
| Selected data for a share outstanding throughout each period: | ||||||||||||||||||||||||||||||||||||
| Class (Commencement Date) | ||||||||||||||||||||||||||||||||||||
| Investment Operations | Less Distributions | |||||||||||||||||||||||||||||||||||
| MICHIGAN | ||||||||||||||||||||||||||||||||||||
| Year Ended May 31, | Beginning Net Asset Value | Net Invest- ment Income (Loss)(a) | Net Realized/ Unrealized Gain (Loss) | Total | Net Invest- ment Income | Capital Gains(b) | Total | Ending Net Asset Value | Total Return(c) | |||||||||||||||||||||||||||
Class A (6/85) |
| |||||||||||||||||||||||||||||||||||
2011 | $ | 11.19 | $ | .47 | $ | (.12 | ) | $ | .35 | $ | (.46 | ) | $ | — | $ | (.46 | ) | $ | 11.08 | 3.16 | % | |||||||||||||||
2010 | 10.83 | .46 | .36 | .82 | (.46 | ) | — | (.46 | ) | 11.19 | 7.73 | |||||||||||||||||||||||||
2009 | 11.15 | .47 | (.32 | ) | .15 | (.46 | ) | (.01 | ) | (.47 | ) | 10.83 | 1.59 | |||||||||||||||||||||||
2008 | 11.41 | .47 | (.23 | ) | .24 | (.47 | ) | (.03 | ) | (.50 | ) | 11.15 | 2.17 | |||||||||||||||||||||||
2007 | 11.45 | .47 | .07 | .54 | (.48 | ) | (.10 | ) | (.58 | ) | 11.41 | 4.70 | ||||||||||||||||||||||||
Class B (2/97) |
| |||||||||||||||||||||||||||||||||||
2011 | 11.21 | .38 | (.12 | ) | .26 | (.37 | ) | — | (.37 | ) | 11.10 | 2.41 | ||||||||||||||||||||||||
2010 | 10.86 | .38 | .35 | .73 | (.38 | ) | — | (.38 | ) | 11.21 | 6.86 | |||||||||||||||||||||||||
2009 | 11.17 | .40 | (.32 | ) | .08 | (.38 | ) | (.01 | ) | (.39 | ) | 10.86 | .94 | |||||||||||||||||||||||
2008 | 11.43 | .38 | (.22 | ) | .16 | (.39 | ) | (.03 | ) | (.42 | ) | 11.17 | 1.41 | |||||||||||||||||||||||
2007 | 11.48 | .39 | .05 | .44 | (.39 | ) | (.10 | ) | (.49 | ) | 11.43 | 3.85 | ||||||||||||||||||||||||
Class C (6/93) |
| |||||||||||||||||||||||||||||||||||
2011 | 11.18 | .41 | (.11 | ) | .30 | (.40 | ) | — | (.40 | ) | 11.08 | 2.70 | ||||||||||||||||||||||||
2010 | 10.83 | .40 | .35 | .75 | (.40 | ) | — | (.40 | ) | 11.18 | 7.05 | |||||||||||||||||||||||||
2009 | 11.15 | .42 | (.33 | ) | .09 | (.40 | ) | (.01 | ) | (.41 | ) | 10.83 | 1.04 | |||||||||||||||||||||||
2008 | 11.40 | .41 | (.23 | ) | .18 | (.40 | ) | (.03 | ) | (.43 | ) | 11.15 | 1.67 | |||||||||||||||||||||||
2007 | 11.44 | .41 | .06 | .47 | (.41 | ) | (.10 | ) | (.51 | ) | 11.40 | 4.11 | ||||||||||||||||||||||||
Class I (2/97)(f) |
| |||||||||||||||||||||||||||||||||||
2011 | 11.18 | .49 | (.11 | ) | .38 | (.48 | ) | — | (.48 | ) | 11.08 | 3.46 | ||||||||||||||||||||||||
2010 | 10.83 | .48 | .36 | .84 | (.49 | ) | — | (.49 | ) | 11.18 | 7.87 | |||||||||||||||||||||||||
2009 | 11.15 | .50 | (.32 | ) | .18 | (.49 | ) | (.01 | ) | (.50 | ) | 10.83 | 1.82 | |||||||||||||||||||||||
2008 | 11.41 | .49 | (.23 | ) | .26 | (.49 | ) | (.03 | ) | (.52 | ) | 11.15 | 2.39 | |||||||||||||||||||||||
2007 | 11.45 | .50 | .06 | .56 | (.50 | ) | (.10 | ) | (.60 | ) | 11.41 | 4.92 | ||||||||||||||||||||||||
| 82 | Nuveen Investments |
| Ratios/Supplemental Data | ||||||||||||||||||
| Ratios to Average Net Assets(d) | ||||||||||||||||||
| Ending Net Assets (000) | Expenses Including Interest(e) | Expenses Excluding Interest | Net Invest- ment Income | Portfolio Turnover Rate | ||||||||||||||
| $ | 148,020 | .84 | % | .84 | % | 4.22 | % | 6 | % | |||||||||
| 159,191 | .85 | .85 | 4.18 | 11 | ||||||||||||||
| 151,852 | .86 | .86 | 4.45 | 9 | ||||||||||||||
| 159,696 | .86 | .85 | 4.14 | 14 | ||||||||||||||
| 169,395 | .91 | .84 | 4.09 | 12 | ||||||||||||||
| 964 | 1.59 | 1.59 | 3.47 | 6 | ||||||||||||||
| 1,674 | 1.60 | 1.60 | 3.44 | 11 | ||||||||||||||
| 2,858 | 1.61 | 1.61 | 3.70 | 9 | ||||||||||||||
| 4,080 | 1.61 | 1.60 | 3.40 | 14 | ||||||||||||||
| 4,845 | 1.67 | 1.60 | 3.35 | 12 | ||||||||||||||
| 29,681 | 1.39 | 1.39 | 3.67 | 6 | ||||||||||||||
| 30,655 | 1.40 | 1.40 | 3.63 | 11 | ||||||||||||||
| 32,068 | 1.41 | 1.41 | 3.90 | 9 | ||||||||||||||
| 35,814 | 1.41 | 1.40 | 3.59 | 14 | ||||||||||||||
| 37,779 | 1.46 | 1.39 | 3.54 | 12 | ||||||||||||||
| 19,397 | .64 | .64 | 4.42 | 6 | ||||||||||||||
| 19,888 | .65 | .65 | 4.38 | 11 | ||||||||||||||
| 18,297 | .66 | .66 | 4.65 | 9 | ||||||||||||||
| 19,100 | .66 | .65 | 4.34 | 14 | ||||||||||||||
| 20,351 | .71 | .64 | 4.29 | 12 | ||||||||||||||
| (a) | Per share Net Investment Income (Loss) is calculated using the average daily shares method. |
| (b) | Distributions from Capital Gains include short-term capital gains, if any. |
| (c) | Total return is the combination of changes in net asset value without any sales charge, reinvested dividend income at net asset value and reinvested capital gains distributions at net asset value, if any. Total returns are not annualized. |
| (d) | Ratios do not reflect the effect of custodian fee credits earned on the Fund’s net cash on deposit with the custodian bank, where applicable. |
| (e) | The expense ratios reflect, among other things, the interest expense deemed to have been paid by the Fund on the floating rate certificates issued by the special purpose trusts for the self-deposited inverse floaters held by the Fund, where applicable, as described in Footnote 1 – General Information and Significant Accounting Policies, Inverse Floating Rate Securities. |
| (f) | Effective May 1, 2008, Class R Shares were renamed Class I Shares. |
See accompanying notes to financial statements.
| Nuveen Investments | 83 |
Financial Highlights (continued)
| Selected data for a share outstanding throughout each period: | ||||||||||||||||||||||||||||||||||||
| Class (Commencement Date) | ||||||||||||||||||||||||||||||||||||
| Investment Operations | Less Distributions | |||||||||||||||||||||||||||||||||||
| MISSOURI | ||||||||||||||||||||||||||||||||||||
| Year Ended May 31, | Beginning Net Asset Value | Net Invest- ment Income (Loss)(a) | Net Realized/ Unrealized Gain (Loss) | Total | Net Invest- ment Income | Capital Gains(b) | Total | Ending Net Asset Value | Total Return(c) | |||||||||||||||||||||||||||
Class A (8/87) |
| |||||||||||||||||||||||||||||||||||
2011 | $ | 10.82 | $ | .48 | $ | (.13 | ) | $ | .35 | $ | (.47 | ) | $ | — | $ | (.47 | ) | $ | 10.70 | 3.30 | % | |||||||||||||||
2010 | 10.14 | .48 | .66 | 1.14 | (.46 | ) | — | (.46 | ) | 10.82 | 11.49 | |||||||||||||||||||||||||
2009 | 10.73 | .47 | (.56 | ) | (.09 | ) | (.45 | ) | (.05 | ) | (.50 | ) | 10.14 | (.52 | ) | |||||||||||||||||||||
2008 | 11.03 | .45 | (.28 | ) | .17 | (.45 | ) | (.02 | ) | (.47 | ) | 10.73 | 1.59 | |||||||||||||||||||||||
2007 | 10.98 | .46 | .05 | .51 | (.45 | ) | (.01 | ) | (.46 | ) | 11.03 | 4.66 | ||||||||||||||||||||||||
Class B (2/97) |
| |||||||||||||||||||||||||||||||||||
2011 | 10.83 | .40 | (.13 | ) | .27 | (.39 | ) | — | (.39 | ) | 10.71 | 2.55 | ||||||||||||||||||||||||
2010 | 10.15 | .40 | .67 | 1.07 | (.39 | ) | — | (.39 | ) | 10.83 | 10.69 | |||||||||||||||||||||||||
2009 | 10.74 | .39 | (.55 | ) | (.16 | ) | (.38 | ) | (.05 | ) | (.43 | ) | 10.15 | (1.26 | ) | |||||||||||||||||||||
2008 | 11.04 | .37 | (.28 | ) | .09 | (.37 | ) | (.02 | ) | (.39 | ) | 10.74 | .81 | |||||||||||||||||||||||
2007 | 10.99 | .38 | .05 | .43 | (.37 | ) | (.01 | ) | (.38 | ) | 11.04 | 3.87 | ||||||||||||||||||||||||
Class C (2/94) |
| |||||||||||||||||||||||||||||||||||
2011 | 10.80 | .42 | (.13 | ) | .29 | (.41 | ) | — | (.41 | ) | 10.68 | 2.74 | ||||||||||||||||||||||||
2010 | 10.13 | .42 | .66 | 1.08 | (.41 | ) | — | (.41 | ) | 10.80 | 10.83 | |||||||||||||||||||||||||
2009 | 10.72 | .41 | (.55 | ) | (.14 | ) | (.40 | ) | (.05 | ) | (.45 | ) | 10.13 | (1.06 | ) | |||||||||||||||||||||
2008 | 11.02 | .39 | (.28 | ) | .11 | (.39 | ) | (.02 | ) | (.41 | ) | 10.72 | 1.03 | |||||||||||||||||||||||
2007 | 10.97 | .40 | .05 | .45 | (.39 | ) | (.01 | ) | (.40 | ) | 11.02 | 4.10 | ||||||||||||||||||||||||
Class I (2/97)(f) |
| |||||||||||||||||||||||||||||||||||
2011 | 10.82 | .50 | (.13 | ) | .37 | (.49 | ) | — | (.49 | ) | 10.70 | 3.52 | ||||||||||||||||||||||||
2010 | 10.14 | .50 | .67 | 1.17 | (.49 | ) | — | (.49 | ) | 10.82 | 11.74 | |||||||||||||||||||||||||
2009 | 10.73 | .49 | (.55 | ) | (.06 | ) | (.48 | ) | (.05 | ) | (.53 | ) | 10.14 | (.29 | ) | |||||||||||||||||||||
2008 | 11.03 | .47 | (.28 | ) | .19 | (.47 | ) | (.02 | ) | (.49 | ) | 10.73 | 1.81 | |||||||||||||||||||||||
2007 | 10.99 | .48 | .04 | .52 | (.47 | ) | (.01 | ) | (.48 | ) | 11.03 | 4.79 | ||||||||||||||||||||||||
| 84 | Nuveen Investments |
| Ratios/Supplemental Data | ||||||||||||||||||
| Ratios to Average Net Assets(d) | ||||||||||||||||||
| Ending Net Assets (000) | Expenses Including Interest(e) | Expenses Excluding Interest | Net Invest- ment Income | Portfolio Turnover Rate | ||||||||||||||
| $ | 187,844 | .82 | % | .82 | % | 4.48 | % | 6 | % | |||||||||
| 196,974 | .83 | .83 | 4.52 | 6 | ||||||||||||||
| 183,868 | .86 | .84 | 4.68 | 12 | ||||||||||||||
| 195,691 | .87 | .84 | 4.16 | 14 | ||||||||||||||
| 227,412 | .88 | .84 | 4.13 | 16 | ||||||||||||||
| 1,117 | 1.57 | 1.57 | 3.71 | 6 | ||||||||||||||
| 2,439 | 1.58 | 1.58 | 3.79 | 6 | ||||||||||||||
| 3,533 | 1.61 | 1.59 | 3.90 | 12 | ||||||||||||||
| 5,785 | 1.62 | 1.59 | 3.41 | 14 | ||||||||||||||
| 7,351 | 1.63 | 1.59 | 3.38 | 16 | ||||||||||||||
| 26,958 | 1.37 | 1.37 | 3.93 | 6 | ||||||||||||||
| 26,957 | 1.38 | 1.38 | 3.97 | 6 | ||||||||||||||
| 22,120 | 1.41 | 1.39 | 4.13 | 12 | ||||||||||||||
| 21,541 | 1.42 | 1.39 | 3.61 | 14 | ||||||||||||||
| 21,263 | 1.43 | 1.39 | 3.58 | 16 | ||||||||||||||
| 11,115 | .62 | .62 | 4.67 | 6 | ||||||||||||||
| 9,235 | .63 | .63 | 4.72 | 6 | ||||||||||||||
| 6,224 | .67 | .65 | 4.90 | 12 | ||||||||||||||
| 2,657 | .68 | .65 | 4.36 | 14 | ||||||||||||||
| 2,169 | .68 | .64 | 4.31 | 16 | ||||||||||||||
| (a) | Per share Net Investment Income (Loss) is calculated using the average daily shares method. |
| (b) | Distributions from Capital Gains include short-term capital gains, if any. |
| (c) | Total return is the combination of changes in net asset value without any sales charge, reinvested dividend income at net asset value and reinvested capital gains distributions at net asset value, if any. Total returns are not annualized. |
| (d) | Ratios do not reflect the effect of custodian fee credits earned on the Fund’s net cash on deposit with the custodian bank, where applicable. The Fund did not receive an expense reimbursement from the Adviser during the fiscal years ended 2007 through 2011. |
| (e) | The expense ratios reflect, among other things, the interest expense deemed to have been paid by the Fund on the floating rate certificates issued by the special purpose trusts for the self-deposited inverse floaters held by the Fund, where applicable, as described in Footnote 1 – General Information and Significant Accounting Policies, Inverse Floating Rate Securities. |
| (f) | Effective May 1, 2008, Class R Shares were renamed Class I Shares. |
See accompanying notes to financial statements.
| Nuveen Investments | 85 |
Financial Highlights (continued)
| Selected data for a share outstanding throughout each period: | ||||||||||||||||||||||||||||||||||||
| Class (Commencement Date) | ||||||||||||||||||||||||||||||||||||
| Investment Operations | Less Distributions | |||||||||||||||||||||||||||||||||||
| OHIO | ||||||||||||||||||||||||||||||||||||
| Year Ended May 31, | Beginning Net Asset Value | Net Invest- ment Income (Loss)(a) | Net Realized/ Unrealized Gain (Loss) | Total | Net Invest- ment Income | Capital Gains(b) | Total | Ending Net Asset Value | Total Return(c) | |||||||||||||||||||||||||||
Class A (6/85) |
| |||||||||||||||||||||||||||||||||||
2011 | $ | 11.18 | $ | .48 | $ | (.18 | ) | $ | .30 | $ | (.47 | ) | $ | — | $ | (.47 | ) | $ | 11.01 | 2.75 | % | |||||||||||||||
2010 | 10.77 | .48 | .39 | .87 | (.46 | ) | — | (.46 | ) | 11.18 | 8.18 | |||||||||||||||||||||||||
2009 | 10.99 | .47 | (.19 | ) | .28 | (.46 | ) | (.04 | ) | (.50 | ) | 10.77 | 2.75 | |||||||||||||||||||||||
2008 | 11.25 | .46 | (.19 | ) | .27 | (.46 | ) | (.07 | ) | (.53 | ) | 10.99 | 2.47 | |||||||||||||||||||||||
2007 | 11.27 | .47 | .01 | .48 | (.47 | ) | (.03 | ) | (.50 | ) | 11.25 | 4.30 | ||||||||||||||||||||||||
Class B (2/97) |
| |||||||||||||||||||||||||||||||||||
2011 | 11.16 | .40 | (.19 | ) | .21 | (.39 | ) | — | (.39 | ) | 10.98 | 1.90 | ||||||||||||||||||||||||
2010 | 10.75 | .39 | .40 | .79 | (.38 | ) | — | (.38 | ) | 11.16 | 7.41 | |||||||||||||||||||||||||
2009 | 10.97 | .39 | (.19 | ) | .20 | (.38 | ) | (.04 | ) | (.42 | ) | 10.75 | 1.97 | |||||||||||||||||||||||
2008 | 11.24 | .38 | (.21 | ) | .17 | (.37 | ) | (.07 | ) | (.44 | ) | 10.97 | 1.61 | |||||||||||||||||||||||
2007 | 11.25 | .38 | .02 | .40 | (.38 | ) | (.03 | ) | (.41 | ) | 11.24 | 3.64 | ||||||||||||||||||||||||
Class C (8/93) |
| |||||||||||||||||||||||||||||||||||
2011 | 11.15 | .42 | (.19 | ) | .23 | (.41 | ) | — | (.41 | ) | 10.97 | 2.11 | ||||||||||||||||||||||||
2010 | 10.74 | .42 | .39 | .81 | (.40 | ) | — | (.40 | ) | 11.15 | 7.62 | |||||||||||||||||||||||||
2009 | 10.96 | .41 | (.19 | ) | .22 | (.40 | ) | (.04 | ) | (.44 | ) | 10.74 | 2.19 | |||||||||||||||||||||||
2008 | 11.22 | .40 | (.19 | ) | .21 | (.40 | ) | (.07 | ) | (.47 | ) | 10.96 | 1.93 | |||||||||||||||||||||||
2007 | 11.24 | .40 | .02 | .42 | (.41 | ) | (.03 | ) | (.44 | ) | 11.22 | 3.77 | ||||||||||||||||||||||||
Class I (2/97)(f) |
| |||||||||||||||||||||||||||||||||||
2011 | 11.15 | .51 | (.19 | ) | .32 | (.49 | ) | — | (.49 | ) | 10.98 | 2.98 | ||||||||||||||||||||||||
2010 | 10.75 | .50 | .38 | .88 | (.48 | ) | — | (.48 | ) | 11.15 | 8.33 | |||||||||||||||||||||||||
2009 | 10.97 | .49 | (.19 | ) | .30 | (.48 | ) | (.04 | ) | (.52 | ) | 10.75 | 2.99 | |||||||||||||||||||||||
2008 | 11.24 | .49 | (.21 | ) | .28 | (.48 | ) | (.07 | ) | (.55 | ) | 10.97 | 2.60 | |||||||||||||||||||||||
2007 | 11.25 | .49 | .02 | .51 | (.49 | ) | (.03 | ) | (.52 | ) | 11.24 | 4.53 | ||||||||||||||||||||||||
| 86 | Nuveen Investments |
| Ratios/Supplemental Data | ||||||||||||||||||
| Ratios to Average Net Assets(d) | ||||||||||||||||||
| Ending Net Assets (000) | Expenses Including Interest(e) | Expenses Excluding Interest | Net Invest- ment Income | Portfolio Turnover Rate | ||||||||||||||
| $ | 292,694 | .82 | % | .82 | % | 4.40 | % | 10 | % | |||||||||
| 330,410 | .82 | .82 | 4.33 | 10 | ||||||||||||||
| 321,253 | .84 | .84 | 4.40 | 9 | ||||||||||||||
| 338,770 | .93 | .84 | 4.16 | 20 | ||||||||||||||
| 346,298 | .98 | .83 | 4.11 | 10 | ||||||||||||||
| 2,821 | 1.57 | 1.57 | 3.64 | 10 | ||||||||||||||
| 5,034 | 1.58 | 1.58 | 3.58 | 10 | ||||||||||||||
| 7,790 | 1.58 | 1.58 | 3.64 | 9 | ||||||||||||||
| 11,577 | 1.67 | 1.58 | 3.42 | 20 | ||||||||||||||
| 16,125 | 1.73 | 1.58 | 3.36 | 10 | ||||||||||||||
| 60,016 | 1.37 | 1.37 | 3.85 | 10 | ||||||||||||||
| 63,181 | 1.37 | 1.37 | 3.78 | 10 | ||||||||||||||
| 52,693 | 1.39 | 1.39 | 3.85 | 9 | ||||||||||||||
| 50,642 | 1.48 | 1.39 | 3.61 | 20 | ||||||||||||||
| 49,084 | 1.53 | 1.38 | 3.56 | 10 | ||||||||||||||
| 109,802 | .62 | .62 | 4.60 | 10 | ||||||||||||||
| 115,162 | .62 | .62 | 4.54 | 10 | ||||||||||||||
| 109,553 | .64 | .64 | 4.60 | 9 | ||||||||||||||
| 116,718 | .73 | .64 | 4.36 | 20 | ||||||||||||||
| 125,050 | .78 | .63 | 4.31 | 10 | ||||||||||||||
| (a) | Per share Net Investment Income (Loss) is calculated using the average daily shares method. |
| (b) | Distributions from Capital Gains include short-term capital gains, if any. |
| (c) | Total return is the combination of changes in net asset value without any sales charge, reinvested dividend income at net asset value and reinvested capital gains distributions at net asset value, if any. Total returns are not annualized. |
| (d) | Ratios do not reflect the effect of custodian fee credits earned on the Fund’s net cash on deposit with the custodian bank, where applicable. |
| (e) | The expense ratios reflect, among other things, the interest expense deemed to have been paid by the Fund on the floating rate certificates issued by the special purpose trusts for the self-deposited inverse floaters held by the Fund, where applicable, as described in Footnote 1 – General Information and Significant Accounting Policies, Inverse Floating Rate Securities. |
| (f) | Effective May 1, 2008, Class R Shares were renamed Class I Shares. |
See accompanying notes to financial statements.
| Nuveen Investments | 87 |
Financial Highlights (continued)
| Selected data for a share outstanding throughout each period: | ||||||||||||||||||||||||||||||||||||
| Class (Commencement Date) | ||||||||||||||||||||||||||||||||||||
| Investment Operations | Less Distributions | |||||||||||||||||||||||||||||||||||
| WISCONSIN | ||||||||||||||||||||||||||||||||||||
| Year Ended May 31, | Beginning Net Asset Value | Net Invest- ment Income (Loss)(a) | Net Realized/ Unrealized Gain (Loss) | Total | Net Invest- ment Income | Capital Gains(b) | Total | Ending Net Asset Value | Total Return(c) | |||||||||||||||||||||||||||
Class A (6/94) |
| |||||||||||||||||||||||||||||||||||
2011 | $ | 10.39 | $ | .39 | $ | (.12 | ) | $ | .27 | $ | (.38 | ) | $ | — | $ | (.38 | ) | $ | 10.28 | 2.71 | % | |||||||||||||||
2010 | 9.95 | .38 | .44 | .82 | (.38 | ) | — | (.38 | ) | 10.39 | 8.42 | |||||||||||||||||||||||||
2009 | 10.09 | .39 | (.14 | ) | .25 | (.38 | ) | (.01 | ) | (.39 | ) | 9.95 | 2.61 | |||||||||||||||||||||||
2008 | 10.24 | .38 | (.13 | ) | .25 | (.38 | ) | (.02 | ) | (.40 | ) | 10.09 | 2.51 | |||||||||||||||||||||||
2007 | 10.20 | .39 | .06 | .45 | (.39 | ) | (.02 | ) | (.41 | ) | 10.24 | 4.46 | ||||||||||||||||||||||||
Class B (2/97) |
| |||||||||||||||||||||||||||||||||||
2011 | 10.41 | .31 | (.10 | ) | .21 | (.31 | ) | — | (.31 | ) | 10.31 | 2.05 | ||||||||||||||||||||||||
2010 | 9.97 | .31 | .44 | .75 | (.31 | ) | — | (.31 | ) | 10.41 | 7.64 | |||||||||||||||||||||||||
2009 | 10.12 | .32 | (.16 | ) | .16 | (.30 | ) | (.01 | ) | (.31 | ) | 9.97 | 1.74 | |||||||||||||||||||||||
2008 | 10.26 | .30 | (.11 | ) | .19 | (.31 | ) | (.02 | ) | (.33 | ) | 10.12 | 1.82 | |||||||||||||||||||||||
2007 | 10.22 | .32 | .05 | .37 | (.31 | ) | (.02 | ) | (.33 | ) | 10.26 | 3.67 | ||||||||||||||||||||||||
Class C (2/97) |
| |||||||||||||||||||||||||||||||||||
2011 | 10.41 | .33 | (.11 | ) | .22 | (.33 | ) | — | (.33 | ) | 10.30 | 2.17 | ||||||||||||||||||||||||
2010 | 9.96 | .33 | .45 | .78 | (.33 | ) | — | (.33 | ) | 10.41 | 7.94 | |||||||||||||||||||||||||
2009 | 10.11 | .34 | (.16 | ) | .18 | (.32 | ) | (.01 | ) | (.33 | ) | 9.96 | 1.93 | |||||||||||||||||||||||
2008 | 10.26 | .32 | (.12 | ) | .20 | (.33 | ) | (.02 | ) | (.35 | ) | 10.11 | 1.96 | |||||||||||||||||||||||
2007 | 10.23 | .34 | .05 | .39 | (.34 | ) | (.02 | ) | (.36 | ) | 10.26 | 3.91 | ||||||||||||||||||||||||
Class I (2/97)(f) |
| |||||||||||||||||||||||||||||||||||
2011 | 10.42 | .42 | (.12 | ) | .30 | (.41 | ) | — | (.41 | ) | 10.31 | 2.92 | ||||||||||||||||||||||||
2010 | 9.97 | .40 | .46 | .86 | (.41 | ) | — | (.41 | ) | 10.42 | 8.73 | |||||||||||||||||||||||||
2009 | 10.12 | .41 | (.15 | ) | .26 | (.40 | ) | (.01 | ) | (.41 | ) | 9.97 | 2.72 | |||||||||||||||||||||||
2008 | 10.28 | .40 | (.13 | ) | .27 | (.41 | ) | (.02 | ) | (.43 | ) | 10.12 | 2.64 | |||||||||||||||||||||||
2007 | 10.25 | .42 | .04 | .46 | (.41 | ) | (.02 | ) | (.43 | ) | 10.28 | 4.59 | ||||||||||||||||||||||||
| 88 | Nuveen Investments |
| Ratios/Supplemental Data | ||||||||||||||||||
| Ratios to Average Net Assets(d) | ||||||||||||||||||
| Ending Net Assets (000) | Expenses Including Interest(e) | Expenses Excluding Interest | Net Invest- ment Income | Portfolio Turnover Rate | ||||||||||||||
| $ | 45,101 | .87 | % | .87 | % | 3.81 | % | 14 | % | |||||||||
| 50,270 | .90 | .90 | 3.75 | 6 | ||||||||||||||
| 46,933 | .89 | .89 | 4.02 | 12 | ||||||||||||||
| 50,640 | .88 | .88 | 3.72 | 3 | ||||||||||||||
| 42,279 | .90 | .90 | 3.78 | 10 | ||||||||||||||
| 548 | 1.62 | 1.62 | 2.99 | 14 | ||||||||||||||
| 1,383 | 1.65 | 1.65 | 3.00 | 6 | ||||||||||||||
| 1,598 | 1.63 | 1.63 | 3.27 | 12 | ||||||||||||||
| 2,174 | 1.63 | 1.63 | 2.98 | 3 | ||||||||||||||
| 2,464 | 1.65 | 1.65 | 3.04 | 10 | ||||||||||||||
| 9,105 | 1.42 | 1.42 | 3.26 | 14 | ||||||||||||||
| 9,329 | 1.45 | 1.45 | 3.19 | 6 | ||||||||||||||
| 6,907 | 1.44 | 1.44 | 3.46 | 12 | ||||||||||||||
| 6,512 | 1.43 | 1.43 | 3.17 | 3 | ||||||||||||||
| 5,975 | 1.45 | 1.45 | 3.24 | 10 | ||||||||||||||
| 18,236 | .67 | .67 | 4.14 | 14 | ||||||||||||||
| 2,605 | .70 | .70 | 3.94 | 6 | ||||||||||||||
| 1,573 | .69 | .69 | 4.20 | 12 | ||||||||||||||
| 1,506 | .68 | .68 | 3.92 | 3 | ||||||||||||||
| 1,031 | .69 | .69 | 3.97 | 10 | ||||||||||||||
| (a) | Per share Net Investment Income (Loss) is calculated using the average daily shares method. |
| (b) | Distributions from Capital Gains include short-term capital gains, if any. |
| (c) | Total return is the combination of changes in net asset value without any sales charge, reinvested dividend income at net asset value and reinvested capital gains distributions at net asset value, if any. Total returns are not annualized. |
| (d) | Ratios do not reflect the effect of custodian fee credits earned on the Fund’s net cash on deposit with the custodian bank, where applicable. |
| (e) | The expense ratios reflect, among other things, the interest expense deemed to have been paid by the Fund on the floating rate certificates issued by the special purpose trusts for the self-deposited inverse floaters held by the Fund, where applicable, as described in Footnote 1 – General Information and Significant Accounting Policies, Inverse Floating Rate Securities. |
| (f) | Effective May 1, 2008, Class R Shares were renamed Class I Shares. |
See accompanying notes to financial statements.
| Nuveen Investments | 89 |
1. General Information and Significant Accounting Policies
General Information
The Nuveen Multistate Trust IV (the “Trust”) is an open-end investment company registered under the Investment Company Act of 1940, as amended. The Trust is comprised of the Nuveen Kansas Municipal Bond Fund (“Kansas”), Nuveen Kentucky Municipal Bond Fund (“Kentucky”), Nuveen Michigan Municipal Bond Fund (“Michigan”), Nuveen Missouri Municipal Bond Fund (“Missouri”), Nuveen Ohio Municipal Bond Fund (“Ohio”) and Nuveen Wisconsin Municipal Bond Fund (“Wisconsin”) (each a “Fund” and collectively, the “Funds”). The Trust was organized as a Massachusetts business trust on July 1, 1996. The Funds were each organized as a series of predecessor trusts or corporations prior to that date.
Effective January 1, 2011, the Funds’ adviser, Nuveen Asset Management, a wholly-owned subsidiary of Nuveen Investments, Inc. (“Nuveen”), changed its name to Nuveen Fund Advisors, Inc. (the “Adviser”). Concurrently, the Adviser formed a wholly-owned subsidiary, Nuveen Asset Management, LLC (the “Sub-Adviser”), to house its portfolio management capabilities and to serve as the Funds’ sub-adviser, and the Funds’ portfolio managers became employees of the Sub-Adviser. This allocation of responsibilities between the Adviser and the Sub-Adviser affects each of the Funds. The Adviser will compensate the Sub-Adviser for the portfolio management services it provides to the Funds from each Fund’s management fee.
Effective April 30, 2011, Nuveen Investments, LLC, a wholly-owned subsidiary of Nuveen, changed its name to Nuveen Securities, LLC.
Each Fund’s investment objective is to provide as high a level of current interest income exempt from regular federal, state and, in some cases, local income taxes as is consistent with preservation of capital. Under normal market conditions, each Fund invests at least 80% of its net assets in municipal bonds that pay interest that is exempt from regular federal and its respective state personal income tax. Each Fund invests at least 80% of its net assets in investment grade municipal bonds rated BBB/Baa or higher at the time of purchase by at least one independent rating agency, or, if unrated, judged by the Sub-Adviser to be of comparable quality. Each Fund may invest up to 20% of its net assets in below investment grade municipal bonds, commonly referred to as “high yield” or “junk” bonds. Each Fund may invest up to 15% of its net assets in municipal securities whose interest payments vary inversely with changes in short-term tax-exempt interest rates (i.e., inverse floating rate securities).
The Funds’ most recent prospectus provides further description of each Fund’s investment objective, principal investment strategies, and principal risks.
Significant Accounting Policies
The following is a summary of significant accounting policies followed by the Funds in the preparation of their financial statements in accordance with accounting principles generally accepted in the United States (“U.S. GAAP”).
Investment Valuation
Prices of municipal bonds are provided by a pricing service approved by the Funds’ Board of Trustees. These securities are generally classified as Level 2 for fair value measurement purposes. When price quotes are not readily available (which is usually the case for municipal bonds) the pricing service establishes a security’s fair value using methods that may include consideration of the following: yields or prices of investments of comparable quality, type of issue, coupon, maturity and rating, market quotes or indications of value from security dealers, evaluations of anticipated cash flows or collateral, general market conditions and other information and analysis, including the obligor’s credit characteristics considered relevant. In pricing certain securities, particularly less liquid and lower quality securities, the pricing service may consider information about a security, its issuer, or market activity, provided by the Adviser. These securities are generally classified as Level 2 or Level 3, depending on the priority of the significant inputs.
Certain securities may not be able to be priced by the pre-established pricing methods as described above. Such securities may be valued by the Funds’ Board of Trustees or its designee at fair value. These securities generally include, but are not limited to, restricted securities (securities which may not be publicly sold without registration under the Securities Act of 1933, as amended) for which a pricing service is unable to provide a market price; securities whose trading has been formally suspended; debt securities that have gone into default and for which there is no current market quotation; a security whose market price is not available from a pre-established pricing source; a security with respect to which an event has occurred that is likely to materially affect the value of the security after the market has closed but before the calculation of a Fund’s net asset value (as may be the case in non-U.S. markets on which the security is primarily traded) or make it difficult or impossible to obtain a reliable market quotation; and a security whose price, as provided by the pricing service, is not deemed to reflect the security’s fair value. As a general principle, the fair value of a security would appear to be the amount that the owner might reasonably expect to receive for it in a current sale. A variety of factors may be considered in determining the fair value of such securities, which may include consideration of the following: yields or prices of investments of comparable quality, type of issue, coupon, maturity and rating, market quotes or indications of value from security dealers, evaluations of anticipated cash flows or collateral, general market conditions and other information and analysis, including the obligor’s credit characteristics considered relevant. These securities are generally classified as Level 2 or Level 3 depending on the priority of the significant inputs. Regardless of the method employed to value a particular security, all valuations are subject to review by the Funds’ Board of Trustees or its designee.
| 90 | Nuveen Investments |
Refer to Footnote 2 – Fair Value Measurements for further details on the leveling of securities held by the Funds as of the end of the reporting period.
Investment Transactions
Investment transactions are recorded on a trade date basis. Realized gains and losses from transactions are determined on the specific identification method, which is the same basis used for federal income tax purposes. Investments purchased on a when-issued/delayed delivery basis may have extended settlement periods. Any investments so purchased are subject to market fluctuation during this period. The Funds have instructed the custodian to segregate assets with a current value at least equal to the amount of the when-issued/delayed delivery purchase commitments. At May 31, 2011, Michigan, Missouri and Wisconsin had outstanding when-issued/delayed delivery purchase commitments of $787,964, $486,560 and $974,590, respectively. There were no such outstanding purchase commitments in any of the other Funds.
Investment Income
Investment income, which reflects the amortization of premiums and includes the accretion of discounts for financial reporting purposes, is recorded on an accrual basis. Investment income also reflects paydown gains and losses, if any.
Income Taxes
Each Fund is a separate taxpayer for federal income tax purposes. Each Fund intends to distribute substantially all of its net investment income and net capital gains to shareholders and to otherwise comply with the requirements of Subchapter M of the Internal Revenue Code applicable to regulated investment companies. Therefore, no federal income tax provision is required. Furthermore, each Fund intends to satisfy conditions that will enable interest from municipal securities, which is exempt from regular federal and designated state income taxes, to retain such tax-exempt status when distributed to shareholders of the Funds. Net realized capital gains and ordinary income distributions paid by the Funds are subject to federal taxation.
For all open tax years and all major taxing jurisdictions, management of the Funds has concluded that there are no significant uncertain tax positions that would require recognition in the financial statements. Open tax years are those that are open for examination by taxing authorities (i.e., generally the last four tax year ends and the interim tax period since then). Furthermore, management of the Funds is also not aware of any tax positions for which it is reasonably possible that the total amounts of unrecognized tax benefits will significantly change in the next twelve months.
Dividends and Distributions to Shareholders
The Funds declare dividends from their net investment income daily and pay shareholders monthly. Fund shares begin to accrue dividends on the business day after the day when the monies used to purchase Fund shares are collected by the Funds’ transfer agent.
Net realized capital gains and/or market discount from investment transactions, if any, are declared and distributed to shareholders at least annually. Furthermore, capital gains are distributed only to the extent they exceed available capital loss carryforwards.
Distributions to shareholders of net investment income, net realized capital gains and/or market discount, if any, are recorded on the ex-dividend date. The amount and timing of distributions are determined in accordance with federal income tax regulations, which may differ from U.S. GAAP.
Flexible Sales Charge Program
Class A Shares are generally sold with an up-front sales charge and incur a .20% annual 12b-1 service fee. Class A Share purchases of $1 million or more are sold at net asset value without an up-front sales charge but may be subject to a contingent deferred sales charge (“CDSC”) if redeemed within eighteen months of purchase. Class B Shares were sold without an up-front sales charge but incur a .75% annual 12b-1 distribution fee and a .20% annual 12b-1 service fee. Class B Shares are subject to a CDSC of up to 5% depending upon the length of time the shares are held by the investor (CDSC is reduced to 0% at the end of six years). Class B Shares convert to Class A Shares eight years after purchase. Class C Shares are sold without an up-front sales charge but incur a .55% annual 12b-1 distribution fee and a .20% annual 12b-1 service fee. Class C Shares are subject to a CDSC of 1% if redeemed within twelve months of purchase. Class I Shares are not subject to any sales charge or 12b-1 distribution or service fees.
Inverse Floating Rate Securities
Each Fund is authorized to invest in inverse floating rate securities. An inverse floating rate security is created by depositing a municipal bond, typically with a fixed interest rate, into a special purpose trust created by a broker-dealer. In turn, this trust (a) issues floating rate certificates, in face amounts equal to some fraction of the deposited bond’s par amount or market value, that typically pay short-term tax-exempt interest rates to third parties, and (b) issues to a long-term investor (such as one of the Funds) an inverse floating rate certificate (sometimes referred to as an “inverse floater”) that represents all remaining or residual interest in the trust. The income received by the inverse floater holder varies inversely with the short-term rate paid to the floating rate certificates’ holders, and in most circumstances the inverse floater holder bears substantially all of the underlying bond’s downside investment risk and also benefits disproportionately from any potential appreciation of the underlying bond’s value. The price of an inverse floating rate security will be more volatile than that of the underlying bond because the interest rate is dependent on not only the fixed coupon rate of the underlying bond but also on the short-term interest paid on the floating rate certificates, and because the inverse floating rate security essentially bears the risk of loss of the greater face value of the underlying bond.
| Nuveen Investments | 91 |
Notes to Financial Statements (continued)
A Fund may purchase an inverse floating rate security in a secondary market transaction without first owning the underlying bond (referred to as an “externally-deposited inverse floater”), or instead by first selling a fixed-rate bond to a broker-dealer for deposit into the special purpose trust and receiving in turn the residual interest in the trust (referred to as a “self-deposited inverse floater”). The inverse floater held by a Fund gives the Fund the right (a) to cause the holders of the floating rate certificates to tender their notes at par, and (b) to have the broker transfer the fixed-rate bond held by the trust to the Fund, thereby collapsing the trust. An investment in an externally-deposited inverse floater is identified in the Portfolio of Investments as “(IF) – Inverse floating rate investment.” An investment in a self-deposited inverse floater is accounted for as a financing transaction. In such instances, a fixed-rate bond deposited into a special purpose trust is identified in the Portfolio of Investments as “(UB) – Underlying bond of an inverse floating rate trust reflected as a financing transaction,” with the Fund accounting for the short-term floating rate certificates issued by the trust as “Floating rate obligations” on the Statement of Assets and Liabilities. In addition, the Fund reflects in “Investment Income” the entire earnings of the underlying bond and the related interest paid to the holders of the short-term floating rate certificates as “Interest expense on floating rate obligations” on the Statement of Operations.
During the fiscal year ended May 31, 2011, each Fund invested in externally-deposited inverse floaters and/or self-deposited inverse floaters.
Each Fund may also enter into shortfall and forbearance agreements (sometimes referred to as a “recourse trust” or “credit recovery swap”) (such agreements referred to herein as “Recourse Trusts”) with a broker-dealer by which a Fund agrees to reimburse the broker-dealer, in certain circumstances, for the difference between the liquidation value of the fixed-rate bond held by the trust and the liquidation value of the floating rate certificates issued by the trust plus any shortfalls in interest cash flows. Under these agreements, a Fund’s potential exposure to losses related to or on inverse floaters may increase beyond the value of a Fund’s inverse floater investments as a Fund may potentially be liable to fulfill all amounts owed to holders of the floating rate certificates. At period end, any such shortfall is recognized as “Unrealized depreciation on Recourse Trusts” on the Statement of Assets and Liabilities.
At May 31, 2011, each Fund’s maximum exposure to externally-deposited Recourse Trusts was as follows:
| Kansas | Kentucky | Michigan | Missouri | Ohio | Wisconsin | |||||||||||||||||||
Maximum exposure to Recourse Trusts | $ | — | $ | 15,000,000 | $ | 2,400,000 | $ | — | $ | — | $ | 3,000,000 | ||||||||||||
The average floating rate obligations outstanding and average annual interest rate and fees related to self-deposited inverse floaters for the following Funds during the fiscal year ended May 31, 2011, were as follows:
| Kansas | Missouri | |||||||
Average floating rate obligations outstanding | $ | 1,248,425 | $ | 2,225,000 | ||||
Average annual interest rate and fees | 0.74 | % | 0.45 | % | ||||
Derivative Financial Instruments
Each Fund is authorized to invest in certain derivative instruments, including foreign currency forwards, futures, options and swap contracts. Although each Fund is authorized to invest in such derivative instruments, and may do so in the future, they did make any such investments during the fiscal year ended May 31, 2011.
Market and Counterparty Credit Risk
In the normal course of business each Fund may invest in financial instruments and enter into financial transactions where risk of potential loss exists due to changes in the market (market risk) or failure of the other party to the transaction to perform (counterparty credit risk). The potential loss could exceed the value of the financial assets recorded on the financial statements. Financial assets, which potentially expose each Fund to counterparty credit risk, consist principally of cash due from counterparties on forward, option and swap transactions, when applicable. The extent of each Fund’s exposure to counterparty credit risk in respect to these financial assets approximates their carrying value as recorded on the Statement of Assets and Liabilities. Futures contracts, when applicable, expose a Fund to minimal counterparty credit risk as they are exchange traded and the exchange’s clearinghouse, which is counterparty to all exchange traded futures, guarantees the futures contracts against default.
Each Fund helps manage counterparty credit risk by entering into agreements only with counterparties the Adviser believes have the financial resources to honor their obligations and by having the Adviser monitor the financial stability of the counterparties. Additionally, counterparties may be required to pledge collateral daily (based on the daily valuation of the financial asset) on behalf of each Fund with a value approximately equal to the amount of any unrealized gain above a pre-determined threshold. Reciprocally, when each Fund has an unrealized loss, the Funds have instructed the custodian to pledge assets of the Funds as collateral with a value approximately equal to the amount of the unrealized loss above a pre-determined threshold. Collateral pledges are monitored and subsequently adjusted if and when the valuations fluctuate, either up or down, by at least the pre-determined threshold amount.
Zero Coupon Securities
Each Fund is authorized to invest in zero coupon securities. A zero coupon security does not pay a regular interest coupon to its holders during the life of the security. Tax-exempt income to the holder of the security comes from accretion of the difference between the original purchase price of the security at issuance and the par value of the security at maturity and is effectively paid at maturity. The market prices of zero coupon securities generally are more volatile than the market prices of securities that pay interest periodically.
| 92 | Nuveen Investments |
Multiclass Operations and Allocations
Income and expenses of the Funds that are not directly attributable to a specific class of shares are prorated among the classes based on the relative settled shares of each class. Expenses directly attributable to a class of shares, which presently only include 12b-1 distribution and service fees, are recorded to the specific class.
Realized and unrealized capital gains and losses of the Funds are prorated among the classes based on the relative net assets of each class.
Custodian Fee Credit
Each Fund has an arrangement with the custodian bank whereby certain custodian fees and expenses are reduced by net credits earned on each Fund’s cash on deposit with the bank. Such deposit arrangements are an alternative to overnight investments. Credits for cash balances may be offset by charges for any days on which a Fund overdraws its account at the custodian bank.
Indemnifications
Under the Trust’s organizational documents, its officers and trustees are indemnified against certain liabilities arising out of the performance of their duties to the Trust. In addition, in the normal course of business, the Trust enters into contracts that provide general indemnifications to other parties. The Trust’s maximum exposure under these arrangements is unknown as this would involve future claims that may be made against the Trust that have not yet occurred. However, the Trust has not had prior claims or losses pursuant to these contracts and expects the risk of loss to be remote.
Use of Estimates
The preparation of financial statements in conformity with U.S. GAAP requires management to make estimates and assumptions that affect the reported amounts of assets and liabilities at the date of the financial statements and the reported amounts of increases and decreases in net assets from operations during the reporting period. Actual results may differ from those estimates.
2. Fair Value Measurements
Fair value is defined as the price that the Funds would receive upon selling an investment or transferring a liability in an orderly transaction to an independent buyer in the principal or most advantageous market of the investment. A three-tier hierarchy is used to maximize the use of observable market data and minimize the use of unobservable inputs and to establish classification of fair value measurements for disclosure purposes. Observable inputs reflect the assumptions market participants would use in pricing the asset or liability. Observable inputs are based on market data obtained from sources independent of the reporting entity. Unobservable inputs reflect the reporting entity’s own assumptions about the assumptions market participants would use in pricing the asset or liability. Unobservable inputs are based on the best information available in the circumstances. The three-tier hierarchy of inputs is summarized in the three broad levels listed below:
| Level 1 – | Quoted prices in active markets for identical securities. | |
| Level 2 – | Other significant observable inputs (including quoted prices for similar securities, interest rates, prepayment speeds, credit risk, etc.). | |
| Level 3 – | Significant unobservable inputs (including management’s assumptions in determining the fair value of investments). |
The inputs or methodologies used for valuing securities are not an indication of the risk associated with investing in those securities.
The following is a summary of each Fund’s fair value measurements as of May 31, 2011:
| Kansas | Level 1 | Level 2 | Level 3 | Total | ||||||||||||
Investments: | ||||||||||||||||
Municipal Bonds | $ | — | $ | 176,860,682 | $ | — | $ | 176,860,682 | ||||||||
| Kentucky | Level 1 | Level 2 | Level 3 | Total | ||||||||||||
Investments: | ||||||||||||||||
Municipal Bonds | $ | — | $ | 397,110,637 | $ | — | $ | 397,110,637 | ||||||||
| Michigan | Level 1 | Level 2 | Level 3 | Total | ||||||||||||
Investments: | ||||||||||||||||
Municipal Bonds | $ | — | $ | 197,274,635 | $ | — | $ | 197,274,635 | ||||||||
| Missouri | Level 1 | Level 2 | Level 3 | Total | ||||||||||||
Investments: | ||||||||||||||||
Municipal Bonds | $ | — | $ | 227,355,967 | $ | — | $ | 227,355,967 | ||||||||
| Ohio | Level 1 | Level 2 | Level 3 | Total | ||||||||||||
Investments: | ||||||||||||||||
Municipal Bonds | $ | — | $ | 455,589,129 | $ | — | $ | 455,589,129 | ||||||||
| Wisconsin | Level 1 | Level 2 | Level 3 | Total | ||||||||||||
Investments: | ||||||||||||||||
Municipal Bonds | $ | — | $ | 71,924,480 | $ | — | $ | 71,924,480 | ||||||||
| Nuveen Investments | 93 |
Notes to Financial Statements (continued)
During the fiscal year ended May 31, 2011, the Funds recognized no significant transfers to/from Level 1, Level 2, or Level 3.
3. Derivative Instruments and Hedging Activities
The Funds record derivative instruments at fair value, with changes in fair value recognized on the Statement of Operations, when applicable. Even though the Funds’ investments in derivatives may represent economic hedges, they are not considered to be hedge transactions for financial reporting purposes. The Funds did not invest in derivative instruments during the fiscal year ended May 31, 2011.
4. Fund Shares
Transactions in Fund shares were as follows:
| Kansas | ||||||||||||||||
| Year Ended 5/31/11 | Year Ended 5/31/10 | |||||||||||||||
| Shares | Amount | Shares | Amount | |||||||||||||
Shares sold: | ||||||||||||||||
Class A | 2,373,395 | $ | 24,618,995 | 2,026,005 | $ | 20,846,927 | ||||||||||
Class A – automatic conversion of Class B Shares | 47,870 | 498,089 | 104,767 | 1,065,637 | ||||||||||||
Class B | 133 | 1,364 | 154 | 1,574 | ||||||||||||
Class C | 714,113 | 7,476,577 | 872,186 | 8,999,803 | ||||||||||||
Class I | 1,007,494 | 10,616,153 | 380,264 | 3,951,892 | ||||||||||||
Shares issued to shareholders due to reinvestment of distributions: | ||||||||||||||||
Class A | 331,261 | 3,431,331 | 307,709 | 3,176,573 | ||||||||||||
Class B | 3,455 | 35,546 | 4,935 | 50,454 | ||||||||||||
Class C | 77,596 | 802,631 | 59,078 | 609,795 | ||||||||||||
Class I | 30,784 | 320,252 | 7,068 | 73,469 | ||||||||||||
| 4,586,101 | 47,800,938 | 3,762,166 | 38,776,124 | |||||||||||||
Shares redeemed: | ||||||||||||||||
Class A | (2,395,122 | ) | (24,538,356 | ) | (1,954,728 | ) | (20,179,093 | ) | ||||||||
Class B | (69,338 | ) | (708,133 | ) | (39,251 | ) | (402,761 | ) | ||||||||
Class B – automatic conversion to Class A Shares | (48,295 | ) | (498,089 | ) | (105,648 | ) | (1,065,637 | ) | ||||||||
Class C | (475,612 | ) | (4,871,031 | ) | (240,624 | ) | (2,469,610 | ) | ||||||||
Class I | (772,173 | ) | (7,831,469 | ) | (134,586 | ) | (1,404,597 | ) | ||||||||
| (3,760,540 | ) | (38,447,078 | ) | (2,474,837 | ) | (25,521,698 | ) | |||||||||
Net increase (decrease) | 825,561 | $ | 9,353,860 | 1,287,329 | $ | 13,254,426 | ||||||||||
| Kentucky | ||||||||||||||||
| Year Ended 5/31/11 | Year Ended 5/31/10 | |||||||||||||||
| Shares | Amount | Shares | Amount | |||||||||||||
Shares sold: | ||||||||||||||||
Class A | 1,886,089 | $ | 20,349,081 | 3,678,376 | $ | 39,167,939 | ||||||||||
Class A – automatic conversion of Class B Shares | 99,590 | 1,058,354 | 114,192 | 1,206,295 | ||||||||||||
Class B | 776 | 8,361 | 1,107 | 11,793 | ||||||||||||
Class C | 830,339 | 8,971,206 | 1,049,131 | 11,186,099 | ||||||||||||
Class I | 606,810 | 6,459,737 | 491,107 | 5,233,271 | ||||||||||||
Shares issued to shareholders due to reinvestment of distributions: | ||||||||||||||||
Class A | 883,038 | 9,470,996 | 884,711 | 9,425,452 | ||||||||||||
Class B | 8,419 | 90,676 | 13,904 | 148,035 | ||||||||||||
Class C | 125,387 | 1,346,496 | 112,243 | 1,197,406 | ||||||||||||
Class I | 20,305 | 217,863 | 12,087 | 128,912 | ||||||||||||
| 4,460,753 | 47,972,770 | 6,356,858 | 67,705,202 | |||||||||||||
Shares redeemed: | ||||||||||||||||
Class A | (6,283,503 | ) | (66,823,731 | ) | (3,345,532 | ) | (35,665,723 | ) | ||||||||
Class B | (150,915 | ) | (1,618,871 | ) | (130,320 | ) | (1,381,135 | ) | ||||||||
Class B – automatic conversion to Class A Shares | (99,511 | ) | (1,058,354 | ) | (114,089 | ) | (1,206,295 | ) | ||||||||
Class C | (1,227,623 | ) | (12,998,799 | ) | (610,033 | ) | (6,518,284 | ) | ||||||||
Class I | (288,742 | ) | (3,128,306 | ) | (143,157 | ) | (1,533,097 | ) | ||||||||
| (8,050,294 | ) | (85,628,061 | ) | (4,343,131 | ) | (46,304,534 | ) | |||||||||
Net increase (decrease) | (3,589,541 | ) | $ | (37,655,291 | ) | 2,013,727 | $ | 21,400,668 | ||||||||
| 94 | Nuveen Investments |
| Michigan | ||||||||||||||||
| Year Ended 5/31/11 | Year Ended 5/31/10 | |||||||||||||||
| Shares | Amount | Shares | Amount | |||||||||||||
Shares sold: | ||||||||||||||||
Class A | 1,877,751 | $ | 20,563,436 | 1,900,264 | $ | 20,886,100 | ||||||||||
Class A – automatic conversion of Class B Shares | 5,894 | 64,906 | 40,054 | 440,513 | ||||||||||||
Class B | 505 | 5,611 | 1,049 | 11,593 | ||||||||||||
Class C | 229,357 | 2,540,096 | 208,969 | 2,308,164 | ||||||||||||
Class I | 233,116 | 2,576,075 | 281,261 | 3,108,903 | ||||||||||||
Shares issued to shareholders due to reinvestment of distributions: | ||||||||||||||||
Class A | 296,360 | 3,281,905 | 301,719 | 3,334,460 | ||||||||||||
Class B | 1,954 | 21,701 | 3,394 | 37,534 | ||||||||||||
Class C | 41,891 | 463,595 | 43,982 | 485,462 | ||||||||||||
Class I | 51,375 | 568,619 | 52,606 | 580,749 | ||||||||||||
| 2,738,203 | 30,085,944 | 2,833,298 | 31,193,478 | |||||||||||||
Shares redeemed: | ||||||||||||||||
Class A | (3,052,747 | ) | (33,471,462 | ) | (2,031,569 | ) | (22,386,204 | ) | ||||||||
Class B | (59,100 | ) | (655,304 | ) | (78,334 | ) | (860,265 | ) | ||||||||
Class B – automatic conversion to Class A Shares | (5,884 | ) | (64,906 | ) | (39,984 | ) | (440,513 | ) | ||||||||
Class C | (332,783 | ) | (3,673,986 | ) | (473,164 | ) | (5,224,286 | ) | ||||||||
Class I | (311,963 | ) | (3,439,275 | ) | (244,991 | ) | (2,686,709 | ) | ||||||||
| (3,762,477 | ) | (41,304,933 | ) | (2,868,042 | ) | (31,597,977 | ) | |||||||||
Net increase (decrease) | (1,024,274 | ) | $ | (11,218,989 | ) | (34,744 | ) | $ | (404,499 | ) | ||||||
| Missouri | ||||||||||||||||
| Year Ended 5/31/11 | Year Ended 5/31/10 | |||||||||||||||
| Shares | Amount | Shares | Amount | |||||||||||||
Shares sold: | ||||||||||||||||
Class A | 1,710,347 | $ | 18,411,554 | 1,952,862 | $ | 20,514,904 | ||||||||||
Class A – automatic conversion of Class B Shares | 86,749 | 934,751 | 60,008 | 618,898 | ||||||||||||
Class B | 223 | 2,392 | 255 | 2,684 | ||||||||||||
Class C | 477,585 | 5,106,206 | 549,534 | 5,792,558 | ||||||||||||
Class I | 848,162 | 9,173,785 | 550,833 | 5,820,396 | ||||||||||||
Shares issued to shareholders due to reinvestment of distributions: | ||||||||||||||||
Class A | 531,014 | 5,682,728 | 523,836 | 5,537,509 | ||||||||||||
Class B | 4,608 | 49,518 | 8,040 | 84,837 | ||||||||||||
Class C | 51,573 | 550,919 | 46,275 | 488,840 | ||||||||||||
Class I | 23,688 | 253,744 | 15,276 | 162,158 | ||||||||||||
| 3,733,949 | 40,165,597 | 3,706,919 | 39,022,784 | |||||||||||||
Shares redeemed: | ||||||||||||||||
Class A | (2,975,284 | ) | (31,580,126 | ) | (2,465,200 | ) | (25,963,148 | ) | ||||||||
Class B | (38,996 | ) | (422,667 | ) | (71,193 | ) | (753,280 | ) | ||||||||
Class B – automatic conversion to Class A Shares | (86,676 | ) | (934,751 | ) | (59,941 | ) | (618,898 | ) | ||||||||
Class C | (500,716 | ) | (5,313,836 | ) | (284,446 | ) | (3,010,707 | ) | ||||||||
Class I | (686,279 | ) | (7,227,699 | ) | (326,257 | ) | (3,501,482 | ) | ||||||||
| (4,287,951 | ) | (45,479,079 | ) | (3,207,037 | ) | (33,847,515 | ) | |||||||||
Net increase (decrease) | (554,002 | ) | $ | (5,313,482 | ) | 499,882 | $ | 5,175,269 | ||||||||
| Nuveen Investments | 95 |
Notes to Financial Statements (continued)
| Ohio | ||||||||||||||||
| Year Ended 5/31/11 | Year Ended 5/31/10 | |||||||||||||||
| Shares | Amount | Shares | Amount | |||||||||||||
Shares sold: | ||||||||||||||||
Class A | 3,114,850 | $ | 34,046,787 | 3,180,557 | $ | 35,049,801 | ||||||||||
Class A – automatic conversion of Class B Shares | 52,855 | 585,666 | 107,172 | 1,166,811 | ||||||||||||
Class B | 783 | 8,652 | 10,767 | 119,467 | ||||||||||||
Class C | 665,559 | 7,341,378 | 1,086,092 | 11,964,329 | ||||||||||||
Class I | 730,135 | 8,001,357 | 857,129 | 9,454,875 | ||||||||||||
Shares issued to shareholders due to reinvestment of distributions: | ||||||||||||||||
Class A | 640,290 | 7,054,109 | 638,885 | 7,053,510 | ||||||||||||
Class B | 7,454 | 81,952 | 9,698 | 106,715 | ||||||||||||
Class C | 108,161 | 1,186,730 | 92,605 | 1,020,041 | ||||||||||||
Class I | 324,007 | 3,558,920 | 322,714 | 3,552,277 | ||||||||||||
| 5,644,094 | 61,865,551 | 6,305,619 | 69,487,826 | |||||||||||||
Shares redeemed: | ||||||||||||||||
Class A | (6,765,267 | ) | (73,603,132 | ) | (4,199,181 | ) | (46,455,561 | ) | ||||||||
Class B | (149,553 | ) | (1,645,195 | ) | (186,295 | ) | (2,057,515 | ) | ||||||||
Class B – automatic conversion to Class A Shares | (52,955 | ) | (585,666 | ) | (107,349 | ) | (1,166,811 | ) | ||||||||
Class C | (971,277 | ) | (10,508,712 | ) | (416,485 | ) | (4,588,505 | ) | ||||||||
Class I | (1,374,841 | ) | (14,968,206 | ) | (1,047,215 | ) | (11,604,015 | ) | ||||||||
| (9,313,893 | ) | (101,310,911 | ) | (5,956,525 | ) | (65,872,407 | ) | |||||||||
Net increase (decrease) | (3,669,799 | ) | $ | (39,445,360 | ) | 349,094 | $ | 3,615,419 | ||||||||
| Wisconsin | ||||||||||||||||
| Year Ended 5/31/11 | Year Ended 5/31/10 | |||||||||||||||
| Shares | Amount | Shares | Amount | |||||||||||||
Shares sold: | ||||||||||||||||
Class A | 529,620 | $ | 5,440,704 | 676,723 | $ | 6,923,390 | ||||||||||
Class A – automatic conversion of Class B Shares | 12,220 | 126,145 | 13,716 | 140,261 | ||||||||||||
Class B | 27 | 275 | 27 | 271 | ||||||||||||
Class C | 219,215 | 2,277,264 | 272,344 | 2,784,082 | ||||||||||||
Class I | 1,646,182 | 16,538,693 | 98,184 | 1,007,272 | ||||||||||||
Shares issued to shareholders due to reinvestment of distributions: | ||||||||||||||||
Class A | 119,375 | 1,224,178 | 119,178 | 1,216,425 | ||||||||||||
Class B | 2,157 | 22,262 | 2,894 | 29,588 | ||||||||||||
Class C | 21,518 | 220,905 | 19,128 | 195,662 | ||||||||||||
Class I | 11,718 | 119,973 | 5,839 | 59,760 | ||||||||||||
| 2,562,032 | 25,970,399 | 1,208,033 | 12,356,711 | |||||||||||||
Shares redeemed: | ||||||||||||||||
Class A | (1,113,501 | ) | (11,321,640 | ) | (689,079 | ) | (7,000,692 | ) | ||||||||
Class B | (69,639 | ) | (702,764 | ) | (16,610 | ) | (166,649 | ) | ||||||||
Class B – automatic conversion to Class A Shares | (12,191 | ) | (126,145 | ) | (13,689 | ) | (140,261 | ) | ||||||||
Class C | (252,970 | ) | (2,568,078 | ) | (88,104 | ) | (906,320 | ) | ||||||||
Class I | (139,604 | ) | (1,404,552 | ) | (11,635 | ) | (120,143 | ) | ||||||||
| (1,587,905 | ) | (16,123,179 | ) | (819,117 | ) | (8,334,065 | ) | |||||||||
Net increase (decrease) | 974,127 | $ | 9,847,220 | 388,916 | $ | 4,022,646 | ||||||||||
5. Investment Transactions
Purchases and sales (including maturities but excluding short-term investments, when applicable) during the fiscal year ended May 31, 2011, were as follows:
| Kansas | Kentucky | Michigan | Missouri | Ohio | Wisconsin | |||||||||||||||||||
Purchases | $ | 46,796,196 | $ | 31,037,804 | $ | 11,459,914 | $ | 14,489,133 | $ | 47,312,904 | $ | 18,481,269 | ||||||||||||
Sales and maturities | 27,611,643 | 62,977,240 | 21,768,478 | 20,730,556 | 91,597,380 | 8,443,193 | ||||||||||||||||||
| 96 | Nuveen Investments |
6. Income Tax Information
The following information is presented on an income tax basis. Differences between amounts for financial statement and federal income tax purposes are primarily due to timing differences in recognizing taxable market discount, timing differences in recognizing certain gains and losses on investment transactions and the treatment of investments in inverse floating rate securities reflected as financing transactions, if any. To the extent that differences arise that are permanent in nature, such amounts are reclassified within the capital accounts as detailed below. Temporary differences do not require reclassification. Temporary and permanent differences do not impact the net asset values of the Funds.
At May 31, 2011, the cost and unrealized appreciation (depreciation) of investments as determined on a federal income tax basis, were as follows:
| Kansas | Kentucky | Michigan | Missouri | Ohio | Wisconsin | |||||||||||||||||||
Cost of investments | $ | 163,909,131 | $ | 387,795,395 | $ | 190,370,422 | $ | 222,227,270 | $ | 442,065,366 | $ | 70,414,694 | ||||||||||||
Gross unrealized: | ||||||||||||||||||||||||
Appreciation | $ | 6,552,589 | $ | 13,243,376 | $ | 8,713,960 | $ | 9,053,621 | $ | 18,472,816 | $ | 2,345,239 | ||||||||||||
Depreciation | (1,886,064 | ) | (3,928,134 | ) | (1,809,747 | ) | (6,149,386 | ) | (4,949,053 | ) | (835,453 | ) | ||||||||||||
Net unrealized appreciation (depreciation) of investments | $ | 4,666,525 | $ | 9,315,242 | $ | 6,904,213 | $ | 2,904,235 | $ | 13,523,763 | $ | 1,509,786 | ||||||||||||
Permanent differences, primarily due to federal taxes paid, taxable market discount and distribution character reclassifications, resulted in reclassifications among the Funds’ components of net assets at May 31, 2011, the Funds’ tax year end, as follows:
| Kansas | Kentucky | Michigan | Missouri | Ohio | Wisconsin | |||||||||||||||||||
Capital paid-in | $ | 10,934 | $ | — | $ | 1,054 | $ | — | $ | (171 | ) | $ | 152 | |||||||||||
Undistributed (Over-distribution of) net investment income | (20,695 | ) | (6,663 | ) | (1,240 | ) | (24 | ) | (125,675 | ) | (247 | ) | ||||||||||||
Accumulated net realized gain (loss) | 9,761 | 6,663 | 186 | 24 | 125,846 | 95 | ||||||||||||||||||
The tax components of undistributed net tax-exempt income, net ordinary income and net long-term capital gains at May 31, 2011, the Funds’ tax year end, were as follows:
| Kansas | Kentucky | Michigan | Missouri | Ohio | Wisconsin | |||||||||||||||||||
Undistributed net tax-exempt income* | $ | 660,912 | $ | 1,451,594 | $ | 573,133 | $ | 1,348,399 | $ | 2,832,895 | $ | 228,084 | ||||||||||||
Undistributed net ordinary income** | 7,353 | — | 10,626 | — | 110,741 | 608 | ||||||||||||||||||
Undistributed net long-term capital gains | — | — | — | — | — | — | ||||||||||||||||||
| * | Undistributed net tax-exempt income (on a tax basis) has not been reduced for the dividends declared during the period May 1, 2011 through May 31, 2011, and paid on June 1, 2011. |
| ** | Net ordinary income consists of taxable market discount income and net short-term capital gains, if any. |
The tax character of distributions paid during the Funds’ tax years ended May 31, 2011 and May 31, 2010, was designated for purposes of the dividends paid deduction as follows:
| 2011 | Kansas | Kentucky | Michigan | Missouri | Ohio | Wisconsin | ||||||||||||||||||
Distributions from net tax-exempt income*** | $ | 6,971,310 | $ | 17,493,087 | $ | 8,250,957 | $ | 10,102,147 | $ | 20,457,840 | $ | 2,289,195 | ||||||||||||
Distributions from net ordinary income** | — | — | — | — | 373,843 | — | ||||||||||||||||||
Distributions from net long-term capital gains | — | — | — | — | — | — | ||||||||||||||||||
| 2010 | Kansas | Kentucky | Michigan | Missouri | Ohio | Wisconsin | ||||||||||||||||||
Distributions from net tax-exempt income | $ | 6,227,362 | $ | 17,190,583 | $ | 8,618,837 | $ | 9,887,747 | $ | 20,877,457 | $ | 2,195,220 | ||||||||||||
Distributions from net ordinary income** | — | — | — | — | — | — | ||||||||||||||||||
Distributions from net long-term capital gains | — | 15,133 | — | — | — | — | ||||||||||||||||||
| ** | Net ordinary income consists of taxable market discount income and net short-term capital gains, if any. |
| *** | The Funds hereby designate these amounts paid during the fiscal year ended May 31, 2011, as Exempt Interest Dividends. |
At May 31, 2011, the Funds’ tax year end, the Funds had unused capital loss carryforwards available for federal income tax purposes to be applied against future capital gains, if any. If not applied, the carryforwards will expire as follows:
| Kansas | Kentucky | Michigan | Missouri | Ohio | Wisconsin | |||||||||||||||||||
Expiration: | ||||||||||||||||||||||||
May 31, 2017 | $ | 760,902 | $ | — | $ | — | $ | 615,557 | $ | — | $ | — | ||||||||||||
May 31, 2018 | 193,761 | 4,354,150 | 3,035,189 | 663,355 | 1,122,034 | 40,757 | ||||||||||||||||||
May 31, 2019 | — | — | — | — | 2,421,767 | — | ||||||||||||||||||
Total | $ | 954,663 | $ | 4,354,150 | $ | 3,035,189 | $ | 1,278,912 | $ | 3,543,801 | $ | 40,757 | ||||||||||||
| Nuveen Investments | 97 |
Notes to Financial Statements (continued)
During the Funds’ tax year ended May 31, 2011, the following Funds utilized capital loss carryforwards as follows:
| Kansas | Kentucky | Michigan | Missouri | Wisconsin | ||||||||||||||||
Utilized capital loss carryforwards | $ | 20,757 | $ | 1,124,891 | $ | 611,395 | $ | 447,614 | $ | 11,799 | ||||||||||
The Funds have elected to defer net realized losses from investments incurred from November 1, 2010 through May 31, 2011, the Fund’s tax year end, (“post-October losses”) in accordance with federal income tax regulations. Post-October losses are treated as having arisen on the first day of the following fiscal year. The following Funds have elected to defer post-October losses as follows:
| Kansas | Ohio | Wisconsin | ||||||||||
Post-October capital losses | $ | 508,405 | $ | 934,286 | $ | 450,190 | ||||||
7. Management Fees and Other Transactions with Affiliates
Each Fund’s management fee consists of two components – a fund-level fee, based only on the amount of assets within each individual Fund, and a complex-level fee, based on the aggregate amount of all eligible fund assets managed by the Adviser. This pricing structure enables each Fund’s shareholders to benefit from growth in the assets within their respective Fund as well as from growth in the amount of complex-wide assets managed by the Adviser.
The annual fund-level fee for each Fund, payable monthly, is calculated according to the following schedule:
| Average Daily Net Assets | Fund-Level Fee Rate | |||
For the first $125 million | .3500 | % | ||
For the next $125 million | .3375 | |||
For the next $250 million | .3250 | |||
For the next $500 million | .3125 | |||
For the next $1 billion | .3000 | |||
For the next $3 billion | .2750 | |||
For net assets over $5 billion | .2500 | |||
The annual complex-level fee for each Fund, payable monthly, is calculated according to the following schedule:
| Complex-Level Asset Breakpoint Level* | Effective Rate at Breakpoint Level | |||
$55 billion | .2000 | % | ||
$56 billion | .1996 | |||
$57 billion | .1989 | |||
$60 billion | .1961 | |||
$63 billion | .1931 | |||
$66 billion | .1900 | |||
$71 billion | .1851 | |||
$76 billion | .1806 | |||
$80 billion | .1773 | |||
$91 billion | .1691 | |||
$125 billion | .1599 | |||
$200 billion | .1505 | |||
$250 billion | .1469 | |||
$300 billion | .1445 | |||
| * | The complex-level fee is calculated based upon the aggregate daily “eligible assets” of all Nuveen Funds. Eligible assets do not include assets attributable to investments in other Nuveen Funds or assets in excess of $2 billion added to the Nuveen Fund complex in connection with the Adviser’s assumption of the management of the former First American Funds effective January 1, 2011. Eligible assets include closed-end fund assets managed by the Adviser that are attributable to financial leverage. For these purposes, financial leverage includes the closed-end funds’ use of preferred stock and borrowings and certain investments in the residual interest certificates (also called inverse floating rate securities) in tender option bond (TOB) trusts, including the portion of assets held by a TOB trust that has been effectively financed by the trust’s issuance of floating rate securities, subject to an agreement by the Adviser as to certain funds to limit the amount of such assets for determining eligible assets in certain circumstances. As of May 31, 2011, the complex-level fee rate for each of these Funds was .1774%. |
The management fee compensates the Adviser for overall investment advisory and administrative services and general office facilities. The Adviser has entered into sub-advisory agreements with the Sub-Adviser under which the Sub-Adviser manages the investment portfolios of the Funds. The Sub-Adviser is compensated for its services to the Funds from the management fees paid to the Adviser.
The Adviser has agreed to waive fees or reimburse expenses of Ohio so that total annual Fund operating expenses (excluding 12b-1 distribution and service fees, interest expenses, taxes, fees incurred in acquiring and disposing of portfolio securities and extraordinary expenses) do not exceed .75% of the average daily net assets of any class of Fund shares. The Adviser may also voluntarily reimburse additional expenses from time to time in any of the Funds. Voluntary reimbursements may be terminated at any time at the Adviser’s discretion.
| 98 | Nuveen Investments |
The Trust pays no compensation directly to those of its trustees who are affiliated with the Adviser or to its officers, all of whom receive remuneration for their services to the Trust from the Adviser or its affiliates. The Board of Trustees has adopted a deferred compensation plan for independent trustees that enables trustees to elect to defer receipt of all or a portion of the annual compensation they are entitled to receive from certain Nuveen-advised funds. Under the plan, deferred amounts are treated as though equal dollar amounts had been invested in shares of select Nuveen-advised funds.
During the fiscal year ended May 31, 2011, Nuveen Securities, LLC (the “Distributor”), a wholly-owned subsidiary of Nuveen, collected sales charges on purchases of Class A Shares, the majority of which were paid out as concessions to financial intermediaries as follows:
| Kansas | Kentucky | Michigan | Missouri | Ohio | Wisconsin | |||||||||||||||||||
Sales charges collected (Unaudited) | $ | 547,911 | $ | 322,174 | $ | 112,952 | $ | 391,119 | $ | 290,792 | $ | 81,743 | ||||||||||||
Paid to financial intermediaries (Unaudited) | 483,285 | 281,333 | 98,416 | 340,284 | 254,987 | 70,613 | ||||||||||||||||||
The Distributor also received 12b-1 service fees on Class A Shares, substantially all of which were paid to compensate financial intermediaries for providing services to shareholders relating to their investments.
During the fiscal year ended May 31, 2011, the Distributor compensated financial intermediaries directly with commission advances at the time of purchase as follows:
| Kansas | Kentucky | Michigan | Missouri | Ohio | Wisconsin | |||||||||||||||||||
Commission advances (Unaudited) | $ | 154,013 | $ | 124,345 | $ | 22,358 | $ | 68,115 | $ | 111,235 | $ | 23,538 | ||||||||||||
To compensate for commissions advanced to financial intermediaries, all 12b-1 service fees collected on Class B Shares during the first year following a purchase, all 12b-1 distribution fees collected on Class B Shares, and all 12b-1 service and distribution fees collected on Class C Shares during the first year following a purchase are retained by the Distributor. During the fiscal year ended May 31, 2011, the Distributor retained such 12b-1 fees as follows:
| Kansas | Kentucky | Michigan | Missouri | Ohio | Wisconsin | |||||||||||||||||||
12b-1 fees retained (Unaudited) | $ | 78,501 | $ | 102,625 | $ | 32,019 | $ | 51,436 | $ | 106,578 | $ | 27,049 | ||||||||||||
The remaining 12b-1 fees charged to the Funds were paid to compensate financial intermediaries for providing services to shareholders relating to their investments.
The Distributor also collected and retained CDSC on share redemptions during the fiscal year ended May 31, 2011, as follows:
| Kansas | Kentucky | Michigan | Missouri | Ohio | Wisconsin | |||||||||||||||||||
CDSC retained (Unaudited) | $ | 6,850 | $ | 5,946 | $ | 4,326 | $ | 2,822 | $ | 11,080 | $ | 22,856 | ||||||||||||
8. New Accounting Pronouncements
Fair Value Measurements and Disclosures
On May 12, 2011, the Financial Accounting Standards Board (“FASB”) issued an Accounting Standard Update (“ASU”) modifying Topic 820, Fair Value Measurements and Disclosures. At the same time, the International Accounting Standards Board (“IASB”) issued International Financial Reporting Standard (“IFRS”) 13, Fair Value Measurement. The objective by the FASB and IASB is convergence of their guidance on fair value measurements and disclosures. Specifically, the ASU requires reporting entities to disclose i) the amounts of any transfers between Level 1 and Level 2, and the reasons for the transfers, ii) for Level 3 fair value measurements, a) quantitative information about significant unobservable inputs used, b) a description of the valuation processes used by the reporting entity and c) a narrative description of the sensitivity of the fair value measurement to changes in unobservable inputs if a change in those inputs might result in a significantly higher or lower fair value measurement. The effective date of the ASU is for interim and annual periods beginning after December 15, 2011. At this time, management is evaluating the implications of this guidance and the impact it will have on the financial statement amounts and footnote disclosures, if any.
| Nuveen Investments | 99 |
Trustees and Officers (Unaudited)
The management of the Funds, including general supervision of the duties performed for the Funds by the Adviser, is the responsibility of the Board of Trustees of the Funds. The number of trustees of the Funds is currently set at ten. None of the trustees who are not “interested” persons of the Funds (referred to herein as “independent trustees”) has ever been a director or employee of, or consultant to, Nuveen or its affiliates. The names and business addresses of the trustees and officers of the Funds, their principal occupations and other affiliations during the past five years, the number of portfolios each oversees and other directorships they hold are set forth below.
The Funds’ Statement of Additional Information (“SAI”) includes more information about the trustees. To request a free copy, call Nuveen Investments at (800) 257-8787 or visit the Funds’ website at www.nuveen.com.
Name, Birthdate and Address | Position(s) Held with the Funds | Year First Elected or Appointed (1) | Principal Occupation(s) Including other Directorships During Past 5 Years | Number of Portfolios in Fund Complex Overseen by Trustee | ||||
| Independent Trustees: | ||||||||
Robert P. Bremner (2) 8/22/40 333 W. Wacker Drive Chicago, IL 60606 | Chairman of the Board and Trustee | 1996 | Private Investor and Management Consultant; Treasurer and Director, Humanities Council of Washington, D.C.; Board Member, Independent Directors Council affiliated with the Investment Company Institute. | 245 | ||||
Jack B. Evans 10/22/48 333 W. Wacker Drive Chicago, IL 60606 | Trustee | 1999 | President, The Hall-Perrine Foundation, a private philanthropic corporation (since 1996); Director and Chairman, United Fire Group, a publicly held company; member of the Board of Regents for the State of Iowa University System; Director, Source Media Group; Life Trustee of Coe College and the Iowa College Foundation; formerly, Director, Alliant Energy; formerly, Director, Federal Reserve Bank of Chicago; formerly, President and Chief Operating Officer, SCI Financial Group, Inc., a regional financial services firm. | 245 | ||||
William C. Hunter 3/6/48 333 W. Wacker Drive Chicago, IL 60606 | Trustee | 2004 | Dean, Tippie College of Business, University of Iowa (since 2006); Director (since 2004) of Xerox Corporation; Director (since 2005), Beta Gamma Sigma International Honor Society; Director of Wellmark, Inc. (since 2009); formerly, Dean and Distinguished Professor of Finance, School of Business at the University of Connecticut (2003-2006); previously, Senior Vice President and Director of Research at the Federal Reserve Bank of Chicago (1995-2003); formerly, Director (1997-2007), Credit Research Center at George Washington University. | 245 | ||||
David J. Kundert (2) 10/28/42 333 W. Wacker Drive Chicago, IL 60606 | Trustee | 2005 | Director, Northwestern Mutual Wealth Management Company; retired (since 2004) as Chairman, JPMorgan Fleming Asset Management, President and CEO, Banc One Investment Advisors Corporation, and President, One Group Mutual Funds; prior thereto, Executive Vice President, Banc One Corporation and Chairman and CEO, Banc One Investment Management Group; Member, Board of Regents, Luther College; member of the Wisconsin Bar Association; member of Board of Directors, Friends of Boerner Botanical Gardens; member of Board of Directors and Chair of Investment Committee, Greater Milwaukee Foundation. | 245 | ||||
William J. Schneider (2) 9/24/44 333 W. Wacker Drive Chicago, IL 60606 | Trustee | 1997 | Chairman of Miller-Valentine Partners Ltd., a real estate investment company; formerly, Senior Partner and Chief Operating Officer (retired 2004) of Miller-Valentine Group; member, University of Dayton Business School Advisory Council; member, Mid-America Health System Board; formerly, member and chair, Dayton Philharmonic Orchestra Association; formerly, member, Business Advisory Council, Cleveland Federal Reserve Bank. | 245 | ||||
Judith M. Stockdale 12/29/47 333 W. Wacker Drive Chicago, IL 60606 | Trustee | 1997 | Executive Director, Gaylord and Dorothy Donnelley Foundation (since 1994); prior thereto, Executive Director, Great Lakes Protection Fund (1990-1994). | 245 | ||||
Carole E. Stone (2) 6/28/47 333 W. Wacker Drive Chicago, IL 60606 | Trustee | 2007 | Director, Chicago Board Options Exchange (since 2006); Director, C2 Options Exchange, Incorporated (since 2009); formerly, Commissioner, New York State Commission on Public Authority Reform (2005-2010); formerly, Chair, New York Racing Association Oversight Board (2005-2007). | 245 | ||||
| 100 | Nuveen Investments |
Name, Birthdate and Address | Position(s) Held with the Funds | Year First Elected or Appointed (1) | Principal Occupation(s) During Past Five Years | Number of Portfolios in Fund Complex Overseen by Trustee | ||||
Virginia L. Stringer 8/16/44 333 West Wacker Drive Chicago, IL 60606 | Trustee | 2011 | Board Member, Mutual Fund Directors Forum; Member, Governing Board, Investment Company Institute’s Independent Directors Council; governance consultant and non-profit board member; former Owner and President, Strategic Management Resources, Inc. a management consulting firm; previously, held several executive positions in general management, marketing and human resources at IBM and The Pillsbury Company; Independent Director, First American Fund Complex (1987-2010) and Chair (1997-2010). | 245 | ||||
Terence J. Toth (2) 9/29/59 333 W. Wacker Drive Chicago, IL 60606 | Trustee | 2008 | Director, Legal & General Investment Management America, Inc. (since 2008); Managing Partner, Promus Capital (since 2008); formerly, CEO and President, Northern Trust Global Investments (2004-2007); Executive Vice President, Quantitative Management & Securities Lending (2000-2004); prior thereto, various positions with Northern Trust Company (since 1994); member: Goodman Theatre Board (since 2004), Chicago Fellowship Board (since 2005) and Catalyst Schools of Chicago Board (since 2008); formerly, member: Northern Trust Mutual Funds Board (2005-2007), Northern Trust Global Investments Board (2004-2007), Northern Trust Japan Board (2004-2007), Northern Trust Securities Inc. Board (2003-2007) and Northern Trust Hong Kong Board (1997-2004). | 245 | ||||
| Interested Trustee: | ||||||||
John P. Amboian (3) 6/14/61 333 W. Wacker Drive Chicago, IL 60606 | Trustee | 2008 | Chief Executive Officer and Chairman (since 2007), and Director (since 1999) of Nuveen Investments, Inc., formerly, President (1999-2007); Chief Executive Officer (since 2007) of Nuveen Investments Advisers Inc.; Director (since 1998) formerly, Chief Executive Officer (2007-2010) of Nuveen Fund Advisors, Inc. | 245 | ||||
Name, Birthdate and Address | Position(s) Held with the Funds | Year First Elected or Appointed (4) | Principal Occupation(s) During Past 5 Years | Number of Portfolios in Fund Complex Overseen by Officer | ||||
| Officers of the Funds: | ||||||||
Gifford R. Zimmerman 9/9/56 333 W. Wacker Drive Chicago, IL 60606 | Chief Administrative Officer | 1988 | Managing Director (since 2002), Assistant Secretary and Associate General Counsel of Nuveen Securities, LLC; Managing Director (since 2004) and Assistant Secretary (since 1994) of Nuveen Investments, Inc.; Managing Director (since 2002), Assistant Secretary (since 1997) and Co-General Counsel (since 2011) of Nuveen Fund Advisors, Inc.; Managing Director, Assistant Secretary and Associate General Counsel of Nuveen Asset Management, LLC (since 2011); Managing Director, Associate General Counsel and Assistant Secretary of Symphony Asset Management LLC (since 2003); Vice President and Assistant Secretary of NWQ Investment Management Company, LLC (since 2002), Nuveen Investments Advisers Inc. (since 2002), Tradewinds Global Investors LLC, and Santa Barbara Asset Management, LLC (since 2006), Nuveen HydePark Group LLC and Nuveen Investment Solutions, Inc. (since 2007) and of Winslow Capital Management Inc. (since 2010); Chief Administrative Officer and Chief Compliance Officer (since 2010) of Nuveen Commodities Asset Management, LLC; Chartered Financial Analyst. | 245 | ||||
Margo L. Cook 4/11/64 333 W. Wacker Drive Chicago, IL 60606 | Vice President | 2009 | Executive Vice President (since 2008) of Nuveen Investments, Inc. and of Nuveen Fund Advisors, Inc. (since 2011); previously, Head of Institutional Asset Management (2007-2008) of Bear Stearns Asset Management; Head of Institutional Asset Management (1986-2007) of Bank of NY Mellon; Chartered Financial Analyst. | 245 | ||||
| Nuveen Investments | 101 |
Trustees and Officers (Unaudited) (continued)
Name, Birthdate and Address | Position(s) Held with the Funds | Year First Elected or Appointed (4) | Principal Occupation(s) During Past 5 Years | Number of Portfolios in Fund Complex Overseen by Officer | ||||
Lorna C. Ferguson 10/24/45 333 W. Wacker Drive Chicago, IL 60606 | Vice President | 1998 | Managing Director (since 2004) of Nuveen Securities, LLC and Managing Director (since 2005) of Nuveen Fund Advisors, Inc. | 245 | ||||
Stephen D. Foy 5/31/54 333 W. Wacker Drive Chicago, IL 60606 | Vice President and Controller | 1998 | Senior Vice President (since 2010), formerly, Vice President (1993-2010) and Funds Controller (since 1998) of Nuveen Securities, LLC; Senior Vice President (since 2010), formerly, Vice President (2005-2010) of Nuveen Fund Advisors, Inc.; Certified Public Accountant. | 245 | ||||
Scott S. Grace 8/20/70 333 W. Wacker Drive Chicago, IL 60606 | Vice President and Treasurer | 2009 | Managing Director, Corporate Finance & Development, Treasurer (since 2009) of Nuveen Securities, LLC; Managing Director and Treasurer (since 2009) of Nuveen Fund Advisors, Inc., Nuveen Investment Solutions, Inc., Nuveen Investments Advisers, Inc., Nuveen Investments Holdings Inc. and (since (2011) Nuveen Asset Management, LLC; Vice President and Treasurer of NWQ Investment Management Company, LLC, Tradewinds Global Investors, LLC, Symphony Asset Management LLC and Winslow Capital Management, Inc.; Vice President of Santa Barbara Asset Management, LLC; formerly, Treasurer (2006-2009), Senior Vice President (2008-2009), previously, Vice President (2006-2008) of Janus Capital Group, Inc.; formerly, Senior Associate in Morgan Stanley’s Global Financial Services Group (2000-2003); Chartered Accountant Designation. | 245 | ||||
Walter M. Kelly 2/24/70 333 W. Wacker Drive Chicago, IL 60606 | Chief Compliance Officer and Vice President | 2003 | Senior Vice President (since 2008), Vice President (2006-2008) of Nuveen Securities, LLC; Senior Vice President (since 2008) and Assistant Secretary (since 2008) of Nuveen Fund Advisors, Inc. | 245 | ||||
Tina M. Lazar 8/27/61 333 W. Wacker Drive Chicago, IL 60606 | Vice President | 2002 | Senior Vice President (since 2009), formerly, Vice President of Nuveen Securities, LLC (1999-2009); Senior Vice President (since 2010), formerly, Vice President (2005-2010) of Nuveen Fund Advisors, Inc. | 245 | ||||
Larry W. Martin 7/27/51 333 West Wacker Drive Chicago, IL 60606 | Vice President and Assistant Secretary | 1997 | Senior Vice President (since 2010), formerly, Vice President (1993-2010), Assistant Secretary and Assistant General Counsel of Nuveen Securities, LLC; Senior Vice President (since 2011) of Nuveen Asset Management, LLC: Senior Vice President (since 2010), formerly, Vice President (2005-2010), and Assistant Secretary of Nuveen Investments, Inc.; Senior Vice President (since 2010), formerly Vice President (2005-2010), and Assistant Secretary (since 1997) of Nuveen Fund Advisors, Inc.; Vice President and Assistant Secretary of Nuveen Investments Advisers, Inc. (since 2002), NWQ Investment Management Company, LLC, Symphony Asset Management LLC (since 2003), Tradewinds Global Investors, LLC, Santa Barbara Asset Management, LLC (since 2006), Nuveen HydePark Group, LLC and Nuveen Investment Solutions, Inc. (since 2007), and of Winslow Capital Management, Inc. (since 2010); Vice President and Assistant Secretary of Nuveen Commodities Asset Management, LLC (since 2010). | 245 |
| 102 | Nuveen Investments |
Name, Birthdate and Address | Position(s) Held with the Funds | Year First Elected or Appointed (4) | Principal Occupation(s) Including other Directorships During Past 5 Years | Number of Portfolios in Fund Complex Overseen by Officer | ||||
Kevin J. McCarthy 3/26/66 333 W. Wacker Drive Chicago, IL 60606 | Vice President and Secretary | 2007 | Managing Director (since 2008), formerly, Vice President (2007-2008), Nuveen Securities, LLC; Managing Director (since 2008), Assistant Secretary (since 2007) and Co-General Counsel (since 2011) of Nuveen Fund Advisors, Inc.; Managing Director, Assistant Secretary and Associate General Counsel (since 2011) of Nuveen Asset Management, LLC; Managing Director (since 2008), and Assistant Secretary, Nuveen Investment Holdings, Inc.; Vice President (since 2007) and Assistant Secretary of Nuveen Investments Advisers Inc., NWQ Investment Management Company, LLC, Tradewinds Global Investors LLC, NWQ Holdings, LLC, Symphony Asset Management LLC, Santa Barbara Asset Management, LLC, Nuveen HydePark Group, LLC, Nuveen Investment Solutions, Inc. (since 2007) and of Winslow Capital Management, Inc. (since 2010); Vice President and Secretary (since 2010) of Nuveen Commodities Asset Management, LLC; prior thereto, Partner, Bell, Boyd & Lloyd LLP (1997-2007). | 245 | ||||
Kathleen L. Prudhomme 3/30/53 800 Nicollet Mall Minneapolis, MN 55402 | Vice President and Assistant Secretary | 2011 | Managing Director, Assistant Secretary and Co-General Counsel (since 2011) of Nuveen Fund Advisors, Inc.; Managing Director, Assistant Secretary and Associate General Counsel (since 2011) of Nuveen Asset Management, LLC; Managing Director and Assistant Secretary (since 2011) of Nuveen Securities, LLC; formerly, Deputy General Counsel, FAF Advisors, Inc. (2004-2010). | 245 | ||||
Jeffrey M. Wilson 3/13/56 333 West Wacker Drive Chicago, IL 60606 | Vice President | 2011 | Senior Vice President of Nuveen Investments (since 2011), formerly, Senior Vice President of FAF Advisors, Inc. (2000-2010). | 112 |
| (1) | Trustees serve an indefinite term until his/her successor is elected or appointed. The year first elected or appointed represents the year in which the trustee was first elected or appointed to any fund in the Nuveen Fund Complex. |
| (2) | Also serves as a trustee of the Nuveen Diversified Commodity Fund, an exchange-traded commodity pool managed by Nuveen Commodities Asset Management, LLC, an affiliate of the Adviser. |
| (3) | Mr. Amboian is an interested trustee because of his position with Nuveen Investments, Inc. and certain of its subsidiaries, which are affiliates of the Nuveen Funds. |
| (4) | Officers serve one year terms through August of each year. The year first elected or appointed represents the year in which the officer was first elected or appointed to any fund in the Nuveen Fund Complex. |
| Nuveen Investments | 103 |
Annual Investment Management Agreement Approval Process
(Unaudited)
The Board of Trustees (each, a “Board” and each Trustee, a “Board Member”) of the Funds, including the Board Members who are not parties to the Funds’ advisory or sub-advisory agreements or “interested persons” of any such parties (the “Independent Board Members”), are responsible for approving the advisory agreements (each, an “Investment Management Agreement”) between each Fund and Nuveen Fund Advisors, Inc. (the “Advisor”) and the sub-advisory agreements (each a “Sub-Advisory Agreement”) between the Advisor and Nuveen Asset Management, LLC (the “Sub-Advisor”) (the Investment Management Agreements and the Sub-Advisory Agreements are referred to collectively as the “Advisory Agreements”) and their periodic continuation. Pursuant to the Investment Company Act of 1940, as amended (the “1940 Act”), the Board is generally required to consider the continuation of advisory agreements and sub-advisory agreements on an annual basis. Accordingly, at an in-person meeting held on May 23-25, 2011 (the “May Meeting”), the Board, including a majority of the Independent Board Members, considered and approved the continuation of the Advisory Agreements for the Funds for an additional one-year period.
In preparation for their considerations at the May Meeting, the Board requested and received extensive materials prepared in connection with the review of the Advisory Agreements. The materials provided a broad range of information regarding the Funds, the Advisor and the Sub-Advisor (the Advisor and the Sub-Advisor are collectively, the “Fund Advisers” and each, a “Fund Adviser”). As described in more detail below, the information provided included, among other things, a review of Fund performance, including Fund investment performance assessments against peer groups and appropriate benchmarks, a comparison of Fund fees and expenses relative to peers, a description and assessment of shareholder service levels for the Funds, a summary of the performance of certain service providers, a review of product initiatives and shareholder communications and an analysis of the Fund Adviser’s profitability with comparisons to comparable peers in the managed fund business. As part of their annual review, the Board also held a separate meeting on April 19-20, 2011, to review the Funds’ investment performance and consider an analysis provided by the Advisor of the Sub-Advisor which generally evaluated the Sub-Advisor’s investment team, investment mandate, organizational structure and history, investment philosophy and process, performance of the applicable Fund, and significant changes to the foregoing. As a result of their review of the materials and discussions, the Board presented the Advisor with questions and the Advisor responded.
The materials and information prepared in connection with the review of the Advisory Agreements at the May Meeting supplemented the information provided to the Board during the year. In this regard, throughout the year, the Board, acting directly or through its committees, regularly reviews the performance and various services provided by the Advisor and, since the internal restructuring described in Section A below, the Sub-Advisor. The Board meets at least quarterly as well as at other times as the need arises. At its quarterly meetings, the Board reviews reports by the Advisor which include, among other things, Fund performance, a review of the investment teams and compliance reports. The Board also meets with key investment personnel managing the Fund portfolios during the year. In addition, the Board continues its program of seeking to visit each sub-advisor to the Nuveen funds at least once over a multiple year rotation, meeting with key investment and business personnel. The Board also met with State Street Bank & Trust Company, the Funds’ accountant and custodian, in 2010. The Board considers factors and information that are relevant to its consideration of the renewal of the Advisory Agreements at these meetings held throughout the year. Accordingly, the Board considered the information provided and knowledge gained at these meetings when performing its review at the May Meeting of the Advisory Agreements. The Independent Board Members are assisted throughout the process by independent legal counsel who provided materials describing applicable law and the duties of directors or trustees in reviewing advisory contracts and met with the Independent Board Members in executive sessions without management present.
The Board considered all factors it believed relevant with respect to each Fund, including among other factors: (a) the nature, extent and quality of the services provided by the Fund Advisers, (b) the investment performance of the Fund and Fund Advisers, (c) the advisory fees and costs of the services to be provided to the Funds and the profitability of the Fund Advisers, (d) the extent of any economies of scale, (e) any benefits derived by the Fund Advisers from the relationship with the Fund and (f) other factors. Each Board Member may have accorded different weight to the various factors in reaching his or her conclusions with respect to a Fund’s Advisory Agreements. The Independent Board Members did not identify any single factor as all important or controlling. The Independent Board Members’ considerations were instead based on a comprehensive consideration of all the information presented. The principal factors considered by the Board and its conclusions are described below.
A. Nature, Extent and Quality of Services
In considering renewal of the Advisory Agreements, the Independent Board Members considered the nature, extent and quality of the Fund Adviser’s services, including advisory services and the resulting Fund performance and administrative services. The Independent Board Members reviewed materials outlining, among other things, the Fund Adviser’s organization and business; the types of services that the Fund Adviser or its affiliates provide to the Funds; the performance record of the applicable Fund (as described in further detail below); and any initiatives Nuveen had taken for the applicable fund product line.
In considering advisory services, the Board recognized that the Advisor provides various oversight, administrative, compliance and other services for the Funds and the Sub-Advisor provides the portfolio investment management services to the Funds. The Board recognized that Nuveen engaged in an internal restructuring in 2010 pursuant to which portfolio management services the Advisor had provided directly to the Funds were transferred to the Sub-Advisor, a newly-organized, wholly-owned subsidiary of the Advisor. Accordingly, in reviewing the portfolio management services provided to each Fund, the Board reviewed the materials provided by the Nuveen Investment Services Oversight Team analyzing, among other things, the Sub-Advisor’s investment team and changes
| 104 | Nuveen Investments |
thereto, organization and history, assets under management, Fund objectives and mandate, the investment teams’ philosophy and strategies in managing the Fund, developments affecting the Sub-Advisor or Fund and Fund performance. The Independent Board Members also reviewed portfolio manager compensation arrangements to evaluate each Fund Adviser’s ability to attract and retain high quality investment personnel, preserve stability, and reward performance but not provide an incentive to take undue risks. In addition, the Board considered the Advisor’s execution of its oversight responsibilities over the Sub-Advisor. Given the importance of compliance, the Independent Board Members also considered Nuveen’s compliance program, including the report of the chief compliance officer regarding the Funds’ compliance policies and procedures.
In addition to advisory services, the Board considered the quality and extent of administrative and other non-investment advisory services the Advisor and its affiliates provide to the Funds, including product management, investment services (such as oversight of investment policies and procedures, risk management, and pricing), fund administration, oversight of service providers, shareholder services, administration of Board relations, regulatory and portfolio compliance and legal support. In reviewing the services provided, the Board also reviewed materials describing various notable initiatives and projects the Advisor performed in connection with the open-end fund product line. These initiatives included operations necessary to effect the acquisition of FAF Advisors, Inc.’s (“FAF”) long-term asset management business by Nuveen and the subsequent integration of FAF and the funds FAF advised into the Nuveen family of funds; changes in dividend declaration policies; and adding funds to various distribution platforms.
Based on their review, the Independent Board Members found that, overall, the nature, extent and quality of services provided to the respective Funds under each applicable Advisory Agreement were satisfactory.
B. The Investment Performance of the Funds and Fund Advisers
The Board, including the Independent Board Members, reviewed and considered the performance history of each Fund over various time periods. The Board reviewed, among other things, each Fund’s historic investment performance as well as information comparing the Fund’s performance information with that of other funds (the “Performance Peer Group”) based on data provided by an independent provider of mutual fund data and with recognized and/or customized benchmarks.
The Board reviewed reports, including a comprehensive analysis of the Funds’ performance and the applicable investment team. In this regard, the Board reviewed each Fund’s total return information compared to its Performance Peer Group for the quarter, one-, three- and five-year periods ending December 31, 2010 and for the same periods ending March 31, 2011. In addition, the Board reviewed each Fund’s total return information compared to recognized and/or customized benchmarks for the quarter, one- and three-year periods ending December 31, 2010 and for the same periods ending March 31, 2011.
In reviewing performance comparison information, the Independent Board Members recognized that the usefulness of the comparisons of the performance of certain funds with the performance of their respective Performance Peer Group may be limited because the Performance Peer Group may not adequately represent the objectives and strategies of the applicable funds or may be limited in size or number. In this regard, the Independent Board Members noted that the Performance Peer Groups of the Nuveen Kansas Municipal Bond Fund (the “Kansas Fund”), Nuveen Kentucky Municipal Bond Fund (the “Kentucky Fund”) and Nuveen Wisconsin Municipal Bond Fund (the “Wisconsin Fund”) were classified as having significant differences from such Funds based on various considerations such as special fund objectives, potential investable universe and the composition of the peer set (e.g., the number and size of competing funds and number of competing managers). The Independent Board Members also noted that the investment experience of a particular shareholder in the Funds will vary depending on when such shareholder invests in the applicable Fund, the class held (if multiple classes are offered) and the performance of the Fund (or respective class) during that shareholder’s investment period.
In considering the results of the comparisons, the Independent Board Members observed, among other things, that the Nuveen Missouri Municipal Bond Fund (the “Missouri Fund”), Nuveen Michigan Municipal Bond Fund (the “Michigan Fund”) and Nuveen Ohio Municipal Bond Fund (the “Ohio Fund”) had demonstrated generally favorable performance in comparison to peers, performing in the first or second quartile over various periods. With respect to the Kansas Fund, Kentucky Fund and Wisconsin Fund, which, as noted above, had significant differences with their Performance Peer Groups, the Independent Board Members noted that each such Fund underperformed its respective benchmark in the one- and three-year periods. With respect to any Funds that underperformed their peers and/or benchmarks from time to time, the Board monitors such Funds closely and considers any steps necessary or appropriate to address such issues.
Based on their review, the Independent Board Members determined that each Fund’s investment performance had been satisfactory.
C. Fees, Expenses and Profitability
1. Fees and Expenses
The Board evaluated the management fees and expenses of each Fund reviewing, among other things, such Fund’s gross management fees, net management fees and net expense ratios in absolute terms as well as compared to the fee and expenses of a comparable universe of funds based on data provided by an independent fund data provider (the “Peer Universe”) and in certain cases, to a more focused subset of funds in the Peer Universe (the “Peer Group”) and any expense limitations.
The Independent Board Members further reviewed the methodology regarding the construction of the applicable Peer Universe and Peer Group (if any). In reviewing the comparisons of fee and expense information, the Independent Board Members took into
| Nuveen Investments | 105 |
Annual Investment Management Agreement Approval Process
(Unaudited) (continued)
account that in certain instances various factors such as: the asset level of a fund relative to peers; the limited size and particular composition of the Peer Universe or Peer Group; the investment objectives of the peers; expense anomalies; changes in the funds comprising the Peer Universe or Peer Group from year to year; levels of reimbursement; the timing of information used; and differences in the states reflected in the Peer Universe or Peer Group may impact the comparative data thereby limiting the ability to make a meaningful comparison with peers, including for each of the Funds.
In reviewing the fee schedule for a Fund, the Independent Board Members also considered the fund-level and complex-wide breakpoint schedules (described in further detail below) and any fee waivers and reimbursements provided by Nuveen. In reviewing fees and expenses, the Board considered the expenses and fees to be higher if they were over 10 basis points higher, slightly higher if they were 6 to 10 basis points higher, in line if they were within 5 basis points higher than the peer average and below if they were below the peer average of the Peer Group (if available) or Peer Universe if there was no separate Peer Group.
The Independent Board Members noted that the Kansas Fund, Kentucky Fund, Missouri Fund, Michigan Fund and Ohio Fund each had net management fees slightly higher or higher than the peer average but a net expense ratio below or in line with the peer average, and that the Wisconsin Fund had net management fees slightly higher or higher than the peer average and a net expense ratio slightly higher or higher than the peer average.
Based on their review of the fee and expense information provided, the Independent Board Members determined that each Fund’s management fees were reasonable in light of the nature, extent and quality of services provided to the Fund.
2. Comparisons with the Fees of Other Clients
The Independent Board Members further reviewed information regarding the nature of services and fee rates offered by the Advisor to other clients, including municipal separately managed accounts and passively managed exchange traded funds (ETFs) sub-advised by the Advisor. In evaluating the comparisons of fees, the Independent Board Members noted that the fee rates charged to the Funds and other clients vary, among other things, because of the different services involved and the additional regulatory and compliance requirements associated with registered investment companies, such as the Funds. Accordingly, the Independent Board Members considered the differences in the product types, including, but not limited to, the services provided, the structure and operations, product distribution and costs thereof, portfolio investment policies, investor profiles, account sizes and regulatory requirements. The Independent Board Members noted, in particular, that the range of services provided to the Funds (as discussed above) is much more extensive than that provided to separately managed accounts. Given the inherent differences in the products, particularly the extensive services provided to the Funds, the Independent Board Members believe such facts justify the different levels of fees.
In considering the fees of the Sub-Advisor, the Independent Board Members also considered the pricing schedule or fees that the Sub-Advisor charges for similar investment management services for other Nuveen funds.
3. Profitability of Fund Advisers
In conjunction with its review of fees, the Independent Board Members also considered the profitability of Nuveen for its advisory activities (which incorporated Nuveen’s wholly-owned affiliated sub-advisers) and its financial condition. The Independent Board Members reviewed the revenues and expenses of Nuveen’s advisory activities for the last two years, the allocation methodology used in preparing the profitability data and an analysis of the key drivers behind the changes in revenues and expenses that impacted profitability in 2010. The Independent Board Members noted this information supplemented the profitability information requested and received during the year to help keep them apprised of developments affecting profitability (such as changes in fee waivers and expense reimbursement commitments). In this regard, the Independent Board Members noted that they have an Independent Board Member serve as a point person to review and keep them apprised of changes to the profitability analysis and/or methodologies during the year. The Independent Board Members also considered Nuveen’s revenues for advisory activities, expenses, and profit margin compared to that of various unaffiliated management firms with similar amounts of assets under management and relatively comparable asset composition prepared by Nuveen.
In reviewing profitability, the Independent Board Members recognized the subjective nature of determining profitability which may be affected by numerous factors including the allocation of expenses. Further, the Independent Board Members recognized the difficulties in making comparisons as the profitability of other advisers generally is not publicly available and the profitability information that is available for certain advisers or management firms may not be representative of the industry and may be affected by, among other things, the adviser’s particular business mix, capital costs, types of funds managed and expense allocations. Notwithstanding the foregoing, the Independent Board Members reviewed Nuveen’s methodology and assumptions for allocating expenses across product lines to determine profitability. In reviewing profitability, the Independent Board Members recognized Nuveen’s investment in its fund business. Based on their review, the Independent Board Members concluded that the Advisor’s level of profitability for its advisory activities was reasonable in light of the services provided.
In evaluating the reasonableness of the compensation, the Independent Board Members also considered other amounts paid to a Fund Adviser by the Funds as well as any indirect benefits (such as soft dollar arrangements, if any) the Fund Adviser and its affiliates receive, or are expected to receive, that are directly attributable to the management of the Funds, if any. See Section E
| 106 | Nuveen Investments |
below for additional information on indirect benefits the Fund Adviser may receive as a result of its relationship with the Funds. Based on their review of the overall fee arrangements of each Fund, the Independent Board Members determined that the advisory fees and expenses of the respective Fund were reasonable.
D. Economies of Scale and Whether Fee Levels Reflect These Economies of Scale
With respect to economies of scale, the Independent Board Members have recognized the potential benefits resulting from the costs of a fund being spread over a larger asset base, although economies of scale are difficult to measure and predict with precision, particularly on a fund-by-fund basis. One method to help ensure the shareholders share in these benefits is to include breakpoints in the advisory fee schedule. Generally, management fees for funds in the Nuveen complex are comprised of a fund-level component and a complex-level component, subject to certain exceptions. Accordingly, the Independent Board Members reviewed and considered the applicable fund-level breakpoints in the advisory fee schedules that reduce advisory fees as asset levels increase.
In addition to fund-level advisory fee breakpoints, the Board also considered the Funds’ complex-wide fee arrangement. Pursuant to the complex-wide fee arrangement, the fees of the funds in the Nuveen complex are generally reduced as the assets in the fund complex reach certain levels. The complex-wide fee arrangement seeks to provide the benefits of economies of scale to fund shareholders when total fund complex assets increase, even if assets of a particular fund are unchanged or have decreased. The approach reflects the notion that some of Nuveen’s costs are attributable to services provided to all its funds in the complex and therefore all funds benefit if these costs are spread over a larger asset base. In this regard, the Independent Board Members also noted that a portion of the assets acquired pursuant to the transaction with FAF are included in determining the level of assets for calculating the complex-wide fee, which helps reduce such fee to the benefit of all shareholders.
Based on their review, the Independent Board Members concluded that the breakpoint schedules and complex-wide fee arrangement were acceptable and reflect economies of scale to be shared with shareholders when assets under management increase.
E. Indirect Benefits
In evaluating fees, the Independent Board Members received and considered information regarding potential “fall out” or ancillary benefits the respective Fund Adviser or its affiliates may receive as a result of its relationship with each Fund. In this regard, the Independent Board Members considered, among other things, any sales charges, distribution fees and shareholder services fees received and retained by the Funds’ principal underwriter, an affiliate of the Advisor, which includes fees received pursuant to any 12b-1 plan. The Independent Board Members, therefore, considered the 12b-1 fees retained by Nuveen during the last calendar year.
In addition to the above, the Independent Board Members considered whether each Fund Adviser received any benefits from soft dollar arrangements whereby a portion of the commissions paid by a Fund for brokerage may be used to acquire research that may be useful to the Fund Adviser in managing the assets of the Funds and other clients. The Independent Board Members recognized that each Fund Adviser has the authority to pay a higher commission in return for brokerage and research services if it determines in good faith that the commission paid is reasonable in relation to the value of the brokerage and research services provided. Nevertheless, the Independent Board Members noted that commissions are generally not paid in connection with municipal securities transactions typically executed on a principal basis.
Based on their review, the Independent Board Members concluded that any indirect benefits received by a Fund Adviser as a result of its relationship with the Funds were reasonable and within acceptable parameters.
F. Other Considerations
The Independent Board Members did not identify any single factor discussed previously as all-important or controlling. The Board Members, including the Independent Board Members, unanimously concluded that the terms of each Advisory Agreement are fair and reasonable, that the respective Fund Adviser’s fees are reasonable in light of the services provided to each Fund and that the Advisory Agreements be renewed.
| Nuveen Investments | 107 |
Notes
| 108 | Nuveen Investments |
Notes
| Nuveen Investments | 109 |
Glossary of Terms Used in this Report
Auction Rate Bond: An auction rate bond is a security whose interest payments are adjusted periodically through an auction process, which process typically also serves as a means for buying and selling the bond. Auctions that fail to attract enough buyers for all the shares offered for sale are deemed to have “failed,” with current holders receiving a formula-based interest rate until the next scheduled auction.
Average Annual Total Return: This is a commonly used method to express an investment’s performance over a particular, usually multi-year time period. It expresses the return that would have been necessary each year to equal the investment’s actual cumulative performance (including change in NAV or offer price and reinvested dividends and capital gains distributions, if any) over the time period being considered.
Average Effective Maturity: The market-value-weighted average of the effective maturity dates of the individual securities including cash. In the case of a bond that has been advance-refunded to a call date, the effective maturity is the date on which the bond is scheduled to be redeemed using the proceeds of an escrow account. In most other cases the effective maturity is the stated maturity date of the security.
Average Duration: Duration is a measure of the expected period over which a bond’s principal and interest will be paid, and consequently is a measure of the sensitivity of a bond’s (or bond fund’s) value to changes when market interest rates change. Generally, the longer a bond or Fund’s duration, the more the price of the bond or Fund will change as interest rates change.
Inverse Floaters: Inverse floating rate securities are created by depositing a municipal bond, typically with a fixed interest rate, into a special purpose trust created by a broker-dealer. This trust, in turn, (a) issues floating rate certificates typically paying short-term tax-exempt interest rates to third parties in amounts equal to some fraction of the deposited bond’s par amount or market value, and (b) issues an inverse floating rate certificate (sometimes referred to as an “inverse floater”) to an investor (such as a Fund) interested in gaining investment exposure to a long-term municipal bond. The income received by the holder of the inverse floater varies inversely with the short-term rate paid to the floating rate certificates’ holders, and in most circumstances the holder of the inverse floater bears substantially all of the underlying bond’s downside investment risk. The holder of the inverse floater typically also benefits disproportionately from any potential appreciation of the underlying bond’s value. Hence, an inverse floater essentially represents an investment in the underlying bond on a leveraged basis.
Lipper Michigan Municipal Debt Funds Average: Represents the average annualized total return for all reporting funds in the Lipper Michigan Municipal Debt Fund category. The Lipper Michigan Municipal Debt Funds Average contained 23, 17 and 16 funds for the 1-year, 5-year and 10-year periods, respectively, ended May 31, 2011.
Lipper Ohio Municipal Debt Funds Average: Represents the average annualized total return for all reporting funds in the Lipper Ohio Municipal Debt Fund category. The Lipper Ohio Municipal Debt Funds Average contained 43, 36 and 32 funds for the 1-year, 5-year and 10-year periods, respectively, ended May 31, 2011.
Lipper Other States Municipal Debt Funds Average: Represents the average annualized total return for all reporting funds in the Lipper Other States Municipal Debt Fund category. The Lipper Other States Municipal Debt Funds Average contained 144, 137 and 123 funds for the 1-year, 5-year and 10-year periods, respectively, ended May 31, 2011. Shareholders should note that the performance of the Lipper Other States Average represents the overall average of returns for funds from ten different states with a wide variety of municipal market conditions, making direct comparisons less meaningful.
Net Asset Value (NAV): A Fund’s NAV is the dollar value of one share in the Fund. It is calculated by subtracting the liabilities of the Fund from its total assets and then dividing the remainder by the number of shares outstanding. Fund NAVs are calculated at the end of each business day.
Pre-Refundings: Pre-Refundings, also known as advance refundings or refinancings, occur when an issuer sells new bonds and uses the proceeds to fund principal and interest payments of older existing bonds. This process often results in lower borrowing costs for bond issuers.
Standard & Poor’s (S&P) Kansas Municipal Bond Index: An unleveraged, market value-weighted index designed to measure the performance of the tax-exempt, investment-grade Kansas municipal bond market.
Standard & Poor’s (S&P) Kentucky Municipal Bond Index: An unleveraged, market value-weighted index designed to measure the performance of the tax-exempt, investment-grade Kentucky municipal bond market.
Standard & Poor’s (S&P) Michigan Municipal Bond Index: An unleveraged, market value-weighted index designed to measure the performance of the tax-exempt, investment-grade Michigan municipal bond market.
Standard & Poor’s (S&P) Missouri Municipal Bond Index: An unleveraged, market value-weighted index designed to measure the performance of the tax-exempt, investment-grade Missouri municipal bond market.
Standard & Poor’s (S&P) National Municipal Bond Index: An unleveraged, market value-weighted index designed to measure the performance of the tax-exempt, investment-grade U.S. municipal bond market.
Standard & Poor’s (S&P) Ohio Municipal Bond Index: An unleveraged, market value-weighted index designed to measure the performance of the tax-exempt, investment-grade Ohio municipal bond market.
Standard & Poor’s (S&P) Wisconsin Municipal Bond Index: An unleveraged, market value-weighted index designed to measure the performance of the tax-exempt, investment-grade Wisconsin municipal bond market.
Zero Coupon Bond: A zero coupon bond does not pay a regular interest coupon to its holders during the life of the bond. Tax-exempt income to the holder of the bond comes from accretion of the difference between the original purchase price of the bond at issuance and the par value of the bond at maturity and is effectively paid at maturity. The market prices of zero coupon bonds generally are more volatile than the market prices of bonds that pay interest periodically.
| 110 | Nuveen Investments |
Fund Manager
Nuveen Fund Advisors, Inc.
333 West Wacker Drive
Chicago, IL 60606
Sub-Adviser
Nuveen Asset Management, LLC
333 West Wacker Drive
Chicago, IL 60606
Legal Counsel
Chapman and Cutler LLP
Chicago, IL
Independent Registered Public Accounting Firm
PricewaterhouseCoopers LLP
Chicago, IL
Custodian
State Street Bank & Trust Company
Boston, MA
Transfer Agent and Shareholder Services
Boston Financial
Data Services, Inc.
Nuveen Investor Services
P.O. Box 8530
Boston, MA 02266-8530
(800) 257-8787
Quarterly Portfolio of Investments and Proxy Voting information: You may obtain (i) each Fund’s quarterly portfolio of investments, (ii) information regarding how the Funds voted proxies relating to portfolio securities held during the most recent twelve-month period ended June 30, and (iii) a description of the policies and procedures that the Funds used to determine how to vote proxies relating to portfolio securities without charge, upon request, by calling Nuveen Investments at (800) 257-8787 or on Nuveen’s website at www.nuveen.com.
You may also obtain this and other Fund information directly from the Securities and Exchange Commission (SEC). The SEC may charge a copying fee for this information. Visit the SEC on-line at http://www.sec.gov or in person at the SEC’s Public Reference Room in Washington, D.C. Call the SEC at (202) 942-8090 for room hours and operation. You may also request Fund information by sending an e-mail request to publicinfo@sec.gov or by writing to the SEC’s Public Reference Section at 100 F Street NE, Washington, D.C. 20549.
The Financial Industry Regulatory Authority (FINRA) provides a Public Disclosure Program which supplies certain information regarding the disciplinary history of FINRA members and their associated persons in response to either telephone inquiries at (800) 289-9999 or written inquiries at www.finra.org. FINRA also provides an investor brochure that includes information describing the Public Disclosure Program.
| Nuveen Investments | 111 |
Nuveen Investments:
Serving Investors for Generations
Since 1898, financial advisors and their clients have relied on Nuveen Investments to provide dependable investment solutions through continued adherence to proven, long-term investing principles. Today, we offer a range of high quality equity and fixed-income solutions designed to be integral components of a well-diversified core portfolio.
Focused on meeting investor needs.
Nuveen Investments is a global investment management firm that seeks to help secure the long-term goals of institutions and high net worth investors as well as the consultants and financial advisors who serve them. We market our growing range of specialized investment solutions under the high-quality brands of HydePark, NWQ, Nuveen Asset Management, Santa Barbara, Symphony, Tradewinds and Winslow Capital. In total, Nuveen Investments managed approximately $206 billion of assets as of March 31, 2011.
Find out how we can help you.
To learn more about how the products and services of Nuveen Investments may be able to help you meet your financial goals, talk to your financial advisor, or call us at (800) 257-8787. Please read the information provided carefully before you invest. Investors should consider the investment objective and policies, risk considerations, charges and expenses of any investment carefully. Where applicable, be sure to obtain a prospectus, which contains this and other relevant information. To obtain a prospectus, please contact your securities representative or Nuveen Investments, 333 W. Wacker Dr., Chicago, IL 60606. Please read the prospectus carefully before you invest or send money.
Learn more about Nuveen Funds at: www.nuveen.com/mf
Nuveen makes things e-simple.
It only takes a minute to sign up for e-Reports. Once enrolled, you’ll receive an e-mail as soon as your Nuveen Fund information is ready — no more waiting for delivery by regular mail. Just click on the link within the e-mail to see the report and save it on your computer if you wish.
Free e-Reports right to your e-mail!
www.investordelivery.com
If you receive your Nuveen Fund distributions and statements from your financial advisor or brokerage account.
OR
www.nuveen.com/accountaccess
If you receive your Nuveen Fund distributions and statements directly from Nuveen.
Distributed by Nuveen Securities, LLC 333 West Wacker Drive Chicago, IL 60606 www.nuveen.com |
MAN-MS6-0511D
Mutual Funds
Nuveen Municipal Bond Funds
(formerly First American Tax Free Income Funds)
Dependable, tax-free income because it’s not what you earn, it’s what you keep.®
Annual Report
May 31, 2011
| Share Class / Ticker Symbol | ||||||||
| Fund Name | Class A | Class C | Class C1 | Class I | ||||
Nuveen Colorado Tax Free Fund | FCOAX | — | FCCOX | FCOYX | ||||
Nuveen Minnesota Intermediate Municipal Bond Fund | FAMAX | NIBMX | FACMX | FAMTX | ||||
Nuveen Minnesota Municipal Bond Fund | FJMNX | NMBCX | FCMNX | FYMNX | ||||
Nuveen Missouri Tax Free Fund | ARMOX | — | FFMCX | ARMIX | ||||
Nuveen Nebraska Municipal Bond Fund | FNTAX | NCNBX | FNTCX | FNTYX | ||||
Nuveen Ohio Tax Free Fund | FOFAX | — | FOTCX | FOTYX | ||||
Nuveen Oregon Intermediate Municipal Bond Fund | FOTAX | NIMOX | — | FORCX | ||||
INVESTMENT ADVISER NAME CHANGE
Effective January 1, 2011, Nuveen Asset Management, the Funds’ investment adviser, changed its name to Nuveen Fund Advisors, Inc. (“Nuveen Fund Advisors”). Concurrently, Nuveen Fund Advisors formed a wholly-owned subsidiary, Nuveen Asset Management, LLC, to house its portfolio management capabilities.
NUVEEN INVESTMENTS COMPLETES STRATEGIC COMBINATION WITH FAF ADVISORS
On December 31, 2010, Nuveen Investments completed the strategic combination between Nuveen Asset Management, the largest investment affiliate of Nuveen Investments, and FAF Advisors. As part of this transaction, U.S. Bancorp — the parent of FAF Advisors — received cash consideration and a 9.5% stake in Nuveen Investments in exchange for the long-term investment business of FAF Advisors, including investment-management responsibilities for the non-money market mutual funds of the First American Funds family.
The approximately $27 billion of mutual fund and institutional assets managed by FAF Advisors, along with the investment professionals managing these assets and other key personnel, have become part of Nuveen Asset Management, LLC. With these additions to Nuveen Asset Management, LLC, this affiliate now manages more than $100 billion of assets across a broad range of strategies from municipal and taxable fixed income to traditional and specialized equity investments.
This combination does not affect the investment objectives or strategies of the Funds in this report. Over time, Nuveen Investments expects that the combination will provide even more ways to meet the needs of investors who work with financial advisors and consultants by enhancing the multi-boutique model of Nuveen Investments, which also includes highly respected investment teams at HydePark, NWQ Investment Management, Santa Barbara Asset Management, Symphony Asset Management, Tradewinds Global Investors and Winslow Capital. Nuveen Investments managed approximately $206 billion of assets as of March 31, 2011.
| Must be preceded by or accompanied by a prospectus. | NOT FDIC INSURED | MAY LOSE VALUE | NO BANK GUARANTEE |
| 4 | ||||
| 5 | ||||
| 21 | ||||
| 36 | ||||
| 38 | ||||
| 40 | ||||
| 42 | ||||
| 43 | ||||
| 44 | ||||
| 81 | ||||
| 82 | ||||
| 86 | ||||
| 90 | ||||
| 104 | ||||
| 119 | ||||
| 123 | ||||
| 126 | ||||
| 127 | ||||
Letter to Shareholders
Dear Shareholders,
In 2010, the global economy recorded another year of recovery from the financial and economic crises of 2008, but many of the factors that caused the downturn still weigh on the prospects for continued improvement. In the U.S., ongoing weakness in housing values has put pressure on homeowners and mortgage lenders. Similarly, the strong earnings recovery for corporations and banks is only slowly being translated into increased hiring or more active lending. Globally, deleveraging by private and public borrowers has inhibited economic growth and that process is far from complete.
Encouragingly, constructive actions are being taken by governments around the world to deal with economic issues. In the U.S., the recent passage of a stimulatory tax bill relieved some of the pressure on the Federal Reserve to promote economic expansion through quantitative easing and offers the promise of sustained economic growth. A number of European governments are undertaking programs that could significantly reduce their budget deficits. Governments across the emerging markets are implementing various steps to deal with global capital flows without undermining international trade and investment.
The success of these government actions could determine whether 2011 brings further economic recovery and financial market progress. One risk associated with the extraordinary efforts to strengthen U.S. economic growth is that the debt of the U.S. government will continue to grow to unprecedented levels. Another risk is that over time there could be inflationary pressures on asset values in the U.S. and abroad, because what happens in the U.S. impacts the rest of the world economy. Also, these various actions are being taken in a setting of heightened global economic uncertainty, primarily about the supplies of energy and other critical commodities. In this challenging environment, your Nuveen investment team continues to seek sustainable investment opportunities and to remain alert to potential risks in a recovery still facing many headwinds. On your behalf, we monitor their activities to assure they maintain their investment disciplines.
As you will note elsewhere in this report, on December 31, 2010, Nuveen Investments completed a strategic combination with FAF Advisors, Inc., the manager of the First American Funds. The combination adds highly respected and distinct investment teams to meet the needs of investors and their advisors and is designed to benefit all fund shareholders by creating a fund organization with the potential for further economies of scale and the ability to draw from even greater talent and expertise to meet those investor needs.
As always, I encourage you to contact your financial consultant if you have any questions about your investment in a Nuveen Fund. On behalf of the other members of your Fund Board, we look forward to continuing to earn your trust in the months and years ahead.
Sincerely,
Robert P. Bremner
Chairman of the Board
July 21, 2011
| 4 | Nuveen Investments |
Certain statements in this report are forward-looking statements. Discussions of specific investments are for illustration only and are not intended as recommendations of individual investments. The forward-looking statements and other views expressed herein are those of the portfolio managers as of the date of this report. Actual future results or occurrences may differ significantly from those anticipated in any forward-looking statements and the views expressed herein are subject to change at any time, due to numerous market and other factors. The Funds disclaim any obligation to update publicly or revise any forward-looking statements or views expressed herein.
Any reference to credit ratings for portfolio holdings denotes the highest rating assigned by a Nationally Recognized Statistical Rating Organization (NRSRO) such as Standard & Poor’s (S&P), Moody’s or Fitch. AAA, AA, A and BBB ratings are investment grade; BB, B, CCC, CC, C and D ratings are below investment grade. Holdings and ratings may change over time.
Nuveen Colorado Tax Free Fund
(formerly known as First American Colorado Tax Free Fund)
Nuveen Minnesota Intermediate Municipal Bond Fund
(formerly known as First American Minnesota Intermediate Tax Free Fund)
Nuveen Minnesota Municipal Bond Fund
(formerly known as First American Minnesota Tax Free Fund)
Nuveen Missouri Tax Free Fund
(formerly known as First American Missouri Tax Free Fund)
Nuveen Nebraska Municipal Bond Fund
(formerly known as First American Nebraska Tax Free Fund)
Nuveen Ohio Tax Free Fund
(formerly known as First American Ohio Tax Free Fund)
Nuveen Oregon Intermediate Municipal Bond Fund
(formerly known as First American Oregon Intermediate Tax Free Fund)
These Funds feature portfolio management by Nuveen Asset Management, LLC, an affiliate of Nuveen Investments. Recently, the Nuveen Colorado Tax Free Fund, the Nuveen Minnesota Intermediate Municipal Bond Fund, the Nuveen Minnesota Municipal Bond Fund, the Nuveen Missouri Tax Free Fund, the Nuveen Nebraska Municipal Bond Fund, the Nuveen Ohio Tax Free Fund and the Nuveen Oregon Intermediate Municipal Bond Fund changed their fiscal year ends to May 31 from June 30. As a result, this annual report covers an eleven-month period.
Here portfolio managers Daniel Close, Christopher Drahn, Michael Hamilton and Douglas White examine economic and municipal market conditions, key investment strategies and the Funds’ performance during the eleven months ending May 31, 2011.
Daniel Close, CFA, who has 13 years of investment experience, assumed portfolio management responsibility for the Nuveen Ohio Tax Free Fund in January 2011. Michael Hamilton and Christopher Drahn are no longer co-managers of the Fund.
Christopher Drahn, CFA, with 31 years of investment experience, assumed sole portfolio management responsibility for the Nuveen Colorado Tax Free Fund, the Nuveen Minnesota Intermediate Municipal Bond Fund and the Nuveen Missouri Tax Free Fund in January 2011. Michael Welle is no longer a co-manager of the Nuveen Colorado Tax Free Fund, while Douglas White is no longer a co-manager for the Nuveen Minnesota Intermediate Municipal Bond Fund and the Nuveen Missouri Tax Free Fund.
| Nuveen Investments | 5 |
Michael Hamilton, who has 22 years of investment experience, assumed sole portfolio management responsibility for the Nuveen Oregon Intermediate Municipal Bond Fund in January 2011. Christopher Drahn is no longer a co-manager of the Fund.
Douglas White, CFA, with 28 years of investment experience, assumed sole portfolio management responsibility for the Nuveen Minnesota Municipal Bond Fund and the Nuveen Nebraska Municipal Bond Fund in January 2011. Michael Welle and Christopher Drahn are no longer co-managers of the Funds.
What factors affected the U.S. economic and municipal market environments during the eleven-month reporting period ended May 31, 2011?
During this period, the U.S. economy demonstrated some signs of modest improvement, supported by the efforts of both the Federal Reserve (Fed) and the federal government. For its part, the Fed continued to hold the benchmark fed funds rate in a target range of zero to 0.25% since cutting it to this record low level in December 2008. At its June 2011 meeting (following the end of this reporting period), the central bank stated that it anticipated keeping the fed funds rate at “exceptionally low levels” for an “extended period.” The Fed also completed its second round of quantitative easing with the purchase of $600 billion in longer-term U.S. Treasury bonds. The goal of this plan was to lower long-term interest rates and thereby stimulate economic activity and create jobs. The federal government continued to focus on implementing the economic stimulus package passed in early 2009 and aimed at providing job creation, tax relief, fiscal assistance to state and local governments, and expansion of unemployment benefits and other federal social welfare programs.
In the first quarter of 2011, the U.S. economy, as measured by the U.S. gross domestic product (GDP), grew at an annualized rate of 1.9%, marking the seventh consecutive quarter of positive growth. The employment situation slowly improved, with the national jobless rate registering 9.1% in May 2011, down from 9.6% a year earlier. While the Fed’s longer-term inflation expectations remained stable, inflation over this period posted its largest twelve-month gain since October 2008, as the Consumer Price Index (CPI) rose 3.6% year-over-year as of May 2011. The core CPI (which excludes food and energy) increased 1.5%, staying within the Fed’s unofficial objective of 2.0% or lower for this measure. The housing market remained a major weak spot in the economy. For the twelve months ended April 2011 (most recent data available at the time this report was prepared), the average home price in the Standard & Poor’s (S&P)/Case-Shiller Index of 20 major metropolitan areas lost 4.0%, with six of the 20 metropolitan areas hitting their lowest levels since housing prices peaked in 2006.
The municipal bond market was affected by a significant decline in new tax-exempt issuance during this period. One reason for the decrease in new tax-exempt supply was the heavy issuance of taxable municipal debt in 2010 under the Build America Bond (BAB) program, which was created as part of the American Recovery and Reinvestment Act of February 2009 and expired on December 31, 2010. Between the beginning of this reporting period on June 1, 2010, and the end of the BAB program, taxable Build America Bond issuance totaled $74.5 billion, accounting for 28% of new bonds issued in the municipal market.
| 6 | Nuveen Investments |
After rallying strongly during the first part of the period, the municipal market suffered a reversal in mid-November 2010, due largely to investor concerns about inflation, the federal deficit, and the deficit’s impact on demand for U.S. Treasury securities. Adding to this market pressure was media coverage of the strained finances of some state and local governments. As a result, money began to flow out of municipal mutual funds as yields rose and valuations declined. As we moved into the second quarter of 2011, we saw the environment in the municipal market improve.
Over the eleven months ended May 31, 2011, municipal bond issuance nationwide — both tax-exempt and taxable — totaled $315.5 billion. For the first five months of 2011, municipal issuance nationwide was down 50% from the first five months of 2010. This decline reflects the heavy issuance of BABs at the end of 2010, as borrowers took advantage of the program’s favorable terms before its expiration at year end.
Yields generally rose across the curve in the last half of 2010, but then reversed course and declined in the first five months of 2011. The municipal yield curve steepened with yields on 15-year and longer maturity bonds showing a net rise for the overall period. Rates generally fell for short- and intermediate-term bonds that had maturities of ten years or less. For the period, total returns were generally positive for municipal bond maturities across the yield curve; however, intermediate bonds with maturities between five and ten years were the best-performing segment during the time frame.
Colorado
Colorado’s unemployment rate was 8.7% at the end of the reporting period, slightly better than the national average of 9.1%. Recently, job growth in Colorado has started to accelerate, ranking in the nation’s second quintile — this growth is driven by the professional services, health care and leisure/hospitality industries. In the Denver area, major projects such as the redevelopment of the former Fitzsimons Army Base and the construction of the FasTracks public transportation project are underway. Despite these positive growth characteristics, Colorado faces challenges resulting from the recession. However, Colorado’s near-term difficulties are moderate compared to those of other states, and it has demonstrated a proactive approach to addressing fiscal concerns, especially over the past few challenging years. At the end of the fiscal period, Colorado held credit ratings of Aa2 and AA- from Moody’s and S&P, respectively, on its long-term appropriation-backed obligations. The state’s constitution prohibits the state from issuing long-term general obligation (GO) debt. During the reporting period, Colorado issued $6.9 billion in municipal bonds, nearly matching the level seen in the prior twelve-month period, as compared to a 15.1% drop in national issuance.
Minnesota
Although the recovery in Minnesota’s economy stumbled somewhat at the end of 2010, it still continued to be stronger than the United States overall as unemployment figures have been lower than the national average and job growth has been above average. The state’s unemployment rate of approximately 6.4% is significantly below the national average of
| Nuveen Investments | 7 |
9.1%. Minnesota’s current biennial budget for the 2010 and 2011 fiscal years ended on June 30, 2011 (after the close of this reporting period). State government was forced to partially shut down for nearly three weeks as newly elected Democratic governor Mark Dayton and the Republican-controlled legislature could not agree over how to close a $1.3 billion budget gap. On July 20 the governor and legislature finally agreed to a two-year $35.7 billion budget which defers $700 million in school spending into the next biennium and calls for issuing approximately $600 million in bonds secured by revenues from the 1998 tobacco companies lawsuit settlement. Although the shutdown was somewhat out of the ordinary, the magnitude of the gap was still modest compared to the deficits many other states had to close. In addition, Minnesota is still regarded as having a good fiscal track record, a diversified economy, and above-average wealth levels.
Much of the municipal bond issuance that took place in 2010 was in intermediate maturity securities as many Minnesota borrowers used the Build America Bond (BAB) program to issue longer maturities, directing supply into the taxable marketplace. This made the availability of longer maturity, tax-exempt bonds quite limited in the state. For the first five months of 2011, state issuance was down nearly 20% versus the same period last year compared to a 50% decline in issuance at the national level. At period end, Minnesota held credit ratings of Aa1 from Moody’s and AAA from Standard & Poor’s, respectively. The state’s credit position reflected its well-balanced and diverse economy, above-average wealth levels, moderate debt burden and strong debt management balanced by recent fiscal strains caused by below-budget income and sales tax revenues.
Missouri
For 2010, Missouri posted GDP growth of 1.4%, compared with the national measure of 2.6%, which ranked Missouri 39th in percentage GDP growth by state. Although this represented a significant turnaround from 2009, when Missouri’s economy contracted 3.8%, the state’s heavy reliance on the manufacturing sector has hampered its ability to more fully participate in recovery. In May 2011, the jobless rate in Missouri was 8.9%, its lowest level since March 2009, down from 9.5% in May 2010. In May 2011, the Missouri legislature approved a $23.2 billion state budget for fiscal 2012 that cut funding for colleges and universities by 5.5% and held basic aid for K-12 education flat. As of May 2011, Moody’s and S&P rated Missouri general obligation debt at Aaa and AAA, respectively, with stable outlooks. During the twelve months ended May 31, 2011, municipal issuance in Missouri was down 28% from the previous twelve-month period, to $4.6 billion.
Nebraska
Nebraska’s economic recovery remained ahead of much of the nation as the impact from the recent recession was less severe. Throughout the downturn, unemployment in the state has remained far below the national average, while job growth finally appears to be gaining some traction after giving back some gains in 2010. In fact, job additions within education, health care and professional services have outweighed some job losses for
| 8 | Nuveen Investments |
goods producers. As of May 2011, Nebraska’s unemployment rate fell to 4.1%, which is well below the national average of 9.1%.
The state has a high dependence on the agriculture and food processing industries, which are benefiting from the recent trend toward higher food costs. Nebraska is one of the top five exporters of corn and soybeans in the United States and futures prices for both crops are up significantly from a year ago. In fact, prices are nearing or surpassing their 2008 highs. Not only will higher prices benefit farmers and food producers, but the effects should spill over to the manufacturing and retail sectors as well. Nebraska is also gaining ground as a transportation hub for the country, which is resulting in higher wages in rail and trucking transportation than the U.S. average.
During the first five months of 2011, Nebraska’s municipal bond issuance was down 31% from the same period last year, compared to a 50% decrease at the national level. The decline in issuance made the availability of longer maturity, tax-exempt bonds quite limited in the state. At period end, Nebraska held credit ratings of Aa2 from Moody’s and AAA from Standard & Poor’s.
Ohio
Ohio’s economy continued to slowly improve with its job market finally turning the corner in 2011 after giving up many of its gains in 2010. The state’s unemployment rate in May 2011 was 8.6%, which was slightly below the national average of 9.1%. This is down from its peak of 10.6% at the beginning of 2010. However, Ohio’s housing market continues to weigh on the state due to a high inventory of foreclosed properties on the market, particularly in the larger metropolitan areas of Cincinnati, Dayton and Toledo. While the housing price decline in Ohio has been less severe than the nation overall, prices are likely to fall further before bottoming out this year. Ohio’s economy is widely diversified, but the manufacturing sector still accounts for more than 12% of the jobs in the state versus the national average of approximately 9%. Although this sector benefited from inventory replenishing early in the recovery, that trend has since waned. Also, the higher commodity prices experienced recently have put pressure on the state’s manufacturers in terms of both raw material and production costs. As manufacturing jobs continue to decline, job growth in other areas such as education and health services have not been able to completely offset the trend.
Over the past few years, Ohio’s structurally unbalanced operations have completely exhausted its Budget Stabilization Fund and drawn down its General Fund reserves, reducing the state’s ability to address future budget shortfalls. The current budget contains considerable funding cuts for local governments, universities, schools and nursing homes in an effort to close an estimated $6 billion shortfall over the next two years.
The state issued approximately $12.8 billion in new municipal bonds during the year ending May 31, 2011, which is a 14% year-over-year increase, compared to a 15% decrease in issuance nationwide. However, Ohio’s year-to-date issuance through May 2011 is down dramatically, nearly 70% lower than the same five-month period a year ago. Toward the end of the fiscal period, Moody’s and Standard & Poor’s reaffirmed Ohio’s credit ratings of Aa1 and AA+, respectively.
| Nuveen Investments | 9 |
Oregon
Oregon’s economic recovery finally appeared to be gaining some momentum as the state makes a transition away from its agricultural and natural resources focus and more toward technology. In October, Intel announced a $6 billion investment to build a new research and development plant in Portland, which should help bolster the state’s economy. The state’s unemployment rate has steadily improved since it peaked as the second highest level in the nation in June 2009. As of May 2011, Oregon’s unemployment rate stood at 9.3%, slightly above the national average.
Oregon has shown strong budgetary controls as the state was able to close an estimated $3.8 billion budget gap with its current $13 billion two-year budget that ends this year. In February, the Governor released his proposed 2011-2013 biennium budget of $14.55 billion that addresses another $3.5 billion gap due to the loss of federal stimulus money and increases to service expenses. The budget deals with the shortfall through cuts to K-12 funding, limits to state worker’s wages, and reductions in human services and juvenile corrections. In Oregon, personal income taxes make up a substantial percentage of the state’s revenues and the recent recession caused a dramatic 18.4% reduction in this income source from its high in fiscal year 2008. Also, with Oregon employing a higher percentage of government workers than the national average, any budget solutions that result in state and local government layoffs or furloughs will impact the economy to a greater degree than other states.
Approximately $3.8 billion in Oregon municipal bonds were issued during 2010, an 11.8% decline from the previous year, compared to a 5.8% increase in issuance nationwide. For the first five months of 2011, state issuance is down another 30.5% compared to a 50% decrease at the national level. In March 2011, Standard & Poor’s raised the state’s credit rating from AA to AA+, which also raised state agencies and related debt one notch. Oregon holds a credit rating of Aa1 from Moody’s.
How did the Funds perform during the eleven-month period ended May 31, 2011?
The tables in the Fund Performance and Expense Ratios section of this report provide total return performance information for the eleven-month, one-year, five-year, ten-year and since inception periods ending May 31, 2011. Each Fund’s Class A Share total returns are compared with the performance of the appropriate Barclays Capital municipal bond index and Lipper peer fund average.
What strategies were used to manage the Funds during the eleven-month reporting period? How did these strategies influence performance?
All of the Funds continued to employ the same fundamental investment strategies and tactics used in previous years, although our ability to implement those strategies depended on the individual characteristics of the portfolios, as well as market conditions within each state. Going into the reporting period, we were generally comfortable with the Funds’ positionings and saw little need to make large-scale shifts to the Funds’ weightings.
| 10 | Nuveen Investments |
Nuveen Colorado Tax Free Fund
The Fund’s Class A Shares at net asset value (NAV) outpaced both the Lipper Colorado Municipal Debt Funds Average and the Barclays Capital Municipal Bond Index for the eleven-month period.
As in all types of market environments, our ongoing focus continued to be on using fundamental credit research to find attractively valued bonds backed by financially solid issuers. Fund results generally benefited from a slight emphasis on intermediate maturities in the mid to lower credit rating categories for much of the period. Although longer maturity, lower rated bonds were the worst performers overall for the period, they did rebound in 2011. Performance also benefited from several purchases made in the second half of the period. Given the rise in yields and the steepness of the yield curve, we decided to position the Fund more aggressively from a maturity standpoint by buying a number of longer bonds in 2011. This served to maintain the Fund’s duration, or sensitivity to interest-rate movements, modestly longer than its Barclays Capital index. To fund these purchases, we used the proceeds from the tactical sales of several bonds and a few called bonds.
Performance was also aided by a number of these tactical sales during the period, which we typically make in the Fund as opportunities arise. With these tactical trades, we sell holdings that are relatively fully priced and replace them with bonds that we believe have more attractive long-term value. These tactical sales usually take place when demand is high or particularly focused on specific structures or characteristics. Additionally, the Fund’s performance benefited from several special situations where bonds were pre-refunded or called during the period. As an example, a number of non-rated, Colorado private school bonds trading at a discount were called. The bonds were issued by the Colorado Educational and Cultural Facilities Authority for the Front Range Christian School.
The purchases we made for the Fund were fairly diversified across the investment-grade spectrum, except for AAA-rated bonds which are typically scarce in Colorado. Due to the limited supply in 2010, we bought a small number of out-of-state bonds. We sold those positions before the end of the fiscal year, ending with more than 99% of the Fund’s portfolio in Colorado-exempt bonds as we were able to add longer maturity bonds from a variety of Colorado issuers and sectors. For example, we added school district general obligation (GO) bonds rated Aa2/AA- from Mapleton School District in Adams County during the period. Additionally, we purchased Twin Peaks Charter Academy bonds rated BBB- from the Colorado Educational and Cultural Facilities Authority. We also found several attractive opportunities in investment-grade, tax-backed metropolitan district bonds, which are used to finance real-estate development projects. They typically have a lower credit quality rating than a bond issued by a more established city or county. An example here was the purchase of an insured GO bond from the Park Creek Metropolitan District. As a result of the purchases, the Fund ended the period positioned with an underweight in one- to five-year bonds, a fairly neutral position in five- to 20-year maturities and a slight overweight in bonds longer than 20 years. As has historically been the case, we continued to overweight the health care sector, particularly hospitals, and the education sector, including both charter schools and higher education bonds.
| Nuveen Investments | 11 |
Nuveen Minnesota Intermediate Municipal Bond Fund
The Fund’s Class A Shares at net asset value (NAV) outpaced both the Lipper Intermediate Municipal Debt Funds Average and the Barclays Capital 1-15 Year Blend Municipal Bond Index for the eleven-month period.
The Fund’s performance benefited from its overweight position in bonds with intermediate maturities, as this was the best-performing segment of the yield curve during the period. We generally laddered the Fund’s holdings out to 15 years, with a modest overweight in the seven- to ten-year part of the yield curve and a slight underweight in two- to five- year bonds. In comparison, the Barclays Capital 1-15 Year Blend Municipal Bond Index is comprised of bonds with maturities spread out fairly evenly between one and seventeen years. We believe the Fund also benefited from both security selection and the general outperformance of Minnesota bonds versus the rest of the country. Minnesota is one of the higher rated states and has lately been one of the stronger performers as the market’s perception of its credit risk is low.
In terms of credit quality, the Fund’s performance in rating segments ranging from AA to BBB was positive overall during the period. However, the Fund’s overweighting in non-rated securities slightly hindered performance as this segment fell short of the broader Minnesota market.
Performance was also aided by a number of tactical sales during the period, which we typically make in the Fund as opportunities arise. With these tactical trades, we sell holdings that are relatively fully priced and replace them with bonds that we believe have more attractive long-term value. These tactical sales usually take place when demand is high or particularly focused on specific structures or characteristics.
The Fund also benefited from several purchases made in early 2011. Given the steepness of the yield curve and the rise in rates that had transpired, we decided to position the Fund more aggressively from a maturity standpoint by buying a number of longer bonds in January. This lengthened the Fund’s duration, or sensitivity to interest-rate movements, which had already been positioned modestly longer than the duration of the Barclays Capital index. To fund these purchases, we used the proceeds from a few called bonds as well as several bonds we were able to tactically sell at advantageous prices.
Our ongoing focus continued to be on using fundamental credit research to find attractively valued bonds backed by financially solid issuers. The purchases we made in the Fund were fairly diversified from a ratings and sector standpoint. As has historically been the case, we favored higher education bonds and health care bonds, particularly hospitals. For example, we bought Rochester Mayo Clinic bonds rated AA (S&P), Gillette Children’s Hospital bonds rated A- (S&P) and Minnesota Higher Education Hamline University bonds rated BBB. We also added to the Fund’s utilities exposure with electric revenue bonds rated A- (S&P) from the Northern Municipal Power Agency. Other notable purchases included a strip of maturities of general obligation (GO) bonds rated Aaa3 (Moody’s) from the City of Bemidji. Conversely, we sold a non-rated, continuing care facility bond as we were unsure about its long-term prospects.
We did not strategically change the Fund’s ratings profile during the period. We maintained our emphasis on mid-quality bonds, A- and BBB-rated, which we have done
| 12 | Nuveen Investments |
historically due to the beneficial income attributes and manageable credit risk we believe these positions represent. We also continued to underweight AAA- and AA-rated bonds. The Fund’s exposure to AAA-rated bonds fell slightly during the period as one bond insurer experienced a downgrade, which brought several holdings down to an AA credit quality rating. These downgrades did not affect the Fund’s performance and only slightly impacted the overall credit quality of the portfolio.
Nuveen Minnesota Municipal Bond Fund
The Fund’s Class A Shares at net asset value (NAV) outpaced the Lipper Minnesota Municipal Debt Funds Average for the eleven-month period. However, the Fund trailed the Barclays Capital Municipal Bond Index over this time frame.
The biggest positive contributor to the Fund’s performance during the period was its longer duration, or sensitivity to interest-rate movements, versus the Barclays Capital index. Given the steepness of the yield curve, we maintained this longer duration stance throughout the period. The Fund also benefited from its holdings at the longer end of its maturity spectrum, specifically bonds with maturities of 17 years and beyond. For the most part, bonds with maturities under 17 years did not have a positive impact on performance.
Individual security selection and select sector positioning also contributed positively to results. For example, the Fund benefited from an overweight position in health care holdings as well as more favorable bond selection within the segment. Health care, which is an area the Fund has historically overweighted, was an outperforming sector during the period. In the local general obligation (GO) bond segment, the Fund was rewarded for an underweight position in this underperforming sector as well as stronger bond selection. The Fund also benefited from positive security selection in housing and transportation bonds. On the negative side, the Fund was hurt by an underweight stance and poor security selection in the state GO sector and an underweight position in water and sewer bonds.
In terms of credit quality, the Fund benefited from its overweight position in the lower categories, including A-rated, BBB-rated and non-rated bonds. Overall, these lower credit qualities were the better performers during the eleven-month period. The Fund’s results were negatively impacted by its selection of AAA-rated bonds, which underperformed for the most part during the period. However, the Fund’s was underweight in the AAA-rated segment of the market which helped comparative performance.
Because of the steep yield curve, we decided to position the Fund more aggressively from a maturity standpoint by purchasing a number of bonds in the 20- to 30-year range. While the Fund’s duration was only slightly lengthened, this did increase its average maturity by more than two years. As a result of the purchases, the Fund’s overweight in longer maturities of more than 20 years is now more pronounced than it was in the previous reporting period. In the remainder of the portfolio, we’ve maintained a generally laddered structure with relatively equal weights in maturities between eight and 20 years.
In order to make these purchases, we liquidated some positions in higher quality, intermediate maturity GO bonds and drew down the Fund’s cash level, which had been as high as 7% at the beginning of the reporting period. Cash had been elevated because the supply of longer maturity municipal bonds was more limited in Minnesota last year and we weren’t able to find attractive buying opportunities.
| Nuveen Investments | 13 |
The purchases we made were primarily in mid-quality bonds in sectors such as higher education, hospitals, continuing care facilities and miscellaneous revenue, which offered more attractive spreads. Through these purchases, we meaningfully increased the Fund’s emphasis on mid-quality bonds rated A and BBB. For example, A-rated bonds increased from approximately 30% to 34% and BBB-rated bonds went from approximately 6% to 15% of the Fund’s net assets during the period, while AAA-rated holdings were reduced from approximately 18% to 11%. We have historically overweighted these mid-grade rating categories due to the beneficial income attributes and manageable credit risk we believe these positions represent. We also continued to underweight AAA- and AA-rated bonds in the Fund’s portfolio.
As is typically the case, we engaged in a number of tactical sales in the Fund as opportunities arose. With these tactical trades, we sell holdings that we can obtain full prices for and replace them with bonds that we believe have more attractive long-term values. These transactions typically take place with investors who are looking for bonds with certain types of structures or characteristics and are willing to pay us full prices for bonds that we own.
Nuveen Missouri Tax Free Fund
The Fund’s Class A Shares at net asset value (NAV) outpaced both the Lipper Other States Municipal Debt Funds Average and the Barclays Capital Municipal Bond Index for the eleven-month period.
The Fund experienced strong outperformance for the period due to several factors. Missouri in general was one of the stronger performing states over the past eleven months, benefiting from a big drop-off in new issue supply, strong demand for municipal bonds and the state’s solid fiscal position. Missouri is also one of only a handful of states that has a long-term AAA S&P rating/Aaa Moody’s rating for its state general obligation (GO) bonds. The Fund’s performance was also helped by a sizeable position in a 20-year, A1/AA- rated Kansas City Special Facilities revenue bond that was pre-refunded during the period. The bond’s price rose significantly due to the pre-refunding, which effectively converted the bond into a four-year maturity and also increased its credit quality (reflecting the government security collateralization now backing the bond). Additionally, the Fund benefited from its purchases of primarily intermediate maturity bonds in 2010. Although the BAB program had reduced long-term, tax-exempt issuance in 2010, the intermediate segment of the yield curve was still the best-performing area overall for the period. After yields backed up and the yield curve steepened, results were also aided by several purchases of longer maturity bonds in 2011.
Performance also benefited from a number of tactical sales during the period, which we typically make in the Fund as opportunities arise. With these tactical trades, we sell holdings that are relatively fully priced and replace them with bonds that we believe have more attractive long-term value. These tactical sales usually take place when demand is high or particularly focused on specific structures or characteristics.
We used the proceeds from the tactical sales and called bonds to fund new purchases in the portfolio. As mentioned in the state’s overview, the supply of bonds in Missouri was down nearly 28% over the past year. Additionally, the majority of tax-exempt bonds that
| 14 | Nuveen Investments |
did come to market in 2010 were more weighted in the short and intermediate maturity range. Most of the purchases we made in the Fund in the second half of 2010 were in intermediate maturities. The Build America Bond program expired at the end of 2010, but supply did not pick up and has fallen even more in 2011. Municipalities are being conservative and hesitant to approve new projects that would require municipal bond issuance. As a result, opportunities in the longer maturity, new issue market continued to be somewhat constrained.
As mentioned earlier, we made a few longer maturity purchases. For example, we bought some A1 rated, Puerto Rico sales tax revenue bonds for the Fund. These bonds are double tax-exempt in all states and can be advantageous when state bond supply is low. We also invested in BBB rated, Rockhurst University revenue bonds issued by the Missouri Health & Educational Facilities Authority in January that we felt were attractively priced. In addition, we purchased A+ rated GO bonds from the city of Belton, Missouri. As has historically been the case, we continued to overweight health care bonds in the Fund’s portfolio, particularly hospitals.
The Fund’s duration, or sensitivity to interest-rate movements, was modestly longer than its benchmark. The Fund ended the period with an underweight to 1- to 10-year bonds, a slight overweight in 10- to 20-year maturities and a fairly neutral position in bonds longer than 20 years.
We did not strategically change the Fund’s ratings profile during the period. We maintained our overweight to mid-quality (A-rated and BBB-rated) and non-rated bonds, which we have done historically due to the beneficial income attributes and manageable credit risk we believe these positions represent. We also continued to be underweight AAA- and AA-rated bonds.
Nuveen Nebraska Municipal Bond Fund
The Fund’s Class A Shares at net asset value (NAV) outpaced both the Lipper Other States Municipal Debt Funds Average and the Barclays Capital Municipal Bond Index for the eleven-month period.
The biggest positive contributors to the Fund’s performance during the period were its security selections within certain sectors as well as select sector weightings. For example, the Fund benefited from both overweight stances as well as stronger bond selections within three outperforming sectors during the period: health care, education and local general obligation (GO) bonds. Health care and education are two areas that we have historically favored and overweighted in the Fund. Results were also enhanced by an overweight position in electric revenue bonds, another segment that surpassed the index during the time frame. On the negative side, the Fund was hurt by an underweight stance and poor security selection in the state GO sector, an area that also outperformed. Results were also impacted by weaker security selection in pre-refunded bonds, although the Fund’s underweight position in this underperforming segment of the market was helpful.
The Fund’s slightly shorter duration, or sensitivity to interest-rate movements, than the Barclays Capital index was a slight drag on performance during the period. Because of
| Nuveen Investments | 15 |
the steepness of the yield curve, we would have liked to extend the Fund’s duration, but the extremely low supply of longer maturity bonds in Nebraska prevented us from doing so. However, the security selection and sector positioning mentioned earlier more than offset the negative impact of the Fund’s shorter duration. The holdings the Fund did have at the longer end of its maturity spectrum, specifically bonds with maturities of 15 years and beyond, helped performance. For the most part, bonds with maturities under 15 years did not have a positive impact on performance.
In terms of credit quality, the Fund was rewarded for its overweight position in the mid and lower categories, including A-rated and non-rated bonds. Overall, these lower credit qualities were the better performers during the eleven-month period. The Fund’s results were negatively impacted by its AAA-rated bonds, which underperformed for the most part during this time frame. However, the Fund was underweight in the AAA-rated segment of the market which helped comparative performance.
Despite the shortage of supply in the state, we were able to find a few opportunities to buy bonds in the 20- to 30-year range. While the Fund’s duration was little changed by these purchases, its average maturity lengthened by more than two years. To make these purchases, we deployed the cash we received from several called bonds as well as the proceeds from some high-quality bonds that we liquidated. Because of the purchases we made, the Fund’s overweight in longer maturities of more than 20 years is now more pronounced than it was in the previous reporting period. In the remainder of the portfolio, we’ve maintained a generally laddered structure with relatively equal weights in maturities between 8 and 20 years.
The bonds we selected were primarily mid and lower quality (BBB, A and non-rated) in sectors such as higher education and hospitals where some supply was available. For example, we added to the Fund’s existing position in non-rated Nebraska Educational Finance Authority bonds issued for Concordia University in Seward. We also purchased a new position in Immanuel Obligated Group bonds rated A- by Fitch issued by the Hospital Authority No. 1 in Lancaster County.
As a result of the recent purchases, we increased the Fund’s emphasis to mid-quality bonds. For example, its exposure to BBB-rated bonds, which typically aren’t issued very often in the state of Nebraska, increased from approximately 0% to 4% of the Fund’s net assets during the period. The Fund’s non-rated position went from approximately 9% to 18% during this time frame and its A-rated bonds increased slightly from approximately 32% to 26%. We have historically overweighted these mid-grade credit qualities due to the beneficial income attributes and manageable credit risk we believe these positions represent. We also continued to underweight AAA- and AA-rated bonds in the Fund, decreasing its AAA exposure to from approximately 16% to 12% of net assets. Additionally, we reduced the Fund’s exposure to the GO and miscellaneous revenue categories, while adding to the higher education sector.
Nuveen Ohio Tax Free Fund
The Fund’s Class A Shares at net asset value (NAV) outpaced the Lipper Ohio Municipal Debt Funds Average for the eleven-month period. However, the Fund trailed the Barclays Capital Municipal Bond Index over this time frame.
| 16 | Nuveen Investments |
The Fund’s performance benefited from its longer duration, or sensitivity to interest-rate movements, versus the Barclays Capital index. Given the steepness of the yield curve, we maintained this longer duration stance throughout the period. Specifically, our portfolio’s position in shorter maturities was beneficial; however, an overweight to the longest maturities detracted from performance as this specific portion of the yield curve was the worst-performing area during the period.
In terms of sectors, performance was enhanced by strong security selection in health care, a sector we typically overweight. This favorable bond selection outweighed the negative effects of the overweight as this sector underperformed the index for this time frame. Conversely, the Fund’s underweight in state general obligation (GO) bonds hindered results as the sector was one of the better performers during the period. Also, the Fund’s overweight position in BBB-rated bonds hurt performance as this credit quality segment fell short of the index.
Purchasing activity was fairly muted in the Fund during the period because of the supply shortage of Ohio bonds discussed in the state’s overview. The purchases we made for the Fund were mainly confined to two sectors: health care, and water and sewer. We were able to find select opportunities in the health care sector as some new-issue deals came to market in Ohio during the period. For example, we bought AA-rated bonds from northeast Ohio’s Cleveland Clinic Health System, Toledo-based Promedica Health System, and Catholic Healthcare Partners, the largest health system in Ohio. In the secondary market, we found an opportunity to add a water and sewer position in the Fund: A-rated bonds from the City of Marysville Wastewater System. Other than these purchases, we did not meaningfully change the Fund’s ratings profile or sector weightings during the period.
The Fund also experienced net outflows over the period. In order to facilitate these outflows, we sold some pre-refunded bonds and used the proceeds from several called bonds and from the tactical selling of some lower coupon, intermediate maturity bonds. With the tactical moves, we sold various positions in the secondary market to retail investors who were looking for bonds with certain types of structures or characteristics and were willing to pay us attractive prices.
Nuveen Oregon Intermediate Municipal Bond Fund
The Fund’s Class A Shares at net asset value (NAV) performed basically in line with its two benchmarks during the eleven-month period, slightly outpacing the Lipper Intermediate Municipal Debt Funds Average and outperformed the Barclays Capital 1-15 Year Blend Municipal Bond Index.
The largest positive contributor to the Fund’s performance during the period was its maturity distribution. The Fund benefited from an overweight position in bonds with maturities in the eight- to twelve-year range as intermediate bonds outperformed during this time frame. Also, an underweight to bonds with maturities less than four years aided results. From a ratings standpoint, the Fund’s underweight to AAA-rated securities was detrimental as that segment outperformed; however, our strong security selection within the AAA segment cancelled out any negative impact. Also, the Fund’s overweight in lower rated bonds, including BBB and non-rated, hurt performance as these segments underperformed the index.
| Nuveen Investments | 17 |
On a sector basis, performance benefited from favorable security selection in hospital bonds, which offset the negative effects of our overweight position in this underperforming sector. However, the biggest drag on performance was the Fund’s underweight to state general obligation (GO) bonds, one of the better performing sectors during the period. As investors’ concerns about the credit quality of municipal bond issuers increased, they turned to bonds that are backed by larger sources of revenues such as states. We tend to avoid investing in state GO bonds because they typically offer lower yields than other types of municipal bonds.
During the period, our overweight to the longer end of the intermediate maturity range and underweight in shorter term bonds helped keep the Fund’s duration, or sensitivity to interest rates changes, longer than the Barclays Capital index. The index is comprised of bonds with maturities spread out fairly evenly between 1 and 17 years. We sought to maintain this longer duration throughout the period and traded bonds accordingly to keep the Fund positioned that way.
In addition to the credit quality weightings mentioned above, the Fund remained very overweighted in AA-rated bonds and neutral in A-rated bonds. One of the reasons for the large AA overweight is that the state of Oregon is heavily populated by those credits. This is largely the result of its School Bond Guaranty Program, which allows lower rated school districts to go to the state and have their bonds wrapped by the program, thus receiving a credit rating of the state of AA+ and Aa1 from S&P and Moody’s, respectively.
In terms of other sector weights, the Fund had slightly higher-than-index positions in education, local GOs, and water and sewer bonds. As in all types of market environments, our ongoing focus continued to be on using fundamental credit research to find attractively valued bonds backed by financially solid issuers. We were able to add a few positions to the portfolio despite the infrequent number of issues that came to market in Oregon during the period. In particular, we found compelling opportunities in the higher education sector including: BBB-rated issues from Linfield College, AA-rated bonds from Reed College and A-rated issues from Lewis & Clark College.
Finally, the Fund did experience net outflows over the period. In order to facilitate these outflows, we sold some bonds due in less than two years and made a number of tactical sales of longer maturity positions. With these tactical moves, we sold various odd-lot positions in the secondary market to investors who were looking for bonds with certain types of structures or characteristics and were willing to pay us full prices. We were patient and received very favorable prices for a number of Oregon bonds that we tactically sold.
Risk Considerations
Mutual fund investing involves risk; principal loss is possible. Debt or fixed income securities are subject to credit risk and interest rate risk. The value of, and income generated by debt securities will decrease or increase based on changes in market interest rates. As interest rates rise, bond prices fall. Credit risk refers to an issuer’s ability to make interest and principal payments when due. Credit risk is heightened for below investment grade bonds. A concentration in specific states exposes the Funds to the additional risks facing issuers in those states.
| 18 | Nuveen Investments |
Dividend Information
Nuveen Colorado Tax Free Fund
The Class A Shares of the Nuveen Colorado Tax Free Fund had dividend increases in November 2010 and February and May 2011 and a dividend reduction in August, September and October 2010. The Class C1 Shares had dividend increases in November 2010 and January and May 2011 and a dividend reduction in August, September and October 2010 while the Fund’s Class I Shares had a dividend increase in May 2011 and dividend reductions in August, September and October 2011..
Nuveen Minnesota Intermediate Municipal Bond Fund
The Class A Shares of the Nuveen Minnesota Intermediate Municipal Bond Fund had one dividend increase in January 2011 and dividend reductions in August 2010 and February 2011. The Fund’s Class C Shares had a dividend increase in February 2011. The Fund’s C1 Shares had dividend increases in September and November 2010 and January and February 2011 and dividend reductions in August, October and December 2010. The Fund’s Class I Shares had a dividend increase in January 2011 and a dividend reduction in August 2010.
Nuveen Minnesota Municipal Bond Fund
The Class A Shares of the Nuveen Minnesota Municipal Bond Fund had dividend increases in September 2010 and January and May 2011 and dividend reductions in August 2010 and February 2011. The Fund’s Class C Shares had dividend increases in February and May 2011. The Fund’s Class CI Shares had dividend increases in September and November 2010 and January 2011 and dividend reductions in August and October 2011 and February 2011. The Fund’s Class I Shares had a dividend increase in September 2010 and January and May 2011 and a dividend reduction in August 2010.
Nuveen Missouri Tax Free Fund
The Class A Shares of the Nuveen Missouri Tax Free Fund had dividend increases in September, October and November 2010 and January 2011 and dividend reductions in August 2010 and February 2011. The Fund’s Class C1 Shares had dividend increase in September, October and November 2010 and January 2011 and dividend reductions in August and September 2010 and February 2011. The Fund’s Class I Shares had dividend increases in September, October and November 2010 and January 2011 and a dividend reduction August 2010.
Nuveen Nebraska Municipal Bond Fund
The Class A Shares of the Nuveen Nebraska Municipal Bond Fund had dividend increases in November 2010 and January and February 2011 and dividend reductions in December 2010 and May 2011. The Fund’s Class C Shares had a dividend reduction in February and May 2011. The Fund’s Class C1 Shares had dividend increases in September and November 2010 and January 2011 and dividend reductions in October 2010 and May 2011. The Fund’s Class I Shares had a dividend increase in November 2010 and a dividend reduction in May 2011.
| Nuveen Investments | 19 |
Nuveen Ohio Tax Free Fund
The Class A Shares of the Nuveen Ohio Tax Free Fund experienced dividend increases in December 2010 and January and February 2011 and a dividend reduction in October 2010. The Fund’s Class C1 Shares experienced dividend increases in September and November 2010 and January 2011 and a dividend reduction in October 2010 and February 2011. The Fund’s Class I Shares maintained the same dividend throughout the period.
Nuveen Oregon Intermediate Municipal Bond Fund
The Class A Shares of the Nuveen Oregon Intermediate Municipal Bond Fund experienced dividend increases in October and November 2010 and May 2011 and dividend reductions in August and December 2010 and February 2011. The Fund’s Class C Shares had dividend increases in February and May 2011. The Fund’s Class I Shares experienced dividend increases in October and November 2010 and May 2011 and a dividend reduction in August 2010 .
Each Fund seeks to pay dividends at a rate that reflects the past and projected performance of the Fund. To permit a Fund to maintain a more stable monthly dividend, the Fund may pay dividends at a rate that may be more or less than the amount of net investment income actually earned by the Fund during the period. If the Fund has cumulatively earned more than it has paid in dividends, it will hold the excess in reserve as undistributed net investment income (UNII) as part of the Fund’s net asset value. Conversely, if the Fund has cumulatively paid in dividends more than it has earned, the excess will constitute a negative UNII that will likewise be reflected in the Fund’s net asset value. Each Fund will, over time, pay all its net investment income as dividends to shareholders. As of May 31, 2011, each Fund except Nuveen Nebraska Municipal Bond Fund had positive UNII balances for both tax purposes and financial reporting purposes. As of May 31, 2011, the Nuveen Nebraska Municipal Bond Fund had a positive UNII balance for tax purposes and a negative UNII balance for financial reporting purposes.
| 20 | Nuveen Investments |
Fund Performance and Expense Ratios (Unaudited)
The Fund Performance and Expense Ratios for each Fund are shown on the following 12 pages.
Returns quoted represent past performance, which is no guarantee of future results. Current performance may be higher or lower than the performance shown. Investment returns and principal value will fluctuate so that when shares are redeemed, they may be worth more or less than their original cost. Returns without sales charges would be lower if the sales charge were included. Returns do not reflect the deduction of taxes that a shareholder would pay on Fund distributions or the redemption of Fund shares. Income is generally exempt from regular federal income taxes. Some income may be subject to state and local income taxes and to the federal alternative minimum tax. Capital gains, if any, are subject to tax.
Returns may reflect a contractual agreement between certain Funds and the investment adviser to waive certain fees and expenses; see Notes to Financial Statements, Footnote 7 — Management Fees and Other Transactions with Affiliates for more information. In addition, returns may reflect a voluntary expense limitation by the Funds’ investment adviser that may be modified or discontinued at any time without notice. For the most recent month-end performance visit www.nuveen.com or call (800) 257-8787.
Returns reflect differences in sales charges and expenses, which are primarily differences in distribution and service fees. Fund returns assume reinvestment of dividends and capital gains.
Comparative index and benchmark return information is provided for the Funds’ Class A Shares at net asset value (NAV) only.
Effective January 18, 2011, Class C Shares and Class Y Shares previously offered by FAF Advisors, Inc. are renamed Class C1 Shares and Class I Shares, respectively, and the Nuveen Minnesota Intermediate Municipal Bond Fund, Nuveen Minnesota Municipal Bond Fund, Nuveen Nebraska Municipal Bond Fund and Nuveen Oregon Intermediate Municipal Bond Fund begin offering Class C Shares only to qualifying institutional investors and certain other qualifying accounts.
The expense ratios shown reflect the Funds’ total operating expenses (before fee waivers or expense reimbursements, if any) as shown in the Funds’ most recent prospectus. The expense ratios include management fees and other fees and expenses.
| Nuveen Investments | 21 |
Fund Performance and Expense Ratios (Unaudited) (continued)
Nuveen Colorado Tax Free Fund
Refer to the first page of this Fund Performance and Expense Ratios section for further explanation of the information included within this page.
Fund Performance
Average Annual Total Returns as of May 31, 2011*
| Cumulative | Average Annual | |||||||||||||||
| 11-Month | 1-Year | 5-Year | 10-Year | |||||||||||||
Class A Shares at NAV | 3.93% | 3.91% | 3.70% | 4.52% | ||||||||||||
Class A Shares at maximum Offering Price | -0.40% | -0.49% | 2.82% | 4.08% | ||||||||||||
Barclays Capital Municipal Bond Index** | 3.11% | 3.17% | 4.78% | 5.02% | ||||||||||||
Lipper Colorado Municipal Debt Funds Average** | 1.66% | 1.92% | 3.41% | 4.18% | ||||||||||||
Class C1 Shares*** | 3.53% | 3.48% | 3.27% | 4.10% | ||||||||||||
Class I Shares | 4.24% | 4.24% | 3.97% | 4.78% | ||||||||||||
Latest Calendar Quarter – Average Annual Total Returns as of June 30, 2011
| Average Annual | ||||||||||||
| 1-Year | 5-Year | 10-Year | ||||||||||
Class A Shares at NAV | 4.40% | 3.88% | 4.47% | |||||||||
Class A Shares at maximum Offering Price | 0.05% | 2.99% | 4.02% | |||||||||
Class C1 Shares*** | 3.96% | 3.45% | 4.04% | |||||||||
Class I Shares | 4.73% | 4.14% | 4.73% | |||||||||
Class A Shares have a maximum 4.20% sales charge (Offering Price). Class A Share purchases of $1 million or more are sold at net asset value without an up-front sales charge but may be subject to a contingent deferred sales charge (CDSC), also known as a back-end sales charge, if redeemed within eighteen months of purchase. Class C1 Shares have a 1% CDSC for redemptions within less than twelve months, which is not reflected in the one-year total return. Class I Shares have no sales charge and may be purchased under limited circumstances or by specified classes of investors.
| Expense Ratios | ||||||||
| Share Class | Gross Expense Ratios | Net Expense Ratios | ||||||
Class A | 1.08% | 0.90% | ||||||
Class C1*** | 1.53% | 1.35% | ||||||
Class I | 0.88% | 0.70% | ||||||
The Fund’s adviser has contractually agreed to waive fees and reimburse other Fund expenses through June 30, 2011, so that total annual Fund operating expenses, after fee waivers and/or expense reimbursements and excluding acquired Fund fees and expenses, do not exceed 0.70%, 1.15%, and 0.50%, for Class A, Class C1, and Class I Shares, respectively, and waive fees and reimburse other Fund expenses through March 31, 2012 so that annual Fund operating expenses, after fee waivers and/or expense reimbursements and excluding acquired Fund fees and expenses, do not exceed 0.90%, 1.35% and 0.70% for Class A, Class C1 and Class I Shares, respectively. Fee waivers and expense reimbursements will not be terminated prior to that time without the approval of the Fund’s Board of Directors.
| * | Eleven-month returns are cumulative; all other returns are annualized. |
| ** | Refer to the Glossary of Terms Used in the Report for definitions. |
| *** | Class C1 Shares are not available for new accounts or for additional investment into existing accounts, but Class C1 Shares can be issued for purposes of dividend reinvestment. |
| 22 | Nuveen Investments |
Growth of an Assumed $10,000 Investment as of May 31, 2011
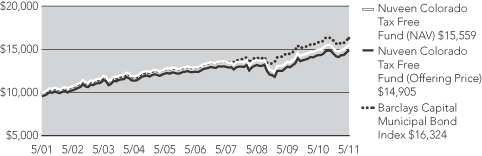
The graphs do not reflect the deduction of taxes, such as state and local income taxes or capital gains taxes, that a shareholder may pay on Fund distributions or the redemption of Fund shares.
| Nuveen Investments | 23 |
Fund Performance and Expense Ratios (Unaudited) (continued)
Nuveen Minnesota Intermediate Municipal Bond Fund
Refer to the first page of this Fund Performance and Expense Ratios section for further explanation of the information included within this page.
Fund Performance
Average Annual Total Returns as of May 31, 2011*
| Cumulative | Average Annual | |||||||||||||||
| 11-Month | 1-Year | 5-Year | 10-Year | |||||||||||||
Class A Shares at NAV | 4.00% | 4.20% | 4.61% | 4.32% | ||||||||||||
Class A Shares at maximum Offering Price | 0.91% | 1.11% | 3.97% | 4.00% | ||||||||||||
Barclays Capital 1-15 Year Blend Municipal Bond Index** | 3.59% | 3.80% | 5.16% | 2.70% | ||||||||||||
Lipper Intermediate Municipal Debt Funds Average** | 3.35% | 3.39% | 4.13% | 4.08% | ||||||||||||
Class I Shares | 4.00% | 4.20% | 4.68% | 4.43% | ||||||||||||
| Cumulative | Average Annual | |||||||||||
| 11-Month | 1-Year | Since Inception**** | ||||||||||
Class C Shares | N/A | N/A | 4.88% | |||||||||
Class C1 Shares*** | 3.46% | 3.71% | 4.82% | |||||||||
Latest Calendar Quarter – Average Annual Total Returns as of June 30, 2011
| Average Annual | ||||||||||||
| 1-Year | 5-Year | 10-Year | ||||||||||
Class A Shares at NAV | 4.30% | 4.73% | 4.29% | |||||||||
Class A Shares at maximum Offering Price | 1.20% | 4.09% | 3.98% | |||||||||
Class I Shares | 4.41% | 4.82% | 4.41% | |||||||||
| Average Annual | ||||||||
| 1-Year | Since Inception**** | |||||||
Class C Shares | N/A | 5.23% | ||||||
Class C1 Shares*** | 3.72% | 4.73% | ||||||
Class A Shares have a maximum 3.00% sales charge (Offering Price). Class A Share purchases of $1 million or more are sold at net asset value without an up-front sales charge but may be subject to a contingent deferred sales charge (CDSC), also known as a back-end sales charge, if redeemed within eighteen months of purchase. Class C Shares and Class C1 Shares have a 1% CDSC for redemptions within less than twelve months, which is not reflected in the one-year total return. Class I Shares have no sales charge and may be purchased under limited circumstances or by specified classes of investors.
| Expense Ratios | ||||||||
| Share Class | Gross Expense Ratios | Net Expense Ratios | ||||||
Class A | 0.85% | 0.76% | ||||||
Class C | 1.40% | 1.40% | ||||||
Class C1*** | 1.30% | 1.30% | ||||||
Class I | 0.65% | 0.65% | ||||||
The Fund’s adviser has contractually agreed to reimburse Class A Share 12b-1 fees through March 31, 2012 to the extent necessary so that total annual Fund operating expenses, after fee waivers and/or expense reimbursement and excluding acquired Fund fees and expenses, do not exceed 0.75% for Class A Shares. Fee waivers and/or expense reimbursements will not be terminated prior to that time without with approval of the Fund’s Board of Directors. In addition, the Fund’s distributor has contractually agreed to limit its Class A Share 12b-1 fees to 0.15% of average daily net assets through March 31, 2012.
| * | Eleven-month returns are cumulative; all other returns are annualized. |
| ** | Refer to the Glossary of Terms Used in the Report for definitions. |
| *** | Class C1 Shares are not available for new accounts or for additional investment into existing accounts, but Class C1 Shares can be issued for purposes of dividend reinvestment. |
| **** | Since inception returns for Class C and Class C1 Shares are from 1/18/11 and 10/28/09, respectively. Since inception returns for Class C Shares are cumulative. |
| 24 | Nuveen Investments |
Growth of an Assumed $10,000 Investment as of May 31, 2011
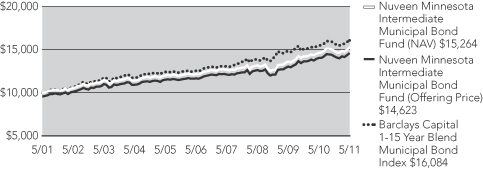
The graphs do not reflect the deduction of taxes, such as state and local income taxes or capital gains taxes, that a shareholder may pay on Fund distributions or the redemption of Fund shares.
| Nuveen Investments | 25 |
Fund Performance and Expense Ratios (Unaudited) (continued)
Nuveen Minnesota Municipal Bond Fund
Refer to the first page of this Fund Performance and Expense Ratios section for further explanation of the information included within this page.
Fund Performance
Average Annual Total Returns as of May 31, 2011*
| Cumulative | Average Annual | |||||||||||||||
| 11-Month | 1-Year | 5-Year | 10-Year | |||||||||||||
Class A Shares at NAV | 2.94% | 2.96% | 3.97% | 4.47% | ||||||||||||
Class A Shares at maximum Offering Price | -1.41% | -1.38% | 3.09% | 4.02% | ||||||||||||
Barclays Capital Municipal Bond Index** | 3.11% | 3.17% | 4.78% | 5.02% | ||||||||||||
Lipper Minnesota Municipal Debt Funds Average** | 2.45% | 2.52% | 3.73% | 4.26% | ||||||||||||
Class C1 Shares*** | 2.48% | 2.46% | 3.50% | 4.02% | ||||||||||||
Class I Shares | 3.09% | 3.23% | 4.18% | 4.71% | ||||||||||||
| Cumulative | ||||
| Since Inception**** | ||||
Class C Shares | 6.99% | |||
Latest Calendar Quarter – Average Annual Total Returns as of June 30, 2011
| Average Annual | ||||||||||||
| 1-Year | 5-Year | 10-Year | ||||||||||
Class A Shares at NAV | 3.74% | 4.21% | 4.48% | |||||||||
Class A Shares at maximum Offering Price | -0.64% | 3.33% | 4.03% | |||||||||
Class C1 Shares*** | 3.24% | 3.72% | 4.02% | |||||||||
Class I Shares | 3.91% | 4.40% | 4.71% | |||||||||
| Cumulative | ||||
| Since Inception**** | ||||
Class C Shares | 7.87% | |||
Class A Shares have a maximum 4.20% sales charge (Offering Price). Class A Share purchases of $1 million or more are sold at net asset value without an up-front sales charge but may be subject to a contingent deferred sales charge (CDSC), also known as a back-end sales charge, if redeemed within eighteen months of purchase. Class C Shares and Class C1 Shares have a 1% CDSC for redemptions within less than twelve months, which is not reflected in the one-year total return. Class I Shares have no sales charge and may be purchased under limited circumstances or by specified classes of investors.
| Expense Ratios | ||||||||
| Share Class | Gross Expense Ratios | Net Expense Ratios | ||||||
Class A | 0.89% | 0.86% | ||||||
Class C | 1.44% | 1.44% | ||||||
Class C1*** | 1.34% | 1.34% | ||||||
Class I | 0.69% | 0.69% | ||||||
The Fund’s adviser has contractually agreed to reimburse Class A Share 12b-1 fees through March 31, 2012 to the extent necessary so that total annual Fund operating expenses, after fee waivers and/or expense reimbursement and excluding acquired Fund fees and expenses, do not exceed 0.85% for Class A Shares. Fee waivers and/or expense reimbursements will not be terminated prior to that time without the approval of the Fund’s Board of Directors.
| * | Eleven-month returns are cumulative; all other returns are annualized. |
| ** | Refer to the Glossary of Terms Used in the Report for definitions. |
| *** | Class C1 Shares are not available for new accounts or for additional investment into existing accounts, but Class C1 Shares can be issued for purposes of dividend reinvestment. |
| **** | Since inception returns for Class C Shares from 1/18/11. |
| 26 | Nuveen Investments |
Growth of an Assumed $10,000 Investment as of May 31, 2011
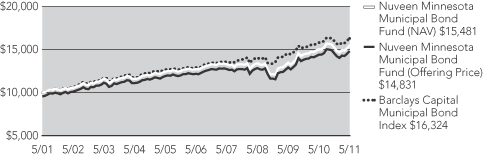
The graphs do not reflect the deduction of taxes, such as state and local income taxes or capital gains taxes, that a shareholder may pay on Fund distributions or the redemption of Fund shares.
| Nuveen Investments | 27 |
Fund Performance and Expense Ratios (Unaudited) (continued)
Nuveen Missouri Tax Free Fund
Refer to the first page of this Fund Performance and Expense Ratios section for further explanation of the information included within this page.
Fund Performance
Average Annual Total Returns as of May 31, 2011*
| Cumulative | Average Annual | |||||||||||||||
| 11-Month | 1-Year | 5-Year | 10-Year | |||||||||||||
Class A Shares at NAV | 4.18% | 4.16% | 4.31% | 4.34% | ||||||||||||
Class A Shares at maximum Offering Price | -0.18% | -0.18% | 3.42% | 3.89% | ||||||||||||
Barclays Capital Municipal Bond Index** | 3.11% | 3.17% | 4.78% | 5.02% | ||||||||||||
Lipper Other States Municipal Debt Funds Average** | 2.13% | 1.98% | 3.41% | 4.04% | ||||||||||||
Class I Shares | 4.25% | 4.25% | 4.52% | 4.58% | ||||||||||||
| Cumulative | Average Annual | |||||||||||||||
| 11-Month | 1-Year | 5-Year | Since Inception**** | |||||||||||||
Class C1 Shares*** | 3.72% | 3.66% | 3.86% | 3.73% | ||||||||||||
Latest Calendar Quarter – Average Annual Total Returns as of June 30, 2011
| Average Annual | ||||||||||||
| 1-Year | 5-Year | 10-Year | ||||||||||
Class A Shares at NAV | 4.79% | 4.53% | 4.34% | |||||||||
Class A Shares at Offering Price | 0.41% | 3.63% | 3.89% | |||||||||
Class I Shares | 4.88% | 4.75% | 4.58% | |||||||||
| Average Annual | ||||||||||||
| 1-Year | 5-Year | Since Inception**** | ||||||||||
Class C1 Shares*** | 4.20% | 4.07% | 3.74% | |||||||||
Class A Shares have a maximum 4.20% sales charge (Offering Price). Class A Share purchases of $1 million or more are sold at net asset value without an up-front sales charge but may be subject to a contingent deferred sales charge (CDSC), also known as a back-end sales charge, if redeemed within eighteen months of purchase. Class C1 Shares have a 1% CDSC for redemptions within less than twelve months, which is not reflected in the one-year total return. Class I Shares have no sales charge and may be purchased under limited circumstances or by specified classes of investors.
| Expense Ratios | ||||||||
| Share Class | Gross Expense Ratios | Net Expense Ratios | ||||||
Class A | 0.99% | 0.86% | ||||||
Class C1*** | 1.44% | 1.36% | ||||||
Class I | 0.79% | 0.71% | ||||||
The Fund’s adviser has contractually agreed to waive fees and reimburse other Fund expenses through March 31, 2012 so that annual Fund operating expenses, after fee waivers and/or expense reimbursements and excluding acquired Fund fees and expenses, do not exceed 0.85%, 1.35% and 0.70% for Class A, Class C1 and Class I, respectively. Fee waivers and expense reimbursements will not be terminated prior to that time without the approval of the Fund’s Board of Directors.
| * | Eleven-month returns are cumulative; all other returns are annualized. |
| ** | Refer to the Glossary of Terms Used in the Report for definitions. |
| *** | Class C1 Shares are not available for new accounts or for additional investment into existing accounts, but Class C1 Shares can be issued for purposes of dividend reinvestment. |
| **** | Since inception returns for Class C1 Shares are from 9/24/11. |
| 28 | Nuveen Investments |
Growth of an Assumed $10,000 Investment as of May 31, 2011
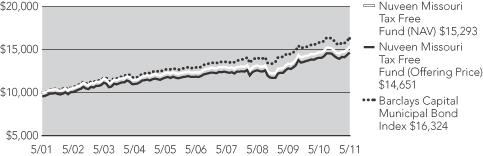
The graphs do not reflect the deduction of taxes, such as state and local income taxes or capital gains taxes, that a shareholder may pay on Fund distributions or the redemption of Fund shares.
| Nuveen Investments | 29 |
Fund Performance and Expense Ratios (Unaudited) (continued)
Nuveen Nebraska Municipal Bond Fund
Refer to the first page of this Fund Performance and Expense Ratios section for further explanation of the information included within this page.
Fund Performance
Average Annual Total Returns as of May 31, 2011*
| Cumulative | Average Annual | |||||||||||||||
| 11-Month | 1-Year | 5-Year | 10-Year | |||||||||||||
Class A Shares at NAV | 3.28% | 3.23% | 4.12% | 4.54% | ||||||||||||
Class A Shares at maximum Offering Price | -1.03% | -1.15% | 3.22% | 4.09% | ||||||||||||
Barclays Capital Municipal Bond Index** | 3.11% | 3.17% | 4.78% | 5.02% | ||||||||||||
Lipper Other States Municipal Debt Funds Average** | 2.13% | 1.98% | 3.41% | 4.04% | ||||||||||||
Class C1 Shares*** | 2.80% | 2.81% | 3.71% | 4.13% | ||||||||||||
Class I Shares | 3.39% | 3.46% | 4.35% | 4.79% | ||||||||||||
| Cumulative | ||||
| Since Inception**** | ||||
Class C Shares | 5.70% | |||
Latest Calendar Quarter – Average Annual Total Returns as of June 30, 2011
| Average Annual | ||||||||||||
| 1-Year | 5-Year | 10-Year | ||||||||||
Class A Shares at NAV | 3.73% | 4.32% | 4.52% | |||||||||
Class A Shares at maximum Offering Price | -0.60% | 3.44% | 4.07% | |||||||||
Class C1 Shares*** | 3.31% | 3.91% | 4.11% | |||||||||
Class I Shares | 3.96% | 4.58% | 4.78% | |||||||||
| Cumulative | ||||
| Since Inception**** | ||||
Class C Shares | 6.21% | |||
Class A Shares have a maximum 4.20% sales charge (Offering Price). Class A Share purchases of $1 million or more are sold at net asset value without an up-front sales charge but may be subject to a contingent deferred sales charge (CDSC), also known as a back-end sales charge, if redeemed within eighteen months of purchase. Class C Shares and Class C1 Shares have a 1% CDSC for redemptions within less than twelve months, which is not reflected in the one-year total return. Class I Shares have no sales charge and may be purchased under limited circumstances or by specified classes of investors.
| Expense Ratios | ||||||||
| Share Class | Gross Expense Ratios | Net Expense Ratios | ||||||
Class A | 1.11% | 0.91% | ||||||
Class C | 1.66% | 1.46% | ||||||
Class C1*** | 1.56% | 1.36% | ||||||
Class I | 0.91% | 0.71% | ||||||
The Fund’s adviser has contractually agreed to waive fees and reimburse other Fund expenses through June 30, 2011, so that total annual Fund operating expenses, after fee waivers and/or expense reimbursements and excluding acquired Fund fees and expenses, do not exceed 0.70%, 1.25%, 1.15% and 0.50%, for Class A, Class C, Class C1, and Class I Shares, respectively, and waive fees and reimburse other Fund expenses through March 31, 2012 so that annual Fund operating expenses, after fee waivers and/or expense reimbursements and excluding acquired Fund fees and expenses, do not exceed 0.90%, 1.45%, 1.35% and 0.70% for Class A, Class C, Class C1 and Class I Shares, respectively. Fee waivers and expense reimbursements will not be terminated prior to that time without the approval of the Fund’s Board of Directors.
| * | Eleven-month returns are cumulative; all other returns are annualized. |
| ** | Refer to the Glossary of Terms Used in the Report for definitions. |
| *** | Class C1 Shares are not available for new accounts or for additional investment into existing accounts, but Class C1 Shares can be issued for purposes of dividend reinvestment. |
| **** | Since inception returns for Class C Shares are from 1/18/11. |
| 30 | Nuveen Investments |
Growth of an Assumed $10,000 Investment as of May 31, 2011
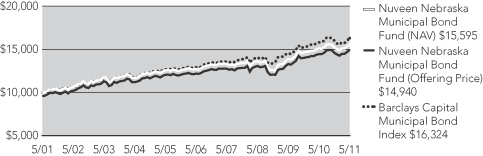
The graphs do not reflect the deduction of taxes, such as state and local income taxes or capital gains taxes, that a shareholder may pay on Fund distributions or the redemption of Fund shares.
| Nuveen Investments | 31 |
Fund Performance and Expense Ratios (Unaudited) (continued)
Nuveen Ohio Tax Free Fund
Refer to the first page of this Fund Performance and Expense Ratios section for further explanation of the information included within this page.
Fund Performance
Average Annual Total Returns as of May 31, 2011*
| Cumulative | Average Annual | |||||||||||||||
| 11-Month | 1-Year | 5-Year | Since Inception**** | |||||||||||||
Class A Shares at NAV | 2.69% | 2.72% | 4.14% | 4.33% | ||||||||||||
Class A Shares at maximum Offering Price | 1.65% | -1.61% | 3.25% | 3.83% | ||||||||||||
Barclays Capital Municipal Bond Index** | 3.11% | 3.17% | 4.78% | 5.02% | ||||||||||||
Lipper Ohio Municipal Debt Funds Average** | 1.54% | 1.42% | 3.43% | 4.04% | ||||||||||||
Class C1 Shares*** | 2.31% | 2.30% | 3.71% | 3.79% | ||||||||||||
Class I Shares | 2.81% | 2.96% | 4.38% | 4.57% | ||||||||||||
Latest Calendar Quarter – Average Annual Total Returns as of June 30, 2011
| Average Annual | ||||||||||||
| 1-Year | 5-Year | Since Inception**** | ||||||||||
Class A Shares at NAV | 3.22% | 4.37% | 4.35% | |||||||||
Class A Shares at maximum Offering Price | -1.14% | 3.47% | 3.86% | |||||||||
Class C1 Shares*** | 2.80% | 3.94% | 3.81% | |||||||||
Class I Shares | 3.36% | 4.61% | 4.59% | |||||||||
Class A Shares have a maximum 4.20% sales charge (Offering Price). Class A Share purchases of $1 million or more are sold at net asset value without an up-front sales charge but may be subject to a contingent deferred sales charge (CDSC), also known as a back-end sales charge, if redeemed within eighteen months of purchase. Class C1 Shares have a 1% CDSC for redemptions within less than twelve months, which is not reflected in the one-year total return. Class I Shares have no sales charge and may be purchased under limited circumstances or by specified classes of investors.
| Expense Ratios | ||||||||
| Share Class | Gross Expense Ratios | Net Expense Ratios | ||||||
Class A | 1.14% | 0.92% | ||||||
Class C1*** | 1.59% | 1.37% | ||||||
Class I | 0.94% | 0.72% | ||||||
The Fund’s adviser has contractually agreed to waive fees and reimburse other Fund expenses through June 30, 2011, so that total annual Fund operating expenses, after fee waivers and/or expense reimbursements and excluding acquired Fund fees and expenses, do not exceed 0.70%, 1.15%, and 0.50%, for Class A, Class C1, and Class I Shares, respectively, and waive fees and reimburse other Fund expenses through March 31, 2012 so that annual Fund operating expenses, after fee waivers and/or expense reimbursements and excluding acquired Fund fees and expenses, do not exceed 0.90%, 1.35% and 0.70% for Class A, Class C1 and Class I Shares, respectively. Fee waivers and expense reimbursements will not be terminated prior to that time without the approval of the Fund’s Board of Directors.
| * | Eleven-month returns are cumulative; all other returns are annualized. |
| ** | Refer to the Glossary of Terms Used in the Report for definitions. |
| *** | Class C1 Shares are not available for new accounts or for additional investment into existing accounts, but Class C1 Shares can be issued for purposes of dividend reinvestment. |
| **** | Since inception returns are from 4/30/02. |
| 32 | Nuveen Investments |
Growth of an Assumed $10,000 Investment as of May 31, 2011
The graphs do not reflect the deduction of taxes, such as state and local income taxes or capital gains taxes, that a shareholder may pay on Fund distributions or the redemption of Fund shares.
| Nuveen Investments | 33 |
Fund Performance and Expense Ratios (Unaudited) (continued)
Nuveen Oregon Intermediate Municipal Bond Fund
Refer to the first page of this Fund Performance and Expense Ratios section for further explanation of the information included within this page.
Fund Performance
Average Annual Total Returns as of May 31, 2011*
| Cumulative | Average Annual | |||||||||||||||
| 11-Month | 1-Year | 5-Year | 10-Year | |||||||||||||
Class A Shares at NAV | 3.46% | 3.64% | 4.35% | 4.08% | ||||||||||||
Class A Shares at maximum Offering Price | 0.39% | 0.56% | 3.72% | 3.76% | ||||||||||||
Barclays Capital 1-15 Year Blend Municipal Bond Index** | 3.59% | 3.80% | 5.16% | 2.70% | ||||||||||||
Lipper Intermediate Municipal Debt Funds Average** | 3.35% | 3.39% | 4.13% | 4.08% | ||||||||||||
Class I Shares | 3.62% | 3.80% | 4.48% | 4.23% | ||||||||||||
| Cumulative | ||||
| Since Inception*** | ||||
Class C Shares | 5.04% | |||
Latest Calendar Quarter – Average Annual Total Returns as of June 30, 2011
| Average Annual | ||||||||||||
| 1-Year | 5-Year | 10-Year | ||||||||||
Class A Shares at NAV | 3.84% | 4.51% | 4.07% | |||||||||
Class A Shares at maximum Offering Price | 0.75% | 3.88% | 3.75% | |||||||||
Class I Shares | 3.91% | 4.65% | 4.20% | |||||||||
| Cumulative | ||||
| Since Inception*** | ||||
Class C Shares | 5.34% | |||
Class A Shares have a maximum 3.00% sales charge (Offering Price). Class A Share purchases of $1 million or more are sold at net asset value without an up-front sales charge but may be subject to a contingent deferred sales charge (CDSC), also known as a back-end sales charge, if redeemed within eighteen months of purchase. Class C Shares have a 1% CDSC for redemptions within less than twelve months, which is not reflected in the one-year total return. Class I Shares have no sales charge and may be purchased under limited circumstances or by specified classes of investors.
| Expense Ratios | ||||||||
| Share Class | Gross Expense Ratios | Net Expense Ratios | ||||||
Class A | 0.87% | 0.86% | ||||||
Class C | 1.42% | 1.42% | ||||||
Class I | 0.67% | 0.67% | ||||||
The Fund’s adviser has contractually agreed to reimburse Class A Share 12b-1 fees through March 31, 2012 to the extent necessary so that total annual Fund operating expenses, after fee waivers and/or expense reimbursement and excluding acquired Fund fees and expenses, do not exceed 0.85% for Class A Shares. Fee waivers and/or expense reimbursements will not be terminated prior to that time without the approval of the Fund’s Board of Directors.
| * | Eleven-month returns are cumulative; all other returns are annualized. |
| ** | Refer to the Glossary of Terms Used in the Report for definitions. |
| *** | Since inception returns for Class C Shares are from 1/18/11. |
| 34 | Nuveen Investments |
Growth of an Assumed $10,000 Investment as of May 31, 2011
The graphs do not reflect the deduction of taxes, such as state and local income taxes or capital gains taxes, that a shareholder may pay on Fund distributions or the redemption of Fund shares.
| Nuveen Investments | 35 |
Yields (Unaudited) as of May 31, 2011
Dividend Yield is the most recent dividend per share (annualized) divided by the offering price per share.
The SEC 30-Day Yield is a standardized measure of a Fund’s yield that accounts for the future amortization of premiums or discounts of bonds held in the Fund’s portfolio. The SEC 30-Day Yield is computed under an SEC standardized formula and is based on the maximum offer price per share. Dividend Yield may differ from the SEC 30-Day Yield because the Fund may be paying out more or less than it is earning and it may not include the effect of amortization of bond premium.
The Taxable-Equivalent Yield represents the yield that must be earned on a fully taxable investment in order to equal the yield of the Fund on an after-tax basis at a specified tax rate. With respect to investments that generate qualified dividend income that is taxable at a maximum rate of 15%, the Taxable-Equivalent Yield is lower.
Nuveen Colorado Tax Free Fund
| Dividend Yield | 30-Day Yield | SEC 30-Day Yield | Taxable- Equivalent Yield1 | |||||||||||||
Class A Shares at NAV | 4.18% | 3.95% | — | 5.75% | ||||||||||||
Class A Shares at Offer | 8.01% | — | 3.79% | 5.52% | ||||||||||||
Class C1 Shares | 3.71% | — | 3.41% | 4.96% | ||||||||||||
Class I Shares | 4.34% | — | 4.11% | 5.98% | ||||||||||||
Nuveen Minnesota Intermediate Municipal Bond Fund
| Dividend Yield | 30-Day Yield | SEC 30-Day Yield | Taxable- Equivalent Yield2 | |||||||||||||
Class A Shares at NAV | 3.41% | 2.70% | — | 4.07% | ||||||||||||
Class A Shares at Offer | 6.62% | — | 2.62% | 3.95% | ||||||||||||
Class C Shares | 2.78% | — | 2.12% | 3.20% | ||||||||||||
Class C1 Shares | 2.93% | — | 2.03% | 3.06% | ||||||||||||
Class I Shares | 3.55% | — | 2.74% | 4.13% | ||||||||||||
Nuveen Minnesota Municipal Bond Fund
| Dividend Yield | 30-Day Yield | SEC 30-Day Yield | Taxable- Equivalent Yield2 | |||||||||||||
Class A Shares at NAV | 3.82% | 4.41% | — | 6.65% | ||||||||||||
Class A Shares at Offer | 7.33% | — | 4.22% | 6.37% | ||||||||||||
Class C Shares | 3.21% | — | 3.91% | 5.90% | ||||||||||||
Class C1 Shares | 3.33% | — | 3.62% | 5.46% | ||||||||||||
Class I Shares | 3.99% | — | 4.54% | 6.85% | ||||||||||||
Nuveen Missouri Tax Free Fund
| Dividend Yield | 30-Day Yield | SEC 30-Day Yield | Taxable- Equivalent Yield3 | |||||||||||||
Class A Shares at NAV | 3.99% | 3.89% | — | 5.75% | ||||||||||||
Class A Shares at Offer | 7.65% | — | 3.73% | 5.51% | ||||||||||||
Class C1 Shares | 3.54% | — | 3.37% | 4.98% | ||||||||||||
Class I Shares | 4.19% | — | 4.02% | 5.94% | ||||||||||||
| 1 | The Taxable-Equivalent Yield is based on the Fund’s 30-Day Yield on the indicated date and a combined federal and state income tax rate of 31.3%. |
| 2 | The Taxable-Equivalent Yield is based on the Fund’s 30-Day Yield on the indicated date and a combined federal and state income tax rate of 33.7%. |
| 3 | The Taxable-Equivalent Yield is based on the Fund’s 30-Day Yield on the indicated date and a combined federal and state income tax rate of 32.3%. |
| 36 | Nuveen Investments |
Nuveen Nebraska Municipal Bond Fund
| Dividend Yield | 30-Day Yield | SEC 30-Day Yield | Taxable- Equivalent Yield4 | |||||||||||||
Class A Shares at NAV | 4.08% | 3.70% | — | 5.51% | ||||||||||||
Class A Shares at Offer | 7.83% | — | 3.54% | 5.28% | ||||||||||||
Class C Shares | 3.50% | — | 3.01% | 4.49% | ||||||||||||
Class C1 Shares | 3.65% | — | 2.99% | 4.46% | ||||||||||||
Class I Shares | 4.26% | — | 3.82% | 5.69% | ||||||||||||
Nuveen Ohio Tax Free Fund
| Dividend Yield | 30-Day Yield | SEC 30-Day Yield | Taxable- Equivalent Yield5 | |||||||||||||
Class A Shares at NAV | 3.89% | 3.61% | — | 5.30% | ||||||||||||
Class A Shares at Offer | 7.45% | — | 3.46% | 5.08% | ||||||||||||
Class C1 Shares | 3.41% | — | 3.11% | 4.57% | ||||||||||||
Class I Shares | 4.06% | — | 3.75% | 5.51% | ||||||||||||
Nuveen Oregon Intermediate Municipal Bond Fund
| Dividend Yield | 30-Day Yield | SEC 30-Day Yield | Taxable- Equivalent Yield6 | |||||||||||||
Class A Shares at NAV | 3.18% | 2.04% | — | 3.18% | ||||||||||||
Class A Shares at Offer | 6.19% | — | 1.98% | 3.08% | ||||||||||||
Class C Shares | 3.36% | — | 1.59% | 2.48% | ||||||||||||
Class I Shares | 3.36% | — | 2.24% | 3.49% | ||||||||||||
| 4 | The Taxable-Equivalent Yield is based on the Fund’s 30-Day Yield on the indicated date and a combined federal and state income tax rate of 32.9%. |
| 5 | The Taxable-Equivalent Yield is based on the Fund’s 30-Day Yield on the indicated date and a combined federal and state income tax rate of 31.9%. |
| 6 | The Taxable-Equivalent Yield is based on the Fund’s 30-Day Yield on the indicated date and a combined federal and state income tax rate of 35.8%. |
| Nuveen Investments | 37 |
Holding Summaries as of May 31, 2011 (Unaudited)
This data relates to the securities held in the Fund’s portfolio of investments. It should not be construed as a measure of performance for the Fund itself.
Ratings shown are the highest of Standard & Poor’s Group, Moody’s Investor Service, Inc. or Fitch, Inc. AAA includes bonds with an implied AAA rating since they are backed by U.S. Government or agency securities. AAA, AA, A and BBB ratings are investment grade; BB, B, CCC, CC, C and D ratings are below-investment grade. Holdings designated N/R are not rated by any of these national rating agencies.
Nuveen Colorado Tax Free Fund
Bond Credit Quality1
Nuveen Minnesota Intermediate Municipal Bond Fund
Bond Credit Quality1
Nuveen Minnesota Municipal Bond Fund
Bond Credit Quality1
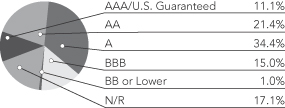
Nuveen Missouri Tax Free Fund
Bond Credit Quality1
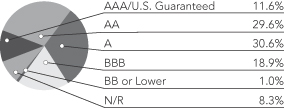
| Portfolio Composition1 | ||||
| Education | 21.5% | |||
| General Obligations | 21.2% | |||
| Health Care | 16.0% | |||
| Utilities | 9.4% | |||
| Certificates of Participation | 8.3% | |||
| Transportation | 7.7% | |||
| Housing | 5.7% | |||
| Tax Revenue | 5.3% | |||
| Other | 4.6% | |||
| Short-Term Investments | 0.3% | |||
| Portfolio Composition1 | ||||
| Health Care | 28.7% | |||
| General Obligations | 23.8% | |||
| Education | 18.3% | |||
| Utilities | 9.7% | |||
| Miscellaneous | 4.6% | |||
| Other | 14.0% | |||
| Short-Term Investments | 0.9% | |||
| Portfolio Composition1 | ||||
| Health Care | 30.6% | |||
| Utilities | 17.6% | |||
| General Obligations | 11.9% | |||
| Education | 10.5% | |||
| Transportation | 9.0% | |||
| Housing | 8.2% | |||
| Other | 10.5% | |||
| Short-Term Investments | 1.7% | |||
| Portfolio Composition1 | ||||
| Health Care | 24.4% | |||
| Lease Revenue | 16.0% | |||
| Tax Revenue | 12.2% | |||
| Utilities | 11.0% | |||
| General Obligations | 8.3% | |||
| Certificates of Participation | 7.9% | |||
| Education | 5.6% | |||
| Continuing Care Retirement Communities | 5.1% | |||
| Other | 9.1% | |||
| Short-Term Investments | 0.4% | |||
| 1 | As a percentage of total municipal bonds as of May 31, 2011. Holdings are subject to change. |
| 38 | Nuveen Investments |
Nuveen Nebraska Municipal Bond Fund
Bond Credit Quality1
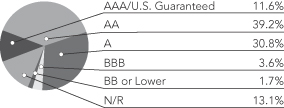
Nuveen Ohio Tax Free Fund
Bond Credit Quality1
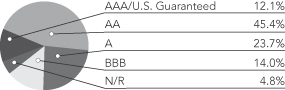
Nuveen Oregon Intermediate Municipal Bond Fund
Bond Credit Quality1
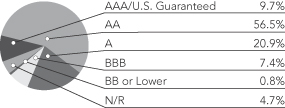
| Portfolio Composition1 | ||||
| Education | 24.6% | |||
| Utilities | 22.3% | |||
| Health Care | 15.6% | |||
| General Obligations | 14.6% | |||
| Continuing Care Retirement Communities | 7.1% | |||
| Housing | 6.1% | |||
| Other | 7.8% | |||
| Short-Term Investments | 1.9% | |||
| Portfolio Composition1 | ||||
| General Obligations | 27.3% | |||
| Health Care | 24.4% | |||
| Education | 16.4% | |||
| Utilities | 13.4% | |||
| Lease Revenue | 4.4% | |||
| Other | 13.4% | |||
| Short-Term Investments | 0.7% | |||
| Portfolio Composition1 | ||||
| General Obligations | 47.3% | |||
| Health Care | 13.4% | |||
| Utilities | 10.1% | |||
| Education | 9.4% | |||
| Tax Revenue | 6.8% | |||
| Other | 12.8% | |||
| Short-Term Investments | 0.2% | |||
| 1 | As a percentage of total municipal bonds as of May 31, 2011. Holdings are subject to change. |
| Nuveen Investments | 39 |
As a shareholder of one or more of the Funds, you incur two types of costs: (1) transaction costs, including up-front and back-end sales charges (loads) or redemption fees, where applicable; and (2) ongoing costs, including management fees; distribution and service (12b-1) fees, where applicable; and other Fund expenses. The Examples below are intended to help you understand your ongoing costs (in dollars) of investing in the Funds and to compare these costs with the ongoing costs of investing in other mutual funds. Since the expense examples for Class C Shares of Minnesota Intermediate Municipal Bond Fund, Minnesota Municipal Bond Fund, Nebraska Municipal Bond Fund and Oregon Intermediate Municipal Bond Fund reflect only the first 134 days of the Funds’ operations they may not provide a meaningful understanding of the Funds’ ongoing expenses.
The Examples below are based on an investment of $1,000 invested at the beginning of the period and held for the period.
The information under “Actual Performance,” together with the amount you invested, allows you to estimate actual expenses incurred over the reporting period. Simply divide your account value by $1,000 (for example, an $8,600 account value divided by $1,000 = 8.60) and multiply the result by the cost shown for your share class, in the row entitled “Expenses Incurred During Period” to estimate the expenses incurred on your account during this period.
The information under “Hypothetical Performance,” provides information about hypothetical account values and hypothetical expenses based on the respective Fund’s actual expense ratio and an assumed rate of return of 5% per year before expenses, which is not the Fund’s actual return. The hypothetical account values and expenses may not be used to estimate the actual ending account balance or expense you incurred for the period. You may use this information to compare the ongoing costs of investing in the Fund and other Funds. To do so, compare this 5% hypothetical example with the 5% hypothetical examples that appear in the shareholder reports of the other funds.
Please note that the expenses shown in the table are meant to highlight your ongoing costs only and do not reflect any transaction costs. Therefore, the hypothetical information is useful in comparing ongoing costs only, and will not help you determine the relative total costs of owning different funds or share classes. In addition, if these transaction costs were included, your costs would have been higher.
Nuveen Colorado Tax Free Fund
| Actual Performance | Hypothetical Performance | |||||||||||||||||||||||||
| A Shares | C1 Shares | I Shares | A Shares | C1 Shares | I Shares | |||||||||||||||||||||
| Beginning Account Value (12/01/10) | $ | 1,000.00 | $ | 1,000.00 | $ | 1,000.00 | $ | 1,000.00 | $ | 1,000.00 | $ | 1,000.00 | ||||||||||||||
| Ending Account Value (5/31/11) | $ | 1,029.00 | $ | 1,026.70 | $ | 1,030.00 | $ | 1,021.39 | $ | 1,019.20 | $ | 1,022.44 | ||||||||||||||
| Expenses Incurred During Period | $ | 3.59 | $ | 5.81 | $ | 2.53 | $ | 3.58 | $ | 5.79 | $ | 2.52 | ||||||||||||||
For each class of the Fund, expenses are equal to the Fund’s annualized net expense ratio of .71%, 1.15% and .50% for Classes A, C1 and I, respectively, multiplied by the average account value over the period, multiplied by 182/365 (to reflect the one-half year period).
Nuveen Minnesota Intermediate Municipal Bond Fund
| Actual Performance | Hypothetical Performance | |||||||||||||||||||||||||||||||||
| A Shares | C Shares | C1 Shares | I Shares | A Shares | C Shares | C1 Shares | I Shares | |||||||||||||||||||||||||||
| Beginning Account Value (12/01/10) | $ | 1,000.00 | $ | 1,000.00 | $ | 1,000.00 | $ | 1,000.00 | $ | 1,000.00 | $ | 1,000.00 | $ | 1,000.00 | $ | 1,000.00 | ||||||||||||||||||
| Ending Account Value (5/31/11) | $ | 1,026.60 | $ | 1,048.80 | $ | 1,023.80 | $ | 1,026.20 | $ | 1,021.19 | $ | 1,018.15 | $ | 1,018.50 | $ | 1,021.74 | ||||||||||||||||||
| Expenses Incurred During Period | $ | 3.79 | $ | 6.95 | $ | 6.51 | $ | 3.23 | $ | 3.78 | $ | 6.84 | $ | 6.49 | $ | 3.23 | ||||||||||||||||||
For each class of the Fund, expenses are equal to the Fund’s annualized net expense ratio of .75%, 1.29% and .64% for Classes A, C1 and I, respectively, multiplied by the average account value over the period, multiplied by 182/365 (to reflect the one-half year period). For Class C of the Fund, expenses are equal to the Fund’s annualized net expense ratio of 1.36% multiplied by the average account value over the period, multiplied by 134/365 (to reflect the 134 days in the period since class commencement of operations).
Nuveen Minnesota Municipal Bond Fund
| Actual Performance | Hypothetical Performance | |||||||||||||||||||||||||||||||||
| A Shares | C Shares | C1 Shares | I Shares | A Shares | C Shares | C1 Shares | I Shares | |||||||||||||||||||||||||||
| Beginning Account Value (12/01/10) | $ | 1,000.00 | $ | 1,000.00 | $ | 1,000.00 | $ | 1,000.00 | $ | 1,000.00 | $ | 1,000.00 | $ | 1,000.00 | $ | 1,000.00 | ||||||||||||||||||
| Ending Account Value (5/31/11) | $ | 1,016.80 | $ | 1,069.90 | $ | 1,014.30 | $ | 1,018.60 | $ | 1,020.69 | $ | 1,017.85 | $ | 1,018.30 | $ | 1,021.54 | ||||||||||||||||||
| Expenses Incurred During Period | $ | 4.29 | $ | 7.33 | $ | 6.68 | $ | 3.42 | $ | 4.28 | $ | 7.14 | $ | 6.69 | $ | 3.43 | ||||||||||||||||||
For each class of the Fund, expenses are equal to the Fund’s annualized net expense ratio of .85%, 1.33% and .68% for Classes A, C1 and I, respectively, multiplied by the average account value over the period, multiplied by 182/365 (to reflect the one-half year period). For Class C of the Fund, expenses are equal to the Fund’s annualized net expense ratio of 1.42% multiplied by the average account value over the period, multiplied by 134/365 (to reflect the 134 days in the period since class commencement of operations).
| 40 | Nuveen Investments |
Nuveen Missouri Tax Free Fund
| Actual Performance | Hypothetical Performance | |||||||||||||||||||||||||
| A Shares | C1 Shares | I Shares | A Shares | C1 Shares | I Shares | |||||||||||||||||||||
| Beginning Account Value (12/01/10) | $ | 1,000.00 | $ | 1,000.00 | $ | 1,000.00 | $ | 1,000.00 | $ | 1,000.00 | $ | 1,000.00 | ||||||||||||||
| Ending Account Value (5/31/11) | $ | 1,025.80 | $ | 1,023.40 | $ | 1,026.80 | $ | 1,020.69 | $ | 1,018.20 | $ | 1,021.44 | ||||||||||||||
| Expenses Incurred During Period | $ | 4.29 | $ | 6.81 | $ | 3.54 | $ | 4.28 | $ | 6.79 | $ | 3.53 | ||||||||||||||
For each class of the Fund, expenses are equal to the Fund’s annualized net expense ratio of .85%, 1.35% and .70% for Classes A, C1 and I, respectively, multiplied by the average account value over the period, mulitplied by 182/365 (to reflect the one-half year period).
Nuveen Nebraska Municipal Bond Fund
| Actual Performance | Hypothetical Performance | |||||||||||||||||||||||||||||||||
| A Shares | C Shares | C1 Shares | I Shares | A Shares | C Shares | C1 Shares | I Shares | |||||||||||||||||||||||||||
| Beginning Account Value (12/01/10) | $ | 1,000.00 | $ | 1,000.00 | $ | 1,000.00 | $ | 1,000.00 | $ | 1,000.00 | $ | 1,000.00 | $ | 1,000.00 | $ | 1,000.00 | ||||||||||||||||||
| Ending Account Value (5/31/11) | $ | 1,023.60 | $ | 1,057.00 | $ | 1,020.50 | $ | 1,023.70 | $ | 1,021.39 | $ | 1,018.75 | $ | 1,019.20 | $ | 1,022.44 | ||||||||||||||||||
| Expenses Incurred During Period | $ | 3.58 | $ | 6.36 | $ | 5.79 | $ | 2.52 | $ | 3.58 | $ | 6.24 | $ | 5.79 | $ | 2.52 | ||||||||||||||||||
For each class of the Fund, expenses are equal to the Fund’s annualized net expense ratio of .71%, 1.15% and .50% for Classes A, C1 and I, respectively, multiplied by the average account value over the period, mulitplied by 182/365 (to reflect the one-half year period). For Class C of the Fund, expenses are equal to the Fund’s annualized net expense ratio of 1.24% multiplied by the average account value over the period, multiplied by 134/365 (to reflect the 134 days in the period since class commencement of operations).
Nuveen Ohio Tax Free Fund
| Actual Performance | Hypothetical Performance | |||||||||||||||||||||||||
| A Shares | C1 Shares | I Shares | A Shares | C1 Shares | I Shares | |||||||||||||||||||||
| Beginning Account Value (12/01/10) | $ | 1,000.00 | $ | 1,000.00 | $ | 1,000.00 | $ | 1,000.00 | $ | 1,000.00 | $ | 1,000.00 | ||||||||||||||
| Ending Account Value (5/31/11) | $ | 1,019.00 | $ | 1,016.70 | $ | 1,020.00 | $ | 1,021.39 | $ | 1,019.20 | $ | 1,022.44 | ||||||||||||||
| Expenses Incurred During Period | $ | 3.57 | $ | 5.78 | $ | 2.52 | $ | 3.58 | $ | 5.79 | $ | 2.52 | ||||||||||||||
For each class of the Fund, expenses are equal to the Fund’s annualized net expense ratio of .71%, 1.15% and .50% for Classes A, C1 and I, respectively, multiplied by the average account value over the period, mulitplied by 182/365 (to reflect the one-half year period).
Nuveen Oregon Intermediate Municipal Bond Fund
| Actual Performance | Hypothetical Performance | |||||||||||||||||||||||||
| A Shares | C Shares | I Shares | A Shares | C Shares | I Shares | |||||||||||||||||||||
| Beginning Account Value (12/01/10) | $ | 1,000.00 | $ | 1,000.00 | $ | 1,000.00 | $ | 1,000.00 | $ | 1,000.00 | $ | 1,000.00 | ||||||||||||||
| Ending Account Value (5/31/11) | $ | 1,025.00 | $ | 1,050.40 | $ | 1,025.80 | $ | 1,020.84 | $ | 1,018.15 | $ | 1,021.79 | ||||||||||||||
| Expenses Incurred During Period | $ | 4.14 | $ | 6.95 | $ | 3.18 | $ | 4.13 | $ | 6.84 | $ | 3.18 | ||||||||||||||
For each class of the Fund, expenses are equal to the Fund’s annualized net expense ratio of .82%, and .63% for Classes A, and I, respectively, multiplied by the average account value over the period, mulitplied by 182/365 (to reflect the one-half year period). For Class C of the Fund, expenses are equal to the Fund’s annualized net expense ratio of 1.36% multiplied by the average account value over the period, multiplied by 134/365 (to reflect the 134 days in the period since class commencement of operations).
| Nuveen Investments | 41 |
Shareholder Meeting Report (Unaudited)
A special meeting of shareholders was held in the offices of FAF Advisors, Inc. on December 17, 2010; at this meeting the shareholders were asked to vote on the election of Board Members, the approval of an Investment Advisory Agreement and the approval of an Investment Sub-Advisory Agreement.
| Nuveen Colorado Tax-Free Fund | Nuveen Minnesota Intermediate Municipal Bond Fund | Nuveen Minnesota Municipal Bond Fund | Nuveen Missouri Tax-Free Fund | Nuveen Nebraska Municipal Bond Fund | Nuveen Ohio Tax-Free Fund | Nuveen Oregon Intermediate Municipal Bond Fund | ||||||||||||||||||||||
| To approve an investment advisory agreement with Nuveen Asset Management and an investment sub-advisory agreement between Nuveen Asset Management and Nuveen Asset Management, LLC.: | ||||||||||||||||||||||||||||
For | 4,924,164 | 19,537,687 | 8,409,806 | 12,195,273 | 3,241,179 | 5,928,705 | 13,552,722 | |||||||||||||||||||||
Against | 32,152 | 41,211 | 177,157 | 142,212 | 4,582 | 1,971 | 10,580 | |||||||||||||||||||||
Abstain | 25,835 | 48,161 | 350,276 | 14,876 | 20,216 | 3,765 | 129,457 | |||||||||||||||||||||
Broker Non-Votes | 1,040,586 | 3,391,332 | 6,268,998 | 1,674,001 | 793,738 | 307,848 | 2,281,069 | |||||||||||||||||||||
Total | 6,022,737 | 23,018,391 | 15,206,237 | 14,026,362 | 4,059,715 | 6,242,289 | 15,973,828 | |||||||||||||||||||||
Approval of the Board Members was reached as follows: | ||||||||||||||||||||||||||||
John P. Amboian | ||||||||||||||||||||||||||||
For | 6,022,737 | 22,954,140 | 14,653,464 | 13,985,592 | 4,045,243 | 6,231,991 | 15,936,945 | |||||||||||||||||||||
Withhold | — | 64,251 | 552,773 | 40,770 | 14,472 | 10,298 | 36,883 | |||||||||||||||||||||
Total | 6,022,737 | 23,018,391 | 15,206,237 | 14,026,362 | 4,059,715 | 6,242,289 | 15,973,828 | |||||||||||||||||||||
Robert P. Bremner | ||||||||||||||||||||||||||||
For | 6,022,737 | 22,920,630 | 14,653,464 | 13,981,128 | 4,045,243 | 6,231,991 | 15,936,945 | |||||||||||||||||||||
Withhold | — | 97,761 | 552,773 | 45,234 | 14,472 | 10,298 | 36,883 | |||||||||||||||||||||
Total | 6,022,737 | 23,018,391 | 15,206,237 | 14,026,362 | 4,059,715 | 6,242,289 | 15,973,828 | |||||||||||||||||||||
Jack B. Evans | ||||||||||||||||||||||||||||
For | 6,022,737 | 22,959,263 | 14,653,464 | 13,981,996 | 4,045,243 | 6,231,991 | 15,936,945 | |||||||||||||||||||||
Withhold | — | 59,128 | 552,773 | 44,366 | 14,472 | 10,298 | 36,883 | |||||||||||||||||||||
Total | 6,022,737 | 23,018,391 | 15,206,237 | 14,026,362 | 4,059,715 | 6,242,289 | 15,973,828 | |||||||||||||||||||||
William C. Hunter | ||||||||||||||||||||||||||||
For | 6,022,737 | 22,959,263 | 14,653,464 | 13,981,996 | 4,045,243 | 6,231,991 | 15,936,945 | |||||||||||||||||||||
Withhold | — | 59,128 | 552,773 | 44,366 | 14,472 | 10,298 | 36,883 | |||||||||||||||||||||
Total | 6,022,737 | 23,018,391 | 15,206,237 | 14,026,362 | 4,059,715 | 6,242,289 | 15,973,828 | |||||||||||||||||||||
David J. Kundert | ||||||||||||||||||||||||||||
For | 6,022,737 | 22,920,630 | 14,653,464 | 13,981,128 | 4,045,243 | 6,231,991 | 15,936,945 | |||||||||||||||||||||
Withhold | — | 97,761 | 552,773 | 45,234 | 14,472 | 10,298 | 36,883 | |||||||||||||||||||||
Total | 6,022,737 | 23,018,391 | 15,206,237 | 14,026,362 | 4,059,715 | 6,242,289 | 15,973,828 | |||||||||||||||||||||
William J. Schneider | ||||||||||||||||||||||||||||
For | 6,022,737 | 22,920,630 | 14,653,464 | 13,981,996 | 4,045,243 | 6,231,991 | 15,936,945 | |||||||||||||||||||||
Withhold | — | 97,761 | 552,773 | 44,366 | 14,472 | 10,298 | 36,883 | |||||||||||||||||||||
Total | 6,022,737 | 23,018,391 | 15,206,237 | 14,026,362 | 4,059,715 | 6,242,289 | 15,973,828 | |||||||||||||||||||||
Judith M. Stockdale | ||||||||||||||||||||||||||||
For | 6,022,737 | 22,954,140 | 14,653,464 | 13,981,996 | 4,045,243 | 6,231,991 | 15,946,994 | |||||||||||||||||||||
Withhold | — | 64,251 | 552,773 | 44,366 | 14,472 | 10,298 | 26,834 | |||||||||||||||||||||
Total | 6,022,737 | 23,018,391 | 15,206,237 | 14,026,362 | 4,059,715 | 6,242,289 | 15,973,828 | |||||||||||||||||||||
Carole E. Stone | ||||||||||||||||||||||||||||
For | 6,022,737 | 22,959,263 | 14,653,464 | 13,981,996 | 4,045,243 | 6,231,991 | 15,946,994 | |||||||||||||||||||||
Withhold | — | 59,128 | 552,773 | 44,366 | 14,472 | 10,298 | 26,834 | |||||||||||||||||||||
Total | 6,022,737 | 23,018,391 | 15,206,237 | 14,026,362 | 4,059,715 | 6,242,289 | 15,973,828 | |||||||||||||||||||||
Virginia L. Stringer | ||||||||||||||||||||||||||||
For | 6,022,737 | 22,915,507 | 14,653,464 | 13,981,128 | 4,045,243 | 6,231,991 | 15,946,994 | |||||||||||||||||||||
Withhold | — | 102,884 | 552,773 | 45,234 | 14,472 | 10,298 | 26,834 | |||||||||||||||||||||
Total | 6,022,737 | 23,018,391 | 15,206,237 | 14,026,362 | 4,059,715 | 6,242,289 | 15,973,828 | |||||||||||||||||||||
Terence J. Toth | ||||||||||||||||||||||||||||
For | 6,022,737 | 22,959,263 | 14,653,464 | 13,985,592 | 4,045,243 | 6,231,991 | 15,936,945 | |||||||||||||||||||||
Withhold | — | 59,128 | 552,773 | 40,770 | 14,472 | 10,298 | 36,883 | |||||||||||||||||||||
Total | 6,022,737 | 23,018,391 | 15,206,237 | 14,026,362 | 4,059,715 | 6,242,289 | 15,973,828 | |||||||||||||||||||||
| 42 | Nuveen Investments |
Independent Registered
Public Accounting Firm
The Board of Directors and Shareholders
Nuveen Colorado Tax Free Fund (formerly known as First American Colorado Tax Free Fund)
Nuveen Minnesota Intermediate Municipal Bond Fund (formerly known as First American Minnesota Intermediate Tax Free Fund)
Nuveen Minnesota Municipal Bond Fund (formerly known as First American Minnesota Tax Free Fund)
Nuveen Missouri Tax Free Fund (formerly known as First American Missouri Tax Free Fund)
Nuveen Nebraska Municipal Bond Fund (formerly known as First American Nebraska Tax Free Fund)
Nuveen Ohio Tax Free Fund (formerly known as First American Ohio Tax Free Fund)
Nuveen Oregon Intermediate Municipal Bond Fund (formerly known as First American Oregon Intermediate Tax Free Fund)
We have audited the accompanying statements of assets and liabilities, including the portfolios of investments, of Nuveen Colorado Tax Free Fund (formerly known as First American Colorado Tax Free Fund), Nuveen Minnesota Intermediate Municipal Bond Fund (formerly known as First American Minnesota Intermediate Tax Free Fund), Nuveen Minnesota Municipal Bond Fund (formerly known as First American Minnesota Tax Free Fund), Nuveen Missouri Tax Free Fund (formerly known as First American Missouri Tax Free Fund), Nuveen Nebraska Municipal Bond Fund (formerly known as First American Nebraska Tax Free Fund), Nuveen Ohio Tax Free Fund (formerly known as First American Ohio Tax Free Fund), and Nuveen Oregon Intermediate Municipal Bond Fund (formerly known as First American Oregon Intermediate Tax Free Fund) (the “Funds”) as of May 31, 2011, and the related statements of operations, the statements of changes in net assets, and the financial highlights for each of the periods indicated therein. These financial statements and financial highlights are the responsibility of the Funds’ management. Our responsibility is to express an opinion on these financial statements and financial highlights based on our audits.
We conducted our audits in accordance with the standards of the Public Company Accounting Oversight Board (United States). Those standards require that we plan and perform the audits to obtain reasonable assurance about whether the financial statements and financial highlights are free of material misstatement. We were not engaged to perform an audit of the Funds’ internal control over financial reporting. Our audits included consideration of internal control over financial reporting as a basis for designing audit procedures that are appropriate in the circumstances, but not for the purpose of expressing an opinion on the effectiveness of the Funds’ internal control over financial reporting. Accordingly, we express no such opinion. An audit also includes examining, on a test basis, evidence supporting the amounts and disclosures in the financial statements and financial highlights, assessing the accounting principles used and significant estimates made by management, and evaluating the overall financial statement presentation. Our procedures included confirmation of securities owned as of May 31, 2011, by correspondence with the custodian and brokers or by other appropriate auditing procedures where replies from brokers were not received. We believe that our audits provide a reasonable basis for our opinion.
In our opinion, the financial statements and financial highlights referred to above present fairly, in all material respects, the financial positions of Nuveen Colorado Tax Free Fund (formerly known as First American Colorado Tax Free Fund), Nuveen Minnesota Intermediate Municipal Bond Fund (formerly known as First American Minnesota Intermediate Tax Free Fund), Nuveen Minnesota Municipal Bond Fund (formerly known as First American Minnesota Tax Free Fund), Nuveen Missouri Tax Free Fund (formerly known as First American Missouri Tax Free Fund), Nuveen Nebraska Municipal Bond Fund (formerly known as First American Nebraska Tax Free Fund), Nuveen Ohio Tax Free Fund (formerly known as First American Ohio Tax Free Fund), and Nuveen Oregon Intermediate Municipal Bond Fund (formerly known as First American Oregon Intermediate Tax Free Fund) at May 31, 2011, and the results of their operations, the changes in their net assets, and the financial highlights for each of the periods indicated therein in conformity with U.S. generally accepted accounting principles.

Chicago, Illinois
July 28, 2011
| Nuveen Investments | 43 |
Nuveen Colorado Tax Free Fund
(formerly known as First American Colorado Tax Free Fund)
May 31, 2011
| Principal Amount (000) | Description p | Value | ||||||||||||
MUNICIPAL BONDS – 98.6% | ||||||||||||||
Certificates of Participation – 8.2% | ||||||||||||||
Colorado Higher Education Capital Construction Lease | ||||||||||||||
| $ | 425 | 5.500%, 11/01/2019 | $ | 481,661 | ||||||||||
| 1,255 | 5.500%, 11/01/2027 | 1,335,383 | ||||||||||||
Colorado Higher Education Capital Construction Lease (Pre-refunded 11/01/2018 @ 100) | ||||||||||||||
| 465 | 5.500%, 11/01/2027 | 569,936 | ||||||||||||
Eagle River Fire District | ||||||||||||||
| 225 | 6.125%, 12/01/2019 | 235,253 | ||||||||||||
| 220 | 6.625%, 12/01/2024 | 228,002 | ||||||||||||
| 400 | 6.785%, 12/01/2030 | 404,224 | ||||||||||||
Garfield County Public Library, Regional Lease Financing Program | ||||||||||||||
| 835 | 5.375%, 12/01/2027 | 891,604 | ||||||||||||
Pueblo County, Capital Construction | ||||||||||||||
| 210 | 4.400%, 12/01/2016 | 225,494 | ||||||||||||
| 200 | 5.000%, 12/01/2024 | 204,278 | ||||||||||||
| 4,235 | Total Certificates of Participation | 4,575,835 | ||||||||||||
Continuing Care Retirement Communities – 3.0% | ||||||||||||||
Colorado Health Facilities Authority, Christian Living Communities Project, Series A | ||||||||||||||
| 250 | 5.250%, 01/01/2014 | 249,750 | ||||||||||||
| 100 | 5.750%, 01/01/2026 | 92,507 | ||||||||||||
Colorado Health Facilities Authority, Covenant Retirement Communities | ||||||||||||||
| 500 | 5.000%, 12/01/2016 | 516,825 | ||||||||||||
| 200 | 5.250%, 12/01/2025 | 184,370 | ||||||||||||
Colorado Health Facilities Authority, Covenant Retirement Communities, Series B | ||||||||||||||
| 350 | 6.125%, 12/01/2033 | 336,592 | ||||||||||||
Illinois Finance Authority, Franciscan Communities, Series A | ||||||||||||||
| 225 | 5.500%, 05/15/2037 | 165,010 | ||||||||||||
Illinois Finance Authority, Three Crowns Park Plaza, Series A | ||||||||||||||
| 100 | 5.875%, 02/15/2026 | 93,678 | ||||||||||||
| 1,725 | Total Continuing Care Retirement Communities | 1,638,732 | ||||||||||||
Education – 21.2% | ||||||||||||||
Adams State College Auxiliary Facilities Improvement Series A, (STAID) | ||||||||||||||
| 1,340 | 5.500%, 05/15/2034 | 1,405,459 | ||||||||||||
| 1,000 | 5.500%, 05/15/2039 | 1,038,780 | ||||||||||||
Colorado Educational & Cultural Facilities Authority, Ave Maria School Project (RAAI) | ||||||||||||||
| 220 | 4.750%, 12/01/2014 | 228,765 | ||||||||||||
| 230 | 4.750%, 12/01/2015 | 238,478 | ||||||||||||
| 250 | 4.850%, 12/01/2025 | 219,985 | ||||||||||||
Colorado Educational & Cultural Facilities Authority, Bromley East Charter School Project | ||||||||||||||
| 65 | 6.250%, 09/15/2011 (ETM) | 66,049 | ||||||||||||
Colorado Educational & Cultural Facilities Authority, Charter School | ||||||||||||||
| 1,000 | 5.625%, 05/01/2040 | 962,680 | ||||||||||||
Colorado Educational & Cultural Facilities Authority, Charter School, James Irwin Foundation (CIFG) (STAID) | ||||||||||||||
| 250 | 5.000%, 08/01/2027 | 251,365 | ||||||||||||
Colorado Educational & Cultural Facilities Authority, Charter School, Parker Core (SMO) | ||||||||||||||
| 500 | 5.000%, 11/01/2037 | 434,125 | ||||||||||||
Colorado Educational & Cultural Facilities Authority, Charter School, Pinnacle High School | ||||||||||||||
| 1,000 | 5.000%, 12/01/2029 | 978,740 | ||||||||||||
Colorado Educational & Cultural Facilities Authority, Charter School, Twin Peaks, Series B | ||||||||||||||
| 600 | 7.500%, 03/15/2035 | 613,044 | ||||||||||||
| 44 | Nuveen Investments |
| Principal Amount (000) | Description p | Value | ||||||||||||
Education (continued) | ||||||||||||||
Colorado Educational & Cultural Facilities Authority, Cheyenne Mountain Charter School, Series A, (SMO) | ||||||||||||||
| $ | 240 | 5.000%, 06/15/2018 | $ | 255,953 | ||||||||||
| 255 | 5.000%, 06/15/2019 | 268,416 | ||||||||||||
| 265 | 5.000%, 06/15/2020 | 275,197 | ||||||||||||
| 500 | 5.250%, 06/15/2029 | 483,030 | ||||||||||||
Colorado Educational & Cultural Facilities Authority, Kent Denver School Project | ||||||||||||||
| 500 | 5.125%, 10/01/2039 | 489,715 | ||||||||||||
Colorado Educational & Cultural Facilities Authority, Northwest Nazarene | ||||||||||||||
| 690 | 4.500%, 11/01/2015 | 696,389 | ||||||||||||
Colorado Educational & Cultural Facilities Authority, Vail Mountain School Project | ||||||||||||||
| 1,000 | 6.125%, 05/01/2040 | 941,420 | ||||||||||||
University of Colorado Enterprise System, Series A | ||||||||||||||
| 335 | 5.750%, 06/01/2028 | 373,950 | ||||||||||||
| 500 | 5.375%, 06/01/2032 | 531,020 | ||||||||||||
Western State College (STAID) | ||||||||||||||
| 1,000 | 5.000%, 05/15/2034 | 1,015,390 | ||||||||||||
| 11,740 | Total Education | 11,767,950 | ||||||||||||
General Obligations – 21.0% | ||||||||||||||
Adams & Arapahoe Counties School District, #28J, Aurora (STAID) | ||||||||||||||
| 300 | 5.500%, 12/01/2021 | 353,010 | ||||||||||||
| 165 | 5.500%, 12/01/2025 | 186,336 | ||||||||||||
Adams County School District #1, Mapleton Public Schools (STAID) | ||||||||||||||
| 1,000 | 6.250%, 12/01/2035 | 1,128,710 | ||||||||||||
Belle Creek Metropolitan School District #1 | ||||||||||||||
| 670 | 6.000%, 12/01/2026 | 713,919 | ||||||||||||
Boulder, Larimer & Weld Counties, St. Vrain Valley School District #RE1J (STAID) | ||||||||||||||
| 2,000 | 5.000%, 12/15/2033 | 2,108,380 | ||||||||||||
Denver City & County School District #1, Series A, (STAID) | ||||||||||||||
| 1,000 | 5.000%, 12/01/2028 | 1,074,620 | ||||||||||||
Gunnison Watershed School District, #RE1J, Series 2009, (STAID) | ||||||||||||||
| 1,000 | 5.250%, 12/01/2026 | 1,108,650 | ||||||||||||
| 1,800 | 5.250%, 12/01/2033 | 1,931,886 | ||||||||||||
North Range Metropolitan District #1 (ACA) | ||||||||||||||
| 295 | 4.250%, 12/15/2018 | 250,098 | ||||||||||||
Puerto Rico Commonwealth, Series A | ||||||||||||||
| 500 | 5.500%, 07/01/2018 | 537,580 | ||||||||||||
Puerto Rico Commonwealth, Series C-7, (NATL) | ||||||||||||||
| 250 | 6.000%, 07/01/2027 | 259,463 | ||||||||||||
Puerto Rico Commonwealth, Public Improvement, Series A | ||||||||||||||
| 375 | 5.250%, 07/01/2026 | 370,751 | ||||||||||||
Rio Blanco County School District, #RE1, Meeker (STAID) | ||||||||||||||
| 500 | 5.250%, 12/01/2022 | 560,150 | ||||||||||||
| 150 | 5.250%, 12/01/2024 | 165,117 | ||||||||||||
Sand Creek Metropolitan District, Limited Tax, Series B | ||||||||||||||
| 1,000 | 5.000%, 12/01/2040 | 873,650 | ||||||||||||
| 11,005 | Total General Obligations | 11,622,320 | ||||||||||||
Health Care – 15.8% | ||||||||||||||
Colorado Health Facilities Authority, Catholic Health Initiatives, Series A | ||||||||||||||
| 500 | 5.000%, 07/01/2039 | 483,860 | ||||||||||||
Colorado Health Facilities Authority, Catholic Health Initiatives, Series D | ||||||||||||||
| 500 | 5.125%, 10/01/2017 | 581,830 | ||||||||||||
| 500 | 6.250%, 10/01/2033 | 541,125 | ||||||||||||
| Nuveen Investments | 45 |
Portfolio of Investments
Nuveen Colorado Tax Free Fund (continued)
May 31, 2011
| Principal Amount (000) | Description p | Value | ||||||||||||
Health Care (continued) | ||||||||||||||
Colorado Health Facilities Authority, Evangelical Lutheran | ||||||||||||||
| $ | 250 | 5.000%, 06/01/2016 | $ | 268,488 | ||||||||||
| 195 | 6.900%, 12/01/2025 | 199,136 | ||||||||||||
Colorado Health Facilities Authority, Evangelical Lutheran, Series A | ||||||||||||||
| 230 | 5.250%, 06/01/2034 | 206,259 | ||||||||||||
Colorado Health Facilities Authority, Health & Residential Care Facilities, Volunteers of America | ||||||||||||||
Series A | ||||||||||||||
| 500 | 5.000%, 07/01/2015 | 487,740 | ||||||||||||
Colorado Health Facilities Authority, Longmont United Hospital, Series B, (RAAI) | ||||||||||||||
| 325 | 4.625%, 12/01/2024 | 296,241 | ||||||||||||
Colorado Health Facilities Authority, National Jewish Medical & Research Center | ||||||||||||||
| 855 | 5.375%, 01/01/2016 | 855,880 | ||||||||||||
Colorado Health Facilities Authority, Portercare Adventist Health | ||||||||||||||
(Pre-refunded 11/15/2011 @ 101) | ||||||||||||||
| 600 | 6.500%, 11/15/2023 | 622,800 | ||||||||||||
Colorado Health Facilities Authority, Valley View Hospital Association Project | ||||||||||||||
| 400 | 5.500%, 05/15/2028 | 380,520 | ||||||||||||
Colorado Health Facilities, NCMC Income Project, Series A, (AGM) | ||||||||||||||
| 1,000 | 5.250%, 05/15/2026 | 1,033,120 | ||||||||||||
Colorado Health Facilities, Total Longterm Care National, Series A | ||||||||||||||
| 780 | 6.250%, 11/15/2040 | 762,528 | ||||||||||||
Colorado Springs Hospital | ||||||||||||||
| 750 | 6.250%, 12/15/2033 | 789,990 | ||||||||||||
Delta County Memorial Hospital District Enterprise | ||||||||||||||
| 500 | 5.350%, 09/01/2017 | 507,325 | ||||||||||||
| 515 | 5.500%, 09/01/2025 | 511,436 | ||||||||||||
Denver Health & Hospital Authority, Healthcare, Series A | ||||||||||||||
| 250 | 4.750%, 12/01/2027 | 221,145 | ||||||||||||
| 8,650 | Total Health Care | 8,749,423 | ||||||||||||
Housing – 5.6% | ||||||||||||||
Colorado Educational & Cultural Facilities Authority, Student Housing, Campus Village Apartment | ||||||||||||||
| 810 | 5.000%, 06/01/2022 | 854,210 | ||||||||||||
| 50 | 5.500%, 06/01/2038 | 48,597 | ||||||||||||
Colorado Housing & Finance Authority, Series E-2, (AMT) | ||||||||||||||
| 25 | 7.000%, 02/01/2030 | 25,676 | ||||||||||||
Colorado Housing & Finance Authority, Multifamily Project, Series B-4, Class I | ||||||||||||||
| 95 | 5.900%, 04/01/2031 | 95,057 | ||||||||||||
Colorado Housing & Finance Authority, Single Family Program, Series B-2, (AMT) | ||||||||||||||
| 10 | 7.100%, 04/01/2017 | 10,370 | ||||||||||||
Denver City & County Housing Authority, Capital Funding Program, Three Towers Rehabilitation Project (AGM) (AMT) | ||||||||||||||
| 1,500 | 4.550%, 11/01/2017 | 1,575,075 | ||||||||||||
| 500 | 5.200%, 11/01/2027 | 504,725 | ||||||||||||
| 2,990 | Total Housing | 3,113,710 | ||||||||||||
Lease Revenue – 1.0% | ||||||||||||||
Puerto Rico Public Buildings Authority, Government Facilities | ||||||||||||||
Series M-2, Mandatory Put 07/01/2017 @ 100 (AMBAC) (COMGTY) | ||||||||||||||
| 500 | 5.500%, 07/01/2035 | 533,175 | ||||||||||||
Miscellaneous – 0.7% | ||||||||||||||
High Plains Metropolitan District, Series B | ||||||||||||||
| 400 | 4.375%, 12/01/2015 | 401,412 | ||||||||||||
| 46 | Nuveen Investments |
| Principal Amount (000) | Description p | Value | ||||||||||||
Tax Revenue – 5.3% | ||||||||||||||
Lone Tree Sales & Use Tax, Recreational Projects, Series A | ||||||||||||||
| $ | 340 | 5.000%, 12/01/2020 | $ | 385,050 | ||||||||||
Park Creek Metropolitan District, Limited Property Tax, Series A, (AGM) | ||||||||||||||
| 1,000 | 6.125%, 12/01/2041 | 1,033,440 | ||||||||||||
Park Meadows Business Improvement District, Shared Sales Tax | ||||||||||||||
| 225 | 5.000%, 12/01/2017 | 224,876 | ||||||||||||
| 475 | 5.300%, 12/01/2027 | 409,203 | ||||||||||||
Puerto Rico, Sales Tax Financing, Series A | ||||||||||||||
| 550 | 6.000%, 08/01/2042 | 564,938 | ||||||||||||
Superior Open Space Sales & Use Tax | ||||||||||||||
| 330 | 5.000%, 06/01/2026 | 315,243 | ||||||||||||
| 2,920 | Total Tax Revenue | 2,932,750 | ||||||||||||
Transportation – 7.6% | ||||||||||||||
Denver City & County Airport Revenue, Series A | ||||||||||||||
| 1,000 | 5.000%, 11/15/2031 | 1,017,570 | ||||||||||||
E-470 Public Highway Authority, Series B (NATL) | ||||||||||||||
| 1,575 | 0.000%, 09/01/2017 | 1,131,842 | ||||||||||||
| 960 | 0.000%, 09/01/2019 | 590,880 | ||||||||||||
| 1,000 | 0.000%, 09/01/2022 | 486,570 | ||||||||||||
E-470 Public Highway Authority, Series C, Convertible CABs (NATL) | ||||||||||||||
| 500 | 0.000% through 09/01/2011, thereafter 5.000%, 09/01/2017 | 514,530 | ||||||||||||
E-470 Public Highway Authority, Series D1, (NATL) | ||||||||||||||
| 300 | 5.500%, 09/01/2024 | 293,352 | ||||||||||||
Eagle County Air Terminal, Airport Terminal Improvement Project | ||||||||||||||
Series B, (AMT) | ||||||||||||||
| 205 | 5.250%, 05/01/2020 | 194,463 | ||||||||||||
| 5,540 | Total Transportation | 4,229,207 | ||||||||||||
Utilities – 9.2% | ||||||||||||||
Arkansas River Power Authority | ||||||||||||||
| 225 | 6.000%, 10/01/2040 | 219,672 | ||||||||||||
| 1,255 | 6.125%, 10/01/2040 | 1,247,257 | ||||||||||||
Broomfield Water Activity Enterprise (NATL) | ||||||||||||||
| 500 | 5.500%, 12/01/2017 | 506,710 | ||||||||||||
Colorado Housing & Finance Authority, Waste Disposal, Management Income Project (AMT) | ||||||||||||||
| 250 | 5.700%, 07/01/2018 | 268,878 | ||||||||||||
Colorado Springs Utilities, Series C | ||||||||||||||
| 1,200 | 5.500%, 11/15/2048 | 1,261,992 | ||||||||||||
Colorado Water Resources & Power Development Authority, Fountain Electric Water Utility | ||||||||||||||
Series A, (AGM) | ||||||||||||||
| 350 | 5.000%, 09/01/2036 | 353,188 | ||||||||||||
Eagle River Water & Sanitation Revenue (AGTY) | ||||||||||||||
| 800 | 5.000%, 12/01/2034 | 823,440 | ||||||||||||
Public Authority for Colorado Energy Natural Gas | ||||||||||||||
| 425 | 6.250%, 11/15/2028 | 449,650 | ||||||||||||
| 5,005 | Total Utilities | 5,130,787 | ||||||||||||
| 54,710 | Total Municipal Bonds (cost $53,248,299) | 54,695,301 | ||||||||||||
| Nuveen Investments | 47 |
Portfolio of Investments
Nuveen Colorado Tax Free Fund (continued)
May 31, 2011
| Shares | Description p | Value | ||||||||||||
SHORT-TERM INVESTMENTS – 0.3% | ||||||||||||||
Money Market Funds – 0.3% | ||||||||||||||
| 146,724 | First American Tax Free Obligations Fund, Class Z, 0.000% | $ | 146,724 | |||||||||||
Total Short-Term Investments (cost $146,724) | 146,724 | |||||||||||||
Total Investments – 98.9% (cost $53,395,023) | 54,842,025 | |||||||||||||
Other Assets Less Liabilities – 1.1% | 611,573 | |||||||||||||
Net Assets – 100.0% | $ | 55,453,598 | ||||||||||||
| p | All percentages shown in the Portfolio of Investments are based on net assets. |
 | Convertible Capital Appreciation Bonds (Convertible CABs) initially pay no interest but accrete in value from the date of issuance through the conversion date, at which time the bonds start to accrue and pay interest on a semiannual basis until final maturity. |
 | The rate shown is the annualized seven-day effective yield as of May 31, 2011. |
| (ETM) | Escrowed to maturity. |
See accompanying notes to financial statements.
| 48 | Nuveen Investments |
Portfolio of Investments
Nuveen Minnesota Intermediate Municipal Bond Fund
(formerly known as First American Minnesota Intermediate Tax Free Fund)
May 31, 2011
| Principal Amount (000) | Description p | Value | ||||||||||||
MUNICIPAL BONDS – 98.5% | ||||||||||||||
Certificates of Participation – 1.3% | ||||||||||||||
Duluth Independent School District #709, Series B (MSDCEP) | ||||||||||||||
| $ | 1,890 | 4.000%, 02/01/2019 | $ | 2,103,230 | ||||||||||
Northeast Metropolitan Intermediate School District #916 | ||||||||||||||
| 1,000 | 4.250%, 01/01/2015 | 1,052,090 | ||||||||||||
| 2,890 | Total Certificates of Participation | 3,155,320 | ||||||||||||
Economic Development – 2.2% | ||||||||||||||
Minneapolis Community Development Agency, Series G-3, (Pre-refunded 12/01/2011 @ 100) | ||||||||||||||
| 975 | 5.350%, 12/01/2021 | 999,970 | ||||||||||||
Minneapolis Development, Common Bond, Series 1A, (AMT) | ||||||||||||||
| 480 | 4.550%, 12/01/2013 | 508,617 | ||||||||||||
| 505 | 4.625%, 12/01/2014 | 539,820 | ||||||||||||
Minneapolis Development, Common Bond, Series 2A | ||||||||||||||
| 2,000 | 4.625%, 12/01/2020 | 2,076,500 | ||||||||||||
Minneapolis Supported Development, Common Bond, Series 2A, (AMT) | ||||||||||||||
| 1,000 | 5.125%, 06/01/2022 | 1,006,410 | ||||||||||||
| 4,960 | Total Economic Development | 5,131,317 | ||||||||||||
Education – 18.2% | ||||||||||||||
Minneapolis, The Blake School Project | ||||||||||||||
| 550 | 4.000%, 09/01/2019 | 594,930 | ||||||||||||
| 315 | 4.000%, 09/01/2021 | 335,103 | ||||||||||||
Minneapolis, The Blake School Project, (Pre-refunded 09/01/2011 @ 100) | ||||||||||||||
| 445 | 5.000%, 09/01/2012 | 450,375 | ||||||||||||
Minnesota Colleges & Universities, Series A | ||||||||||||||
| 985 | 4.000%, 10/01/2022 | 1,035,728 | ||||||||||||
| 1,755 | 4.000%, 10/01/2023 | 1,820,725 | ||||||||||||
| 1,415 | 4.250%, 10/01/2024 | 1,483,132 | ||||||||||||
| 750 | 4.375%, 10/01/2025 | 781,777 | ||||||||||||
| 870 | 4.500%, 10/01/2026 | 907,601 | ||||||||||||
Minnesota Higher Education Facilities Authority, Augsburg College, Series 6-C | ||||||||||||||
| 1,075 | 4.750%, 05/01/2018 | 1,106,293 | ||||||||||||
Minnesota Higher Education Facilities Authority, Augsburg College, Series 6-J1 | ||||||||||||||
| 320 | 5.000%, 05/01/2013 | 338,518 | ||||||||||||
| 375 | 5.000%, 05/01/2016 | 404,527 | ||||||||||||
| 1,295 | 5.000%, 05/01/2020 | 1,338,629 | ||||||||||||
Minnesota Higher Education Facilities Authority, Augsburg College, Series 7-G | ||||||||||||||
| 815 | 4.000%, 10/01/2021 | 797,600 | ||||||||||||
Minnesota Higher Education Facilities Authority, Bethel University, Series 6-R | ||||||||||||||
| 1,125 | 5.500%, 05/01/2018 | 1,169,201 | ||||||||||||
| 1,185 | 5.500%, 05/01/2019 | 1,224,153 | ||||||||||||
| 1,050 | 5.500%, 05/01/2024 | 1,024,380 | ||||||||||||
Minnesota Higher Education Facilities Authority, College of Art & Design, Series 6-K | ||||||||||||||
| 310 | 5.000%, 05/01/2013 | 327,940 | ||||||||||||
| 320 | 5.000%, 05/01/2014 | 345,520 | ||||||||||||
| 340 | 5.000%, 05/01/2015 | 372,144 | ||||||||||||
| 355 | 5.000%, 05/01/2016 | 385,835 | ||||||||||||
| 370 | 5.000%, 05/01/2017 | 396,577 | ||||||||||||
Minnesota Higher Education Facilities Authority, Gustavus Adolfus College, Series 7-B | ||||||||||||||
| 1,500 | 5.000%, 10/01/2018 | 1,697,370 | ||||||||||||
| 1,040 | 5.000%, 10/01/2023 | 1,111,354 | ||||||||||||
| 150 | 4.250%, 10/01/2024 | 150,569 | ||||||||||||
| Nuveen Investments | 49 |
Portfolio of Investments
Nuveen Minnesota Intermediate Municipal Bond Fund (continued)
May 31, 2011
| Principal Amount (000) | Description p | Value | ||||||||||||
Education (continued) | ||||||||||||||
Minnesota Higher Education Facilities Authority, Hamline University, Series 7-E | ||||||||||||||
| $ | 1,000 | 4.125%, 10/01/2018 | $ | 1,031,450 | ||||||||||
| 1,370 | 4.375%, 10/01/2020 | 1,396,989 | ||||||||||||
| 500 | 4.500%, 10/01/2021 | 509,250 | ||||||||||||
| 250 | 5.000%, 10/01/2029 | 244,698 | ||||||||||||
Minnesota Higher Education Facilities Authority, Hamline University, Series K-1 | ||||||||||||||
| 1,000 | 4.250%, 10/01/2018 | 1,032,080 | ||||||||||||
Minnesota Higher Education Facilities Authority, Hamline University, Series K-2 | ||||||||||||||
| 625 | 6.000%, 10/01/2032 | 655,356 | ||||||||||||
Minnesota Higher Education Facilities Authority, St. Benedict College, Series V | ||||||||||||||
| 1,585 | 4.500%, 03/01/2017 | 1,710,516 | ||||||||||||
Minnesota Higher Education Facilities Authority, St. Catherine College, Series 5-N1 | ||||||||||||||
| 500 | 5.250%, 10/01/2022 | 505,445 | ||||||||||||
Minnesota Higher Education Facilities Authority, St. John’s University, Series 6-U | ||||||||||||||
| 290 | 4.200%, 10/01/2019 | 310,338 | ||||||||||||
| 385 | 4.300%, 10/01/2020 | 409,752 | ||||||||||||
| 145 | 4.500%, 10/01/2022 | 152,831 | ||||||||||||
Minnesota Higher Education Facilities Authority, St. Olaf College, Series 6-O | ||||||||||||||
| 500 | 5.000%, 10/01/2016 | 571,290 | ||||||||||||
Minnesota Higher Education Facilities Authority, St. Scholastica College, Series 6-S | ||||||||||||||
| 360 | 4.375%, 12/01/2016 | 382,860 | ||||||||||||
| 380 | 4.500%, 12/01/2017 | 402,602 | ||||||||||||
Minnesota Higher Education Facilities Authority, St. Scholastica College, Series 7-J | ||||||||||||||
| 150 | 6.000%, 12/01/2028 | 158,900 | ||||||||||||
Minnesota Higher Education Facilities Authority, St. Scholastica College, Series H | ||||||||||||||
| 750 | 5.125%, 12/01/2030 | 738,645 | ||||||||||||
Minnesota Higher Education Facilities Authority, University of St. Thomas | ||||||||||||||
Series 6-I | ||||||||||||||
| 1,045 | 4.000%, 04/01/2014 | 1,116,583 | ||||||||||||
Minnesota Higher Education Facilities Authority, University of St. Thomas, Series 6-X | ||||||||||||||
| 500 | 4.500%, 04/01/2021 | 528,130 | ||||||||||||
| 1,250 | 5.000%, 04/01/2024 | 1,317,387 | ||||||||||||
Minnesota Higher Education Facilities Authority, University of St. Thomas, Series 7-A | ||||||||||||||
| 1,000 | 4.000%, 10/01/2017 | 1,087,020 | ||||||||||||
| 1,000 | 4.500%, 10/01/2018 | 1,111,470 | ||||||||||||
| 1,845 | 4.500%, 10/01/2019 | 2,034,481 | ||||||||||||
Moorhead Educational Facilities, Concordia College, Series A | ||||||||||||||
| 500 | 4.100%, 12/15/2014 | 533,630 | ||||||||||||
| 880 | 4.200%, 12/15/2015 | 948,904 | ||||||||||||
| 925 | 4.300%, 12/15/2016 | 993,959 | ||||||||||||
| 1,005 | 5.000%, 12/15/2018 | 1,079,571 | ||||||||||||
| 1,060 | 5.000%, 12/15/2019 | 1,127,554 | ||||||||||||
University of Minnesota, Series C | ||||||||||||||
| 1,000 | 5.000%, 12/01/2019 | 1,185,110 | ||||||||||||
| 40,510 | Total Education | 42,876,782 | ||||||||||||
General Obligations – 23.7% | ||||||||||||||
Anoka County Capital Improvement, Series A | ||||||||||||||
| 610 | 4.100%, 02/01/2018 | 654,365 | ||||||||||||
| 1,000 | 5.000%, 02/01/2020 | 1,148,170 | ||||||||||||
Anoka County Capital Improvement, Series C | ||||||||||||||
| 285 | 4.100%, 02/01/2018 | 321,586 | ||||||||||||
| 595 | 4.200%, 02/01/2019 | 663,514 | ||||||||||||
Anoka County Capital Improvement, Series D | ||||||||||||||
| 500 | 5.000%, 02/01/2024 | 542,290 | ||||||||||||
| 50 | Nuveen Investments |
| Principal Amount (000) | Description p | Value | ||||||||||||
General Obligations (continued) | ||||||||||||||
Bemidji | ||||||||||||||
| $ | 635 | 5.500%, 02/01/2023 | $ | 751,002 | ||||||||||
| 750 | 5.500%, 02/01/2024 | 874,897 | ||||||||||||
| 875 | 5.500%, 02/01/2025 | 1,007,580 | ||||||||||||
| 1,010 | 5.500%, 02/01/2026 | 1,152,592 | ||||||||||||
| 1,150 | 5.500%, 02/01/2027 | 1,303,376 | ||||||||||||
Burnsville Independent School District #191, Alternative Facilities, Series A (AGM) (MSDCEP) | ||||||||||||||
| 350 | 4.200%, 02/01/2025 | 358,589 | ||||||||||||
Burnsville Independent School District #191, Alternative Facilities, Series A (MSDCEP) | ||||||||||||||
| 1,200 | 4.250%, 02/01/2020 | 1,321,440 | ||||||||||||
Chaska Independent School District #112, School Building, Series A (MSDCEP) (NATL) | ||||||||||||||
| 1,000 | 4.250%, 02/01/2019 | 1,101,850 | ||||||||||||
Chatfield Independent School District #227, School Building, Series A (AGM) (MSDCEP) | ||||||||||||||
| 450 | 4.000%, 02/01/2018 | 504,976 | ||||||||||||
Dakota County Community Development Agency, Senior Housing Facilities, Series A | ||||||||||||||
| 510 | 4.375%, 01/01/2019 | 561,377 | ||||||||||||
| 215 | 4.500%, 01/01/2020 | 234,619 | ||||||||||||
Duluth DECC Improvement, Series A | ||||||||||||||
| 1,160 | 4.500%, 02/01/2021 | 1,265,630 | ||||||||||||
| 465 | 4.500%, 02/01/2022 | 500,405 | ||||||||||||
| 1,100 | 4.625%, 02/01/2024 | 1,162,370 | ||||||||||||
Duluth Independent School District #709, Series A (AGM) (MSDCEP) | ||||||||||||||
| 1,150 | 4.250%, 02/01/2022 | 1,229,706 | ||||||||||||
Lakeville Independent School District #194 Series A, Crossover refunded 02/01/2013 @ 100 | ||||||||||||||
(FGIC) (MSDCEP) | ||||||||||||||
| 1,260 | 5.000%, 02/01/2022 | 1,335,814 | ||||||||||||
Mankato, Series A | ||||||||||||||
| 765 | 3.500%, 02/01/2018 | 832,435 | ||||||||||||
| 775 | 3.500%, 02/01/2019 | 827,413 | ||||||||||||
Minneapolis Special School District #1 (MSDCEP) | ||||||||||||||
| 1,135 | 4.000%, 02/01/2018 | 1,216,890 | ||||||||||||
Minnesota, Series C | ||||||||||||||
| 500 | 5.000%, 08/01/2019 | 603,035 | ||||||||||||
Moorhead Independent School District #152, Crossover refunded 04/01/2012 @ 100 | ||||||||||||||
(FGIC) (MSDCEP) | ||||||||||||||
| 3,450 | 5.000%, 04/01/2015 | 3,564,333 | ||||||||||||
| 2,510 | 5.000%, 04/01/2016 | 2,593,181 | ||||||||||||
Mounds View Independent School District #621, School Building, Series A (MSDCEP) | ||||||||||||||
| 625 | 3.250%, 02/01/2017 | 682,062 | ||||||||||||
| 1,000 | 4.000%, 02/01/2021 | 1,098,180 | ||||||||||||
| 750 | 4.000%, 02/01/2022 | 817,095 | ||||||||||||
Mounds View Independent School District #621, School Building, Series A, Crossover refunded 02/01/2012 @ 100 (MSDCEP) | ||||||||||||||
| 2,565 | 5.000%, 02/01/2019 | 2,646,593 | ||||||||||||
Mounds View Independent School District #621, School Building, Series A, Crossover refunded 02/01/2012 @ 100 (MSDCEP) (NATL) | ||||||||||||||
| 2,340 | 5.000%, 02/01/2018 | 2,414,435 | ||||||||||||
Osseo Independent School District #279 | ||||||||||||||
Series A (MSDCEP) | ||||||||||||||
| 1,180 | 4.000%, 02/01/2021 | 1,271,096 | ||||||||||||
Otter Tail County, Disposal System, Prairie Lakes Municipal Solid Waste Authority (AMT) (MCCEP) | ||||||||||||||
| 620 | 4.750%, 05/01/2027 (WI/DD, Settling 6/01/11) | 628,054 | ||||||||||||
Pequot Lakes Independent School District #186, Crossover refunded 02/01/2012 @ 100 | ||||||||||||||
| 500 | 5.125%, 02/01/2018 | 514,005 | ||||||||||||
| Nuveen Investments | 51 |
Portfolio of Investments
Nuveen Minnesota Intermediate Municipal Bond Fund (continued)
May 31, 2011
| Principal Amount (000) | Description p | Value | ||||||||||||
General Obligations (continued) | ||||||||||||||
Perham, Disposal System (AMT) | ||||||||||||||
| $ | 1,205 | 5.850%, 05/01/2015 | $ | 1,207,603 | ||||||||||
Puerto Rico Commonwealth, (NATL) | ||||||||||||||
| 1,605 | 6.000%, 07/01/2014 | 1,747,524 | ||||||||||||
Puerto Rico Commonwealth, Series A | ||||||||||||||
| 575 | 5.500%, 07/01/2018 | 618,217 | ||||||||||||
| 1,000 | 5.500%, 07/01/2018 | 1,075,160 | ||||||||||||
Puerto Rico Commonwealth, Series A (SGI) | ||||||||||||||
| 1,000 | 5.500%, 07/01/2017 | 1,082,210 | ||||||||||||
Puerto Rico Commonwealth, Government Development, Series B | ||||||||||||||
| 1,000 | 5.000%, 12/01/2014 | 1,062,900 | ||||||||||||
Ramsey County Capital Improvement, Series A | ||||||||||||||
| 520 | 4.000%, 02/01/2018 | 588,864 | ||||||||||||
Robbinsdale Independent School District #281, Alternative Facility, Series B (MSDCEP) | ||||||||||||||
| 500 | 4.500%, 02/01/2021 | 551,570 | ||||||||||||
Rochester Wastewater, Series A | ||||||||||||||
| 1,140 | 4.000%, 12/01/2018 | 1,267,007 | ||||||||||||
South Washington County, Independent School District #833, Series A (MSDCEP) | ||||||||||||||
| 2,000 | 4.000%, 02/01/2022 | 2,142,940 | ||||||||||||
South Washington County, Independent School District #833, Series B, Crossover refunded 02/01/2012 @ 100 (AGM) (MSDCEP) | ||||||||||||||
| 1,030 | 5.000%, 02/01/2015 | 1,055,977 | ||||||||||||
St. Cloud Library Sales Tax, Series B (AGM) | ||||||||||||||
| 1,000 | 4.000%, 02/01/2018 | 1,089,550 | ||||||||||||
St. Michael Independent School District #885, Crossover refunded 02/01/2012 @ 100 | ||||||||||||||
| 1,000 | 5.000%, 02/01/2017 | 1,026,840 | ||||||||||||
St. Peter, Series A (AGM) | ||||||||||||||
| 550 | 3.000%, 09/01/2018 | 578,232 | ||||||||||||
| 515 | 3.150%, 09/01/2019 | 540,904 | ||||||||||||
| 585 | 3.300%, 09/01/2020 | 614,104 | ||||||||||||
Wadena Deer Creek Independent School District #2155 (MSDCEP) | ||||||||||||||
| 430 | 4.000%, 02/01/2018 | 475,193 | ||||||||||||
| 410 | 4.000%, 02/01/2019 | 445,777 | ||||||||||||
Wright County Jail, Series A (MCCEP) | ||||||||||||||
| 640 | 4.500%, 12/01/2020 | 711,763 | ||||||||||||
Zumbrota-Mazeppa Independent School District #2805, Alternative Facilities, Series A | ||||||||||||||
(MSDCEP) | ||||||||||||||
| 200 | 4.000%, 02/01/2019 | 220,496 | ||||||||||||
| 51,890 | Total General Obligations | 55,807,786 | ||||||||||||
Health Care – 28.5% | ||||||||||||||
Aitkin Health Care Facilities, Riverwood Healthcare Center | ||||||||||||||
| 735 | 5.250%, 02/01/2015 | 715,390 | ||||||||||||
Bemidji Health Care Facilities, North County Health Services | ||||||||||||||
| 500 | 5.000%, 09/01/2017 | 532,450 | ||||||||||||
| 1,050 | 5.000%, 09/01/2018 | 1,109,399 | ||||||||||||
| 1,110 | 5.000%, 09/01/2019 | 1,158,984 | ||||||||||||
Cuyuna Range Hospital District | ||||||||||||||
| 425 | 5.000%, 06/01/2016 | 421,851 | ||||||||||||
| 1,340 | 5.000%, 06/01/2017 | 1,320,918 | ||||||||||||
| 1,320 | 5.000%, 06/01/2019 | 1,267,847 | ||||||||||||
Duluth Economic Development Authority, Benedictine Health System-St. Mary’s, | ||||||||||||||
(Pre-refunded 02/15/2014 @ 100) | ||||||||||||||
| 2,045 | 5.375%, 02/15/2022 | 2,298,580 | ||||||||||||
| 52 | Nuveen Investments |
| Principal Amount (000) | Description p | Value | ||||||||||||
Health Care (continued) | ||||||||||||||
Fergus Falls Health Care Facilities, Lake Region Health Care | ||||||||||||||
| $ | 400 | 4.750%, 08/01/2025 | $ | 397,528 | ||||||||||
Glencoe Health Care Facilities, Regional Health Services Project | ||||||||||||||
| 760 | 5.000%, 04/01/2013 | 792,072 | ||||||||||||
| 800 | 5.000%, 04/01/2014 | 837,856 | ||||||||||||
| 845 | 5.000%, 04/01/2015 | 881,969 | ||||||||||||
| 1,815 | 5.000%, 04/01/2017 | 1,869,740 | ||||||||||||
Maple Grove Health Care Facilities, North Memorial Health Care | ||||||||||||||
| 1,730 | 4.500%, 09/01/2017 | 1,812,313 | ||||||||||||
Maple Grove Health Care System, Maple Grove Hospital | ||||||||||||||
| 1,000 | 5.000%, 05/01/2017 | 1,091,230 | ||||||||||||
Marshall Medical Center, Avera Marshall Regional Medical Center Project, | ||||||||||||||
| 345 | 4.500%, 11/01/2013 (ETM) | 372,966 | ||||||||||||
Marshall Medical Center, Avera Marshall Regional Medical Center Project, | ||||||||||||||
| 1,155 | 4.750%, 11/01/2020 | 1,308,372 | ||||||||||||
Meeker County Hospital Facilities, Memorial Hospital Project | ||||||||||||||
| 1,000 | 5.625%, 11/01/2022 | 1,001,810 | ||||||||||||
Minneapolis & St. Paul Housing & Redevelopment Authority, Minnesota Children’s Hospitals & Clinics | ||||||||||||||
Series A | ||||||||||||||
| 1,000 | 5.250%, 08/15/2025 | 1,070,580 | ||||||||||||
Minneapolis Health Care System, Allina Health System, Series A, (Pre-refunded 11/15/2012 @ 100) | ||||||||||||||
| 2,500 | 6.000%, 11/15/2023 | 2,707,575 | ||||||||||||
| 1,300 | 5.750%, 11/15/2032 | 1,403,220 | ||||||||||||
Minneapolis Health Care System, Fairview Health Services, | ||||||||||||||
Series A | ||||||||||||||
| 4,000 | 6.375%, 11/15/2023 | 4,474,760 | ||||||||||||
Minneapolis Health Care System, Fairview Health Services, Series A | ||||||||||||||
| 605 | 5.000%, 05/15/2012 (ETM) | 632,830 | ||||||||||||
Minneapolis National Marrow Donor Program | ||||||||||||||
| 3,000 | 4.250%, 08/01/2020 | 2,977,380 | ||||||||||||
Minnesota Agricultural & Economic Development Board, Essentia Health Obligated Group | ||||||||||||||
Series C-1 (AGC) | ||||||||||||||
| 1,000 | 5.500%, 02/15/2025 | 1,079,070 | ||||||||||||
Minnesota Agricultural & Economic Development Board, Evangelical Lutheran Project | ||||||||||||||
| 200 | 5.500%, 02/01/2012 | 205,204 | ||||||||||||
| 730 | 5.500%, 02/01/2015 | 750,141 | ||||||||||||
Minnesota Agricultural & Economic Development Board, Health Care System | ||||||||||||||
Series A (NATL) | ||||||||||||||
| 305 | 5.500%, 11/15/2017 | 305,985 | ||||||||||||
| 10 | 5.750%, 11/15/2026 | 10,004 | ||||||||||||
Monticello-Big Lake Community Hospital District, Health Care Facilities, Series C | ||||||||||||||
| 2,320 | 5.750%, 12/01/2015 | 2,297,867 | ||||||||||||
Northfield Hospital | ||||||||||||||
| 515 | 5.000%, 11/01/2013 | 540,214 | ||||||||||||
| 920 | 5.000%, 11/01/2014 | 973,875 | ||||||||||||
| 1,080 | 5.500%, 11/01/2017 | 1,164,694 | ||||||||||||
Redwood Falls Hospital Facilities, Redwood Area Hospital Project | ||||||||||||||
| 1,015 | 5.000%, 12/01/2021 | 998,730 | ||||||||||||
Rochester Health Care Facilities, Mayo Clinic, Series C | ||||||||||||||
| 1,140 | 4.500%, 11/15/2038 | 1,222,867 | ||||||||||||
Rochester Health Care Facilities, Olmsted Medical Center Project | ||||||||||||||
| 1,000 | 5.125%, 07/01/2020 | 1,035,950 | ||||||||||||
Shakopee Health Care Facilities, St. Francis Regional Medical Center | ||||||||||||||
| 1,785 | 5.000%, 09/01/2017 | 1,881,640 | ||||||||||||
| Nuveen Investments | 53 |
Portfolio of Investments
Nuveen Minnesota Intermediate Municipal Bond Fund (continued)
May 31, 2011
| Principal Amount (000) | Description p | Value | ||||||||||||
Health Care (continued) | ||||||||||||||
St. Cloud Health Care, CentraCare Health System Project (AGC) | ||||||||||||||
| $ | 1,000 | 5.375%, 05/01/2031 | $ | 1,034,460 | ||||||||||
St. Cloud Health Care, CentraCare Health System Project, Series A | ||||||||||||||
| 1,000 | 4.250%, 05/01/2021 | 1,025,130 | ||||||||||||
St. Louis Park Health Care Facilities, Park Nicollet Health Services | ||||||||||||||
| 1,300 | 5.500%, 07/01/2029 | 1,283,815 | ||||||||||||
St. Louis Park Health Care Facilities, Park Nicollet Health Services, Series C | ||||||||||||||
| 2,500 | 5.625%, 07/01/2026 | 2,520,925 | ||||||||||||
St. Paul Housing & Redevelopment Authority, Allina Health System, Series A, (NATL) | ||||||||||||||
| 500 | 5.000%, 11/15/2015 | 560,980 | ||||||||||||
| 1,200 | 5.000%, 11/15/2019 | 1,316,628 | ||||||||||||
St. Paul Housing & Redevelopment Authority, Allina Health System, Series A-1 | ||||||||||||||
| 3,000 | 5.000%, 11/15/2024 | 3,110,010 | ||||||||||||
St. Paul Housing & Redevelopment Authority, Gillette Children’s Specialty Healthcare | ||||||||||||||
| 1,560 | 5.000%, 02/01/2019 | 1,610,123 | ||||||||||||
| 1,000 | 5.000%, 02/01/2019 | 1,073,400 | ||||||||||||
| 500 | 5.000%, 02/01/2020 | 513,545 | ||||||||||||
St. Paul Housing & Redevelopment Authority, HealthEast Project | ||||||||||||||
| 1,840 | 5.150%, 11/15/2020 | 1,700,786 | ||||||||||||
St. Paul Housing & Redevelopment Authority, HealthPartners Obligated Group Project | ||||||||||||||
| 1,350 | 5.250%, 05/15/2019 | 1,416,771 | ||||||||||||
St. Paul Port Authority, HealthEast Midway Campus, Series A | ||||||||||||||
| 1,230 | 5.250%, 05/01/2015 | 1,210,750 | ||||||||||||
| 2,000 | 5.750%, 05/01/2025 | 1,846,640 | ||||||||||||
Todd, Morrison, Cass & Wadena Counties, United Hospital District, Lakewood Health System | ||||||||||||||
| 400 | 4.000%, 12/01/2013 | 428,968 | ||||||||||||
Winona Health Care Facilities, Winona Health Obligated Group | ||||||||||||||
| 1,000 | 5.000%, 07/01/2020 | 1,015,940 | ||||||||||||
Winona Health Care Facilities, Winona Health Obligated Group, Series A | ||||||||||||||
| 525 | 5.300%, 07/01/2017 | 543,286 | ||||||||||||
| 64,705 | Total Health Care | 67,136,018 | ||||||||||||
Housing – 1.9% | ||||||||||||||
Anoka Housing & Redevelopment Authority, Woodland Park Project, Series A (FHLMC) | ||||||||||||||
| 500 | 5.000%, 04/01/2027 | 506,760 | ||||||||||||
Minnesota State Housing Finance Agency, Nonprofit Housing | ||||||||||||||
| 1,185 | 5.250%, 08/01/2027 | 1,250,850 | ||||||||||||
Moorhead Senior Housing, Sheyenne Crossing Project | ||||||||||||||
| 2,000 | 5.600%, 04/01/2025 | 1,865,520 | ||||||||||||
Worthington Housing Authority, Meadows Worthington Project, Series A | ||||||||||||||
| 885 | 5.000%, 11/01/2017 | 840,653 | ||||||||||||
| 4,570 | Total Housing | 4,463,783 | ||||||||||||
Lease Revenue – 2.7% | ||||||||||||||
Andover Economic Development Authority Public Facilities, Community Center | ||||||||||||||
Crossover refunded 02/01/2014 @ 100 | ||||||||||||||
| 495 | 5.000%, 02/01/2019 | 535,793 | ||||||||||||
| 730 | 5.000%, 02/01/2019 | 790,160 | ||||||||||||
Pine County Housing & Redevelopment Authority, Public Project, Series A | ||||||||||||||
| 465 | 4.500%, 02/01/2016 | 503,362 | ||||||||||||
| 385 | 4.500%, 02/01/2017 | 411,346 | ||||||||||||
St. Paul Housing & Redevelopment Authority, Jimmy Lee Recreation Center | ||||||||||||||
| 180 | 4.500%, 12/01/2019 | 194,722 | ||||||||||||
| 290 | 4.500%, 12/01/2020 | 310,648 | ||||||||||||
St. Paul Port Authority, Office Building | ||||||||||||||
| 2,415 | 5.000%, 12/01/2019 | 2,527,225 | ||||||||||||
| 54 | Nuveen Investments |
| Principal Amount (000) | Description p | Value | ||||||||||||
Lease Revenue (continued) | ||||||||||||||
Stevens County Housing & Redevelopment Authority, Public Project, Series A | ||||||||||||||
| $ | 315 | 4.000%, 02/01/2018 | $ | 336,883 | ||||||||||
| 325 | 4.000%, 02/01/2019 | 343,652 | ||||||||||||
| 340 | 4.100%, 02/01/2020 | 358,506 | ||||||||||||
| 5,940 | Total Lease Revenue | 6,312,297 | ||||||||||||
Miscellaneous – 4.6% | ||||||||||||||
Itasca County, Charles K. Blandin Foundation | ||||||||||||||
| 635 | 4.000%, 05/01/2018 | 652,253 | ||||||||||||
| 255 | 4.000%, 05/01/2019 | 259,623 | ||||||||||||
Seaway Port Authority of Duluth, Cargill Incorporated Project | ||||||||||||||
| 2,000 | 4.200%, 05/01/2013 | 2,065,100 | ||||||||||||
St. Paul Housing & Redevelopment Authority, Minnesota Public Radio Project (APM) | ||||||||||||||
| 2,395 | 5.000%, 12/01/2025 | 2,520,809 | ||||||||||||
St. Paul Housing & Redevelopment Authority, Parking Facilities Project, Series A | ||||||||||||||
| 805 | 4.000%, 08/01/2021 | 824,666 | ||||||||||||
| 895 | 4.125%, 08/01/2023 | 900,603 | ||||||||||||
| 935 | 4.250%, 08/01/2024 | 940,891 | ||||||||||||
| 575 | 4.250%, 08/01/2025 | 571,038 | ||||||||||||
St. Paul Port Authority, Amherst H. Wilder Foundation, Series 3 | ||||||||||||||
| 2,000 | 5.000%, 12/01/2024 | 2,116,400 | ||||||||||||
| 10,495 | Total Miscellaneous | 10,851,383 | ||||||||||||
Tax Revenue – 1.7% | ||||||||||||||
Hennepin County Sales Tax, Ballpark Project, Series B | ||||||||||||||
| 555 | 4.375%, 12/15/2022 | 594,821 | ||||||||||||
| 1,000 | 5.000%, 12/15/2029 | 1,059,680 | ||||||||||||
Minneapolis St. Anthony Falls Project | ||||||||||||||
| 1,040 | 5.000%, 02/01/2017 | 1,016,870 | ||||||||||||
| 570 | 5.300%, 02/01/2021 | 525,267 | ||||||||||||
Minneapolis Tax Increment, Grant Park Project | ||||||||||||||
| 1,000 | 5.200%, 02/01/2022 | 907,300 | ||||||||||||
| 4,165 | Total Tax Revenue | 4,103,938 | ||||||||||||
Transportation – 4.0% | ||||||||||||||
Minneapolis & St. Paul Metropolitan Airports Commission, Series A | ||||||||||||||
| 1,000 | 4.000%, 01/01/2019 | 1,061,430 | ||||||||||||
| 1,000 | 5.000%, 01/01/2020 | 1,122,830 | ||||||||||||
| 500 | 5.000%, 01/01/2021 | 554,300 | ||||||||||||
Minneapolis & St. Paul Metropolitan Airports Commission, Series A (NATL) | ||||||||||||||
| 1,000 | 5.000%, 01/01/2019 | 1,037,920 | ||||||||||||
| 2,200 | 5.000%, 01/01/2020 | 2,243,692 | ||||||||||||
Minneapolis & St. Paul Metropolitan Airports Commission, Series B (AMBAC) (AMT) | ||||||||||||||
| 2,125 | 5.000%, 01/01/2020 | 2,186,986 | ||||||||||||
Puerto Rico Commonwealth, Highway & Transportation Authority, Series X (IBC) (NATL) | ||||||||||||||
| 1,250 | 5.500%, 07/01/2013 | 1,289,125 | ||||||||||||
| 9,075 | Total Transportation | 9,496,283 | ||||||||||||
Utilities – 9.7% | ||||||||||||||
Chaska Electric, Series A | ||||||||||||||
| 1,000 | 4.200%, 10/01/2015 | 1,088,130 | ||||||||||||
Cohasset Pollution Control, Allete Project (IBCC) (RAAI) | ||||||||||||||
| 2,230 | 4.950%, 07/01/2022 | 2,261,332 | ||||||||||||
Litchfield Electric Utilities, Series C (AGC) | ||||||||||||||
| 500 | 5.000%, 02/01/2029 | 521,250 | ||||||||||||
| Nuveen Investments | 55 |
Portfolio of Investments
Nuveen Minnesota Intermediate Municipal Bond Fund (continued)
May 31, 2011
| Principal Amount (000) | Description p | Value | ||||||||||||
Utilities (continued) | ||||||||||||||
Marshall Public Utilities, Series A (AGC) | ||||||||||||||
| $ | 315 | 3.500%, 07/01/2016 | $ | 338,278 | ||||||||||
| 275 | 3.500%, 07/01/2017 | 293,953 | ||||||||||||
| 340 | 3.750%, 07/01/2018 | 364,368 | ||||||||||||
Minnesota State Municipal Power Agency | ||||||||||||||
| 420 | 4.125%, 10/01/2017 | 454,360 | ||||||||||||
| 1,000 | 5.250%, 10/01/2022 | 1,088,930 | ||||||||||||
Northern Municipal Power Agency, Series A1 | ||||||||||||||
| 2,830 | 5.000%, 01/01/2020 | 3,167,902 | ||||||||||||
Northern Municipal Power Agency, Minnesota Electric Systems, Series A (AGC) | ||||||||||||||
| 1,000 | 5.000%, 01/01/2019 | 1,124,690 | ||||||||||||
| 2,000 | 5.000%, 01/01/2021 | 2,196,560 | ||||||||||||
Northern Municipal Power Agency, Minnesota Electric Systems, Series A (AMBAC) | ||||||||||||||
| 380 | 5.000%, 01/01/2013 | 403,724 | ||||||||||||
| 460 | 5.000%, 01/01/2017 | 524,331 | ||||||||||||
Puerto Rico Commonwealth, Aqueduct & Sewer Authority, Series A (AGC) | ||||||||||||||
| 500 | 5.000%, 07/01/2016 | 561,600 | ||||||||||||
Shakopee Public Utilities, Series A (AGM) | ||||||||||||||
| 295 | 4.250%, 02/01/2018 | 314,337 | ||||||||||||
Southern Minnesota Municipal Power Agency, Series A (AMBAC) | ||||||||||||||
| 2,000 | 5.250%, 01/01/2014 | 2,207,840 | ||||||||||||
Southern Minnesota Municipal Power Agency, Series A (NATL) | ||||||||||||||
| 3,500 | 0.000%, 01/01/2020 | 2,495,535 | ||||||||||||
| 5,000 | 0.000%, 01/01/2021 | 3,366,650 | ||||||||||||
| 24,045 | Total Utilities | 22,773,770 | ||||||||||||
| 223,245 | Total Municipal Bonds (cost $221,747,817) | 232,108,677 | ||||||||||||
| Shares | Description p | Value | ||||||||||||
SHORT-TERM INVESTMENTS – 1.0% | ||||||||||||||
Money Market Funds – 1.0% | ||||||||||||||
| 2,203,121 | Federated Minnesota Municipal Cash Trust, 0.010% | $ | 2,203,121 | |||||||||||
Total Short-Term Investments (cost $2,203,121) | 2,203,121 | |||||||||||||
Total Investments – 99.5% (cost $223,950,938) | 234,311,798 | |||||||||||||
Other Assets Less Liabilities – 0.5% | 1,243,836 | |||||||||||||
Net Assets – 100.0% | $ | 235,555,634 | ||||||||||||
| p | All percentages shown in the Portfolio of Investments are based on net assets. |
| The rate shown is the annualized seven-day effective yield as of May 31, 2011. |
| (ETM) | Escrowed to maturity. |
| (WI/DD) | Investment, or portion of investment, Purchased on a when-issued or delayed delivery basis. |
See accompanying notes to financial statements.
| 56 | Nuveen Investments |
Portfolio of Investments
Nuveen Minnesota Municipal Bond Fund
(formerly known as First American Minnesota Tax Free Fund)
May 31, 2011
| Principal Amount (000) | Description p | Value | ||||||||||||
MUNICIPAL BONDS – 99.7% | ||||||||||||||
Certificate of Participation – 1.4% | ||||||||||||||
Duluth Independent School District #709, Series B (MSDCEP) | ||||||||||||||
| $ | 2,000 | 4.000%, 02/01/2019 | $ | 2,225,641 | ||||||||||
Continuing Care Retirement Communities – 0.8% | ||||||||||||||
Golden Valley Covenant Retirement Communities, Series A | ||||||||||||||
| 1,450 | 5.500%, 12/01/2029 | 1,330,245 | ||||||||||||
Economic Development – 1.5% | ||||||||||||||
Minnesota Agricultural & Economic Development Board, Minnesota Small Business Program, | ||||||||||||||
| 500 | 5.550%, 08/01/2016 | 494,095 | ||||||||||||
Moorhead, American Crystal Sugar Recovery Zone Facility | ||||||||||||||
| 1,800 | 5.650%, 06/01/2027 | 1,808,820 | ||||||||||||
| 2,300 | Total Economic Development | 2,302,915 | ||||||||||||
Education – 10.6% | ||||||||||||||
Baytown Lease, St. Croix Preparatory Academy, Series A | ||||||||||||||
| 1,500 | 7.000%, 08/01/2038 | 1,400,220 | ||||||||||||
Duluth Housing & Redevelopment Authority, Public Schools Academy, Series A | ||||||||||||||
| 1,750 | 5.600%, 11/01/2030 | 1,527,068 | ||||||||||||
Minnesota Higher Education Facilities Authority, Bethel University, Series 6-R | ||||||||||||||
| 1,725 | 5.500%, 05/01/2026 | 1,647,202 | ||||||||||||
| 820 | 5.500%, 05/01/2027 | 777,483 | ||||||||||||
Minnesota Higher Education Facilities Authority, College of Art & Design, Series 6-K | ||||||||||||||
| 30 | 5.000%, 05/01/2026 | 30,158 | ||||||||||||
Minnesota Higher Education Facilities Authority, Gustavus Adolfus College, Series 7-B | ||||||||||||||
| 1,000 | 5.000%, 10/01/2031 | 1,015,940 | ||||||||||||
Minnesota Higher Education Facilities Authority, Hamline University, Series K-2 | ||||||||||||||
| 625 | 6.000%, 10/01/2032 | 655,356 | ||||||||||||
| 2,000 | 6.000%, 10/01/2040 | 2,046,180 | ||||||||||||
Minnesota Higher Education Facilities Authority, St. Scholastica College, Series 7-J | ||||||||||||||
| 1,835 | 6.300%, 12/01/2040 | 1,908,859 | ||||||||||||
Minnesota Higher Education Facilities Authority, Vermilion Community College Project, Series 3-T | ||||||||||||||
| 155 | 6.000%, 01/01/2013 | 155,313 | ||||||||||||
St. Paul Housing & Redevelopment Authority, Community Peace Academy Project, Series A | ||||||||||||||
| 2,550 | 5.000%, 12/01/2036 | 1,903,906 | ||||||||||||
St. Paul Housing & Redevelopment Authority, St. Paul Academy & Summit School Project | ||||||||||||||
| 2,000 | 5.000%, 10/01/2024 | 2,106,240 | ||||||||||||
University of Minnesota, Series A | ||||||||||||||
| 1,540 | 5.250%, 12/01/2029 | 1,718,625 | ||||||||||||
| 17,530 | Total Education | 16,892,550 | ||||||||||||
General Obligations – 12.0% | ||||||||||||||
Bemidji | ||||||||||||||
| 10,000 | 6.000%, 02/01/2041 | 11,447,300 | ||||||||||||
Burnsville Independent School District #191, Alternative Facilities, Series A (MSDCEP) | ||||||||||||||
| 1,430 | 4.500%, 02/01/2022 | 1,554,982 | ||||||||||||
Hopkins Independent School District #270, Series A (MSDCEP) | ||||||||||||||
| 1,000 | 5.000%, 02/01/2028 | 1,097,550 | ||||||||||||
Perham, Disposal System (AMT) | ||||||||||||||
| 1,500 | 6.000%, 05/01/2022 | 1,503,330 | ||||||||||||
St. Paul Independent School District #625, Series A (MSDCEP) | ||||||||||||||
| 1,795 | 4.000%, 02/01/2031 (WI/DD, Settling 6/15/11) | 1,757,790 | ||||||||||||
| 1,880 | 4.000%, 02/01/2032 (WI/DD, Settling 6/15/11) | 1,806,923 | ||||||||||||
| 17,605 | Total General Obligations | 19,167,875 | ||||||||||||
| Nuveen Investments | 57 |
Portfolio of Investments
Nuveen Minnesota Municipal Bond Fund (continued)
May 31, 2011
| Principal Amount (000) | Description p | Value | ||||||||||||
Health Care – 31.0% | ||||||||||||||
Anoka County Housing & Redevelopment Authority, Park River Estates Care Center, Series D | ||||||||||||||
| $ | 1,500 | 6.750%, 11/01/2036 | $ | 1,439,340 | ||||||||||
Chippewa County, Montevideo Hospital Project | ||||||||||||||
| 2,370 | 5.500%, 03/01/2037 | 2,203,650 | ||||||||||||
Duluth Economic Development Authority, Benedictine Health System-St.Mary’s, (Pre-refunded 02/15/2014) | ||||||||||||||
| 1,065 | 5.250%, 02/15/2028 | 1,193,503 | ||||||||||||
Glencoe Health Care Facilities, Regional Health Services Project | ||||||||||||||
| 2,000 | 5.000%, 04/01/2031 | 1,828,140 | ||||||||||||
Hawaii Pacific Health, Series B | ||||||||||||||
| 2,500 | 5.750%, 07/01/2040 | 2,323,800 | ||||||||||||
Maple Grove Health Care System, Maple Grove Hospital | ||||||||||||||
| 1,500 | 4.500%, 05/01/2023 | 1,463,985 | ||||||||||||
| 1,000 | 5.250%, 05/01/2025 | 1,004,140 | ||||||||||||
Marshall Medical Center, Weiner Memorial Medical Center Project, Series A, (Pre-refunded 11/01/2013 @ 100) | ||||||||||||||
| 305 | 5.250%, 11/01/2016 | 335,161 | ||||||||||||
| 875 | 5.850%, 11/01/2023 | 974,024 | ||||||||||||
Minneapolis & St. Paul Housing & Redevelopment Authority, Minnesota Children’s Hospitals & Clinics, Series A | ||||||||||||||
| 2,275 | 5.250%, 08/15/2035 | 2,307,988 | ||||||||||||
Minneapolis Health Care System, Fairview Health Services, Series A | ||||||||||||||
| 3,000 | 6.625%, 11/15/2028 | 3,272,940 | ||||||||||||
Minneapolis National Marrow Donor Program | ||||||||||||||
| 2,000 | 4.875%, 08/01/2025 | 1,936,240 | ||||||||||||
Minnesota Agricultural & Economic Development Board, Essentia Health Obligated Group, Series C-1 (AGC) | ||||||||||||||
| 1,000 | 5.000%, 02/15/2030 | 1,003,780 | ||||||||||||
Minnesota Agricultural & Economic Development Board, Health Care System, Fairview Health Services, Series A | ||||||||||||||
| 125 | 6.375%, 11/15/2029 | 125,471 | ||||||||||||
Monticello-Big Lake Community Hospital District, Health Care Facilities, Series C | ||||||||||||||
| 1,000 | 6.200%, 12/01/2022 | 965,780 | ||||||||||||
New Hope Housing & Health Care Facilities, Masonic Home North Ridge | ||||||||||||||
| 1,600 | 5.750%, 03/01/2015 | 1,552,960 | ||||||||||||
Rochester Health Care & Housing, Samaritan Bethany, Series A | ||||||||||||||
| 1,100 | 7.375%, 12/01/2041 | 1,112,782 | ||||||||||||
Rochester Health Care Facilities, Olmsted Medical Center Project | ||||||||||||||
| 1,700 | 5.875%, 07/01/2030 | 1,672,154 | ||||||||||||
Shakopee Health Care Facilities, St. Francis Regional Medical Center | ||||||||||||||
| 2,000 | 5.250%, 09/01/2034 | 1,904,440 | ||||||||||||
St. Cloud Health Care, CentraCare Health System Project, Series A | ||||||||||||||
| 1,000 | 5.125%, 05/01/2030 | 1,007,430 | ||||||||||||
St. Louis Park Health Care Facilities, Park Nicollet Health Services | ||||||||||||||
| 2,000 | 5.750%, 07/01/2039 | 1,950,940 | ||||||||||||
St. Louis Park Health Care Facilities, Park Nicollet Health Services, Series B, (Pre-refunded 07/01/2014) | ||||||||||||||
| 2,000 | 5.500%, 07/01/2025 | 2,276,180 | ||||||||||||
St. Louis Park Health Care Facilities, Park Nicollet Health Services, Series C | ||||||||||||||
| 1,000 | 5.750%, 07/01/2030 | 1,005,720 | ||||||||||||
St. Paul Housing & Redevelopment Authority, Allina Health System, Series A-1 | ||||||||||||||
| 3,050 | 5.250%, 11/15/2029 | 3,125,213 | ||||||||||||
St. Paul Housing & Redevelopment Authority, Episcopal Nursing Home | ||||||||||||||
| 2,190 | 5.630%, 10/01/2033 | 1,894,026 | ||||||||||||
St. Paul Housing & Redevelopment Authority, Gillette Children’s Specialty Healthcare | ||||||||||||||
| 2,060 | 5.000%, 02/01/2029 | 2,010,292 | ||||||||||||
| 58 | Nuveen Investments |
| Principal Amount (000) | Description p | Value | ||||||||||||
Health Care (continued) | ||||||||||||||
St. Paul Housing & Redevelopment Authority, Health Partners Obligated Group Project | ||||||||||||||
| $ | 2,000 | 5.250%, 05/15/2026 | $ | 1,947,420 | ||||||||||
| 2,000 | 5.250%, 05/15/2036 | 1,826,360 | ||||||||||||
St. Paul Housing & Redevelopment Authority, HealthEast Project | ||||||||||||||
| 800 | 6.000%, 11/15/2030 | 719,560 | ||||||||||||
St. Paul Housing & Redevelopment Authority, Regions Hospital Project | ||||||||||||||
| 500 | 5.250%, 05/15/2018 | 500,520 | ||||||||||||
St. Paul Port Authority, HealthEast Midway Campus, Series A | ||||||||||||||
| 900 | 5.875%, 05/01/2030 | 804,168 | ||||||||||||
St. Paul Port Authority, HealthEast Midway Campus, Series B | ||||||||||||||
| 1,800 | 6.000%, 05/01/2030 | 1,631,916 | ||||||||||||
| 50,215 | Total Health Care | 49,320,023 | ||||||||||||
Housing – 8.3% | ||||||||||||||
Cottage Grove Senior Housing, PHS/Cottage Grove Inc. Project, Series A | ||||||||||||||
| 850 | 5.000%, 12/01/2031 | 711,764 | ||||||||||||
Dakota County Community Development Agency, Multifamily Housing, Ebenezer Ridges Project (GNMA) | ||||||||||||||
| 1,980 | 5.900%, 04/20/2042 | 2,007,740 | ||||||||||||
Maplewood Multifamily Housing, Carefree Cottages ll, Mandatory Put 04/15/2019 @ 100 (AMT) (FNMA) | ||||||||||||||
| 2,000 | 4.800%, 04/15/2034 | 2,026,660 | ||||||||||||
Minneapolis & St. Paul Housing Financing Board, Single Family Mortgage, Series A4 (AMT) (FHLMC) (FNMA) (GNMA) | ||||||||||||||
| 596 | 5.000%, 11/01/2038 | 592,548 | ||||||||||||
Minneapolis Housing, Keeler Apartments Project, Series A | ||||||||||||||
| 1,350 | 5.000%, 10/01/2037 | 1,093,257 | ||||||||||||
Minneapolis Multifamily Housing, Vantage Flats Project (AMT) (GNMA) | ||||||||||||||
| 865 | 5.200%, 10/20/2048 | 824,103 | ||||||||||||
Minnesota Housing Finance Agency, Residential Housing | ||||||||||||||
Series B (AMT) | ||||||||||||||
| 395 | 5.650%, 07/01/2033 | 395,079 | ||||||||||||
Minnesota Housing Finance Agency, Residential Housing, Series D (AMT) | ||||||||||||||
| 3,465 | 4.700%, 07/01/2027 | 3,306,684 | ||||||||||||
Moorhead Senior Housing, Sheyenne Crossing Project | ||||||||||||||
| 1,620 | 5.650%, 04/01/2041 | 1,327,865 | ||||||||||||
St. Paul Housing & Redevelopment Authority, Rossy & Richard Shaller, Series A | ||||||||||||||
| 1,100 | 5.250%, 10/01/2042 | 854,469 | ||||||||||||
| 14,221 | Total Housing | 13,140,169 | ||||||||||||
Lease Revenue – 3.2% | ||||||||||||||
Lakeville Housing & Redevelopment Authority, Ice Arena Project | ||||||||||||||
| 585 | 4.625%, 02/01/2032 | 585,140 | ||||||||||||
Pine County Housing & Redevelopment Authority, Public Project, Series A | ||||||||||||||
| 1,000 | 5.000%, 02/01/2028 | 1,001,990 | ||||||||||||
| 1,890 | 5.000%, 02/01/2031 | 1,850,499 | ||||||||||||
St. Paul Housing & Redevelopment Authority, Jimmy Lee Recreation Center | ||||||||||||||
| 500 | 4.750%, 12/01/2026 | 514,500 | ||||||||||||
St. Paul Port Authority, Regions Hospital Parking Ramp Project, Series 1 | ||||||||||||||
| 1,375 | 5.000%, 08/01/2036 | 1,186,323 | ||||||||||||
| 5,350 | Total Lease Revenue | 5,138,452 | ||||||||||||
Miscellaneous – 2.6% | ||||||||||||||
Little Canada Commercial Development, RLF Minnesota Project | ||||||||||||||
| 340 | 5.000%, 04/01/2013 | 341,765 | ||||||||||||
Seaway Port Authority of Duluth, Cargill Incorporated Project | ||||||||||||||
| 1,130 | 4.200%, 05/01/2013 | 1,166,781 | ||||||||||||
| Nuveen Investments | 59 |
Portfolio of Investments
Nuveen Minnesota Municipal Bond Fund (continued)
May 31, 2011
| Principal Amount (000) | Description p | Value | ||||||||||||
Miscellaneous (continued) | ||||||||||||||
St. Paul Housing & Redevelopment Authority, Parking Facilities Project, Series A | ||||||||||||||
| $ | 1,070 | 5.000%, 08/01/2030 | $ | 1,088,425 | ||||||||||
| 1,500 | 5.000%, 08/01/2035 | 1,463,925 | ||||||||||||
| 4,040 | Total Miscellaneous | 4,060,896 | ||||||||||||
Recreational Facility Authority – 1.2% | ||||||||||||||
Moorhead Golf Course, Series B | ||||||||||||||
| 1,885 | 5.875%, 12/01/2021 | 1,828,356 | ||||||||||||
Tax Revenue – 0.2% | ||||||||||||||
Minneapolis St. Anthony Falls Project | ||||||||||||||
| 400 | 5.650%, 02/01/2027 | 352,528 | ||||||||||||
Transportation – 9.1% | ||||||||||||||
Minneapolis & St. Paul Metropolitan Airports Commission Series A (AMBAC) | ||||||||||||||
| 3,250 | 5.000%, 01/01/2019 | 3,580,915 | ||||||||||||
| 5,000 | 5.000%, 01/01/2020 | 5,482,150 | ||||||||||||
Minneapolis & St. Paul Metropolitan Airports Commission, Series B (AMT) | ||||||||||||||
| 4,000 | 5.000%, 01/01/2020 | 4,356,160 | ||||||||||||
Mozaic Parking Project, Series A | ||||||||||||||
| 1,000 | 8.500%, 01/01/2041 | 1,018,200 | ||||||||||||
| 13,250 | Total Transportation | 14,437,425 | ||||||||||||
Utilities – 17.8% | ||||||||||||||
Chaska Electric, Series A | ||||||||||||||
| 45 | 6.100%, 10/01/2030 | 45,048 | ||||||||||||
Minnesota Municipal Power Agency, Series A | ||||||||||||||
| 5,000 | 5.000%, 10/01/2030 | 5,087,350 | ||||||||||||
Northern Municipal Power Agency, Minnesota Electric Systems, Series A (AMBAC) | ||||||||||||||
| 2,000 | 5.000%, 01/01/2026 | 2,070,760 | ||||||||||||
Puerto Rico Commonwealth, Aqueduct & Sewer Authority, Series A | ||||||||||||||
| 1,500 | 6.000%, 07/01/2038 | 1,504,620 | ||||||||||||
Puerto Rico Electric Power Authority, Series SS (NATL) | ||||||||||||||
| 2,000 | 5.000%, 07/01/2024 | 2,002,100 | ||||||||||||
Southern Minnesota Municipal Power Agency, Series A (NATL) | ||||||||||||||
| 2,000 | 0.000%, 01/01/2019 | 1,506,700 | ||||||||||||
| 1,765 | 0.000%, 01/01/2021 | 1,188,428 | ||||||||||||
| 3,000 | 0.000%, 01/01/2023 | 1,781,550 | ||||||||||||
| 11,000 | 0.000%, 01/01/2024 | 6,123,260 | ||||||||||||
| 4,770 | 0.000%, 01/01/2025 | 2,487,840 | ||||||||||||
| 6,100 | 0.000%, 01/01/2026 | 2,972,835 | ||||||||||||
| 2,300 | 0.000%, 01/01/2027 | 1,052,503 | ||||||||||||
Western Minnesota Municipal Power Agency (NATL) | ||||||||||||||
| 410 | 9.750%, 01/01/2016 (ETM) | 539,080 | ||||||||||||
| 41,890 | Total Utilities | 28,362,074 | ||||||||||||
| 172,136 | Total Municipal Bonds (cost $155,926,740) | 158,559,149 | ||||||||||||
| Shares | Description p | Value | ||||||||||||
SHORT-TERM INVESTMENTS – 1.6% | ||||||||||||||
Money Market Funds – 1.6% | ||||||||||||||
| 2,660,415 | Federated Minnesota Municipal Cash Trust, 0.010% | $ | 2,660,415 | |||||||||||
Total Short-Term Investments (cost $2,660,415) | 2,660,415 | |||||||||||||
Total Investments – 101.3% (cost $158,587,155) | 161,219,564 | |||||||||||||
Other Assets Less Liabilities – (1.3)% | (2,113,031) | |||||||||||||
Net Assets – 100.0% | $ | 159,106,533 | ||||||||||||
| p | All percentages shown in the Portfolio of Investments are based on net assets. |
| | The rate shown is the annualized seven-day effective yield as of May 31, 2011. |
| (ETM) | Escrowed to maturity. |
| (WI/DD) | Investment, or portion of investment, purchased on a when-issued or delayed delivery basis. |
See accompanying notes to financial statements.
| 60 | Nuveen Investments |
Portfolio of Investments
Nuveen Missouri Tax Free Fund
(formerly known as First American Missouri Tax Free Fund)
May 31, 2011
| Principal Amount (000) | Description p | Value | ||||||||||||
MUNICIPAL BONDS – 98.8% | ||||||||||||||
Certificates of Participation – 7.8% | ||||||||||||||
Belton Refunding & Improvement | ||||||||||||||
| $ | 355 | 5.250%, 03/01/2029 | $ | 360,613 | ||||||||||
Belton Refunding & Improvement (NATL) | ||||||||||||||
| 600 | 4.375%, 03/01/2019 | 616,920 | ||||||||||||
| 250 | 4.500%, 03/01/2022 | 250,612 | ||||||||||||
Cass County | ||||||||||||||
| 1,975 | 4.000%, 05/01/2022 | 1,955,132 | ||||||||||||
Cottleville | ||||||||||||||
| 200 | 5.125%, 08/01/2026 | 187,446 | ||||||||||||
| 1,700 | 5.250%, 08/01/2031 | 1,526,209 | ||||||||||||
Hazelwood School District, Energy Improvements Project | ||||||||||||||
| 515 | 4.500%, 03/01/2017 | 559,450 | ||||||||||||
| 445 | 4.500%, 03/01/2018 | 477,302 | ||||||||||||
Kansas City Metropolitan Junior College District | ||||||||||||||
| 1,025 | 4.500%, 07/01/2021 | 1,103,976 | ||||||||||||
Lincoln County Public Water Supply, District #1 | ||||||||||||||
| 1,500 | 6.750%, 06/15/2035 | 1,548,900 | ||||||||||||
Missouri School Boards Association, Liberty Public School District #53 (AGM) | ||||||||||||||
| 1,015 | 5.250%, 03/01/2025 | 1,086,689 | ||||||||||||
Taney County Public Water Supply, District #3 | ||||||||||||||
| 590 | 4.500%, 07/01/2025 | 592,472 | ||||||||||||
Texas County Justice Center Project (AGC) | ||||||||||||||
| 1,595 | 4.500%, 12/01/2025 | 1,618,670 | ||||||||||||
Union, Series A | ||||||||||||||
| 520 | 5.200%, 07/01/2023 | 525,060 | ||||||||||||
| 12,285 | Total Certificates of Participation | 12,409,451 | ||||||||||||
Continuing Care Retirement Communities – 5.1% | ||||||||||||||
Cole County Industrial Development Authority, Lutheran Services Heisinger Project | ||||||||||||||
| 2,000 | 5.250%, 02/01/2024 | 1,948,600 | ||||||||||||
Illinois Finance Authority, Franciscan Communities, Series A | ||||||||||||||
| 500 | 5.500%, 05/15/2027 | 403,055 | ||||||||||||
Kirkwood Industrial Development Authority, Aberdeen, Series C-2 | ||||||||||||||
| 1,500 | 7.000%, 11/15/2015 | 1,501,845 | ||||||||||||
Lee’s Summit Industrial Development Authority, Senior Living Facilities, John Knox Village Group, Series A | ||||||||||||||
| 1,035 | 5.000%, 08/15/2014 | 1,082,538 | ||||||||||||
Missouri Health & Educational Facilities Authority, Senior Living Facilities, Lutheran Senior, Series A | ||||||||||||||
| 1,500 | 5.375%, 02/01/2035 | 1,337,100 | ||||||||||||
St. Louis County Industrial Development Authority, Friendship Village West, Series A | ||||||||||||||
| 2,000 | 5.500%, 09/01/2028, DD | 1,827,040 | ||||||||||||
| 8,535 | Total Continuing Care Retirement Communities | 8,100,178 | ||||||||||||
Education – 5.6% | ||||||||||||||
Curators University System Facilities, Series A | ||||||||||||||
| 1,000 | 5.000%, 11/01/2033 | 1,038,570 | ||||||||||||
Lincoln University Auxiliary System (AGC) | ||||||||||||||
| 1,000 | 5.125%, 06/01/2037 | 1,002,050 | ||||||||||||
Missouri Development Finance Board, Midwest Research Institute Project | ||||||||||||||
| 1,185 | 5.000%, 11/01/2017 | 1,269,443 | ||||||||||||
Missouri Health & Educational Facilities Authority, Rockhurst University, Series A | ||||||||||||||
| 1,000 | 6.500%, 10/01/2030 | 1,034,870 | ||||||||||||
| 1,300 | 6.500%, 10/01/2035 | 1,320,371 | ||||||||||||
| Nuveen Investments | 61 |
Portfolio of Investments
Nuveen Missouri Tax Free Fund (continued)
May 31, 2011
| Principal Amount (000) | Description p | Value | ||||||||||||
Education (continued) | ||||||||||||||
Missouri Health & Educational Facilities Authority, Washington University, Series A | ||||||||||||||
| $ | 3,000 | 5.375%, 03/15/2039 | $ | 3,199,770 | ||||||||||
| 8,485 | Total Education | 8,865,074 | ||||||||||||
General Obligations – 8.2% | ||||||||||||||
Belton | ||||||||||||||
| 1,520 | 5.000%, 03/01/2027 | 1,650,492 | ||||||||||||
| 680 | 5.000%, 03/01/2030 | 710,648 | ||||||||||||
| 1,000 | 4.750%, 03/01/2031 | 1,022,270 | ||||||||||||
Blue Springs Neighborhood Improvement, South Area Improvement Project | ||||||||||||||
| 850 | 5.000%, 02/15/2029 | 888,335 | ||||||||||||
Jackson County School District #4, Blue Springs, Series A | ||||||||||||||
| 2,000 | 4.750%, 03/01/2026 | 2,098,320 | ||||||||||||
Jackson County School District #7, Lee’s Summit | ||||||||||||||
| 1,000 | 4.750%, 03/01/2027 | 1,050,870 | ||||||||||||
Platte County School District #R-3 (NATL) | ||||||||||||||
| 685 | 5.000%, 03/01/2024 | 714,386 | ||||||||||||
Puerto Rico Commonwealth, Public Improvement, Series A | ||||||||||||||
| 1,000 | 5.250%, 07/01/2026 | 988,670 | ||||||||||||
Richmond Heights, Manhasset Village Neighborhood | ||||||||||||||
| 690 | 4.500%, 04/01/2026 | 691,780 | ||||||||||||
St. Charles County, Francis Howell School District (MDDP) | ||||||||||||||
| 1,000 | 5.000%, 03/01/2027 | 1,078,800 | ||||||||||||
Wentzville School District #R-04, Refunding & Improvement, Series A, (MDDP) | ||||||||||||||
| 5,000 | 0.000%, 03/01/2026 | 2,244,150 | ||||||||||||
| 15,425 | Total General Obligations | 13,138,721 | ||||||||||||
Health Care – 24.2% | ||||||||||||||
Boone County Hospital | ||||||||||||||
| 1,115 | 5.050%, 08/01/2020 | 1,126,005 | ||||||||||||
| 2,000 | 5.625%, 08/01/2038 | 2,005,080 | ||||||||||||
Cape Girardeau County Industrial Development Authority, Health Care Facilities, Saint Francis Medical Center, Series A | ||||||||||||||
| 250 | 5.125%, 06/01/2023 | 261,237 | ||||||||||||
| 200 | 5.125%, 06/01/2024 | 205,870 | ||||||||||||
| 500 | 5.500%, 06/01/2029 | 505,800 | ||||||||||||
| 2,000 | 5.750%, 06/01/2039 | 2,034,600 | ||||||||||||
Cape Girardeau County Industrial Development Authority, Health Care Facilities, Southeast Missouri Hospital | ||||||||||||||
| 245 | 5.625%, 06/01/2022 | 246,156 | ||||||||||||
Cape Girardeau County Industrial Development Authority, Health Care Facilities, Southeast Missouri Hospital (Pre-refunded 06/01/2012 @ 100) | ||||||||||||||
| 1,255 | 5.625%, 06/01/2022 | 1,319,997 | ||||||||||||
Cass County Hospital | ||||||||||||||
| 2,000 | 5.500%, 05/01/2027 | 1,833,020 | ||||||||||||
Clinton County Industrial Development Authority, Health Facilities, Cameron Regional Medical Center | ||||||||||||||
| 1,000 | 5.000%, 12/01/2037 | 670,310 | ||||||||||||
Colorado Health Facilities Authority, Sisters of Charity of Leavenworth, Series B | ||||||||||||||
| 495 | 5.250%, 01/01/2025 | 522,977 | ||||||||||||
Grundy County Industrial Development Authority Health Facilities, Wright Memorial Hospital | ||||||||||||||
| 1,120 | 5.650%, 09/01/2022 | 1,122,822 | ||||||||||||
| 1,000 | 5.750%, 09/01/2023 | 1,000,550 | ||||||||||||
Hannibal Industrial Development Authority Health Facilities | ||||||||||||||
| 1,345 | 4.300%, 03/01/2013 | 1,378,800 | ||||||||||||
| 850 | 5.375%, 09/01/2019 | 882,750 | ||||||||||||
| 1,835 | 5.000%, 03/01/2022 | 1,836,395 | ||||||||||||
| 62 | Nuveen Investments |
| Principal Amount (000) | Description p | Value | ||||||||||||
Health Care (continued) | ||||||||||||||
Joplin Industrial Development Authority Health Facilities, Freeman Health System Project | ||||||||||||||
| $ | 2,000 | 5.500%, 02/15/2024 | $ | 2,007,000 | ||||||||||
Missouri Health & Educational Facilities Authority, BJC Health System, Series A, | ||||||||||||||
| 2,310 | 6.750%, 05/15/2012 (ETM) | 2,436,011 | ||||||||||||
Missouri Health & Educational Facilities Authority, Children’s Mercy Hospital | ||||||||||||||
| 2,500 | 5.625%, 05/15/2039 | 2,537,525 | ||||||||||||
Missouri Health & Educational Facilities Authority, Jefferson Memorial Hospital (RAAI) | ||||||||||||||
| 2,300 | 5.000%, 08/15/2019 | 2,328,681 | ||||||||||||
Missouri Health & Educational Facilities Authority, Lake Regional Health System Project | ||||||||||||||
| 515 | 5.000%, 02/15/2012 | 528,102 | ||||||||||||
Missouri Health & Educational Facilities Authority, Saint Luke’s Health System | ||||||||||||||
Series 2003-B (AGM) | ||||||||||||||
| 2,000 | 5.500%, 11/15/2032 | 2,095,120 | ||||||||||||
Missouri Health & Educational Facilities, Series A | ||||||||||||||
| 485 | 5.250%, 11/15/2025 | 510,196 | ||||||||||||
| 500 | 5.000%, 11/15/2030 | 503,360 | ||||||||||||
Missouri Health & Educational Facilities Authority, Senior Living Facilities, Lutheran Senior | ||||||||||||||
| 1,250 | 5.500%, 02/01/2042 | 1,110,225 | ||||||||||||
Missouri Health & Educational Facilities Authority, SSM Health Care | ||||||||||||||
Series A | ||||||||||||||
| 2,000 | 5.000%, 06/01/2036 | 2,001,160 | ||||||||||||
Missouri Health & Educational Facilities Authority, SSM Health Care, Series B | ||||||||||||||
| 1,500 | 5.000%, 06/01/2030 | 1,533,825 | ||||||||||||
Saline County Industrial Development Authority, Health Facilities, John Fitzgibbon Memorial Hospital | ||||||||||||||
| 1,000 | 5.600%, 12/01/2028 | 949,760 | ||||||||||||
| 1,000 | 5.625%, 12/01/2035 | 794,910 | ||||||||||||
St. Louis County Industrial Development Authority, Health Facilities, Ranken-Jordan Project | ||||||||||||||
| 125 | 4.250%, 11/15/2014 | 117,833 | ||||||||||||
| 670 | 5.000%, 11/15/2027 | 551,872 | ||||||||||||
| 1,300 | 5.000%, 11/15/2035 | 990,158 | ||||||||||||
St. Louis County Industrial Development Authority, Health Facilities, Ranken-Jordan Project, Series A, (Pre-refunded 11/15/2013) | ||||||||||||||
| 500 | 6.625%, 11/15/2035 | 571,405 | ||||||||||||
| 39,165 | Total Health Care | 38,519,512 | ||||||||||||
Housing – 2.6% | ||||||||||||||
Joplin Industrial Development Authority, Christian Homes, Series F | ||||||||||||||
| 500 | 5.750%, 05/15/2031 | 448,625 | ||||||||||||
Kansas City Industrial Development Authority, Multifamily Housing, Grand Boulevard, Series A (GNMA) | ||||||||||||||
| 1,290 | 5.300%, 11/20/2049 | 1,301,184 | ||||||||||||
Missouri Housing Development Commission, Homeownership Loan Program, Series A1 | ||||||||||||||
(AMT) (FHLMC) (FNMA) (GNMA) | ||||||||||||||
| 370 | 5.300%, 03/01/2039 | 364,676 | ||||||||||||
Missouri Housing Development Commission, Homeownership Loan Program, Series B (AMT) (FNMA) (GNMA) | ||||||||||||||
| 485 | 4.800%, 09/01/2031 | 463,772 | ||||||||||||
Missouri Housing Development Commission, Homeownership Loan Program, Series C1 (AMT) (FNMA) (GNMA) | ||||||||||||||
| 245 | 5.000%, 09/01/2037 | 236,645 | ||||||||||||
Riverside Industrial Development Authority, Riverside Horizons Project, Series A (ACA) | ||||||||||||||
| 1,400 | 5.000%, 05/01/2027 | 1,383,298 | ||||||||||||
| 4,290 | Total Housing | 4,198,200 | ||||||||||||
Lease Revenue – 15.9% | ||||||||||||||
Cape Girardeau County, Jackson School District #R-2 (NATL) | ||||||||||||||
| 1,000 | 5.250%, 03/01/2026 | 1,037,960 | ||||||||||||
| Nuveen Investments | 63 |
Portfolio of Investments
Nuveen Missouri Tax Free Fund (continued)
May 31, 2011
| Principal Amount (000) | Description p | Value | ||||||||||||
Lease Revenue (continued) | ||||||||||||||
Clay County Public Building Authority, Series A (AGM) | ||||||||||||||
| $ | 1,425 | 5.125%, 05/15/2014 | $ | 1,430,002 | ||||||||||
Kansas City Industrial Development Authority, National Security Campus | ||||||||||||||
| 1,250 | 4.000%, 09/01/2013 | 1,270,625 | ||||||||||||
| 1,115 | 4.000%, 09/01/2014 | 1,124,355 | ||||||||||||
Kansas City Municipal Assistance, Capital Appreciation Leasehold, Series B-1 (AMBAC) | ||||||||||||||
| 2,000 | 0.000%, 04/15/2027 | 814,580 | ||||||||||||
Kansas City Special Facilities, MCI Overhaul Base Project, Series G, (Pre-refunded 09/01/2015) (AMT) | ||||||||||||||
| 4,000 | 4.750%, 09/01/2028 | 4,473,840 | ||||||||||||
Missouri Board of Public Buildings, Special Obligation, Series A | ||||||||||||||
| 1,000 | 5.000%, 10/15/2027 | 1,031,630 | ||||||||||||
Missouri Board of Public Buildings, State Office Building Special Obligation | ||||||||||||||
Series A | ||||||||||||||
| 5,000 | 5.125%, 05/01/2026 | 5,013,100 | ||||||||||||
Missouri Board of Public Buildings, State Office Building Special Obligation, Series A (NATL) | ||||||||||||||
| 3,000 | 5.000%, 05/01/2024 | 3,009,300 | ||||||||||||
Missouri Development Finance Board, Infrastructure Facilities, Branson, Series A | ||||||||||||||
| 1,000 | 5.000%, 12/01/2017 | 1,029,270 | ||||||||||||
| 750 | 5.375%, 12/01/2022 | 763,095 | ||||||||||||
Missouri Development Finance Board, Infrastructure Facilities, Independence Water System Improvement, Series C | ||||||||||||||
| 500 | 5.750%, 11/01/2029 | 513,515 | ||||||||||||
Platte County School District #R-3 (MDDP) | ||||||||||||||
| 200 | 5.000%, 03/01/2028 | 207,698 | ||||||||||||
Springfield Public Building, Capital Improvement Program (AMBAC) | ||||||||||||||
| 2,000 | 5.000%, 03/01/2024 | 2,133,760 | ||||||||||||
St. Louis Municipal Finance Leasehold, Convention Center Capital Improvement, Series A (AGC) | ||||||||||||||
| 1,000 | 0.000%, 07/15/2026 | 413,250 | ||||||||||||
| 1,000 | 0.000%, 07/15/2027 | 382,540 | ||||||||||||
| 1,000 | 0.000%, 07/15/2028 | 354,460 | ||||||||||||
| 1,000 | 0.000%, 07/15/2029 | 323,240 | ||||||||||||
| 28,240 | Total Lease Revenue | 25,326,220 | ||||||||||||
Miscellaneous – 2.4% | ||||||||||||||
Kansas City Industrial Development Authority, Downtown Redevelopment District, Series A | ||||||||||||||
| 200 | 5.000%, 09/01/2032 (WI/DD) | 194,750 | ||||||||||||
Kennett Industrial Development Authority, Manac Trailers USA Inc Project (AMT) | ||||||||||||||
| 1,500 | 4.250%, 03/01/2022 | 1,241,685 | ||||||||||||
| 500 | 4.250%, 03/01/2024 | 393,480 | ||||||||||||
Missouri Development Finance Board, Infrastructure Facilities, Eastland Center Project, Series A | ||||||||||||||
| 1,010 | 4.250%, 04/01/2015 | 1,079,347 | ||||||||||||
Sugar Creek Industrial Development, Lafarge North America, Series A (AMT) | ||||||||||||||
| 1,000 | 5.650%, 06/01/2037 | 872,080 | ||||||||||||
| 4,210 | Total Miscellaneous | 3,781,342 | ||||||||||||
Revolving Funds – 1.3% | ||||||||||||||
Missouri Environmental Improvement & Energy Resources Authority, Water Pollution Control | ||||||||||||||
Series A | ||||||||||||||
| 1,000 | 5.750%, 01/01/2029 | 1,138,340 | ||||||||||||
Missouri Environmental Improvement & Energy Resources Authority, Water Pollution Control, Series B | ||||||||||||||
| 110 | 5.250%, 01/01/2015 | 110,427 | ||||||||||||
Missouri Environmental Improvement & Energy Resources Authority, Water Pollution Control, Series C | ||||||||||||||
| 410 | 4.750%, 07/01/2023 | 439,954 | ||||||||||||
| 470 | 5.000%, 07/01/2023 | 471,490 | ||||||||||||
| 1,990 | Total Revolving Funds | 2,160,211 | ||||||||||||
| 64 | Nuveen Investments |
| Principal Amount (000) | Description p | Value | ||||||||||||
Tax Revenue – 12.1% | ||||||||||||||
Columbia Special Obligation, Electric Utility Improvement, Series A | ||||||||||||||
| $ | 400 | 5.000%, 10/01/2021 | $ | 445,816 | ||||||||||
| 445 | 5.000%, 10/01/2023 | 487,021 | ||||||||||||
| 500 | 5.125%, 10/01/2030 | 526,165 | ||||||||||||
Fenton Tax Increment, Gravois Bluffs Redevelopment Project | ||||||||||||||
| 1,000 | 5.000%, 04/01/2014 | 1,069,870 | ||||||||||||
Harrisonville Towne Center Project | ||||||||||||||
| 340 | 4.375%, 11/01/2017 | 351,778 | ||||||||||||
| 715 | 4.500%, 11/01/2022 | 720,777 | ||||||||||||
Howard Bend Levee District (SGI) | ||||||||||||||
| 1,745 | 5.500%, 03/01/2026 | 1,813,840 | ||||||||||||
Jackson County Special Obligation, Harry S. Truman Sports Complex (AMBAC) | ||||||||||||||
| 3,000 | 5.000%, 12/01/2028 | 3,062,850 | ||||||||||||
Kansas City Tax Increment Financing Commission, Maincor Project, Series A | ||||||||||||||
| 500 | 5.250%, 03/01/2018 | 482,340 | ||||||||||||
Missouri Development Finance Board, Independence Centerpoint Project, Series E | ||||||||||||||
| 1,000 | 5.125%, 04/01/2025 | 1,023,450 | ||||||||||||
Missouri Development Finance Board, Independence Crackerneck Creek Project, Series B | ||||||||||||||
| 1,000 | 5.000%, 03/01/2025 | 1,005,610 | ||||||||||||
Monarch-Chesterfield Levee District | ||||||||||||||
| 1,000 | 3.000%, 03/01/2018 | 1,022,230 | ||||||||||||
Osage Beach Tax Increment, Prewitt’s Point Project | ||||||||||||||
| 1,455 | 5.000%, 05/01/2023 | 1,196,621 | ||||||||||||
Puerto Rico Sales Tax Financing Corporation, Series A | ||||||||||||||
| 1,500 | 6.000%, 08/01/2042 | 1,540,740 | ||||||||||||
Puerto Rico Sales Tax Financing Corporation, Series C | ||||||||||||||
| 1,530 | 6.000%, 08/01/2039 | 1,575,487 | ||||||||||||
| 1,000 | 5.250%, 08/01/2041 | 956,230 | ||||||||||||
Raytown Live Redevelopment Plan, Project #1 | ||||||||||||||
| 1,000 | 5.125%, 12/01/2031 | 979,500 | ||||||||||||
Riverside Tax Increment, L-385 Levee Project | ||||||||||||||
| 1,000 | 5.250%, 05/01/2020 | 1,027,340 | ||||||||||||
| 19,130 | Total Tax Revenue | 19,287,665 | ||||||||||||
Transportation – 2.7% | ||||||||||||||
Puerto Rico Commonwealth Highway & Transportation Authority, Series K | ||||||||||||||
| 1,000 | 5.000%, 07/01/2017 | 1,038,630 | ||||||||||||
St. Louis, Lambert-St. Louis International Airport, Series A (AGM) | ||||||||||||||
| 1,000 | 5.000%, 07/01/2020 | 1,049,090 | ||||||||||||
St. Louis, Lambert-St. Louis International Airport, Series A-1 | ||||||||||||||
| 2,000 | 6.125%, 07/01/2024 | 2,153,380 | ||||||||||||
| 4,000 | Total Transportation | 4,241,100 | ||||||||||||
Utilities – 10.9% | ||||||||||||||
Carroll County Public Water Supply, District #I | ||||||||||||||
| 500 | 6.000%, 03/01/2039 | 523,145 | ||||||||||||
Jefferson County Public Water Supply, District #C-1 | ||||||||||||||
| 745 | 4.125%, 12/01/2024 | 761,502 | ||||||||||||
| 500 | 4.250%, 12/01/2025 | 509,675 | ||||||||||||
Kansas City Sanitary Sewer System, Series A | ||||||||||||||
| 2,000 | 5.250%, 01/01/2034 | 2,089,520 | ||||||||||||
Kansas City Water, Series A | ||||||||||||||
| 500 | 5.250%, 12/01/2032 | 537,305 | ||||||||||||
| Nuveen Investments | 65 |
Portfolio of Investments
Nuveen Missouri Tax Free Fund (continued)
May 31, 2011
| Principal Amount (000) | Description p | Value | ||||||||||||
Utilities (continued) | ||||||||||||||
Metropolitan St. Louis Sewer District, Wastewater System, Series A | ||||||||||||||
| $ | 500 | 5.750%, 05/01/2038 | $ | 538,990 | ||||||||||
Missouri Development Finance Board, Independence Water System Improvements (AMBAC) | ||||||||||||||
| 1,000 | 5.000%, 11/01/2024 | 1,015,950 | ||||||||||||
Missouri Environmental Improvement & Energy Resources Authority, Tri-County Water Authority Project | ||||||||||||||
| 140 | 4.000%, 04/01/2018 | 154,976 | ||||||||||||
| 1,000 | 4.000%, 04/01/2022 | 1,073,850 | ||||||||||||
Missouri Environmental Improvement & Energy Resources Authority, Water Pollution Control, Series C, (Pre-refunded 07/01/2011) | ||||||||||||||
| 1,685 | 5.000%, 07/01/2023 | 1,691,200 | ||||||||||||
Missouri Joint Municipal Electric Utility Commission, Power Project, Iatan 2 Project, Series A | ||||||||||||||
| 2,000 | 6.000%, 01/01/2039 | 2,074,380 | ||||||||||||
Missouri Joint Municipal Electric Utility Commission, Power Project, Iatan 2 Project, Series A (AMBAC) | ||||||||||||||
| 1,000 | 5.000%, 01/01/2028 | 1,010,350 | ||||||||||||
Missouri Joint Municipal Electric Utility Commission, Power Project, Plum Point Project (NATL) | ||||||||||||||
| 1,500 | 5.000%, 01/01/2016 | 1,633,230 | ||||||||||||
North Central Regional Water Commission, Waterworks Systems | ||||||||||||||
| 2,070 | 5.000%, 01/01/2037 | 1,800,920 | ||||||||||||
Puerto Rico Electric Power Authority, Series WW | ||||||||||||||
| 1,000 | 5.250%, 07/01/2025 | 1,001,710 | ||||||||||||
St. Joseph Industrial Development Authority, Sewer System Improvements Project | ||||||||||||||
| 500 | 4.750%, 04/01/2020 | 528,640 | ||||||||||||
| 390 | 4.750%, 04/01/2021 | 408,993 | ||||||||||||
| 17,030 | Total Utilities | 17,354,336 | ||||||||||||
| 162,785 | Total Municipal Bonds (cost $155,976,264) | 157,382,010 | ||||||||||||
| Shares | Description p | Value | ||||||||||||
SHORT-TERM INVESTMENT – 0.4% | ||||||||||||||
Money Market Funds – 0.4% | ||||||||||||||
| 565,168 | First American Tax Free Obligations Fund, Class Z, 0.000% | $ | 565,168 | |||||||||||
Total Short-Term Investments (cost $565,168) | 565,168 | |||||||||||||
Total Investments – 99.2% (cost $156,541,432) | 157,947,178 | |||||||||||||
Other Assets Less Liabilities – 0.8% | 1,275,011 | |||||||||||||
Net Assets – 100.0% | $ | 159,222,189 | ||||||||||||
| p | All percentages shown in the Portfolio of Investments are based on net assets. |
| The rate shown is the annualized seven-day effective yield as of May 31, 2011. |
| DD | Investment, or portion of investment, purchased on a delayed delivery basis. |
| (ETM) | Escrowed to maturity. |
See accompanying notes to financial statements.
| 66 | Nuveen Investments |
Portfolio of Investments
Nuveen Nebraska Municipal Bond Fund
(formerly known as First American Nebraska Tax Free Fund)
May 31, 2011
| Principal Amount (000) | Description p | Value | ||||||||||||
MUNICIPAL BONDS – 98.9% | ||||||||||||||
Continuing Care Retirement Communities – 7.2% | ||||||||||||||
Colorado Health Facilities Authority, Christian Living Communities Project, Series A | ||||||||||||||
| $ | 100 | 5.750%, 01/01/2026 | $ | 92,507 | ||||||||||
Illinois Finance Authority, Franciscan Communities, Series A | ||||||||||||||
| 275 | 5.500%, 05/15/2037 | 201,680 | ||||||||||||
Illinois Finance Authority, Three Crowns Park Plaza, Series A | ||||||||||||||
| 200 | 5.875%, 02/15/2026 | 187,356 | ||||||||||||
Lancaster County Hospital Authority #1, Immanuel Obligation Group | ||||||||||||||
| 2,090 | 5.625%, 01/01/2040 | 2,030,602 | ||||||||||||
South Dakota Health & Educational Facilities Authority, Westhills Village Retirement Community | ||||||||||||||
| 600 | 5.000%, 09/01/2025 | 591,954 | ||||||||||||
| 3,265 | Total Continuing Care Retirement Communities | 3,104,099 | ||||||||||||
Education – 24.8% | ||||||||||||||
Colorado Educational & Cultural Facilities Authority, Charter School | ||||||||||||||
| 990 | 5.625%, 05/01/2040 | 953,053 | ||||||||||||
Douglas County Educational Facilities, Creighton University, Series A | ||||||||||||||
| 1,000 | 5.500%, 07/01/2030 | 1,031,680 | ||||||||||||
Missouri Health & Educational Facilities Authority, Washington University, Series A | ||||||||||||||
| 500 | 5.375%, 03/15/2039 | 533,295 | ||||||||||||
Nebraska Educational Finance Authority (RAAI) | ||||||||||||||
| 605 | 5.000%, 04/01/2017 | 610,820 | ||||||||||||
Nebraska Educational Finance Authority, Clarkson College Project | ||||||||||||||
| 500 | 5.450%, 09/01/2035 | 507,090 | ||||||||||||
Nebraska Educational Finance Authority, Concordia University Project | ||||||||||||||
| 2,690 | 5.000%, 10/01/2037, DD | 2,213,332 | ||||||||||||
Nebraska Utility Corporation, University of Nebraska, Lincoln Project | ||||||||||||||
(Pre-refunded 01/01/2012) | ||||||||||||||
| 1,045 | 5.250%, 01/01/2015 | 1,075,838 | ||||||||||||
University of Nebraska Facilities Corporation, Medical Center Research Project | ||||||||||||||
| 500 | 5.000%, 02/15/2015 | 514,615 | ||||||||||||
University of Nebraska, Lincoln Memorial Stadium, Series A | ||||||||||||||
| 500 | 5.000%, 11/01/2015 | 545,870 | ||||||||||||
University of Nebraska, Lincoln Student Fees | ||||||||||||||
| 750 | 5.000%, 07/01/2022 | 785,243 | ||||||||||||
University of Nebraska, Omaha Health & Recreation Project | ||||||||||||||
| 1,000 | 5.000%, 05/15/2033 | 1,034,690 | ||||||||||||
University of Nebraska, Omaha Student Facilities Project | ||||||||||||||
| 350 | 5.000%, 05/15/2032 | 361,539 | ||||||||||||
University of Nebraska, Omaha Student Housing Project | ||||||||||||||
| 500 | 5.000%, 05/15/2023 | 537,505 | ||||||||||||
| 10,930 | Total Education | 10,704,570 | ||||||||||||
General Obligations – 14.8% | ||||||||||||||
Brown County | ||||||||||||||
| 200 | 4.350%, 06/15/2026 | 200,548 | ||||||||||||
| 400 | 4.700%, 12/15/2026 | 400,508 | ||||||||||||
Buffalo County (AGC) | ||||||||||||||
| 195 | 6.000%, 12/15/2028 | 207,119 | ||||||||||||
Douglas County School District #10, Elkhorn Public Schools | ||||||||||||||
| 500 | 6.000%, 06/15/2028 | 523,230 | ||||||||||||
| Nuveen Investments | 67 |
Portfolio of Investments
Nuveen Nebraska Municipal Bond Fund (continued)
May 31, 2011
| Principal Amount (000) | Description p | Value | ||||||||||||
General Obligations (continued) | ||||||||||||||
Douglas County School District #54, Ralston Public Schools (Pre-refunded 08/15/2011) (AGM) | ||||||||||||||
| $ | 845 | 5.000%, 12/15/2016 | $ | 853,391 | ||||||||||
Douglas County School District #59 | ||||||||||||||
| 350 | 4.700%, 12/15/2032 | 356,030 | ||||||||||||
La Vista | ||||||||||||||
| 345 | 4.800%, 12/15/2026 | 345,166 | ||||||||||||
Lincoln Stormwater | ||||||||||||||
| 400 | 4.500%, 06/01/2030 | 414,532 | ||||||||||||
Lincoln-Lancaster County Public Building Commission, Tax Supported Lease Rental | ||||||||||||||
| 750 | 4.500%, 10/15/2026 | 760,478 | ||||||||||||
Omaha | ||||||||||||||
| 450 | 5.750%, 10/15/2028 | 515,115 | ||||||||||||
Puerto Rico Commonwealth, Series C-7, (NATL) | ||||||||||||||
| 250 | 6.000%, 07/01/2027 | 259,463 | ||||||||||||
Puerto Rico Commonwealth, Public Improvement, Series A | ||||||||||||||
| 375 | 5.250%, 07/01/2026 | 370,751 | ||||||||||||
Saunders County (AGM) | ||||||||||||||
| 650 | 5.000%, 11/01/2030 | 650,598 | ||||||||||||
Scotts Bluff County | ||||||||||||||
| 500 | 4.550%, 01/15/2026 | 500,440 | ||||||||||||
| 6,210 | Total General Obligations | 6,357,369 | ||||||||||||
Health Care – 15.7% | ||||||||||||||
Colorado Health Facilities Authority, Evangelical Lutheran | ||||||||||||||
Series B, Mandatory Put 12/01/2014 @ 100 | ||||||||||||||
| 250 | 5.000%, 06/01/2039 | 266,248 | ||||||||||||
Douglas County Hospital Authority #2, Boy’s Town Project | ||||||||||||||
| 1,000 | 4.750%, 09/01/2028 | 1,014,940 | ||||||||||||
Douglas County Hospital Authority #2, Children’s Hospital | ||||||||||||||
| 1,000 | 6.000%, 08/15/2028 | 1,048,900 | ||||||||||||
Douglas County Hospital Authority #3, Methodist Health | ||||||||||||||
| 275 | 5.750%, 11/01/2028 | 280,805 | ||||||||||||
| 1,000 | 5.500%, 11/01/2038 | 965,660 | ||||||||||||
Halifax, Florida Hospital Medical Center | ||||||||||||||
Series A | ||||||||||||||
| 600 | 5.000%, 06/01/2038 | 534,168 | ||||||||||||
Indiana Health & Educational Facility Financing Authority, Schneck Memorial Hospital Project, | ||||||||||||||
Series A | ||||||||||||||
| 600 | 5.250%, 02/15/2030 | 561,276 | ||||||||||||
Lancaster County Hospital Authority #1, BryanLGH Medical Center Project Series A, | ||||||||||||||
| 500 | 5.000%, 06/01/2019 | 500,000 | ||||||||||||
Madison County Hospital Authority #1, Faith Regional Health Services Project | ||||||||||||||
(Pre-refunded 01/01/2012) (RAAI) | ||||||||||||||
| 500 | 5.500%, 07/01/2021 | 514,675 | ||||||||||||
Nebraska Investment Finance Authority, Great Plains Regional Medical Center Project (RAAI) | ||||||||||||||
| 250 | 5.200%, 11/15/2016 | 255,925 | ||||||||||||
| 805 | 5.300%, 11/15/2017 | 822,380 | ||||||||||||
| 6,780 | Total Health Care | 6,764,977 | ||||||||||||
Housing – 6.1% | ||||||||||||||
Nebraska Investment Finance Authority, Single Family Housing, Series A | ||||||||||||||
(FHLMC) (FNMA) (GNMA) | ||||||||||||||
| 2,000 | 5.700%, 09/01/2031 | 2,114,640 | ||||||||||||
| 68 | Nuveen Investments |
| Principal Amount (000) | Description p | Value | ||||||||||||
Housing (continued) | ||||||||||||||
Omaha Housing Authority, Multifamily Housing, Timbercreek Apartments (GNMA) | ||||||||||||||
| $ | 520 | 5.150%, 11/20/2022 | $ | 521,524 | ||||||||||
| 2,520 | Total Housing | 2,636,164 | ||||||||||||
Miscellaneous – 2.1% | ||||||||||||||
Forsyth, Montana, Pollution Control, Northwestern Corporation (AMBAC) | ||||||||||||||
| 585 | 4.650%, 08/01/2023 | 608,184 | ||||||||||||
Washington County Wastewater Facilities, Cargill Incorporated Project (AMT) | ||||||||||||||
| 300 | 5.900%, 11/01/2027 | 306,675 | ||||||||||||
| 885 | Total Miscellaneous | 914,859 | ||||||||||||
Recreational Facility Authority – 1.6% | ||||||||||||||
Douglas County Zoo Facility, Omaha’s Henry Doorly Zoo Project | ||||||||||||||
| 665 | 4.750%, 09/01/2024 | 678,612 | ||||||||||||
Revolving Funds – 1.4% | ||||||||||||||
Nebraska Investment Finance Authority, Drinking Water, Series A | ||||||||||||||
| 580 | 5.150%, 01/01/2016 | 581,839 | ||||||||||||
Tax Revenue – 2.8% | ||||||||||||||
Omaha Special Tax | ||||||||||||||
| 650 | 5.250%, 10/15/2028 | 695,194 | ||||||||||||
Omaha Special Tax, Series A | ||||||||||||||
| 500 | 5.125%, 02/01/2032 | 506,705 | ||||||||||||
| 1,150 | Total Tax Revenue | 1,201,899 | ||||||||||||
Utilities – 22.4% | ||||||||||||||
Arkansas River Power Authority | ||||||||||||||
| 1,000 | 6.125%, 10/01/2040 | 993,830 | ||||||||||||
Central Plains Energy Project, Nebraska Gas Project #1, Series A | ||||||||||||||
| 750 | 5.250%, 12/01/2021 | 734,085 | ||||||||||||
Grand Island Electric System (NATL) | ||||||||||||||
| 750 | 5.125%, 08/15/2016 | 752,737 | ||||||||||||
Hastings Electric System (AGM) | ||||||||||||||
| 250 | 5.000%, 01/01/2015 | 250,000 | ||||||||||||
Lincoln Electric System | ||||||||||||||
| 250 | 5.000%, 09/01/2026 | 261,622 | ||||||||||||
Municipal Energy Agency of Nebraska, Power Supply System, Series A, (BHAC) | ||||||||||||||
| 150 | 5.375%, 04/01/2039 | 156,911 | ||||||||||||
Nebraska Public Power District, Series B | ||||||||||||||
| 500 | 5.000%, 01/01/2033 | 513,945 | ||||||||||||
Omaha Public Power District, Electric System, Series A | ||||||||||||||
| 1,000 | 5.500%, 02/01/2033 | 1,076,960 | ||||||||||||
| 1,200 | 5.500%, 02/01/2035 | 1,281,552 | ||||||||||||
Puerto Rico Commonwealth, Aqueduct & Sewer Authority, Series A | ||||||||||||||
| 500 | 6.000%, 07/01/2038 | 501,540 | ||||||||||||
Puerto Rico Commonwealth, Aqueduct & Sewer Authority, Series A, (AGC) | ||||||||||||||
| 500 | 5.000%, 07/01/2025 | 513,020 | ||||||||||||
Puerto Rico Electric Power Authority, Series WW | ||||||||||||||
| 1,000 | 5.250%, 07/01/2025 | 1,001,710 | ||||||||||||
Southern Nebraska Public Power District, Electric System | ||||||||||||||
| 1,500 | 5.250%, 12/15/2028 | 1,626,555 | ||||||||||||
| 9,350 | Total Utilities | 9,664,467 | ||||||||||||
| 42,335 | Total Municipal Bonds (cost $41,515,276) | 42,608,855 | ||||||||||||
| Nuveen Investments | 69 |
Portfolio of Investments
Nuveen Nebraska Municipal Bond Fund (continued)
May 31, 2011
| Shares | Description p | Value | ||||||||||||
SHORT-TERM INVESTMENTS – 1.9% | ||||||||||||||
Money Market Funds – 1.9% | ||||||||||||||
| 825,840 | First American Tax Free Obligations Fund, Class Z, 0.000% | $ | 825,840 | |||||||||||
Total Short-Term Investments (cost $825,840) | 825,840 | |||||||||||||
Total Investments – 100.8% (cost $42,341,116) | 43,434,695 | |||||||||||||
Other Assets Less Liabilities – (0.8)% | (344,190) | |||||||||||||
Net Assets – 100.0% | $ | 43,090,505 | ||||||||||||
| p | All percentages shown in the Portfolio of Investments are based on net assets. |
| The rate shown is the annualized seven-day effective yield as of May 31, 2011. |
| DD | Investment, or portion of investment, purchased on a delayed delivery basis. |
See accompanying notes to financial statements.
| 70 | Nuveen Investments |
Portfolio of Investments
Nuveen Ohio Tax Free Fund
(formerly known as First American Ohio Tax Free Fund)
May 31, 2011
| Principal Amount (000) | Description p | Value | ||||||||||||
MUNICIPAL BONDS – 98.6% | ||||||||||||||
Certificates of Participation – 2.0% | ||||||||||||||
Mahoning County Career & Technical Center, Series B | ||||||||||||||
| $ | 475 | 4.750%, 12/01/2036 | $ | 476,055 | ||||||||||
Mayfield County School District, Middle School Project, Series B | ||||||||||||||
| 435 | 0.000%, 09/01/2027 | 185,036 | ||||||||||||
| 855 | 0.000%, 09/01/2028 | 337,947 | ||||||||||||
| 1,765 | Total Certificates of Participation | 999,038 | ||||||||||||
Continuing Care Retirement Communities – 2.2% | ||||||||||||||
Franklin County Health Care Facilities, Refunding & Improvement, Ohio Presbyterian, Series A | ||||||||||||||
| 800 | 5.000%, 07/01/2026 | 735,440 | ||||||||||||
Hamilton County Health Care, Life Enriching Communities Project, Series A | ||||||||||||||
| 400 | 5.000%, 01/01/2027 | 360,224 | ||||||||||||
| 1,200 | Total Continuing Care Retirement Communities | 1,095,664 | ||||||||||||
Education – 16.2% | ||||||||||||||
Bowling Green Student Housing, State University Project | ||||||||||||||
| 500 | 5.750%, 06/01/2031 | 483,860 | ||||||||||||
Cincinnati Port Development Authority, Economic Development Authority, Sisters of Mercy | ||||||||||||||
| 250 | 5.000%, 10/01/2025 | 246,090 | ||||||||||||
Ohio Higher Educational Facilities, Baldwin-Wallace College Project | ||||||||||||||
| 750 | 5.000%, 12/01/2013 | 810,863 | ||||||||||||
Ohio Higher Educational Facilities, College of Wooster Project | ||||||||||||||
| 400 | 5.000%, 09/01/2020 | 423,564 | ||||||||||||
Ohio Higher Educational Facilities, John Carroll University Project | ||||||||||||||
| 1,000 | 5.000%, 04/01/2019 | 1,074,870 | ||||||||||||
Ohio Higher Educational Facilities, Mount Union College Project | ||||||||||||||
| 1,000 | 5.000%, 10/01/2031 | 1,009,250 | ||||||||||||
Ohio Higher Educational Facilities, Ohio Northern University Project | ||||||||||||||
| 1,000 | 5.000%, 05/01/2026 | 979,380 | ||||||||||||
Ohio Higher Educational Facilities, Otterbein College Project, Series A | ||||||||||||||
| 500 | 5.500%, 12/01/2028 | 526,490 | ||||||||||||
Ohio Higher Educational Facilities, University of Dayton Project | ||||||||||||||
| 645 | 5.375%, 12/01/2029 | 672,870 | ||||||||||||
Ohio Higher Educational Facilities, Wittenburg University 2005 Project | ||||||||||||||
| 505 | 5.000%, 12/01/2024 | 475,195 | ||||||||||||
Ohio Higher Educational Facilities, Xavier University Project | ||||||||||||||
| 500 | 5.000%, 05/01/2040 | 489,865 | ||||||||||||
University of Cincinnati, Series A, (Pre-refunded 06/01/2011) (FGIC) (NATL) | ||||||||||||||
| 1,000 | 5.500%, 06/01/2014 | 1,010,000 | ||||||||||||
| 8,050 | Total Education | 8,202,297 | ||||||||||||
General Obligations – 27.1% | ||||||||||||||
Cincinnati, Series A | ||||||||||||||
| 150 | 4.500%, 12/01/2029 | 154,521 | ||||||||||||
Cincinnati City School District, Classroom Construction & Improvement | ||||||||||||||
(FGIC) (NATL) | ||||||||||||||
| 535 | 5.250%, 12/01/2019 | 628,716 | ||||||||||||
| 380 | 5.250%, 12/01/2027 | 428,363 | ||||||||||||
Cincinnati City School District, School Improvement | ||||||||||||||
| 300 | 5.250%, 06/01/2021 | 346,950 | ||||||||||||
Columbus City School District, School Facilities Construction & Improvement, Series B | ||||||||||||||
| 1,320 | 5.000%, 12/01/2027 | 1,418,761 | ||||||||||||
| Nuveen Investments | 71 |
Portfolio of Investments
Nuveen Ohio Tax Free Fund (continued)
May 31, 2011
| Principal Amount (000) | Description p | Value | ||||||||||||
General Obligations (continued) | ||||||||||||||
Cuyahoga Falls, Various Purpose | ||||||||||||||
| $ | 750 | 4.250%, 12/01/2034 | $ | 751,478 | ||||||||||
Dayton City School District, School Facilities Construction & Improvement, Series D, | ||||||||||||||
(FGIC) (NATL) | ||||||||||||||
| 500 | 5.000%, 12/01/2011 | 511,490 | ||||||||||||
Franklin County | ||||||||||||||
| 690 | 4.500%, 12/01/2027 | 712,970 | ||||||||||||
Gahanna (NATL) | ||||||||||||||
| 400 | 5.000%, 12/01/2027 | 421,176 | ||||||||||||
Greene County, General Infrastructure (AMBAC) | ||||||||||||||
| 1,000 | 5.250%, 12/01/2026 | 1,070,630 | ||||||||||||
Highland School District (OSDCEP) | ||||||||||||||
| 100 | 0.000%, 12/01/2022 | 61,280 | ||||||||||||
Highland School District, School Facilities Construction & Improvement (OSDCEP) | ||||||||||||||
| 1,000 | 5.375%, 12/01/2033 | 1,072,600 | ||||||||||||
Ohio Common Schools, Series A, (Pre-refunded 03/15/2012) | ||||||||||||||
| 1,000 | 5.125%, 09/15/2022 | 1,038,860 | ||||||||||||
Ohio State Infrastructure Improvement, Series A | ||||||||||||||
| 1,000 | 5.500%, 02/01/2020 | 1,221,350 | ||||||||||||
Ohio State Parks & Recreational Facilities, Series II-A, (AGM) | ||||||||||||||
| 1,000 | 5.250%, 02/01/2020 | 1,111,360 | ||||||||||||
Puerto Rico Commonwealth, Government Development, Series B | ||||||||||||||
| 260 | 5.000%, 12/01/2014 | 276,354 | ||||||||||||
Sidney City School District (FGIC) (NATL) | ||||||||||||||
| 755 | 4.375%, 12/01/2027 | 759,243 | ||||||||||||
Solon Rebuilding & Improvement | ||||||||||||||
| 1,000 | 5.000%, 12/01/2021 | 1,055,460 | ||||||||||||
St. Marys City School District, Construction & Improvement (AGM) (OSDCEP) | ||||||||||||||
| 600 | 5.000%, 12/01/2028 | 623,136 | ||||||||||||
| 12,740 | Total General Obligations | 13,664,698 | ||||||||||||
Health Care – 24.2% | ||||||||||||||
Allen County Hospital Facilities, Catholic Healthcare, Series A | ||||||||||||||
| 250 | 5.000%, 06/01/2038 | 236,893 | ||||||||||||
| 100 | 5.250%, 06/01/2038 | 98,300 | ||||||||||||
Allen County Hospital Facilities, Catholic Healthcare, Series B | ||||||||||||||
| 500 | 4.125%, 09/01/2020 | 524,085 | ||||||||||||
Butler County Hospital Facilities, UC Health | ||||||||||||||
| 750 | 5.500%, 11/01/2022 | 753,795 | ||||||||||||
Fairfield County Hospital Facilities, Fairfield Medical Center Project (RAAI) | ||||||||||||||
| 345 | 5.000%, 06/15/2022 | 324,407 | ||||||||||||
Franklin County Health Care Facilities, Ohio Presbyterian Services, Series A | ||||||||||||||
| 500 | 5.625%, 07/01/2026 | 499,220 | ||||||||||||
Franklin County Hospital Improvement, Nationwide Children’s Hospital Project | ||||||||||||||
| 750 | 5.000%, 11/01/2034 | 736,763 | ||||||||||||
Franklin County Hospital Improvement, Nationwide Children’s Hospital Project, Series A | ||||||||||||||
| 365 | 4.750%, 11/01/2023 | 376,260 | ||||||||||||
Franklin County, Trinity Health, Series C | ||||||||||||||
| 500 | 4.500%, 12/01/2037 | 440,810 | ||||||||||||
Lake County Hospital Facilities, Lake Hospital System, Series C | ||||||||||||||
| 750 | 5.625%, 08/15/2029 | 714,248 | ||||||||||||
Lorain County Hospital, Catholic Healthcare | ||||||||||||||
| 350 | 5.500%, 10/01/2017 | 368,120 | ||||||||||||
| 72 | Nuveen Investments |
| Principal Amount (000) | Description p | Value | ||||||||||||
Health Care (continued) | ||||||||||||||
Lucas County Hospital, Promedica Healthcare, Series A | ||||||||||||||
| $ | 575 | 6.000%, 11/15/2041 | $ | 606,504 | ||||||||||
Lucas County Hospital, Promedica Healthcare, Series D | ||||||||||||||
| 400 | 5.000%, 11/15/2038 | 378,860 | ||||||||||||
Miami County Hospital Facilities, Refunding & Improvement, Upper Valley Medical Center | ||||||||||||||
| 500 | 5.250%, 05/15/2026 | 500,635 | ||||||||||||
Montgomery County, Catholic Health Initiatives, Series A | ||||||||||||||
| 750 | 5.000%, 05/01/2039 | 730,155 | ||||||||||||
Montgomery County, Catholic Health Series D | ||||||||||||||
| 100 | 6.250%, 10/01/2033 | 107,587 | ||||||||||||
Montgomery County, Healthcare & Multi-Family Housing Revenue, St. Leonard | ||||||||||||||
| 500 | 6.625%, 04/01/2040 | 475,650 | ||||||||||||
Ohio Higher Educational Facilities, University Hospitals Health System, Series 2009A | ||||||||||||||
| 500 | 6.750%, 01/15/2039 | 515,770 | ||||||||||||
Ohio Hospital Facilities, Cleveland Clinic, Series A | ||||||||||||||
| 1,990 | 5.500%, 01/01/2039 | 2,029,421 | ||||||||||||
Richland County Hospital Facilities, Medcentral Health System Obligated Group | ||||||||||||||
| 535 | 5.250%, 11/15/2036 | 502,847 | ||||||||||||
Ross County Hospital, Adena Health Systems | ||||||||||||||
| 500 | 5.500%, 12/01/2028 | 503,050 | ||||||||||||
Scioto County Hospital Revenue, Southern Ohio Medical Center | ||||||||||||||
| 800 | 5.750%, 02/15/2038 | 793,447 | ||||||||||||
| 12,310 | Total Health Care | 12,216,827 | ||||||||||||
Housing – 3.9% | ||||||||||||||
Ohio Housing Finance Agency, Residential Mortgage Backed Securities, Series C, | ||||||||||||||
| 905 | 5.200%, 09/01/2029 | 918,792 | ||||||||||||
Ohio Housing Finance Agency, Residential Mortgage Backed Securities, Series E, (AMT) (FNMA) (GNMA) | ||||||||||||||
| 440 | 4.850%, 09/01/2026 | 436,691 | ||||||||||||
Ohio Housing Finance Agency, Residential Mortgage Backed Securities, Series F, (FHLMC) (FNMA) (GNMA) | ||||||||||||||
| 600 | 5.450%, 09/01/2033 | 613,536 | ||||||||||||
| 1,945 | Total Housing | 1,969,019 | ||||||||||||
Lease Revenue – 4.4% | ||||||||||||||
Cleveland-Cuyahoga County Port Authority, Rita Project (RAAI) | ||||||||||||||
| 750 | 5.000%, 11/15/2019 | 766,673 | ||||||||||||
Riversouth Authority, Lazarus Building Redevelopment, Series A | ||||||||||||||
| 400 | 5.750%, 12/01/2027 | 357,452 | ||||||||||||
Riversouth Authority, Riverfront Area Redevelopment, Series A | ||||||||||||||
| 1,000 | 5.250%, 12/01/2017 | 1,096,720 | ||||||||||||
| 2,150 | Total Lease Revenue | 2,220,845 | ||||||||||||
Revolving Funds – 2.1% | ||||||||||||||
Ohio Water Development Authority, Water Pollution Control (Pre-refunded 06/01/2012) | ||||||||||||||
| 1,000 | 5.050%, 12/01/2021 | 1,048,130 | ||||||||||||
Tax Revenue – 1.2% | ||||||||||||||
Buckeye Tobacco Settlement, Series A-2 | ||||||||||||||
| 200 | 5.875%, 06/01/2030 | 146,466 | ||||||||||||
Puerto Rico Sales Tax Financing, Series A | ||||||||||||||
| 500 | 5.375%, 08/01/2039 | 488,260 | ||||||||||||
| 700 | Total Tax Revenue | 634,726 | ||||||||||||
| Nuveen Investments | 73 |
Portfolio of Investments
Nuveen Ohio Tax Free Fund (continued)
May 31, 2011
| Principal Amount (000) | Description p | Value | ||||||||||||
Transportation – 2.0% | ||||||||||||||
Columbus Regional Airport Authority (NATL) | ||||||||||||||
| $ | 1,000 | 5.000%, 01/01/2028 | $ | 1,016,750 | ||||||||||
Utilities – 13.3% | ||||||||||||||
American Municipal Power, Prairie State Energy Campus Project, Series A | ||||||||||||||
| 1,000 | 5.000%, 02/15/2031 | 1,014,430 | ||||||||||||
Hamilton County Sewer System, Metropolitan Sewer District, Series A, (NATL) | ||||||||||||||
| 930 | 5.000%, 12/01/2026 | 986,107 | ||||||||||||
Hamilton Electric, Series A, (AGM) | ||||||||||||||
| 1,000 | 4.300%, 10/15/2016 | 1,111,970 | ||||||||||||
Marysville Ohio Wastewater Treatment Systems | ||||||||||||||
| 250 | 5.250%, 12/01/2025 (WI/DD, Settling 6/01/11) | 259,160 | ||||||||||||
Montgomery County Water, Greater Moraine Beaver (AMBAC) | ||||||||||||||
| 1,000 | 5.375%, 11/15/2016 | 1,035,210 | ||||||||||||
Northeast Ohio Regional Sewer District, Wastewater Revenue (NATL) | ||||||||||||||
| 700 | 4.500%, 11/15/2037 | 658,224 | ||||||||||||
Ohio Air Quality Development Authority, Firstenergy Generation, Series A | ||||||||||||||
| 500 | 5.700%, 08/01/2020 | 528,840 | ||||||||||||
Ohio Air Quality Development Authority, Pollution Control, Nuclear Generation | ||||||||||||||
Series A, Mandatory Put 07/01/2015 @ 100 (AGM) | ||||||||||||||
| 500 | 3.375%, 07/01/2033 | 504,750 | ||||||||||||
Ohio Water Development Authority, Water Quality, Series A | ||||||||||||||
| 200 | 5.000%, 06/01/2030 | �� | 213,920 | |||||||||||
Puerto Rico Electric Power Authority, Series WW | ||||||||||||||
| 400 | 5.375%, 07/01/2023 | 413,900 | ||||||||||||
| 6,480 | Total Utilities | 6,726,511 | ||||||||||||
| 49,340 | Total Municipal Bonds (cost $48,764,258) | 49,794,505 | ||||||||||||
| Shares | Description p | Value | ||||||||||||
SHORT-TERM INVESTMENTS – 0.7% | ||||||||||||||
Money Market Funds – 0.7% | ||||||||||||||
| 332,467 | First American Tax Free Obligations Fund, Class Z, 0.000% | 332,467 | ||||||||||||
Total Short-Term Investments (cost $332,467) | 332,467 | |||||||||||||
Total Investments – 99.3% (cost $49,096,725) | 50,126,972 | |||||||||||||
Other Assets Less Liabilities – 0.7% | 364,728 | |||||||||||||
Net Assets – 100.0% | $ | 50,491,700 | ||||||||||||
| p | All percentages shown in the Portfolio of Investments are based on net assets. |
| The rate shown is the annualized seven-day effective yield as of May 31, 2011. |
| WI/DD | Investment, or portion of investment, purchased on a when-issued or delayed delivery basis. |
See accompanying notes to financial statements.
| 74 | Nuveen Investments |
Portfolio of Investments
Nuveen Oregon Intermediate Municipal Bond Fund
(formerly known as First American Oregon Intermediate Tax Free Fund)
May 31, 2011
| Principal Amount (000) | Description p | Value | ||||||||||||
MUNICIPAL BONDS – 98.7% | ||||||||||||||
Certificates of Participation – 2.7% | ||||||||||||||
Oregon Department of Administrative Services, Series A | ||||||||||||||
| $ | 1,500 | 4.700%, 05/01/2025 | $ | 1,567,905 | ||||||||||
Oregon Department of Administrative Services, Series A (FGIC) (NATL) | ||||||||||||||
| 1,060 | 5.000%, 11/01/2018 | 1,192,192 | ||||||||||||
Oregon Department of Administrative Services, Series C | ||||||||||||||
| 1,055 | 5.000%, 11/01/2025 | 1,131,836 | ||||||||||||
| 3,615 | Total Certificates of Participation | 3,891,933 | ||||||||||||
Continuing Care Retirement Communities – 3.1% | ||||||||||||||
Clackamas County Hospital Facility Authority, Robison Jewish Home | ||||||||||||||
| 1,000 | 5.125%, 10/01/2024 | 856,930 | ||||||||||||
Illinois Finance Authority, Franciscan Communities, Series A | ||||||||||||||
| 1,000 | 5.500%, 05/15/2027 | 806,110 | ||||||||||||
Multnomah County Hospital Facilities Authority, Terwilliger Plaza Project | ||||||||||||||
| 1,900 | 6.500%, 12/01/2029 | 1,906,460 | ||||||||||||
Multnomah County Hospital Facilities Authority, Terwilliger Plaza Project Series A | ||||||||||||||
| 1,000 | 5.250%, 12/01/2026 | 959,050 | ||||||||||||
| 4,900 | Total Continuing Care Retirement Communities | 4,528,550 | ||||||||||||
Education – 9.3% | ||||||||||||||
Forest Grove Campus Improvement, Pacific University Project | ||||||||||||||
| 250 | 5.750%, 05/01/2024 | 256,792 | ||||||||||||
Forest Grove Campus Improvement, Pacific University Project Series A (RAAI) | ||||||||||||||
| 2,350 | 5.000%, 05/01/2022 | 2,374,017 | ||||||||||||
Oregon Facilities Authority, Concordia University Projects, Series A | ||||||||||||||
| 1,140 | 6.125%, 09/01/2030 | 1,144,264 | ||||||||||||
Oregon Facilities Authority, Lewis & Clark College Project, Series A | ||||||||||||||
| 625 | 4.000%, 10/01/2017 | 674,637 | ||||||||||||
| 500 | 5.250%, 10/01/2024 | 537,965 | ||||||||||||
Oregon Facilities Authority, Linfield College Project, Series A | ||||||||||||||
| 1,000 | 5.000%, 10/01/2025 | 1,016,280 | ||||||||||||
Oregon Facilities Authority, LTD College Project, Series A | ||||||||||||||
| 500 | 4.750%, 10/01/2028 | 501,465 | ||||||||||||
Oregon Facilities Authority, Reed College Project, Series A | ||||||||||||||
| 1,000 | 5.000%, 07/01/2029 | 1,078,270 | ||||||||||||
Oregon Facilities Authority, University of Portland Projects, Series A | ||||||||||||||
| 1,000 | 4.250%, 04/01/2014 | 1,058,960 | ||||||||||||
| 250 | 5.000%, 04/01/2017 | 277,413 | ||||||||||||
| 2,000 | 4.500%, 04/01/2021 | 2,061,600 | ||||||||||||
Oregon Facilities Authority, Willamette University Projects, Series A | ||||||||||||||
| 1,085 | 4.300%, 10/01/2021 | 1,109,098 | ||||||||||||
| 450 | 4.000%, 10/01/2024 | 445,482 | ||||||||||||
Oregon Health & Science University, Series A (NATL) | ||||||||||||||
| 1,000 | 5.250%, 07/01/2022 | 1,021,580 | ||||||||||||
| 13,150 | Total Education | 13,557,823 | ||||||||||||
General Obligations – 46.7% | ||||||||||||||
Blue Mountain Hospital District | ||||||||||||||
| 605 | 4.250%, 02/01/2019 | 642,746 | ||||||||||||
| 655 | 4.500%, 02/01/2020 | 700,542 | ||||||||||||
| 255 | 5.000%, 02/01/2021 | 279,011 | ||||||||||||
Central Oregon Community College District (SBG) | ||||||||||||||
| 1,000 | 4.000%, 06/15/2019 | 1,118,580 | ||||||||||||
| 800 | 4.500%, 06/15/2020 | 922,496 | ||||||||||||
| Nuveen Investments | 75 |
Portfolio of Investments
Nuveen Oregon Intermediate Municipal Bond Fund (continued)
May 31, 2011
| Principal Amount (000) | Description p | Value | ||||||||||||
General Obligations (continued) | ||||||||||||||
Chemeketa, Oregon, Community College District (SBG) | ||||||||||||||
| $ | 1,000 | 5.500%, 06/15/2024 | $ | 1,133,610 | ||||||||||
Chemeketa, Oregon, Community College District (FGIC) | ||||||||||||||
| 2,170 | 5.500%, 06/01/2013 (ETM) | 2,388,042 | ||||||||||||
Clackamas Community College District (NATL) | ||||||||||||||
| 1,145 | 5.000%, 05/01/2019 | 1,272,828 | ||||||||||||
Clackamas County School District #115, Series B (NATL) (SBG) | ||||||||||||||
| 1,975 | 4.500%, 06/15/2021 | 2,117,338 | ||||||||||||
Clackamas County School District #12, North Clackamas, Deferred Interest, Series B, Convertible CABs (AGM) (SBG) 0.000% through 06/15/2011, thereafter | ||||||||||||||
| 685 | 5.000%, 06/15/2019 | 766,816 | ||||||||||||
Clackamas County School District #12, North Clackamas, Deferred Interest, Series B, Convertible CABs (AGM) (SBG) 0.000% through 06/15/2011, thereafter | ||||||||||||||
| 3,665 | 5.000%, 06/15/2021 | 4,034,505 | ||||||||||||
Clackamas County School District #12, North Clackamas, Deferred Interest, Series B, Convertible CABs (AGM) (SBG) 0.000% through 06/15/2011, thereafter | ||||||||||||||
| 3,135 | 5.000%, 06/15/2022 | 3,420,128 | ||||||||||||
Clackamas County School District #46, Oregon Trail, Series A (SBG) | ||||||||||||||
| 1,000 | 5.000%, 06/15/2024 | 1,120,360 | ||||||||||||
Clackamas County School District #7J, Lake Oswego (AGM) | ||||||||||||||
| 200 | 5.250%, 06/01/2025 | 236,550 | ||||||||||||
Clackamas County School District #86, Canby (AGM) (SBG) | ||||||||||||||
| 1,000 | 5.000%, 06/15/2018 | 1,115,840 | ||||||||||||
| 1,305 | 5.000%, 06/15/2021 | 1,435,017 | ||||||||||||
Deschutes & Jefferson Counties School District #2-J, Redmond | ||||||||||||||
Series A (FGIC) (NATL) (SBG) | ||||||||||||||
| 1,250 | 5.000%, 06/15/2013 | 1,359,738 | ||||||||||||
Deschutes & Jefferson Counties School District #2-J, Richmond, Series B, (SBG) | ||||||||||||||
| 3,030 | 0.000%, 06/15/2022 | 1,927,080 | ||||||||||||
Deschutes County (AGM) | ||||||||||||||
| 1,755 | 5.000%, 12/01/2014 | 1,866,600 | ||||||||||||
Josephine County Unit School District, Three Rivers (FGIC) (NATL) (SBG) | ||||||||||||||
| 1,000 | 5.000%, 12/15/2019 | 1,178,680 | ||||||||||||
Linn County Community School District #9, Lebanon, (Pre-refunded 06/15/2013) (FGIC) (SBG) | ||||||||||||||
| 1,000 | 5.550%, 06/15/2021 | 1,103,580 | ||||||||||||
Marion & Clackamas Counties School District #4J, Silver Falls (NATL) (SBG) | ||||||||||||||
| 1,305 | 4.500%, 06/15/2022 | 1,385,479 | ||||||||||||
McMinnville School District #40 (AGM) | ||||||||||||||
| 1,000 | 5.500%, 06/15/2013 | 1,101,770 | ||||||||||||
Metro National Areas | ||||||||||||||
| 1,000 | 5.250%, 09/01/2014 | 1,024,010 | ||||||||||||
| 1,635 | 5.000%, 06/01/2020 | 1,873,890 | ||||||||||||
Multnomah-Clackamas Counties School District #10JT, Gresham-Barlow (AGM) (SBG) | ||||||||||||||
| 1,000 | 5.250%, 06/15/2017 | 1,199,740 | ||||||||||||
Multnomah-Clackamas Counties School District #28JT, Zero Coupon Bond (AMBAC) (SBG) | ||||||||||||||
| 1,000 | 0.000%, 06/01/2016 | 820,160 | ||||||||||||
North Lincoln Fire & Rescue District #1 (AGM) | ||||||||||||||
| 125 | 4.250%, 02/01/2018 | 137,829 | ||||||||||||
Oregon Department of Administrative Services, Oregon Opportunity | ||||||||||||||
| 1,500 | 5.000%, 12/01/2020 | 1,782,855 | ||||||||||||
Oregon, Alternate Energy, Series B (AMT) | ||||||||||||||
| 540 | 5.000%, 01/01/2020 | 598,536 | ||||||||||||
| 535 | 5.000%, 01/01/2021 | 589,538 | ||||||||||||
| 100 | 5.000%, 01/01/2023 | 107,604 | ||||||||||||
| 76 | Nuveen Investments |
| Principal Amount (000) | Description p | Value | ||||||||||||
General Obligations (continued) | ||||||||||||||
Pacific City Joint Water Sanitation Authority | ||||||||||||||
| $ | 455 | 4.650%, 07/01/2022 | $ | 465,388 | ||||||||||
Puerto Rico Commonwealth, Government Development, Series B | ||||||||||||||
| 1,000 | 5.000%, 12/01/2014 | 1,062,900 | ||||||||||||
Puerto Rico Public Buildings Authority, Series J, Mandatory Put 07/01/2012 @ 100 (AMBAC) (COMGTY) | ||||||||||||||
| 1,000 | 5.000%, 07/01/2036 | 1,022,270 | ||||||||||||
Redmond, Terminal Expansion Project | ||||||||||||||
| 240 | 4.000%, 06/01/2021 | 247,531 | ||||||||||||
| 200 | 4.250%, 06/01/2023 | 203,368 | ||||||||||||
| 500 | 4.625%, 06/01/2029 | 496,980 | ||||||||||||
Salem-Keizer School District #24J (AGM) (SBG) | ||||||||||||||
| 1,150 | 5.000%, 06/15/2014 | 1,291,876 | ||||||||||||
Salem-Keizer School District #24J Series B, Deferred Interest (SBG) | ||||||||||||||
| 635 | 0.000%, 06/15/2022 | 403,860 | ||||||||||||
Sandy | ||||||||||||||
| 190 | 4.000%, 06/01/2015 | 204,894 | ||||||||||||
| 150 | 4.000%, 06/01/2016 | 160,522 | ||||||||||||
| 210 | 4.000%, 06/01/2017 | 222,802 | ||||||||||||
| 240 | 4.000%, 06/01/2018 | 252,168 | ||||||||||||
| 100 | 4.000%, 06/01/2019 | 104,254 | ||||||||||||
The Dalles | ||||||||||||||
| 130 | 4.000%, 06/01/2017 | 143,239 | ||||||||||||
| 140 | 4.000%, 06/01/2018 | 153,192 | ||||||||||||
| 75 | 4.000%, 06/01/2019 | 80,690 | ||||||||||||
Tualatin Hills Park & Recreation District (FGIC) (NATL) | ||||||||||||||
| 870 | 5.750%, 03/01/2013 | 950,101 | ||||||||||||
Umatilla County School District #16R, Pendleton (FGIC) (NATL) | ||||||||||||||
| 1,540 | 5.250%, 07/01/2014 | 1,712,126 | ||||||||||||
Wasco County School District #12 (AGM) (SBG) | ||||||||||||||
| 1,080 | 5.500%, 06/15/2014 | 1,230,790 | ||||||||||||
Washington & Clackamas Counties School District #23J, Tigard (FGIC) (NATL) | ||||||||||||||
| 1,000 | 5.500%, 06/01/2013 | 1,097,420 | ||||||||||||
Washington & Clackamas Counties School District #23J, Tigard | ||||||||||||||
| 1,030 | 0.000%, 06/15/2014 | 970,404 | ||||||||||||
Washington County | ||||||||||||||
| 1,525 | 5.000%, 06/01/2022 | 1,689,365 | ||||||||||||
Washington County School District #48J, Beaverton, Series A (AGM) | ||||||||||||||
| 1,600 | 5.000%, 06/01/2014 | 1,797,280 | ||||||||||||
| 1,500 | 5.000%, 06/01/2016 | 1,687,485 | ||||||||||||
Washington, Multnomah & Yamhill Counties School District #1J | ||||||||||||||
| 1,000 | 5.000%, 11/01/2014 | 1,136,730 | ||||||||||||
Washington, Multnomah & Yamhill Counties School District #1J, Hillsboro (NATL) | ||||||||||||||
| 2,490 | 5.000%, 06/15/2019 | 2,850,253 | ||||||||||||
West Vy Fire District | ||||||||||||||
| 120 | 2.000%, 02/01/2012 | 120,347 | ||||||||||||
| 120 | 3.000%, 02/01/2013 | 122,400 | ||||||||||||
| 125 | 3.000%, 02/01/2014 | 127,855 | ||||||||||||
| 125 | 3.000%, 02/01/2015 | 127,770 | ||||||||||||
| 130 | 3.500%, 02/01/2016 | 134,927 | ||||||||||||
| 135 | 4.000%, 02/01/2017 | 142,610 | ||||||||||||
| 140 | 4.000%, 02/01/2018 | 146,723 | ||||||||||||
| 145 | 4.000%, 02/01/2019 | 149,625 | ||||||||||||
Yamhill County School District #29J, Newberg (FGIC) (NATL) (SBG) | ||||||||||||||
| 1,260 | 5.250%, 06/15/2015 | 1,449,403 | ||||||||||||
| 1,835 | 5.250%, 06/15/2016 | 2,155,263 | ||||||||||||
| Nuveen Investments | 77 |
Portfolio of Investments
Nuveen Oregon Intermediate Municipal Bond Fund (continued)
May 31, 2011
| Principal Amount (000) | Description p | Value | ||||||||||||
General Obligations (continued) | ||||||||||||||
Yamhill County School District #40, McMinnville (AGM) (SBG) | ||||||||||||||
| $ | 1,005 | 5.000%, 06/15/2023 | $ | 1,103,148 | ||||||||||
| 63,560 | Total General Obligations | 68,179,457 | ||||||||||||
Health Care – 13.3% | ||||||||||||||
Clackamas County Hospital Facility Authority, Legacy Health System, Series A | ||||||||||||||
| 1,000 | 5.000%, 07/15/2021 | 1,050,940 | ||||||||||||
Clackamas County Hospital Facility Authority, Willamette Falls Hospital Project (RAAI) | ||||||||||||||
| 1,200 | 5.500%, 04/01/2022 | 1,203,636 | ||||||||||||
Deschutes County Facilities Authority, Cascade Healthcare Community | ||||||||||||||
| 1,500 | 7.375%, 01/01/2023 | 1,792,500 | ||||||||||||
Series B (AMBAC) | ||||||||||||||
| 250 | 5.000%, 01/01/2016 | 268,485 | ||||||||||||
Klamath Falls Community Hospital Authority, Merle West Medical Center Project (AGC) | ||||||||||||||
| 960 | 4.750%, 09/01/2020 | 982,992 | ||||||||||||
Medford Hospital Facilities Authority, Asante Health System (AGM) | ||||||||||||||
| 1,900 | 5.500%, 08/15/2028 | 2,035,128 | ||||||||||||
Multnomah County Hospital Facilities Authority, Adventist Health System/West, Series A | ||||||||||||||
| 440 | 4.500%, 09/01/2021 | 460,121 | ||||||||||||
| 1,875 | 5.000%, 09/01/2021 | 2,026,481 | ||||||||||||
Multnomah County Hospital Facilities Authority, Providence Health System | ||||||||||||||
| 1,000 | 5.250%, 10/01/2022 | 1,085,450 | ||||||||||||
Oregon Facilities Authority, Legacy Health System, Series A | ||||||||||||||
| 2,000 | 4.250%, 03/15/2017 | 2,128,580 | ||||||||||||
| 1,000 | 4.750%, 03/15/2024 | 1,006,360 | ||||||||||||
Oregon Facilities Authority, Peacehealth, Series A | ||||||||||||||
| 1,000 | 5.000%, 11/01/2020 | 1,113,910 | ||||||||||||
Oregon Facilities Authority, Samaritan Health Services, Series A | ||||||||||||||
| 1,250 | 5.000%, 10/01/2019 | 1,360,875 | ||||||||||||
| 500 | 5.000%, 10/01/2024 | 512,795 | ||||||||||||
Salem Hospital Facility Authority, Series A | ||||||||||||||
| 1,500 | 5.750%, 08/15/2023 | 1,631,400 | ||||||||||||
Umatilla County Hospital Facilities Authority, Catholic Health Initiatives, Series A | ||||||||||||||
| 690 | 5.000%, 03/01/2012 | 714,164 | ||||||||||||
| 18,065 | Total Health Care | 19,373,817 | ||||||||||||
Housing – 2.4% | ||||||||||||||
Oregon Housing & Community Services, Multifamily Housing, Series A (AMT) | ||||||||||||||
| 750 | 4.000%, 07/01/2019 | 740,295 | ||||||||||||
| 500 | 4.250%, 07/01/2021 | 491,530 | ||||||||||||
Oregon Housing & Community Services, Single Family Mortgage Program | ||||||||||||||
Series A | ||||||||||||||
| 235 | 4.050%, 01/01/2018 | 238,943 | ||||||||||||
Series D | ||||||||||||||
| 1,230 | 4.750%, 07/01/2022 | 1,268,155 | ||||||||||||
Portland Housing Authority, Yards Union Station Project (AMT) | ||||||||||||||
| 705 | 4.750%, 05/01/2022 | 710,034 | ||||||||||||
| 3,420 | Total Housing | 3,448,957 | ||||||||||||
Lease Revenue – 0.7% | ||||||||||||||
Puerto Rico Public Buildings Authority, Government Facilities | ||||||||||||||
Series M-2, Mandatory Put 07/01/2017 @ 100 (AMBAC) (COMGTY) | ||||||||||||||
| 1,000 | 5.500%, 07/01/2035 | 1,066,350 | ||||||||||||
Recreational Facility Authority – 0.7% | ||||||||||||||
Portland Urban Renewal & Redevelopment, Convention Center, Series A (AMBAC) | ||||||||||||||
| 1,000 | 5.750%, 06/15/2015 | 1,003,930 | ||||||||||||
| 78 | Nuveen Investments |
| Principal Amount (000) | Description p | Value | ||||||||||||
Tax Revenue – 6.7% | ||||||||||||||
Keizer Assessment, Keizer Station Area A Local Improvement District | ||||||||||||||
| $ | 905 | 5.200%, 06/01/2031 | $ | 922,539 | ||||||||||
Medford Urban Renewal Agency | ||||||||||||||
| 1,010 | 4.500%, 06/01/2013 | 1,063,833 | ||||||||||||
Portland Economic Development, Broadway Project, Series A | ||||||||||||||
| 880 | 5.125%, 04/01/2016 | 1,002,065 | ||||||||||||
| 1,355 | 6.250%, 04/01/2023 | 1,546,489 | ||||||||||||
Portland Urban Renewal & Redevelopment, North MacAdam, Series B | ||||||||||||||
| 2,655 | 5.000%, 06/15/2024 | 2,795,582 | ||||||||||||
Portland Urban Renewal & Redevelopment, South Park Blocks, Series B | ||||||||||||||
| 2,030 | 5.000%, 06/15/2021 | 2,186,939 | ||||||||||||
Seaside Urban Renewal Agency, Greater Seaside Urban Renewal | ||||||||||||||
| 280 | 4.750%, 06/01/2015 | 294,196 | ||||||||||||
| 9,115 | Total Tax Revenue | 9,811,643 | ||||||||||||
Transportation – 3.1% | ||||||||||||||
Oregon Department of Transportation, Highway User Tax | ||||||||||||||
Series A | ||||||||||||||
| 1,000 | 5.000%, 11/15/2021 | 1,154,060 | ||||||||||||
| 700 | 5.000%, 11/15/2024 | 738,787 | ||||||||||||
Oregon Department of Transportation, Highway User Tax, Series A, (Pre-refunded 11/15/2012) | ||||||||||||||
| 1,000 | 5.500%, 11/15/2016 | 1,074,860 | ||||||||||||
Portland International Airport (AMT) | ||||||||||||||
| 1,000 | 5.000%, 07/01/2017 | 1,113,080 | ||||||||||||
Portland International Airport, Series B | ||||||||||||||
| 250 | 5.000%, 07/01/2018 | 276,393 | ||||||||||||
Redmond Airport | ||||||||||||||
| 215 | 5.500%, 06/01/2024 | 217,356 | ||||||||||||
| 4,165 | Total Transportation | 4,574,536 | ||||||||||||
Utilities – 10.0% | ||||||||||||||
Lane County Metropolitan Wastewater Management | ||||||||||||||
| 1,500 | 5.000%, 11/01/2022 | 1,655,805 | ||||||||||||
Lane County Metropolitan Wastewater Management (FGIC) (NATL) | ||||||||||||||
| 820 | 5.000%, 11/01/2021 | 891,578 | ||||||||||||
Lebanon Wastewater Revenue (AGM) | ||||||||||||||
| 165 | 4.000%, 03/01/2017 | 182,327 | ||||||||||||
| 435 | 4.000%, 03/01/2018 | 478,778 | ||||||||||||
Portland Sewer System, First Lien, Series A | ||||||||||||||
| 1,000 | 4.750%, 06/15/2024 | 1,079,770 | ||||||||||||
Portland Sewer System, Second Lien, Series B (NATL) | ||||||||||||||
| 1,175 | 5.000%, 06/15/2023 | 1,273,371 | ||||||||||||
Portland Water System, Series A | ||||||||||||||
| 2,000 | 5.000%, 05/01/2015 | 2,302,520 | ||||||||||||
Portland Water System, Second Lien, Series A (NATL) | ||||||||||||||
| 500 | 4.375%, 10/01/2024 | 519,490 | ||||||||||||
Puerto Rico Commonwealth, Aqueduct & Sewer Authority, Series A (AGC) | ||||||||||||||
| 1,500 | 5.000%, 07/01/2025 | 1,539,060 | ||||||||||||
Puerto Rico Electric Power Authority, Series WW | ||||||||||||||
| 800 | 5.375%, 07/01/2023 | 827,800 | ||||||||||||
Redmond Water Revenue | ||||||||||||||
| 450 | 4.500%, 06/01/2025 | 478,584 | ||||||||||||
The Dalles Water Revenue (AMBAC) | ||||||||||||||
| 325 | 4.250%, 06/01/2020 | 349,466 | ||||||||||||
| Nuveen Investments | 79 |
Portfolio of Investments
Nuveen Oregon Intermediate Municipal Bond Fund (continued)
May 31, 2011
| Principal Amount (000) | Description p | Value | ||||||||||||
Utilities (continued) | ||||||||||||||
Washington County Clean Water Services (FGIC) (NATL) | ||||||||||||||
| $ | 1,790 | 5.125%, 10/01/2014 | $ | 1,815,149 | ||||||||||
Washington County Clean Water Services (NATL) | ||||||||||||||
| 1,000 | 5.000%, 10/01/2014 | 1,134,680 | ||||||||||||
| 13,460 | Total Utilities | 14,528,378 | ||||||||||||
| 135,450 | Total Municipal Bonds (cost $137,036,412) | 143,965,374 | ||||||||||||
| Shares | Description p | Value | ||||||||||||
Short-Term Investments – 0.2% | ||||||||||||||
Money Market Funds – 0.2% | ||||||||||||||
| 274,764 | First American Tax Free Obligations Fund, Class Z, 0.000% | $ | 274,764 | |||||||||||
Total Short-Term Investments (cost $274,764) | 274,764 | |||||||||||||
Total Investments – 98.9% (cost $137,311,176) | 144,240,138 | |||||||||||||
Other Assets Less Liabilities – 1.1% | 1,617,703 | |||||||||||||
Net Assets – 100.0% | $ | 145,857,841 | ||||||||||||
| p | All percentages shown in the Portfolio of Investments are based on net assets. |
| Convertible Capital Appreciation Bonds (Convertible CABs) initially pay no interest but accrete in value from the date of issuance through the conversion date, at which time the bonds start to accrue and pay interest on a semi-annual basis until final maturity. |
| The rate shown is the annualized seven-day effective yield as of May 31, 2011. |
| (ETM) | Escrowed to maturity. |
See accompanying notes to financial statements.
| 80 | Nuveen Investments |
Statement of Assets & Liabilities
May 31, 2011 (all dollars and shares are rounded to thousands (000), except for per share data)
| Colorado Tax Free | Minnesota Intermediate | Minnesota | Missouri Tax Free | Nebraska | Ohio Tax Free | Oregon Intermediate | ||||||||||||||||||||||
Assets | ||||||||||||||||||||||||||||
Investments, at value (cost $53,395, $223,951, $158,587, $156,541, $42,341, $49,097 and $137,311, respectively) | $ | 54,842 | $ | 234,312 | $ | 161,220 | $ | 157,947 | $ | 43,435 | $ | 50,127 | $ | 144,240 | ||||||||||||||
Receivables: | ||||||||||||||||||||||||||||
From Adviser | — | — | — | — | 3 | 1 | — | |||||||||||||||||||||
Interest | 806 | 2,921 | 2,026 | 2,108 | 627 | 830 | 2,044 | |||||||||||||||||||||
Investments sold | — | — | — | — | 1,096 | — | — | |||||||||||||||||||||
Shares sold | 22 | 137 | 211 | 216 | 1 | 2 | 8 | |||||||||||||||||||||
Other assets | 8 | 7 | 9 | 8 | 9 | 7 | 7 | |||||||||||||||||||||
Total assets | 55,678 | 237,377 | 163,466 | 160,279 | 45,171 | 50,967 | 146,299 | |||||||||||||||||||||
Liabilities | ||||||||||||||||||||||||||||
Payables: | ||||||||||||||||||||||||||||
Dividends | 153 | 572 | 280 | 494 | 107 | 158 | 323 | |||||||||||||||||||||
Investments purchased | — | 613 | 3,627 | 195 | 1,815 | 259 | — | |||||||||||||||||||||
Shares redeemed | 20 | 448 | 286 | 230 | 111 | 9 | 2 | |||||||||||||||||||||
Accrued expenses: | ||||||||||||||||||||||||||||
Management fees | 1 | 92 | 52 | 65 | — | — | 54 | |||||||||||||||||||||
12b-1 distribution and service fees | 3 | 9 | 27 | 5 | 4 | 1 | 6 | |||||||||||||||||||||
Other | 47 | 87 | 87 | 68 | 43 | 48 | 56 | |||||||||||||||||||||
Total liablities | 224 | 1,821 | 4,359 | 1,057 | 2,080 | 475 | 441 | |||||||||||||||||||||
Net assets | $ | 55,454 | $ | 235,556 | $ | 159,107 | $ | 159,222 | $ | 43,091 | $ | 50,492 | $ | 145,858 | ||||||||||||||
Class A Shares | ||||||||||||||||||||||||||||
Net assets | $ | 10,812 | $ | 37,175 | $ | 85,183 | $ | 22,951 | $ | 7,099 | $ | 1,642 | $ | 31,399 | ||||||||||||||
Shares outstanding | 1,076 | 3,646 | 7,864 | 1,958 | 691 | 159 | 3,087 | |||||||||||||||||||||
Net asset value per share | $ | 10.04 | $ | 10.20 | $ | 10.83 | $ | 11.72 | $ | 10.28 | $ | 10.33 | $ | 10.17 | ||||||||||||||
Offering price per share (net asset value per share plus maximum sales charge of 4.20%, 3.00%, 4.20%, 4.20%, 4.20%, 4.20% and 3.00%, respectively, of offering price) | $ | 10.48 | $ | 10.52 | $ | 11.30 | $ | 12.23 | $ | 10.73 | $ | 10.78 | $ | 10.48 | ||||||||||||||
Class C Shares | ||||||||||||||||||||||||||||
Net assets | N/A | $ | 623 | $ | 618 | N/A | $ | 321 | N/A | $ | 632 | |||||||||||||||||
Shares outstanding | N/A | 61 | 57 | N/A | 31 | N/A | 62 | |||||||||||||||||||||
Net asset value and offering price per share | N/A | $ | 10.14 | $ | 10.82 | N/A | $ | 10.28 | N/A | $ | 10.15 | |||||||||||||||||
Class C1 Shares(1) | ||||||||||||||||||||||||||||
Net assets | $ | 2,481 | $ | 6,242 | $ | 22,190 | $ | 1,661 | $ | 4,201 | $ | 1,681 | N/A | |||||||||||||||
Shares outstanding | 248 | 611 | 2,058 | 142 | 412 | 165 | N/A | |||||||||||||||||||||
Net asset value and offering price per share | $ | 10.01 | $ | 10.22 | $ | 10.78 | $ | 11.69 | $ | 10.19 | $ | 10.18 | N/A | |||||||||||||||
Class I Shares(1) | ||||||||||||||||||||||||||||
Net assets | $ | 42,161 | $ | 191,516 | $ | 51,116 | $ | 134,610 | $ | 31,470 | $ | 47,169 | $ | 113,827 | ||||||||||||||
Shares outstanding | 4,188 | 18,903 | 4,726 | 11,484 | 3,064 | 4,570 | 11,195 | |||||||||||||||||||||
Net asset value and offering price per share | $ | 10.07 | $ | 10.13 | $ | 10.82 | $ | 11.72 | $ | 10.27 | $ | 10.32 | $ | 10.17 | ||||||||||||||
Net assets consist of: | ||||||||||||||||||||||||||||
Capital paid-in | $ | 53,892 | $ | 224,853 | $ | 156,840 | $ | 157,425 | $ | 42,605 | $ | 50,413 | $ | 139,108 | ||||||||||||||
Undistributed (Over-distribution of) net investment income | 66 | 250 | 585 | 201 | (1 | ) | 50 | 131 | ||||||||||||||||||||
Accumulated net realized gain (loss) | 49 | 92 | (951 | ) | 190 | (607 | ) | (1,001 | ) | (310 | ) | |||||||||||||||||
Net unrealized appreciation (depreciation) | 1,447 | 10,361 | 2,633 | 1,406 | 1,094 | 1,030 | 6,929 | |||||||||||||||||||||
Net assets | $ | 55,454 | $ | 235,556 | $ | 159,107 | $ | 159,222 | 43,091 | $ | 50,492 | $ | 145,858 | |||||||||||||||
Authorized shares | 2 billion | 2 billion | 2 billion | 2 billion | 2 billion | 2 billion | 2 billion | |||||||||||||||||||||
Par value per share | $ | 0.0001 | $ | 0.0001 | $ | 0.0001 | $ | 0.0001 | $ | 0.0001 | $ | 0.0001 | $ | 0.0001 | ||||||||||||||
| N/A | – Colorado Tax Free, Missouri Tax Free and Ohio Tax Free do not offer Class C Shares. Oregon Intermediate does not offer Class C1 Shares. |
| (1) | – Effective January 18, 2011, Class C Shares and Class Y Shares previously offered by FAF Advisors, Inc. were renamed Class C1 Shares and Class I Shares, respectively. |
See accompanying notes to financial statements.
| Nuveen Investments | 81 |
(all dollars are rounded to thousands (000))
| Colorado Tax Free | Minnesota Intermediate | |||||||||||||||
| Eleven Months Ended 5/31/11 | Year Ended 6/30/10 | Eleven Months Ended 5/31/11 | Year Ended 6/30/10 | |||||||||||||
Investment Income | ||||||||||||||||
Interest and dividends from non-affiliated investments | $ | 2,833 | $ | 3,218 | $ | 9,437 | $ | 9,413 | ||||||||
Interest and dividends from affiliated investments | — | — | — | — | ||||||||||||
Total investment Income | 2,833 | 3,218 | 9,437 | 9,413 | ||||||||||||
Expenses | ||||||||||||||||
Management fees | 321 | 323 | 1,129 | 1,079 | ||||||||||||
12b-1 service fees – Class A | 24 | 28 | 71 | 71 | ||||||||||||
12b-1 distribution and service fees – Class C | N/A | N/A | 1 | — | ||||||||||||
12b-1 distribution and service fees – Class C1(1) | 17 | 20 | 35 | 8 | ||||||||||||
Adminstration fees | 81 | 151 | 293 | 493 | ||||||||||||
Shareholders’ servicing agent fees and expenses | 48 | 80 | 62 | 75 | ||||||||||||
Custodian’s fees and expenses | 5 | 3 | 15 | 11 | ||||||||||||
Directors’ fees and expenses | 16 | 31 | 18 | 31 | ||||||||||||
Professional fees | 33 | 51 | 33 | 50 | ||||||||||||
Shareholders’ reports – printing and mailing expenses | 11 | 5 | 32 | 9 | ||||||||||||
Federal and state registration fees | 4 | 6 | 8 | 12 | ||||||||||||
Other expenses | 13 | 20 | 16 | 22 | ||||||||||||
Total expenses before expense reimbursement | 573 | 718 | 1,713 | 1,861 | ||||||||||||
Expense reimbursement | (249 | ) | (347 | ) | (192 | ) | (327 | ) | ||||||||
Net expenses | 324 | 371 | 1,521 | 1,534 | ||||||||||||
Net investment income (loss) | 2,509 | 2,847 | 7,916 | 7,879 | ||||||||||||
Realized and Unrealized Gain (Loss) | ||||||||||||||||
Net realized gain (loss) from: | ||||||||||||||||
Investments | 214 | 1,080 | 91 | 42 | ||||||||||||
Futures | — | — | — | — | ||||||||||||
Change in net unrealized appreciation (depreciation) of investments | (442 | ) | 2,902 | 888 | 9,395 | |||||||||||
Net realized and unrealized gain (loss) | (228 | ) | 3,982 | 979 | 9,437 | |||||||||||
Net increase (decrease) in net assets from operations | $ | 2,281 | $ | 6,829 | $ | 8,895 | $ | 17,316 | ||||||||
| N/A – | Colorado Tax Free, Missouri Tax Free and previously offered by FAF Advisors, Inc. Ohio Tax Free do not offer Class C Shares. Oregon Intermediate does not offer Class C1 Shares. |
| (1) | – Effective January 18, 2011, Class C Shares were renamed Class C1 Shares. |
See accompanying notes to financial statements.
| 82 | Nuveen Investments |
| Minnesota | Missouri Tax Free | |||||||||||||||
| Eleven Months Ended 5/31/11 | Year Ended 6/30/10 | Eleven Months Ended 5/31/11 | Year Ended 6/30/10 | |||||||||||||
Investment Income | ||||||||||||||||
Interest and dividends from non-affiliated investments | $ | 7,252 | $ | 7,729 | $ | 7,366 | $ | 7,512 | ||||||||
Interest and dividends from affiliated investments | — | 1 | 1 | 1 | ||||||||||||
Total investment Income | 7,252 | 7,730 | 7,367 | 7,513 | ||||||||||||
Expenses | ||||||||||||||||
Management fees | 789 | 822 | 838 | 753 | ||||||||||||
12b-1 service fees – Class A | 185 | 228 | 51 | 57 | ||||||||||||
12b-1 distribution and service fees – Class C | 1 | — | N/A | N/A | ||||||||||||
12b-1 distribution and service fees – Class C1(1) | 153 | 158 | 11 | 7 | ||||||||||||
Administration fees | 211 | 377 | 203 | 346 | ||||||||||||
Shareholders’ servicing agent fees and expenses | 66 | 82 | 56 | 82 | ||||||||||||
Custodian’s fees and expenses | 10 | 8 | 10 | 8 | ||||||||||||
Directors’ fees and expenses | 17 | 31 | 17 | 31 | ||||||||||||
Professional fees | 33 | 51 | 33 | 51 | ||||||||||||
Shareholders’ reports – printing and mailing expenses | 42 | 8 | 22 | 7 | ||||||||||||
Federal and state registration fees | 10 | 13 | 7 | 9 | ||||||||||||
Other expenses | 15 | 21 | 13 | 21 | ||||||||||||
Total expenses before expense reimbursement | 1,532 | 1,799 | 1,261 | 1,372 | ||||||||||||
Expense reimbursement | (204 | ) | (355 | ) | (179 | ) | (281 | ) | ||||||||
Net expenses | 1,328 | 1,444 | 1,082 | 1,091 | ||||||||||||
Net investment income (loss) | 5,924 | 6,286 | 6,285 | 6,422 | ||||||||||||
Realized and Unrealized Gain (Loss) | ||||||||||||||||
Net realized gain (loss) from: | ||||||||||||||||
Investments | (721 | ) | 1,108 | 317 | 835 | |||||||||||
Futures | — | — | — | — | ||||||||||||
Change in net unrealized appreciation (depreciation) of investments | (727 | ) | 12,393 | (46 | ) | 7,851 | ||||||||||
Net realized and unrealized gain (loss) | (1,448 | ) | 13,501 | 271 | 8,686 | |||||||||||
Net increase (decrease) in net assets from operations | $ | 4,476 | $ | 19,787 | $ | 6,556 | $ | 15,108 | ||||||||
| N/A – | Colorado Tax Free, Missouri Tax Free and Ohio Tax Free do not offer Class C Shares. Oregon Intermediate does not offer Class C1 Shares. |
| (1) | – Effective January 18, 2011, Class C Shares previously offered by FAF Advisors, Inc. were renamed Class C1 Shares. |
See accompanying notes to financial statements.
| Nuveen Investments | 83 |
Statement of Operations (continued)
(all dollars are rounded to thousands (000))
| Nebraska | Ohio Tax Free | |||||||||||||||
| Eleven Months Ended 5/31/11 | Year Ended 6/30/10 | Eleven Months Ended 5/31/11 | Year Ended 6/30/10 | |||||||||||||
Investment Income | ||||||||||||||||
Interest and dividends from non-affiliated investments | $ | 1,883 | $ | 1,984 | $ | 2,502 | $ | 2,474 | ||||||||
Interest and dividends from affiliated investments | — | — | — | — | ||||||||||||
Total investment Income | 1,883 | 1,984 | 2,502 | 2,474 | ||||||||||||
Expenses | ||||||||||||||||
Management fees | 203 | 208 | 304 | 277 | ||||||||||||
12b-1 service fees – Class A | 14 | 16 | 4 | 4 | ||||||||||||
12b-1 distribution and service fees – Class C | 1 | — | N/A | N/A | ||||||||||||
12b-1 distribution and service fees – Class C1(1) | 26 | 23 | 9 | 5 | ||||||||||||
Administration fees | 55 | 100 | 82 | 131 | ||||||||||||
Shareholders’ servicing agent fees and expenses | 48 | 80 | 50 | 80 | ||||||||||||
Custodian’s fees and expenses | 4 | 2 | 5 | 3 | ||||||||||||
Directors’ fees and expenses | 16 | 31 | 16 | 31 | ||||||||||||
Professional fees | 33 | 50 | 33 | 51 | ||||||||||||
Shareholders’ reports – printing and mailing expenses | 10 | 3 | 11 | 3 | ||||||||||||
Federal and state registration fees | 7 | 9 | 4 | 6 | ||||||||||||
Other expenses | 14 | 21 | 14 | 21 | ||||||||||||
Total expenses before expense reimbursement | 431 | 543 | 532 | 612 | ||||||||||||
Expense reimbursement | (196 | ) | (298 | ) | (248 | ) | (328 | ) | ||||||||
Net expenses | 235 | 245 | 284 | 284 | ||||||||||||
Net investment income (loss) | 1,648 | 1,739 | 2,218 | 2,190 | ||||||||||||
Realized and Unrealized Gain (Loss) | ||||||||||||||||
Net realized gain (loss) from: | ||||||||||||||||
Investments | 31 | (19 | ) | (448 | ) | 19 | ||||||||||
Futures | — | — | — | — | ||||||||||||
Change in net unrealized appreciation (depreciation) of investments | (323 | ) | 2,000 | (779 | ) | 2,508 | ||||||||||
Net realized and unrealized gain (loss) | (292 | ) | 1,981 | (1,227 | ) | 2,527 | ||||||||||
Net increase (decrease) in net assets from operations | $ | 1,356 | $ | 3,720 | $ | 991 | $ | 4,717 | ||||||||
| N/A – | Colorado Tax Free, Missouri Tax Free and Ohio Tax Free do not offer Class C Shares. Oregon Intermediate does not offer Class C1 Shares. |
| (1) | – Effective January 18, 2011, Class C Shares previously offered by FAF Advisors, Inc. were renamed Class C1 Shares. |
See accompanying notes to financial statements.
| 84 | Nuveen Investments |
| Oregon Intermediate | ||||||||
| Eleven Months Ended 5/31/11 | Year Ended 6/30/10 | |||||||
Investment Income | ||||||||
Interest and dividends from non-affiliated investments | $ | 5,824 | $ | 6,369 | ||||
Interest and dividends from affiliated investments | 1 | 2 | ||||||
Total investment Income | 5,825 | 6,371 | ||||||
Expenses | ||||||||
Management fees | 756 | 755 | ||||||
12b-1 service fees – Class A | 70 | 54 | ||||||
12b-1 distribution and service fees – Class C | 1 | — | ||||||
12b-1 distribution and service fees – Class C1(1) | N/A | N/A | ||||||
Administration fees | 202 | 346 | ||||||
Shareholders’ servicing agent fees and expenses | 40 | 60 | ||||||
Custodian’s fees and expenses | 10 | 8 | ||||||
Directors’ fees and expenses | 17 | 30 | ||||||
Professional fees | 33 | 50 | ||||||
Shareholders’ reports – printing and mailing expenses | 16 | 6 | ||||||
Federal and state registration fees | 6 | 6 | ||||||
Other expenses | 14 | 21 | ||||||
Total expenses before expense reimbursement | 1,165 | 1,336 | ||||||
Expense reimbursement | (146 | ) | (252 | ) | ||||
Net expenses | 1,019 | 1,084 | ||||||
Net investment income (loss) | 4,806 | 5,287 | ||||||
Realized and Unrealized Gain (Loss) | ||||||||
Net realized gain (loss) from: | ||||||||
Investments | 192 | 528 | ||||||
Futures | — | (111 | ) | |||||
Change in net unrealized appreciation (depreciation) of investments | 259 | 4,379 | ||||||
Net realized and unrealized gain (loss) | 451 | 4,796 | ||||||
Net increase (decrease) in net assets from operations | $ | 5,257 | $ | 10,083 | ||||
| N/A – | Colorado Tax Free, Missouri Tax Free and Ohio Tax Free do not offer Class C Shares. Oregon Intermediate does not offer Class C1 Shares. |
| (1) | – Effective January 18, 2011, Class C Shares previously offered by FAF Advisors, Inc. were renamed Class C1 Shares. |
See accompanying notes to financial statements.
| Nuveen Investments | 85 |
Statement of Changes in Net Assets (all dollars are rounded to thousands (000))
| Colorado Tax Free | Minnesota Intermediate | |||||||||||||||||||||||
| Eleven Months Ended 5/31/11 | Year Ended 6/30/10 | Year Ended 6/30/09 | Eleven Months Ended 5/31/11 | Year Ended 6/30/10 | Year Ended 6/30/09 | |||||||||||||||||||
Operations | ||||||||||||||||||||||||
Net investment income (loss) | $ | 2,509 | $ | 2,847 | $ | 2,049 | $ | 7,916 | $ | 7,879 | $ | 7,724 | ||||||||||||
Net realized gain (loss) from: | ||||||||||||||||||||||||
Investments | 214 | 1,080 | 145 | 91 | 42 | 277 | ||||||||||||||||||
Futures | — | — | — | — | — | — | ||||||||||||||||||
Change in net unrealized appreciation (depreciation) of: | ||||||||||||||||||||||||
Investments | (442 | ) | 2,902 | (872 | ) | 888 | 9,395 | (1,942 | ) | |||||||||||||||
Futures | — | — | — | — | — | — | ||||||||||||||||||
Net increase (decrease) in net assets resulting from operations | 2,281 | 6,829 | 1,322 | 8,895 | 17,316 | 6,059 | ||||||||||||||||||
Distributions to Shareholders | ||||||||||||||||||||||||
From net investment income: | ||||||||||||||||||||||||
Class A | (425 | ) | (470 | ) | (367 | ) | (1,184 | ) | (1,021 | ) | (936 | ) | ||||||||||||
Class C | N/A | N/A | N/A | (3 | ) | — | — | |||||||||||||||||
Class C1(1) | (95 | ) | (118 | ) | (123 | ) | (156 | ) | (38 | ) | — | |||||||||||||
Class I(1) | (1,897 | ) | (2,237 | ) | (1,611 | ) | (6,253 | ) | (6,807 | ) | (6,863 | ) | ||||||||||||
From accumulated net realized gains: | ||||||||||||||||||||||||
Class A | (99 | ) | (101 | ) | (46 | ) | — | (14 | ) | (67 | ) | |||||||||||||
Class C | N/A | N/A | N/A | — | — | — | ||||||||||||||||||
Class C1(1) | (24 | ) | (27 | ) | (24 | ) | — | — | — | |||||||||||||||
Class I(1) | (432 | ) | (455 | ) | (132 | ) | — | (90 | ) | (447 | ) | |||||||||||||
Decrease in net assets from distributions to shareholders | (2,972 | ) | (3,408 | ) | (2,303 | ) | (7,596 | ) | (7,970 | ) | (8,313 | ) | ||||||||||||
Fund Share Transactions | ||||||||||||||||||||||||
Proceeds from sale of shares | 14,622 | 11,522 | 51,410 | 52,793 | 63,339 | 49,457 | ||||||||||||||||||
Proceeds from shares issued to shareholders due to reinvestment of distributions | 693 | 742 | 528 | 1,207 | 963 | 966 | ||||||||||||||||||
| 15,315 | 12,264 | 51,938 | 54,000 | 64,302 | 50,423 | |||||||||||||||||||
Cost of shares redeemed | (22,397 | ) | (17,958 | ) | (10,020 | ) | (52,108 | ) | (36,742 | ) | (50,450 | ) | ||||||||||||
Net increase (decrease) in net assets from Fund share transactions | (7,082 | ) | (5,694 | ) | 41,918 | 1,892 | 27,560 | (27 | ) | |||||||||||||||
Net increase (decrease) in net assets | (7,773 | ) | (2,273 | ) | 40,937 | 3,191 | 36,906 | (2,281 | ) | |||||||||||||||
Net assets at the beginning of period | 63,227 | 65,500 | 24,563 | 232,365 | 195,459 | 197,740 | ||||||||||||||||||
Net assets at the end of period | $ | 55,454 | $ | 63,227 | $ | 65,500 | $ | 235,556 | $ | 232,365 | $ | 195,459 | ||||||||||||
Undistributed (Over-distribution of) net investment income at end of period | $ | 66 | $ | (26 | ) | $ | (48 | ) | $ | 250 | $ | (69 | ) | $ | (82 | ) | ||||||||
| N/A – | Colorado Tax Free, Missouri Tax Free and Ohio Tax Free do not offer Class C Shares. Oregon Intermediate does not offer Class C1 Shares. |
| (1) | – Effective January 18, 2011, Class C Shares and Class Y Shares previously offered by FAF Advisors, Inc. were renamed ClassC1 Shares and Class I Shares, respectively. |
See accompanying notes to financial statements.
| 86 | Nuveen Investments |
| Minnesota | Missouri Tax Free | |||||||||||||||||||||||
| Eleven Months Ended 5/31/11 | Year Ended 6/30/10 | Year Ended 6/30/09 | Eleven Months Ended 5/31/11 | Year Ended 6/30/10 | Year Ended 6/30/09 | |||||||||||||||||||
Operations | ||||||||||||||||||||||||
Net investment income (loss) | $ | 5,924 | $ | 6,286 | $ | 6,466 | $ | 6,285 | $ | 6,422 | $ | 6,579 | ||||||||||||
Net realized gain (loss) from: | ||||||||||||||||||||||||
Investments | (721 | ) | 1,108 | (810 | ) | 317 | 835 | 685 | ||||||||||||||||
Futures | — | — | (154 | ) | — | — | — | |||||||||||||||||
Change in net unrealized appreciation (depreciation) of: | ||||||||||||||||||||||||
Investments | (727 | ) | 12,393 | (6,522 | ) | (46 | ) | 7,851 | (4,614 | ) | ||||||||||||||
Futures | — | — | — | — | — | — | ||||||||||||||||||
Net increase (decrease) in net assets resulting from operations | 4,476 | 19,787 | (1,020 | ) | 6,556 | 15,108 | 2,650 | |||||||||||||||||
Distributions to Shareholders | ||||||||||||||||||||||||
From net investment income: | ||||||||||||||||||||||||
Class A | (2,870 | ) | (3,519 | ) | (3,870 | ) | (868 | ) | (951 | ) | (955 | ) | ||||||||||||
Class C | (3 | ) | — | — | N/A | N/A | N/A | |||||||||||||||||
Class C1(1) | (719 | ) | (818 | ) | (735 | ) | (56 | ) | (42 | ) | (21 | ) | ||||||||||||
Class I(1) | (1,771 | ) | (1,956 | ) | (1,856 | ) | (5,095 | ) | (5,466 | ) | (5,710 | ) | ||||||||||||
From accumulated net realized gains: | ||||||||||||||||||||||||
Class A | — | (6 | ) | (519 | ) | (40 | ) | (168 | ) | (51 | ) | |||||||||||||
Class C | — | — | — | N/A | N/A | N/A | ||||||||||||||||||
Class C1(1) | — | (1 | ) | (109 | ) | (3 | ) | (8 | ) | (1 | ) | |||||||||||||
Class I(1) | — | (3 | ) | (234 | ) | (221 | ) | (918 | ) | (283 | ) | |||||||||||||
Decrease in net assets from distributions to shareholders | (5,363 | ) | (6,303 | ) | (7,323 | ) | (6,283 | ) | (7,553 | ) | (7,021 | ) | ||||||||||||
Fund Share Transactions | ||||||||||||||||||||||||
Proceeds from sale of shares | 22,308 | 35,124 | 33,280 | 28,087 | 46,372 | 32,119 | ||||||||||||||||||
Proceeds from shares issued to shareholders due to reinvestment of distributions | 2,399 | 2,893 | 3,456 | 705 | 942 | 724 | ||||||||||||||||||
| 24,707 | 38,017 | 36,736 | 28,792 | 47,314 | 32,843 | |||||||||||||||||||
Cost of shares redeemed | (36,046 | ) | (29,968 | ) | (45,736 | ) | (32,375 | ) | (35,382 | ) | (46,714 | ) | ||||||||||||
Net increase (decrease) in net assets from Fund share transactions | (11,339 | ) | 8,049 | (9,000 | ) | (3,583 | ) | 11,932 | (13,871 | ) | ||||||||||||||
Net increase (decrease) in net assets | (12,226 | ) | 21,533 | (17,343 | ) | (3,310 | ) | 19,487 | (18,242 | ) | ||||||||||||||
Net assets at the beginning of period | 171,333 | 149,800 | 167,143 | 162,532 | 143,045 | 161,287 | ||||||||||||||||||
Net assets at the end of period | $ | 159,107 | $ | 171,333 | $ | 149,800 | $ | 159,222 | $ | 162,532 | $ | 143,045 | ||||||||||||
Undistributed (Over-distribution of) net investment income at end of period | $ | 585 | $ | 24 | $ | 31 | $ | 201 | $ | (65 | ) | $ | (28 | ) | ||||||||||
| N/A – | Colorado Tax Free, Missouri Tax Free and Ohio Tax Free do not offer Class C Shares. Oregon Intermediate does not offer Class C1 Shares. |
| (1) | – Effective January 18, 2011, Class C Shares and Class Y Shares previously offered by FAF Advisors, Inc. were renamed Class C1 Shares and Class I Shares, respectively. |
See accompanying notes to financial statements.
| Nuveen Investments | 87 |
Statement of Changes in Net Assets (continued) (all dollars are rounded to thousands (000))
| Nebraska | Ohio Tax Free | |||||||||||||||||||||||
| Eleven Months Ended 5/31/11 | Year Ended 6/30/10 | Year Ended 6/30/09 | Eleven Months Ended 5/31/11 | Year Ended 6/30/10 | Year Ended 6/30/09 | |||||||||||||||||||
Operations | ||||||||||||||||||||||||
Net investment income (loss) | $ | 1,648 | $ | 1,739 | $ | 1,719 | $ | 2,218 | $ | 2,190 | $ | 2,020 | ||||||||||||
Net realized gain (loss) from: | ||||||||||||||||||||||||
Investments | 31 | (19 | ) | (202 | ) | (448 | ) | 19 | (353 | ) | ||||||||||||||
Futures | — | — | (245 | ) | — | — | (195 | ) | ||||||||||||||||
Change in net unrealized appreciation (depreciation) of: | ||||||||||||||||||||||||
Investments | (323 | ) | 2,000 | (344 | ) | (779 | ) | 2,508 | (255 | ) | ||||||||||||||
Futures | — | — | — | — | — | 2 | ||||||||||||||||||
Net increase (decrease) in net assets resulting from operations | 1,356 | 3,720 | 928 | 991 | 4,717 | 1,219 | ||||||||||||||||||
Distributions to Shareholders | ||||||||||||||||||||||||
From net investment income: | ||||||||||||||||||||||||
Class A | (257 | ) | (244 | ) | (253 | ) | (66 | ) | (53 | ) | (31 | ) | ||||||||||||
Class C | (2 | ) | — | — | N/A | N/A | N/A | |||||||||||||||||
Class C1(1) | (150 | ) | (123 | ) | (90 | ) | (50 | ) | (23 | ) | (10 | ) | ||||||||||||
Class I(1) | (1,262 | ) | (1,333 | ) | (1,415 | ) | (2,086 | ) | (2,063 | ) | (2,005 | ) | ||||||||||||
From accumulated net realized gains: | ||||||||||||||||||||||||
Class A | — | — | — | — | — | — | ||||||||||||||||||
Class C | — | — | — | N/A | N/A | N/A | ||||||||||||||||||
Class C1(1) | — | — | — | — | — | — | ||||||||||||||||||
Class I(1) | — | — | — | — | — | — | ||||||||||||||||||
Decrease in net assets from distributions to shareholders | (1,671 | ) | (1,700 | ) | (1,758 | ) | (2,202 | ) | (2,139 | ) | (2,046 | ) | ||||||||||||
Fund Share Transactions | ||||||||||||||||||||||||
Proceeds from sale of shares | 6,584 | 7,353 | 9,170 | 9,606 | 20,563 | 6,775 | ||||||||||||||||||
Proceeds from shares issued to shareholders due to reinvestment of distributions | 435 | 362 | 304 | 174 | 247 | 323 | ||||||||||||||||||
| 7,019 | 7,715 | 9,474 | 9,780 | 20,810 | 7,098 | |||||||||||||||||||
Cost of shares redeemed | (5,884 | ) | (6,585 | ) | (6,543 | ) | (20,851 | ) | (6,844 | ) | (9,441 | ) | ||||||||||||
Net increase (decrease) in net assets from Fund share transactions | 1,135 | 1,130 | 2,931 | (11,071 | ) | 13,966 | (2,343 | ) | ||||||||||||||||
Net increase (decrease) in net assets | 820 | 3,150 | 2,101 | (12,282 | ) | 16,544 | (3,170 | ) | ||||||||||||||||
Net assets at the beginning of period | 42,271 | 39,121 | 37,020 | 62,774 | 46,230 | 49,400 | ||||||||||||||||||
Net assets at the end of period | $ | 43,091 | $ | 42,271 | $ | 39,121 | $ | 50,492 | $ | 62,774 | $ | 46,230 | ||||||||||||
Undistributed (Over-distribution of) net investment income at end of period | $ | (1 | ) | $ | 22 | $ | (17 | ) | $ | 50 | $ | 34 | $ | (17 | ) | |||||||||
| N/A – | Colorado Tax Free, Missouri Tax Free and Ohio Tax Free do not offer Class C Shares. Oregon Intermediate does not offer Class C1 Shares. |
| (1) | – Effective January 18, 2011, Class C Shares and Class Y Shares previously offered by FAF Advisors, Inc. were renamed Class C1 Shares and Class I Shares, respectively. |
See accompanying notes to financial statements.
| 88 | Nuveen Investments |
| Oregon Intermediate | ||||||||||||
| Eleven Months Ended 5/31/11 | Year Ended 6/30/10 | Year Ended 6/30/09 | ||||||||||
Operations | ||||||||||||
Net investment income (loss) | $ | 4,806 | $ | 5,287 | $ | 4,843 | ||||||
Net realized gain (loss) from: | ||||||||||||
Investments | 192 | 528 | (498 | ) | ||||||||
Futures | — | (111 | ) | (324 | ) | |||||||
Change in net unrealized appreciation (depreciation) of: | ||||||||||||
Investments | 259 | 4,379 | 1,808 | |||||||||
Futures | — | — | 3 | |||||||||
Net increase (decrease) in net assets resulting from operations | 5,257 | 10,083 | 5,832 | |||||||||
Distributions to Shareholders | ||||||||||||
From net investment income: | ||||||||||||
Class A | (940 | ) | (719 | ) | (256 | ) | ||||||
Class C | (4 | ) | — | — | ||||||||
Class C1(1) | N/A | N/A | N/A | |||||||||
Class I(1) | (3,702 | ) | (4,596 | ) | (4,645 | ) | ||||||
From accumulated net realized gains: | ||||||||||||
Class A | — | — | — | |||||||||
Class C | — | — | — | |||||||||
Class C1(1) | N/A | N/A | N/A | |||||||||
Class I(1) | — | — | — | |||||||||
Decrease in net assets from distributions to shareholders | (4,646 | ) | (5,315 | ) | (4,901 | ) | ||||||
Fund Share Transactions | ||||||||||||
Proceeds from sale of shares | 33,676 | 66,046 | 31,459 | |||||||||
Proceeds from shares issued to shareholders due to reinvestment of distributions | 871 | 645 | 228 | |||||||||
| 34,547 | 66,691 | 31,687 | ||||||||||
Cost of shares redeemed | (54,159 | ) | (37,522 | ) | (28,463 | ) | ||||||
Net increase (decrease) in net assets from Fund share transactions | (19,612 | ) | 29,169 | 3,224 | ||||||||
Net increase (decrease) in net assets | (19,001 | ) | 33,937 | 4,155 | ||||||||
Net assets at the beginning of period | 164,859 | 130,922 | 126,767 | |||||||||
Net assets at the end of period | $ | 145,858 | $ | 164,859 | $ | 130,922 | ||||||
Undistributed (Over-distribution of) net investment income at end of period | $ | 131 | $ | (29 | ) | $ | (1 | ) | ||||
| N/A – | Colorado Tax Free, Missouri Tax Free and Ohio Tax Free do not offer Class C Shares. Oregon Intermediate does not offer Class C1 Shares. |
| (1) | – Effective January 18, 2011, Class C Shares and Class Y Shares previously offered by FAF Advisors, Inc. were renamed Class C1 and Class I Shares, respectively. |
See accompanying notes to financial statements.
| Nuveen Investments | 89 |
| Selected data for a share outstanding throughout each period: | ||||||||||||||||||||||||||||||||||||
| Class (Commencement Date) | ||||||||||||||||||||||||||||||||||||
| Investment Operations | Less Distributions | |||||||||||||||||||||||||||||||||||
| COLORADO TAX FREE | ||||||||||||||||||||||||||||||||||||
| Beginning Net Asset Value | Net Invest- ment Income (Loss)(a) | Net Realized/ Unrealized Gain (Loss) | Total | Net Invest- ment Income | Capital Gains(b) | Total | Ending Net Asset Value | Total Return(c) | ||||||||||||||||||||||||||||
Class A (2/00) | ||||||||||||||||||||||||||||||||||||
Year Ended 5/31 | ||||||||||||||||||||||||||||||||||||
2011(e) | $ | 10.12 | $ | .39 | $ | — | $ | .39 | $ | (.38 | ) | $ | (.09 | ) | $ | (.47 | ) | $ | 10.04 | 3.93 | % | |||||||||||||||
Year Ended 6/30 | ||||||||||||||||||||||||||||||||||||
2010 | 9.60 | .43 | .60 | 1.03 | (.42 | ) | (.09 | ) | (.51 | ) | 10.12 | 10.91 | ||||||||||||||||||||||||
2009 | 10.28 | .41 | (.56 | ) | (.15 | ) | (.45 | ) | (.08 | ) | (.53 | ) | 9.60 | (1.20 | ) | |||||||||||||||||||||
2008 | 10.61 | .48 | (.33 | ) | .15 | (.45 | ) | (.03 | ) | (.48 | ) | 10.28 | 1.52 | |||||||||||||||||||||||
2007 | 10.73 | .46 | (.02 | ) | .44 | (.48 | ) | (.08 | ) | (.56 | ) | 10.61 | 4.13 | |||||||||||||||||||||||
2006(g) | 11.30 | .35 | (.26 | ) | .09 | (.34 | ) | (.32 | ) | (.66 | ) | 10.73 | .77 | |||||||||||||||||||||||
Year Ended 9/30 | ||||||||||||||||||||||||||||||||||||
2005 | 11.52 | .49 | (.11 | ) | .38 | (.51 | ) | (.09 | ) | (.60 | ) | 11.30 | 3.36 | |||||||||||||||||||||||
Class C1 (2/00)(f) | ||||||||||||||||||||||||||||||||||||
Year Ended 5/31 | ||||||||||||||||||||||||||||||||||||
2011(e) | 10.09 | .35 | — | .35 | (.34 | ) | (.09 | ) | (.43 | ) | 10.01 | 3.53 | ||||||||||||||||||||||||
Year Ended 6/30 | ||||||||||||||||||||||||||||||||||||
2010 | 9.57 | .38 | .61 | .99 | (.38 | ) | (.09 | ) | (.47 | ) | 10.09 | 10.51 | ||||||||||||||||||||||||
2009 | 10.26 | .41 | (.61 | ) | (.20 | ) | (.41 | ) | (.08 | ) | (.49 | ) | 9.57 | (1.70 | ) | |||||||||||||||||||||
2008 | 10.59 | .42 | (.31 | ) | .11 | (.41 | ) | (.03 | ) | (.44 | ) | 10.26 | 1.12 | |||||||||||||||||||||||
2007 | 10.71 | .42 | (.02 | ) | .40 | (.44 | ) | (.08 | ) | (.52 | ) | 10.59 | 3.72 | |||||||||||||||||||||||
2006(g) | 11.28 | .32 | (.27 | ) | .05 | (.30 | ) | (.32 | ) | (.62 | ) | 10.71 | .47 | |||||||||||||||||||||||
Year Ended 9/30 | ||||||||||||||||||||||||||||||||||||
2005 | 11.50 | .43 | (.10 | ) | .33 | (.46 | ) | (.09 | ) | (.55 | ) | 11.28 | 2.95 | |||||||||||||||||||||||
Class I (2/00)(f) | ||||||||||||||||||||||||||||||||||||
Year Ended 5/31 | ||||||||||||||||||||||||||||||||||||
2011(e) | 10.14 | .41 | .01 | .42 | (.40 | ) | (.09 | ) | (.49 | ) | 10.07 | 4.24 | ||||||||||||||||||||||||
Year Ended 6/30 | ||||||||||||||||||||||||||||||||||||
2010 | 9.62 | .45 | .61 | 1.06 | (.45 | ) | (.09 | ) | (.54 | ) | 10.14 | 11.16 | ||||||||||||||||||||||||
2009 | 10.29 | .44 | (.58 | ) | (.14 | ) | (.45 | ) | (.08 | ) | (.53 | ) | 9.62 | (.85 | ) | |||||||||||||||||||||
2008 | 10.63 | .49 | (.32 | ) | .17 | (.48 | ) | (.03 | ) | (.51 | ) | 10.29 | 1.67 | |||||||||||||||||||||||
2007 | 10.75 | .50 | (.03 | ) | .47 | (.51 | ) | (.08 | ) | (.59 | ) | 10.63 | 4.39 | |||||||||||||||||||||||
2006(g) | 11.32 | .37 | (.26 | ) | .11 | (.36 | ) | (.32 | ) | (.68 | ) | 10.75 | .96 | |||||||||||||||||||||||
Year Ended 9/30 | ||||||||||||||||||||||||||||||||||||
2005 | 11.53 | .51 | (.09 | ) | .42 | (.54 | ) | (.09 | ) | (.63 | ) | 11.32 | 3.70 | |||||||||||||||||||||||
| 90 | Nuveen Investments |
| Ratios/Supplemental Data | ||||||||||||||||||||||
| Ratios to Average Net Assets Before Reimbursement | Ratios to Average Net Assets After Reimbursement(d) | |||||||||||||||||||||
| Ending Net Assets (000) | Expenses | Net Invest- ment Income (Loss) | Expenses | Net Invest- ment Income (Loss) | Portfolio Turnover Rate | |||||||||||||||||
| $ | 10,812 | 1.14 | %* | 3.84 | %* | .72 | %* | 4.27 | %* | 20 | % | |||||||||||
| 10,811 | 1.29 | 3.69 | .75 | 4.23 | 25 | |||||||||||||||||
| 11,088 | 1.45 | 3.88 | .75 | 4.58 | 41 | |||||||||||||||||
| 5,815 | 1.80 | 3.35 | .75 | 4.40 | 49 | |||||||||||||||||
| 8,788 | 1.75 | 3.27 | .75 | 4.27 | 47 | |||||||||||||||||
| 8,507 | 1.52 | * | 3.53 | * | .75 | * | 4.30 | * | 35 | |||||||||||||
| 8,362 | 1.18 | 3.80 | .75 | 4.23 | 30 | |||||||||||||||||
| 2,481 | 1.58 | * | 3.38 | * | 1.14 | * | 3.82 | * | 20 | |||||||||||||
| 3,172 | 1.69 | 3.29 | 1.15 | 3.83 | 25 | |||||||||||||||||
| 2,891 | 1.85 | 3.49 | 1.15 | 4.19 | 41 | |||||||||||||||||
| 2,859 | 2.20 | 2.93 | 1.15 | 3.98 | 49 | |||||||||||||||||
| 2,888 | 2.24 | 2.78 | 1.15 | 3.87 | 47 | |||||||||||||||||
| 3,007 | 2.27 | * | 2.78 | * | 1.15 | * | 3.90 | * | 35 | |||||||||||||
| 3,423 | 1.93 | 3.05 | 1.15 | 3.83 | 30 | |||||||||||||||||
| 42,161 | .92 | * | 4.04 | * | .49 | * | 4.47 | * | 20 | |||||||||||||
| 49,244 | 1.04 | 3.94 | .50 | 4.48 | 25 | |||||||||||||||||
| 51,521 | 1.20 | 4.11 | .50 | 4.81 | 41 | |||||||||||||||||
| 15,889 | 1.55 | 3.58 | .50 | 4.63 | 49 | |||||||||||||||||
| 13,477 | 1.50 | 3.51 | .50 | 4.51 | 47 | |||||||||||||||||
| 10,181 | 1.27 | * | 3.81 | * | .50 | * | 4.58 | * | 35 | |||||||||||||
| 8,363 | .93 | 4.05 | .50 | 4.48 | 30 | |||||||||||||||||
| (a) | Per share Net Investment Income (Loss) is calculated using the average daily shares method. |
| (b) | Distributions from Capital Gains include short-term capital gains, if any. |
| (c) | Total return is the combination of changes in net asset value without any sales charge, reinvested dividend income at net asset value and reinvested capital gains distributions at net asset value, if any. Total returns are not annualized. |
| (d) | After expense reimbursement from the Adviser, where applicable. Ratios do not reflect the effect of custodian fee credits earned on the Fund’s net cash on deposit with the custodian bank, where applicable. |
| (e) | For the eleven months ended May 31, 2011. |
| (f) | Effective January 18, 2011, Class C Shares and Class Y Shares previously offered by FAF Advisors were renamed Class C1 Shares and Class I Shares, respectively. |
| (g) | For the nine months ended June 30, 2006. |
| * | Annualized. |
See accompanying notes to financial statements.
| Nuveen Investments | 91 |
Financial Highlights (continued)
| Selected data for a share outstanding throughout each period: | ||||||||||||||||||||||||||||||||||||
| Class (Commencement Date) | ||||||||||||||||||||||||||||||||||||
| Investment Operations | Less Distributions | |||||||||||||||||||||||||||||||||||
| MINNESOTA INTERMEDIATE | ||||||||||||||||||||||||||||||||||||
| Beginning Net Asset Value | Net Invest- ment Income (Loss)(a) | Net Realized/ Unrealized Gain (Loss) | Total | Net Invest- ment Income | Capital Gains(b) | Total | Ending Net Asset Value | Total Return(c) | ||||||||||||||||||||||||||||
Class A (2/94) | ||||||||||||||||||||||||||||||||||||
Year Ended 5/31 | ||||||||||||||||||||||||||||||||||||
2011(e) | $ | 10.12 | $ | .33 | $ | .07 | $ | .40 | $ | (.32 | ) | $ | — | $ | (.32 | ) | $ | 10.20 | 4.00 | % | ||||||||||||||||
Year Ended 6/30 | ||||||||||||||||||||||||||||||||||||
2010 | 9.67 | .36 | .46 | .82 | (.36 | ) | (.01 | ) | (.37 | ) | 10.12 | 8.51 | ||||||||||||||||||||||||
2009 | 9.75 | .38 | (.05 | ) | .33 | (.38 | ) | (.03 | ) | (.41 | ) | 9.67 | 3.53 | |||||||||||||||||||||||
2008 | 9.83 | .39 | (.05 | ) | .34 | (.39 | ) | (.03 | ) | (.42 | ) | 9.75 | 3.53 | |||||||||||||||||||||||
2007 | 9.88 | .39 | (.01 | ) | .38 | (.38 | ) | (.05 | ) | (.43 | ) | 9.83 | 3.87 | |||||||||||||||||||||||
2006(i) | 10.16 | .29 | (.22 | ) | .07 | (.29 | ) | (.06 | ) | (.35 | ) | 9.88 | .74 | |||||||||||||||||||||||
Year Ended 9/30 | ||||||||||||||||||||||||||||||||||||
2005 | 10.34 | .39 | (.15 | ) | .24 | (.39 | ) | (.03 | ) | (.42 | ) | 10.16 | 2.33 | |||||||||||||||||||||||
Class C (1/11) | ||||||||||||||||||||||||||||||||||||
Year Ended 5/31 | ||||||||||||||||||||||||||||||||||||
2011(g) | 9.77 | .11 | .36 | .47 | (.10 | ) | — | (.10 | ) | 10.14 | 4.88 | |||||||||||||||||||||||||
Class C1 (10/09)(f) | ||||||||||||||||||||||||||||||||||||
Year Ended 5/31 | ||||||||||||||||||||||||||||||||||||
2011(e) | 10.14 | .28 | .07 | .35 | (.27 | ) | — | (.27 | ) | 10.22 | 3.46 | |||||||||||||||||||||||||
Year Ended 6/30 | ||||||||||||||||||||||||||||||||||||
2010(h) | 9.94 | .21 | .20 | .41 | (.20 | ) | (.01 | ) | (.21 | ) | 10.14 | 4.15 | ||||||||||||||||||||||||
Class I (2/94)(f) | ||||||||||||||||||||||||||||||||||||
Year Ended 5/31 | ||||||||||||||||||||||||||||||||||||
2011(e) | 10.06 | .34 | .06 | .40 | (.33 | ) | — | (.33 | ) | 10.13 | 4.00 | |||||||||||||||||||||||||
Year Ended 6/30 | ||||||||||||||||||||||||||||||||||||
2010 | 9.62 | .36 | .45 | .81 | (.36 | ) | (.01 | ) | (.37 | ) | 10.06 | 8.50 | ||||||||||||||||||||||||
2009 | 9.69 | .39 | (.04 | ) | .35 | (.39 | ) | (.03 | ) | (.42 | ) | 9.62 | 3.71 | |||||||||||||||||||||||
2008 | 9.78 | .39 | (.05 | ) | .34 | (.40 | ) | (.03 | ) | (.43 | ) | 9.69 | 3.51 | |||||||||||||||||||||||
2007 | 9.83 | .40 | — | .40 | (.40 | ) | (.05 | ) | (.45 | ) | 9.78 | 4.05 | ||||||||||||||||||||||||
2006(i) | 10.11 | .30 | (.22 | ) | .08 | (.30 | ) | (.06 | ) | (.36 | ) | 9.83 | .85 | |||||||||||||||||||||||
Year Ended 9/30 | ||||||||||||||||||||||||||||||||||||
2005 | 10.29 | .40 | (.15 | ) | .25 | (.40 | ) | (.03 | ) | (.43 | ) | 10.11 | 2.50 | |||||||||||||||||||||||
| 92 | Nuveen Investments |
| Ratios/Supplemental Data | ||||||||||||||||||||||
| Ratios to Average Net Assets Before Reimbursement | Ratios to Average Net Assets After Reimbursement(d) | |||||||||||||||||||||
| Ending Net Assets (000) | Expenses | Net Invest- ment Income (Loss) | Expenses | Net Invest- ment Income (Loss) | Portfolio Turnover Rate | |||||||||||||||||
| $ | 37,175 | .92 | %* | 3.40 | %* | .74 | %* | 3.60 | %* | 12 | % | |||||||||||
| 34,957 | 1.08 | 3.28 | .75 | 3.61 | 9 | |||||||||||||||||
| 23,019 | 1.07 | 3.68 | .75 | 4.00 | 18 | |||||||||||||||||
| 22,059 | 1.07 | 3.65 | .77 | 3.95 | 15 | |||||||||||||||||
| 21,153 | 1.07 | 3.64 | .85 | 3.86 | 18 | |||||||||||||||||
| 26,526 | 1.08 | * | 3.62 | * | .85 | * | 3.85 | * | 11 | |||||||||||||
| 32,326 | 1.06 | 3.57 | .85 | 3.78 | 15 | |||||||||||||||||
| 623 | 1.41 | * | 3.10 | * | 1.37 | * | 3.14 | * | 12 | |||||||||||||
| 6,242 | 1.37 | * | 2.99 | * | 1.31 | * | 3.05 | * | 12 | |||||||||||||
| 3,965 | 1.48 | * | 2.87 | * | 1.35 | * | 3.00 | * | 9 | |||||||||||||
| 191,516 | .72 | * | 3.60 | * | .66 | * | 3.67 | * | 12 | |||||||||||||
| 193,443 | .83 | 3.53 | .70 | 3.66 | 9 | |||||||||||||||||
| 172,440 | .82 | 3.92 | .70 | 4.04 | 18 | |||||||||||||||||
| 175,681 | .82 | 3.90 | .70 | 4.02 | 15 | |||||||||||||||||
| 168,920 | .82 | 3.89 | .70 | 4.01 | 18 | |||||||||||||||||
| 175,485 | .83 | * | 3.87 | * | .70 | * | 4.00 | * | 11 | |||||||||||||
| 197,251 | .81 | 3.82 | .70 | 3.93 | 15 | |||||||||||||||||
| (a) | Per share Net Investment Income (Loss) is calculated using the average daily shares method. |
| (b) | Distributions from Capital Gains include short-term capital gains, if any. |
| (c) | Total return is the combination of changes in net asset value without any sales charge, reinvested dividend income at net asset value and reinvested capital gains distributions at net asset value, if any. Total returns are not annualized. |
| (d) | After expense reimbursement from the Adviser, where applicable. Ratios do not reflect the effect of custodian fee credits earned on the Fund’s net cash on deposit with the custodian bank, where applicable. |
| (e) | For the eleven months ended May 31, 2011. |
| (f) | Effective January 18, 2011, Class C Shares and Class Y Shares previously offered by FAF Advisors were renamed Class C1 Shares and Class Y Shares and Class I Shares, respectively. |
| (g) | For the period January 18, 2011 (commencement of operations) through May 31, 2011. |
| (h) | For the period October 28, 2009 (commencement of operations) through June 30, 2010. |
| (i) | For the nine months ended June 30, 2006. |
| * | Annualized. |
See accompanying notes to financial statements.
| Nuveen Investments | 93 |
Financial Highlights (continued)
| Selected data for a share outstanding throughout each period: | ||||||||||||||||||||||||||||||||||||
| Class (Commencement Date) | ||||||||||||||||||||||||||||||||||||
| Investment Operations | Less Distributions | |||||||||||||||||||||||||||||||||||
| MINNESOTA MUNICIPAL | ||||||||||||||||||||||||||||||||||||
| Beginning Net Asset Value | Net Invest- ment Income (Loss)(a) | Net Realized/ Unrealized Gain (Loss) | Total | Net Invest- ment Income | Capital Gains(b) | Total | Ending Net Asset Value | Total Return(c) | ||||||||||||||||||||||||||||
Class A (7/88) |
| |||||||||||||||||||||||||||||||||||
Year Ended 5/31 | ||||||||||||||||||||||||||||||||||||
2011(e) | $ | 10.87 | $ | .39 | $ | (.08 | ) | $ | .31 | $ | (.35 | ) | $ | — | $ | (.35 | ) | $ | 10.83 | 2.94 | % | |||||||||||||||
Year Ended 6/30 | ||||||||||||||||||||||||||||||||||||
2010 | 9.98 | .41 | .89 | 1.30 | (.41 | ) | — | (.41 | ) | 10.87 | 13.19 | |||||||||||||||||||||||||
2009 | 10.48 | .43 | (.44 | ) | (.01 | ) | (.43 | ) | (.06 | ) | (.49 | ) | 9.98 | .07 | ||||||||||||||||||||||
2008 | 10.93 | .44 | (.38 | ) | .06 | (.45 | ) | (.06 | ) | (.51 | ) | 10.48 | .54 | |||||||||||||||||||||||
2007 | 10.97 | .46 | (.02 | ) | .44 | (.45 | ) | (.03 | ) | (.48 | ) | 10.93 | 4.05 | |||||||||||||||||||||||
2006(h) | 11.21 | .35 | (.21 | ) | .14 | (.35 | ) | (.03 | ) | (.38 | ) | 10.97 | 1.28 | |||||||||||||||||||||||
Year Ended 9/30 | ||||||||||||||||||||||||||||||||||||
2005 | 11.23 | .45 | .03 | .48 | (.45 | ) | (.05 | ) | (.50 | ) | 11.21 | 4.42 | ||||||||||||||||||||||||
Class C (1/11) |
| |||||||||||||||||||||||||||||||||||
Year Ended 5/31 | ||||||||||||||||||||||||||||||||||||
2011(g) | 10.23 | .15 | .56 | .71 | (.12 | ) | — | (.12 | ) | 10.82 | 6.99 | |||||||||||||||||||||||||
Class C1 (2/99)(f) |
| |||||||||||||||||||||||||||||||||||
Year Ended 5/31 | ||||||||||||||||||||||||||||||||||||
2011(e) | 10.82 | .34 | (.08 | ) | .26 | (.30 | ) | — | (.30 | ) | 10.78 | 2.48 | ||||||||||||||||||||||||
Year Ended 6/30 | ||||||||||||||||||||||||||||||||||||
2010 | 9.94 | .36 | .88 | 1.24 | (.36 | ) | — | (.36 | ) | 10.82 | 12.58 | |||||||||||||||||||||||||
2009 | 10.44 | .38 | (.44 | ) | (.06 | ) | (.38 | ) | (.06 | ) | (.44 | ) | 9.94 | (.42 | ) | |||||||||||||||||||||
2008 | 10.89 | .40 | (.39 | ) | .01 | (.40 | ) | (.06 | ) | (.46 | ) | 10.44 | .06 | |||||||||||||||||||||||
2007 | 10.93 | .42 | (.02 | ) | .40 | (.41 | ) | (.03 | ) | (.44 | ) | 10.89 | 3.65 | |||||||||||||||||||||||
2006(h) | 11.17 | .31 | (.20 | ) | .11 | (.32 | ) | (.03 | ) | (.35 | ) | 10.93 | .98 | |||||||||||||||||||||||
Year Ended 9/30 | ||||||||||||||||||||||||||||||||||||
2005 | 11.19 | .41 | .03 | .44 | (.41 | ) | (.05 | ) | (.46 | ) | 11.17 | 4.02 | ||||||||||||||||||||||||
Class I (8/97)(f) |
| |||||||||||||||||||||||||||||||||||
Year Ended 5/31 | ||||||||||||||||||||||||||||||||||||
2011(e) | 10.86 | .41 | (.08 | ) | .33 | (.37 | ) | — | (.37 | ) | 10.82 | 3.09 | ||||||||||||||||||||||||
Year Ended 6/30 | ||||||||||||||||||||||||||||||||||||
2010 | 9.97 | .42 | .90 | 1.32 | (.43 | ) | — | (.43 | ) | 10.86 | 13.37 | |||||||||||||||||||||||||
2009 | 10.47 | .44 | (.44 | ) | — | (.44 | ) | (.06 | ) | (.50 | ) | 9.97 | .23 | |||||||||||||||||||||||
2008 | 10.92 | .46 | (.38 | ) | .08 | (.47 | ) | (.06 | ) | (.53 | ) | 10.47 | .71 | |||||||||||||||||||||||
2007 | 10.96 | .48 | (.01 | ) | .47 | (.48 | ) | (.03 | ) | (.51 | ) | 10.92 | 4.31 | |||||||||||||||||||||||
2006(h) | 11.20 | .36 | (.20 | ) | .16 | (.37 | ) | (.03 | ) | (.40 | ) | 10.96 | 1.47 | |||||||||||||||||||||||
Year Ended 9/30 | ||||||||||||||||||||||||||||||||||||
2005 | 11.22 | .48 | .03 | .51 | (.48 | ) | (.05 | ) | (.53 | ) | 11.20 | 4.69 | ||||||||||||||||||||||||
| 94 | Nuveen Investments |
| Ratios/Supplemental Data | ||||||||||||||||||||||
| Ratios to Average Net Assets Before Reimbursement | Ratios to Average Net Assets After Reimbursement(d) | |||||||||||||||||||||
| Ending Net Assets (000) | Expenses | Net Invest ment Income (Loss) | Expenses | Net Invest ment Income (Loss) | Portfolio Turnover Rate | |||||||||||||||||
| $ | 85,183 | 1.00 | %* | 3.77 | %* | .85 | %* | 3.94 | %* | 25 | % | |||||||||||
| 91,922 | 1.11 | 3.60 | .85 | 3.86 | 34 | |||||||||||||||||
| 87,218 | 1.11 | 4.06 | .85 | 4.32 | 28 | |||||||||||||||||
| 102,089 | 1.10 | 3.91 | .87 | 4.14 | 37 | |||||||||||||||||
| 106,732 | 1.10 | 3.95 | .95 | 4.10 | 20 | |||||||||||||||||
| 101,142 | 1.10 | * | 4.00 | * | .95 | * | 4.15 | * | 11 | |||||||||||||
| 106,783 | 1.06 | 3.93 | .95 | 4.04 | 16 | |||||||||||||||||
| 618 | 1.50 | * | 3.91 | * | 1.43 | * | 3.98 | * | 25 | |||||||||||||
| 22,190 | 1.43 | * | 3.33 | * | 1.33 | * | 3.43 | * | 25 | |||||||||||||
| 26,772 | 1.51 | 3.19 | 1.35 | 3.35 | 34 | |||||||||||||||||
| 20,489 | 1.51 | 3.66 | 1.35 | 3.82 | 28 | |||||||||||||||||
| 20,061 | 1.50 | 3.48 | 1.35 | 3.63 | 37 | |||||||||||||||||
| 14,221 | 1.58 | 3.46 | 1.35 | 3.69 | 20 | |||||||||||||||||
| 10,359 | 1.85 | * | 3.25 | * | 1.35 | * | 3.75 | * | 11 | |||||||||||||
| 9,841 | 1.81 | 3.18 | 1.35 | 3.64 | 16 | |||||||||||||||||
| 51,116 | .77 | * | 4.01 | * | .68 | * | 4.11 | * | 25 | |||||||||||||
| 52,639 | .86 | 3.84 | .70 | 4.00 | 34 | |||||||||||||||||
| 42,093 | .86 | 4.31 | .70 | 4.47 | 28 | |||||||||||||||||
| 44,993 | .85 | 4.17 | .70 | 4.32 | 37 | |||||||||||||||||
| 56,181 | .85 | 4.20 | .70 | 4.35 | 20 | |||||||||||||||||
| 48,760 | .85 | * | 4.25 | * | .70 | * | 4.40 | * | 11 | |||||||||||||
| 46,471 | .81 | 4.18 | .70 | 4.29 | 16 | |||||||||||||||||
| (a) | Per share Net Investment Income (Loss) is calculated using the average daily shares method. |
| (b) | Distributions from Capital Gains include short-term capital gains, if any. |
| (c) | Total return is the combination of changes in net asset value without any sales charge, reinvested dividend income at net asset value and reinvested capital gains distributions at net asset value, if any. Total returns are not annualized. |
| (d) | After expense reimbursement from the Adviser, where applicable. Ratios do not reflect the effect of custodian fee credits earned on the Fund’s net cash on deposit with the custodian bank, where applicable. |
| (e) | For the eleven months ended May 31, 2011. |
| (f) | Effective January 18, 2011, Class C Shares and Class Y Shares previously offered by FAF Advisors were renamed Class C1 Shares and Class I Shares, respectively. |
| (g) | For the period January 18, 2011 (commencement of operations) through May 31, 2011. |
| (h) | For the nine months ended June 30, 2006. |
| * | Annualized. |
See accompanying notes to financial statements.
| Nuveen Investments | 95 |
Financial Highlights (continued)
| Selected data for a share outstanding throughout each period: | ||||||||||||||||||||||||||||||||||||
| Class (Commencement Date) | ||||||||||||||||||||||||||||||||||||
| Investment Operations | Less Distributions | |||||||||||||||||||||||||||||||||||
| MISSOURI TAX FREE | ||||||||||||||||||||||||||||||||||||
| Beginning Net Asset Value | Net Invest- ment Income (Loss)(a) | Net Realized/ Unrealized Gain (Loss) | Total | Net Invest- ment Income | Capital Gains(b) | Total | Ending Net Asset Value | Total Return(c) | ||||||||||||||||||||||||||||
Class A (9/90) |
| |||||||||||||||||||||||||||||||||||
Year Ended 5/31 | ||||||||||||||||||||||||||||||||||||
2011(e) | $ | 11.68 | $ | .44 | $ | .04 | $ | .48 | $ | (.42 | ) | $ | (.02 | ) | $ | (.44 | ) | $ | 11.72 | 4.18 | % | |||||||||||||||
Year Ended 6/30 | ||||||||||||||||||||||||||||||||||||
2010 | 11.11 | .48 | .66 | 1.14 | (.48 | ) | (.09 | ) | (.57 | ) | 11.68 | 10.41 | ||||||||||||||||||||||||
2009 | 11.40 | .47 | (.26 | ) | .21 | (.47 | ) | (.03 | ) | (.50 | ) | 11.11 | 2.01 | |||||||||||||||||||||||
2008 | 11.72 | .46 | (.29 | ) | .17 | (.46 | ) | (.03 | ) | (.49 | ) | 11.40 | 1.44 | |||||||||||||||||||||||
2007 | 11.76 | .45 | .05 | .50 | (.45 | ) | (.09 | ) | (.54 | ) | 11.72 | 4.23 | ||||||||||||||||||||||||
2006(g) | 12.14 | .34 | (.29 | ) | .05 | (.34 | ) | (.09 | ) | (.43 | ) | 11.76 | .38 | |||||||||||||||||||||||
Year Ended 9/30 | ||||||||||||||||||||||||||||||||||||
2005 | 12.32 | .45 | (.12 | ) | .33 | (.45 | ) | (.06 | ) | (.51 | ) | 12.14 | 2.74 | |||||||||||||||||||||||
Class C1 (9/01)(f) |
| |||||||||||||||||||||||||||||||||||
Year Ended 5/31 | ||||||||||||||||||||||||||||||||||||
2011(e) | 11.65 | .38 | .05 | .43 | (.37 | ) | (.02 | ) | (.39 | ) | 11.69 | 3.72 | ||||||||||||||||||||||||
Year Ended 6/30 | ||||||||||||||||||||||||||||||||||||
2010 | 11.08 | .43 | .66 | 1.09 | (.43 | ) | (.09 | ) | (.52 | ) | 11.65 | 9.90 | ||||||||||||||||||||||||
2009 | 11.36 | .43 | (.25 | ) | .18 | (.43 | ) | (.03 | ) | (.46 | ) | 11.08 | 1.70 | |||||||||||||||||||||||
2008 | 11.69 | .41 | (.30 | ) | .11 | (.41 | ) | (.03 | ) | (.44 | ) | 11.36 | .95 | |||||||||||||||||||||||
2007 | 11.73 | .41 | .04 | .45 | (.40 | ) | (.09 | ) | (.49 | ) | 11.69 | 3.84 | ||||||||||||||||||||||||
2006(g) | 12.12 | .30 | (.30 | ) | — | (.30 | ) | (.09 | ) | (.39 | ) | 11.73 | — | |||||||||||||||||||||||
Year Ended 9/30 | ||||||||||||||||||||||||||||||||||||
2005 | 12.29 | .40 | (.11 | ) | .29 | (.40 | ) | (.06 | ) | (.46 | ) | 12.12 | 2.42 | |||||||||||||||||||||||
Class I (7/88)(f) |
| |||||||||||||||||||||||||||||||||||
Year Ended 5/31 | ||||||||||||||||||||||||||||||||||||
2011(e) | 11.69 | .45 | .04 | .49 | (.44 | ) | (.02 | ) | (.46 | ) | 11.72 | 4.25 | ||||||||||||||||||||||||
Year Ended 6/30 | ||||||||||||||||||||||||||||||||||||
2010 | 11.12 | .50 | .66 | 1.16 | (.50 | ) | (.09 | ) | (.59 | ) | 11.69 | 10.57 | ||||||||||||||||||||||||
2009 | 11.40 | .49 | (.24 | ) | .25 | (.50 | ) | (.03 | ) | (.53 | ) | 11.12 | 2.36 | |||||||||||||||||||||||
2008 | 11.73 | .48 | (.30 | ) | .18 | (.48 | ) | (.03 | ) | (.51 | ) | 11.40 | 1.60 | |||||||||||||||||||||||
2007 | 11.76 | .48 | .06 | .54 | (.48 | ) | (.09 | ) | (.57 | ) | 11.73 | 4.58 | ||||||||||||||||||||||||
2006(g) | 12.15 | .36 | (.30 | ) | .06 | (.36 | ) | (.09 | ) | (.45 | ) | 11.76 | .49 | |||||||||||||||||||||||
Year Ended 9/30 | ||||||||||||||||||||||||||||||||||||
2005 | 12.32 | .48 | (.11 | ) | .37 | (.48 | ) | (.06 | ) | (.54 | ) | 12.15 | 3.08 | |||||||||||||||||||||||
| 96 | Nuveen Investments |
| Ratios/Supplemental Data | ||||||||||||||||||||||
| Ratios to Average Net Assets Before Reimbursement | Ratios to Average Net Assets After Reimbursement(d) | |||||||||||||||||||||
| Ending Net Assets (000) | Expenses | Net Invest- ment Income (Loss) | Expenses | Net Invest- ment Income (Loss) | Portfolio Turnover Rate | |||||||||||||||||
| $ | 22,951 | 1.03 | %* | 3.92 | %* | .84 | %* | 4.11 | %* | 10 | % | |||||||||||
| 23,830 | 1.12 | 3.87 | .85 | 4.14 | 15 | |||||||||||||||||
| 22,766 | 1.12 | 4.08 | .95 | 4.25 | 17 | |||||||||||||||||
| 23,135 | 1.10 | 3.77 | .95 | 3.92 | 20 | |||||||||||||||||
| 24,945 | 1.10 | 3.63 | .95 | 3.78 | 33 | |||||||||||||||||
| 26,972 | 1.09 | * | 3.60 | * | .95 | * | 3.74 | * | 20 | |||||||||||||
| 30,188 | 1.06 | 3.54 | .95 | 3.65 | 19 | |||||||||||||||||
| 1,661 | 1.45 | * | 3.51 | * | 1.34 | * | 3.62 | * | 10 | |||||||||||||
| 1,653 | 1.52 | 3.45 | 1.35 | 3.62 | 15 | |||||||||||||||||
| 757 | 1.52 | 3.68 | 1.35 | 3.85 | 17 | |||||||||||||||||
| 406 | 1.50 | 3.38 | 1.35 | 3.53 | 20 | |||||||||||||||||
| 518 | 1.57 | 3.13 | 1.35 | 3.35 | 33 | |||||||||||||||||
| 214 | 1.84 | * | 2.85 | * | 1.35 | * | 3.34 | * | 20 | |||||||||||||
| 190 | 1.81 | 2.79 | 1.35 | 3.25 | 19 | |||||||||||||||||
| 134,610 | .80 | * | 4.16 | * | .69 | * | 4.27 | * | 10 | |||||||||||||
| 137,049 | .87 | 4.12 | .70 | 4.29 | 15 | |||||||||||||||||
| 119,522 | .87 | 4.32 | .70 | 4.49 | 17 | |||||||||||||||||
| 137,746 | .85 | 4.02 | .70 | 4.17 | 20 | |||||||||||||||||
| 130,644 | .85 | 3.88 | .70 | 4.03 | 33 | |||||||||||||||||
| 138,394 | .84 | * | 3.85 | * | .70 | * | 3.99 | * | 20 | |||||||||||||
| 151,710 | .81 | 3.79 | .70 | 3.90 | 19 | |||||||||||||||||
| (a) | Per share Net Investment Income (Loss) is calculated using the average daily shares method. |
| (b) | Distributions from Capital Gains include short-term capital gains, if any. |
| (c) | Total return is the combination of changes in net asset value without any sales charge, reinvested dividend income at net asset value and reinvested capital gains distributions at net asset value, if any. Total returns are not annualized. |
| (e) | For the eleven months ended May 31, 2011. |
| (d) | After expense reimbursement from the Adviser, where applicable. Ratios do not reflect the effect of custodian fee credits earned on the Fund’s net cash on deposit with the custodian bank, where applicable. |
| (f) | Effective January 18, 2011, Class C Shares and Class Y Shares previously offered by FAF Advisors were renamed Class C1 Shares and Class I Shares, respectively. |
| (g) | For the nine months ended June 30, 2006. |
| * | Annualized. |
See accompanying notes to financial statements.
| Nuveen Investments | 97 |
Financial Highlights (continued)
| Selected data for a share outstanding throughout each period: | ||||||||||||||||||||||||||||||||||||
| Class (Commencement Date) | ||||||||||||||||||||||||||||||||||||
| Investment Operations | Less Distributions | |||||||||||||||||||||||||||||||||||
| NEBRASKA | ||||||||||||||||||||||||||||||||||||
| Beginning Net Asset Value | Net Invest- ment Income (Loss)(a) | Net Realized/ Unrealized Gain (Loss) | Total | Net Invest- ment Income | Capital Gains(b) | Total | Ending Net Asset Value | Total Return(c) | ||||||||||||||||||||||||||||
CLASS A (2/01) | ||||||||||||||||||||||||||||||||||||
Year Ended 5/31 | ||||||||||||||||||||||||||||||||||||
2011(e) | $ | 10.34 | $ | .39 | $ | (.06 | ) | $ | .33 | $ | (.39 | ) | $ | — | $ | (.39 | ) | $ | 10.28 | 3.28 | % | |||||||||||||||
Year Ended 6/30 | ||||||||||||||||||||||||||||||||||||
2010 | 9.84 | .41 | .49 | .90 | (.40 | ) | — | (.40 | ) | 10.34 | 9.26 | |||||||||||||||||||||||||
2009 | 10.06 | .43 | (.21 | ) | .22 | (.44 | ) | — | (.44 | ) | 9.84 | 2.33 | ||||||||||||||||||||||||
2008 | 10.30 | .42 | (.20 | ) | .22 | (.41 | ) | (.05 | ) | (.46 | ) | 10.06 | 2.19 | |||||||||||||||||||||||
2007 | 10.33 | .42 | .02 | .44 | (.42 | ) | (.05 | ) | (.47 | ) | 10.30 | 4.24 | ||||||||||||||||||||||||
2006(h) | 10.58 | .31 | (.24 | ) | .07 | (.30 | ) | (.02 | ) | (.32 | ) | 10.33 | .65 | |||||||||||||||||||||||
Year Ended 9/30 | ||||||||||||||||||||||||||||||||||||
2005 | 10.66 | .39 | (.05 | ) | .34 | (.42 | ) | — | (.42 | ) | 10.58 | 3.20 | ||||||||||||||||||||||||
CLASS C (1/11) | ||||||||||||||||||||||||||||||||||||
Year Ended 5/31 | ||||||||||||||||||||||||||||||||||||
2011(g) | 9.86 | .14 | .42 | .56 | (.14 | ) | — | (.14 | ) | 10.28 | 5.70 | |||||||||||||||||||||||||
CLASS C1 (2/01)(f) | ||||||||||||||||||||||||||||||||||||
Year Ended 5/31 | ||||||||||||||||||||||||||||||||||||
2011(e) | 10.26 | .34 | (.06 | ) | .28 | (.35 | ) | — | (.35 | ) | 10.19 | 2.80 | ||||||||||||||||||||||||
Year Ended 6/30 | ||||||||||||||||||||||||||||||||||||
2010 | 9.76 | .38 | .48 | .86 | (.36 | ) | — | (.36 | ) | 10.26 | 8.91 | |||||||||||||||||||||||||
2009 | 9.99 | .39 | (.22 | ) | .17 | (.40 | ) | — | (.40 | ) | 9.76 | 1.84 | ||||||||||||||||||||||||
2008 | 10.23 | .38 | (.20 | ) | .18 | (.37 | ) | (.05 | ) | (.42 | ) | 9.99 | 1.81 | |||||||||||||||||||||||
2007 | 10.26 | .37 | .02 | .39 | (.37 | ) | (.05 | ) | (.42 | ) | 10.23 | 3.86 | ||||||||||||||||||||||||
2006(h) | 10.50 | .27 | (.22 | ) | .05 | (.27 | ) | (.02 | ) | (.29 | ) | 10.26 | .46 | |||||||||||||||||||||||
Year Ended 9/30 | ||||||||||||||||||||||||||||||||||||
2005 | 10.58 | .35 | (.06 | ) | .29 | (.37 | ) | — | (.37 | ) | 10.50 | 2.81 | ||||||||||||||||||||||||
CLASS I (2/01)(f) | ||||||||||||||||||||||||||||||||||||
Year Ended 5/31 | ||||||||||||||||||||||||||||||||||||
2011(e) | 10.34 | .41 | (.07 | ) | .34 | (.41 | ) | — | (.41 | ) | 10.27 | 3.39 | ||||||||||||||||||||||||
Year Ended 6/30 | ||||||||||||||||||||||||||||||||||||
2010 | 9.83 | .44 | .50 | .94 | (.43 | ) | — | (.43 | ) | 10.34 | 9.65 | |||||||||||||||||||||||||
2009 | 10.06 | .45 | (.22 | ) | .23 | (.46 | ) | — | (.46 | ) | 9.83 | 2.48 | ||||||||||||||||||||||||
2008 | 10.30 | .44 | (.19 | ) | .25 | (.44 | ) | (.05 | ) | (.49 | ) | 10.06 | 2.45 | |||||||||||||||||||||||
2007 | 10.33 | .44 | .02 | .46 | (.44 | ) | (.05 | ) | (.49 | ) | 10.30 | 4.51 | ||||||||||||||||||||||||
2006(h) | 10.58 | .32 | (.23 | ) | .09 | (.32 | ) | (.02 | ) | (.34 | ) | 10.33 | .85 | |||||||||||||||||||||||
Year Ended 9/30 | ||||||||||||||||||||||||||||||||||||
2005 | 10.66 | .43 | (.07 | ) | .36 | (.44 | ) | — | (.44 | ) | 10.58 | 3.45 | ||||||||||||||||||||||||
| 98 | Nuveen Investments |
| Ratios/Supplemental Data | ||||||||||||||||||||||
| Ratios to Average Net Assets Before Reimbursement | Ratios to Average Net Assets After Reimbursement(d) | |||||||||||||||||||||
| Ending Net Assets (000) | Expenses | Net Invest- ment Income (Loss) | Expenses | Net Invest- ment Income (Loss) | Portfolio Turnover Rate | |||||||||||||||||
| $ | 7,099 | 1.21 | %* | 3.62 | %* | .72 | %* | 4.11 | %* | 21 | % | |||||||||||
| 6,333 | 1.46 | 3.30 | .75 | 4.01 | 18 | |||||||||||||||||
| 5,847 | 1.50 | 3.66 | .75 | 4.41 | 34 | |||||||||||||||||
| 5,689 | 1.47 | 3.34 | .75 | 4.06 | 22 | |||||||||||||||||
| 7,091 | 1.44 | 3.28 | .75 | 3.97 | 39 | |||||||||||||||||
| 6,910 | 1.30 | * | 3.34 | * | .75 | * | 3.89 | * | 35 | |||||||||||||
| 7,136 | 1.12 | 3.41 | .75 | 3.78 | 21 | |||||||||||||||||
| 321 | 1.60 | * | 3.37 | * | 1.24 | * | 3.73 | * | 21 | |||||||||||||
| 4,201 | 1.64 | * | 3.19 | * | 1.14 | * | 3.69 | * | 21 | |||||||||||||
| 4,181 | 1.86 | 2.91 | 1.15 | 3.62 | 18 | |||||||||||||||||
| 2,585 | 1.90 | 3.27 | 1.15 | 4.02 | 34 | |||||||||||||||||
| 1,798 | 1.87 | 2.93 | 1.15 | 3.65 | 22 | |||||||||||||||||
| 1,559 | 1.92 | 2.79 | 1.15 | 3.56 | 39 | |||||||||||||||||
| 1,487 | 2.05 | * | 2.59 | * | 1.15 | * | 3.49 | * | 35 | |||||||||||||
| 1,565 | 1.87 | 2.66 | 1.15 | 3.38 | 21 | |||||||||||||||||
| 31,470 | .99 | * | 3.83 | * | .49 | * | 4.34 | * | 21 | |||||||||||||
| 31,757 | 1.21 | 3.55 | .50 | 4.26 | 18 | |||||||||||||||||
| 30,689 | 1.25 | 3.92 | .50 | 4.67 | 34 | |||||||||||||||||
| 29,533 | 1.22 | 3.59 | .50 | 4.31 | 22 | |||||||||||||||||
| 32,502 | 1.19 | 3.53 | .50 | 4.22 | 39 | |||||||||||||||||
| 31,347 | 1.05 | * | 3.59 | * | .50 | * | 4.14 | * | 35 | |||||||||||||
| 32,418 | .87 | 3.66 | .50 | 4.03 | 21 | |||||||||||||||||
| (a) | Per share Net Investment Income (Loss) is calculated using the average daily shares method. |
| (b) | Distributions from Capital Gains include short-term capital gains, if any. |
| (c) | Total return is the combination of changes in net asset value without any sales charge, reinvested dividend income at net asset value and reinvested capital gains distributions at net asset value, if any. Total returns are not annualized. |
| (d) | After expense reimbursement from the Adviser, where applicable. Ratios do not reflect the effect of custodian fee credits earned on the Fund’s net cash on deposit with the custodian bank, where applicable. |
| (e) | For the eleven months ended May 31, 2011. |
| (f) | Effective January 18, 2011, Class C Shares and Class Y Shares previously offered by FAF Advisors were renamed Class C1 Shares and Class I Shares, respectively. |
| (g) | For the period January 18, 2011 (commencement of operations) through May 31, 2011. |
| (h) | For the nine months ended June 30, 2006. |
| * | Annualized. |
See accompanying notes to financial statements.
| Nuveen Investments | 99 |
Financial Highlights (continued)
| Selected data for a share outstanding throughout each period: | ||||||||||||||||||||||||||||||||||||
| Class (Commencement Date) | ||||||||||||||||||||||||||||||||||||
| Investment Operations | Less Distributions | |||||||||||||||||||||||||||||||||||
| OHIO TAX FREE | ||||||||||||||||||||||||||||||||||||
| Beginning Net Asset Value | Net Invest- ment Income (Loss)(a) | Net Realized/ Unrealized Gain (Loss) | Total | Net Invest- ment Income | Capital Gains(b) | Total | Ending Net Asset Value | Total Return(c) | ||||||||||||||||||||||||||||
Class A (4/02) | ||||||||||||||||||||||||||||||||||||
Year Ended 5/31 | ||||||||||||||||||||||||||||||||||||
2011(e) | $ | 10.42 | $ | .37 | $ | (.10 | ) | $ | .27 | $ | (.36 | ) | $ | — | $ | (.36 | ) | $ | 10.33 | 2.69 | % | |||||||||||||||
Year Ended 6/30 | ||||||||||||||||||||||||||||||||||||
2010 | 9.90 | .38 | .51 | .89 | (.37 | ) | — | (.37 | ) | 10.42 | 9.12 | |||||||||||||||||||||||||
2009 | 10.02 | .40 | (.12 | ) | .28 | (.40 | ) | — | (.40 | ) | 9.90 | 2.99 | ||||||||||||||||||||||||
2008 | 10.20 | .39 | (.15 | ) | .24 | (.39 | ) | (.03 | ) | (.42 | ) | 10.02 | 2.38 | |||||||||||||||||||||||
2007 | 10.17 | .38 | .05 | .43 | (.38 | ) | (.02 | ) | (.40 | ) | 10.20 | 4.28 | ||||||||||||||||||||||||
2006(g) | 10.42 | .29 | (.25 | ) | .04 | (.28 | ) | (.01 | ) | (.29 | ) | 10.17 | .40 | |||||||||||||||||||||||
Year Ended 9/30 | ||||||||||||||||||||||||||||||||||||
2005 | 10.52 | .36 | (.06 | ) | .30 | (.36 | ) | (.04 | ) | (.40 | ) | 10.42 | 2.86 | |||||||||||||||||||||||
Class C1 (4/02)(f) | ||||||||||||||||||||||||||||||||||||
Year Ended 5/31 | ||||||||||||||||||||||||||||||||||||
2011(e) | 10.27 | .33 | (.10 | ) | .23 | (.32 | ) | — | (.32 | ) | 10.18 | 2.31 | ||||||||||||||||||||||||
Year Ended 6/30 | ||||||||||||||||||||||||||||||||||||
2010 | 9.76 | .35 | .49 | .84 | (.33 | ) | — | (.33 | ) | 10.27 | 8.72 | |||||||||||||||||||||||||
2009 | 9.89 | .37 | (.13 | ) | .24 | (.37 | ) | — | (.37 | ) | 9.76 | 2.52 | ||||||||||||||||||||||||
2008 | 10.07 | .35 | (.15 | ) | .20 | (.35 | ) | (.03 | ) | (.38 | ) | 9.89 | 2.00 | |||||||||||||||||||||||
2007 | 10.05 | .33 | .05 | .38 | (.34 | ) | (.02 | ) | (.36 | ) | 10.07 | 3.81 | ||||||||||||||||||||||||
2006(g) | 10.32 | .25 | (.26 | ) | (.01 | ) | (.25 | ) | (.01 | ) | (.26 | ) | 10.05 | (.08 | ) | |||||||||||||||||||||
Year Ended 9/30 | ||||||||||||||||||||||||||||||||||||
2005 | 10.41 | .32 | (.05 | ) | .27 | (.32 | ) | (.04 | ) | (.36 | ) | 10.32 | 2.58 | |||||||||||||||||||||||
Class I (4/02)(f) | ||||||||||||||||||||||||||||||||||||
Year Ended 5/31 | ||||||||||||||||||||||||||||||||||||
2011(e) | 10.42 | .39 | (.10 | ) | .29 | (.39 | ) | — | (.39 | ) | 10.32 | 2.81 | ||||||||||||||||||||||||
Year Ended 6/30 | ||||||||||||||||||||||||||||||||||||
2010 | 9.90 | .41 | .51 | .92 | (.40 | ) | — | (.40 | ) | 10.42 | 9.39 | |||||||||||||||||||||||||
2009 | 10.01 | .42 | (.10 | ) | .32 | (.43 | ) | — | (.43 | ) | 9.90 | 3.36 | ||||||||||||||||||||||||
2008 | 10.19 | .41 | (.15 | ) | .26 | (.41 | ) | (.03 | ) | (.44 | ) | 10.01 | 2.63 | |||||||||||||||||||||||
2007 | 10.17 | .41 | .04 | .45 | (.41 | ) | (.02 | ) | (.43 | ) | 10.19 | 4.44 | ||||||||||||||||||||||||
2006(g) | 10.43 | .30 | (.25 | ) | .05 | (.30 | ) | (.01 | ) | (.31 | ) | 10.17 | .49 | |||||||||||||||||||||||
Year Ended 9/30 | ||||||||||||||||||||||||||||||||||||
2005 | 10.53 | .38 | (.05 | ) | .33 | (.39 | ) | (.04 | ) | (.43 | ) | 10.43 | 3.12 | |||||||||||||||||||||||
| 100 | Nuveen Investments |
| Ratios/Supplemental Data | ||||||||||||||||||||||
| Ratios to Average Net Assets Before Reimbursement | Ratios to Average Net Assets After Reimbursement(d) | |||||||||||||||||||||
| Ending Net Assets (000) | Expenses | Net Invest- ment Income (Loss) | Expenses | Net Invest- ment Income (Loss) | Portfolio Turnover Rate | |||||||||||||||||
| $ | 1,642 | 1.17 | %* | 3.44 | %* | .72 | %* | 3.89 | %* | 9 | % | |||||||||||
| 1,899 | 1.34 | 3.13 | .75 | 3.72 | 14 | |||||||||||||||||
| 1,048 | 1.39 | 3.45 | .75 | 4.09 | 12 | |||||||||||||||||
| 635 | 1.39 | 3.17 | .75 | 3.81 | 12 | |||||||||||||||||
| 808 | 1.41 | 3.04 | .75 | 3.70 | 33 | |||||||||||||||||
| 841 | 1.28 | * | 3.07 | * | .75 | * | 3.60 | * | 11 | |||||||||||||
| 988 | 1.11 | 3.05 | .75 | 3.41 | 13 | |||||||||||||||||
| 1,681 | 1.57 | * | 3.08 | * | 1.14 | * | 3.52 | * | 9 | |||||||||||||
| 1,347 | 1.74 | 2.75 | 1.15 | 3.34 | 14 | |||||||||||||||||
| 399 | 1.79 | 3.04 | 1.15 | 3.68 | 12 | |||||||||||||||||
| 255 | 1.78 | 2.76 | 1.15 | 3.39 | 12 | |||||||||||||||||
| 187 | 1.90 | 2.54 | 1.15 | 3.29 | 33 | |||||||||||||||||
| 209 | 2.03 | * | 2.34 | * | 1.15 | * | 3.22 | * | 11 | |||||||||||||
| 174 | 1.86 | 2.30 | 1.15 | 3.01 | 13 | |||||||||||||||||
| 47,169 | .94 | * | 3.65 | * | .49 | * | 4.11 | * | 9 | |||||||||||||
| 59,528 | 1.09 | 3.38 | .50 | 3.97 | 14 | |||||||||||||||||
| 44,783 | 1.14 | 3.71 | .50 | 4.35 | 12 | |||||||||||||||||
| 48,510 | 1.14 | 3.42 | .50 | 4.06 | 12 | |||||||||||||||||
| 42,223 | 1.16 | 3.28 | .50 | 3.94 | 33 | |||||||||||||||||
| 40,606 | 1.03 | * | 3.32 | * | .50 | * | 3.85 | * | 11 | |||||||||||||
| 41,104 | .86 | 3.30 | .50 | 3.66 | 13 | |||||||||||||||||
| (a) | Per share Net Investment Income (Loss) is calculated using the average daily shares method. |
| (b) | Distributions from Capital Gains include short-term capital gains, if any. |
| (c) | Total return is the combination of changes in net asset value without any sales charge, reinvested dividend income at net asset value and reinvested capital gains distributions at net asset value, if any. Total returns are not annualized. |
| (d) | After expense reimbursement from the Adviser, where applicable. Ratios do not reflect the effect of custodian fee credits earned on the Fund’s net cash on deposit with the custodian bank, where applicable. |
| (e) | For the eleven months ended May 31, 2011. |
| (f) | Effective January 18, 2011, Class C Shares and Class Y Shares previously offered by FAF Advisors were renamed Class C1 Shares and Class I Shares, respectively. |
| (g) | For the nine months ended June 30, 2006. |
| * | Annualized. |
See accompanying notes to financial statements.
| Nuveen Investments | 101 |
Financial Highlights (continued)
| Selected data for a share outstanding throughout each period: | ||||||||||||||||||||||||||||||||||||
| Class (Commencement Date) | ||||||||||||||||||||||||||||||||||||
| Investment Operations | Less Distributions | |||||||||||||||||||||||||||||||||||
| OREGON INTERMEDIATE | ||||||||||||||||||||||||||||||||||||
| Beginning Net Asset Value | Net Invest- ment Income (Loss)(a) | Net Realized/ Unrealized Gain (Loss) | Total | Net Invest- ment Income | Capital Gains(b) | Total | Ending Net Asset Value | Total Return(c) | ||||||||||||||||||||||||||||
Class A (2/99) | ||||||||||||||||||||||||||||||||||||
Year Ended 5/31 | ||||||||||||||||||||||||||||||||||||
2011(e) | $ | 10.11 | $ | .29 | $ | .05 | $ | .34 | $ | (.28 | ) | $ | — | $ | (.28 | ) | $ | 10.17 | 3.46 | % | ||||||||||||||||
Year Ended 6/30 | ||||||||||||||||||||||||||||||||||||
2010 | 9.77 | .35 | .33 | .68 | (.34 | ) | — | (.34 | ) | 10.11 | 7.05 | |||||||||||||||||||||||||
2009 | 9.68 | .36 | .09 | .45 | (.36 | ) | — | (.36 | ) | 9.77 | 4.77 | |||||||||||||||||||||||||
2008 | 9.72 | .35 | (.02 | ) | .33 | (.36 | ) | (.01 | ) | (.37 | ) | 9.68 | 3.39 | |||||||||||||||||||||||
2007 | 9.78 | .37 | (.02 | ) | .35 | (.37 | ) | (.04 | ) | (.41 | ) | 9.72 | 3.54 | |||||||||||||||||||||||
2006(h) | 10.07 | .27 | (.25 | ) | .02 | (.27 | ) | (.04 | ) | (.31 | ) | 9.78 | .16 | |||||||||||||||||||||||
Year Ended 9/30 | ||||||||||||||||||||||||||||||||||||
2005 | 10.30 | .36 | (.19 | ) | .17 | (.36 | ) | (.04 | ) | (.40 | ) | 10.07 | 1.67 | |||||||||||||||||||||||
Class C (1/11) | ||||||||||||||||||||||||||||||||||||
Year Ended 5/31 | ||||||||||||||||||||||||||||||||||||
2011(g) | 9.78 | .09 | .40 | .49 | (.12 | ) | — | (.12 | ) | 10.15 | 5.04 | |||||||||||||||||||||||||
Class I (8/97)(f) | ||||||||||||||||||||||||||||||||||||
Year Ended 5/31 | ||||||||||||||||||||||||||||||||||||
2011(e) | 10.11 | .31 | .05 | .36 | (.30 | ) | — | (.30 | ) | 10.17 | 3.62 | |||||||||||||||||||||||||
Year Ended 6/30 | ||||||||||||||||||||||||||||||||||||
2010 | 9.77 | .35 | .35 | .70 | (.36 | ) | — | (.36 | ) | 10.11 | 7.21 | |||||||||||||||||||||||||
2009 | 9.68 | .37 | .10 | .47 | (.38 | ) | — | (.38 | ) | 9.77 | 4.92 | |||||||||||||||||||||||||
2008 | 9.72 | .37 | (.03 | ) | .34 | (.37 | ) | (.01 | ) | (.38 | ) | 9.68 | 3.54 | |||||||||||||||||||||||
2007 | 9.78 | .38 | (.02 | ) | .36 | (.38 | ) | (.04 | ) | (.42 | ) | 9.72 | 3.70 | |||||||||||||||||||||||
2006(h) | 10.07 | .28 | (.25 | ) | .03 | (.28 | ) | (.04 | ) | (.32 | ) | 9.78 | .28 | |||||||||||||||||||||||
Year Ended 9/30 | ||||||||||||||||||||||||||||||||||||
2005 | 10.30 | .38 | (.19 | ) | .19 | (.38 | ) | (.04 | ) | (.42 | ) | 10.07 | 1.82 | |||||||||||||||||||||||
| 102 | Nuveen Investments |
| Ratios/Supplemental Data | ||||||||||||||||||||||
| Ratios to Average Net Assets Before Reimbursement | Ratios to Average Net Assets After Reimbursement(d) | |||||||||||||||||||||
Ending Net Assets (000) | Expenses | Net Invest- ment Income (Loss) | Expenses | Net Invest- ment Income (Loss) | Portfolio Turnover Rate | |||||||||||||||||
| $ | 31,399 | .97 | %* | 3.04 | %* | .82 | %* | 3.18 | %* | 12 | % | |||||||||||
| 31,043 | 1.10 | 3.12 | .85 | 3.37 | 19 | |||||||||||||||||
| 10,963 | 1.12 | 3.43 | .85 | 3.70 | 19 | |||||||||||||||||
| 5,967 | 1.12 | 3.37 | .85 | 3.64 | 15 | |||||||||||||||||
| 7,895 | 1.12 | 3.44 | .85 | 3.71 | 43 | |||||||||||||||||
| 9,456 | 1.11 | * | 3.36 | * | .85 | * | 3.62 | * | 13 | |||||||||||||
| 9,356 | 1.06 | 3.35 | .85 | 3.56 | 20 | |||||||||||||||||
| 632 | 1.40 | * | 2.50 | * | 1.36 | * | 2.53 | * | 12 | |||||||||||||
| 113,827 | .74 | * | 3.26 | * | .65 | * | 3.35 | * | 12 | |||||||||||||
| 133,816 | .85 | 3.37 | .70 | 3.52 | 19 | |||||||||||||||||
| 119,959 | .87 | 3.67 | .70 | 3.84 | 19 | |||||||||||||||||
| 120,800 | .87 | 3.61 | .70 | 3.78 | 15 | |||||||||||||||||
| 109,357 | .87 | 3.69 | .70 | 3.86 | 43 | |||||||||||||||||
| 111,344 | .86 | * | 3.61 | * | .70 | * | 3.77 | * | 13 | |||||||||||||
| 133,613 | .81 | 3.60 | .70 | 3.71 | 20 | |||||||||||||||||
| (a) | Per share Net Investment Income (Loss) is calculated using the average daily shares method. |
| (b) | Distributions from Capital Gains include short-term capital gains, if any. |
| (c) | Total return is the combination of changes in net asset value without any sales charge, reinvested dividend income at net asset value and reinvested capital gains distributions at net asset value, if any. Total returns are not annualized. |
| (d) | After expense reimbursement from the Adviser, where applicable. Ratios do not reflect the effect of custodian fee credits earned on the Fund’s net cash on deposit with the custodian bank, where applicable. |
| (e) | For the eleven months ended May 31, 2011. |
| (f) | Effective January 18, 2011, Class Y Shares previously offered by FAF Advisors were renamed Class I Shares. |
| (g) | For the period January 18, 2011 (commencement of operations) through May 31, 2011. |
| (h) | For the nine months ended June 30, 2006. |
| * | Annualized. |
See accompanying notes to financial statements.
| Nuveen Investments | 103 |
Notes to Financial Statements (all dollars and shares are rounded to thousands (000))
1. General Information and Significant Accounting Policies General Information
On July 28, 2010, U.S. Bancorp, the indirect parent company of FAF Advisors, Inc. (“FAF Advisors”), entered into an agreement to sell a portion of FAF Advisors’ asset management business to Nuveen Investments, Inc. (“Nuveen”). Included in the sale was the part of FAF Advisors’ asset management business that advises the funds included in this report. The sale closed on December 31, 2010 (the “Sale”).
In connection with the Sale, the funds’ Board of Directors was asked to consider and approve new investment advisory agreements for the funds with Nuveen Asset Management, a wholly-owned subsidiary of Nuveen. The new investment advisory agreements for each fund were submitted to the funds’ shareholders for approval and took effect on January 1, 2011. Effective January 1, 2011, the funds’ adviser, Nuveen Asset Management, changed its name to Nuveen Fund Advisors, Inc. (“Nuveen Fund Advisors” or the “Adviser”). Concurrently, the Adviser formed a wholly-owned subsidiary, Nuveen Asset Management, LLC (the “Sub-Adviser”), to house its portfolio management capabilities and to serve as the funds’ sub-adviser, and the funds’ portfolio managers became employees of the Sub-Adviser. This allocation of responsibilities between the Adviser and the Sub-Adviser affects each of the funds. The Adviser will compensate the Sub-Adviser for the portfolio management services it provides to the funds from each fund’s management fee.
There was no change in the funds’ investment objectives or policies as a result of the Sale. The Sale did result in a change to each fund’s name effective January 1, 2011.
The funds’ Board of Directors also approved new distribution agreements with Nuveen Investments, LLC, a wholly-owned subsidiary of Nuveen. Effective April 30, 2011, Nuveen Investments, LLC changed its name to Nuveen Securities, LLC.
First American Investment Funds, Inc., known as Nuveen Investment Funds, Inc. effective April 4, 2011, (the “Trust”), is an open-end investment company registered under the Investment Company Act of 1940, as amended. The Trust is comprised of the Nuveen Colorado Tax Free Fund (“Colorado Tax Free”), formerly known as First American Colorado Tax Free Fund, Nuveen Minnesota Intermediate Municipal Bond Fund (“Minnesota Intermediate”), formerly known as First American Minnesota Intermediate Tax Free Fund, Nuveen Minnesota Municipal Bond Fund (“Minnesota”), formerly known as First American Minnesota Tax Free Fund, Nuveen Missouri Tax Free Fund (“Missouri Tax Free”), formerly known as First American Missouri Tax Free Fund, Nuveen Nebraska Municipal Bond Fund (“Nebraska”), formerly known as First American Nebraska Tax Free Fund, Nuveen Ohio Tax Free Fund (“Ohio Tax Free”), formerly known as First American Ohio Tax Free Fund and Nuveen Oregon Intermediate Municipal Bond Fund (“Oregon Intermediate”), formerly known as First American Oregon Intermediate Tax Free Fund (each a “Fund” and collectively, the “Funds”), among others.
The investment objective of Colorado Tax Free, Minnesota Intermediate, Minnesota, Missouri Tax Free, Nebraska, Ohio Tax Free and Oregon Intermediate is to provide maximum current income that is exempt from both federal income tax and its respective state income tax to the extent consistent with prudent investment risk.
Under normal market conditions, as a fundamental policy, each Fund invests at least 80% of its net assets (plus the amount of any borrowings for investment purposes) in municipal securities that pay interest that is exempt from federal and its respective state income tax, including the federal and state alternative minimum tax. Each Fund normally may invest up to 20% of its net assets in taxable obligations, including obligations the interest on which is subject to the federal and state, where applicable, alternative minimum tax.
Each Fund’s most recent prospectus provides further descriptions of each Fund’s investment objective, principal investment strategies and principal risks.
During the current fiscal period, the Funds’ Board of Directors approved a change in the Funds’ fiscal and tax year ends from June 30 to May 31.
Effective January 18, 2011, Class C Shares and Class Y Shares previously offered by FAF Advisors were renamed Class C1 Shares and Class I Shares, respectively. Class C1 Shares are not available for new accounts or for additional investment into existing accounts, but Class C1 Shares can be issued for purposes of dividend reinvestment.
Effective January 18, 2011, Minnesota Intermediate, Minnesota, Nebraska and Oregon Intermediate began offering Class C Shares only to qualifying institutional investors and certain other qualifying accounts.
Significant Accounting Policies
The following is a summary of significant accounting policies followed by the Funds in the preparation of their financial statements in accordance with U.S. generally accepted accounting principles (“U.S. GAAP”).
Investment Valuation
Prices of municipal bonds are provided by a pricing service approved by the Funds’ Board of Directors. These securities are generally classified as Level 2 for fair value measurement purposes. When price quotes are not readily available (which is usually the case for municipal bonds) the pricing service establishes a security’s fair value using methods that may include consideration of the following: yields or prices of investments of comparable quality, type of issue, coupon, maturity and rating, market quotes or indications of value
| 104 | Nuveen Investments |
from security dealers, evaluations of anticipated cash flows or collateral, general market conditions and other information and analysis, including the obligor’s credit characteristics considered relevant. In pricing certain securities, particularly less liquid and lower quality securities, the pricing service may consider information about a security, its issuer, or market activity provided by the Adviser. These securities are generally classified as Level 2 or Level 3 depending on the priority of the significant inputs. Investments in open-end funds are valued at their respective net asset values on the valuation date. These investment vehicles are generally classified as Level 1.
Futures contracts are valued using the closing settlement price or, in the absence of such a price, the last traded price. Futures contracts are generally classified as Level 1.
Certain securities may not be able to be priced by the pre-established pricing methods as described above. Such securities may be valued by the Funds’ Board of Directors or its designee at fair value. These securities generally include, but are not limited to, restricted securities (securities which may not be publicly sold without registration under the Securities Act of 1933, as amended) for which a pricing service is unable to provide a market price; securities whose trading has been formally suspended; debt securities that have gone into default and for which there is no current market quotation; a security whose market price is not available from a pre-established pricing source; a security with respect to which an event has occurred that is likely to materially affect the value of the security after the market has closed but before the calculation of a Fund’s net asset value (as may be the case in non-U.S. markets on which the security is primarily traded) or make it difficult or impossible to obtain a reliable market quotation; and a security whose price, as provided by the pricing service, is not deemed to reflect the security’s fair value. As a general principle, the fair value of a security would appear to be the amount that the owner might reasonably expect to receive for them in a current sale. A variety of factors may be considered in determining the fair value of these securities, which may include consideration of the following: yields or prices of investments of comparable quality, type of issue, coupon, maturity and rating, market quotes or indications of value from security dealers, evaluations of anticipated cash flows or collateral, general market conditions and other information and analysis, including the obligor’s credit characteristics considered relevant. These securities are generally classified as Level 2 or Level 3 depending on the priority of the significant inputs. Regardless of the method employed to value a particular security, all valuations are subject to review by the Funds’ Board of Directors or its designee.
Refer to Footnote 2 – Fair Value Measurements for further details on the leveling of securities held by the Funds as of the end of the reporting period.
Investment Transactions
Investment transactions are recorded on a trade date basis. Realized gains and losses from transactions are determined on the specific identification method, which is the same basis used for federal income tax purposes. Investments purchased on a when-issued/ delayed delivery basis may have extended settlement periods. Any investments so purchased are subject to market fluctuation during this period. The Funds have instructed the custodian to segregate assets with a current value at least equal to the amount of the when-issued/delayed delivery purchase commitments. At May 31, 2011, Minnesota Intermediate, Minnesota, Missouri, Nebraska and Ohio had outstanding when issued/delayed delivery purchase commitments of $613,149, $3,627,243, $194,624, $1,815,386 and $259,160, respectively. There were no such outstanding purchase commitments in any of the other Funds.
Investment Income
Interest income, which reflects the amortization of premiums and includes accretion of discounts for financial reporting purposes, is recorded on an accrual basis. Dividend income is recorded on the ex-dividend date. Interest income also reflects pay down gains and losses, if any.
Professional Fees
Professional fees presented on the Statement of Operations consist of legal fees incurred in the normal course of operations, audit fees, tax consulting fees and, in some cases, workout expenditures. Workout expenditures are incurred in an attempt to protect or enhance an investment, or to pursue other claims or legal actions on behalf of Fund shareholders.
Income Taxes
Each Fund is a separate taxpayer for federal income tax purposes. Each Fund intends to distribute substantially all of its net investment income and net capital gains to shareholders and to otherwise comply with the requirements of Subchapter M of the Internal Revenue Code applicable to regulated investment companies. Therefore, no federal income tax provision is required. Furthermore, each Fund intends to satisfy conditions that will enable interest from municipal securities, which is exempt from regular federal and designated state income taxes, to retain such tax-exempt status when distributed to shareholders of the Funds. Net realized capital gains and ordinary income distributions paid by the Funds are subject to federal taxation.
For all open tax years and all major taxing jurisdictions, management of the Funds has concluded that there are no significant uncertain tax positions that would require recognition in the financial statements. Open tax years are those that are open for examination by taxing authorities (i.e., generally the last four tax year ends and the interim tax period since then). Furthermore, management of the Funds is also not aware of any tax positions for which it is reasonably possible that the total amounts of unrecognized tax benefits will significantly change in the next twelve months.
| Nuveen Investments | 105 |
Notes to Financial Statements (continued)
Dividends and Distributions to Shareholders
The Funds declare dividends from their net investment income daily and pay shareholders monthly. Fund shares begin to accrue dividends on the business day after the day when the monies used to purchase Fund shares are collected by the Funds’ transfer agent.
Net realized capital gains and/or market discount from investment transactions, if any, are declared and distributed to shareholders at least annually. Furthermore, capital gains are distributed only to the extent they exceed available capital loss carryforwards.
Distributions to shareholders of net investment income, net realized capital gains and/or market discount, if any, are recorded on the ex-dividend date. The amount and timing of distributions are determined in accordance with federal income tax regulations, which may differ from U.S. GAAP.
Inverse Floating Rate Securities
Each Fund is authorized to invest in inverse floating rate securities. An inverse floating rate security is created by depositing a municipal bond, typically with a fixed interest rate, into a special purpose trust created by a broker-dealer. In turn, this trust (a) issues floating rate certificates, in face amounts equal to some fraction of the deposited bond’s par amount or market value, that typically pay short-term tax-exempt interest rates to third parties, and (b) issues to a long-term investor (such as the Fund) an inverse floating rate certificate (sometimes referred to as an “inverse floater”) that represents all remaining or residual interest in the trust. The income received by the inverse floater holder varies inversely with the short-term rate paid to the floating rate certificates’ holders, and In most circumstances the inverse floater holder bears substantially all of the underlying bond’s downside investment risk and also benefits disproportionately from any potential appreciation of the underlying bond’s value. The price of an inverse floating rate security will be more volatile than that of the underlying bond because the interest rate is dependent on not only the fixed coupon rate of the underlying bond but also on the short-term interest paid on the floating rate certificates, and because the inverse floating rate security essentially bears the risk of loss of the greater face value of the underlying bond.
A Fund may purchase an inverse floating rate security in a secondary market transaction without first owning the underlying bond (referred to as an “externally-deposited inverse floater”), or instead by first selling a fixed-rate bond to a broker-dealer for deposit into the special purpose trust and receiving in turn the residual interest in the trust (referred to as a “self-deposited inverse floater”). The inverse floater held by a Fund gives the Fund the right (a) to cause the holders of the floating rate certificates to tender their notes at par, and (b) to have the broker transfer the fixed-rate bond held by the trust to the Fund, thereby collapsing the trust. An investment in an externally-deposited inverse floater is identified in the Portfolio of Investments as “(IF) – Inverse floating rate investment.” An investment in a self-deposited inverse floater is accounted for as a financing transaction. In such instances, a fixed-rate bond deposited into a special purpose trust is identified in the Portfolio of Investments as “(UB) – Underlying bond of an inverse floating rate trust reflected as a financing transaction,” with the Fund accounting for the short-term floating rate certificates issued by the trust as “Floating rate obligations” on the Statement of Assets and Liabilities. In addition, the Fund reflects in “Interest and dividends from unaffiliated investments” the entire earnings of the underlying bond and recognizes the related interest paid to the holders of the short-term floating rate certificates as “Interest expense on floating rate obligations” on the Statement of Operations.
During the eleven months ended May 31, 2011, the Funds did not invest in externally-deposited inverse floaters and/or self-deposited inverse floaters.
Futures Contracts
Each Fund is subject to interest rate risk in the normal course of pursuing its investment objectives and is authorized to invest in futures contracts in attempt to manage such risk. Upon entering into a futures contract, a Fund is required to deposit with the broker an amount of cash or liquid securities equal to a specified percentage of the contract amount. This is known as the “initial margin.” Cash held by the broker to cover initial margin requirements on open futures contracts, if any, is recognized as “Deposits with brokers for open futures contracts” on the Statement of Assets and Liabilities. Subsequent payments (“variation margin”) are made or received by a Fund each day, depending on the daily fluctuation of the value of the contract. Variation margin is recognized as a receivable or payable for “Variation margin on futures contracts” on the Statement of Assets and Liabilities, when applicable.
During the period the futures contract is open, changes in the value of the contract are recognized as an unrealized gain or loss by “marking-to-market” on a daily basis to reflect the changes in market value of the contract, which is recognized as “Change in net unrealized appreciation (depreciation) of futures contracts” on the Statement of Operations. When the contract is closed or expired, the Fund records a realized gain or loss equal to the difference between the value of the contract on the closing date and value of the contract when originally entered into, which is recognized as “Net realized gain (loss) from futures contracts” on the Statement of Operations.
Risks of investments in futures contracts include the possible adverse movement in the price of the securities or indices underlying the contracts, the possibility that there may not be a liquid secondary market for the contracts and/or that a change in the value of the contract may not correlate with a change in the value of the underlying securities or indices. The Funds did not enter into futures contracts during the eleven months ended May 31, 2011.
| 106 | Nuveen Investments |
Market and Counterparty Credit Risk
In the normal course of business each Fund may invest in financial instruments and enter into financial transactions where risk of potential loss exists due to changes in the market (market risk) or failure of the other party to the transaction to perform (counterparty credit risk). The potential loss could exceed the value of the financial assets recorded on the financial statements. Financial assets, which potentially expose each Fund to counterparty credit risk, consist principally of cash due from counterparties on forward, option and swap transactions, when applicable. The extent of each Fund’s exposure to counterparty credit risk in respect to these financial assets approximates their carrying value as recorded on the Statement of Assets and Liabilities. Futures contracts, when applicable, expose a Fund to minimal counterparty credit risk as they are exchange traded and the exchange’s clearinghouse, which is counterparty to all exchange traded futures, guarantees the futures contracts against default.
Each Fund helps manage counterparty credit risk by entering into agreements only with counterparties the Adviser believes have the financial resources to honor their obligations and by having the Adviser monitor the financial stability of the counterparties. Additionally, counterparties may be required to pledge collateral daily (based on the daily valuation of the financial asset) on behalf of each Fund with a value approximately equal to the amount of any unrealized gain above a predetermined threshold. Reciprocally, when each Fund has an unrealized loss, the Funds have instructed the custodian to pledge assets of the Funds as collateral with a value approximately equal to the amount of the unrealized loss above a pre-determined threshold. Collateral pledges are monitored and subsequently adjusted if and when the valuations fluctuate, either up or down, by at least the pre-determined threshold amount.
Zero Coupon Securities
Each Fund is authorized to invest in zero coupon securities. A zero coupon security does not pay a regular interest coupon to its holders during the life of the security. Tax-exempt income to the holder of the security comes from accretion of the difference between the original purchase price of the security at issuance and the par value of the security at maturity and is effectively paid at maturity. The market prices of zero coupon securities generally are more volatile than the market prices of securities that pay interest periodically.
Multiclass Operations and Allocations
Income and expenses of the Funds that are not directly attributable to a specific class of shares are prorated among the classes based on the relative net assets of each class. Expenses directly attributable to a class of shares, which presently only include 12b-1 distribution and shareholder service fees, are recorded to the specific class.
Income, realized and unrealized capital gains and losses of the Funds are prorated among the classes based on the relative net assets of each class.
Interfund Lending Program
During the period July 1, 2010 through December 31, 2010, pursuant to an exemptive order issued by the Securities and Exchange Commission, the Funds, along with other registered investment companies in the First American Funds family, were allowed to participate in an interfund lending program. This program provided an alternative credit facility allowing the Funds to borrow from, or lend money to, other participating funds. The Funds did not have any interfund lending transactions during the period July 1, 2010 through December 31, 2010. The exemptive order terminated with respect to the Funds on December 31, 2010, in connection with the Sale.
Indemnifications
Under the Trust’s organizational documents, its officers and directors are indemnified against certain liabilities arising out of the performance of their duties to the Trust. In addition, in the normal course of business, the Trust enters into contracts that provide general indemnifications to other parties. The Trust’s maximum exposure under these arrangements is unknown as this would involve future claims that may be made against the Trust that have not yet occurred. However, the Trust has not had prior claims or losses pursuant to these contracts and expects the risk of loss to be remote.
Use of Estimates
The preparation of financial statements in conformity with U.S. GAAP requires management to make estimates and assumptions that affect the reported amounts of assets and liabilities at the date of the financial statements and the reported amounts of increases and decreases in net assets from operations during the reporting period. Actual results may differ from those estimates.
| Nuveen Investments | 107 |
Notes to Financial Statements (continued)
2. Fair Value Measurements
Fair value is defined as the price that the Funds would receive upon selling an investment or transferring a liability in an orderly transaction to an independent buyer in the principal or most advantageous market of the investment. A three-tier hierarchy is used to maximize the use of observable market data and minimize the use of unobservable inputs and to establish classification of fair value measurements for disclosure purposes. Observable inputs reflect the assumptions market participants would use in pricing the asset or liability. Observable inputs are based on market data obtained from sources independent of the reporting entity. Unobservable inputs reflect the reporting entity’s own assumptions about the assumptions market participants would use in pricing the asset or liability. Unobservable inputs are based on the best information available in the circumstances. The three-tier hierarchy of inputs is summarized in the three broad levels listed below:
| Level 1 – | Quoted prices in active markets for identical securities. | |
| Level 2 – | Other significant observable inputs (including quoted prices for similar securities, interest rates, prepayment speeds, credit risk, etc.). | |
| Level 3 – | Significant unobservable inputs (including management’s assumptions in determining the fair value of investments). |
The inputs or methodologies used for valuing securities are not an indication of the risk associated with investing in those securities. The following is a summary of each Fund’s fair value measurements as of May 31, 2011:
| Colorado Tax Free | Level 1 | Level 2 | Level 3 | Total | ||||||||||||
Investments: | ||||||||||||||||
Municipal Bonds | $ | — | $ | 54,695 | $ | — | $ | 54,695 | ||||||||
Short-Term Investments | 147 | — | — | 147 | ||||||||||||
Total | $ | 147 | $ | 54,695 | $ | — | $ | 54,842 | ||||||||
| Minnesota Intermediate | Level 1 | Level 2 | Level 3 | Total | ||||||||||||
Investments: | ||||||||||||||||
Municipal Bonds | $ | — | $ | 232,109 | $ | — | $ | 232,109 | ||||||||
Short-Term Investments | 2,203 | — | — | 2,203 | ||||||||||||
Total | $ | 2,203 | $ | 232,109 | $ | — | $ | 234,312 | ||||||||
| Minnesota | Level 1 | Level 2 | Level 3 | Total | ||||||||||||
Investments: | ||||||||||||||||
Municipal Bonds | $ | — | $ | 158,559 | $ | — | $ | 158,559 | ||||||||
Short-Term Investments | 2,661 | — | — | 2,661 | ||||||||||||
Total | $ | 2,661 | $ | 158,559 | $ | — | $ | 161,220 | ||||||||
| Missouri Tax Free | Level 1 | Level 2 | Level 3 | Total | ||||||||||||
Investments: | ||||||||||||||||
Municipal Bonds | $ | — | $ | 157,382 | $ | — | $ | 157,382 | ||||||||
Short-Term Investments | 565 | — | — | 565 | ||||||||||||
Total | $ | 565 | $ | 157,382 | $ | — | $ | 157,947 | ||||||||
| Nebraska | Level 1 | Level 2 | Level 3 | Total | ||||||||||||
Investments: | ||||||||||||||||
Municipal Bonds | $ | — | $ | 42,609 | $ | — | $ | 42,609 | ||||||||
Short-Term Investments | 826 | — | — | 826 | ||||||||||||
Total | $ | 826 | $ | 42,609 | $ | — | $ | 43,435 | ||||||||
| Ohio Tax Free | Level 1 | Level 2 | Level 3 | Total | ||||||||||||
Investments: | ||||||||||||||||
Municipal Bonds | $ | — | $ | 49,795 | $ | — | $ | 49,795 | ||||||||
Short-Term Investments | 332 | — | — | 332 | ||||||||||||
Total | $ | 332 | $ | 49,795 | $ | — | $ | 50,127 | ||||||||
| Oregon Intermediate | Level 1 | Level 2 | Level 3 | Total | ||||||||||||
Investments: | ||||||||||||||||
Municipal Bonds | $ | — | $ | 143,965 | $ | — | $ | 143,965 | ||||||||
Short-Term Investments | 275 | — | — | 275 | ||||||||||||
Total | $ | 275 | $ | 143,965 | $ | — | $ | 144,240 | ||||||||
During the eleven months ended May 31, 2011, the Funds recognized no significant transfers to/from Level 1, Level 2 or Level 3.
| 108 | Nuveen Investments |
3. Derivative Instruments and Hedging Activities
The Funds record derivative instruments at fair value, with changes in fair value recognized on the Statement of Operations, when applicable. Even though the Funds’ investments in derivatives may represent economic hedges, they are not considered to be hedge transactions for financial reporting purposes. The Funds did not invest in derivative instruments during the eleven months ended May 31, 2011.
4. Fund Shares
Transactions in Fund shares were as follows:
| Colorado Tax Free | ||||||||||||||||||||||||
| Eleven Months Ended 5/31/11 | Year Ended 6/30/10 | Year Ended 6/30/09 | ||||||||||||||||||||||
| Shares | Amount | Shares | Amount | Shares | Amount | |||||||||||||||||||
Shares issued from merger (1): | ||||||||||||||||||||||||
Class A | — | $ | — | — | $ | — | 614 | $ | 5,874 | |||||||||||||||
Class C1 (2) | — | — | — | — | — | — | ||||||||||||||||||
Class I (2) | — | — | — | — | 4,418 | 42,389 | ||||||||||||||||||
Shares sold: | ||||||||||||||||||||||||
Class A | 304 | 3,013 | 102 | 1,018 | 59 | 877 | ||||||||||||||||||
Class C1 (2) | 11 | 115 | 55 | 554 | 63 | 598 | ||||||||||||||||||
Class I (2) | 1,125 | 11,494 | 988 | 9,950 | 264 | 1,672 | ||||||||||||||||||
Shares issued to shareholders due to reinvestment of distributions: | ||||||||||||||||||||||||
Class A | 40 | 396 | 44 | 442 | 34 | 323 | ||||||||||||||||||
Class C1 (2) | 8 | 78 | 10 | 104 | 12 | 118 | ||||||||||||||||||
Class I (2) | 22 | 219 | 19 | 196 | 10 | 87 | ||||||||||||||||||
| (1,510 | ) | 15,315 | 1,218 | 12,264 | 5,474 | 51,938 | ||||||||||||||||||
Shares redeemed: | ||||||||||||||||||||||||
Class A | (337 | ) | (3,347 | ) | (232 | ) | (2,325 | ) | (118 | ) | (1,135 | ) | ||||||||||||
Class C1 (2) | (86 | ) | (857 | ) | (53 | ) | (537 | ) | (52 | ) | (494 | ) | ||||||||||||
Class I (2) | (1,815 | ) | (18,193 | ) | (1,507 | ) | (15,096 | ) | (879 | ) | (8,391 | ) | ||||||||||||
| (2,238 | ) | (22,397 | ) | (1,792 | ) | (17,958 | ) | (1,049 | ) | (10,020 | ) | |||||||||||||
Net increase (decrease) | (728 | ) | $ | (7,082 | ) | (574 | ) | $ | (5,694 | ) | 4,425 | $ | 41,918 | |||||||||||
| Minnesota Intermediate | ||||||||||||||||||||||||
| Eleven Months Ended 5/31/11 | Year Ended 6/30/10 | Year Ended 6/30/09 | ||||||||||||||||||||||
| Shares | Amount | Shares | Amount | Shares | Amount | |||||||||||||||||||
Shares sold: | ||||||||||||||||||||||||
Class A | 1,134 | $ | 11,516 | 1,407 | $ | 14,085 | 1,026 | $ | 9,912 | |||||||||||||||
Class C (3) | 61 | 610 | — | — | — | — | ||||||||||||||||||
Class C1 (2) | 412 | 4,205 | 424 | 4,278 | — | — | ||||||||||||||||||
Class I (2) | 3,617 | 36,462 | 4,529 | 44,976 | 4,173 | 39,545 | ||||||||||||||||||
Shares issued to shareholders due to reinvestment of distributions: | ||||||||||||||||||||||||
Class A | 91 | 914 | 76 | 761 | 72 | 687 | ||||||||||||||||||
Class C (3) | — | 2 | — | — | — | — | ||||||||||||||||||
Class C1 (2) | 12 | 123 | 3 | 34 | — | — | ||||||||||||||||||
Class I (2) | 17 | 168 | 17 | 168 | 29 | 279 | ||||||||||||||||||
| 5,344 | 54,000 | 6,456 | 64,302 | 5,300 | 50,423 | |||||||||||||||||||
Shares redeemed: | ||||||||||||||||||||||||
Class A | (1,032 | ) | (10,363 | ) | (409 | ) | (4,091 | ) | (982 | ) | (9,326 | ) | ||||||||||||
Class C (3) | — | — | — | — | — | — | ||||||||||||||||||
Class C1 (2) | (204 | ) | (2,040 | ) | (36 | ) | (370 | ) | — | — | ||||||||||||||
Class I (2) | (3,957 | ) | (39,705 | ) | (3,247 | ) | (32,281 | ) | (4,400 | ) | (41,124 | ) | ||||||||||||
| (5,193 | ) | (52,108 | ) | (3,692 | ) | (36,742 | ) | (5,382 | ) | (50,450 | ) | |||||||||||||
Net increase (decrease) | 151 | $ | 1,892 | 2,764 | $ | 27,560 | (82 | ) | $ | (27 | ) | |||||||||||||
| (1) | Refer to Footnote 8 – Fund Mergers for further details. |
| (2) | Effective January 18, 2011, Class C Shares and Class Y Shares previously offered by FAF Advisors, were renamed Class C1 Shares Class I Shares, respectively. |
| (3) | Class C Shares commenced operations on January 18, 2011. |
| Nuveen Investments | 109 |
Notes to Financial Statements (continued)
| Minnesota | ||||||||||||||||||||||||
| Eleven Months Ended 5/31/11 | Year Ended 6/30/10 | Year Ended 6/30/09 | ||||||||||||||||||||||
| Shares | Amount | Shares | Amount | Shares | Amount | |||||||||||||||||||
Shares sold: | ||||||||||||||||||||||||
Class A | 776 | $ | 8,397 | 1,218 | $ | 12,953 | 1,152 | $ | 11,454 | |||||||||||||||
Class C (2) | 57 | 601 | 638 | 6,758 | — | — | ||||||||||||||||||
Class C1 (1) | 335 | 3,329 | — | — | 448 | 4,451 | ||||||||||||||||||
Class I (1) | 922 | 9,980 | 1,443 | 15,413 | 1,806 | 17,375 | ||||||||||||||||||
Shares issued to shareholders due to reinvestment of distributions: | ||||||||||||||||||||||||
Class A | 165 | 1,787 | 207 | 2,206 | 283 | 2,771 | ||||||||||||||||||
Class C (2) | — | 3 | 58 | 611 | — | — | ||||||||||||||||||
Class C1 (1) | 50 | 539 | — | — | 60 | 585 | ||||||||||||||||||
Class I (1) | 7 | 71 | 7 | 76 | 10 | 100 | ||||||||||||||||||
| 2,312 | 24,707 | 3,571 | 38,017 | 3,759 | 36,736 | |||||||||||||||||||
Shares redeemed: | ||||||||||||||||||||||||
Class A | (1,533 | ) | (16,489 | ) | (1,708 | ) | (18,154 | ) | (2,438 | ) | (23,953 | ) | ||||||||||||
Class C (2) | — | — | (284 | ) | (3,009 | ) | — | — | ||||||||||||||||
Class C1 (1) | (802 | ) | (8,182 | ) | — | — | (368 | ) | (3,560 | ) | ||||||||||||||
Class I (1) | (1,051 | ) | (11,375 | ) | (824 | ) | (8,805 | ) | (1,892 | ) | (18,223 | ) | ||||||||||||
| (3,386 | ) | (36,046 | ) | (2,816 | ) | (29,968 | ) | (4,698 | ) | (45,736 | ) | |||||||||||||
Net increase (decrease) | (1,074 | ) | $ | (11,339 | ) | 755 | $ | 8,049 | (939 | ) | $ | (9,000 | ) | |||||||||||
| Missouri Tax Free | ||||||||||||||||||||||||
| Eleven Months Ended 5/31/11 | Year Ended 6/30/10 | Year Ended 6/30/09 | ||||||||||||||||||||||
| Shares | Amount | Shares | Amount | Shares | Amount | |||||||||||||||||||
Shares sold: | ||||||||||||||||||||||||
Class A | 197 | $ | 2,319 | 335 | $ | 3,897 | 242 | $ | 2,562 | |||||||||||||||
Class C1 (1) | 28 | 333 | 90 | 1,029 | 31 | 342 | ||||||||||||||||||
Class I (1) | 2,193 | 25,435 | 3,576 | 41,446 | 2,680 | 29,215 | ||||||||||||||||||
Shares issued to shareholders due to reinvestment of distributions: | ||||||||||||||||||||||||
Class A | 43 | 501 | 56 | 653 | 47 | 517 | ||||||||||||||||||
Class C1 (1) | 3 | 34 | 3 | 33 | 1 | 17 | ||||||||||||||||||
Class I (1) | 15 | 170 | 22 | 256 | 18 | 190 | ||||||||||||||||||
| 2,479 | 28,792 | 4,082 | 47,314 | 3,019 | 32,843 | |||||||||||||||||||
Shares redeemed: | ||||||||||||||||||||||||
Class A | (321 | ) | (3,703 | ) | (401 | ) | (4,633 | ) | (270 | ) | (2,921 | ) | ||||||||||||
Class C1 (1) | (31 | ) | (349 | ) | (19 | ) | (212 | ) | — | (2 | ) | |||||||||||||
Class I (1) | (2,449 | ) | (28,323 | ) | (2,625 | ) | (30,537 | ) | (4,026 | ) | (43,791 | ) | ||||||||||||
| (2,801 | ) | (32,375 | ) | (3,045 | ) | (35,382 | ) | (4,296 | ) | (46,714 | ) | |||||||||||||
Net increase (decrease) | (322 | ) | $ | (3,583 | ) | 1,037 | $ | 11,932 | (1,277 | ) | $ | (13,871 | ) | |||||||||||
| (1) | Effective January 18, 2011, Class C Shares and Class Y Shares previously offered by FAF Advisors, were renamed Class C1 Shares and Class I Shares, respectively. |
| (2) | Class C Shares commenced operations on January 18, 2011. |
| 110 | Nuveen Investments |
| Nebraska | ||||||||||||||||||||||||
| Eleven Months Ended 5/31/11 | Year Ended 6/30/10 | Year Ended 6/30/09 | ||||||||||||||||||||||
| Shares | Amount | Shares | Amount | Shares | Amount | |||||||||||||||||||
Shares sold: | ||||||||||||||||||||||||
Class A | 186 | $ | 1,922 | 156 | $ | 1,600 | 129 | $ | 1,265 | |||||||||||||||
Class C (2) | 31 | 312 | — | — | — | — | ||||||||||||||||||
Class C1 (1) | 72 | 730 | 155 | 1,575 | 87 | 819 | ||||||||||||||||||
Class I (1) | 355 | 3,620 | 406 | 4,178 | 732 | 7,086 | ||||||||||||||||||
Shares issued to shareholders due to reinvestment of distributions: | ||||||||||||||||||||||||
Class A | 14 | 146 | 15 | 153 | 17 | 166 | ||||||||||||||||||
Class C (2) | — | 2 | — | — | — | — | ||||||||||||||||||
Class C1 (1) | 9 | 95 | 7 | 75 | 5 | 47 | ||||||||||||||||||
Class I (1) | 19 | 192 | 13 | 134 | 9 | 91 | ||||||||||||||||||
| 686 | 7,019 | 752 | 7,715 | 979 | 9,474 | |||||||||||||||||||
Shares redeemed: | ||||||||||||||||||||||||
Class A | (121 | ) | (1,231 | ) | (153 | ) | (1,577 | ) | (117 | ) | (1,154 | ) | ||||||||||||
Class C (2) | — | — | — | — | — | — | ||||||||||||||||||
Class C1 (1) | (77 | ) | (768 | ) | (20 | ) | (204 | ) | (7 | ) | (66 | ) | ||||||||||||
Class I (1) | (381 | ) | (3,885 | ) | (468 | ) | (4,804 | ) | (556 | ) | (5,323 | ) | ||||||||||||
| (579 | ) | (5,884 | ) | (641 | ) | (6,585 | ) | (680 | ) | (6,543 | ) | |||||||||||||
Net increase (decrease) | 107 | $ | 1,135 | 111 | $ | 1,130 | 299 | $ | 2,931 | |||||||||||||||
| Ohio Tax Free | ||||||||||||||||||||||||
| Eleven Months Ended 5/31/11 | Year Ended 6/30/10 | Year Ended 6/30/09 | ||||||||||||||||||||||
| Shares | Amount | Shares | Amount | Shares | Amount | |||||||||||||||||||
Shares sold: | ||||||||||||||||||||||||
Class A | 18 | $ | 186 | 107 | $ | 1,100 | 44 | $ | 425 | |||||||||||||||
Class C1 (1) | 47 | 487 | 91 | 927 | 27 | 266 | ||||||||||||||||||
Class I (1) | 862 | 8,933 | 1,797 | 18,536 | 624 | 6,084 | ||||||||||||||||||
Shares issued to shareholders due to reinvestment of distributions: | ||||||||||||||||||||||||
Class A | 5 | 58 | 5 | 48 | 3 | 24 | ||||||||||||||||||
Class C1 (1) | 3 | 28 | 1 | 9 | 1 | 5 | ||||||||||||||||||
Class I (1) | 8 | 88 | 19 | 190 | 30 | 294 | ||||||||||||||||||
| 943 | 9,780 | 2,020 | 20,810 | 729 | 7,098 | |||||||||||||||||||
Shares redeemed: | ||||||||||||||||||||||||
Class A | (46 | ) | (469 | ) | (36 | ) | (368 | ) | (4 | ) | (36 | ) | ||||||||||||
Class C1 (1) | (16 | ) | (162 | ) | (2 | ) | (15 | ) | (13 | ) | (117 | ) | ||||||||||||
Class I (1) | (2,015 | ) | (20,220 | ) | (625 | ) | (6,461 | ) | (975 | ) | (9,288 | ) | ||||||||||||
| (2,077 | ) | (20,851 | ) | (663 | ) | (6,844 | ) | (992 | ) | (9,441 | ) | |||||||||||||
Net increase (decrease) | (1,134 | ) | $ | (11,071 | ) | 1,357 | $ | 13,966 | (263 | ) | $ | (2,343 | ) | |||||||||||
| (1) | Effective January 18, 2011, Class C Shares and Class Y Shares previously offered by FAF Advisors, were renamed Class C1 Shares and Class I Shares, respectively. |
| (2) | Class C Shares commenced operations on January 18, 2011. |
| Nuveen Investments | 111 |
Notes to Financial Statements (continued)
| Oregon Intermediate | ||||||||||||||||||||||||
| Eleven Months Ended 5/31/11 | Year Ended 6/30/10 | Year Ended 6/30/09 | ||||||||||||||||||||||
| Shares | Amount | Shares | Amount | Shares | Amount | |||||||||||||||||||
Shares sold: | ||||||||||||||||||||||||
Class A | 939 | $ | 9,517 | 2,048 | $ | 20,541 | 645 | $ | 6,281 | |||||||||||||||
Class C (2) | 62 | 615 | — | — | — | — | ||||||||||||||||||
Class I (1) | 2,355 | 23,543 | 4,537 | 45,505 | 2,596 | 25,178 | ||||||||||||||||||
Shares issued to shareholders due to reinvestment of distributions: | ||||||||||||||||||||||||
Class A | 72 | 727 | 54 | 542 | 14 | 141 | ||||||||||||||||||
Class C (2) | — | 4 | — | — | — | — | ||||||||||||||||||
Class I (1) | 14 | 141 | 10 | 103 | 9 | 87 | ||||||||||||||||||
| 3,442 | 34,547 | 6,649 | 66,691 | 3,264 | 31,687 | |||||||||||||||||||
Shares redeemed: | ||||||||||||||||||||||||
Class A | (993 | ) | (9,904 | ) | (154 | ) | (1,554 | ) | (154 | ) | (1,497 | ) | ||||||||||||
Class C (2) | — | — | — | — | — | — | ||||||||||||||||||
Class I (1) | (4,411 | ) | (44,255 | ) | (3,588 | ) | (35,968 | ) | (2,804 | ) | (26,966 | ) | ||||||||||||
| (5,404 | ) | (54,159 | ) | (3,742 | ) | (37,522 | ) | (2,958 | ) | (28,463 | ) | |||||||||||||
Net increase (decrease) | (1,962 | ) | $ | (19,612 | ) | 2,907 | $ | 29,169 | 306 | $ | 3,224 | |||||||||||||
| (1) | Effective January 18, 2011, Class Y Shares previously offered by FAF Advisors were renamed Class I Shares. |
| (2) | Class C Shares commenced operations on January 18, 2011. |
5. Investment Transactions
Purchases and sales (including maturities but excluding short-term investments, where applicable) during the eleven months ended May 31, 2011, were as follows:
| Colorado Tax Free | Minnesota Intermediate | Minnesota | Missouri Tax Free | |||||||||||||
Purchases | $ | 12,351 | $ | 38,742 | $ | 45,490 | $ | 23,126 | ||||||||
Sales and maturities | 17,314 | 28,953 | 39,589 | 15,972 | ||||||||||||
| Nebraska | Ohio Tax Free | Oregon Intermediate | ||||||||||||||
Purchases | $ | 12,492 | $ | 5,349 | $ | 18,597 | ||||||||||
Sales and maturities | 8,706 | 14,164 | 26,699 | |||||||||||||
6. Income Tax Information
The following information is presented on an income tax basis. Differences between amounts for financial statement and federal income tax purposes are primarily due to timing differences in recognizing certain gains and losses on investment transactions. To the extent that differences arise that are permanent in nature, such amounts are reclassified within the capital accounts as detailed below. Temporary differences do not require reclassification. Temporary and permanent differences do not impact the net asset values of the Funds.
At May 31, 2011, the cost and unrealized appreciation (depreciation) of investments, as determined on a federal income tax basis, were as follows:
| Colorado Tax Free | Minnesota Intermediate | Minnesota | Missouri Tax Free | |||||||||||||
Cost of investments | $ | 53,395 | $ | 223,951 | $ | 158,587 | $ | 156,541 | ||||||||
Gross unrealized: | ||||||||||||||||
Appreciation | 2,145 | 11,211 | 6,338 | 4,799 | ||||||||||||
Depreciation | (698 | ) | (850 | ) | (3,706 | ) | (3,393 | ) | ||||||||
Net unrealized appreciation (depreciation) of investments | $ | 1,447 | $ | 10,361 | $ | 2,632 | $ | 1,406 | ||||||||
| Nebraska | Ohio Tax Free | Oregon Intermediate | ||||||||||||||
Cost of investments | $ | 42,341 | $ | 49,097 | $ | 137,311 | ||||||||||
Gross unrealized: | ||||||||||||||||
Appreciation | 1,431 | 1,626 | 7,471 | |||||||||||||
Depreciation | (337 | ) | (596 | ) | (542 | ) | ||||||||||
Net unrealized appreciation (depreciation) of investments | $ | 1,094 | $ | 1,030 | $ | 6,929 | ||||||||||
| 112 | Nuveen Investments |
Permanent differences, primarily due to tax equalization, resulted in reclassifications among the Funds’ components of net assets at May 31, 2011, the Funds’ tax year-end, as follows:
| Colorado Tax Free | Minnesota Intermediate | Minnesota | Missouri Tax Free | |||||||||||||
Capital paid-in | $ | 63 | $ | — | $ | — | $ | 28 | ||||||||
Undistributed (Over-distribution of) net investment income | — | — | — | — | ||||||||||||
Accumulated net realized gain (loss) | (63 | ) | — | — | (28 | ) | ||||||||||
| Nebraska | Ohio Tax Free | Oregon Intermediate | ||||||||||||||
Capital paid-in | $ | — | $ | — | $ | — | ||||||||||
Undistributed (Over-distribution of) net investment income | — | — | — | |||||||||||||
Accumulated net realized gain (loss) | — | — | — | |||||||||||||
The tax components of undistributed net tax-exempt income, net ordinary income and net long-term capital gains at May 31, 2011, the Funds’ tax year end, were as follows:
| Colorado Tax Free | Minnesota Intermediate | Minnesota | Missouri Tax Free | |||||||||||||
Undistributed net tax-exempt income* | $ | 281 | $ | 921 | $ | 1,024 | $ | 729 | ||||||||
Undistributed net ordinary income** | 1 | 29 | 71 | 142 | ||||||||||||
Undistributed net long-term capital gains | 49 | 91 | — | 83 | ||||||||||||
| Nebraska | Ohio Tax Free | Oregon Intermediate | ||||||||||||||
Undistributed net tax-exempt income* | $ | 133 | $ | 230 | $ | 450 | ||||||||||
Undistributed net ordinary income** | 24 | — | 97 | |||||||||||||
Undistributed net long-term capital gains | — | — | 18 | |||||||||||||
| * | Undistributed net tax exempt income (on a tax basis) has not been reduced for the dividends declared during the period May 1, 2011 through May 31, 2011 and paid on June 1, 2011. |
| ** | Net ordinary income consists of net taxable income derived from dividends, interest and net short-term capital gains, if any. |
The tax character of distributions paid during the eleven months ended May 31, 2011, and during the tax years ended June 30, 2010 and June 30, 2009, was designated for purposes of the dividends paid deduction as follows:
| Eleven months ended May 31, 2011 | Colorado Tax Free | Minnesota Intermediate | Minnesota | Missouri Tax Free | ||||||||||||
Distributions from net tax-exempt income*** | $ | 2,406 | $ | 7,479 | $ | 5,053 | $ | 5,941 | ||||||||
Distributions from net ordinary income** | 103 | 15 | 88 | 97 | ||||||||||||
Distributions from net long-term capital gains**** | 520 | — | — | 199 | ||||||||||||
| Eleven months ended May 31, 2011 | Nebraska | Ohio Tax Free | Oregon Intermediate | |||||||||||||
Distributions from net tax-exempt income*** | $ | 1,620 | $ | 2,215 | $ | 4,508 | ||||||||||
Distributions from net ordinary income** | 13 | — | 108 | |||||||||||||
Distributions from net long-term capital gains**** | — | — | — | |||||||||||||
| 2010 | Colorado Tax Free | Minnesota Intermediate | Minnesota | Missouri Tax Free | ||||||||||||
Distributions from net tax-exempt income | $ | 2,802 | $ | 7,780 | $ | 6,226 | $ | 6,465 | ||||||||
Distributions from net ordinary income** | 29 | 36 | 73 | 7 | ||||||||||||
Distributions from net long-term capital gains | 583 | 104 | 10 | 1,094 | ||||||||||||
| 2010 | Nebraska | Ohio Tax Free | Oregon Intermediate | |||||||||||
Distributions from net tax-exempt income | $ | 1,703 | $ | 2,104 | $ | 5,244 | ||||||||
Distributions from net ordinary income** | 7 | — | 95 | |||||||||||
Distributions from net long-term capital gains | — | — | — | |||||||||||
| ** | Net ordinary income consists of net taxable income derived from dividends, interest and net short-term capital gains, if any. |
| *** | The Funds hereby designate these amounts paid during the eleven months ended May 31, 2011, as Exempt Interest Dividends |
| **** | The Funds designated as long-term capital gain dividend, pursuant to the Internal Revenue Code Section 852 (b)(3), the amount necessary to reduce earnings and profits of the Funds related to net capital gain to zero for the eleven months ended May 31, 2011. |
| Nuveen Investments | 113 |
Notes to Financial Statements (continued)
| 2009 | Colorado Tax Free | Minnesota Intermediate | Minnesota | Missouri Tax Free | ||||||||||||
Distributions from net tax-exempt income | $ | 1,960 | $ | 7,840 | $ | 6,482 | $ | 6,705 | ||||||||
Distributions from net ordinary income** | 67 | 13 | 2 | 62 | ||||||||||||
Distributions from net long-term capital gains | 139 | 514 | 862 | 273 | ||||||||||||
| 2009 | Nebraska | Ohio Tax Free | Oregon Intermediate | |||||||||||
Distributions from net tax-exempt income | $ | 1,745 | $ | 2,045 | $ | 4,872 | ||||||||
Distributions from net ordinary income** | — | — | 4 | |||||||||||
Distributions from net long-term capital gains | — | — | — | |||||||||||
| ** | Net ordinary income consists of net taxable income derived from dividends, interest and net short-term capital gains, if any. |
At May 31, 2011, the Funds’ tax year end, the following Funds had unused capital loss carryforwards available for federal income tax purposes to be applied against future capital gains, if any. If not applied, the carryforwards will expire as follows:
| Minnesota | Nebraska | Ohio Tax Free | ||||||||||
Expiration: | ||||||||||||
May 31, 2017 | $ | — | $ | 328 | $ | 224 | ||||||
May 31, 2018 | 65 | 36 | 205 | |||||||||
May 31, 2019 | 58 | — | 30 | |||||||||
Total | $ | 123 | $ | 364 | $ | 459 | ||||||
During the eleven months ended May 31, 2011, the following Funds utilized their capital loss carryforwards as follows:
| Nebraska | Oregon Intermediate | |||||||
Utilized capital loss carryforwards | $ | 31 | $ | 141 | ||||
The Funds have elected to defer net realized losses from investments incurred from November 1, 2010 through May 31, 2011, the Funds’ tax year end, (“post-October losses”) in accordance with federal income tax regulations. Post-October losses are treated as having arisen on the first day of the following fiscal year. The following Funds have elected to defer post-October losses as follows:
| Minnesota | Ohio Tax Free | |||||||
Post-October capital losses | $ | 663 | $ | 450 | ||||
7. Management Fees and Other Transactions with Affiliates
Investment Advisory Fees
During the period July 1, 2010 through December 31, 2010, pursuant to an investment advisory agreement (the “Agreement”), FAF Advisors managed each Fund’s assets and furnished related office facilities, equipment, research, and personnel. The Agreement required each Fund to pay FAF Advisors a monthly advisory fee equal, on an annual basis, to .50% of each Fund’s average daily net assets.
Effective January 1, 2011, pursuant to a new investment advisory agreement (the “New Agreement”), the Funds’ new investment adviser is Nuveen Fund Advisors. Under the New Agreement, each Fund’s management fee consists of two components – a fund-level fee, based only on the amount of assets within each individual Fund, and a complex-level fee, based on the aggregate amount of all eligible fund assets managed by Nuveen Fund Advisors. This pricing structure enables Fund shareholders to benefit from growth in the assets within their Fund as well as from growth in the amount of complex-wide assets managed by Nuveen Fund Advisors.
The annual fund-level fee for each Fund, payable monthly, is calculated according to the following schedule:
| Average Daily Net Assets | Colorado Tax Free | Minnesota Intermediate | Minnesota | Missouri Tax Free | ||||||||||||
For the first $125 million | .4500 | % | .3500 | % | .3500 | % | .4500 | % | ||||||||
For the next $125 million | .4375 | .3375 | .3375 | .4375 | ||||||||||||
For the next $250 million | .4250 | .3250 | .3250 | .4250 | ||||||||||||
For the next $500 million | .4125 | .3125 | .3125 | .4125 | ||||||||||||
For the next $1 billion | .4000 | .3000 | .3000 | .4000 | ||||||||||||
For net assets over $2 billion | .3750 | .2750 | .2750 | .3750 | ||||||||||||
| Average Daily Net Assets | Nebraska | Ohio Tax Free | Oregon Intermediate | |||||||||||||
For the first $125 million | .3500 | % | .4500 | % | .3500 | % | ||||||||||
For the next $125 million | .3375 | .4375 | .3375 | |||||||||||||
For the next $250 million | .3250 | .4250 | .3250 | |||||||||||||
For the next $500 million | .3125 | .4125 | .3125 | |||||||||||||
For the next $1 billion | .3000 | .4000 | .3000 | |||||||||||||
For net assets over $2 billion | .2750 | .3750 | .2750 | |||||||||||||
| 114 | Nuveen Investments |
The annual complex-level fee for each Fund, payable monthly, is determined by taking the complex-level fee rate, which is based on the aggregate amount of “eligible assets” of all Nuveen funds as set forth in the schedule below, and making, as appropriate, an upward adjustment to that rate based upon the percentage of the particular fund’s assets that are not “eligible assets.” The complex-level fee schedule is as follows:
| Complex-Level Asset Breakpoint Level* | Effective Rate at Breakpoint Level | |||
$55 billion | .2000 | % | ||
$56 billion | .1996 | |||
$57 billion | .1989 | |||
$60 billion | .1961 | |||
$63 billion | .1931 | |||
$66 billion | .1900 | |||
$71 billion | .1851 | |||
$76 billion | .1806 | |||
$80 billion | .1773 | |||
$91 billion | .1691 | |||
$125 billion | .1599 | |||
$200 billion | .1505 | |||
$250 billion | .1469 | |||
$300 billion | .1445 | |||
| * | The complex-level fee is calculated based upon the aggregate daily “eligible assets” of all Nuveen Funds. Eligible assets do not include assets attributable to investments in other Nuveen Funds or assets in excess of $2 billion added to the Nuveen fund complex in connection with Nuveen Fund Advisors’ assumption of the management of the former First American Funds effective January 1, 2011. Eligible assets include closed-end fund assets managed by Nuveen Fund Advisors that are attributable to financial leverage. For these purposes, financial leverage includes the closed-end funds’ use of preferred stock and borrowings and investments in the residual interest certificates (also called inverse floating rate securities) in tender option bond (TOB) trusts, including the portion of assets held by the TOB trust that has been effectively financed by the trust’s issuance of floating rate securities, subject to an agreement by Nuveen Fund Advisors as to certain funds to limit the amount of such assets for determining eligible assets in certain circumstances. |
As of May 31, 2011, the complex-level fee rate for each Fund was as follows:
| Fund | Rate | |||
Colorado Tax Free | .1989 | % | ||
Minnesota Intermediate | .1971 | |||
Minnesota | .1975 | |||
Missouri Tax Free | .1971 | |||
Nebraska | .1964 | |||
Ohio Tax Free | .2000 | |||
Oregon Intermediate | .1986 | |||
The management fee compensates Nuveen Fund Advisors for the overall investment advisory and administrative services and general office facilities it provides for the Funds. Effective January 1, 2011, Nuveen Fund Advisors has entered into a sub-advisory agreement with the Sub-Adviser. The Sub-Adviser is compensated for its services to the Funds from the management fees paid to Nuveen Fund Advisors.
During the period July 1, 2010 through December 31, 2010, the Funds may have invested in related money market funds that were series of First American Funds, Inc., subject to certain limitations. In order to avoid the payment of duplicative investment advisory fees to FAF Advisors, which acted as the investment advisor to both the investing Funds and the related money market funds, FAF Advisors reimbursed each investing Fund an amount equal to that portion of FAF Advisors’ investment advisory fee received from the related money market funds that was attributable to the assets of the investing Fund. This reimbursement, if any, is recognized as a component of “Expense Reimbursement” on the Statement of Operations and terminated with respect to the Funds on December 31, 2010, in connection with the Sale.
During the period July 1, 2010 through December 31, 2010, FAF Advisors agreed to waive fees and reimburse other Fund expenses through June 30, 2011, so that total Fund operating expenses, as a percentage of each Fund’s average daily net assets, did not exceed the following amounts:
| Share Class | ||||||||||||
| Fund | A | C (1) | Y (1) | |||||||||
Colorado Tax Free | .75 | % | 1.15 | % | .50 | % | ||||||
Minnesota Intermediate | .75 | 1.35 | .70 | |||||||||
Minnesota | .85 | 1.35 | .70 | |||||||||
Missouri Tax Free | .85 | 1.35 | .70 | |||||||||
Nebraska | .75 | 1.15 | .50 | |||||||||
Ohio Tax Free | .75 | 1.15 | .50 | |||||||||
Oregon Intermediate | .85 | N/A | .70 | |||||||||
| N/A | – Not applicable; Fund did not offer Class C Shares during the six months ended December 31, 2010. |
| (1) | – Effective January 18, 2011, Class C Shares and Class Y shares previously offered by FAF Advisors were renamed Class C1 Shares and Class I Shares, respectively. |
| Nuveen Investments | 115 |
Notes to Financial Statements (continued)
Effective January 1, 2011, Nuveen Fund Advisors has contractually agreed to waive fees and reimburse other Fund expenses of each Fund so that total annual Fund operating expenses, after waivers and/or expense reimbursements and excluding acquired Fund fees and expenses, do not exceed the average daily net assets of any class of Fund shares in the amounts and for the time periods stated in the following table.
Colorado Tax Free | Minnesota Intermediate | Minnesota | Missouri | |||||||||||||
Class A (1) | .7000 | % | .7500 | % | .8500 | % | .8500 | % | ||||||||
Class C (2) | N/A | 1.4500 | 1.4500 | N/A | ||||||||||||
Class C1(3) | 1.1500 | 1.3500 | 1.3500 | 1.3500 | ||||||||||||
Class I (3) | .5000 | .7000 | .7000 | .7000 | ||||||||||||
First expiration date | June 30, 2011 | March 31, 2012 | March 31, 2012 | March 31, 2012 | ||||||||||||
After first expiration date: | ||||||||||||||||
Class A (1) | .9000 | % | N/A | N/A | N/A | |||||||||||
Class C1(3) | 1.3500 | N/A | N/A | N/A | ||||||||||||
Class I (3) | .7000 | N/A | N/A | N/A | ||||||||||||
Expiration date | March 31, 2012 | N/A | N/A | N/A | ||||||||||||
| Nebraska | Ohio Tax Free | Oregon Intermediate | ||||||||||||||
Class A (1) | .7000 | % | .7000 | % | .8500 | % | ||||||||||
Class C (2) | 1.2500 | N/A | 1.4500 | |||||||||||||
Class C1(3) | 1.1500 | 1.1500 | N/A | |||||||||||||
Class I (3) | .5000 | .5000 | .7000 | |||||||||||||
First expiration date | June 30, 2011 | June 30, 2011 | March 31, 2012 | |||||||||||||
After first expiration date: | ||||||||||||||||
Class A (1) | .9000 | % | .9000 | % | N/A | |||||||||||
Class C (2) | 1.4500 | N/A | N/A | |||||||||||||
Class C1(3) | 1.3500 | 1.3500 | N/A | |||||||||||||
Class I (3) | .7000 | .7000 | N/A | |||||||||||||
Expiration date | March 31, 2012 | March 31, 2012 | N/A | |||||||||||||
| N/A | – Not applicable. |
| (1) | – Nuveen Fund Advisors has contractually agreed to reimburse Class A Share 12b-1 fees to the extent necessary so that total annual Fund operating expenses, after waivers and/or expense reimbursements and excluding acquired Fund fees and expenses do not exceed .7500%, .8500% and .8500% for Class A Shares of Minnesota Intermediate, Minnesota and Oregon Intermediate, respectively. |
| (2) | – Effective January 18, 2011, Minnesota Intermediate, Minnesota, Nebraska and Oregon Intermediate began offering Class C1 Shares only to qualifying institutional investors and certain other qualifying accounts. |
| (3) | – Effective January 18, 2011, Class C Shares and Class Y Shares previously offered by FAF Advisors were renamed Class C1 Shares and Class I Shares, respectively. |
During the period July 1, 2010 through December 31, 2010, independent directors of the Funds may have participated and elected to defer receipt of part or all of their annual compensation under a deferred compensation plan (the “Plan”). Deferred amounts were treated as though equivalent dollar amounts had been invested in shares of selected open-end funds as designated by each director. All amounts in the Plan were 100% vested and accounts under the Plan were obligations of the Funds. Deferred amounts remain in the Funds until distributed in accordance with the Plan.
Effective January 1, 2011, independent directors may elect to defer receipt of all or a portion of the annual compensation they are entitled to receive from certain funds advised by Nuveen Fund Advisors. Under the plan, deferred amounts are treated as though equal dollar amounts had been invested in shares of select funds advised by Nuveen Fund Advisors.
Administration Fees
During the period July 1, 2010 through December 31, 2010, FAF Advisors served as the Funds’ administrator pursuant to an administration agreement between FAF Advisors and the Funds. U.S. Bancorp Fund Services, LLC (“USBFS”) served as sub-administrator pursuant to a sub-administration agreement between USBFS and FAF Advisors. FAF Advisors is a subsidiary of U.S. Bank National Association (“U.S. Bank”). Both U.S. Bank and USBFS are direct subsidiaries of U.S. Bancorp. Under the administration agreement, FAF Advisors was compensated to provide, or compensated other entities to provide, services to the Funds. These services included various legal, oversight, and administrative and accounting services. The Funds paid FAF Advisors administration fees, which were calculated daily and paid monthly, equal to the Funds’ pro rata share of an amount equal, on an annual basis, to .25% of the aggregate average daily net assets of all open-end funds in the First American Funds family up to $8 billion, .235% on the next $17 billion of the aggregate average daily net assets, .22% on the next $25 billion of the aggregate average daily net assets and .20% of the aggregate average daily net assets in excess of $50 billion. All fees paid to the sub-administrator were paid from the administration fee. In addition to these fees, the Funds may have reimbursed FAF Advisors and the sub-administrator for any out-of-pocket expenses incurred in providing administration services. Effective January 1, 2011, FAF Advisors and USBFS no longer serve as the Funds’ administrator and sub-administrator, respectively, and the Funds have not entered into any new administration or sub-administration agreements.
| 116 | Nuveen Investments |
Transfer Agent Fees
USBFS serves as the Funds’ transfer agent pursuant to a transfer agent agreement with the Trust. The Funds are charged transfer agent fees on a per shareholder account basis, subject to a minimum fee per share class. These fees are charged to each Fund based upon the number of accounts within each Fund. In addition to these fees, the Funds may reimburse USBFS for out-of-pocket expenses incurred in providing transfer agent services.
Custodian Fees
U.S. Bank serves as the custodian for the Fund pursuant to a custodian agreement with the Trust. The custodian fee charged for each Fund is equal to an annual rate of .005% of average daily net assets. All fees are computed daily and paid monthly. Interest earned on un-invested cash balances is used to reduce a portion of each Fund’s custodian expenses. These credits, if any, are recognized as “Custodian fee credit” on the Statement of Operations. Conversely, the custodian charges a fee for any cash overdrafts incurred, which increases the Funds’ custodian expenses.
Distribution and Shareholder Servicing (12b-1) Fees
During the period July 1, 2010 through December 31, 2010, Quasar Distributors, LLC (“Quasar”), a subsidiary of U.S. Bancorp, served as the distributor of the Funds pursuant to a distribution agreement with the Trust. Under the distribution agreement, and pursuant to a plan adopted by each Fund under Rule 12b-1 of the Investment Company Act, the Funds paid Quasar a monthly distribution and/or shareholder servicing fee equal to an annual rate of .25% and .65% of the Funds’ average daily net assets attributable to Class A Shares and Class C Shares (renamed Class C1 Shares), respectively. No distribution or shareholder servicing fees were paid by Class Y Shares (renamed Class I Shares). These fees may have been used by Quasar to provide compensation for sales support, distribution activities, and/or shareholder servicing activities. During the period July 1, 2010 through December 31, 2010, total distribution and shareholder servicing fees waived by Quasar for the following Funds were as follows:
| Fund | Amount | |||
Minnesota Intermediate | $ | 19 | ||
Oregon Intermediate | 17 | |||
Effective January 1, 2011, the Funds entered into a distribution agreement with Nuveen Securities, LLC, who now serves as the Funds’ distributor. Under the new agreement, Class A Shares incur a .20% (.15% for Class A Shares of Minnesota Intermediate) annual 12b-1 service fee. Class C Shares incur a .55% annual 12b-1 distribution fee and a .20% annual 12b-1 service fee. Class C1 Shares continue to incur a .40% annual 12b-1 distribution fee and a .25% annual 12b-1 service fee. Class I Shares continue to not be subject to any 12b-1 distribution or service fees. Annual distribution and service fees are based on average daily net assets.
Nuveen Securities LLC has contractually agreed to limit its Class A Share 12b-1 fees to .15% of average daily net assets through March 31, 2012 for Minnesota Intermediate.
All 12b-1 service and distribution fees collected on Class C1 Shares during the first year following a purchase were retained by Quasar and/or Nuveen Securities, LLC to compensate for commissions advanced to financial intermediaries. During the eleven months ended May 31, 2011, Quasar and/or Nuveen Securities, LLC. retained such 12b-1 fees as follows:
Colorado Tax Free | Minnesota Intermediate | Minnesota | Missouri Tax Free | |||||||||||||||
12b-1 fees retained (Unaudited) | $ | 9 | $ | 46 | $ | 86 | $ | 32 | ||||||||||
| Nebraska | Ohio Tax Free | Oregon Intermediate | ||||||||||||||
12b-1 fees retained (Unaudited) | $ | 12 | $ | 8 | $ | 14 | ||||||||||
The remaining 12b-1 fees charged to the Funds were paid to compensate financial intermediaries for providing services to shareholders relating to their investments.
During the eleven months ended May 31, 2011, Quasar and/or Nuveen Securities, LLC compensated financial intermediaries directly with commission advances at the time of purchase as follows:
Colorado Tax Free | Minnesota Intermediate | Minnesota | Missouri Tax Free | |||||||||||||||
Sales charges collected (Unaudited) | $ | 7 | $ | 60 | $ | 96 | $ | 36 | ||||||||||
Paid to financial intermediaries (Unaudited) | $ | 6 | $ | 54 | $ | 87 | $ | 34 | ||||||||||
| Nebraska | Ohio Tax Free | Oregon Intermediate | ||||||||||||||
Sales charges collected (Unaudited) | $ | 13 | $ | 4 | $ | 24 | ||||||||||
Paid to financial intermediaries (Unaudited) | $ | 12 | $ | 3 | $ | 22 | ||||||||||
During the eleven months ended May 31, 2011, Quasar and/or Nuveen Securities, LLC collected sales charges on purchases of Class A Shares, the majority of which were paid out as concessions to financial intermediaries as follows:
Colorado Tax Free | Minnesota Intermediate | Minnesota | Missouri Tax Free | |||||||||||||||
Commission advances (Unaudited) | $ | 1 | $ | 23 | $ | 36 | $ | 13 | ||||||||||
| Nuveen Investments | 117 |
Notes to Financial Statements (continued)
| Nebraska | Ohio Tax Free | Oregon Intermediate | ||||||||||||||
Commission advances (Unaudited) | $ | 8 | $ | 2 | $ | 19 | ||||||||||
Quasar and/or Nuveen Securities, LLC also received 12b-1 service fees on Class A Shares, substantially all of which were paid to compensate financial intermediaries for providing services to shareholders relating to their investments.
Other Fees and Expenses
In addition to investment advisory fees, transfer agent fees, custodian fees, and distribution and shareholder servicing fees, each Fund is responsible for paying other operating expenses, including: legal, auditing, registration fees, postage and printing of shareholder reports, fees and expenses of independent directors, insurance, and other miscellaneous expenses. During the period July 1, 2010 through December 31, 2010, legal fees and expenses of $17 were paid to a law firm of which an Assistant Secretary of the Funds was a partner.
Contingent Deferred Sales Charges
During the period July 1, 2010 through January 17, 2011, Class A Shares of Colorado Tax Free, Minnesota, Missouri, Nebraska and Ohio Tax Free were sold with an up-front sales charge of 4.25%. Class A Shares of Minnesota Intermediate and Oregon Intermediate were sold with an up-front sales charge of 2.25%. Class C Shares (renamed Class C1 Shares) were subject to a contingent deferred sales charge (“CDSC”) of 1% for twelve months. Class Y Shares (renamed Class I Shares) had no sales charge and were offered only to qualifying institutional investors and certain other qualifying accounts.
Effective January 18, 2011, Class A Shares of Colorado Tax Free, Minnesota, Missouri, Nebraska and Ohio Tax Free are sold with an up-front sales charge of 4.20%. Class A Shares of Minnesota Intermediate and Oregon Intermediate are sold with an up-front sales charge of 3.00%. Class A Share purchases of $1 million or more for the Funds are sold at net asset value without any sales charge. Class A Share purchases of the Funds may be subject to a CDSC if redeemed within eighteen months of purchase. Class C Shares and Class C1 Shares are subject to a CDSC of 1% if redeemed within twelve months of purchase. Class I Shares continue to have no sales charge and may be purchased under limited circumstance or by specified classes of investors.
Quasar and Nuveen Securities, LLC collected and retained CDSC on share redemptions during the eleven months ended May 31, 2011, as follows:
Colorado Tax Free | Minnesota Intermediate | Minnesota | Missouri Tax Free | |||||||||||||||
CDSC retained (Unaudited) | $ | 1 | $ | 9 | $ | 12 | $ | 1 | ||||||||||
| Nebraska | Ohio Tax Free | Oregon Intermediate | ||||||||||||||
CDSC retained (Unaudited) | $ | — | $ | — | $ | 3 | ||||||||||
8. Fund Mergers
Effective after the close of business on January 16, 2009, Colorado Tax Free acquired the assets and assumed the liabilities of First American Colorado Intermediate Tax Free Fund (“Colorado Intermediate Tax Free”). Colorado Tax Free was deemed to be the accounting survivor in the merger. Shareholders of Colorado Intermediate Tax Free approved the merger on December 30, 2008.
The merger was accomplished by tax free exchanges as detailed below:
| Share Class | ||||||||||||||||
| Colorado Tax Free | Class A | Class C | Class Y | Total | ||||||||||||
Net assets of Colorado Intermediate Tax Free | $ | 5,874 | $ | — | $ | 42,389 | $ | 48,263 | ||||||||
Colorado Intermediate Tax Free shares exchanged | 577 | — | 4,170 | 4,747 | ||||||||||||
Colorado Tax Free shares issued | 614 | — | 4,418 | 5,032 | ||||||||||||
Net assets of Colorado Tax Free immediately before the merger | $ | 4,995 | $ | 2,897 | $ | 15,034 | $ | 22,926 | ||||||||
Net assets of Colorado Tax Free immediately after the merger | $ | 10,869 | $ | 2,897 | $ | 57,423 | $ | 71,189 | ||||||||
9. New Accounting Pronouncements
Fair Value Measurements and Disclosures
On May 12, 2011, the Financial Accounting Standards Board (“FASB”) issued an Accounting Standard Update (“ASU”) modifying Topic 820, Fair Value Measurements and Disclosures. At the same time, the International Accounting Standards Board (“IASB”) issued International Financial Reporting Standard (“IFRS”) 13, Fair Value Measurement. The objective by the FASB and IASB is convergence of their guidance on fair value measurements and disclosures. Specifically, the ASU requires reporting entities to disclose ii) the amounts of any transfers between Level 1 and Level 2, and the reasons for the transfers, ii) for Level 3 fair value measurements, a) quantitative information about significant unobservable inputs used, b) a description of the valuation processes used by the reporting entity and c) a narrative description of the sensitivity of the fair value measurement to changes in unobservable inputs if a change in those inputs might result in a significantly higher or lower fair value measurement. The effective date of the ASU is for interim and annual periods beginning after December 15, 2011. At this time, management is evaluating the implications of this guidance and the impact it will have on the financial statement amounts and footnote disclosures, if any.
| 118 | Nuveen Investments |
Trustees and Officers (Unaudited)
The management of the Funds, including general supervision of the duties performed for the Funds by the Adviser, is the responsibility of the Board of Trustees of the Funds. The number of trustees of the Funds is currently set at ten. None of the trustees who are not “interested” persons of the Funds (referred to herein as “independent trustees”) has ever been a director or employee of, or consultant to, Nuveen or its affiliates. The names and business addresses of the trustees and officers of the Funds, their principal occupations and other affiliations during the past five years, the number of portfolios each oversees and other directorships they hold are set forth below.
The Funds’ Statement of Additional Information (“SAI”) includes more information about the trustees. To request a free copy, call Nuveen Investments at (800) 257-8787 or visit the Funds’ website at www.nuveen.com.
Name, Birthdate and Address | Position(s) Held with the Funds | Year First Elected or Appointed (1) | Principal Occupation(s) Including other Directorships During Past 5 Years | Number of Portfolios in Fund Complex Overseen by Trustee | ||||
| Independent Trustees: | ||||||||
Robert P. Bremner (2) 8/22/40 333 W. Wacker Drive Chicago, IL 60606 | Chairman of the Board and Trustee | 1996 | Private Investor and Management Consultant; Treasurer and Director, Humanities Council of Washington, D.C.; Board Member, Independent Directors Council affiliated with the Investment Company Institute. | 245 | ||||
Jack B. Evans 10/22/48 333 W. Wacker Drive Chicago, IL 60606 | Trustee | 1999 | President, The Hall-Perrine Foundation, a private philanthropic corporation (since 1996); Director and Chairman, United Fire Group, a publicly held company; member of the Board of Regents for the State of Iowa University System; Director, Source Media Group; Life Trustee of Coe College and the Iowa College Foundation; formerly, Director, Alliant Energy; formerly, Director, Federal Reserve Bank of Chicago; formerly, President and Chief Operating Officer, SCI Financial Group, Inc., a regional financial services firm. | 245 | ||||
William C. Hunter 3/6/48 333 W. Wacker Drive Chicago, IL 60606 | Trustee | 2004 | Dean, Tippie College of Business, University of Iowa (since 2006); Director (since 2004) of Xerox Corporation; Director (since 2005), Beta Gamma Sigma International Honor Society; Director of Wellmark, Inc. (since 2009); formerly, Dean and Distinguished Professor of Finance, School of Business at the University of Connecticut (2003-2006); previously, Senior Vice President and Director of Research at the Federal Reserve Bank of Chicago (1995-2003); formerly, Director (1997-2007), Credit Research Center at George Washington University. | 245 | ||||
David J. Kundert (2) 10/28/42 333 W. Wacker Drive Chicago, IL 60606 | Trustee | 2005 | Director, Northwestern Mutual Wealth Management Company; retired (since 2004) as Chairman, JPMorgan Fleming Asset Management, President and CEO, Banc One Investment Advisors Corporation, and President, One Group Mutual Funds; prior thereto, Executive Vice President, Banc One Corporation and Chairman and CEO, Banc One Investment Management Group; Member, Board of Regents, Luther College; member of the Wisconsin Bar Association; member of Board of Directors, Friends of Boerner Botanical Gardens; member of Board of Directors and Chair of Investment Committee, Greater Milwaukee Foundation. | 245 | ||||
William J. Schneider (2) 9/24/44 333 W. Wacker Drive Chicago, IL 60606 | Trustee | 1997 | Chairman of Miller-Valentine Partners Ltd., a real estate investment company; formerly, Senior Partner and Chief Operating Officer (retired 2004) of Miller-Valentine Group; member, University of Dayton Business School Advisory Council; member, Mid-America Health System Board; formerly, member and chair, Dayton Philharmonic Orchestra Association; formerly, member, Business Advisory Council, Cleveland Federal Reserve Bank. | 245 | ||||
Judith M. Stockdale 12/29/47 333 W. Wacker Drive Chicago, IL 60606 | Trustee | 1997 | Executive Director, Gaylord and Dorothy Donnelley Foundation (since 1994); prior thereto, Executive Director, Great Lakes Protection Fund (1990-1994). | 245 | ||||
Carole E. Stone (2) 6/28/47 333 W. Wacker Drive Chicago, IL 60606 | Trustee | 2007 | Director, Chicago Board Options Exchange (since 2006); Director, C2 Options Exchange, Incorporated (since 2009); formerly, Commissioner, New York State Commission on Public Authority Reform (2005-2010); formerly, Chair, New York Racing Association Oversight Board (2005-2007). | 245 | ||||
| Nuveen Investments | 119 |
Trustees and Officers (Unaudited) (continued)
Name, Birthdate and Address | Position(s) Held with the Funds | Year First Elected or Appointed (1) | Principal Occupation(s) During Past Five Years | Number of Portfolios in Fund Complex Overseen by Trustee | ||||
Virginia L. Stringer 8/16/44 333 West Wacker Drive Chicago, IL 60606 | Trustee | 2011 | Board Member, Mutual Fund Directors Forum; Member, Governing Board, Investment Company Institute’s Independent Directors Council; governance consultant and non-profit board member; former Owner and President, Strategic Management Resources, Inc. a management consulting firm; previously, held several executive positions in general management, marketing and human resources at IBM and The Pillsbury Company; Independent Director, First American Fund Complex (1987-2010) and Chair (1997-2010). | 245 | ||||
Terence J. Toth (2) 9/29/59 333 W. Wacker Drive Chicago, IL 60606 | Trustee | 2008 | Director, Legal & General Investment Management America, Inc. (since 2008); Managing Partner, Promus Capital (since 2008); formerly, CEO and President, Northern Trust Global Investments (2004-2007); Executive Vice President, Quantitative Management & Securities Lending (2000-2004); prior thereto, various positions with Northern Trust Company (since 1994); member: Goodman Theatre Board (since 2004), Chicago Fellowship Board (since 2005) and Catalyst Schools of Chicago Board (since 2008); formerly, member: Northern Trust Mutual Funds Board (2005-2007), Northern Trust Global Investments Board (2004-2007), Northern Trust Japan Board (2004-2007), Northern Trust Securities Inc. Board (2003-2007) and Northern Trust Hong Kong Board (1997-2004). | 245 | ||||
| Interested Trustee: | ||||||||
John P. Amboian (3) 6/14/61 333 W. Wacker Drive Chicago, IL 60606 | Trustee | 2008 | Chief Executive Officer and Chairman (since 2007), and Director (since 1999) of Nuveen Investments, Inc., formerly, President (1999-2007); Chief Executive Officer (since 2007) of Nuveen Investments Advisers Inc.; Director (since 1998) formerly, Chief Executive Officer (2007-2010) of Nuveen Fund Advisors, Inc. | 245 | ||||
Name, Birthdate and Address | Position(s) Held with the Funds | Year First Elected or Appointed (4) | Principal Occupation(s) During Past 5 Years | Number of Portfolios in Fund Complex Overseen by Officer | ||||
| Officers of the Funds: | ||||||||
Gifford R. Zimmerman 9/9/56 333 W. Wacker Drive Chicago, IL 60606 | Chief Administrative Officer | 1988 | Managing Director (since 2002), Assistant Secretary and Associate General Counsel of Nuveen Securities, LLC; Managing Director (since 2004) and Assistant Secretary (since 1994) of Nuveen Investments, Inc.; Managing Director (since 2002), Assistant Secretary (since 1997) and Co-General Counsel (since 2011) of Nuveen Fund Advisors, Inc.; Managing Director, Assistant Secretary and Associate General Counsel of Nuveen Asset Management, LLC (since 2011); Managing Director, Associate General Counsel and Assistant Secretary of Symphony Asset Management LLC (since 2003); Vice President and Assistant Secretary of NWQ Investment Management Company, LLC (since 2002), Nuveen Investments Advisers Inc. (since 2002), Tradewinds Global Investors LLC, and Santa Barbara Asset Management, LLC (since 2006), Nuveen HydePark Group LLC and Nuveen Investment Solutions, Inc. (since 2007) and of Winslow Capital Management Inc. (since 2010); Chief Administrative Officer and Chief Compliance Officer (since 2010) of Nuveen Commodities Asset Management, LLC; Chartered Financial Analyst. | 245 | ||||
Margo L. Cook 4/11/64 333 W. Wacker Drive Chicago, IL 60606 | Vice President | 2009 | Executive Vice President (since 2008) of Nuveen Investments, Inc. and of Nuveen Fund Advisors, Inc. (since 2011); previously, Head of Institutional Asset Management (2007-2008) of Bear Stearns Asset Management; Head of Institutional Asset Management (1986-2007) of Bank of NY Mellon; Chartered Financial Analyst. | 245 | ||||
| 120 | Nuveen Investments |
Name, Birthdate and Address | Position(s) Held with the Funds | Year First Elected or Appointed (4) | Principal Occupation(s) During Past 5 Years | Number of Portfolios in Fund Complex Overseen by Officer | ||||
Lorna C. Ferguson 10/24/45 333 W. Wacker Drive Chicago, IL 60606 | Vice President | 1998 | Managing Director (since 2004) of Nuveen Securities, LLC and Managing Director (since 2005) of Nuveen Fund Advisors, Inc. | 245 | ||||
Stephen D. Foy 5/31/54 333 W. Wacker Drive Chicago, IL 60606 | Vice President and Controller | 1998 | Senior Vice President (since 2010), formerly, Vice President (1993-2010) and Funds Controller (since 1998) of Nuveen Securities, LLC; Senior Vice President (since 2010), formerly, Vice President (2005-2010) of Nuveen Fund Advisors, Inc.; Certified Public Accountant. | 245 | ||||
Scott S. Grace 8/20/70 333 W. Wacker Drive Chicago, IL 60606 | Vice President and Treasurer | 2009 | Managing Director, Corporate Finance & Development, Treasurer (since 2009) of Nuveen Securities, LLC; Managing Director and Treasurer (since 2009) of Nuveen Fund Advisors, Inc., Nuveen Investment Solutions, Inc., Nuveen Investments Advisers, Inc., Nuveen Investments Holdings Inc. and (since (2011) Nuveen Asset Management, LLC; Vice President and Treasurer of NWQ Investment Management Company, LLC, Tradewinds Global Investors, LLC, Symphony Asset Management LLC and Winslow Capital Management, Inc.; Vice President of Santa Barbara Asset Management, LLC; formerly, Treasurer (2006-2009), Senior Vice President (2008-2009), previously, Vice President (2006-2008) of Janus Capital Group, Inc.; formerly, Senior Associate in Morgan Stanley’s Global Financial Services Group (2000-2003); Chartered Accountant Designation. | 245 | ||||
Walter M. Kelly 2/24/70 333 W. Wacker Drive Chicago, IL 60606 | Chief Compliance Officer and Vice President | 2003 | Senior Vice President (since 2008), Vice President (2006-2008) of Nuveen Securities, LLC; Senior Vice President (since 2008) and Assistant Secretary (since 2008) of Nuveen Fund Advisors, Inc. | 245 | ||||
Tina M. Lazar 8/27/61 333 W. Wacker Drive Chicago, IL 60606 | Vice President | 2002 | Senior Vice President (since 2009), formerly, Vice President of Nuveen Securities, LLC (1999-2009); Senior Vice President (since 2010), formerly, Vice President (2005-2010) of Nuveen Fund Advisors, Inc. | 245 | ||||
Larry W. Martin 7/27/51 333 West Wacker Drive Chicago, IL 60606 | Vice President and Assistant Secretary | 1997 | Senior Vice President (since 2010), formerly, Vice President (1993-2010), Assistant Secretary and Assistant General Counsel of Nuveen Securities, LLC; Senior Vice President (since 2011) of Nuveen Asset Management, LLC: Senior Vice President (since 2010), formerly, Vice President (2005-2010), and Assistant Secretary of Nuveen Investments, Inc.; Senior Vice President (since 2010), formerly Vice President (2005-2010), and Assistant Secretary (since 1997) of Nuveen Fund Advisors, Inc.; Vice President and Assistant Secretary of Nuveen Investments Advisers, Inc. (since 2002), NWQ Investment Management Company, LLC, Symphony Asset Management LLC (since 2003), Tradewinds Global Investors, LLC, Santa Barbara Asset Management, LLC (since 2006), Nuveen HydePark Group, LLC and Nuveen Investment Solutions, Inc. (since 2007), and of Winslow Capital Management, Inc. (since 2010); Vice President and Assistant Secretary of Nuveen Commodities Asset Management, LLC (since 2010). | 245 |
| Nuveen Investments | 121 |
Trustees and Officers (Unaudited) (continued)
Name, Birthdate and Address | Position(s) Held with the Funds | Year First Elected or Appointed (4) | Principal Occupation(s) Including other Directorships During Past 5 Years | Number of Portfolios in Fund Complex Overseen by Officer | ||||
Kevin J. McCarthy 3/26/66 333 W. Wacker Drive Chicago, IL 60606 | Vice President and Secretary | 2007 | Managing Director (since 2008), formerly, Vice President (2007-2008), Nuveen Securities, LLC; Managing Director (since 2008), Assistant Secretary (since 2007) and Co-General Counsel (since 2011) of Nuveen Fund Advisors, Inc.; Managing Director, Assistant Secretary and Associate General Counsel (since 2011) of Nuveen Asset Management, LLC; Managing Director (since 2008), and Assistant Secretary, Nuveen Investment Holdings, Inc.; Vice President (since 2007) and Assistant Secretary of Nuveen Investments Advisers Inc., NWQ Investment Management Company, LLC, Tradewinds Global Investors LLC, NWQ Holdings, LLC, Symphony Asset Management LLC, Santa Barbara Asset Management, LLC, Nuveen HydePark Group, LLC, Nuveen Investment Solutions, Inc. (since 2007) and of Winslow Capital Management, Inc. (since 2010); Vice President and Secretary (since 2010) of Nuveen Commodities Asset Management, LLC; prior thereto, Partner, Bell, Boyd & Lloyd LLP (1997-2007). | 245 | ||||
Kathleen L. Prudhomme 3/30/53 800 Nicollet Mall Minneapolis, MN 55402 | Vice President and Assistant Secretary | 2011 | Managing Director, Assistant Secretary and Co-General Counsel (since 2011) of Nuveen Fund Advisors, Inc.; Managing Director, Assistant Secretary and Associate General Counsel (since 2011) of Nuveen Asset Management, LLC; Managing Director and Assistant Secretary (since 2011) of Nuveen Securities, LLC; formerly, Deputy General Counsel, FAF Advisors, Inc. (2004-2010). | 245 | ||||
Jeffrey M. Wilson 3/13/56 333 West Wacker Drive Chicago, IL 60606 | Vice President | 2011 | Senior Vice President of Nuveen Investments (since 2011), formerly, Senior Vice President of FAF Advisors, Inc. (2000-2010). | 112 |
| (1) | Trustees serve an indefinite term until his/her successor is elected or appointed. The year first elected or appointed represents the year in which the trustee was first elected or appointed to any fund in the Nuveen Fund Complex. |
| (2) | Also serves as a trustee of the Nuveen Diversified Commodity Fund, an exchange-traded commodity pool managed by Nuveen Commodities Asset Management, LLC, an affiliate of the Adviser. |
| (3) | Mr. Amboian is an interested trustee because of his position with Nuveen Investments, Inc. and certain of its subsidiaries, which are affiliates of the Nuveen Funds. |
| (4) | Officers serve one year terms through August of each year. The year first elected or appointed represents the year in which the officer was first elected or appointed to any fund in the Nuveen Fund Complex. |
| 122 | Nuveen Investments |
Annual Investment Management Agreement Approval Process
(Unaudited)
A. Background
Prior to January 1, 2011, FAF Advisors, Inc. (“FAF”), a wholly-owned subsidiary of U.S. Bank National Association (“U.S. Bank”), served as investment adviser to each Fund pursuant to an investment advisory agreement between First American Investment Funds, Inc. (the “Company”) and FAF (the “Prior Advisory Agreement”), and as administrator to each Fund pursuant to an administrative agreement between the Company and FAF (the “Prior Administrative Agreement”). On July 29, 2010, U.S. Bank and FAF entered into a definitive agreement with Nuveen Investments, Inc. (“Nuveen”), Nuveen Asset Management (“NAM”) and certain Nuveen affiliates, whereby NAM would acquire a portion of the asset management business of FAF (the “Transaction”). The acquired business included the assets of FAF used in providing investment advisory services, research, sales and distribution in connection with equity, fixed income, real estate, global infrastructure and asset allocation investment products (other than the money market business and closed-end funds advised by FAF), including the Funds. In connection with the Transaction, the Board of Directors (the “Prior Board”) serving the Funds as directors at that time (each a “Prior Director” and, collectively, the “Prior Directors”) considered a number of proposals designed to integrate the Funds into the Nuveen family of funds, including the appointment of NAM as investment adviser and Nuveen Investments, LLC as distributor to the Funds. The Prior Board also considered a proposal in connection with an internal restructuring of NAM (the “Restructuring”), for Nuveen Asset Management, LLC (“NAM LLC”), a wholly-owned subsidiary of NAM formed in anticipation of the Restructuring, to serve as sub-advisor for each Fund.
The Prior Board approved a new investment advisory agreement (the “New Advisory Agreement”) for each Fund with NAM and an investment sub-advisory agreement between NAM and NAM LLC (the “NAM Sub-Advisory Agreement”). At a meeting of the Funds’ stockholders held on December 17, 2010, stockholders of the Funds approved the New Advisory Agreement and the NAM Sub-Advisory Agreement. In addition, stockholders of the Company’s funds (including the Funds) elected ten directors, including one Prior Director, to the board of directors of the Company (the “New Board”).
On December 31, 2010, the Transaction closed and the New Board (which replaced the Prior Board) took effect. On January 1, 2011, the New Advisory Agreement and the NAM Sub-Advisory Agreement became effective. In addition, in connection with the Restructuring, NAM has changed its name to Nuveen Fund Advisors, Inc. (“NFA”). The following is a summary of the considerations of the Prior Board, which were set forth in a proxy statement dated November 10, 2010 (the “Proxy Statement”), in approving the New Advisory Agreement and the NAM Sub-Advisory Agreement for the Funds.
B. Prior Board Considerations
The New Advisory Agreement for each Fund was approved by the Prior Board after consideration of all factors determined to be relevant to its deliberations, including those discussed below. The Prior Board authorized the submission of the New Advisory Agreement for consideration by each Fund’s stockholders.
At meetings held in May and June of 2010, the Prior Board was apprised of the general terms of the Transaction and, as a result, began the process of considering the transition of services from FAF to NFA. In preparation for its September 21-23, 2010 meeting, the Prior Board received, in response to a written due diligence request prepared by the Prior Board and its independent legal counsel and provided to NFA and FAF, a significant amount of information covering a range of issues in advance of the meeting. To assist the Prior Board in its consideration of the New Advisory Agreement for each Fund, NFA provided materials and information about, among other things: (1) NFA and its affiliates, including their history and organizational structure, product lines, experience in providing investment advisory, administrative and other services, and financial condition, (2) the nature, extent and quality of services to be provided under the New Advisory Agreement, (3) proposed Fund fees and expenses and comparative information relating thereto, and (4) NFA’s compliance and risk management capabilities and processes. In addition, the Prior Board was provided with a memorandum from independent legal counsel outlining the legal duties of the Prior Board under the Investment Company Act of 1940, as amended (the “1940 Act”). In response to further requests from the Prior Board and its independent legal counsel, NFA and FAF provided additional information to the Prior Board following its September 21-23 meeting.
An additional in-person meeting of the Prior Board to consider the New Advisory Agreement was held on October 7, 2010, at which the members of the Prior Board in attendance, all of whom were not considered to be “interested persons” of the Company as defined in the 1940 Act (the “Independent Prior Directors”), approved the New Advisory Agreement with NFA for each Fund.
In considering the New Advisory Agreement for each Fund, the Prior Board, advised by independent legal counsel, reviewed and analyzed the factors it deemed relevant, including: (1) the nature, quality, and extent of services to be rendered to the Funds by NFA, (2) the cost of services to be provided, including Fund expense information, and (3) whether economies of scale may be realized as the Funds grow and whether fee levels are adjusted to enable Fund investors to share in these potential economies of scale.
In considering the New Advisory Agreement, the Prior Board did not identify any particular information that was all-important or controlling, and each Prior Director may have attributed different weights to the various factors discussed below. Where appropriate, the Prior Directors evaluated all information available to them regarding the Company’s funds on a fund-by-fund basis, and their determinations were made separately with respect to each such fund (including each of the Funds). The Prior Directors, all of whom were Independent Prior Directors, concluded that the terms of the New Advisory Agreement and the fee rates to be paid in light of the services to be provided to each Fund are in the best interests of each Fund, and that the New Advisory Agreement should be
| Nuveen Investments | 123 |
Annual Investment Management Agreement Approval Process
(Unaudited) (continued)
approved and recommended to stockholders for approval. In voting to approve the New Advisory Agreement with respect to each Fund, the Prior Board considered in particular the following factors:
Nature, Extent and Quality of Services. In considering approval of the New Advisory Agreement, the Prior Board considered the nature, extent and quality of services to be provided by NFA, including advisory services and administrative services. The Prior Board reviewed materials outlining, among other things, NFA’s organizational structure and business; the types of services that NFA or its affiliates are expected to provide to the Funds; the performance record of the applicable Fund (as described in further detail below); and fund product lines offered by NFA. The Prior Board considered that affiliation with a larger fund complex and well-recognized sponsor may result in a broader distribution network, potential economies of scale with respect to other services or fees and broader shareholder services including exchange options.
With respect to personnel, the Prior Board considered information regarding retention plans for current FAF employees who would be offered employment by NFA, and the background and experience of NFA employees who would become portfolio managers as of the closing of the Transaction. The Prior Board also reviewed information regarding portfolio manager compensation arrangements to evaluate NFA’s ability to attract and retain high quality investment personnel.
In evaluating the services of NFA, the Prior Board also considered NFA’s ability to supervise the Funds’ other service providers and, given the importance of compliance, NFA’s compliance program. Among other things, the Prior Board considered the report of NFA’s chief compliance officer regarding NFA’s compliance policies and procedures.
In addition to advisory services, the Prior Board considered the quality of administrative services expected to be provided by NFA and its affiliates including product management, fund administration, oversight of service providers, shareholder services, administration of Board relations, regulatory and portfolio compliance and legal support.
The Prior Board considered that, based on representations from FAF and NFA, the Transaction would allow stockholders to continue their investment in each of the Company’s funds with the same investment objective and principal strategies. The Prior Board considered the historical investment performance of each of the Company’s funds (including each Fund) previously provided during the annual contract renewal process.
Cost of Services Provided by NFA. In evaluating the costs of the services to be provided by NFA under the New Advisory Agreement, the Prior Board received a comparison of each Fund’s annual operating expenses as of June 30, 2010 under the Prior Advisory Agreement and under the New Advisory Agreement, in each case adjusted to reflect a decrease in net assets for certain of the Company’s funds from redemptions by the U.S. Bank 401(k) Plan expected to occur prior to the closing of the Transaction. The Prior Board considered, among other things, that the advisory fee rates and other expenses would change as a result of NFA serving as investment adviser to each Fund. The Prior Board noted that the services provided by NFA under the New Advisory Agreement would include certain administrative services, which services (along with other services) were provided pursuant to the Prior Administrative Agreement and were charged separately from the advisory fee. Accordingly, the Prior Board considered that the fee rates paid under the New Advisory Agreement include bundled investment advisory and administrative fees and thus are higher than the fee rates paid under the Prior Advisory Agreement for most of the Company’s funds, but lower than the combined fee rates paid under the Prior Advisory Agreement and the Prior Administrative Agreement. The Prior Board also noted that certain administrative services provided under the Prior Administrative Agreement would not be provided under the New Advisory Agreement and will be delegated to other service providers. Similarly, certain fees paid by FAF under the Prior Administrative Agreement will not be paid by NFA under the New Advisory Agreement and will be paid directly by the Funds. However, immediately following the closing of the Transaction, the net expense ratio of each Fund was expected to be the same or lower than the Fund’s net expense ratio as of June 30, 2010, adjusted (where applicable) to reflect a decrease in net assets resulting from redemptions by the U.S. Bank 401(k) Plan expected to occur prior to the closing of the Transaction, assuming the Fund’s net assets at the time of the closing of the Transaction were no lower than their adjusted June 30 level. In addition, the Prior Board noted that NFA has committed to certain undertakings to maintain current fee caps and/or to waive fees or reimburse expenses to maintain net management fees at certain levels and Nuveen has represented to the Prior Board that Nuveen and its affiliates will not take any action that imposes an “unfair burden” on any Fund as a result of the Transaction. The Prior Board also considered that fees payable under the New Advisory Agreement include both a fund-level fee and a complex-level fee, and that schedules for the fund-level and complex-level fees contain breakpoints that are based, respectively, on Fund assets and Nuveen complex-wide assets. The Prior Board considered that breakpoints in the fund-level fee allow for the possibility that this portion of the advisory fee could decline in the future if Fund assets were to increase or increase in the future if Fund assets were to decline. The Prior Board also considered that breakpoints in the complex-level fee allow for the possibility that this portion of the advisory fee could decline in the future if complex-wide assets were to increase or increase in the future if complex-wide assets were to decline, regardless, in each case, of whether assets of the particular Fund had increased or decreased.
In considering the compensation to be paid to NFA, the Prior Board also reviewed fee information regarding NFA-sponsored funds, to the extent such funds had similar investment objectives and strategies to the Funds. The Prior Board reviewed information provided by NFA regarding similar funds managed by NFA and noted that the fee rates payable by these funds were generally comparable to the fee rates proposed for the Company’s funds. The Prior Board also compared proposed fee and expense information to the median fees and expenses of comparable funds, using information provided by an independent data service.
| 124 | Nuveen Investments |
In evaluating the compensation, the Prior Board also considered other amounts expected to be paid to NFA by the Funds as well as any indirect benefits (such as soft dollar arrangements, if any) NFA and its affiliates are expected to receive, that are directly attributable to the management of the Funds.
The Prior Board also considered that the Funds would not bear any of the costs relating to the Transaction, including the costs of preparing, printing and mailing the Proxy Statement.
Economies of Scale. The Prior Board reviewed information regarding potential economies of scale or other efficiencies that might result from the Funds’ potential association with Nuveen. The Prior Board noted that the New Advisory Agreement provides for breakpoints in the Funds’ fund-level and complex-level management fee rates as the assets of the Funds and the assets held by the various registered investment companies sponsored by Nuveen increase, respectively. The Prior Board concluded that the structure of the investment management fee rates, with the breakpoints for the Funds under the New Advisory Agreement, reflected sharing of potential economies of scale with the Funds’ stockholders.
Conclusion. After deliberating in executive session, the members of the Prior Board in attendance, all of whom were Independent Prior Directors, approved the New Advisory Agreement with respect to each Fund, concluding that the New Advisory Agreement was in the best interests of each Fund.
NAM Sub-Advisory Agreement. The Prior Board also approved the NAM Sub-Advisory Agreement between NFA and NAM LLC as a result of the Restructuring expected to occur with NFA. The Prior Board considered that the services to be provided by NAM LLC under the NAM Sub-Advisory Agreement would not result in any material change in the nature or level of investment advisory services or administrative services provided to the Funds. In addition, the portfolio managers will continue to manage the Funds in their capacity as employees of NAM LLC. The Prior Board considered that NFA will pay a portion of the advisory fee it receives from each Fund to NAM LLC for its services as sub-advisor. The Prior Board concluded, based upon the conclusions that the Prior Board reached in connection with the approval of the New Advisory Agreement and after determining that it need not reconsider all of the factors that it had considered in connection with the approval of the New Advisory Agreement, to approve the NAM Sub-Advisory Agreement.
| Nuveen Investments | 125 |
Glossary of Terms Used in this Report
Average Annual Total Return: This is a commonly used method to express an investment’s performance over a particular, usually multi-year time period. It expresses the return that would have been necessary each year to equal the investment’s actual cumulative performance (including change in NAV or offer price and reinvested dividends and capital gains distributions, if any) over the time period being considered.
Average Effective Maturity: The market-value-weighted average of the effective maturity dates of the individual securities including cash. In the case of a bond that has been advance-refunded to a call date, the effective maturity is the date on which the bond is scheduled to be redeemed using the proceeds of an escrow account. In most other cases the effective maturity is the stated maturity date of the security.
Average Duration: Duration is a measure of the expected period over which a bond’s principal and interest will be paid, and consequently is a measure of the sensitivity of a bond’s (or bond fund’s) value to changes when market interest rates change. Generally, the longer a bond or Fund’s duration, the more the price of the bond or Fund will change as interest rates change.
Barclays Capital Municipal Bond Index: An unmanaged index comprised of fixed-rate, investment-grade tax- exempt bonds with remaining maturities of one year or more.
Barclays Capital 1-15 Year Blend Municipal Bond Index: An unmanaged index comprised of fixed-rate, investment-grade tax-exempt bonds with remaining maturities between 1 and 17 years.
Inverse Floaters: Inverse floating rate securities are created by depositing a municipal bond, typically with a fixed interest rate, into a special purpose trust created by a broker-dealer. This trust, in turn, (a) issues floating rate certificates typically paying short-term tax-exempt interest rates to third parties in amounts equal to some fraction of the deposited bond’s par amount or market value, and (b) issues an inverse floating rate certificate (sometimes referred to as an “inverse floater”) to an investor (such as a Fund) interested in gaining investment exposure to a long-term municipal bond. The income received by the holder of the inverse floater varies inversely with the short-term rate paid to the floating rate certificates’ holders, and in most circumstances the holder of the inverse floater bears substantially all of the underlying bond’s downside investment risk. The holder of the inverse floater typically also benefits disproportionately from any potential appreciation of the underlying bond’s value. Hence, an inverse floater essentially represents an investment in the underlying bond on a leveraged basis.
Lipper Colorado Municipal Debt Funds Average: Represents the average annualized total return for all reporting funds in the Lipper Colorado Municipal Debt Fund category. The Lipper Colorado Municipal Debt Funds Average contained 18, 18, 16 and 16 funds for the 11-month, 1-year, 5-year and 10-year periods, respectively, ended May 31, 2011.
Lipper Intermediate Municipal Debt Funds Average: Represents the average annualized total return for all reporting funds in the Lipper Intermediate Municipal Debt Funds Average category. The Lipper Intermediate Municipal Debt Funds Average contained 163, 163, 139 and 80 funds for the 11-month, 1-year, 5-year and 10-year periods, respectively, ended May 31, 2011.
Lipper Minnesota Municipal Debt Funds Average: Represents the average annualized total return for all reporting funds in the Lipper Minnesota Municipal Debt Fund category. The Lipper Minnesota Municipal Debt Funds Average contained 39, 39, 33 and 31 funds for the 11-month, 1-year, 5-year and 10-year periods, respectively, ended May 31, 2011.
Lipper Ohio Municipal Debt Funds Average: Represents the average annualized total return for all reporting funds in the Lipper Ohio Municipal Debt Fund category. The Lipper Ohio Municipal Debt Funds Average contained 43, 43, 36 and 32 funds for the 11-month, 1-year, 5-year and 10-year periods, respectively, ended May 31, 2011.
Lipper Other States Municipal Debt Funds Average: Represents the average annualized total return for all reporting funds in the Lipper Other States Municipal Debt Fund category. The Lipper Other States Municipal Debt Funds Average contained 144, 144, 137 and 123 funds for the 11-month, 1-year, 5-year and 10-year periods, respectively, ended May 31, 2011. Shareholders should note that the performance of the Lipper Other States Average represents the overall average of returns for funds from ten different states with a wide variety of municipal market conditions, making direct comparisons less meaningful.
Net Asset Value (NAV): A Fund’s NAV is the dollar value of one share in the Fund. It is calculated by subtracting the liabilities of the Fund from its total assets and then dividing the remainder by the number of shares outstanding. Fund NAVs are calculated at the end of each business day.
Pre-Refundings: Pre-Refundings, also known as advance refundings or refinancings, occur when an issuer sells new bonds and uses the proceeds to fund principal and interest payments of older existing bonds. This process often results in lower borrowing costs for bond issuers.
Zero Coupon Bond: A zero coupon bond does not pay a regular interest coupon to its holders during the life of the bond. Tax-exempt income to the holder of the bond comes from accretion of the difference between the original purchase price of the bond at issuance and the par value of the bond at maturity and is effectively paid at maturity. The market prices of zero coupon bonds generally are more volatile than the market prices of bonds that pay interest periodically.
| 126 | Nuveen Investments |
Fund Manager
Nuveen Fund Advisors, Inc.
333 West Wacker Drive
Chicago, IL 60606
Sub-Adviser
Nuveen Asset Management, LLC
333 West Wacker Drive
Chicago, IL 60606
Legal Counsel
Chapman and Cutler LLP
Chicago, IL
Independent Registered Public Accounting Firm
Ernst & Young LLP
Chicago, IL
Custodian
U.S. Bank National Association
St. Paul, MN
Transfer Agent and Shareholder Services
U.S. Bancorp
Fund Services, LLC
615 E. Michigan Street
Milwaukee, WI 53202
Quarterly Portfolio of Investments and Proxy Voting information: You may obtain (i) each Fund’s quarterly portfolio of investments, (ii) information regarding how the Funds voted proxies relating to portfolio securities held during the most recent twelve-month period ended June 30, and (iii) a description of the policies and procedures that the Funds used to determine how to vote proxies relating to portfolio securities without charge, upon request, by calling Nuveen Investments at (800) 257-8787 or on Nuveen’s website at www.nuveen.com.
You may also obtain this and other Fund information directly from the Securities and Exchange Commission (SEC). The SEC may charge a copying fee for this information. Visit the SEC on-line at http://www.sec.gov or in person at the SEC’s Public Reference Room in Washington, D.C. Call the SEC at (202) 942-8090 for room hours and operation. You may also request Fund information by sending an e-mail request to publicinfo@sec.gov or by writing to the SEC’s Public Reference Section at 100 F Street NE, Washington, D.C. 20549.
The Financial Industry Regulatory Authority (FINRA) provides a Public Disclosure Program which supplies certain information regarding the disciplinary history of FINRA members and their associated persons in response to either telephone inquiries at (800) 289-9999 or written inquiries at www.finra.org. FINRA also provides an investor brochure that includes information describing the Public Disclosure Program.
| Nuveen Investments | 127 |
Nuveen Investments:
Serving Investors for Generations
Since 1898, financial advisors and their clients have relied on Nuveen Investments to provide dependable investment solutions through continued adherence to proven, long-term investing principles. Today, we offer a range of high quality equity and fixed-income solutions designed to be integral components of a well-diversified core portfolio.
Focused on meeting investor needs.
Nuveen Investments is a global investment management firm that seeks to help secure the long-term goals of institutions and high net worth investors as well as the consultants and financial advisors who serve them. We market our growing range of specialized investment solutions under the high-quality brands of HydePark, NWQ, Nuveen Asset Management, Santa Barbara, Symphony, Tradewinds and Winslow Capital. In total, Nuveen Investments managed approximately $206 billion of assets as of March 31, 2011.
Find out how we can help you.
To learn more about how the products and services of Nuveen Investments may be able to help you meet your financial goals, talk to your financial advisor, or call us at (800) 257-8787. Please read the information provided carefully before you invest. Investors should consider the investment objective and policies, risk considerations, charges and expenses of any investment carefully. Where applicable, be sure to obtain a prospectus, which contains this and other relevant information. To obtain a prospectus, please contact your securities representative or Nuveen Investments, 333 W. Wacker Dr., Chicago, IL 60606. Please read the prospectus carefully before you invest or send money.
Learn more about Nuveen Funds at: www.nuveen.com/mf
Nuveen makes things e-simple.
It only takes a minute to sign up for e-Reports. Once enrolled, you’ll receive an e-mail as soon as your Nuveen Fund information is ready — no more waiting for delivery by regular mail. Just click on the link within the e-mail to see the report and save it on your computer if you wish.
Free e-Reports right to your e-mail!
www.investordelivery.com
If you receive your Nuveen Fund distributions and statements from your financial advisor or brokerage account.
OR
www.nuveen.com/accountaccess
If you receive your Nuveen Fund distributions and statements directly from Nuveen.
Distributed by Nuveen Securities, LLC 333 West Wacker Drive Chicago, IL 60606 www.nuveen.com |
MAN-FTFI-0511D
PART C
OTHER INFORMATION
Item 15. Indemnification
Section 4 of Article XII of Registrant’s Declaration of Trust, as amended, provides as follows:
Subject to the exceptions and limitations contained in this Section 4, every person who is, or has been, a Trustee, officer, employee or agent of the Trust, including persons who serve at the request of the Trust as directors, trustees, officers, employees or agents of another organization in which the Trust has an interest as a shareholder, creditor or otherwise (hereinafter referred to as a “Covered Person”), shall be indemnified by the Trust to the fullest extent permitted by law against liability and against all expenses reasonably incurred or paid by him in connection with any claim, action, suit or proceeding in which he becomes involved as a party or otherwise by virtue of his being or having been such a Trustee, director, officer, employee or agent and against amounts paid or incurred by him in settlement thereof.
No indemnification shall be provided hereunder to a Covered Person:
(a) against any liability to the Trust or its Shareholders by reason of a final adjudication by the court or other body before which the proceeding was brought that he engaged in willful misfeasance, bad faith, gross negligence or reckless disregard of the duties involved in the conduct of his office;
(b) with respect to any matter as to which he shall have been finally adjudicated not to have acted in good faith in the reasonable belief that his action was in the best interests of the Trust; or
(c) in the event of a settlement or other disposition not involving a final adjudication (as provided in paragraph (a) or (b)) and resulting in a payment by a Covered Person, unless there has been either a determination that such Covered Person did not engage in willful misfeasance, bad faith, gross negligence or reckless disregard of the duties involved in the conduct of his office by the court or other body approving the settlement or other disposition or a reasonable determination, based on a review of readily available facts (as opposed to a full trial-type inquiry), that he did not engage in such conduct:
(i) by a vote of a majority of the Disinterested Trustees acting on the matter (provided that a majority of the Disinterested Trustees then in office act on the matter); or
(ii) by written opinion of independent legal counsel.
The rights of indemnification herein provided may be insured against by policies maintained by the Trust, shall be severable, shall not affect any other rights to which any Covered Person may now or hereafter be entitled, shall continue as to a person who has ceased to be such a Covered Person and shall inure to the benefit of the heirs, executors and administrators of such a person. Nothing contained herein shall affect any rights to indemnification to which Trust personnel other than Covered Persons may be entitled by contract or otherwise under law.
Expenses of preparation and presentation of a defense to any claim, action, suit or proceeding subject to a claim for indemnification under this Section 4 shall be advanced by the Trust prior to final disposition thereof upon receipt of an undertaking by or on behalf of the recipient to repay such amount if it is ultimately determined that he is not entitled to indemnification under this Section 4, provided that either:
C-1
(a) such undertaking is secured by a surety bond or some other appropriate security or the Trust shall be insured against losses arising out of any such advances; or
(b) a majority of the Disinterested Trustees acting on the matter (provided that a majority of the Disinterested Trustees then in office act on the matter) or independent legal counsel in a written opinion shall determine, based upon a review of the readily available facts (as opposed to a full trial-type inquiry), that there is reason to believe that the recipient ultimately will be found entitled to indemnification.
As used in this Section 4, a “Disinterested Trustee” is one (x) who is not an Interested Person of the Trust (including, as such Disinterested Trustee, anyone who has been exempted from being an Interested Person by any rule, regulation or order of the Commission), and (y) against whom none of such actions, suits or other proceedings or another action, suit or other proceeding on the same or similar grounds is then or has been pending.
As used in this Section 4, the words “claim,” “action,” “suit” or “proceeding” shall apply to all claims, actions, suits, proceedings (civil, criminal, administrative or other, including appeals), actual or threatened; and the word “liability” and “expenses” shall include without limitation, attorneys’ fees, costs, judgments, amounts paid in settlement, fines, penalties and other liabilities.
The trustees and officers of the Registrant are covered by Investment Trust Errors and Omission policies in the aggregate amount of $70,000,000 (with a $2,500,000 deductible for operational failures (after the deductible is satisfied, the insurer would cover 80% of any operational failure claims and the Fund would be liable for 20% of any such claims) and $1,000,000 for all other claims) against liability and expenses of claims of wrongful acts arising out of their position with the Registrant, except for matters which involved willful acts, bad faith, gross negligence and willful disregard of duty (i.e., where the insured did not act in good faith for a purpose he or she reasonably believed to be in the best interest of the Registrant or where he or she shall have had reasonable cause to believe this conduct was unlawful).
Insofar as indemnification for liabilities arising under the Securities Act of 1933 (“1933 Act”) may be permitted to the officers, trustees or controlling persons of the Registrant pursuant to the Declaration of Trust of the Registrant or otherwise, the Registrant has been advised that in the opinion of the Securities and Exchange Commission such indemnification is against public policy as expressed in the 1933 Act and is, therefore, unenforceable. In the event that a claim for indemnification against such liabilities (other than the payment by the Registrant of expenses incurred or paid by an officer or trustee or controlling person of the Registrant in the successful defense of any action, suit or proceeding) is asserted by such officer, trustee or controlling person in connection with the securities being registered, the Registrant will, unless in the opinion of its counsel the matter has been settled by controlling precedent, submit to a court of appropriate jurisdiction the question of whether such indemnification by it is against public policy as expressed in the 1933 Act and will be governed by the final adjudication of such issue.
C-2
Item 16. Exhibits.
| (1)(a) | Declaration of Trust of Registrant dated July 1, 1996. (1) | |
| (1)(b) | Certificate of Amendment to Declaration of Trust of Registrant dated September 15, 2000. (4) | |
| (1)(c) | Amended Establishment and Designation of Classes, dated September 15, 2000. (4) | |
| (1)(d) | Amended Establishment and Designation of Series, dated April 23, 2008. (5) | |
| (2) | By-Laws of Registrant, amended and restated as of November 18, 2009. (6) | |
| (3) | Not applicable | |
| (4) | Form of Agreement and Plan of Reorganization is filed herewith as Appendix I to Part A of this Registration Statement. | |
| (5) | Not applicable. | |
| (6)(a) | Investment Management Agreement between Registrant and Nuveen Fund Advisors, Inc. (f/k/a Nuveen Asset Management), dated November 13, 2007. (5) | |
| (6)(b) | Amendment of Investment Management Agreement, dated January 1, 2011. (6) | |
| (6)(c) | Renewal of Investment Management Agreement between Registrant and Nuveen Fund Advisors, Inc. (f/k/a Nuveen Asset Management), dated May 25, 2011. (6) | |
| (6)(d) | Investment Sub-Advisory Agreement between Nuveen Fund Advisors, Inc. and Nuveen Asset Management, LLC, dated January 1, 2011. (7) | |
| (7)(a) | Distribution Agreement between Registrant and John Nuveen & Co. Incorporated, dated February 1, 1997. (2) | |
| (7)(b) | Renewal of Distribution Agreement between Registrant and Nuveen Securities, LLC (f/k/a Nuveen Investments, LLC), dated August 2, 2011. (7) | |
| (7)(c) | Form of Dealer Distribution, Shareholder Servicing and Fee-Based Program Agreement. (9) | |
| (7)(d) | Form of Rule 22c-2 Agreement. (10) | |
| (8) | Not applicable. | |
| (9)(a) | Amended and Restated Master Custodian Agreement between the Nuveen Funds and State Street Bank and Trust Company, dated February 25, 2005. (9) | |
| (9)(b) | Appendix A to the Custodian Agreement, September 13, 2011. (8) | |
| (10)(a) | Plan of Distribution and Service Pursuant to Rule 12b-1, dated July 23, 1998. (3) | |
| (10)(b) | Multiple Class Plan, dated May 1, 2008. (11) | |
| (11) | Opinion and Consent of Vedder Price P.C. is filed herewith. | |
| (12) | Form of Opinion and Consent of Vedder Price P.C. supporting the tax matters and consequences to shareholders discussed in the Proxy Statement/Prospectus is filed herewith. | |
| (13) | Not applicable. | |
| (14)(a) | Consent of Independent Auditor is filed herewith. | |
| (14)(b) | Consent of Independent Auditor is filed herewith. | |
C-3
| (15) | Not applicable. | |
| (16) | Powers of Attorney are filed herewith. | |
| (17) | Form of Proxy is filed herein and appears following the Proxy Statement/Prospectus included in this registration statement. | |
| (1) | Incorporated by reference to the initial registration statement filed on Form N-1A for Registrant. |
| (2) | Incorporated by reference to the post-effective amendment no. 1 filed on Form N-1A for Registrant. |
| (3) | Incorporated by reference to the post-effective amendment no. 4 filed on Form N-1A for Registrant. |
| (4) | Incorporated by reference to the post-effective amendment no. 5 filed on Form N-1A for Registrant. |
| (5) | Incorporated by reference to the post-effective amendment no. 15 filed on Form N-1A for Registrant. |
| (6) | Incorporated by reference to the post-effective amendment no. 18 filed on Form N-1A for Registrant. |
| (7) | Incorporated by reference to the post-effective amendment no. 19 filed on Form N-1A for Registrant. |
| (8) | Incorporated by reference to the post-effective amendment no. 29 filed on Form N-1A for Registrant. |
| (9) | Incorporated by reference to the post-effective amendment no. 13 filed on Form N-1A for Nuveen Multistate Trust II (File No. 333-14729). |
| (10) | Incorporated by reference to the post-effective amendment no. 12 filed on Form N-1A for Nuveen Multistate Trust I (File No. 333-16617). |
| (11) | Incorporated by reference to the post-effective amendment no. 19 filed on Form N-1A for Nuveen Multistate Trust II (File No. 333-14729). |
Item 17. Undertakings.
(1) The undersigned Registrant agrees that prior to any public reoffering of the securities registered through the use of a prospectus which is a part of this registration statement by any person or party who is deemed to be an underwriter within the meaning of Rule 145(c) of the 1933 Act, the reoffering prospectus will contain the information called for by the applicable registration form for reofferings by persons who may be deemed underwriters, in addition to the information called for by the other items of the applicable form.
(2) The undersigned Registrant agrees that every prospectus that is filed under paragraph (1) above will be filed as a part of an amendment to the registration statement and will not be used until the amendment is effective, and that, in determining any liability under the 1933 Act, each post-effective amendment shall be deemed to be a new registration statement for the securities offered therein, and the offering of the securities at that time shall be deemed to be the initial bona fide offering of them.
C-4
SIGNATURES
As required by the Securities Act of 1933, this registration statement has been signed on behalf of the registrant, in the City of Chicago, the State of Illinois, on the 9th day of December, 2011.
| NUVEEN MULTISTATE TRUST IV | ||
| By: | /s/ Kathleen L. Prudhomme | |
| Kathleen L. Prudhomme | ||
| Vice President and Assistant Secretary | ||
As required by the Securities Act of 1933, this registration statement has been signed by the following persons in the capacities and on the dates indicated:
Signature | Capacity | Date | ||||
/s/ Stephen D. Foy Stephen D. Foy | Vice President and Controller | December 9, 2011 | ||||
/s/ Gifford R. Zimmerman Gifford R. Zimmerman | Chief Administrative Officer | December 9, 2011 | ||||
/s/ Robert P. Bremner | Chairman of the Board and Director | ) | ||||
| Robert P. Bremner* | ) | |||||
| ) | ||||||
/s/ John P. Amboian | Director | ) | ||||
| John P. Amboian* | ) | |||||
| ) | ||||||
/s/ Jack B. Evans | Director | ) | ||||
| Jack B. Evans* | ) | |||||
| ) | ||||||
/s/ William C. Hunter | Director | ) | ||||
| William C. Hunter* | ) | By:/s/ Kathleen L. Prudhomme Kathleen L. Prudhomme Attorney-in-Fact December 9, 2011 | ||||
| ) | ||||||
/s/ David J. Kundert | Director | ) | ||||
| David J. Kundert* | ) | |||||
| ) | ||||||
/s/ William J. Schneider | Director | ) | ||||
| William J. Schneider* | ) | |||||
| ) | ||||||
/s/ Judith M. Stockdale | Director | ) | ||||
| Judith M. Stockdale* | ) | |||||
| ) | ||||||
/s/ Carole E. Stone | Director | ) | ||||
| Carole E. Stone* | ) | |||||
| ) | ||||||
C-5
Signature | Capacity | Date | ||||
/s/ Virginia L. Stringer | Director | ) | ||||
| Virginia L. Stringer* | ) | |||||
| ) | ||||||
/s/ Terence J. Toth | Director | ) | ||||
| Terence J. Toth* | ) | |||||
* An original power of attorney authorizing, among others, Kevin J. McCarthy, Kathleen L. Prudhomme and Gifford R. Zimmerman, to execute this registration statement, and amendments thereto, for each of the directors of the Registrant on whose behalf this registration statement is filed, has been executed and is filed herewith as exhibit 16.
C-6
EXHIBIT INDEX
Exhibit No. | Name of Exhibit | |
| 11 | Opinion and Consent of Counsel | |
| 12 | Form of Opinion and Consent of Tax Counsel Supporting Tax Matters | |
| 14(a) | Consent of Independent Auditor | |
| 14(b) | Consent of Independent Auditor | |
| 16 | Powers of Attorney | |
C-7