UNITED STATES
SECURITIES AND EXCHANGE COMMISSION
Washington, D.C. 20549
FORM N-CSR
CERTIFIED SHAREHOLDER REPORT OF REGISTERED MANAGEMENT
INVESTMENT COMPANIES
Investment Company Act file number 811-07751
Nuveen Multistate Trust IV
(Exact name of registrant as specified in charter)
Nuveen Investments
333 West Wacker Drive, Chicago, IL 60606
(Address of principal executive offices) (Zip code)
Kevin J. McCarthy
Nuveen Investments
333 West Wacker Drive, Chicago, IL 60606
(Name and address of agent for service)
Registrant’s telephone number, including area code: (312) 917-7700
Date of fiscal year end: May 31
Date of reporting period: November 30, 2012
Form N-CSR is to be used by management investment companies to file reports with the Commission not later than 10 days after the transmission to stockholders of any report that is required to be transmitted to stockholders under Rule 30e-1 under the Investment Company Act of 1940 (17 CFR 270.30e-1). The Commission may use the information provided on Form N-CSR in its regulatory, disclosure review, inspection, and policy making roles.
A registrant is required to disclose the information specified by Form N-CSR, and the Commission will make this information public. A registrant is not required to respond to the collection of information contained in Form N-CSR unless the Form displays a currently valid Office of Management and Budget (“OMB”) control number. Please direct comments concerning the accuracy of the information collection burden estimate and any suggestions for reducing the burden to Secretary, Securities and Exchange Commission, 450 Fifth Street, NW, Washington, DC 20549-0609. The OMB has reviewed this collection of information under the clearance requirements of 44 U.S.C. ss.3507.
Item 1. Reports to Stockholders.

Mutual Funds
Nuveen Municipal Bond Funds
Dependable, tax-free income because it’s not what you earn, it’s what you keep.®
Semi-Annual Report
November 30, 2012
| Share Class / Ticker Symbol | ||||||||
| Fund Name | Class A | Class B | Class C | Class I | ||||
Nuveen Kansas Municipal Bond Fund | FKSTX | — | FCKSX | FRKSX | ||||
Nuveen Kentucky Municipal Bond Fund | FKYTX | FKYBX | FKYCX | FKYRX | ||||
Nuveen Michigan Municipal Bond Fund | FMITX | — | FLMCX | NMMIX | ||||
Nuveen Missouri Municipal Bond Fund | FMOTX | FMMBX | FMOCX | FMMRX | ||||
Nuveen Ohio Municipal Bond Fund | FOHTX | FOHBX | FOHCX | NXOHX | ||||
Nuveen Wisconsin Municipal Bond Fund | FWIAX | — | FWICX | FWIRX | ||||
LIFE IS COMPLEX.
Nuveen makes things e-simple.
It only takes a minute to sign up for e-Reports. Once enrolled, you’ll receive an e-mail as soon as your Nuveen Fund information is ready. No more waiting for delivery by regular mail. Just click on the link within the e-mail to see the report and save it on your computer if you wish.
Free e-Reports right to your e-mail!
www.investordelivery.com
If you receive your Nuveen Fund distributions and statements from your financial advisor or brokerage account.
OR
www.nuveen.com/accountaccess
If you receive your Nuveen Fund distributions and statements directly from Nuveen.
| Must be preceded by or accompanied by a prospectus. | NOT FDIC INSURED | MAY LOSE VALUE | NO BANK GUARANTEE |
| 4 | ||||
| 5 | ||||
| 12 | ||||
| 19 | ||||
| 21 | ||||
| 23 | ||||
| 25 | ||||
| 74 | ||||
| 75 | ||||
| 76 | ||||
| 80 | ||||
| 92 | ||||
| 106 | ||||
| 107 | ||||
Letter to Shareholders

Dear Shareholders,
Despite the global economy’s ability to muddle through the many economic headwinds of 2012, investors continue to have good reasons to remain cautious. The European Central Bank’s decisions to extend intermediate term financing to major European banks and to support sovereign debt markets have begun to show signs of a stabilized euro area financial market. The larger member states of the European Union (EU) are working diligently to strengthen the framework for a tighter financial and banking union and meaningful progress has been made by agreeing to centralize large bank regulation under the European Central Bank. However, economic conditions in the southern tier members are not improving and the pressures on their political leadership remain intense. The jury is out on whether the respective populations will support the continuing austerity measures that are needed to meet the EU fiscal targets.
In the U.S., the Fed remains committed to low interest rates into 2015 through its third program of Quantitative Easing (QE3). Inflation remains low but a growing number of economists are expressing concern about the economic distortions resulting from negative real interest rates. The highly partisan atmosphere in Congress led to a disappointingly modest solution for dealing with the end-of-year tax and spending issues. Early indications for the new Congressional term have not given much encouragement that the atmosphere for dealing with the sequestration legislation and the debt ceiling issues, let alone a more encompassing “grand bargain,” will be any better than the last Congress. Over the longer term, there are some encouraging trends for the U.S. economy: house prices are beginning to recover, banks and corporations continue to strengthen their financial positions and incentives for capital investment in the U.S. by domestic and foreign corporations are increasing due to more competitive energy and labor costs.
During 2012 U.S. investors have benefited from strong returns in the domestic equity markets and solid returns in most fixed income markets. However, many of the macroeconomic risks of 2012 remain unresolved, including negotiating through the many U.S. fiscal issues, managing the risks of another year of abnormally low U.S. interest rates, sustaining the progress being made in the euro area and reducing the potential economic impact of geopolitical issues, particularly in the Middle East. In the face of these uncertainties, the experienced investment professionals at Nuveen Investments seek out investments that are enjoying positive economic conditions. At the same time they are always on the alert for risks in markets subject to excessive optimism or for opportunities in markets experiencing undue pessimism. Monitoring this process is a critical function for the Fund Board as it oversees your Nuveen Fund on your behalf.
As always, I encourage you to communicate with your financial consultant if you have any questions about your investment in a Nuveen Fund. On behalf of the other members of your Fund Board, we look forward to continuing to earn your trust in the months and years ahead.
Sincerely,

Robert P. Bremner
Chairman of the Board
January 22, 2013
| 4 | Nuveen Investments |
Certain statements in this report are forward-looking statements. Discussions of specific investments are for illustration only and are not intended as recommendations of individual investments. The forward-looking statements and other views expressed herein are those of the portfolio managers as of the date of this report. Actual future results or occurrences may differ significantly from those anticipated in any forward-looking statements and the views expressed herein are subject to change at any time, due to numerous market and other factors. The Funds disclaim any obligation to update publicly or revise any forward-looking statements or views expressed herein.
Ratings shown are the highest rating given by one of the following national rating agencies: Standard & Poor’s Group, Moody’s Investors Service, Inc. or Fitch, Inc. Credit ratings are subject to change. AAA, AA, A and BBB are investment grade ratings; BB, B, CCC, CC, C and D are below investment grade ratings. Certain bonds backed by U.S. Government or agency securities are regarded as having an implied rating equal to the rating of such securities. Holdings designated N/R are not rated by these national rating agencies.
Portfolio managers Daniel Close, CFA, Steven Hlavin and Chris Drahn, CFA, review key investment strategies and the performance of the Nuveen Kansas Municipal Bond Fund, the Nuveen Kentucky Municipal Bond Fund, the Nuveen Michigan Municipal Bond Fund, the Nuveen Missouri Municipal Bond Fund, the Nuveen Ohio Municipal Bond Fund and the Nuveen Wisconsin Municipal Bond Fund. Dan has managed the Kentucky, Michigan and Ohio Funds since 2007, Steve has managed the Kansas and Wisconsin Funds since 2011 and Chris has managed the Missouri Fund since 2011.
How did the Funds perform during the six-month period ending November 30, 2012?
The tables in the Fund Performance and Expense Ratios section of this report provide Class A Share total returns for the Funds for the six-month, one-year, five-year and ten-year periods ending November 30, 2012. The tables also compare these returns to each Fund’s benchmark index and its appropriate Lipper classification average.
During the six-month period, the Class A Shares at net asset value (NAV) of the Kansas, Michigan, Missouri and Ohio Funds outperformed the S&P Municipal Bond Index, while the Wisconsin Fund’s Class A Shares at NAV performed in line with this Index and the Class A Shares at NAV of the Kentucky Fund trailed it. The Kansas, Michigan, Missouri and Wisconsin Funds also outperformed their respective S&P state specific index, while the Kentucky and Ohio Funds underperformed their respective S&P state specific index. The Kansas, Michigan, Missouri, Ohio and Wisconsin Funds all outpaced their respective Lipper classification averages, while the Kentucky Fund fell short of its Lipper comparative performance measure.
Going forward, the Funds will only be compared to the primary S&P Municipal Bond Index because it more closely reflects the Fund’s investment universe. There have been no changes to the way the Funds are managed.
What strategies were used to manage the Funds during the reporting period? How did these strategies influence performance?
All of the Funds continued to employ the same fundamental investment strategies and tactics long relied upon by Nuveen Asset Management. Our municipal bond portfolios are managed with a value-oriented approach and close input from Nuveen Asset Management’s research team. Below we highlight the specific factors influencing each Fund’s investment strategy, as well as how we managed each portfolio in light of recent market conditions.
| Nuveen Investments | 5 |
Nuveen Kansas and Wisconsin Municipal Bond Funds
The Nuveen Kansas Municipal Bond Fund’s outperformance of the S&P Municipal Bond Index during the six-month period was driven most notably by the Fund’s duration positioning. The portfolio had more exposure to longer duration (more interest rate sensitive) bonds and a lower than benchmark allocation to short duration securities. This positioning was helpful for the Fund, as interest rates fell to a greater extent on longer dated issues compared to their shorter maturity counterparts.
From the standpoint of the portfolio’s credit quality breakdown, the Fund benefited from having less exposure than the benchmark to AAA-rated and AA-rated bonds, which did not fare as well as lower quality issues that offered more income and, as a result, tended to be favored by investors searching for yield in the low interest-rate environment. We also maintained an advantageous overweighting in non-rated bonds, which outperformed the Index and therefore added to the Fund’s results. The Fund was also overweighted in BBB-rated securities, which were much sought after by investors. However, the performance from the Fund’s BBB exposure was tempered by the fact that a portion of these holdings were Puerto Rico issues, which suffered along with investors’ perceptions of the U.S. territory’s weakening credit quality during the period.
On balance, the Fund’s sector positioning had a slightly negative influence on performance compared with the index. One drawback was the make-up of the Kansas municipal bond market. With relatively few toll road and corporate-backed industrial development revenue bonds to select from, the Fund was subsequently underweighted in these two strong-performing sectors relative to the national market, an allocation that limited the Fund’s upside during the period.
Our management focus centered on finding attractive opportunities to invest the proceeds from called bonds and new shareholder inflows, of which there was a healthy amount throughout the period. New purchases typically took place in the primary (new-issue) municipal bond market and consisted largely of securities with intermediate maturities offering a level of income that we thought compensated us well for the securities’ underlying credit risk. We believed it was desirable to make purchases in the intermediate segment of the yield curve because we thought these securities offered better value than shorter- or longer-dated bonds, while still providing the Fund with a measure of defensiveness, should interest rates rise from their historically low levels.
The Fund’s purchases during the six-month period included some Burlington Environmental Kansas City Power and Light utility bonds and Wyandotte County Utility Systems revenue bonds, both of which were attractive to us because of the relative scarcity of Kansas utility bonds, and these purchases enabled us to bring the Fund’s weighting in the utility sector closer to that of the national benchmark. Other notable acquisitions were Kansas State Athletics sales-tax bonds, education bonds for the Leavenworth County School District and health care bonds for Labette County Hospital.
The Nuveen Wisconsin Municipal Bond Fund’s performance relative to the S&P Municipal Bond Index was helped the most by our favorable duration positioning. As with the Kansas Fund, we were overweight in bonds with longer maturities, which were the main beneficiaries of falling interest rates during the period.
| 6 | Nuveen Investments |
On a credit quality basis, the Fund gained from being underweight in the market’s highest rated securities, those with AAA and AA credit ratings. Although these bonds turned in positive results in absolute terms, they did not keep pace with lower rated securities, which investors generally preferred for their higher yields amid low interest rates. The Fund was also favorably overweighted in BBB-rated securities, which were much sought after by investors. However, the performance from the Fund’s BBB exposure was tempered by the fact that a portion of these holdings were Puerto Rico issues, which suffered along with investors’ perceptions of the U.S. territory’s weakening credit quality during the period.
In sector terms, the Fund’s positioning was shaped by the availability of securities in the Wisconsin municipal bond market. Because of a prevalence of dedicated sales-tax bonds, for example, the Fund was overweight in this category, while remaining underweight in utility bonds, a category of issuance that tends to be relatively limited in Wisconsin. In both cases, the Fund’s performance relative to the national municipal bond market was hampered by these sector allocations, given that dedicated sales-tax bonds lagged while utility securities outperformed.
With the healthy amount of new shareholder inflows into the Wisconsin Fund during the six-month period, we bought a variety of in-state debt across a range of maturities. We purchased several Wisconsin hospital and utility bond offerings from among the state’s modest level of new issuance during the period. The lack of available bonds that are fully tax-exempt for Wisconsin residents prompted us to buy three out-of-state issues, Virginia bonds for toll road and tunnel projects and Texas prepaid gas bonds (these securities are used by municipalities to prepay natural gas costs and control energy spending), whose relative value we thought was favorable enough to compensate our shareholders for their state tax liability.
To fund these purchases and keep the portfolio fully invested during the period, we primarily used the proceeds of shareholder inflows. Meanwhile, our very limited bond selling activity involved swapping out of Puerto Rico bonds with relatively low coupon income and into higher coupon debt of this U.S. territory. As Puerto Rico’s credit outlook became increasingly problematic, we believed it was prudent to focus on the higher quality credits because they were more defensive and potentially less vulnerable to further weakening in Puerto Rico’s financial position. Bonds issued by the Puerto Rico Sales Tax Financing Corporation (COFINA) were downgraded by Moody’s in July 2012. This downgrade was due mainly to the performance of Puerto Rico’s economy and its impact on the projected growth of sales tax revenues, and not to any sector or structural issues. Each of the Funds held varying amounts of the COFINA bonds purchased at different times, with those purchased prior to and early in this period performing more positively than those purchased during the latter part of this period. Therefore, the impact on performance differed from Fund to Fund. As we continue to emphasize Puerto Rico’s stronger credits, we view these bonds as long-term holdings and note that the commonwealth’s recent enforcement of sales tax collections has improved significantly. Like all U.S. territorial bonds, Puerto Rico debt is generally fully tax-exempt for residents of all 50 states.
| Nuveen Investments | 7 |
Nuveen Kentucky, Michigan and Ohio Municipal Bond Funds
The Nuveen Kentucky Municipal Bond Fund lagged the results of its benchmark, the S&P Municipal Bond Index. The main factor behind this underperformance was that the Kentucky municipal bond market as a whole simply did not perform as well as that of many other states during the period. Given the portfolio’s obviously high allocation to Kentucky bonds, this exposure provided a headwind for the Fund’s performance relative to a national index.
Other factors also detracted from results included credit rating. The Fund was underweight in bonds with below investment-grade credit ratings, a function of the typically high credit quality of the Kentucky municipal bond market. This stance proved unhelpful in an environment in which lower rated bonds outperformed their higher rated counterparts. In sector terms, meanwhile, the Fund was overweight in pre-refunded bonds, a category that lagged because the securities feature very high credit ratings and very short durations, two attributes that were out of favor during the period.
Duration, a measure of interest-rate sensitivity, was the primary strategy adding to the Fund’s results in relative terms. Specifically, the portfolio had more exposure to longer duration securities, which were more sensitive than shorter duration bonds to falling interest rates during the six months and thus benefited disproportionately from the favorable market conditions. A corresponding de-emphasis of very short duration issues also helped lift relative performance.
As we experienced bond calls and received a healthy level of new shareholder investments into the portfolio throughout the period, our main objective was to keep the Fund fully invested. New purchases took place across a variety of sectors. These portfolio additions, which included purchases in the water/sewer, health care, corporate-backed industrial development revenue, appropriations, public power, higher education and airport categories, took place in both the primary (new-issue) and secondary municipal market. When possible, we bought bonds on the longer end of the yield curve and with lower investment-grade credit ratings, although lower rated bonds generally became more expensive as the period progressed and the municipal bond market rallied. At times, however, because specific bonds were available when we had funds requiring investment, we would buy high quality, intermediate maturity bonds that still enabled us to achieve our management objectives.
The Nuveen Michigan Municipal Bond Fund’s outperformance of the S&P Municipal Bond Index was driven by the Fund’s credit rating allocation. Compared to the Index, the Fund had more exposure to bonds with credit ratings below BBB, which benefited significantly from investors’ willingness to take on additional credit risk in exchange for higher yields in the prevailing low interest-rate environment. Similarly, the Fund had a smaller allocation to AAA-rated bonds, the market’s highest quality issues, which did not fare as well as lower rated securities.
The Fund’s duration stance had an only slightly positive performance impact. The Fund was overweight in longer bonds, which are more sensitive to changes in interest rates and therefore performed well in the falling rate environment. The Fund had only a modest underweighting in the weaker performing shorter dated issues, and less exposure would
| 8 | Nuveen Investments |
have been desirable in retrospect. On a sector basis, the Fund benefited from its allocation to tobacco-securitization bonds, which rallied during the period. Counterbalancing that impact, however, was the Fund’s overweighting in pre-refunded bonds, whose extremely short maturities and very high credit ratings were unfavorable attributes in the market backdrop of the past six months.
Our key management objective was to keep the Fund fully invested by identifying attractive securities to apply the proceeds of new shareholder inflows and bond calls throughout the period. One particularly large bond call during the past six months was for the Detroit Wayne County Stadium Authority (Comerica Park), a fairly sizeable portfolio holding. The issuer refinanced these securities with a new bond issue, and we used a portion of our proceeds to buy the new Wayne County bonds. Other purchases reflected which types of bonds were available at the times when we had money requiring investment.
We bought securities across a number of sectors, including public power, water/sewer, health care, tobacco, general obligation (GO), airport, multifamily housing and Michigan unemployment obligation assessment bonds. We preferred to buy longer dated, lower rated bonds offering what we saw as good value, but when these types of bonds were unavailable, we sometimes purchased intermediate maturity issues with higher credit ratings to keep the portfolio fully invested, and we remained on the lookout for superior value opportunities.
One significant event in the Michigan bond market during the period was Detroit’s credit rating downgrade from rating agency Fitch Inc., which took place in June 2012. We did not own any Detroit GO bonds, but we had an opportunity toward the end of the period to add to the Fund’s Detroit enterprise bonds, including water and sewer bonds. In our opinion, these securities offered exceptional value and we believed they would be outside the reach of a potential Detroit bankruptcy filing.
The leading factor behind the outperformance of the Nuveen Ohio Municipal Bond Fund compared with the S&P Municipal Bond Index was a helpful allocation to Buckeye Tobacco bonds, an Ohio tobacco-securitization bond issue whose prices rose sharply during the period. The Fund’s relatively large exposure to these securities provided a significant boost to performance.
Also adding to the Ohio Fund’s results was favorable duration and credit quality positioning. From the standpoint of duration, being overweight compared to the index in longer maturity bonds was a plus, as these securities benefited to the greatest extent from declining interest rates. In terms of credit quality, the Fund’s overweighting in BB-rated bonds (which included the tobacco holdings mentioned above) and corresponding underweighting in AAA-rated bonds was helpful in an environment in which lower rated, higher yielding bonds performed better than higher quality issues. In contrast, the Fund’s sector allocation was a negative on a relative basis, with an overweighting in pre-refunded bonds hurting the most, given their very short maturities and high underlying credit quality.
As with the other Funds discussed in this report, our purchase activity was oriented around investing new money received into the portfolio, either as a result of bond calls or
| Nuveen Investments | 9 |
new shareholder inflows. To keep the Fund fully invested, we looked to a variety of sectors for new additions to the portfolio, including GO, health care and dedicated-tax bonds, as well as higher education securities, including a position in bonds issued by Miami University. We also added marginally to water/sewer, corporate-backed industrial revenue and tax-increment financing bonds. Although we were able to find what we believed was attractive value throughout the past six months, the market’s steep rally in the period’s second half left bond prices higher and made value opportunities more elusive than at the start of the period.
Nuveen Missouri Municipal Bond Fund
The Nuveen Missouri Municipal Bond Fund outperformed the S&P Municipal Bond Index during the six-month reporting period, with its duration stance contributing the most to these positive results on a relative basis. Compared to the Index, the Fund was slightly overweight in bonds with longer maturities and correspondingly underweight in shorter maturity issues. As interest rates on longer dated bonds fell more sharply than on their shorter dated counterparts, the Fund was well positioned to benefit to a greater extent from these favorable market conditions.
To a lesser degree, the Fund also gained from constructive credit quality positioning. Given the historically low interest-rate environment, investors’ willingness to accept increased credit risk in exchange for higher income translated into generally strong relative performance for municipal bonds with lower credit ratings. The Fund therefore benefited from its slight overweighting in A-rated bonds, the top performing credit quality segment in the investment-grade universe during the period, as well as its even larger overweighting in BBB-rated bonds, the lowest investment-grade rated credit tier, and a corresponding underweighting in the two highest quality bond categories, AAA-rated and AA-rated issues.
Sector positioning had a minimal impact on the Fund’s relative performance during the period, although a slight overweighting in pre-refunded bonds limited the Fund’s upside. These bonds have very high credit quality and very short maturities, so they were not well positioned in a market environment favoring securities with the opposite characteristics. A slight underweighting in outperforming water/sewer bonds also had a small negative influence on the Fund’s results.
Using primarily the proceeds of new shareholder inflows and bond calls during the period, we added a variety of securities to the portfolio across the investment-grade credit spectrum. New purchases were diversified across multiple sectors and did not result in substantial changes to the portfolio’s sector weightings. During the past six months, we participated in several lower investment-grade bond deals, and we also purchased some A-rated and AA-rated GO bonds, as well as some higher rated St. Louis sewer district bonds. Other purchases included a non-rated college bond issue and some health care and airport bonds. What these purchases had in common was that we were investing opportunistically, trying to take advantage of attractive values in the marketplace as they came available while simultaneously keeping the Fund fully invested by purchasing bonds whenever we had cash requiring investment. As the period progressed and the municipal market rallied, we were still finding areas of value among lower investment-grade rated positions, but the relative value offered by these lower rated bonds, in some cases, grew
| 10 | Nuveen Investments |
less compelling, making higher rated bonds look somewhat more attractive on a relative basis at period end than at the start of the period.
Risk Considerations
Mutual fund investing involves risk; principal loss is possible. Debt or fixed income securities such as those held by the Funds, are subject to market risk, credit risk, interest rate risk, call risk, state concentration risk, tax risk, and income risk. As interest rates rise, bond prices fall. Credit risk refers to an issuers ability to make interest and principal payments when due. Below investment grade or high yield debt securities are subject to liquidity risk and heightened credit risk. The Fund’s use of inverse floaters creates effective leverage. Leverage involves the risk that the Funds could lose more than its original investment and also increases the Funds’ exposure to volatility and interest rate risk.
Dividend Information
All share classes of the Nuveen Kansas Municipal Bond Fund, the Nuveen Kentucky Municipal Bond Fund and the Nuveen Wisconsin Municipal Bond Fund experienced one monthly dividend reduction, as did the Class B, C and I Shares of the Nuveen Ohio Municipal Bond Fund. All share classes of the Nuveen Missouri Municipal Bond Fund and the Class C Shares of the Nuveen Ohio Municipal Bond Fund received two monthly dividend reductions. There were no other dividend changes during the six-month reporting period.
Each Fund seeks to pay dividends at a rate that reflects the past and projected performance of the Fund. To permit a Fund to maintain a more stable monthly dividend, the Fund may pay dividends at a rate that may be more or less than the amount of net investment income actually earned by the Fund during the period. If the Fund has cumulatively earned more than it has paid in dividends, it will hold the excess in reserve as undistributed net investment income (UNII) as part of the Fund’s net asset value. Conversely, if the Fund has cumulatively paid in dividends more than it has earned, the excess will constitute negative UNII that will likewise be reflected in the Fund’s net asset value. Each Fund will, over time, pay all its net investment income as dividends to shareholders. As of November 30, 2012, all four Funds had positive UNII balances, based upon our best estimate, for tax purposes. Kentucky had a negative UNII balance while Kansas, Michigan, Missouri, Ohio and Wisconsin had positive UNII balances for financial reporting purposes.
| Nuveen Investments | 11 |
Fund Performance and Expense Ratios
The Fund Performance and Expense Ratios for each Fund are shown on the following six pages.
Returns quoted represent past performance, which is no guarantee of future results. Current performance may be higher or lower than the performance shown. Investment returns and principal value will fluctuate so that when shares are redeemed, they may be worth more or less than their original cost. Returns without sales charges would be lower if the sales charge were included. Returns do not reflect the deduction of taxes that a shareholder would pay on Fund distributions or the redemption of Fund shares. Income is generally exempt from regular federal income taxes. Some income may be subject to state and local income taxes and to the federal alternative minimum tax. Capital gains, if any, are subject to tax.
Returns may reflect a contractual agreement between certain Funds and the investment adviser to waive certain fees and expenses; see Notes to Financial Statements, Footnote 7 — Management Fees and Other Transactions with Affiliates for more information. In addition, returns may reflect a voluntary expense limitation by the Funds’ investment adviser that may be modified or discontinued at any time without notice. For the most recent month-end performance visit www.nuveen.com or call (800) 257-8787.
Returns reflect differences in sales charges and expenses, which are primarily differences in distribution and service fees. Fund returns assume reinvestment of dividends and capital gains.
Comparative index and Lipper return information is provided for the Funds’ Class A Shares at net asset value (NAV) only.
The expense ratios shown reflect the Funds’ total operating expenses (before fee waivers and/or expense reimbursements, if any) as shown in the Funds’ most recent prospectus. The expense ratios include management fees and other fees and expenses.
| 12 | Nuveen Investments |
Nuveen Kansas Municipal Bond Fund
Refer to the first page of this Fund Performance and Expense Ratios section for further explanation of the information included within this page.
Fund Performance
Average Annual Total Returns as of November 30, 2012*
| Cumulative | Average Annual | |||||||||||||||
| 6-Month | 1-Year | 5-Year | 10-Year | |||||||||||||
Class A Shares at NAV | 5.00% | 12.76% | 6.42% | 5.43% | ||||||||||||
Class A Shares at maximum Offering Price | 0.60% | 7.99% | 5.50% | 4.98% | ||||||||||||
S&P Municipal Bond Index** | 4.52% | 10.94% | 6.09% | 5.57% | ||||||||||||
S&P Kansas Municipal Bond Index** | 4.13% | 10.18% | 6.11% | 5.52% | ||||||||||||
Lipper Other States Municipal Debt Funds Classification Average** | 4.15% | 10.37% | 5.12% | 4.61% | ||||||||||||
Class C Shares | 4.73% | 12.18% | 5.84% | 4.85% | ||||||||||||
Class I Shares | 5.09% | 13.05% | 6.64% | 5.64% | ||||||||||||
Average Annual Total Returns as of December 31, 2012 (Most Recent Calendar Quarter)*
| Cumulative | Average Annual | |||||||||||||||
| 6-Month | 1-Year | 5-Year | 10-Year | |||||||||||||
Class A Shares at NAV | 2.79% | 8.14% | 6.00% | 4.96% | ||||||||||||
Class A Shares at maximum Offering Price | -1.52% | 3.65% | 5.10% | 4.51% | ||||||||||||
Class C Shares | 2.62% | 7.58% | 5.42% | 4.39% | ||||||||||||
Class I Shares | 2.98% | 8.34% | 6.20% | 5.18% | ||||||||||||
Class A Shares have a maximum 4.20% sales charge (Offering Price). Class A Share purchases of $1 million or more are sold at net asset value without an up-front sales charge but may be subject to a contingent deferred sales charge (CDSC), also known as a back-end sales charge, if redeemed within eighteen months of purchase. Class C Shares have a 1% CDSC for redemptions within less than twelve months, which is not reflected in the one-year total return. Class I Shares have no sales charge and may be purchased under limited circumstances or by specified classes of investors.
Expense Ratios as of Most Recent Prospectus
| Expense Ratios | ||||
Class A Shares | 0.85% | |||
Class C Shares | 1.39% | |||
Class I Shares | 0.64% | |||
| * | Six-month returns are cumulative; all other returns are annualized. |
| ** | Refer to the Glossary of Terms Used in this Report for definitions. Indexes and Lipper averages are not available for direct investment. |
| Nuveen Investments | 13 |
Fund Performance and Expense Ratios (continued)
Nuveen Kentucky Municipal Bond Fund
Refer to the first page of this Fund Performance and Expense Ratios section for further explanation of the information included within this page.
Fund Performance
Average Annual Total Returns as of November 30, 2012*
| Cumulative |
| Average Annual |
| |||||||||||||
| 6-Month | 1-Year | 5-Year | 10-Year | |||||||||||||
Class A Shares at NAV | 3.97% | 10.73% | 5.60% | 5.13% | ||||||||||||
Class A Shares at maximum Offering Price | -0.40% | 6.07% | 4.70% | 4.68% | ||||||||||||
S&P Municipal Bond Index** | 4.52% | 10.94% | 6.09% | 5.57% | ||||||||||||
S&P Kentucky Municipal Bond Index** | 4.34% | 11.30% | 6.51% | 5.17% | ||||||||||||
Lipper Other States Municipal Debt Funds Classification Average** | 4.15% | 10.37% | 5.12% | 4.61% | ||||||||||||
Class B Shares w/o CDSC | 3.59% | 9.93% | 4.80% | 4.51% | ||||||||||||
Class B Shares w/CDSC | -1.41% | 5.93% | 4.64% | 4.51% | ||||||||||||
Class C Shares | 3.70% | 10.16% | 5.02% | 4.55% | ||||||||||||
Class I Shares | 4.08% | 10.96% | 5.81% | 5.34% | ||||||||||||
Average Annual Total Returns as of December 31, 2012 (Most Recent Calendar Quarter)*
| Cumulative |
| Average Annual |
| |||||||||||||
| 6-Month | 1-Year | 5-Year | 10-Year | |||||||||||||
Class A Shares at NAV | 2.70% | 7.12% | 5.30% | 4.78% | ||||||||||||
Class A Shares at maximum Offering Price | -1.63% | 2.59% | 4.39% | 4.32% | ||||||||||||
Class B Shares w/o CDSC | 2.33% | 6.34% | 4.50% | 4.16% | ||||||||||||
Class B Shares w/CDSC | -2.67% | 2.34% | 4.33% | 4.16% | ||||||||||||
Class C Shares | 2.44% | 6.56% | 4.72% | 4.20% | ||||||||||||
Class I Shares | 2.81% | 7.34% | 5.50% | 4.98% | ||||||||||||
Class A Shares have a maximum 4.20% sales charge (Offering Price). Class A Share purchases of $1 million or more are sold at net asset value without an up-front sales charge but may be subject to a contingent deferred sales charge (CDSC), also known as a back-end sales charge, if redeemed within eighteen months of purchase. Class B Shares have a CDSC that begins at 5% for redemptions during the first year and declines periodically until after six years when the charge becomes 0%. Class B Shares automatically convert to Class A Shares eight years after purchase. Class C Shares have a 1% CDSC for redemptions within less than twelve months, which is not reflected in the one-year total return. Class I Shares have no sales charge and may be purchased under limited circumstances or by specified classes of investors.
Expense Ratios as of Most Recent Prospectus
| Expense Ratios | ||||
Class A Shares | 0.79% | |||
Class B Shares | 1.54% | |||
Class C Shares | 1.34% | |||
Class I Shares | 0.59% | |||
| * | Six-month returns are cumulative; all other returns are annualized. |
| ** | Refer to the Glossary of Terms Used in this Report for definitions. Indexes and Lipper averages are not available for direct investment. |
| 14 | Nuveen Investments |
Nuveen Michigan Municipal Bond Fund
Refer to the first page of this Fund Performance and Expense Ratios section for further explanation of the information included within this page.
Fund Performance
Average Annual Total Returns as of November 30, 2012*
| Cumulative | Average Annual | |||||||||||||||
| 6-Month | 1-Year | 5-Year | 10-Year | |||||||||||||
Class A Shares at NAV | 4.76% | 10.95% | 5.53% | 5.01% | ||||||||||||
Class A Shares at maximum Offering Price | 0.33% | 6.26% | 4.63% | 4.57% | ||||||||||||
S&P Municipal Bond Index** | 4.52% | 10.94% | 6.09% | 5.57% | ||||||||||||
S&P Michigan Municipal Bond Index** | 4.60% | 11.09% | 6.03% | 5.49% | ||||||||||||
Lipper Michigan Municipal Debt Funds Classification Average** | 3.98% | 10.30% | 4.31% | 4.49% | ||||||||||||
Class C Shares | 4.50% | 10.40% | 4.96% | 4.45% | ||||||||||||
Class I Shares | 4.87% | 11.18% | 5.73% | 5.22% | ||||||||||||
Average Annual Total Returns as of December 31, 2012 (Most Recent Calendar Quarter)*
| Cumulative | Average Annual | |||||||||||||||
| 6-Month | 1-Year | 5-Year | 10-Year | |||||||||||||
Class A Shares at NAV | 3.46% | 7.95% | 5.28% | 4.66% | ||||||||||||
Class A Shares at maximum Offering Price | -0.84% | 3.44% | 4.37% | 4.21% | ||||||||||||
Class C Shares | 3.21% | 7.41% | 4.71% | 4.08% | ||||||||||||
Class I Shares | 3.57% | 8.27% | 5.50% | 4.87% | ||||||||||||
Class A Shares have a maximum 4.20% sales charge (Offering Price). Class A Share purchases of $1 million or more are sold at net asset value without an up-front sales charge but may be subject to a contingent deferred sales charge (CDSC), also known as a back-end sales charge, if redeemed within eighteen months of purchase. Class C Shares have a 1% CDSC for redemptions within less than twelve months, which is not reflected in the one-year total return. Class I Shares have no sales charge and may be purchased under limited circumstances or by specified classes of investors.
Expense Ratios as of Most Recent Prospectus
| Expense Ratios | ||||
Class A Shares | 0.83% | |||
Class C Shares | 1.37% | |||
Class I Shares | 0.62% | |||
| * | Six-month returns are cumulative; all other returns are annualized. |
| ** | Refer to the Glossary of Terms Used in this Report for definitions. Indexes and Lipper averages are not available for direct investment. |
| Nuveen Investments | 15 |
Fund Performance and Expense Ratios (continued)
Nuveen Missouri Municipal Bond Fund
Refer to the first page of this Fund Performance and Expense Ratios section for further explanation of the information included within this page.
Fund Performance
Average Annual Total Returns as of November 30, 2012*
| Cumulative | Average Annual | |||||||||||||||
| 6-Month | 1-Year | 5-Year | 10-Year | |||||||||||||
Class A Shares at NAV | 4.73% | 11.87% | 6.10% | 5.38% | ||||||||||||
Class A Shares at maximum Offering Price | 0.37% | 7.18% | 5.20% | 4.93% | ||||||||||||
S&P Municipal Bond Index** | 4.52% | 10.94% | 6.09% | 5.57% | ||||||||||||
S&P Missouri Municipal Bond Index** | 4.16% | 10.19% | 6.04% | 5.63% | ||||||||||||
Lipper Other States Municipal Debt Funds Classification Average** | 4.15% | 10.37% | 5.12% | 4.61% | ||||||||||||
Class B Shares w/o CDSC | 4.53% | 11.23% | 5.35% | 4.75% | ||||||||||||
Class B Shares w/CDSC | -0.47% | 7.23% | 5.19% | 4.75% | ||||||||||||
Class C Shares | 4.47% | 11.31% | 5.52% | 4.80% | ||||||||||||
Class I Shares | 4.84% | 12.09% | 6.31% | 5.59% | ||||||||||||
Average Annual Total Returns as of December 31, 2012 (Most Recent Calendar Quarter)*
| Cumulative | Average Annual | |||||||||||||||
| 6-Month | 1-Year | 5-Year | 10-Year | |||||||||||||
Class A Shares at NAV | 3.38% | 8.16% | 5.89% | 5.01% | ||||||||||||
Class A Shares at maximum Offering Price | -0.94% | 3.62% | 4.98% | 4.57% | ||||||||||||
Class B Shares w/o CDSC | 3.18% | 7.56% | 5.14% | 4.39% | ||||||||||||
Class B Shares w/CDSC | -1.82% | 3.56% | 4.98% | 4.39% | ||||||||||||
Class C Shares | 3.12% | 7.62% | 5.31% | 4.44% | ||||||||||||
Class I Shares | 3.49% | 8.38% | 6.09% | 5.22% | ||||||||||||
Class A Shares have a maximum 4.20% sales charge (Offering Price). Class A Share purchases of $1 million or more are sold at net asset value without an up-front sales charge but may be subject to a contingent deferred sales charge (CDSC), also known as a back-end sales charge, if redeemed within eighteen months of purchase. Class B Shares have a CDSC that begins at 5% for redemptions during the first year and declines periodically until after six years when the charge becomes 0%. Class B Shares automatically convert to Class A Shares eight years after purchase. Class C Shares have a 1% CDSC for redemptions within less than twelve months, which is not reflected in the one-year total return. Class I Shares have no sales charge and may be purchased under limited circumstances or by specified classes of investors.
Expense Ratios as of Most Recent Prospectus
| Expense Ratios | ||||
Class A Shares | 0.82% | |||
Class B Shares | 1.56% | |||
Class C Shares | 1.37% | |||
Class I Shares | 0.62% | |||
| * | Six-month returns are cumulative; all other returns are annualized. |
| ** | Refer to the Glossary of Terms Used in this Report for definitions. Indexes and Lipper averages are not available for direct investment. |
| 16 | Nuveen Investments |
Nuveen Ohio Municipal Bond Fund
Refer to the first page of this Fund Performance and Expense Ratios section for further explanation of the information included within this page.
Fund Performance
Average Annual Total Returns as of November 30, 2012*
| Cumulative | Average Annual | |||||||||||||||
| 6-Month | 1-Year | 5-Year | 10-Year | |||||||||||||
Class A Shares at NAV | 5.03% | 11.61% | 5.95% | 5.27% | ||||||||||||
Class A Shares at maximum Offering Price | 0.65% | 6.95% | 5.05% | 4.82% | ||||||||||||
S&P Municipal Bond Index** | 4.52% | 10.94% | 6.09% | 5.57% | ||||||||||||
S&P Ohio Municipal Bond Index** | 6.22% | 13.24% | 5.82% | 5.34% | ||||||||||||
Lipper Ohio Municipal Debt Funds Classification Average** | 4.49% | 11.06% | 4.87% | 4.53% | ||||||||||||
Class B Shares w/o CDSC | 4.68% | 10.85% | 5.17% | 4.64% | ||||||||||||
Class B Shares w/CDSC | -0.32% | 6.85% | 5.00% | 4.64% | ||||||||||||
Class C Shares | 4.86% | 11.07% | 5.38% | 4.70% | ||||||||||||
Class I Shares | 5.25% | 11.88% | 6.18% | 5.48% | ||||||||||||
Average Annual Total Returns as of December 31, 2012 (Most Recent Calendar Quarter)*
| Cumulative | Average Annual | |||||||||||||||
| 6-Month | 1-Year | 5-Year | 10-Year | |||||||||||||
Class A Shares at NAV | 3.91% | 8.62% | 5.76% | 4.92% | ||||||||||||
Class A Shares at maximum Offering Price | -0.44% | 4.05% | 4.85% | 4.47% | ||||||||||||
Class B Shares w/o CDSC | 3.47% | 7.78% | 4.96% | 4.30% | ||||||||||||
Class B Shares w/CDSC | -1.53% | 3.78% | 4.79% | 4.30% | ||||||||||||
Class C Shares | 3.64% | 7.99% | 5.17% | 4.34% | ||||||||||||
Class I Shares | 4.03% | 8.78% | 5.96% | 5.12% | ||||||||||||
Class A Shares have a maximum 4.20% sales charge (Offering Price). Class A Share purchases of $1 million or more are sold at net asset value without an up-front sales charge but may be subject to a contingent deferred sales charge (CDSC), also known as a back-end sales charge, if redeemed within eighteen months of purchase. Class B Shares have a CDSC that begins at 5% for redemptions during the first year and declines periodically until after six years when the charge becomes 0%. Class B Shares automatically convert to Class A Shares eight years after purchase. Class C Shares have a 1% CDSC for redemptions within less than twelve months, which is not reflected in the one-year total return. Class I Shares have no sales charge and may be purchased under limited circumstances or by specified classes of investors.
Expense Ratios as of Most Recent Prospectus
| Expense Ratios | ||||
Class A Shares | 0.81% | |||
Class B Shares | 1.56% | |||
Class C Shares | 1.36% | |||
Class I Shares | 0.61% | |||
| * | Six-month returns are cumulative; all other returns are annualized. |
| ** | Refer to the Glossary of Terms Used in this Report for definitions. Indexes and Lipper averages are not available for direct investment. |
| Nuveen Investments | 17 |
Fund Performance and Expense Ratios (continued)
Nuveen Wisconsin Municipal Bond Fund
Refer to the first page of this Fund Performance and Expense Ratios section for further explanation of the information included within this page.
Fund Performance
Average Annual Total Returns as of November 30, 2012*
| Cumulative | Average Annual | |||||||||||||||
| 6-Month | 1-Year | 5-Year | 10-Year | |||||||||||||
Class A Shares at NAV | 4.55% | 11.51% | 6.15% | 5.19% | ||||||||||||
Class A Shares at maximum Offering Price | 0.13% | 6.87% | 5.24% | 4.74% | ||||||||||||
S&P Municipal Bond Index** | 4.52% | 10.94% | 6.09% | 5.57% | ||||||||||||
S&P Wisconsin Municipal Bond Index** | 4.19% | 9.61% | 6.40% | 5.98% | ||||||||||||
Lipper Other States Municipal Debt Funds Classification Average** | 4.15% | 10.37% | 5.12% | 4.61% | ||||||||||||
Class C Shares | 4.27% | 10.82% | 5.58% | 4.62% | ||||||||||||
Class I Shares | 4.74% | 11.81% | 6.38% | 5.41% | ||||||||||||
Average Annual Total Returns as of December 31, 2012 (Most Recent Calendar Quarter)*
| Cumulative | Average Annual | |||||||||||||||
| 6-Month | 1-Year | 5-Year | 10-Year | |||||||||||||
Class A Shares at NAV | 2.52% | 7.02% | 5.73% | 4.71% | ||||||||||||
Class A Shares at maximum Offering Price | -1.75% | 2.55% | 4.81% | 4.26% | ||||||||||||
Class C Shares | 2.25% | 6.46% | 5.14% | 4.14% | ||||||||||||
Class I Shares | 2.63% | 7.23% | 5.94% | 4.91% | ||||||||||||
Class A Shares have a maximum 4.20% sales charge (Offering Price). Class A Share purchases of $1 million or more are sold at net asset value without an up-front sales charge but may be subject to a contingent deferred sales charge (CDSC), also known as a back-end sales charge, if redeemed within eighteen months of purchase. Class C Shares have a 1% CDSC for redemptions within less than twelve months, which is not reflected in the one-year total return. Class I Shares have no sales charge and may be purchased under limited circumstances or by specified classes of investors.
Expense Ratios as of Most Recent Prospectus
| Expense Ratios | ||||
Class A Shares | 0.86% | |||
Class C Shares | 1.40% | |||
Class I Shares | 0.65% | |||
| * | Six-month returns are cumulative; all other returns are annualized. |
| ** | Refer to the Glossary of Terms Used in this Report for definitions. Indexes and Lipper averages are not available for direct investment. |
| 18 | Nuveen Investments |
Yields as of November 30, 2012
Dividend Yield is the most recent dividend per share (annualized) divided by the offering price per share.
The SEC 30-Day Yield is a standardized measure of a Fund’s yield that accounts for the future amortization of premiums or discounts of bonds held in the Fund’s portfolio. The SEC 30-Day Yield is computed under an SEC standardized formula and is based on the maximum offer price per share. Dividend Yield may differ from the SEC 30-Day Yield because the Fund may be paying out more or less than it is earning and it may not include the effect of amortization of bond premium.
The Taxable-Equivalent Yield represents the yield that must be earned on a fully taxable investment in order to equal the yield of the Fund on an after-tax basis at a specified tax rate. With respect to investments that generate qualified dividend income that is taxable at a maximum rate of 15%, the Taxable-Equivalent Yield is lower.
Nuveen Kansas Municipal Bond Fund
| Dividend Yield | SEC 30-Day Yield | Taxable- Equivalent Yield1 | ||||||||||
Class A Shares5 | 3.28% | 2.07% | 3.07% | |||||||||
Class C Shares | 2.91% | 1.62% | 2.40% | |||||||||
Class I Shares | 3.62% | 2.36% | 3.50% | |||||||||
Nuveen Kentucky Municipal Bond Fund
| Dividend Yield | SEC 30-Day Yield | Taxable- Equivalent Yield2 | ||||||||||
Class A Shares5 | 3.46% | 1.84% | 2.72% | |||||||||
Class B Shares | 2.89% | 1.18% | 1.74% | |||||||||
Class C Shares | 3.10% | 1.38% | 2.04% | |||||||||
Class I Shares | 3.82% | 2.12% | 3.13% | |||||||||
Nuveen Michigan Municipal Bond Fund
| Dividend Yield | SEC 30-Day Yield | Taxable- Equivalent Yield3 | ||||||||||
Class A Shares5 | 3.56% | 1.71% | 2.48% | |||||||||
Class C Shares | 3.23% | 1.24% | 1.80% | |||||||||
Class I Shares | 3.92% | 1.98% | 2.87% | |||||||||
Nuveen Missouri Municipal Bond Fund
| Dividend Yield | SEC 30-Day Yield | Taxable- Equivalent Yield4 | ||||||||||
Class A Shares5 | 3.55% | 2.31% | 3.41% | |||||||||
Class B Shares | 2.99% | 1.67% | 2.47% | |||||||||
Class C Shares | 3.21% | 1.87% | 2.76% | |||||||||
Class I Shares | 3.91% | 2.61% | 3.86% | |||||||||
| 1 | TheTaxable-Equivalent Yield is based on the Fund’s SEC 30-Day Yield on the indicated date and a combined federal and state income tax rate of 32.6%. |
| 2 | TheTaxable-Equivalent Yield is based on the Fund’s SEC 30-Day Yield on the indicated date and a combined federal and state income tax rate of 32.3%. |
| 3 | TheTaxable-Equivalent Yield is based on the Fund’s SEC 30-Day Yield on the indicated date and a combined federal and state income tax rate of 31.1%. |
| 4 | TheTaxable-Equivalent Yield is based on the Fund’s SEC 30-Day Yield on the indicated date and a combined federal and state income tax rate of 32.3%. |
| 5 | The SEC Yield for Class A shares quoted in the table reflects the maximum sales load. Investors paying a reduced load because of volume discounts, investors paying no load because they qualify for one of the several exclusions from the load, and existing shareholders who previously paid a load but would like to know the SEC Yield applicable to their shares on a going-forward basis, should understand that the SEC Yield effectively applicable to them would be higher than the figure quoted in the table. |
| Nuveen Investments | 19 |
Yields as of November 30, 2012 (continued)
Nuveen Ohio Municipal Bond Fund
| Dividend Yield | SEC 30-Day Yield | Taxable- Equivalent Yield1 | ||||||||||
Class A Shares3 | 3.62% | 1.77% | 2.60% | |||||||||
Class B Shares | 3.09% | 1.11% | 1.63% | |||||||||
Class C Shares | 3.25% | 1.30% | 1.91% | |||||||||
Class I Shares | 3.99% | 2.04% | 3.00% | |||||||||
Nuveen Wisconsin Municipal Bond Fund
| Dividend Yield | SEC 30-Day Yield | Taxable- Equivalent Yield2 | ||||||||||
Class A Shares3 | 3.28% | 2.23% | 3.32% | |||||||||
Class C Shares | 2.89% | 1.78% | 2.65% | |||||||||
Class I Shares | 3.62% | 2.52% | 3.76% | |||||||||
| 1 | The Taxable-Equivalent Yield is based on the Fund’s SEC 30-Day Yield on the indicated date and a combined federal and state income tax rate of 31.9%. |
| 2 | The Taxable-Equivalent Yield is based on the Fund’s SEC 30-Day Yield on the indicated date and a combined federal and state income tax rate of 32.9%. |
| 3 | The SEC Yield for Class A shares quoted in the table reflects the maximum sales load. Investors paying a reduced load because of volume discounts, investors paying no load because they qualify for one of the several exclusions from the load, and existing shareholders who previously paid a load but would like to know the SEC Yield applicable to their shares on a going-forward basis, should understand that the SEC Yield effectively applicable to them would be higher than the figure quoted in the table. |
| 20 | Nuveen Investments |
Holding Summaries as of November 30, 2012
This data relates to the securities held in each Fund’s portfolio of investments. It should not be construed as a measure of performance for the Fund itself.
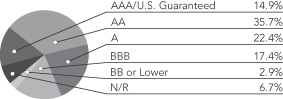
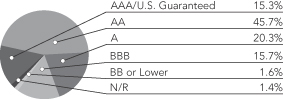
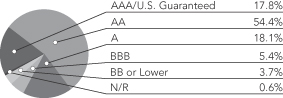
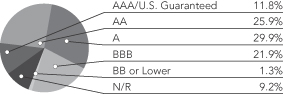
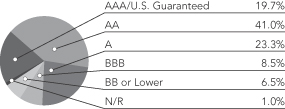
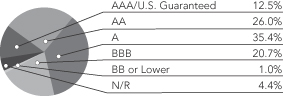
Ratings shown are the highest rating given by one of the following national rating agencies: Standard & Poor’s Group, Moody’s Investors Service, Inc. or Fitch, Inc. Credit ratings are subject to change. AAA, AA, A and BBB are investment grade ratings; BB, B, CCC, CC, C and D are below investment grade ratings. Certain bonds backed by U.S. Government or agency securities are regarded as having an implied rating equal to the rating of such securities. Holdings designated N/R are not rated by these national rating agencies.
Nuveen Kansas Municipal Bond Fund
Bond Credit Quality1
Nuveen Kentucky Municipal Bond Fund
Bond Credit Quality1
Nuveen Michigan Municipal Bond Fund
Bond Credit Quality1
Nuveen Missouri Municipal Bond Fund
Bond Credit Quality1
| Portfolio Composition1 | ||||
| Tax Obligation/Limited | 26.4% | |||
| Health Care | 22.1% | |||
| Tax Obligation/General | 16.1% | |||
| Utilities | 12.1% | |||
| U.S. Guaranteed | 6.7% | |||
| Water and Sewer | 5.5% | |||
| Other | 11.1% | |||
| Portfolio Composition1 | ||||
| Tax Obligation/Limited | 24.1% | |||
| Health Care | 18.8% | |||
| Utilities | 18.6% | |||
| Water and Sewer | 12.5% | |||
| U.S. Guaranteed | 10.0% | |||
| Education and Civic Organizations | 4.8% | |||
| Other | 11.2% | |||
| Portfolio Composition1 | ||||
| Tax Obligation/General | 33.8% | |||
| Water and Sewer | 15.6% | |||
| Tax Obligation/Limited | 12.4% | |||
| Health Care | 12.3% | |||
| U.S. Guaranteed | 10.1% | |||
| Utilities | 5.3% | |||
| Other | 10.5% | |||
| Portfolio Composition1 | ||||
| Health Care | 22.6% | |||
| Tax Obligation/Limited | 21.1% | |||
| Tax Obligation/General | 10.3% | |||
| Education and Civic Organizations | 8.3% | |||
| U.S. Guaranteed | 7.7% | |||
| Long-Term Care | 7.2% | |||
| Water and Sewer | 7.0% | |||
| Utilities | 6.5% | |||
| Other | 9.3% | |||
| 1 | As a percentage of total investments. Holdings are subject to change. |
| Nuveen Investments | 21 |
Holding Summaries as of November 30, 2012 (continued)
Nuveen Ohio Municipal Bond Fund
Bond Credit Quality1
Nuveen Wisconsin Municipal Bond Fund
Bond Credit Quality1
| Portfolio Composition1 | ||||
| Tax Obligation/Limited | 17.6% | |||
| Tax Obligation/General | 15.1% | |||
| Health Care | 14.8% | |||
| U.S. Guaranteed | 14.4% | |||
| Water and Sewer | 7.7% | |||
| Utilities | 7.6% | |||
| Education and Civic Organizations | 7.3% | |||
| Consumer Staples | 5.0% | |||
| Other | 10.5% | |||
| Portfolio Composition1 | ||||
| Tax Obligation/Limited | 40.7% | |||
| Health Care | 17.9% | |||
Utilities | 10.3% | |||
| Education and Civic Organizations | 7.7% | |||
| U.S. Guaranteed | 7.7% | |||
| Housing/Single Family | 3.6% | |||
| Other | 12.1% | |||
| 1 | As a percentage of total investments. Holdings are subject to change. |
| 22 | Nuveen Investments |
As a shareholder of one or more of the Funds, you incur two types of costs: (1) transaction costs, including up-front and back-end sales charges (loads) or redemption fees, where applicable; and (2) ongoing costs, including management fees; distribution and service (12b-1) fees, where applicable; and other Fund expenses. The Examples below are intended to help you understand your ongoing costs (in dollars) of investing in the Funds and to compare these costs with the ongoing costs of investing in other mutual funds.
The Examples below are based on an investment of $1,000 invested at the beginning of the period and held through the period.
The information under “Actual Performance,” together with the amount you invested, allows you to estimate actual expenses incurred over the reporting period. Simply divide your account value by $1,000 (for example, an $8,600 account value divided by $1,000 = 8.60) and multiply the result by the cost shown for your share class, in the row entitled “Expenses Incurred During Period” to estimate the expenses incurred on your account during this period.
The information under “Hypothetical Performance,” provides information about hypothetical account values and hypothetical expenses based on the respective Fund’s actual expense ratio and an assumed rate of return of 5% per year before expenses, which is not the Fund’s actual return. The hypothetical account values and expenses may not be used to estimate the actual ending account balance or expense you incurred for the period. You may use this information to compare the ongoing costs of investing in the Fund and other funds. To do so, compare this 5% hypothetical example with the 5% hypothetical examples that appear in the shareholder reports of the other funds.
Please note that the expenses shown in the tables are meant to highlight your ongoing costs only and do not reflect any transaction costs. Therefore, the hypothetical information is useful in comparing ongoing costs only, and will not help you determine the relative total costs of owning different funds or share classes. In addition, if these transaction costs were included, your costs would have been higher.
Nuveen Kansas Municipal Bond Fund
| Hypothetical Performance | ||||||||||||||||||||||||||
| Actual Performance | (5% annualized return before expenses) | |||||||||||||||||||||||||
| A Shares | C Shares | I Shares | A Shares | C Shares | I Shares | |||||||||||||||||||||
| Beginning Account Value (6/01/12) | $ | 1,000.00 | $ | 1,000.00 | $ | 1,000.00 | $ | 1,000.00 | $ | 1,000.00 | $ | 1,000.00 | ||||||||||||||
| Ending Account Value (11/30/12) | $ | 1,050.00 | $ | 1,047.30 | $ | 1,050.90 | $ | 1,020.96 | $ | 1,018.15 | $ | 1,021.96 | ||||||||||||||
| Expenses Incurred During Period | $ | 4.16 | $ | 6.98 | $ | 3.14 | $ | 4.15 | $ | 6.98 | $ | 3.14 | ||||||||||||||
For each class of the Fund, expenses are equal to the Fund’s annualized net expense ratio of .81%, 1.36% and .61% for Classes A, C and I, respectively, multiplied by the average account value over the period, multiplied by 183/365 (to reflect the one-half year period).
Nuveen Kentucky Municipal Bond Fund
| Hypothetical Performance | ||||||||||||||||||||||||||||||||||
| Actual Performance | (5% annualized return before expenses) | |||||||||||||||||||||||||||||||||
| A Shares | B Shares | C Shares | I Shares | A Shares | B Shares | C Shares | I Shares | |||||||||||||||||||||||||||
| Beginning Account Value (6/01/12) | $ | 1,000.00 | $ | 1,000.00 | $ | 1,000.00 | $ | 1,000.00 | $ | 1,000.00 | $ | 1,000.00 | $ | 1,000.00 | $ | 1,000.00 | ||||||||||||||||||
| Ending Account Value (11/30/12) | $ | 1,039.70 | $ | 1,035.90 | $ | 1,037.00 | $ | 1,040.80 | $ | 1,021.11 | $ | 1,017.35 | $ | 1,018.35 | $ | 1,022.11 | ||||||||||||||||||
| Expenses Incurred During Period | $ | 4.04 | $ | 7.86 | $ | 6.84 | $ | 3.02 | $ | 4.00 | $ | 7.79 | $ | 6.78 | $ | 2.99 | ||||||||||||||||||
For each class of the Fund, expenses are equal to the Fund’s annualized net expense ratio of .79%, 1.54%, 1.34% and .59% for Classes A, B, C and I, respectively, multiplied by the average account value over the period, multiplied by 183/365 (to reflect the one-half year period).
Nuveen Michigan Municipal Bond Fund
| Hypothetical Performance | ||||||||||||||||||||||||||
| Actual Performance | (5% annualized return before expenses) | |||||||||||||||||||||||||
| A Shares | C Shares | I Shares | A Shares | C Shares | I Shares | |||||||||||||||||||||
| Beginning Account Value (6/01/12) | $ | 1,000.00 | $ | 1,000.00 | $ | 1,000.00 | $ | 1,000.00 | $ | 1,000.00 | $ | 1,000.00 | ||||||||||||||
| Ending Account Value (11/30/12) | $ | 1,047.60 | $ | 1,045.00 | $ | 1,048.70 | $ | 1,020.91 | $ | 1,018.15 | $ | 1,021.96 | ||||||||||||||
| Expenses Incurred During Period | $ | 4.21 | $ | 7.02 | $ | 3.18 | $ | 4.20 | $ | 6.98 | $ | 3.14 | ||||||||||||||
For each class of the Fund, expenses are equal to the Fund’s annualized net expense ratio of .82%, 1.37% and .62% for Classes A, C and I, respectively, multiplied by the average account value over the period, multiplied by 183/365 (to reflect the one-half year period).
| Nuveen Investments | 23 |
Expense Examples (continued)
Nuveen Missouri Municipal Bond Fund
| Hypothetical Performance | ||||||||||||||||||||||||||||||||||
| Actual Performance | (5% annualized return before expenses) | |||||||||||||||||||||||||||||||||
| A Shares | B Shares | C Shares | I Shares | A Shares | B Shares | C Shares | I Shares | |||||||||||||||||||||||||||
| Beginning Account Value (6/01/12) | $ | 1,000.00 | $ | 1,000.00 | $ | 1,000.00 | $ | 1,000.00 | $ | 1,000.00 | $ | 1,000.00 | $ | 1,000.00 | $ | 1,000.00 | ||||||||||||||||||
| Ending Account Value (11/30/12) | $ | 1,047.30 | $ | 1,045.30 | $ | 1,044.70 | $ | 1,048.40 | $ | 1,021.00 | $ | 1,017.25 | $ | 1,018.25 | $ | 1,022.00 | ||||||||||||||||||
| Expenses Incurred During Period | $ | 4.09 | $ | 7.93 | $ | 6.90 | $ | 3.07 | $ | 4.04 | $ | 7.82 | $ | 6.81 | $ | 3.03 | ||||||||||||||||||
For each class of the Fund, expenses are equal to the Fund’s annualized net expense ratio of .80%, 1.55%, 1.35% and .60% for Classes A, B, C and I, respectively, multiplied by the average account value over the period, multiplied by 183/365 (to reflect the one-half year period).
Nuveen Ohio Municipal Bond Fund
| Hypothetical Performance | ||||||||||||||||||||||||||||||||||
| Actual Performance | (5% annualized return before expenses) | |||||||||||||||||||||||||||||||||
| A Shares | B Shares | C Shares | I Shares | A Shares | B Shares | C Shares | I Shares | |||||||||||||||||||||||||||
| Beginning Account Value (6/01/12) | $ | 1,000.00 | $ | 1,000.00 | $ | 1,000.00 | $ | 1,000.00 | $ | 1,000.00 | $ | 1,000.00 | $ | 1,000.00 | $ | 1,000.00 | ||||||||||||||||||
| Ending Account Value (11/30/12) | $ | 1,050.30 | $ | 1,046.80 | $ | 1,048.60 | $ | 1,052.50 | $ | 1,021.00 | $ | 1,017.25 | $ | 1,018.25 | $ | 1,022.00 | ||||||||||||||||||
| Expenses Incurred During Period | $ | 4.10 | $ | 7.93 | $ | 6.91 | $ | 3.08 | $ | 4.04 | $ | 7.82 | $ | 6.81 | $ | 3.03 | ||||||||||||||||||
For each class of the Fund, expenses are equal to the Fund’s annualized net expense ratio of .80%, 1.55%, 1.35% and .60% for Classes A, B, C and I, respectively, multiplied by the average account value over the period, multiplied by 183/365 (to reflect the one-half year period).
Nuveen Wisconsin Municipal Bond Fund
| Hypothetical Performance | ||||||||||||||||||||||||||
| Actual Performance | (5% annualized return before expenses) | |||||||||||||||||||||||||
| A Shares | C Shares | I Shares | A Shares | C Shares | I Shares | |||||||||||||||||||||
| Beginning Account Value (6/01/12) | $ | 1,000.00 | $ | 1,000.00 | $ | 1,000.00 | $ | 1,000.00 | $ | 1,000.00 | $ | 1,000.00 | ||||||||||||||
| Ending Account Value (11/30/12) | $ | 1,045.50 | $ | 1,042.70 | $ | 1,047.40 | $ | 1,020.75 | $ | 1,018.05 | $ | 1,021.75 | ||||||||||||||
| Expenses Incurred During Period | $ | 4.35 | $ | 7.10 | $ | 3.33 | $ | 4.29 | $ | 7.01 | $ | 3.29 | ||||||||||||||
For each class of the Fund, expenses are equal to the Fund’s annualized net expense ratio of .85%, 1.39% and .65% for Classes A, C and I, respectively, multiplied by the average account value over the period, multiplied by 183/365 (to reflect the one-half year period).
| 24 | Nuveen Investments |
Portfolio of Investments (Unaudited)
Nuveen Kansas Municipal Bond Fund
November 30, 2012
| Principal Amount (000) | Description (1) | Optional Call Provisions (2) | Ratings (3) | Value | ||||||||||||||
Consumer Staples – 0.6% | ||||||||||||||||||
| $ | 1,535 | Puerto Rico, The Children’s Trust Fund, Tobacco Settlement Asset-Backed Refunding Bonds, Series 2002, 5.500%, 5/15/39 | 8/20 at 100.00 | BBB | $ | 1,536,735 | ||||||||||||
Education and Civic Organizations – 3.8% | ||||||||||||||||||
| 1,200 | Kansas Development Finance Authority, Board of Regents, Revenue Bonds, Kansas State University Housing System, Series 2005A, 5.000%, 4/01/22 – NPFG Insured | 4/15 at 100.00 | Aa3 | 1,312,968 | ||||||||||||||
| 2,950 | Kansas Development Finance Authority, Refunding Revenue Bonds, University of Kansas Center for Research Inc. Project, Series 2012-E1, 4.000%, 2/01/24 | 2/20 at 100.00 | Aa1 | 3,357,189 | ||||||||||||||
Kansas Development Finance Authority, Revenue Bonds, Kansas Board of Regents University of Kansas Medical Center Research Institute, Series 2010N: | ||||||||||||||||||
| 675 | 5.000%, 4/01/29 | 4/20 at 100.00 | Aa1 | 793,625 | ||||||||||||||
| 1,390 | 5.000%, 4/01/30 | 4/20 at 100.00 | Aa1 | 1,625,105 | ||||||||||||||
| 510 | Puerto Rico Industrial, Tourist, Educational, Medical and Environmental Control Facilities Fin Authority, Higher Ed Rev and Rev Refunding Bonds, University of the Sacred Heart Project, Series 2012, 4.375%, 10/01/31 (WI/DD, Settling 12/18/12) | No Opt. Call | Baa2 | 510,255 | ||||||||||||||
| 1,750 | Topeka, Kansas, Economic Development Revenue Bonds, YMCA Project, Refunding Series 2011A, 6.500%, 9/01/32 | 9/21 at 100.00 | N/R | 1,877,015 | ||||||||||||||
| 8,475 | Total Education and Civic Organizations | 9,476,157 | ||||||||||||||||
Health Care – 21.8% | ||||||||||||||||||
| 8,650 | Kansas Development Finance Authority Hospital Revenue Bonds, Adventist Health System/Sunbelt Obligated Group, Series 2009C, | 11/19 at 100.00 | AA– | 10,316,336 | ||||||||||||||
| 2,400 | Kansas Development Finance Authority Hospital Revenue Bonds, Adventist Health System/Sunbelt Obligated Group, Series 2009D, 5.000%, 11/15/29 (UB) | 11/17 at 100.00 | AA– | 2,723,784 | ||||||||||||||
| 1,680 | Kansas Development Finance Authority, Health Facilities Revenue Bonds, Hays Medical Center Inc., Series 2005L, 5.000%, 11/15/20 | 11/15 at 100.00 | A2 | 1,866,077 | ||||||||||||||
| 3,950 | Kansas Development Finance Authority, Health Facilities Revenue Bonds, Hays Medical Center Inc., Series 2010Q, 5.000%, 5/15/35 | 5/19 at 100.00 | A2 | 4,375,178 | ||||||||||||||
| 5,000 | Kansas Development Finance Authority, Health Facilities Revenue Bonds, KU Health System, Series 2011H, 5.125%, 3/01/39 | 3/20 at 100.00 | A+ | 5,551,700 | ||||||||||||||
| 2,000 | Kansas Development Finance Authority, Health Facilities Revenue Bonds, Stormont-Vail Health Care Inc., Series 2008F, 5.375%, 11/15/28 | 11/17 at 100.00 | A2 | 2,234,400 | ||||||||||||||
| 3,715 | Kansas Development Finance Authority, Health Facilities Revenue Bonds, Stormont-Vail Health Care Inc., Series 2011F, 5.250%, 11/15/29 | 11/19 at 100.00 | A2 | 4,224,364 | ||||||||||||||
Kansas Development Finance Authority, Revenue Bonds, Sisters of Charity of Leavenworth Health Services Corporation, Series 2010A: | ||||||||||||||||||
| 1,010 | 5.000%, 1/01/20 | No Opt. Call | AA | 1,238,028 | ||||||||||||||
| 1,000 | 5.000%, 1/01/23 | 1/20 at 100.00 | AA | 1,186,740 | ||||||||||||||
| 1,515 | 5.000%, 1/01/40 (UB) | 1/20 at 100.00 | AA | 1,690,195 | ||||||||||||||
| 1,750 | Kansas Development Finance Authority, Revenue Bonds, Sisters of Charity of Leavenworth Health Services Corporation, Tender Option Bond Trust 4153, 17.664%, 1/01/18 (IF) (4) | No Opt. Call | AA | 2,559,200 | ||||||||||||||
| 3,250 | Labette County Medical Center, Kansas, Revenue Bonds, Series 2007A, 5.750%, 9/01/37 | �� | 9/17 at 100.00 | N/R | 3,437,493 | |||||||||||||
Lawrence, Kansas, Hospital Revenue Bonds, Lawrence Memorial Hospital, Refunding Series 2006: | ||||||||||||||||||
| 2,500 | 5.125%, 7/01/26 | 7/16 at 100.00 | A1 | 2,668,750 | ||||||||||||||
| 500 | 5.125%, 7/01/36 | 7/16 at 100.00 | A1 | 527,920 | ||||||||||||||
| 3,000 | Neosho County, Kansas, Hospital Revenue Bonds, Neosho Memorial Regional Medical Center, Series 2006A, 5.150%, 9/01/31 | 9/14 at 100.00 | N/R | 3,088,170 | ||||||||||||||
| Nuveen Investments | 25 |
Portfolio of Investments (Unaudited)
Nuveen Kansas Municipal Bond Fund (continued)
November 30, 2012
| Principal Amount (000) | Description (1) | Optional Call Provisions (2) | Ratings (3) | Value | ||||||||||||||
Health Care (continued) | ||||||||||||||||||
| $ | 1,000 | Olathe, Kansas, Health Facilities Revenue Bonds, Olathe Medical Center, Series 2010A, 5.000%, 9/01/30 | 9/19 at 100.00 | A+ | $ | 1,110,730 | ||||||||||||
| 500 | Olathe, Kansas, Health Facilities Revenue Bonds, Olathe Medical Center, Series 2012A, 4.000%, 9/01/30 | 9/21 at 100.00 | A+ | 534,050 | ||||||||||||||
| 750 | Salina, Kansas, Hospital Revenue Bonds, Salina Regional Medical Center, Series 2006, 4.625%, 10/01/31 | 4/16 at 100.00 | A1 | 787,658 | ||||||||||||||
| 4,000 | Wichita, Kansas, Hospital Facilities Revenue Refunding and Improvement Bonds, Via Christi Health System Inc., Series 2011A-IV, 5.000%, 11/15/29 | 11/21 at 100.00 | AA– | 4,684,280 | ||||||||||||||
| 48,170 | Total Health Care | 54,805,053 | ||||||||||||||||
Housing/Single Family – 0.6% | ||||||||||||||||||
| 1,510 | Sedgwick and Shawnee Counties, Kansas, FNMA/GNMA Mortgage-Backed Securities Program Single Family Revenue Bonds, Series 2005A, 5.550%, 6/01/37 (Alternative Minimum Tax) | 6/15 at 105.00 | Aaa | 1,540,457 | ||||||||||||||
| 55 | Sedgwick and Shawnee Counties, Kansas, GNMA Mortgage-Backed Securities Program Single Family Revenue Bonds, Series 1997A-1, 6.950%, 6/01/29 (Alternative Minimum Tax) | No Opt. Call | Aaa | 55,139 | ||||||||||||||
| 1,565 | Total Housing/Single Family | 1,595,596 | ||||||||||||||||
Long-Term Care – 4.6% | ||||||||||||||||||
| 3,125 | Kansas Development Finance Authority, Revenue Bonds, Lifespace Communities, Inc., Refunding Series 2010S, 5.000%, 5/15/30 | 5/20 at 100.00 | A | 3,407,813 | ||||||||||||||
Lenexa, Kansas, Health Care Facilities Revenue Bonds, Lakeview Village Inc, Refunding & Improvement Series 2007: | ||||||||||||||||||
| 1,270 | 5.125%, 5/15/16 | No Opt. Call | N/R | 1,357,147 | ||||||||||||||
| 1,100 | 5.500%, 5/15/39 | 5/17 at 100.00 | N/R | 1,134,111 | ||||||||||||||
| 2,030 | Manhattan Health Care Facility Revenue Bonds, Kansas, Meadowlarks Hills Retirement, Series 2007B, 5.125%, 5/15/42 | 5/14 at 103.00 | N/R | 2,055,984 | ||||||||||||||
| 2,000 | Olathe, Kansas, Senior Living Facility Revenue Bonds, Aberdeen Village Inc, Refunding Series 2005A, 5.600%, 5/15/28 | 2/13 at 100.00 | N/R | 2,000,840 | ||||||||||||||
| 1,540 | Olathe, Kansas, Senior Living Facility Revenue Bonds, Catholic Care Campus Santa Marta, Series 2006A, 6.000%, 11/15/38 | 11/16 at 100.00 | N/R | 1,592,406 | ||||||||||||||
| 11,065 | Total Long-Term Care | 11,548,301 | ||||||||||||||||
Tax Obligation/General – 14.6% | ||||||||||||||||||
| 4,000 | Allen County, Kansas Public Building Commission Revenue Bonds, Allen County Hospital Project, Series 2012, 5.150%, 12/01/36 | 12/22 at 100.00 | A | 4,473,800 | ||||||||||||||
| 2,500 | Butler and Sedgwick Counties Unified School District 385, Andover, Kansas, General Obligation Refunding and Improvement Bonds, Series 2000, 6.000%, 9/01/16 – AGM Insured | No Opt. Call | AA– | 2,970,950 | ||||||||||||||
| 2,000 | Butler County Unified School District 402, Kansas, General Obligation Bonds, Series 2008A, 5.125%, 9/01/32 – AGC Insured | 9/18 at 100.00 | Aa3 | 2,330,300 | ||||||||||||||
| 65 | Cowley County Unified School District 465, Winfield, Kansas, General Obligation Bonds, Series 2003, 5.250%, 10/01/23 – NPFG Insured | 10/13 at 100.00 | BBB | 67,153 | ||||||||||||||
| 3,000 | Johnson and Miami Counties Unified School District 230, Kansas, General Obligation Bonds, Series 2011A, 5.250%, 9/01/28 | 9/21 at 100.00 | Aa3 | 3,704,610 | ||||||||||||||
| 2,250 | Johnson County Unified School District 229, Blue Valley, Kansas, General Obligation Bonds, Series 2012A, 5.000%, 10/01/23 – NPFG Insured | 10/22 at 100.00 | Aaa | 2,934,090 | ||||||||||||||
| 2,000 | Johnson County Unified School District 231, Gardner, Edgerton and Antioch, Kansas, General Obligation Bonds, Refunding and Improvement Series 2012A, 5.000%, 10/01/23 | 10/22 at 100.00 | A+ | 2,500,240 | ||||||||||||||
| 4,000 | Leavenworth County Unified School District 469, Lansing, Kansas, General Obligation Bonds, Series 2012, 4.000%, 9/01/38 (WI/DD, Settling 12/20/12) | No Opt. Call | Aa3 | 4,257,480 | ||||||||||||||
| 26 | Nuveen Investments |
| Principal Amount (000) | Description (1) | Optional Call Provisions (2) | Ratings (3) | Value | ||||||||||||||
Tax Obligation/General (continued) | ||||||||||||||||||
| $ | 1,100 | Puerto Rico, General Obligation Bonds, Public Improvement, Refunding Series 2011C, 6.500%, 7/01/40 | 7/21 at 100.00 | Baa1 | $ | 1,264,065 | ||||||||||||
Puerto Rico, General Obligation Bonds, Public Improvement, Refunding Series 2012A: | ||||||||||||||||||
| 600 | 5.500%, 7/01/39 | 7/22 at 100.00 | Baa1 | 629,826 | ||||||||||||||
| 1,000 | 5.000%, 7/01/41 | 7/22 at 100.00 | Baa1 | 1,010,200 | ||||||||||||||
| 3,000 | Sedgwick County Unified School District 260, Kansas, General Obligation Bonds, Refunding & School Improvement Series 2012, 5.000%, 10/01/30 | 10/22 at 100.00 | AA– | 3,666,420 | ||||||||||||||
| 3,000 | Sedgwick County Unified School District 262, Kansas, General Obligation Bonds, Series 2008, 5.000%, 9/01/23 – AGC Insured | 9/18 at 100.00 | AA– | 3,594,690 | ||||||||||||||
| 500 | Unified School District 470, Cowley County, Kansas, General Obligation Bonds, Series 2008A, 5.500%, 9/01/21 – AGM Insured | 9/18 at 100.00 | AA– | 613,195 | ||||||||||||||
| 2,085 | Wyandotte County Unified School District 203, Piper, Kansas, General Obligation Bonds, Series 2008B, 5.500%, 9/01/28 | 9/18 at 100.00 | AA– | 2,533,338 | ||||||||||||||
| 31,100 | Total Tax Obligation/General | 36,550,357 | ||||||||||||||||
Tax Obligation/Limited – 26.1% | ||||||||||||||||||
| 1,000 | Dodge City, Kansas, Sales Tax Revenue Bonds, Series 2009, 5.000%, 6/01/34 – AGC Insured | 6/19 at 100.00 | AA– | 1,185,760 | ||||||||||||||
| 875 | Government of Guam, Business Privilege Tax Bonds, Series 2011A, 5.125%, 1/01/42 | 1/22 at 100.00 | A | 1,000,563 | ||||||||||||||
| 1,000 | Guam Government, Limited Obligation Section 30 Revenue Bonds, Series 2009A, 5.750%, 12/01/34 | 12/19 at 100.00 | BBB+ | 1,145,680 | ||||||||||||||
Johnson County Public Building Commission, Kansas, Lease Purchase Revenue Bonds, Series 2011A: | ||||||||||||||||||
| 1,820 | 4.000%, 9/01/25 | 9/20 at 100.00 | AAA | 2,094,984 | ||||||||||||||
| 2,020 | 4.000%, 9/01/26 | 9/20 at 100.00 | AAA | 2,314,698 | ||||||||||||||
| 1,625 | 4.000%, 9/01/27 | 9/20 at 100.00 | AAA | 1,848,275 | ||||||||||||||
| 1,220 | 4.125%, 9/01/28 | 9/20 at 100.00 | AAA | 1,392,593 | ||||||||||||||
| 1,270 | 4.250%, 9/01/29 | 9/20 at 100.00 | AAA | 1,457,046 | ||||||||||||||
| 1,200 | Kansas Development Finance Authority, Athletic Facilities Revenue Bonds, K-State Athletics Inc Project, Series 2011-A1, 5.000%, 7/01/28 | 7/16 at 100.00 | A1 | 1,346,760 | ||||||||||||||
Kansas Development Finance Authority, Athletic Facilities Revenue Bonds, K-State Athletics, Inc., Project, Series 2012B-1: | ||||||||||||||||||
| 2,750 | 5.000%, 7/01/30 | 7/17 at 100.00 | A1 | 3,117,510 | ||||||||||||||
| 1,855 | 5.000%, 7/01/32 | 7/17 at 100.00 | A1 | 2,102,902 | ||||||||||||||
| 365 | Kansas Development Finance Authority, Board of Regents, Revenue Bonds, Scientific Research and Development Facilities Projects, Series 2003C, Reg S, 5.000%, 10/01/23 – AMBAC Insured | 4/13 at 102.00 | AA | 377,888 | ||||||||||||||
| 1,665 | Kansas Development Finance Authority, K-State Olathe Innovation Campus Inc., Johnson County Sales Tax Revenue Bonds, Series 2009L, 5.000%, 9/01/39 | 9/19 at 100.00 | AA | 1,970,344 | ||||||||||||||
| 1,140 | Kansas Development Finance Authority, Lease Revenue Bonds, Department of Administration, State Capitol Restoration Project, Series 2004G-1, 5.125%, 4/01/21 – NPFG Insured | 4/14 at 100.00 | AA | 1,206,291 | ||||||||||||||
| 3,910 | Kansas Development Finance Authority, Revenue Bonds, Department of Administration, Comprehensive Transportation Program, Series 2006A, 5.000%, 11/01/23 – FGIC Insured | 11/16 at 100.00 | AA | 4,506,549 | ||||||||||||||
Kansas Development Finance Authority, Revenue Bonds, Department of Commerce Impact Program, Series 2011K: | �� | |||||||||||||||||
| 4,900 | 5.000%, 12/01/20 | 12/19 at 100.00 | AA | 6,053,264 | ||||||||||||||
| 3,605 | 4.000%, 12/01/22 | 12/19 at 100.00 | AA | 4,097,948 | ||||||||||||||
| 40 | Kansas Development Finance Authority, Revenue Bonds, State Projects, Series 2001W, 5.000%, 10/01/17 – NPFG Insured | 2/13 at 100.00 | AA | 40,148 | ||||||||||||||
| 1,155 | Kansas Development Finance Authority, Revenue Bonds, State Projects, Series 2004A, 5.000%, 4/01/22 – FGIC Insured | 4/14 at 101.00 | AA | 1,233,297 | ||||||||||||||
| Nuveen Investments | 27 |
Portfolio of Investments (Unaudited)
Nuveen Kansas Municipal Bond Fund (continued)
November 30, 2012
| Principal Amount (000) | Description (1) | Optional Call Provisions (2) | Ratings (3) | Value | ||||||||||||||
Tax Obligation/Limited (continued) | ||||||||||||||||||
| $ | 5,000 | Overland Park Development Corporation, Kansas, First Tier Revenue Bonds, Overland Park Convention Center, Series 2007A, 5.250%, 1/01/32 – AMBAC Insured | 1/17 at 100.00 | BB+ | $ | 5,174,150 | ||||||||||||
Overland Park Transportation Development District, Kansas, Sales Tax Revenue Bonds, Oak Park Mall Project, Series 2010: | ||||||||||||||||||
| 805 | 5.200%, 4/01/20 | No Opt. Call | BBB | 936,585 | ||||||||||||||
| 1,350 | 5.900%, 4/01/32 | 4/20 at 100.00 | BBB | 1,547,154 | ||||||||||||||
| 3,000 | Puerto Rico Infrastructure Financing Authority, Special Tax Revenue Bonds, Series 2006, 5.000%, 7/01/46 | 7/16 at 100.00 | BBB+ | 3,008,760 | ||||||||||||||
| 2,000 | Puerto Rico Public Buildings Authority, Guaranteed Government Facilities Revenue Bonds, Series 2012U, 5.250%, 7/01/42 – AMBAC Insured | 7/22 at 100.00 | Baa1 | 2,055,260 | ||||||||||||||
| 1,535 | Puerto Rico Sales Tax Financing Corporation, Sales Tax Revenue Bonds, First Subordinate Series 2010C, 5.250%, 8/01/41 | 8/20 at 100.00 | A+ | 1,651,645 | ||||||||||||||
| 7,500 | Puerto Rico Sales Tax Financing Corporation, Sales Tax Revenue Bonds, Series 2007A, 0.000%, 8/01/56 | No Opt. Call | AA– | 599,250 | ||||||||||||||
| 5,000 | Virgin Islands Public Finance Authority, Gross Receipts Taxes Loan Note, Refunding Series 2012A, 5.000%, 10/01/32 | No Opt. Call | BBB+ | 5,626,000 | ||||||||||||||
| 1,150 | Virgin Islands Public Finance Authority, Matching Fund Loan Notes Revenue Bonds, Subordinate Lien Series 2010B, 5.250%, 10/01/29 | 10/20 at 100.00 | Baa2 | 1,282,239 | ||||||||||||||
| 7,630 | Wyandotte County-Kansas City Unified Government, Kansas, Sales Tax Special Obligation Capital Appreciation Revenue Bonds Redevelopment Project Area B – Major Multi-Sport Athletic Complex Project, Subordinate Lien Series 2010B, 0.000%, 6/01/21 | No Opt. Call | BBB | 5,248,982 | ||||||||||||||
| 68,385 | Total Tax Obligation/Limited | 65,622,525 | ||||||||||||||||
Transportation – 1.2% | ||||||||||||||||||
| 1,750 | Kansas Turnpike Authority, Revenue Bonds, Series 2012A, 4.000%, 9/01/26 – AGM Insured | 9/20 at 100.00 | AA– | 1,979,740 | ||||||||||||||
| 945 | Virginia Small Business Financing Authority, Senior Lien Revenue Bonds, Elizabeth River Crossing, Opco LLC Project, Series 2012, 5.250%, 1/01/32 (Alternative Minimum Tax) | 7/22 at 100.00 | BBB– | 1,054,195 | ||||||||||||||
| 2,695 | Total Transportation | 3,033,935 | ||||||||||||||||
U.S. Guaranteed – 6.7% (5) | ||||||||||||||||||
Kansas Development Finance Authority, Board of Regents, Revenue Bonds, Scientific Research and Development Facilities Projects, Series 2003C, Reg S: | ||||||||||||||||||
| 2,010 | 5.000%, 10/01/23 (Pre-refunded 4/01/13) – AMBAC Insured | 4/13 at 102.00 | Aa2 (5) | 2,082,400 | ||||||||||||||
| 625 | 5.000%, 10/01/23 (Pre-refunded 4/01/13) – AMBAC Insured | 4/13 at 102.00 | Aa2 (5) | 647,513 | ||||||||||||||
| 1,690 | Sedgwick and Shawnee Counties, Kansas, Mortgage Backed Securities Program Single Family Mortgage Revenue Bonds, Series 2006A6, 5.550%, 6/01/38 (Alternative Minimum Tax) (ETM) | 6/16 at 103.00 | Aaa | 1,802,909 | ||||||||||||||
| 1,010 | Wichita, Kansas, Revenue Bonds, CSJ Health System of Wichita, Inc., Series 1985-XXV, 7.200%, 10/01/15 (ETM) | 5/13 at 100.00 | A+ (5) | 1,098,516 | ||||||||||||||
Wyandotte County-Kansas City Unified Government, Kansas, Utility System Revenue Bonds, Series 2004B: | ||||||||||||||||||
| 1,000 | 5.000%, 9/01/24 (Pre-refunded 9/01/14) – AGM Insured | 9/14 at 100.00 | AA– (5) | 1,079,360 | ||||||||||||||
| 9,265 | 5.000%, 9/01/32 (Pre-refunded 9/01/14) – AGM Insured | 9/14 at 100.00 | AA– (5) | 10,000,266 | ||||||||||||||
| 15,600 | Total U.S. Guaranteed | 16,710,964 | ||||||||||||||||
Utilities – 12.0% | ||||||||||||||||||
| 3,000 | Burlingoton, Kansas, Environmental Improvement Revenue Bonds, Kansas City Power and Light Company, Series 2005, 4.650%, 9/01/35 – SYNCORA GTY Insured | 9/15 at 100.00 | BBB | 3,140,340 | ||||||||||||||
| 2,235 | Burlington, Kansas, Pollution Control Revenue Bonds, Kansas Gas and Electric Company, Refunding Series 2004A, 5.300%, 6/01/31 – NPFG Insured | 6/14 at 100.00 | A3 | 2,314,365 | ||||||||||||||
| 28 | Nuveen Investments |
| Principal Amount (000) | Description (1) | Optional Call Provisions (2) | Ratings (3) | Value | ||||||||||||||
Utilities (continued) | ||||||||||||||||||
Kansas State Power Pool, Electric Utility Revenue Bonds, Dogwood Energy Facility, Series 2012A: | ||||||||||||||||||
| $ | 1,395 | 5.000%, 12/01/22 | No Opt. Call | Baa1 | $ | 1,618,074 | ||||||||||||
| 1,265 | 5.000%, 12/01/23 | 12/22 at 100.00 | Baa1 | 1,456,369 | ||||||||||||||
| 2,575 | 5.000%, 12/01/31 | 12/20 at 100.00 | Baa1 | 2,843,521 | ||||||||||||||
| 3,000 | Puerto Rico Electric Power Authority, Power Revenue Bonds, Refunding Series 2012A, 5.050%, 7/01/42 | 7/22 at 100.00 | BBB+ | 3,081,330 | ||||||||||||||
| 2,300 | Texas Municipal Gas Acquisition and Supply Corporation III, Gas Supply Revenue Bonds, Series 2012, 5.000%, 12/15/32 (WI/DD, Settling 12/04/12) | No Opt. Call | A3 | 2,549,895 | ||||||||||||||
| 4,500 | Wyandotte County-Kansas City Unified Government, Kansas, Utility System Revenue Bonds, Refunding Series 2012A, 5.000%, 9/01/32 | 9/22 at 100.00 | A+ | 5,367,150 | ||||||||||||||
Wyandotte County-Kansas City Unified Government, Kansas, Utility System Revenue Bonds, Series 2009A: | ||||||||||||||||||
| 1,075 | 5.000%, 9/01/29 – BHAC Insured | 3/19 at 100.00 | AA+ | 1,280,701 | ||||||||||||||
| 3,000 | 5.250%, 9/01/34 – BHAC Insured | 3/19 at 100.00 | AA+ | 3,604,470 | ||||||||||||||
| 1,535 | Wyandotte County-Kansas City Unified Government, Kansas, Utility System Revenue Bonds, Series 2011A, 5.000%, 9/01/28 | 9/21 at 100.00 | A+ | 1,835,614 | ||||||||||||||
| 1,000 | Wynadotte County-Kansas City Unified Government, Kansas, Industrial Revenue Bonds, Board of Public Utilities Office Building Complex, Series 2001, 5.000%, 5/01/21 – NPFG Insured | 5/13 at 100.00 | BBB | 1,003,540 | ||||||||||||||
| 26,880 | Total Utilities | 30,095,369 | ||||||||||||||||
Water and Sewer – 5.5% | ||||||||||||||||||
| 2,000 | Guam Government Waterworks Authority, Water and Wastewater System Revenue Bonds, Series 2005, 5.875%, 7/01/35 | 7/15 at 100.00 | Ba2 | 2,072,260 | ||||||||||||||
| 3,000 | Kansas Development Finance Authority, Water Pollution Control Revolving Fund, State Match Program, Series 2008-CW, 5.000%, 11/01/24 | 1/13 at 100.00 | AAA | 3,126,030 | ||||||||||||||
| 1,000 | Puerto Rico Aqueduct and Sewerage Authority, Revenue Bonds, Senior Lien Series 2008A, 6.000%, 7/01/38 | 7/18 at 100.00 | Baa2 | 1,060,400 | ||||||||||||||
| 2,000 | Puerto Rico Aqueduct and Sewerage Authority, Revenue Bonds, Senior Lien Series 2012A, 5.250%, 7/01/42 | 7/22 at 100.00 | Baa2 | 2,044,500 | ||||||||||||||
| 2,000 | Wichita, Kansas, Water and Sewer Utility Revenue Bonds, Refunding Series 2011A, 5.000%, 10/01/28 | 10/21 at 100.00 | AA– | 2,464,580 | ||||||||||||||
| 2,500 | Wichita, Kansas, Water and Sewer Utility Revenue Bonds, Series 2009A, 5.000%, 10/01/39 | 10/19 at 100.00 | AA– | 2,963,750 | ||||||||||||||
| 12,500 | Total Water and Sewer | 13,731,520 | ||||||||||||||||
| 227,970 | Total Long-Term Investments (cost $221,830,534) – 97.5% | 244,706,512 | ||||||||||||||||
SHORT-TERM INVESTMENTS – 1.3% | ||||||||||||||||||
Tax Obligation/General – 1.3% | ||||||||||||||||||
| 3,400 | Wichita, Kansas, General Obligation Bonds, Variable Rate Demand Obligations, Renewal and Improvement Temporary Notes, Series 2011-248, 0.300%, 8/15/13 (6) | 2/13 at 100.00 | SP-1+ | 3,400,374 | ||||||||||||||
| $ | 3,400 | Total Short-Term Investments (cost $3,399,100) | 3,400,374 | |||||||||||||||
Total Investments (cost $225,229,634) – 98.8% | 248,106,886 | |||||||||||||||||
Floating Rate Obligations – (3.8)% | (9,420,000) | |||||||||||||||||
Other Assets Less Liabilities – 5.0% | 12,360,494 | |||||||||||||||||
Net Assets – 100% | $ | 251,047,380 | ||||||||||||||||
| Nuveen Investments | 29 |
Portfolio of Investments (Unaudited)
Nuveen Kansas Municipal Bond Fund (continued)
November 30, 2012
| (1) | All percentages shown in the Portfolio of Investments are based on net assets. |
| (2) | Optional Call Provisions: Dates (month and year) and prices of the earliest optional call or redemption. There may be other call provisions at varying prices at later dates. Certain mortgage-backed securities may be subject to periodic principal paydowns. |
| (3) | Ratings: Using the highest of Standard & Poor’s Group (“Standard & Poor’s”), Moody’s Investors Service, Inc. (“Moody’s”) or Fitch, Inc. (“Fitch”) rating. Ratings below BBB by Standard & Poor’s, Baa by Moody’s or BBB by Fitch are considered to be below investment grade. Holdings designated N/R are not rated by any of these national rating agencies. |
| (4) | Investment, or portion of investment, has been pledged to collateralize the net payment obligations for investments in inverse floating rate transactions. |
| (5) | Backed by an escrow or trust containing sufficient U.S. Government or U.S. Government agency securities, which ensure the timely payment of principal and interest. Certain bonds backed by U.S. Government or agency securities are regarded as having an implied rating equal to the rating of such securities. |
| (6) | Investment has a maturity of more than one year, but has variable rate and demand features which qualify it as a short-term investment. The rate disclosed is that in effect at the end of the reporting period. This rate changes periodically based on market conditions or a specified market index. |
| N/R | Not rated. |
| WI/DD | Investment, or portion of investment, purchased on a when-issued or delayed delivery basis. |
| (ETM) | Escrowed to maturity. |
| (IF) | Inverse floating rate investment. |
| (UB) | Underlying bond of an inverse floating rate trust reflected as a financing transaction. See Notes to Financial Statements, Footnote 1 – General Information and Significant Accounting Policies, Inverse Floating Rate Securities for more information. |
See accompanying notes to financial statements.
| 30 | Nuveen Investments |
Portfolio of Investments (Unaudited)
Nuveen Kentucky Municipal Bond Fund
November 30, 2012
| Principal Amount (000) | Description (1) | Optional Call Provisions (2) | Ratings (3) | Value | ||||||||||||||
Consumer Staples – 1.4% | ||||||||||||||||||
| $ | 25,000 | Puerto Rico, The Children’s Trust Fund, Tobacco Settlement Asset-Backed Bonds, Series 2005A, 0.000%, 5/15/50 | 5/15 at 11.19 | BB– | $ | 1,952,500 | ||||||||||||
| 4,795 | Puerto Rico, The Children’s Trust Fund, Tobacco Settlement Asset-Backed Refunding Bonds, Series 2002, 5.375%, 5/15/33 | 8/20 at 100.00 | BBB+ | 4,800,418 | ||||||||||||||
| 29,795 | Total Consumer Staples | 6,752,918 | ||||||||||||||||
Education and Civic Organizations – 4.8% | ||||||||||||||||||
| 1,000 | Campbellsville, Kentucky, Revenue Bonds, Campbellsville University, Series 2005, 5.700%, 3/01/34 | 3/15 at 100.00 | N/R | 1,041,350 | ||||||||||||||
| 1,000 | Kentucky Asset/Liability Commission, General Receipts Revenue Bonds, University of Kentucky, Series 2005, 5.000%, 10/01/16 – FGIC Insured | 10/15 at 100.00 | Aa2 | 1,124,360 | ||||||||||||||
Kentucky Asset/Liability Commission, General Receipts Revenue Bonds, University of Kentucky, Series 2007A: | ||||||||||||||||||
| 1,645 | 5.000%, 10/01/20 – AMBAC Insured | 10/17 at 100.00 | Aa2 | 1,925,999 | ||||||||||||||
| 2,675 | 5.000%, 10/01/21 – AMBAC Insured | 10/17 at 100.00 | Aa2 | 3,125,096 | ||||||||||||||
| 4,435 | 5.000%, 10/01/22 – AMBAC Insured | 10/17 at 100.00 | Aa2 | 5,181,233 | ||||||||||||||
| 1,500 | Louisville and Jefferson County Metropolitan Government, Kentucky, General Revenue Bonds, Bellarmine University, Series 2008A, 6.000%, 5/01/38 | 5/18 at 100.00 | Baa3 | 1,662,135 | ||||||||||||||
| 2,000 | Louisville and Jefferson County Metropolitan Government, Kentucky, Industrial Building Revenue Bonds, Sisters of Mercy of the Americas, Series 2006, 5.000%, 10/01/35 | 10/16 at 100.00 | A+ | 2,115,940 | ||||||||||||||
University of Kentucky, General Receipts Bonds, Refunding Series 2012A: | ||||||||||||||||||
| 1,435 | 5.000%, 5/01/19 | No Opt. Call | Aa2 | 1,781,452 | ||||||||||||||
| 1,185 | 5.000%, 5/01/20 | No Opt. Call | Aa2 | 1,498,160 | ||||||||||||||
| 2,340 | 5.000%, 5/01/21 | No Opt. Call | Aa2 | 2,992,298 | ||||||||||||||
| 19,215 | Total Education and Civic Organizations | 22,448,023 | ||||||||||||||||
Health Care – 18.7% | ||||||||||||||||||
| 3,360 | Christian County, Kentucky, Hospital Revenue Refunding Bonds, Jennie Stuart Medical Center, Series 2006A, 5.500%, 2/01/36 – AGC Insured | 2/18 at 100.00 | AA– | 3,707,659 | ||||||||||||||
Glasgow, Kentucky, Healthcare Revenue Bonds, T.J. Samson Community Hospital Project, Series 2011: | ||||||||||||||||||
| 2,000 | 6.375%, 2/01/35 | 8/21 at 100.00 | BBB | 2,365,060 | ||||||||||||||
| 3,310 | 6.450%, 2/01/41 | 8/21 at 100.00 | BBB | 3,876,440 | ||||||||||||||
| 540 | Kentucky Economic Development Finance Authority , Medical Center Revenue Bonds, Ashland Hospital Corporation d/b/a Kings Daughters Medical Center Project, Series 2010A, 5.000%, 2/01/40 | 2/20 at 100.00 | A+ | 594,356 | ||||||||||||||
Kentucky Economic Development Finance Authority, Hospital Facilities Revenue Bonds, Owensboro Medical Health System, Series 2010A: | ||||||||||||||||||
| 3,925 | 5.500%, 6/01/21 | 6/20 at 100.00 | BBB+ | 4,643,511 | ||||||||||||||
| 165 | 6.375%, 6/01/40 | 6/20 at 100.00 | BBB+ | 200,005 | ||||||||||||||
| 3,375 | 6.500%, 3/01/45 | 6/20 at 100.00 | BBB+ | 4,108,894 | ||||||||||||||
Kentucky Economic Development Finance Authority, Hospital Revenue Bonds, Baptist Healthcare System Obligated Group, Series 2009A: | ||||||||||||||||||
| 1,100 | 5.375%, 8/15/24 | 8/19 at 100.00 | AA– | 1,281,478 | ||||||||||||||
| 7,090 | 5.625%, 8/15/27 | 8/19 at 100.00 | AA– | 8,375,275 | ||||||||||||||
| 6,500 | Kentucky Economic Development Finance Authority, Hospital Revenue Bonds, Baptist Healthcare System Obligated Group, Series 2011, 5.000%, 8/15/42 | 8/21 at 100.00 | AA– | 7,244,185 | ||||||||||||||
Kentucky Economic Development Finance Authority, Hospital Revenue Bonds, Saint Elizabeth Medical Center, Series 2009A: | ||||||||||||||||||
| 50 | 5.375%, 5/01/34 | 5/19 at 100.00 | AA– | 57,532 | ||||||||||||||
| 5,010 | 5.500%, 5/01/39 | 5/19 at 100.00 | AA– | 5,744,165 | ||||||||||||||
Kentucky Economic Development Finance Authority, Hospital System Revenue Refunding and Improvement Bonds, Appalachian Regional Healthcare Inc., Series 1997: | ||||||||||||||||||
| 3,500 | 5.850%, 10/01/17 | 4/13 at 100.00 | BB | 3,505,565 | ||||||||||||||
| 1,495 | 5.875%, 10/01/22 | 4/13 at 100.00 | BB | 1,496,570 | ||||||||||||||
| Nuveen Investments | 31 |
Portfolio of Investments (Unaudited)
Nuveen Kentucky Municipal Bond Fund (continued)
November 30, 2012
| Principal Amount (000) | Description (1) | Optional Call Provisions (2) | Ratings (3) | Value | ||||||||||||||
Health Care (continued) | ||||||||||||||||||
| $ | 7,000 | Murray Hospital Facilities, Kentucky, Revenue Bonds, Murray-Calloway County Public Hospital, Series 2007, 5.125%, 8/01/37 | 8/17 at 100.00 | Baa2 | $ | 7,146,860 | ||||||||||||
| 7,000 | Pikeville, Kentucky, Hospital Revenue Bonds, Pikeville Medical Center, Inc. Project, Improvement and Refunding Series 2011, 6.500%, 3/01/41 | 3/21 at 100.00 | A3 | 8,552,530 | ||||||||||||||
| 2,195 | Rockcastle County, Kentucky, First Mortgage Revenue Bonds, Rockcastle Hospital and Respiratory Care Center Inc. Project, Series 2005, 5.550%, 6/01/30 | 6/15 at 100.00 | BBB– | 2,267,501 | ||||||||||||||
| 16,565 | Russell, Kentucky, Revenue Bonds, Bon Secours Health System, Series 2002A, 5.625%, 11/15/30 | 2/13 at 100.00 | A– | 16,599,620 | ||||||||||||||
| 1,000 | Warren County, Kentucky, Hospital Facilities Revenue Bonds, Community Hospital, Series 2007A, 5.000%, 8/01/29 | 8/17 at 100.00 | A | 1,066,140 | ||||||||||||||
Warren County, Kentucky, Hospital Revenue Bonds, Bowling Green-Warren County Community Hospital Corporation, Series 2012A: | ||||||||||||||||||
| 1,980 | 5.000%, 10/01/33 | 10/22 at 100.00 | A | 2,231,420 | ||||||||||||||
| 2,000 | 5.000%, 10/01/37 | 10/22 at 100.00 | A | 2,241,560 | ||||||||||||||
| 79,160 | Total Health Care | 87,306,326 | ||||||||||||||||
Housing/Multifamily – 0.3% | ||||||||||||||||||
| 1,190 | Kentucky Housing Corporation, Conduit Multifamily Mortgage Revenue Bonds, Florence Homes III Apartments Project, Series 2005B, 5.000%, 6/01/35 (Mandatory put 6/01/23) (Alternative Minimum Tax) | 6/15 at 102.00 | AA+ | 1,260,174 | ||||||||||||||
Housing/Single Family – 2.2% | ||||||||||||||||||
Kentucky Housing Corporation Housing Revenue Bonds Series 2011B: | ||||||||||||||||||
| 150 | 3.000%, 1/01/21 | No Opt. Call | AAA | 160,799 | ||||||||||||||
| 485 | 3.000%, 7/01/21 | No Opt. Call | AAA | 521,894 | ||||||||||||||
| 705 | 3.100%, 7/01/22 | 7/21 at 100.00 | AAA | 760,117 | ||||||||||||||
| 360 | 3.300%, 1/01/23 | 7/21 at 100.00 | AAA | 388,192 | ||||||||||||||
| 595 | 3.300%, 7/01/23 | 7/21 at 100.00 | AAA | 641,594 | ||||||||||||||
| 610 | 3.625%, 1/01/25 | 7/21 at 100.00 | AAA | 665,431 | ||||||||||||||
| 290 | Kentucky Housing Corporation, Housing Revenue Bonds, Series 2004F, 3.900%, 7/01/31 (Alternative Minimum Tax) | 1/14 at 100.00 | AAA | 290,310 | ||||||||||||||
| 675 | Kentucky Housing Corporation, Housing Revenue Bonds, Series 2007K, 5.000%, 7/01/34 | 1/17 at 100.00 | AAA | 717,977 | ||||||||||||||
Kentucky Housing Corporation, Housing Revenue Bonds, Series 2008E: | ||||||||||||||||||
| 50 | 5.375%, 7/01/33 | 1/18 at 100.00 | AAA | 55,017 | ||||||||||||||
| 40 | 5.450%, 7/01/38 | 1/18 at 100.00 | AAA | 41,890 | ||||||||||||||
| 4,585 | Kentucky Housing Corporation, Housing Revenue Bonds, Series 2009B, 5.150%, 7/01/39 | 1/19 at 100.00 | AAA | 5,040,611 | ||||||||||||||
| 1,050 | Kentucky Housing Corporation, Housing Revenue Bonds, Series 2010C, 4.625%, 7/01/33 | 1/20 at 100.00 | AAA | 1,139,313 | ||||||||||||||
| 9,595 | Total Housing/Single Family | 10,423,145 | ||||||||||||||||
Industrials – 0.6% | ||||||||||||||||||
| 2,575 | Kentucky Economic Development Finance Authority, Solid Waste Disposal Revenue Bonds, Republic Services Inc., Refunding 2010B, 0.000%, 4/01/31 – AGM Insured | 12/12 at 100.00 | BBB | 2,575,000 | ||||||||||||||
Long-Term Care – 0.5% | ||||||||||||||||||
| 2,090 | Kentucky Economic Development Finance Authority, Multifamily Housing Revenue Bonds, Christian Care Communities Projects, Series 2005, 5.250%, 11/20/25 | 11/15 at 103.00 | AA+ | 2,297,851 | ||||||||||||||
Materials – 0.6% | ||||||||||||||||||
| 2,820 | Wickliffe, Kentucky, Solid Waste Disposal Facility Revenue Bonds, Westvaco Corporation, Series 1996, 6.375%, 4/01/26 (Alternative Minimum Tax) | 4/13 at 100.00 | BBB | 2,822,341 | ||||||||||||||
| 32 | Nuveen Investments |
| Principal Amount (000) | Description (1) | Optional Call Provisions (2) | Ratings (3) | Value | ||||||||||||||
Tax Obligation/General – 1.7% | ||||||||||||||||||
Crittenden County, Kentucky, General Obligation Bonds, Series 2007: | ||||||||||||||||||
| $ | 1,085 | 6.000%, 12/01/27 | 12/17 at 100.00 | N/R | $ | 1,217,218 | ||||||||||||
| 1,605 | 6.250%, 12/01/32 | 12/17 at 100.00 | N/R | 1,811,836 | ||||||||||||||
| 2,190 | 6.500%, 12/01/37 | 12/17 at 100.00 | N/R | 2,493,972 | ||||||||||||||
Louisville and Jefferson County Metropolitan Government, Kentucky, General Obligation Bonds, Series 2004A-B: | ||||||||||||||||||
| 1,195 | 5.000%, 11/01/16 – AMBAC Insured | 11/14 at 100.00 | AAA | 1,299,682 | ||||||||||||||
| 1,000 | 5.000%, 11/01/17 – AMBAC Insured | 11/14 at 100.00 | AAA | 1,087,600 | ||||||||||||||
| 7,075 | Total Tax Obligation/General | 7,910,308 | ||||||||||||||||
Tax Obligation/Limited – 23.9% | ||||||||||||||||||
| 3,020 | Government of Guam, Business Privilege Tax Bonds, Series 2011A, 5.125%, 1/01/42 | 1/22 at 100.00 | A | 3,453,370 | ||||||||||||||
| 1,000 | Kentucky Asset/Liability Commission, General Fund Revenue Project Notes, Federal Highway Trust Fund First Series 2010A, 5.000%, 9/01/21 | 9/20 at 100.00 | AA | 1,262,590 | ||||||||||||||
| 2,000 | Kentucky Asset/Liability Commission, General Fund Revenue Project Notes, First Series 2005, 5.000%, 5/01/25 – NPFG Insured | 5/15 at 100.00 | Aa3 | 2,165,140 | ||||||||||||||
| 2,440 | Kentucky Asset/Liability Commission, General Fund Revenue, Project Notes – Federal Highway Trust Fund First Series 2005, | No Opt. Call | AA | 2,633,199 | ||||||||||||||
Kentucky Economic Development Finance Authority, Louisville Arena Project Revenue Bonds, Louisville Arena Authority, Inc., Series 2008-A1: | ||||||||||||||||||
| 1,950 | 5.750%, 12/01/28 – AGC Insured | 6/18 at 100.00 | AA– | 2,216,448 | ||||||||||||||
| 3,450 | 6.000%, 12/01/33 – AGC Insured | 6/18 at 100.00 | AA– | 3,908,747 | ||||||||||||||
| 4,430 | 6.000%, 12/01/38 – AGC Insured | 6/18 at 100.00 | AA– | 4,983,529 | ||||||||||||||
| 8,965 | 6.000%, 12/01/42 – AGC Insured | 6/18 at 100.00 | AA– | 10,042,323 | ||||||||||||||
Kentucky Economic Development Finance Authority, Louisville Arena Project Revenue Bonds, Louisville Arena Authority, Inc., Series 2008-A2: | ||||||||||||||||||
| 35 | 0.000%, 12/01/15 – AGC Insured | No Opt. Call | AA– | 31,546 | ||||||||||||||
| 50 | 0.000%, 12/01/16 – AGC Insured | No Opt. Call | AA– | 43,409 | ||||||||||||||
| 3,505 | 0.000%, 12/01/22 – AGC Insured | No Opt. Call | AA– | 2,246,670 | ||||||||||||||
| 3,750 | 0.000%, 12/01/23 – AGC Insured | No Opt. Call | AA– | 2,269,200 | ||||||||||||||
| 5,000 | Kentucky Economic Development Finance Authority, Louisville Arena Project Revenue Bonds, Louisville Arena Authority, Inc., Tender Option Bonds Trust 11810-1, 16.085%, 6/01/16 – AGC Insured (IF) | No Opt. Call | AA– | 7,732,800 | ||||||||||||||
Kentucky Local Correctional Facilities Authority, Multi-County Lease Revenue Bonds, Series 2004: | ||||||||||||||||||
| 1,430 | 5.250%, 11/01/13 – NPFG Insured | No Opt. Call | BBB | 1,486,614 | ||||||||||||||
| 2,365 | 5.250%, 11/01/14 – NPFG Insured | No Opt. Call | BBB | 2,548,855 | ||||||||||||||
Kentucky State Property and Buildings Commission, Revenue Bonds, Project 84, Series 2005: | ||||||||||||||||||
| 2,115 | 5.000%, 8/01/18 – NPFG Insured | No Opt. Call | Aa3 | 2,574,018 | ||||||||||||||
| 125 | 5.000%, 8/01/19 – NPFG Insured | No Opt. Call | Aa3 | 155,220 | ||||||||||||||
| 2,000 | Kentucky State Property and Buildings Commission, Revenue Bonds, Project 85, Series 2005, 5.000%, 8/01/15 – AGM Insured | No Opt. Call | AA– | 2,229,120 | ||||||||||||||
Kentucky State Property and Buildings Commission, Revenue Bonds, Project 93, Refunding Series 2009: | ||||||||||||||||||
| 2,500 | 5.250%, 2/01/28 – AGC Insured | 2/19 at 100.00 | AA– | 3,000,625 | ||||||||||||||
| 2,500 | 5.250%, 2/01/29 – AGC Insured | 2/19 at 100.00 | AA– | 2,933,625 | ||||||||||||||
| 2,000 | Kentucky Turnpike Authority, Economic Development Road Revenue Bonds, Revitalization Project, Refunding Series 2010A, 5.000%, 7/01/20 | No Opt. Call | AA+ | 2,547,000 | ||||||||||||||
| 1,800 | Kentucky Turnpike Authority, Economic Development Road Revenue Bonds, Revitalization Project, Refunding Series 2011A, 5.000%, 7/01/24 | 7/21 at 100.00 | AA+ | 2,249,820 | ||||||||||||||
Kentucky Turnpike Authority, Economic Development Road Revenue Bonds, Revitalization Project, Refunding Series 2012A: | ||||||||||||||||||
| 500 | 5.000%, 7/01/24 | 7/22 at 100.00 | AA+ | 638,265 | ||||||||||||||
| 5,000 | 5.000%, 7/01/28 | 7/22 at 100.00 | AA+ | 6,290,050 | ||||||||||||||
| 4,000 | 5.000%, 7/01/30 | 7/22 at 100.00 | AA+ | 4,988,600 | ||||||||||||||
| 2,000 | 5.000%, 7/01/31 | 7/22 at 100.00 | AA+ | 2,478,660 | ||||||||||||||
| Nuveen Investments | 33 |
Portfolio of Investments (Unaudited)
Nuveen Kentucky Municipal Bond Fund (continued)
November 30, 2012
| Principal Amount (000) | Description (1) | Optional Call Provisions (2) | Ratings (3) | Value | ||||||||||||||
Tax Obligation/Limited (continued) | ||||||||||||||||||
Kentucky Turnpike Authority, Economic Development Road Revenue Bonds, Revitalization Project, Series 2006B: | ||||||||||||||||||
| $ | 2,095 | 5.000%, 7/01/15 – AMBAC Insured | No Opt. Call | AA+ | $ | 2,338,355 | ||||||||||||
| 5,000 | 5.000%, 7/01/24 – AMBAC Insured | 7/16 at 100.00 | AA+ | 5,746,050 | ||||||||||||||
| 25 | Kentucky Turnpike Authority, Economic Development Road Revenue Bonds, Revitalization Project, Series 2008A, 5.000%, 7/01/28 | 7/18 at 100.00 | AA+ | 29,591 | ||||||||||||||
| 2,820 | Kentucky Turnpike Authority, Economic Development Road Revenue Bonds, Revitalization Project, Series 2009A, 5.000%, 7/01/29 | 7/19 at 100.00 | AA+ | 3,425,877 | ||||||||||||||
| 2,060 | Laurel County School District Finance Corporation, Kentucky, School Building Revenue Bonds, Series 2007, 5.000%, 6/01/27 – AGM Insured | 6/17 at 100.00 | Aa3 | 2,332,909 | ||||||||||||||
| 3,000 | Lexington-Fayette Urban County Government Public Facilities Corporation, Kentucky State Lease Revenue Bonds, Eastern State Hospital Project, Series 2011A, 5.250%, 6/01/29 | 6/21 at 100.00 | Aa3 | 3,599,160 | ||||||||||||||
| 1,695 | Louisville and Jefferson County Visitors and Convention Commission, Kentucky, Dedicated Tax Revenue Bonds, Series 2004A, 5.000%, 12/01/15 – AGM Insured | 6/14 at 101.00 | AA– | 1,811,040 | ||||||||||||||
| 500 | Pendleton County, Kentucky, Leasing Trust Revenue Bonds, Kentucky Association of Counties, Series 1993A, 6.400%, 3/01/19 | No Opt. Call | B | 585,385 | ||||||||||||||
| 1,090 | Puerto Rico Highway and Transportation Authority, Highway Revenue Bonds, Series 2005K, 5.000%, 7/01/30 | 7/15 at 100.00 | Baa1 | 1,122,842 | ||||||||||||||
| 1,000 | Puerto Rico Highway and Transportation Authority, Highway Revenue Bonds, Series 2007N, 5.500%, 7/01/25 | No Opt. Call | Baa1 | 1,108,470 | ||||||||||||||
| 11,600 | Puerto Rico Sales Tax Financing Corporation, Sales Tax Revenue Bonds, First Subordinate Series 2009A, 0.000%, 8/01/34 | No Opt. Call | A+ | 3,693,208 | ||||||||||||||
| 26,250 | Puerto Rico Sales Tax Financing Corporation, Sales Tax Revenue Bonds, First Subordinate Series 2010A, 0.000%, 8/01/35 | No Opt. Call | A+ | 7,768,163 | ||||||||||||||
| 1,010 | Virgin Islands Public Finance Authority, Gross Receipts Taxes Loan Note, Series 2003, 5.250%, 10/01/21 – AGM Insured | 10/14 at 100.00 | AA– | 1,069,277 | ||||||||||||||
| 126,075 | Total Tax Obligation/Limited | 111,739,770 | ||||||||||||||||
Transportation – 3.9% | ||||||||||||||||||
Guam International Airport Authority, Revenue Bonds, Series 2003C: | ||||||||||||||||||
| 5,000 | 5.250%, 10/01/22 – NPFG Insured (Alternative Minimum Tax) | 10/13 at 100.00 | BBB | 5,009,850 | ||||||||||||||
| 2,195 | 5.000%, 10/01/23 – NPFG Insured (Alternative Minimum Tax) | 10/13 at 100.00 | BBB | 2,223,491 | ||||||||||||||
| 5,090 | Kenton County Airport Board, Kentucky, Airport Revenue Bonds, Cincinnati/Northern Kentucky International Airport, Series 2003B, 5.000%, 3/01/23 – NPFG Insured (Alternative Minimum Tax) | 3/13 at 100.00 | A– | 5,115,246 | ||||||||||||||
| 980 | Kenton County Airport Board, Kentucky, Airport Revenue Bonds, Cincinnati/Northern Kentucky International Airport, Series 2007B, 5.000%, 3/01/13 – SYNCORA GTY Insured (Alternative Minimum Tax) | No Opt. Call | A– | 988,624 | ||||||||||||||
Lexington-Fayette Urban County Government, Kentucky, General Airport Revenue Refunding Bonds, Series 2012B: | ||||||||||||||||||
| 1,215 | 5.000%, 7/01/29 (Alternative Minimum Tax) | No Opt. Call | AA | 1,437,782 | ||||||||||||||
| 1,100 | 5.000%, 7/01/31 (Alternative Minimum Tax) | No Opt. Call | AA | 1,288,573 | ||||||||||||||
| 1,000 | 5.000%, 7/01/38 | No Opt. Call | AA | 1,174,170 | ||||||||||||||
| 1,000 | Louisville and Jefferson County Regional Airport Authority, Kentucky, Airport System Revenue Bonds, Series 2003C, 5.250%, 7/01/22 – AGM Insured (Alternative Minimum Tax) | 7/13 at 100.00 | AA– | 1,016,060 | ||||||||||||||
| 17,580 | Total Transportation | 18,253,796 | ||||||||||||||||
U.S. Guaranteed – 9.9% (4) | ||||||||||||||||||
| 1,305 | Ballard County School District Finance Corporation, Kentucky, School Building Revenue Bonds, Series 2004, 5.000%, 6/01/21 (Pre-refunded 6/01/14) – AMBAC Insured | 6/14 at 100.00 | Aa3 (4) | 1,396,220 | ||||||||||||||
| 34 | Nuveen Investments |
| Principal Amount (000) | Description (1) | Optional Call Provisions (2) | Ratings (3) | Value | ||||||||||||||
U.S. Guaranteed (4) (continued) | ||||||||||||||||||
Boone County School District Finance Corporation, Kentucky, School Building Revenue Bonds, Series 2004B: | ||||||||||||||||||
| $ | 1,460 | 5.000%, 5/01/20 (Pre-refunded 5/01/14) – AGM Insured | 5/14 at 100.00 | Aa3 (4) | $ | 1,556,433 | ||||||||||||
| 2,580 | 5.000%, 5/01/21 (Pre-refunded 5/01/14) – AGM Insured | 5/14 at 100.00 | Aa3 (4) | 2,750,409 | ||||||||||||||
Butler County School District Finance Corporation, Kentucky, Revenue Bonds, School Buildings, Series 2004C: | ||||||||||||||||||
| 1,220 | 5.000%, 6/01/20 (Pre-refunded 6/01/14) | 6/14 at 100.00 | Aa3 (4) | 1,306,242 | ||||||||||||||
| 1,255 | 5.000%, 6/01/22 (Pre-refunded 6/01/14) | 6/14 at 100.00 | Aa3 (4) | 1,343,716 | ||||||||||||||
Kenton County School District Finance Corporation, Kentucky, School Building Revenue Bonds, Series 2004: | ||||||||||||||||||
| 2,115 | 5.000%, 6/01/17 (Pre-refunded 6/01/14) – NPFG Insured | 6/14 at 100.00 | Aa3 (4) | 2,262,839 | ||||||||||||||
| 3,510 | 5.000%, 6/01/18 (Pre-refunded 6/01/14) – NPFG Insured | 6/14 at 100.00 | Aa3 (4) | 3,755,349 | ||||||||||||||
| 3,690 | 5.000%, 6/01/19 (Pre-refunded 6/01/14) – NPFG Insured | 6/14 at 100.00 | Aa3 (4) | 3,947,931 | ||||||||||||||
| 1,000 | Kentucky State Property and Buildings Commission, Revenue Bonds, Project 81, Series 2003, 5.000%, 11/01/19 (Pre-refunded 11/01/13) – AMBAC Insured | 11/13 at 100.00 | A+ (4) | 1,042,910 | ||||||||||||||
| 2,795 | Kentucky State Property and Buildings Commission, Revenue Bonds, Project 85, Series 2005, 5.000%, 8/01/22 (Pre-refunded 8/01/15) – AGM Insured | 8/15 at 100.00 | Aa2 (4) | 3,136,829 | ||||||||||||||
| 5,000 | Kentucky State Property and Buildings Commission, Revenue Refunding Bonds, Project 79, Series 2003, 5.000%, 10/01/22 (Pre-refunded 10/01/13) – NPFG Insured | 10/13 at 100.00 | A+ (4) | 5,199,750 | ||||||||||||||
Letcher County School District Finance Corporation, Kentucky, School Building Revenue Bonds, Series 2004: | ||||||||||||||||||
| 1,430 | 5.000%, 6/01/18 (Pre-refunded 6/01/14) – AGM Insured | 6/14 at 100.00 | Aa3 (4) | 1,528,842 | ||||||||||||||
| 1,585 | 5.000%, 6/01/20 (Pre-refunded 6/01/14) – AGM Insured | 6/14 at 100.00 | Aa3 (4) | 1,694,555 | ||||||||||||||
| 1,730 | Louisville-Jefferson County Metropolitan Government, Kentucky, Health Facilities Revenue Bonds, Jewish Hospital & Saint Mary’s HealthCare Inc. Project, Series 2008, 6.125%, 2/01/37 (Pre-refunded 2/01/18) | 2/18 at 100.00 | Aaa | 2,209,504 | ||||||||||||||
Oldham County School District Finance Corporation, Kentucky, School Building Revenue Bonds, Series 2004: | ||||||||||||||||||
| 1,230 | 5.000%, 5/01/18 (Pre-refunded 5/01/14) – NPFG Insured | 5/14 at 100.00 | Aa3 (4) | 1,310,331 | ||||||||||||||
| 1,635 | 5.000%, 5/01/20 (Pre-refunded 5/01/14) – NPFG Insured | 5/14 at 100.00 | Aa3 (4) | 1,741,782 | ||||||||||||||
| 1,715 | 5.000%, 5/01/21 (Pre-refunded 5/01/14) – NPFG Insured | 5/14 at 100.00 | Aa3 (4) | 1,827,007 | ||||||||||||||
Puerto Rico Public Finance Corporation, Commonwealth Appropriation Bonds, Series 2002E: | ||||||||||||||||||
| 245 | 6.000%, 8/01/26 – AGC Insured (ETM) | No Opt. Call | AA– (4) | 362,286 | ||||||||||||||
| 2,755 | 6.000%, 8/01/26 – AGC Insured (ETM) | No Opt. Call | AA+ (4) | 4,073,874 | ||||||||||||||
| 1,360 | Shelby County School District Finance Corporation, Kentucky, Revenue Bonds, School Buildings, Series 2004, 5.000%, 5/01/23 (Pre-refunded 5/01/14) – NPFG Insured | 5/14 at 100.00 | Aa3 (4) | 1,449,828 | ||||||||||||||
| 2,185 | Spencer County School District Finance Corporation, Kentucky, Revenue Bonds, School Buildings, Series 2004, 5.000%, 7/01/21 (Pre-refunded 7/01/14) – AGM Insured | 7/14 at 100.00 | Aa3 (4) | 2,347,914 | ||||||||||||||
| 41,800 | Total U.S. Guaranteed | 46,244,551 | ||||||||||||||||
Utilities – 18.5% | ||||||||||||||||||
| 1,175 | Boone County, Kentucky, Collateralized Pollution Control Revenue Bonds, Dayton Power & Light Company, Series 2005A, 4.700%, | 7/15 at 100.00 | A3 | 1,224,644 | ||||||||||||||
| 6,000 | Guam Power Authority, Revenue Bonds, Series 2010A, 5.000%, | 10/20 at 100.00 | AA– | 6,558,120 | ||||||||||||||
| 4,980 | Guam Power Authority, Revenue Bonds, Series 2012A, 5.000%, | 10/22 at 100.00 | AA– | 5,856,629 | ||||||||||||||
Kentucky Municipal Power Agency, Power Supply System Revenue Bonds, Prairie State Project Series 2007A: | ||||||||||||||||||
| 4,000 | 5.000%, 9/01/37 – NPFG Insured | 9/17 at 100.00 | A– | 4,448,000 | ||||||||||||||
| 4,600 | 5.250%, 9/01/42 – NPFG Insured | 9/17 at 100.00 | A– | 5,259,180 | ||||||||||||||
| 7,535 | 5.250%, 9/01/42 – NPFG Insured (UB) | 9/17 at 100.00 | Aa1 | 8,744,443 | ||||||||||||||
| Nuveen Investments | 35 |
Portfolio of Investments (Unaudited)
Nuveen Kentucky Municipal Bond Fund (continued)
November 30, 2012
| Principal Amount (000) | Description (1) | Optional Call Provisions (2) | Ratings (3) | Value | ||||||||||||||
Utilities (continued) | ||||||||||||||||||
| $ | 2,500 | Kentucky Municipal Power Agency, Power Supply System Revenue Bonds, Prairie State Project, Tender Option Bond Trust 1025, 19.034%, 9/01/42 – NPFG Insured (IF) | 9/17 at 100.00 | AA+ | $ | 4,104,625 | ||||||||||||
| 1,275 | Louisville-Jefferson County Metropolitan Government, Kentucky, Environmental Facilities Revenue, Louisville Gas & Electric Company Project, Series 2007B, 1.600%, 6/01/33 (Mandatory put 6/01/17) | No Opt. Call | A+ | 1,310,254 | ||||||||||||||
| 4,000 | Louisville-Jefferson County Metropolitan Government, Kentucky, Pollution Control Revenue Bonds, Louisville Gas and Electric Company Project, Sereis 2003A, 1.650%, 10/01/33 (Mandatory put 4/03/17) | No Opt. Call | A+ | 4,098,840 | ||||||||||||||
Owensboro, Kentucky, Electric Light and Power System Revenue Bonds, Series 1991B: | ||||||||||||||||||
| 3,745 | 0.000%, 1/01/15 – AMBAC Insured | No Opt. Call | A3 | 3,613,176 | ||||||||||||||
| 7,900 | 0.000%, 1/01/17 – AMBAC Insured | No Opt. Call | A3 | 7,228,737 | ||||||||||||||
| 13,300 | 0.000%, 1/01/18 – AMBAC Insured | No Opt. Call | A3 | 11,824,763 | ||||||||||||||
Paducah, Kentucky, Electric Board Revenue Bonds, Series 2009A: | ||||||||||||||||||
| 2,945 | 5.000%, 10/01/20 – AGC Insured | 4/19 at 100.00 | Aa3 | 3,574,670 | ||||||||||||||
| 95 | 5.000%, 10/01/28 – AGC Insured | 4/19 at 100.00 | Aa3 | 109,284 | ||||||||||||||
| 8,595 | 5.250%, 10/01/35 – AGC Insured | 4/19 at 100.00 | Aa3 | 9,748,104 | ||||||||||||||
| 2,975 | Puerto Rico Electric Power Authority, Power Revenue Bonds, Series 2003NN, 5.250%, 7/01/23 – NPFG Insured | No Opt. Call | BBB+ | 3,396,796 | ||||||||||||||
| 3,990 | Puerto Rico Electric Power Authority, Power Revenue Bonds, Series 2005RR, 5.000%, 7/01/24 – FGIC Insured | 7/15 at 100.00 | BBB+ | 4,212,004 | ||||||||||||||
| 1,225 | Virgin Islands Water and Power Authority, Electric System Revenue Bonds, Refunding Series 2007A, 5.000%, 7/01/25 | 7/17 at 100.00 | Baa3 | 1,305,409 | ||||||||||||||
| 80,835 | Total Utilities | 86,617,678 | ||||||||||||||||
Water and Sewer – 12.4% | ||||||||||||||||||
Campbell & Kenton Counties Sanitation District 1, Kentucky, Revenue Bonds, Series 2007: | ||||||||||||||||||
| 225 | 5.000%, 8/01/21 – NPFG Insured | 8/17 at 100.00 | AA | 264,427 | ||||||||||||||
| 3,795 | 5.000%, 8/01/24 – NPFG Insured | 8/17 at 100.00 | AA | 4,414,875 | ||||||||||||||
| 2,750 | Kentucky Infrastructure Authority, Wastewater and Drinking Water Revolving Fund Revenue Bonds, Series 2012A, 5.000%, 2/01/30 | 2/22 at 100.00 | AAA | 3,410,633 | ||||||||||||||
| 915 | Kentucky Rural Water Finance Corporation, Multimodal Public Projects Revenue Bonds, Flexible Term Program, Series 2001A, 5.375%, 2/01/20 | 2/13 at 100.00 | A+ | 920,966 | ||||||||||||||
Louisville and Jefferson County Metropolitan Government Board of Water Works, Kentucky, Water System Revenue Bonds, Series 2006: | ||||||||||||||||||
| 2,565 | 5.000%, 11/15/27 | 11/16 at 100.00 | AAA | 2,937,464 | ||||||||||||||
| 4,990 | 5.000%, 11/15/29 | 11/16 at 100.00 | AAA | 5,672,931 | ||||||||||||||
Louisville and Jefferson County Metropolitan Sewer District, Kentucky, Sewer and Drainage System Revenue Bonds, Refunding Series 2011A: | ||||||||||||||||||
| 7,500 | 5.000%, 5/15/28 | 11/21 at 100.00 | AA | 9,161,399 | ||||||||||||||
| 3,000 | 5.000%, 5/15/34 | 11/21 at 100.00 | AA | 3,570,750 | ||||||||||||||
Louisville and Jefferson County Metropolitan Sewer District, Kentucky, Sewer and Drainage System Revenue Bonds, Series 2004A: | ||||||||||||||||||
| 5,405 | 5.250%, 5/15/37 – FGIC Insured | 5/14 at 101.00 | AA | 5,780,161 | ||||||||||||||
| 750 | 5.000%, 5/15/38 – FGIC Insured | 5/14 at 101.00 | AA | 800,483 | ||||||||||||||
| 2,000 | Northern Kentucky Water District, Revenue Bonds, Series 2009, 6.500%, 2/01/33 – AGM Insured | 8/18 at 100.00 | Aa3 | 2,438,680 | ||||||||||||||
| 3,495 | Northern Kentucky Water District, Revenue Bonds, Series 2012, 5.000%, 2/01/26 | 2/22 at 100.00 | Aa3 | 4,265,193 | ||||||||||||||
| 4,740 | Owen County, Kentucky, Waterworks System Revenue Bonds, Kentucky-American Water Company Project, Series 2009A, 6.250%, 6/01/39 | 6/19 at 100.00 | BBB+ | 5,431,471 | ||||||||||||||
| 36 | Nuveen Investments |
| Principal Amount (000) | Description (1) | Optional Call Provisions (2) | Ratings (3) | Value | ||||||||||||||
Water and Sewer (continued) | ||||||||||||||||||
| $ | 5,000 | Owen County, Kentucky, Waterworks System Revenue Bonds, Kentucky-American Water Company Project, Series 2009B, 5.625%, 9/01/39 | 9/19 at 100.00 | BBB+ | $ | 5,505,850 | ||||||||||||
| 195 | Owensboro, Kentucky, Water Revenue Bonds, Refunding & Improvement Series 2009, 5.000%, 9/15/29 | 9/18 at 100.00 | Aa3 | 226,085 | ||||||||||||||
| 3,000 | Puerto Rico Aqueduct and Sewerage Authority, Revenue Bonds, Senior Lien Series 2012A, 5.250%, 7/01/42 | 7/22 at 100.00 | Baa2 | 3,066,750 | ||||||||||||||
| 50,325 | Total Water and Sewer | 57,868,118 | ||||||||||||||||
| $ | 470,130 | Total Investments (cost $420,381,036) – 99.4% | 464,519,999 | |||||||||||||||
Floating Rate Obligations – (1.2)% | (5,650,000) | |||||||||||||||||
Other Assets Less Liabilities – 1.8% | 8,550,279 | |||||||||||||||||
Net Assets – 100% | $ | 467,420,278 | ||||||||||||||||
| (1) | All percentages shown in the Portfolio of Investments are based on net assets. |
| (2) | Optional Call Provisions: Dates (month and year) and prices of the earliest optional call or redemption. There may be other call provisions at varying prices at later dates. Certain mortgage-backed securities may be subject to periodic principal paydowns. |
| (3) | Ratings: Using the highest of Standard & Poor’s Group (“Standard & Poor’s”), Moody’s Investors Service, Inc. (“Moody’s”) or Fitch, Inc. (“Fitch”) rating. Ratings below BBB by Standard & Poor’s, Baa by Moody’s or BBB by Fitch are considered to be below investment grade. Holdings designated N/R are not rated by any of these national rating agencies. |
| (4) | Backed by an escrow or trust containing sufficient U.S. Government or U.S. Government agency securities, which ensure the timely payment of principal and interest. Certain bonds backed by U.S. Government or agency securities are regarded as having an implied rating equal to the rating of such securities. |
| N/R | Not rated. |
| (ETM) | Escrowed to maturity. |
| (IF) | Inverse floating rate investment. |
| (UB) | Underlying bond of an inverse floating rate trust reflected as a financing transaction. See Notes to Financial Statements, Footnote 1 – General Information and Significant Accounting Policies, Inverse Floating Rate Securities for more information. |
See accompanying notes to financial statements.
| Nuveen Investments | 37 |
Portfolio of Investments (Unaudited)
Nuveen Michigan Municipal Bond Fund
November 30, 2012
| Principal Amount (000) | Description (1) | Optional Call Provisions (2) | Ratings (3) | Value | ||||||||||||||
Consumer Staples – 3.9% | ||||||||||||||||||
| $ | 7,645 | Michigan Tobacco Settlement Finance Authority, Tobacco Settlement Asset-Backed Revenue Bonds, Series 2008A, 6.875%, 6/01/42 | 6/18 at 100.00 | BB– | $ | 7,914,866 | ||||||||||||
| 725 | Puerto Rico, The Children’s Trust Fund, Tobacco Settlement Asset-Backed Refunding Bonds, Series 2002, 5.375%, 5/15/33 | 8/20 at 100.00 | BBB+ | 725,819 | ||||||||||||||
| 8,370 | Total Consumer Staples | 8,640,685 | ||||||||||||||||
Education and Civic Organizations – 1.7% | ||||||||||||||||||
| 830 | Michigan Finance Authority, Public School Academy Limited Obligation Revenue and Refunding Bonds, Detroit Service Learning Academy Project, Series 2011, 7.000%, 10/01/31 | 10/21 at 100.00 | BBB– | 962,767 | ||||||||||||||
| 1,000 | Michigan Finance Authority, Public School Academy Limited Obligation Revenue Bonds, Hanley International Academy, Inc. Project, | 9/20 at 100.00 | BBB– | 1,044,690 | ||||||||||||||
| 500 | Michigan Finance Authority, Public School Academy Limited Obligation Revenue Bonds, Holly Academy Project, Refunding Series 2011, | 10/21 at 100.00 | BBB– | 598,180 | ||||||||||||||
| 1,000 | Michigan State University, General Revenue Bonds, Refunding | 2/20 at 100.00 | Aa1 | 1,141,610 | ||||||||||||||
| 3,330 | Total Education and Civic Organizations | 3,747,247 | ||||||||||||||||
Health Care – 11.9% | ||||||||||||||||||
| 1,000 | Grand Traverse County Hospital Financial Authority, Michigan, Revenue Bonds, Munson Healthcare, Refunding Series 2011A, 5.000%, 7/01/29 | 7/21 at 100.00 | AA– | 1,139,410 | ||||||||||||||
| 450 | Jackson County Hospital Finance Authority, Michigan, Hospital Revenue Bonds, Alligiance Health, Refunding Series 2010A, 5.000%, 6/01/37 – AGM Insured | 6/20 at 100.00 | AA– | 502,218 | ||||||||||||||
Kent Hospital Finance Authority, Michigan, Revenue Refunding Bonds, Spectrum Health System, Refunding Series 2011C: | ||||||||||||||||||
| 2,135 | 5.000%, 1/15/31 | 1/22 at 100.00 | AA | 2,478,201 | ||||||||||||||
| 365 | 5.000%, 1/15/42 | 1/22 at 100.00 | AA | 413,381 | ||||||||||||||
| 3,000 | Michigan Finance Authority, Hospital Revenue and REfunding Bonds, Crittenton Hospital Medical Center, Series 2012A, 5.000%, 6/01/39 | No Opt. Call | A– | 3,266,160 | ||||||||||||||
Michigan Finance Authority, Revenue Bonds, Oakwood Obligated Group, Refunding Series 2012: | ||||||||||||||||||
| 1,670 | 5.000%, 11/01/25 | 11/22 at 100.00 | A | 1,965,189 | ||||||||||||||
| 1,250 | 5.000%, 11/01/42 | 11/22 at 100.00 | A | 1,394,300 | ||||||||||||||
| 2,000 | Michigan Finance Authority, Revenue Bonds, Trinity Health Credit Group, Refunding Series 2011, 5.000%, 12/01/39 | 12/21 at 100.00 | AA | 2,283,860 | ||||||||||||||
| 3,300 | Michigan State Hospital Finance Authority, Hospital Revenue Bonds, Henry Ford Health System, Refunding Series 2009, 5.750%, 11/15/39 | 11/19 at 100.00 | A1 | 3,869,448 | ||||||||||||||
| 1,000 | Michigan State Hospital Finance Authority, Hospital Revenue Bonds,MidMichigan Obligated Group, Series 2009A, 5.875%, 6/01/39 – AGC Insured | 6/19 at 100.00 | AA– | 1,154,720 | ||||||||||||||
| 2,000 | Michigan State Hospital Finance Authority, Revenue Bonds, Sparrow Obligated Group, Series 2005, 5.000%, 11/15/36 – NPFG Insured | 5/15 at 100.00 | A+ | 2,075,540 | ||||||||||||||
| 2,000 | Michigan State Hospital Finance Authority, Revenue Bonds, Trinity Health Care Group, Series 2009C, 5.000%, 12/01/48 | 6/22 at 100.00 | AA | 2,264,940 | ||||||||||||||
| 1,590 | Royal Oak Hospital Finance Authority, Michigan, Hospital Revenue and Refunding Bonds, William Beaumont Hospital Obligated Group, | 8/19 at 100.00 | A1 | 1,849,695 | ||||||||||||||
| 1,200 | Royal Oak Hospital Finance Authority, Michigan, Hospital Revenue Bonds, William Beaumont Hospital, Refunding Series 2009V, 8.250%, 9/01/39 | 9/18 at 100.00 | A1 | 1,565,640 | ||||||||||||||
| 22,960 | Total Health Care | 26,222,702 | ||||||||||||||||
| 38 | Nuveen Investments |
| Principal Amount (000) | Description (1) | Optional Call Provisions (2) | Ratings (3) | Value | ||||||||||||||
Housing/Multifamily – 2.9% | ||||||||||||||||||
| $ | 1,200 | Michigan Housing Development Authority, Rental Housing Revenue Bonds, Series 2006D, 5.125%, 4/01/31 – AGM Insured (Alternative Minimum Tax) | 7/15 at 100.00 | AA | $ | 1,246,932 | ||||||||||||
| 2,175 | Michigan Housing Development Authority, Rental Housing Revenue Bonds, Series 2009A, 5.700%, 10/01/39 | 10/18 at 100.00 | AA | 2,407,355 | ||||||||||||||
| 1,350 | Michigan Housing Development Authority, Rental Housing Revenue Bonds, Series 2012D, 3.950%, 10/01/37 (WI/DD, Settling 12/05/12) | 4/22 at 100.00 | AA | 1,374,894 | ||||||||||||||
| 1,335 | Michigan Housing Development Authority, Section 8 Assisted Mortgage Revenue Bonds, Series 1983I, 0.000%, 4/01/14 | No Opt. Call | AA | 1,219,843 | ||||||||||||||
| 6,060 | Total Housing/Multifamily | 6,249,024 | ||||||||||||||||
Tax Obligation/General – 32.7% | ||||||||||||||||||
| 690 | Ann Arbor Public School District, Washtenaw County, Michigan, General Obligation Bonds, Refunding Series 2012, 5.000%, 5/01/29 | 5/22 at 100.00 | Aa2 | 855,862 | ||||||||||||||
| 660 | Ann Arbor Public School District, Washtenaw County, Michigan, General Obligation Bonds, Series 2008, 5.000%, 5/01/23 | 5/18 at 100.00 | AA+ | 776,675 | ||||||||||||||
| 800 | Ann Arbor, Michigan, General Obligation Bonds, Court & Police Facilities Capital Improvement Series 2008, 5.000%, 5/01/38 | 5/18 at 100.00 | AA+ | 927,352 | ||||||||||||||
| 1,435 | Bay City, Michigan, General Obligation Bonds, Series 2008B, | 4/18 at 100.00 | AA– | 1,696,328 | ||||||||||||||
| 1,020 | Caledonia Community Schools, Kent, Allegan and Barry Counties, Michigan, General Obligation Bonds, Series 2003, 5.250%, 5/01/22 | 5/13 at 100.00 | Aa2 | 1,040,227 | ||||||||||||||
Caledonia Community Schools, Kent, Allegan and Barry Counties, Michigan, General Obligation Bonds, Series 2005: | ||||||||||||||||||
| 1,000 | 5.000%, 5/01/23 – NPFG Insured | 5/15 at 100.00 | Aa2 | 1,097,370 | ||||||||||||||
| 2,085 | 5.000%, 5/01/24 – NPFG Insured | 5/15 at 100.00 | Aa2 | 2,288,016 | ||||||||||||||
| 1,000 | 5.000%, 5/01/25 – NPFG Insured | 5/15 at 100.00 | Aa2 | 1,097,370 | ||||||||||||||
| 2,013 | Caledonia Community Schools, Kent, Allegan and Barry Counties, Michigan, General Obligation Bonds, Tender Option Bond Trust 2008-1096, 8.012%, 5/01/32 – NPFG Insured (IF) | 5/17 at 100.00 | Aa2 | 2,441,387 | ||||||||||||||
| 1,850 | Chippewa Valley Schools, Macomb County, Michigan, General Obligation Bonds, Series 2005, 5.000%, 5/01/24 – NPFG Insured | 5/15 at 100.00 | Aa2 | 2,030,135 | ||||||||||||||
| 1,450 | City of Jackson, County of Jackson, State of Michigan, Downtown Development Bonds, Series 2001, General Obligation Limited Tax, 0.000%, 6/01/21 – AGM Insured | No Opt. Call | AA– | 1,035,170 | ||||||||||||||
| 4,500 | Detroit-Wayne County Stadium Authority, Michigan, Wayne County Limited Tax General Obligation Bonds, Building Authority Stadium Refunding Series 2012, 5.000%, 10/01/26 – AGM Insured | 10/22 at 100.00 | AA– | 5,115,599 | ||||||||||||||
| 1,245 | Edwardsburg Public School, Cass County, Michigan, General Obligation Bonds, Series 2004, 5.000%, 5/01/24 – AGM Insured | 5/14 at 100.00 | AA– | 1,316,861 | ||||||||||||||
| 480 | Genesee County, Michigan, General Obligaton Water Supply Bonds, | 11/13 at 100.00 | A1 | 496,800 | ||||||||||||||
| 2,615 | Hazel Park School District, Oakland County, Michigan, General Obligation Bonds, Refunding Series 2012, 4.750%, 5/01/30 – AGM Insured | 5/21 at 100.00 | AA– | 2,968,810 | ||||||||||||||
| 50 | Holly Area School District, Oakland County, Michigan, General Obligation Bonds, Series 2006, 5.125%, 5/01/32 – NPFG Insured | 5/16 at 100.00 | Aa2 | 55,463 | ||||||||||||||
| 1,060 | Homer Community School District, Calhourn, Jackson, Hillsdale and Branch Counties, Michigan, General Obligation Bonds, School Building & Site, Series 2011B, 5.500%, 5/01/41 | 5/21 at 100.00 | AA– | 1,256,280 | ||||||||||||||
| 1,675 | Hopkins Public Schools, Allegan County, Michigan, General Obligation Bonds, Series 2007, 5.000%, 5/01/25 – NPFG Insured | 5/17 at 100.00 | Aa2 | 1,865,096 | ||||||||||||||
| 1,215 | Kalamazoo Public Schools, Michigan, General Obligation Bonds, | 5/16 at 100.00 | Aa2 | 1,365,733 | ||||||||||||||
| 840 | Lowell Area Schools, Kent and Ionia Counties, Michigan, General Obligation Bonds, Series 2007, 5.000%, 5/01/37 – AGM Insured | 5/17 at 100.00 | Aa2 | 947,092 | ||||||||||||||
| Nuveen Investments | 39 |
Portfolio of Investments (Unaudited)
Nuveen Michigan Municipal Bond Fund (continued)
November 30, 2012
| Principal Amount (000) | Description (1) | Optional Call Provisions (2) | Ratings (3) | Value | ||||||||||||||
Tax Obligation/General (continued) | ||||||||||||||||||
| $ | 410 | Michigan Finance Authority, Revenue Bonds, Detroit City School District, Series 2012, 5.000%, 6/01/20 | No Opt. Call | A+ | $ | 479,421 | ||||||||||||
| 1,230 | Michigan Municipal Bond Authority, AMBAC Insured Bonds, Series 2007B-A, 5.000%, 12/01/34 – AMBAC Insured | 6/17 at 100.00 | N/R | 1,215,769 | ||||||||||||||
| 1,000 | Michigan State, General Obligation Bonds, Environmental Program, Refunding Series 2011A, 5.000%, 12/01/22 | 12/21 at 100.00 | Aa2 | 1,280,450 | ||||||||||||||
| 350 | Michigan State, General Obligation Bonds, Environmental Program, | 5/19 at 100.00 | Aa2 | 427,697 | ||||||||||||||
| 140 | Oakland County Building Authority, Michigan, General Obligation Bonds, Refunding Series 2006, 5.000%, 6/01/27 | 6/13 at 100.00 | AAA | 142,918 | ||||||||||||||
Oakland Intermediate School District, Oakland County, Michigan, General Obligation Bonds, Series 2007: | ||||||||||||||||||
| 500 | 5.000%, 5/01/27 – AGM Insured | 5/17 at 100.00 | Aaa | 568,015 | ||||||||||||||
| 1,200 | 5.000%, 5/01/36 – AGM Insured | 5/17 at 100.00 | Aaa | 1,358,532 | ||||||||||||||
| 1,370 | Oakridge Public Schools, Muskegon County, Michigan, General Obligation Bonds, Series 2005, 5.000%, 5/01/24 – NPFG Insured | 5/15 at 100.00 | AA– | 1,503,397 | ||||||||||||||
Okemos Public School District, Ingham County, Michigan, General Obligation Refunding Bonds, Series 1993: | ||||||||||||||||||
| 1,000 | 0.000%, 5/01/17 – NPFG Insured | No Opt. Call | Aa3 | 923,820 | ||||||||||||||
| 1,020 | 0.000%, 5/01/18 – NPFG Insured | No Opt. Call | Aa3 | 916,450 | ||||||||||||||
| 1,100 | Ottawa County, Michigan, General Obligation Bonds, Sewer Disposal System, Series 2010, 5.000%, 5/01/37 | 5/20 at 100.00 | Aaa | 1,301,916 | ||||||||||||||
| 4,000 | Ottawa County, Michigan, Water Supply System, General Obligation Bonds, Series 2007, 5.000%, 8/01/30 – NPFG Insured | 8/17 at 100.00 | Aaa | 4,543,039 | ||||||||||||||
| 1,075 | Parchment School District, Kalamazoo County, Michigan, General Obligation Bonds, Tender Option Bond Trust 2836, | No Opt. Call | Aa2 | 1,368,507 | ||||||||||||||
| 150 | South Haven, Van Buren County,Michigan, General Obligation Bonds, Capital Improvement Series 2009, 5.125%, 12/01/33 – AGC Insured | 12/19 at 100.00 | AA– | 175,730 | ||||||||||||||
| 500 | South Redford School District, Wayne County, Michigan, General Obligation Bonds, School Building and Site, Series 2005, | 5/15 at 100.00 | Aa2 | 536,290 | ||||||||||||||
| 1,400 | South Redford School District, Wayne County, Michigan, General Obligation Bonds, Series 2004, 5.000%, 5/01/21 – FGIC Insured | 11/14 at 100.00 | Aa2 | 1,512,252 | ||||||||||||||
| 500 | Thornapple Kellogg School District, Barry County, Michigan, General Obligation Bonds, Series 2007, 5.000%, 5/01/32 – NPFG Insured | 5/17 at 100.00 | Aa2 | 564,695 | ||||||||||||||
| 1,530 | Trenton Public Schools District, Michigan, General Obligation Bonds, | 5/18 at 100.00 | Aa2 | 1,746,036 | ||||||||||||||
| 1,350 | Van Dyke Public Schools, Macomb County, Michigan, General Obligation Bonds, School Building and Site, Series 2008, 5.000%, 5/01/38 – AGM Insured | 5/18 at 100.00 | Aa2 | 1,524,056 | ||||||||||||||
| 1,500 | Wayland Union School District, Allegan County, Michigan, General Obligation Bonds, Series 2008, 5.000%, 5/01/28 – AGM Insured | 5/18 at 100.00 | Aa2 | 1,724,610 | ||||||||||||||
| 985 | Wayne Charter County, Michigan, General Obligation Bonds, Building Improvements, Series 2009A, 6.750%, 11/01/39 | 12/19 at 100.00 | BBB+ | 1,161,197 | ||||||||||||||
| 1,150 | Wayne Westland Community Schools, Michigan, General Obligation Bonds, Series 2004, 5.000%, 5/01/17 – AGM Insured | 11/14 at 100.00 | Aa2 | 1,245,657 | ||||||||||||||
| 1,915 | West Bloomfield School District, Oakland County, Michigan, General Obligation Bonds, Series 2005, 5.000%, 5/01/20 – AGM Insured | 5/15 at 100.00 | AA– | 2,113,126 | ||||||||||||||
| 3,270 | West Ottawa Public School District, Ottawa County, Michigan, General Obligation Refunding Bonds, Series 1992, 0.000%, 5/01/17 – FGIC Insured | No Opt. Call | Aa3 | 3,001,893 | ||||||||||||||
| 5,175 | Williamston Community School District, Michigan, Unlimited Tax General Obligation QSBLF Bonds, Series 1996, 5.500%, 5/01/25 – NPFG Insured | No Opt. Call | Aa3 | 6,489,656 | ||||||||||||||
| 40 | Nuveen Investments |
| Principal Amount (000) | Description (1) | Optional Call Provisions (2) | Ratings (3) | Value | ||||||||||||||
Tax Obligation/General (continued) | ||||||||||||||||||
| $ | 3,170 | Zeeland Public Schools, Ottawa and Allegan Counties, Michigan, General Obligation Bonds, Series 2005, 5.000%, 5/01/22 – FGIC Insured | 5/15 at 100.00 | Aa3 | $ | 3,488,300 | ||||||||||||
| 64,673 | Total Tax Obligation/General | 71,987,055 | ||||||||||||||||
Tax Obligation/Limited – 12.0% | ||||||||||||||||||
| 1,045 | Government of Guam, Business Privilege Tax Bonds, Series 2011A, 5.125%, 1/01/42 | 1/22 at 100.00 | A | 1,194,958 | ||||||||||||||
Grand Rapids Downtown Development Authority, Michigan, Tax Increment Revenue Bonds, Series 1994: | ||||||||||||||||||
| 3,985 | 0.000%, 6/01/17 – NPFG Insured | No Opt. Call | BBB | 3,294,041 | ||||||||||||||
| 3,295 | 0.000%, 6/01/18 – NPFG Insured | No Opt. Call | BBB | 2,594,911 | ||||||||||||||
| 1,455 | Kalkaska County Hospital Authority, Michigan, Hospital Revenue Bonds, Series 2007, 5.125%, 5/01/14 | No Opt. Call | A– | 1,491,899 | ||||||||||||||
| 2,020 | Michigan Finance Authority, Unemployment Obligation Assessment Revenue Bonds, Series 2012B, 5.000%, 7/01/22 | 7/16 at 100.00 | AAA | 2,308,294 | ||||||||||||||
| 4,400 | Michigan State Building Authority, Revenue Bonds, Facilities Program, Series 2005II, 5.000%, 10/15/30 – AMBAC Insured | 10/15 at 100.00 | Aa3 | 4,801,103 | ||||||||||||||
Michigan State Building Authority, Revenue Bonds, Refunding Series 2006IA: | ||||||||||||||||||
| 3,000 | 0.000%, 10/15/27 – AGM Insured | 10/16 at 58.27 | AA | 1,567,530 | ||||||||||||||
| 1,500 | 0.000%, 10/15/28 – AGM Insured | 10/16 at 55.35 | AA | 738,240 | ||||||||||||||
| 3,960 | 5.000%, 10/15/36 – FGIC Insured | 10/16 at 100.00 | Aa3 | 4,418,172 | ||||||||||||||
| 2,000 | Michigan State Building Authority, Revenue Refunding Bonds, Facilities Program, Series 2003II, 5.000%, 10/15/22 – NPFG Insured | 10/13 at 100.00 | Aa3 | 2,077,860 | ||||||||||||||
| 700 | Michigan State Trunk Line Fund Refunding Bonds, Series 2009, 5.000%, 11/15/36 | 11/21 at 100.00 | AA+ | 833,175 | ||||||||||||||
| 1,000 | Virgin Islands Public Finance Authority, Matching Fund Loan Notes Revenue Bonds, Series 2009B, 5.000%, 10/01/25 | 10/19 at 100.00 | BBB+ | 1,109,370 | ||||||||||||||
| 28,360 | Total Tax Obligation/Limited | 26,429,553 | ||||||||||||||||
Transportation – 1.6% | ||||||||||||||||||
| 50 | Kent County, Michigan, Airport Revenue Bonds, Gerald R. Ford International Airport, Series 2007, 5.000%, 1/01/32 | 1/17 at 100.00 | AAA | 56,034 | ||||||||||||||
| 2,000 | Wayne County Airport Authority, Michigan, Airport Revenue Bonds, Detroit Metro Wayne County Airport, Series 2012A, 5.000%, 12/01/37 | No Opt. Call | A | 2,283,080 | ||||||||||||||
| 1,000 | Wayne County Airport Authority, Michigan, Revenue Bonds, Detroit Metropolitan Airport, Refunding Series 2011A, 5.000%, 12/01/21 (Alternative Minimum Tax) | No Opt. Call | A | 1,201,940 | ||||||||||||||
| 3,050 | Total Transportation | 3,541,054 | ||||||||||||||||
U.S. Guaranteed – 9.8% (4) | ||||||||||||||||||
| 2,505 | Detroit, Michigan, Senior Lien Water Supply System Revenue Bonds, | 7/13 at 100.00 | A+ (4) | 2,575,015 | ||||||||||||||
| 2,000 | Howell Public Schools, Livingston County, Michigan, General Obligation Bonds, Series 2003, 5.000%, 5/01/24 (Pre-refunded 11/01/13) | 11/13 at 100.00 | Aa2 (4) | 2,087,720 | ||||||||||||||
| 1,000 | Jackson Public Schools, Jackson County, Michigan, General Obligation School Building and Site Bonds, Series 2004, 5.000%, 5/01/22 (Pre-refunded 5/01/14) – AGM Insured | 5/14 at 100.00 | Aa2 (4) | 1,066,790 | ||||||||||||||
| 1,300 | Lansing Community College, Michigan, General Obligation Bonds, | 5/13 at 100.00 | AA (4) | 1,326,117 | ||||||||||||||
| 4,000 | Michigan House of Representatives, Certificates of Participation, | No Opt. Call | N/R (4) | 3,152,800 | ||||||||||||||
| 2,000 | Michigan State Hospital Finance Authority, Hospital Revenue Refunding Bonds, Henry Ford Health System, Series 2003A, 5.625%, 3/01/17 (Pre-refunded 3/01/13) | 3/13 at 100.00 | A1 (4) | 2,026,740 | ||||||||||||||
| Nuveen Investments | 41 |
Portfolio of Investments (Unaudited)
Nuveen Michigan Municipal Bond Fund (continued)
November 30, 2012
| Principal Amount (000) | Description (1) | Optional Call Provisions (2) | Ratings (3) | Value | ||||||||||||||
U.S. Guaranteed (4) (continued) | ||||||||||||||||||
| $ | 1,000 | Michigan State Hospital Finance Authority, Revenue Bonds, Chelsea Community Hospital, Series 2005, 5.000%, 5/15/37 (Pre-refunded 5/15/15) | 5/15 at 100.00 | AA+ (4) | $ | 1,110,330 | ||||||||||||
Michigan State Hospital Finance Authority, Revenue Bonds, Marquette General Hospital, Series 2005A: | ||||||||||||||||||
| 1,400 | 5.000%, 5/15/26 (Pre-refunded 5/15/15) | 5/15 at 100.00 | Baa3 (4) | 1,552,278 | ||||||||||||||
| 50 | 5.000%, 5/15/34 (Pre-refunded 5/15/15) | 5/15 at 100.00 | Baa3 (4) | 55,439 | ||||||||||||||
Michigan Technological University, General Revenue Bonds, Series 2004A: | ||||||||||||||||||
| 1,230 | 5.000%, 10/01/24 (Pre-refunded 10/01/13) – NPFG Insured | �� | 10/13 at 100.00 | Aa3 (4) | 1,278,610 | |||||||||||||
| 1,740 | 5.000%, 10/01/29 (Pre-refunded 10/01/13) – NPFG Insured | 10/13 at 100.00 | Aa3 (4) | 1,808,765 | ||||||||||||||
| 4,000 | Puerto Rico Electric Power Authority, Power Revenue Refunding Bonds, Series 1989O, 0.000%, 7/01/17 – NPFG Insured (ETM) | No Opt. Call | BBB+ (4) | 3,513,160 | ||||||||||||||
| 22,225 | Total U.S. Guaranteed | 21,553,764 | ||||||||||||||||
Utilities – 5.2% | ||||||||||||||||||
| 1,000 | Lansing Board of Water and Light, Michigan, Steam and Electric Utility System Revenue Bonds, Series 2003A, 5.000%, 7/01/21 – AGM Insured | 7/13 at 100.00 | AA– | 1,026,660 | ||||||||||||||
Lansing Board of Water and Light, Michigan, Steam and Electric Utility System Revenue Bonds, Series 2008A: | ||||||||||||||||||
| 175 | 5.000%, 7/01/28 | 7/18 at 100.00 | AA– | 197,626 | ||||||||||||||
| 2,130 | 5.000%, 7/01/32 | 7/18 at 100.00 | AA– | 2,404,664 | ||||||||||||||
| 500 | Lansing Board of Water and Light, Michigan, Utility System Rvenue Bonds Series 2011A, 5.000%, 7/01/34 | No Opt. Call | AA– | 590,325 | ||||||||||||||
Lansing Board of Water and Light, Michigan, Utility System Rvenue Bonds, Tender Option Bond Trust 4700: | ||||||||||||||||||
| 800 | 17.800%, 7/01/37 (IF) (5) | 7/21 at 100.00 | AA– | 1,351,232 | ||||||||||||||
| 250 | 17.954%, 7/01/37 (IF) (5) | 7/21 at 100.00 | AA– | 422,260 | ||||||||||||||
| 1,500 | Michigan Public Power Agency, AFEC Project Revenue Bonds, Series 2012A, 5.000%, 1/01/43 – AGM Insured | 1/22 at 100.00 | A2 | 1,646,235 | ||||||||||||||
| 2,000 | Michigan Public Power Agency, Revenue Bonds, Combustion Turbine 1 Project, Series 2011, 5.000%, 1/01/27 – AGM Insured | 1/21 at 100.00 | AA– | 2,332,900 | ||||||||||||||
| 1,000 | Monroe County Economic Development Corporation, Michigan, Collateralized Limited Obligation Revenue Refunding Bonds, Detroit Edison Company, Series 1992AA, 6.950%, 9/01/22 – FGIC Insured | No Opt. Call | A2 | 1,382,660 | ||||||||||||||
| 9,355 | Total Utilities | 11,354,562 | ||||||||||||||||
Water and Sewer – 15.1% | ||||||||||||||||||
| 1,500 | Detroit Water and Sewerage Department, Michigan, Sewage Disposal System Revenue Bonds, Refunding Senior Lien Series 2012A, 5.000%, 7/01/39 – AGM Insured | 7/22 at 100.00 | AA– | 1,654,215 | ||||||||||||||
| 230 | Detroit Water Supply System, Michigan, Water Supply System Revenue Bonds, Refunding, Series 2006D, 5.000%, 7/01/33 – NPFG Insured | No Opt. Call | A | 235,653 | ||||||||||||||
| 1,690 | Detroit, Michigan, Second Lien Sewerage Disposal System Revenue Bonds, Series 2005A, 5.000%, 7/01/35 – NPFG Insured | 7/15 at 100.00 | A | 1,733,788 | ||||||||||||||
| 2,495 | Detroit, Michigan, Senior Lien Water Supply System Revenue Bonds, Series 2003A, 5.000%, 7/01/25 – NPFG Insured | 7/13 at 100.00 | A+ | 2,533,648 | ||||||||||||||
Detroit, Michigan, Sewerage Disposal System Revenue Bonds, Series 1999A: | ||||||||||||||||||
| 4,455 | 0.000%, 7/01/19 – FGIC Insured | No Opt. Call | A+ | 3,653,323 | ||||||||||||||
| 700 | 0.000%, 7/01/21 – FGIC Insured | No Opt. Call | A+ | 522,956 | ||||||||||||||
| 2,915 | Detroit, Michigan, Water Supply System Revenue Bonds, Senior Lien Series 2011A, 5.250%, 7/01/41 | 7/21 at 100.00 | A+ | 3,171,957 | ||||||||||||||
| 4,000 | Grand Rapids, Michigan, Sanitary Sewer System Revenue Bonds, Series 2005, 5.000%, 1/01/30 – NPFG Insured | 7/15 at 100.00 | AA+ | 4,363,920 | ||||||||||||||
| 42 | Nuveen Investments |
| Principal Amount (000) | Description (1) | Optional Call Provisions (2) | Ratings (3) | Value | ||||||||||||||
Water and Sewer (continued) | ||||||||||||||||||
Grand Rapids, Michigan, Sanitary Sewer System Revenue Bonds, Series 2008: | ||||||||||||||||||
| $ | 145 | 5.000%, 1/01/28 | 1/18 at 100.00 | AA+ | $ | 168,948 | ||||||||||||
| 3,500 | 5.000%, 1/01/38 | 1/18 at 100.00 | AA+ | 4,024,510 | ||||||||||||||
| 2,000 | Grand Rapids, Michigan, Water Supply System Revenue Bonds, | 1/19 at 100.00 | AA | 2,339,220 | ||||||||||||||
| 1,625 | Lansing, Michigan, Sewerage Disposal System Revenue Bonds, | 5/14 at 100.00 | Aa2 | 1,723,556 | ||||||||||||||
| 365 | Michigan Finance Authority, State Revolving Fund Revenue Bonds, Clean Water Series 2012, 5.000%, 10/01/32 | 10/22 at 100.00 | AAA | 451,844 | ||||||||||||||
| 4,055 | Michigan Municipal Bond Authority, Drinking Water Revolving Fund Revenue Bonds, Series 2004, 5.000%, 10/01/24 | 10/14 at 100.00 | AAA | 4,381,995 | ||||||||||||||
| 1,000 | Michigan Municipal Bond Authority, Water Revolving Fund Revenue Bonds, Series 2007, 5.000%, 10/01/23 | 10/17 at 100.00 | AAA | 1,182,660 | ||||||||||||||
| 500 | Saginaw, Michigan, Water Supply System Revenue Bonds, Series 2008, 5.250%, 7/01/22 – NPFG Insured | 7/18 at 100.00 | A | 565,135 | ||||||||||||||
| 500 | Saginaw, Michigan, Water Supply System Revenue Bonds, Series 2011A, 5.000%, 7/01/31 – AGM Insured | 8/21 at 100.00 | AA– | 573,970 | ||||||||||||||
| 31,675 | Total Water and Sewer | 33,281,298 | ||||||||||||||||
| $ | 200,058 | Total Investments (cost $191,266,807) – 96.8% | 213,006,944 | |||||||||||||||
Other Assets Less Liabilities – 3.2% | 7,036,452 | |||||||||||||||||
Net Assets – 100% | $ | 220,043,396 | ||||||||||||||||
| (1) | All percentages shown in the Portfolio of Investments are based on net assets. |
| (2) | Optional Call Provisions: Dates (month and year) and prices of the earliest optional call or redemption. There may be other call provisions at varying prices at later dates. Certain mortgage-backed securities may be subject to periodic principal paydowns. |
| (3) | Ratings: Using the highest of Standard & Poor’s Group (“Standard & Poor’s”), Moody’s Investors Service, Inc. (“Moody’s”) or Fitch, Inc. (“Fitch”) rating. Ratings below BBB by Standard & Poor’s, Baa by Moody’s or BBB by Fitch are considered to be below investment grade. Holdings designated N/R are not rated by any of these national rating agencies. |
| (4) | Backed by an escrow or trust containing sufficient U.S. Government or U.S. Government agency securities, which ensure the timely payment of principal and interest. Certain bonds backed by U.S. Government or agency securities are regarded as having an implied rating equal to the rating of such securities. |
| (5) | Investment, or portion of investment, has been pledged to collateralize the net payment obligations for investments in inverse floating rate transactions. |
| N/R | Not rated. |
| WI/DD | Investment, or portion of investment, purchased on a when-issued or delayed delivery basis. |
| (ETM) | Escrowed to maturity. |
| (IF) | Inverse floating rate investment. |
See accompanying notes to financial statements.
| Nuveen Investments | 43 |
Portfolio of Investments (Unaudited)
Nuveen Missouri Municipal Bond Fund
November 30, 2012
| Principal Amount (000) | Description (1) | Optional Call Provisions (2) | Ratings (3) | Value | ||||||||||||||
Consumer Staples – 3.0% | ||||||||||||||||||
| $ | 3,000 | Cape Girardeau County Industrial Development Authority, Missouri, Solid Waste Disposal Revenue Bonds, Procter & Gamble Products Company Project, Series 1998, 5.300%, 5/15/28 (Alternative Minimum Tax) | 5/13 at 100.00 | AA– | $ | 3,006,360 | ||||||||||||
| 8,790 | Missouri Development Finance Board, Solid Waste Disposal Revenue Bonds, Procter and Gamble Inc., Series 1999, 5.200%, 3/15/29 (Alternative Minimum Tax) | No Opt. Call | AA– | 11,513,930 | ||||||||||||||
| 11,790 | Total Consumer Staples | 14,520,290 | ||||||||||||||||
Education and Civic Organizations – 8.3% | ||||||||||||||||||
| 3,000 | Callaway County Industrial Development Authority, Missouri, Revenue Bonds, Westminster College Project, Refunding Series 2012C, 5.250%, 8/01/37 | 8/22 at 100.00 | N/R | 3,154,230 | ||||||||||||||
| 1,000 | Curators of the University of Missouri, System Facilities Revenue Bonds, Series 2007A, 5.000%, 11/01/33 | 11/17 at 100.00 | AA+ | 1,158,320 | ||||||||||||||
| 1,025 | Kansas City, Missouri, Metropolitan Junior College District Certificates of Participation, Series 2008, 4.500%, 7/01/21 | 7/17 at 100.00 | Aa2 | 1,168,695 | ||||||||||||||
| 1,000 | Lincoln University, Missouri, Auxillary System Revenue Bonds, Series 2007, 5.125%, 6/01/37 – AGC Insured | 6/17 at 100.00 | AA– | 1,078,650 | ||||||||||||||
| 1,185 | Missouri Development Finance Board, Research Facility Revenue Bonds, Midwest Research Institute Project, Series 2007, 5.000%, 11/01/17 | No Opt. Call | Baa2 | 1,364,551 | ||||||||||||||
| 1,625 | Missouri Health and Educational Facilities Authority, Educational Facilities Revenue Bonds, Ranken Technical College, Series 2011, 5.125%, 11/01/31 | 11/19 at 100.00 | A– | 1,787,549 | ||||||||||||||
Missouri Health and Educational Facilities Authority, Educational Facilities Revenue Bonds, Southwest Baptist University Project, Series 2012: | ||||||||||||||||||
| 460 | 3.000%, 10/01/18 | No Opt. Call | BBB– | 474,053 | ||||||||||||||
| 575 | 3.500%, 10/01/22 | No Opt. Call | BBB– | 595,988 | ||||||||||||||
| 2,700 | 5.000%, 10/01/33 | 10/22 at 100.00 | BBB– | 2,990,601 | ||||||||||||||
| 3,870 | Missouri Health and Educational Facilities Authority, Revenue Bonds, A.T. Still University of Health Sciences, Series 2011, 5.250%, 10/01/41 | 10/21 at 100.00 | A– | 4,472,404 | ||||||||||||||
| 1,500 | Missouri Health and Educational Facilities Authority, Revenue Bonds, Rockhurst University, Series 1999, 6.000%, 10/01/25 | 10/18 at 103.00 | BBB | 1,745,250 | ||||||||||||||
Missouri Health and Educational Facilities Authority, Revenue Bonds, Rockhurst University, Series 2011A: | ||||||||||||||||||
| 2,500 | 6.500%, 10/01/30 | 10/18 at 103.00 | BBB | 2,932,050 | ||||||||||||||
| 1,300 | 6.500%, 10/01/35 | 10/18 at 103.00 | BBB | 1,503,723 | ||||||||||||||
| 900 | Missouri Health and Educational Facilities Authority, Revenue Bonds, Stephens College, Series 1999, 6.000%, 6/01/24 | 6/13 at 100.00 | Aa3 | 902,349 | ||||||||||||||
| 3,000 | Missouri Health and Educational Facilities Authority, Revenue Bonds, Washington University, Seres 2008A, 5.375%, 3/15/39 | 3/18 at 100.00 | AAA | 3,544,770 | ||||||||||||||
| 1,000 | Missouri Health and Educational Facilities Authority, Revenue Bonds, Washington University, Series 2001A, 5.500%, 6/15/16 | No Opt. Call | AAA | 1,177,470 | ||||||||||||||
| 2,600 | Missouri Health and Educational Facilities Authority, Revenue Bonds, Washington University, Series 2011B, 5.000%, 11/15/37 | 11/21 at 100.00 | AAA | 3,168,906 | ||||||||||||||
| 2,400 | Missouri Health and Educational Facilities Authority, Revenue Bonds, Webster University, Series 2011, 5.000%, 4/01/36 | 4/21 at 100.00 | A2 | 2,737,368 | ||||||||||||||
| 2,590 | Missouri State University, Auxiliary Enterprise System Revenue Bonds, Series 2007A, 5.000%, 4/01/24 – SYNCORA GTY Insured | 4/17 at 100.00 | A+ | 2,993,082 | ||||||||||||||
| 1,000 | Saint Louis Industrial Development Authority, Missouri, Confluence Academy Project, Series 2007A, 5.350%, 6/15/32 | 6/15 at 103.00 | N/R | 975,140 | ||||||||||||||
| 35,230 | Total Education and Civic Organizations | 39,925,149 | ||||||||||||||||
| 44 | Nuveen Investments |
| Principal Amount (000) | Description (1) | Optional Call Provisions (2) | Ratings (3) | Value | ||||||||||||||
Health Care – 22.5% | ||||||||||||||||||
Boone County, Missouri, Hospital Revenue Bonds, Boone Hospital Center, Refunding Series 2012: | ||||||||||||||||||
| $ | 500 | 4.000%, 8/01/20 | No Opt. Call | A | $ | 556,350 | ||||||||||||
| 1,000 | 3.125%, 8/01/21 | No Opt. Call | A | 1,044,530 | ||||||||||||||
| 200 | 3.200%, 8/01/22 | No Opt. Call | A | 208,196 | ||||||||||||||
| 2,000 | Boone County, Missouri, Hospital Revenue Bonds, Boone Hospital Center, Series 2008, 5.625%, 8/01/38 | 8/18 at 100.00 | A | 2,297,040 | ||||||||||||||
Cape Girardeau County Industrial Development Authority, Missouri, Health Facilities Revenue Bonds, Saint Francis Medical Center, Series 2009A: | ||||||||||||||||||
| 250 | 5.125%, 6/01/23 | 6/19 at 100.00 | AA– | 283,288 | ||||||||||||||
| 200 | 5.125%, 6/01/24 | 6/19 at 100.00 | AA– | 224,538 | ||||||||||||||
| 500 | 5.500%, 6/01/29 | 6/19 at 100.00 | AA– | 566,500 | ||||||||||||||
| 4,150 | 5.750%, 6/01/39 | 6/19 at 100.00 | AA– | 4,765,528 | ||||||||||||||
| 245 | Cape Girardeau County Industrial Development Authority, Missouri, Health Facilities Revenue Bonds, Southeast Missouri Hospital Association, Series 2002, 5.625%, 6/01/22 | 2/13 at 100.00 | BBB+ | 245,466 | ||||||||||||||
Cape Girardeau County Industrial Development Authority, Missouri, Health Facilities Revenue Bonds, Southeast Missouri Hospital Association, Series 2007: | ||||||||||||||||||
| 1,490 | 5.000%, 6/01/27 | 6/17 at 100.00 | BBB+ | 1,562,414 | ||||||||||||||
| 2,500 | 5.000%, 6/01/36 | 6/17 at 100.00 | BBB+ | 2,589,050 | ||||||||||||||
Cass County, Missouri, Hospital Revenue Bonds, Series 2007: | ||||||||||||||||||
| 2,500 | 5.500%, 5/01/27 | 11/16 at 100.00 | BBB– | 2,618,075 | ||||||||||||||
| 6,020 | 5.625%, 5/01/38 | 11/16 at 100.00 | BBB– | 6,216,973 | ||||||||||||||
| 1,000 | Citizens Memorial Hospital District of Polk County, Missouri, Hospital Revenue Bonds, Refunding Series 2012, 5.000%, 8/01/28 | 8/19 at 100.00 | N/R | 1,034,290 | ||||||||||||||
Clinton County Industrial Development Authority, Missouri, Revenue Bonds, Cameron Regional Medical Center, Series 2007: | ||||||||||||||||||
| 1,250 | 5.000%, 12/01/32 | 12/17 at 100.00 | N/R | 1,286,463 | ||||||||||||||
| 4,995 | 5.000%, 12/01/37 | 12/17 at 100.00 | N/R | 5,086,708 | ||||||||||||||
Grundy County Industrial Development Authority, Missouri, Health Facility Revenue Bonds, Wright Memorial Hospital, Series 2009: | ||||||||||||||||||
| 1,120 | 5.650%, 9/01/22 | 9/19 at 100.00 | BBB– | 1,240,490 | ||||||||||||||
| 1,000 | 5.750%, 9/01/23 | 9/19 at 100.00 | BBB– | 1,109,590 | ||||||||||||||
| 850 | Hannibal Industrial Development Authority, Missouri, Health Facilities Refunding Revenue Bonds, Hannibal Regional Hospital, Refunding Series 2010, 5.375%, 9/01/19 | 9/13 at 102.00 | BBB+ | 883,048 | ||||||||||||||
| 1,935 | Hannibal Industrial Development Authority, Missouri, Health Facilities Revenue Bonds, Hannibal Regional Hospital, Series 2006, 5.000%, 3/01/22 | 3/16 at 100.00 | BBB+ | 2,032,331 | ||||||||||||||
Joplin Industrial Development Authority, Missouri, Health Facilities Revenue Bonds, Freeman Health System, Series 2004: | ||||||||||||||||||
| 2,000 | 5.500%, 2/15/24 | 2/15 at 102.00 | BBB+ | 2,126,980 | ||||||||||||||
| 1,250 | 5.500%, 2/15/29 | 2/15 at 102.00 | BBB+ | 1,326,238 | ||||||||||||||
| 800 | Joplin Industrial Development Authority, Missouri, Health Facilities Revenue Bonds, Freeman Health System, Series 2011, 5.500%, 2/15/31 | 2/21 at 100.00 | BBB+ | 909,280 | ||||||||||||||
| 2,800 | Missouri Health and Educational Facilities Authority, Health Facilities Revenue Bonds The Childrens Mercy Hospital, Series 2009, 5.625%, 5/15/39 | 5/19 at 100.00 | A+ | 3,171,476 | ||||||||||||||
Missouri Health and Educational Facilities Authority, Health Facilities Revenue Bonds, Capital Region Medical Center, Series 2011: | ||||||||||||||||||
| 365 | 3.000%, 11/01/17 | No Opt. Call | A3 | 375,924 | ||||||||||||||
| 575 | 3.250%, 11/01/18 | No Opt. Call | A3 | 600,294 | ||||||||||||||
| 2,160 | 5.000%, 11/01/27 | 11/20 at 100.00 | A3 | 2,437,279 | ||||||||||||||
| 3,035 | Missouri Health and Educational Facilities Authority, Health Facilities Revenue Bonds, Heartland Regional Medical Center, Series 2012, 5.000%, 2/15/37 | 2/22 at 100.00 | A1 | 3,407,091 | ||||||||||||||
| Nuveen Investments | 45 |
Portfolio of Investments (Unaudited)
Nuveen Missouri Municipal Bond Fund (continued)
November 30, 2012
| Principal Amount (000) | Description (1) | Optional Call Provisions (2) | Ratings (3) | Value | ||||||||||||||
Health Care (continued) | ||||||||||||||||||
| $ | 3,000 | Missouri Health and Educational Facilities Authority, Health Facilities Revenue Bonds, Mercy Health, Series 2012, 4.000%, 11/15/42 (WI/DD, Settling 12/18/12) | No Opt. Call | Aa3 | $ | 3,121,320 | ||||||||||||
| 2,000 | Missouri Health and Educational Facilities Authority, Health Facilities Revenue Bonds, St. Luke’s Episcopal and Presbyterian Hospitals, Series 2011, 5.000%, 12/01/25 | 12/21 at 100.00 | A+ | 2,328,280 | ||||||||||||||
| 2,000 | Missouri Health and Educational Facilities Authority, Health Facility Revenue Bonds, St. Lukes’s Health System, Series 2003B, 5.500%, 11/15/32 – AGM Insured | 11/18 at 100.00 | AA– | 2,284,400 | ||||||||||||||
Missouri Health and Educational Facilities Authority, Health Facility Revenue Bonds, St. Lukes’s Health System, Series 2010A: | ||||||||||||||||||
| 485 | 5.250%, 11/15/25 | 11/20 at 100.00 | A+ | 572,116 | ||||||||||||||
| 2,540 | 5.000%, 11/15/30 | 11/20 at 100.00 | A+ | 2,894,355 | ||||||||||||||
| 1,000 | 5.000%, 11/15/40 | 11/20 at 100.00 | A+ | 1,121,460 | ||||||||||||||
| 1,000 | Missouri Health and Educational Facilities Authority, Revenue Bonds, BJC Health System, Series 2003, 5.125%, 5/15/25 | 5/13 at 100.00 | AA | 1,019,500 | ||||||||||||||
| 1,000 | Missouri Health and Educational Facilities Authority, Revenue Bonds, BJC Health System, Series 2005A, 5.000%, 5/15/22 | 5/15 at 100.00 | AA | 1,104,000 | ||||||||||||||
| 2,300 | Missouri Health and Educational Facilities Authority, Revenue Bonds, Jefferson Memorial Hospital Obligated Group, Refunding and Improvement Series 2004, 5.000%, 8/15/19 – RAAI Insured | 8/14 at 100.00 | Baa2 | 2,373,232 | ||||||||||||||
| 2,770 | Missouri Health and Educational Facilities Authority, Revenue Bonds, Lake Regional Health System, Series 2003, Reg S, 5.700%, 2/15/34 | 2/14 at 100.00 | BBB+ | 2,850,662 | ||||||||||||||
Missouri Health and Educational Facilities Authority, Revenue Bonds, Lester E. Cox Medical Center, Series 1992H: | ||||||||||||||||||
| 1,805 | 0.000%, 9/01/17 – NPFG Insured | No Opt. Call | A2 | 1,606,594 | ||||||||||||||
| 3,005 | 0.000%, 9/01/21 – NPFG Insured | No Opt. Call | A2 | 2,282,237 | ||||||||||||||
| 4,025 | 0.000%, 9/01/22 – NPFG Insured | No Opt. Call | A2 | 2,900,455 | ||||||||||||||
| 2,010 | Missouri Health and Educational Facilities Authority, Revenue Bonds, SSM Health Care System, Series 2008A, 5.000%, 6/01/36 | 6/18 at 100.00 | AA– | 2,209,854 | ||||||||||||||
Missouri Health and Educational Facilities Authority, Revenue Bonds, SSM Health Care System, Series 2010B: | ||||||||||||||||||
| 1,500 | 5.000%, 6/01/30 | 6/20 at 100.00 | AA– | 1,729,050 | ||||||||||||||
| 3,000 | 5.000%, 6/01/34 | 6/20 at 100.00 | AA– | 3,429,660 | ||||||||||||||
| 7,140 | Missouri Health and Educational Facilities Authority, Revenue Refunding Bonds, CoxhHealth Systems Inc., , Series 2008A, 5.500%, 11/15/39 | 11/18 at 100.00 | A2 | 8,067,699 | ||||||||||||||
| 1,000 | North Carolina Medical Care Commission, Healthcare Facilities Revenue Bonds, Duke University Health System, Series 2009A, 5.000%, 6/01/39 | 6/19 at 100.00 | AA | 1,120,810 | ||||||||||||||
| 1,000 | Saline County Industrial Development Authority, Missouri, Health Facilities Revenue Bonds, John Fitzgibbon Memorial Hospital Inc., Series 2005, 5.625%, 12/01/35 | 12/15 at 100.00 | BBB– | 1,025,910 | ||||||||||||||
| 4,780 | Saline County Industrial Development Authority, Missouri, Health Facilities Revenue Bonds, John Fitzgibbon Memorial Hospital Inc., Series 2010, 5.600%, 12/01/28 | 12/20 at 100.00 | BBB– | 5,200,352 | ||||||||||||||
St. Louis County Industrial Development Authority, Missouri, Healthcare Facilities Revenue Bonds, Ranken-Jordan Project, Refunding Series 2007: | ||||||||||||||||||
| 125 | 4.250%, 11/15/14 | No Opt. Call | N/R | 128,913 | ||||||||||||||
| 1,320 | 5.000%, 11/15/22 | 11/16 at 100.00 | N/R | 1,375,717 | ||||||||||||||
| 2,345 | 5.000%, 11/15/27 | 11/16 at 100.00 | N/R | 2,410,988 | ||||||||||||||
| 2,600 | 5.000%, 11/15/35 | 11/16 at 100.00 | N/R | 2,641,886 | ||||||||||||||
| 2,880 | Taney County Industrial Development Authority, Missouri, Hospital Revenue Bonds, Skaggs Community Hospital Association, Series 1998, 5.400%, 5/15/28 | 5/13 at 100.00 | BB | 2,880,403 | ||||||||||||||
| 103,320 | Total Health Care | 108,885,283 | ||||||||||||||||
| 46 | Nuveen Investments |
| Principal Amount (000) | Description (1) | Optional Call Provisions (2) | Ratings (3) | Value | ||||||||||||||
Housing/Multifamily – 0.9% | ||||||||||||||||||
| $ | 1,290 | Kansas City Industrial Development Authority, Missouri, GNMA Collateralized Multifamily Housing Revenue Bonds, Grand Boulevard Lofts Project, Series 2009A, 5.300%, 11/20/49 | 11/19 at 100.00 | Aaa | $ | 1,434,390 | ||||||||||||
Missouri Housing Development Commission, GNMA Collateralized Multifamily Housing Revenue Bonds, JB Hughes Apartments I and II, Series 2002G: | ||||||||||||||||||
| 153 | 6.200%, 5/20/19 | 5/17 at 100.00 | Aa1 | 164,405 | ||||||||||||||
| 975 | 6.300%, 5/20/37 | 5/17 at 100.00 | Aa1 | 1,025,144 | ||||||||||||||
| 1,840 | Missouri Housing Development Commission, Multifamily Housing Revenue Bonds, Mansion Apartments II, Series 1999, 6.125%, 4/01/22 (Alternative Minimum Tax) | 4/13 at 100.00 | N/R | 1,840,110 | ||||||||||||||
| 4,258 | Total Housing/Multifamily | 4,464,049 | ||||||||||||||||
Housing/Single Family – 0.7% | ||||||||||||||||||
| 415 | Missouri Housing Development Commission, Single Family Mortgage Revenue Bonds, Homeownership Loan Program, Series 2005A-1, 5.900%, 9/01/35 (Alternative Minimum Tax) | 9/14 at 100.00 | Aaa | 425,703 | ||||||||||||||
| 415 | Missouri Housing Development Commission, Single Family Mortgage Revenue Bonds, Homeownership Loan Program, Series 2006B, 4.800%, 9/01/31 (Alternative Minimum Tax) | 9/15 at 100.00 | AA+ | 428,724 | ||||||||||||||
| 200 | Missouri Housing Development Commission, Single Family Mortgage Revenue Bonds, Homeownership Loan Program, Series 2006C-1, 5.000%, 9/01/37 (Alternative Minimum Tax) | 9/15 at 100.00 | AA+ | 206,988 | ||||||||||||||
| 835 | Missouri Housing Development Commission, Single Family Mortgage Revenue Bonds, Homeownership Loan Program, Series 2007A-1, 4.700%, 9/01/27 (Alternative Minimum Tax) | 9/16 at 100.00 | AA+ | 877,259 | ||||||||||||||
| 1,185 | Missouri Housing Development Commission, Single Family Mortgage Revenue Bonds, Homeownership Loan Program, Series 2007E-1, 5.200%, 9/01/38 (Alternative Minimum Tax) | 3/17 at 100.00 | AA+ | 1,252,474 | ||||||||||||||
| 285 | Missouri Housing Development Commission, Single Family Mortgage Revenue Bonds, Homeownership Loan Program, Series 2008A-1, 5.300%, 3/01/39 (Alternative Minimum Tax) | 9/17 at 100.00 | AA+ | 303,730 | ||||||||||||||
| 3,335 | Total Housing/Single Family | 3,494,878 | ||||||||||||||||
Industrials – 0.4% | ||||||||||||||||||
Kennett Industrial Development Authority, Missouri, Revenue Bonds, Manac Trailers USA Inc Project, Series 2007: | ||||||||||||||||||
| 1,500 | 4.250%, 3/01/22 (Alternative Minimum Tax) | 3/15 at 100.00 | Ba2 | 1,341,165 | ||||||||||||||
| 500 | 4.250%, 3/01/24 (Alternative Minimum Tax) | 3/15 at 100.00 | Ba2 | 436,975 | ||||||||||||||
| 2,000 | Total Industrials | 1,778,140 | ||||||||||||||||
Long-Term Care – 7.1% | ||||||||||||||||||
Cole County Industrial Development Authority, Missouri, Revenue Bonds, Lutheran Senior Services – Heisinger Project, Series 2004: | ||||||||||||||||||
| 2,000 | 5.250%, 2/01/24 | 2/14 at 100.00 | BBB+ | 2,037,180 | ||||||||||||||
| 2,250 | 5.500%, 2/01/35 | 2/14 at 100.00 | BBB+ | 2,292,840 | ||||||||||||||
Joplin Industrial Development Authority, Missouri, Revenue Bonds, Christian Homes Inc., Series 2007F: | ||||||||||||||||||
| 1,000 | 5.500%, 5/15/17 | No Opt. Call | BBB– | 1,114,190 | ||||||||||||||
| 2,000 | 5.750%, 5/15/31 | 5/17 at 100.00 | BBB– | 2,113,980 | ||||||||||||||
| 4,250 | Kansas City Industrial Development Authority, Missouri, Retirement Center Revenue Refunding and Improvement Bonds, Kingswood Project, Series 1998A, 5.875%, 11/15/29 | 5/13 at 100.00 | N/R | 4,250,510 | ||||||||||||||
Lees Summit Industrial Development Authority, Missouri, Revenue Bonds, John Knox Village Obligated Group, Series 2007A: | ||||||||||||||||||
| 1,035 | 5.000%, 8/15/14 | No Opt. Call | BBB– | 1,075,500 | ||||||||||||||
| 1,500 | 5.125%, 8/15/26 | 8/17 at 100.00 | BBB– | 1,542,480 | ||||||||||||||
| 2,525 | 5.125%, 8/15/32 | 8/17 at 100.00 | BBB– | 2,586,812 | ||||||||||||||
| Nuveen Investments | 47 |
Portfolio of Investments (Unaudited)
Nuveen Missouri Municipal Bond Fund (continued)
November 30, 2012
| Principal Amount (000) | Description (1) | Optional Call Provisions (2) | Ratings (3) | Value | ||||||||||||||
Long-Term Care (continued) | ||||||||||||||||||
| $ | 1,625 | Missouri Health and Educational Facilities Authority, Revenue Bonds, Lutheran Senior Services Projects, Senior Lien Series 2010, 5.500%, 2/01/42 | 2/20 at 100.00 | BBB+ | $ | 1,775,004 | ||||||||||||
Missouri Health and Educational Facilities Authority, Revenue Bonds, Lutheran Senior Services Projects, Series 2011: | ||||||||||||||||||
| 1,000 | 5.750%, 2/01/31 | 2/21 at 100.00 | BBB+ | 1,147,520 | ||||||||||||||
| 2,750 | 6.000%, 2/01/41 | 2/21 at 100.00 | BBB+ | 3,164,013 | ||||||||||||||
| 2,100 | Missouri Health and Educational Facilities Authority, Revenue Bonds, Lutheran Senior Services, Series 2005, 5.375%, 2/01/35 | 2/15 at 100.00 | BBB+ | 2,161,299 | ||||||||||||||
Missouri Health and Educational Facilities Authority, Revenue Bonds, Lutheran Senior Services, Series 2007A: | ||||||||||||||||||
| 325 | 4.875%, 2/01/18 | 2/17 at 100.00 | BBB+ | 357,009 | ||||||||||||||
| 2,000 | 4.875%, 2/01/37 | 2/17 at 100.00 | BBB+ | 2,063,780 | ||||||||||||||
| 1,690 | St. Louis County Industrial Development Authority, Missouri, Revenue Bonds, Friendship Village of Sunset Hills, Series 2012, 5.000%, 9/01/42 | 9/22 at 100.00 | A | 1,825,977 | ||||||||||||||
St. Louis County Industrial Development Authority, Missouri, Revenue Bonds, Friendship Village of West County, Series 2007A: | ||||||||||||||||||
| 700 | 5.375%, 9/01/21 | 9/17 at 100.00 | BBB– | 748,489 | ||||||||||||||
| 4,000 | 5.500%, 9/01/28 | 9/17 at 100.00 | BBB– | 4,219,000 | ||||||||||||||
| 32,750 | Total Long-Term Care | 34,475,583 | ||||||||||||||||
Materials – 0.4% | ||||||||||||||||||
| 2,000 | Sugar Creek, Missouri, Industrial Development Revenue Bonds, Lafarge North America Inc., Series 2003A, 5.650%, 6/01/37 (Alternative Minimum Tax) | 6/13 at 101.00 | A | 2,014,000 | ||||||||||||||
Tax Obligation/General – 10.2% | ||||||||||||||||||
| 1,000 | Belton School District 124, Cass County, Missouri, General Obligation Bonds, Refunding & Improvement Series 2012, 4.000%, 3/01/28 – NPFG Insured | 3/20 at 100.00 | AA+ | 1,111,170 | ||||||||||||||
Belton, Missouri, General Obligation Bonds, Refunding & Improvement Series 2011: | ||||||||||||||||||
| 1,120 | 5.000%, 3/01/29 | 3/21 at 100.00 | A+ | 1,334,491 | ||||||||||||||
| 1,245 | 5.000%, 3/01/30 | 3/21 at 100.00 | A+ | 1,474,229 | ||||||||||||||
| 1,000 | 4.750%, 3/01/31 | 3/21 at 100.00 | A+ | 1,168,030 | ||||||||||||||
| 850 | Blue Springs, Missouri, General Obligation Bonds, South Area Neighborhood Improvement, Refunding Series 2009, 5.000%, 2/15/29 | 2/19 at 100.00 | AA– | 976,472 | ||||||||||||||
Branson Reorganized School District R-4, Taney County, Missouri, General Obligation Bonds, School Building Series 2012: | ||||||||||||||||||
| 1,170 | 4.000%, 3/01/27 – AGM Insured | 3/22 at 100.00 | A+ | 1,297,097 | ||||||||||||||
| 1,095 | 3.750%, 3/01/31 | 3/22 at 100.00 | A+ | 1,166,635 | ||||||||||||||
| 2,400 | 4.375%, 3/01/32 | 3/22 at 100.00 | A+ | 2,688,480 | ||||||||||||||
| 625 | Cottleville, Missouri, Certificates of Participation, Refunding Series 2012, 4.000%, 8/01/36 | 8/20 at 100.00 | A2 | 637,688 | ||||||||||||||
| 2,000 | Hazelwood School District, St Louis County, Missouri, General Obligation Bonds, Refunding & Improvement, Missouri Direct Deposit Program, Series 2012, 4.000%, 3/01/31 | 3/22 at 100.00 | AA+ | 2,272,040 | ||||||||||||||
| 1,315 | Independence School District, Jackson County, Missouri, General Obligation Bonds, Series 2010, 5.000%, 3/01/27 | 3/20 at 100.00 | AA+ | 1,584,299 | ||||||||||||||
| 2,000 | Jackson County Reorganized School District 4, Blue Springs, Missouri, General Obligation Bonds, Refunding & Improvement Series 2009A, 4.750%, 3/01/26 | 3/19 at 100.00 | AA | 2,312,800 | ||||||||||||||
| 1,000 | Jackson County Reorganized School District R-7, Lees Summit, Missouri, General Obligation Bonds, School Building Series 2008, 4.750%, 3/01/27 | 3/18 at 100.00 | Aa1 | 1,152,890 | ||||||||||||||
| 500 | Jefferson City School District, Missouri, General Obligation Bonds, Series 2007, 5.000%, 3/01/20 – NPFG Insured | 3/17 at 100.00 | AA+ | 579,460 | ||||||||||||||
| 48 | Nuveen Investments |
| Principal Amount (000) | Description (1) | Optional Call Provisions (2) | Ratings (3) | Value | ||||||||||||||
Tax Obligation/General (continued) | ||||||||||||||||||
Joplin, Missouri, General Obligation Bonds, School Building, Direct Deposit Program Series 2012: | ||||||||||||||||||
| $ | 1,300 | 4.000%, 3/01/29 | 3/22 at 100.00 | AA+ | $ | 1,451,619 | ||||||||||||
| 500 | 3.125%, 3/01/32 | 3/22 at 100.00 | AA+ | 514,675 | ||||||||||||||
Kansas City, Missouri, General Obligation Bonds, Improvement & Refunding Series 2012A: | �� | |||||||||||||||||
| 1,550 | 4.500%, 2/01/24 | 2/22 at 100.00 | AA | 1,896,534 | ||||||||||||||
| 1,025 | 4.000%, 2/01/25 | 2/22 at 100.00 | AA | 1,196,134 | ||||||||||||||
| 200 | 4.500%, 2/01/28 | 2/22 at 100.00 | AA | 240,118 | ||||||||||||||
| 2,000 | Miller County School District R-2, Osage, Missouri, General Obligation Bonds, Series 2006, 5.000%, 3/01/24 – AGM Insured | 3/16 at 100.00 | AA– | 2,257,580 | ||||||||||||||
Missouri School Boards Association, Lease Participation Certificates, Clay County School District 53 Liberty, Series 2007: | ||||||||||||||||||
| 1,015 | 5.250%, 3/01/25 – AGM Insured | 3/17 at 100.00 | AA– | 1,181,298 | ||||||||||||||
| 1,070 | 5.250%, 3/01/26 – AGM Insured | 3/17 at 100.00 | AA– | 1,225,418 | ||||||||||||||
| 625 | 5.250%, 3/01/27 – AGM Insured | 3/17 at 100.00 | AA– | 715,781 | ||||||||||||||
| 1,250 | Nixa Reorganized School District R 02, Christian County, Missouri, General Obligation Bonds, Series 2006, 5.250%, 3/01/24 – AGM Insured | 3/16 at 100.00 | AA+ | 1,411,938 | ||||||||||||||
| 1,240 | North Kansas City School District 74, Clay County, Missouri, General Obligation Bonds, Direct Deposit Program, Series 2007, 5.000%, 3/01/27 | 3/18 at 100.00 | AA+ | 1,467,701 | ||||||||||||||
| 595 | North Kansas City School District 74, Clay County, Missouri, General Obligation Bonds, Series 2005, 5.000%, 3/01/25 | 3/15 at 100.00 | AA+ | 651,965 | ||||||||||||||
| 685 | Platte County Reorganized School District R3, Missouri, General Obligation Bonds, Series 2004, 5.000%, 3/01/24 – NPFG Insured | 3/14 at 100.00 | AA | 720,997 | ||||||||||||||
| 200 | Platte County R-III School District Building Corporation, Missouri, Leasehold Refunding and Improvement Revenue Bonds, Series 2008, 5.000%, 3/01/28 | 3/18 at 100.00 | AA– | 225,038 | ||||||||||||||
| 2,000 | Puerto Rico, General Obligation Bonds, Public Improvement, Refunding Series 2012A, 5.500%, 7/01/39 | 7/22 at 100.00 | Baa1 | 2,099,420 | ||||||||||||||
| 1,000 | Puerto Rico, General Obligation Bonds, Public Improvment Refunding Series 2008A, 5.250%, 7/01/26 | 7/18 at 100.00 | Baa1 | 1,047,450 | ||||||||||||||
| 1,000 | Saint Charles County Francis Howell School District, Missouri, General Obligation Bonds, Series 2009, 5.000%, 3/01/27 | 3/19 at 100.00 | AA+ | 1,195,790 | ||||||||||||||
| 1,780 | Saint Louis County, Missouri, General Obligation Bonds, Courthouse Projects, Series 2012, 3.000%, 2/01/27 (WI/DD, Settling 12/06/12) | No Opt. Call | AAA | 1,853,745 | ||||||||||||||
Saint Louis Special Administrative Board of the Transitional School District, Missouri, General Obligation Bonds, St Louis Public Schools, Missouri Direct Deposit Program, Series 2011B: | ||||||||||||||||||
| 2,500 | 4.000%, 4/01/25 | 4/21 at 100.00 | AA+ | 2,846,700 | ||||||||||||||
| 1,000 | 4.000%, 4/01/27 | 4/21 at 100.00 | AA+ | 1,122,050 | ||||||||||||||
| 1,345 | St. Louis County Pattonville School District R3, Missouri, General Obligation Bonds, Series 2000, 6.500%, 3/01/14 – FGIC Insured | No Opt. Call | AA | 1,447,099 | ||||||||||||||
| 5,000 | Wentzville School District R-04, Saint Charles County, Missouri, General Obligation Improvement and Refunding Bonds, Series 2009A, 0.000%, 3/01/26 | 3/19 at 66.11 | AA+ | 2,811,650 | ||||||||||||||
| 46,200 | Total Tax Obligation/General | 49,336,481 | ||||||||||||||||
Tax Obligation/Limited – 21.0% | ||||||||||||||||||
| 205 | Arnold, Missouri, Certificates of Participation, Series 2012, 2.000%, 8/15/14 | No Opt. Call | A+ | 208,477 | ||||||||||||||
Belton, Missouri, Certificates of Participation, Series 2007: | ||||||||||||||||||
| 600 | 4.375%, 3/01/19 – NPFG Insured | 3/17 at 100.00 | Baa2 | 651,924 | ||||||||||||||
| 250 | 4.500%, 3/01/22 – NPFG Insured | 3/17 at 100.00 | Baa2 | 267,955 | ||||||||||||||
| 355 | Belton, Missouri, Certificates of Participation, Series 2008, 5.250%, 3/01/29 | 3/18 at 100.00 | A | 391,448 | ||||||||||||||
| Nuveen Investments | 49 |
Portfolio of Investments (Unaudited)
Nuveen Missouri Municipal Bond Fund (continued)
November 30, 2012
| Principal Amount (000) | Description (1) | Optional Call Provisions (2) | Ratings (3) | Value | ||||||||||||||
Tax Obligation/Limited (continued) | ||||||||||||||||||
Cape Girardeau County Building Corporation, Missouri, Leasehold Revenue Bonds, Reorganized School District R-02, Jackson R-II School District High School Project, Series 2005: | ||||||||||||||||||
| $ | 1,290 | 5.250%, 3/01/21 – NPFG Insured | 3/16 at 100.00 | A | $ | 1,463,763 | ||||||||||||
| 1,000 | 5.250%, 3/01/26 – NPFG Insured | 3/16 at 100.00 | A | 1,129,550 | ||||||||||||||
| 1,975 | Cass County, Missouri, Certificates of Participation, Refunding Series 2010, 4.000%, 5/01/22 | 5/20 at 100.00 | A | 2,192,685 | ||||||||||||||
Columbia, Missouri, Special Obligation Bonds, Electric Utility Project – Annual Appropriation Obligation, Series 2012D: | ||||||||||||||||||
| 1,005 | 3.000%, 10/01/24 | 10/20 at 100.00 | AA | 1,051,260 | ||||||||||||||
| 950 | 3.000%, 10/01/25 | 10/20 at 100.00 | AA | 987,924 | ||||||||||||||
| 1,360 | 3.250%, 10/01/28 | 10/20 at 100.00 | AA | 1,420,806 | ||||||||||||||
Fenton, Missouri, Tax Increment Revenue Bonds, Gravois Bluffs Redevelopment Project, Series 2006: | ||||||||||||||||||
| 1,000 | 5.000%, 4/01/14 | No Opt. Call | BBB+ | 1,044,410 | ||||||||||||||
| 475 | 4.500%, 4/01/21 | 4/14 at 100.00 | BBB+ | 487,930 | ||||||||||||||
| 1,685 | Fulton, Missouri, Tax Increment Revenue Bonds, Fulton Commons Redevelopment Project, Series 2006, 5.000%, 6/01/28 | 6/16 at 100.00 | N/R | 1,470,213 | ||||||||||||||
| 530 | Government of Guam, Business Privilege Tax Bonds, Series 2011A, 5.125%, 1/01/42 | 1/22 at 100.00 | A | 606,055 | ||||||||||||||
| 2,270 | Government of Guam, Business Privilege Tax Bonds, Series 2012B-1, 5.000%, 1/01/42 | 1/22 at 100.00 | A | 2,573,613 | ||||||||||||||
Harrisonville, Missouri, Annual Appropriation-Supported Tax Increment and Sales Tax Revenue Bonds, Harrisonville Towne Center Project, Series 2007: | ||||||||||||||||||
| 340 | 4.375%, 11/01/17 | 11/13 at 100.00 | A+ | 346,572 | ||||||||||||||
| 715 | 4.500%, 11/01/22 | 11/13 at 100.00 | A+ | 724,724 | ||||||||||||||
Hazelwood School District, St Louis County, Missouri, Certificates of Participation, Energy Improvements Project, Series 2006: | ||||||||||||||||||
| 515 | 4.500%, 3/01/17 | 3/16 at 100.00 | A+ | 561,973 | ||||||||||||||
| 445 | 4.500%, 3/01/18 | 3/16 at 100.00 | A+ | 484,391 | ||||||||||||||
| 1,745 | Howard Bend Levee District, Missouri, Levee District Improvement Bonds, Series 2005, 5.500%, 3/01/26 – SYNCORA GTY Insured | No Opt. Call | BBB+ | 2,192,680 | ||||||||||||||
| 3,000 | Jackson County, Missouri, Special Obligation Bonds, Harry S. Truman Sports Complex, Series 2006, 5.000%, 12/01/28 – AMBAC Insured | 12/16 at 100.00 | Aa3 | 3,347,850 | ||||||||||||||
| 925 | Kansas City Industrial Development Authority, Missouri, Downtown Redevelpment District Revenue Bonds, Series 2011A, 5.000%, 9/01/32 | 9/21 at 100.00 | AA– | 1,067,598 | ||||||||||||||
Kansas City Industrial Development Authority, Missouri, Infrastructure Revenue Bonds, NNSA National Security Campus Project, MoDot Funded Transportation Improvements, Series 2010: | ||||||||||||||||||
| 1,250 | 4.000%, 9/01/13 | No Opt. Call | N/R | 1,265,663 | ||||||||||||||
| 670 | 4.000%, 9/01/14 | No Opt. Call | N/R | 686,737 | ||||||||||||||
| 2,000 | Kansas City Municipal Assistance Corporation, Missouri, Leasehold Revenue Bonds, Series 2004B-1, 0.000%, 4/15/27 – AMBAC Insured | No Opt. Call | AA– | 1,168,300 | ||||||||||||||
| 2,525 | Kansas City Tax Increment Financing Commission, Missouri, Tax Increment Revenue Bonds, Briarcliff West Project, Series 2006A, 5.400%, 6/01/24 | 6/14 at 102.00 | N/R | 2,525,783 | ||||||||||||||
| 1,000 | Kansas City Tax Increment Financing Commission, Missouri, Tax Increment Revenue Bonds, Maincor Project, Series 2007A, 5.250%, 3/01/18 | No Opt. Call | N/R | 1,063,010 | ||||||||||||||
| 225 | Kansas City Tax Increment Financing Commission, Missouri, Tax Increment Revenue Bonds, Shoal Creek Parkway Project, Series 2011, 5.000%, 6/01/21 | 6/16 at 100.00 | N/R | 236,795 | ||||||||||||||
| 1,025 | Kansas City, Missouri, Special Obligation Bonds, Kansas City, Missouri Projects, Series 2012A, 5.000%, 3/01/26 | 3/22 at 100.00 | AA– | 1,218,869 | ||||||||||||||
| 2,000 | Lakeside 370 Levee District, Saint Charles, Missouri, Levee District Improvement Bonds, Series 2008, 7.000%, 4/01/28 | 4/16 at 100.00 | N/R | 1,439,040 | ||||||||||||||
| 50 | Nuveen Investments |
| Principal Amount (000) | Description (1) | Optional Call Provisions (2) | Ratings (3) | Value | ||||||||||||||
Tax Obligation/Limited (continued) | ||||||||||||||||||
| $ | 3,885 | Missouri Association of Rural Education, Pulaski County, Certificates of Participation, Waynesville School District R-6, Series 2004, 5.100%, 3/01/24 – NPFG Insured | 3/14 at 100.00 | BBB | $ | 3,973,539 | ||||||||||||
| 4,920 | Missouri Development Finance Board, Infrastructure Facilities Revenue Bonds, Branson Landing Project, Series 2005A, 5.000%, 6/01/35 | 6/15 at 100.00 | A | 5,107,944 | �� | |||||||||||||
| 1,000 | Missouri Development Finance Board, Infrastructure Facilities Revenue Bonds, City of Independence, Centerpoint Project, Series 2007E, 5.125%, 4/01/25 | 4/17 at 100.00 | A– | 1,084,700 | ||||||||||||||
| 2,335 | Missouri Development Finance Board, Infrastructure Facilities Revenue Bonds, City of Independence, Crackerneck Creek Project, Series 2006C, 5.000%, 3/01/28 | 3/16 at 100.00 | A– | 2,418,756 | ||||||||||||||
| 1,000 | Missouri Development Finance Board, Infrastructure Facilities Revenue Bonds, City of Independence, Crackerneck Creek Project, Series 2008B, 5.000%, 3/01/25 | 3/18 at 100.00 | A– | 1,089,120 | ||||||||||||||
| 1,010 | Missouri Development Finance Board, Infrastructure Facilities Revenue Bonds, City of Independence, Eastland Center Project, Refunding Series 2007A, 4.250%, 4/01/15 | No Opt. Call | A– | 1,069,317 | ||||||||||||||
| 105 | Missouri State Board of Public Building, Special Obligation Bonds, Series 2003A, 5.000%, 10/15/27 | 10/13 at 100.00 | AA+ | 108,828 | ||||||||||||||
| 450 | Monarch-Chesterfield Levee District, St. Louis County, Missouri, Levee District Improvement Bonds, Series 1999, 5.750%, 3/01/19 – NPFG Insured | 3/13 at 100.00 | A | 451,764 | ||||||||||||||
| 1,000 | Monarch-Chesterfield Levee District, St. Louis County, Missouri, Levee District Improvement Bonds, Series 2010, 3.000%, 3/01/18 | 3/17 at 100.00 | A– | 1,065,350 | ||||||||||||||
| 1,000 | Oak Grove, Missouri, Refunding and Improvement Certificates of Participation Series 2012, 5.000%, 1/01/33 | 1/22 at 100.00 | Baa1 | 1,075,920 | ||||||||||||||
| 3,955 | Osage Beach, Missouri, Tax Increment Revenue Bonds, Prewitts Point Transportation Development District, Series 2006, 5.000%, 5/01/23 | 5/13 at 101.00 | N/R | 3,546,765 | ||||||||||||||
| 1,000 | Pevely, Missouri, General Obligation Bonds, Series 2004, 5.250%, 3/01/24 – RAAI Insured | 3/13 at 100.00 | N/R | 1,006,250 | ||||||||||||||
| 1,000 | Puerto Rico Highway and Transportation Authority, Highway Revenue Bonds, Series 2005K, 5.000%, 7/01/17 | 7/15 at 100.00 | Baa1 | 1,057,440 | ||||||||||||||
| 3,000 | Puerto Rico Public Buildings Authority, Guaranteed Government Facilities Revenue Bonds, Series 1993L, 5.500%, 7/01/21 | No Opt. Call | Baa1 | 3,327,630 | ||||||||||||||
| 3,540 | Puerto Rico Sales Tax Financing Corporation, Sales Tax Revenue Bonds, First Subordinate Series 2009A, 6.000%, 8/01/42 | 8/19 at 100.00 | A+ | 4,020,484 | ||||||||||||||
| 250 | Puerto Rico Sales Tax Financing Corporation, Sales Tax Revenue Bonds, First Subordinate Series 2010A, 5.500%, 8/01/42 | 2/20 at 100.00 | A+ | 271,295 | ||||||||||||||
Puerto Rico Sales Tax Financing Corporation, Sales Tax Revenue Bonds, First Subordinate Series 2010C: | ||||||||||||||||||
| 1,660 | 6.000%, 8/01/39 | 8/20 at 100.00 | A+ | 1,914,611 | ||||||||||||||
| 1,265 | 5.250%, 8/01/41 | 8/20 at 100.00 | A+ | 1,361,127 | ||||||||||||||
| 1,070 | Puerto Rico Sales Tax Financing Corporation, Sales Tax Revenue Bonds, First Subordinate Series 2011A-1, 5.250%, 8/01/43 | 8/21 at 100.00 | A+ | 1,156,927 | ||||||||||||||
Puerto Rico Sales Tax Financing Corporation, Sales Tax Revenue Bonds, Series 2007A: | ||||||||||||||||||
| 15,780 | 0.000%, 8/01/41 – NPFG Insured | No Opt. Call | AA– | 3,431,834 | ||||||||||||||
| 8,935 | 0.000%, 8/01/42 – FGIC Insured | No Opt. Call | AA– | 1,828,637 | ||||||||||||||
| 1,000 | Raytown, Missouri, Annual Appropriation Supported Tax Increment and Sales Tax Revenue Bonds, Raytown Live Redevelopment Project Area 1, Series 2007, 5.125%, 12/01/31 | 6/17 at 100.00 | A+ | 1,072,110 | ||||||||||||||
| 1,700 | Riverside Industrial Development Authority, Missouri, Industrial Development Revenue Bonds, Riverside Horizon, Series 2007A, 5.000%, 5/01/27 – ACA Insured | 5/17 at 100.00 | A | 1,796,033 | ||||||||||||||
| Nuveen Investments | 51 |
Portfolio of Investments (Unaudited)
Nuveen Missouri Municipal Bond Fund (continued)
November 30, 2012
| Principal Amount (000) | Description (1) | Optional Call Provisions (2) | Ratings (3) | Value | ||||||||||||||
Tax Obligation/Limited (continued) | ||||||||||||||||||
| $ | 2,170 | Riverside, Missouri, L-385 Levee Redevelopment Plan Tax Increment Revenue Bonds, Series 2004, 5.250%, 5/01/20 | 5/15 at 100.00 | A | $ | 2,308,685 | ||||||||||||
| 1,150 | Saint Charles, Missouri, Certificates of Participation, Series 2012, 2.000%, 5/01/13 | No Opt. Call | A1 | 1,156,900 | ||||||||||||||
Saint Joseph Industrial Development Authority, Missouri, Special Obligation Revenue Bonds, Sewerage System Improvements Project, Series 2007: | ||||||||||||||||||
| 500 | 4.750%, 4/01/20 | 4/17 at 100.00 | A | 552,505 | ||||||||||||||
| 390 | 4.750%, 4/01/21 | 4/17 at 100.00 | A | 428,497 | ||||||||||||||
Saint Louis Municipal Finance Corporation, Missouri, Leasehold Revenue Bonds, Convention Center, Series 2009A: | ||||||||||||||||||
| 1,000 | 0.000%, 7/15/26 – AGC Insured | No Opt. Call | AA– | 593,580 | ||||||||||||||
| 1,000 | 0.000%, 7/15/27 – AGC Insured | No Opt. Call | AA– | 560,730 | ||||||||||||||
| 1,000 | 0.000%, 7/15/28 – AGC Insured | No Opt. Call | AA– | 534,060 | ||||||||||||||
| 1,000 | 0.000%, 7/15/29 – AGC Insured | No Opt. Call | AA– | 507,220 | ||||||||||||||
| 1,945 | Springfield Center City Development Corporation, Missouri, Lease Revenue Bonds, Jordan Valley Park Exposition Center, Series 2002A, 5.000%, 6/01/27 – AMBAC Insured | 12/12 at 100.00 | Aa3 | 1,951,574 | ||||||||||||||
| 4,500 | Springfield Public Building Corporation, Missouri, Lease Revenue Bonds, Series 2004, 5.000%, 3/01/24 – AMBAC Insured | 3/14 at 100.00 | Aa2 | 4,731,795 | ||||||||||||||
St. Joseph Industrial Development Authority, Missouri, Tax Increment Bonds, Shoppes at North Village Project, Series 2005A: | ||||||||||||||||||
| 660 | 5.375%, 11/01/24 | 11/14 at 100.00 | N/R | 665,768 | ||||||||||||||
| 1,600 | 5.500%, 11/01/27 | 11/14 at 100.00 | N/R | 1,611,776 | ||||||||||||||
| 1,800 | St. Joseph Industrial Development Authority, Missouri, Tax Increment Bonds, Shoppes at North Village Project, Series 2005B, 5.500%, 11/01/27 | 11/14 at 100.00 | N/R | 1,813,248 | ||||||||||||||
| 3,225 | St. Louis Industrial Development Authority, Missouri, Senior Lien Revenue Bonds, St. Louis Convention Center Headquarters Hotel, Series 2000A, 0.000%, 7/15/15 – AMBAC Insured | No Opt. Call | A | 2,982,512 | ||||||||||||||
| 1,595 | Texas County, Missouri, Certificates of Participation, Justice Center Project, Series 2006, 4.500%, 12/01/25 – AGC Insured | 12/16 at 100.00 | AA– | 1,786,496 | ||||||||||||||
| 520 | Union, Missouri, Certificates of Participation, Series 2006A, 5.200%, 7/01/23 | 7/14 at 100.00 | N/R | 535,657 | ||||||||||||||
| 1,000 | Virgin Islands Public Finance Authority, Matching Fund Loan Notes Revenue Bonds, Series 2012A, 5.000%, 10/01/32 | 10/22 at 100.00 | BBB+ | 1,125,200 | ||||||||||||||
| 119,245 | Total Tax Obligation/Limited | 101,360,582 | ||||||||||||||||
Transportation – 3.9% | ||||||||||||||||||
| 2,025 | Kansas City, Missouri, Passenger Facility Charge Revenue Bonds, Kansas City International Airport, Series 2001, 5.000%, 4/01/23 – AMBAC Insured (Alternative Minimum Tax) | 4/13 at 100.00 | A | 2,038,952 | ||||||||||||||
| 3,500 | Saint Louis, Missouri, Airport Revenue Bonds, Lambert-St. Louis International Airport, Refunding Series 2012A, 5.000%, 7/01/32 – FGIC Insured (Alternative Minimum Tax) | 7/22 at 100.00 | A– | 3,847,970 | ||||||||||||||
| 2,000 | St. Louis, Missouri, Airport Revenue Bonds, Lambert-St Louis International Series 2009A-2, 6.125%, 7/01/24 | 7/19 at 100.00 | A– | 2,393,780 | ||||||||||||||
| 3,210 | St. Louis, Missouri, Airport Revenue Bonds, Lambert-St. Louis International Airport, Series 2005, 5.500%, 7/01/18 – NPFG Insured | No Opt. Call | A– | 3,777,753 | ||||||||||||||
St. Louis, Missouri, Airport Revenue Bonds, Lambert-St. Louis International Airport, Series 2007A: | ||||||||||||||||||
| 1,035 | 5.000%, 7/01/20 – AGM Insured | 7/17 at 100.00 | AA– | 1,167,594 | ||||||||||||||
| 2,000 | 5.000%, 7/01/21 – AGM Insured | 7/17 at 100.00 | AA– | 2,256,220 | ||||||||||||||
St. Louis, Missouri, Airport Revenue Refunding Bonds, Series 2003A: | ||||||||||||||||||
| 2,450 | 5.250%, 7/01/16 – AGM Insured | 7/13 at 100.00 | AA– | 2,509,584 | ||||||||||||||
| 1,000 | 5.250%, 7/01/18 – AGM Insured | 7/13 at 100.00 | AA– | 1,022,440 | ||||||||||||||
| 17,220 | Total Transportation | 19,014,293 | ||||||||||||||||
| 52 | Nuveen Investments |
| Principal Amount (000) | Description (1) | Optional Call Provisions (2) | Ratings (3) | Value | ||||||||||||||
U.S. Guaranteed – 7.7% (4) | ||||||||||||||||||
| $ | 4,500 | Cape Girardeau County, Missouri, Single Family Mortgage Revenue Bonds, Series 1983, 0.000%, 12/01/14 (ETM) | No Opt. Call | Aaa | $ | 4,455,045 | ||||||||||||
Columbia, Missouri, Special Obligation Electric Utility Improvement Bonds, Annual Appropriation Obligation, Series 2008A: | ||||||||||||||||||
| 400 | 5.000%, 10/01/21 (Pre-refunded 10/01/17) | 10/17 at 100.00 | AA (4) | 483,552 | ||||||||||||||
| 545 | 5.000%, 10/01/23 (Pre-refunded 10/01/17) | 10/17 at 100.00 | AA (4) | 658,840 | ||||||||||||||
| 500 | 5.125%, 10/01/30 (Pre-refunded 10/01/17) | 10/17 at 100.00 | AA (4) | 607,415 | ||||||||||||||
Cottleville, Missouri, Certificates of Participation, Series 2006: | ||||||||||||||||||
| 200 | 5.125%, 8/01/26 (Pre-refunded 8/01/14) | 8/14 at 100.00 | N/R (4) | 215,910 | ||||||||||||||
| 2,120 | 5.250%, 8/01/31 (Pre-refunded 8/01/14) | 8/14 at 100.00 | N/R (4) | 2,293,056 | ||||||||||||||
| 1,035 | Dunklin County, Missouri, Certificates of Participation, Series 2004, 5.000%, 12/01/19 (Pre-refunded 12/01/14) – FGIC Insured | 12/14 at 100.00 | BBB (4) | 1,128,398 | ||||||||||||||
| 1,025 | Excelsior Springs School District, Missouri, Leasehold Revenue Bonds, Series 1994, 0.000%, 3/01/14 – AGM Insured (ETM) | No Opt. Call | AA (4) | 1,019,055 | ||||||||||||||
| 3,000 | Harrisonville, Missouri, Lease Participation Certificates, Series 2003, 5.000%, 12/01/22 (Pre-refunded 12/01/13) – SYNCORA GTY Insured | 12/13 at 100.00 | A+ (4) | 3,140,190 | ||||||||||||||
| 4,000 | Kansas City, Missouri, Special Facility Revenue Bonds, MCI Overhaul Base Project, Series 2005G, 4.750%, 9/01/28 (Pre-refunded 9/01/15) (Alternative Minimum Tax) | 9/15 at 100.00 | AA– (4) | 4,457,760 | ||||||||||||||
| 90 | Missouri Development Finance Board. Infrastructure Facilities Revenue Bonds, City of Independence, Missouri – Events Center Project, Series 2009F, 6.000%, 4/01/27 (Pre-refunded 4/01/14) | 4/14 at 100.00 | A– (4) | 96,734 | ||||||||||||||
Missouri Health and Educational Facilities Authority, Revenue Bonds, Lester E. Cox Medical Center, Series 1992H: | ||||||||||||||||||
| 1,000 | 0.000%, 9/01/17 – NPFG Insured (ETM) | No Opt. Call | BBB (4) | 943,160 | ||||||||||||||
| 1,800 | 0.000%, 9/01/21 – NPFG Insured (ETM) | No Opt. Call | BBB (4) | 1,507,284 | ||||||||||||||
| 2,385 | 0.000%, 9/01/22 – NPFG Insured (ETM) | No Opt. Call | BBB (4) | 1,915,942 | ||||||||||||||
| 895 | Missouri State Board of Public Building, Special Obligation Bonds, Series 2003A, 5.000%, 10/15/27 (Pre-refunded 10/15/13) | 10/13 at 100.00 | Aa1 (4) | 931,176 | ||||||||||||||
| 1,195 | Nixa, Missouri, Electric System Revenue Bonds, Series 2005, 5.000%, 4/01/25 (Pre-refunded 4/01/13) – SYNCORA GTY Insured | 4/13 at 100.00 | N/R (4) | 1,213,953 | ||||||||||||||
| 3,905 | North Kansas City School District 74, Clay County, Missouri, General Obligation Bonds, Series 2005, 5.000%, 3/01/25 (Pre-refunded 3/01/15) | 3/15 at 100.00 | Aa1 (4) | 4,308,152 | ||||||||||||||
| 690 | Richmond Heights, Missouri, General Obligation Bonds, Manhasset Village Nieghboorhood, Series 2006, 4.500%, 4/01/26 (Pre-refunded 4/01/14) | 4/14 at 100.00 | N/R (4) | 722,202 | ||||||||||||||
| 2,055 | Springfield Public Building Corporation, Missouri, Lease Revenue Bonds, Jordan Valley Park Projects, Series 2000A, 6.125%, 6/01/21 – AMBAC Insured (ETM) | 6/13 at 100.00 | N/R (4) | 2,055,000 | ||||||||||||||
Springfield School District R12, Missouri, General Obligation Bonds, Series 2003: | ||||||||||||||||||
| 1,225 | 5.125%, 3/01/20 (Pre-refunded 3/01/13) – FGIC Insured | 3/13 at 100.00 | AA+ (4) | 1,239,406 | ||||||||||||||
| 2,000 | 5.000%, 3/01/22 (Pre-refunded 3/01/13) – FGIC Insured | 3/13 at 100.00 | AA+ (4) | 2,023,080 | ||||||||||||||
| 1,250 | 5.000%, 3/01/23 (Pre-refunded 3/01/13) – FGIC Insured | 3/13 at 100.00 | AA+ (4) | 1,263,975 | ||||||||||||||
| 500 | St. Louis County Industrial Development Authority, Missouri, Health Facilities Revenue Bonds, Ranken-Jordan Project, Series 2003, 6.625%, 11/15/35 (Pre-refunded 11/15/13) | 11/13 at 100.00 | N/R (4) | 529,615 | ||||||||||||||
| 36,315 | Total U.S. Guaranteed | 37,208,900 | ||||||||||||||||
Utilities – 6.4% | ||||||||||||||||||
| 235 | Guam Power Authority, Revenue Bonds, Series 2012A, 5.000%, 10/01/34 | 10/22 at 100.00 | BBB | 268,504 | ||||||||||||||
| 375 | Missouri Development Finance Board, Infrastructure Facilities Leasehold Revenue Bonds, City of Independence, Missouri, Annual Appropriation Electric System Revenue Bonds – Dogwood Project, Series 2012A, 5.000%, 6/01/26 | 6/22 at 100.00 | AA– | 439,253 | ||||||||||||||
| Nuveen Investments | 53 |
Portfolio of Investments (Unaudited)
Nuveen Missouri Municipal Bond Fund (continued)
November 30, 2012
| Principal Amount (000) | Description (1) | Optional Call Provisions (2) | Ratings (3) | Value | ||||||||||||||
Utilities (continued) | ||||||||||||||||||
| $ | 3,000 | Missouri Environmental Improvement and Energy Resources Authority, Revenue Bonds, Kansas City Power & Light Company Project, Series 2008 | No Opt. Call | BBB | $ | 3,057,570 | ||||||||||||
| 1,000 | Missouri Joint Municipal Electric Utility Commission, Iatan 2 Power Project Revenue Bonds, Series 2006A, 5.000%, 1/01/28 – AMBAC Insured | 1/16 at 100.00 | A2 | 1,106,270 | ||||||||||||||
Missouri Joint Municipal Electric Utility Commission, Plum Point Project, Revenue Bonds, Series 2006: | ||||||||||||||||||
| 1,500 | 5.000%, 1/01/16 – NPFG Insured | No Opt. Call | A– | 1,638,480 | ||||||||||||||
| 405 | 5.000%, 1/01/17 – NPFG Insured | 1/16 at 100.00 | A– | 439,976 | ||||||||||||||
| 285 | 5.000%, 1/01/19 – NPFG Insured | 1/16 at 100.00 | A– | 307,484 | ||||||||||||||
| 4,720 | 5.000%, 1/01/34 – NPFG Insured | 1/16 at 100.00 | A– | 4,968,366 | ||||||||||||||
| 2,005 | Missouri Joint Municipal Electric Utility Commission, Power Project Revenue Bonds, Iatan 2 Project, Series 2009A, 6.000%, 1/01/39 | 1/16 at 100.00 | A2 | 2,354,933 | ||||||||||||||
Missouri Joint Municipal Electric Utility Commission, Power Supply System Revenue Bonds, MoPEP Facilities, Series 2012: | ||||||||||||||||||
| 285 | 4.000%, 1/01/17 | No Opt. Call | A2 | 315,583 | ||||||||||||||
| 2,200 | 5.000%, 1/01/32 | 1/21 at 100.00 | A2 | 2,501,092 | ||||||||||||||
| 2,000 | 5.000%, 1/01/37 | 1/21 at 100.00 | A2 | 2,232,760 | ||||||||||||||
Missouri Joint Municipal Electric Utility Commission, Prairie State Power Project Revenue Bonds, Series 2007A: | ||||||||||||||||||
| 500 | 5.000%, 1/01/16 – AMBAC Insured | No Opt. Call | A | 559,410 | ||||||||||||||
| 1,010 | 5.000%, 1/01/42 – AMBAC Insured | 1/17 at 100.00 | A | 1,118,747 | ||||||||||||||
| 2,000 | Puerto Rico Electric Power Authority, Power Revenue Bonds, Series 2003NN, 5.250%, 7/01/23 – NPFG Insured | No Opt. Call | BBB+ | 2,283,560 | ||||||||||||||
| 3,035 | Puerto Rico Electric Power Authority, Power Revenue Bonds, Series 2010XX, 5.250%, 7/01/40 | 7/20 at 100.00 | BBB+ | 3,143,289 | ||||||||||||||
| 1,000 | Puerto Rico Electric Power Authority, Power Revenue Bonds, Series WW, 5.250%, 7/01/25 | 7/18 at 100.00 | BBB+ | 1,074,670 | ||||||||||||||
| 3,030 | Sikeston, Missouri, Electric System Revenue Refunding Bonds, Series 1996, 6.000%, 6/01/14 – NPFG Insured | No Opt. Call | BBB+ | 3,246,706 | ||||||||||||||
| 28,585 | Total Utilities | 31,056,653 | ||||||||||||||||
Water and Sewer – 7.0% | ||||||||||||||||||
Cape Girardeau, Missouri, Waterworks System Refunding Revenue Bonds, Series 2012A: | ||||||||||||||||||
| 250 | 3.250%, 1/01/25 | 1/20 at 100.00 | A+ | 261,028 | ||||||||||||||
| 725 | 3.375%, 1/01/26 | 1/20 at 100.00 | A+ | 761,859 | ||||||||||||||
| 1,500 | Carroll County Public Water Supply District 1, Missouri, Water System Revenue Bonds, Refunding Series 2009, 6.000%, 3/01/39 | 3/18 at 100.00 | A | 1,722,210 | ||||||||||||||
| 1,370 | Guam Government Waterworks Authority, Water and Wastewater System Revenue Bonds, Series 2010, 5.625%, 7/01/40 | 7/20 at 100.00 | Ba2 | 1,460,817 | ||||||||||||||
Jefferson County Consolidated Public Water Supply District C1, Missouri, Waterworks Revenue Bonds, Refunding Series 2010: | ||||||||||||||||||
| 745 | 4.125%, 12/01/24 | 12/17 at 100.00 | A+ | 837,656 | ||||||||||||||
| 500 | 4.250%, 12/01/25 | 12/17 at 100.00 | A+ | 563,385 | ||||||||||||||
| 2,000 | Kansas City, Missouri, Sanitary Sewer System Revenue Bonds, Series 2009A, 5.250%, 1/01/34 | 1/19 at 100.00 | AA | 2,392,860 | ||||||||||||||
| 500 | Kansas City, Missouri, Water Revenue Bonds, Refunding & Improvement Series 2009A, 5.250%, 12/01/32 | 12/18 at 100.00 | AA+ | 594,755 | ||||||||||||||
| 4,600 | Kansas City, Missouri, Water Revenue Bonds, Series 2012A, 4.500%, 12/01/36 | 12/21 at 100.00 | AA+ | 5,339,587 | ||||||||||||||
| 1,500 | Lincoln County Public Water Supply District 1, Missouri, Certificates of Participation, Refunding Series 2009, 6.750%, 6/15/35 | 6/16 at 100.00 | A– | 1,635,960 | ||||||||||||||
| 500 | Metropolitan St. Louis Sewerage District, Missouri, Wastewater System Revenue Bonds, Series 2008A, 5.750%, 5/01/38 | 5/17 at 100.00 | AAA | 590,040 | ||||||||||||||
| 54 | Nuveen Investments |
| Principal Amount (000) | Description (1) | Optional Call Provisions (2) | Ratings (3) | Value | ||||||||||||||
Water and Sewer (continued) | ||||||||||||||||||
| $ | 4,000 | Metropolitan St. Louis Sewerage District, Missouri, Wastewater System Revenue Bonds, Series 2012B, 5.000%, 5/01/29 | 5/22 at 100.00 | AAA | $ | 5,023,560 | ||||||||||||
| 2,600 | Missouri Development Finance Board, Independence, Infrastructure Facilities Revenue Bonds, Water System Improvement Projects, Series 2004, 5.000%, 11/01/24 – AMBAC Insured | 11/14 at 100.00 | A– | 2,762,682 | ||||||||||||||
| 500 | Missouri Development Finance Board, Independence, Infrastructure Facilities Revenue Bonds, Water System Improvement Projects, Series 2009C, 5.750%, 11/01/29 | 11/14 at 100.00 | A– | 536,305 | ||||||||||||||
| 1,000 | Missouri Development Finance Board, Infrastructure Facilities Revenue Bonds, City of Saint JosephSewerage System Improvement Projects, Series 2011E, 5.375%, 5/01/36 | 5/20 at 100.00 | A | 1,093,860 | ||||||||||||||
| 2,965 | Missouri Environmental Improvement and Energy Resources Authority, Water Facility Revenue Bonds, Missouri-American Water Company, Series 2006, 4.600%, 12/01/36 – AMBAC Insured (Alternative Minimum Tax) (UB) (5) | 12/16 at 100.00 | AA+ | 3,122,412 | ||||||||||||||
| 470 | Missouri Environmental Improvement and Energy Resources Authority, Water Pollution Control and Drinking Water Revenue Bonds, State Revolving Fund Program, Series 2001C, 5.000%, 7/01/23 | 1/13 at 100.00 | Aaa | 471,838 | ||||||||||||||
| 410 | Missouri Environmental Improvement and Energy Resources Authority, Water Pollution Control and Drinking Water Revenue Bonds, State Revolving Fund Program, Series 2005C, 4.750%, 7/01/23 | 1/16 at 100.00 | Aaa | 457,736 | ||||||||||||||
| 1,000 | Missouri Environmental Improvement and Energy Resources Authority, Water Pollution Control and Drinking Water Revenue Bonds, State Revolving Fund Program, Series 2008A, 5.750%, 1/01/29 | 1/19 at 100.00 | Aaa | 1,238,760 | ||||||||||||||
| 65 | Missouri Environmental Improvement and Energy Resources Authority, Water Pollution Control Revenue Bonds, State Revolving Fund Program – Multi-Participants, Series 1998B, 5.250%, 1/01/15 | 1/13 at 100.00 | Aaa | 65,272 | ||||||||||||||
| 2,070 | North Central Missouri Regional Water Commission, Waterworks System Revenue Bonds, Series 2006, 5.000%, 1/01/37 | 1/17 at 100.00 | N/R | 2,181,966 | ||||||||||||||
| 590 | Taney County Public Water Supply District 3, Missouri, Certificates of Participation, Refundind Series 2010, 4.500%, 7/01/25 | 7/15 at 101.00 | A+ | 620,108 | ||||||||||||||
| 29,860 | Total Water and Sewer | 33,734,656 | ||||||||||||||||
| $ | 472,108 | Total Investments (cost $436,227,293) – 99.5% | 481,268,937 | |||||||||||||||
Floating Rate Obligations – (0.5)% | (2,225,000) | |||||||||||||||||
Other Assets Less Liabilities – 1.0% | 4,571,948 | |||||||||||||||||
Net Assets – 100% | $ | 483,615,885 | ||||||||||||||||
| (1) | All percentages shown in the Portfolio of Investments are based on net assets. |
| (2) | Optional Call Provisions: Dates (month and year) and prices of the earliest optional call or redemption. There may be other call provisions at varying prices at later dates. Certain mortgage-backed securities may be subject to periodic principal paydowns. |
| (3) | Ratings: Using the highest of Standard & Poor’s Group (“Standard & Poor’s”), Moody’s Investors Service, Inc. (“Moody’s”) or Fitch, Inc. (“Fitch”) rating. Ratings below BBB by Standard & Poor’s, Baa by Moody’s or BBB by Fitch are considered to be below investment grade. Holdings designated N/R are not rated by any of these national rating agencies. |
| (4) | Backed by an escrow or trust containing sufficient U.S. Government or U.S. Government agency securities, which ensure the timely payment of principal and interest. Certain bonds backed by U.S. Government or agency securities are regarded as having an implied rating equal to the rating of such securities. |
| (5) | Investment, or portion of investment, has been pledged to collateralize the net payment obligations for investments in inverse floating rate transactions. |
| N/R | Not rated. |
| WI/DD | Investment, or portion of investment, purchased on a when-issued or delayed delivery basis. |
| (ETM) | Escrowed to maturity. |
| (UB) | Underlying bond of an inverse floating rate trust reflected as a financing transaction. See Notes to Financial Statements, Footnote 1 – General Information and Significant Accounting Policies, Inverse Floating Rate Securities for more information. |
See accompanying notes to financial statements.
| Nuveen Investments | 55 |
Portfolio of Investments (Unaudited)
Nuveen Ohio Municipal Bond Fund
November 30, 2012
| Principal Amount (000) | Description (1) | Optional Call Provisions (2) | Ratings (3) | Value | ||||||||||||||
Consumer Staples – 5.0% | ||||||||||||||||||
| $ | 250 | Buckeye Tobacco Settlement Financing Authority, Ohio, Tobacco Settlement Asset-Backed Revenue Bonds, Senior Lien, Series 2007A-1, 5.000%, 6/01/16 | No Opt. Call | A1 | $ | 279,830 | ||||||||||||
Buckeye Tobacco Settlement Financing Authority, Ohio, Tobacco Settlement Asset-Backed Revenue Bonds, Senior Lien, Series 2007A-2: | ||||||||||||||||||
| 6,850 | 5.125%, 6/01/24 | 6/17 at 100.00 | B | 6,182,742 | ||||||||||||||
| 20,840 | 5.875%, 6/01/47 | 6/17 at 100.00 | BB | 18,588,655 | ||||||||||||||
| 5,170 | Puerto Rico, The Children’s Trust Fund, Tobacco Settlement Asset-Backed Refunding Bonds, Series 2002, 5.375%, 5/15/33 | 8/20 at 100.00 | BBB+ | 5,175,842 | ||||||||||||||
| 33,110 | Total Consumer Staples | 30,227,069 | ||||||||||||||||
Education and Civic Organizations – 7.2% | ||||||||||||||||||
| 4,000 | Cleveland State University, Ohio, General Receipts Bonds, Series 2012, 5.000%, 6/01/37 | 12/21 at 100.00 | A+ | 4,584,600 | ||||||||||||||
| 2,000 | Kent State University, Ohio, University General Receipts Bonds, Series 2012A, 5.000%, 5/01/42 – AGC Insured | 5/22 at 100.00 | Aa3 | 2,325,160 | ||||||||||||||
| 1,925 | Miami University of Ohio, General Receipts Bonds, Series 2011, 5.000%, 9/01/36 | 9/21 at 100.00 | AA | 2,278,719 | ||||||||||||||
Miami University of Ohio, General Receipts Bonds, Series 2012: | ||||||||||||||||||
| 1,000 | 4.000%, 9/01/31 | 9/22 at 100.00 | AA | 1,118,520 | ||||||||||||||
| 770 | 4.000%, 9/01/32 | 9/22 at 100.00 | AA | 856,348 | ||||||||||||||
| 1,600 | Ohio Higher Education Facilities Commission, General Revenue Bonds, Kenyon College, Series 2006, 5.000%, 7/01/41 | 7/16 at 100.00 | A+ | 1,691,520 | ||||||||||||||
| 1,750 | Ohio Higher Education Facilities Commission, General Revenue Bonds, Oberlin College, Series 2003, 5.125%, 10/01/24 | 10/13 at 100.00 | AA | 1,811,548 | ||||||||||||||
| 910 | Ohio Higher Education Facilities Commission, Revenue Bonds, Case Western Reserve University, Series 1990B, 6.500%, 10/01/20 | No Opt. Call | AA– | 1,122,740 | ||||||||||||||
| 400 | Ohio Higher Education Facilities Commission, Revenue Bonds, College of Wooster Project, Series 2005, 5.000%, 9/01/20 | 9/15 at 100.00 | A1 | 434,496 | ||||||||||||||
| 1,000 | Ohio Higher Education Facilities Commission, Revenue Bonds, John Carroll University, Series 1997, 5.000%, 4/01/19 | 4/16 at 100.00 | A3 | 1,101,090 | ||||||||||||||
| 1,000 | Ohio Higher Education Facilities Commission, Revenue Bonds, Mount Union College, Series 2006, 5.000%, 10/01/31 | 10/16 at 100.00 | A3 | 1,070,990 | ||||||||||||||
Ohio Higher Education Facilities Commission, Revenue Bonds, Ohio Northern University, Series 2005: | ||||||||||||||||||
| 760 | 5.000%, 5/01/20 | 5/15 at 100.00 | Baa2 | 791,228 | ||||||||||||||
| 1,000 | 5.000%, 5/01/26 | 5/15 at 100.00 | Baa2 | 1,025,130 | ||||||||||||||
Ohio Higher Education Facilities Commission, Revenue Bonds, Wittenberg University, Series 2005: | ||||||||||||||||||
| 1,505 | 5.000%, 12/01/24 | 12/15 at 100.00 | Ba2 | 1,508,732 | ||||||||||||||
| 1,000 | 5.000%, 12/01/29 | 12/15 at 100.00 | Ba2 | 992,090 | ||||||||||||||
Ohio Higher Educational Facilities Commission, Revenue Bonds, Denison University Project, Series 2012: | ||||||||||||||||||
| 1,140 | 5.000%, 11/01/27 | 5/22 at 100.00 | AA | 1,398,997 | ||||||||||||||
| 1,000 | 5.000%, 11/01/30 | 5/22 at 100.00 | AA | 1,208,170 | ||||||||||||||
| 645 | Ohio Higher Educational Facilities Commission, Revenue Bonds, University of Dayton, Refunding Series 2009, 5.375%, 12/01/29 | 12/18 at 100.00 | A | 771,788 | ||||||||||||||
Ohio Higher Educational Facilities Commission, Revenue Bonds, University of Dayton, Series 2004: | ||||||||||||||||||
| 1,315 | 5.000%, 12/01/25 – AMBAC Insured | 12/14 at 100.00 | A | 1,420,161 | ||||||||||||||
| 1,060 | 5.000%, 12/01/27 – AMBAC Insured | 12/14 at 100.00 | A | 1,140,984 | ||||||||||||||
Ohio Higher Educational Facilities Commission, Revenue Bonds, Wittenberg University, Series 2001: | ||||||||||||||||||
| 1,200 | 5.500%, 12/01/21 | 6/13 at 100.00 | Ba2 | 1,200,720 | ||||||||||||||
| 2,100 | 5.000%, 12/01/26 | 6/13 at 100.00 | Ba2 | 2,099,853 | ||||||||||||||
| 56 | Nuveen Investments |
| Principal Amount (000) | Description (1) | Optional Call Provisions (2) | Ratings (3) | Value | ||||||||||||||
Education and Civic Organizations (continued) | ||||||||||||||||||
| $ | 500 | Ohio Higher Educational Facility Commission, Higher Educational Facility Revenue Bonds, Xavier University Project, Series 2010, 5.000%, 5/01/40 | 5/20 at 100.00 | A– | $ | 566,240 | ||||||||||||
| 1,885 | Ohio State Higher Education Facilities, Revenue Bonds, Case Western Reserve University, Series 2006, 5.000%, 12/01/44 – NPFG Insured | 12/16 at 100.00 | AA– | 2,114,386 | ||||||||||||||
| 750 | Ohio State, Higher Educational Facility Revenue Bonds, Baldwin-Wallace College Project, Series 2004, 5.000%, 12/01/13 | No Opt. Call | A– | 780,435 | ||||||||||||||
| 500 | Ohio State, Higher Educational Facility Revenue Bonds, Otterbein College Project, Series 2008A, 5.500%, 12/01/28 | 12/18 at 100.00 | A3 | 577,555 | ||||||||||||||
| 1,900 | Ohio University at Athens, Subordinate Lien General Receipts Bonds, | 6/14 at 100.00 | Aa3 | 2,019,738 | ||||||||||||||
| 250 | Port of Greater Cincinnati Development Authority, Ohio, Economic Development Revenue Bonds, Sisters of Mercy of the Americas, | 10/16 at 100.00 | A+ | 264,233 | ||||||||||||||
| 1,675 | University of Cincinnati, Ohio, General Receipts Bonds, Series 2004A, 5.000%, 6/01/21 – AMBAC Insured | 6/14 at 100.00 | AA– | 1,778,733 | ||||||||||||||
University of Cincinnati, Ohio, General Receipts Bonds, Series 2004D: | ||||||||||||||||||
| 1,325 | 5.000%, 6/01/24 – AMBAC Insured | 6/14 at 100.00 | AA– | 1,402,142 | ||||||||||||||
| 1,005 | 5.000%, 6/01/26 – AMBAC Insured | 6/14 at 100.00 | AA– | 1,066,275 | ||||||||||||||
| 1,025 | University of Cincinnati, Ohio, General Receipts Bonds, Series 2004E, 5.000%, 6/01/21 – AMBAC Insured | 12/14 at 100.00 | AA– | 1,108,671 | ||||||||||||||
| 39,895 | Total Education and Civic Organizations | 43,631,992 | ||||||||||||||||
Health Care – 14.5% | ||||||||||||||||||
Akron, Bath and Copley Joint Township Hospital District, Ohio, Hospital Facilities Revenue Bonds, Summa Health System, Series 2004A: | ||||||||||||||||||
| 1,220 | 5.250%, 11/15/31 – RAAI Insured | 11/14 at 100.00 | Baa1 | 1,267,214 | ||||||||||||||
| 150 | 5.500%, 11/15/34 – RAAI Insured | 11/14 at 100.00 | Baa1 | 156,569 | ||||||||||||||
| 1,065 | Akron, Bath and Copley Joint Township Hospital District, Ohio, Hospital Revenue Bonds, Children’s Hospital Medical Center, Series 2003, 5.250%, 11/15/25 – AGM Insured | 11/13 at 100.00 | Aa3 | 1,092,136 | ||||||||||||||
Allen County, Ohio, Hospital Facilities Revenue Bonds, Catholic Healthcare Partners, Series 2010A: | ||||||||||||||||||
| 3,050 | 5.250%, 6/01/38 | 6/20 at 100.00 | AA– | 3,458,670 | ||||||||||||||
| 250 | 5.000%, 6/01/38 | 6/20 at 100.00 | AA– | 277,605 | ||||||||||||||
| 500 | Allen County, Ohio, Hospital Facilities Revenue Bonds, Catholic Healthcare Partners, Series 2010B, 4.125%, 9/01/20 | No Opt. Call | AA– | 588,985 | ||||||||||||||
Butler County, Ohio, Hospital Facilities Revenue Bonds, UC Health, | ||||||||||||||||||
| 750 | 5.500%, 11/01/22 | 11/20 at 100.00 | BBB+ | 886,673 | ||||||||||||||
| 3,440 | 5.500%, 11/01/40 | 11/20 at 100.00 | BBB+ | 3,913,447 | ||||||||||||||
| 345 | Fairfield County, Ohio, Hsopital Facilities Revenue Bonds, Fairfield Medical Center Project, Series 2003, 5.000%, 6/15/22 – RAAI Insured | 6/22 at 100.00 | Baa2 | 345,811 | ||||||||||||||
Franklin County, Ohio, Hospital Revenue Bonds, Nationwide Children’s Hospital Project, Improvement Series 2009: | ||||||||||||||||||
| 3,000 | 5.000%, 11/01/34 | 11/19 at 100.00 | Aa2 | 3,371,340 | ||||||||||||||
| 3,000 | 5.250%, 11/01/40 | 11/19 at 100.00 | Aa2 | 3,397,830 | ||||||||||||||
Franklin County, Ohio, Hospital Revenue Bonds, Nationwide Children’s Hospital Project, Series 2005: | ||||||||||||||||||
| 365 | 4.750%, 11/01/23 | 11/18 at 100.00 | Aa2 | 413,636 | ||||||||||||||
| 3,180 | 5.000%, 11/01/40 | 11/18 at 100.00 | Aa2 | 3,469,348 | ||||||||||||||
| 640 | Franklin County, Ohio, Hospital Revenue Bonds, OhioHealth Corporation, Series 2011A, 5.000%, 11/15/41 | 11/21 at 100.00 | AA+ | 725,107 | ||||||||||||||
| 4,830 | Franklin County, Ohio, Hospital Revenue Bonds, OhioHealth Corporation, Tender Option Bond Trust 11-21B, 9.316%, 11/15/41 (IF) (4) | 11/21 at 100.00 | AA+ | 6,114,587 | ||||||||||||||
| Nuveen Investments | 57 |
Portfolio of Investments (Unaudited)
Nuveen Ohio Municipal Bond Fund (continued)
November 30, 2012
| Principal Amount (000) | Description (1) | Optional Call Provisions (2) | Ratings (3) | Value | ||||||||||||||
Health Care (continued) | ||||||||||||||||||
| $ | 500 | Franklin County, Ohio, Revenue Bonds, Trinity Health Credit Group, Refunding Series 2010C, 4.500%, 12/01/37 | 12/20 at 100.00 | AA | $ | 539,890 | ||||||||||||
| 470 | Hancock County, Ohio, Hospital Revenue Bonds, Blanchard Valley Regional Health Center, Series 2011A, 6.250%, 12/01/34 | 6/21 at 100.00 | A2 | 568,771 | ||||||||||||||
| 750 | Lake County, Ohio, Hospital Facilities Revenue Bonds, Lake Hospital System, Inc., Refunding Series 2008C, 5.625%, 8/15/29 | 8/18 at 100.00 | A3 | 840,713 | ||||||||||||||
Lucas County, Ohio, Hospital Revenue Bonds, ProMedica Healthcare Obligated Group, Series 2008D: | ||||||||||||||||||
| 400 | 5.000%, 11/15/38 | 11/18 at 100.00 | AA– | 437,068 | ||||||||||||||
| 305 | 5.125%, 11/15/40 | 11/18 at 100.00 | AA– | 334,966 | ||||||||||||||
| 3,240 | Lucas County, Ohio, Hospital Revenue Bonds, ProMedica Healthcare Obligated Group, Series 2011A, 6.000%, 11/15/41 | 11/21 at 100.00 | AA– | 4,028,810 | ||||||||||||||
| 2,530 | Miami County, Ohio, Hospital Facilities Revenue Refunding Bonds, Upper Valley Medical Center Inc., Series 2006, 5.250%, 5/15/26 | 5/16 at 100.00 | A2 | 2,722,634 | ||||||||||||||
| 930 | Middleburg Heights, Ohio, Hospital Facilities Revenue Bonds, Southwest General Health Center Project, Refunding Series 2011, 5.250%, 8/01/41 | 8/21 at 100.00 | A2 | 1,046,678 | ||||||||||||||
| 7,000 | Montgomery County, Ohio, Hospital Facilities Revenue Refunding and Improvement Bonds, Kettering Medical Center, Series 1996, 6.250%, 4/01/20 – NPFG Insured | No Opt. Call | A | 8,448,860 | ||||||||||||||
| 750 | Montgomery County, Ohio, Revenue Bonds, Catholic Health Initiatives, Refunding Series 2009A, 5.000%, 5/01/39 | 5/19 at 100.00 | AA– | 825,248 | ||||||||||||||
| 2,270 | Montgomery County, Ohio, Revenue Bonds, Catholic Health Initiatives, Series 2004A, 5.000%, 5/01/32 | 5/14 at 100.00 | AA– | 2,367,610 | ||||||||||||||
| 100 | Montgomery County, Ohio, Revenue Bonds, Catholic Health Initiatives, Series 2008D, 6.250%, 10/01/33 | 10/18 at 100.00 | AA– | 121,606 | ||||||||||||||
Montgomery County, Ohio, Revenue Bonds, Miami Valley Hospital, | ||||||||||||||||||
| 2,000 | 6.250%, 11/15/33 | 11/14 at 100.00 | Aa3 | 2,173,240 | ||||||||||||||
| 1,125 | 6.250%, 11/15/39 | 11/14 at 100.00 | Aa3 | 1,225,181 | ||||||||||||||
| 2,480 | Ohio State Higher Educational Facilities Commission, Hospital Revenue Bonds, Summa Health System Project, Series 2010, 5.250%, 11/15/40 – AGM Insured | 5/20 at 100.00 | AA– | 2,796,671 | ||||||||||||||
| 2,990 | Ohio State, Hospital Facility Revenue Refunding Bonds, Cleveland Clinic Health System Obligated Group, Series 2009A, 5.500%, 1/01/39 | 1/19 at 100.00 | Aa2 | 3,436,078 | ||||||||||||||
Ohio State, Hospital Facility Revenue Refunding Bonds, Cleveland Clinic Health System Obligated Group, Tender Option Bond Trust 3551: | ||||||||||||||||||
| 700 | 19.555%, 1/01/17 (IF) | No Opt. Call | Aa2 | 1,031,352 | ||||||||||||||
| 5,625 | 20.062%, 1/01/33 (IF) | 1/19 at 100.00 | Aa2 | 8,981,775 | ||||||||||||||
| 2,280 | Ohio State, Hospital Facility Revenue Refunding Bonds, Cleveland Clinic Health System Obligated Group, Tender Option Bond Trust 3591, 20.220%, 1/01/17 (IF) | No Opt. Call | Aa2 | 3,640,613 | ||||||||||||||
| 2,000 | Ohio State, Hospital Revenue Bonds, University Hospitals Health System, Inc., Series 2012C, 4.125%, 1/15/42 | 1/17 at 100.00 | A | 2,032,560 | ||||||||||||||
Richland County, Ohio, Hospital Revenue Bonds, MidCentral Health System Group, Series 2006: | ||||||||||||||||||
| 75 | 5.000%, 11/15/13 | No Opt. Call | A– | 77,762 | ||||||||||||||
| 3,235 | 5.250%, 11/15/36 | 11/16 at 100.00 | A– | 3,448,057 | ||||||||||||||
Ross County, Ohio, Hospital Revenue Refunding Bonds, Adena Health System Series 2008: | ||||||||||||||||||
| 500 | 5.500%, 12/01/28 | 12/18 at 100.00 | A2 | 565,705 | ||||||||||||||
| 1,075 | 5.750%, 12/01/35 | 12/18 at 100.00 | A2 | 1,227,102 | ||||||||||||||
| 800 | Scioto County, Ohio, Hospital Facilities Refunding Revenue Bonds, Southern Ohio Medical Center, Series 2008, 5.750%, 2/15/38 | 2/18 at 100.00 | A2 | 885,576 | ||||||||||||||
| 58 | Nuveen Investments |
| Principal Amount (000) | Description (1) | Optional Call Provisions (2) | Ratings (3) | Value | ||||||||||||||
Health Care (continued) | ||||||||||||||||||
| $ | 2,000 | Southeastern Ohio Port Authority, Hosptial Facilities Revenue Bonds, Memorial Health System Obligated Group Project, Refunding and Improvement Series 2012, 6.000%, 12/01/42 | 12/22 at 100.00 | N/R | $ | 2,187,220 | ||||||||||||
| 2,830 | Wood County, Ohio, Hospital Facilities Refunding and Improvement Revenue Bonds, Wood County Hospital Project, Series 2012, 5.000%, 12/01/42 (WI/DD, Settling 12/06/12) | No Opt. Call | Baa2 | 3,050,542 | ||||||||||||||
| 74,745 | Total Health Care | 88,521,246 | ||||||||||||||||
Housing/Multifamily – 1.7% | ||||||||||||||||||
| 500 | Bowling Green, Ohio, Student Housing Revenue Bonds, CFP I LLC – Bowling Green State University Project, Series 2010, 5.750%, 6/01/31 | 6/20 at 100.00 | BBB– | 568,725 | ||||||||||||||
| 920 | Clark County, Ohio, Multifamily Housing Revenue Bonds, Church of God Retirement Home, Series 1998, 6.250%, 11/01/30 (Alternative Minimum Tax) | 5/13 at 100.00 | N/R | 784,291 | ||||||||||||||
| 1,805 | Montgomery County, Ohio, GNMA Guaranteed Multifamily Housing Revenue Bonds, Canterbury Court Project, Series 2007, 5.500%, 10/20/42 (Alternative Minimum Tax) | 10/18 at 101.00 | Aa1 | 1,983,569 | ||||||||||||||
| 1,210 | Ohio Capital Corporation for Housing, FHA-Insured Section 8 Assisted Mortgage Loan Revenue Refunding Bonds, Series 1999D, 5.950%, 2/01/23 | 2/13 at 100.00 | Aa2 | 1,212,965 | ||||||||||||||
| 2,175 | Summit County Port Authority, Ohio, Multifamily Housing Revenue Bonds, Callis Tower Apartments Project, Series 2007, 5.250%, 9/20/47 (Alternative Minimum Tax) | 9/17 at 102.00 | AA+ | 2,346,912 | ||||||||||||||
| 3,000 | Trumbull County, Ohio, Multifamily Housing Revenue Bonds, Royal Mall Apartments, Series 2007, 5.000%, 5/20/49 (Alternative Minimum Tax) | 11/17 at 102.00 | Aaa | 3,218,100 | ||||||||||||||
| 9,610 | Total Housing/Multifamily | 10,114,562 | ||||||||||||||||
Housing/Single Family – 0.3% | ||||||||||||||||||
| 130 | Ohio Housing Finance Agency, GNMA Mortgage-Backed Securities Program Residential Mortgage Revenue Bonds, Series 2006E, 4.850%, 9/01/26 (Alternative Minimum Tax) | 3/16 at 100.00 | Aaa | 136,107 | ||||||||||||||
| 360 | Ohio Housing Finance Agency, Residential Mortgage Revenue Bonds, Mortgage-Backed Securities Program, Series 2006H, 5.000%, 9/01/31 (Alternative Minimum Tax) | 9/15 at 100.00 | Aaa | 373,126 | ||||||||||||||
| 315 | Ohio Housing Finance Agency, Residential Mortgage Revenue Bonds, Mortgage-Backed Securities Program, Series 2008F, 5.450%, 9/01/33 | 3/18 at 100.00 | Aaa | 326,765 | ||||||||||||||
| 700 | Ohio Housing Finance Agency, Residential Mortgage Revenue Bonds, Mortgage-Backed Securities Program, Series 2009C, 5.200%, 9/01/29 | 9/18 at 100.00 | Aaa | 780,857 | ||||||||||||||
| 1,505 | Total Housing/Single Family | 1,616,855 | ||||||||||||||||
Industrials – 1.8% | ||||||||||||||||||
| 500 | Cleveland-Cuyahoga County Port Authority, Ohio, Common Bond Fund Revenue Bonds, Cleveland Christian Home Project, Series 2002C, 5.950%, 5/15/22 | 5/14 at 100.00 | BBB | 507,195 | ||||||||||||||
| 260 | Cleveland-Cuyahoga County Port Authority, Ohio, Development Revenue Bonds, Bond Fund Program – Columbia National Group Project, Series 2005D, 5.000%, 5/15/20 (Alternative Minimum Tax) | 11/15 at 100.00 | BBB | 265,392 | ||||||||||||||
| 1,255 | Cleveland-Cuyahoga County Port Authority, Ohio, Development Revenue Bonds, Jergens Inc., Series 1998A, 5.375%, 5/15/18 (Alternative Minimum Tax) | 5/13 at 100.00 | BBB | 1,262,179 | ||||||||||||||
| 75 | Cleveland-Cuyahoga County Port Authority, Ohio, Development Revenue Bonds, Port Cleveland Bond Fund, Series 1997A, 5.800%, 5/15/27 (Alternative Minimum Tax) | 5/13 at 100.00 | BBB | 75,312 | ||||||||||||||
Ohio State, Economic Development Revenue Bonds, Ohio Enterprise Bond Fund, Shearer’s Foods Inc. Project, Series 2009-5: | ||||||||||||||||||
| 1,455 | 5.000%, 6/01/22 | 12/19 at 100.00 | AA+ | 1,754,628 | ||||||||||||||
| 1,645 | 5.000%, 12/01/24 | 12/19 at 100.00 | AA+ | 1,943,469 | ||||||||||||||
| Nuveen Investments | 59 |
Portfolio of Investments (Unaudited)
Nuveen Ohio Municipal Bond Fund (continued)
November 30, 2012
| Principal Amount (000) | Description (1) | Optional Call Provisions (2) | Ratings (3) | Value | ||||||||||||||
Industrials (continued) | ||||||||||||||||||
Ohio, Economic Development Revenue Bonds, Enterprise Bond Fund Loan Pool, Series 2002-4: | ||||||||||||||||||
| $ | 185 | 5.000%, 6/01/15 (Alternative Minimum Tax) | 6/14 at 100.00 | AA+ | $ | 189,508 | ||||||||||||
| 675 | 5.450%, 6/01/22 (Alternative Minimum Tax) | 6/14 at 100.00 | AA+ | 690,795 | ||||||||||||||
| 1,020 | Ohio, Economic Development Revenue Bonds, Enterprise Bond Fund Loan Pool, Series 2002-7, 5.850%, 12/01/22 (Alternative Minimum Tax) | 12/12 at 100.00 | AA+ | 1,055,802 | ||||||||||||||
| 3,375 | Ohio, Solid Waste Revenue Refunding Bonds, Republic Services Inc., Project, Series 2010, 0.430%, 11/01/35 (Mandatory put 3/01/13) (WI/DD, Settling 12/03/12) | No Opt. Call | BBB | 3,375,000 | ||||||||||||||
| 10,445 | Total Industrials | 11,119,280 | ||||||||||||||||
Long-Term Care – 1.4% | ||||||||||||||||||
| 800 | Franklin County, Ohio, Healthcare Facilities Revenue Bonds, Ohio Presbyterian Retirement Services, Improvement Series 2005A, 5.000%, 7/01/26 | 7/15 at 100.00 | BBB | 824,200 | ||||||||||||||
| 1,505 | Franklin County, Ohio, Healthcare Facilities Revenue Bonds, Ohio Presbyterian Retirement Services, Improvement Series 2010A, 5.625%, 7/01/26 | 7/21 at 100.00 | BBB | 1,718,560 | ||||||||||||||
| 2,000 | Franklin County, Ohio, Healthcare Facilities Revenue Bonds, Ohio Presbyterian Retirement Services, Series 2002A, 5.125%, 7/01/22 – RAAI Insured | 1/13 at 100.00 | BBB | 2,002,880 | ||||||||||||||
| 400 | Hamilton County, Ohio, Health Care Revenue Refunding Bonds, Life Enriching Communities Project, Series 2006A, 5.000%, 1/01/27 | 1/17 at 100.00 | BBB | 420,236 | ||||||||||||||
| 3,080 | Montgomery County, Ohio, Health Care and Multifamily Housing Revenue Bonds, Saint Leonard, Refunding & improvement Series 2010, 6.625%, 4/01/40 | 4/20 at 100.00 | BBB– | 3,533,530 | ||||||||||||||
| 7,785 | Total Long-Term Care | 8,499,406 | ||||||||||||||||
Materials – 0.6% | ||||||||||||||||||
| 3,500 | Lorain County Port Authority, Ohio, Recovery Zone Facility Economic Development Revenue Bonds, United State Steel Corporation Project, Series 2010, 6.750%, 12/01/40 | 12/20 at 100.00 | BB | 3,820,355 | ||||||||||||||
Tax Obligation/General – 14.8% | ||||||||||||||||||
| 3,360 | Adams County Valley School District, Adams and Highland Counties, Ohio, Unlimited Tax School Improvement General Obligation Bonds, | No Opt. Call | BBB | 3,607,934 | ||||||||||||||
| 600 | Anthony Wayne Local School District, Lucas, Wood and Fulton Counties, Ohio, School Facilities Construction and Improvement Bonds, | No Opt. Call | Aa3 | 595,890 | ||||||||||||||
| 25 | Barberton City School District, Summit County, Ohio, General Obligation Bonds, School Improvement Series 2008, 5.250%, 12/01/31 | 6/18 at 100.00 | AA | 29,122 | ||||||||||||||
| 1,000 | Beavercreek City School District, Ohio, General Obligation Bonds, | 6/19 at 100.00 | Aa1 | 1,179,010 | ||||||||||||||
| 915 | Buckeye Valley Local School District, Ohio, Unlimited Tax General Obligation Bonds, Series 1995A, 6.850%, 12/01/15 – NPFG Insured | No Opt. Call | BBB | 990,442 | ||||||||||||||
| 1,180 | Canal Winchester Local School District, Franklin and Fairfield Counties, Ohio, General Obligation Bonds, Series 2005B, 0.000%, 12/01/33 – NPFG Insured | No Opt. Call | A1 | 529,171 | ||||||||||||||
| 2,515 | Canton City School District, Stark County, Ohio, General Obligation Bonds, Series 2005, 5.000%, 12/01/19 – NPFG Insured | 6/15 at 100.00 | A | 2,734,585 | ||||||||||||||
| 300 | Cincinnati City School District, Hamilton County, Ohio, General Obligation Bonds, School Improvement, Refunding Series 2010, 5.250%, 6/01/21 | 6/20 at 100.00 | Aa2 | 380,058 | ||||||||||||||
Cincinnati City School District, Hamilton County, Ohio, General Obligation Bonds, Series 2006: | ||||||||||||||||||
| 535 | 5.250%, 12/01/19 – FGIC Insured | No Opt. Call | AA+ | 677,037 | ||||||||||||||
| 380 | 5.250%, 12/01/27 – FGIC Insured | No Opt. Call | AA+ | 524,826 | ||||||||||||||
| 60 | Nuveen Investments |
| Principal Amount (000) | Description (1) | Optional Call Provisions (2) | Ratings (3) | Value | ||||||||||||||
Tax Obligation/General (continued) | ||||||||||||||||||
| $ | 150 | Cincinnati, Ohio, Various Purpose General Obligation Bonds, Series 2009A, 4.500%, 12/01/29 | 6/19 at 100.00 | AA+ | $ | 172,908 | ||||||||||||
| 1,000 | Clyde-Green Springs Exempt Village School District, Summit County, Ohio, General Obligation Bonds, Series 2008, 5.000%, 12/01/27 – AGM Insured | 6/18 at 100.00 | Aa2 | 1,153,620 | ||||||||||||||
| 1,000 | Columbus City School District, Franklin County, Ohio, General Obligation Bonds, Series 2006, 0.000%, 12/01/28 – AGM Insured | No Opt. Call | AA+ | 593,680 | ||||||||||||||
| 2,675 | Cuyahoga County, Ohio, General Obligation Bonds, Series 2004, 5.000%, 12/01/22 | 12/14 at 100.00 | AA+ | 2,908,474 | ||||||||||||||
| 1,345 | Cuyahoga County, Ohio, Limited Tax General Obligation Bonds, | No Opt. Call | AAA | 1,551,592 | ||||||||||||||
| 225 | Cuyahoga County, Ohio, Limited Tax General Obligation Various Purpose Refunding Bonds, Series 1993B, 5.250%, 10/01/13 | No Opt. Call | AAA | 234,088 | ||||||||||||||
| 750 | Cuyahoga Falls, Ohio, General Obligation Bonds, Various Purpose Refunding Series 2009, 4.250%, 12/01/34 | 12/17 at 100.00 | Aa2 | 818,925 | ||||||||||||||
| 1,005 | Findlay, Ohio, General Obligation Bonds, Series 2004, 5.250%, 7/01/15 – NPFG Insured | 7/14 at 100.00 | AA | 1,080,486 | ||||||||||||||
Franklin County, Ohio, General Obligation Bonds, Series 2007: | ||||||||||||||||||
| 690 | 4.500%, 12/01/27 | 12/17 at 100.00 | AAA | 788,511 | ||||||||||||||
| 3,160 | 5.000%, 12/01/28 | 12/17 at 100.00 | AAA | 3,706,964 | ||||||||||||||
| 400 | Gahanna, Ohio, General Obligation Bonds, Various Purpose Series 2007, 5.000%, 12/01/27 – NPFG Insured | 12/17 at 100.00 | Aa1 | 463,780 | ||||||||||||||
| 1,000 | Greene County, Ohio, General Obligation Bonds, General Infrastructure Series 2007, 5.250%, 12/01/26 – AMBAC Insured | 12/17 at 100.00 | Aa2 | 1,169,830 | ||||||||||||||
Highland Local School District, Morrow and Delaware Counties, Ohio, General Obligation Bonds, School Facilities Construction and Improvement Series 2008: | ||||||||||||||||||
| 100 | 0.000%, 12/01/22 | No Opt. Call | Aa2 | 76,350 | ||||||||||||||
| 1,000 | 5.375%, 12/01/33 | 12/18 at 100.00 | Aa2 | 1,196,570 | ||||||||||||||
| 1,095 | Hilliard, Ohio, General Obligation Bonds, Various Purpose Series 2012, 5.000%, 12/01/23 | 12/22 at 100.00 | Aa1 | 1,387,047 | ||||||||||||||
| 2,500 | Hubbard Exempt Village School District, Trumbull County, Ohio, General Obligation Bonds, Classroom Facilities Improvements, Series 2007, 5.000%, 12/01/34 – CIFG Insured | 6/17 at 100.00 | A+ | 2,821,875 | ||||||||||||||
Indian Creek Local School District, Jefferson County, Ohio, General Obligation Bonds, School Facilities Construction and Improvements, Series 2009: | ||||||||||||||||||
| 1,750 | 5.000%, 12/01/34 | 6/19 at 100.00 | Aa2 | 2,021,863 | ||||||||||||||
| 1,100 | 5.125%, 12/01/36 | 6/19 at 100.00 | Aa2 | 1,274,812 | ||||||||||||||
| 1,095 | Kenston Local School District, Geauga County, Ohio, General Obligation Bonds, School improvement Series 2012, 0.000%, 12/01/27 | 6/19 at 100.00 | Aa1 | 678,582 | ||||||||||||||
| 755 | Kenston Local School District, Geauga County, Ohio, General Obligation Bonds, Series 2011, 5.000%, 12/01/19 | No Opt. Call | Aa1 | 936,102 | ||||||||||||||
| 1,400 | Kent City School District, Portage County, Ohio, General Obligation Library Improvement Bonds, Series 2004, 5.000%, 12/01/20 – FGIC Insured | 12/14 at 100.00 | AA | 1,522,192 | ||||||||||||||
| 1,560 | Kettering City School District, Montgomery County, Ohio, General Obligation Bonds, Series 2007, 5.250%, 12/01/31 – AGM Insured | No Opt. Call | Aa2 | 2,011,916 | ||||||||||||||
| 185 | Kettering, Ohio, Limited Tax General Obligation Bonds, Series 1991, 6.650%, 12/01/12 | No Opt. Call | Aa2 | 185,033 | ||||||||||||||
Kings Local School District, Warren County, Ohio, General Obligation School Improvement Bonds, Series 2005: | ||||||||||||||||||
| 1,000 | 5.000%, 12/01/22 – NPFG Insured | 6/15 at 100.00 | Aaa | 1,106,340 | ||||||||||||||
| 1,480 | 5.000%, 12/01/24 – NPFG Insured | 6/15 at 100.00 | Aaa | 1,630,383 | ||||||||||||||
| 450 | Lake County, Ohio, Limited Tax Sewer District Improvement Bonds, Series 2000, 5.600%, 12/01/20 | No Opt. Call | Aa1 | 536,364 | ||||||||||||||
| Nuveen Investments | 61 |
Portfolio of Investments (Unaudited)
Nuveen Ohio Municipal Bond Fund (continued)
November 30, 2012
| Principal Amount (000) | Description (1) | Optional Call Provisions (2) | Ratings (3) | Value | ||||||||||||||
Tax Obligation/General (continued) | ||||||||||||||||||
| $ | 1,725 | Lakewood City School District, Cuyahoga County, Ohio, General Obligation Bonds, Series 2007, 5.000%, 12/01/30 – FGIC Insured | 12/17 at 100.00 | Aa2 | $ | 1,973,642 | ||||||||||||
| 1,000 | Lorain, Ohio, General Obligation Bonds, Pellet Terminal Improvement Series 2008, 6.750%, 12/01/28 – AMBAC Insured | 12/12 at 100.00 | A3 | 1,209,180 | ||||||||||||||
| 2,380 | Lucas County, Ohio, General Obligation Bonds, Various Purpose | 10/18 at 100.00 | Aa2 | 2,689,852 | ||||||||||||||
| 1,855 | Marysville Exempted School District, Union County, Ohio, General Obligation Bonds, Series 2006, 5.000%, 12/01/24 – AGM Insured | 12/15 at 100.00 | AA– | 2,066,878 | ||||||||||||||
| 1,000 | Mason City School District, Counties of Warren and Butler, Ohio, General Obligation Bonds, Series 2007, 5.000%, 12/01/31 | 6/17 at 100.00 | Aaa | 1,146,390 | ||||||||||||||
| 1,000 | Maumee City School District, Lucas County, Ohio, General Obligation Bonds, Capital Apprication Refunding Series 2012, 0.000%, 12/01/23 | No Opt. Call | AA– | 751,040 | ||||||||||||||
| 1,000 | Milford Exempted Village School District, Ohio, General Obligation Bonds, Series 2008, 5.250%, 12/01/36 | 12/18 at 100.00 | Aa3 | 1,147,780 | ||||||||||||||
| 1,265 | Monroe Local School District, Butler County, Ohio, General Obligation Bonds, Series 2002, 5.750%, 12/01/20 – AMBAC Insured | No Opt. Call | A2 | 1,586,335 | ||||||||||||||
| 275 | Napoleon City School District, Henry County, Ohio, General Obligation Bonds, Facilities Construction & Improvement Series 2012, 5.000%, 12/01/36 | 6/22 at 100.00 | Aa3 | 320,059 | ||||||||||||||
| 1,585 | New Albany, Ohio, General Obligation Bonds, Series 2012, 5.000%, 12/01/29 | 6/22 at 100.00 | Aa1 | 1,953,750 | ||||||||||||||
| 530 | Newark, Ohio, General Obligation Bonds, Storm Sewer Improvement Series 2009, 5.500%, 12/01/34 | 12/19 at 100.00 | Aa3 | 635,518 | ||||||||||||||
Oak Hills Local School District, Hamilton County, Ohio, General Obligation Bonds, Refunding Series 2005: | ||||||||||||||||||
| 3,740 | 5.000%, 12/01/23 – AGM Insured | 12/15 at 100.00 | AA– | 4,148,445 | ||||||||||||||
| 500 | 5.000%, 12/01/24 – AGM Insured | 12/15 at 100.00 | AA– | 553,510 | ||||||||||||||
| 1,000 | 5.000%, 12/01/25 – AGM Insured | 12/15 at 100.00 | AA– | 1,107,020 | ||||||||||||||
| 925 | Oakwood City School District, Montgomery County, Ohio, General Obligation Bonds, Series 2012, 0.000%, 12/01/21 | No Opt. Call | Aa2 | 744,486 | ||||||||||||||
| 3,280 | Ohio State, General Obligation Bonds, Refunding Common Schools | No Opt. Call | AA+ | 4,315,004 | ||||||||||||||
| 1,845 | Ohio, General Obligation Bonds, Infrastructure Improvement Series 2005A, 5.000%, 9/01/16 | 3/15 at 100.00 | AA+ | 2,031,493 | ||||||||||||||
| 1,000 | Ohio, General Obligation Bonds, Infrastructure Improvements, Refunding Series 2002A, 5.500%, 2/01/20 | No Opt. Call | AA+ | 1,292,390 | ||||||||||||||
| 1,000 | Olmsted Falls City School District, Cuyahoga County, Ohio, General Obligation Bonds, Series 2007, 5.000%, 12/01/35 – SYNCORA GTY Insured | 6/17 at 100.00 | A+ | 1,127,920 | ||||||||||||||
| 1,500 | Pettisville Local School District, Fulton County, Ohio, General Obligation Bonds, School Facilities Construction and Improvement Bonds, | 6/19 at 100.00 | Aa2 | 1,727,175 | ||||||||||||||
| 600 | Saint Marys City School District, Auglaize County, Ohio, General Obligation Bonds, School Facilities Construction and Improvement, Series 2008, 5.000%, 12/01/28 – AGM Insured | 6/18 at 100.00 | Aa2 | 678,150 | ||||||||||||||
| 755 | Sidney City School District, Shelby County, Ohio, General Obligation Bonds, Refunding Series 2007, 4.375%, 12/01/27 – FGIC Insured | 12/17 at 100.00 | Aa3 | 826,053 | ||||||||||||||
| 1,710 | South Euclid, Ohio, General Obligation Bonds, Real Estate Acquisition and Urban Redevelopment, Series 2012, 5.000%, 6/01/32 | 6/22 at 100.00 | Aa2 | 2,062,380 | ||||||||||||||
| 30 | Strongsville, Ohio, Limited Tax General Obligation Various Purpose Improvement Bonds, Series 1996, 5.950%, 12/01/21 | 12/12 at 100.00 | Aaa | 30,139 | ||||||||||||||
| 3,435 | Summit County, Ohio, General Obligation Bonds, Series 2002R, 5.500%, 12/01/21 – FGIC Insured | No Opt. Call | Aa1 | 4,535,814 | ||||||||||||||
| 62 | Nuveen Investments |
| Principal Amount (000) | Description (1) | Optional Call Provisions (2) | Ratings (3) | Value | ||||||||||||||
Tax Obligation/General (continued) | ||||||||||||||||||
| $ | 1,300 | Sylvania City School District, Lucas County, Ohio, General Obligation Bonds, School Improvement Series 1995, 5.250%, 12/01/36 – AGC Insured | 6/17 at 100.00 | Aa2 | $ | 1,485,523 | ||||||||||||
| 735 | Symmes Township, Hamilton County, Ohio, General Obligation Bonds, Parkland Acquistion & Improvment Series 2010, 5.250%, 12/01/37 | 12/20 at 100.00 | Aa1 | 891,165 | ||||||||||||||
| 1,000 | Vandalia Butler City School District, Montgomery County, Ohio, General Obligation Bonds, School Improvment Series 2009, 5.125%, 12/01/37 | 6/19 at 100.00 | AA | 1,134,550 | ||||||||||||||
| 500 | Wadsworth City School District, Medina County, Ohio, General Obligation Bonds, School Improvement Series 2009, 5.000%, 12/01/37 – AGC Insured | 12/17 at 100.00 | AA– | 558,315 | ||||||||||||||
| 2,000 | West Clermont Local School District, Clermont County, Ohio, General Obligation Bonds, Series 2008, 5.000%, 12/01/31 – AGM Insured | 12/18 at 100.00 | AA– | 2,350,780 | ||||||||||||||
| 80,150 | Total Tax Obligation/General | 90,357,098 | ||||||||||||||||
Tax Obligation/Limited – 17.3% | ||||||||||||||||||
Blue Ash, Ohio, Tax Increment Financing Revenue Bonds, Duke Realty Ohio, Series 2006: | ||||||||||||||||||
| 950 | 5.000%, 12/01/25 | 12/16 at 102.00 | N/R | 1,006,297 | ||||||||||||||
| 1,165 | 5.000%, 12/01/30 | 12/16 at 102.00 | N/R | 1,214,944 | ||||||||||||||
| 650 | 5.000%, 12/01/35 | 12/16 at 102.00 | N/R | 671,593 | ||||||||||||||
| 1,150 | Cincinnati, Ohio, Economic Development Revenue Bonds, Keystone Parke Project, Series 2008A, 5.000%, 11/01/38 | 11/13 at 102.00 | AA | 1,212,560 | ||||||||||||||
| 2,600 | Cleveland-Cuyahoga County Port Authority, Ohio, Development Revenue Bonds, R.I.T.A. Project, Series 2004, 5.000%, 11/15/19 – RAAI Insured | 11/14 at 100.00 | A– | 2,725,320 | ||||||||||||||
Columbiana Exempted Village School District, Columbiana County, Ohio, Certificates of Participation, Series 2010: | ||||||||||||||||||
| 1,400 | 5.000%, 12/01/26 – AGM Insured | 12/20 at 100.00 | AA– | 1,646,330 | ||||||||||||||
| 1,645 | 5.000%, 12/01/28 – AGM Insured | 12/20 at 100.00 | AA– | 1,930,539 | ||||||||||||||
| 5,000 | Columbus Metropolitan Library, Franklin County, Ohio, Special Obligation Library Fund Facilities Notes, Series 2012-1, 4.000%, 12/01/37 (WI/DD, Settling 12/04/12) | No Opt. Call | Aa2 | 5,344,200 | ||||||||||||||
Columbus-Franklin County Finance Authority, Ohio, Development Revenue Bonds, Hubbard Avenue Parking Facility Project, Series 2012A: | ||||||||||||||||||
| 500 | 4.500%, 12/01/27 | 12/19 at 100.00 | BBB | 514,735 | ||||||||||||||
| 685 | 5.000%, 12/01/32 | 12/19 at 100.00 | BBB | 711,420 | ||||||||||||||
| 555 | 5.000%, 12/01/36 | 12/19 at 100.00 | BBB | 570,335 | ||||||||||||||
Cuyhoga County, Ohio, Recovery Zone Facility Economic Development Revenue Bonds, Medical Mart- Convention Center Project, Series 2010F: | ||||||||||||||||||
| 2,710 | 5.250%, 12/01/25 | 12/20 at 100.00 | AA | 3,284,032 | ||||||||||||||
| 3,250 | 5.000%, 12/01/27 | 12/20 at 100.00 | AA | 3,829,540 | ||||||||||||||
| 1,700 | Delaware County District Library, Delaware, Franklin, Marion, Morrow and Union Counties, Ohio, Library Fund Library Facilities Special Obligation Notes, Series 2009, 5.000%, 12/01/34 | 12/19 at 100.00 | Aa2 | 1,960,270 | ||||||||||||||
| 5,615 | Franklin County Convention Facilities Authority, Ohio, Excise Tax and Lease Revenue Anticipation Bonds, Series 2005, 5.000%, 12/01/25 – AMBAC Insured | 12/15 at 100.00 | Aaa | 6,282,904 | ||||||||||||||
Franklin County Convention Facilities Authority, Ohio, Excise Tax and Lease Revenue Refunding Anticipation Bonds, Series 2007: | ||||||||||||||||||
| 2,215 | 5.000%, 12/01/26 | 12/17 at 100.00 | Aaa | 2,610,112 | ||||||||||||||
| 2,000 | 5.000%, 12/01/27 | 12/17 at 100.00 | Aaa | 2,356,760 | ||||||||||||||
| 2,875 | Government of Guam, Business Privilege Tax Bonds, Series 2011A, 5.125%, 1/01/42 | 1/22 at 100.00 | A | 3,287,563 | ||||||||||||||
Government of Guam, Business Privilege Tax Bonds, Series 2012B-1: | ||||||||||||||||||
| 3,285 | 5.000%, 1/01/29 | 1/22 at 100.00 | A | 3,819,667 | ||||||||||||||
| 1,220 | 5.000%, 1/01/42 | 1/22 at 100.00 | A | 1,383,175 | ||||||||||||||
| Nuveen Investments | 63 |
Portfolio of Investments (Unaudited)
Nuveen Ohio Municipal Bond Fund (continued)
November 30, 2012
| Principal Amount (000) | Description (1) | Optional Call Provisions (2) | Ratings (3) | Value | ||||||||||||||
Tax Obligation/Limited (continued) | ||||||||||||||||||
| $ | 1,670 | Greater Cleveland Regional Transit Authority, Ohio, General Obligation Bonds, Capital Improvement Refunding Series 2004, 5.000%, 12/01/17 – NPFG Insured | 12/14 at 100.00 | Aa2 | $ | 1,806,322 | ||||||||||||
Hamilton County Convention Facilities Authority, Ohio, First Lien Revenue Bonds, Series 2004: | ||||||||||||||||||
| 2,300 | 5.000%, 12/01/20 – FGIC Insured | 6/14 at 100.00 | A+ | 2,431,054 | ||||||||||||||
| 2,535 | 5.000%, 12/01/22 – FGIC Insured | 6/14 at 100.00 | A+ | 2,682,588 | ||||||||||||||
| 5,800 | Hamilton County, Ohio, Sales Tax Bonds, Subordinate Lien, Series 2006A, 5.000%, 12/01/32 – AMBAC Insured | 12/16 at 100.00 | A+ | 6,465,434 | ||||||||||||||
Hamilton County, Ohio, Sales Tax Bonds, Subordinate Series 2000B: | ||||||||||||||||||
| 500 | 0.000%, 12/01/26 – AMBAC Insured | No Opt. Call | A2 | 294,950 | ||||||||||||||
| 3,300 | 0.000%, 12/01/28 – AMBAC Insured | No Opt. Call | A+ | 1,771,638 | ||||||||||||||
| 1,750 | 0.000%, 12/01/28 – AGM Insured | No Opt. Call | AA– | 960,383 | ||||||||||||||
Hamilton County, Ohio, Sales Tax Revenue Bonds, Refunding Series 2011A: | ||||||||||||||||||
| 1,235 | 5.000%, 12/01/25 | 12/21 at 100.00 | A+ | 1,469,045 | ||||||||||||||
| 5,375 | 5.000%, 12/01/31 | 12/21 at 100.00 | A+ | 6,224,519 | ||||||||||||||
| 2,750 | Hudson City School District, Ohio, Certificates of Participation, Series 2012, 4.000%, 6/01/34 – NPFG Insured | 6/22 at 100.00 | Aa3 | 2,914,918 | ||||||||||||||
| 475 | Mahoning Career and Technology Center, Ohio, Certificate of Participation, Series 2009B, 4.750%, 12/01/36 | 12/17 at 100.00 | AA– | 523,203 | ||||||||||||||
Mayfield City School District, Ohio, Certificates of Participation, Middle School Project, Series 2009B: | ||||||||||||||||||
| 435 | 0.000%, 9/01/27 | No Opt. Call | Aa2 | 262,053 | ||||||||||||||
| 855 | 0.000%, 9/01/28 | No Opt. Call | Aa2 | 490,787 | ||||||||||||||
| 2,635 | 5.000%, 9/01/31 | 9/19 at 100.00 | Aa2 | 2,984,981 | ||||||||||||||
| 2,015 | Milton Union Exempt Village School District, Ohio, Special Limited Obligation Bonds, Series 2009, 5.000%, 12/01/32 | 12/19 at 100.00 | A+ | 2,315,134 | ||||||||||||||
New Albany Community Authority, Ohio, Community Facilities Revenue Refunding Bonds, Series 2012C: | ||||||||||||||||||
| 1,100 | 5.000%, 10/01/23 | 10/22 at 100.00 | A1 | 1,347,049 | ||||||||||||||
| 110 | 5.000%, 10/01/24 | 10/22 at 100.00 | A1 | 133,045 | ||||||||||||||
| 1,900 | Ohio State Building Authority, State Facilities Bonds, Administrative Building Fund Projects, Series 2005A, 5.000%, 4/01/25 – AGM Insured | 4/15 at 100.00 | AA | 2,091,444 | ||||||||||||||
| 3,135 | Ohio State Building Authority, State Facilities Bonds, Adult Correctional Building Fund Project, Series 2005A, 5.000%, 4/01/23 – AGM Insured | 4/15 at 100.00 | AA | 3,453,955 | ||||||||||||||
Ohio, State Appropriation Lease Bonds, Parks and Recreation Capital Facilities, Series 2005A-II: | ||||||||||||||||||
| 1,000 | 5.250%, 2/01/19 – AGM Insured | 2/15 at 100.00 | AA | 1,101,010 | ||||||||||||||
| 1,000 | 5.250%, 2/01/20 – AGM Insured | 2/15 at 100.00 | AA | 1,101,010 | ||||||||||||||
| 11,900 | Puerto Rico Sales Tax Financing Corporation, Sales Tax Revenue Bonds, First Subordinate Series 2009A, 0.000%, 8/01/34 | No Opt. Call | A+ | 3,788,722 | ||||||||||||||
Puerto Rico Sales Tax Financing Corporation, Sales Tax Revenue Bonds, First Subordinate Series 2010A: | ||||||||||||||||||
| 400 | 0.000%, 8/01/35 | No Opt. Call | A+ | 118,372 | ||||||||||||||
| 500 | 5.375%, 8/01/39 | 2/20 at 100.00 | A+ | 542,945 | ||||||||||||||
| 5,000 | 5.500%, 8/01/42 | 2/20 at 100.00 | A+ | 5,425,900 | ||||||||||||||
| 18,000 | Puerto Rico Sales Tax Financing Corporation, Sales Tax Revenue Bonds, Series 2007A, 0.000%, 8/01/44 – NPFG Insured | No Opt. Call | AA– | 3,278,880 | ||||||||||||||
| 400 | Riversouth Authority, Ohio, Lazarus Building Redevelopment Bonds, Series 2007A, 5.750%, 12/01/27 | 12/17 at 100.00 | N/R | 413,652 | ||||||||||||||
Riversouth Authority, Ohio, Riversouth Area Redevelopment Bonds, Refunding Series 2012A: | ||||||||||||||||||
| 1,400 | 5.000%, 12/01/23 | 12/22 at 100.00 | AA+ | 1,744,834 | ||||||||||||||
| 800 | 5.000%, 12/01/24 | 12/22 at 100.00 | AA+ | 987,040 | ||||||||||||||
| 121,445 | Total Tax Obligation/Limited | 105,487,163 | ||||||||||||||||
| 64 | Nuveen Investments |
| Principal Amount (000) | Description (1) | Optional Call Provisions (2) | Ratings (3) | Value | ||||||||||||||
Transportation – 4.7% | ||||||||||||||||||
Cleveland, Ohio, Airport System Revenue Bonds, Series 2012A: | ||||||||||||||||||
| $ | 5,000 | 5.000%, 1/01/30 | 1/22 at 100.00 | A– | $ | 5,805,150 | ||||||||||||
| 3,450 | 5.000%, 1/01/31 – AGM Insured | 1/22 at 100.00 | AA– | 4,032,498 | ||||||||||||||
| 2,000 | 5.000%, 1/01/31 | 1/22 at 100.00 | A– | 2,325,520 | ||||||||||||||
| 1,000 | Columbus Regional Airport Authority, Ohio, Revenue Bonds, Refunding Series 2007, 5.000%, 1/01/28 – NPFG Insured | 1/17 at 100.00 | A+ | 1,129,930 | ||||||||||||||
Dayton, Ohio, Airport Revenue Bonds, James M. Cox International Airport, Series 2003C: | ||||||||||||||||||
| 1,025 | 5.250%, 12/01/27 – RAAI Insured (Alternative Minimum Tax) | 12/13 at 100.00 | A– | 1,045,070 | ||||||||||||||
| 1,000 | 5.350%, 12/01/32 – RAAI Insured (Alternative Minimum Tax) | 12/13 at 100.00 | A– | 1,014,220 | ||||||||||||||
| 10,000 | Ohio Turnpike Commission, Revenue Refunding Bonds, Series 1998A, 5.500%, 2/15/24 – FGIC Insured | No Opt. Call | AA | 13,150,100 | ||||||||||||||
| 23,475 | Total Transportation | 28,502,488 | ||||||||||||||||
U.S. Guaranteed – 14.2% (5) | ||||||||||||||||||
| 5,690 | Akron, Ohio, Income Tax Revenue Bonds, Community Learning Centers, Series 2004A, 5.000%, 12/01/33 (Pre-refunded 12/01/13) – FGIC Insured | 12/13 at 100.00 | AA+ (5) | 5,958,853 | ||||||||||||||
| 3,590 | Canal Winchester Local School District, Franklin and Fairfield Counties, Ohio, General Obligation Bonds, Series 2005B, 5.000%, 12/01/27 (Pre-refunded 6/01/15) – NPFG Insured | 6/15 at 100.00 | A1 (5) | 3,996,819 | ||||||||||||||
| 2,295 | Central Ohio Solid Waste Authority, General Obligation Bonds, Series 2004A, 5.000%, 12/01/15 (Pre-refunded 6/01/14) – AMBAC Insured | 6/14 at 100.00 | AAA | 2,457,234 | ||||||||||||||
| 4,090 | Cleveland State University, Ohio, General Receipts Bonds, Series 2003A, 5.000%, 6/01/23 (Pre-refunded 6/01/13) – FGIC Insured | 6/13 at 100.00 | A+ (5) | 4,187,669 | ||||||||||||||
| 1,380 | Columbus, Ohio, Tax Increment Financing Bonds, Easton Project, Series 2004A, 5.000%, 12/01/25 (Pre-refunded 6/01/14) – AMBAC Insured | 6/14 at 100.00 | BBB+ (5) | 1,430,301 | ||||||||||||||
Cuyahoga County, Ohio, Revenue Refunding Bonds, Cleveland Clinic Health System, Series 2003A: | ||||||||||||||||||
| 1,990 | 6.000%, 1/01/32 (Pre-refunded 7/01/13) | 7/13 at 100.00 | Aa2 (5) | 2,056,904 | ||||||||||||||
| 1,910 | 6.000%, 1/01/32 (Pre-refunded 7/01/13) | 7/13 at 100.00 | Aa2 (5) | 1,974,214 | ||||||||||||||
| 1,245 | Cuyahoga Falls, Ohio, General Obligation Bonds, Series 2004, 5.000%, 12/01/18 (Pre-refunded 6/01/14) – NPFG Insured | 6/14 at 100.00 | Aa2 (5) | 1,332,611 | ||||||||||||||
| 1,235 | Dayton, Ohio, Airport Revenue Bonds, James M. Cox International Airport, Series 2005B, 5.000%, 12/01/14 – SYNCORA GTY Insured (ETM) | No Opt. Call | A– (5) | 1,349,830 | ||||||||||||||
| 1,170 | Dayton, Ohio, General Obligation Bonds, Series 2004, 5.250%, 12/01/15 (Pre-refunded 6/01/14) – AMBAC Insured | 6/14 at 100.00 | Aa2 (5) | 1,256,720 | ||||||||||||||
| 1,000 | Fairview Park, Ohio, General Obligation Bonds, Series 2005, 5.000%, 12/01/25 (Pre-refunded 12/01/15) – NPFG Insured | 12/15 at 100.00 | Aa2 (5) | 1,136,200 | ||||||||||||||
| 2,140 | Greater Cleveland Regional Transit Authority, Ohio, General Obligation Bonds, Capital Improvement Refunding Series 2004, 5.000%, 12/01/17 (Pre-refunded 12/01/14) – NPFG Insured | 12/14 at 100.00 | Aa2 (5) | 2,338,977 | ||||||||||||||
| 1,775 | Hebron, Ohio, Mortgage Revenue Bonds, Waterworks System Improvements, Series 2004, 5.875%, 12/01/25 (Pre-refunded 6/01/14) | 6/14 at 100.00 | N/R (5) | 1,923,177 | ||||||||||||||
| 1,270 | Kenston Local School District, Geauga County, Ohio, General Obligation Bonds, Series 2003, 5.000%, 12/01/23 (Pre-refunded 6/01/13) – NPFG Insured | 6/13 at 100.00 | Aa1 (5) | 1,300,518 | ||||||||||||||
| 1,260 | Lancaster, Ohio, Wastewater System Improvement Revenue Bonds, Series 2004, 5.000%, 12/01/25 (Pre-refunded 12/01/14) – AMBAC Insured | 12/14 at 100.00 | N/R (5) | 1,373,702 | ||||||||||||||
| 5,610 | Montgomery County, Ohio, Revenue Bonds, Catholic Health Initiatives, Series 2001, 5.375%, 9/01/21 (ETM) | 9/21 at 100.00 | Aa3 (5) | 5,633,955 | ||||||||||||||
Ohio Higher Education Facilities Commission, General Revenue Bonds, Case Western Reserve University, Series 2004A: | ||||||||||||||||||
| 2,310 | 5.000%, 12/01/16 (Pre-refunded 12/01/13) – AMBAC Insured | 12/13 at 100.00 | AA– (5) | 2,417,946 | ||||||||||||||
| 2,825 | 5.000%, 12/01/17 (Pre-refunded 12/01/13) – AMBAC Insured | 12/13 at 100.00 | AA– (5) | 2,957,012 | ||||||||||||||
| 2,975 | 5.000%, 12/01/18 (Pre-refunded 12/01/13) – AMBAC Insured | 12/13 at 100.00 | AA– (5) | 3,114,022 | ||||||||||||||
| Nuveen Investments | 65 |
Portfolio of Investments (Unaudited)
Nuveen Ohio Municipal Bond Fund (continued)
November 30, 2012
| Principal Amount (000) | Description (1) | Optional Call Provisions (2) | Ratings (3) | Value | ||||||||||||||
U.S. Guaranteed (5) (continued) | ||||||||||||||||||
| $ | 1,650 | Ohio State Higher Educational Facilities Commission, Hospital Revenue Bonds, University Hospitals Health System, Series 2009, 6.750%, 1/15/39 (Pre-refunded 1/15/15) | 1/15 at 100.00 | A (5) | $ | 1,869,698 | ||||||||||||
| 1,855 | Ohio University at Athens, Subordinate Lien General Receipts Bonds, Series 2004, 5.000%, 12/01/21 (Pre-refunded 6/01/14) – NPFG Insured | 6/14 at 100.00 | Aa3 (5) | 1,984,665 | ||||||||||||||
| 2,670 | Ohio Water Development Authority, Loan Revenue Bonds, Pure Water Development, Series 1990I, 6.000%, 12/01/16 – AMBAC Insured (ETM) | No Opt. Call | Aaa | 2,923,970 | ||||||||||||||
| 530 | Ohio Water Development Authority, Revenue Bonds, Drinking Water Assistance Fund, State Match, Series 2008, 5.000%, 6/01/28 (Pre-refunded 6/01/18) – AGM Insured | 6/18 at 100.00 | AAA | 649,987 | ||||||||||||||
Ohio Water Development Authority, Water Pollution Control Loan Fund Revenue Bonds, Water Quality Project, Series 2005B: | ||||||||||||||||||
| 1,000 | 5.000%, 6/01/25 (Pre-refunded 6/01/15) | 6/15 at 100.00 | AAA | 1,113,320 | ||||||||||||||
| 645 | 5.000%, 6/01/25 (Pre-refunded 6/01/15) | 6/15 at 100.00 | AAA | 718,091 | ||||||||||||||
| 730 | Ohio, General Obligation Bonds, Common Schools, Series 2004B, 5.000%, 3/15/21 (Pre-refunded 3/15/14) | 3/14 at 100.00 | AA+ (5) | 774,202 | ||||||||||||||
| 6,055 | Ohio, General Obligation Bonds, Infrastructure Improvements, Series 2003F, 5.000%, 2/01/22 (Pre-refunded 2/01/13) | 2/13 at 100.00 | AA+ (5) | 6,104,227 | ||||||||||||||
| 1,490 | Ohio, State Appropriation Lease Bonds, Mental Health Capital Facilities, Series 2003B-II, 5.000%, 6/01/16 (Pre-refunded 6/01/13) | 6/13 at 100.00 | AA (5) | 1,525,805 | ||||||||||||||
| 1,000 | Ohio, State Appropriation Lease Bonds, Parks and Recreation Capital Facilities, Series 2004A-II, 5.000%, 12/01/15 (Pre-refunded 12/01/13) | 12/13 at 100.00 | AA (5) | 1,047,560 | ||||||||||||||
Olentangy Local School District, Delaware and Franklin Counties, Ohio, General Obligation Bonds, Series 2004A: | ||||||||||||||||||
| 400 | 5.250%, 12/01/21 (Pre-refunded 6/01/14) – FGIC Insured | 6/14 at 100.00 | AA+ (5) | 429,460 | ||||||||||||||
| 3,055 | 5.250%, 12/01/22 (Pre-refunded 6/01/14) – FGIC Insured | 6/14 at 100.00 | AA+ (5) | 3,280,001 | ||||||||||||||
| 1,495 | Otsego Local School District, Wood, Henry and Lucas Counties, Ohio, General Obligation Bonds, Series 2004, 5.375%, 12/01/22 (Pre-refunded 12/01/14) – AGM Insured | 12/14 at 100.00 | Aa3 (5) | 1,645,816 | ||||||||||||||
| 1,545 | Puerto Rico Electric Power Authority, Power Revenue Refunding Bonds, Series 1989O, 0.000%, 7/01/17 (ETM) | No Opt. Call | AA+ (5) | 1,380,118 | ||||||||||||||
| 1,000 | Riversouth Authority, Ohio, Riversouth Area Redevelopment Bonds, Series 2004A, 5.250%, 12/01/17 (Pre-refunded 6/01/14) | 6/14 at 100.00 | AA+ (5) | 1,073,650 | ||||||||||||||
| 3,315 | South Point Local School District, Lawrence County, Ohio, General Obligation Bonds, Series 2004, 5.000%, 12/01/24 (Pre-refunded 12/01/14) – AGM Insured | 12/14 at 100.00 | AA (5) | 3,623,229 | ||||||||||||||
| 1,185 | Sugarcreek Local School District, Athens County, Ohio, General Obligation Bonds, Series 2003, 5.250%, 12/01/24 (Pre-refunded 12/01/13) – NPFG Insured | 12/13 at 100.00 | N/R (5) | 1,244,570 | ||||||||||||||
| 3,755 | Toledo City School District, Lucas County, Ohio, General Obligation Bonds, Series 2003B, 5.000%, 12/01/22 (Pre-refunded 12/01/13) – FGIC Insured | 12/13 at 100.00 | Aa2 (5) | 3,930,471 | ||||||||||||||
West Chester Township, Butler County, Ohio, General Obligation Bonds, Series 2003: | ||||||||||||||||||
| 1,365 | 5.250%, 12/01/19 (Pre-refunded 12/01/13) – NPFG Insured | 12/13 at 100.00 | Aaa | 1,433,767 | ||||||||||||||
| 1,515 | 5.250%, 12/01/21 (Pre-refunded 12/01/13) – NPFG Insured | 12/13 at 100.00 | Aaa | 1,591,324 | ||||||||||||||
| 82,015 | Total U.S. Guaranteed | 86,540,595 | ||||||||||||||||
Utilities – 7.5% | ||||||||||||||||||
American Municipal Power Ohio Inc., General Revenue Bonds, Prairie State Energy Campus Project Series 2008A: | ||||||||||||||||||
| 1,000 | 5.000%, 2/15/31 | 2/18 at 100.00 | A1 | 1,143,660 | ||||||||||||||
| 5,000 | 5.250%, 2/15/43 | 2/18 at 100.00 | A1 | 5,676,300 | ||||||||||||||
| 1,535 | Cleveland Public Power System, Ohio, First Mortgage Improvement Revenue Bonds, Series 1994A, 0.000%, 11/15/13 – NPFG Insured | No Opt. Call | A2 | 1,520,832 | ||||||||||||||
| 66 | Nuveen Investments |
| Principal Amount (000) | Description (1) | Optional Call Provisions (2) | Ratings (3) | Value | ||||||||||||||
Utilities (contiued) | ||||||||||||||||||
Cleveland, Ohio, Public Power System Revenue Bonds, Series 2008B: | ||||||||||||||||||
| $ | 4,740 | 0.000%, 11/15/34 – NPFG Insured | No Opt. Call | A2 | $ | 1,848,363 | ||||||||||||
| 2,000 | 5.000%, 11/15/38 – NPFG Insured | 5/18 at 100.00 | A2 | 2,227,040 | ||||||||||||||
| 7,500 | 0.000%, 11/15/38 – NPFG Insured | No Opt. Call | A2 | 2,353,500 | ||||||||||||||
| 1,000 | Hamilton, Ohio, Electric System Revenue Bonds, Refunding Series 2002A, 4.300%, 10/15/16 – AGM Insured | 10/15 at 101.00 | Aa3 | 1,109,650 | ||||||||||||||
| 1,800 | Ohio Air Quality Development Authority, Air Quality Revenue Refunding Bonds, Columbus Southern Power Company Project, Series 2009B, 5.800%, 12/01/38 (Mandatory put 12/01/19) | No Opt. Call | Baa1 | 2,095,830 | ||||||||||||||
| 500 | Ohio Air Quality Development Authority, Ohio, Pollution Control Revenue Refunding Bonds, FirstEnergy Generation Corp. Project, Series 2010A, 3.375%, 7/01/33 (Mandatory put 7/01/15) | No Opt. Call | BBB– | 518,455 | ||||||||||||||
| 500 | Ohio Air Quality Development Authority, Ohio, Revenue Bonds, FirstEnergy Generation Corp. Project, Series 2009A, 5.700%, 8/01/20 | No Opt. Call | BBB– | 604,420 | ||||||||||||||
| 4,400 | Ohio Air Quality Development Authority, Ohio, Revenue Bonds, Ohio Valley Electric Corporation Project, Series 2009E, 5.625%, 10/01/19 | No Opt. Call | BBB– | 5,340,588 | ||||||||||||||
Ohio Municipal Electric Generation Agency, Beneficial Interest Certificates, Belleville Hydroelectric Project – Joint Venture 5, Series 2004: | ||||||||||||||||||
| 1,000 | 5.000%, 2/15/20 – AMBAC Insured | 2/14 at 100.00 | A1 | 1,052,840 | ||||||||||||||
| 5,450 | 5.000%, 2/15/21 – AMBAC Insured | 2/14 at 100.00 | A1 | 5,734,545 | ||||||||||||||
| 1,640 | 5.000%, 2/15/22 – AMBAC Insured | 2/14 at 100.00 | A1 | 1,726,658 | ||||||||||||||
| 3,295 | 5.000%, 2/15/23 – AMBAC Insured | 2/14 at 100.00 | A1 | 3,462,946 | ||||||||||||||
| 4,285 | Ohio Water Development Authority, Pollution Control Revenue Refunding Bonds, FirstEnergy Nuclear Generating Corporation Project, Series 2010B, 2.200%, 6/01/33 (Mandatory put 6/01/16) | No Opt. Call | BBB– | 4,304,880 | ||||||||||||||
| 400 | Puerto Rico Electric Power Authority, Power Revenue Bonds, Series WW, 5.375%, 7/01/23 | 7/18 at 100.00 | BBB+ | 436,574 | ||||||||||||||
| 4,460 | Puerto Rico Industrial, Tourist, Educational, Medical and Environmental Control Facilities Financing Authority, Co-Generation Facility Revenue Bonds, Series 2000A, 6.625%, 6/01/26 (Alternative Minimum Tax) | 6/13 at 100.00 | Ba1 | 4,478,507 | ||||||||||||||
| 50,505 | Total Utilities | 45,635,588 | ||||||||||||||||
Water and Sewer – 7.6% | ||||||||||||||||||
| 1,390 | Akron, Ohio, Waterworks System Mortgage Revenue Improvement and Refunding Bonds, Series 2009, 5.000%, 3/01/34 – AGC Insured | 3/19 at 100.00 | Aa3 | 1,547,779 | ||||||||||||||
| 1,730 | Butler County, Ohio, Sewerage System Revenue Bonds, Series 2005, 5.000%, 12/01/23 – AGM Insured | No Opt. Call | Aa3 | 2,161,739 | ||||||||||||||
| 4,355 | Cincinnati, Ohio, Water System Revenue Bonds, Series 2007B, 5.000%, 12/01/32 | 12/17 at 100.00 | AAA | 5,054,849 | ||||||||||||||
| 865 | City of Marysville, Ohio, Water System Mortgage Revenue Bonds, Series 2007, 5.000%, 12/01/32 – AMBAC Insured | 12/17 at 100.00 | A1 | 989,681 | ||||||||||||||
Cleveland, Ohio, Water Revenue Bonds, Second Lien Series 2012A: | ||||||||||||||||||
| 1,500 | 5.000%, 1/01/24 | 1/22 at 100.00 | Aa2 | 1,884,210 | ||||||||||||||
| 775 | 5.000%, 1/01/26 | 1/22 at 100.00 | Aa2 | 951,739 | ||||||||||||||
| 1,000 | 5.000%, 1/01/27 | 1/22 at 100.00 | Aa2 | 1,219,770 | ||||||||||||||
| 10,330 | Cleveland, Ohio, Waterworks First Mortgage Revenue Refunding and Improvement Bonds, Series 1993G, 5.500%, 1/01/21 – NPFG Insured | No Opt. Call | Aa1 | 13,369,603 | ||||||||||||||
| 930 | Hamilton County, Ohio, Sewer System Revenue and Improvement Bonds, Metropolitan Sewer District of Greater Cincinnati, Series 2006A, 5.000%, 12/01/26 – NPFG Insured | 12/16 at 100.00 | AA+ | 1,063,715 | ||||||||||||||
| 450 | Ironton, Ohio, Sewer System Improvement Revenue Bonds, Series 2011, 5.250%, 12/01/40 – AGM Insured | 12/20 at 100.00 | Aa3 | 523,472 | ||||||||||||||
| 1,745 | Lebanon, Ohio, Waterworks System Revenue Bonds, Improvement and Refunding Series 2012, 5.000%, 12/01/31 | 12/21 at 100.00 | Aa3 | 2,084,647 | ||||||||||||||
| Nuveen Investments | 67 |
Portfolio of Investments (Unaudited)
Nuveen Ohio Municipal Bond Fund (continued)
November 30, 2012
| Principal Amount (000) | Description (1) | Optional Call Provisions (2) | Ratings (3) | Value | ||||||||||||||
Water and Sewer (continued) | ||||||||||||||||||
| $ | 5,590 | Marysville, Ohio, Wastewater Treatment System Revenue Bonds, Series 2007, 4.750%, 12/01/47 – SYNCORA GTY Insured | 12/17 at 100.00 | A– | $ | 5,960,729 | ||||||||||||
Marysville, Ohio, Wastewater Treatment System Revenue Bonds, Series 2006: | ||||||||||||||||||
| 1,755 | 5.250%, 12/01/25 – SYNCORA GTY Insured | 12/16 at 100.00 | A– | 2,027,885 | ||||||||||||||
| 80 | 4.750%, 12/01/46 – SYNCORA GTY Insured | 12/16 at 100.00 | A– | 85,334 | ||||||||||||||
| 700 | Northeast Ohio Regional Sewer District, Wastewater Improvement Revenue Bonds, Series 2007, 4.500%, 11/15/37 – NPFG Insured | 5/17 at 100.00 | AA+ | 745,759 | ||||||||||||||
| 105 | Ohio Water Development Authority, Revenue Bonds, Fresh Water Development, Series 2004, 5.250%, 12/01/15 | 6/14 at 100.00 | AAA | 112,622 | ||||||||||||||
Ohio Water Development Authority, Revenue Bonds, Water Development Community Assistance Program, Refunding Series 2009: | ||||||||||||||||||
| 1,405 | 5.000%, 12/01/25 | 12/19 at 100.00 | Aa1 | 1,712,681 | ||||||||||||||
| 1,475 | 5.000%, 12/01/26 | 12/19 at 100.00 | Aa1 | 1,793,554 | ||||||||||||||
| 200 | Ohio Water Development Authority, Water Pollution Control Loan Fund Revenue Bonds, Water Quality Project, Series 2010A, 5.000%, 6/01/30 | 12/19 at 100.00 | AAA | 245,546 | ||||||||||||||
| 2,060 | Springboro, Ohio, Sewer System Mortgage Revenue Bonds, Refunding Series 2012, 5.000%, 6/01/27 | 6/22 at 100.00 | Aa3 | 2,519,543 | ||||||||||||||
| 38,440 | Total Water and Sewer | 46,054,857 | ||||||||||||||||
| $ | 576,625 | Total Investments (cost $539,285,481) – 98.6% | 600,128,554 | |||||||||||||||
Other Assets Less Liabilities – 1.4% | 8,525,751 | |||||||||||||||||
Net Assets – 100% | $ | 608,654,305 | ||||||||||||||||
| (1) | All percentages shown in the Portfolio of Investments are based on net assets. |
| (2) | Optional Call Provisions: Dates (month and year) and prices of the earliest optional call or redemption. There may be other call provisions at varying prices at later dates. Certain mortgage-backed securities may be subject to periodic principal paydowns. |
| (3) | Ratings: Using the highest of Standard & Poor’s Group (“Standard & Poor’s”), Moody’s Investors Service, Inc. (“Moody’s”) or Fitch, Inc. (“Fitch”) rating. Ratings below BBB by Standard & Poor’s, Baa by Moody’s or BBB by Fitch are considered to be below investment grade. Holdings designated N/R are not rated by any of these national rating agencies. |
| (4) | Investment, or portion of investment, has been pledged to collateralize the net payment obligations for investments in inverse floating rate transactions. |
| (5) | Backed by an escrow or trust containing sufficient U.S. Government or U.S. Government agency securities, which ensure the timely payment of principal and interest. Certain bonds backed by U.S. Government or agency securities are regarded as having an implied rating equal to the rating of such securities. |
| N/R | Not rated. |
| WI/DD | Investment, or portion of investment, purchased on a when-issued or delayed delivery basis. |
| (ETM) | Escrowed to maturity. |
| (IF) | Inverse floating rate investment. |
See accompanying notes to financial statements.
| 68 | Nuveen Investments |
Portfolio of Investments (Unaudited)
Nuveen Wisconsin Municipal Bond Fund
November 30, 2012
| Principal Amount (000) | Description (1) | Optional Call Provisions (2) | Ratings (3) | Value | ||||||||||||||
Consumer Staples – 1.1% | ||||||||||||||||||
| $ | 1,025 | Puerto Rico, The Children’s Trust Fund, Tobacco Settlement Asset-Backed Refunding Bonds, Series 2002, 5.500%, 5/15/39 | 8/20 at 100.00 | BBB | $ | 1,026,158 | ||||||||||||
| 240 | Virgin Islands Public Finance Authority, Matching Fund Revenue Loan Note – Diageo Project, Series 2009A, 6.750%, 10/01/37 | 10/19 at 100.00 | BBB | 287,011 | ||||||||||||||
| 1,265 | Total Consumer Staples | 1,313,169 | ||||||||||||||||
Education and Civic Organizations – 7.4% | ||||||||||||||||||
| 500 | Delafield Community Development Authority, Wisconsin, Redevelopment Revenue Bonds, Saint John’s Northwestern Milirary Academy, | 6/19 at 100.00 | Aaa | 576,235 | ||||||||||||||
Madison Community Development Authority, Wisconsin, Revenue Bonds, The Wisconsin Alumni Research Foundation, Series 2009: | ||||||||||||||||||
| 1,000 | 5.000%, 10/01/23 | 10/19 at 100.00 | AAA | 1,222,220 | ||||||||||||||
| 500 | 5.000%, 10/01/27 | 10/19 at 100.00 | AAA | 603,080 | ||||||||||||||
| 300 | 5.000%, 10/01/28 | 10/19 at 100.00 | AAA | 360,948 | ||||||||||||||
| 2,250 | 5.000%, 10/01/34 | 10/19 at 100.00 | AAA | 2,639,183 | ||||||||||||||
| 1,300 | Milwaukee Redevelopment Authority, Wisconsin, Revenue Bonds, Milwaukee School of Engineering Project, Series 2012, 4.100%, 4/01/32 – AGM Insured | 4/22 at 100.00 | Aa3 | 1,389,726 | ||||||||||||||
| 550 | Puerto Rico Industrial, Tourist, Educational, Medical and Environmental Control Facilities Fin Authority, Higher Ed Rev and Rev Refunding Bonds, University of the Sacred Heart Project, Series 2012, 5.000%, 10/01/42 (WI/DD, Settling 12/18/12) | No Opt. Call | Baa2 | 559,719 | ||||||||||||||
| 1,000 | Puerto Rico Industrial, Tourist, Educational, Medical and Environmental Control Facilities Financing Authority, Higher Education Revenue Bonds, Inter-American University of Puerto Rico Project, Refunding Series 2012, 5.000%, 10/01/20 | No Opt. Call | A– | 1,153,410 | ||||||||||||||
| 250 | Puerto Rico Industrial, Tourist, Educational, Medical and Environmental Control Facilities Financing Authority, Higher Education Revenue Refunding Bonds, Ana G. Mendez University System, Series 2002, 5.500%, 12/01/31 | 12/13 at 100.00 | BBB– | 252,010 | ||||||||||||||
| 7,650 | Total Education and Civic Organizations | 8,756,531 | ||||||||||||||||
Health Care – 17.2% | ||||||||||||||||||
Monroe Redevelopment Authority, Wisconsin, Development Revenue Bonds, The Monroe Clinic, Inc., Series 2009: | ||||||||||||||||||
| 1,150 | 5.500%, 2/15/29 | 2/19 at 100.00 | A3 | 1,300,363 | ||||||||||||||
| 2,550 | 5.875%, 2/15/39 | 2/19 at 100.00 | A3 | 2,936,606 | ||||||||||||||
| 1,500 | Puerto Rico Industrial, Tourist, Educational, Medical and Environmental Control Facilities Financing Authority, Hospital Revenue Bonds, Auxilio Mutuo Hospital, Series 2011A, 6.000%, 7/01/33 | 7/21 at 100.00 | A– | 1,747,545 | ||||||||||||||
| 1,205 | Wisconsin Health and Educational Facilities Authority, Revenue Bonds, Aurora Health Care, Inc., Series 2012A, 5.000%, 7/15/28 | 7/21 at 100.00 | A3 | 1,381,484 | ||||||||||||||
| 1,230 | Wisconsin Health and Educational Facilities Authority, Revenue Bonds, Divine Savior Healthcare, Series 2006, 5.000%, 5/01/32 | 5/16 at 100.00 | BBB | 1,266,728 | ||||||||||||||
| 1,000 | Wisconsin Health and Educational Facilities Authority, Revenue Bonds, Froedtert Community Health, Inc. Obligated Group, Tender Option Bond Trust 3592, 17.961%, 4/01/17 (IF) (4) | No Opt. Call | AA– | 1,498,880 | ||||||||||||||
| 1,000 | Wisconsin Health and Educational Facilities Authority, Revenue Bonds, Gundersen Lutheran, Series 2011A, 5.250%, 10/15/39 | 10/21 at 100.00 | A+ | 1,143,550 | ||||||||||||||
| 665 | Wisconsin Health and Educational Facilities Authority, Revenue Bonds, Howard Young Health Care, Inc., Refunding Series 2012, 5.000%, 8/15/22 | No Opt. Call | A– | 752,733 | ||||||||||||||
| 1,000 | Wisconsin Health and Educational Facilities Authority, Revenue Bonds, Marshfield Clinic, Series 2006A, 5.375%, 2/15/34 | 2/16 at 100.00 | A– | 1,058,720 | ||||||||||||||
| 890 | Wisconsin Health and Educational Facilities Authority, Revenue Bonds, Marshfield Clinic, Series 2012B, 5.000%, 2/15/40 | 2/22 at 100.00 | A– | 987,241 | ||||||||||||||
| Nuveen Investments | 69 |
Portfolio of Investments (Unaudited)
Nuveen Wisconsin Municipal Bond Fund (continued)
November 30, 2012
| Principal Amount (000) | Description (1) | Optional Call Provisions (2) | Ratings (3) | Value | ||||||||||||||
Health Care (continued) | ||||||||||||||||||
| $ | 1,000 | Wisconsin Health and Educational Facilities Authority, Revenue Bonds, Meriter Hospital, Inc., Series 2011A, 5.750%, 5/01/35 | 5/21 at 100.00 | A+ | $ | 1,205,310 | ||||||||||||
| 1,350 | Wisconsin Health and Educational Facilities Authority, Revenue Bonds, Ministry Health Care, Inc., Refunding 2012C, 5.000%, 8/15/32 | 8/22 at 100.00 | A+ | 1,541,066 | ||||||||||||||
| 1,000 | Wisconsin Health and Educational Facilities Authority, Revenue Bonds, ThedaCare, Inc., Series 2009A, 5.500%, 12/15/38 | 12/19 at 100.00 | AA– | 1,129,510 | ||||||||||||||
| 2,000 | Wisconsin Health and Educational Facilities Authority, Revenue Bonds, Wheaton Franciscan Healthcare System, Series 2006, 5.250%, 8/15/19 | 8/16 at 100.00 | A– | 2,280,220 | ||||||||||||||
| 17,540 | Total Health Care | 20,229,956 | ||||||||||||||||
Housing/Multifamily – 2.6% | ||||||||||||||||||
| 1,880 | Puerto Rico Housing Finance Authority, Subordinate Lien Capital Fund Program Revenue Bonds, Modernization Series 2008, 5.125%, 12/01/27 | 12/18 at 100.00 | A+ | 2,087,834 | ||||||||||||||
| 970 | Wisconsin Housing and Economic Development Authority, Housing Revenue Bonds, Series 2006A, 4.550%, 5/01/27 (Alternative Minimum Tax) | 5/16 at 100.00 | AA | 1,007,132 | ||||||||||||||
| 2,850 | Total Housing/Multifamily | 3,094,966 | ||||||||||||||||
Housing/Single Family – 3.4% | ||||||||||||||||||
| 1,500 | Platteville Redevelopment Authority, Wisconsin, Revenue Bonds, University of Wisconsin – Platteville Real Estate Foundation Project, Series 2012A, 5.000%, 7/01/42 | 7/22 at 100.00 | BBB– | 1,568,520 | ||||||||||||||
| 20 | Virgin Islands Housing Finance Corporation, GNMA Mortgage-Backed Securities Program Single Family Mortgage Revenue Refunding Bonds, Series 1995A, 6.450%, 3/01/16 (Alternative Minimum Tax) | 3/13 at 100.00 | N/R | 20,064 | ||||||||||||||
Wisconsin Housing and Economic Development Authority, Home Ownership Revenue Bonds, Series 2005E: | ||||||||||||||||||
| 1,000 | 4.900%, 11/01/35 | 5/15 at 100.00 | AA | 1,034,150 | ||||||||||||||
| 1,375 | 4.900%, 11/01/35 – AMBAC Insured | 5/15 at 100.00 | AA | 1,421,956 | ||||||||||||||
| 3,895 | Total Housing/Single Family | 4,044,690 | ||||||||||||||||
Long-Term Care – 0.9% | ||||||||||||||||||
| 1,000 | New Richmond Community Development Authority, Wisconsin, Health Care Facilities Revenue Bonds, PHM/New Richmond Senior Housing, Inc., Series 2011, 6.650%, 9/01/43 | 9/18 at 101.00 | N/R | 1,102,730 | ||||||||||||||
Materials – 1.2% | ||||||||||||||||||
| 1,235 | Green Bay Redevelopment Authority, Wisconsin, Industrial Development Revenue Bonds, Fort James Project, Series 1999, 5.600%, 5/01/19 (Alternative Minimum Tax) | No Opt. Call | N/R | 1,423,535 | ||||||||||||||
Tax Obligation/General – 1.0% | ||||||||||||||||||
| 95 | Guam, General Obligation Bonds, Series 1993A, 5.400%, 11/15/18 | 5/13 at 100.00 | B+ | 95,104 | ||||||||||||||
| 1,000 | Puerto Rico, General Obligation Bonds, Public Improvement, Refunding Series 2012A, 5.125%, 7/01/37 | 7/22 at 100.00 | Baa1 | 1,023,540 | ||||||||||||||
| 1,095 | Total Tax Obligation/General | 1,118,644 | ||||||||||||||||
Tax Obligation/Limited – 39.1% | ||||||||||||||||||
| 650 | Beloit Community Development Authority, Rock County, Wisconsin, Lease Revenue Bonds, Series 2009, 5.000%, 3/01/25 | 3/18 at 100.00 | N/R | 725,602 | ||||||||||||||
| 2,000 | Glendale Community Development Authority, Wisconsin, Community Development Lease Revenue Bonds, Bayshore Public Parking Project, Series 2004A, 5.000%, 10/01/24 | 10/14 at 100.00 | A1 | 2,102,280 | ||||||||||||||
Glendale Community Development Authority, Wisconsin, Community Development Lease Revenue Refunding Bonds, Tax Increment District 7, Series 2011B: | ||||||||||||||||||
| 1,000 | 3.850%, 9/01/20 | 9/18 at 100.00 | A1 | 1,113,100 | ||||||||||||||
| 500 | 3.700%, 9/01/21 | 9/18 at 100.00 | A1 | 546,135 | ||||||||||||||
| 70 | Nuveen Investments |
| Principal Amount (000) | Description (1) | Optional Call Provisions (2) | Ratings (3) | Value | ||||||||||||||
Tax Obligation/Limited (continued) | ||||||||||||||||||
Glendale Community Development Authority, Wisconsin, Community Development Lease Revenue Refunding Bonds, Tax Increment District 7, Series 2012: | ||||||||||||||||||
| $ | 180 | 2.000%, 9/01/13 | No Opt. Call | A1 | $ | 181,910 | ||||||||||||
| 100 | 1.850%, 9/01/18 | No Opt. Call | A1 | 102,088 | ||||||||||||||
| 500 | 2.750%, 9/01/22 | 9/20 at 100.00 | A1 | 522,035 | ||||||||||||||
Government of Guam, Business Privilege Tax Bonds, Series 2011A: | ||||||||||||||||||
| 1,000 | 5.000%, 1/01/31 | 1/22 at 100.00 | A | 1,154,990 | ||||||||||||||
| 440 | 5.125%, 1/01/42 | 1/22 at 100.00 | A | 503,140 | ||||||||||||||
| 960 | Madison Community Development Authority, Wisconsin, Lease Revenue Refunding Bonds, Monona Terrace, Series 2002, 4.375%, 3/01/20 | 2/13 at 100.00 | Aa2 | 962,467 | ||||||||||||||
| 675 | Milwaukee Redevelopment Authority, Wisconsin, HSI Industrial I LLC Project Revenue Bonds, Series 2008, 5.125%, 6/01/29 | 6/16 at 100.00 | A1 | 719,233 | ||||||||||||||
| 2,000 | Milwaukee Redevelopment Authority, Wisconsin, Lease Revenue Bonds, Neighborhood Public Schools Initiative, Series 2002A, 4.875%, 8/01/21 – AMBAC Insured | 2/13 at 100.00 | Aa3 | 2,007,280 | ||||||||||||||
| 1,300 | Milwaukee Redevelopment Authority, Wisconsin, Lease Revenue Bonds, Neighborhood Public Schools Initiative, Series 2007A, 4.000%, 8/01/23 – AMBAC Insured | 8/17 at 100.00 | Aa3 | 1,418,612 | ||||||||||||||
| 275 | Milwaukee Redevelopment Authority, Wisconsin, Lease Revenue Bonds, Public Schools, Series 2005A, 4.600%, 8/01/22 | 8/15 at 100.00 | Aa3 | 293,794 | ||||||||||||||
| 1,500 | Neenah Community Development Authority, Wisconsin, Lease Revenue Bonds, Series 2004A, 5.000%, 12/01/26 | 12/14 at 100.00 | A1 | 1,608,405 | ||||||||||||||
Neenah Community Development Authority, Wisconsin, Lease Revenue Bonds, Series 2008A: | ||||||||||||||||||
| 500 | 4.625%, 12/01/28 | 12/18 at 100.00 | A1 | 563,965 | ||||||||||||||
| 1,000 | 4.750%, 12/01/32 | 12/18 at 100.00 | A1 | 1,117,310 | ||||||||||||||
| 2,500 | Oneida Tribe of Indians of Wisconsin, Retail Sales Revenue Bonds, | 2/19 at 102.00 | AA– | 2,938,625 | ||||||||||||||
| 500 | Puerto Rico Convention Center District Authority, Hotel Occupancy Tax Revenue Bonds, Series 2006A, 5.000%, 7/01/31 – AMBAC Insured | 7/16 at 100.00 | BBB+ | 506,935 | ||||||||||||||
| 1,200 | Puerto Rico Highway and Transportation Authority, Highway Revenue Bonds, Series 2004-I, 5.000%, 7/01/23 – FGIC Insured | 7/14 at 100.00 | Baa1 | 1,237,716 | ||||||||||||||
| 1,400 | Puerto Rico Infrastructure Financing Authority, Special Tax Revenue Bonds, Series 2006, 5.000%, 7/01/46 | 7/16 at 100.00 | BBB+ | 1,404,088 | ||||||||||||||
| 1,280 | Puerto Rico Public Buildings Authority, Guaranteed Government Facilities Revenue Bonds, Series 2011S, 6.000%, 7/01/41 | 7/21 at 100.00 | Baa1 | 1,403,494 | ||||||||||||||
| 1,000 | Puerto Rico Sales Tax Financing Corporation, Sales Tax Revenue Bonds, First Subordinate Series 2009A, 6.000%, 8/01/42 | 8/19 at 100.00 | A+ | 1,135,730 | ||||||||||||||
| 1,000 | Puerto Rico Sales Tax Financing Corporation, Sales Tax Revenue Bonds, First Subordinate Series 2010A, 5.500%, 8/01/42 | 2/20 at 100.00 | A+ | 1,085,180 | ||||||||||||||
| 1,325 | Puerto Rico Sales Tax Financing Corporation, Sales Tax Revenue Bonds, First Subordinate Series 2010C, 6.000%, 8/01/39 | 8/20 at 100.00 | A+ | 1,528,229 | ||||||||||||||
| 6,615 | Puerto Rico Sales Tax Financing Corporation, Sales Tax Revenue Bonds, Series 2007A, 0.000%, 8/01/45 – NPFG Insured | No Opt. Call | AA– | 1,131,430 | ||||||||||||||
Saint Francis Community Development Authority, Wisconsin, Lease Revenue Bonds, Series 2007: | ||||||||||||||||||
| 400 | 4.150%, 3/01/20 | 3/17 at 100.00 | A1 | 440,880 | ||||||||||||||
| 300 | 4.350%, 3/01/22 | 3/17 at 100.00 | A1 | 325,902 | ||||||||||||||
| 280 | 4.500%, 3/01/24 | 3/17 at 100.00 | A1 | 302,509 | ||||||||||||||
| 520 | 4.600%, 3/01/27 | 3/17 at 100.00 | A1 | 561,704 | ||||||||||||||
| 1,770 | Southeast Wisconsin Professional Baseball Park District, Sales Tax Revenue Refunding Bonds, Series 1998A, 5.500%, 12/15/26 – NPFG Insured | No Opt. Call | AA– | 2,414,687 | ||||||||||||||
| 1,220 | Sturgeon Bay Waterfront Redevelopment Authority, Wisconsin, Lease Revenue Bonds, Series 2006A, 4.500%, 10/01/21 | 10/16 at 100.00 | N/R | 1,300,532 | ||||||||||||||
| Nuveen Investments | 71 |
Portfolio of Investments (Unaudited)
Nuveen Wisconsin Municipal Bond Fund (continued)
November 30, 2012
| Principal Amount (000) | Description (1) | Optional Call Provisions (2) | Ratings (3) | Value | ||||||||||||||
Tax Obligation/Limited (continued) | ||||||||||||||||||
| $ | 1,305 | Sun Prairie Community Development Authority, Wisconsin, Lease Revenue Bonds, Tax Increment District 8, Series 2006, 4.250%, 8/01/25 | 8/16 at 100.00 | A1 | $ | 1,436,074 | ||||||||||||
| 1,500 | Virgin Islands Public Finance Authority, Matching Fund Loan Notes Revenue Bonds, Series 2012A, 5.000%, 10/01/32 | 10/22 at 100.00 | BBB+ | 1,687,800 | ||||||||||||||
| 1,145 | Virgin Islands Public Finance Authority, Matching Fund Loan Notes Revenue Bonds, Subordinate Lien Series 2010B, 5.250%, 10/01/29 | 10/20 at 100.00 | Baa2 | 1,276,664 | ||||||||||||||
| 1,000 | Weston Community Development Authority, Wisconsin, Lease Revenue Bonds, Series 2004A, 5.250%, 10/01/21 | 10/14 at 100.00 | A1 | 1,063,790 | ||||||||||||||
| 1,000 | Weston Community Development Authority, Wisconsin, Lease Revenue Bonds, Series 2005A, 5.000%, 10/01/21 | 10/15 at 100.00 | A1 | 1,072,350 | ||||||||||||||
| 380 | Winnebago County Housing Authority, Wisconsin, Housing Revenue Bonds, Group Home III Project, Series 1992A, 7.125%, 3/01/22 | 3/13 at 100.00 | N/R | 382,109 | ||||||||||||||
Wisconsin Center District, Junior Dedicated Tax Revenue Refunding Bonds, Series 1999: | ||||||||||||||||||
| 2,985 | 5.250%, 12/15/23 – AGM Insured | No Opt. Call | AA– | 3,596,354 | ||||||||||||||
| 765 | 5.250%, 12/15/27 – AGM Insured | No Opt. Call | AA– | 919,216 | ||||||||||||||
| 2,035 | Wisconsin Center District, Senior Dedicated Tax Revenue Refunding Bonds, Series 2003A, 0.000%, 12/15/28 – AGM Insured | No Opt. Call | AA– | 1,204,700 | ||||||||||||||
| 48,005 | Total Tax Obligation/Limited | 45,999,044 | ||||||||||||||||
Transportation – 2.1% | ||||||||||||||||||
| 1,000 | Public Finance Authority, Wisconsin, Senior Airport Facilities Revenue and Refunding Bonds, TrIPS Obligated Group, Series 2012B, | 7/22 at 100.00 | BBB– | 1,022,120 | ||||||||||||||
| 1,000 | Virginia Small Business Financing Authority, Senior Lien Revenue Bonds, 95 Express Lanes LLC Project, Series 2012, 5.000%, 1/01/40 (Alternative Minimum Tax) | 1/22 at 100.00 | BBB– | 1,077,890 | ||||||||||||||
| 355 | Virginia Small Business Financing Authority, Senior Lien Revenue Bonds, Elizabeth River Crossing, Opco LLC Project, Series 2012, 5.250%, 1/01/32 (Alternative Minimum Tax) | 7/22 at 100.00 | BBB– | 396,020 | ||||||||||||||
| 2,355 | Total Transportation | 2,496,030 | ||||||||||||||||
U.S. Guaranteed – 7.4% (5) | ||||||||||||||||||
| 1,300 | Milwaukee Redevelopment Authority, Wisconsin, Lease Revenue Bonds, Public Schools, Series 2003A, 5.125%, 8/01/21 (Pre-refunded 8/01/13) – AMBAC Insured | 8/13 at 100.00 | A1 (5) | 1,341,834 | ||||||||||||||
| 1,000 | Onalaska Community Development Authority, Wisconsin, Community Development Lease Revenue Bonds, Series 2003, 4.875%, 10/01/27 (Pre-refunded 10/01/13) | 10/13 at 100.00 | A1 (5) | 1,038,040 | ||||||||||||||
Southeast Wisconsin Professional Baseball Park District, Sales Tax Revenue Refunding Bonds, Series 1998A: | ||||||||||||||||||
| 900 | 5.500%, 12/15/18 – NPFG Insured (ETM) | No Opt. Call | AA– (5) | 1,139,220 | ||||||||||||||
| 900 | 5.500%, 12/15/19 – NPFG Insured (ETM) | No Opt. Call | AA– (5) | 1,164,789 | ||||||||||||||
| 2,220 | 5.500%, 12/15/20 – NPFG Insured (ETM) | No Opt. Call | AA– (5) | 2,915,681 | ||||||||||||||
| 1,000 | Wisconsin Health and Educational Facilities Authority, Revenue Bonds, ProHealth Care, Inc. Obligated Group, Series 2009, 6.625%, 2/15/32 (Pre-refunded 2/18/14) | 2/14 at 100.00 | A+ (5) | 1,075,620 | ||||||||||||||
| 7,320 | Total U.S. Guaranteed | 8,675,184 | ||||||||||||||||
Utilities – 9.9% | ||||||||||||||||||
| 2,150 | Guam Power Authority, Revenue Bonds, Series 2012A, 5.000%, 10/01/27 – AGM Insured | 10/22 at 100.00 | AA– | 2,495,935 | ||||||||||||||
| 2,250 | Kaukauna, Wisconsin, Electric Revenue Bonds, Series 2012A, 5.000%, 12/15/35 – AGM Insured | 12/22 at 100.00 | AA– | 2,579,828 | ||||||||||||||
| 1,310 | Puerto Rico Electric Power Authority, Power Revenue Bonds, | No Opt. Call | BBB+ | 1,495,732 | ||||||||||||||
| 72 | Nuveen Investments |
| Principal Amount (000) | Description (1) | Optional Call Provisions (2) | Ratings (3) | Value | ||||||||||||||
Utilities (continued) | ||||||||||||||||||
| $ | 1,060 | Puerto Rico Electric Power Authority, Power Revenue Bonds, Series 2007VV, 5.250%, 7/01/24 – FGIC Insured | No Opt. Call | BBB+ | $ | 1,206,132 | ||||||||||||
| 1,265 | Puerto Rico Electric Power Authority, Power Revenue Bonds, Series 2010XX, 5.250%, 7/01/40 | 7/20 at 100.00 | BBB+ | 1,310,135 | ||||||||||||||
| 1,150 | Texas Municipal Gas Acquisition and Supply Corporation III, Gas Supply Revenue Bonds, Series 2012, 5.000%, 12/15/32 (WI/DD, Settling 12/04/12) | No Opt. Call | A3 | 1,274,948 | ||||||||||||||
| 1,200 | Virgin Islands Water and Power Authority, Electric System Revenue Bonds, Refunding Series 2007A, 5.000%, 7/01/25 | 7/17 at 100.00 | Baa3 | 1,278,768 | ||||||||||||||
| 10,385 | Total Utilities | 11,641,478 | ||||||||||||||||
Water and Sewer – 2.7% | ||||||||||||||||||
| 1,000 | Guam Government Waterworks Authority, Water and Wastewater System Revenue Bonds, Series 2010, 5.625%, 7/01/40 | 7/20 at 100.00 | Ba2 | 1,066,290 | ||||||||||||||
| 1,000 | Puerto Rico Aqueduct and Sewerage Authority, Revenue Bonds, Senior Lien Series 2008A, 6.000%, 7/01/38 | 7/18 at 100.00 | Baa2 | 1,060,400 | ||||||||||||||
| 1,000 | Puerto Rico Aqueduct and Sewerage Authority, Revenue Bonds, Senior Lien Series 2012A, 5.750%, 7/01/37 | 7/22 at 100.00 | Baa2 | 1,063,960 | ||||||||||||||
| 3,000 | Total Water and Sewer | 3,190,650 | ||||||||||||||||
| $ | 107,595 | Total Investments (cost $102,709,880) – 96.0% | 113,086,607 | |||||||||||||||
Other Assets Less Liabilities – 4.0% | 4,653,675 | |||||||||||||||||
Net Assets – 100% | $ | 117,740,282 | ||||||||||||||||
| (1) | All percentages shown in the Portfolio of Investments are based on net assets. |
| (2) | Optional Call Provisions: Dates (month and year) and prices of the earliest optional call or redemption. There may be other call provisions at varying prices at later dates. Certain mortgage-backed securities may be subject to periodic principal paydowns. |
| (3) | Ratings: Using the highest of Standard & Poor’s Group (“Standard & Poor’s”), Moody’s Investors Service, Inc. (“Moody’s”) or Fitch, Inc. (“Fitch”) rating. Ratings below BBB by Standard & Poor’s, Baa by Moody’s or BBB by Fitch are considered to be below investment grade. Holdings designated N/R are not rated by any of these national rating agencies. |
| (4) | Investment, or portion of investment, has been pledged to collateralize the net payment obligations for investments in inverse floating rate transactions. |
| (5) | Backed by an escrow or trust containing sufficient U.S. Government or U.S. Government agency securities, which ensure the timely payment of principal and interest. Certain bonds backed by U.S. Government or agency securities are regarded as having an implied rating equal to the rating of such securities. |
| N/R | Not rated. |
| WI/DD | Investment, or portion of investment, purchased on a when-issued or delayed delivery basis. |
| (ETM) | Escrowed to maturity. |
| (IF) | Inverse floating rate investment. |
See accompanying notes to financial statements.
| Nuveen Investments | 73 |
Statement of Assets and Liabilities (Unaudited)
November 30, 2012
| Kansas | Kentucky | Michigan | Missouri | Ohio | Wisconsin | |||||||||||||||||||
Assets | ||||||||||||||||||||||||
Investments, at value (cost $225,229,634, $420,381,036, $191,266,807, $436,227,293, $539,285,481 and $102,709,880, respectively) | $ | 248,106,886 | $ | 464,519,999 | $ | 213,006,944 | $ | 481,268,937 | $ | 600,128,554 | $ | 113,086,607 | ||||||||||||
Cash | 7,336,917 | 1,955,551 | 2,981,725 | 1,479,665 | 7,372,868 | 5,084,957 | ||||||||||||||||||
Receivables: | ||||||||||||||||||||||||
Interest | 3,089,233 | 5,830,593 | 2,139,108 | 5,999,244 | 10,452,943 | 1,635,433 | ||||||||||||||||||
Investments sold | 8,555,901 | 3,651,714 | 4,305,052 | 3,968,211 | 4,431,018 | 203,121 | ||||||||||||||||||
Shares sold | 1,555,400 | 963,152 | 2,557,547 | 997,038 | 2,426,922 | 710,066 | ||||||||||||||||||
Other assets | 807 | 60,763 | 32,785 | 24,230 | 74,566 | 368 | ||||||||||||||||||
Total assets | 268,645,144 | 476,981,772 | 225,023,161 | 493,737,325 | 624,886,871 | 120,720,552 | ||||||||||||||||||
Liabilities | ||||||||||||||||||||||||
Floating rate obligations | 9,420,000 | 5,650,000 | — | 2,225,000 | — | — | ||||||||||||||||||
Payables: | ||||||||||||||||||||||||
Dividends | 177,957 | 254,440 | 181,340 | 270,621 | 677,531 | 92,576 | ||||||||||||||||||
Investments purchased | 7,273,041 | 2,575,000 | 3,859,741 | 4,925,336 | 13,978,585 | 1,813,190 | ||||||||||||||||||
Shares redeemed | 497,818 | 619,413 | 705,763 | 2,288,741 | 980,979 | 969,433 | ||||||||||||||||||
Accrued expenses: | ||||||||||||||||||||||||
Management fees | 103,055 | 191,013 | 90,644 | 201,429 | 264,279 | 49,191 | ||||||||||||||||||
Trustees fees | 852 | 60,817 | 32,800 | 24,290 | 74,646 | 391 | ||||||||||||||||||
12b-1 distribution and service fees | 65,252 | 105,251 | 45,732 | 65,298 | 103,967 | 20,519 | ||||||||||||||||||
Other | 59,789 | 105,560 | 63,745 | 120,725 | 152,579 | 34,970 | ||||||||||||||||||
Total liabilities | 17,597,764 | 9,561,494 | 4,979,765 | 10,121,440 | 16,232,566 | 2,980,270 | ||||||||||||||||||
Net assets | $ | 251,047,380 | $ | 467,420,278 | $ | 220,043,396 | $ | 483,615,885 | $ | 608,654,305 | $ | 117,740,282 | ||||||||||||
Class A Shares | ||||||||||||||||||||||||
Net assets | $ | 170,114,424 | $ | 373,501,613 | $ | 158,492,845 | $ | 252,585,095 | $ | 340,563,182 | $ | 59,414,267 | ||||||||||||
Shares outstanding | 14,715,825 | 32,124,017 | 13,098,441 | 21,387,582 | 28,253,681 | 5,214,334 | ||||||||||||||||||
Net asset value per share | $ | 11.56 | $ | 11.63 | $ | 12.10 | $ | 11.81 | $ | 12.05 | $ | 11.39 | ||||||||||||
Offering price per share (net asset value per share plus maximum sales charge of 4.20% of offering price) | $ | 12.07 | $ | 12.14 | $ | 12.63 | $ | 12.33 | $ | 12.58 | $ | 11.89 | ||||||||||||
Class B Shares | ||||||||||||||||||||||||
Net assets | N/A | $ | 1,174,702 | N/A | $ | 450,009 | $ | 1,883,363 | N/A | |||||||||||||||
Shares outstanding | N/A | 101,021 | N/A | 38,021 | 156,701 | N/A | ||||||||||||||||||
Net asset value and offering price per share | N/A | $ | 11.63 | N/A | $ | 11.84 | $ | 12.02 | N/A | |||||||||||||||
Class C Shares | ||||||||||||||||||||||||
Net assets | $ | 63,289,624 | $ | 72,094,075 | $ | 33,171,424 | $ | 36,907,513 | $ | 77,780,294 | $ | 18,318,459 | ||||||||||||
Shares outstanding | 5,481,749 | 6,200,463 | 2,744,651 | 3,131,327 | 6,477,335 | 1,606,337 | ||||||||||||||||||
Net asset value and offering price per share | $ | 11.55 | $ | 11.63 | $ | 12.09 | $ | 11.79 | $ | 12.01 | $ | 11.40 | ||||||||||||
Class I Shares | ||||||||||||||||||||||||
Net assets | $ | 17,643,332 | $ | 20,649,888 | $ | 28,379,127 | $ | 193,673,268 | $ | 188,427,466 | $ | 40,007,556 | ||||||||||||
Shares outstanding | 1,519,695 | 1,775,660 | 2,346,677 | 16,401,904 | 15,678,779 | 3,501,327 | ||||||||||||||||||
Net asset value and offering price per share | $ | 11.61 | $ | 11.63 | $ | 12.09 | $ | 11.81 | $ | 12.02 | $ | 11.43 | ||||||||||||
Net assets consist of: | ||||||||||||||||||||||||
Capital paid-in | $ | 225,868,643 | $ | 426,933,049 | $ | 198,320,994 | $ | 438,463,889 | $ | 548,378,647 | $ | 107,462,716 | ||||||||||||
Undistributed (Over-distribution of) net investment income | 339,031 | (48,809 | ) | 507,265 | 931,653 | 1,919,293 | 238,575 | |||||||||||||||||
Accumulated net realized gain (loss) | 1,962,454 | (3,602,925 | ) | (525,000 | ) | (821,301 | ) | (2,486,708 | ) | (337,736 | ) | |||||||||||||
Net unrealized appreciation (depreciation) | 22,877,252 | 44,138,963 | 21,740,137 | 45,041,644 | 60,843,073 | 10,376,727 | ||||||||||||||||||
Net assets | $ | 251,047,380 | $ | 467,420,278 | $ | 220,043,396 | $ | 483,615,885 | $ | 608,654,305 | $ | 117,740,282 | ||||||||||||
Authorized shares – per class | Unlimited | Unlimited | Unlimited | Unlimited | Unlimited | Unlimited | ||||||||||||||||||
Par value per share | $ | 0.01 | $ | 0.01 | $ | 0.01 | $ | 0.01 | $ | 0.01 | $ | 0.01 | ||||||||||||
| N/A – | Kansas, Michigan and Wisconsin do not offer Class B Shares. |
See accompanying notes to financial statements.
| 74 | Nuveen Investments |
Statement of Operations (Unaudited)
Six Months Ended November 30, 2012
| Kansas | Kentucky | Michigan | Missouri | Ohio | Wisconsin | |||||||||||||||||||
Investment Income | $ | 5,055,255 | $ | 10,311,672 | $ | 4,930,013 | $ | 10,986,232 | $ | 13,480,751 | $ | 2,366,416 | ||||||||||||
Expenses | ||||||||||||||||||||||||
Management fees | 595,399 | 1,139,541 | 543,223 | 1,200,180 | 1,461,434 | 275,647 | ||||||||||||||||||
12b-1 service fees – Class A | 158,208 | 364,290 | 154,880 | 242,803 | 327,063 | 54,956 | ||||||||||||||||||
12b-1 distribution and service fees – Class B | N/A | 6,205 | N/A | 2,443 | 9,286 | N/A | ||||||||||||||||||
12b-1 distribution and service fees – Class C | 213,920 | 253,470 | 117,820 | 131,365 | 272,936 | 57,221 | ||||||||||||||||||
Shareholder servicing agent fees and expenses | 43,739 | 73,497 | 41,311 | 99,476 | 122,276 | 23,503 | ||||||||||||||||||
Interest expense | 32,273 | 18,791 | — | 3,942 | — | — | ||||||||||||||||||
Custodian fees and expenses | 18,904 | 35,101 | 17,710 | 44,411 | 49,573 | 9,988 | ||||||||||||||||||
Trustees fees and expenses | 3,210 | 6,349 | 2,973 | 6,986 | 8,280 | 1,448 | ||||||||||||||||||
Professional fees | 23,034 | 36,769 | 23,729 | 33,721 | 42,811 | 16,658 | ||||||||||||||||||
Shareholder reporting expenses | 11,309 | 20,404 | 11,149 | 15,163 | 28,916 | 5,855 | ||||||||||||||||||
Federal and state registration fees | 3,242 | 7,393 | 5,678 | — | 13,404 | 6,848 | ||||||||||||||||||
Other expenses | 3,525 | 6,400 | 3,609 | 3,918 | 8,684 | 1,982 | ||||||||||||||||||
Total expenses before custodian fee credit | 1,106,763 | 1,968,210 | 922,082 | 1,784,408 | 2,344,663 | 454,106 | ||||||||||||||||||
Custodian fee credit | (1,920 | ) | (3,501 | ) | (714 | ) | (1,450 | ) | (4,152 | ) | (1,764 | ) | ||||||||||||
Net expenses | 1,104,843 | 1,964,709 | 921,368 | 1,782,958 | 2,340,511 | 452,342 | ||||||||||||||||||
Net investment income (loss) | 3,950,412 | 8,346,963 | 4,008,645 | 9,203,274 | 11,140,240 | 1,914,074 | ||||||||||||||||||
Realized and Unrealized Gain (Loss) | ||||||||||||||||||||||||
Net realized gain (loss) from investments | 187,733 | 105,461 | 1,441,080 | 205,785 | 208,905 | 73,762 | ||||||||||||||||||
Change in net unrealized appreciation (depreciation) of investments | 7,191,909 | 8,852,679 | 4,390,212 | 12,440,604 | 17,677,829 | 2,915,373 | ||||||||||||||||||
Net realized and unrealized gain (loss) | 7,379,642 | 8,958,140 | 5,831,292 | 12,646,389 | 17,886,734 | 2,989,135 | ||||||||||||||||||
Net increase (decrease) in net assets from operations | $ | 11,330,054 | $ | 17,305,103 | $ | 9,839,937 | $ | 21,849,663 | $ | 29,026,974 | $ | 4,903,209 | ||||||||||||
| N/A – | Kansas, Michigan and Wisconsin do not offer Class B Shares. |
See accompanying notes to financial statements.
| Nuveen Investments | 75 |
Statement of Changes in Net Assets (Unaudited)
| Kansas | Kentucky | |||||||||||||||
Six Months Ended | Year Ended | Six Months Ended | Year Ended | |||||||||||||
Operations | ||||||||||||||||
Net investment income (loss) | $ | 3,950,412 | $ | 7,378,488 | $ | 8,346,963 | $ | 16,866,846 | ||||||||
Net realized gain (loss) from investments | 187,733 | 3,170,557 | 105,461 | 628,279 | ||||||||||||
Change in net unrealized appreciation (depreciation) of investments | 7,191,909 | 11,261,319 | 8,852,679 | 26,013,734 | ||||||||||||
Net increase (decrease) in net assets from operations | 11,330,054 | 21,810,364 | 17,305,103 | 43,508,859 | ||||||||||||
Distributions to Shareholders | ||||||||||||||||
From net investment income: | ||||||||||||||||
Class A | (2,856,764 | ) | (5,265,199 | ) | (6,901,902 | ) | (14,181,181 | ) | ||||||||
Class B | N/A | N/A | (19,976 | ) | (66,648 | ) | ||||||||||
Class C | (879,780 | ) | (1,467,755 | ) | (1,102,530 | ) | (2,042,205 | ) | ||||||||
Class I | (309,532 | ) | (475,234 | ) | (352,445 | ) | (573,751 | ) | ||||||||
Decrease in net assets from distributions to shareholders | (4,046,076 | ) | (7,208,188 | ) | (8,376,853 | ) | (16,863,785 | ) | ||||||||
Fund Share Transactions | ||||||||||||||||
Shares issued in the Reorganization (1) | — | — | — | — | ||||||||||||
Proceeds from sale of shares | 32,019,931 | 47,176,523 | 28,740,193 | 43,701,109 | ||||||||||||
Proceeds from shares issued to shareholders due to reinvestment of distributions | 2,922,759 | 4,899,727 | 6,149,524 | 11,128,791 | ||||||||||||
| 34,942,690 | 52,076,250 | 34,889,717 | 54,829,900 | |||||||||||||
Cost of shares redeemed | (9,332,021 | ) | (19,562,372 | ) | (17,351,337 | ) | (40,582,088 | ) | ||||||||
Net increase (decrease) in net assets from Fund share transactions | 25,610,669 | 32,513,878 | 17,538,380 | 14,247,812 | ||||||||||||
Net increase (decrease) in net assets | 32,894,647 | 47,116,054 | 26,466,630 | 40,892,886 | ||||||||||||
Net assets at the beginning of period | 218,152,733 | 171,036,679 | 440,953,648 | 400,060,762 | ||||||||||||
Net assets at the end of period | $ | 251,047,380 | $ | 218,152,733 | $ | 467,420,278 | $ | 440,953,648 | ||||||||
Undistributed (Over-distribution of) net investment income at the end of period | $ | 339,031 | $ | 434,695 | $ | (48,809 | ) | $ | (18,919 | ) | ||||||
| N/A – | Kansas does not offer Class B Shares. Class B Shares of Kansas converted to Class A Shares at the close of business on February 15, 2012, and are no longer available for dividend reinvestment or through an exchange from other Nuveen mutual funds. |
| (1) – | Refer to Footnote 8 – Fund Reorganizations for further details. |
See accompanying notes to financial statements.
| 76 | Nuveen Investments |
| Michigan | Missouri | |||||||||||||||
| Six Months Ended 11/30/12 | Year Ended 5/31/12 | Six Months Ended 11/30/12 | Year Ended 5/31/12 | |||||||||||||
Operations | ||||||||||||||||
Net investment income (loss) | $ | 4,008,645 | $ | 8,184,910 | $ | 9,203,274 | $ | 12,073,762 | ||||||||
Net realized gain (loss) from investments | 1,441,080 | 1,038,140 | 205,785 | 241,154 | ||||||||||||
Change in net unrealized appreciation (depreciation) of investments | 4,390,212 | 10,616,833 | 12,440,604 | 19,118,899 | ||||||||||||
Net increase (decrease) in net assets from operations | 9,839,937 | 19,839,883 | 21,849,663 | 31,433,815 | ||||||||||||
Distributions to Shareholders | ||||||||||||||||
From net investment income: | ||||||||||||||||
Class A | (2,927,974 | ) | (5,939,900 | ) | (4,771,800 | ) | (8,634,006 | ) | ||||||||
Class B | N/A | N/A | (7,123 | ) | (28,063 | ) | ||||||||||
Class C | (515,100 | ) | (1,001,466 | ) | (598,605 | ) | (1,088,082 | ) | ||||||||
Class I | (491,182 | ) | (866,554 | ) | (3,904,567 | ) | (2,173,436 | ) | ||||||||
Decrease in net assets from distributions to shareholders | (3,934,256 | ) | (7,807,920 | ) | (9,282,095 | ) | (11,923,587 | ) | ||||||||
Fund Share Transactions | ||||||||||||||||
Share issued in the Reorganization (1) | — | — | — | 176,817,906 | ||||||||||||
Proceeds from sale of shares | 16,084,617 | 19,160,143 | 39,280,162 | 74,290,341 | ||||||||||||
Proceeds from shares issued to shareholders due to reinvestment of distributions | 2,695,840 | 4,341,983 | 7,129,993 | 6,810,577 | ||||||||||||
| 18,780,457 | 23,502,126 | 46,410,155 | 257,918,824 | |||||||||||||
Cost of shares redeemed | (12,126,294 | ) | (26,112,242 | ) | (30,423,337 | ) | (49,400,901 | ) | ||||||||
Net increase (decrease) in net assets from Fund share transactions | 6,654,163 | (2,610,116 | ) | 15,986,818 | 208,517,923 | |||||||||||
Net increase (decrease) in net assets | 12,559,844 | 9,421,847 | 28,554,386 | 228,028,151 | ||||||||||||
Net assets at the beginning of period | 207,483,552 | 198,061,705 | 455,061,499 | 227,033,348 | ||||||||||||
Net assets at the end of period | $ | 220,043,396 | $ | 207,483,552 | $ | 483,615,885 | $ | 455,061,499 | ||||||||
Undistributed (Over-distribution of) net investment income at the end of period | $ | 507,265 | $ | 432,876 | $ | 931,653 | $ | 1,010,474 | ||||||||
| N/A – | Michigan does not offer Class B Shares. Class B Shares of Michigan converted to Class A Shares at the close of business on February 15, 2012, and are no longer available for dividend reinvestment or through an exchange from other Nuveen mutual funds. |
| (1) – | Refer to Footnote 8 – Fund Reorganizations for further details. |
See accompanying notes to financial statements.
| Nuveen Investments | 77 |
Statement of Changes in Net Assets (Unaudited) (continued)
| Ohio | Wisconsin | |||||||||||||||
Six Months Ended | Year Ended 5/31/12 | Six Months Ended | Year Ended 5/31/12 | |||||||||||||
Operations | ||||||||||||||||
Net investment income (loss) | $ | 11,140,240 | $ | 20,936,742 | $ | 1,914,074 | $ | 3,326,276 | ||||||||
Net realized gain (loss) from investments | 208,905 | 2,692,800 | 73,762 | 77,544 | ||||||||||||
Change in net unrealized appreciation (depreciation) of investments | 17,677,829 | 26,443,568 | 2,915,373 | 5,971,539 | ||||||||||||
Net increase (decrease) in net assets from operations | 29,026,974 | 50,073,110 | 4,903,209 | 9,375,359 | ||||||||||||
Distributions to Shareholders | ||||||||||||||||
From net investment income: | ||||||||||||||||
Class A | (6,435,433 | ) | (12,572,284 | ) | (979,842 | ) | (1,756,455 | ) | ||||||||
Class B | (31,673 | ) | (78,365 | ) | N/A | N/A | ||||||||||
Class C | (1,237,961 | ) | (2,326,719 | ) | (230,096 | ) | (331,505 | ) | ||||||||
Class I | (3,691,144 | ) | (5,430,554 | ) | (675,287 | ) | (1,052,887 | ) | ||||||||
Decrease in net assets from distributions to shareholders | (11,396,211 | ) | (20,407,922 | ) | (1,885,225 | ) | (3,140,847 | ) | ||||||||
Fund Share Transactions | ||||||||||||||||
Shares issued in the Reorganization (1) | — | 54,288,873 | — | — | ||||||||||||
Proceeds from sale of shares | 54,821,655 | 52,236,670 | 24,111,417 | 32,770,206 | ||||||||||||
Proceeds from shares issued to shareholders due to reinvestment of distributions | 7,254,424 | 12,405,593 | 1,411,912 | 2,118,693 | ||||||||||||
| 62,076,079 | 118,931,136 | 25,523,329 | 34,888,899 | |||||||||||||
Cost of shares redeemed | (27,851,962 | ) | (57,129,774 | ) | (7,248,109 | ) | (17,666,169 | ) | ||||||||
Net increase (decrease) in net assets from Fund share transactions | 34,224,117 | 61,801,362 | 18,275,220 | 17,222,730 | ||||||||||||
Net increase (decrease) in net assets | 51,854,880 | 91,466,550 | 21,293,204 | 23,457,242 | ||||||||||||
Net assets at the beginning of period | 556,799,425 | 465,332,875 | 96,447,078 | 72,989,836 | ||||||||||||
Net assets at the end of period | $ | 608,654,305 | $ | 556,799,425 | $ | 117,740,282 | $ | 96,447,078 | ||||||||
Undistributed (Over-distribution of) net investment income at the end of period | $ | 1,919,293 | $ | 2,175,264 | $ | 238,575 | $ | 209,726 | ||||||||
| N/A – | Wisconsin does not offer Class B Shares. Class B Shares of Wisconsin converted to Class A Shares at the close of business on February 15, 2012 and are no longer available for dividend reinvestment or through an exchange from other Nuveen mutual funds. |
| (1) – | Refer to Footnote 8 – Fund Reorganizations for further details. |
See accompanying notes to financial statements.
| 78 | Nuveen Investments |
[THIS PAGE INTENTIONALLY LEFT BLANK]
| Nuveen Investments | 79 |
Financial Highlights (Unaudited)
| Selected data for a share outstanding throughout each period: | ||||||||||||||||||||||||||||||||||||
| Class (Commencement Date) | ||||||||||||||||||||||||||||||||||||
| Investment Operations | Less Distributions | |||||||||||||||||||||||||||||||||||
| KANSAS | ||||||||||||||||||||||||||||||||||||
| Year Ended May 31, | Beginning Net Asset Value | Net Invest- ment Income (Loss)(a) | Net Realized/ Unrealized Gain (Loss) | Total | Net Invest- ment Income | Capital Gains(b) | Total | Ending Net Asset Value | Total Return(c) | |||||||||||||||||||||||||||
Class A (1/92) |
| |||||||||||||||||||||||||||||||||||
2013(f) | $ | 11.21 | $ | .20 | $ | .36 | $ | .56 | $ | (.21 | ) | $ | — | $ | (.21 | ) | $ | 11.56 | 5.00 | % | ||||||||||||||||
2012 | 10.37 | .44 | .83 | 1.27 | (.43 | ) | — | (.43 | ) | 11.21 | 12.43 | |||||||||||||||||||||||||
2011 | 10.48 | .43 | (.11 | ) | .32 | (.43 | ) | — | (.43 | ) | 10.37 | 3.10 | ||||||||||||||||||||||||
2010 | 10.03 | .44 | .44 | .88 | (.43 | ) | — | (.43 | ) | 10.48 | 8.67 | |||||||||||||||||||||||||
2009 | 10.23 | .43 | (.20 | ) | .23 | (.43 | ) | — | (.43 | ) | 10.03 | 2.62 | ||||||||||||||||||||||||
2008 | 10.40 | .43 | (.16 | ) | .27 | (.42 | ) | (.02 | ) | (.44 | ) | 10.23 | 2.70 | |||||||||||||||||||||||
Class C (2/97) |
| |||||||||||||||||||||||||||||||||||
2013(f) | 11.20 | .17 | .36 | .53 | (.18 | ) | — | (.18 | ) | 11.55 | 4.73 | |||||||||||||||||||||||||
2012 | 10.36 | .37 | .84 | 1.21 | (.37 | ) | — | (.37 | ) | 11.20 | 11.86 | |||||||||||||||||||||||||
2011 | 10.48 | .37 | (.12 | ) | .25 | (.37 | ) | — | (.37 | ) | 10.36 | 2.47 | ||||||||||||||||||||||||
2010 | 10.03 | .38 | .44 | .82 | (.37 | ) | — | (.37 | ) | 10.48 | 8.10 | |||||||||||||||||||||||||
2009 | 10.23 | .38 | (.21 | ) | .17 | (.37 | ) | — | (.37 | ) | 10.03 | 2.05 | ||||||||||||||||||||||||
2008 | 10.40 | .37 | (.15 | ) | .22 | (.37 | ) | (.02 | ) | (.39 | ) | 10.23 | 2.17 | |||||||||||||||||||||||
Class I (2/97) |
| |||||||||||||||||||||||||||||||||||
2013(f) | 11.26 | .21 | .36 | .57 | (.22 | ) | — | (.22 | ) | 11.61 | 5.09 | |||||||||||||||||||||||||
2012 | 10.42 | .46 | .83 | 1.29 | (.45 | ) | — | (.45 | ) | 11.26 | 12.62 | |||||||||||||||||||||||||
2011 | 10.53 | .45 | (.11 | ) | .34 | (.45 | ) | — | (.45 | ) | 10.42 | 3.32 | ||||||||||||||||||||||||
2010 | 10.07 | .46 | .45 | .91 | (.45 | ) | — | (.45 | ) | 10.53 | 8.96 | |||||||||||||||||||||||||
2009 | 10.27 | .45 | (.20 | ) | .25 | (.45 | ) | — | (.45 | ) | 10.07 | 2.82 | ||||||||||||||||||||||||
2008 | 10.45 | .45 | (.16 | ) | .29 | (.45 | ) | (.02 | ) | (.47 | ) | 10.27 | 2.83 | |||||||||||||||||||||||
| 80 | Nuveen Investments |
| Ratios/Supplemental Data | ||||||||||||||||||
| Ratios to Average Net Assets(d) | ||||||||||||||||||
| Ending Net Assets (000) | Expenses Including Interest(e) | Expenses Excluding Interest | Net Invest- ment Income (Loss) | Portfolio Turnover Rate | ||||||||||||||
| $ | 170,114 | .84 | %* | .81 | %* | 3.53 | %* | 6 | % | |||||||||
| 151,334 | .86 | .83 | 4.03 | 36 | ||||||||||||||
| 122,629 | .83 | .82 | 4.12 | 16 | ||||||||||||||
| 120,162 | .84 | .84 | 4.27 | 18 | ||||||||||||||
| 110,130 | .85 | .85 | 4.38 | 13 | ||||||||||||||
| 94,259 | .87 | .87 | 4.12 | 16 | ||||||||||||||
| 63,290 | 1.39 | * | 1.36 | * | 2.98 | * | 6 | |||||||||||
| 52,451 | 1.40 | 1.37 | 3.47 | 36 | ||||||||||||||
| 36,864 | 1.38 | 1.37 | 3.58 | 16 | ||||||||||||||
| 33,948 | 1.39 | 1.39 | 3.71 | 18 | ||||||||||||||
| 25,570 | 1.40 | 1.40 | 3.83 | 13 | ||||||||||||||
| 21,090 | 1.42 | 1.42 | 3.57 | 16 | ||||||||||||||
| 17,643 | .64 | * | .61 | * | 3.73 | * | 6 | |||||||||||
| 14,368 | .65 | .62 | 4.22 | 36 | ||||||||||||||
| 10,648 | .63 | .62 | 4.29 | 16 | ||||||||||||||
| 7,960 | .64 | .64 | 4.47 | 18 | ||||||||||||||
| 5,069 | .65 | .65 | 4.58 | 13 | ||||||||||||||
| 4,293 | .67 | .67 | 4.31 | 16 | ||||||||||||||
| (a) | Per share Net Investment Income (Loss) is calculated using the average daily shares method. |
| (b) | Distributions from Capital Gains include short-term capital gains, if any. |
| (c) | Total return is the combination of changes in net asset value without any sales charge, reinvested dividend income at net asset value and reinvested capital gains distributions at net asset value, if any. Total returns are not annualized. |
| (d) | Ratios do not reflect the effect of custodian fee credits earned on the Fund’s net cash on deposit with the custodian bank, where applicable. |
| (e) | The expense ratios reflect, among other things, the interest expense deemed to have been paid by the Fund on the floating rate certificates issued by the special purpose trusts for the self-deposited inverse floaters held by the Fund, where applicable, as described in Footnote 1 – General Information and Significant Accounting Policies, Inverse Floating Rate Securities. |
| (f) | For the six months ended November 30, 2012. |
| * | Annualized. |
See accompanying notes to financial statements.
| Nuveen Investments | 81 |
Financial Highlights (Unaudited) (continued)
| Selected data for a share outstanding throughout each period: | ||||||||||||||||||||||||||||||||||||
| Class (Commencement Date) | ||||||||||||||||||||||||||||||||||||
| Investment Operations | Less Distributions | |||||||||||||||||||||||||||||||||||
| KENTUCKY | ||||||||||||||||||||||||||||||||||||
| Year Ended May 31, | Beginning Net Asset Value | Net Invest- ment Income (Loss)(a) | Net Gain | Total | Net | Capital Gains(b) | Total | Ending Net Asset Value | Total Return(c) | |||||||||||||||||||||||||||
Class A (5/87) |
| |||||||||||||||||||||||||||||||||||
2013(f) | $ | 11.40 | $ | .22 | $ | .23 | $ | .45 | $ | (.22 | ) | $ | — | $ | (.22 | ) | $ | 11.63 | 3.97 | % | ||||||||||||||||
2012 | 10.69 | .46 | .70 | 1.16 | (.45 | ) | — | (.45 | ) | 11.40 | 11.10 | |||||||||||||||||||||||||
2011 | 10.85 | .46 | (.18 | ) | .28 | (.44 | ) | — | (.44 | ) | 10.69 | 2.68 | ||||||||||||||||||||||||
2010 | 10.39 | .44 | .46 | .90 | (.44 | ) | — | * | (.44 | ) | 10.85 | 8.81 | ||||||||||||||||||||||||
2009 | 10.78 | .44 | (.32 | ) | .12 | (.44 | ) | (.07 | ) | (.51 | ) | 10.39 | 1.33 | |||||||||||||||||||||||
2008 | 10.96 | .44 | (.16 | ) | .28 | (.44 | ) | (.02 | ) | (.46 | ) | 10.78 | 2.63 | |||||||||||||||||||||||
Class B (2/97) |
| |||||||||||||||||||||||||||||||||||
2013(f) | 11.41 | .17 | .23 | .40 | (.18 | ) | — | (.18 | ) | 11.63 | 3.59 | |||||||||||||||||||||||||
2012 | 10.70 | .37 | .71 | 1.08 | (.37 | ) | — | (.37 | ) | 11.41 | 10.20 | |||||||||||||||||||||||||
2011 | 10.85 | .38 | (.16 | ) | .22 | (.37 | ) | — | (.37 | ) | 10.70 | 2.03 | ||||||||||||||||||||||||
2010 | 10.40 | .36 | .45 | .81 | (.36 | ) | — | * | (.36 | ) | 10.85 | 7.91 | ||||||||||||||||||||||||
2009 | 10.79 | .36 | (.32 | ) | .04 | (.36 | ) | (.07 | ) | (.43 | ) | 10.40 | .56 | |||||||||||||||||||||||
2008 | 10.97 | .36 | (.17 | ) | .19 | (.35 | ) | (.02 | ) | (.37 | ) | 10.79 | 1.85 | |||||||||||||||||||||||
Class C (10/93) |
| |||||||||||||||||||||||||||||||||||
2013(f) | 11.40 | .18 | .24 | .42 | (.19 | ) | — | (.19 | ) | 11.63 | 3.70 | |||||||||||||||||||||||||
2012 | 10.70 | .39 | .71 | 1.10 | (.40 | ) | — | (.40 | ) | 11.40 | 10.44 | |||||||||||||||||||||||||
2011 | 10.85 | .40 | (.16 | ) | .24 | (.39 | ) | — | (.39 | ) | 10.70 | 2.22 | ||||||||||||||||||||||||
2010 | 10.39 | .38 | .46 | .84 | (.38 | ) | — | * | (.38 | ) | 10.85 | 8.20 | ||||||||||||||||||||||||
2009 | 10.79 | .38 | (.33 | ) | .05 | (.38 | ) | (.07 | ) | (.45 | ) | 10.39 | .64 | |||||||||||||||||||||||
2008 | 10.96 | .38 | (.15 | ) | .23 | (.38 | ) | (.02 | ) | (.40 | ) | 10.79 | 2.15 | |||||||||||||||||||||||
Class I (2/97) |
| |||||||||||||||||||||||||||||||||||
2013(f) | 11.40 | .23 | .23 | .46 | (.23 | ) | — | (.23 | ) | 11.63 | 4.08 | |||||||||||||||||||||||||
2012 | 10.70 | .48 | .70 | 1.18 | (.48 | ) | — | (.48 | ) | 11.40 | 11.24 | |||||||||||||||||||||||||
2011 | 10.85 | .48 | (.16 | ) | .32 | (.47 | ) | — | (.47 | ) | 10.70 | 3.01 | ||||||||||||||||||||||||
2010 | 10.39 | .47 | .45 | .92 | (.46 | ) | — | * | (.46 | ) | 10.85 | 9.00 | ||||||||||||||||||||||||
2009 | 10.79 | .46 | (.33 | ) | .13 | (.46 | ) | (.07 | ) | (.53 | ) | 10.39 | 1.41 | |||||||||||||||||||||||
2008 | 10.96 | .46 | (.15 | ) | .31 | (.46 | ) | (.02 | ) | (.48 | ) | 10.79 | 2.90 | |||||||||||||||||||||||
| 82 | Nuveen Investments |
| Ratios/Supplemental Data | ||||||||||||||||||
| Ratios to Average Net Assets(d) | ||||||||||||||||||
| Ending Net Assets (000) | Expenses Including Interest(e) | Expenses Excluding Interest | Net Invest- ment Income (Loss) | Portfolio Turnover Rate | ||||||||||||||
| $ | 373,502 | .80 | %** | .79 | %** | 3.78 | %** | 4 | % | |||||||||
| 360,084 | .80 | .80 | 4.12 | 16 | ||||||||||||||
| 334,809 | .80 | .80 | 4.26 | 7 | ||||||||||||||
| 376,621 | .81 | .81 | 4.15 | 9 | ||||||||||||||
| 346,849 | .85 | .82 | 4.28 | 19 | ||||||||||||||
| 362,734 | .89 | .83 | 4.04 | 8 | ||||||||||||||
| 1,175 | 1.55 | ** | 1.54 | ** | 3.04 | ** | 4 | |||||||||||
| 1,499 | 1.55 | 1.55 | 3.38 | 16 | ||||||||||||||
| 2,465 | 1.55 | 1.55 | 3.49 | 7 | ||||||||||||||
| 5,119 | 1.56 | 1.56 | 3.40 | 9 | ||||||||||||||
| 7,289 | 1.60 | 1.57 | 3.52 | 19 | ||||||||||||||
| 9,685 | 1.64 | 1.58 | 3.29 | 8 | ||||||||||||||
| 72,094 | 1.35 | ** | 1.34 | ** | 3.22 | ** | 4 | |||||||||||
| 63,378 | 1.35 | 1.35 | 3.56 | 16 | ||||||||||||||
| 51,820 | 1.35 | 1.35 | 3.71 | 7 | ||||||||||||||
| 55,515 | 1.36 | 1.36 | 3.59 | 9 | ||||||||||||||
| 47,428 | 1.40 | 1.37 | 3.73 | 19 | ||||||||||||||
| 46,588 | 1.44 | 1.38 | 3.49 | 8 | ||||||||||||||
| 20,650 | .60 | ** | .59 | ** | 3.97 | ** | 4 | |||||||||||
| 15,992 | .60 | .60 | 4.30 | 16 | ||||||||||||||
| 10,967 | .60 | .60 | 4.46 | 7 | ||||||||||||||
| 7,453 | .61 | .61 | 4.35 | 9 | ||||||||||||||
| 3,394 | .65 | .62 | 4.48 | 19 | ||||||||||||||
| 2,891 | .69 | .63 | 4.24 | 8 | ||||||||||||||
| (a) | Per share Net Investment Income (Loss) is calculated using the average daily shares method. |
| (b) | Distributions from Capital Gains include short-term capital gains, if any. |
| (c) | Total return is the combination of changes in net asset value without any sales charge, reinvested dividend income at net asset value and reinvested capital gains distributions at net asset value, if any. Total returns are not annualized. |
| (d) | Ratios do not reflect the effect of custodian fee credits earned on the Fund’s net cash on deposit with the custodian bank, where applicable. |
| (e) | The expense ratios reflect, among other things, the interest expense deemed to have been paid by the Fund on the floating rate certificates issued by the special purpose trusts for the self-deposited inverse floaters held by the Fund, where applicable, as described in Footnote 1 – General Information and Significant Accounting Policies, Inverse Floating Rate Securities. |
| (f) | For the six months ended November 30, 2012. |
| * | Rounds to less than $.01 per share. |
| ** | Annualized. |
See accompanying notes to financial statements.
| Nuveen Investments | 83 |
Financial Highlights (Unaudited) (continued)
| Selected data for a share outstanding throughout each period: | ||||||||||||||||||||||||||||||||||||
| Class (Commencement Date) | ||||||||||||||||||||||||||||||||||||
| Investment Operations | Less Distributions | |||||||||||||||||||||||||||||||||||
| MICHIGAN | ||||||||||||||||||||||||||||||||||||
| Year Ended May 31, | Beginning Net Asset Value | Net Invest- ment Income (Loss)(a) | Net Realized/ Unrealized Gain (Loss) | Total | Net Invest- ment Income | Capital Gains(b) | Total | Ending Net Asset Value | Total Return(c) | |||||||||||||||||||||||||||
Class A (6/85) |
| |||||||||||||||||||||||||||||||||||
2013(f) | $ | 11.77 | $ | .23 | $ | .33 | $ | .56 | $ | (.23 | ) | $ | — | $ | (.23 | ) | $ | 12.10 | 4.76 | % | ||||||||||||||||
2012 | 11.08 | .47 | .67 | 1.14 | (.45 | ) | — | (.45 | ) | 11.77 | 10.48 | |||||||||||||||||||||||||
2011 | 11.19 | .47 | (.12 | ) | .35 | (.46 | ) | — | (.46 | ) | 11.08 | 3.16 | ||||||||||||||||||||||||
2010 | 10.83 | .46 | .36 | .82 | (.46 | ) | — | (.46 | ) | 11.19 | 7.73 | |||||||||||||||||||||||||
2009 | 11.15 | .47 | (.32 | ) | .15 | (.46 | ) | (.01 | ) | (.47 | ) | 10.83 | 1.59 | |||||||||||||||||||||||
2008 | 11.41 | .47 | (.23 | ) | .24 | (.47 | ) | (.03 | ) | (.50 | ) | 11.15 | 2.17 | |||||||||||||||||||||||
Class C (6/93) |
| |||||||||||||||||||||||||||||||||||
2013(f) | 11.76 | .20 | .33 | .53 | (.20 | ) | — | (.20 | ) | 12.09 | 4.50 | |||||||||||||||||||||||||
2012 | 11.08 | .41 | .66 | 1.07 | (.39 | ) | — | (.39 | ) | 11.76 | 9.81 | |||||||||||||||||||||||||
2011 | 11.18 | .41 | (.11 | ) | .30 | (.40 | ) | — | (.40 | ) | 11.08 | 2.70 | ||||||||||||||||||||||||
2010 | 10.83 | .40 | .35 | .75 | (.40 | ) | — | (.40 | ) | 11.18 | 7.05 | |||||||||||||||||||||||||
2009 | 11.15 | .42 | (.33 | ) | .09 | (.40 | ) | (.01 | ) | (.41 | ) | 10.83 | 1.04 | |||||||||||||||||||||||
2008 | 11.40 | .41 | (.23 | ) | .18 | (.40 | ) | (.03 | ) | (.43 | ) | 11.15 | 1.67 | |||||||||||||||||||||||
Class I (2/97) |
| |||||||||||||||||||||||||||||||||||
2013(f) | 11.76 | .24 | .33 | .57 | (.24 | ) | — | (.24 | ) | 12.09 | 4.87 | |||||||||||||||||||||||||
2012 | 11.08 | .49 | .66 | 1.15 | (.47 | ) | — | (.47 | ) | 11.76 | 10.59 | |||||||||||||||||||||||||
2011 | 11.18 | .49 | (.11 | ) | .38 | (.48 | ) | — | (.48 | ) | 11.08 | 3.46 | ||||||||||||||||||||||||
2010 | 10.83 | .48 | .36 | .84 | (.49 | ) | — | (.49 | ) | 11.18 | 7.87 | |||||||||||||||||||||||||
2009 | 11.15 | .50 | (.32 | ) | .18 | (.49 | ) | (.01 | ) | (.50 | ) | 10.83 | 1.82 | |||||||||||||||||||||||
2008 | 11.41 | .49 | (.23 | ) | .26 | (.49 | ) | (.03 | ) | (.52 | ) | 11.15 | 2.39 | |||||||||||||||||||||||
| 84 | Nuveen Investments |
| Ratios/Supplemental Data | ||||||||||||||||||
| Ratios to Average Net Assets(d) | ||||||||||||||||||
| Ending Net Assets (000) | Expenses Including Interest(e) | Expenses Excluding Interest | Net Invest- ment Income (Loss) | Portfolio Turnover Rate | ||||||||||||||
| $ | 158,493 | .82 | %* | .82 | %* | 3.86 | %* | 10 | % | |||||||||
| 153,467 | .84 | .84 | 4.12 | 12 | ||||||||||||||
| 148,020 | .84 | .84 | 4.22 | 6 | ||||||||||||||
| 159,191 | .85 | .85 | 4.18 | 11 | ||||||||||||||
| 151,852 | .86 | .86 | 4.45 | 9 | ||||||||||||||
| 159,696 | .86 | .85 | 4.14 | 14 | ||||||||||||||
| 33,171 | 1.37 | * | 1.37 | * | 3.31 | * | 10 | |||||||||||
| 30,129 | 1.38 | 1.38 | 3.58 | 12 | ||||||||||||||
| 29,681 | 1.39 | 1.39 | 3.67 | 6 | ||||||||||||||
| 30,655 | 1.40 | 1.40 | 3.63 | 11 | ||||||||||||||
| 32,068 | 1.41 | 1.41 | 3.90 | 9 | ||||||||||||||
| 35,814 | 1.41 | 1.40 | 3.59 | 14 | ||||||||||||||
| 28,379 | .62 | * | .62 | * | 4.06 | * | 10 | |||||||||||
| 23,887 | .63 | .63 | 4.32 | 12 | ||||||||||||||
| 19,397 | .64 | .64 | 4.42 | 6 | ||||||||||||||
| 19,888 | .65 | .65 | 4.38 | 11 | ||||||||||||||
| 18,297 | .66 | .66 | 4.65 | 9 | ||||||||||||||
| 19,100 | .66 | .65 | 4.34 | 14 | ||||||||||||||
| (a) | Per share Net Investment Income (Loss) is calculated using the average daily shares method. |
| (b) | Distributions from Capital Gains include short-term capital gains, if any. |
| (c) | Total return is the combination of changes in net asset value without any sales charge, reinvested dividend income at net asset value and reinvested capital gains distributions at net asset value, if any. Total returns are not annualized. |
| (d) | Ratios do not reflect the effect of custodian fee credits earned on the Fund’s net cash on deposit with the custodian bank, where applicable. |
| (e) | The expense ratios reflect, among other things, the interest expense deemed to have been paid by the Fund on the floating rate certificates issued by the special purpose trusts for the self-deposited inverse floaters held by the Fund, where applicable, as described in Footnote 1 – General Information and Significant Accounting Policies, Inverse Floating Rate Securities. |
| (f) | For the six months ended November 30, 2012. |
| * | Annualized. |
See accompanying notes to financial statements.
| Nuveen Investments | 85 |
Financial Highlights (Unaudited) (continued)
| Selected data for a share outstanding throughout each period: | ||||||||||||||||||||||||||||||||||||
| Class (Commencement Date) | ||||||||||||||||||||||||||||||||||||
| Investment Operations | Less Distributions | |||||||||||||||||||||||||||||||||||
| MISSOURI | ||||||||||||||||||||||||||||||||||||
| Year Ended May 31, | Beginning Net Asset Value | Net Invest- ment Income (Loss)(a) | Net Realized/ Unrealized Gain (Loss) | Total | Net Invest- ment Income | Capital Gains(b) | Total | Ending Net Asset Value | Total Return(c) | |||||||||||||||||||||||||||
Class A (8/87) |
| |||||||||||||||||||||||||||||||||||
2013(f) | $ | 11.50 | $ | .23 | $ | .31 | $ | .54 | $ | (.23 | ) | $ | — | $ | (.23 | ) | $ | 11.81 | 4.73 | % | ||||||||||||||||
2012 | 10.70 | .48 | .79 | 1.27 | (.47 | ) | — | (.47 | ) | 11.50 | 12.08 | |||||||||||||||||||||||||
2011 | 10.82 | .48 | (.13 | ) | .35 | (.47 | ) | — | (.47 | ) | 10.70 | 3.30 | ||||||||||||||||||||||||
2010 | 10.14 | .48 | .66 | 1.14 | (.46 | ) | — | (.46 | ) | 10.82 | 11.49 | |||||||||||||||||||||||||
2009 | 10.73 | .47 | (.56 | ) | (.09 | ) | (.45 | ) | (.05 | ) | (.50 | ) | 10.14 | (.52 | ) | |||||||||||||||||||||
2008 | 11.03 | .45 | (.28 | ) | .17 | (.45 | ) | (.02 | ) | (.47 | ) | 10.73 | 1.59 | |||||||||||||||||||||||
Class B (2/97) |
| |||||||||||||||||||||||||||||||||||
2013(f) | 11.51 | .18 | .34 | .52 | (.19 | ) | — | (.19 | ) | 11.84 | 4.53 | |||||||||||||||||||||||||
2012 | 10.71 | .40 | .79 | 1.19 | (.39 | ) | — | (.39 | ) | 11.51 | 11.24 | |||||||||||||||||||||||||
2011 | 10.83 | .40 | (.13 | ) | .27 | (.39 | ) | — | (.39 | ) | 10.71 | 2.55 | ||||||||||||||||||||||||
2010 | 10.15 | .40 | .67 | 1.07 | (.39 | ) | — | (.39 | ) | 10.83 | 10.69 | |||||||||||||||||||||||||
2009 | 10.74 | .39 | (.55 | ) | (.16 | ) | (.38 | ) | (.05 | ) | (.43 | ) | 10.15 | (1.26 | ) | |||||||||||||||||||||
2008 | 11.04 | .37 | (.28 | ) | .09 | (.37 | ) | (.02 | ) | (.39 | ) | 10.74 | .81 | |||||||||||||||||||||||
Class C (2/94) |
| |||||||||||||||||||||||||||||||||||
2013(f) | 11.48 | .19 | .32 | .51 | (.20 | ) | — | (.20 | ) | 11.79 | 4.47 | |||||||||||||||||||||||||
2012 | 10.68 | .41 | .80 | 1.21 | (.41 | ) | — | (.41 | ) | 11.48 | 11.50 | |||||||||||||||||||||||||
2011 | 10.80 | .42 | (.13 | ) | .29 | (.41 | ) | — | (.41 | ) | 10.68 | 2.74 | ||||||||||||||||||||||||
2010 | 10.13 | .42 | .66 | 1.08 | (.41 | ) | — | (.41 | ) | 10.80 | 10.83 | |||||||||||||||||||||||||
2009 | 10.72 | .41 | (.55 | ) | (.14 | ) | (.40 | ) | (.05 | ) | (.45 | ) | 10.13 | (1.06 | ) | |||||||||||||||||||||
2008 | 11.02 | .39 | (.28 | ) | .11 | (.39 | ) | (.02 | ) | (.41 | ) | 10.72 | 1.03 | |||||||||||||||||||||||
Class I (2/97) |
| |||||||||||||||||||||||||||||||||||
2013(f) | 11.50 | .24 | .31 | .55 | (.24 | ) | — | (.24 | ) | 11.81 | 4.84 | |||||||||||||||||||||||||
2012 | 10.70 | .48 | .81 | 1.29 | (.49 | ) | — | (.49 | ) | 11.50 | 12.28 | |||||||||||||||||||||||||
2011 | 10.82 | .50 | (.13 | ) | .37 | (.49 | ) | — | (.49 | ) | 10.70 | 3.52 | ||||||||||||||||||||||||
2010 | 10.14 | .50 | .67 | 1.17 | (.49 | ) | — | (.49 | ) | 10.82 | 11.74 | |||||||||||||||||||||||||
2009 | 10.73 | .49 | (.55 | ) | (.06 | ) | (.48 | ) | (.05 | ) | (.53 | ) | 10.14 | (.29 | ) | |||||||||||||||||||||
2008 | 11.03 | .47 | (.28 | ) | .19 | (.47 | ) | (.02 | ) | (.49 | ) | 10.73 | 1.81 | |||||||||||||||||||||||
| 86 | Nuveen Investments |
| Ratios/Supplemental Data | ||||||||||||||||||
| Ratios to Average Net Assets(d) | ||||||||||||||||||
| Ending Net Assets (000) | Expenses Including Interest(e) | Expenses Excluding Interest | Net Invest- ment Income (Loss) | Portfolio Turnover Rate | ||||||||||||||
| $ | 252,585 | .80 | %* | .80 | %* | 3.90 | %* | 4 | % | |||||||||
| 233,521 | .83 | .83 | 4.28 | 8 | ||||||||||||||
| 187,844 | .82 | .82 | 4.48 | 6 | ||||||||||||||
| 196,974 | .83 | .83 | 4.52 | 6 | ||||||||||||||
| 183,868 | .86 | .84 | 4.68 | 12 | ||||||||||||||
| 195,691 | .87 | .84 | 4.16 | 14 | ||||||||||||||
| 450 | 1.55 | * | 1.55 | * | 3.15 | * | 4 | |||||||||||
| 546 | 1.57 | 1.57 | 3.58 | 8 | ||||||||||||||
| 1,117 | 1.57 | 1.57 | 3.71 | 6 | ||||||||||||||
| 2,439 | 1.58 | 1.58 | 3.79 | 6 | ||||||||||||||
| 3,533 | 1.61 | 1.59 | 3.90 | 12 | ||||||||||||||
| 5,785 | 1.62 | 1.59 | 3.41 | 14 | ||||||||||||||
| 36,908 | 1.35 | * | 1.35 | * | 3.35 | * | 4 | |||||||||||
| 33,690 | 1.38 | 1.38 | 3.73 | 8 | ||||||||||||||
| 26,958 | 1.37 | 1.37 | 3.93 | 6 | ||||||||||||||
| 26,957 | 1.38 | 1.38 | 3.97 | 6 | ||||||||||||||
| 22,120 | 1.41 | 1.39 | 4.13 | 12 | ||||||||||||||
| 21,541 | 1.42 | 1.39 | 3.61 | 14 | ||||||||||||||
| 193,673 | .60 | * | .60 | * | 4.10 | * | 4 | |||||||||||
| 187,304 | .63 | .63 | 4.34 | 8 | ||||||||||||||
| 11,115 | .62 | .62 | 4.67 | 6 | ||||||||||||||
| 9,235 | .63 | .63 | 4.72 | 6 | ||||||||||||||
| 6,224 | .67 | .65 | 4.90 | 12 | ||||||||||||||
| 2,657 | .68 | .65 | 4.36 | 14 | ||||||||||||||
| (a) | Per share Net Investment Income (Loss) is calculated using the average daily shares method. |
| (b) | Distributions from Capital Gains include short-term capital gains, if any. |
| (c) | Total return is the combination of changes in net asset value without any sales charge, reinvested dividend income at net asset value and reinvested capital gains distributions at net asset value, if any. Total returns are not annualized. |
| (d) | Ratios do not reflect the effect of custodian fee credits earned on the Fund’s net cash on deposit with the custodian bank, where applicable. |
| (e) | The expense ratios reflect, among other things, the interest expense deemed to have been paid by the Fund on the floating rate certificates issued by the special purpose trusts for the self-deposited inverse floaters held by the Fund, where applicable, as described in Footnote 1 – General Information and Significant Accounting Policies, Inverse Floating Rate Securities. |
| (f) | For the six months ended November 30, 2012. |
| * | Annualized. |
See accompanying notes to financial statements.
| Nuveen Investments | 87 |
Financial Highlights (Unaudited) (continued)
| Selected data for a share outstanding throughout each period: | ||||||||||||||||||||||||||||||||||||
| Class (Commencement Date) | ||||||||||||||||||||||||||||||||||||
| Investment Operations | Less Distributions | |||||||||||||||||||||||||||||||||||
| OHIO | ||||||||||||||||||||||||||||||||||||
| Year Ended May 31, | Beginning Net Asset Value | Net Invest- ment Income (Loss)(a) | Net Realized/ Unrealized Gain (Loss) | Total | Net Invest- ment Income | Capital Gains(b) | Total | Ending Net Asset Value | Total Return(c) | |||||||||||||||||||||||||||
Class A (6/85) |
| |||||||||||||||||||||||||||||||||||
2013(f) | $ | 11.70 | $ | .23 | $ | .35 | $ | .58 | $ | (.23 | ) | $ | — | $ | (.23 | ) | $ | 12.05 | 5.03 | % | ||||||||||||||||
2012 | 11.01 | .49 | .67 | 1.16 | (.47 | ) | — | (.47 | ) | 11.70 | 10.77 | |||||||||||||||||||||||||
2011 | 11.18 | .48 | (.18 | ) | .30 | (.47 | ) | — | (.47 | ) | 11.01 | 2.75 | ||||||||||||||||||||||||
2010 | 10.77 | .48 | .39 | .87 | (.46 | ) | — | (.46 | ) | 11.18 | 8.18 | |||||||||||||||||||||||||
2009 | 10.99 | .47 | (.19 | ) | .28 | (.46 | ) | (.04 | ) | (.50 | ) | 10.77 | 2.75 | |||||||||||||||||||||||
2008 | 11.25 | .46 | (.19 | ) | .27 | (.46 | ) | (.07 | ) | (.53 | ) | 10.99 | 2.47 | |||||||||||||||||||||||
Class B (2/97) |
| |||||||||||||||||||||||||||||||||||
2013(f) | 11.67 | .18 | .36 | .54 | (.19 | ) | — | (.19 | ) | 12.02 | 4.68 | |||||||||||||||||||||||||
2012 | 10.98 | .40 | .68 | 1.08 | (.39 | ) | — | (.39 | ) | 11.67 | 10.00 | |||||||||||||||||||||||||
2011 | 11.16 | .40 | (.19 | ) | .21 | (.39 | ) | — | (.39 | ) | 10.98 | 1.90 | ||||||||||||||||||||||||
2010 | 10.75 | .39 | .40 | .79 | (.38 | ) | — | (.38 | ) | 11.16 | 7.41 | |||||||||||||||||||||||||
2009 | 10.97 | .39 | (.19 | ) | .20 | (.38 | ) | (.04 | ) | (.42 | ) | 10.75 | 1.97 | |||||||||||||||||||||||
2008 | 11.24 | .38 | (.21 | ) | .17 | (.37 | ) | (.07 | ) | (.44 | ) | 10.97 | 1.61 | |||||||||||||||||||||||
Class C (8/93) |
| |||||||||||||||||||||||||||||||||||
2013(f) | 11.65 | .19 | .37 | .56 | (.20 | ) | — | (.20 | ) | 12.01 | 4.86 | |||||||||||||||||||||||||
2012 | 10.97 | .42 | .67 | 1.09 | (.41 | ) | — | (.41 | ) | 11.65 | 10.13 | |||||||||||||||||||||||||
2011 | 11.15 | .42 | (.19 | ) | .23 | (.41 | ) | — | (.41 | ) | 10.97 | 2.11 | ||||||||||||||||||||||||
2010 | 10.74 | .42 | .39 | .81 | (.40 | ) | — | (.40 | ) | 11.15 | 7.62 | |||||||||||||||||||||||||
2009 | 10.96 | .41 | (.19 | ) | .22 | (.40 | ) | (.04 | ) | (.44 | ) | 10.74 | 2.19 | |||||||||||||||||||||||
2008 | 11.22 | .40 | (.19 | ) | .21 | (.40 | ) | (.07 | ) | (.47 | ) | 10.96 | 1.93 | |||||||||||||||||||||||
Class I (2/97) |
| |||||||||||||||||||||||||||||||||||
2013(f) | 11.66 | .24 | .37 | .61 | (.25 | ) | — | (.25 | ) | 12.02 | 5.25 | |||||||||||||||||||||||||
2012 | 10.98 | .51 | .67 | 1.18 | (.50 | ) | — | (.50 | ) | 11.66 | 10.94 | |||||||||||||||||||||||||
2011 | 11.15 | .51 | (.19 | ) | .32 | (.49 | ) | — | (.49 | ) | 10.98 | 2.98 | ||||||||||||||||||||||||
2010 | 10.75 | .50 | .38 | .88 | (.48 | ) | — | (.48 | ) | 11.15 | 8.33 | |||||||||||||||||||||||||
2009 | 10.97 | .49 | (.19 | ) | .30 | (.48 | ) | (.04 | ) | (.52 | ) | 10.75 | 2.99 | |||||||||||||||||||||||
2008 | 11.24 | .49 | (.21 | ) | .28 | (.48 | ) | (.07 | ) | (.55 | ) | 10.97 | 2.60 | |||||||||||||||||||||||
| 88 | Nuveen Investments |
| Ratios/Supplemental Data | ||||||||||||||||||
| Ratios to Average Net Assets(d) | ||||||||||||||||||
| Ending Net Assets (000) | Expenses Including Interest(e) | Expenses Excluding Interest | Net Invest- ment Income (Loss) | Portfolio Turnover Rate | ||||||||||||||
| $ | 340,563 | .80 | %* | .80 | %* | 3.85 | %* | 3 | % | |||||||||
| 317,442 | .82 | .82 | 4.28 | 13 | ||||||||||||||
| 292,694 | .82 | .82 | 4.40 | 10 | ||||||||||||||
| 330,410 | .82 | .82 | 4.33 | 10 | ||||||||||||||
| 321,253 | .84 | .84 | 4.40 | 9 | ||||||||||||||
| 338,770 | .93 | .84 | 4.16 | 20 | ||||||||||||||
| 1,883 | 1.55 | * | 1.55 | * | 3.11 | * | 3 | |||||||||||
| 2,065 | 1.57 | 1.57 | 3.55 | 13 | ||||||||||||||
| 2,821 | 1.57 | 1.57 | 3.64 | 10 | ||||||||||||||
| 5,034 | 1.58 | 1.58 | 3.58 | 10 | ||||||||||||||
| 7,790 | 1.58 | 1.58 | 3.64 | 9 | ||||||||||||||
| 11,577 | 1.67 | 1.58 | 3.42 | 20 | ||||||||||||||
| 77,780 | 1.35 | * | 1.35 | * | 3.30 | * | 3 | |||||||||||
| 68,344 | 1.37 | 1.37 | 3.73 | 13 | ||||||||||||||
| 60,016 | 1.37 | 1.37 | 3.85 | 10 | ||||||||||||||
| 63,181 | 1.37 | 1.37 | 3.78 | 10 | ||||||||||||||
| 52,693 | 1.39 | 1.39 | 3.85 | 9 | ||||||||||||||
| 50,642 | 1.48 | 1.39 | 3.61 | 20 | ||||||||||||||
| 188,427 | .60 | * | .60 | * | 4.05 | * | 3 | |||||||||||
| 168,949 | .62 | .62 | 4.48 | 13 | ||||||||||||||
| 109,802 | .62 | .62 | 4.60 | 10 | ||||||||||||||
| 115,162 | .62 | .62 | 4.54 | 10 | ||||||||||||||
| 109,553 | .64 | .64 | 4.60 | 9 | ||||||||||||||
| 116,718 | .73 | .64 | 4.36 | 20 | ||||||||||||||
| (a) | Per share Net Investment Income (Loss) is calculated using the average daily shares method. |
| (b) | Distributions from Capital Gains include short-term capital gains, if any. |
| (c) | Total return is the combination of changes in net asset value without any sales charge, reinvested dividend income at net asset value and reinvested capital gains distributions at net asset value, if any. Total returns are not annualized. |
| (d) | Ratios do not reflect the effect of custodian fee credits earned on the Fund’s net cash on deposit with the custodian bank, where applicable. The Fund has a contractual fee waiver/expense reimbursement agreement with the Adviser, but did not receive a fee waiver/expense reimbursement during the periods presented herein. |
| (e) | The expense ratios reflect, among other things, the interest expense deemed to have been paid by the Fund on the floating rate certificates issued by the special purpose trusts for the self-deposited inverse floaters held by the Fund, where applicable, as described in Footnote 1 – General Information and Significant Accounting Policies, Inverse Floating Rate Securities. |
| (f) | For the six months ended November 30, 2012. |
| * | Annualized. |
See accompanying notes to financial statements.
| Nuveen Investments | 89 |
Financial Highlights (Unaudited) (continued)
| Selected data for a share outstanding throughout each period: | ||||||||||||||||||||||||||||||||||||
| Class (Commencement Date) | ||||||||||||||||||||||||||||||||||||
| Investment Operations | Less Distributions | |||||||||||||||||||||||||||||||||||
| WISCONSIN | ||||||||||||||||||||||||||||||||||||
| Year Ended May 31, | Beginning Net Asset Value | Net Invest- ment Income (Loss)(a) | Net Realized/ Unrealized Gain (Loss) | Total | Net Invest- ment Income | Capital Gains(b) | Total | Ending Net Asset Value | Total Return(c) | |||||||||||||||||||||||||||
Class A (6/94) |
| |||||||||||||||||||||||||||||||||||
2013(f) | $ | 11.09 | $ | .20 | $ | .30 | $ | .50 | $ | (.20 | ) | $ | — | $ | (.20 | ) | $ | 11.39 | 4.55 | % | ||||||||||||||||
2012 | 10.28 | .43 | .78 | 1.21 | (.40 | ) | — | (.40 | ) | 11.09 | 11.96 | |||||||||||||||||||||||||
2011 | 10.39 | .39 | (.12 | ) | .27 | (.38 | ) | — | (.38 | ) | 10.28 | 2.71 | ||||||||||||||||||||||||
2010 | 9.95 | .38 | .44 | .82 | (.38 | ) | — | (.38 | ) | 10.39 | 8.42 | |||||||||||||||||||||||||
2009 | 10.09 | .39 | (.14 | ) | .25 | (.38 | ) | (.01 | ) | (.39 | ) | 9.95 | 2.61 | |||||||||||||||||||||||
2008 | 10.24 | .38 | (.13 | ) | .25 | (.38 | ) | (.02 | ) | (.40 | ) | 10.09 | 2.51 | |||||||||||||||||||||||
Class C (2/97) |
| |||||||||||||||||||||||||||||||||||
2013(f) | 11.10 | .17 | .30 | .47 | (.17 | ) | — | (.17 | ) | 11.40 | 4.27 | |||||||||||||||||||||||||
2012 | 10.30 | .36 | .78 | 1.14 | (.34 | ) | — | (.34 | ) | 11.10 | 11.27 | |||||||||||||||||||||||||
2011 | 10.41 | .33 | (.11 | ) | .22 | (.33 | ) | — | (.33 | ) | 10.30 | 2.17 | ||||||||||||||||||||||||
2010 | 9.96 | .33 | .45 | .78 | (.33 | ) | — | (.33 | ) | 10.41 | 7.94 | |||||||||||||||||||||||||
2009 | 10.11 | .34 | (.16 | ) | .18 | (.32 | ) | (.01 | ) | (.33 | ) | 9.96 | 1.93 | |||||||||||||||||||||||
2008 | 10.26 | .32 | (.12 | ) | .20 | (.33 | ) | (.02 | ) | (.35 | ) | 10.11 | 1.96 | |||||||||||||||||||||||
Class I (2/97) |
| |||||||||||||||||||||||||||||||||||
2013(f) | 11.12 | .21 | .31 | .52 | (.21 | ) | — | (.21 | ) | 11.43 | 4.74 | |||||||||||||||||||||||||
2012 | 10.31 | .44 | .79 | 1.23 | (.42 | ) | — | (.42 | ) | 11.12 | 12.16 | |||||||||||||||||||||||||
2011 | 10.42 | .42 | (.12 | ) | .30 | (.41 | ) | — | (.41 | ) | 10.31 | 2.92 | ||||||||||||||||||||||||
2010 | 9.97 | .40 | .46 | .86 | (.41 | ) | — | (.41 | ) | 10.42 | 8.73 | |||||||||||||||||||||||||
2009 | 10.12 | .41 | (.15 | ) | .26 | (.40 | ) | (.01 | ) | (.41 | ) | 9.97 | 2.72 | |||||||||||||||||||||||
2008 | 10.28 | .40 | (.13 | ) | .27 | (.41 | ) | (.02 | ) | (.43 | ) | 10.12 | 2.64 | |||||||||||||||||||||||
| 90 | Nuveen Investments |
| Ratios/Supplemental Data | ||||||||||||||||||
| Ratios to Average Net Assets(d) | ||||||||||||||||||
| Ending Net Assets (000) | Expenses Including Interest(e) | Expenses Excluding Interest | Net Invest- ment Income (Loss) | Portfolio Turnover Rate | ||||||||||||||
| $ | 59,414 | .85 | %* | .85 | %* | 3.62 | %* | 1 | % | |||||||||
| 51,124 | .87 | .87 | 3.94 | 19 | ||||||||||||||
| 45,101 | .87 | .87 | 3.81 | 14 | ||||||||||||||
| 50,270 | .90 | .90 | 3.75 | 6 | ||||||||||||||
| 46,933 | .89 | .89 | 4.02 | 12 | ||||||||||||||
| 50,640 | .88 | .88 | 3.72 | 3 | ||||||||||||||
| 18,318 | 1.39 | * | 1.39 | * | 3.06 | * | 1 | |||||||||||
| 12,542 | 1.41 | 1.41 | 3.38 | 19 | ||||||||||||||
| 9,105 | 1.42 | 1.42 | 3.26 | 14 | ||||||||||||||
| 9,329 | 1.45 | 1.45 | 3.19 | 6 | ||||||||||||||
| 6,907 | 1.44 | 1.44 | 3.46 | 12 | ||||||||||||||
| 6,512 | 1.43 | 1.43 | 3.17 | 3 | ||||||||||||||
| 40,008 | .65 | * | .65 | * | 3.82 | * | 1 | |||||||||||
| 32,782 | .66 | .66 | 4.13 | 19 | ||||||||||||||
| 18,236 | .67 | .67 | 4.14 | 14 | ||||||||||||||
| 2,605 | .70 | .70 | 3.94 | 6 | ||||||||||||||
| 1,573 | .69 | .69 | 4.20 | 12 | ||||||||||||||
| 1,506 | .68 | .68 | 3.92 | 3 | ||||||||||||||
| (a) | Per share Net Investment Income (Loss) is calculated using the average daily shares method. |
| (b) | Distributions from Capital Gains include short-term capital gains, if any. |
| (c) | Total return is the combination of changes in net asset value without any sales charge, reinvested dividend income at net asset value and reinvested capital gains distributions at net asset value, if any. Total returns are not annualized. |
| (d) | Ratios do not reflect the effect of custodian fee credits earned on the Fund’s net cash on deposit with the custodian bank, where applicable. |
| (e) | The expense ratios reflect, among other things, the interest expense deemed to have been paid by the Fund on the floating rate certificates issued by the special purpose trusts for the self-deposited inverse floaters held by the Fund, where applicable, as described in Footnote 1 – General Information and Significant Accounting Policies, Inverse Floating Rate Securities. |
| (f) | For the six months ended November 30, 2012. |
| * | Annualized. |
See accompanying notes to financial statements.
| Nuveen Investments | 91 |
Notes to Financial Statements (Unaudited)
1. General Information and Significant Accounting Policies
General Information
The Nuveen Multistate Trust IV (the “Trust”) is an open-end investment company registered under the Investment Company Act of 1940, as amended. The Trust is comprised of the Nuveen Kansas Municipal Bond Fund (“Kansas”), Nuveen Kentucky Municipal Bond Fund (“Kentucky”), Nuveen Michigan Municipal Bond Fund (“Michigan”), Nuveen Missouri Municipal Bond Fund (“Missouri”), Nuveen Ohio Municipal Bond Fund (“Ohio”) and Nuveen Wisconsin Municipal Bond Fund (“Wisconsin”) (each a “Fund” and collectively, the “Funds”), as diversified funds (non-diversified for Kansas and Wisconsin). The Trust was organized as a Massachusetts business trust on July 1, 1996. The Funds were each organized as a series of predecessor trusts or corporations prior to that date.
On December 31, 2012, the Funds’ investment adviser converted from a Delaware corporation to a Delaware limited liability company. As a result, Nuveen Fund Advisers, Inc., a wholly-owned subsidiary of Nuveen Investments, Inc. (“Nuveen”), changed its name to Nuveen Fund Advisers, LLC (the “Adviser”). There were no changes to the identities or roles of any personnel as a result of the change.
Each Fund’s investment objective is to provide as high a level of current interest income exempt from regular federal, its respective state and, in some cases, its respective local income taxes as is consistent with preservation of capital. Under normal market conditions, each Fund invests at least 80% of its net assets, plus the amount of any borrowings for investment purposes, in municipal bonds that pay interest that is exempt from regular federal and its respective state personal income tax. Under normal market conditions, each Fund invests at least 80% of its net assets in investment grade municipal bonds rated BBB/Baa or higher at the time of purchase by at least one independent rating agency, or, if unrated, judged by Nuveen Asset Management, LLC (the “Sub-Adviser”), a wholly-owned subsidiary of the Adviser, to be of comparable quality. Each Fund may invest up to 20% of its net assets in below investment grade municipal bonds, commonly referred to as “high yield” or “junk” bonds. Each Fund may invest up to 15% of its net assets in municipal securities whose interest payments vary inversely with changes in short-term tax-exempt interest rates (“inverse floaters”).
The Funds’ most recent prospectus provides further descriptions of each Fund’s investment objective, principal investment strategies, and principal risks.
Significant Accounting Policies
The following is a summary of significant accounting policies followed by the Funds in the preparation of their financial statements in accordance with accounting principles generally accepted in the United States (“U.S. GAAP”).
Investment Valuation
Prices of municipal bonds are provided by a pricing service approved by the Funds’ Board of Trustees. These securities are generally classified as Level 2 for fair value measurement purposes. The pricing service establishes a security’s fair value using methods that may include consideration of the following: yields or prices of investments of comparable quality, type of issue, coupon, maturity and rating, market quotes or indications of value from security dealers, evaluations of anticipated cash flows or collateral, general market conditions and other information and analysis, including the obligor’s credit characteristics considered relevant. In pricing certain securities, particularly less liquid and lower quality securities, the pricing service may consider information about a security, its issuer, or market activity, provided by the Adviser. These securities are generally classified as Level 2 or Level 3 depending on the priority of the significant inputs.
Certain securities may not be able to be priced by the pre-established pricing methods as described above. Such securities may be valued by the Funds’ Board of Trustees or its designee at fair value. These securities generally include, but are not limited to, restricted securities (securities which may not be publicly sold without registration under the Securities Act of 1933, as amended) for which a pricing service is unable to provide a market price; securities whose trading has been formally suspended; debt securities that have gone into default and for which there is no current market quotation; a security whose market price is not available from a pre-established pricing source; a security with respect to which an event has occurred that is likely to materially affect the value of the security after the market has closed but before the calculation of a Fund’s net asset value (as may be the case in non-U.S. markets on which the security is primarily traded) or make it difficult or impossible to obtain a reliable market quotation; and a security whose price, as provided by the pricing service, is not deemed to reflect the security’s fair value. As a general principle, the fair value of a security would appear to be the amount that the owner might reasonably expect to receive for it in a current sale. A variety of factors may be considered in determining the fair value of such securities, which may include consideration of the following: yields or prices of investments of comparable quality, type of issue, coupon, maturity and rating, market quotes or indications of value from security dealers, evaluations of anticipated cash flows or collateral, general market conditions and other information and analysis, including the obligor’s credit characteristics considered relevant. These securities are generally classified as Level 2 or Level 3 depending on the priority of the significant inputs. Regardless of the method employed to value a particular security, all valuations are subject to review by the Funds’ Board of Trustees or its designee.
Refer to Footnote 2 – Fair Value Measurements for further details on the leveling of securities held by the Funds as of the end of the reporting period.
Investment Transactions
Investment transactions are recorded on a trade date basis. Realized gains and losses from transactions are determined on the specific identification method, which is the same basis used for federal income tax purposes. Investments purchased on a when-issued/
| 92 | Nuveen Investments |
delayed delivery basis may have extended settlement periods. Any investments so purchased are subject to market fluctuation during this period. The Funds have instructed the custodian to earmark securities in the Funds’ portfolios with a current value at least equal to the amount of the when-issued/delayed delivery purchase commitments. At November 30, 2012, Kansas, Kentucky, Michigan, Missouri, Ohio and Wisconsin had outstanding when-issued/delayed delivery purchase commitments of $7,273,040, $2,575,000, $3,859,741, $4,913,663, $13,978,585 and $1,813,190, respectively.
Investment Income
Investment income, which reflects the amortization of premiums and includes accretion of discounts for financial reporting purposes, is recorded on an accrual basis. Investment income also reflects paydown gains and losses, if any.
Professional Fees
Professional fees presented on the Statement of Operations consist of legal fees incurred in the normal course of operations, audit fees, tax consulting fees and, in some cases, workout expenditures. Workout expenditures are incurred in an attempt to protect or enhance an investment, or to pursue other claims or legal actions on behalf of Fund shareholders. Legal fee refund presented on the Statement of Operations reflects a refund of workout expenditures paid in a prior reporting period, when applicable.
Income Taxes
Each Fund is a separate taxpayer for federal income tax purposes. Each Fund intends to distribute substantially all of its net investment income and net capital gains to shareholders and to otherwise comply with the requirements of Subchapter M of the Internal Revenue Code applicable to regulated investment companies. Therefore, no federal income tax provision is required. Furthermore, each Fund intends to satisfy conditions that will enable interest from municipal securities, which is exempt from regular federal and designated state income taxes, to retain such tax-exempt status when distributed to shareholders of the Funds. Net realized capital gains and ordinary income distributions paid by the Funds are subject to federal taxation.
For all open tax years and all major taxing jurisdictions, management of the Funds has concluded that there are no significant uncertain tax positions that would require recognition in the financial statements. Open tax years are those that are open for examination by taxing authorities (i.e., generally the last four tax year ends and the interim tax period since then). Furthermore, management of the Funds is also not aware of any tax positions for which it is reasonably possible that the total amounts of unrecognized tax benefits will significantly change in the next twelve months.
Dividends and Distributions to Shareholders
The Funds declare dividends from their net investment income daily and pay shareholders monthly. Fund shares begin to accrue dividends on the business day after the day when the monies used to purchase Fund shares are collected by the Funds’ transfer agent.
Net realized capital gains and/or market discount from investment transactions, if any, are declared and distributed to shareholders at least annually. Furthermore, capital gains are distributed only to the extent they exceed available capital loss carryforwards.
Distributions to shareholders of net investment income, net realized capital gains and/or market discount, if any, are recorded on the ex-dividend date. The amount and timing of distributions are determined in accordance with federal income tax regulations, which may differ from U.S. GAAP.
Share Classes and Sales Charges
Class A Shares are generally sold with an up-front sales charge and incur a .20% annual 12b-1 service fee. Class A Share purchases of $1 million or more are sold at net asset value without an up-front sales charge but may be subject to a contingent deferred sales charge (“CDSC”) if redeemed within eighteen months of purchase. Kansas, Michigan and Wisconsin do not offer Class B Shares. Kentucky, Missouri and Ohio will issue Class B Shares upon the exchange of Class B Shares from another Nuveen mutual fund or for purposes of dividend reinvestment, but Class B Shares are not available for new accounts or for additional investment into existing accounts. Class B Shares were sold without an up-front sales charge but incur a ..75% annual 12b-1 distribution fee and a .20% annual 12b-1 service fee. Class B Shares are subject to a CDSC of up to 5% depending upon the length of time the shares are held by the investor (CDSC is reduced to 0% at the end of six years). Class B Shares automatically convert to Class A Shares eight years after purchase. Class C Shares are sold without an up-front sales charge but incur a .55% annual 12b-1 distribution fee and a .20% annual 12b-1 service fee. Class C Shares are subject to a CDSC of 1% if redeemed within twelve months of purchase. Class I Shares are not subject to any sales charge or 12b-1 distribution or service fees.
Inverse Floating Rate Securities
Each Fund is authorized to invest in inverse floating rate securities. An inverse floating rate security is created by depositing a municipal bond, typically with a fixed interest rate, into a special purpose trust created by a broker-dealer. In turn, this trust (a) issues floating rate certificates, in face amounts equal to some fraction of the deposited bond’s par amount or market value, that typically pay short-term tax-exempt interest rates to third parties, and (b) issues to a long-term investor (such as one of the Funds) an inverse floating rate certificate (sometimes referred to as an “inverse floater”) that represents all remaining or residual interest in the trust. The income received by the inverse floater holder varies inversely with the short-term rate paid to the floating rate certificates’ holders, and in most circumstances the inverse floater holder bears substantially all of the underlying bond’s downside investment risk and also benefits disproportionately from any potential appreciation of the underlying bond’s value. The price of an inverse floating rate security will be more volatile than that of the underlying bond because the interest rate is dependent on not only the fixed coupon rate of the underlying bond but also on the short-term interest paid on the floating rate certificates, and because the inverse floating rate security essentially bears the risk of loss of the greater face value of the underlying bond.
| Nuveen Investments | 93 |
Notes to Financial Statements (Unaudited) (continued)
A Fund may purchase an inverse floating rate security in a secondary market transaction without first owning the underlying bond (referred to as an “externally-deposited inverse floater”), or instead by first selling a fixed-rate bond to a broker-dealer for deposit into the special purpose trust and receiving in turn the residual interest in the trust (referred to as a “self-deposited inverse floater”). The inverse floater held by a Fund gives the Fund the right (a) to cause the holders of the floating rate certificates to tender their notes at par, and (b) to have the broker transfer the fixed-rate bond held by the trust to the Fund, thereby collapsing the trust. An investment in an externally-deposited inverse floater is identified in the Portfolio of Investments as “(IF) – Inverse floating rate investment.” An investment in a self-deposited inverse floater is accounted for as a financing transaction. In such instances, a fixed-rate bond deposited into a special purpose trust is identified in the Portfolio of Investments as “(UB) – Underlying bond of an inverse floating rate trust reflected as a financing transaction,” with the Fund accounting for the short-term floating rate certificates issued by the trust as “Floating rate obligations” on the Statement of Assets and Liabilities. In addition, the Fund reflects in “Investment Income” the entire earnings of the underlying bond and recognizes the related interest paid to the holders of the short-term floating rate certificates as “Interest expense” on the Statement of Operations.
During the six months ended November 30, 2012, each Fund invested in externally-deposited inverse floaters and/or self-deposited inverse floaters.
Each Fund may also enter into shortfall and forbearance agreements (sometimes referred to as a “recourse trust” or “credit recovery swap”) (such agreements referred to herein as “Recourse Trusts”) with a broker-dealer by which a Fund agrees to reimburse the broker-dealer, in certain circumstances, for the difference between the liquidation value of the fixed-rate bond held by the trust and the liquidation value of the floating rate certificates issued by the trust plus any shortfalls in interest cash flows. Under these agreements, a Fund’s potential exposure to losses related to or on inverse floaters may increase beyond the value of a Fund’s inverse floater investments as a Fund may potentially be liable to fulfill all amounts owed to holders of the floating rate certificates. At period end, any such shortfall is recognized as “Unrealized depreciation on Recourse Trusts” on the Statement of Assets and Liabilities.
At November 30, 2012, each Fund’s maximum exposure to the floating rate obligations issued by externally-deposited Recourse Trusts was as follows:
| Kansas | Kentucky | Michigan | Missouri | Ohio | Wisconsin | |||||||||||||||||||
Maximum exposure | $ | 5,250,000 | $ | 15,000,000 | $ | 3,150,000 | $ | — | $ | 4,830,000 | $ | — | ||||||||||||
The average floating rate obligations outstanding and average annual interest rate and fees related to self-deposited inverse floaters for the following Funds during the six months ended November 30, 2012, were as follows:
| Kansas | Kentucky | Missouri | ||||||||||
Average floating rate obligations outstanding | $ | 9,420,000 | $ | 5,650,000 | $ | 2,225,000 | ||||||
Average annual interest rate and fees | 0.68 | % | 0.66 | % | 0.35 | % | ||||||
Derivative Financial Instruments
Each Fund is authorized to invest in certain derivative instruments, including foreign currency forwards, futures, options and swap contracts. Although each Fund is authorized to invest in such derivative instruments, and may do so in the future, they did not make any such investments during the six months ended November 30, 2012.
Market and Counterparty Credit Risk
In the normal course of business each Fund may invest in financial instruments and enter into financial transactions where risk of potential loss exists due to changes in the market (market risk) or failure of the other party to the transaction to perform (counterparty credit risk). The potential loss could exceed the value of the financial assets recorded on the financial statements. Financial assets, which potentially expose each Fund to counterparty credit risk, consist principally of cash due from counterparties on forward, option and swap transactions, when applicable. The extent of each Fund’s exposure to counterparty credit risk in respect to these financial assets approximates their carrying value as recorded on the Statement of Assets and Liabilities. Futures contracts, when applicable, expose a Fund to minimal counterparty credit risk as they are exchange traded and the exchange’s clearinghouse, which is counterparty to all exchange traded futures, guarantees the futures contracts against default.
Each Fund helps manage counterparty credit risk by entering into agreements only with counterparties the Adviser believes have the financial resources to honor their obligations and by having the Adviser monitor the financial stability of the counterparties. Additionally, counterparties may be required to pledge collateral daily (based on the daily valuation of the financial asset) on behalf of each Fund with a value approximately equal to the amount of any unrealized gain above a pre-determined threshold. Reciprocally, when each Fund has an unrealized loss, the Funds have instructed the custodian to pledge assets of the Funds as collateral with a value approximately equal to the amount of the unrealized loss above a pre-determined threshold. Collateral pledges are monitored and subsequently adjusted if and when the valuations fluctuate, either up or down, by at least the pre-determined threshold amount.
Zero Coupon Securities
Each Fund is authorized to invest in zero coupon securities. A zero coupon security does not pay a regular interest coupon to its holders during the life of the security. Income to the holder of the security comes from accretion of the difference between the original purchase price of the security at issuance and the par value of the security at maturity and is effectively paid at maturity. The market prices of zero coupon securities generally are more volatile than the market prices of securities that pay interest periodically.
| 94 | Nuveen Investments |
Multiclass Operations and Allocations
Income and expenses of the Funds that are not directly attributable to a specific class of shares are prorated among the classes based on the relative settled shares of each class. Expenses directly attributable to a class of shares, which presently only include 12b-1 distribution and service fees, are recorded to the specific class.
Realized and unrealized capital gains and losses of the Funds are prorated among the classes based on the relative net assets of each class.
Custodian Fee Credit
Each Fund has an arrangement with the custodian bank whereby certain custodian fees and expenses are reduced by net credits earned on each Fund’s cash on deposit with the bank. Such deposit arrangements are an alternative to overnight investments. Credits for cash balances may be offset by charges for any days on which a Fund overdraws its account at the custodian bank.
Indemnifications
Under the Trust’s organizational documents, its officers and trustees are indemnified against certain liabilities arising out of the performance of their duties to the Trust. In addition, in the normal course of business, the Trust enters into contracts that provide general indemnifications to other parties. The Trust’s maximum exposure under these arrangements is unknown as this would involve future claims that may be made against the Trust that have not yet occurred. However, the Trust has not had prior claims or losses pursuant to these contracts and expects the risk of loss to be remote.
Use of Estimates
The preparation of financial statements in conformity with U.S. GAAP requires management to make estimates and assumptions that affect the reported amounts of assets and liabilities at the date of the financial statements and the reported amounts of increases and decreases in net assets from operations during the reporting period. Actual results may differ from those estimates.
2. Fair Value Measurements
Fair value is defined as the price that the Funds would receive upon selling an investment or transferring a liability in an orderly transaction to an independent buyer in the principal or most advantageous market for the investment. A three-tier hierarchy is used to maximize the use of observable market data and minimize the use of unobservable inputs and to establish classification of fair value measurements for disclosure purposes. Observable inputs reflect the assumptions market participants would use in pricing the asset or liability. Observable inputs are based on market data obtained from sources independent of the reporting entity. Unobservable inputs reflect the reporting entity’s own assumptions about the assumptions market participants would use in pricing the asset or liability. Unobservable inputs are based on the best information available in the circumstances. The following is a summary of the three-tiered heirarchy of valuation input levels.
| Level 1 – | Inputs are unadjusted and prices are determined using quoted prices in active markets for identical securities. | |
| Level 2 – | Prices are determined using other significant observable inputs (including quoted prices for similar securities, interest rates, prepayment speeds, credit risk, etc.). | |
| Level 3 – | Prices are determined using significant unobservable inputs (including management’s assumptions in determining the fair value of investments). |
The inputs or methodologies used for valuing securities are not an indication of the risks associated with investing in those securities. The following is a summary of each Fund’s fair value measurements as of the end of the reporting period:
| Kansas | Level 1 | Level 2 | Level 3 | Total | ||||||||||||
Long-Term Investments*: | ||||||||||||||||
Municipal Bonds | $ | — | $ | 244,706,512 | $ | — | $ | 244,706,512 | ||||||||
Short-Term Investments*: | ||||||||||||||||
Municipal Bonds | — | 3,400,374 | — | 3,400,374 | ||||||||||||
Total | $ | — | $ | 248,106,886 | $ | — | $ | 248,106,886 | ||||||||
| Kentucky | Level 1 | Level 2 | Level 3 | Total | ||||||||||||
Long-Term Investments*: | ||||||||||||||||
Municipal Bonds | $ | — | $ | 464,519,999 | $ | — | $ | 464,519,999 | ||||||||
| Michigan | Level 1 | Level 2 | Level 3 | Total | ||||||||||||
Long-Term Investments*: | ||||||||||||||||
Municipal Bonds | $ | — | $ | 213,006,944 | $ | — | $ | 213,006,944 | ||||||||
| Missouri | Level 1 | Level 2 | Level 3 | Total | ||||||||||||
Long-Term Investments*: | ||||||||||||||||
Municipal Bonds | $ | — | $ | 481,268,937 | $ | — | $ | 481,268,937 | ||||||||
| Ohio | Level 1 | Level 2 | Level 3 | Total | ||||||||||||
Long-Term Investments*: | ||||||||||||||||
Municipal Bonds | $ | — | $ | 600,128,554 | $ | — | $ | 600,128,554 | ||||||||
| Wisconsin | Level 1 | Level 2 | Level 3 | Total | ||||||||||||
Long-Term Investments*: | ||||||||||||||||
Municipal Bonds | $ | — | $ | 113,086,607 | $ | — | $ | 113,086,607 | ||||||||
| * | Refer to the Fund’s Portfolio of Investments for industry classifications. |
| Nuveen Investments | 95 |
Notes to Financial Statements (Unaudited) (continued)
The Nuveen funds’ Board of Directors/Trustees is responsible for the valuation process and has delegated the oversight of the daily valuation process to the Adviser’s Valuation Committee. The Valuation Committee, pursuant to the valuation policies and procedures adopted by the Board of Directors/Trustees, is responsible for making fair value determinations, evaluating the effectiveness of the funds’ pricing policies, and reporting to the Board of Directors/Trustees. The Valuation Committee is aided in its efforts by the Adviser’s dedicated Securities Valuation Team, which is responsible for administering the daily valuation process and applying fair value methodologies as approved by the Valuation Committee. When determining the reliability of independent pricing services for investments owned by the funds, the Valuation Committee, among other things, conducts due diligence reviews of the pricing services and monitors the quality of security prices received through various testing reports conducted by the Securities Valuation Team.
The Valuation Committee will consider pricing methodologies it deems relevant and appropriate when making fair value determinations. Examples of possible methodologies include, but are not limited to, multiple of earnings; discount from market of a similar freely traded security; discounted cash-flow analysis; book value or a multiple thereof; risk premium/yield analysis; yield to maturity; and/or fundamental investment analysis. The Valuation Committee will also consider factors it deems relevant and appropriate in light of the facts and circumstances. Examples of possible factors include, but are not limited to, the type of security; the issuer’s financial statements; the purchase price of the security; the discount from market value of unrestricted securities of the same class at the time of purchase; analysts’ research and observations from financial institutions; information regarding any transactions or offers with respect to the security; the existence of merger proposals or tender offers affecting the security; the price and extent of public trading in similar securities of the issuer or comparable companies; and the existence of a shelf registration for restricted securities.
For each portfolio security that has been fair valued pursuant to the policies adopted by the Board of Directors/Trustees, the fair value price is compared against the last available and next available market quotations. The Valuation Committee reviews the results of such testing and fair valuation occurrences are reported to the Board of Directors/Trustees.
3. Derivative Instruments and Hedging Activities
The Funds record derivative instruments at fair value, with changes in fair value recognized on the Statement of Operations, when applicable. Even though the Funds’ investments in derivatives may represent economic hedges, they are not considered to be hedge transactions for financial reporting purposes. The Funds did not invest in derivative instruments during the six months ended November 30, 2012.
4. Fund Shares
Transactions in Fund shares were as follows:
| Kansas | ||||||||||||||||
| Six Months Ended 11/30/12 | Year Ended 5/31/12 | |||||||||||||||
| Shares | Amount | Shares | Amount | |||||||||||||
Shares sold: | ||||||||||||||||
Class A | 1,614,541 | $ | 18,343,264 | 2,382,416 | $ | 25,954,110 | ||||||||||
Class A – automatic conversion of Class B Shares | — | — | 45,433 | 504,079 | ||||||||||||
Class B (1) | — | — | 2,191 | 23,086 | ||||||||||||
Class C | 918,992 | 10,410,259 | 1,343,252 | 14,592,447 | ||||||||||||
Class I | 287,939 | 3,266,408 | 555,842 | 6,102,801 | ||||||||||||
Shares issued to shareholders due to reinvestment of distributions: | ||||||||||||||||
Class A | 186,396 | 2,118,980 | 342,330 | 3,704,264 | ||||||||||||
Class B | N/A | N/A | 1,536 | 16,214 | ||||||||||||
Class C | 54,360 | 617,401 | 87,999 | 952,085 | ||||||||||||
Class I | 16,322 | 186,378 | 20,855 | 227,164 | ||||||||||||
| 3,078,550 | 34,942,690 | 4,781,854 | 52,076,250 | |||||||||||||
Shares redeemed: | ||||||||||||||||
Class A | (585,785 | ) | (6,647,515 | ) | (1,091,581 | ) | (11,828,292 | ) | ||||||||
Class B (1) | — | — | (44,956 | ) | (489,369 | ) | ||||||||||
Class B – automatic conversion to Class A Shares | — | — | (45,846 | ) | (504,079 | ) | ||||||||||
Class C | (175,975 | ) | (1,990,493 | ) | (303,465 | ) | (3,266,047 | ) | ||||||||
Class I | (60,905 | ) | (694,013 | ) | (322,533 | ) | (3,474,585 | ) | ||||||||
| (822,665 | ) | (9,332,021 | ) | (1,808,381 | ) | (19,562,372 | ) | |||||||||
Net increase (decrease) | 2,255,885 | $ | 25,610,669 | 2,973,473 | $ | 32,513,878 | ||||||||||
| (1) | Kansas does not offer Class B Shares. Class B Shares of Kansas converted to Class A Shares at the close of business on February 15, 2012, and are no longer available for dividend reinvestment or through an exchange from other Nuveen mutual funds. |
| 96 | Nuveen Investments |
| Kentucky | ||||||||||||||||
| Six Months Ended 11/30/12 | Year Ended 5/31/12 | |||||||||||||||
| Shares | Amount | Shares | Amount | |||||||||||||
Shares sold: | ||||||||||||||||
Class A | 1,355,100 | $ | 15,531,218 | 2,371,170 | $ | 26,346,859 | ||||||||||
Class A – automatic conversion of Class B Shares | 2,503 | 28,578 | 67,832 | 750,886 | ||||||||||||
Class B | — | — | 389 | 4,292 | ||||||||||||
Class C | 703,442 | 8,053,041 | 945,220 | 10,490,733 | ||||||||||||
Class I | 447,807 | 5,126,327 | 549,539 | 6,108,339 | ||||||||||||
Shares issued to shareholders due to reinvestment of distributions: | ||||||||||||||||
Class A | 441,123 | 5,063,438 | 846,254 | 9,375,162 | ||||||||||||
Class B | 1,572 | 18,023 | 4,564 | 50,471 | ||||||||||||
Class C | 71,191 | 817,138 | 127,008 | 1,408,460 | ||||||||||||
Class I | 21,941 | 251,954 | 26,522 | 294,698 | ||||||||||||
| 3,044,679 | 34,889,717 | 4,938,498 | 54,829,900 | |||||||||||||
Shares redeemed: | ||||||||||||||||
Class A | (1,256,007 | ) | (14,377,707 | ) | (3,011,874 | ) | (33,272,048 | ) | ||||||||
Class B | (29,486 | ) | (337,211 | ) | (36,064 | ) | (396,032 | ) | ||||||||
Class B – automatic conversion to Class A Shares | (2,503 | ) | (28,578 | ) | (67,810 | ) | (750,886 | ) | ||||||||
Class C | (131,789 | ) | (1,510,379 | ) | (357,390 | ) | (3,959,122 | ) | ||||||||
Class I | (96,394 | ) | (1,097,462 | ) | (198,867 | ) | (2,204,000 | ) | ||||||||
| (1,516,179 | ) | (17,351,337 | ) | (3,672,005 | ) | (40,582,088 | ) | |||||||||
Net increase (decrease) | 1,528,500 | $ | 17,538,380 | 1,266,493 | $ | 14,247,812 | ||||||||||
| Michigan | ||||||||||||||||
| Six Months Ended 11/30/12 | Year Ended 5/31/12 | |||||||||||||||
| Shares | Amount | Shares | Amount | |||||||||||||
Shares sold: | ||||||||||||||||
Class A | 717,342 | $ | 8,525,082 | 917,339 | $ | 10,495,117 | ||||||||||
Class A – automatic conversion of Class B Shares | — | — | 64,230 | 739,735 | ||||||||||||
Class B (1) | — | — | 180 | 2,045 | ||||||||||||
Class C | 280,940 | 3,340,905 | 254,078 | 2,912,982 | ||||||||||||
Class I | 351,435 | 4,218,630 | 435,709 | 5,010,264 | ||||||||||||
Shares issued to shareholders due to reinvestment of distributions: | ||||||||||||||||
Class A | 173,992 | 2,071,782 | 289,643 | 3,318,158 | ||||||||||||
Class B | N/A | N/A | 666 | 7,549 | ||||||||||||
Class C | 22,644 | 269,204 | 39,702 | 454,560 | ||||||||||||
Class I | 29,814 | 354,854 | 49,039 | 561,716 | ||||||||||||
| 1,576,167 | 18,780,457 | 2,050,586 | 23,502,126 | |||||||||||||
Shares redeemed: | ||||||||||||||||
Class A | (834,322 | ) | (9,901,915 | ) | (1,584,843 | ) | (18,120,037 | ) | ||||||||
Class B (1) | — | — | (23,556 | ) | (268,908 | ) | ||||||||||
Class B – automatic conversion to Class A Shares | — | — | (64,132 | ) | (739,735 | ) | ||||||||||
Class C | (121,647 | ) | (1,445,634 | ) | (410,780 | ) | (4,655,846 | ) | ||||||||
Class I | (65,536 | ) | (778,745 | ) | (204,937 | ) | (2,327,716 | ) | ||||||||
| (1,021,505 | ) | (12,126,294 | ) | (2,288,248 | ) | (26,112,242 | ) | |||||||||
Net increase (decrease) | 554,662 | $ | 6,654,163 | (237,662 | ) | $ | (2,610,116 | ) | ||||||||
| (1) | Michigan does not offer Class B Shares. Class B Shares of Michigan converted to Class A Shares at the close of business on February 15, 2012, and are no longer available for dividend reinvestment or through an exchange from other Nuveen mutual funds. |
| Nuveen Investments | 97 |
Notes to Financial Statements (Unaudited) (continued)
| Missouri | ||||||||||||||||
| Six Months Ended 11/30/12 | Year Ended 5/31/12 | |||||||||||||||
| Shares | Amount | Shares | Amount | |||||||||||||
Shares issued in the Reorganization (1): | ||||||||||||||||
Class A | — | $ | — | 2,347,227 | $ | 26,692,203 | ||||||||||
Class B | — | — | — | — | ||||||||||||
Class C | — | — | — | — | ||||||||||||
Class I | — | — | 13,203,086 | 150,125,703 | ||||||||||||
Shares sold: | ||||||||||||||||
Class A | 1,602,355 | 18,568,608 | 3,235,606 | 36,069,843 | ||||||||||||
Class A – automatic conversion of Class B Shares | 5,474 | 63,715 | 33,272 | 367,252 | ||||||||||||
Class B | — | — | 98 | 1,090 | ||||||||||||
Class C | 358,147 | 4,148,875 | 612,475 | 6,852,081 | ||||||||||||
Class I | 1,421,389 | 16,498,526 | 2,729,020 | 31,000,075 | ||||||||||||
Shares issued to shareholders due to reinvestment of distributions: | ||||||||||||||||
Class A | 309,348 | 3,595,189 | 522,907 | 5,835,803 | ||||||||||||
Class B | 571 | 6,740 | 2,207 | 24,465 | ||||||||||||
Class C | 35,088 | 407,069 | 56,805 | 633,613 | ||||||||||||
Class I | 267,992 | 3,121,433 | 28,238 | 316,696 | ||||||||||||
| 4,000,364 | 46,410,155 | 22,770,941 | 257,918,824 | |||||||||||||
Shares redeemed: | ||||||||||||||||
Class A | (837,167 | ) | (9,712,408 | ) | (3,388,284 | ) | (37,862,489 | ) | ||||||||
Class B | (4,564 | ) | (51,396 | ) | (25,907 | ) | (286,251 | ) | ||||||||
Class B – automatic conversion to Class A Shares | (5,460 | ) | (63,715 | ) | (33,243 | ) | (367,252 | ) | ||||||||
Class C | (196,948 | ) | (2,283,039 | ) | (257,896 | ) | (2,872,792 | ) | ||||||||
Class I | (1,578,152 | ) | (18,312,779 | ) | (708,877 | ) | (8,012,117 | ) | ||||||||
| (2,622,291 | ) | (30,423,337 | ) | (4,414,207 | ) | (49,400,901 | ) | |||||||||
Net increase (decrease) | 1,378,073 | $ | 15,986,818 | 18,356,734 | $ | 208,517,923 | ||||||||||
| Ohio | ||||||||||||||||
| Six Months Ended 11/30/12 | Year Ended 5/31/12 | |||||||||||||||
| Shares | Amount | Shares | Amount | |||||||||||||
Shares issued in the Reorganization (1): | ||||||||||||||||
Class A | — | $ | — | 351,397 | $ | 4,072,374 | ||||||||||
Class B | — | — | — | — | ||||||||||||
Class C | — | — | — | — | ||||||||||||
Class I | — | — | 4,345,610 | 50,216,498 | ||||||||||||
Shares sold: | ||||||||||||||||
Class A | 2,193,132 | 25,899,923 | 2,736,123 | 31,191,510 | ||||||||||||
Class A – automatic conversion of Class B Shares | 133 | 1,578 | 34,397 | 384,024 | ||||||||||||
Class B | — | — | 328 | 3,699 | ||||||||||||
Class C | 894,699 | 10,531,663 | 946,512 | 10,800,354 | ||||||||||||
Class I | 1,562,317 | 18,387,564 | 862,023 | 9,857,084 | ||||||||||||
Shares issued to shareholders due to reinvestment of distributions: | ||||||||||||||||
Class A | 367,650 | 4,355,508 | 650,714 | 7,417,263 | ||||||||||||
Class B | 2,560 | 30,219 | 5,530 | 62,832 | ||||||||||||
Class C | 64,507 | 761,194 | 115,357 | 1,310,377 | ||||||||||||
Class I | 178,577 | 2,108,430 | 318,148 | 3,615,121 | ||||||||||||
| 5,263,575 | 62,076,079 | 10,366,139 | 118,931,136 | |||||||||||||
Shares redeemed: | ||||||||||||||||
Class A | (1,444,182 | ) | (17,061,590 | ) | (3,230,124 | ) | (36,696,313 | ) | ||||||||
Class B | (22,700 | ) | (267,786 | ) | (51,283 | ) | (575,239 | ) | ||||||||
Class B – automatic conversion to Class A Shares | (133 | ) | (1,578 | ) | (34,470 | ) | (384,024 | ) | ||||||||
Class C | (345,905 | ) | (4,072,752 | ) | (669,197 | ) | (7,635,125 | ) | ||||||||
Class I | (546,877 | ) | (6,448,256 | ) | (1,044,769 | ) | (11,839,073 | ) | ||||||||
| (2,359,797 | ) | (27,851,962 | ) | (5,029,843 | ) | (57,129,774 | ) | |||||||||
Net increase (decrease) | 2,903,778 | $ | 34,224,117 | 5,336,296 | $ | 61,801,362 | ||||||||||
(1) Refer to Footnote 8 – Fund Reorganizations for further details. |
| |||||||||||||||
| 98 | Nuveen Investments |
| Wisconsin | ||||||||||||||||
| Six Months Ended 11/30/12 | Year Ended 5/31/12 | |||||||||||||||
| Shares | Amount | Shares | Amount | |||||||||||||
Shares sold: | ||||||||||||||||
Class A | 735,526 | $ | 8,216,704 | 655,888 | $ | 7,082,522 | ||||||||||
Class A – automatic conversion of Class B Shares | — | — | 31,997 | 349,636 | ||||||||||||
Class B (2) | — | — | 17 | 185 | ||||||||||||
Class C | 555,444 | 6,214,908 | 308,011 | 3,328,514 | ||||||||||||
Class I | 864,430 | 9,679,805 | 2,051,353 | 22,009,349 | ||||||||||||
Shares issued to shareholders due to reinvestment of distributions: | ||||||||||||||||
Class A | 78,403 | 878,758 | 126,764 | 1,364,196 | ||||||||||||
Class B | N/A | N/A | 867 | 9,212 | ||||||||||||
Class C | 16,905 | 189,708 | 23,849 | 257,127 | ||||||||||||
Class I | 30,551 | 343,446 | 45,350 | 488,158 | ||||||||||||
| 2,281,259 | 25,523,329 | 3,244,096 | 34,888,899 | |||||||||||||
Shares redeemed: | ||||||||||||||||
Class A | (210,047 | ) | (2,344,650 | ) | (590,272 | ) | (6,289,132 | ) | ||||||||
Class B (2) | — | — | (22,129 | ) | (242,597 | ) | ||||||||||
Class B – automatic conversion to Class A Shares | — | — | (31,938 | ) | (349,636 | ) | ||||||||||
Class C | (96,049 | ) | (1,084,151 | ) | (86,112 | ) | (910,574 | ) | ||||||||
Class I | (341,650 | ) | (3,819,308 | ) | (917,078 | ) | (9,874,230 | ) | ||||||||
| (647,746 | ) | (7,248,109 | ) | (1,647,529 | ) | (17,666,169 | ) | |||||||||
Net increase (decrease) | 1,633,513 | $ | 18,275,220 | 1,596,567 | $ | 17,222,730 | ||||||||||
| (2) | Wisconsin does not offer Class B Shares. Class B Shares of Wisconsin converted to Class A Shares at the close of business on February 15, 2012, and are no longer available for dividend reinvestment or through an exchange from other Nuveen mutual funds. |
5. Investment Transactions
Purchases and sales (including maturities but excluding short-term investments, where applicable) during the six months ended November 30, 2012, were as follows:
| Kansas | Kentucky | Michigan | Missouri | Ohio | Wisconsin | |||||||||||||||||||
Purchases | $ | 32,923,340 | $ | 40,335,341 | $ | 24,813,608 | $ | 37,083,297 | $ | 55,648,954 | $ | 19,571,753 | ||||||||||||
Sales and maturities | 14,475,983 | 19,044,650 | 21,490,749 | 18,837,612 | 19,322,100 | 1,210,000 | ||||||||||||||||||
6. Income Tax Information
The following information is presented on an income tax basis. Differences between amounts for financial statement and federal income tax purposes are primarily due to timing differences in recognizing taxable market discount, timing differences in recognizing certain gains and losses on investment transactions and the treatment of investments in inverse floating rate securities reflected as financing transactions, if any. To the extent that differences arise that are permanent in nature, such amounts are reclassified within the capital accounts as detailed below. Temporary differences do not require reclassification. Temporary and permanent differences do not impact the net asset values of the Funds.
At November 30, 2012, the cost and unrealized appreciation (depreciation) of investments, as determined on a federal income tax basis, were as follows:
| Kansas | Kentucky | Michigan | Missouri | Ohio | Wisconsin | |||||||||||||||||||
Cost of investments | $ | 215,466,545 | $ | 414,696,492 | $ | 191,098,960 | $ | 433,416,747 | $ | 538,991,176 | $ | 102,629,230 | ||||||||||||
Gross unrealized: | ||||||||||||||||||||||||
Appreciation | $ | 23,239,018 | $ | 44,210,589 | $ | 21,942,464 | $ | 46,550,397 | $ | 61,285,567 | $ | 10,472,638 | ||||||||||||
Depreciation | (18,160 | ) | (36,638 | ) | (34,480 | ) | (923,524 | ) | (148,189 | ) | (15,261 | ) | ||||||||||||
Net unrealized appreciation (depreciation) of investments | $ | 23,220,858 | $ | 44,173,951 | $ | 21,907,984 | $ | 45,626,873 | $ | 61,137,378 | $ | 10,457,377 | ||||||||||||
Permanent differences, primarily due to federal taxes paid, taxable market discount, nondeductible reorganizational expenses and reorganizational adjustments, resulted in reclassifications among the Funds’ components of net assets at May 31, 2012, the Funds’ last tax year end, as follows:
| Kansas | Kentucky | Michigan | Missouri | Ohio | Wisconsin | |||||||||||||||||||
Capital paid-in | $ | 6,250 | $ | — | $ | 9,032 | $ | (13,420 | ) | $ | 941,972 | $ | 517 | |||||||||||
Undistributed (Over-distribution of) net investment income | (29,391 | ) | (15,848 | ) | (40,001 | ) | 5,138 | (31,643 | ) | (1,522 | ) | |||||||||||||
Accumulated net realized gain (loss) | 23,141 | 15,848 | 30,969 | 8,282 | (910,329 | ) | 1,005 | |||||||||||||||||
| Nuveen Investments | 99 |
Notes to Financial Statements (Unaudited) (continued)
The tax components of undistributed net tax-exempt income, net ordinary income and net long-term capital gains at May 31, 2012, the Funds’ last tax year end, were as follows:
| Kansas | Kentucky | Michigan | Missouri | Ohio | Wisconsin | |||||||||||||||||||
Undistributed net tax-exempt income* | $ | 789,594 | $ | 1,320,859 | $ | 903,914 | $ | 2,072,017 | $ | 3,711,557 | $ | 436,610 | ||||||||||||
Undistributed net ordinary income** | 41,387 | 10,914 | — | 10,886 | 58,062 | 6,012 | ||||||||||||||||||
Undistributed net long-term capital gains | 1,697,215 | — | — | 2,167 | — | — | ||||||||||||||||||
| * | Undistributed net tax-exempt income (on a tax basis) has not been reduced for the dividends declared during the period May 1, 2012 through May 31, 2012, and paid on June 1, 2012. |
| ** | Net ordinary income consists of taxable market discount income and net short-term capital gains, if any. |
The tax character of distributions paid during the Funds’ last tax year ended May 31, 2012, was designated for purposes of the dividends paid deduction as follows:
| Kansas | Kentucky | Michigan | Missouri | Ohio | Wisconsin | |||||||||||||||||||
Distributions from net tax-exempt income | $ | 7,140,628 | $ | 16,883,775 | $ | 7,817,648 | $ | 11,193,335 | $ | 19,950,770 | $ | 3,075,226 | ||||||||||||
Distributions from net ordinary income** | — | — | — | — | 240,637 | — | ||||||||||||||||||
Distributions from net long-term capital gains | — | — | — | — | — | — | ||||||||||||||||||
| ** | Net ordinary income consists of taxable market discount income and net short-term capital gains, if any. |
At May 31, 2012, the Funds’ last tax year end, the following Funds had unused capital loss carryforwards available for federal income tax purposes to be applied against future capital gains, if any. If not applied, the carryforwards will expire as follows:
| Kentucky | Michigan | Missouri* | Ohio* | Wisconsin | ||||||||||||||||
Expiration: | ||||||||||||||||||||
May 31, 2016 | $ | — | $ | — | $ | — | $ | 219,990 | $ | — | ||||||||||
May 31, 2017 | — | — | 368,288 | 204,682 | — | |||||||||||||||
May 31, 2018 | 3,710,023 | 1,966,080 | 663,355 | 30,607 | 40,757 | |||||||||||||||
May 31, 2019 | — | — | — | 2,149,014 | — | |||||||||||||||
Total | $ | 3,710,023 | $ | 1,966,080 | $ | 1,031,643 | $ | 2,604,293 | $ | 40,757 | ||||||||||
| * | A portion of Missouri’s and Ohio’s capital loss carryforward is subject to an annual limitation under Internal Revenue code and related regulations. |
During the Funds’ last tax year ended May 31, 2012, the following Funds utilized their capital loss carryforwards as follows:
| Kansas | Kentucky | Michigan | Missouri | Ohio | ||||||||||||||||
Utilized capital loss carryforwards | $ | 1,017,846 | $ | 644,127 | $ | 1,069,109 | $ | 247,269 | $ | 1,805,166 | ||||||||||
Under the Regulated Investment Company Modernization Act of 2010, capital losses incurred by the Funds after December 31, 2010, will not be subject to expiration. During the Funds’ last tax year ended May 31, 2012, the following Fund generated post-enactment capital losses as follows:
| Wisconsin | ||||
Post-enactment losses: | ||||
Short-term | $ | — | ||
Long-term | 306,610 | |||
The Funds have elected to defer losses incurred from November 1, 2011 through May 31, 2012, the Funds’ last tax year end, in accordance with federal income tax rules. These losses are treated as having arisen on the first day of the current fiscal year. The following Fund has elected to defer losses as follows:
| Wisconsin | ||||
Post-October capital losses | $ | 65,031 | ||
Late-year ordinary losses | — | |||
7. Management Fees and Other Transactions with Affiliates
Each Fund’s management fee consists of two components – a fund-level fee, based only on the amount of assets within each individual Fund, and a complex-level fee, based on the aggregate amount of all eligible fund assets managed by the Adviser. This pricing structure enables each Fund’s shareholders to benefit from growth in the assets within their respective Fund as well as from growth in the amount of complex-wide assets managed by the Adviser.
| 100 | Nuveen Investments |
The annual fund-level fee for each Fund, payable monthly, is calculated according to the following schedule:
| Average Daily Net Assets | Fund-Level Fee Rate | |||
For the first $125 million | .3500 | % | ||
For the next $125 million | .3375 | |||
For the next $250 million | .3250 | |||
For the next $500 million | .3125 | |||
For the next $1 billion | .3000 | |||
For the next $3 billion | .2750 | |||
For net assets over $5 billion | .2500 | |||
The annual complex-level fee for each Fund, payable monthly, is calculated according to the following schedule:
| Complex-Level Asset Breakpoint Level* | Effective Rate at Breakpoint Level | |||
$55 billion | .2000 | % | ||
$56 billion | .1996 | |||
$57 billion | .1989 | |||
$60 billion | .1961 | |||
$63 billion | .1931 | |||
$66 billion | .1900 | |||
$71 billion | .1851 | |||
$76 billion | .1806 | |||
$80 billion | .1773 | |||
$91 billion | .1691 | |||
$125 billion | .1599 | |||
$200 billion | .1505 | |||
$250 billion | .1469 | |||
$300 billion | .1445 | |||
| * | The complex-level fee is calculated based upon the aggregate daily “eligible assets” of all Nuveen Funds. Eligible assets do not include assets attributable to investments in other Nuveen Funds or assets in excess of $2 billion added to the Nuveen Fund complex in connection with the Adviser’s assumption of the management of the former First American Funds effective January 1, 2011. Eligible assets include closed-end fund assets managed by the Adviser that are attributable to financial leverage. For these purposes, financial leverage includes the closed-end funds’ use of preferred stock and borrowings and certain investments in the residual interest certificates (also called inverse floating rate securities) in tender option bond (TOB) trusts, including the portion of assets held by a TOB trust that has been effectively financed by the trust’s issuance of floating rate securities, subject to an agreement by the Adviser as to certain funds to limit the amount of such assets for determining eligible assets in certain circumstances. As of November 30, 2012, the complex-level fee rate for each of these Funds was as follows: |
| Fund | Complex-Level Fee Rate | |||
Kansas | 0.1684 | % | ||
Kentucky | 0.1684 | |||
Michigan | 0.1684 | |||
Missouri | 0.1775 | |||
Ohio | 0.1713 | |||
Wisconsin | 0.1684 | |||
The management fee compensates the Adviser for overall investment advisory and administrative services and general office facilities. The Adviser is responsible for each Fund’s overall investment strategy and asset allocation decisions. The Adviser has entered into sub-advisory agreements with the Sub-Adviser under which the Sub-Adviser manages the investment portfolios of the Funds. The Sub-Adviser is compensated for its services to the Funds from the management fees paid to the Adviser.
The Adviser has agreed to waive fees and/or reimburse expenses so that total annual Fund operating expenses (excluding 12b-1 distribution and service fees, interest expenses, taxes, fees incurred in acquiring and disposing of portfolio securities, acquired fund fees and expenses and extraordinary expenses) for Ohio do not exceed .750% of the average daily net assets of any class of Fund shares. The Adviser may also voluntarily reimburse additional expenses from time to time in any of the Funds. Voluntary reimbursements may be terminated at any time at the Adviser’s discretion.
The Trust pays no compensation directly to those of its trustees who are affiliated with the Adviser or to its officers, all of whom receive remuneration for their services to the Trust from the Adviser or its affiliates. The Board of Trustees has adopted a deferred compensation plan for independent trustees that enables trustees to elect to defer receipt of all or a portion of the annual compensation they are entitled to receive from certain Nuveen-advised funds. Under the plan, deferred amounts are treated as though equal dollar amounts had been invested in shares of select Nuveen-advised funds.
| Nuveen Investments | 101 |
Notes to Financial Statements (Unaudited) (continued)
During the six months ended November 30, 2012, Nuveen Securities, LLC (the “Distributor”), a wholly-owned subsidiary of Nuveen, collected sales charges on purchases of Class A Shares, the majority of which were paid out as concessions to financial intermediaries as follows:
| Kansas | Kentucky | Michigan | Missouri | Ohio | Wisconsin | |||||||||||||||||||
Sales charges collected | $ | 402,487 | $ | 329,659 | $ | 126,843 | $ | 397,096 | $ | 289,851 | $ | 146,193 | ||||||||||||
Paid to financial intermediaries | 351,372 | 288,007 | 108,422 | 345,354 | 252,497 | 127,935 | ||||||||||||||||||
The Distributor also received 12b-1 service fees on Class A Shares, substantially all of which were paid to compensate financial intermediaries for providing services to shareholders relating to their investments.
During the six months ended November 30, 2012, the Distributor compensated financial intermediaries directly with commission advances at the time of purchase as follows:
| Kansas | Kentucky | Michigan | Missouri | Ohio | Wisconsin | |||||||||||||||||||
Commission advances | $ | 123,073 | $ | 111,303 | $ | 31,690 | $ | 91,199 | $ | 145,056 | $ | 64,481 | ||||||||||||
To compensate for commissions advanced to financial intermediaries, all 12b-1 service fees collected on Class B Shares during the first year following a purchase, all 12b-1 distribution fees collected on Class B Shares, and all 12b-1 service and distribution fees collected on Class C Shares during the first year following a purchase are retained by the Distributor. During the six months ended November 30, 2012, the Distributor retained such 12b-1 fees as follows:
| Kansas | Kentucky | Michigan | Missouri | Ohio | Wisconsin | |||||||||||||||||||
12b-1 fees retained | $ | 66,842 | $ | 54,742 | $ | 17,877 | $ | 37,642 | $ | 63,351 | $ | 19,357 | ||||||||||||
The remaining 12b-1 fees charged to the Funds were paid to compensate financial intermediaries for providing services to shareholders relating to their investments.
The Distributor also collected and retained CDSC on share redemptions during the six months ended November 30, 2012, as follows:
| Kansas | Kentucky | Michigan | Missouri | Ohio | Wisconsin | |||||||||||||||||||
CDSC retained | $ | 2,695 | $ | 333 | $ | 195 | $ | 3,336 | $ | 4,207 | $ | 3,039 | ||||||||||||
8. Fund Reorganizations
During the fiscal year ended May 31, 2012, the following Nuveen open-end funds were reorganized into the following Funds included in this report as follows (each the “Reorganization” and collectively, the “Reorganizations”):
| • | Nuveen Missouri Tax Free Fund (“Missouri Tax Free”) into Missouri; and |
| • | Nuveen Ohio Tax Free Fund (“Ohio Tax Free”) into Ohio. |
Missouri Tax Free and Ohio Tax Free are collectively the “Acquired Funds.” Missouri and Ohio are collectively the “Acquiring Funds.”
The Adviser proposed the Reorganizations of the Acquired Funds into the Acquiring Funds, as well as a number of other fund reorganizations between funds with similar investment objectives and policies, as part of an initiative to eliminate certain redundancies among the products it offers and in an effort to achieve certain operating efficiencies. The Acquired Funds’ Board of Directors determined that the Reorganizations were in the best interest of the Acquired Funds and that the interests of existing shareholders would not be diluted as a result of the Reorganizations. The Board of Directors unanimously approved the Reorganizations on September 20, 2011.
A special meeting of Missouri Tax Free’s and Ohio Tax Free’s shareholders was held on February 16, 2012, for the purpose of voting on the Reorganizations, at which time, each of the Reorganizations were approved. The Reorganizations were consummated at the close of business on March 9, 2012.
Upon consummation of each Reorganization, the Acquired Funds transferred all of their assets and liabilities to the Acquiring Funds in exchange for the Acquiring Funds’ shares of equal value. The Acquiring Funds’ shares were then distributed to the Acquired Funds’ shareholders and the Acquired Funds were terminated. As a result of the Reorganizations, the Acquired Funds’ shareholders became shareholders of the Acquiring Funds and the Acquired Funds’ shareholders received the Acquiring Funds’ shares with a total value equal to the total value of their Acquired Funds’ shares immediately prior to the closing of their Reorganization.
The Reorganizations were structured to qualify as tax-free reorganizations under the Internal Revenue Code for federal income tax purposes, and the Acquired Funds’ shareholders will recognize no gain or loss for federal income tax purposes as a result of the Reorganizations. Prior to the closing of each of the Reorganizations, the Acquired Funds distributed all of their net investment income and capital gains, if any. Such a distribution may be taxable to the Acquired Funds’ shareholders for federal income tax purposes.
| 102 | Nuveen Investments |
The cost, fair value and net unrealized appreciation (depreciation) of the investments of the Acquired Funds as of the date of the Reorganizations were as follows:
| Missouri Tax Free | Ohio Tax Free | |||||||
Cost of investments | $ | 161,788,408 | $ | 49,965,589 | ||||
Fair value of investments | 172,688,737 | 53,532,979 | ||||||
Unrealized appreciation (depreciation) of investments | 10,900,279 | 3,567,390 | ||||||
For financial reporting purposes, assets received and shares issued by the Acquiring Funds were recorded at fair value; however, the cost basis of the investments received from the Acquired Funds were carried forward to align ongoing reporting of the Acquiring Funds’ realized and unrealized gains and losses with amounts distributable to shareholders for tax purposes.
For accounting and performance reporting purposes, the Acquiring Funds are the survivors. The shares outstanding, net assets and net asset value (“NAV”) per share immediately before and after the Reorganizations are as follows:
| Acquired Funds – Prior to Reorganizations | Shares Outstanding | Net Assets | NAV per Share | |||||||||
Missouri Tax Free | ||||||||||||
Class A | 2,014,487 | $ | 24,932,701 | $ | 12.38 | |||||||
Class C1 | 142,600 | 1,759,503 | 12.34 | |||||||||
Class I | 12,130,585 | 150,125,702 | 12.38 | |||||||||
Ohio Tax Free | ||||||||||||
Class A | 211,685 | 2,291,286 | 10.82 | |||||||||
Class C1 | 166,843 | 1,781,088 | 10.68 | |||||||||
Class I | 4,638,858 | 50,216,498 | 10.83 | |||||||||
| Acquiring Funds – Prior to Reorganizations | Shares Outstanding | Net Assets | NAV per Share | |||||||||
Missouri | ||||||||||||
Class A | 17,359,459 | $ | 197,408,414 | $ | 11.37 | |||||||
Class B | 48,162 | 548,011 | 11.38 | |||||||||
Class C | 2,772,579 | 31,475,271 | 11.35 | |||||||||
Class I | 2,508,565 | 28,523,583 | 11.37 | |||||||||
Ohio | ||||||||||||
Class A | 26,582,704 | 308,070,336 | 11.59 | |||||||||
Class B | 180,652 | 2,088,204 | 11.56 | |||||||||
Class C | 5,787,394 | 66,830,674 | 11.55 | |||||||||
Class I | 10,026,321 | 115,861,225 | 11.56 | |||||||||
| Acquiring Funds – Post Reorganizations | Shares Outstanding | Net Assets | NAV per Share | |||||||||
Missouri | ||||||||||||
Class A | 19,706,686 | $ | 224,100,618 | $ | 11.37 | |||||||
Class B | 48,162 | 548,011 | 11.38 | |||||||||
Class C | 2,772,579 | 31,475,271 | 11.35 | |||||||||
Class I | 15,711,651 | 178,649,285 | 11.37 | |||||||||
Ohio | ||||||||||||
Class A | 26,934,101 | 312,142,710 | 11.59 | |||||||||
Class B | 180,652 | 2,088,204 | 11.56 | |||||||||
Class C | 5,787,394 | 66,830,674 | 11.55 | |||||||||
Class I | 14,371,931 | 166,077,723 | 11.56 | |||||||||
The beginning of the Acquired Funds’ fiscal period was June 1, 2011.
Assuming the Reorganizations had been completed on June 1, 2011, the beginning of the Acquiring Funds’ fiscal period, the pro forma results of operations for the Acquired Funds for the period June 1, 2011 through March 9, 2012, each Fund’s Reorganization date, are as follows:
| Missouri Tax Free | Ohio Tax Free | |||||||
Net investment income (loss) | $ | (34,657 | ) | $ | (48,565 | ) | ||
Net realized and unrealized gains (losses) | 11,238,276 | 3,611,723 | ||||||
Change in net assets resulting from operations | 9,797,872 | 2,532,911 | ||||||
Because the combined investment portfolios for each Reorganization have been managed as a single integrated portfolio since each Reorganization was completed, it was not practicable to separate the amounts of revenue and earnings of the Acquired Funds that had been included in the Statement of Operations since the Reorganizations were consummated.
| Nuveen Investments | 103 |
Notes to Financial Statements (Unaudited) (continued)
9. New Accounting Pronouncements
Financial Accounting Standards Board (“FASB”) Balance Sheet (Topic 210): Disclosures about Offsetting Assets and Liabilities In December 2011, the FASB issued Accounting Standards Update (“ASU”) No. 2011-11 (“ASU No. 2011-11”) to enhance disclosures about financial instruments and derivative instruments that are subject to offsetting (“netting”) on the Statement of Assets and Liabilities. This information will enable users of the entity’s financial statements to evaluate the effect or potential effect of netting arrangements on the entity’s financial position. ASU No. 2011-11 is effective prospectively during interim or annual periods beginning on or after January 1, 2013. At this time, management is evaluating the implications of this guidance and the impact it will have to the financial statements amounts and footnote disclosures, if any.
| 104 | Nuveen Investments |
Notes
| Nuveen Investments | 105 |
Glossary of Terms Used in this Report
Average Annual Total Return: This is a commonly used method to express an investment’s performance over a particular, usually multi-year time period. It expresses the return that would have been necessary each year to equal the investment’s actual cumulative performance (including change in NAV or offer price and reinvested dividends and capital gains distributions, if any) over the time period being considered.
Average Maturity: For a bond fund or defined portfolio, the average of the stated maturity dates of the fixed-income securities held. In general, the longer the average maturity, the greater the fund’s or defined portfolio’s sensitivity to interest-rate changes, which means greater price fluctuation. A shorter average maturity usually means a less sensitive, and consequently, less volatile, portfolio.
Duration: Duration is a measure of the expected period over which a bond’s principal and interest will be paid, and consequently is a measure of the sensitivity of a bond’s (or bond fund’s) value to changes when market interest rates change. Generally, the longer a bond or Fund’s duration, the more the price of the bond or Fund will change as interest rates change.
Gross Domestic Product (GDP): The total market value of all final goods and services produced in a country/region in a given year, equal to total consumer, investment and government spending, plus the value of exports, minus the value of imports.
Inverse Floating Rate Securities: Inverse floating rate securities, also known as inverse floaters or tender option bonds (TOBs), are created by depositing a municipal bond, typically with a fixed interest rate, into a special purpose trust created by a broker-dealer. This trust, in turn, (a) issues floating rate certificates typically paying short-term tax-exempt interest rates to third parties in amounts equal to some fraction of the deposited bond’s par amount or market value, and (b) issues an inverse floating rate certificate (sometimes referred to as an “inverse floater”) to an investor (such as a Fund) interested in gaining investment exposure to a long-term municipal bond. The income received by the holder of the inverse floater varies inversely with the short-term rate paid to the floating rate certificates’ holders, and in most circumstances the holder of the inverse floater bears substantially all of the underlying bond’s downside investment risk. The holder of the inverse floater typically also benefits disproportionately from any potential appreciation of the underlying bond’s value. Hence, an inverse floater essentially represents an investment in the underlying bond on a leveraged basis.
Leverage: Leverage is created whenever a fund has investment exposure (both reward and/or risk) equivalent to more than 100% of the investment capital.
Lipper Michigan Municipal Debt Funds Classification Average: Represents the average annualized total return for all reporting funds in the Lipper Michigan Municipal Debt Funds Classification. Lipper returns account for the effects of management fees and assume reinvestment of distributions, but do not reflect any applicable sales charge.
Lipper Ohio Municipal Debt Funds Classification Average: Represents the average annualized total return for all reporting funds in the Lipper Ohio Municipal Debt Funds Classification. Lipper returns account for the effects of management fees and assume reinvestment of distributions, but do not reflect any applicable sales charge.
Lipper Other States Municipal Debt Funds Classification Average: Represents the average annualized total return for all reporting funds in the Lipper Other States Municipal Debt Funds Classification. Shareholders should note that the performance of the Lipper Other States Average represents the overall average of returns for funds from ten different states with a wide variety of municipal market conditions, making direct comparisons less meaningful. Lipper returns account for the effects of management fees and assume reinvestment of distributions, but do not reflect any applicable sales charge.
Net Asset Value (NAV): The net market value of all securities held in a portfolio.
Net Asset Value (NAV) Per Share: The market value of one share of a mutual fund or closed-end fund. For a Fund, the NAV is calculated daily by taking the Fund’s total assets (securities, cash, and accrued earnings), subtracting the Funds’s liabilities, and dividing by the number of shares outstanding.
Pre-Refundings: Pre-Refundings, also known as advance refundings or refinancings, occur when an issuer sells new bonds and uses the proceeds to fund principal and interest payments of older existing bonds. This process often results in lower borrowing costs for bond issuers.
S&P Kansas Municipal Bond Index: An unleveraged, market value-weighted index designed to measure the performance of the tax-exempt, investment-grade Kansas municipal bond market. Index returns assume reinvestment of distributions, but do not reflect any applicable sales charges or management fees.
S&P Kentucky Municipal Bond Index: An unleveraged, market value-weighted index designed to measure the performance of the tax-exempt, investment-grade Kentucky municipal bond market. Index returns assume reinvestment of distributions, but do not reflect any applicable sales charges or management fees.
S&P Michigan Municipal Bond Index: An unleveraged, market value-weighted index designed to measure the performance of the tax-exempt, investment-grade Michigan municipal bond market. Index returns assume reinvestment of distributions, but do not reflect any applicable sales charges or management fees.
S&P Missouri Municipal Bond Index: An unleveraged, market value-weighted index designed to measure the performance of the tax-exempt, investment-grade Missouri municipal bond market. Index returns assume reinvestment of distributions, but do not reflect any applicable sales charges or management fees.
S&P Municipal Bond Index: An unleveraged, market value-weighted index designed to measure the performance of the tax-exempt, investment-grade U.S. municipal bond market. Index returns assume reinvestment of distributions, but do not reflect any applicable sales charges or management fees.
S&P Ohio Municipal Bond Index: An unleveraged, market value-weighted index designed to measure the performance of the tax-exempt, investment-grade Ohio municipal bond market. Index returns assume reinvestment of distributions, but do not reflect any applicable sales charges or management fees.
S&P Wisconsin Municipal Bond Index: An unleveraged, market value-weighted index designed to measure the performance of the tax-exempt, investment-grade Wisconsin municipal bond market. Index returns assume reinvestment of distributions, but do not reflect any applicable sales charges or management fees.
Zero Coupon Bond: A zero coupon bond does not pay a regular interest coupon to its holders during the life of the bond. Tax-exempt income to the holder of the bond comes from accretion of the difference between the original purchase price of the bond at issuance and the par value of the bond at maturity and is effectively paid at maturity. The market prices of zero coupon bonds generally are more volatile than the market prices of bonds that pay interest periodically.
| 106 | Nuveen Investments |
Fund Manager
Nuveen Fund Advisors, LLC
333 West Wacker Drive
Chicago, IL 60606
Sub-Adviser
Nuveen Asset Management, LLC
333 West Wacker Drive
Chicago, IL 60606
Legal Counsel
Chapman and Cutler LLP
Chicago, IL
Independent Registered Public Accounting Firm
PricewaterhouseCoopers LLP
Chicago, IL
Custodian
State Street Bank & Trust Company
Boston, MA
Transfer Agent and Shareholder Services
Boston Financial
Data Services, Inc.
Nuveen Investor Services
P.O. Box 8530
Boston, MA 02266-8530
(800) 257-8787
Quarterly Portfolio of Investments and Proxy Voting information: You may obtain (i) each Fund’s quarterly portfolio of investments, (ii) information regarding how each Fund voted proxies relating to portfolio securities held during the most recent twelve-month period ended June 30, and (iii) a description of the policies and procedures that each Fund used to determine how to vote proxies relating to portfolio securities without charge, upon request, by calling Nuveen Investments at (800) 257-8787 or on Nuveen’s website at www.nuveen.com.
You may also obtain this and other Fund information directly from the Securities and Exchange Commission (SEC). The SEC may charge a copying fee for this information. Visit the SEC on-line at http://www.sec.gov or in person at the SEC’s Public Reference Room in Washington, D.C. Call the SEC at (202) 942-8090 for room hours and operation. You may also request Fund information by sending an e-mail request to publicinfo@sec.gov or by writing to the SEC’s Public Reference Section at 100 F Street NE, Washington, D.C. 20549.
The Financial Industry Regulatory Authority (FINRA) provides a Public Disclosure Program which supplies certain information regarding the disciplinary history of FINRA members and their associated persons in response to either telephone inquiries at (800) 289-9999 or written inquiries at www.finra.org. FINRA also provides an investor brochure that includes information describing the Public Disclosure Program.
| Nuveen Investments | 107 |
Nuveen Investments:
Serving Investors for Generations
Since 1898, financial advisors and their clients have relied on Nuveen Investments to provide dependable investment solutions through continued adherence to proven, long-term investing principles. Today, we offer a range of high quality equity and fixed-income solutions designed to be integral components of a well-diversified core portfolio.
Focused on meeting investor needs.
Nuveen Investments provides high-quality investment services designed to help secure the longterm goals of institutional and individual investors as well as the consultants and financial advisors who serve them. Nuveen Investments markets a wide range of specialized investment solutions which provide investors access to capabilities of its high-quality boutique investment affiliates-Nuveen Asset Management, Symphony Asset Management, NWQ Investment Management Company, Santa Barbara Asset Management, Tradewinds Global Investors, Winslow Capital Management, and Gresham Investment Management. In total, Nuveen Investments managed approximately $220 billion as of September 30, 2012.
Find out how we can help you.
To learn more about how the products and services of Nuveen Investments may be able to help you meet your financial goals, talk to your financial advisor, or call us at (800) 257-8787. Please read the information provided carefully before you invest. Investors should consider the investment objective and policies, risk considerations, charges and expenses of any investment carefully. Where applicable, be sure to obtain a prospectus, which contains this and other relevant information. To obtain a prospectus, please contact your securities representative or Nuveen Investments, 333 W. Wacker Dr., Chicago, IL 60606. Please read the prospectus carefully before you invest or send money.
Learn more about Nuveen Funds at: www.nuveen.com/mf
Distributed by Nuveen Securities, LLC 333 West Wacker Drive Chicago, IL 60606 www.nuveen.com |
MSA-MS6-1112D
Item 2. Code of Ethics.
Not applicable to this filing.
Item 3. Audit Committee Financial Expert.
Not applicable to this filing.
Item 4. Principal Accountant Fees and Services.
Not applicable to this filing.
Item 5. Audit Committee of Listed Registrants.
Not applicable to this registrant.
Item 6. Schedule of Investments.
(a) See Portfolio of Investments in Item 1.
(b) Not applicable.
Item 7. Disclosure of Proxy Voting Policies and Procedures for Closed-End Management Investment Companies.
Not applicable to this registrant.
Item 8. Portfolio Managers of Closed-End Management Investment Companies.
Not applicable to this registrant.
Item 9. Purchases of Equity Securities by Closed-End Management Investment Company and Affiliated Purchasers.
Not applicable to this registrant.
Item 10. Submission of Matters to a Vote of Security Holders.
There have been no material changes to the procedures by which shareholders may recommend nominees to the registrant’s Board implemented after the registrant last provided disclosure in response to this Item.
Item 11. Controls and Procedures.
| (a) | The registrant’s principal executive and principal financial officers, or persons performing similar functions, have concluded that the registrant’s disclosure controls and procedures (as defined in Rule 30a-3(c) under the Investment Company Act of 1940, as amended (the “1940 Act”) (17 CFR 270.30a-3(c))) are effective, as of a date within 90 days of the filing date of this report that includes the disclosure required by this paragraph, based on their evaluation of the controls and procedures required by Rule 30a-3(b) under the 1940 Act (17 CFR 270.30a-3(b)) and Rules 13a-15(b) or 15d-15(b) under the Securities Exchange Act of 1934, as amended (the “Exchange Act”) (17 CFR 240.13a-15(b) or 240.15d-15(b)). |
| (b) | There were no changes in the registrant’s internal control over financial reporting (as defined in Rule 30a-3(d) under the 1940 Act (17 CFR 270.30a-3(d)) that occurred during the second fiscal quarter of the period covered by this report that has materially affected, or is reasonably likely to materially affect, the registrant’s internal control over financial reporting. |
Item 12. Exhibits.
File the exhibits listed below as part of this Form.
(a)(1) Any code of ethics, or amendment thereto, that is the subject of the disclosure required by Item 2, to the extent that the registrant intends to satisfy the Item 2 requirements through filing of an exhibit: Not applicable to this filing.
(a)(2) A separate certification for each principal executive officer and principal financial officer of the registrant as required by Rule 30a-2(a) under the 1940 Act (17 CFR 270.30a-2(a)) in the exact form set forth below: See EX-99.CERT attached hereto.
(a)(3) Any written solicitation to purchase securities under Rule 23c-1 under the 1940 Act (17 CFR 270.23c-1) sent or given during the period covered by the report by or on behalf of the registrant to 10 or more persons: Not applicable to this registrant.
(b) If the report is filed under Section 13(a) or 15(d) of the Exchange Act, provide the certifications required by Rule 30a-2(b) under the 1940 Act (17 CFR 270.30a-2(b)), Rule 13a-14(b) or Rule 15d-14(b) under the Exchange Act (17 CFR 240.13a-14(b) or 240.15d-14(b)), and Section 1350 of Chapter 63 of Title 18 of the United States Code (18 U.S.C. 1350) as an Exhibit. A certification furnished pursuant to this paragraph will not be deemed “filed” for purposes of Section 18 of the Exchange Act (15 U.S.C. 78r), or otherwise subject to the liability of that section. Such certification will not be deemed to be incorporated by reference into any filing under the Securities Act of 1933 or the Exchange Act, except to the extent that the registration specifically incorporates it by reference: See EX-99.906 CERT attached hereto.
SIGNATURES
Pursuant to the requirements of the Securities Exchange Act of 1934 and the Investment Company Act of 1940, the registrant has duly caused this report to be signed on its behalf by the undersigned, thereunto duly authorized.
(Registrant) Nuveen Multistate Trust IV
| By | (Signature and Title) | /s/ Kevin J. McCarthy | ||||
Kevin J. McCarthy Vice President and Secretary |
Date: February 7, 2013
Pursuant to the requirements of the Securities Exchange Act of 1934 and the Investment Company Act of 1940, this report has been signed below by the following persons on behalf of the registrant and in the capacities and on the dates indicated.
| By | (Signature and Title) | /s/ Gifford R. Zimmerman | ||||
Gifford R. Zimmerman Chief Administrative Officer (principal executive officer) |
Date: February 7, 2013
| By | (Signature and Title) | /s/ Stephen D. Foy | ||||
Stephen D. Foy Vice President and Controller (principal financial officer) |
Date: February 7, 2013