| Investment Company Act file number | 811-07751 |
| Item 1. | Reports to Stockholders. |
 | Annual Shareholder Report May 31, 2024 |
| Cost of a $10,000 investment | Costs paid as a percentage of $10,000 investment | |||
| Class A Shares | $81 | 0.81% |
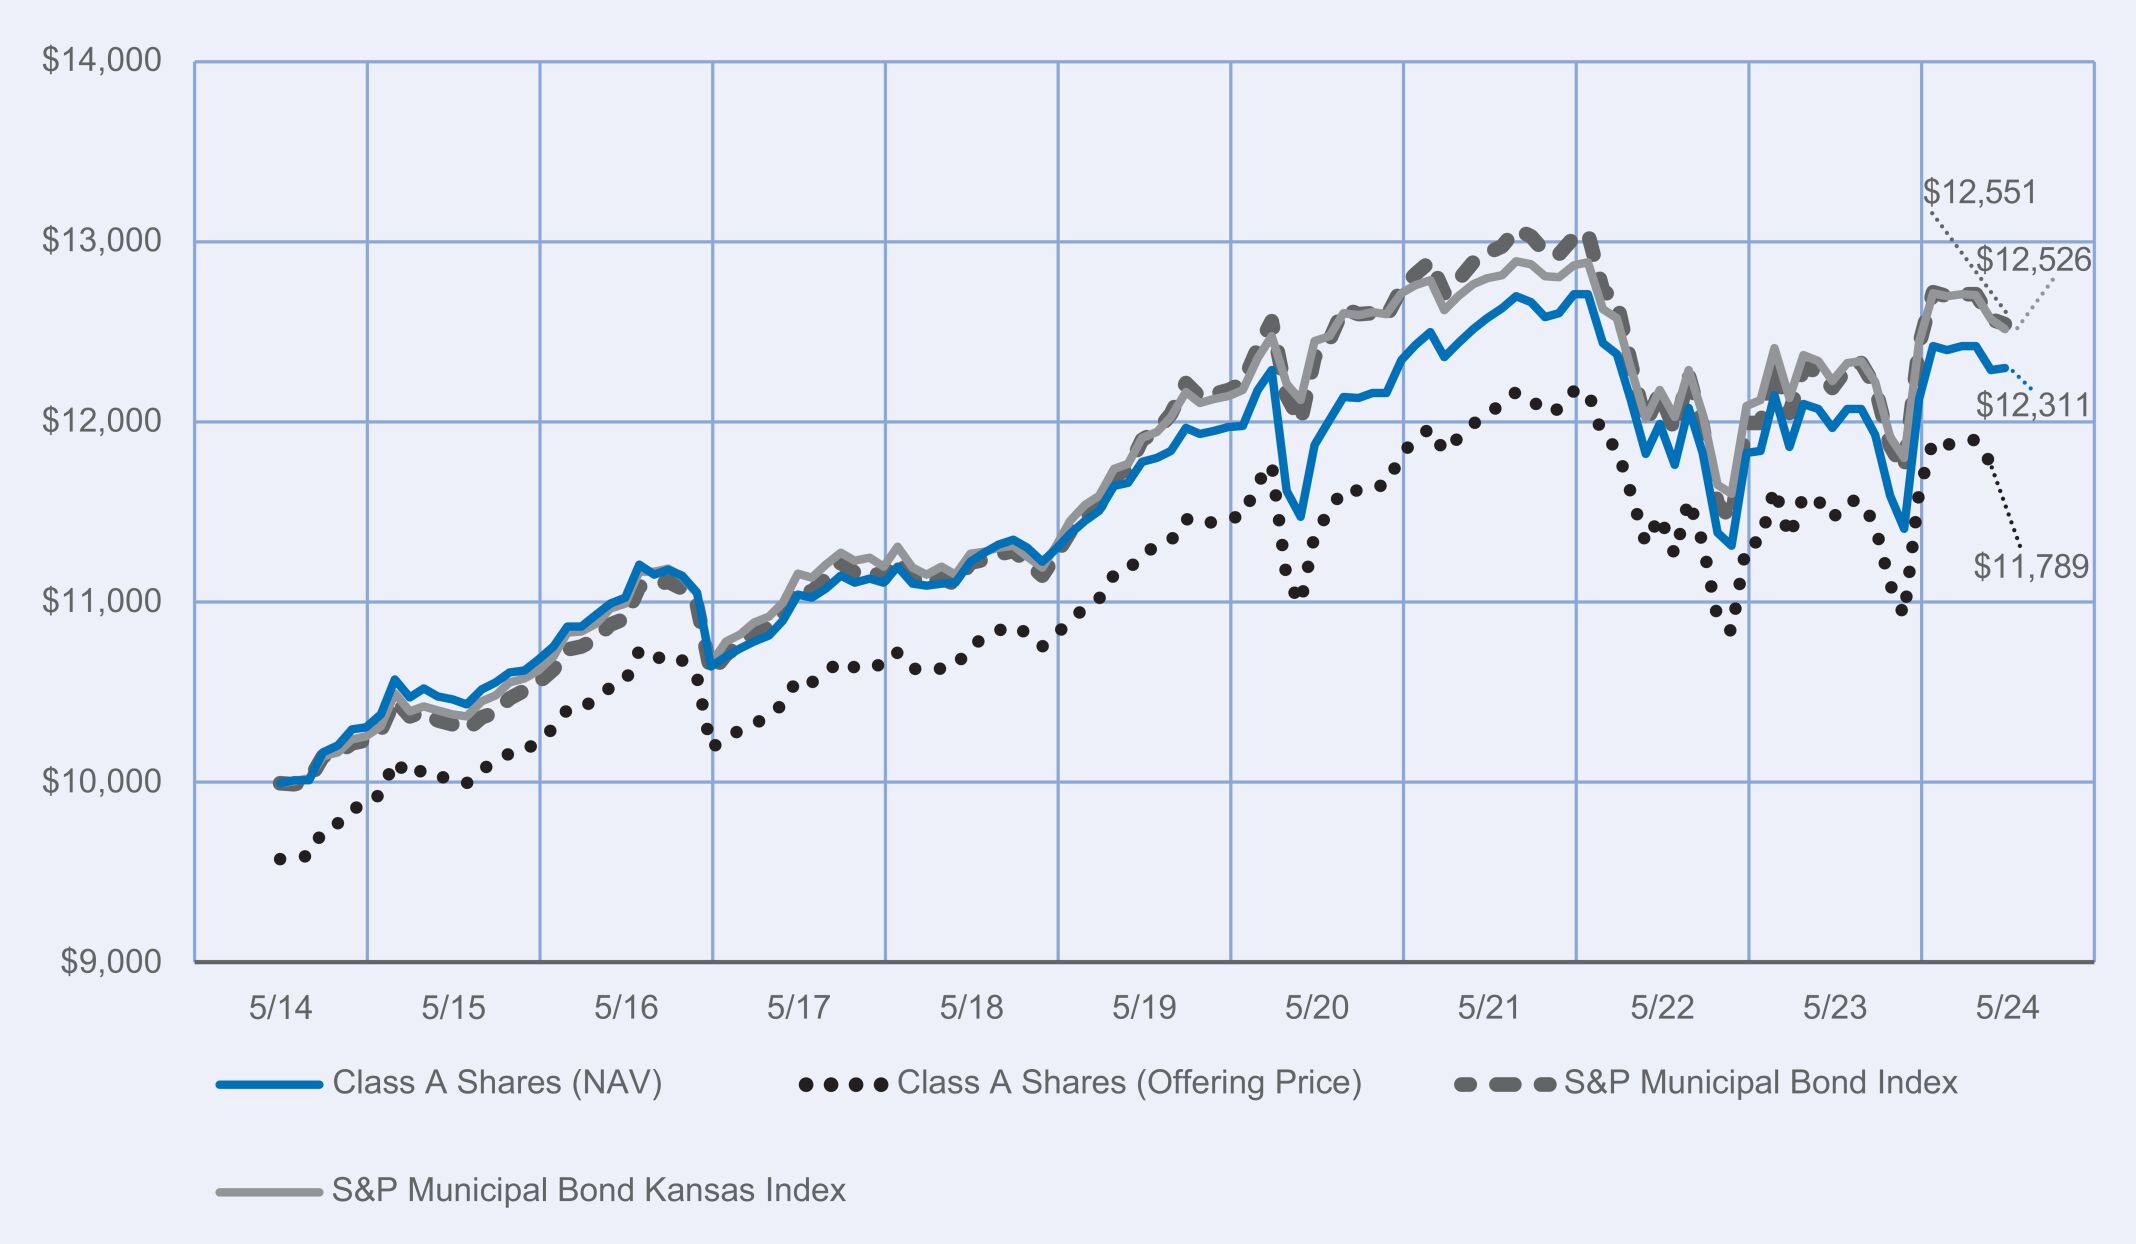
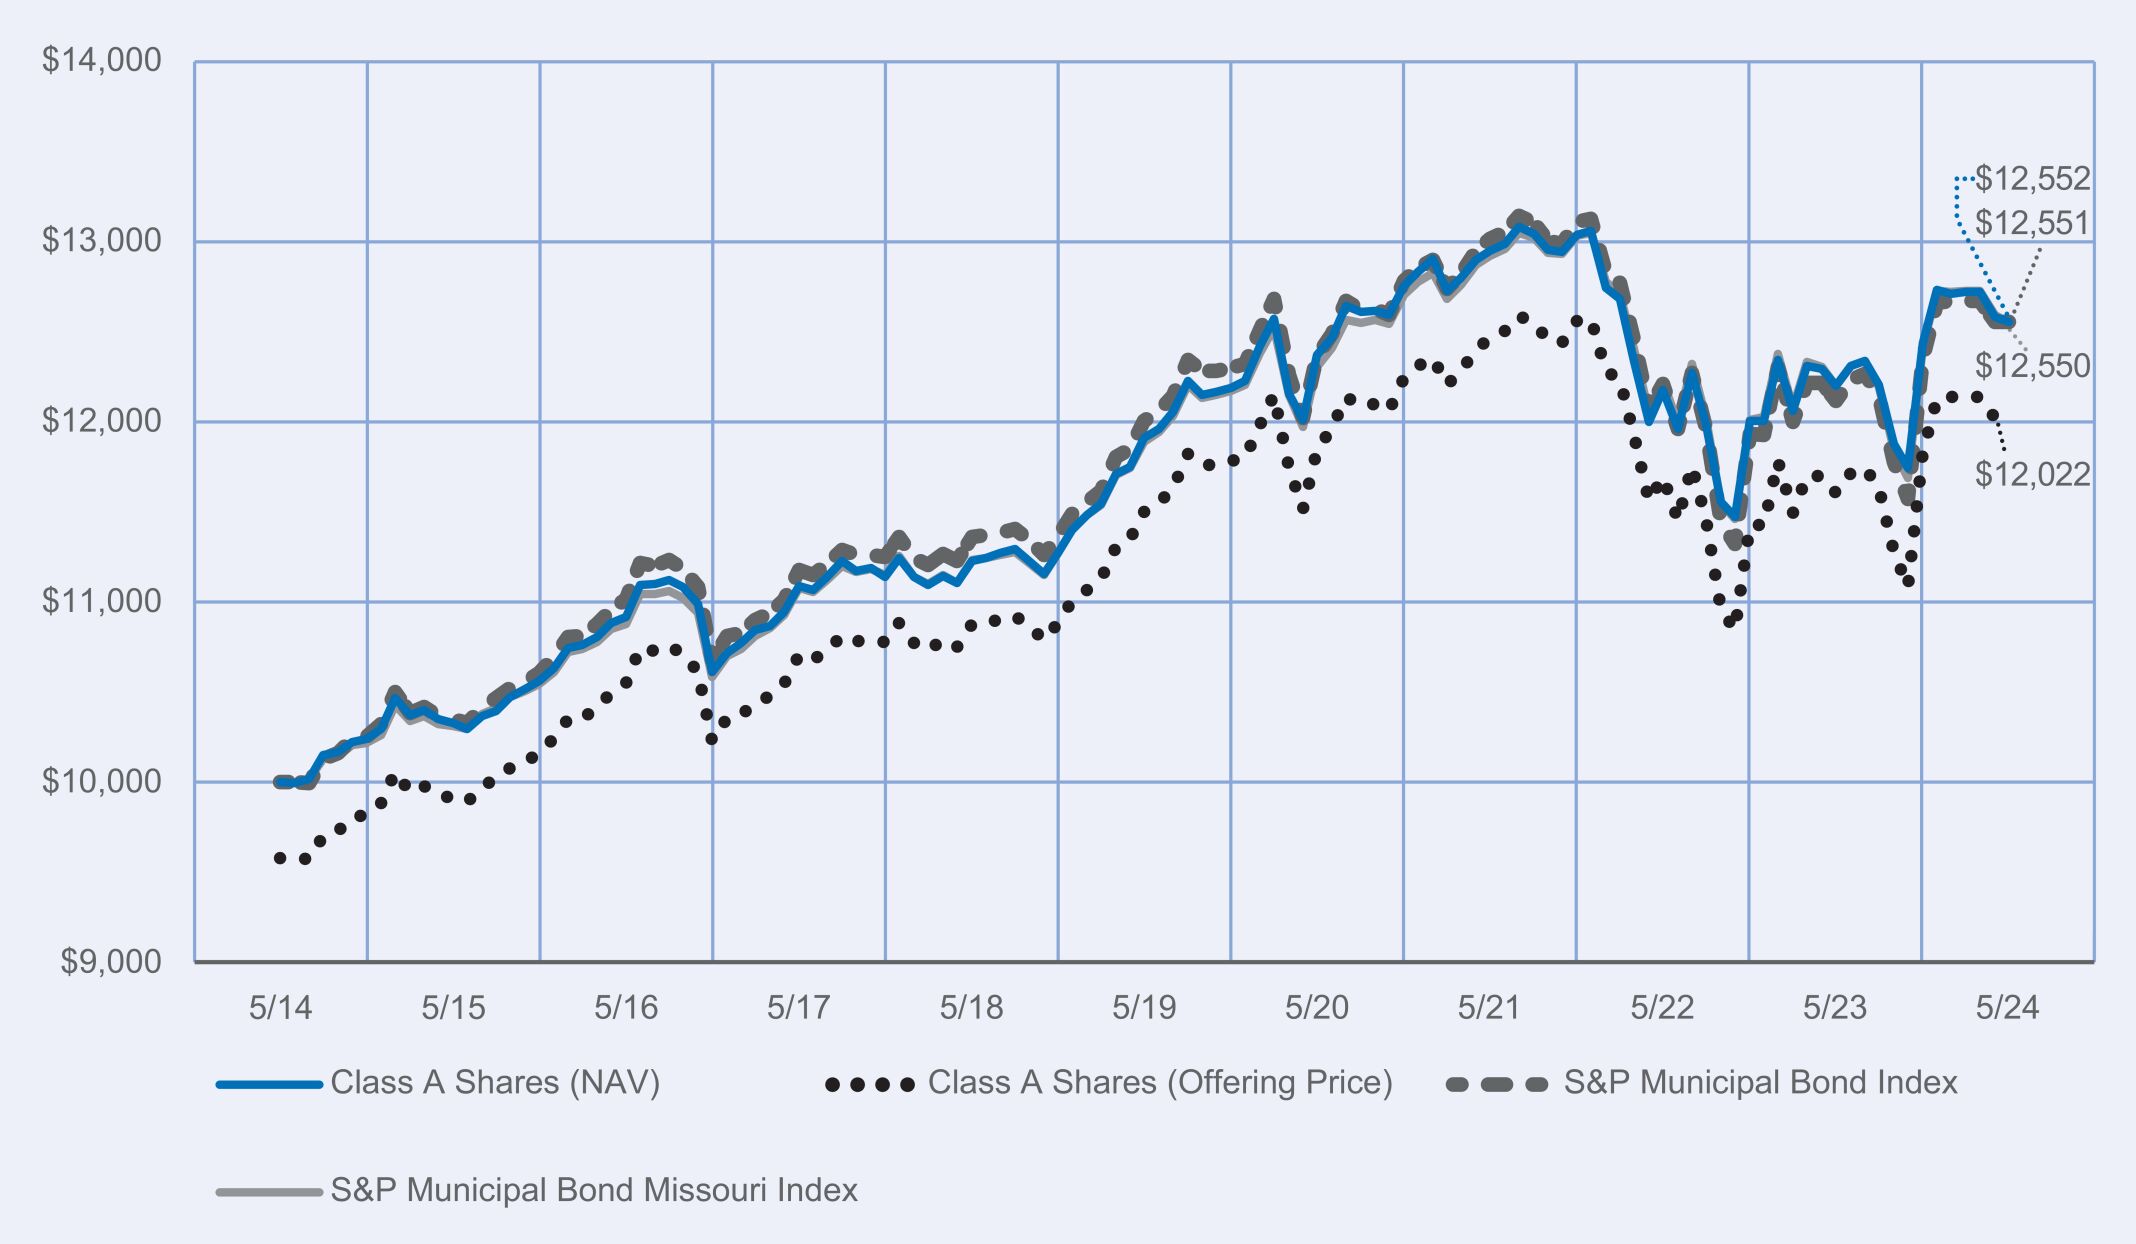
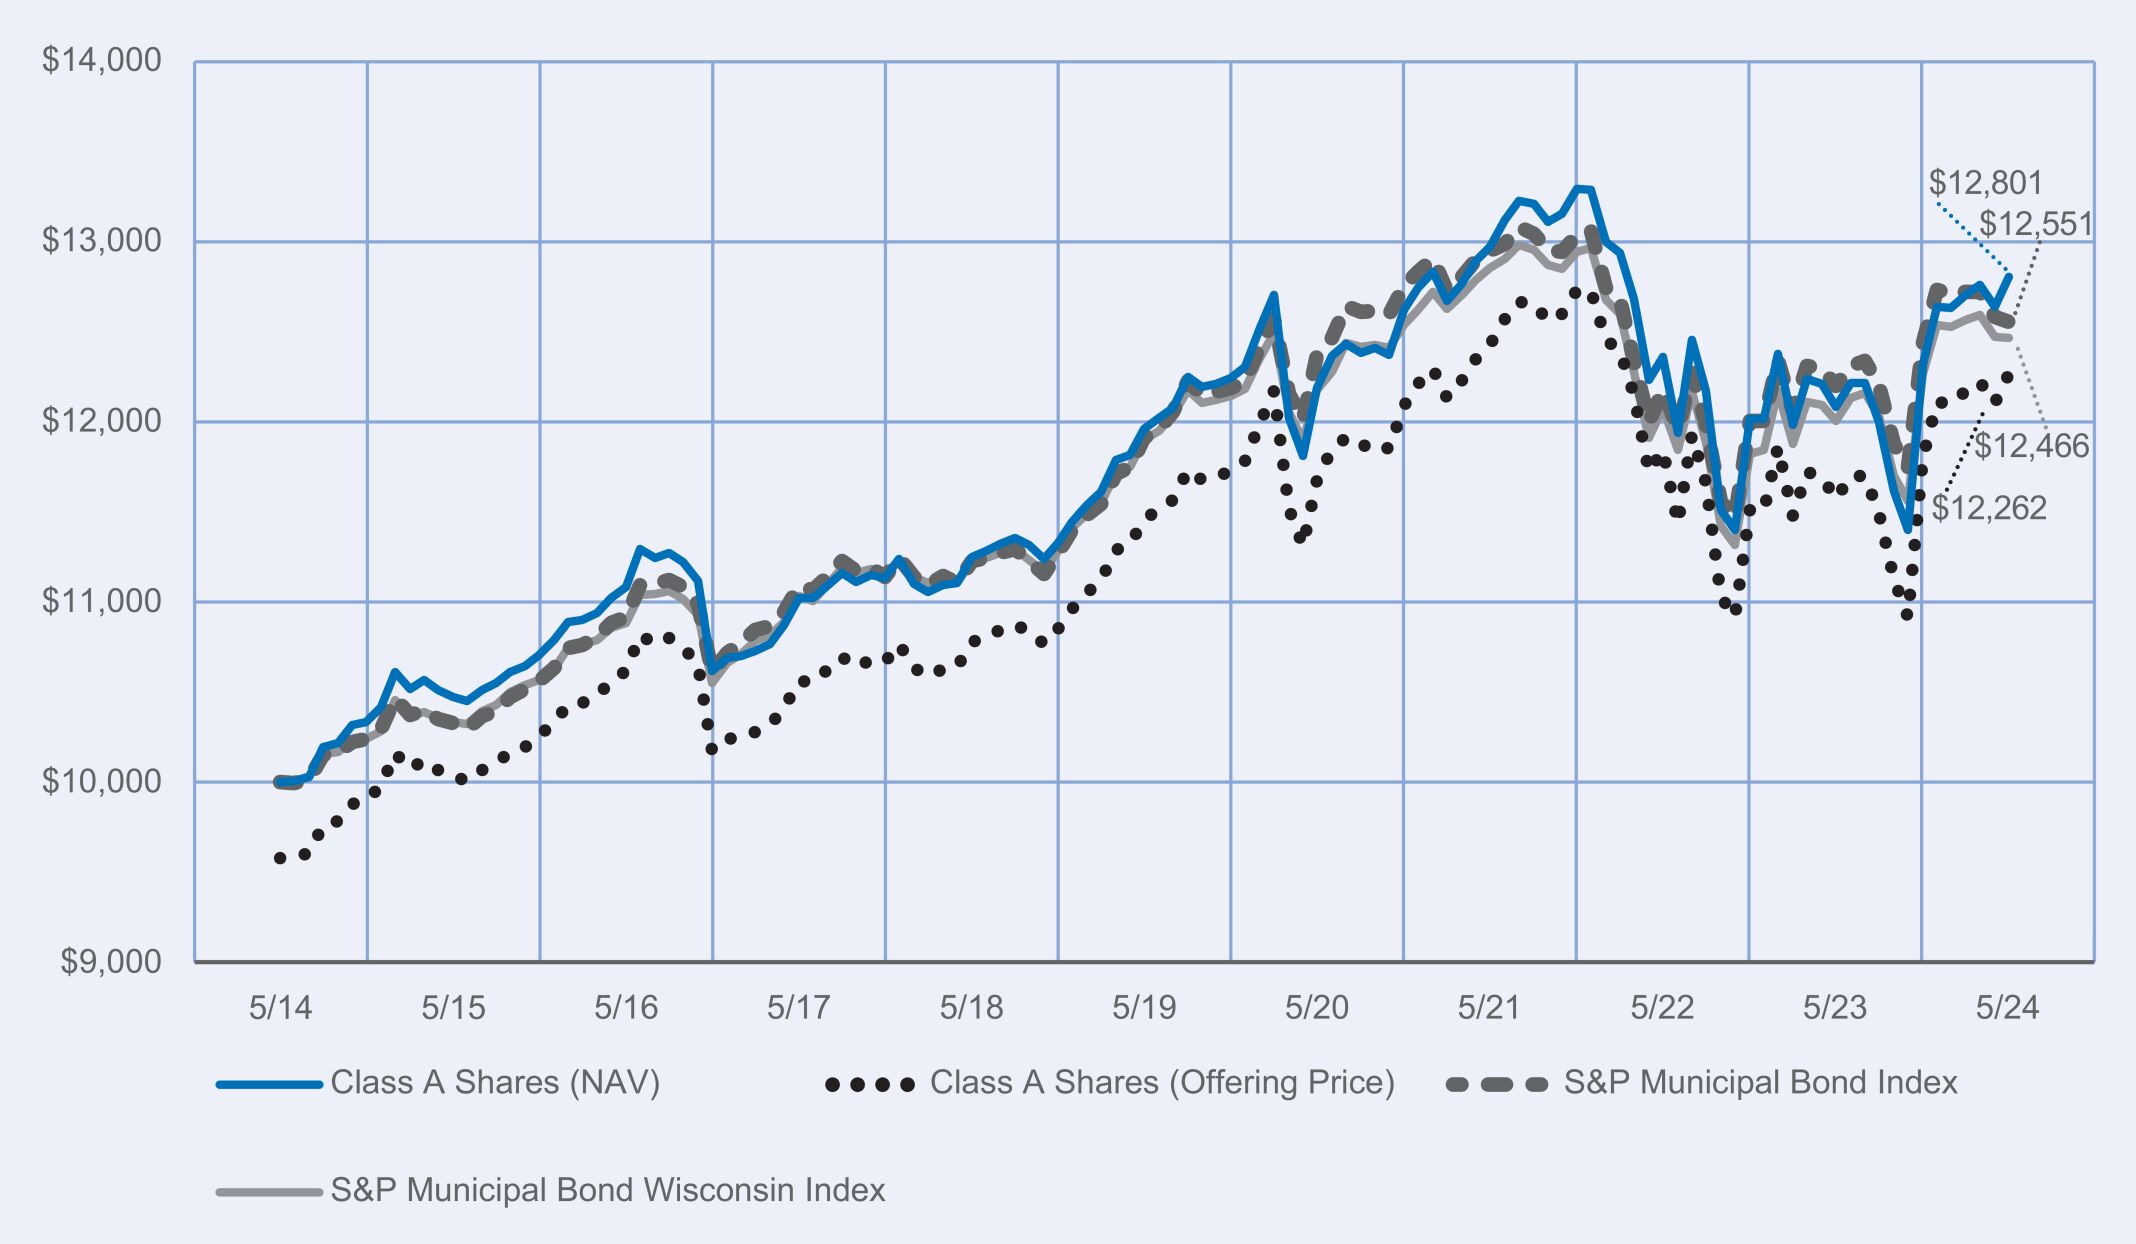
Performance Highlights • The Nuveen Kansas Municipal Bond Fund returned 2.81% for Class A shares at net asset value (NAV) for the 12 months ended May 31, 2024. The Fund outperformed the S&P Municipal Bond Kansas Index, which returned 2.35%. • Top contributors to relative performance » Overweight to the dedicated tax sector, which outperformed. » Overweight to the health care sector, which outperformed. » Underweight to the transportation sector, which underperformed. • Top detractors from relative performance » Overweight to shorter-maturity bonds, which underperformed. » Overweight to the local general obligation (GO) sector, which underperformed. » Overweight to the utility sector, which underperformed. | Performance Attribution  Dedicated tax sector Health care sector Transportation sector Dedicated tax sector Health care sector Transportation sector Shorter-maturity bonds Local GO sector Utility sector Shorter-maturity bonds Local GO sector Utility sector |
| 1 | continued>> |
| 1‑Year | 5‑Year | 10‑Year | ||||||||||
| Class A Shares at NAV (excluding maximum sales charge) | 2.81 | % | 0.87 | % | 2.10 | % | ||||||
| Class A Shares at maximum sales charge (Offering Price) | (1.47 | )% | 0.01 | % | 1.66 | % | ||||||
| S&P Municipal Bond Index | 2.88 | % | 1.06 | % | 2.30 | % | ||||||
| S&P Municipal Bond Kansas Index | 2.35 | % | 1.00 | % | 2.28 | % | ||||||
| Lipper Other States Municipal Debt Funds Classification Average | 2.59 | % | 0.29 | % | 1.56 | % | ||||||
| 2 | continued>> |
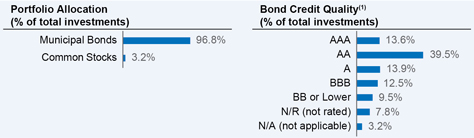
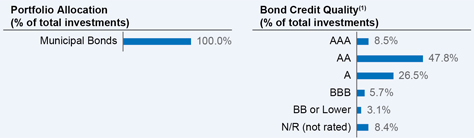
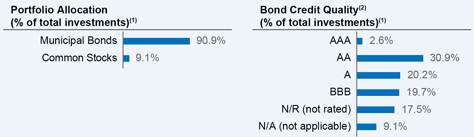
| Fund net assets | $ | 204,932,402 | ||
| Total number of portfolio holdings | 146 | |||
| Portfolio turnover (%) | 9% | |||
| Total advisory fees paid for the year | $ | 1,085,168 |
| • | Portfolio manager update: Effective October 13, 2023, Paul Brennan, CFA was added as a portfolio manager of the Fund. |
| • | Management fees: As of May 1, 2024, the Fund’s overall complex-level fee begins at a maximum rate of 0.1600% of the Fund’s average daily net assets, with breakpoints for eligible complex-level assets above $124.3 billion. |
| • | prospectus • financial statements and other information • fund holdings • proxy voting information |
67065R101_AR_0524 3668667-INV-Y-07/25 (A, C, I) |  |
| 3 |
| | Annual Shareholder Report May 31, 2024 |
| Cost of a $10,000 investment | Costs paid as a percentage of $10,000 investment | |||
| Class C Shares | $161 | 1.61% |
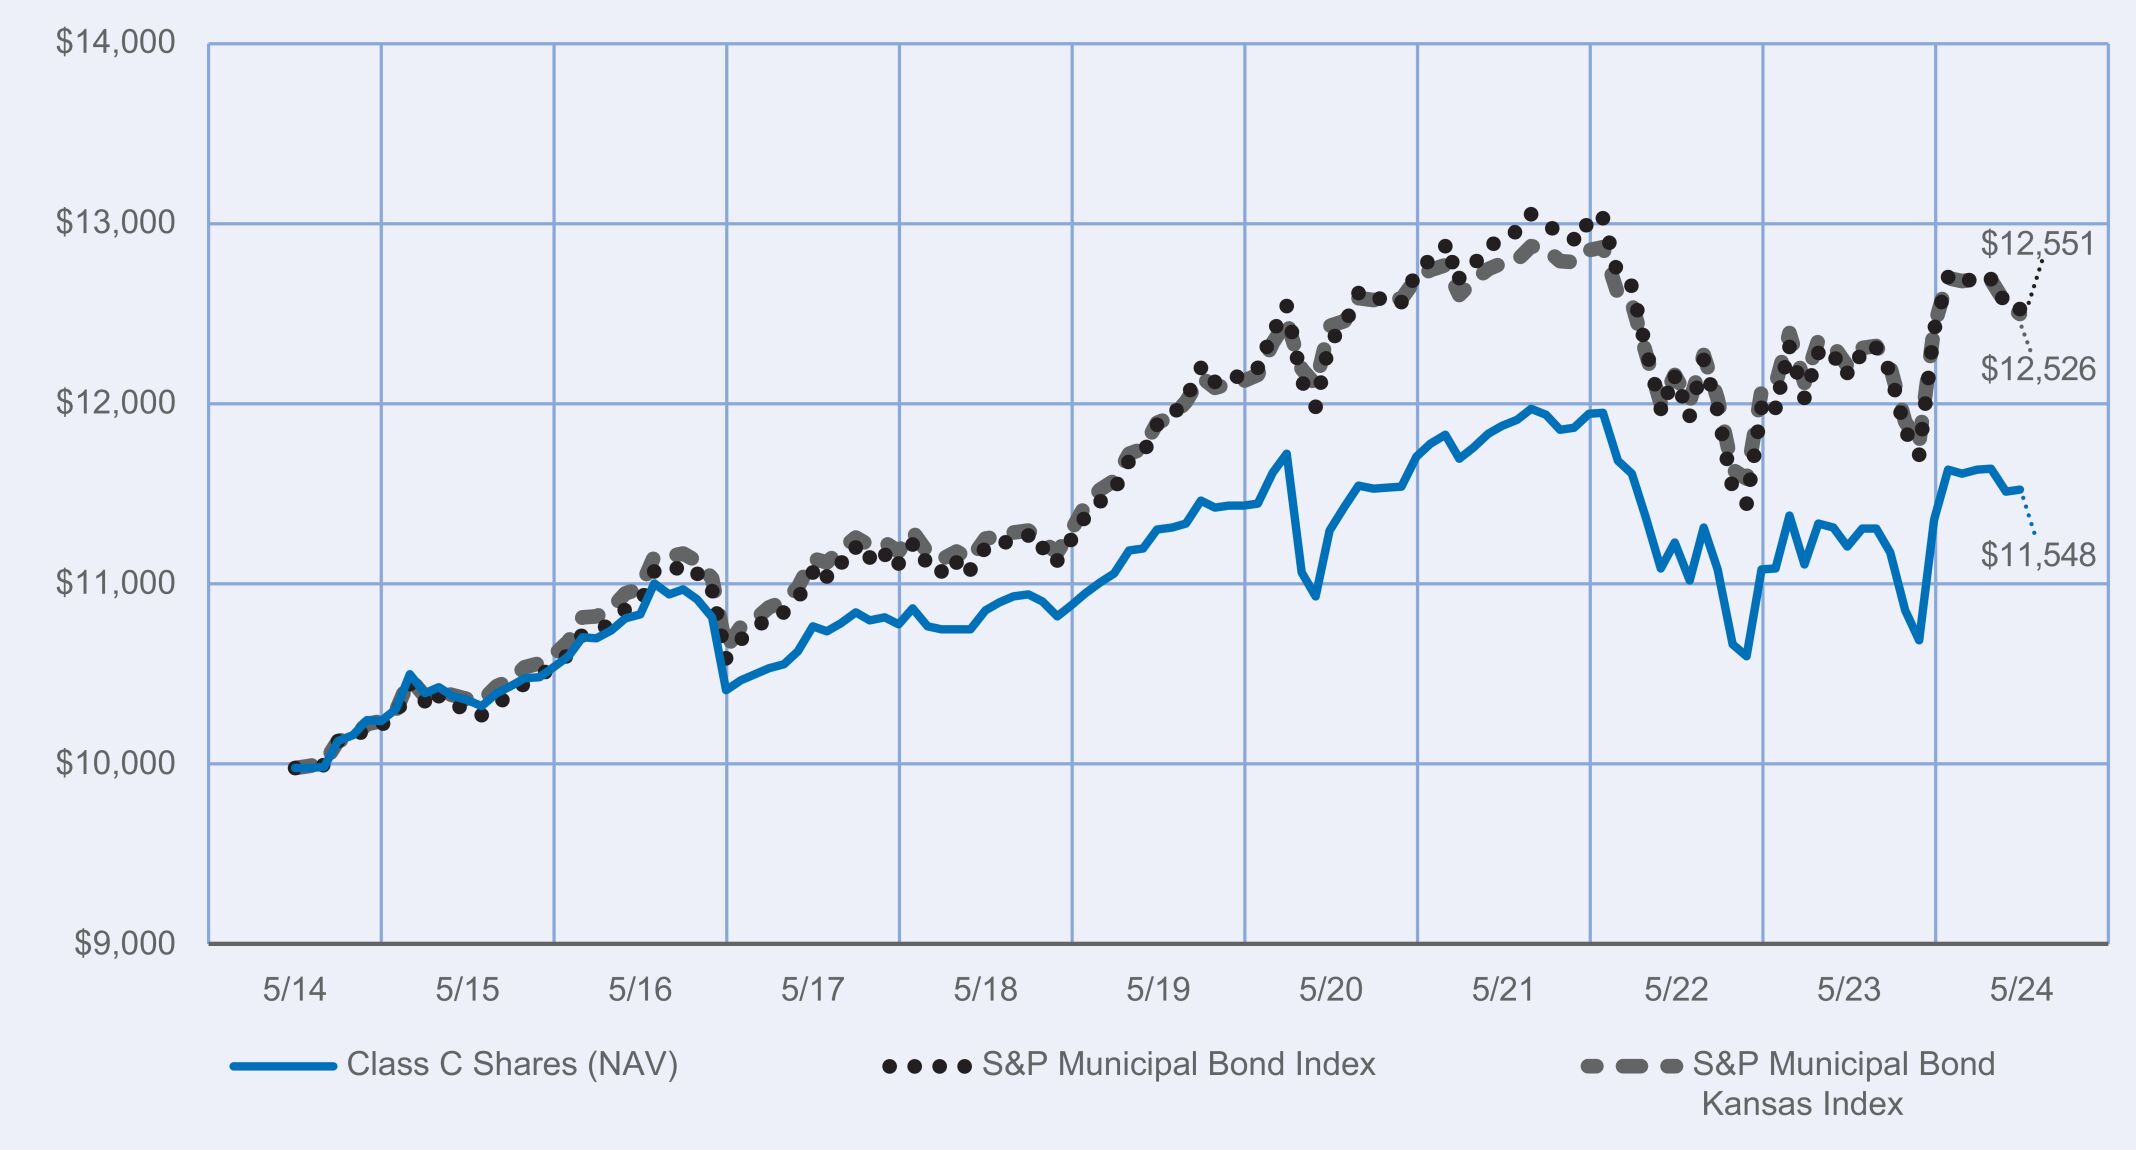
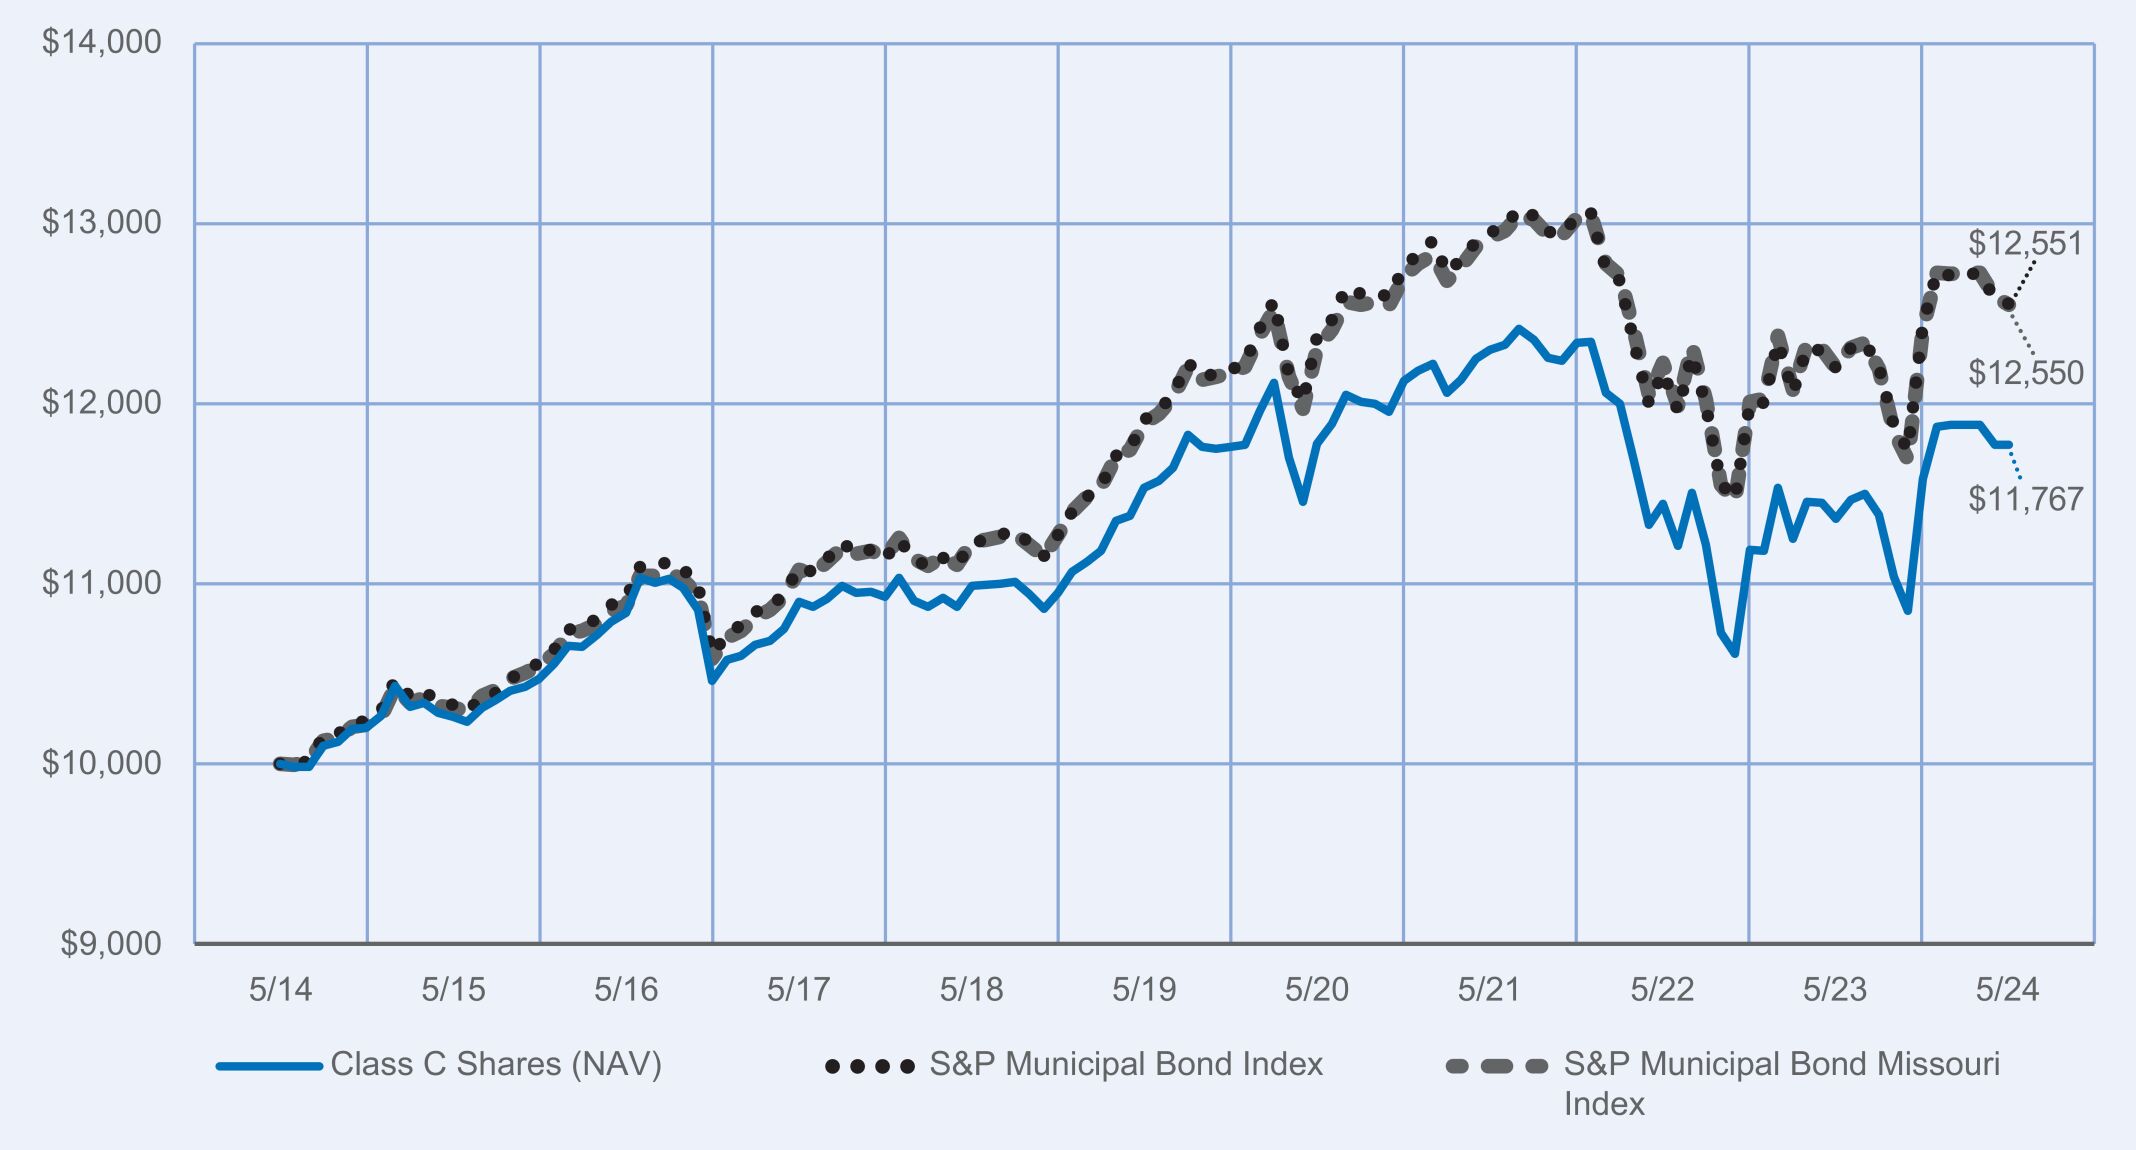
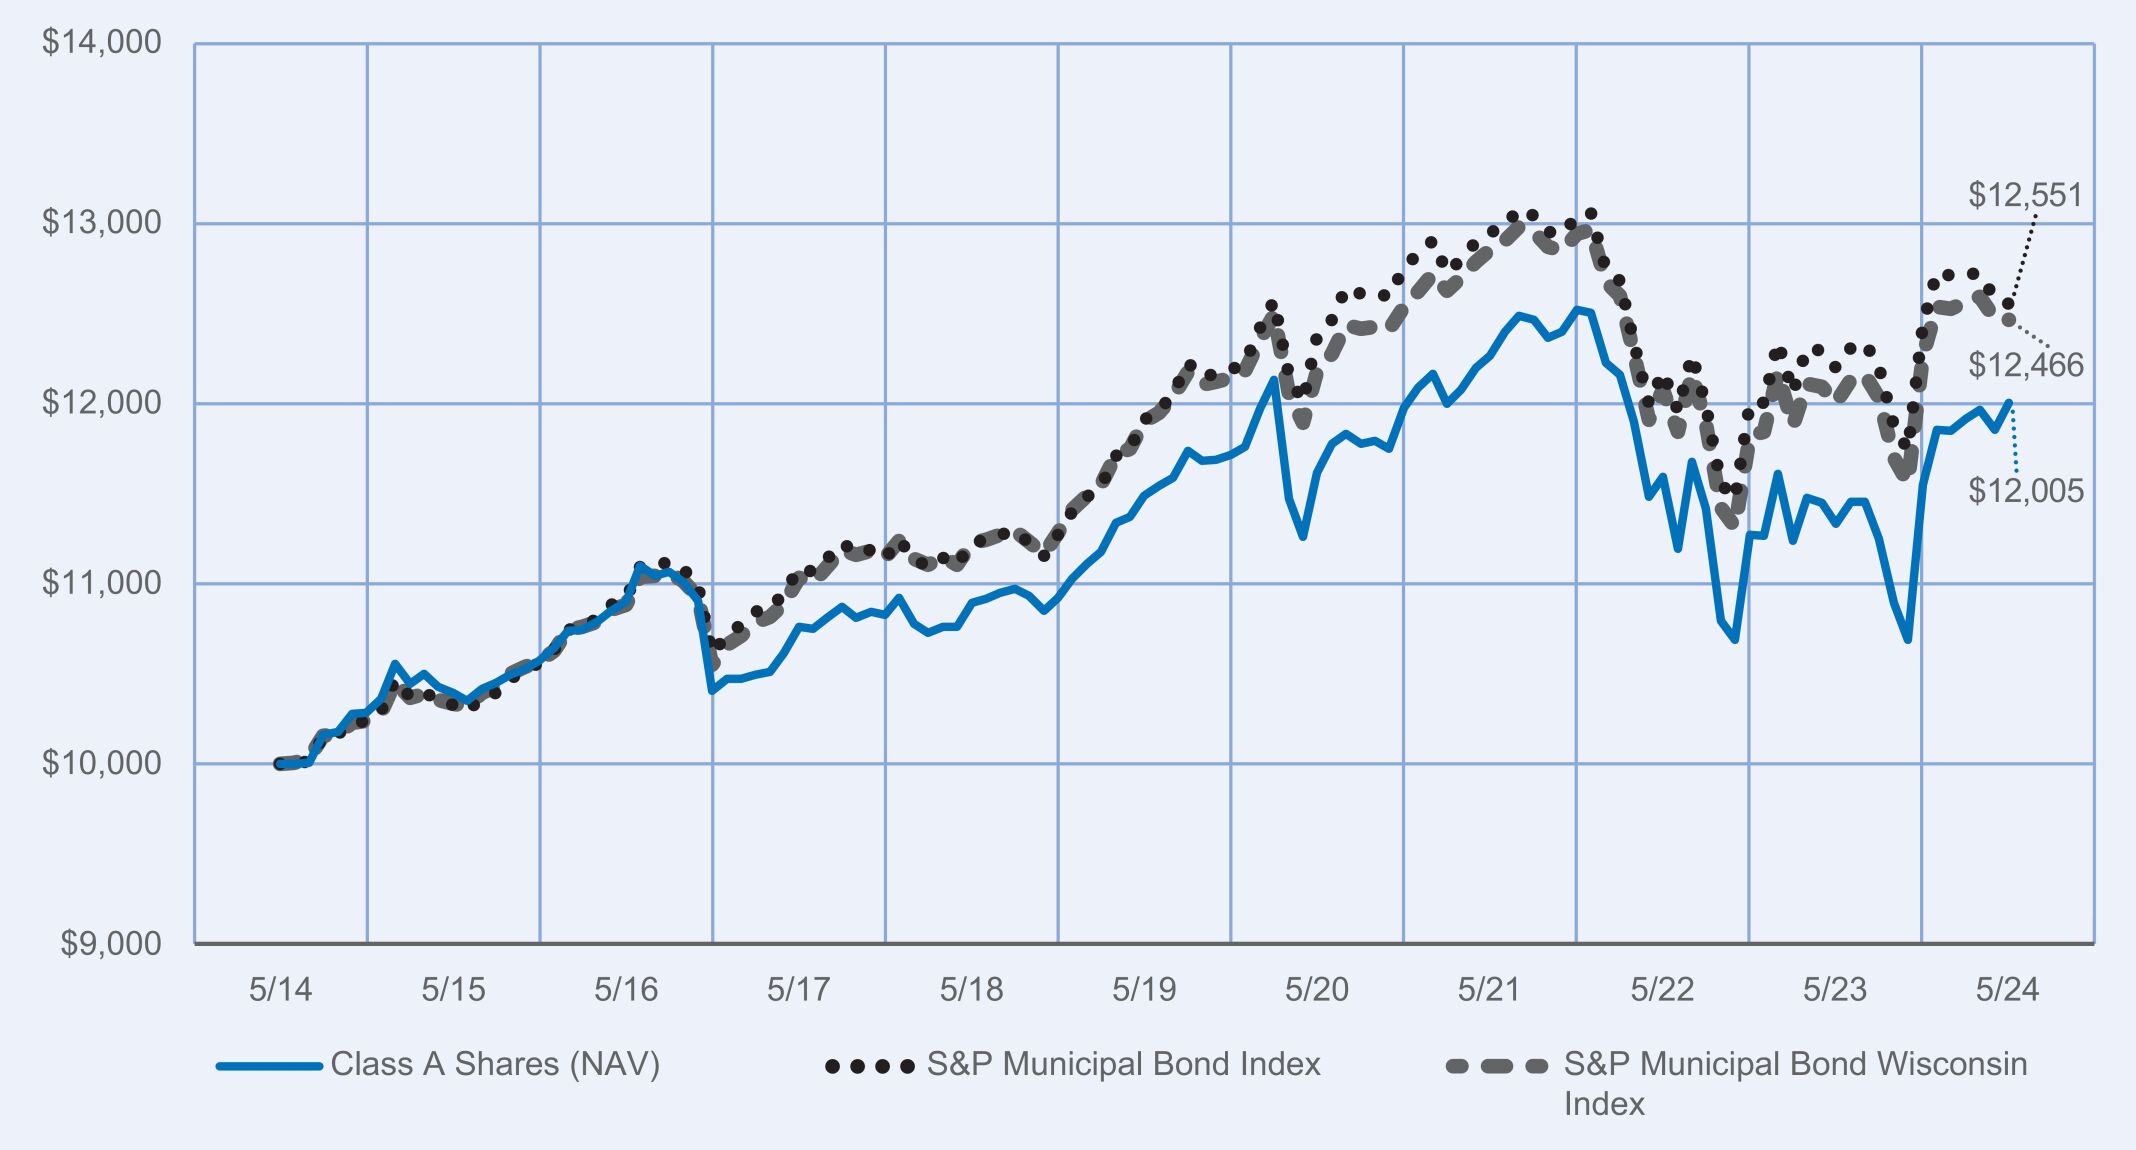
Performance Highlights • The Nuveen Kansas Municipal Bond Fund returned 2.01% for Class C shares at net asset value (NAV) for the 12 months ended May 31, 2024. The Fund underperformed the S&P Municipal Bond Kansas Index, which returned 2.35%. • Top detractors from relative performance » Overweight to shorter-maturity bonds, which underperformed. » Overweight to the local general obligation (GO) sector, which underperformed. » Overweight to the utility sector, which underperformed. • Top contributors to relative performance » Overweight to the dedicated tax sector, which outperformed. » Overweight to the health care sector, which outperformed. » Underweight to the transportation sector, which underperformed. | Performance Attribution Shorter-maturity bonds Local GO sector Utility sector Dedicated tax sector Health care sector Transportation sector |
| 1 | continued>> |
| 1‑Year | 5‑Year | 10‑Year | ||||||||||
| Class C Shares at NAV (excluding maximum sales charge) | 2.01 | % | 0.05 | % | 1.45 | % | ||||||
| S&P Municipal Bond Index | 2.88 | % | 1.06 | % | 2.30 | % | ||||||
| S&P Municipal Bond Kansas Index | 2.35 | % | 1.00 | % | 2.28 | % | ||||||
| Lipper Other States Municipal Debt Funds Classification Average | 2.59 | % | 0.29 | % | 1.56 | % | ||||||
| 2 | continued>> |
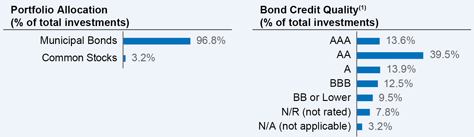
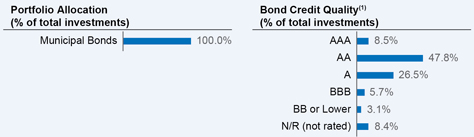
| Fund net assets | $ | 204,932,402 | ||
| Total number of portfolio holdings | 146 | |||
| Portfolio turnover (%) | 9% | |||
| Total advisory fees paid for the year | $ | 1,085,168 |
| • | Portfolio manager update: Effective October 13, 2023, Paul Brennan, CFA was added as a portfolio manager of the Fund. |
| • | Management fees: As of May 1, 2024, the Fund’s overall complex-level fee begins at a maximum rate of 0.1600% of the Fund’s average daily net assets, with breakpoints for eligible complex-level assets above $124.3 billion. |
| • | prospectus • financial statements and other information • fund holdings • proxy voting information |
67065R671_AR_0524 3668667-INV-Y-07/25 (A, C, I) | |
| 3 |
| | Annual Shareholder Report May 31, 2024 |
| Cost of a $10,000 investment | Costs paid as a percentage of $10,000 investment | |||
| Class I Shares | $61 | 0.61% |
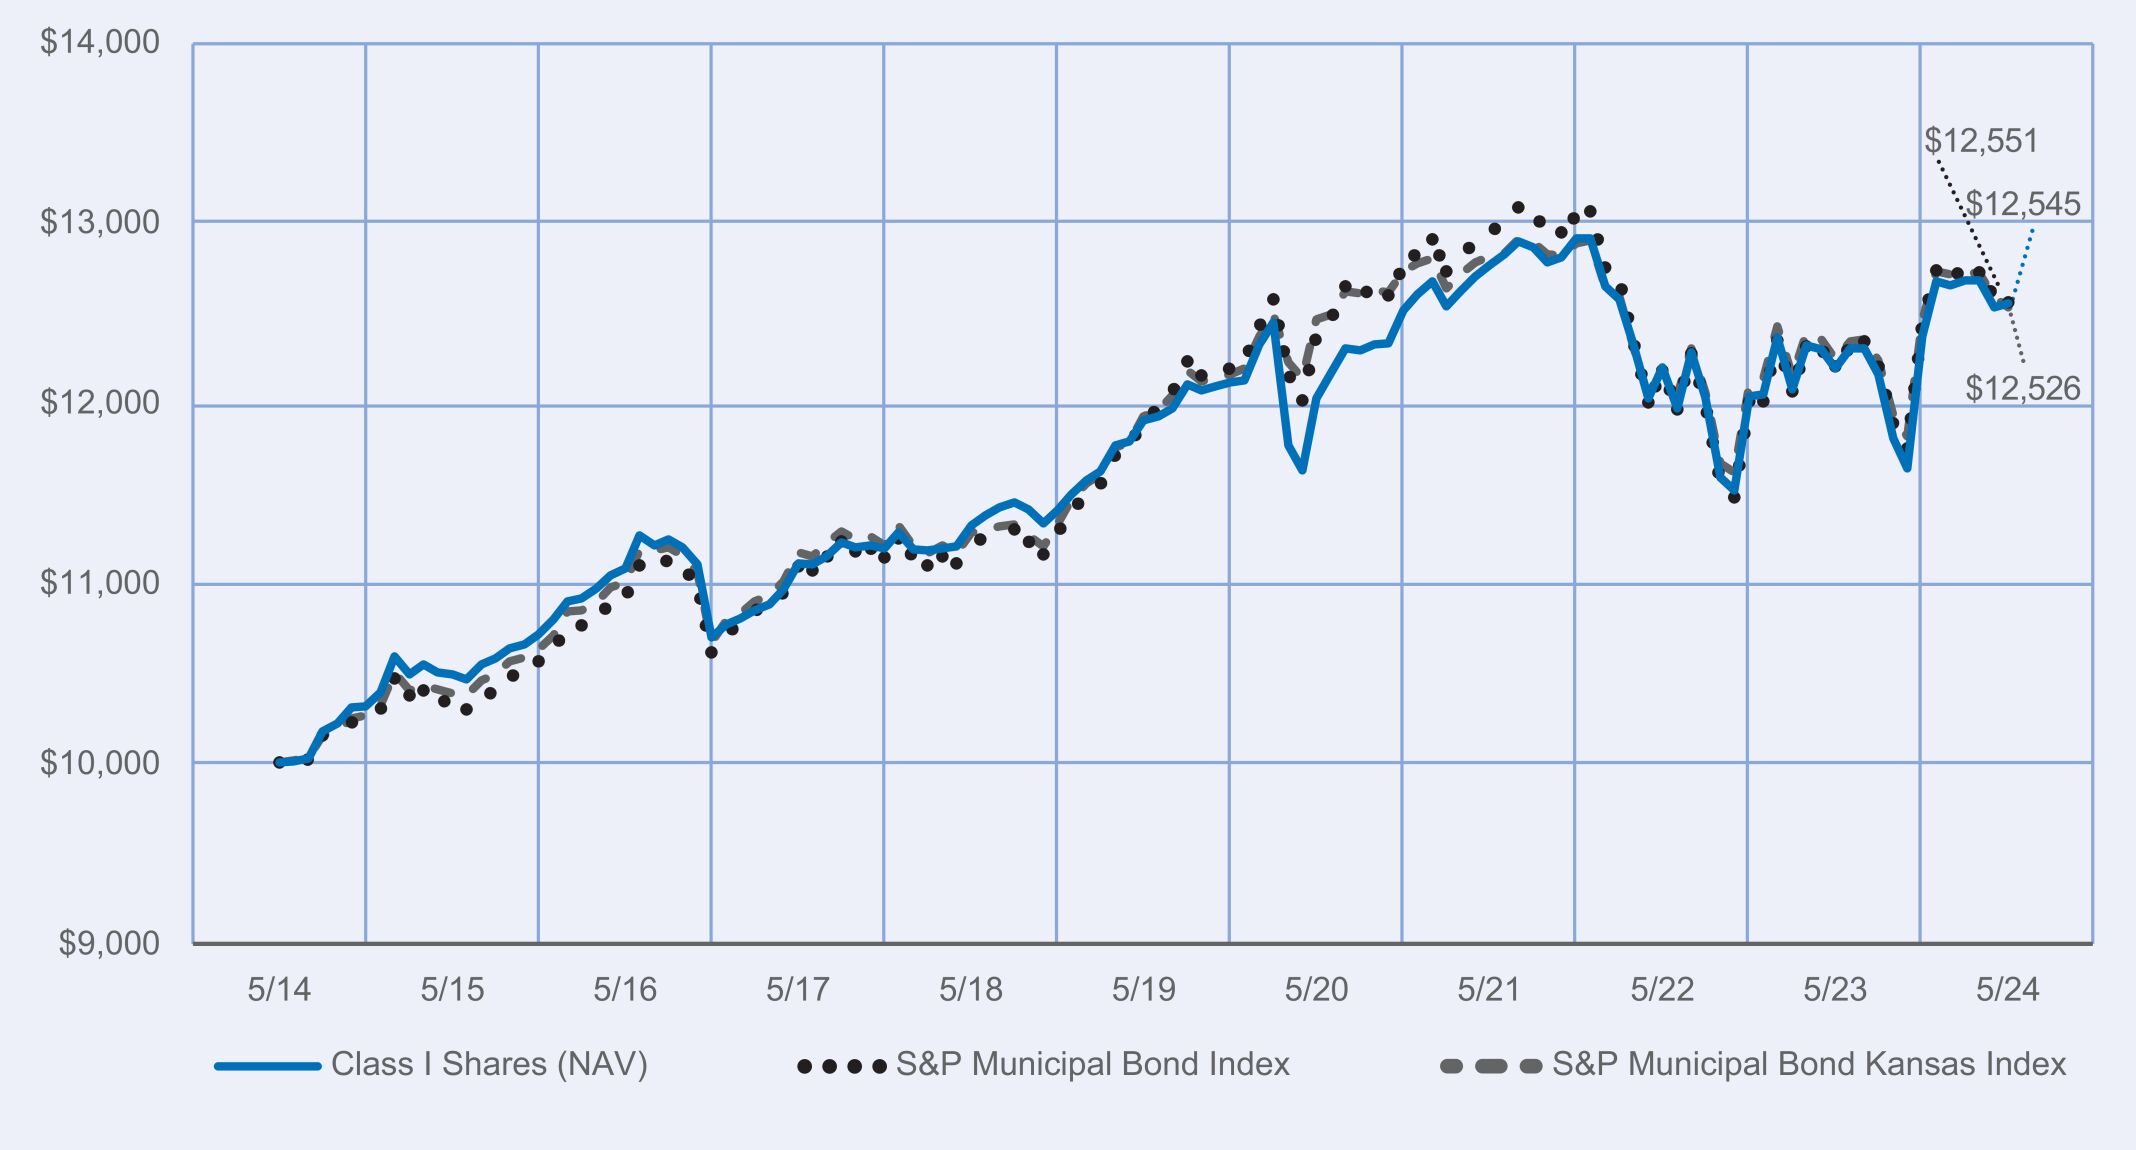
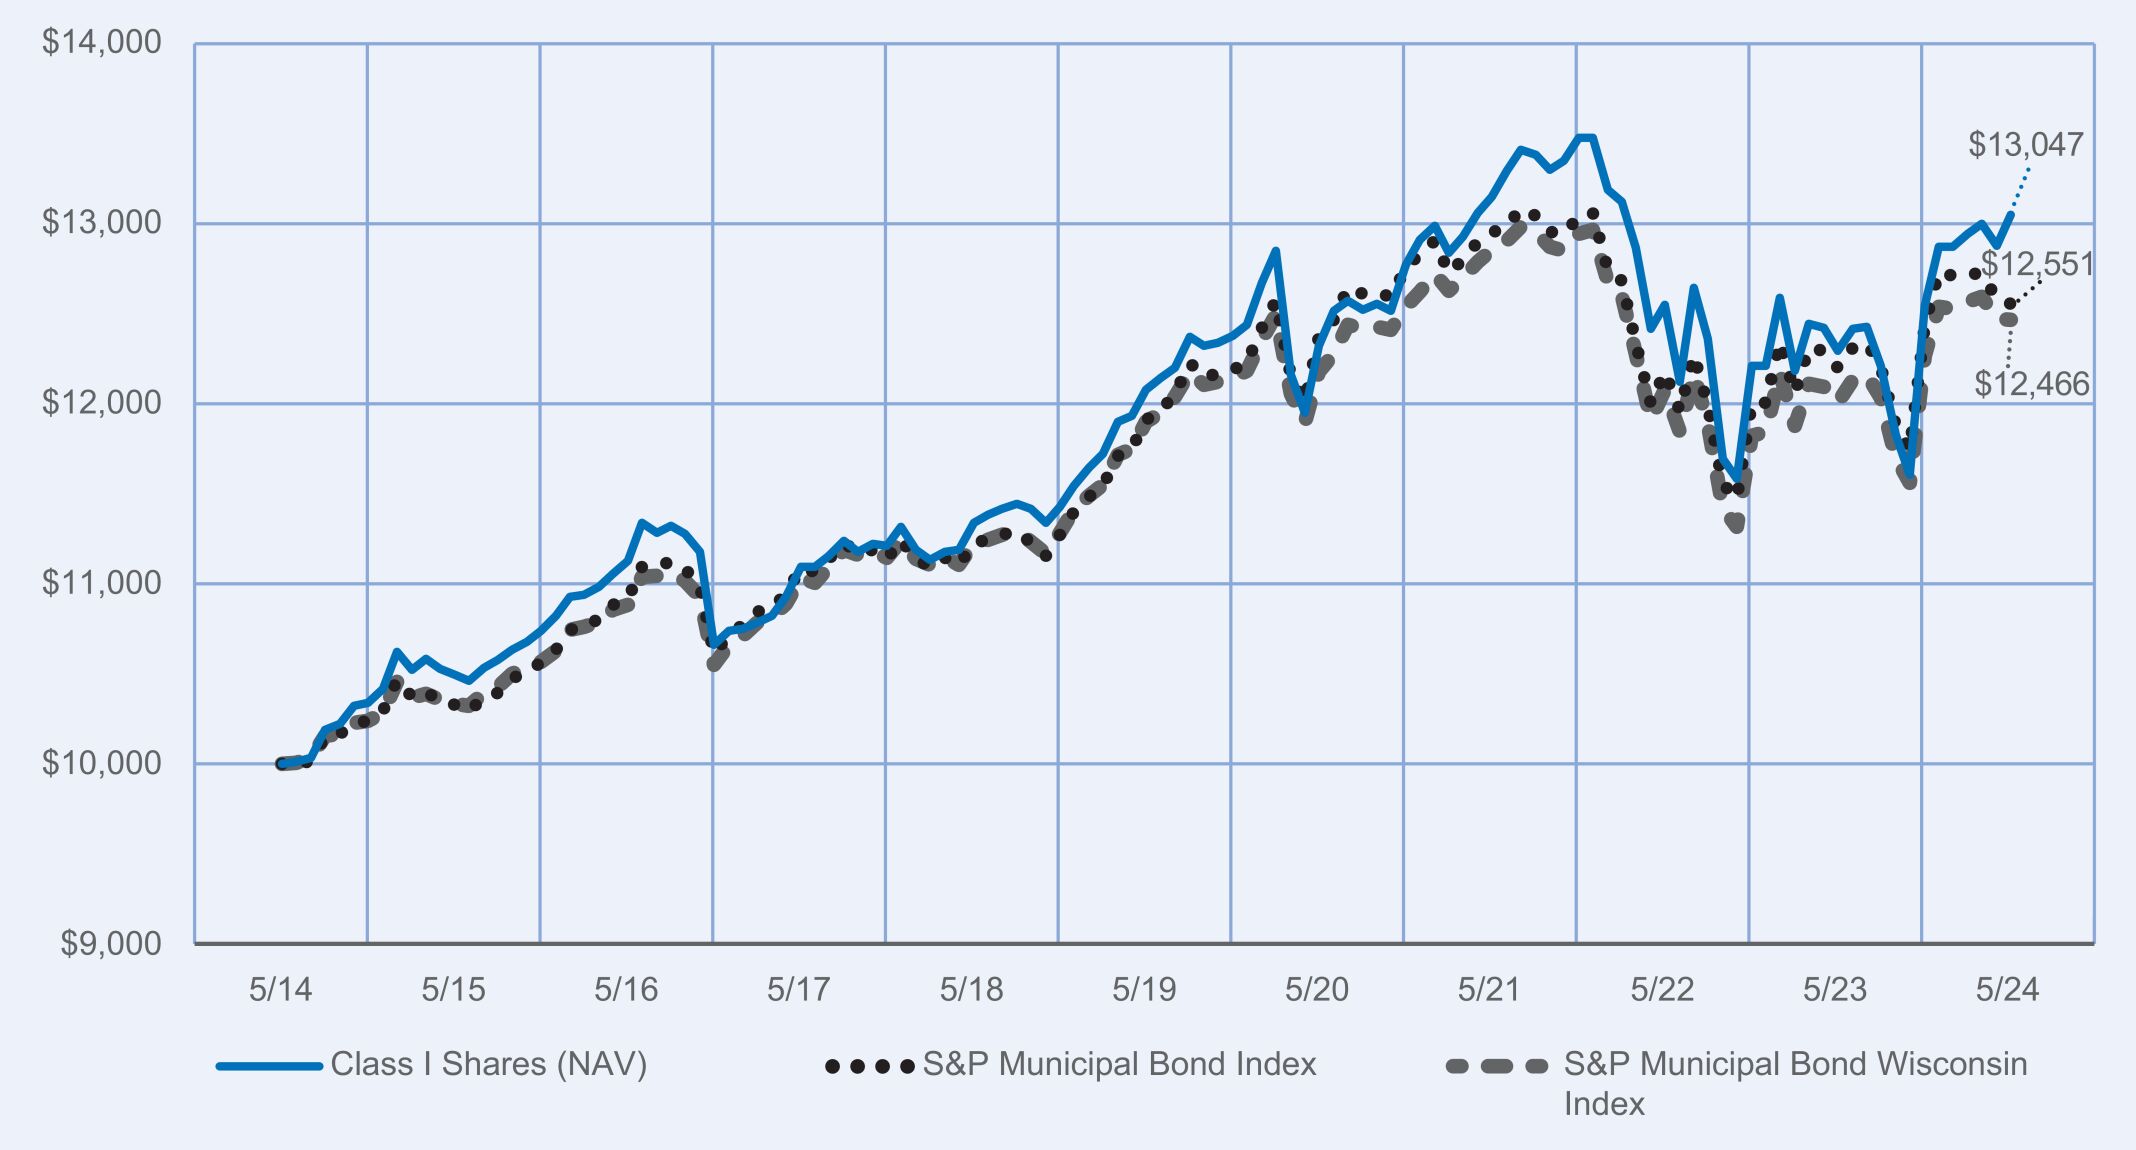
Performance Highlights • The Nuveen Kansas Municipal Bond Fund returned 2.95% for Class I shares at net asset value (NAV) for the 12 months ended May 31, 2024. The Fund outperformed the S&P Municipal Bond Kansas Index, which returned 2.35%. • Top contributors to relative performance » Overweight to the dedicated tax sector, which outperformed. » Overweight to the health care sector, which outperformed. » Underweight to the transportation sector, which underperformed. • Top detractors from relative performance » Overweight to shorter-maturity bonds, which underperformed. » Overweight to the local general obligation (GO) sector, which underperformed. » Overweight to the utility sector, which underperformed. | Performance Attribution Dedicated tax sector Health care sector Transportation sector Shorter-maturity bonds Local GO sector Utility sector |
| 1 | continued>> |
| 1‑Year | 5‑Year | 10‑Year | ||||||||||
| Class I Shares at NAV | 2.95 | % | 1.06 | % | 2.29 | % | ||||||
| S&P Municipal Bond Index | 2.88 | % | 1.06 | % | 2.30 | % | ||||||
| S&P Municipal Bond Kansas Index | 2.35 | % | 1.00 | % | 2.28 | % | ||||||
| Lipper Other States Municipal Debt Funds Classification Average | 2.59 | % | 0.29 | % | 1.56 | % | ||||||
| 2 | continued>> |
| Fund net assets | $ | 204,932,402 | ||
| Total number of portfolio holdings | 146 | |||
| Portfolio turnover (%) | 9% | |||
| Total advisory fees paid for the year | $ | 1,085,168 |

| • | Portfolio manager update: Effective October 13, 2023, Paul Brennan, CFA was added as a portfolio manager of the Fund. |
| • | Management fees: As of May 1, 2024, the Fund’s overall complex-level fee begins at a maximum rate of 0.1600% of the Fund’s average daily net assets, with breakpoints for eligible complex-level assets above $124.3 billion. |
| • | prospectus • financial statements and other information • fund holdings • proxy voting information |
67065R408_AR_0524 3668667-INV-Y-07/25 (A, C, I) | |
| 3 |
| | Annual Shareholder Report May 31, 2024 |
| Cost of a $10,000 investment | Costs paid as a percentage of $10,000 investment | |||
| Class A Shares | $79 | 0.79% |
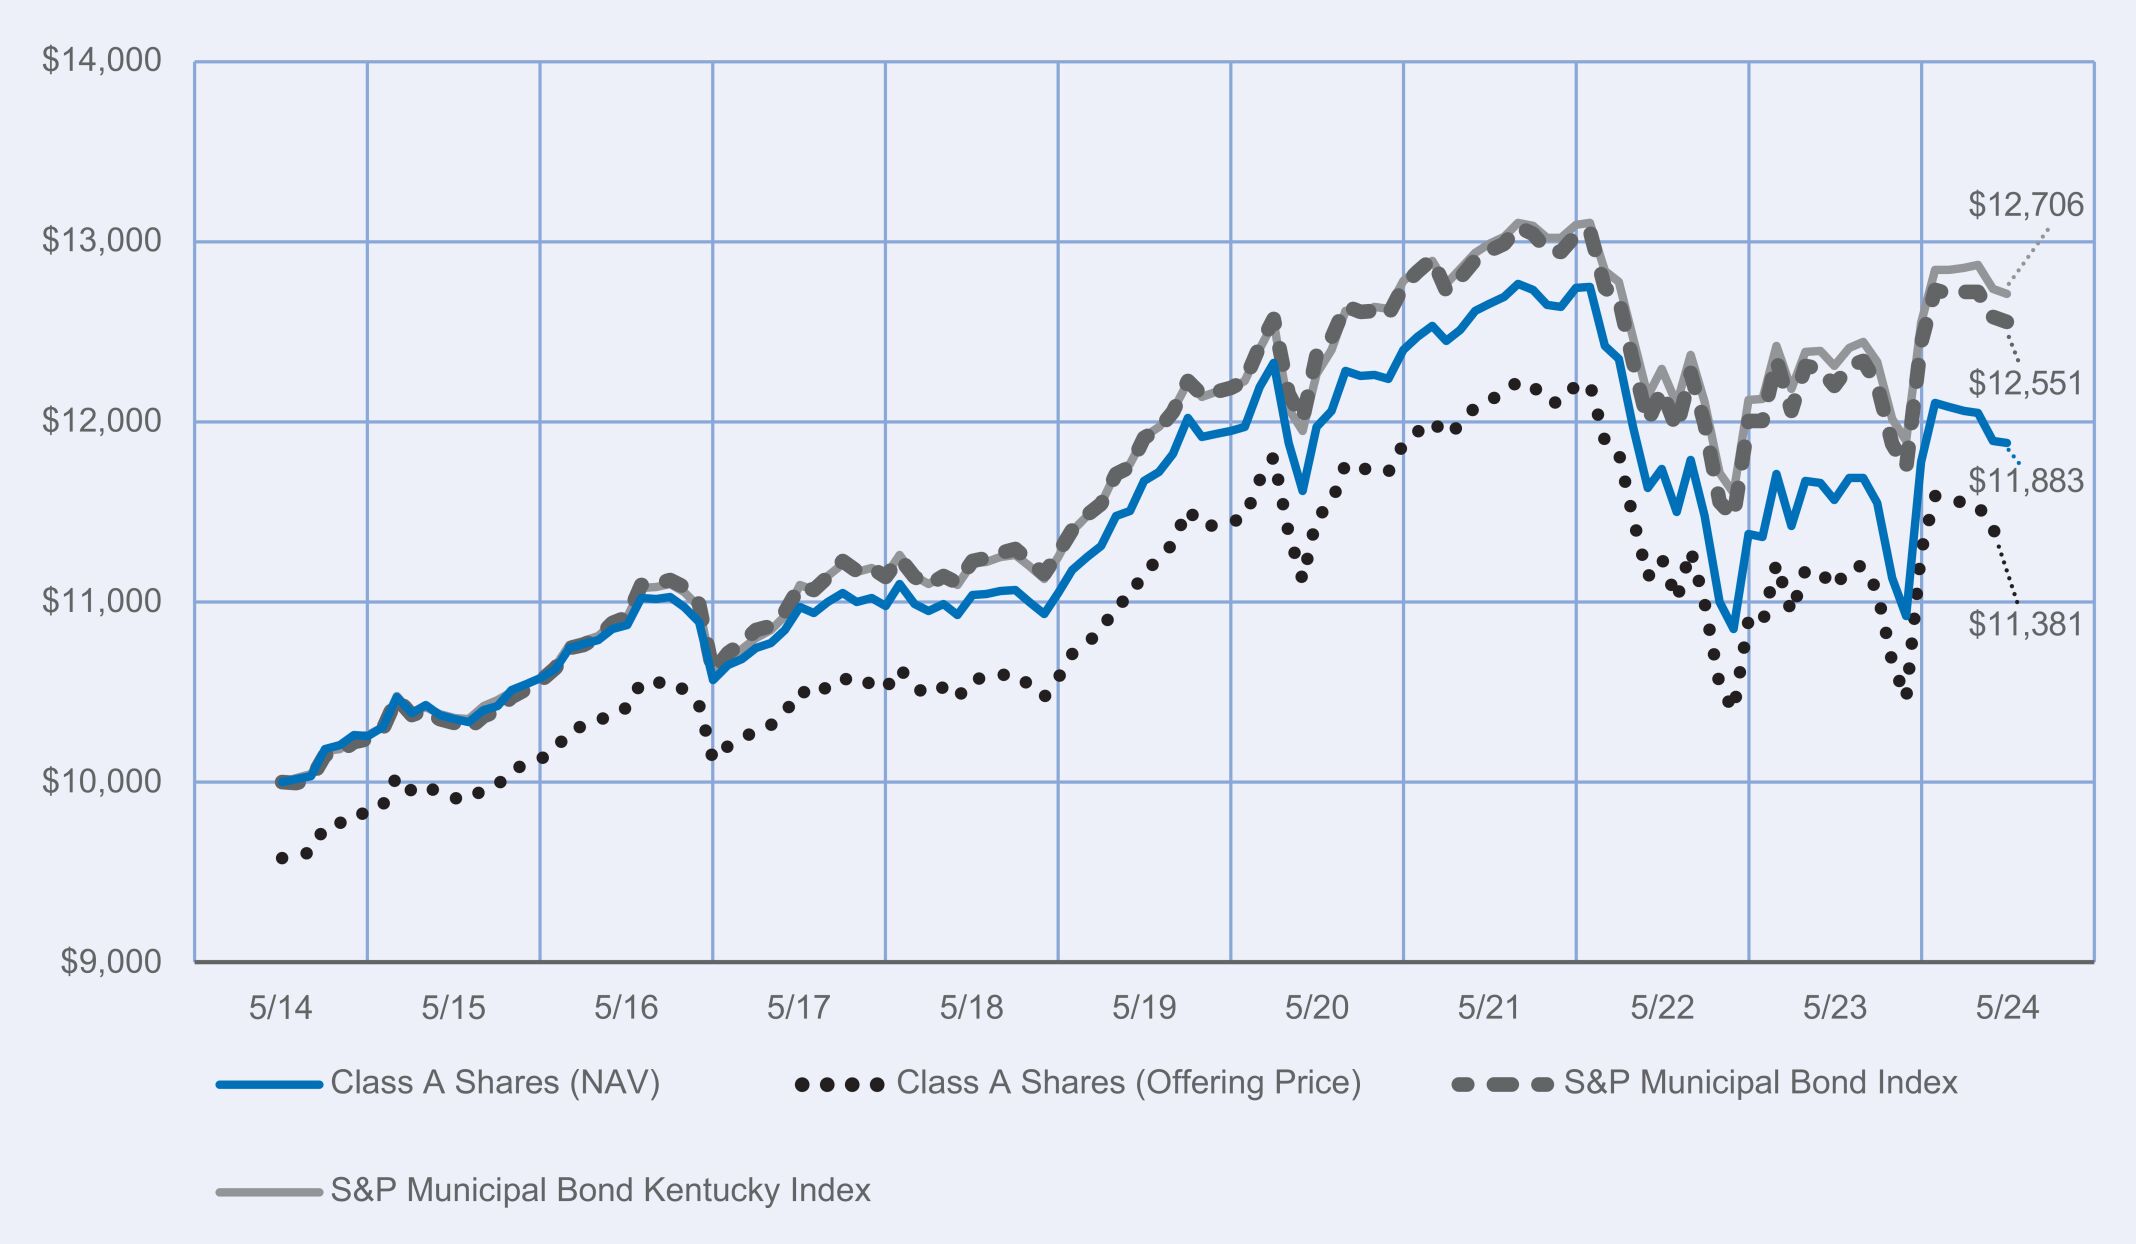
Performance Highlights • The Nuveen Kentucky Municipal Bond Fund returned 2.74% for Class A shares at net asset value (NAV) for the 12 months ended May 31, 2024. The Fund underperformed the S&P Municipal Bond Kentucky Index, which returned 3.23%. • Top detractors from relative performance » Sector allocation, particularly an underweight exposure to the industrial development revenue (IDR) sector, which outperformed, and an overweight exposure to the dedicated tax sector, which underperformed. » An overweight to the eight to 10-year duration segment, which underperformed. » Allocation to cash, which underperformed. • Top contributors to relative performance » Underweight allocation to zero to eight-year duration bonds, which underperformed, and an overweight allocation to 10-year and longer duration bonds, which outperformed. » Credit ratings allocations, specifically an underweight to the highest credit quality (AAA and AA rated) bonds, which lagged lower rated bonds. » Underweight allocations to the water and sewer sector and appropriation sector, both of which underperformed. | Performance Attribution IDR and dedicated tax sectors Eight to 10-year duration bonds Cash Short and long duration bonds Credit ratings allocations Water and sewer sector and appropriation sector |
| 1 | continued>> |
| 1‑Year | 5‑Year | 10‑Year | ||||||||||
| Class A Shares at NAV (excluding maximum sales charge) | 2.74 | % | 0.36 | % | 1.74 | % | ||||||
| Class A Shares at maximum sales charge (Offering Price) | (1.59 | )% | (0.50 | )% | 1.30 | % | ||||||
| S&P Municipal Bond Index | 2.88 | % | 1.06 | % | 2.30 | % | ||||||
| S&P Municipal Bond Kentucky Index | 3.23 | % | 1.30 | % | 2.42 | % | ||||||
| Lipper Other States Municipal Debt Funds Classification Average | 2.59 | % | 0.29 | % | 1.56 | % | ||||||
| 2 | continued>> |
| Fund net assets | $ | 238,205,608 | ||
| Total number of portfolio holdings | 96 | |||
| Portfolio turnover (%) | 21% | |||
| Total advisory fees paid for the year | $ | 1,245,659 |

| • | Portfolio manager update: Effective October 13, 2023, Scott Romans, Ph.D. and Kristen DeJong, CFA were added as portfolio managers of the Fund. |
| • | Management fees: As of May 1, 2024, the Fund’s overall complex-level fee begins at a maximum rate of 0.1600% of the Fund’s average daily net assets, with breakpoints for eligible complex-level assets above $124.3 billion. |
| • | prospectus • financial statements and other information • fund holdings • proxy voting information |
67065R507_AR_0524 3668676-INV-Y-07/25 (A, C, I) | |
| 3 |
| | Annual Shareholder Report May 31, 2024 |
| Cost of a $10,000 investment | Costs paid as a percentage of $10,000 investment | |||
| Class C Shares | $159 | 1.59% |
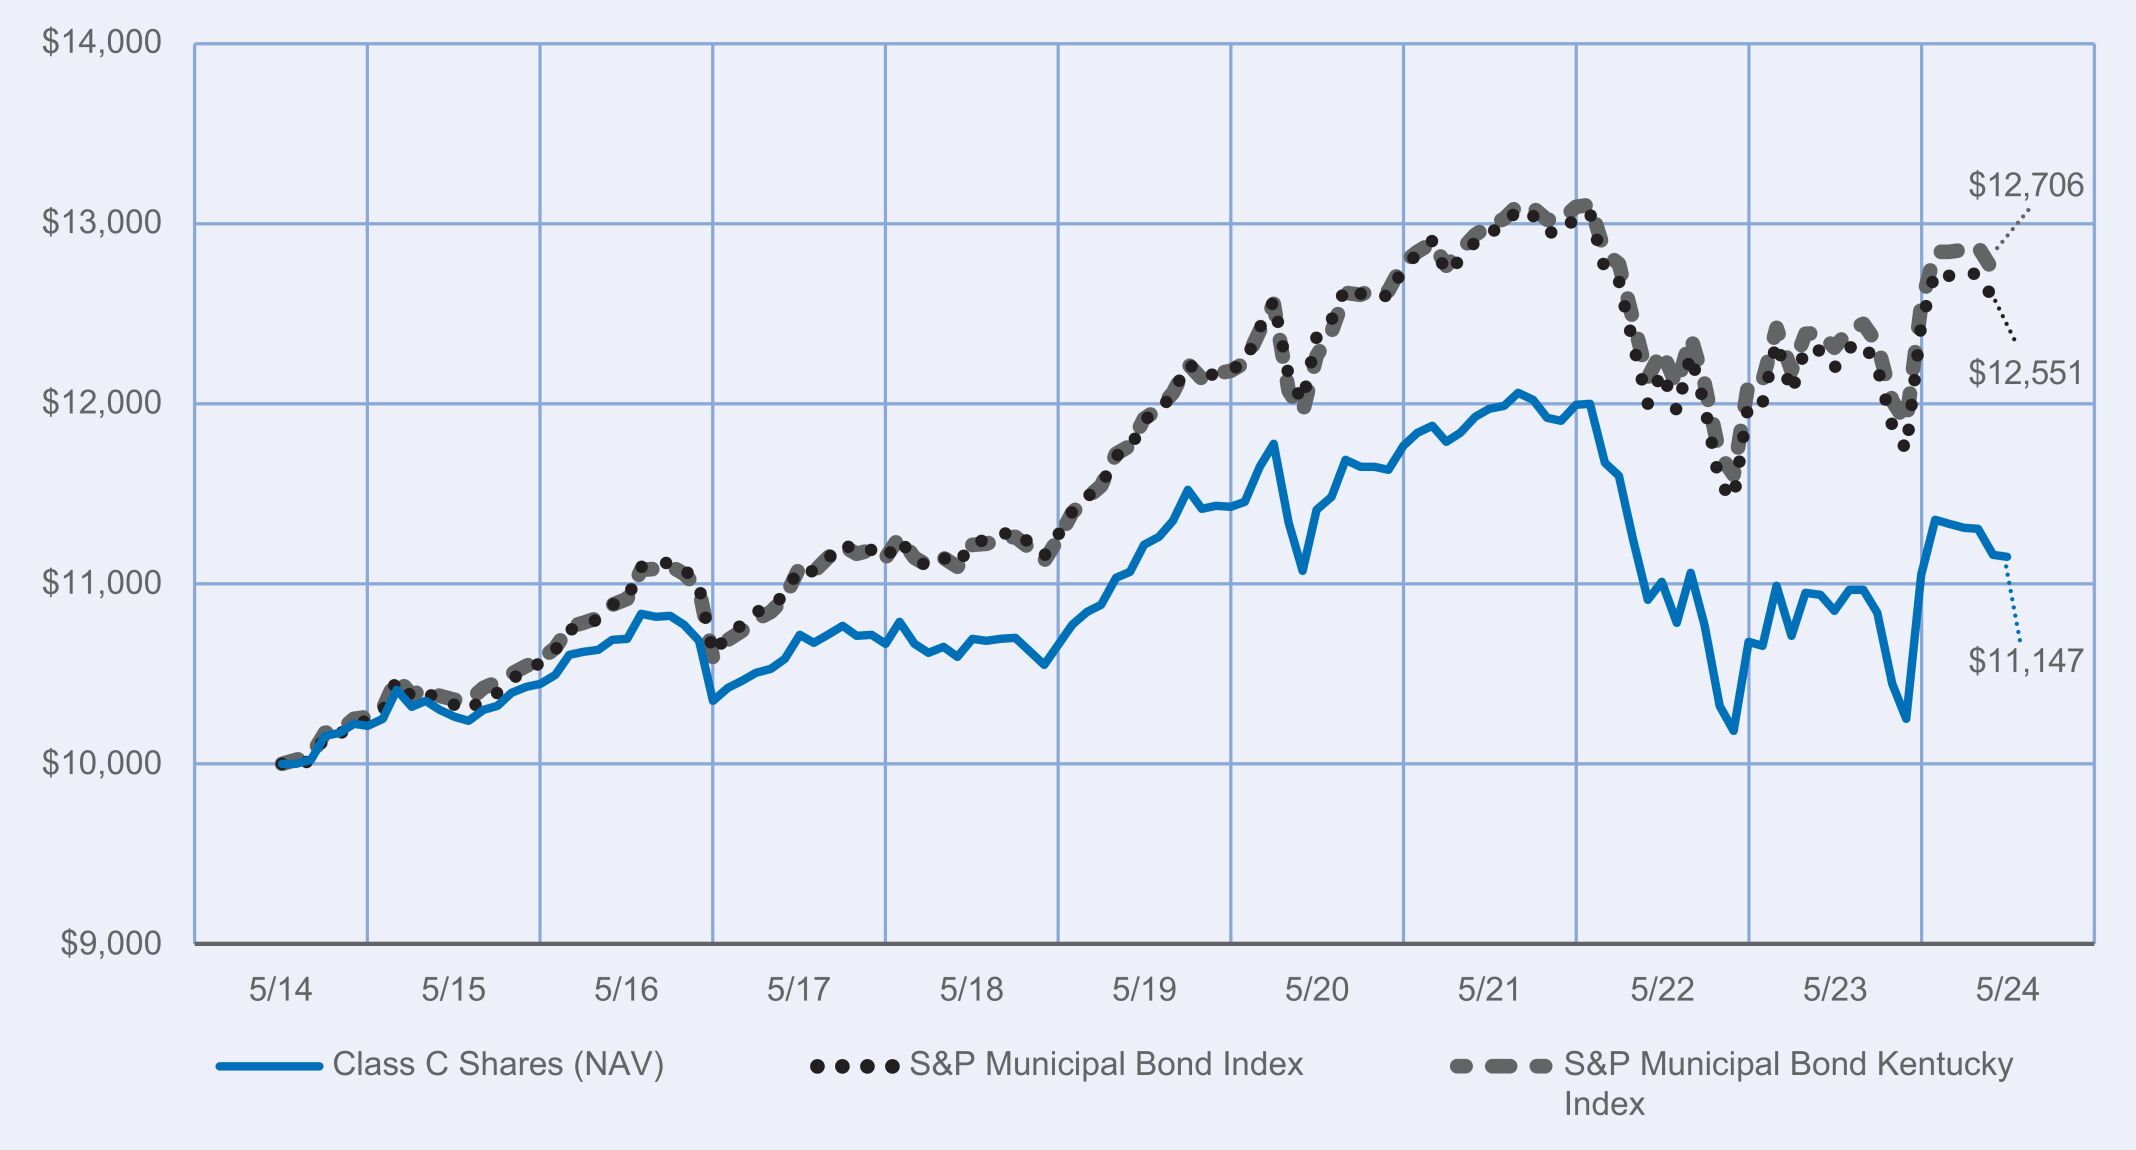
Performance Highlights • The Nuveen Kentucky Municipal Bond Fund returned 1.93% for Class C shares at net asset value (NAV) for the 12 months ended May 31, 2024. The Fund underperformed the S&P Municipal Bond Kentucky Index, which returned 3.23%. • Top detractors from relative performance » Sector allocation, particularly an underweight exposure to the industrial development revenue (IDR) sector, which outperformed, and an overweight exposure to the dedicated tax sector, which underperformed. » An overweight to the eight to 10-year duration segment, which underperformed. » Allocation to cash, which underperformed. • Top contributors to relative performance » Underweight allocation to zero to eight-year duration bonds, which underperformed, and an overweight allocation to 10-year and longer duration bonds, which outperformed. » Credit ratings allocations, specifically an underweight to the highest credit quality (AAA and AA rated) bonds, which lagged lower rated bonds. » Underweight allocations to the water and sewer sector and appropriation sector, both of which underperformed. | Performance Attribution IDR and dedicated tax sectors Eight to 10-year duration bonds Cash Short and long duration bonds Credit ratings allocations Water and sewer sector and appropriation sector |
| 1 | continued>> |
| 1‑Year | 5‑Year | 10‑Year | ||||||||||
| Class C Shares at NAV (excluding maximum sales charge) | 1.93 | % | (0.46 | )% | 1.09 | % | ||||||
| S&P Municipal Bond Index | 2.88 | % | 1.06 | % | 2.30 | % | ||||||
| S&P Municipal Bond Kentucky Index | 3.23 | % | 1.30 | % | 2.42 | % | ||||||
| Lipper Other States Municipal Debt Funds Classification Average | 2.59 | % | 0.29 | % | 1.56 | % | ||||||
| 2 | continued>> |
| Fund net assets | $ | 238,205,608 | ||
| Total number of portfolio holdings | 96 | |||
| Portfolio turnover (%) | 21% | |||
| Total advisory fees paid for the year | $ | 1,245,659 |

| • | Portfolio manager update: Effective October 13, 2023, Scott Romans, Ph.D. and Kristen DeJong, CFA were added as portfolio managers of the Fund. |
| • | Management fees: As of May 1, 2024, the Fund’s overall complex-level fee begins at a maximum rate of 0.1600% of the Fund’s average daily net assets, with breakpoints for eligible complex-level assets above $124.3 billion. |
| • | prospectus • financial statements and other information • fund holdings • proxy voting information |
67065R663_AR_0524 3668676-INV-Y-07/25 (A, C, I) | |
| 3 |
| | Annual Shareholder Report May 31, 2024 |
| Cost of a $10,000 investment | Costs paid as a percentage of $10,000 investment | |||
| Class I Shares | $59 | 0.59% |
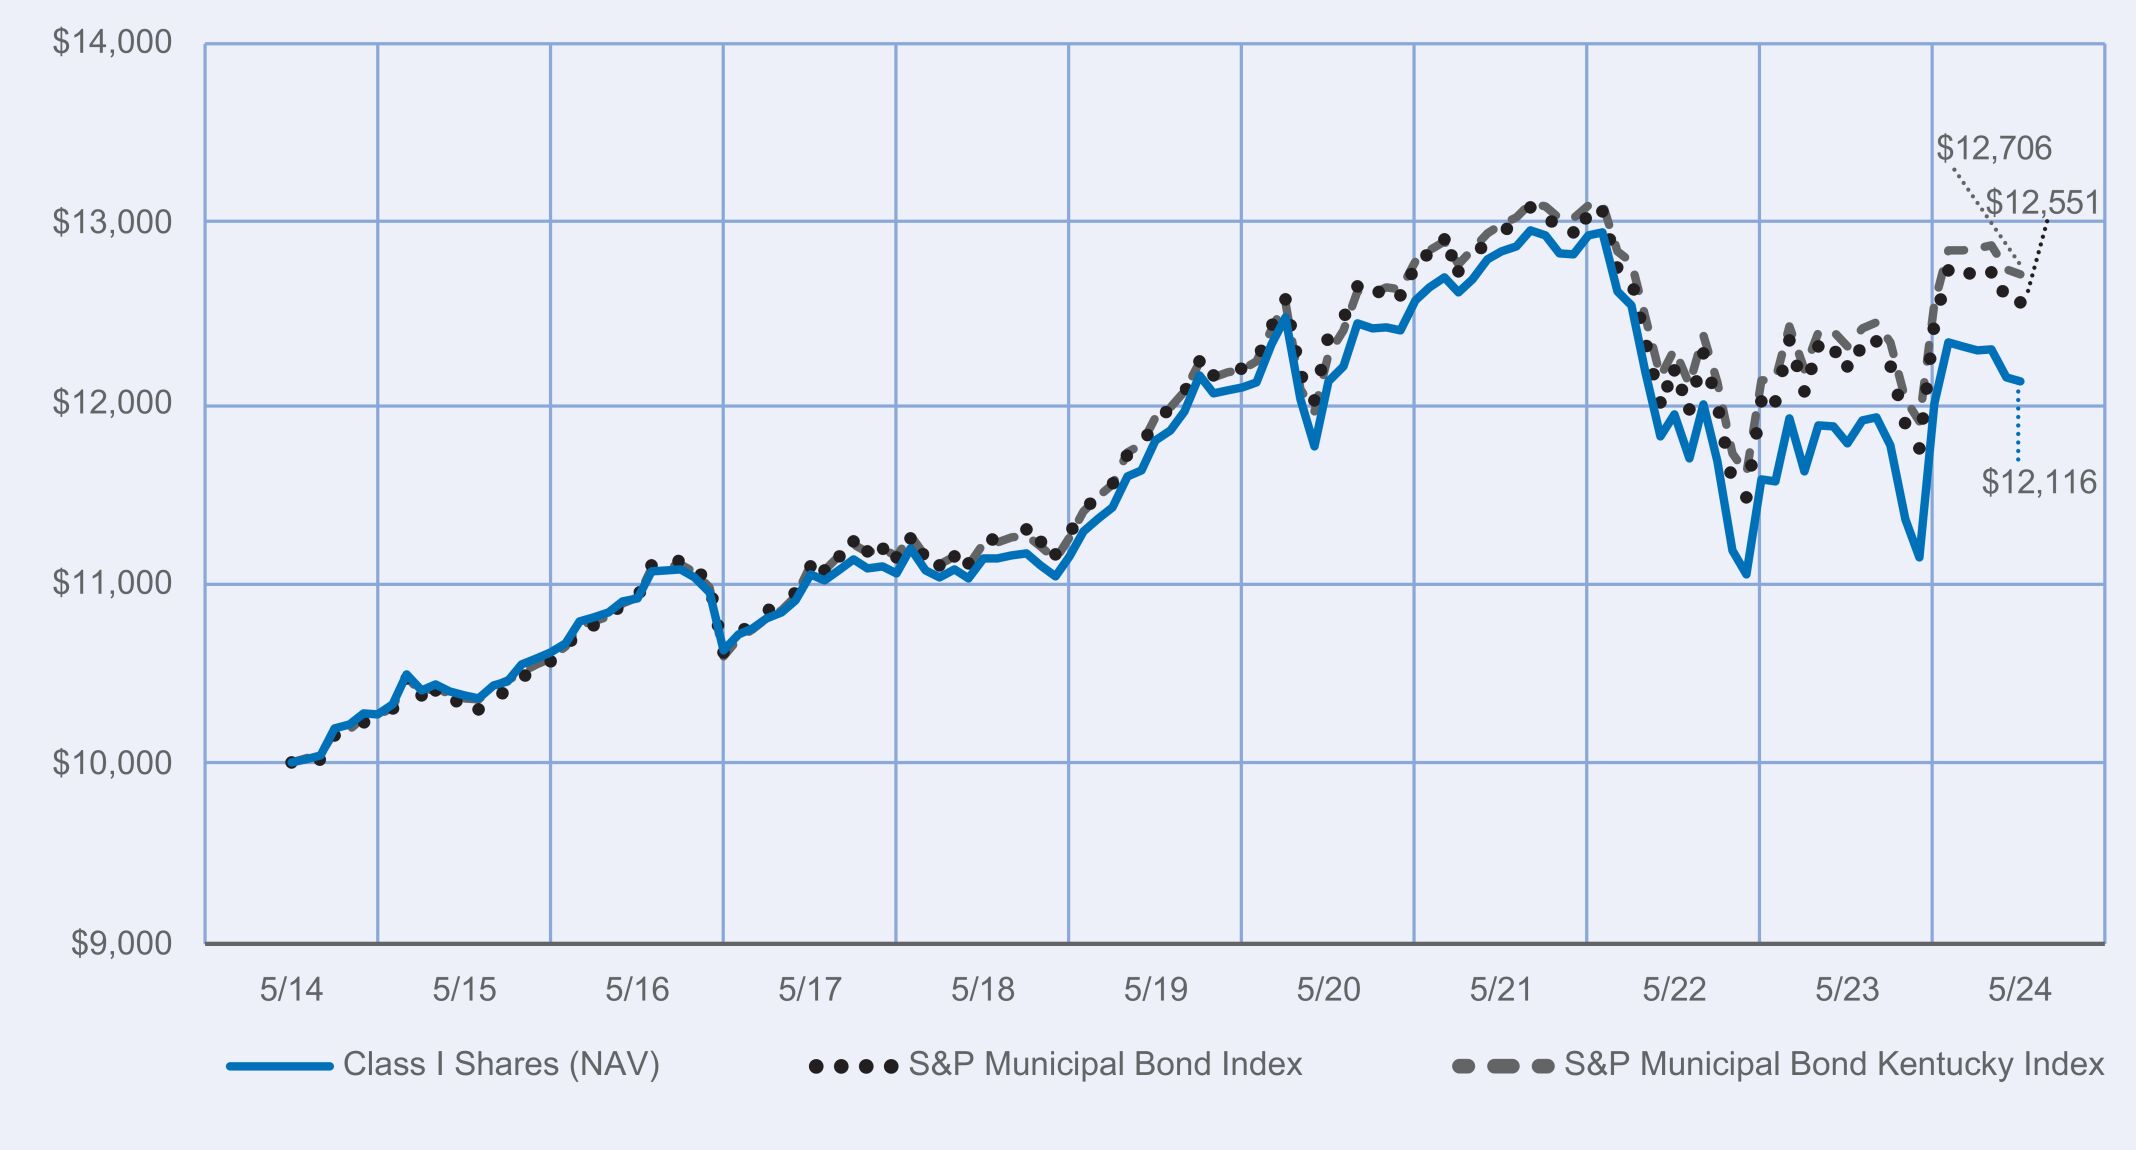
Performance Highlights • The Nuveen Kentucky Municipal Bond Fund returned 2.94% for Class I shares at net asset value (NAV) for the 12 months ended May 31, 2024. The Fund underperformed the S&P Municipal Bond Kentucky Index, which returned 3.23%. • Top detractors from relative performance » Sector allocation, particularly an underweight exposure to the industrial development revenue (IDR) sector, which outperformed, and an overweight exposure to the dedicated tax sector, which underperformed. » An overweight to the eight to 10-year duration segment, which underperformed. » Allocation to cash, which underperformed. • Top contributors to relative performance » Underweight allocation to zero to eight-year duration bonds, which underperformed, and an overweight allocation to 10-year and longer duration bonds, which outperformed. » Credit ratings allocations, specifically an underweight to the highest credit quality (AAA and AA rated) bonds, which lagged lower rated bonds. » Underweight allocations to the water and sewer sector and appropriation sector, both of which underperformed. | Performance Attribution IDR and dedicated tax sectors Eight to 10-year duration bonds Cash Short and long duration bonds Credit ratings allocations Water and sewer sector and appropriation sector |
| 1 | continued>> |
| 1‑Year | 5‑Year | 10‑Year | ||||||||||
| Class I Shares at NAV | 2.94 | % | 0.55 | % | 1.94 | % | ||||||
| S&P Municipal Bond Index | 2.88 | % | 1.06 | % | 2.30 | % | ||||||
| S&P Municipal Bond Kentucky Index | 3.23 | % | 1.30 | % | 2.42 | % | ||||||
| Lipper Other States Municipal Debt Funds Classification Average | 2.59 | % | 0.29 | % | 1.56 | % | ||||||
| 2 | continued>> |
| Fund net assets | $ | 238,205,608 | ||
| Total number of portfolio holdings | 96 | |||
| Portfolio turnover (%) | 21% | |||
| Total advisory fees paid for the year | $ | 1,245,659 |
| • | Portfolio manager update: Effective October 13, 2023, Scott Romans, Ph.D. and Kristen DeJong, CFA were added as portfolio managers of the Fund. |
| • | Management fees: As of May 1, 2024, the Fund’s overall complex-level fee begins at a maximum rate of 0.1600% of the Fund’s average daily net assets, with breakpoints for eligible complex-level assets above $124.3 billion. |
| • | prospectus • financial statements and other information • fund holdings • proxy voting information |
67065R804_AR_0524 3668676-INV-Y-07/25 (A, C, I) | |
| 3 |
| | Annual Shareholder Report May 31, 2024 |
| Cost of a $10,000 investment | Costs paid as a percentage of $10,000 investment | |||
| Class A Shares | $83 | 0.83% |
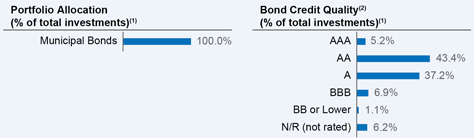
Performance Highlights • The Nuveen Michigan Municipal Bond Fund returned 2.50% for Class A shares at net asset value (NAV) for the 12 months ended May 31, 2024. The Fund underperformed the S&P Municipal Bond Michigan Index, which returned 2.85%. • Top detractors from relative performance » Sector allocations, primarily overweight exposures to the local general obligation (GO) and other utility sectors, which underperformed. » Overweight allocation to bonds with durations of 12 years and longer, which underperformed. » Underweight to BB rated bonds, which outperformed. • Top contributors to relative performance » Security selection, where a diverse range of credits performed well. » Duration positioning, especially an overweight to bonds with 10 to 12-year durations, which outperformed, and an underweight to bonds with two to four-year durations, which underperformed. | Performance Attribution Local GO and other utility sectors 12+ year duration bonds BB rated bonds Security selection 10-12 year and 2-4 year duration bonds |
| 1 | continued>> |
| 1‑Year | 5‑Year | 10‑Year | ||||||||||
| Class A Shares at NAV (excluding maximum sales charge) | 2.50 | % | 0.23 | % | 1.88 | % | ||||||
| Class A Shares at maximum sales charge (Offering Price) | (1.79 | )% | (0.62 | )% | 1.44 | % | ||||||
| S&P Municipal Bond Index | 2.88 | % | 1.06 | % | 2.30 | % | ||||||
| S&P Municipal Bond Michigan Index | 2.85 | % | 1.17 | % | 2.62 | % | ||||||
| Lipper Other States Municipal Debt Funds Classification Average | 2.59 | % | 0.29 | % | 1.56 | % | ||||||
| 2 | continued>> |
| Fund net assets | $ | 222,016,449 | ||
| Total number of portfolio holdings | 121 | |||
| Portfolio turnover (%) | 21% | |||
| Total advisory fees paid for the year | $ | 1,250,494 |
| • | Portfolio manager update: Effective October 13, 2023, Scott Romans, Ph.D. and Kristen DeJong, CFA were added as portfolio managers of the Fund. |
| • | Management fees: As of May 1, 2024, the Fund’s overall complex-level fee begins at a maximum rate of 0.1600% of the Fund’s average daily net assets, with breakpoints for eligible complex-level assets above $124.3 billion. |
| • | prospectus • financial statements and other information • fund holdings • proxy voting information |
67065R853_AR_0524 3668750-INV-Y-07/25 (A, C, I) | |
| 3 |
| | Annual Shareholder Report May 31, 2024 |
| Cost of a $10,000 investment | Costs paid as a percentage of $10,000 investment | |||
| Class C Shares | $163 | 1.63% |
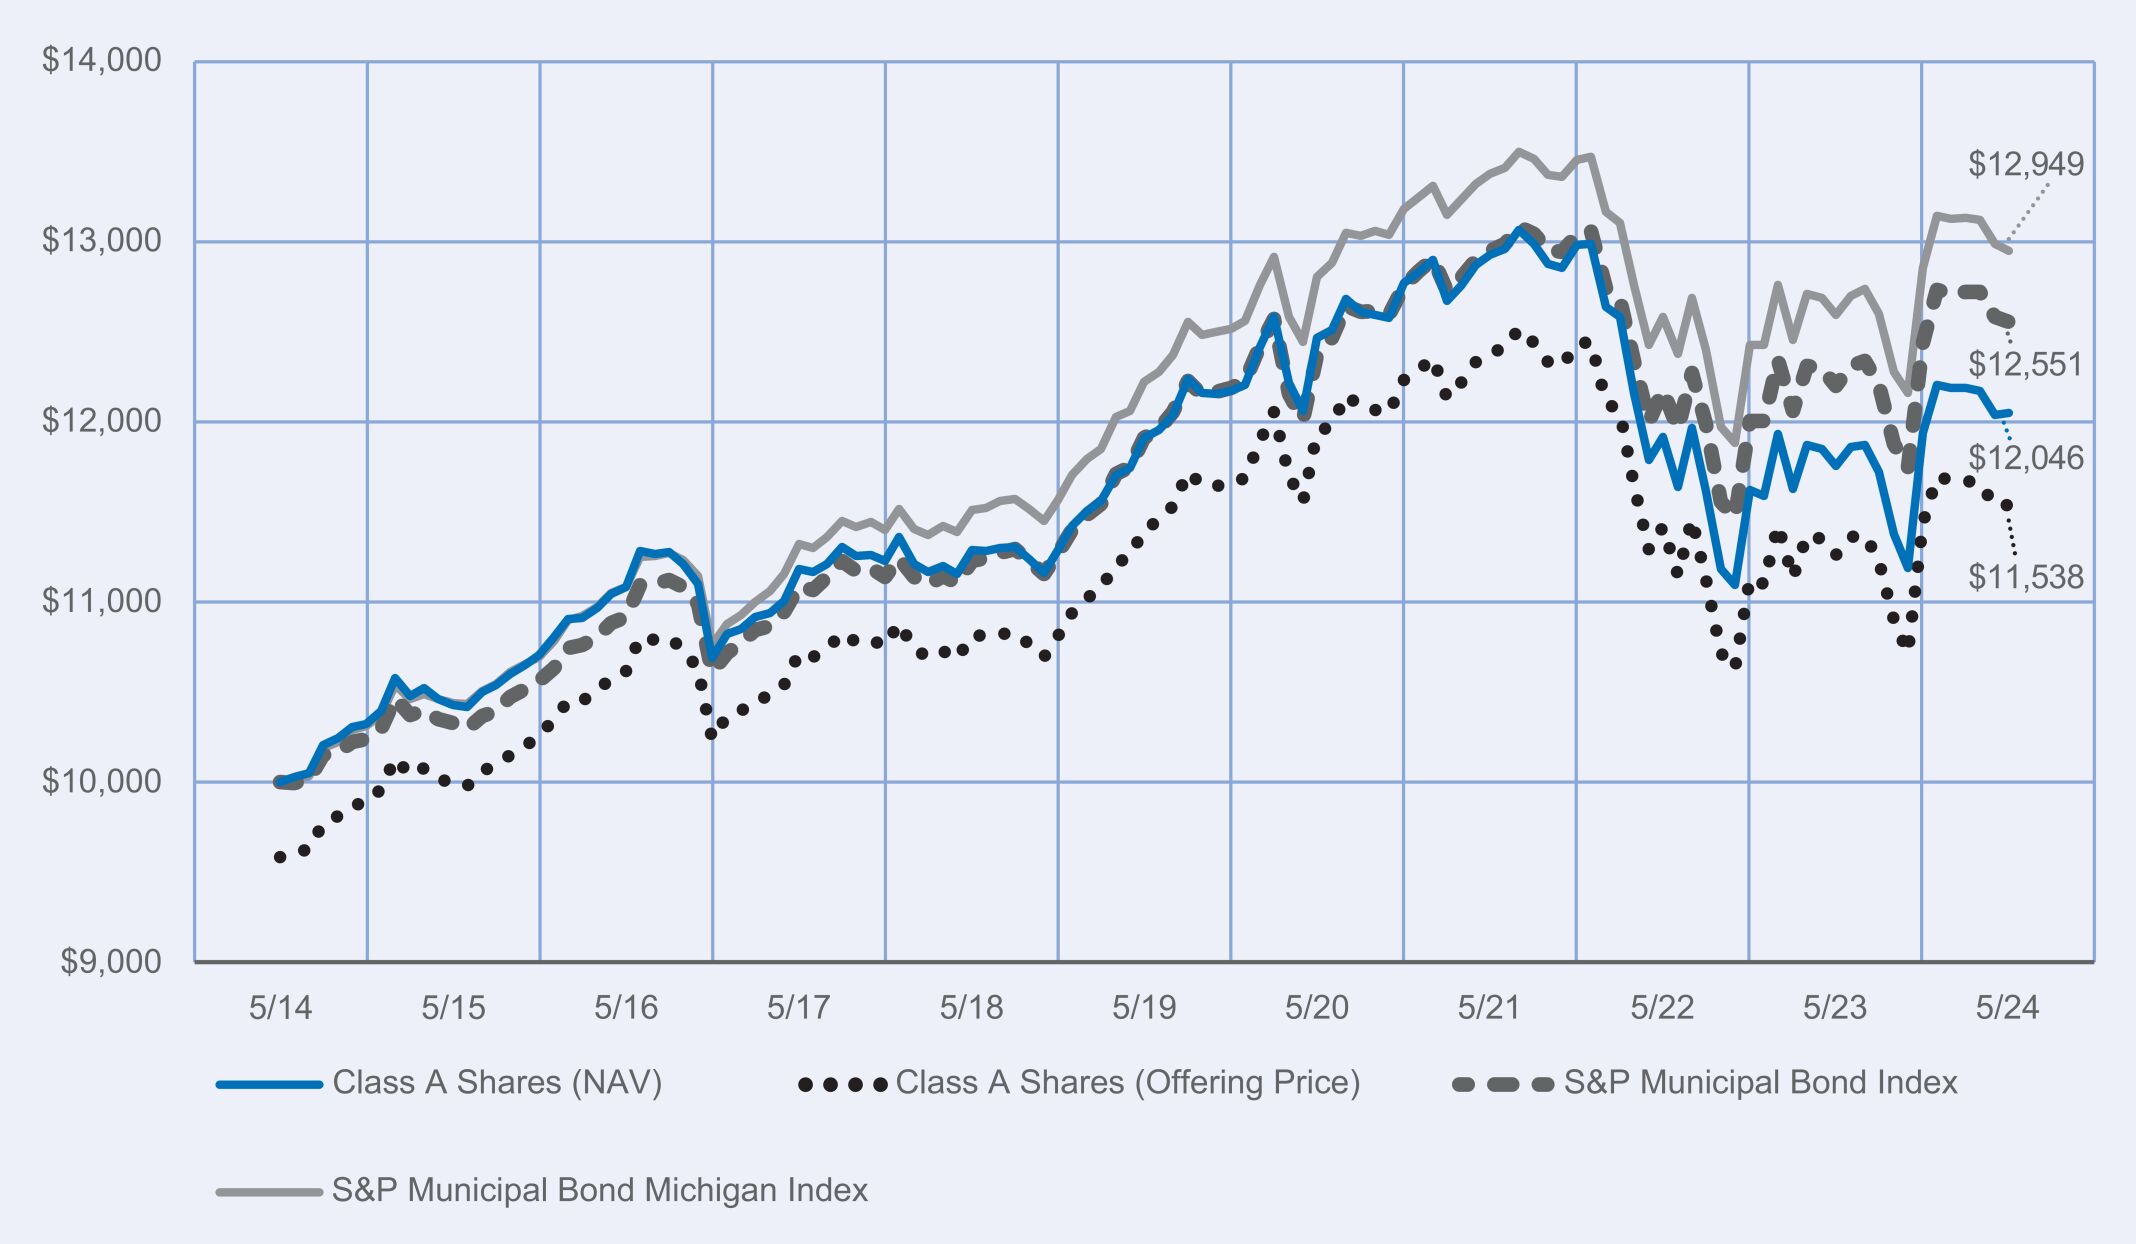
Performance Highlights • The Nuveen Michigan Municipal Bond Fund returned 1.57% for Class C shares at net asset value (NAV) for the 12 months ended May 31, 2024. The Fund underperformed the S&P Municipal Bond Michigan Index, which returned 2.85%. • Top detractors from relative performance » Sector allocations, primarily overweight exposures to the local general obligation (GO) and other utility sectors, which underperformed. » Overweight allocation to bonds with durations of 12 years and longer, which underperformed. » Underweight to BB rated bonds, which outperformed. • Top contributors to relative performance » Security selection, where a diverse range of credits performed well. » Duration positioning, especially an overweight to bonds with 10 to 12-year durations, which outperformed, and an underweight to bonds with two to four-year durations, which underperformed. | Performance Attribution Local GO and other utility sectors 12+ year duration bonds BB rated bonds Security selection 10-12 year and 2-4 year duration bonds |
| 1 | continued>> |
| 1‑Year | 5‑Year | 10‑Year | ||||||||||
| Class C Shares at NAV (excluding maximum sales charge) | 1.57 | % | (0.58 | )% | 1.23 | % | ||||||
| S&P Municipal Bond Index | 2.88 | % | 1.06 | % | 2.30 | % | ||||||
| S&P Municipal Bond Michigan Index | 2.85 | % | 1.17 | % | 2.62 | % | ||||||
| Lipper Other States Municipal Debt Funds Classification Average | 2.59 | % | 0.29 | % | 1.56 | % | ||||||
| 2 | continued>> |
| Fund net assets | $ | 222,016,449 | ||
| Total number of portfolio holdings | 121 | |||
| Portfolio turnover (%) | 21% | |||
| Total advisory fees paid for the year | $ | 1,250,494 |

| • | Portfolio manager update: Effective October 13, 2023, Scott Romans, Ph.D. and Kristen DeJong, CFA were added as portfolio managers of the Fund. |
| • | Management fees: As of May 1, 2024, the Fund’s overall complex-level fee begins at a maximum rate of 0.1600% of the Fund’s average daily net assets, with breakpoints for eligible complex-level assets above $124.3 billion. |
| • | prospectus • financial statements and other information • fund holdings • proxy voting information |
67065R655_AR_0524 3668750-INV-Y-07/25 (A, C, I) | |
| 3 |
| | Annual Shareholder Report May 31, 2024 |
| Cost of a $10,000 investment | Costs paid as a percentage of $10,000 investment | |||
| Class I Shares | $63 | 0.63% |
Performance Highlights • The Nuveen Michigan Municipal Bond Fund returned 2.60% for Class I shares at net asset value (NAV) for the 12 months ended May 31, 2024. The Fund performed in line with the S&P Municipal Bond Michigan Index, which returned 2.85%. • Top detractors from relative performance » Sector allocations, primarily overweight exposures to the local general obligation (GO) and other utility sectors, which underperformed. » Overweight allocation to bonds with durations of 12 years and longer, which underperformed. » Underweight to BB rated bonds, which outperformed. • Top contributors to relative performance » Security selection, where a diverse range of credits performed well. » Duration positioning, especially an overweight to bonds with 10 to 12-year durations, which outperformed, and an underweight to bonds with two to four-year durations, which underperformed. | Performance Attribution Local GO and other utility sectors 12+ year duration bonds BB rated bonds Security selection 10-12 year and 2-4 year duration bonds |
| 1 | continued>> |

| 1‑Year | 5‑Year | 10‑Year | ||||||||||
| Class I Shares at NAV | 2.60 | % | 0.44 | % | 2.08 | % | ||||||
| S&P Municipal Bond Index | 2.88 | % | 1.06 | % | 2.30 | % | ||||||
| S&P Municipal Bond Michigan Index | 2.85 | % | 1.17 | % | 2.62 | % | ||||||
| Lipper Other States Municipal Debt Funds Classification Average | 2.59 | % | 0.29 | % | 1.56 | % | ||||||
| 2 | continued>> |
| Fund net assets | $ | 222,016,449 | ||
| Total number of portfolio holdings | 121 | |||
| Portfolio turnover (%) | 21% | |||
| Total advisory fees paid for the year | $ | 1,250,494 |

| • | Portfolio manager update: Effective October 13, 2023, Scott Romans, Ph.D. and Kristen DeJong, CFA were added as portfolio managers of the Fund. |
| • | Management fees: As of May 1, 2024, the Fund’s overall complex-level fee begins at a maximum rate of 0.1600% of the Fund’s average daily net assets, with breakpoints for eligible complex-level assets above $124.3 billion. |
| • | prospectus • financial statements and other information • fund holdings • proxy voting information |
67065R820_AR_0524 3668750-INV-Y-07/25 (A, C, I) | |
| 3 |
| | Annual Shareholder Report May 31, 2024 |
| Cost of a $10,000 investment | Costs paid as a percentage of $10,000 investment | |||
| Class A Shares | $78 | 0.78% |
Performance Highlights • The Nuveen Missouri Municipal Bond Fund returned 3.60% for Class A shares at net asset value (NAV) for the 12 months ended May 31, 2024. The Fund outperformed the S&P Municipal Bond Missouri Index, which returned 2.87%. • Top contributors to relative performance » Duration positioning, especially an underweight to bonds with six year and shorter durations and an overweight to bonds with eight years and longer durations, which benefited from the yield curve flattening. » Sector allocation, primarily an overweight to the incremental tax sector and underweights to the single-family housing and other revenue sectors. » Security selection across a diverse group of holdings. • Top detractors from relative performance » There were no material detractors in this reporting period. | Performance Attribution Duration positioning Sector allocation Security selection No material detractors |
| 1 | continued>> |
| 1‑Year | 5‑Year | 10‑Year | ||||||||||
| Class A Shares at NAV (excluding maximum sales charge) | 3.60 | % | 0.90 | % | 2.30 | % | ||||||
| Class A Shares at maximum sales charge (Offering Price) | (0.71 | )% | 0.04 | % | 1.86 | % | ||||||
| S&P Municipal Bond Index | 2.88 | % | 1.06 | % | 2.30 | % | ||||||
| S&P Municipal Bond Missouri Index | 2.87 | % | 1.09 | % | 2.30 | % | ||||||
| Lipper Other States Municipal Debt Funds Classification Average | 2.59 | % | 0.29 | % | 1.56 | % | ||||||
| 2 | continued>> |
| Fund net assets | $ | 508,212,429 | ||
| Total number of portfolio holdings | 250 | |||
| Portfolio turnover (%) | 20% | |||
| Total advisory fees paid for the year | $ | 2,585,170 |

| • | Portfolio manager updates: Effective October 13, 2023, Michael Hamilton and Stephen Candido, CFA were added as portfolio managers of the Fund. Effective April 1, 2024, Christopher Drahn retired from Nuveen Asset Management, LLC and no longer serves as a portfolio manager of the Fund. |
| • | Management fees: As of May 1, 2024, the Fund’s overall complex-level fee begins at a maximum rate of 0.1600% of the Fund’s average daily net assets, with breakpoints for eligible complex-level assets above $124.3 billion. |
| • | prospectus • financial statements and other information • fund holdings • proxy voting information |
67065R812_AR_0524 3668763-INV-Y-07/25 (A, C, I) | |
| 3 |
| | Annual Shareholder Report May 31, 2024 |
| Cost of a $10,000 investment | Costs paid as a percentage of $10,000 investment | |||
| Class C Shares | $158 | 1.58% |
Performance Highlights • The Nuveen Missouri Municipal Bond Fund returned 2.76% for Class C shares at net asset value (NAV) for the 12 months ended May 31, 2024. The Fund performed in line with the S&P Municipal Bond Missouri Index, which returned 2.87%. • Top contributors to relative performance » Duration positioning, especially an underweight to bonds with six year and shorter durations and an overweight to bonds with eight years and longer durations, which benefited from the yield curve flattening. » Sector allocation, primarily an overweight to the incremental tax sector and underweights to the single-family housing and other revenue sectors. » Security selection across a diverse group of holdings. • Top detractors from relative performance » There were no material detractors in this reporting period. | Performance Attribution Duration positioning Sector allocation Security selection No material detractors |
| 1 | continued>> |
| 1‑Year | 5‑Year | 10‑Year | ||||||||||
| Class C Shares at NAV (excluding maximum sales charge) | 2.76 | % | 0.08 | % | 1.64 | % | ||||||
| S&P Municipal Bond Index | 2.88 | % | 1.06 | % | 2.30 | % | ||||||
| S&P Municipal Bond Missouri Index | 2.87 | % | 1.09 | % | 2.30 | % | ||||||
| Lipper Other States Municipal Debt Funds Classification Average | 2.59 | % | 0.29 | % | 1.56 | % | ||||||
| 2 | continued>> |
| Fund net assets | $ | 508,212,429 | ||
| Total number of portfolio holdings | 250 | |||
| Portfolio turnover (%) | 20% | |||
| Total advisory fees paid for the year | $ | 2,585,170 |
| • | Portfolio manager updates: Effective October 13, 2023, Michael Hamilton and Stephen Candido, CFA were added as portfolio managers of the Fund. Effective April 1, 2024, Christopher Drahn retired from Nuveen Asset Management, LLC and no longer serves as a portfolio manager of the Fund. |
| • | Management fees: As of May 1, 2024, the Fund’s overall complex-level fee begins at a maximum rate of 0.1600% of the Fund’s average daily net assets, with breakpoints for eligible complex-level assets above $124.3 billion. |
| • | prospectus • financial statements and other information • fund holdings • proxy voting information |
67065R648_AR_0524 3668763-INV-Y-07/25 (A, C, I) | |
| 3 |
| | Annual Shareholder Report May 31, 2024 |
| Cost of a $10,000 investment | Costs paid as a percentage of $10,000 investment | |||
| Class I Shares | $58 | 0.58% |
Performance Highlights • The Nuveen Missouri Municipal Bond Fund returned 3.69% for Class I shares at net asset value (NAV) for the 12 months ended May 31, 2024. The Fund outperformed the S&P Municipal Bond Missouri Index, which returned 2.87%. • Top contributors to relative performance » Duration positioning, especially an underweight to bonds with six year and shorter durations and an overweight to bonds with eight years and longer durations, which benefited from the yield curve flattening. » Sector allocation, primarily an overweight to the incremental tax sector and underweights to the single-family housing and other revenue sectors. » Security selection across a diverse group of holdings. • Top detractors from relative performance » There were no material detractors in this reporting period. | Performance Attribution Duration positioning Sector allocation Security selection No material detractors |
| 1 | continued>> |

| 1‑Year | 5‑Year | 10‑Year | ||||||||||
| Class I Shares at NAV | 3.69 | % | 1.08 | % | 2.50 | % | ||||||
| S&P Municipal Bond Index | 2.88 | % | 1.06 | % | 2.30 | % | ||||||
| S&P Municipal Bond Missouri Index | 2.87 | % | 1.09 | % | 2.30 | % | ||||||
| Lipper Other States Municipal Debt Funds Classification Average | 2.59 | % | 0.29 | % | 1.56 | % | ||||||
| 2 | continued>> |
| Fund net assets | $ | 508,212,429 | ||
| Total number of portfolio holdings | 250 | |||
| Portfolio turnover (%) | 20% | |||
| Total advisory fees paid for the year | $ | 2,585,170 |
| • | Portfolio manager updates: Effective October 13, 2023, Michael Hamilton and Stephen Candido, CFA were added as portfolio managers of the Fund. Effective April 1, 2024, Christopher Drahn retired from Nuveen Asset Management, LLC and no longer serves as a portfolio manager of the Fund. |
| • | Management fees: As of May 1, 2024, the Fund’s overall complex-level fee begins at a maximum rate of 0.1600% of the Fund’s average daily net assets, with breakpoints for eligible complex-level assets above $124.3 billion. |
| • | prospectus • financial statements and other information • fund holdings • proxy voting information |
67065R770_AR_0524 3668763-INV-Y-07/25 (A, C, I) | |
| 3 |
| | Annual Shareholder Report May 31, 2024 |
| Cost of a $10,000 investment | Costs paid as a percentage of $10,000 investment | |||
| Class A Shares | $78 | 0.78% |
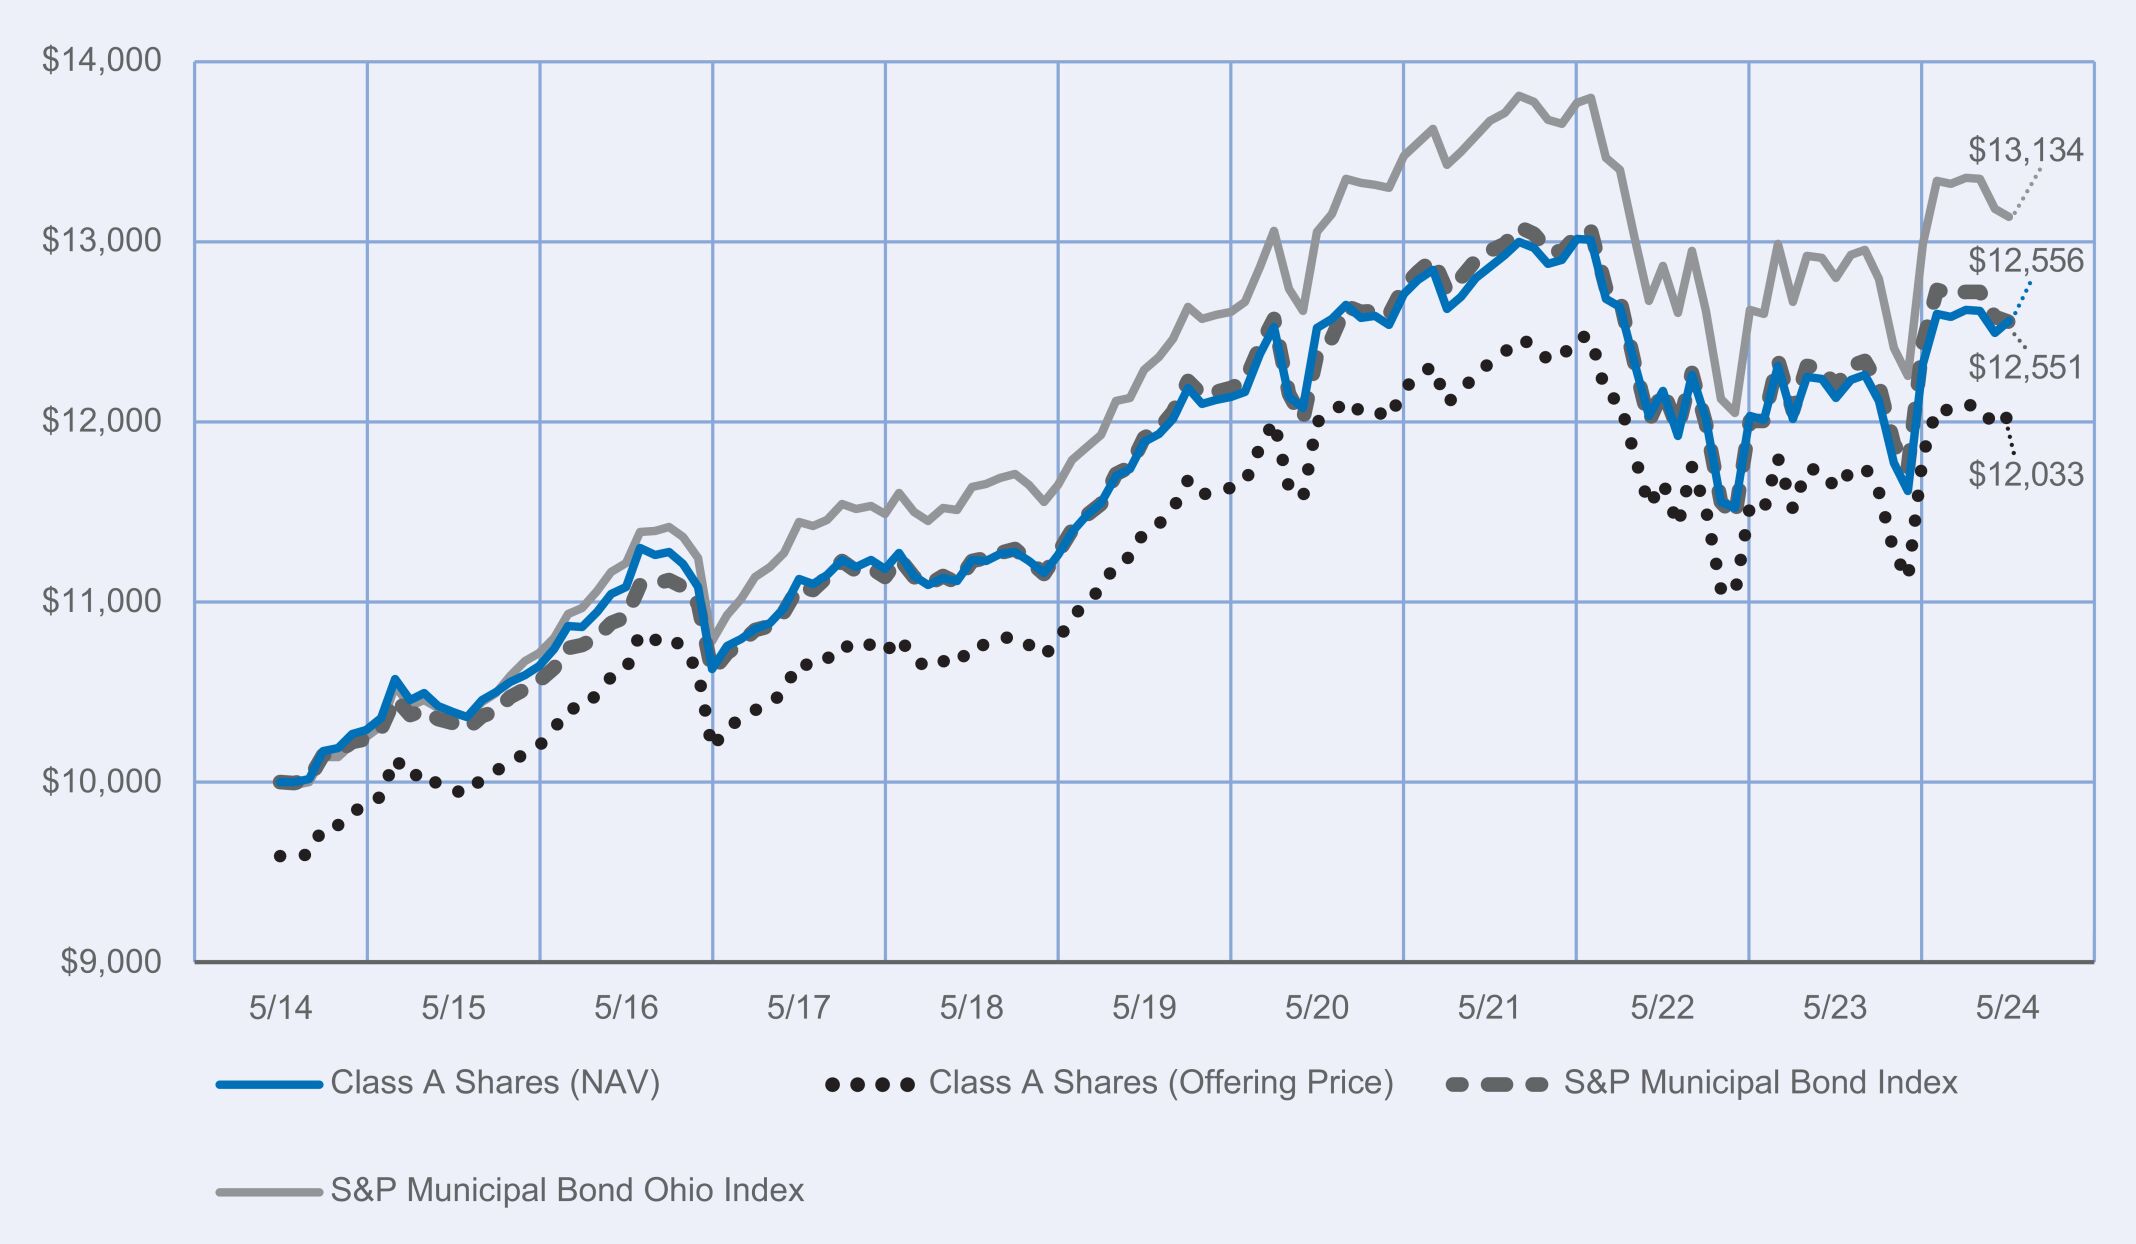
Performance Highlights • The Nuveen Ohio Municipal Bond Fund returned 3.52% for Class A shares at net asset value (NAV) for the 12 months ended May 31, 2024. The Fund outperformed the S&P Municipal Bond Ohio Index, which returned 2.65%. • Top contributors to relative performance » Sector allocation and security selection, largely driven by the Energy Harbor/Vistra Vision equity position, whose share prices increased before and after the merger transaction closed. » Duration positioning, especially an underweight exposure to bonds with two to four-year durations and 12-year and longer durations, which underperformed. • Top detractors from relative performance » Underweight to BB rated bonds, which outperformed, and overweight to AA rated bonds, which underperformed. » Underweight to the life care sector, which performed well. | Performance Attribution Energy Harbor/Vistra Vision Duration positioning BB and AA rated bonds Life care sector |
| 1 | continued>> |
| 1‑Year | 5‑Year | 10‑Year | ||||||||||
| Class A Shares at NAV (excluding maximum sales charge) | 3.52 | % | 1.11 | % | 2.30 | % | ||||||
| Class A Shares at maximum sales charge (Offering Price) | (0.80 | )% | 0.24 | % | 1.87 | % | ||||||
| S&P Municipal Bond Index | 2.88 | % | 1.06 | % | 2.30 | % | ||||||
| S&P Municipal Bond Ohio Index | 2.65 | % | 1.34 | % | 2.76 | % | ||||||
| Lipper Ohio Municipal Debt Funds Classification Average | 2.92 | % | 0.50 | % | 1.79 | % | ||||||
| 2 | continued>> |
| Fund net assets | $ | 563,079,167 | ||
| Total number of portfolio holdings | 230 | |||
| Portfolio turnover (%) | 14% | |||
| Total advisory fees paid for the year | $ | 2,862,941 |
| • | Portfolio manager update: Effective October 13, 2023, Scott Romans, Ph.D. and Kristen DeJong, CFA were added as portfolio managers of the Fund. |
| • | Management fees: As of May 1, 2024, the Fund’s overall complex-level fee begins at a maximum rate of 0.1600% of the Fund’s average daily net assets, with breakpoints for eligible complex-level assets above $124.3 billion. |
| • | prospectus • financial statements and other information • fund holdings • proxy voting information |
67065R762_AR_0524 3668770-INV-Y-07/25 (A, C, I) | |
| 3 |
| | Annual Shareholder Report May 31, 2024 |
| Cost of a $10,000 investment | Costs paid as a percentage of $10,000 investment | |||
| Class C Shares | $158 | 1.58% |
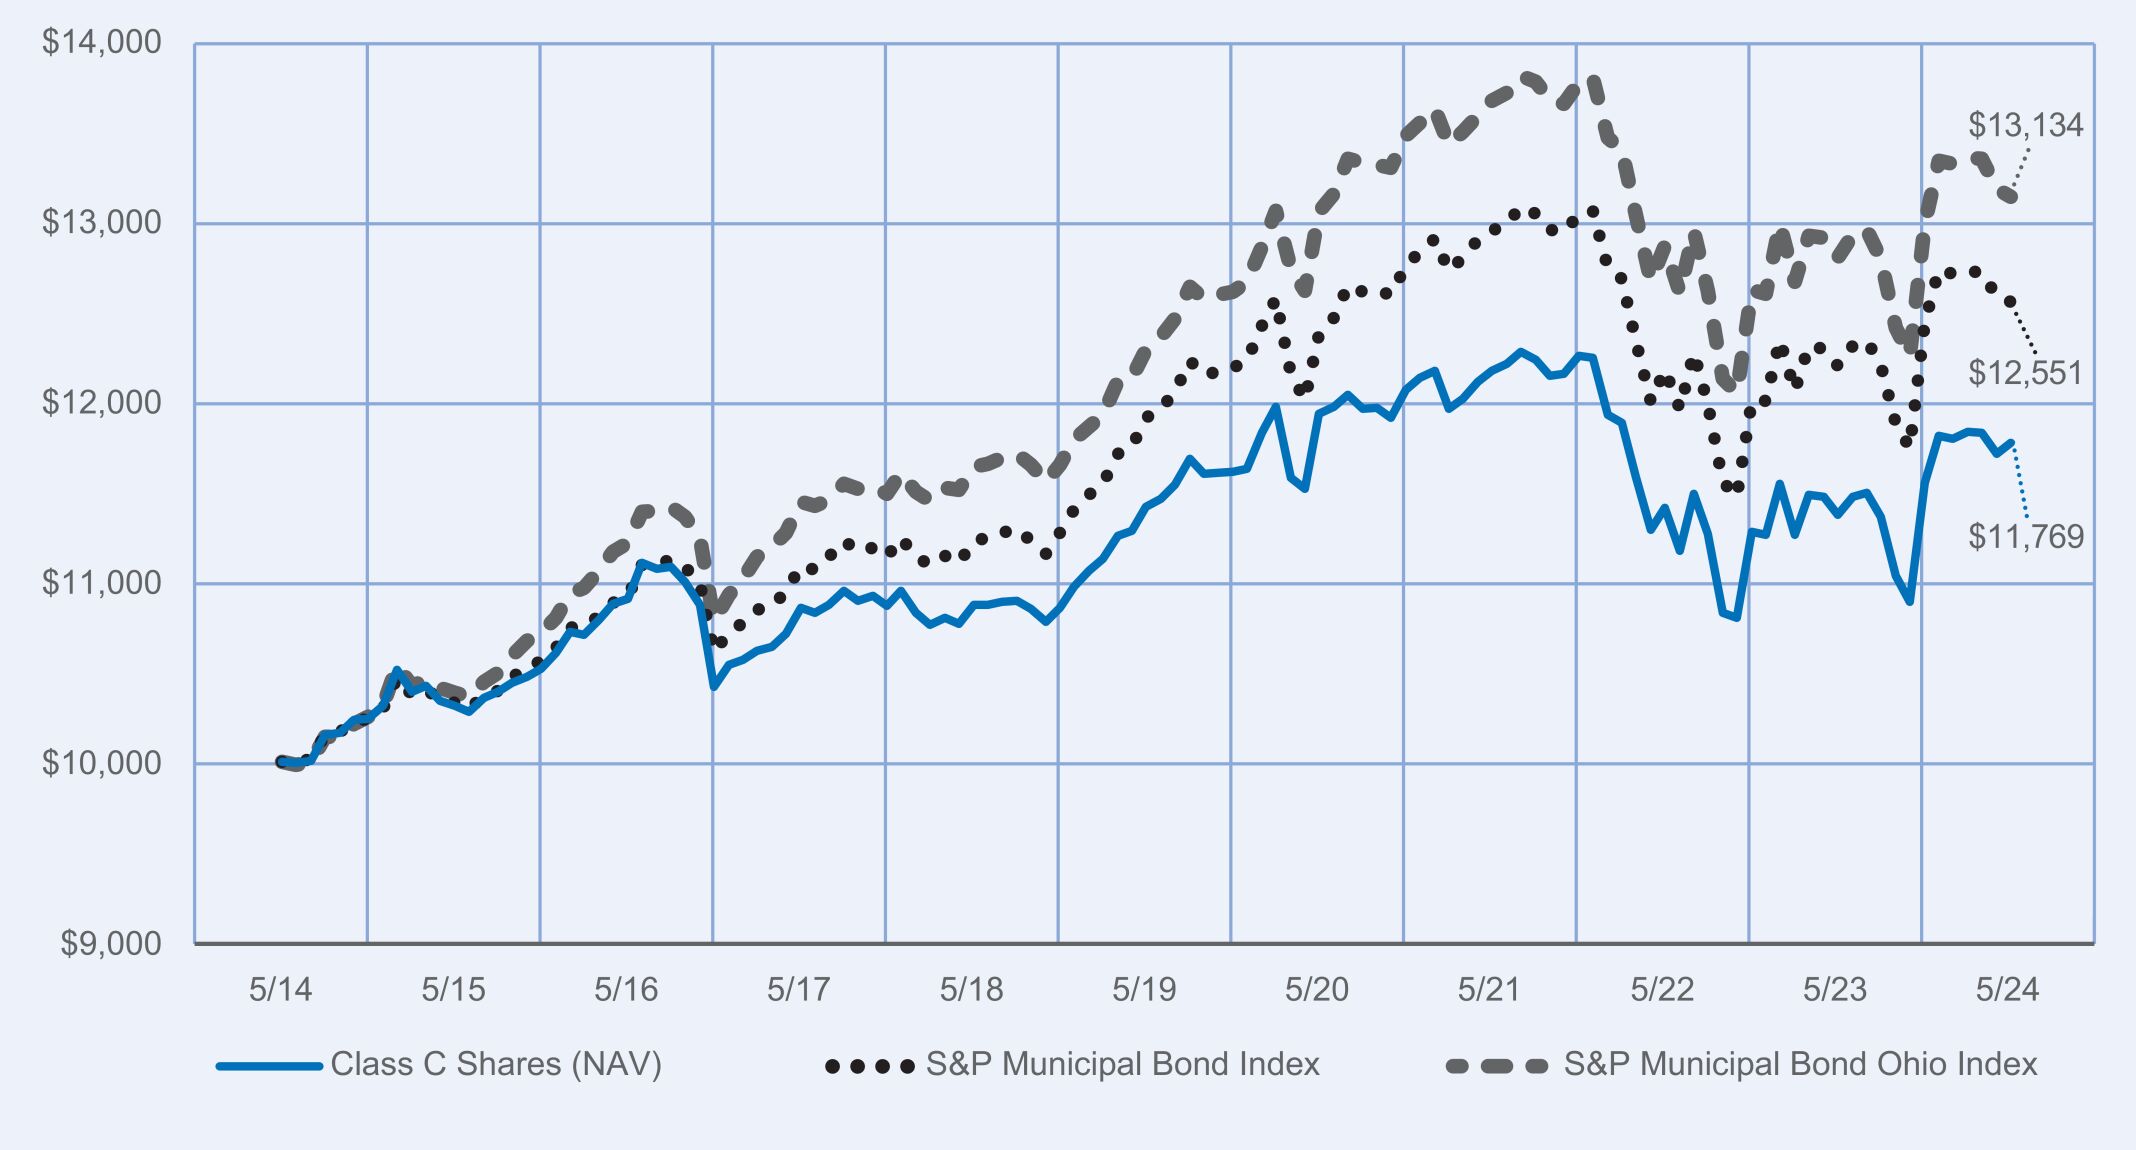
Performance Highlights • The Nuveen Ohio Municipal Bond Fund returned 2.72% for Class C shares at net asset value (NAV) for the 12 months ended May 31, 2024. The Fund performed in line with the S&P Municipal Bond Ohio Index, which returned 2.65%. • Top contributors to relative performance » Sector allocation and security selection, largely driven by the Energy Harbor/Vistra Vision equity position, whose share prices increased before and after the merger transaction closed. » Duration positioning, especially an underweight exposure to bonds with two to four-year durations and 12-year and longer durations, which underperformed. • Top detractors from relative performance » Underweight to BB rated bonds, which outperformed, and overweight to AA rated bonds, which underperformed. » Underweight to the life care sector, which performed well. | Performance Attribution Energy Harbor/Vistra Vision Duration positioning BB and AA rated bonds Life care sector |
| 1 | continued>> |
| 1‑Year | 5‑Year | 10‑Year | ||||||||||
| Class C Shares at NAV (excluding maximum sales charge) | 2.72 | % | 0.29 | % | 1.64 | % | ||||||
| S&P Municipal Bond Index | 2.88 | % | 1.06 | % | 2.30 | % | ||||||
| S&P Municipal Bond Ohio Index | 2.65 | % | 1.34 | % | 2.76 | % | ||||||
| Lipper Ohio Municipal Debt Funds Classification Average | 2.92 | % | 0.50 | % | 1.79 | % | ||||||
| 2 | continued>> |
| Fund net assets | $ | 563,079,167 | ||
| Total number of portfolio holdings | 230 | |||
| Portfolio turnover (%) | 14% | |||
| Total advisory fees paid for the year | $ | 2,862,941 |

| • | Portfolio manager update: Effective October 13, 2023, Scott Romans, Ph.D. and Kristen DeJong, CFA were added as portfolio managers of the Fund. |
| • | Management fees: As of May 1, 2024, the Fund’s overall complex-level fee begins at a maximum rate of 0.1600% of the Fund’s average daily net assets, with breakpoints for eligible complex-level assets above $124.3 billion. |
| • | prospectus • financial statements and other information • fund holdings • proxy voting information |
67065R630_AR_0524 3668770-INV-Y-07/25 (A, C, I) | |
| 3 |
| | Annual Shareholder Report May 31, 2024 |
| Cost of a $10,000 investment | Costs paid as a percentage of $10,000 investment | |||
| Class I Shares | $58 | 0.58% |
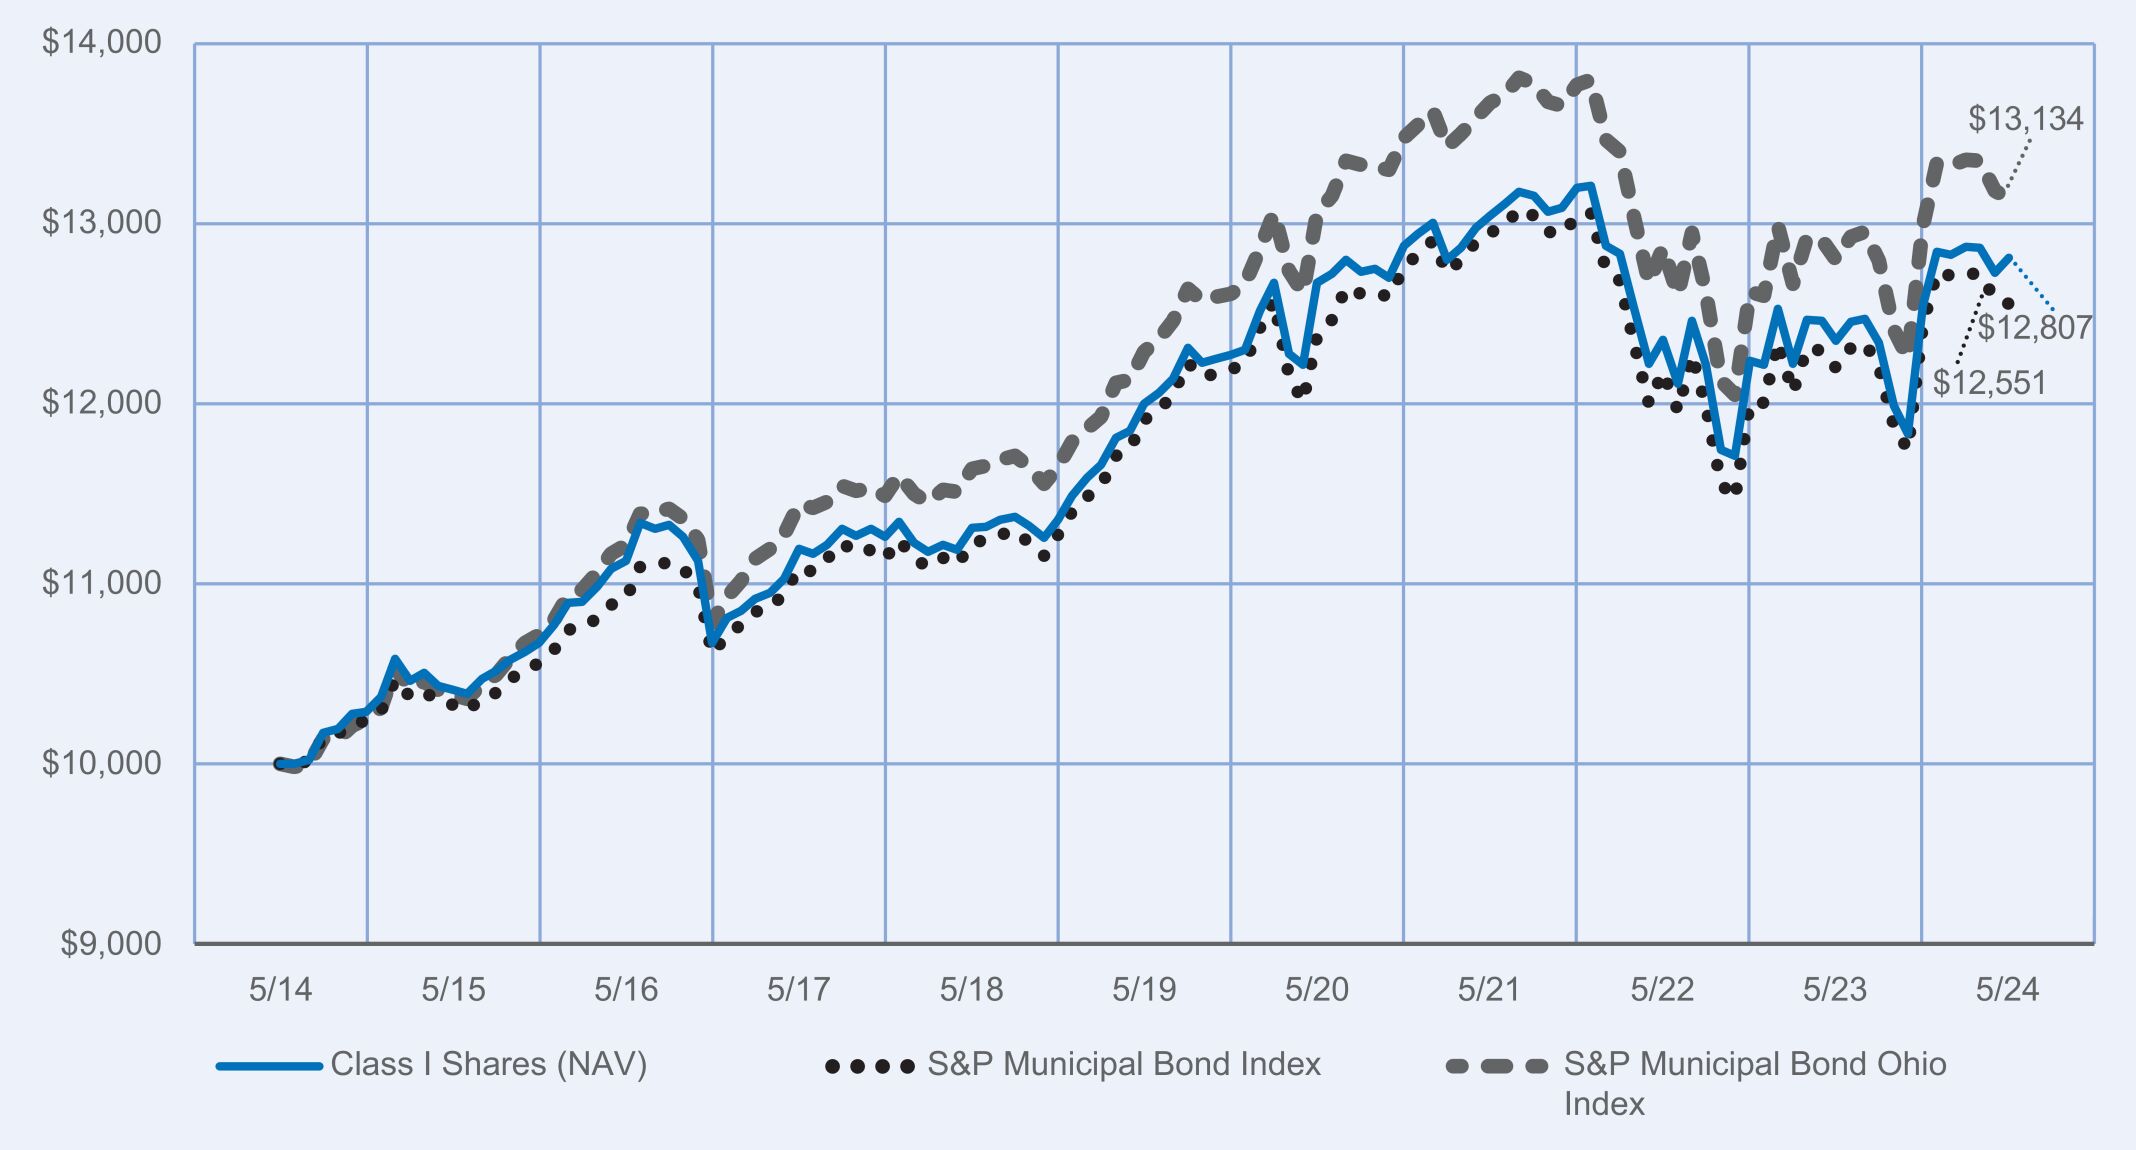
Performance Highlights • The Nuveen Ohio Municipal Bond Fund returned 3.73% for Class I shares at net asset value (NAV) for the 12 months ended May 31, 2024. The Fund outperformed the S&P Municipal Bond Ohio Index, which returned 2.65%. • Top contributors to relative performance » Sector allocation and security selection, largely driven by the Energy Harbor/Vistra Vision equity position, whose share prices increased before and after the merger transaction closed. » Duration positioning, especially an underweight exposure to bonds with two to four-year durations and 12-year and longer durations, which underperformed. • Top detractors from relative performance » Underweight to BB rated bonds, which outperformed, and overweight to AA rated bonds, which underperformed. » Underweight to the life care sector, which performed well. | Performance Attribution Energy Harbor/Vistra Vision Duration positioning BB and AA rated bonds Life care sector |
| 1 | continued>> |
| 1‑Year | 5‑Year | 10‑Year | ||||||||||
| Class I Shares at NAV | 3.73 | % | 1.31 | % | 2.50 | % | ||||||
| S&P Municipal Bond Index | 2.88 | % | 1.06 | % | 2.30 | % | ||||||
| S&P Municipal Bond Ohio Index | 2.65 | % | 1.34 | % | 2.76 | % | ||||||
| Lipper Ohio Municipal Debt Funds Classification Average | 2.92 | % | 0.50 | % | 1.79 | % | ||||||
| 2 | continued>> |
| Fund net assets | $ | 563,079,167 | ||
| Total number of portfolio holdings | 230 | |||
| Portfolio turnover (%) | 14% | |||
| Total advisory fees paid for the year | $ | 2,862,941 |

| • | Portfolio manager update: Effective October 13, 2023, Scott Romans, Ph.D. and Kristen DeJong, CFA were added as portfolio managers of the Fund. |
| • | Management fees: As of May 1, 2024, the Fund’s overall complex-level fee begins at a maximum rate of 0.1600% of the Fund’s average daily net assets, with breakpoints for eligible complex-level assets above $124.3 billion. |
| • | prospectus • financial statements and other information • fund holdings • proxy voting information |
67065R739_AR_0524 3668770-INV-Y-07/25 (A, C, I) | |
| 3 |
| | Annual Shareholder Report May 31, 2024 |
| Cost of a $10,000 investment | Costs paid as a percentage of $10,000 investment | |||
| Class A Shares | $89 | 0.89% |
Performance Highlights • The Nuveen Wisconsin Municipal Bond Fund returned 5.97% for Class A shares at net asset value (NAV) for the 12 months ended May 31, 2024. The Fund outperformed the S&P Municipal Bond Wisconsin Index, which returned 3.84%. • Top contributors to relative performance » Overweight exposure to longer-maturity bonds, which outperformed as the yield curve flattened. » Overweight exposure to non-rated bonds, which benefited from contracting spreads. » Overweight exposure to the health care sector, which outperformed. • Top detractors from relative performance » Overweight to appropriation-backed bonds, which lagged. » Overweight to the multi-family housing sector, which underperformed. | Performance Attribution Longer-maturity bonds Non-rated bonds Health care sector Appropriation bonds Multi-family housing sector |
| 1 | continued>> |
| 1‑Year | 5‑Year | 10‑Year | ||||||||||
| Class A Shares at NAV (excluding maximum sales charge) | 5.97 | % | 1.37 | % | 2.50 | % | ||||||
| Class A Shares at maximum sales charge (Offering Price) | 1.56 | % | 0.51 | % | 2.06 | % | ||||||
| S&P Municipal Bond Index | 2.88 | % | 1.06 | % | 2.30 | % | ||||||
| S&P Municipal Bond Wisconsin Index | 3.84 | % | 0.94 | % | 2.23 | % | ||||||
| Lipper Other States Municipal Debt Funds Classification Average | 2.59 | % | 0.29 | % | 1.56 | % | ||||||
| 2 | continued>> |
| Fund net assets | $ | 72,817,069 | ||
| Total number of portfolio holdings | 70 | |||
| Portfolio turnover (%) | 13% | |||
| Total advisory fees paid for the year | $ | 401,831 |

| • | Portfolio manager update: Effective October 13, 2023, Paul Brennan, CFA was added as a portfolio manager of the Fund. |
| • | Management fees: As of May 1, 2024, the Fund’s overall complex-level fee begins at a maximum rate of 0.1600% of the Fund’s average daily net assets, with breakpoints for eligible complex-level assets above $124.3 billion. |
| • | Fee waiver/reimbursement: As of May 1, 2024, Nuveen Fund Advisors, LLC has agreed to waive fees and/or reimburse expenses of the Fund through July 31, 2026 so that the total annual operating expenses of the Fund (excluding 12b-1 distribution and/or service fees, interest expenses, taxes, acquired fund fees and expenses, fees incurred in acquiring and disposing of portfolio securities and extraordinary expenses) do not exceed 0.65% of the average daily net assets of any class of Fund shares. |
| • | prospectus • financial statements and other information • fund holdings • proxy voting information |
67065R721_AR_0524 3668776-INV-Y-07/25 (A, C, I) | |
| 3 |
| | Annual Shareholder Report May 31, 2024 |
| Cost of a $10,000 investment | Costs paid as a percentage of $10,000 investment | |||
| Class C Shares | $169 | 1.69% |
Performance Highlights • The Nuveen Wisconsin Municipal Bond Fund returned 5.13% for Class C shares at net asset value (NAV) for the 12 months ended May 31, 2024. The Fund outperformed the S&P Municipal Bond Wisconsin Index, which returned 3.84%. • Top contributors to relative performance » Overweight exposure to longer-maturity bonds, which outperformed as the yield curve flattened. » Overweight exposure to non-rated bonds, which benefited from contracting spreads. » Overweight exposure to the health care sector, which outperformed. • Top detractors from relative performance » Overweight to appropriation-backed bonds, which lagged. » Overweight to the multi-family housing sector, which underperformed. | Performance Attribution Longer-maturity bonds Non-rated bonds Health care sector Appropriation bonds Multi-family housing sector |
| 1 | continued>> |
| 1‑Year | 5‑Year | 10‑Year | ||||||||||
| Class C Shares at NAV (excluding maximum sales charge) | 5.13 | % | 0.57 | % | 1.84 | % | ||||||
| S&P Municipal Bond Index | 2.88 | % | 1.06 | % | 2.30 | % | ||||||
| S&P Municipal Bond Wisconsin Index | 3.84 | % | 0.94 | % | 2.23 | % | ||||||
| Lipper Other States Municipal Debt Funds Classification Average | 2.59 | % | 0.29 | % | 1.56 | % | ||||||
| 2 | continued>> |
| Fund net assets | $ | 72,817,069 | ||
| Total number of portfolio holdings | 70 | |||
| Portfolio turnover (%) | 13% | |||
| Total advisory fees paid for the year | $ | 401,831 |

| • | Portfolio manager update: Effective October 13, 2023, Paul Brennan, CFA was added as a portfolio manager of the Fund. |
| • | Management fees: As of May 1, 2024, the Fund’s overall complex-level fee begins at a maximum rate of 0.1600% of the Fund’s average daily net assets, with breakpoints for eligible complex-level assets above $124.3 billion. |
| • | Fee waiver/reimbursement: As of May 1, 2024, Nuveen Fund Advisors, LLC has agreed to waive fees and/or reimburse expenses of the Fund through July 31, 2026 so that the total annual operating expenses of the Fund (excluding 12b-1 distribution and/or service fees, interest expenses, taxes, acquired fund fees and expenses, fees incurred in acquiring and disposing of portfolio securities and extraordinary expenses) do not exceed 0.65% of the average daily net assets of any class of Fund shares. |
| • | prospectus • financial statements and other information • fund holdings • proxy voting information |
67065R622_AR_0524 3668776-INV-Y-07/25 (A, C, I) | |
| 3 |
| | Annual Shareholder Report May 31, 2024 |
| Cost of a $10,000 investment | Costs paid as a percentage of $10,000 investment | |||
| Class I Shares | $69 | 0.69% |
Performance Highlights • The Nuveen Wisconsin Municipal Bond Fund returned 6.16% for Class I shares at net asset value (NAV) for the 12 months ended May 31, 2024. The Fund outperformed the S&P Municipal Bond Wisconsin Index, which returned 3.84%. • Top contributors to relative performance » Overweight exposure to longer-maturity bonds, which outperformed as the yield curve flattened. » Overweight exposure to non-rated bonds, which benefited from contracting spreads. » Overweight exposure to the health care sector, which outperformed. • Top detractors from relative performance » Overweight to appropriation-backed bonds, which lagged. » Overweight to the multi-family housing sector, which underperformed. | Performance Attribution Longer-maturity bonds Non-rated bonds Health care sector Appropriation bonds Multi-family housing sector |
| 1 | continued>> |
| 1‑Year | 5‑Year | 10‑Year | ||||||||||
| Class I Shares at NAV | 6.16 | % | 1.56 | % | 2.70 | % | ||||||
| S&P Municipal Bond Index | 2.88 | % | 1.06 | % | 2.30 | % | ||||||
| S&P Municipal Bond Wisconsin Index | 3.84 | % | 0.94 | % | 2.23 | % | ||||||
| Lipper Other States Municipal Debt Funds Classification Average | 2.59 | % | 0.29 | % | 1.56 | % | ||||||
| 2 | continued>> |
| Fund net assets | $ | 72,817,069 | ||
| Total number of portfolio holdings | 70 | |||
| Portfolio turnover (%) | 13% | |||
| Total advisory fees paid for the year | $ | 401,831 |
| • | Portfolio manager update: Effective October 13, 2023, Paul Brennan, CFA was added as a portfolio manager of the Fund. |
| • | Management fees: As of May 1, 2024, the Fund’s overall complex-level fee begins at a maximum rate of 0.1600% of the Fund’s average daily net assets, with breakpoints for eligible complex-level assets above $124.3 billion. |
| • | Fee waiver/reimbursement: As of May 1, 2024, Nuveen Fund Advisors, LLC has agreed to waive fees and/or reimburse expenses of the Fund through July 31, 2026 so that the total annual operating expenses of the Fund (excluding 12b-1 distribution and/or service fees, interest expenses, taxes, acquired fund fees and expenses, fees incurred in acquiring and disposing of portfolio securities and extraordinary expenses) do not exceed 0.65% of the average daily net assets of any class of Fund shares. |
| • | prospectus • financial statements and other information • fund holdings • proxy voting information |
67065R689_AR_0524 3668776-INV-Y-07/25 (A, C, I) | |
| 3 |
| Item 2. | Code of Ethics. |
As of the end of the period covered by this report, the registrant has adopted a code of ethics that applies to the registrant’s principal executive officer, principal financial officer, principal accounting officer or controller, or persons performing similar functions. There were no amendments to or waivers from the code during the period covered by this report. Upon request, a copy of the registrant’s code of ethics is available without charge by calling 800-257-8787.
| Item 3. | Audit Committee Financial Expert. |
As of the end of the period covered by this report, the registrant’s Board of Directors or Trustees (“Board”) had determined that the registrant has at least one “audit committee financial expert” (as defined in Item 3 of Form N-CSR) serving on its Audit Committee. The members of the registrant’s audit committee that have been designated as audit committee financial experts are Joseph A. Boateng, Albin F. Moschner, John K. Nelson, Loren M. Starr and Robert L. Young, who are “independent” for purposes of Item 3 of Form N-CSR.
Mr. Boateng has served as the Chief Investment Officer for Casey Family Programs since 2007. He was previously Director of U.S. Pension Plans for Johnson & Johnson from 2002-2006. Mr. Boateng is a board member of the Lumina Foundation and Waterside School, an emeritus board member of Year Up Puget Sound, member of the Investment Advisory Committee and former Chair for the Seattle City Employees’ Retirement System, and an Investment Committee Member for The Seattle Foundation. Mr. Boateng previously served on the Board of Trustees for the College Retirement Equities Fund (2018-2023) and on the Management Committee for TIAA Separate Account VA-1 (2019-2023).
Mr. Moschner is a consultant in the wireless industry and, in July 2012, founded Northcroft Partners, LLC, a management consulting firm that provides operational, management and governance solutions. Prior to founding Northcroft Partners, LLC, Mr. Moschner held various positions at Leap Wireless International, Inc., a provider of wireless services, where he was as a consultant from February 2011 to July 2012, Chief Operating Officer from July 2008 to February 2011, and Chief Marketing Officer from August 2004 to June 2008. Before he joined Leap Wireless International, Inc., Mr. Moschner was President of the Verizon Card Services division of Verizon Communications, Inc. from 2000 to 2003, and President of One Point Services at One Point Communications from 1999 to 2000. Mr. Moschner also served at Zenith Electronics Corporation as Director, President and Chief Executive Officer from 1995 to 1996, and as Director, President and Chief Operating Officer from 1994 to 1995.
Mr. Nelson formerly served on the Board of Directors of Core12, LLC from 2008 to 2023, a private firm which develops branding, marketing, and communications strategies for clients. Mr. Nelson has extensive experience in global banking and markets, having served in several senior executive positions with ABN AMRO Holdings N.V. and its affiliated entities and predecessors, including LaSalle Bank Corporation from 1996 to 2008, ultimately serving as Chief Executive Officer of ABN AMRO N.V. North America. During his tenure at the bank, he also served as Global Head of its Financial Markets Division, which encompassed the bank’s Currency, Commodity, Fixed Income, Emerging Markets, and Derivatives businesses. He was a member of the Foreign Exchange Committee of the Federal Reserve Bank of the United States and during his tenure with ABN AMRO served as the bank’s representative on various committees of The Bank of Canada, European Central Bank, and The Bank of England. Mr. Nelson previously served as a senior, external advisor to the financial services practice of Deloitte Consulting LLP. (2012-2014).
Mr. Starr was Vice Chair, Senior Managing Director from 2020 to 2021, and Chief Financial Officer, Senior Managing Director from 2005 to 2020, for Invesco Ltd. Mr. Starr is also a Director and member of the Audit Committee for AMG. He is former Chair and member of the Board of Directors, Georgia Leadership Institute for School Improvement (GLISI); former Chair and member of the Board of Trustees, Georgia Council on Economic Education (GCEE). Mr. Starr previously served on the Board of Trustees for the College Retirement Equities Fund and on the Management Committee for TIAA Separate Account VA-1 (2022-2023).
Mr. Young has more than 30 years of experience in the investment management industry. From 1997 to 2017, he held various positions with J.P. Morgan Investment Management Inc. (“J.P. Morgan Investment”) and its affiliates (collectively, “J.P. Morgan”). Most recently, he served as Chief Operating Officer and Director of J.P. Morgan Investment (from 2010 to 2016) and as President and Principal Executive Officer of the J.P. Morgan Funds (from 2013 to 2016). As Chief Operating Officer of J.P. Morgan Investment, Mr. Young led service, administration and business platform support activities for J.P. Morgan’s domestic retail mutual fund and institutional commingled and separate account businesses and co-led these activities for J.P. Morgan’s global retail and institutional
investment management businesses. As President of the J.P. Morgan Funds, Mr. Young interacted with various service providers to these funds, facilitated the relationship between such funds and their boards, and was directly involved in establishing board agendas, addressing regulatory matters, and establishing policies and procedures. Before joining J.P. Morgan, Mr. Young, a former Certified Public Accountant (CPA), was a Senior Manager (Audit) with Deloitte & Touche LLP (formerly, Touche Ross LLP), where he was employed from 1985 to 1996. During his tenure there, he actively participated in creating, and ultimately led, the firm’s midwestern mutual fund practice.
| Item 4. | Principal Accountant Fees and Services. |
The following tables show the amount of fees that PricewaterhouseCoopers, the Funds’ auditor, billed to the Funds during the Funds’ last two full fiscal years. The Audit Committee approved in advance all audit services and non-audit services that PricewaterhouseCoopers provided to the Funds, except for those non-audit services that were subject to the pre-approval exception under Rule 2-01 of Regulation S-X (the “pre-approval exception”). The pre-approval exception for services provided directly to the Funds waives the pre-approval requirement for services other than audit, review or attest services if: (A) the aggregate amount of all such services provided constitutes no more than 5% of the total amount of revenues paid by the Funds during the fiscal year in which the services are provided; (B) the Funds did not recognize the services as non-audit services at the time of the engagement; and (C) the services are promptly brought to the Audit Committee’s attention, and the Committee (or its delegate) approves the services before the audit is completed.
The Audit Committee has delegated certain pre-approval responsibilities to its Chair (or, in his absence, any other member of the Audit Committee).
| Fiscal Year Ended May 31, 2024 | Audit Fees Billed to Funds1 | Audit-Related Fees Billed to Funds2 | Tax Fees Billed to Funds3 | All Other Fees Billed to Funds4 | ||||||||||||
Nuveen Kansas Municipal Bond Fund | $32,259 | $0 | $0 | $0 | ||||||||||||
Nuveen Kentucky Municipal Bond Fund | $32,259 | $0 | $0 | $0 | ||||||||||||
Nuveen Missouri Municipal Bond Fund | $32,259 | $0 | $0 | $0 | ||||||||||||
Nuveen Michigan Municipal Bond Fund | $32,259 | $0 | $500 | $0 | ||||||||||||
Nuveen Ohio Municipal Bond Fund | $32,259 | $0 | $0 | $0 | ||||||||||||
Nuveen Wisconsin Municipal Bond Fund | $32,259 | $0 | $0 | $0 | ||||||||||||
Total | $193,554 | $0 | $500 | $0 | ||||||||||||
| 1 | “Audit Fees” are the aggregate fees billed for professional services for the audit of the Fund’s annual financial statements and services provided in connection with statutory and regulatory filings or engagements. |
| 2 | “Audit-Related Fees” are the aggregate fees billed for assurance and related services reasonably related to the performance of the audit or review of financial statements that are not reported under “Audit Fees”. These fees include offerings related to the Fund’s common shares and leverage. |
| 3 | “Tax Fees” are the aggregate fees billed for professional services for tax advice, tax compliance, and tax planning. These fees include: all global withholding tax services; excise and state tax reviews; capital gain, tax equalization and taxable basis calculations performed by the principal accountant. |
| 4 | “All Other Fees” are the aggregate fees billed for products and services other than “Audit Fees”, “Audit-Related Fees” and “Tax Fees”. These fees represent all “Agreed-Upon Procedures” engagements pertaining to the Fund’s use of leverage. |
| Fiscal Year Ended May 31, 2024 | Percentage Approved Pursuant to Pre-approval Exception | |||||||||||||||
| Audit Fees Billed to Funds | Audit-Related Fees Billed to Funds | Tax Fees Billed to Funds | All Other Fees Billed to Funds | |||||||||||||
Nuveen Kansas Municipal Bond Fund | 0 | % | 0 | % | 0 | % | 0 | % | ||||||||
Nuveen Kentucky Municipal Bond Fund | 0 | % | 0 | % | 0 | % | 0 | % | ||||||||
Nuveen Missouri Municipal Bond Fund | 0 | % | 0 | % | 0 | % | 0 | % | ||||||||
Nuveen Michigan Municipal Bond Fund | 0 | % | 0 | % | 0 | % | 0 | % | ||||||||
Nuveen Ohio Municipal Bond Fund | 0 | % | 0 | % | 0 | % | 0 | % | ||||||||
Nuveen Wisconsin Municipal Bond Fund | 0 | % | 0 | % | 0 | % | 0 | % | ||||||||
| Fiscal Year Ended May 31, 2023 | Audit Fees Billed to Funds1 | Audit-Related Fees Billed to Funds2 | Tax Fees Billed to Funds3 | All Other Fees Billed to Funds4 | ||||||||||||
Nuveen Kansas Municipal Bond Fund | $37,988 | $0 | $0 | $0 | ||||||||||||
Nuveen Kentucky Municipal Bond Fund | $37,988 | $0 | $0 | $0 | ||||||||||||
Nuveen Missouri Municipal Bond Fund | $37,988 | $0 | $0 | $0 | ||||||||||||
Nuveen Michigan Municipal Bond Fund | $37,988 | $0 | $0 | $0 | ||||||||||||
Nuveen Ohio Municipal Bond Fund | $37,988 | $0 | $0 | $0 | ||||||||||||
Nuveen Wisconsin Municipal Bond Fund | $37,988 | $0 | $0 | $0 | ||||||||||||
Total | $227,928 | $0 | $0 | $0 | ||||||||||||
| 1 | “Audit Fees” are the aggregate fees billed for professional services for the audit of the Fund’s annual financial statements and services provided in connection with statutory and regulatory filings or engagements. |
| 2 | “Audit-Related Fees” are the aggregate fees billed for assurance and related services reasonably related to the performance of the audit or review of financial statements that are not reported under “Audit Fees”. These fees include offerings related to the Fund’s common shares and leverage. |
| 3 | “Tax Fees” are the aggregate fees billed for professional services for tax advice, tax compliance, and tax planning. These fees include: all global withholding tax services; excise and state tax reviews; capital gain, tax equalization and taxable basis calculations performed by the principal accountant. |
| 4 | “All Other Fees” are the aggregate fees billed for products and services other than “Audit Fees”, “Audit-Related Fees” and “Tax Fees”. These fees represent all “Agreed-Upon Procedures” engagements pertaining to the Fund’s use of leverage. |
| Fiscal Year Ended May 31, 2023 | Percentage Approved Pursuant to Pre-approval Exception | |||||||||||||||
| Audit Fees Billed to Funds | Audit-Related Fees Billed to Funds | Tax Fees Billed to Funds | All Other Fees Billed to Funds | |||||||||||||
Nuveen Kansas Municipal Bond Fund | 0 | % | 0 | % | 0 | % | 0 | % | ||||||||
Nuveen Kentucky Municipal Bond Fund | 0 | % | 0 | % | 0 | % | 0 | % | ||||||||
Nuveen Missouri Municipal Bond Fund | 0 | % | 0 | % | 0 | % | 0 | % | ||||||||
Nuveen Michigan Municipal Bond Fund | 0 | % | 0 | % | 0 | % | 0 | % | ||||||||
Nuveen Ohio Municipal Bond Fund | 0 | % | 0 | % | 0 | % | 0 | % | ||||||||
Nuveen Wisconsin Municipal Bond Fund | 0 | % | 0 | % | 0 | % | 0 | % | ||||||||
Fiscal Year Ended May 31, 2024 | | Audit-Related Fees Billed to Adviser and Affiliated Fund |
| | Tax Fees Billed to Adviser and Affiliated Fund |
| | All Other Fees Billed to Adviser and Affiliated Fund Service Providers | | |||
Nuveen Multistate Trust IV | $0 | $0 | $0 | |||||||||
| Percentage Approved Pursuant to Pre-approval Exception | ||||||||||||
| | Audit-Related Fees Billed to Adviser and Affiliated Fund Service Providers | | Tax Fees Billed to Adviser and Affiliated Fund Service Providers | | All Other Fees Billed to Adviser and Affiliated Fund Service Providers | |||||||
| 0 | % | 0 | % | 0 | % | |||||||
| Fiscal Year Ended May 31, 2023 | Audit-Related Fees Billed to Adviser and Affiliated Fund Service Providers | Tax Fees Billed to Adviser and Affiliated Fund Service Providers | All Other Fees Billed to Adviser and Affiliated Fund Service Providers | |||||||||
Nuveen Multistate Trust IV | $0 | $0 | $0 | |||||||||
| Percentage Approved Pursuant to Pre-approval Exception | ||||||||||||
| Audit-Related Fees Billed to Adviser and Affiliated Fund Service Providers | Tax Fees Billed to Adviser and Affiliated Fund Service Providers | All Other Fees Billed to Adviser and Affiliated Fund Service Providers | ||||||||||
| 0 | % | 0 | % | 0 | % | |||||||
| Fiscal Year Ended May 31, 2024 | Total Non-Audit Fees Billed to Fund | Total Non-Audit Fees Affiliated Fund Service Providers (engagements related directly to the operations and financial | Total Non-Audit Fees Billed to Adviser and Affiliated Fund Service Providers (all other engagements) | Total | ||||||||||||
Nuveen Kansas Municipal Bond Fund | $0 | $0 | $0 | $0 | ||||||||||||
Nuveen Kentucky Municipal Bond Fund | $0 | $0 | $0 | $0 | ||||||||||||
Nuveen Missouri Municipal Bond Fund | $0 | $0 | $0 | $0 | ||||||||||||
Nuveen Michigan Municipal Bond Fund | $500 | $0 | $0 | $500 | ||||||||||||
Nuveen Ohio Municipal Bond Fund | $0 | $0 | $0 | $0 | ||||||||||||
Nuveen Wisconsin Municipal Bond Fund | $0 | $0 | $0 | $0 | ||||||||||||
Total | $500 | $0 | $0 | $500 | ||||||||||||
“Non-Audit Fees billed to Fund” for both fiscal year ends represent “Tax Fees” and “All Other Fees” billed to Fund in their respective amounts from the previous table.
Less than 50 percent of the hours expended on the principal accountant’s engagement to audit the registrant’s financial statements for the most recent fiscal year were attributed to work performed by persons other than the principal accountant’s full-time, permanent employees.
| Fiscal Year Ended May 31, 2023 | Total Non-Audit Fees Billed to Fund | Total Non-Audit Fees Affiliated Fund Service Providers (engagements related directly to the operations and financial | Total Non-Audit Fees Billed to Adviser and Affiliated Fund Service Providers (all other | Total | ||||||||||||
Nuveen Kansas Municipal Bond Fund | $0 | $0 | $0 | $0 | ||||||||||||
Nuveen Kentucky Municipal Bond Fund | $0 | $0 | $0 | $0 | ||||||||||||
Nuveen Missouri Municipal Bond Fund | $0 | $0 | $0 | $0 | ||||||||||||
Nuveen Michigan Municipal Bond Fund | $0 | $0 | $0 | $0 | ||||||||||||
Nuveen Ohio Municipal Bond Fund | $0 | $0 | $0 | $0 | ||||||||||||
Nuveen Wisconsin Municipal Bond Fund | $0 | $0 | $0 | $0 | ||||||||||||
| Fiscal Year Ended May 31, 2023 | Total Non-Audit Fees Billed to Fund | Total Non-Audit Fees Affiliated Fund Service Providers (engagements related directly to the operations and financial | Total Non-Audit Fees Billed to Adviser and Affiliated Fund Service Providers (all other | Total | ||||||||||||
Total | $0 | $0 | $0 | $0 | ||||||||||||
“Non-Audit Fees billed to Fund” for both fiscal year ends represent “Tax Fees” and “All Other Fees” billed to Fund in their respective amounts from the previous table.
Audit Committee Pre-Approval Policies and Procedures. Generally, the Audit Committee must approve (i) all non-audit services to be performed for the Funds by the Funds’ independent accountant and (ii) all audit and non-audit services to be performed by the Funds’ independent accountant for the Affiliated Fund Service Providers with respect to the operations and financial reporting of the Funds. Regarding tax and research projects conducted by the independent accountant for the Funds and Affiliated Fund Service Providers (with respect to operations and financial reports of the Trust), such engagements will be (i) pre-approved by the Audit Committee if they are expected to be for amounts greater than $10,000; (ii) reported to the Audit Committee Chair for his verbal approval prior to engagement if they are expected to be for amounts under $10,000 but greater than $5,000; and (iii) reported to the Audit Committee at the next Audit Committee meeting if they are expected to be for an amount under $5,000.
Item 4(i) and Item 4(j) are not applicable to the registrant.
| Item 5. | Audit Committee of Listed Registrants. |
Not applicable to this registrant.
| Item 6. | Investments. |
| (a) | Schedule of Investments is included as part of the financial statements filed under Item 7 of this Form N-CSR. |
| (b) | Not applicable. |
| Item 7. | Financial Statements and Financial Highlights for Open-End Management Investment Companies. |
| Item 8. | Changes in and Disagreements with Accountants for Open-End Management Investment Companies. |
Not applicable.
| Item 9. | Proxy Disclosures for Open-End Management Investment Companies. |
Not applicable.
| Item 10. | Remuneration Paid to Directors, Officers, and Others of Open-End Management Investment Companies. |
Remuneration paid to directors, officers and others is included in the Statement of Operations under the line items “Trustee Fees” and “Management Fees” as part of the financial statements filed under Item 7 of this Form N-CSR.
| Item 11. | Statement Regarding Basis for Approval of Investment Advisory Contract. |
Nuveen Kansas Municipal Bond Fund
Nuveen Kentucky Municipal Bond Fund
Nuveen Michigan Municipal Bond Fund
Nuveen Missouri Municipal Bond Fund
Nuveen Ohio Municipal Bond Fund
Nuveen Wisconsin Municipal Bond Fund
The Approval Process
At meetings held on April 18 and 19, 2024 (the “Meeting”), the Board of Trustees (collectively, the “Board” and each Trustee, a “Board Member”) of Nuveen Multistate Trust IV approved, for each respective fund listed above (each a “Fund”), the renewal of the investment management agreement (each an “Investment Management Agreement”) with Nuveen Fund Advisors, LLC (“NFAL”; NFAL is an “Adviser”) pursuant to which NFAL serves as investment adviser to such Fund. Similarly, for each Fund, the Board approved the renewal of the sub-advisory agreement (each a “Sub-Advisory Agreement”) with Nuveen Asset Management, LLC (the “Sub-Adviser”) pursuant to which the Sub-Adviser serves as the sub-adviser to such Fund. The Board Members are not “interested persons” (as defined under the Investment Company Act of 1940 (the “1940 Act”)) and, therefore, the Board is deemed to be comprised of all disinterested Board Members. References to the Board and the Board Members are interchangeable. Below is a summary of the annual review process the Board undertook related to its most recent renewal of each Investment Management Agreement and Sub-Advisory Agreement on behalf of the applicable Fund.
In accordance with applicable law, following up to an initial two-year period, the Board considers the renewal of each Investment Management Agreement and Sub-Advisory Agreement on behalf of the applicable Fund on an annual basis. The Investment Management Agreements and Sub-Advisory Agreements are collectively referred to as the “Advisory Agreements,” and NFAL and the Sub-Adviser are collectively, the “Fund Advisers” and each a “Fund Adviser.” In addition, the fund complex consists of the group of funds advised by NFAL (collectively referred to as the “Nuveen funds”) and the group of funds advised by Teachers Advisors, LLC (“TAL” and such funds are collectively, the “TC funds”). For clarity, NFAL serves as Adviser to the Nuveen funds, including the Funds, and TAL serves as “Adviser” to the TC funds. The Board Members considered that the prior separate boards of the TC funds and Nuveen funds were consolidated effective in January 2024. Accordingly, at the Meeting, the Board Members considered the review of the advisory agreements for the Nuveen funds as well as reviewed the investment management agreements for the TC funds. Depending on the appropriate context, references to “the Adviser” may be to NFAL with respect to the Nuveen funds and/or TAL with respect to the TC funds.
The Board Members considered the review of the advisory agreements of the Nuveen funds and the TC funds to be an ongoing process. The Board Members therefore employed the accumulated information, knowledge and experience they had gained during their tenure on the respective board of the TC funds or Nuveen funds (as the case may be) governing the applicable funds and working with the respective investment advisers and sub-advisers, as applicable, in their review of the advisory agreements for the fund complex.
During the course of the year prior to the Meeting, the Board and/or its committees received a wide variety of materials that covered a range of topics relevant to the Board’s annual consideration of the renewal of the advisory agreements, including reports on fund investment results over various periods; product initiatives for various funds; fund expenses; compliance, regulatory and risk management matters; trading practices, including soft dollar arrangements (as applicable); the liquidity and derivatives risk management programs; management of distributions; valuation of securities; payments to financial intermediaries, including 12b-1 expenses (as applicable); securities lending (as applicable); and overall market and regulatory developments. The Board also met periodically with and/or received presentations by key investment professionals managing a fund’s portfolio. In particular, at the Board meeting held on February 27-29, 2024 (the “February Meeting”), the Board and/or its Investment Committee received the annual performance review of the funds as described in further detail below. The presentations, discussions and meetings throughout the year also provide a means for the Board to evaluate and consider the level, breadth and quality of services provided by the Adviser and sub-advisers, as applicable, and how such services have changed over time in light of new or modified regulatory requirements, changes to market conditions or other factors.
In connection with its annual consideration of the advisory agreements, the Board, through its independent legal counsel, requested and received extensive materials and information prepared specifically for its review of the advisory agreements. The materials provided at the Meeting and/or prior meetings covered a wide range of matters including, but not limited to, a description of the nature, extent and quality of services provided by the Fund Advisers; the consolidation of the Nuveen fund family and TC fund family; a review of product actions advanced in 2023 for the benefit of particular funds and/or the fund complex; a review of each sub-adviser, if applicable, and/or applicable investment team; an analysis of fund performance with a focus on funds considered to have met certain challenged performance measurements; an analysis of the fees and expense ratios of the funds with a focus on funds considered to have certain expense characteristics; a list of management fee and, if applicable, sub-advisory fee schedules; a review of temporary and permanent expense caps and fee waivers for open-end funds (as applicable); a description of portfolio manager compensation; a description of the profitability and/or financial data of Nuveen, TAL and the sub-advisers; and a description of indirect benefits received by the Adviser and the sub-advisers as a result of their relationships with the funds, as applicable. The Board also considered
1
| Item 11. | Statement Regarding Basis for Approval of Investment Advisory Contract (continued) |
information provided by Broadridge Financial Solutions, Inc. (“Broadridge”), an independent provider of investment company data, comparing fee and expense levels of each respective fund to those of a peer universe and, with respect to open-end funds, also to a peer group of funds selected by Broadridge, subject to certain exceptions.
The information prepared specifically for the annual review supplemented the information provided to the Board and its committees and the evaluations of the funds by the Board and its committees during the year. The Board’s review of the advisory agreements for the fund complex is based on all the information provided to the Board and its committees over time. The performance, fee and expense data and other information provided by a Fund Adviser, Broadridge or other service providers were not independently verified by the Board Members.
As part of their review, the Board Members and independent legal counsel met by videoconference in executive session on April 10, 2024 (the “April Executive Session”) to review and discuss materials provided in connection with their annual review of the advisory agreements for the fund complex. After reviewing this information, the Board Members requested, directly or through independent legal counsel, additional information, and the Board subsequently reviewed and discussed the responses to these follow-up questions and requests.
The Board Members were advised by independent legal counsel during the annual review process as well as throughout the year, including meeting in executive sessions with such counsel at which no representatives of management were present. In connection with their annual review, the Board Members also received a memorandum from independent legal counsel outlining their fiduciary duties and legal standards in reviewing the Advisory Agreements, including guidance from court cases evaluating advisory fees.
The Board’s decisions to renew each Advisory Agreement were not based on a single identified factor, but rather each decision reflected the comprehensive consideration of all the information provided to the Board and its committees throughout the year as well as the materials prepared specifically in connection with the annual review process. The contractual arrangements may reflect the results of prior year(s) of review, negotiation and information provided in connection with the Board’s annual review of the funds’ advisory arrangements and oversight of the funds. Each Board Member may have attributed different levels of importance to the various factors and information considered in connection with the annual review process and may have placed different emphasis on the relevant information year to year in light of, among other things, changing market and economic conditions. A summary of the principal factors and information, but not all the factors, the Board considered in deciding to renew the Advisory Agreements is set forth below.
| A. | Nature, Extent and Quality of Services |
In evaluating the renewal of the Advisory Agreements, the Board Members received and considered information regarding the nature, extent and quality of the applicable Fund Adviser’s services provided to each respective Fund with particular focus on the services and enhancements or changes to such services provided during the last year. The Board Members considered the Investment Management Agreements and the Sub-Advisory Agreements separately in the course of their review. With this approach, they considered the roles of NFAL and the Sub-Adviser in providing services to the Funds.
The Board considered that the Adviser provides a wide array of management, oversight and other services to manage and operate the applicable funds. The Board considered the Adviser’s and its affiliates’ dedication of resources, time, people and capital as well as continual program of improvement and innovation aimed at enhancing the funds and fund complex for investors and meeting the needs of an increasingly complex regulatory environment. In particular, over the past several years, the Board considered the significant resources, both financial and personnel, the Adviser and its affiliates have committed in working to consolidate the Nuveen fund family and TC fund family under one centralized umbrella. The Board considered that the organizational changes in bringing together Nuveen, its affiliates and TIAA’s (as defined below) asset management businesses, consolidating the Nuveen and TC fund families and other initiatives were anticipated to provide various benefits for the funds through, among other things, enhanced operating efficiencies, centralized investment leadership and a centralized shared resources and support model. As part of these efforts, the boards of the TC funds and Nuveen funds were consolidated effective in January 2024. In addition, in conjunction with these consolidation efforts, the Board approved at the Meeting changes to fee and breakpoint structures (as applicable) that could provide cost savings to participating funds, as described in further detail below.
The Board also reviewed information regarding other product actions undertaken or continued by management in the 2023 calendar year in seeking to improve the effectiveness of the organization, the product line-up as well as particular funds through, among other things, continuing to review and optimize the product line and gaining efficiencies through mergers and liquidations; reviewing and updating investment policies and benchmarks; implementing fee waivers and/or expense cap changes for certain funds; evaluating and adjusting portfolio management teams as appropriate for various funds; and developing policy positions on a broad range of regulatory proposals that may impact the funds and communicating with lawmakers and other regulatory authorities to help ensure these positions are considered. In its review, the Board considered that the funds operated in a highly regulated industry and the scope and complexity of the services and resources that the Adviser and its affiliates must provide to manage and operate the applicable funds have expanded over the years as a result of, among other things, regulatory, market and other developments, such as the adoption of the tailored shareholder report or the revised fund name rule.
In considering the breadth and quality of services the Adviser and its various teams provide, the Board considered that the Adviser provides investment advisory services. With respect to the Nuveen funds, such funds utilize sub-advisers to manage the portfolios of the funds subject to the supervision of NFAL. Accordingly, the Board considered that NFAL and its affiliates, among other things, oversee and review the performance of the respective sub-adviser and its investment team(s); evaluate Nuveen fund performance and market conditions; evaluate investment strategies and recommend changes thereto; set and manage distributions consistent with the respective Nuveen fund’s product design; oversee trade execution and, as applicable, securities lending; evaluate investment risks; and manage valuation matters. The Board further considered that over the course of the 2023 calendar year, the Nuveen global public product team which supports the funds in the fund complex and their shareholders assessed the investment personnel across the investment leadership teams which resulted in additions or other modifications to the portfolio management teams of various funds. The Board also reviewed a description of the compensation structure applicable to certain portfolio managers.
2
In addition to the above investment advisory services, the Board further considered the extensive compliance, regulatory, administrative and other services the Adviser and its various teams or affiliates provide to manage and operate the applicable funds. Given the highly regulated industry in which the funds operate, the Board considered the breadth of the Adviser’s compliance program and related policies and procedures. The Board reviewed various initiatives the Adviser’s compliance team undertook or continued in 2023, in part, to address new regulatory requirements, support international business growth and product development, enhance international trading capabilities, enhance monitoring capabilities in light of the new regulatory requirements and guidance and maintain a comprehensive training program. The Board further considered, among other things, that other non-advisory services provided included, among other things, board support and reporting; establishing and reviewing the services provided by other fund service providers (such as a fund’s custodian, accountant, and transfer agent); risk management, including reviews of the liquidity risk management and derivatives risk management programs; legal support services; regulatory advocacy; and cybersecurity, business continuity and disaster recovery planning and testing.
Aside from the services provided, the Board considered the financial resources of the Adviser and/or its affiliates and their willingness to make investments in the technology, personnel and infrastructure to support the funds, including to enhance global talent, middle office systems, software and international and internal capabilities. The Board considered the access provided by the Adviser and its affiliates to a seed capital budget to support new or existing funds and/or facilitate changes for a respective fund. The Board considered the benefits to shareholders of investing in a fund that is a part of a large fund complex with a variety of investment disciplines, capabilities, expertise and resources available to navigate and support the funds including during stressed times. The Board considered the overall reputation and capabilities of the Adviser and its affiliates and the Adviser’s continuing commitment to provide high quality services.
In its review, the Board also considered the significant risks borne by the Adviser and its affiliates in connection with their services to the applicable funds, including entrepreneurial risks in sponsoring and supporting new funds and smaller funds and ongoing risks with managing the funds, such as investment, operational, reputational, regulatory, compliance and litigation risks.
With respect to the Funds, the Board considered the division of responsibilities between NFAL and the Sub-Adviser and considered that the Sub-Adviser and its investment personnel generally are responsible for the management of each Fund’s portfolio under the oversight of NFAL and the Board. The Board considered an analysis of the Sub-Adviser provided by NFAL which included, among other things, a summary of changes in the leadership teams and/or portfolio manager teams; the performance of the Nuveen funds sub-advised by the Sub-Adviser over various periods of time; and data reflecting product changes (if any) taken with respect to certain Nuveen funds. The Board considered that NFAL recommended the renewal of the Sub-Advisory Agreements.
Based on its review, the Board determined, in the exercise of its reasonable business judgment, that it was satisfied with the nature, extent and quality of services provided to the respective Funds under each applicable Advisory Agreement.
| B. | The Investment Performance of the Funds and Fund Advisers |
In evaluating the quality of the services provided by the Fund Advisers, the Board also considered a variety of investment performance data of the Funds. In this regard, the Board and/or its Investment Committee reviewed, among other things, performance of the Funds over the quarter, one-, three- and five-year periods ending December 31, 2023 and March 31, 2024. For those Funds with multiple share classes, the performance data was based on Class I shares; however, the performance of other share classes was substantially similar as those other share classes invest in the same portfolio of securities and differences in performance among the classes would be principally attributed to the variations in the expense structures of the share classes. The Board performed its annual review of fund performance at its February Meeting and an additional review at the April Executive Session and also reviewed and discussed performance data at its other regularly scheduled quarterly meetings throughout the year. The Board therefore took into account the performance data, presentations and discussions (written and oral) that were provided at the Meeting and in prior meetings over time in evaluating fund performance, including management’s analysis of a fund’s performance with particular focus on funds that met certain challenged performance measurements as determined pursuant to a methodology approved by the Board or additional measurements as determined by management’s investment analysts. As various Nuveen funds have modified their portfolio teams and/or made significant changes to their portfolio strategies over time, the Board reviewed, among other things, certain tracking performance data over specific periods comparing performance before and after such changes.
The Board considered that performance data reflects performance over a specified period which may differ significantly depending on the ending dates selected, particularly during periods of market volatility. Further, the Board considered that shareholders may evaluate performance based on their own respective holding periods which may differ from the performance periods reviewed by the Board and lead to differing results.
In its evaluation, the Board reviewed fund performance results from different perspectives. In general, subject to certain exceptions, the Board reviewed both absolute and relative fund performance over the various time periods and considered performance results in light of a fund’s investment objective(s), strategies and risks. With respect to the relative performance, the Board considered fund performance in comparison to the performance of peer funds (the “Performance Peer Group”), subject to certain exceptions, and recognized and/or customized benchmarks (i.e., generally benchmarks derived from multiple recognized benchmarks). In reviewing such comparative performance, the Board was cognizant of the inherent limitations of such data which can make meaningful performance comparisons generally difficult. As an illustration, differences in the composition of the Performance Peer Group, the investment objective(s), strategies, dates of fund inception and other characteristics of the peers in the Performance Peer Group, the level, type and cost of leverage (if any) of the peers, and the varying sizes of peers all may contribute to differences in the performance results of a Performance Peer Group compared to the applicable fund. With respect to relative performance of a fund compared to a benchmark index, differences, among other things, in the investment objective(s) and strategies of a fund and the benchmark (particularly an actively managed fund that does not directly follow an index) as well as the costs of operating a fund would necessarily contribute to differences in performance results and limit the value of the comparative performance information. To assist the Board in its review of the comparability of the relative performance, management generally has ranked the relevancy of the Performance Peer Groups to the Funds as low, medium or high.
3
| Item 11. | Statement Regarding Basis for Approval of Investment Advisory Contract (continued) |
In its review of relative performance, the Board considered a Fund’s performance relative to its Performance Peer Group, among other things, by evaluating its quartile ranking with the 1st quartile representing the top performing funds within the Performance Peer Group and the 4th quartile representing the lowest performing funds.
The Board evaluated performance in light of various relevant factors which may include, among other things, general market conditions, issuer-specific information, asset class information, leverage and fund cash flows. The Board considered that long-term performance could be impacted by even one period of significant outperformance or underperformance and that a single investment theme could disproportionately affect performance. Further, the Board considered that market and economic conditions may significantly impact a fund’s performance, particularly over shorter periods, and such performance may be more reflective of such economic or market events and not necessarily reflective of management skill. Although the Board reviews short-, intermediate- and longer-term performance data, the Board considered that longer periods of performance may reflect full market cycles.
In their review from year to year, the Board Members consider and may place different emphasis on the relevant information in light of changing circumstances in market and economic conditions. In evaluating performance, the Board focused particular attention on funds with less favorable performance records. However, depending on the facts and circumstances, including any differences between the respective fund and its benchmark and/or Performance Peer Group, the Board may be satisfied with a fund’s performance notwithstanding that its performance may be below that of its benchmark and/or peer group for certain periods. With respect to any funds for which the Board has identified performance issues, the Board seeks to monitor such funds more closely until performance improves, discuss with the Adviser the reasons for such results, consider whether any steps are necessary or appropriate to address such issues, discuss and evaluate the potential consequences of such steps and review the results of any steps undertaken.
The performance determinations with respect to each Fund are summarized below.
● For Nuveen Kansas Municipal Bond Fund, the Board considered that although the Fund’s performance was below the performance of its benchmark for the five-year periods ended December 31, 2023 and March 31, 2024, the Fund outperformed its benchmark for the one- and three-year periods ended December 31, 2023 and March 31, 2024. In addition, the Fund ranked in the third quartile of its Performance Peer Group for the one-year periods ended December 31, 2023 and March 31, 2024 and first quartile for the three- and five-year periods ended December 31, 2023 and March 31, 2024. On the basis of the Board’s ongoing review of investment performance and all relevant factors, including the relative market conditions during certain reporting periods, the Fund’s investment objective(s) and management’s discussion of performance, the Board concluded that the Fund’s performance supported renewal of the Advisory Agreements.
● For Nuveen Kentucky Municipal Bond Fund, the Board considered that although the Fund’s performance was below the performance of its benchmark for the three- and five-year periods ended December 31, 2023, the Fund outperformed its benchmark for the one-year period ended December 31, 2023 and ranked in the first quartile of its Performance Peer Group for the one-year period and second quartile for the three- and five-year periods ended December 31, 2023. In addition, although the Fund’s performance was below the performance of its benchmark for the one-, three- and five-year periods ended March 31, 2024, the Fund ranked in the second quartile of its Performance Peer Group for the one- and five-year periods and third quartile for the three-year period ended March 31, 2024. On the basis of the Board’s ongoing review of investment performance and all relevant factors, including the relative market conditions during certain reporting periods, the Fund’s investment objective(s) and management’s discussion of performance, the Board concluded that the Fund’s performance supported renewal of the Advisory Agreements.
● For Nuveen Michigan Municipal Bond Fund, the Board considered that although the Fund’s performance was below the performance of its benchmark for the one-, three- and five-year periods ended December 31, 2023 and March 31, 2024 and the Fund ranked in the fourth quartile of its Performance Peer Group for the three-year periods ended December 31, 2023 and March 31, 2024, the Fund ranked in the third quartile of its Performance Peer Group for the one- and five-year periods ended December 31, 2023 and March 31, 2024. On the basis of the Board’s ongoing review of investment performance and all relevant factors, including the relative market conditions during certain reporting periods, the Fund’s investment objective(s) and management’s discussion of performance, the Board concluded that the Fund’s performance supported renewal of the Advisory Agreements.
● For Nuveen Missouri Municipal Bond Fund, the Board considered that although the Fund’s performance was below the performance of its benchmark for the three- and five-year periods ended December 31, 2023 and March 31, 2024, the Fund outperformed its benchmark for the one-year periods ended December 31, 2023 and March 31, 2024. In addition, the Fund ranked in the first quartile of its Performance Peer Group for the one-, three- and five-year periods ended December 31, 2023 and March 31, 2024. On the basis of the Board’s ongoing review of investment performance and all relevant factors, including the relative market conditions during certain reporting periods, the Fund’s investment objective(s) and management’s discussion of performance, the Board concluded that the Fund’s performance supported renewal of the Advisory Agreements.
● For Nuveen Ohio Municipal Bond Fund, the Board considered that although the Fund’s performance was below the performance of its benchmark for the one- and five-year periods ended December 31, 2023 and March 31, 2024, the Fund outperformed its benchmark for the three-year periods ended December 31, 2023 and March 31, 2024. In addition, although the Fund ranked in the fourth quartile of its Performance Peer Group for the one-year period ended December 31, 2023, the Fund ranked in the first quartile for the three- and five-year periods ended December 31, 2023. The Fund also ranked in the second quartile of its Performance Peer Group for the one-year period and first quartile for the three- and five-year periods ended March 31, 2024. In its review, the Board considered that the Performance Peer Group was classified as low for relevancy. On the basis of the Board’s ongoing review of investment performance and all relevant factors, including the relative market conditions during certain reporting periods, the Fund’s investment objective(s) and management’s discussion of performance, the Board concluded that the Fund’s performance supported renewal of the Advisory Agreements.
4
● For Nuveen Wisconsin Municipal Bond Fund, the Board considered that although the Fund’s performance was below the performance of its benchmark for the one-year period ended December 31, 2023, the Fund outperformed its benchmark for the three- and five-year periods ended December 31, 2023 and ranked in the third quartile of its Performance Peer Group for the one-year period and first quartile for the three- and five-year periods ended December 31, 2023. In addition, the Fund outperformed its benchmark and ranked in the first quartile of its Performance Peer Group for the one-, three- and five-year periods ended March 31, 2024. On the basis of the Board’s ongoing review of investment performance and all relevant factors, including the relative market conditions during certain reporting periods, the Fund’s investment objective(s) and management’s discussion of performance, the Board concluded that the Fund’s performance supported renewal of the Advisory Agreements.
| C. | Fees, Expenses and Profitability |
| 1. | Fees and Expenses |
As part of its annual review, the Board generally reviewed, among other things, the contractual management fee and the net/actual management fee (i.e., the management fee after taking into consideration fee waivers and/or expense reimbursements, if any) paid by a Fund to the Adviser in light of the nature, extent and quality of the services provided. The Board also reviewed information about other expenses and the total operating expense ratio of each Fund (after any fee waivers and/or expense reimbursements). More specifically, the Board Members reviewed, among other things, each Fund’s management fee rates and net total expense ratio in relation to similar data for a comparable universe of funds (the “Expense Universe”) and for a more focused subset of comparable funds (the “Expense Group”) established by Broadridge (subject to certain exceptions). The Board Members reviewed the methodology Broadridge employed to establish its Expense Universe and Expense Group (as applicable) and considered that differences between the applicable fund and its respective Expense Universe and/or Expense Group, as well as changes to the composition of the Expense Universe and/or Expense Group from year to year, may limit some of the value of the comparative data. The Board Members also considered that it can be difficult to compare management fees among funds as there are variations in the services that are included for the fees paid. The Board Members took these limitations and differences into account when reviewing comparative peer data.
The Board Members also considered a Fund’s operating expense ratio as it more directly reflected a shareholder’s total costs in investing in the respective fund. In their review, the Board Members considered, in particular, each fund with a net total expense ratio meeting certain expense or fee criteria when compared to its Expense Universe and Expense Group (if any) and an analysis as to the factors contributing to each such fund’s relative net total expense ratio.
The Board Members also considered, in relevant part, a Fund’s management fee and net total expense ratio in light of the Fund’s performance history, including reviewing certain funds identified by management and/or the Board as having a higher net total expense ratio or management fee compared to their respective peers coupled with experiencing periods of challenged performance and considering the reasons for such comparative positions.
In their evaluation of the fee arrangements for the Funds, the Board Members also reviewed the management fee schedules and the expense reimbursements and/or fee waivers agreed to by the Adviser for the respective fund (if any). In its review, the Board considered that the management fees of the Nuveen funds were generally comprised of two components, a fund-level component and a complex-level component, each with its own breakpoint schedule, subject to certain exceptions. As indicated above, the Board approved a revised fee schedule which would reduce and streamline the asset thresholds necessary to meet breakpoints in the complex-level fee component. The Board considered that management anticipated approximately $50 million in savings for Nuveen fund shareholders as a result of the revised fee schedule as well as additional estimated savings over time. The Board further considered management’s representation that there will be no increase to any Nuveen fund’s respective advisory agreement fee rate as a result of the revised complex-level fee schedule.
In its review, the Board considered that across the Nuveen fund and TC fund complex, management estimated that fund-level breakpoints resulted in approximately $82.5 million in reduced fees overall in 2023 and expense caps and reimbursements generated approximately an additional $91 million in savings to shareholders. In addition, the Board considered that management determined that the Nuveen funds achieved additional fee reductions of approximately $49 million due to the complex-wide management fee structure in 2023.
With respect to the Sub-Adviser, the Board also considered, among other things, the sub-advisory fee schedule paid to the Sub-Adviser in light of the sub-advisory services provided to the respective Fund. In its review, the Board considered that the compensation paid to the Sub-Adviser is the responsibility of NFAL, not the Funds.
The Board’s considerations regarding the comparative fee data for each of the Funds are set forth below. With respect to the quartile rankings noted below, the first quartile represents the range of funds with the lowest management fee rate or net total expense ratio, as applicable, and the fourth quartile represents the range of funds with the highest management fee rate or net total expense ratio, as applicable. The Board considered that Broadridge only calculates quartiles if a minimum number of peers is available and therefore quartile rankings may not be available for certain Expense Groups and/or Expense Universes.
● For Nuveen Kansas Municipal Bond Fund, the Fund’s contractual management fee rate, actual management fee rate and net total expense ratio ranked in the third quartile, fourth quartile and third quartile of its Expense Group, respectively. In addition, the Fund’s contractual management fee rate, actual management fee rate and net total expense ratio ranked in the second quartile, fourth quartile and third quartile of its Expense Universe, respectively. Further, although the Fund’s actual management fee rate was above the Expense Group median, the Fund’s net total expense ratio was slightly above (within 5 basis points of) the Expense Group median.
5
| Item 11. | Statement Regarding Basis for Approval of Investment Advisory Contract (continued) |
● For Nuveen Kentucky Municipal Bond Fund, the Fund’s contractual management fee rate, actual management fee rate and net total expense ratio ranked in the third quartile, fourth quartile and third quartile of its Expense Group, respectively. In addition, the Fund’s contractual management fee rate, actual management fee rate and net total expense ratio ranked in the second quartile, fourth quartile and second quartile of its Expense Universe, respectively. Further, although the Fund’s actual management fee rate was above the Expense Group median, the Fund’s net total expense ratio was generally in-line with the Expense Group median.
● For Nuveen Michigan Municipal Bond Fund, although the Fund’s actual management fee rate ranked in the fourth quartile of its Expense Group, the Fund’s contractual management fee rate and net total expense ratio each ranked in the third quartile of its Expense Group. In addition, although the Fund’s actual management fee rate ranked in the fourth quartile of its Expense Universe, the Fund’s contractual management fee rate ranked in the second quartile and net total expense ratio ranked in the third quartile of its Expense Universe. Further, although the Fund’s actual management fee rate was above the Expense Group median, the Fund’s net total expense ratio was slightly above (within 5 basis points of) the Expense Group median.
● For Nuveen Missouri Municipal Bond Fund, although the Fund’s contractual management fee rate and actual management fee rate ranked in the fourth quartile of its Expense Group, the Fund’s net total expense ratio ranked in the third quartile of its Expense Group. In addition, although the Fund’s contractual management fee rate and actual management fee rate ranked in the fourth quartile of its Expense Universe, the Fund’s net total expense ratio ranked in the second quartile of its Expense Universe. Further, although the Fund’s actual management fee rate was above the Expense Group median, the Fund’s net total expense ratio was generally in-line with the Expense Group median.
● For Nuveen Ohio Municipal Bond Fund, although the Fund’s contractual management fee rate and actual management fee rate ranked in the fourth quartile of its Expense Group and Expense Universe and the Fund’s net total expense ratio ranked in the fourth quartile of its Expense Group, the Fund’s net total expense ratio ranked in the third quartile of its Expense Universe. In addition, although the Fund’s actual management fee rate was above the Expense Group median, the Fund’s net total expense ratio was slightly above (within 5 basis points of) the Expense Group median.
● For Nuveen Wisconsin Municipal Bond Fund, although the Fund’s actual management fee rate and net total expense ratio ranked in the fourth quartile of its Expense Group and Expense Universe, the Fund’s contractual management fee rate ranked in the third quartile of its Expense Group and second quartile of its Expense Universe. In addition, although the Fund’s actual management fee rate was above the Expense Group median, the Fund’s net total expense ratio was slightly above (within 5 basis points of) the Expense Group median. The Board further considered that the Adviser to the Fund agreed to implement a temporary expense cap for the Fund that will expire on July 31, 2026.
Based on its review of the information provided, the Board determined that each Fund’s management fees (as applicable) to a Fund Adviser were reasonable in light of the nature, extent and quality of services provided to the Fund.
| 2. | Comparisons with the Fees of Other Clients |
In evaluating the appropriateness of fees, the Board also considered that the Adviser, affiliated sub-advisers and/or their affiliate(s) provide investment management services to other types of clients which may include: separately managed accounts, retail managed accounts, foreign funds (UCITS), other investment companies (as sub-advisers), limited partnerships and collective investment trusts. The Board reviewed the equal weighted average fee or other fee data for the other types of clients managed in a similar manner to certain of the Nuveen funds and TC funds. The Board considered the Adviser’s rationale for the differences in the management fee rates of the funds compared to the management fee rates charged to these other types of clients. In this regard, the Board considered that differences, including but not limited to, the amount, type and level of services provided by the Adviser to the funds compared to that provided to other clients as well as differences in investment policies; regulatory, disclosure and governance requirements; servicing relationships with vendors; the manner of managing such assets; product structure; investor profiles; and account sizes all may contribute to variations in relative fee rates. Further, differences in the client base, governing bodies, distribution, jurisdiction and operational complexities also would contribute to variations in management fees assessed the funds compared to foreign fund clients. In addition, differences in the level of advisory services required for passively managed funds also contribute to differences in the management fee levels of such funds compared to actively managed funds. As a general matter, higher fee levels reflect higher levels of service provided by the Adviser, increased investment management complexity, greater product management requirements, and higher levels of business risk or some combination of these factors. The Board considered the wide range of services in addition to investment management that the Adviser had provided to the funds compared to other types of clients as well as the increased entrepreneurial, legal and regulatory risks that the Adviser incurs in sponsoring and managing the funds. The Board further considered that a sub-adviser’s fee is essentially for portfolio management services and therefore more comparable to the fees it receives for retail wrap accounts and other external sub-advisory mandates. The Board concluded that the varying levels of fees were reasonable given, among other things, the more extensive services, regulatory requirements and legal liabilities, and the entrepreneurial, legal and regulatory risks incurred in sponsoring and advising a registered investment company compared to that required in advising other types of clients.
| 3. | Profitability of Fund Advisers |
In their review, the Board Members considered various profitability data relating to the Fund Advisers’ services to the Nuveen funds.
6
With respect to the Nuveen funds, the Board Members reviewed the estimated profitability information of Nuveen as a result of its advisory services to the Nuveen funds overall as well as profitability data of certain other asset management firms. Such profitability information included, among other things, gross and net revenue margins (excluding distribution) of Nuveen Investments, Inc. (“Nuveen Investments”) for services to the Nuveen funds on a pre-tax and after-tax basis for the 2023 and 2022 calendar years as well as the revenues earned (less any expense reimbursements/fee waivers) and expenses incurred by Nuveen Investments for its advisory activities to the Nuveen funds (excluding distribution) for the 2023 and 2022 calendar years. The Board Members also considered the rationale for the change in Nuveen’s profitability from 2022 to 2023. In addition, the Board reviewed the revenues, expenses and operating margin (pre- and after-tax) NFAL derived from its exchange-traded fund product line for the 2023 and 2022 calendar years.
In developing the profitability data, the Board Members considered the subjective nature of calculating profitability as the information is not audited and is necessarily dependent on cost allocation methodologies to allocate expenses throughout the complex and among the various advisory products. Given there is no single universally recognized expense allocation methodology and that other reasonable and valid allocation methodologies could be employed and could lead to significantly different results, the Board reviewed, among other things, a description of the cost allocation methodologies employed to develop the financial information, a summary of the refinements Nuveen had made to the methodology that had occurred over the years from 2010 through 2021 to provide Nuveen’s profitability analysis, and a historical expense analysis of Nuveen Investments’ revenues, expenses and pre-tax net revenue margins derived from its advisory services to the Nuveen funds (excluding distribution) for the calendar years from 2017 through 2023. The Board of the Nuveen funds had also appointed two Board Members to serve as the Board’s liaisons to meet with representatives of NFAL and review the development of the profitability data and to report to the full Board.
In addition, the Board considered certain comparative operating margin data. In this regard, the Board reviewed the operating margins of Nuveen Investments compared to the adjusted operating margins of a peer group of asset management firms with publicly available data and the most comparable assets under management (based on asset size and asset composition) to Nuveen. The Board considered that the operating margins of the peers were adjusted generally to address that certain services provided by the peers were not provided by Nuveen. The Board also reviewed, among other things, the net revenue margins (pre-tax) of Nuveen Investments on a company-wide basis and the net revenue margins (pre-tax) of Nuveen Investments derived from its services to the Nuveen funds only (including and excluding distribution) compared to the adjusted operating margins of the peer group for each calendar year from 2014 to 2023. In their review of the comparative data, the Board Members considered the limitations of the comparative data given that peer data is not generally public and the calculation of profitability is subjective and affected by numerous factors (such as types of funds a peer manages, its business mix, its cost of capital, the numerous assumptions underlying the methodology used to allocate expenses and other factors) that can have a significant impact on the results.
Aside from the profitability data, the Board considered that NFAL and TAL are affiliates of Teachers Insurance and Annuity Association of America (“TIAA”). NFAL is a subsidiary of Nuveen, LLC, the investment management arm of TIAA, and TAL is an indirect wholly owned subsidiary of TIAA. Accordingly, the Board also reviewed a balance sheet for TIAA reflecting its assets, liabilities and capital and contingency reserves for the 2023 and 2022 calendar years to consider the financial strength of TIAA. The Board considered the benefit of an investment adviser and its parent with significant resources, particularly during periods of market volatility. The Board also considered the reinvestments the Adviser, its parent and/or other affiliates made into their business through, among other things, the investment of seed capital in certain funds, initiatives in international expansion, investments in infrastructure and continued investments in enhancements to technological capabilities.
The Board Members considered the profitability of the Sub-Adviser from its relationships with the respective Nuveen funds. In this regard, the Board Members reviewed, among other things, the Sub-Adviser’s revenues, expenses and net revenue margins (pre- and after-tax) for its advisory activities to the respective Nuveen funds for the calendar years ended December 31, 2023 and December 31, 2022. The Board Members also reviewed a profitability analysis reflecting the revenues, expenses and revenue margin (pre- and after-tax) grouped by similar types of funds (such as municipal, taxable fixed income, equity, real assets and index/asset allocation) for the Sub-Adviser for the calendar years ending December 31, 2023 and December 31, 2022.
In evaluating the reasonableness of the compensation, the Board Members also considered the indirect benefits NFAL or the Sub-Adviser received that were directly attributable to the management of the applicable funds as discussed in further detail below. Based on its review, the Board was satisfied that each Fund Adviser’s level of profitability from its relationship with each Nuveen fund was not unreasonable over various time frames in light of the nature, extent and quality of services provided.
| D. | Economies of Scale and Whether Fee Levels Reflect These Economies of Scale |
The Board considered whether there have been economies of scale with respect to the management of the funds in the fund complex, including the Funds, whether these economies of scale have been appropriately shared with such funds and whether there is potential for realization of further economies of scale. Although the Board considered that economies of scale are difficult to measure with any precision and the rates at which certain expenses are incurred may not decline with a rise in assets, the Board considered that there are various methods that may be employed to help share the benefits of economies of scale, including, among other things, through the use of breakpoints in the management fee schedule, fee waivers and/or expense limitations, the pricing of funds at scale at inception and investments in the Adviser’s business which can enhance the services provided to the applicable funds for the fees paid. The Board considered that the Adviser has generally employed one or more of these various methods among the applicable funds.
In this regard, the Board considered, as noted above, that the management fee of NFAL generally was comprised of a fund-level component and a complex-level component each with its own breakpoint schedule, subject to certain exceptions. With this structure, the Board considered that the complex-level breakpoint schedule was designed to deliver the benefits of economies of scale to shareholders when the assets of eligible funds in
7
| Item 11. | Statement Regarding Basis for Approval of Investment Advisory Contract (continued) |
the complex pass certain thresholds even if the assets of a particular fund are unchanged or have declined, and the fund-level breakpoint schedules were designed to share economies of scale with shareholders if the particular fund grows. The Board reviewed the fund-level and complex-level fee schedules. As summarized above, the Board approved a new complex-level breakpoint schedule which would simplify and reduce the complex-level fee rates at various thresholds and expanded the eligible funds whose assets would be included in calculating the complex-level fee, effective May 1, 2024. Among other things, the assets of certain TC funds advised by TAL would be phased into the calculation of the complex-wide assets in determining the complex-level fee over a ten-year period. The Board considered the cost savings and additional potential sharing of economies of scale as a result of the reduced complex-level breakpoint schedule and the additional assets from more eligible funds in calculating the assets of the complex for determining the complex-level fee component. The Board reviewed the projected shareholder savings derived from such modifications over a ten-year period from 2024 to 2033. The Board considered management’s representation that there will be no increase to any fund’s respective advisory agreement fee rate.
In addition to the fund-level and complex-level fee schedules (if applicable), the Board Members considered the temporary and/or permanent expense caps (if any) applicable to a Fund. The Board considered that such waivers and reimbursements applicable to the respective funds are another means for potential economies of scale to be shared with shareholders of such funds and can provide a protection from an increase in expenses if the assets of the applicable funds decline.
The Board Members also considered the continued reinvestment in Nuveen/TIAA’s business to enhance its capabilities and services to the benefit of its various clients. The Board understood that many of these investments were not specific to individual funds, but rather incurred across a variety of products and services pursuant to which the family of funds as a whole may benefit. The Board further considered that the Adviser and its affiliates have provided certain additional services, including, but not limited to, services required by new regulations and regulatory interpretations, without raising advisory fees to the funds, and this was also a means of sharing economies of scale with the funds and their shareholders. The Board considered the Adviser’s and/or its affiliates’ ongoing efforts to streamline the product line-up, among other things, to create more scaled funds which may help improve both expense and trading economies.
Based on its review, the Board was satisfied that the current fee arrangements together with the reinvestment in management’s business appropriately shared any economies of scale with shareholders.
| E. | Indirect Benefits |
The Board Members received and considered information regarding various indirect benefits the respective Fund Adviser or its affiliates may receive as a result of their relationship with the funds in the fund complex, including the Funds. These benefits included, among other things, economies of scale to the extent the Adviser or its affiliates share investment resources and/or personnel with other clients of the Adviser. The funds may also be used as investment options for other products or businesses offered by the Adviser and/or its affiliates, such as variable products, fund of funds and 529 education savings plans, and affiliates of the Adviser may serve as sub-advisers to various funds in which case all advisory and sub-advisory fees generated by such funds stay within Nuveen.
Further, the funds may pay the Adviser and/or its affiliates for other services, such as distribution. In this regard, the Board Members considered that an affiliate of the Adviser serves as principal underwriter providing distribution and/or shareholder services to the open-end funds for which it may be compensated. The Board Members also considered that certain share classes of the open-end funds (subject to certain exceptions) pay 12b-1 fees, some of which may be retained by the Adviser’s affiliate. In addition, the Board Members considered that the Adviser and Sub-Adviser may utilize soft dollar brokerage arrangements attributable to the respective funds to obtain research and other services for any or all of their clients, although the Board Members also considered reimbursements of such costs by the Adviser and/or Sub-Adviser.
The Adviser and its affiliates may also benefit from the advisory relationships with the funds in the fund complex to the extent this relationship results in potential investors viewing the TIAA group of companies as a leading retirement plan provider in the academic and nonprofit market and a single source for all their financial service needs. The Adviser and/or its affiliates may further benefit to the extent that they have pricing or other information regarding vendors the funds utilize in establishing arrangements with such vendors for other products.
Based on its review, the Board concluded that any indirect benefits received by a Fund Adviser as a result of its relationship with the Funds were reasonable in light of the services provided.
| F. | Other Considerations |
The Board Members did not identify any single factor discussed previously as all-important or controlling. The Board Members concluded that the terms of each Advisory Agreement were reasonable, that the respective Fund Adviser’s fees were reasonable in light of the services provided to each Fund and that the Advisory Agreements be renewed for an additional one-year period.
8
| Item 12. | Disclosure of Proxy Voting Policies and Procedures for Closed-End Management Investment Companies. |
Not applicable to open-end investment companies.
| Item 13. | Portfolio Managers of Closed-End Management Investment Companies. |
Not applicable to open-end investment companies.
| Item 14. | Purchases of Equity Securities by Closed-End Management Investment Company and Affiliated Purchasers. |
Not applicable to open-end investment companies.
| Item 15. | Submission of Matters to a Vote of Security Holders. |
There have been no material changes to the procedures by which shareholders may recommend nominees to the registrant’s Board of Trustees implemented after the registrant last provided disclosure in response to this Item.
| Item 16. | Controls and Procedures. |
| (a) | The registrant’s principal executive and principal financial officers, or persons performing similar functions, have concluded that the registrant’s disclosure controls and procedures (as defined in Rule 30a-3(c) under the Investment Company Act of 1940, as amended (the “1940 Act”) (17 CFR 270.30a-3(c))) are effective, as of a date within 90 days of the filing date of this report that includes the disclosure required by this paragraph, based on their evaluation of the controls and procedures required by Rule 30a-3(b) under the 1940 Act (17 CFR 270.30a-3(b)) and Rules 13a-15(b) or 15d-15(b) under the Securities Exchange Act of 1934, as amended (the “Exchange Act”) (17 CFR 240.13a-15(b) or 240.15d-15(b)). |
| (b) | There were no changes in the registrant’s internal control over financial reporting (as defined in Rule 30a-3(d) under the 1940 Act (17 CFR 270.30a-3(d)) that occurred during the period covered by this report that has materially affected, or is reasonably likely to materially affect, the registrant’s internal control over financial reporting. |
| Item 17. | Disclosure of Securities Lending Activities for Closed-End Management Investment Companies. |
| (a) | Not applicable to open-end investment companies. |
| (b) | Not applicable to open-end investment companies. |
| Item 18. | Recovery of Erroneously Awarded Compensation. |
| (a) | Not applicable. |
| (b) | Not applicable. |
| Item 19. | Exhibits. |
| (a)(1) | Not applicable because the code of ethics is available, upon request and without charge, by calling 800-257-8787 and there were no amendments during the period covered by this report. |
| (a)(2) |
| (a)(3) | Not applicable. |
| (a)(4) | Not applicable. |
| (b) |
SIGNATURES
Pursuant to the requirements of the Securities Exchange Act of 1934 and the Investment Company Act of 1940, the registrant has duly caused this report to be signed on its behalf by the undersigned, thereunto duly authorized.
Nuveen Multistate Trust IV
| Date: August 6, 2024 | By: /s/ Jordan M. Farris Jordan M. Farris |
Pursuant to the requirements of the Securities Exchange Act of 1934 and the Investment Company Act of 1940, this report has been signed below by the following persons on behalf of the registrant and in the capacities and on the dates indicated.
| Date: August 6, 2024 | By: /s/ Jordan M. Farris Jordan M. Farris | |||||
| Date: August 6, 2024 | By: /s/ E. Scott Wickerham E. Scott Wickerham | |||||