UNITED STATES
SECURITIES AND EXCHANGE COMMISSION
Washington, D.C. 20549
FORM N-CSR
CERTIFIED SHAREHOLDER REPORT OF REGISTERED
MANAGEMENT INVESTMENT COMPANIES
Investment Company Act File Number: 811-07749
| T. Rowe Price Financial Services Fund, Inc. |
|
| (Exact name of registrant as specified in charter) |
| |
| 100 East Pratt Street, Baltimore, MD 21202 |
|
| (Address of principal executive offices) |
| |
| David Oestreicher |
| 100 East Pratt Street, Baltimore, MD 21202 |
|
| (Name and address of agent for service) |
Registrant’s telephone number, including area code: (410) 345-2000
Date of fiscal year end: December 31
Date of reporting period: June 30, 2017
Item 1. Report to Shareholders
| Financial Services Fund | June 30, 2017 |
The views and opinions in this report were current as of June 30, 2017. They are not guarantees of performance or investment results and should not be taken as investment advice. Investment decisions reflect a variety of factors, and the managers reserve the right to change their views about individual stocks, sectors, and the markets at any time. As a result, the views expressed should not be relied upon as a forecast of the fund’s future investment intent. The report is certified under the Sarbanes-Oxley Act, which requires mutual funds and other public companies to affirm that, to the best of their knowledge, the information in their financial reports is fairly and accurately stated in all material respects.
REPORTS ON THE WEB
Sign up for our Email Program, and you can begin to receive updated fund reports and prospectuses online rather than through the mail. Log in to your account at troweprice.com for more information.
Manager’s Letter
Fellow Shareholders
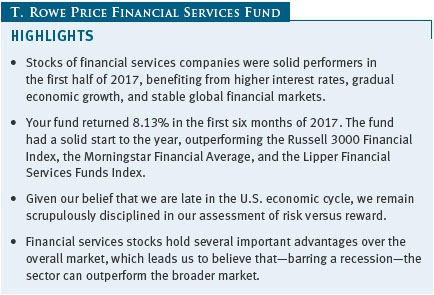
Stocks of financial services companies were solid performers in the first half of 2017, benefiting from higher interest rates as well as gradual economic growth and stable global financial markets. Title insurers, payment networks, and securities exchanges led the gains, while credit card issuers and community banks underperformed. While global economic growth remains slow and the political backdrop complex, the financial services industry stands to materially benefit from a gradual improvement in the regulatory environment.
We are now eight years into the economic cycle and equity bull market, and valuations have increased steadily over the past couple of years as multiple expansion has outstripped earnings growth. We believe this is a great environment for deep fundamental securities analysis. We will stay focused on finding financial services companies that have underappreciated levers for improvement, hidden value, or idiosyncratic growth potential. In this regard, we believe there are a number of individual stocks that are still attractively priced and have strong upside potential.
PERFORMANCE COMPARISON
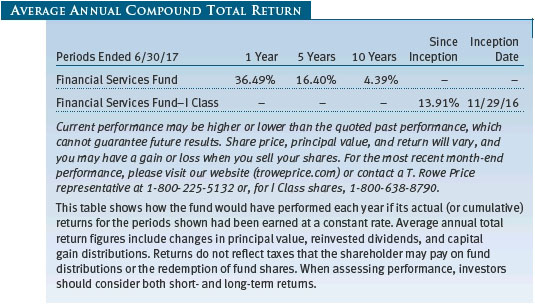
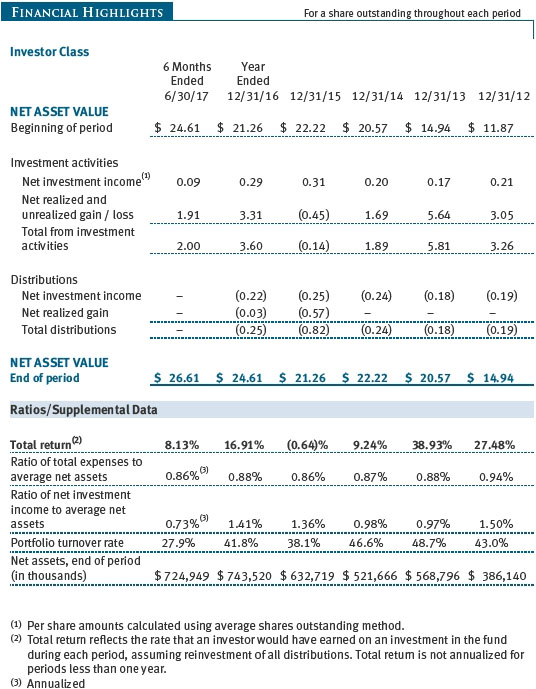
Your fund returned 8.13% in the first six months of 2017. As shown in the Performance Comparison table, the fund had a solid start to the year, outperforming the Russell 3000 Financial Index, the Morningstar Financial Average, and the Lipper Financial Services Funds Index. (Results for the I Class shares varied slightly, reflecting their different fee structure.)

PERFORMANCE REVIEW
One of the mainstays of our investment philosophy is that we take a long-term investment horizon and are, therefore, able to buy out-of-favor stocks that we believe will significantly outperform the market and the financials sector over time. In our last letter, we discussed our decision to materially increase positions in a select group of high-quality financial services companies that were left behind in the postelection rally. These stocks, which included payment networks Visa and MasterCard, financial technology providers Black Knight Financial Services and CoreLogic, securities exchanges CBOE Holdings and Intercontinental Exchange, and digital wallet PayPal Holdings, were among the largest contributors to the fund’s performance in the first half of 2017. (Please refer to the fund’s portfolio of investments for a complete list of holdings and the amount each represents in the portfolio.)
PayPal had underperformed the financials sector and the market following the presidential election, as investors rushed into stocks with greater direct exposure to potential benefits of tax reform, higher interest rates, and accelerating economic growth. Additionally, PayPal had become a controversial stock earlier in 2016, as investors and analysts struggled to determine the financial impact of the company’s efforts to form partnerships with Visa, MasterCard, and other companies within the payments ecosystem. From our fundamental analysis of the opportunities present in such partnerships, we concluded that the market was materially underestimating the earnings per share growth potential of the company. With the benefit of a strong first-quarter earnings report along with better-than-expected guidance on the impact of its strategic actions, shares of PayPal have performed well.
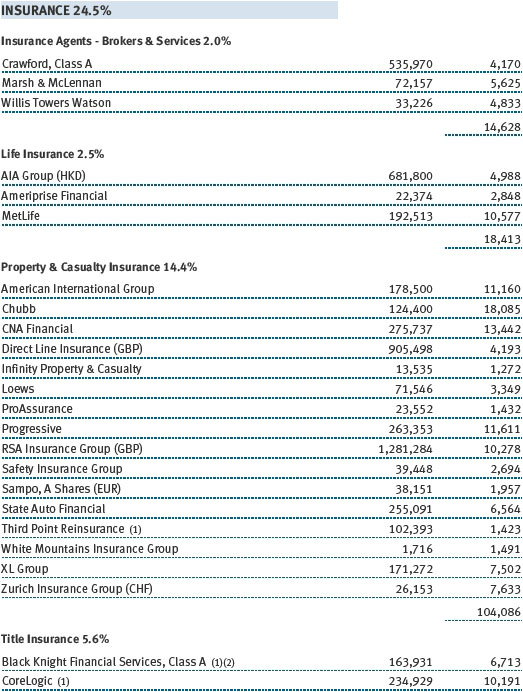
Our longstanding large position in title insurers, namely Fidelity National Financial and First American Financial, also strongly contributed to performance. Title insurers were one of the worst-performing segments within financial services in 2016 as investors worried about the impact of higher interest rates on residential mortgage origination activity. While industry origination levels have declined in 2017, especially for mortgage refinancings, we believe the outlook for residential mortgage originations remains robust thanks to low unemployment, economic growth, and reasonable housing affordability. For the first half of the year, the title insurers outperformed as it became apparent to investors that purchase origination activity would remain strong and that these companies would be able to carefully manage expenses and capital and still grow earnings despite the cyclical pullback in refinancings.
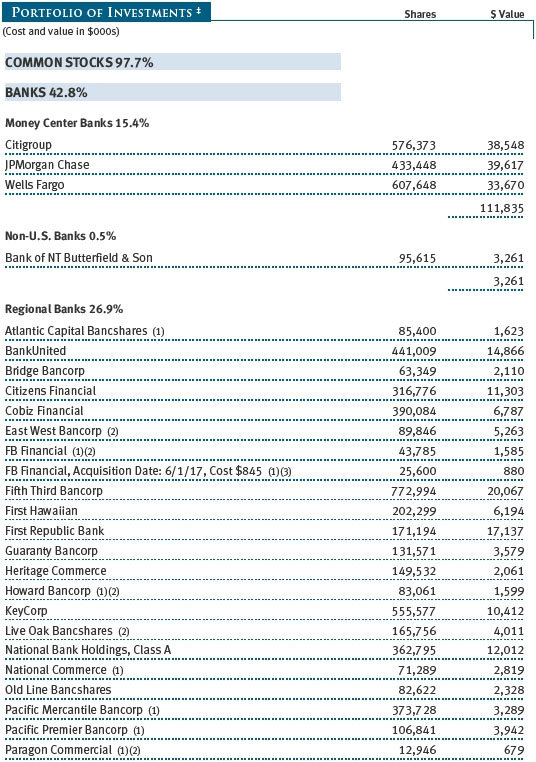
We hold large positions in money center, trust, and investment banks—including Morgan Stanley, Citigroup, State Street, and J.P. Morgan Chase—because of our long-held opinion that banking industry regulatory pressures would begin to ease. These positions were strong contributors to performance in the second half of 2016, and the trend continued into the first half of 2017. All four of these stocks were solid first-half contributors, thanks to a number of changes that we expect to materially benefit banks’ abilities to efficiently utilize their capital and increase their returns on capital without adding risk to the financial markets and economy. Among those changes are the Trump administration’s nomination of leaders—such as the head of the Office of the Comptroller of the Currency and the vice chairman of supervision at the Federal Reserve—who favor reducing regulations. The Treasury Department also released an encouraging memorandum that detailed many recommended changes to the current regulations governing the banking system.
Our large position in regional bank BankUnited detracted significantly from performance during the period. This bank has underperformed most peers as investors are concerned about a slowdown in the company’s loan growth prospects. In our view, at this later point of the economic cycle, we would rather invest with management teams that are willing to curtail loan growth if opportunities in their markets do not present themselves. We believe risk management is one of the most important skill sets of a successful bank management team, and we look for opportunities to invest when such discipline is greeted with disappointment by the market. BankUnited is now trading at 12 times 2018 earnings and 1.4 times its current tangible book value—levels well below most peers—despite an attractive franchise and footprint operating in a consolidating industry. We believe the stock will outperform through a combination of earnings growth and valuation expansion, and we also believe that the company is an attractive acquisition candidate.
PORTFOLIO REVIEW
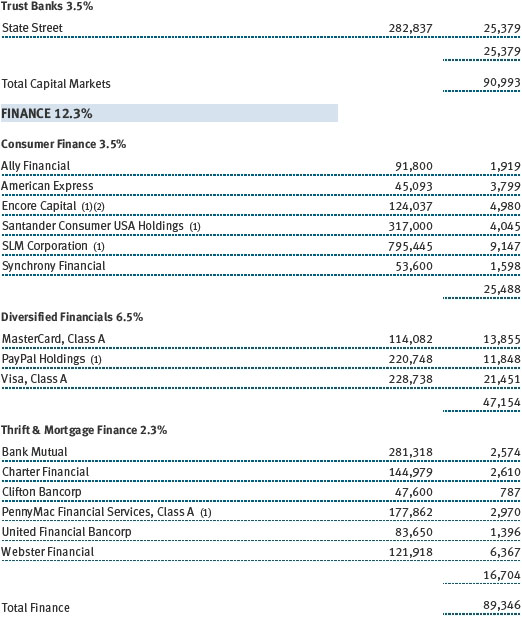
Your fund was well diversified across 95 issuers of securities as of June 30, 2017, and we believe that we have positioned the portfolio to outperform the financials sector in a wide variety of economic backdrops. Given our belief that the economy will continue to grow at a slow pace, we are looking for “idiosyncratic” investments that have the potential for higher-return scenarios, such as an operational turnaround or a company sale. Recognizing the longevity of the economic expansion and the equity bull market, we are also placing increasing importance on the strength of each company’s industry structure, balance sheet, management team, and risk management. Consequently, there is a stronger quality bias in the portfolio than there was a year ago.
The period of November 2016 through February 2017 offered a rare opportunity for us to materially increase the size of our investments in some of the better-run and better-positioned businesses that we follow, such as Visa, MasterCard, PayPal, Black Knight, CBOE, and Intercontinental Exchange. Those stocks had fallen out of favor versus companies that were perceived to benefit more from the changing political and economic landscape, such as banks and consumer finance organizations. These higher-quality companies are rarely cheap and disliked enough for our heavily contrarian investment style, so we moved aggressively when afforded the opportunity.
We have also opportunistically and selectively added to some of our higher-conviction positions in countercyclical areas, such as real estate investment trusts and property and casualty insurance. Our purchase of insurer Chubb earlier in the year is another example of our efforts to take advantage of the underperformance of high-quality companies. Chubb is an industry leader with a best-in-class management team, a very strong balance sheet, and an excellent underwriting track record. We were able to buy the stock at 1.25 times book value, which is a very attractive valuation for such a strong franchise.
The market landscape has changed in recent months, however. Stocks such as Visa, MasterCard, PayPal, CBOE, Intercontinental Exchange, and Chubb have been among the strongest performers in the portfolio and are no longer out of favor and “on sale.” Rather, many of the stocks that outperformed materially following the presidential election have pulled back as concerns have risen about political uncertainty in Washington.
Therefore, many of the best opportunities we see in the market today are in some of the more cyclical groups within financials. Given our belief that we are late in the U.S. economic cycle, we remain scrupulously disciplined in our assessment of risk versus reward. One way to achieve this discipline is by trying to identify situations in which the market is already discounting a more dire economic backdrop in the valuation of a given stock.
For example, we started a new position in subprime auto lender Santander Consumer USA following months of research into the auto lending sector as well as the company’s balance sheet and risk profile. Auto lending is one of the most controversial segments for investors. Nary a day goes by without a high-profile news organization publishing a negative story on the industry. Our work led us to believe that much of the bad news was already reflected in both Santander’s recent financial results and the stock’s valuation, which was at six times its 2018 earnings and 75% of tangible book value after having underperformed the market by 55% over the prior two years. Most importantly, our collaborative research and analysis with our colleagues in T. Rowe Price’s Fixed Income Department gave us confidence that Santander’s underwriting standards were much better than the consensus view. Additionally, with many competitors pulling back from auto lending, the competitive balance has improved, which has increased Santander’s profitable underwriting opportunities. Finally, we believe the company’s Spanish parent company, Banco Santander, might seek to acquire the 40% of shares it does not currently own in order to fund underwriting and reduce costs. We think that there is a strong chance that Banco Santander will purchase the rest of Santander Consumer over the next three years at a share price that is materially higher than today’s price.
Another prominent theme in the fund is our belief that merger and acquisition (M&A) activity will be an important trend within financials for years to come. Highly fragmented industries, including community banking and insurance, can realize economies of scale through M&A/consolidation. As a rule, we avoid making investments based solely on an M&A-related thesis because we recognize it is difficult to precisely identify the players and timing of such activity. However, in many circumstances, we use M&A potential as a secondary component to an investment thesis in which we like a stock for other fundamental reasons. We believe many of our holdings have both strong business-as-usual fundamental prospects and the optionality of a takeover. These holdings include regional banks Pacific Premier Bancorp, BankUnited, Heritage Commerce, Towne Bank, Old Line Bancshares, Bank Mutual Corporation, First Hawaiian, Seacoast Banking, Charter Financial, Cobiz Financial, National Bank Holdings, Preferred Bank, and First Republic Bank.

OUTLOOK
We are optimistic about the idiosyncratic drivers and prospects for our investments over the next 12 months and beyond. We are more balanced, though, in our view of the market and the economy. Going forward, we believe that the odds of economic growth accelerating or decelerating are roughly equal. Thus, we will continue to focus on the risk/reward profiles of each of our current and prospective investments.
Financial services stocks hold several important advantages over the overall market, which leads us to believe that—barring a recession—the sector can outperform the broader market. First, the potential benefits from regulatory reform are both likely and material. As we wrote in the year-end 2016 shareholder letter, we do not believe the Dodd-Frank Wall Street Reform and Consumer Protection Act (passed in 2010 and intended to decrease various risks in the U.S. financial system) will, or should, get overturned; rather, we expect some of the more onerous aspects of the act to be softened by new and less contentious leading regulators. J.P. Morgan Chase, Citigroup, State Street, and Morgan Stanley are among the greatest potential beneficiaries from regulatory reform, and each is among the fund’s largest holdings.
Secondly, valuations for many stocks in the sector are still undemanding. There are plenty of stocks—such as BankUnited at 12 times 2018 earnings, Santander at six times, Citigroup at 11 times, and Fifth Third Bancorp at 12 times—that are trading well below what we believe to be their intrinsic value. Many of these stocks also have unique and company-specific catalysts that we believe will lead to valuation expansion and/or greater-than-expected earnings growth.
Thirdly, the financial services ecosystem has dramatically improved from prior cycles. Banks need to hold far more capital and maintain far greater liquidity than ever before. They also employ more sophisticated risk management processes to better understand and track the risks that they are taking. At the same time, regulators are more engaged in identifying deteriorating lending standards before they create risk for the financial system.
Finally, most of the management teams and Boards of Directors for the largest banks are now focused on improving operations, growing organically, minimizing risk, and returning capital to shareholders. In prior cycles, many of these same companies were focused on growth through risky M&A and on improving returns through increased leverage and the use of new “innovative” products, such as mortgage-backed securities, credit default swaps, and minimum-balance-guaranteed variable annuities.
This is still a highly cyclical group, and the next downturn will probably come from something we and others are not contemplating today. However, we strongly believe that banks and regulators will be better positioned to weather the storm and minimize the damage than they were in the late 2007–2009 recession.
We are, as always, steadfastly focused on identifying idiosyncratic opportunities with strong upside potential. We are trying to find stocks that have an important driver that we believe is either misunderstood or underappreciated by the market. Our long-term investment horizon and contrarian investment style allow us to make opportunistic investments that have uniquely attractive upside potential and risk/reward profiles.
We thank you for your confidence in T. Rowe Price and in our investment management capabilities.
Respectfully submitted,

Gabriel Solomon
Chairman of the fund’s Investment Advisory Committee
July 17, 2017
The committee chairman has day-to-day responsibility for managing the portfolio and works with committee members in developing and executing the fund’s investment program.
RISKS OF INVESTING
The fund’s share price can fall because of weakness in the stock market, a particular industry, or specific holdings. Stock markets can decline for many reasons, including adverse political or economic developments, changes in investor psychology, or heavy institutional selling. The prospects for an industry or company may deteriorate because of a variety of factors, including disappointing earnings or changes in the competitive environment. In addition, the investment manager’s assessment of companies held in a fund may prove incorrect, resulting in losses or poor performance, even in rising markets.
Funds that invest only in specific industries will experience greater volatility than funds investing in a broad range of industries. The banking industry can be significantly affected by legislation that has reduced the separation between commercial and investment banking businesses, changed the laws governing capitalization requirements and the savings and loan industry, and increased competition. In addition, changes in general economic conditions and interest rates can significantly affect the banking industry. Financial services companies may be hurt when interest rates rise sharply, although not all companies are affected equally. The stocks may also be vulnerable to rapidly rising inflation.
GLOSSARY
Lipper indexes: Fund benchmarks that consist of a small number of the largest mutual funds in a particular category as tracked by Lipper Inc.
Morningstar Financial Average: Tracks the performance of funds that seek capital appreciation by investing primarily in equity securities of financial services companies.
Price-to-book ratio: A valuation measure that compares a stock’s market price with its book value, i.e., the company’s net worth divided by the number of outstanding shares.
Price-to-earnings (P/E) ratio—12 months forward: A valuation measure calculated by dividing the price of a stock by the analysts’ forecast of the next 12 months’ expected earnings. The ratio is a measure of how much investors are willing to pay for a company’s future earnings. The higher the P/E, the more investors are paying for a company’s earnings growth in the next 12 months.
Real estate investment trusts: Publicly traded companies that own, develop, and operate apartment complexes, hotels, office buildings, and other commercial properties.
Russell 3000 Financial Index: A subindex of the Russell 3000 Index that includes all of the financials sector components of the Russell 3000.
Russell 3000 Index: An index that tracks the performance of the 3,000 largest companies, representing approximately 98% of the investable U.S. equity market.
Tangible book value: A measure that looks at what common shareholders can expect to receive if the firm goes bankrupt and all of its assets are liquidated at their book values; intangible assets such as goodwill are removed from this calculation because they cannot be sold during liquidation.
Note: Russell Investment Group is the source and owner of the trademarks, service marks, and copyrights related to the Russell indexes. Russell® is a trademark of Russell Investment Group.
Performance and Expenses
This chart shows the value of a hypothetical $10,000 investment in the fund over the past 10 fiscal year periods or since inception (for funds lacking 10-year records). The result is compared with benchmarks, which may include a broad-based market index and a peer group average or index. Market indexes do not include expenses, which are deducted from fund returns as well as mutual fund averages and indexes.

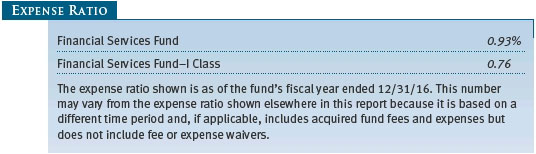
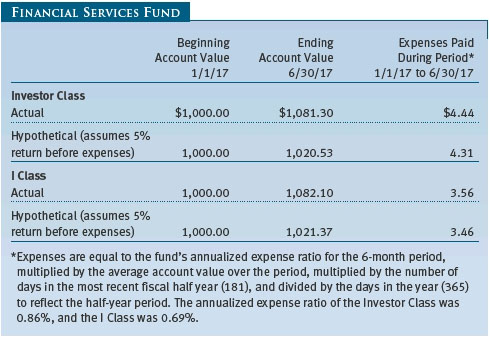
As a mutual fund shareholder, you may incur two types of costs: (1) transaction costs, such as redemption fees or sales loads, and (2) ongoing costs, including management fees, distribution and service (12b-1) fees, and other fund expenses. The following example is intended to help you understand your ongoing costs (in dollars) of investing in the fund and to compare these costs with the ongoing costs of investing in other mutual funds. The example is based on an investment of $1,000 invested at the beginning of the most recent six-month period and held for the entire period.
Please note that the fund has two share classes: The original share class (Investor Class) charges no distribution and service (12b-1) fee, and the I Class shares are also available to institutionally oriented clients and impose no 12b-1 or administrative fee payment. Each share class is presented separately in the table.
Actual Expenses
The first line of the following table (Actual) provides information about actual account values and expenses based on the fund’s actual returns. You may use the information on this line, together with your account balance, to estimate the expenses that you paid over the period. Simply divide your account value by $1,000 (for example, an $8,600 account value divided by $1,000 = 8.6), then multiply the result by the number on the first line under the heading “Expenses Paid During Period” to estimate the expenses you paid on your account during this period.
Hypothetical Example for Comparison Purposes
The information on the second line of the table (Hypothetical) is based on hypothetical account values and expenses derived from the fund’s actual expense ratio and an assumed 5% per year rate of return before expenses (not the fund’s actual return). You may compare the ongoing costs of investing in the fund with other funds by contrasting this 5% hypothetical example and the 5% hypothetical examples that appear in the shareholder reports of the other funds. The hypothetical account values and expenses may not be used to estimate the actual ending account balance or expenses you paid for the period.
Note: T. Rowe Price charges an annual account service fee of $20, generally for accounts with less than $10,000. The fee is waived for any investor whose T. Rowe Price mutual fund accounts total $50,000 or more; accounts electing to receive electronic delivery of account statements, transaction confirmations, prospectuses, and shareholder reports; or accounts of an investor who is a T. Rowe Price Personal Services or Enhanced Personal Services client (enrollment in these programs generally requires T. Rowe Price assets of at least $250,000). This fee is not included in the accompanying table. If you are subject to the fee, keep it in mind when you are estimating the ongoing expenses of investing in the fund and when comparing the expenses of this fund with other funds.
You should also be aware that the expenses shown in the table highlight only your ongoing costs and do not reflect any transaction costs, such as redemption fees or sales loads. Therefore, the second line of the table is useful in comparing ongoing costs only and will not help you determine the relative total costs of owning different funds. To the extent a fund charges transaction costs, however, the total cost of owning that fund is higher.
Unaudited
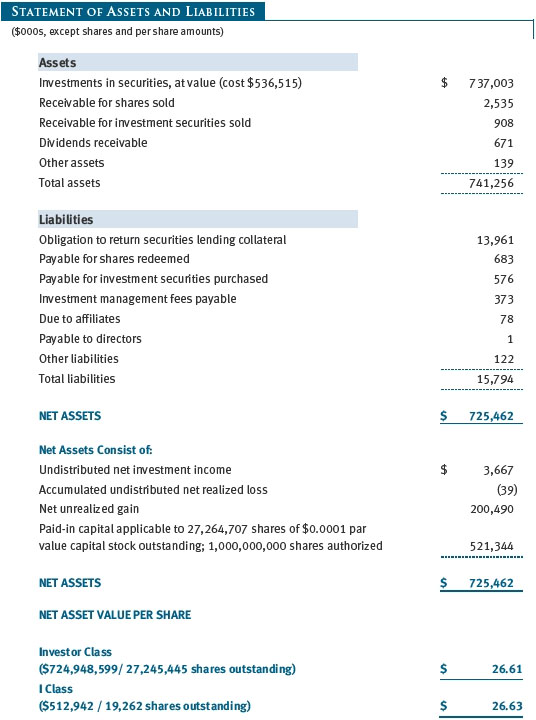
The accompanying notes are an integral part of these financial statements.
Unaudited

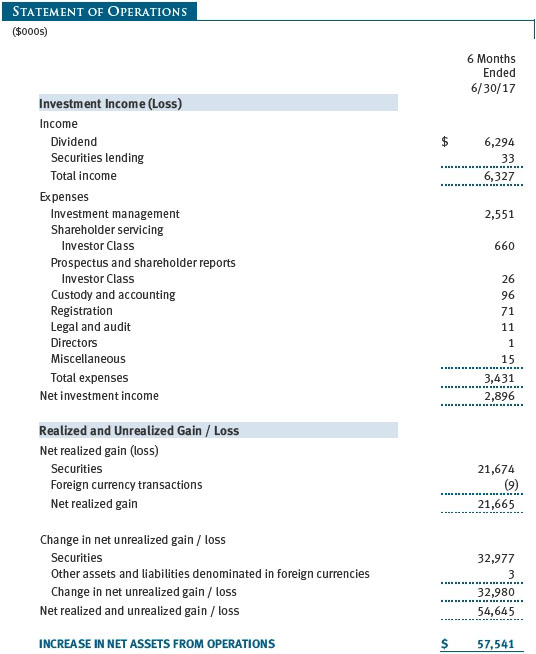
The accompanying notes are an integral part of these financial statements.
Unaudited


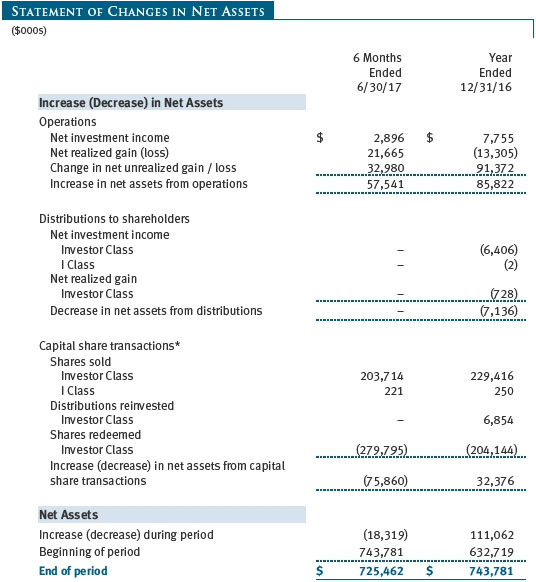
The accompanying notes are an integral part of these financial statements.
Unaudited
The accompanying notes are an integral part of these financial statements.
Unaudited
The accompanying notes are an integral part of these financial statements.
Unaudited

The accompanying notes are an integral part of these financial statements.
Unaudited
| Notes to Financial Statements |
T. Rowe Price Financial Services Fund, Inc. (the fund), is registered under the Investment Company Act of 1940 (the 1940 Act) as a diversified, open-end management investment company. The fund seeks long-term growth of capital and a modest level of income. The fund has two classes of shares: the Financial Services Fund (Investor Class) and the Financial Services Fund–I Class (I Class). I Class shares generally are available only to investors meeting a $1,000,000 minimum investment or certain other criteria. Each class has exclusive voting rights on matters related solely to that class; separate voting rights on matters that relate to both classes; and, in all other respects, the same rights and obligations as the other class.
NOTE 1 - SIGNIFICANT ACCOUNTING POLICIES
Basis of Preparation The fund is an investment company and follows accounting and reporting guidance in the Financial Accounting Standards Board (FASB) Accounting Standards Codification Topic 946 (ASC 946). The accompanying financial statements were prepared in accordance with accounting principles generally accepted in the United States of America (GAAP), including, but not limited to, ASC 946. GAAP requires the use of estimates made by management. Management believes that estimates and valuations are appropriate; however, actual results may differ from those estimates, and the valuations reflected in the accompanying financial statements may differ from the value ultimately realized upon sale or maturity.
Investment Transactions, Investment Income, and Distributions Income and expenses are recorded on the accrual basis. Dividends received from mutual fund investments are reflected as dividend income; capital gain distributions are reflected as realized gain/loss. Earnings on investments recognized as partnerships for federal income tax purposes reflect the tax character of such earnings. Dividend income and capital gain distributions are recorded on the ex-dividend date. Income tax-related interest and penalties, if incurred, would be recorded as income tax expense. Investment transactions are accounted for on the trade date. Realized gains and losses are reported on the identified cost basis. Distributions from REITs are initially recorded as dividend income and, to the extent such represent a return of capital or capital gain for tax purposes, are reclassified when such information becomes available. Income distributions are declared and paid by each class annually. Distributions to shareholders are recorded on the ex-dividend date. A capital gain distribution may also be declared and paid by the fund annually.
Currency Translation Assets, including investments, and liabilities denominated in foreign currencies are translated into U.S. dollar values each day at the prevailing exchange rate, using the mean of the bid and asked prices of such currencies against U.S. dollars as quoted by a major bank. Purchases and sales of securities, income, and expenses are translated into U.S. dollars at the prevailing exchange rate on the date of the transaction. The effect of changes in foreign currency exchange rates on realized and unrealized security gains and losses is reflected as a component of security gains and losses.
Class Accounting Shareholder servicing, prospectus, and shareholder report expenses incurred by each class are charged directly to the class to which they relate. Expenses common to both classes, investment income, and realized and unrealized gains and losses are allocated to the classes based upon the relative daily net assets of each class.
Rebates Subject to best execution, the fund may direct certain security trades to brokers who have agreed to rebate a portion of the related brokerage commission to the fund in cash. Commission rebates are reflected as realized gain on securities in the accompanying financial statements and totaled $7,000 for the six months ended June 30, 2017.
New Accounting Guidance In October 2016, the Securities and Exchange Commission (SEC) issued a new rule, Investment Company Reporting Modernization, which, among other provisions, amends Regulation S-X to require standardized, enhanced disclosures, particularly related to derivatives, in investment company financial statements. Compliance with the guidance is effective for financial statements related to periods ending on or after August 1, 2017; adoption will have no effect on the fund’s net assets or results of operations.
NOTE 2 - VALUATION
The fund’s financial instruments are valued and each class’s net asset value (NAV) per share is computed at the close of the New York Stock Exchange (NYSE), normally 4 p.m. ET, each day the NYSE is open for business. However, the NAV per share may be calculated at a time other than the normal close of the NYSE if trading on the NYSE is restricted, if the NYSE closes earlier, or as may be permitted by the SEC.
Fair Value The fund’s financial instruments are reported at fair value, which GAAP defines as the price that would be received to sell an asset or paid to transfer a liability in an orderly transaction between market participants at the measurement date. The T. Rowe Price Valuation Committee (the Valuation Committee) is an internal committee that has been delegated certain responsibilities by the fund’s Board of Directors (the Board) to ensure that financial instruments are appropriately priced at fair value in accordance with GAAP and the 1940 Act. Subject to oversight by the Board, the Valuation Committee develops and oversees pricing-related policies and procedures and approves all fair value determinations. Specifically, the Valuation Committee establishes procedures to value securities; determines pricing techniques, sources, and persons eligible to effect fair value pricing actions; oversees the selection, services, and performance of pricing vendors; oversees valuation-related business continuity practices; and provides guidance on internal controls and valuation-related matters. The Valuation Committee reports to the Board and has representation from legal, portfolio management and trading, operations, risk management, and the fund’s treasurer.
Various valuation techniques and inputs are used to determine the fair value of financial instruments. GAAP establishes the following fair value hierarchy that categorizes the inputs used to measure fair value:
Level 1 – quoted prices (unadjusted) in active markets for identical financial instruments that the fund can access at the reporting date
Level 2 – inputs other than Level 1 quoted prices that are observable, either directly or indirectly (including, but not limited to, quoted prices for similar financial instruments in active markets, quoted prices for identical or similar financial instruments in inactive markets, interest rates and yield curves, implied volatilities, and credit spreads)
Level 3 – unobservable inputs
Observable inputs are developed using market data, such as publicly available information about actual events or transactions, and reflect the assumptions that market participants would use to price the financial instrument. Unobservable inputs are those for which market data are not available and are developed using the best information available about the assumptions that market participants would use to price the financial instrument. GAAP requires valuation techniques to maximize the use of relevant observable inputs and minimize the use of unobservable inputs. When multiple inputs are used to derive fair value, the financial instrument is assigned to the level within the fair value hierarchy based on the lowest-level input that is significant to the fair value of the financial instrument. Input levels are not necessarily an indication of the risk or liquidity associated with financial instruments at that level but rather the degree of judgment used in determining those values.
Valuation Techniques Equity securities listed or regularly traded on a securities exchange or in the over-the-counter (OTC) market are valued at the last quoted sale price or, for certain markets, the official closing price at the time the valuations are made. OTC Bulletin Board securities are valued at the mean of the closing bid and asked prices. A security that is listed or traded on more than one exchange is valued at the quotation on the exchange determined to be the primary market for such security. Listed securities not traded on a particular day are valued at the mean of the closing bid and asked prices for domestic securities and the last quoted sale or closing price for international securities.
For valuation purposes, the last quoted prices of non-U.S. equity securities may be adjusted to reflect the fair value of such securities at the close of the NYSE. If the fund determines that developments between the close of a foreign market and the close of the NYSE will affect the value of some or all of its portfolio securities, the fund will adjust the previous quoted prices to reflect what it believes to be the fair value of the securities as of the close of the NYSE. In deciding whether it is necessary to adjust quoted prices to reflect fair value, the fund reviews a variety of factors, including developments in foreign markets, the performance of U.S. securities markets, and the performance of instruments trading in U.S. markets that represent foreign securities and baskets of foreign securities. The fund may also fair value securities in other situations, such as when a particular foreign market is closed but the fund is open. The fund uses outside pricing services to provide it with quoted prices and information to evaluate or adjust those prices. The fund cannot predict how often it will use quoted prices and how often it will determine it necessary to adjust those prices to reflect fair value. As a means of evaluating its security valuation process, the fund routinely compares quoted prices, the next day’s opening prices in the same markets, and adjusted prices.
Actively traded equity securities listed on a domestic exchange generally are categorized in Level 1 of the fair value hierarchy. Non-U.S. equity securities generally are categorized in Level 2 of the fair value hierarchy despite the availability of quoted prices because, as described above, the fund evaluates and determines whether those quoted prices reflect fair value at the close of the NYSE or require adjustment. OTC Bulletin Board securities, certain preferred securities, and equity securities traded in inactive markets generally are categorized in Level 2 of the fair value hierarchy.
Investments in mutual funds are valued at the mutual fund’s closing NAV per share on the day of valuation and are categorized in Level 1 of the fair value hierarchy. Assets and liabilities other than financial instruments, including short-term receivables and payables, are carried at cost, or estimated realizable value, if less, which approximates fair value.
Thinly traded financial instruments and those for which the above valuation procedures are inappropriate or are deemed not to reflect fair value are stated at fair value as determined in good faith by the Valuation Committee. The objective of any fair value pricing determination is to arrive at a price that could reasonably be expected from a current sale. Financial instruments fair valued by the Valuation Committee are primarily private placements, restricted securities, warrants, rights, and other securities that are not publicly traded.
Subject to oversight by the Board, the Valuation Committee regularly makes good faith judgments to establish and adjust the fair valuations of certain securities as events occur and circumstances warrant. For instance, in determining the fair value of an equity investment with limited market activity, such as a private placement or a thinly traded public company stock, the Valuation Committee considers a variety of factors, which may include, but are not limited to, the issuer’s business prospects, its financial standing and performance, recent investment transactions in the issuer, new rounds of financing, negotiated transactions of significant size between other investors in the company, relevant market valuations of peer companies, strategic events affecting the company, market liquidity for the issuer, and general economic conditions and events. In consultation with the investment and pricing teams, the Valuation Committee will determine an appropriate valuation technique based on available information, which may include both observable and unobservable inputs. The Valuation Committee typically will afford greatest weight to actual prices in arm’s length transactions, to the extent they represent orderly transactions between market participants, transaction information can be reliably obtained, and prices are deemed representative of fair value. However, the Valuation Committee may also consider other valuation methods such as market-based valuation multiples; a discount or premium from market value of a similar, freely traded security of the same issuer; or some combination. Fair value determinations are reviewed on a regular basis and updated as information becomes available, including actual purchase and sale transactions of the issue. Because any fair value determination involves a significant amount of judgment, there is a degree of subjectivity inherent in such pricing decisions, and fair value prices determined by the Valuation Committee could differ from those of other market participants. Depending on the relative significance of unobservable inputs, including the valuation technique(s) used, fair valued securities may be categorized in Level 2 or 3 of the fair value hierarchy.
Valuation Inputs The following table summarizes the fund’s financial instruments, based on the inputs used to determine their fair values on June 30, 2017:

There were no material transfers between Levels 1 and 2 during the six months ended June 30, 2017.
NOTE 3 - OTHER INVESTMENT TRANSACTIONS
Consistent with its investment objective, the fund engages in the following practices to manage exposure to certain risks and/or to enhance performance. The investment objective, policies, program, and risk factors of the fund are described more fully in the fund’s prospectus and Statement of Additional Information.
Restricted Securities The fund may invest in securities that are subject to legal or contractual restrictions on resale. Prompt sale of such securities at an acceptable price may be difficult and may involve substantial delays and additional costs.
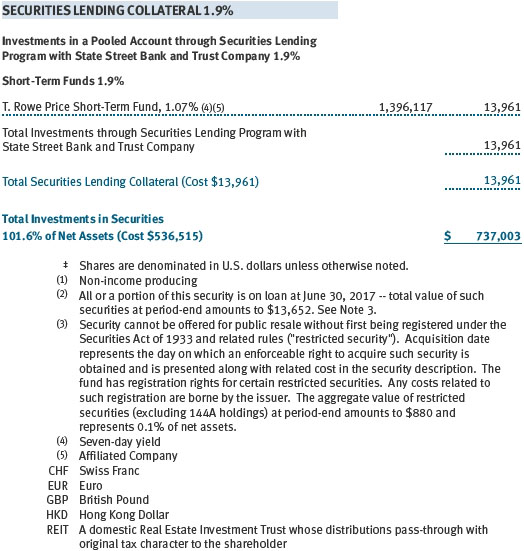
Securities Lending The fund may lend its securities to approved brokers to earn additional income. Its securities lending activities are administered by a lending agent in accordance with a securities lending agreement. Security loans generally do not have stated maturity dates, and the fund may recall a security at any time. The fund receives collateral in the form of cash or U.S. government securities, valued at 102% to 105% of the value of the securities on loan. Collateral is maintained over the life of the loan in an amount not less than the value of loaned securities; any additional collateral required due to changes in security values is delivered to the fund the next business day. Cash collateral is invested by the lending agent(s) in accordance with investment guidelines approved by fund management. Additionally, the lending agent indemnifies the fund against losses resulting from borrower default. Although risk is mitigated by the collateral and indemnification, the fund could experience a delay in recovering its securities and a possible loss of income or value if the borrower fails to return the securities, collateral investments decline in value, and the lending agent fails to perform. Securities lending revenue consists of earnings on invested collateral and borrowing fees, net of any rebates to the borrower, compensation to the lending agent, and other administrative costs. In accordance with GAAP, investments made with cash collateral are reflected in the accompanying financial statements, but collateral received in the form of securities is not. At June 30, 2017, the value of loaned securities was $13,652,000; the value of cash collateral and related investments was $13,961,000.
Other Purchases and sales of portfolio securities other than short-term securities aggregated $214,645,000 and $262,222,000, respectively, for the six months ended June 30, 2017.
NOTE 4 - FEDERAL INCOME TAXES
No provision for federal income taxes is required since the fund intends to continue to qualify as a regulated investment company under Subchapter M of the Internal Revenue Code and distribute to shareholders all of its taxable income and gains. Distributions determined in accordance with federal income tax regulations may differ in amount or character from net investment income and realized gains for financial reporting purposes. Financial reporting records are adjusted for permanent book/tax differences to reflect tax character but are not adjusted for temporary differences. The amount and character of tax-basis distributions and composition of net assets are finalized at fiscal year-end; accordingly, tax-basis balances have not been determined as of the date of this report.
The fund intends to retain realized gains to the extent of available capital loss carryforwards. Net realized capital losses may be carried forward indefinitely to offset future realized capital gains. As of December 31, 2016, the fund had $13,675,000 of available capital loss carryforwards.
At June 30, 2017, the cost of investments for federal income tax purposes was $542,649,000. Net unrealized gain aggregated $194,356,000 at period-end, of which $202,638,000 related to appreciated investments and $8,282,000 related to depreciated investments.
NOTE 5 - RELATED PARTY TRANSACTIONS
The fund is managed by T. Rowe Price Associates, Inc. (Price Associates), a wholly owned subsidiary of T. Rowe Price Group, Inc. (Price Group). The investment management agreement between the fund and Price Associates provides for an annual investment management fee, which is computed daily and paid monthly. The fee consists of an individual fund fee, equal to 0.35% of the fund’s average daily net assets, and a group fee. The group fee rate is calculated based on the combined net assets of certain mutual funds sponsored by Price Associates (the group) applied to a graduated fee schedule, with rates ranging from 0.48% for the first $1 billion of assets to 0.265% for assets in excess of $650 billion. The fund’s group fee is determined by applying the group fee rate to the fund’s average daily net assets. At June 30, 2017, the effective annual group fee rate was 0.29%.
The I Class is subject to an operating expense limitation (I Class limit) pursuant to which Price Associates is contractually required to pay all operating expenses of the I Class, excluding management fees, interest, expenses related to borrowings, taxes, brokerage, and other non-recurring expenses permitted by the investment management agreement, to the extent such operating expenses, on an annualized basis, exceed 0.05% of average net assets. This agreement will continue until April 30, 2019, and may be renewed, revised, or revoked only with approval of the fund’s Board. The I Class is required to repay Price Associates for expenses previously paid to the extent the class’s net assets grow or expenses decline sufficiently to allow repayment without causing the class’s operating expenses to exceed the I Class limit in effect at the time of the waiver. However, no repayment will be made more than three years after the date of a payment or waiver.
Pursuant to this agreement, less than $1,000 of expenses were waived/paid by Price Associates during the six months ended June 30, 2017. Including these amounts, expenses previously waived/paid by Price Associates in an amount of less than $1,000 remains subject to repayment by the fund at June 30, 2017.
In addition, the fund has entered into service agreements with Price Associates and two wholly owned subsidiaries of Price Associates (collectively, Price). Price Associates provides certain accounting and administrative services to the fund. T. Rowe Price Services, Inc. provides shareholder and administrative services in its capacity as the fund’s transfer and dividend-disbursing agent. T. Rowe Price Retirement Plan Services, Inc. provides subaccounting and recordkeeping services for certain retirement accounts invested in the Investor Class and I Class. For the six months ended June 30, 2017, expenses incurred pursuant to these service agreements were $41,000 for Price Associates; $286,000 for T. Rowe Price Services, Inc.; and $56,000 for T. Rowe Price Retirement Plan Services, Inc. The total amount payable at period-end pursuant to these service agreements is reflected as Due to Affiliates in the accompanying financial statements.
Additionally, the fund is one of several mutual funds in which certain college savings plans managed by Price Associates may invest. As approved by the fund’s Board of Directors, shareholder servicing costs associated with each college savings plan are borne by the fund in proportion to the average daily value of its shares owned by the college savings plan. For the six months ended June 30, 2017, the fund was charged $35,000 for shareholder servicing costs related to the college savings plans, of which $23,000 was for services provided by Price. The amount payable at period-end pursuant to this agreement is reflected as Due to Affiliates in the accompanying financial statements. At June 30, 2017, approximately 5% of the outstanding shares of the Investor Class were held by college savings plans.
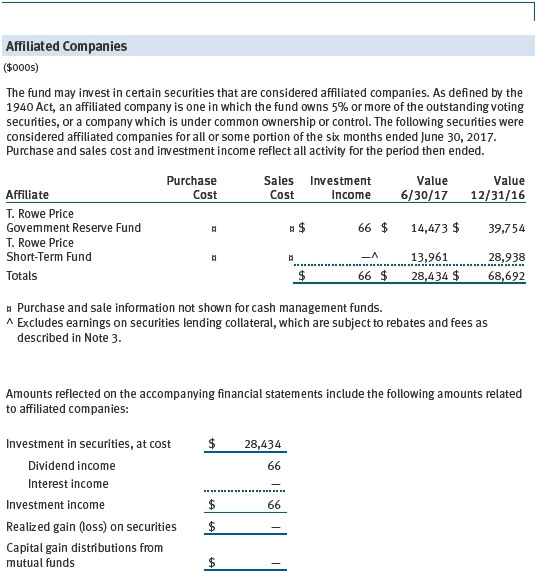
The fund may invest in the T. Rowe Price Government Reserve Fund, the T. Rowe Price Treasury Reserve Fund, or the T. Rowe Price Short-Term Fund (collectively, the Price Reserve Funds), open-end management investment companies managed by Price Associates and considered affiliates of the fund. The Price Reserve Funds are offered as short-term investment options to mutual funds, trusts, and other accounts managed by Price Associates or its affiliates and are not available for direct purchase by members of the public. The Price Reserve Funds pay no investment management fees.
As of June 30, 2017, T. Rowe Price Group, Inc., or its wholly owned subsidiaries owned 10,589 shares of the I Class, representing 55% of the I Class’s net assets.
The fund may participate in securities purchase and sale transactions with other funds or accounts advised by Price Associates (cross trades), in accordance with procedures adopted by the fund’s Board and Securities and Exchange Commission rules, which require, among other things, that such purchase and sale cross trades be effected at the independent current market price of the security. During the six months ended June 30, 2017, the aggregate value of purchases and sales cross trades with other funds or accounts advised by Price Associates was less than 1% of the fund’s net assets as of June 30, 2017.
NOTE 6 - BORROWING
To provide temporary liquidity, the fund may borrow from other T. Rowe Price-sponsored mutual funds under an interfund borrowing program developed and managed by Price Associates. The program permits the borrowing and lending of cash at rates beneficial to both the borrowing and lending funds. Pursuant to program guidelines, loans totaling 10% or more of a borrowing fund’s total assets require collateralization at 102% of the value of the loan; loans of less than 10% are unsecured. During the six months ended June 30, 2017, the fund incurred $1,000 in interest expense related to outstanding borrowings on 3 days in the average amount of $5,300,000 and at an average annual rate of 1.92%. At June 30, 2017, there were no borrowings outstanding.
| Information on Proxy Voting Policies, Procedures, and Records |
A description of the policies and procedures used by T. Rowe Price funds and portfolios to determine how to vote proxies relating to portfolio securities is available in each fund’s Statement of Additional Information. You may request this document by calling 1-800-225-5132 or by accessing the SEC’s website, sec.gov.
The description of our proxy voting policies and procedures is also available on our corporate website.
To access it, please visit the following Web page:
https://www3.troweprice.com/usis/corporate/en/utility/policies.html
Scroll down to the section near the bottom of the page that says, “Proxy Voting Policies.” Click on the Proxy Voting Policies link in the shaded box.
Each fund’s most recent annual proxy voting record is available on our website and through the SEC’s website. To access it through T. Rowe Price, visit the website location shown above, and scroll down to the section near the bottom of the page that says, “Proxy Voting Records.” Click on the Proxy Voting Records link in the shaded box.
| How to Obtain Quarterly Portfolio Holdings |
The fund files a complete schedule of portfolio holdings with the Securities and Exchange Commission for the first and third quarters of each fiscal year on Form N-Q. The fund’s Form N-Q is available electronically on the SEC’s website (sec.gov); hard copies may be reviewed and copied at the SEC’s Public Reference Room, 100 F St. N.E., Washington, DC 20549. For more information on the Public Reference Room, call 1-800-SEC-0330.
| Approval of Investment Management Agreement |
Each year, the fund’s Board of Directors (Board) considers the continuation of the investment management agreement (Advisory Contract) between the fund and its investment advisor, T. Rowe Price Associates, Inc. (Advisor). In that regard, at an in-person meeting held on March 6–7, 2017 (Meeting), the Board, including a majority of the fund’s independent directors, approved the continuation of the fund’s Advisory Contract. At the Meeting, the Board considered the factors and reached the conclusions described below relating to the selection of the Advisor and the approval of the Advisory Contract. The independent directors were assisted in their evaluation of the Advisory Contract by independent legal counsel, from whom they received separate legal advice and with whom they met separately.
In providing information to the Board, the Advisor was guided by a detailed set of requests for information submitted by independent legal counsel on behalf of the independent directors. In considering and approving the Advisory Contract, the Board considered the information it believed was relevant, including, but not limited to, the information discussed below. The Board considered not only the specific information presented in connection with the Meeting but also the knowledge gained over time through interaction with the Advisor about various topics. The Board meets regularly and, at each of its meetings, covers an extensive agenda of topics and materials and considers factors that are relevant to its annual consideration of the renewal of the T. Rowe Price funds’ advisory contracts, including performance and the services and support provided to the funds and their shareholders.
Services Provided by the Advisor
The Board considered the nature, quality, and extent of the services provided to the fund by the Advisor. These services included, but were not limited to, directing the fund’s investments in accordance with its investment program and the overall management of the fund’s portfolio, as well as a variety of related activities such as financial, investment operations, and administrative services; compliance; maintaining the fund’s records and registrations; and shareholder communications. The Board also reviewed the background and experience of the Advisor’s senior management team and investment personnel involved in the management of the fund, as well as the Advisor’s compliance record. The Board concluded that it was satisfied with the nature, quality, and extent of the services provided by the Advisor.
Investment Performance of the Fund
The Board took into account discussions with the Advisor and reports that it receives throughout the year relating to fund performance. In connection with the Meeting, the Board reviewed the fund’s net annualized total returns for the 1-, 2-, 3-, 4-, 5-, and 10-year periods as of September 30, 2016, and compared these returns with the performance of a peer group of funds with similar investment programs and a wide variety of other previously agreed-upon comparable performance measures and market data, including those supplied by Broadridge, which is an independent provider of mutual fund data.
On the basis of this evaluation and the Board’s ongoing review of investment results and factoring in the relative market conditions during certain of the performance periods, the Board concluded that the fund’s performance was satisfactory.
Costs, Benefits, Profits, and Economies of Scale
The Board reviewed detailed information regarding the revenues received by the Advisor under the Advisory Contract and other benefits that the Advisor (and its affiliates) may have realized from its relationship with the fund, including any research received under “soft dollar” agreements and commission-sharing arrangements with broker-dealers. The Board considered that the Advisor may receive some benefit from soft-dollar arrangements pursuant to which research is received from broker-dealers that execute the fund’s portfolio transactions. The Board received information on the estimated costs incurred and profits realized by the Advisor from managing the T. Rowe Price funds. The Board also reviewed estimates of the profits realized from managing the fund in particular, and the Board concluded that the Advisor’s profits were reasonable in light of the services provided to the fund.
The Board also considered whether the fund benefits under the fee levels set forth in the Advisory Contract from any economies of scale realized by the Advisor. Under the Advisory Contract, the fund pays a fee to the Advisor for investment management services composed of two components—a group fee rate based on the combined average net assets of most of the T. Rowe Price funds (including the fund) that declines at certain asset levels and an individual fund fee rate based on the fund’s average daily net assets—and the fund pays its own expenses of operations (subject to an expense limitation agreed to by the Advisor with respect to the fund’s I Class). At the Meeting, the Board approved an additional 0.005% breakpoint to the group fee schedule, effective May 1, 2017. With the new breakpoint, the group fee rate will decline to 0.265% when the combined average net assets of the applicable T. Rowe Price funds exceed $650 billion. The Board concluded that the advisory fee structure for the fund continued to provide for a reasonable sharing of benefits from any economies of scale with the fund’s investors.
Fees and Expenses
The Board was provided with information regarding industry trends in management fees and expenses. Among other things, the Board reviewed data for peer groups that were compiled by Broadridge, which compared: (i) contractual management fees, total expenses, actual management fees, and nonmanagement expenses of the Investor Class of the fund with a group of competitor funds selected by Broadridge (Expense Group) and (ii) total expenses, actual management fees, and nonmanagement expenses of the Investor Class of the fund with a broader set of funds within the Lipper investment classification (Expense Universe). The Board considered the fund’s contractual management fee rate, actual management fee rate (which reflects the management fees actually received from the fund by the Advisor after any applicable waivers, reductions, or reimbursements), operating expenses, and total expenses (which reflect the net total expense ratio of the fund after any waivers, reductions, or reimbursements) in comparison with the information for the Broadridge peer groups. Broadridge generally constructed the peer groups by seeking the most comparable funds based on similar investment classifications and objectives, expense structure, asset size, and operating components and attributes and ranked funds into quintiles, with the first quintile representing the funds with the lowest relative expenses and the fifth quintile representing the funds with the highest relative expenses. The information provided to the Board indicated that the fund’s contractual management fee ranked in the second quintile (Expense Group), the fund’s actual management fee rate ranked in the second quintile (Expense Group) and third quintile (Expense Universe), and the fund’s total expenses ranked in the first and second quintiles (Expense Group and Expense Universe).
The Board also reviewed the fee schedules for institutional accounts and private accounts with similar mandates that are advised or subadvised by the Advisor and its affiliates. Management provided the Board with information about the Advisor’s responsibilities and services provided to subadvisory and other institutional account clients, including information about how the requirements and economics of the institutional business are fundamentally different from those of the mutual fund business. The Board considered information showing that the Advisor’s mutual fund business is generally more complex from a business and compliance perspective than its institutional account business and considered various relevant factors, such as the broader scope of operations and oversight, more extensive shareholder communication infrastructure, greater asset flows, heightened business risks, and differences in applicable laws and regulations associated with the Advisor’s proprietary mutual fund business. In assessing the reasonableness of the fund’s management fee rate, the Board considered the differences in the nature of the services required for the Advisor to manage its mutual fund business versus managing a discrete pool of assets as a subadvisor to another institution’s mutual fund or for an institutional account and that the Advisor generally performs significant additional services and assumes greater risk in managing the fund and other T. Rowe Price funds than it does for institutional account clients.
On the basis of the information provided and the factors considered, the Board concluded that the fees paid by the fund under the Advisory Contract are reasonable.
Approval of the Advisory Contract
As noted, the Board approved the continuation of the Advisory Contract. No single factor was considered in isolation or to be determinative to the decision. Rather, the Board concluded, in light of a weighting and balancing of all factors considered, that it was in the best interests of the fund and its shareholders for the Board to approve the continuation of the Advisory Contract (including the fees to be charged for services thereunder).
Item 2. Code of Ethics.
A code of ethics, as defined in Item 2 of Form N-CSR, applicable to its principal executive officer, principal financial officer, principal accounting officer or controller, or persons performing similar functions is filed as an exhibit to the registrant’s annual Form N-CSR. No substantive amendments were approved or waivers were granted to this code of ethics during the registrant’s most recent fiscal half-year.
Item 3. Audit Committee Financial Expert.
Disclosure required in registrant’s annual Form N-CSR.
Item 4. Principal Accountant Fees and Services.
Disclosure required in registrant’s annual Form N-CSR.
Item 5. Audit Committee of Listed Registrants.
Not applicable.
Item 6. Investments.
(a) Not applicable. The complete schedule of investments is included in Item 1 of this Form N-CSR.
(b) Not applicable.
Item 7. Disclosure of Proxy Voting Policies and Procedures for Closed-End Management Investment Companies.
Not applicable.
Item 8. Portfolio Managers of Closed-End Management Investment Companies.
Not applicable.
Item 9. Purchases of Equity Securities by Closed-End Management Investment Company and Affiliated Purchasers.
Not applicable.
Item 10. Submission of Matters to a Vote of Security Holders.
Not applicable.
Item 11. Controls and Procedures.
(a) The registrant’s principal executive officer and principal financial officer have evaluated the registrant’s disclosure controls and procedures within 90 days of this filing and have concluded that the registrant’s disclosure controls and procedures were effective, as of that date, in ensuring that information required to be disclosed by the registrant in this Form N-CSR was recorded, processed, summarized, and reported timely.
(b) The registrant’s principal executive officer and principal financial officer are aware of no change in the registrant’s internal control over financial reporting that occurred during the registrant’s second fiscal quarter covered by this report that has materially affected, or is reasonably likely to materially affect, the registrant’s internal control over financial reporting.
Item 12. Exhibits.
(a)(1) The registrant’s code of ethics pursuant to Item 2 of Form N-CSR is filed with the registrant’s annual Form N-CSR.
(2) Separate certifications by the registrant's principal executive officer and principal financial officer, pursuant to Section 302 of the Sarbanes-Oxley Act of 2002 and required by Rule 30a-2(a) under the Investment Company Act of 1940, are attached.
(3) Written solicitation to repurchase securities issued by closed-end companies: not applicable.
(b) A certification by the registrant's principal executive officer and principal financial officer, pursuant to Section 906 of the Sarbanes-Oxley Act of 2002 and required by Rule 30a-2(b) under the Investment Company Act of 1940, is attached.
SIGNATURES
Pursuant to the requirements of the Securities Exchange Act of 1934 and the Investment Company Act of 1940, the registrant has duly caused this report to be signed on its behalf by the undersigned, thereunto duly authorized.
T. Rowe Price Financial Services Fund, Inc.
| By | | /s/ Edward C. Bernard |
| | | Edward C. Bernard |
| | | Principal Executive Officer |
| |
| Date | | August 17, 2017 | | | | |
Pursuant to the requirements of the Securities Exchange Act of 1934 and the Investment Company Act of 1940, this report has been signed below by the following persons on behalf of the registrant and in the capacities and on the dates indicated.
| By | | /s/ Edward C. Bernard |
| | | Edward C. Bernard |
| | | Principal Executive Officer |
| |
| Date | | August 17, 2017 | | | | |
| |
| |
| By | | /s/ Catherine D. Mathews |
| | | Catherine D. Mathews |
| | | Principal Financial Officer |
| |
| Date | | August 17, 2017 | | | | |