UNITED STATES
SECURITIES AND EXCHANGE COMMISSION
Washington, D.C. 20549
FORM N-CSR
CERTIFIED SHAREHOLDER REPORT OF REGISTERED
MANAGEMENT INVESTMENT COMPANIES
Investment Company Act File Number: 811-07749
| T. Rowe Price Financial Services Fund, Inc. |
|
| (Exact name of registrant as specified in charter) |
| |
| 100 East Pratt Street, Baltimore, MD 21202 |
|
| (Address of principal executive offices) |
| |
| David Oestreicher |
| 100 East Pratt Street, Baltimore, MD 21202 |
|
| (Name and address of agent for service) |
Registrant’s telephone number, including area code: (410) 345-2000
Date of fiscal year end: December 31
Date of reporting period: December 31, 2021
Item 1. Reports to Shareholders
(a) Report pursuant to Rule 30e-1.
| Financial Services Fund | December 31, 2021 |
| PRISX | Investor Class |
| TFIFX | I Class |
| T. ROWE PRICE FINANCIAL SERVICES FUND |
|
HIGHLIGHTS
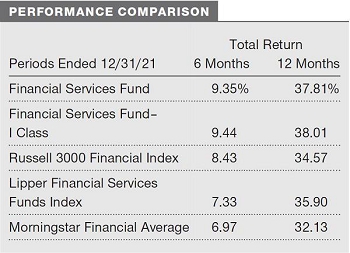
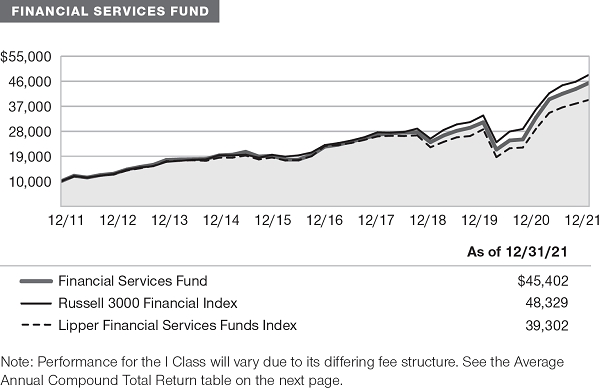
| ■ | Stocks of financial services companies produced robust returns in 2021, as the U.S. economy reopened and recovered. Your fund outperformed the benchmark Russell 3000 Financial Index, the Lipper peer group index, and the Morningstar Financial Average. |
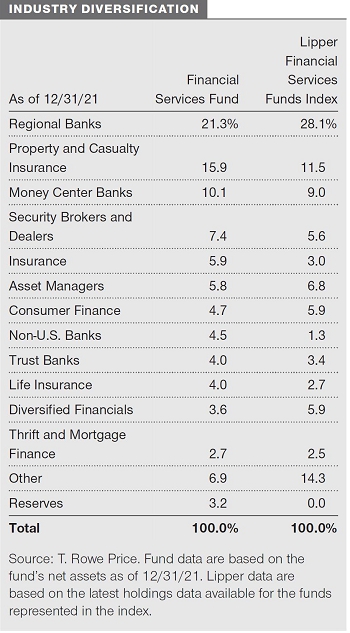
| ■ | Regional banks, money center banks, insurers, and capital markets companies were some of the top contributors to absolute fund performance. |
| ■ | Since mid-2021, we reduced exposure to regional banks and life insurance companies but continued to favor property and casualty insurers. We added to our stake in Goldman Sachs, which is building out its consumer banking and asset and wealth management businesses, and in Capital One Financial, which could benefit from an acceleration of consumer loan growth. |
| ■ | While we believe that the long-term fundamental backdrop for the financials sector is still positive, we have become incrementally more cautious toward the economy and toward various financial services industries, as valuations have increased and the economic recovery that many stocks have priced in may not be as robust as expected. |
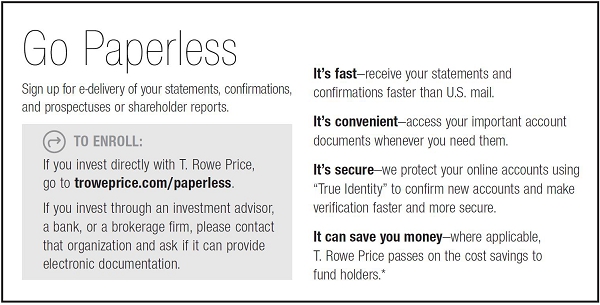
Log in to your account at troweprice.com for more information.
*Certain mutual fund accounts that are assessed an annual account service fee can also save money by switching to e-delivery.
Market Commentary
Dear Shareholder
Major stock and bond indexes produced mixed results during 2021 as strong corporate earnings growth and a recovering economy contended with worries about inflation, new coronavirus variants, and less accommodative central banks. Most developed market stock benchmarks finished the year with positive returns, although gains slowed in the second half of the year, while fixed income returns faced headwinds from rising interest rates.
Large-cap U.S. growth stocks delivered the strongest returns, but solid results were common in many developed markets. However, emerging markets stock benchmarks struggled amid a significant equity market downturn in China.
The large-cap S&P 500 Index returned almost 29%, marking its third straight year of positive returns. Robust results were widespread across the benchmark—according to Bloomberg data, 2021 marked the first year that all of the S&P 500 sectors recorded double-digit gains. The energy sector, which was the worst performer in 2020, was the leader in 2021 amid a sharp increase in oil prices, and real estate stocks also rebounded from a down year as strong demand led to rising rents. Financial and information technology stocks also produced excellent returns and outperformed the broad market.
In the fixed income market, rising Treasury yields weighed on performance, but below investment-grade corporate bonds delivered solid results as they benefited from improving fundamentals and investor demand for higher-yielding securities. (Bond prices and yields move in opposite directions.)
A robust increase in corporate earnings growth appeared to be a significant performance driver during the year. According to FactSet, overall earnings for the S&P 500 rose 89% in the second quarter of 2021 versus the year before, the fastest pace since 2009, and while third-quarter earnings slowed, they continued to beat expectations at an impressive pace. Despite the significant rally in the S&P 500 during 2021, the index’s price/earnings ratio actually fell over that period as earnings rose faster than stock prices. Although economic growth showed signs of slowing at times, data remained generally positive through the end of the period. The unemployment rate, which started the year at 6.7%, fell to 3.9% by December, and job openings reached a record high.
However, optimism surrounding strong earnings and employment gains was tempered by inflation concerns. Prices surged as the release of pent-up demand and supply chain disruptions contributed to higher inflation around the globe. In the U.S., the 6.8% increase in the consumer price index for the 12-month period ended in November was the highest level since 1982, a factor that may have contributed to a decline in consumer sentiment late in the year.
Meanwhile, central banks began to move away from the extremely accommodative policies they instituted in response to the initial wave of the coronavirus. The Federal Reserve began trimming its purchases of Treasuries and agency mortgage-backed securities in November, and policymakers indicated that they could soon start raising short-term interest rates.
How markets respond to the normalization of monetary policy is an open question. While fading stimulus might pose some challenges for investors, I believe it could contribute to a return of price sensitivity in global markets, which bodes well for selective investors focused on fundamentals.
Elevated valuations, higher inflation, and the continuing struggle to control the pandemic also pose potential challenges for financial markets in 2022. However, on the positive side, household wealth gains, pent-up consumer demand, and a potential boom in capital expenditures could sustain growth even as monetary policy turns less supportive. In this environment, our investment teams will remain focused on using fundamental research to identify companies that can add value to your portfolio over the long term.
Thank you for your continued confidence in T. Rowe Price.
Sincerely,

Robert Sharps
President and CEO
Management’s Discussion of Fund Performance
INVESTMENT OBJECTIVE
The fund seeks long-term growth of capital and a modest level of income.
FUND COMMENTARY
How did the fund perform in the past 12 months?
Stocks of financial services companies produced robust returns in 2021, as the U.S. economy reopened and recovered despite the continuation of the coronavirus pandemic. Banks were especially strong, as rising U.S. Treasury interest rates raises the likelihood for improved profitability from lending. Late in the year, the Federal Reserve began to taper its monthly asset purchases—a possible prelude to short-term interest rate increases that could commence sometime in 2022.
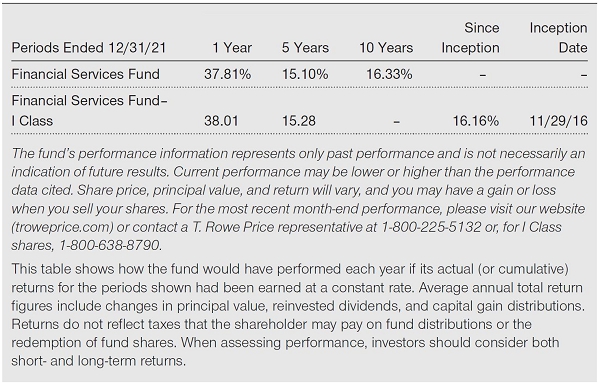
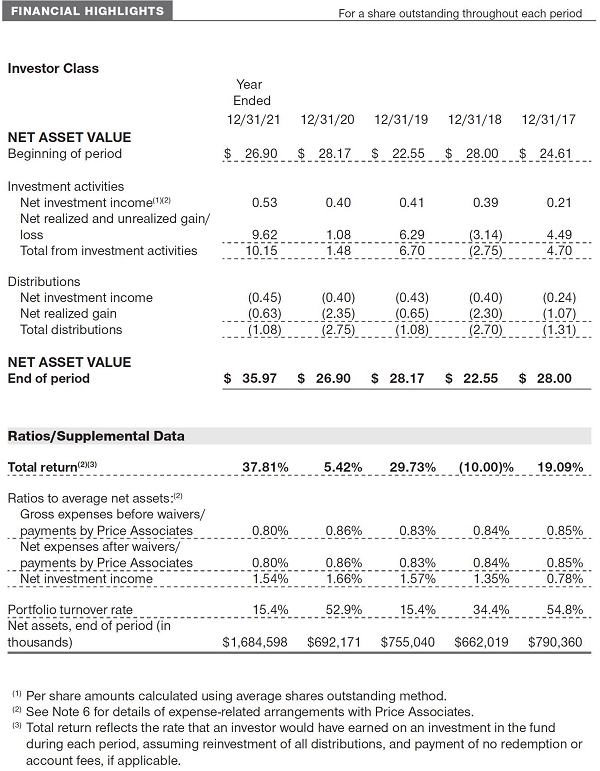
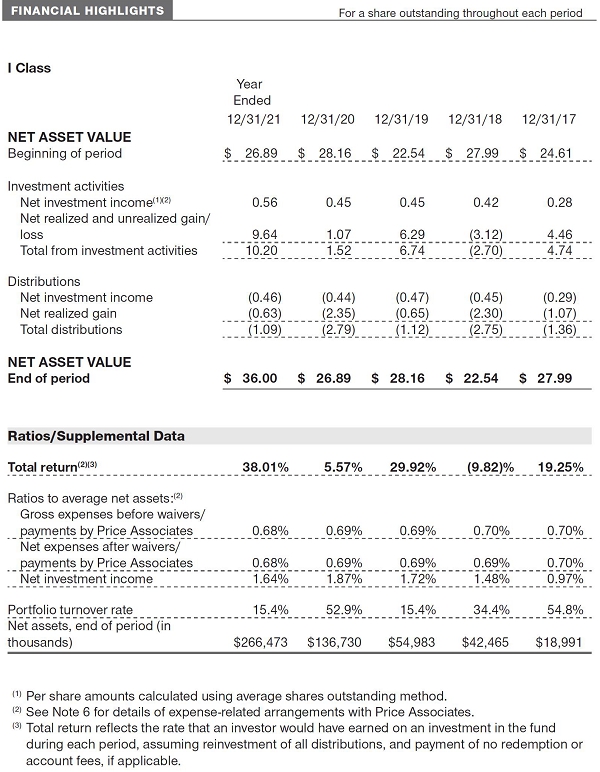
Your fund returned 37.81% in 2021 and outperformed the benchmark Russell 3000 Financial Index, the Lipper peer group index, and the Morningstar Financial Average. Because the Russell benchmark is highly concentrated in large financial companies, we believe that the Lipper index and the Morningstar average are better representations of our opportunity set. (Returns for I Class shares will vary, reflecting their different fee structure. Past performance cannot guarantee future results.)
What factors influenced the fund’s performance?
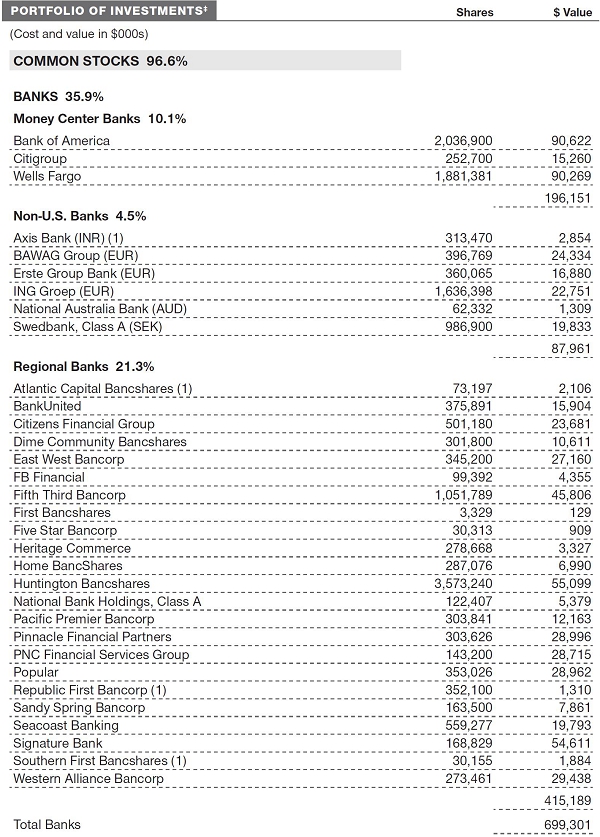
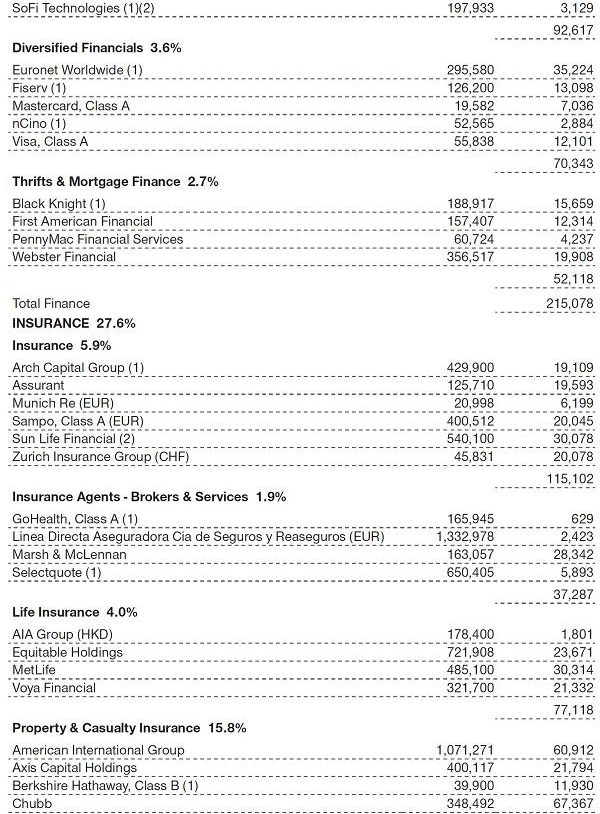
Regional banks were among our largest absolute contributors to performance in 2021; we also made good stock choices relative to competing portfolios. Shares of Signature Bank, which operates in the New York metropolitan area but is increasing its business on the West Coast, advanced as the banking services it provides to cryptocurrency investors are contributing to vigorous deposit growth. Signature is also benefiting from strength in its specialized mortgage and venture capital businesses. Fifth Third Bancorp, an Ohio-based bank operating primarily in the Midwest, performed well, as the company is increasing its fee income, managing expenses well, and using its increased expertise in corporate banking to win new commercial business. Shares of Western Alliance Bancorp, which operates in California, Nevada, and Arizona, extended their first-half gains, lifted in part by growth among residential mortgage loans as well as commercial and industrial loans. (Please refer to the portfolio of investments for a complete list of holdings and the amount each represents in the portfolio.)
Our investments in larger banking entities called money center banks were also significant performance contributors in absolute terms and relative to our peers. Wells Fargo, whose balance sheet growth continues to be hindered by a punitive asset cap imposed by the Federal Reserve almost four years ago, was actually a top contributor to fund performance. We believe that Wells Fargo’s banking and wealth management businesses have greater potential to contribute to the company’s earnings and that the company could benefit significantly not only from rising interest rates, but also from continued cost-cutting as well as the eventual removal of the asset cap. Shares of Bank of America advanced in anticipation of stronger consumer loan growth and rising interest rates; its capital markets and wealth management businesses have also benefited from market conditions. We believe that the combination of its low-cost, retail deposit franchise; scaled consumer banking franchise—including credit cards—and advanced consumer-facing technology gives Bank of America some meaningful long-term advantages over its peers.
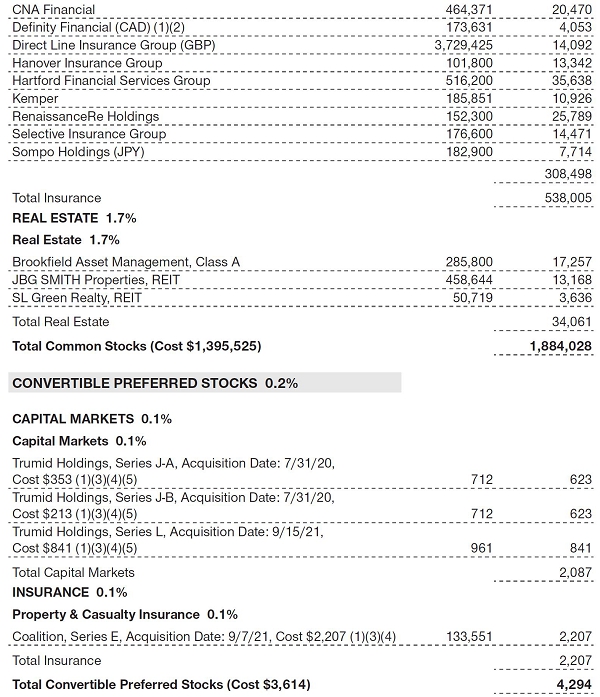
Insurance companies, especially property and casualty (P&C) insurers, were also important absolute contributors to performance, though our industry overweight hurt results versus Lipper. The P&C industry, which sells insurance to businesses, typically has long up cycles; we are currently more than four years into an up cycle, and it is likely to continue for at least another year or two amid rising catastrophe costs and generally higher cost inflation. Industry bellwethers American International Group (AIG) and Switzerland-based global insurer Chubb were top contributors, driven by rising earnings and return on equity. On the other hand, shares of Bermuda-based RenaissanceRe Holdings—a “reinsurance” company that provides insurance to insurance companies—struggled in 2021 as the company suffered significant losses from disasters such as U.S. hurricanes and flooding in Germany. However, we think that the company has the balance sheet strength and other favorable attributes to rebound from these losses and benefit from higher P&C insurance pricing and improving loss ratios. The company may also choose to use its abundant excess capital to increasingly repurchase its shares.
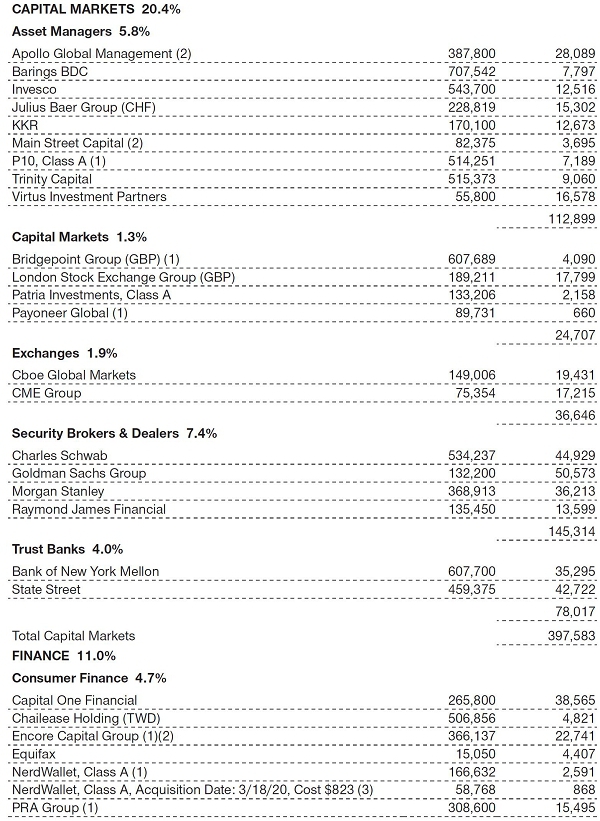
Capital markets companies were solid contributors, beneficiaries of robust financial market performance. Security brokers and dealers Charles Schwab and Morgan Stanley were especially strong. Schwab, which is the premier discount brokerage firm, benefited from rising equity markets, elevated trading activity, a growing customer base, and expectations for higher interest rates. Morgan Stanley, a traditional Wall Street investment bank that has built up a wealth and asset management business, was propelled by strong earnings in a highly active capital markets environment with a rising equity market backdrop.
Other strong contributors included asset managers, such as Apollo Global Management and private-equity manager KKR. State Street and Bank of New York Mellon—which hold large amounts of cash for institutions on a short-term basis and earn interest on it—also did well, as investors anticipated that their earnings will be boosted by rising short-term interest rates. We added to our stakes in these two trust banks in the second half of 2021.
How is the portfolio positioned?
Over the last six months, we reduced our exposure to regional banks by eliminating small positions in Allegiance Bancshares, Cadence Bancorp, and Spirit of Texas Bancshares, among others. Their upside potential didn’t seem compelling given broad expectations for rising rates. However, we maintained sizable stakes in Huntington Bancshares, Fifth Third Bancorp, and Popular, in which we have greater long-term conviction.
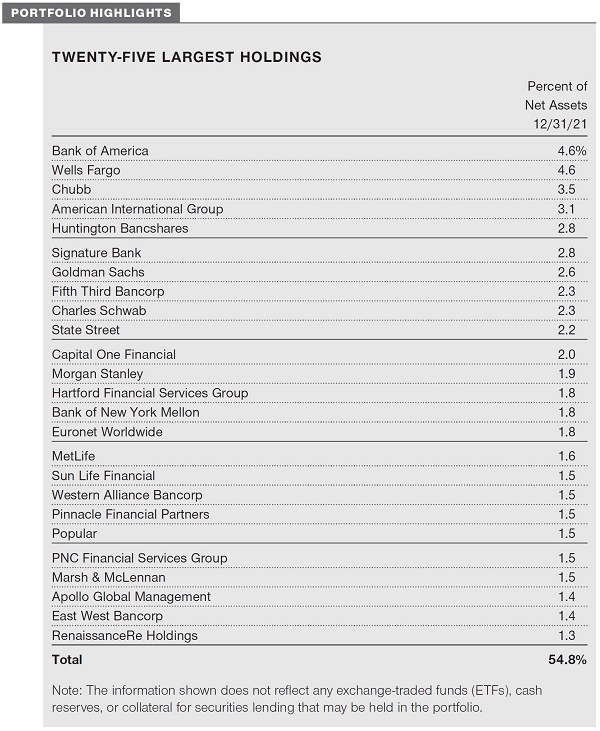
Our two largest positions in the portfolio at year-end, as shown in the Twenty-Five Largest Holdings table on page 9, were Bank of America and Wells Fargo. In the second half of the year, we established a position in Citigroup, which has underperformed for some time and trades at an attractive valuation versus its money center banking peers. We believe that Citigroup’s domestic credit card business gives the company reasonably good exposure to U.S. consumer strength. We are also encouraged that the new CEO recognizes the need to reduce enterprise risk and the complexity of the business—for example, by selling a number of Asian assets and focusing on its global institutional business. As the company increases its earnings, and if it uses its excess capital to repurchase discounted shares, we believe its valuation will increase.
In the insurance space, we reduced our exposure to life insurers by eliminating Aviva PLC and Prudential PLC and trimming MetLife. We also eliminated small stakes in P&C insurers State Auto Financial, ProAssurance, and Safety Insurance Group. However, we increased our holdings in AIG and RenaissanceRe Holdings, as we believe these industry leaders will continue to benefit from the P&C pricing up cycle. We also added Berkshire Hathaway and Definity Financial to the portfolio. The former is a conglomerate that owns stakes in a number of companies, including insurer GEICO and some other financial entities. The latter is a Canadian non-life insurance company that we believe has an attractive risk/reward trade-off and should benefit from a consolidating industry.
Elsewhere in the portfolio, we established stakes in asset manager Invesco and Swiss asset manager Julius Baer. Among security brokers and dealers, we eliminated Lazard and sold some shares of Morgan Stanley, but we significantly increased our stake in Goldman Sachs. The company, which is shifting away from traditional investment banking, like Morgan Stanley, enjoyed strong revenue and earnings growth in 2021. While its capital markets business remains strong, we believe investors continue to underappreciate Goldman’s opportunities and earnings potential as it builds out its consumer banking, private-equity, and asset and wealth management businesses.
In the consumer finance segment, we eliminated SLM Corporation (Sallie Mae) and trimmed credit bureau Equifax. However, we added to our stake in Capital One Financial, a consumer finance company that has not only a credit card business, but also a consumer banking business—primarily auto loans—and commercial banking operations. We believe that the strong consumer environment will last longer than many expect and that Capital One is poised to benefit from an acceleration of consumer loan growth.
Several of the fund’s holdings represent the so-called financial technology (fintech) space, which is currently dominated by companies involved in processing electronic payments, such as Visa and Mastercard. After a period of excellent stock performance, shares of these and some upstart companies experienced a sharp pullback in the latter part of 2021, as macroeconomic events prompted investors to reconsider the high valuations of these high-growth names. While the trend toward electronic payments (and away from cash and checks) will undoubtedly continue, we expect to de-emphasize the fintech space going forward. However, we are looking for value among the names that have fallen sharply in recent months.
What is portfolio management’s outlook?
At present, the economy seems to be in good shape, supported by continued low interest rates. Consumer activity is also in good shape, as spending levels have been strong and bank account balances have remained elevated, thanks in part to the government’s stimulus payments and increasing wages in a very strong jobs market. In terms of credit, consumers and corporations have been deleveraging (i.e., paying down debts) during the pandemic, while banks—both commercial and consumer—are healthy, with fairly low credit losses. We believe that, as consumers begin to spend some of their excess liquidity, loan growth will begin to accelerate and drive up valuations of companies like Capital One.
While we believe that the long-term fundamental backdrop for the financials sector is still positive, we have become incrementally more cautious toward the economy and toward various financial services industries, as valuations have increased and the economic recovery that many stocks have priced in may not be as robust as expected. From a macro standpoint, elevated inflation and the beginning of Fed rate hikes later this year have the potential to slow the economy. If the economy decelerates and the Treasury yield curve flattens (i.e., the difference between short-term and long-term yields decreases), there could be a material impact on some financial companies that rely on a wider difference between short- and long-term rates.
No matter how the economy evolves, we remain committed to seeking the best risk/reward trade-offs among financials and other businesses that serve the sector. We will continue to use our fundamental, proprietary research to assess the long-term opportunity and risk profile of each investment candidate. We’ve also built a small cash position to take advantage of opportunities to buy attractive companies when they become available at cheaper valuations.
The views expressed reflect the opinions of T. Rowe Price as of the date of this report and are subject to change based on changes in market, economic, or other conditions. These views are not intended to be a forecast of future events and are no guarantee of future results.
RISKS OF INVESTING IN THE FINANCIAL SERVICES FUND
Stocks generally fluctuate in value more than bonds and may decline significantly over short time periods. There is a chance that stock prices overall will decline because stock markets tend to move in cycles, with periods of rising and falling prices. The value of stocks held by the fund may decline due to general weakness or volatility in the stock markets in which the fund invests or because of factors that affect a particular company or industry.
A fund that focuses its investments in specific industries or sectors is more susceptible to adverse developments affecting those industries and sectors than a more broadly diversified fund. Because the fund invests significantly in financial services companies, the fund may perform poorly during a downturn in the financial services industry. Financial services companies can be adversely affected by, among other things, regulatory changes, the availability of capital and cost to borrow, the rate of debt defaults, interest rate movements, and price competition.
Investments in the securities of non-U.S. issuers may be adversely affected by local, political, social, and economic conditions overseas; greater volatility; reduced liquidity; or decreases in foreign currency values relative to the U.S. dollar. The risks of investing outside the U.S. are heightened for any investments in emerging markets, which are susceptible to greater volatility than investments in developed markets.
BENCHMARK INFORMATION
Note: Lipper, a Thomson Reuters Company, is the source for all Lipper content reflected in these materials. Copyright 2022 © Refinitiv. All rights reserved. Any copying, republication or redistribution of Lipper content is expressly prohibited without the prior written consent of Lipper. Lipper shall not be liable for any errors or delays in the content, or for any actions taken in reliance thereon.
Note: ©2022 Morningstar, Inc. All rights reserved. The information contained herein: (1) is proprietary to Morningstar and/or its content providers; (2) may not be copied or distributed; and (3) is not warranted to be accurate, complete, or timely. Neither Morningstar nor its content providers are responsible for any damages or losses arising from any use of this information. Past performance is no guarantee of future results.
Note: Frank Russell Company (Russell) is the source and owner of the Russell index data contained or reflected in these materials and all trademarks and copyrights related thereto. Russell® is a registered trademark of Russell. Russell is not responsible for the formatting or configuration of these materials or for any inaccuracy in T. Rowe Price Associates’ presentation thereof.
GROWTH OF $10,000
This chart shows the value of a hypothetical $10,000 investment in the fund over the past 10 fiscal year periods or since inception (for funds lacking 10-year records). The result is compared with benchmarks, which include a broad-based market index and may also include a peer group average or index. Market indexes do not include expenses, which are deducted from fund returns as well as mutual fund averages and indexes.
AVERAGE ANNUAL COMPOUND TOTAL RETURN
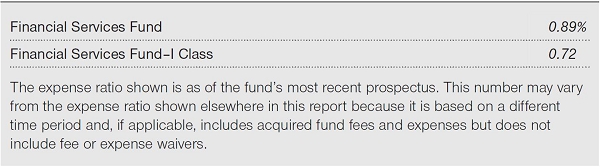
EXPENSE RATIO
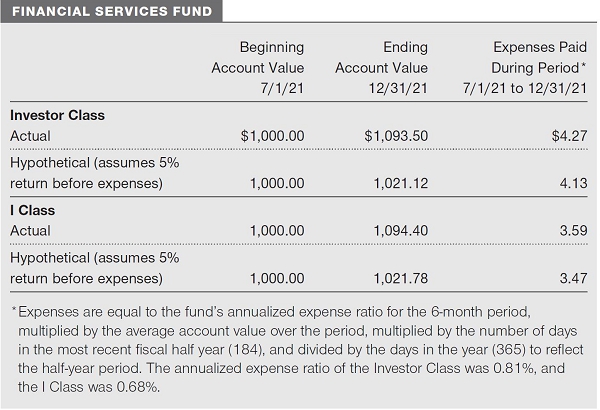
FUND EXPENSE EXAMPLE
As a mutual fund shareholder, you may incur two types of costs: (1) transaction costs, such as redemption fees or sales loads, and (2) ongoing costs, including management fees, distribution and service (12b-1) fees, and other fund expenses. The following example is intended to help you understand your ongoing costs (in dollars) of investing in the fund and to compare these costs with the ongoing costs of investing in other mutual funds. The example is based on an investment of $1,000 invested at the beginning of the most recent six-month period and held for the entire period.
Please note that the fund has two share classes: The original share class (Investor Class) charges no distribution and service (12b-1) fee, and the I Class shares are also available to institutionally oriented clients and impose no 12b-1 or administrative fee payment. Each share class is presented separately in the table.
Actual Expenses
The first line of the following table (Actual) provides information about actual account values and expenses based on the fund’s actual returns. You may use the information on this line, together with your account balance, to estimate the expenses that you paid over the period. Simply divide your account value by $1,000 (for example, an $8,600 account value divided by $1,000 = 8.6), then multiply the result by the number on the first line under the heading “Expenses Paid During Period” to estimate the expenses you paid on your account during this period.
Hypothetical Example for Comparison Purposes
The information on the second line of the table (Hypothetical) is based on hypothetical account values and expenses derived from the fund’s actual expense ratio and an assumed 5% per year rate of return before expenses (not the fund’s actual return). You may compare the ongoing costs of investing in the fund with other funds by contrasting this 5% hypothetical example and the 5% hypothetical examples that appear in the shareholder reports of the other funds. The hypothetical account values and expenses may not be used to estimate the actual ending account balance or expenses you paid for the period.
Note: T. Rowe Price charges an annual account service fee of $20, generally for accounts with less than $10,000. The fee is waived for any investor whose T. Rowe Price mutual fund accounts total $50,000 or more; accounts electing to receive electronic delivery of account statements, transaction confirmations, prospectuses, and shareholder reports; or accounts of an investor who is a T. Rowe Price Personal Services or Enhanced Personal Services client (enrollment in these programs generally requires T. Rowe Price assets of at least $250,000). This fee is not included in the accompanying table. If you are subject to the fee, keep it in mind when you are estimating the ongoing expenses of investing in the fund and when comparing the expenses of this fund with other funds.
You should also be aware that the expenses shown in the table highlight only your ongoing costs and do not reflect any transaction costs, such as redemption fees or sales loads. Therefore, the second line of the table is useful in comparing ongoing costs only and will not help you determine the relative total costs of owning different funds. To the extent a fund charges transaction costs, however, the total cost of owning that fund is higher.
The accompanying notes are an integral part of these financial statements.
The accompanying notes are an integral part of these financial statements.
December 31, 2021
The accompanying notes are an integral part of these financial statements.
December 31, 2021

The accompanying notes are an integral part of these financial statements.

The accompanying notes are an integral part of these financial statements.
The accompanying notes are an integral part of these financial statements.
| NOTES TO FINANCIAL STATEMENTS |
T. Rowe Price Financial Services Fund, Inc. (the fund) is registered under the Investment Company Act of 1940 (the 1940 Act) as an open-end management investment company. During the reporting period, the fund’s classification changed from nondiversified to diversified. The fund seeks long-term growth of capital and a modest level of income. The fund has two classes of shares: the Financial Services Fund (Investor Class) and the Financial Services Fund–I Class (I Class). I Class shares require a $500,000 initial investment minimum, although the minimum generally is waived or reduced for financial intermediaries, eligible retirement plans, and certain other accounts. Prior to November 15, 2021, the initial investment minimum was $1 million and was generally waived for financial intermediaries, eligible retirement plans, and other certain accounts. Each class has exclusive voting rights on matters related solely to that class; separate voting rights on matters that relate to both classes; and, in all other respects, the same rights and obligations as the other class.
NOTE 1 - SIGNIFICANT ACCOUNTING POLICIES
Basis of Preparation The fund is an investment company and follows accounting and reporting guidance in the Financial Accounting Standards Board (FASB) Accounting Standards Codification Topic 946 (ASC 946). The accompanying financial statements were prepared in accordance with accounting principles generally accepted in the United States of America (GAAP), including, but not limited to, ASC 946. GAAP requires the use of estimates made by management. Management believes that estimates and valuations are appropriate; however, actual results may differ from those estimates, and the valuations reflected in the accompanying financial statements may differ from the value ultimately realized upon sale or maturity.
Investment Transactions, Investment Income, and Distributions Investment transactions are accounted for on the trade date basis. Income and expenses are recorded on the accrual basis. Realized gains and losses are reported on the identified cost basis. Income tax-related interest and penalties, if incurred, are recorded as income tax expense. Dividends received from mutual fund investments are reflected as dividend income; capital gain distributions are reflected as realized gain/loss. Dividend income and capital gain distributions are recorded on the ex-dividend date. Distributions from REITs are initially recorded as dividend income and, to the extent such represent a return of capital or capital gain for tax purposes, are reclassified when such information becomes available. Non-cash dividends, if any, are recorded at the fair market value of the asset received. Distributions to shareholders are recorded on the ex-dividend date. Income distributions, if any, are declared and paid by each class annually. A capital gain distribution may also be declared and paid by the fund annually.
Currency Translation Assets, including investments, and liabilities denominated in foreign currencies are translated into U.S. dollar values each day at the prevailing exchange rate, using the mean of the bid and asked prices of such currencies against U.S. dollars as provided by an outside pricing service. Purchases and sales of securities, income, and expenses are translated into U.S. dollars at the prevailing exchange rate on the respective date of such transaction. The effect of changes in foreign currency exchange rates on realized and unrealized security gains and losses is not bifurcated from the portion attributable to changes in market prices.
Class Accounting Shareholder servicing, prospectus, and shareholder report expenses incurred by each class are charged directly to the class to which they relate. Expenses common to all classes, investment income, and realized and unrealized gains and losses are allocated to the classes based upon the relative daily net assets of each class.
Capital Transactions Each investor’s interest in the net assets of the fund is represented by fund shares. The fund’s net asset value (NAV) per share is computed at the close of the New York Stock Exchange (NYSE), normally 4 p.m. ET, each day the NYSE is open for business. However, the NAV per share may be calculated at a time other than the normal close of the NYSE if trading on the NYSE is restricted, if the NYSE closes earlier, or as may be permitted by the SEC. Purchases and redemptions of fund shares are transacted at the next-computed NAV per share, after receipt of the transaction order by T. Rowe Price Associates, Inc., or its agents.
Indemnification In the normal course of business, the fund may provide indemnification in connection with its officers and directors, service providers, and/or private company investments. The fund’s maximum exposure under these arrangements is unknown; however, the risk of material loss is currently considered to be remote.
NOTE 2 - VALUATION
Fair Value The fund’s financial instruments are valued at the close of the NYSE and are reported at fair value, which GAAP defines as the price that would be received to sell an asset or paid to transfer a liability in an orderly transaction between market participants at the measurement date. The T. Rowe Price Valuation Committee (the Valuation Committee) is an internal committee that has been delegated certain responsibilities by the fund’s Board of Directors (the Board) to ensure that financial instruments are appropriately priced at fair value in accordance with GAAP and the 1940 Act.
Subject to oversight by the Board, the Valuation Committee develops and oversees pricing-related policies and procedures and approves all fair value determinations. Specifically, the Valuation Committee establishes policies and procedures used in valuing financial instruments, including those which cannot be valued in accordance with normal procedures or using pricing vendors; determines pricing techniques, sources, and persons eligible to effect fair value pricing actions; evaluates the services and performance of the pricing vendors; oversees the pricing process to ensure policies and procedures are being followed; and provides guidance on internal controls and valuation-related matters. The Valuation Committee provides periodic reporting to the Board on valuation matters.
Various valuation techniques and inputs are used to determine the fair value of financial instruments. GAAP establishes the following fair value hierarchy that categorizes the inputs used to measure fair value:
Level 1 – quoted prices (unadjusted) in active markets for identical financial instruments that the fund can access at the reporting date
Level 2 – inputs other than Level 1 quoted prices that are observable, either directly or indirectly (including, but not limited to, quoted prices for similar financial instruments in active markets, quoted prices for identical or similar financial instruments in inactive markets, interest rates and yield curves, implied volatilities, and credit spreads)
Level 3 – unobservable inputs (including the fund’s own assumptions in determining fair value)
Observable inputs are developed using market data, such as publicly available information about actual events or transactions, and reflect the assumptions that market participants would use to price the financial instrument. Unobservable inputs are those for which market data are not available and are developed using the best information available about the assumptions that market participants would use to price the financial instrument. GAAP requires valuation techniques to maximize the use of relevant observable inputs and minimize the use of unobservable inputs. When multiple inputs are used to derive fair value, the financial instrument is assigned to the level within the fair value hierarchy based on the lowest-level input that is significant to the fair value of the financial instrument. Input levels are not necessarily an indication of the risk or liquidity associated with financial instruments at that level but rather the degree of judgment used in determining those values.
Valuation Techniques Equity securities, including exchange-traded funds, listed or regularly traded on a securities exchange or in the over-the-counter (OTC) market are valued at the last quoted sale price or, for certain markets, the official closing price at the time the valuations are made. OTC Bulletin Board securities are valued at the mean of the closing bid and asked prices. A security that is listed or traded on more than one exchange is valued at the quotation on the exchange determined to be the primary market for such security. Listed securities not traded on a particular day are valued at the mean of the closing bid and asked prices for domestic securities and the last quoted sale or closing price for international securities.
The last quoted prices of non-U.S. equity securities may be adjusted to reflect the fair value of such securities at the close of the NYSE, if the fund determines that developments between the close of a foreign market and the close of the NYSE will affect the value of some or all of its portfolio securities. Each business day, the fund uses information from outside pricing services to evaluate and, if appropriate, decide whether it is necessary to adjust quoted prices to reflect fair value by reviewing a variety of factors, including developments in foreign markets, the performance of U.S. securities markets, and the performance of instruments trading in U.S. markets that represent foreign securities and baskets of foreign securities. The fund uses outside pricing services to provide it with quoted prices and information to evaluate or adjust those prices. The fund cannot predict how often it will use quoted prices and how often it will determine it necessary to adjust those prices to reflect fair value.
Investments in mutual funds are valued at the mutual fund’s closing NAV per share on the day of valuation. Assets and liabilities other than financial instruments, including short-term receivables and payables, are carried at cost, or estimated realizable value, if less, which approximates fair value.
Investments for which market quotations or market-based valuations are not readily available or deemed unreliable are valued at fair value as determined in good faith by the Valuation Committee, in accordance with fair valuation policies and procedures. The objective of any fair value pricing determination is to arrive at a price that could reasonably be expected from a current sale. Financial instruments fair valued by the Valuation Committee are primarily private placements, restricted securities, warrants, rights, and other securities that are not publicly traded. Factors used in determining fair value vary by type of investment and may include market or investment specific considerations. The Valuation Committee typically will afford greatest weight to actual prices in arm’s length transactions, to the extent they represent orderly transactions between market participants, transaction information can be reliably obtained, and prices are deemed representative of fair value. However, the Valuation Committee may also consider other valuation methods such as market-based valuation multiples; a discount or premium from market value of a similar, freely traded security of the same issuer; discounted cash flows; yield to maturity; or some combination. Fair value determinations are reviewed on a regular basis and updated as information becomes available, including actual purchase and sale transactions of the investment. Because any fair value determination involves a significant amount of judgment, there is a degree of subjectivity inherent in such pricing decisions, and fair value prices determined by the Valuation Committee could differ from those of other market participants.
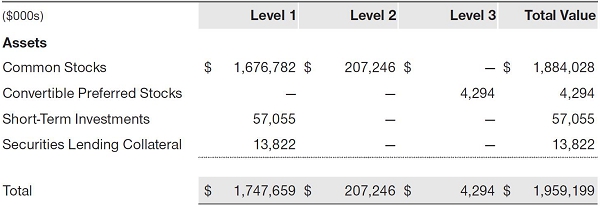
Valuation Inputs The following table summarizes the fund’s financial instruments, based on the inputs used to determine their fair values on December 31, 2021 (for further detail by category, please refer to the accompanying Portfolio of Investments):
NOTE 3 - OTHER INVESTMENT TRANSACTIONS
Consistent with its investment objective, the fund engages in the following practices to manage exposure to certain risks and/or to enhance performance. The investment objective, policies, program, and risk factors of the fund are described more fully in the fund’s prospectus and Statement of Additional Information.
Restricted Securities The fund invests in securities that are subject to legal or contractual restrictions on resale. Prompt sale of such securities at an acceptable price may be difficult and may involve substantial delays and additional costs.
Private Investments Issued by Special Purpose Acquisition Companies
Special purpose acquisition companies (SPACs) are shell companies that have no operations but are formed to raise capital with the intention of merging with or acquiring a company with the proceeds of the SPAC’s initial public offering (IPO). The fund may enter into a contingent commitment with a SPAC to purchase private investments in public equity (PIPE) if and when the SPAC completes its merger or acquisition. The fund maintains liquid assets sufficient to settle its commitment to purchase the PIPE. However, if the commitment expires, then no shares are purchased. Purchased PIPE shares will be restricted from trading until the registration statement for the shares is declared effective. Upon registration, the shares can be freely sold; however, in certain circumstances, the issuer may have the right to temporarily suspend trading of the shares in the first year after the merger or acquisition. The securities issued by a SPAC may be considered illiquid, more difficult to value, and/or be subject to restrictions on resale.
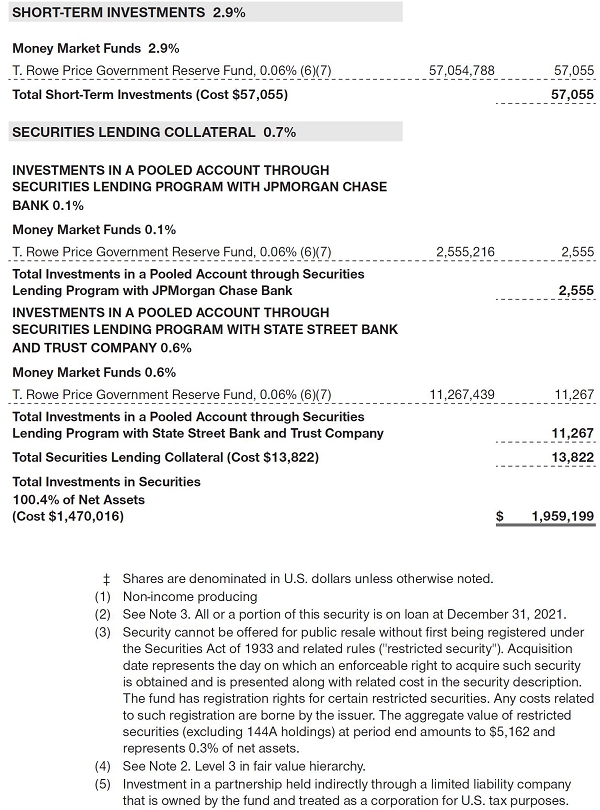
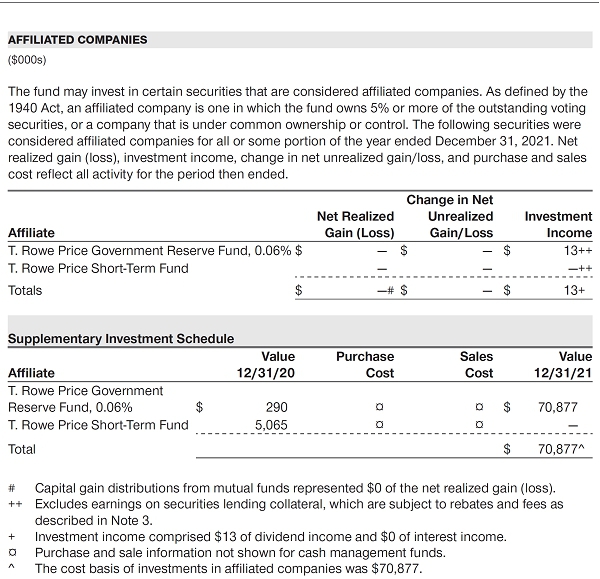
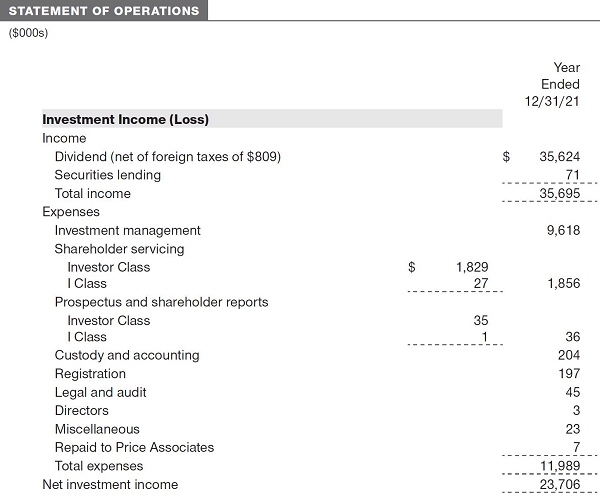
Securities Lending The fund may lend its securities to approved borrowers to earn additional income. Its securities lending activities are administered by a lending agent in accordance with a securities lending agreement. Security loans generally do not have stated maturity dates, and the fund may recall a security at any time. The fund receives collateral in the form of cash or U.S. government securities. Collateral is maintained over the life of the loan in an amount not less than the value of loaned securities; any additional collateral required due to changes in security values is delivered to the fund the next business day. Cash collateral is invested in accordance with investment guidelines approved by fund management. Additionally, the lending agent indemnifies the fund against losses resulting from borrower default. Although risk is mitigated by the collateral and indemnification, the fund could experience a delay in recovering its securities and a possible loss of income or value if the borrower fails to return the securities, collateral investments decline in value, and the lending agent fails to perform. Securities lending revenue consists of earnings on invested collateral and borrowing fees, net of any rebates to the borrower, compensation to the lending agent, and other administrative costs. In accordance with GAAP, investments made with cash collateral are reflected in the accompanying financial statements, but collateral received in the form of securities is not. At December 31, 2021, the value of loaned securities was $13,603,000; the value of cash collateral and related investments was $13,822,000.
Other Purchases and sales of portfolio securities other than short-term securities aggregated $937,530,000 and $226,439,000, respectively, for the year ended December 31, 2021.
NOTE 4 - FEDERAL INCOME TAXES
Generally, no provision for federal income taxes is required since the fund intends to continue to qualify as a regulated investment company under Subchapter M of the Internal Revenue Code and distribute to shareholders all of its taxable income and gains. Distributions determined in accordance with federal income tax regulations may differ in amount or character from net investment income and realized gains for financial reporting purposes.
The fund files U.S. federal, state, and local tax returns as required. The fund’s tax returns are subject to examination by the relevant tax authorities until expiration of the applicable statute of limitations, which is generally three years after the filing of the tax return but which can be extended to six years in certain circumstances. Tax returns for open years have incorporated no uncertain tax positions that require a provision for income taxes.
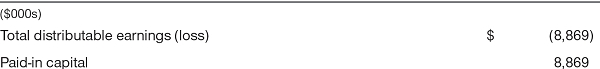
Financial reporting records are adjusted for permanent book/tax differences to reflect tax character but are not adjusted for temporary differences. The permanent book/tax adjustments have no impact on results of operations or net assets and relate primarily to a tax practice that treats a portion of the proceeds from each redemption of capital shares as a distribution of taxable net investment income or realized capital gain. For the year ended December 31, 2021, the following reclassification was recorded:
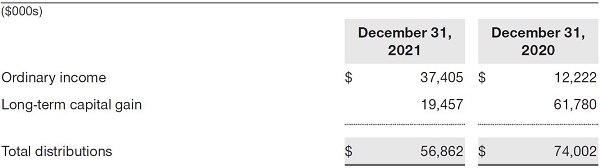
Distributions during the years ended December 31, 2021 and December 31, 2020,were characterized for tax purposes as follows:
At December 31, 2021, the tax-basis cost of investments and components of net assets were as follows:
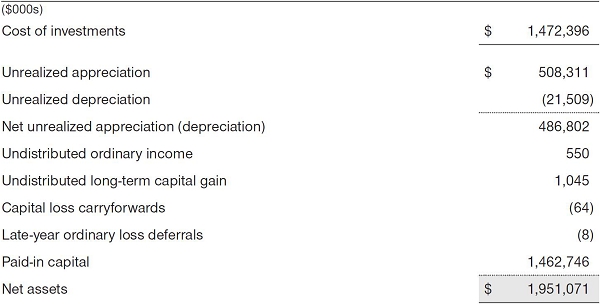
The difference between book-basis and tax-basis net unrealized appreciation (depreciation) is attributable to the deferral of losses from wash sales for tax purposes. The fund intends to retain realized gains to the extent of available capital loss carryforwards. Net realized capital losses may be carried forward indefinitely to offset future realized capital gains. All or a portion of the capital loss carryforwards may be from losses realized between November 1 and the fund’s fiscal year-end, which are deferred for tax purposes until the subsequent year but recognized for financial reporting purposes in the year realized. In accordance with federal tax laws applicable to investment companies, net specified losses realized between November 1 and December 31 are not recognized for tax purposes until the subsequent year (late-year ordinary loss deferrals); however, such losses are recognized for financial reporting purposes in the year realized.
NOTE 5 - FOREIGN TAXES
The fund is subject to foreign income taxes imposed by certain countries in which it invests. Additionally, capital gains realized upon disposition of securities issued in or by certain foreign countries are subject to capital gains tax imposed by those countries. All taxes are computed in accordance with the applicable foreign tax law, and, to the extent permitted, capital losses are used to offset capital gains. Taxes attributable to income are accrued by the fund as a reduction of income. Current and deferred tax expense attributable to capital gains is reflected as a component of realized or change in unrealized gain/loss on securities in the accompanying financial statements. To the extent that the fund has country specific capital loss carryforwards, such carryforwards are applied against net unrealized gains when determining the deferred tax liability. Any deferred tax liability incurred by the fund is included in either Other liabilities or Deferred tax liability on the accompanying Statement of Assets and Liabilities.
NOTE 6 - RELATED PARTY TRANSACTIONS
The fund is managed by T. Rowe Price Associates, Inc. (Price Associates), a wholly owned subsidiary of T. Rowe Price Group, Inc. (Price Group). Price Associates has entered into a sub-advisory agreement(s) with one or more of its wholly owned subsidiaries, to provide investment advisory services to the fund. The investment management agreement between the fund and Price Associates provides for an annual investment management fee, which is computed daily and paid monthly. The fee consists of an individual fund fee, equal to 0.35% of the fund’s average daily net assets, and a group fee. The group fee rate is calculated based on the combined net assets of certain mutual funds sponsored by Price Associates (the group) applied to a graduated fee schedule, with rates ranging from 0.48% for the first $1 billion of assets to 0.260% for assets in excess of $845 billion. The fund’s group fee is determined by applying the group fee rate to the fund’s average daily net assets. The fee is computed daily and paid monthly. At December 31, 2021, the effective annual group fee rate was 0.28%.
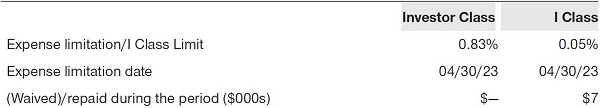
Effective September 1, 2021, the Investor Class is subject to a contractual expense limitation through the expense limitation date indicated in the table below. During the limitation period, Price Associates is required to waive its management fee or pay any expenses (excluding interest; expenses related to borrowings, taxes, and brokerage; and other non-recurring expenses permitted by the investment management agreement) that would otherwise cause the class’s ratio of annualized total expenses to average net assets (net expense ratio) to exceed its expense limitation. The class is required to repay Price Associates for expenses previously waived/paid to the extent the class’s net assets grow or expenses decline sufficiently to allow repayment without causing the class’s net expense ratio (after the repayment is taken into account) to exceed the lesser of: (1) the expense limitation in place at the time such amounts were waived; or (2) the class’s current expense limitation. However, no repayment will be made more than three years after the date of a payment or waiver.
The I Class is also subject to an operating expense limitation (I Class Limit) pursuant to which Price Associates is contractually required to pay all operating expenses of the I Class, excluding management fees; interest; expenses related to borrowings, taxes, and brokerage; and other non-recurring expenses permitted by the investment management agreement, to the extent such operating expenses, on an annualized basis, exceed the I Class Limit. This agreement will continue through the expense limitation date indicated in the table below, and may be renewed, revised, or revoked only with approval of the fund’s Board. The I Class is required to repay Price Associates for expenses previously paid to the extent the class’s net assets grow or expenses decline sufficiently to allow repayment without causing the class’s operating expenses (after the repayment is taken into account) to exceed the lesser of: (1) the I Class Limit in place at the time such amounts were paid; or (2) the current I Class Limit. However, no repayment will be made more than three years after the date of a payment or waiver.
Pursuant to these agreements, expenses were waived/paid by and/or repaid to Price Associates during the year ended December 31, 2021 as indicated in the table below. At December 31, 2021, there were no amounts subject to repayment by the fund. Any repayment of expenses previously waived/paid by Price Associates during the period would be included in the net investment income and expense ratios presented on the accompanying Financial Highlights.
In addition, the fund has entered into service agreements with Price Associates and two wholly owned subsidiaries of Price Associates, each an affiliate of the fund (collectively, Price). Price Associates provides certain accounting and administrative services to the fund. T. Rowe Price Services, Inc. provides shareholder and administrative services in its capacity as the fund’s transfer and dividend-disbursing agent. T. Rowe Price Retirement Plan Services, Inc. provides subaccounting and recordkeeping services for certain retirement accounts invested in the Investor Class. For the year ended December 31, 2021, expenses incurred pursuant to these service agreements were $82,000 for Price Associates; $697,000 for T. Rowe Price Services, Inc.; and $55,000 for T. Rowe Price Retirement Plan Services, Inc. All amounts due to and due from Price, exclusive of investment management fees payable, are presented net on the accompanying Statement of Assets and Liabilities.
Additionally, the fund is one of several mutual funds in which certain college savings plans managed by Price Associates may invest. As approved by the fund’s Board of Directors, shareholder servicing costs associated with each college savings plan are borne by the fund in proportion to the average daily value of its shares owned by the college savings plan. For the year ended December 31, 2021, the fund was charged $115,000 for shareholder servicing costs related to the college savings plans, of which $79,000 was for services provided by Price. All amounts due to and due from Price, exclusive of investment management fees payable, are presented net on the accompanying Statement of Assets and Liabilities. At December 31, 2021, approximately 4% of the outstanding shares of the Investor Class were held by college savings plans.
The fund may invest its cash reserves in certain open-end management investment companies managed by Price Associates and considered affiliates of the fund: the T. Rowe Price Government Reserve Fund or the T. Rowe Price Treasury Reserve Fund, organized as money market funds, or the T. Rowe Price Short-Term Fund, a short-term bond fund (collectively, the Price Reserve Funds). The Price Reserve Funds are offered as short-term investment options to mutual funds, trusts, and other accounts managed by Price Associates or its affiliates and are not available for direct purchase by members of the public. Cash collateral from securities lending, if any, is invested in the T. Rowe Price Government Reserve Fund; prior to December 13, 2021, the cash collateral from securities lending was invested in the T. Rowe Price Short-Term Fund. The Price Reserve Funds pay no investment management fees.
The fund may participate in securities purchase and sale transactions with other funds or accounts advised by Price Associates (cross trades), in accordance with procedures adopted by the fund’s Board and Securities and Exchange Commission rules, which require, among other things, that such purchase and sale cross trades be effected at the independent current market price of the security. During the year ended December 31, 2021, the fund had no purchases or sales cross trades with other funds or accounts advised by Price Associates.
Price Associates has voluntarily agreed to reimburse the fund from its own resources on a monthly basis for the cost of investment research embedded in the cost of the fund’s securities trades. This agreement may be rescinded at any time. For the year ended December 31, 2021, this reimbursement amounted to $49,000, which is included in Net realized gain (loss) on Securities in the Statement of Operations.
NOTE 7 - OTHER MATTERS
Unpredictable events such as environmental or natural disasters, war, terrorism, pandemics, outbreaks of infectious diseases, and similar public health threats may significantly affect the economy and the markets and issuers in which a fund invests. Certain events may cause instability across global markets, including reduced liquidity and disruptions in trading markets, while some events may affect certain geographic regions, countries, sectors, and industries more significantly than others, and exacerbate other pre-existing political, social, and economic risks. The fund’s performance could be negatively impacted if the value of a portfolio holding were harmed by such events.
Since 2020, a novel strain of coronavirus (COVID-19) has resulted in disruptions to global business activity and caused significant volatility and declines in global financial markets. The duration of this outbreak or others and their effects cannot be determined with certainty.
REPORT OF INDEPENDENT REGISTERED PUBLIC ACCOUNTING FIRM
To the Board of Directors and Shareholders of
T. Rowe Price Financial Services Fund, Inc.
Opinion on the Financial Statements
We have audited the accompanying statement of assets and liabilities, including the portfolio of investments, of T. Rowe Price Financial Services Fund, Inc. (the “Fund”) as of December 31, 2021, the related statement of operations for the year ended December 31, 2021, the statement of changes in net assets for each of the two years in the period ended December 31, 2021, including the related notes, and the financial highlights for each of the five years in the period ended December 31, 2021 (collectively referred to as the “financial statements”). In our opinion, the financial statements present fairly, in all material respects, the financial position of the Fund as of December 31, 2021, the results of its operations for the year then ended, the changes in its net assets for each of the two years in the period ended December 31, 2021 and the financial highlights for each of the five years in the period ended December 31, 2021 in conformity with accounting principles generally accepted in the United States of America.
Basis for Opinion
These financial statements are the responsibility of the Fund’s management. Our responsibility is to express an opinion on the Fund’s financial statements based on our audits. We are a public accounting firm registered with the Public Company Accounting Oversight Board (United States) (PCAOB) and are required to be independent with respect to the Fund in accordance with the U.S. federal securities laws and the applicable rules and regulations of the Securities and Exchange Commission and the PCAOB.
We conducted our audits of these financial statements in accordance with the standards of the PCAOB. Those standards require that we plan and perform the audit to obtain reasonable assurance about whether the financial statements are free of material misstatement, whether due to error or fraud.
Our audits included performing procedures to assess the risks of material misstatement of the financial statements, whether due to error or fraud, and performing procedures that respond to those risks. Such procedures included examining, on a test basis, evidence regarding the amounts and disclosures in the financial statements. Our audits also included evaluating the accounting principles used and significant estimates made by management, as well as evaluating the overall presentation of the financial statements. Our procedures included confirmation of securities owned as of December 31, 2021 by correspondence with the custodians, transfer agent and brokers; when replies were not received from brokers, we performed other auditing procedures. We believe that our audits provide a reasonable basis for our opinion.
PricewaterhouseCoopers LLP
Baltimore, Maryland
February 15, 2022
We have served as the auditor of one or more investment companies in the T. Rowe Price group of investment companies since 1973.
TAX INFORMATION (UNAUDITED) FOR THE TAX YEAR ENDED 12/31/21
We are providing this information as required by the Internal Revenue Code. The amounts shown may differ from those elsewhere in this report because of differences between tax and financial reporting requirements.
The fund’s distributions to shareholders included:
| ■ | $16,289,000 from short-term capital gains |
| ■ | $25,709,000 from long-term capital gains, subject to a long-term capital gains tax rate of not greater than 20% |
For taxable non-corporate shareholders, $32,469,000 of the fund's income represents qualified dividend income subject to a long-term capital gains tax rate of not greater than 20%.
For corporate shareholders, $21,438,000 of the fund's income qualifies for the dividends-received deduction.
For individuals and certain trusts and estates which are entitled to claim a deduction of up to 20% of their combined qualified real estate investment trust (REIT) dividends, $453,000 of the fund's income qualifies as qualified real estate investment trust (REIT) dividends.
INFORMATION ON PROXY VOTING POLICIES, PROCEDURES, AND RECORDS
A description of the policies and procedures used by T. Rowe Price funds to determine how to vote proxies relating to portfolio securities is available in each fund’s Statement of Additional Information. You may request this document by calling 1-800-225-5132 or by accessing the SEC’s website, sec.gov.
The description of our proxy voting policies and procedures is also available on our corporate website. To access it, please visit the following Web page:
https://www.troweprice.com/corporate/en/utility/policies.html
Scroll down to the section near the bottom of the page that says, “Proxy Voting Policies.” Click on the Proxy Voting Policies link in the shaded box.
Each fund’s most recent annual proxy voting record is available on our website and through the SEC’s website. To access it through T. Rowe Price, visit the website location shown above, and scroll down to the section near the bottom of the page that says, “Proxy Voting Records.” Click on the Proxy Voting Records link in the shaded box.
HOW TO OBTAIN QUARTERLY PORTFOLIO HOLDINGS
The fund files a complete schedule of portfolio holdings with the Securities and Exchange Commission (SEC) for the first and third quarters of each fiscal year as an exhibit to its reports on Form N-PORT. The fund’s reports on Form N-PORT are available electronically on the SEC’s website (sec.gov). In addition, most T. Rowe Price funds disclose their first and third fiscal quarter-end holdings on troweprice.com.
LIQUIDITY RISK MANAGEMENT PROGRAM
In accordance with Rule 22e-4 (Liquidity Rule) under the Investment Company Act of 1940, as amended, the fund has established a liquidity risk management program (Liquidity Program) reasonably designed to assess and manage the fund’s liquidity risk, which generally represents the risk that the fund would not be able to meet redemption requests without significant dilution of remaining investors’ interests in the fund. The fund’s Board of Directors (Board) has appointed the fund’s investment advisor, T. Rowe Price Associates, Inc. (Price Associates), as the administrator of the Liquidity Program. As administrator, Price Associates is responsible for overseeing the day-to-day operations of the Liquidity Program and, among other things, is responsible for assessing, managing, and reviewing with the Board at least annually the liquidity risk of each T. Rowe Price fund. Price Associates has delegated oversight of the Liquidity Program to a Liquidity Risk Committee (LRC), which is a cross-functional committee composed of personnel from multiple departments within Price Associates.
The Liquidity Program’s principal objectives include supporting the T. Rowe Price funds’ compliance with limits on investments in illiquid assets and mitigating the risk that the fund will be unable to timely meet its redemption obligations. The Liquidity Program also includes a number of elements that support the management and assessment of liquidity risk, including an annual assessment of factors that influence the fund’s liquidity and the periodic classification and reclassification of a fund’s investments into categories that reflect the LRC’s assessment of their relative liquidity under current market conditions. Under the Liquidity Program, every investment held by the fund is classified at least monthly into one of four liquidity categories based on estimations of the investment’s ability to be sold during designated time frames in current market conditions without significantly changing the investment’s market value.
As required by the Liquidity Rule, at a meeting held on July 27, 2021, the Board was presented with an annual assessment prepared by the LRC, on behalf of Price Associates, that addressed the operation of the Liquidity Program and assessed its adequacy and effectiveness of implementation, including any material changes to the Liquidity Program and the determination of each fund’s Highly Liquid Investment Minimum (HLIM). The annual assessment included consideration of the following factors, as applicable: the fund’s investment strategy and liquidity of portfolio investments during normal and reasonably foreseeable stressed conditions, including whether the investment strategy is appropriate for an open-end fund, the extent to which the strategy involves a relatively concentrated portfolio or large positions in particular issuers, and the use of borrowings for investment purposes and derivatives; short-term and long-term cash flow projections covering both normal and reasonably foreseeable stressed conditions; and holdings of cash and cash equivalents, as well as available borrowing arrangements.
For the fund and other T. Rowe Price funds, the annual assessment incorporated a report related to a fund’s holdings, shareholder and portfolio concentration, any borrowings during the period, cash flow projections, and other relevant data for the period of April 1, 2020, through March 31, 2021. The report described the methodology for classifying a fund’s investments (including derivative transactions) into one of four liquidity categories, as well as the percentage of a fund’s investments assigned to each category. It also explained the methodology for establishing a fund’s HLIM and noted that the LRC reviews the HLIM assigned to each fund no less frequently than annually.
During the period covered by the annual assessment, the LRC has concluded, and reported to the Board, that the Liquidity Program continues to operate adequately and effectively and is reasonably designed to assess and manage the fund’s liquidity risk.
ABOUT THE FUND’S DIRECTORS AND OFFICERS
Your fund is overseen by a Board of Directors (Board) that meets regularly to review a wide variety of matters affecting or potentially affecting the fund, including performance, investment programs, compliance matters, advisory fees and expenses, service providers, and business and regulatory affairs. The Board elects the fund’s officers, who are listed in the final table. At least 75% of the Board’s members are considered to be independent, i.e., not “interested persons” as defined in Section 2(a)(19) of the 1940 Act, of the Boards of T. Rowe Price Associates, Inc. (T. Rowe Price), and its affiliates; “interested” directors and officers are employees of T. Rowe Price. The business address of each director and officer is 100 East Pratt Street, Baltimore, Maryland 21202. The Statement of Additional Information includes additional information about the fund directors and is available without charge by calling a T. Rowe Price representative at 1-800-638-5660.
INDEPENDENT DIRECTORS(a)
Name
(Year of Birth)
Year Elected
[Number of T. Rowe Price
Portfolios Overseen] | | Principal Occupation(s) and Directorships of Public Companies and
Other Investment Companies During the Past Five Years |
| | | |
Teresa Bryce Bazemore
(1959)
2018
[204] | | President and Chief Executive Officer, Federal Home Loan Bank of San Francisco (2021 to present); President, Radian Guaranty (2008 to 2017); Chief Executive Officer, Bazemore Consulting LLC (2018 to 2021); Director, Chimera Investment Corporation (2017 to 2021); Director, First Industrial Realty Trust (2020 to present); Director, Federal Home Loan Bank of Pittsburgh (2017 to 2019) |
| | | |
Ronald J. Daniels
(1959)
2018
[204] | | President, The Johns Hopkins University(b) and Professor, Political Science Department, The Johns Hopkins University (2009 to present); Director, Lyndhurst Holdings (2015 to present); Director, BridgeBio Pharma, Inc. (2020 to present) |
| | | |
Bruce W. Duncan
(1951)
2013
[204] | | President, Chief Executive Officer, and Director, CyrusOne, Inc. (2020 to 2021); Chief Executive Officer and Director (2009 to 2016), Chair of the Board (2016 to 2020), and President (2009 to 2016), First Industrial Realty Trust, owner and operator of industrial properties; Chair of the Board (2005 to 2016) and Director (1999 to 2016), Starwood Hotels & Resorts, a hotel and leisure company; Member, Investment Company Institute Board of Governors (2017 to 2019); Member, Independent Directors Council Governing Board (2017 to 2019); Senior Advisor, KKR (2018 to present); Director, Boston Properties (2016 to present); Director, Marriott International, Inc. (2016 to 2020) |
| | | |
Robert J. Gerrard, Jr.
(1952)
2012
[204] | | Advisory Board Member, Pipeline Crisis/Winning Strategies, a collaborative working to improve opportunities for young African Americans (1997 to 2016); Chair of the Board, all funds (July 2018 to present) |
| | | |
Paul F. McBride
(1956)
2013
[204] | | Advisory Board Member, Vizzia Technologies (2015 to present); Board Member, Dunbar Armored (2012 to 2018) |
| | | |
Cecilia E. Rouse, Ph.D.(c)
(1963)
2012
[0] | | Dean, Princeton School of Public and International Affairs (2012 to present); Professor and Researcher, Princeton University (1992 to present); Director of Education Studies Committee, MDRC, a nonprofit education and social policy research organization (2011 to 2020); Member, National Academy of Education (2010 to present); Board Member, National Bureau of Economic Research (2011 to present); Board Member of the Council on Foreign Relations (2018 to present); Board Member, The Pennington School (2017 to present); Board Member, the University of Rhode Island (2020 to present); Chair of Committee on the Status of Minority Groups in the Economic Profession of the American Economic Association (2012 to 2018); Vice President (2015 to 2016) and Board Member (2018 to present), American Economic Association |
| | | |
John G. Schreiber(d)
(1946)
2001
[0] | | Owner/President, Centaur Capital Partners, Inc., a real estate investment company (1991 to present); Cofounder, Partner, and Cochair of the Investment Committee, Blackstone Real Estate Advisors, L.P. (1992 to 2015); Director, Blackstone Mortgage Trust, a real estate finance company (2012 to 2016); Director and Chair of the Board, Brixmor Property Group, Inc. (2013 to present); Director, Hilton Worldwide (2007 to present); Director, Hudson Pacific Properties (2014 to 2016); Director, Invitation Homes (2014 to 2017); Director, JMB Realty Corporation (1980 to present) |
| | | |
Kellye Walker(e)
(1966)
2021
[204] | | Executive Vice President and Chief Legal Officer, Eastman Chemical Company (April 2020 to present); Executive Vice President and Chief Legal Officer, Huntington Ingalls Industries, Inc. (NYSE: HIl) (January 2015 to March 2020); Director, Lincoln Electric Company (October 2020 to present) |
(a) All information about the independent directors was current as of December 31, 2020, unless otherwise indicated, except for the number of portfolios overseen, which is current as of the date of this report.
(b) William J. Stromberg, chair of the Board, director, and chief executive officer of T. Rowe Price Group, Inc., the parent company of the Price Funds’ investment advisor, has served on the Board of Trustees of Johns Hopkins University since 2014.
(c) Effective March 4, 2021, Dr. Rouse resigned from her role as independent director of the Price Funds.
(d) Effective December 31, 2021, Mr. Schreiber resigned from his role as independent director of the Price Funds.
(e)Effective November 8, 2021, Ms. Walker was elected as independent director of the Price Funds.
INTERESTED DIRECTORS(a)
Name
(Year of Birth)
Year Elected
[Number of T. Rowe Price
Portfolios Overseen] | | Principal Occupation(s) and Directorships of Public Companies and
Other Investment Companies During the Past Five Years |
| | | |
David Oestreicher
(1967)
2018
[204] | | General Counsel, Vice President, and Secretary, T. Rowe Price Group, Inc.; Chair of the Board, Chief Executive Officer, President, and Secretary, T. Rowe Price Trust Company; Director, Vice President, and Secretary, T. Rowe Price, T. Rowe Price Investment Services, Inc., T. Rowe Price Retirement Plan Services, Inc., and T. Rowe Price Services, Inc.; Director and Secretary, T. Rowe Price Investment Management, Inc. (Price Investment Management); Vice President and Secretary, T. Rowe Price International (Price International); Vice President, T. Rowe Price Hong Kong (Price Hong Kong), T. Rowe Price Japan (Price Japan), and T. Rowe Price Singapore (Price Singapore); Principal Executive Officer and Executive Vice President, all funds |
| | | |
Robert W. Sharps, CFA, CPA
(1971)
2017
[204] | | Director and Vice President, T. Rowe Price; President, T. Rowe Price Group, Inc.; Director, Price Investment Management; Vice President, T. Rowe Price Trust Company |
(a) All information about the interested directors was current as of December 31, 2020, unless otherwise indicated, except for the number of portfolios overseen, which is current as of the date of this report.
OFFICERS
Name (Year of Birth)
Position Held With Financial
Services Fund | | Principal Occupation(s) |
| | | |
Elias Chrysostomou, CFA (1980)
Vice President | | Vice President, T. Rowe Price Group, Inc., and Price International; formerly, Financials Sector Specialist, Lazard Asset Management (to 2019) |
| | | |
Vincent M. DeAugustino (1983)
Vice President | | Vice President, T. Rowe Price and T. Rowe Price Group, Inc. |
| | | |
Alan S. Dupski, CPA (1982)
Principal Financial Officer, Vice
President, and Treasurer | | Vice President, T. Rowe Price, T. Rowe Price Group, Inc., and T. Rowe Price Trust Company |
| | | |
Jon M. Friar (1982)
Vice President | | Vice President, T. Rowe Price and T. Rowe Price Group, Inc. |
| | | |
John R. Gilner (1961)
Chief Compliance Officer | | Chief Compliance Officer and Vice President, T. Rowe Price; Vice President, T. Rowe Price Group, Inc., and T. Rowe Price Investment Services, Inc. |
| | | |
Gary J. Greb (1961)
Vice President | | Vice President, T. Rowe Price, Price International, and T. Rowe Price Trust Company |
| | | |
Nina P. Jones, CPA (1980)
Vice President | | Vice President, T. Rowe Price and T. Rowe Price Group, Inc. |
| | | |
Takanori Kobayashi (1981)
Vice President | | Vice President, Price Japan, T. Rowe Price Group, Inc., and Price International; formerly, Research Analyst, Allianz Global Investors (to 2017) |
| | | |
Paul J. Krug, CPA (1964)
Vice President | | Vice President, T. Rowe Price, T. Rowe Price Group, Inc., and T. Rowe Price Trust Company |
| | | |
Shengrong Lau (1982)
Vice President | | Vice President, Price Singapore and T. Rowe Price Group, Inc. |
| | | |
Gregory Locraft (1971)
Vice President | | Vice President, T. Rowe Price and T. Rowe Price Group, Inc. |
| | | |
Jihong Min (1979)
Vice President | | Vice President, Price Singapore and T. Rowe Price Group, Inc. |
| | | |
Fran M. Pollack-Matz (1961)
Vice President and Secretary | | Vice President, T. Rowe Price, T. Rowe Price Group, Inc., T. Rowe Price Investment Services, Inc., and T. Rowe Price Services, Inc. |
| | | |
Shannon H. Rauser (1987)
Assistant Secretary | | Assistant Vice President, T. Rowe Price |
| | | |
Matthew J. Snowling, CFA (1971)
Vice President | | Vice President, T. Rowe Price and T. Rowe Price Group, Inc. |
| | | |
Gabriel Solomon (1977)
President | | Vice President, T. Rowe Price and T. Rowe Price Group, Inc. |
| | | |
Preeta Ragavan Srinivasan, CFA (1987)
Vice President | | Vice President, T. Rowe Price and T. Rowe Price Group, Inc. |
| | | |
Zenon Voyiatzis (1971)
Vice President | | Vice President, T. Rowe Price Group, Inc., and Price International |
| | | |
Megan Warren (1968)
Vice President | | Vice President, T. Rowe Price, T. Rowe Price Group, Inc., T. Rowe Price Retirement Plan Services, Inc., T. Rowe Price Services, Inc., and T. Rowe Price Trust Company; formerly, Executive Director, JPMorgan Chase (to 2017) |
| | | |
Ari Weisband (1992)
Vice President | | Vice President, T. Rowe Price |
Unless otherwise noted, officers have been employees of T. Rowe Price or Price International for at least 5 years.
Item 1. (b) Notice pursuant to Rule 30e-3.
Not applicable.
Item 2. Code of Ethics.
The registrant has adopted a code of ethics, as defined in Item 2 of Form N-CSR, applicable to its principal executive officer, principal financial officer, principal accounting officer or controller, or persons performing similar functions. A copy of this code of ethics is filed as an exhibit to this Form N-CSR. No substantive amendments were approved or waivers were granted to this code of ethics during the period covered by this report.
Item 3. Audit Committee Financial Expert.
The registrant’s Board of Directors has determined that Ms. Teresa Bryce Bazemore qualifies as an audit committee financial expert, as defined in Item 3 of Form N-CSR. Ms. Bazemore is considered independent for purposes of Item 3 of Form N-CSR.
Item 4. Principal Accountant Fees and Services.
(a) – (d) Aggregate fees billed for the last two fiscal years for professional services rendered to, or on behalf of, the registrant by the registrant’s principal accountant were as follows:
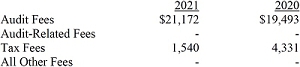
Audit fees include amounts related to the audit of the registrant’s annual financial statements and services normally provided by the accountant in connection with statutory and regulatory filings. Audit-related fees include amounts reasonably related to the performance of the audit of the registrant’s financial statements and specifically include the issuance of a report on internal controls and, if applicable, agreed-upon procedures related to fund acquisitions. Tax fees include amounts related to services for tax compliance, tax planning, and tax advice. The nature of these services specifically includes the review of distribution calculations and the preparation of Federal, state, and excise tax returns. All other fees include the registrant’s pro-rata share of amounts for agreed-upon procedures in conjunction with service contract approvals by the registrant’s Board of Directors/Trustees.
(e)(1) The registrant’s audit committee has adopted a policy whereby audit and non-audit services performed by the registrant’s principal accountant for the registrant, its investment adviser, and any entity controlling, controlled by, or under common control with the investment adviser that provides ongoing services to the registrant require pre-approval in advance at regularly scheduled audit committee meetings. If such a service is required between regularly scheduled audit committee meetings, pre-approval may be authorized by one audit committee member with ratification at the next scheduled audit committee meeting. Waiver of pre-approval for audit or non-audit services requiring fees of a de minimis amount is not permitted.
(2) No services included in (b) – (d) above were approved pursuant to paragraph (c)(7)(i)(C) of Rule 2-01 of Regulation S-X.
(f) Less than 50 percent of the hours expended on the principal accountant’s engagement to audit the registrant’s financial statements for the most recent fiscal year were attributed to work performed by persons other than the principal accountant’s full-time, permanent employees.
(g) The aggregate fees billed for the most recent fiscal year and the preceding fiscal year by the registrant’s principal accountant for non-audit services rendered to the registrant, its investment adviser, and any entity controlling, controlled by, or under common control with the investment adviser that provides ongoing services to the registrant were $3,732,000 and $3,781,000, respectively.
(h) All non-audit services rendered in (g) above were pre-approved by the registrant’s audit committee. Accordingly, these services were considered by the registrant’s audit committee in maintaining the principal accountant’s independence.
Item 5. Audit Committee of Listed Registrants.
Not applicable.
Item 6. Investments.
(a) Not applicable. The complete schedule of investments is included in Item 1 of this Form N-CSR.
(b) Not applicable.
Item 7. Disclosure of Proxy Voting Policies and Procedures for Closed-End Management Investment Companies.
Not applicable.
Item 8. Portfolio Managers of Closed-End Management Investment Companies.
Not applicable.
Item 9. Purchases of Equity Securities by Closed-End Management Investment Company and Affiliated Purchasers.
Not applicable.
Item 10. Submission of Matters to a Vote of Security Holders.
There has been no change to the procedures by which shareholders may recommend nominees to the registrant’s board of directors.
Item 11. Controls and Procedures.
(a) The registrant’s principal executive officer and principal financial officer have evaluated the registrant’s disclosure controls and procedures within 90 days of this filing and have concluded that the registrant’s disclosure controls and procedures were effective, as of that date, in ensuring that information required to be disclosed by the registrant in this Form N-CSR was recorded, processed, summarized, and reported timely.
(b) The registrant’s principal executive officer and principal financial officer are aware of no change in the registrant’s internal control over financial reporting that occurred during the period covered by this report that has materially affected, or is reasonably likely to materially affect, the registrant’s internal control over financial reporting.
Item 12. Disclosure of Securities Lending Activities for Closed-End Management Investment Companies.
Not applicable.
Item 13. Exhibits.
(a)(1) The registrant’s code of ethics pursuant to Item 2 of Form N-CSR is attached.
(2) Separate certifications by the registrant's principal executive officer and principal financial officer, pursuant to Section 302 of the Sarbanes-Oxley Act of 2002 and required by Rule 30a-2(a) under the Investment Company Act of 1940, are attached.
(3) Written solicitation to repurchase securities issued by closed-end companies: not applicable.
(b) A certification by the registrant's principal executive officer and principal financial officer, pursuant to Section 906 of the Sarbanes-Oxley Act of 2002 and required by Rule 30a-2(b) under the Investment Company Act of 1940, is attached.
SIGNATURES
Pursuant to the requirements of the Securities Exchange Act of 1934 and the Investment Company Act of 1940, the registrant has duly caused this report to be signed on its behalf by the undersigned, thereunto duly authorized.
T. Rowe Price Financial Services Fund, Inc.
| | By | | /s/ David Oestreicher |
| | | | David Oestreicher |
| | | | Principal Executive Officer |
| | | | |
| Date February 15, 2022 | | | |
Pursuant to the requirements of the Securities Exchange Act of 1934 and the Investment Company Act of 1940, this report has been signed below by the following persons on behalf of the registrant and in the capacities and on the dates indicated.
| | By | | /s/ David Oestreicher |
| | | | David Oestreicher |
| | | | Principal Executive Officer |
| | | | |
| Date February 15, 2022 | | | |
| | By | | /s/ Alan S. Dupski |
| | | | Alan S. Dupski |
| | | | Principal Financial Officer |
| | | | |
| Date February 15, 2022 | | | |