| Contact: | Jim Sheehan | Martha Schaefer |
| | SeaChange PR | SeaChange IR |
| | 1-978-897-0100 x3064 | 1-978-897-0100 x3030 |
| | jim.sheehan@schange.com | martha.schaefer@schange.com |
SeaChange International Announces Third Quarter Fiscal 2011 Results
| · | Year over Year Growth in Software |
| · | Continued strong revenue growth for Media Services |
| · | Cost reductions for Servers and Storage pave path to profitability |
ACTON, Mass. (Dec. 9, 2010) – SeaChange International, Inc. (NASDAQ: SEAC), the leading global multi-screen video software company, today announced financial results for its fiscal 2011 third quarter ended October 31, 2010. Total non-GAAP revenues were $49.9 million, which were $4.1 million lower than total non-GAAP revenues of $54.0 million for the third quarter of last year. Total GAAP revenues for the third quarter of $49.1 million were $4.2 million lower than last year’s third quarter GAAP revenues of $53.3 million. Non-GAAP net income for this year’s third quarter was $1.5 million or $0.05 per share compared with non-GAAP net income of $3.4 million or $0.11 per share for the third quarter of fiscal 2010. GAAP net loss for this year’s third quarter was $5.2 million or $0.17 per share compared to GAAP net income of $0.7 million or $0.02 per share for last year’s third quarter.
Total non-GAAP revenues for the first nine months of fiscal 2011 ended October 31, 2010, were $159.2 million, which were $9.8 million or 7% higher than total non-GAAP revenues of $149.4 million for the first nine months of fiscal 2010. Non-GAAP net income for the first nine months of fiscal 2011 of $7.4 million or $0.24 per share was $0.7 million or $0.03 per share higher than non-GAAP net income and earnings per share of $6.7 million and $0.21 per share, respectively, for the same period last year. Total GAAP revenues for the first nine months of fiscal 2011 of $155.4 million were $6.7 million higher than GAAP revenues of $148.7 million for the same period last year. GAAP net income for the first nine months of this year was $18.6 million, or $0.58 per share, compared with GAAP net income of $1.3 million, or $0.04 per share, for the first nine months of last year.
(more)
SeaChange Q3 FY11 Earnings/Page 2
Significant GAAP items that have been excluded in calculating non-GAAP net income include the gain on the sale of the Company’s equity investment in Casa Systems in this year’s first quarter, deferred revenue adjustments related to recent acquisitions, restructuring charges, reversal of deferred tax valuation allowance, amortization of intangible assets and stock compensation expense. A reconciliation of GAAP net income to non-GAAP net income is attached to this release and is available on the Company’s website (http://www.schange.com/ir).
The Company ended the third quarter of fiscal 2011 with cash, cash equivalents and marketable securities of $75.0 million and no debt compared with $76.3 million and no debt at the end of the second quarter of fiscal 2011. The use of cash during this year’s third quarter was driven by acquisition payments to the former shareholders of eventIS and VividLogic, higher accounts receivable and capital expenditures that were partially offset by higher accounts payable.
Segment Revenue Results
Total revenues from the Company’s Software segment in the third quarter of fiscal 2011 were $34.8 million, which were $0.9 million lower than Software segment revenues of $35.7 million generated in last year’s third quarter. The decrease in Software segment revenues between years was attributable to lower VOD software licensing revenue from North American customers. This decrease was partially offset by higher Advertising software revenue and the inclusion of VividLogic and eventIS revenue in this year’s third quarter.
The Servers & Storage segment generated $6.2 million in revenue for the third quarter of fiscal 2011 which was $6.2 million lower than revenue for the third quarter of fiscal 2010. The decline in revenue was mainly due to lower VOD server shipments to customers in North America and Latin America combined with the impact of an isolated warranty-related return of product from a customer resulting in the reduction of previously recorded revenue.
The Media Services operating segment revenue for the third quarter of fiscal 2011 of $8.1 million was $2.9 million, or 56% higher than comparable revenue from last year’s third quarter. The significant increase in Media Services revenues between the third quarter of this year compared to last year was the result of newer contract revenues from customers in France and Dubai, as well as increased content processing fees from a customer in Greece.
(more)
SeaChange Q3 FY11 Earnings/Page 3
“SeaChange is in a great position given our customer base and 60-plus percent recurring revenue,” said Bill Styslinger, SeaChange CEO & Chairman. “As we continue to build our software-centric portfolio, we are focused on creating shareholder value. In the software sector, we continue to see year over year growth, and our Media Services saw another period of rapid growth. On the servers and storage side of the business, we have reduced costs and are focused on driving the hardware business to profitability. We are proud to be ranked amongst the Software Magazine Software 500 and to be considered one of the largest software companies in the world.”
Styslinger continued, “Q4 non GAAP revenue guidance is $55M to $59M with a non GAAP EPS range of $0.15 to $0.19. The strong guidance is primarily due to expectations for higher software license revenue in North America.”
The Company will discuss its financial results and business outlook in more detail today during its webcast conference call at 5:00 p.m. EST, which will be available live and archived at www.schange.com/IR/.
About SeaChange International
SeaChange International (NASDAQ: SEAC) is a global leader in multi-screen video and one of the largest software companies worldwide. The Company provides innovative, Emmy award-winning solutions and services for back office, advertising, content, in-home devices and broadcast to hundreds of media companies, including blue chip companies such as Comcast, Virgin Media, AT&T, Hutchison Whampoa, Vodacom and DISH Network. Headquartered in Acton, Massachusetts, SeaChange has product development, support and sales offices around the world. Visit www.schange.com
(more)
SeaChange Q3 FY11 Earnings/Page 4
Safe Harbor Provision
Any statements contained in this document, including the accompanying prepared remarks of the Company’s Chief Executive Officer and Chairman, that do not describe historical facts, including without limitation statements concerning expected future performance, product introductions and general market conditions, may constitute forward-looking statements as that term is defined in the Private Securities Litigation Reform Act of 1995. Any such forward-looking statements contained herein are based on current expectations, but are subject to a number of risks and uncertainties that may cause actual results to differ materially from expectations. The factors that could cause actual future results to differ materially from current expectations include the following: the Company’s dependence on the continued spending of customers on video systems and services; the continued growth, development and acceptance of the video-on-demand market; the impact of worldwide economic cycles; the impact of measures the Company has taken to address slowdowns in the market for the Company’s products and services; the loss of one of the Company's large customers; the cancellation or deferral of purchases of the Company's products; a decline in demand or average selling price for the Company’s products; the Company's ability to manage its growth; unanticipated delays in or costs and expenses relating to implementation of cost reduction or other restructuring plans, including with respect to the server and storage business; the risks associated with international sales, including risks associated with changes in foreign currency exchange rates; the Company's ability to protect its intellectual property rights and the expenses that may be incurred by the Company to protect its intellectual property rights; an unfavorable result in current and any future litigation in which the Company is involved; content providers limiting the scope of content licensed for use in the video-on-demand market; the Company's ability to introduce new products or enhancements to existing products; the Company's dependence on certain sole source suppliers and third-party manufacturers; the Company’s ability to obtain licenses or distribution rights for third-party technology at acceptable prices; the Company's ability to compete in its marketplace; the Company's ability to respond to changing technologies; the performance of companies in which the Company has made equity investments, including On Demand Deutschland GmBH & Co. KG; the ability of the Company to realize the benefits of its acquisitions of eventIS Group B.V. and VividLogic, Inc. and to integrate these and any future acquisitions; future acquisitions or joint ventures that are unsuccessful; impairment of the Company’s goodwill or intangible assets; risks in the Company’s investments that adversely affect the value or liquidity of the investments; changes in the regulatory environment; the Company's ability to hire and retain highly skilled employees; any weaknesses over internal controls over financial reporting; any additional tax liabilities that the Company may be subject to; system errors, failures or disruptions; and volatility of the Company’s stock price.
Further information on factors that could cause actual results to differ from those anticipated is detailed in various publicly available documents made by the Company from time to time with the Securities and Exchange Commission, including but not limited to, those appearing at Item 1A under the caption "Risk Factors" in the Company's Annual Report on Form 10-K filed with the Commission on April 9, 2010. Any forward-looking statements should be considered in light of those factors. The Company cautions readers not to place undue reliance on any such forward-looking statements, which speak as of the date they are made.
(more)
SeaChange Q3 FY11 Earnings/Page 5
The Company disclaims any obligation to publicly update or revise any such statements to reflect any change in Company expectations or events, conditions or circumstances on which any such statements may be based, or that may affect the likelihood that actual results may differ from those set forth in the forward-looking statements.
Use of Non-GAAP Financial Information
To supplement our financial results presented in accordance with Generally Accepted Accounting Principles (GAAP), this press release and the accompanying tables contain certain non-GAAP financial measures that we believe are helpful in understanding our past financial performance and future results. Our non-GAAP financial measures are not meant to be considered in isolation or as a substitute for comparable GAAP measures and should be read in conjunction with our consolidated financial statements prepared in accordance with GAAP. Our management regularly uses our supplemental non-GAAP financial measures internally to understand and manage our business and make operating decisions. Our non-GAAP financial measures include adjustments based on the following items, as well as the related income tax effects and adjustments to the valuation allowance:
Deferred software revenue: Business combination accounting rules require us to account for the fair value of customer contracts assumed in connection with our acquisitions. In connection with the acquisitions of eventIS Group B.V. on September 1, 2009 and VividLogic, Inc. on February 1, 2010, the book value of our deferred software revenue was reduced by approximately $6.0 million in the adjustment to fair value. Because these customer contracts may take up to 18 months to complete, our GAAP revenues subsequent to these acquisitions do not reflect the full amount of software revenues on assumed customer contracts that would have otherwise been recorded by eventIS Group B.V. and VividLogic, Inc. We believe this adjustment is useful to investors as a measure of the ongoing performance of our business because we have historically experienced high renewal rates on similar customer contracts, although we cannot be certain that customers will renew these contracts.
Stock-based compensation expenses: We have excluded the effect of stock-based compensation and stock-based payroll expenses from our non-GAAP operating expenses and net income measures. Although stock-based compensation is a key incentive offered to our employees, we continue to evaluate our business performance excluding stock-based compensation expenses. Stock-based compensation expenses will recur in future periods.
Amortization of intangible assets: We have excluded the effect of amortization of intangible assets from our non-GAAP operating expenses and net income measures. Amortization of intangibles is inconsistent in amount and frequency and is significantly affected by the timing and size of our acquisitions. Investors should note that the use of intangible assets contributed to revenues earned during the periods presented and will contribute to future period revenues as well. Amortization of intangibles assets will recur in future periods.
(more)
SeaChange Q3 FY11 Earnings/Page 6
Acquisition related and other expenses: We incurred significant expenses in connection with our acquisitions of eventIS Group B.V. and VividLogic, Inc. and also incurred certain other operating expenses, which we generally would not have otherwise incurred in the periods presented as a part of our continuing operations. Acquisition related and other expenses consist of transaction costs, costs for transitional employees, other acquired employee related costs, integration related professional services and the change of fair value related to contingent considerations. We believe it is useful for investors to understand the effects of these items on our total operating expenses.
Restructuring: We incurred significant expenses in connection with selected headcount reductions
a write-down of inventory to net realizable value reflecting the discontinuance of certain inventory components and the disposal of fixed assets. We believe it is useful for investors to understand the effects of these items on our total operating expense.
Gain on sale of equity investment: This reflects the gain, excluding any tax effects, on the sale of our investment in Casa Systems. This is considered a one-time event and not included in the financial results of our continuing operations.
Income tax benefit (provision): The income tax adjustment reflects the effective tax rate for the year in which the non-GAAP adjustment occurs and excludes any changes in the tax valuation allowance arising from the gain on the sale of the equity investment in Casa Systems.
(more)
SeaChange Q3 FY11 Earnings/Page 7
| SeaChange International, Inc. | |
| Condensed Consolidated Balance Sheets | |
| (in thousands, except share data) | |
| | | | | | | |
| | | October 31, 2010 | | | January 31, 2010 | |
| Assets | | (unaudited) | | | | |
| Current assets: | | | | | | |
| Cash and cash equivalents | | $ | 61,417 | | | $ | 37,647 | |
| Restricted cash | | | 1,335 | | | | 73 | |
| Marketable securities | | | 5,077 | | | | 2,114 | |
| Accounts receivable, net | | | 49,603 | | | | 54,278 | |
| Inventories, net | | | 15,489 | | | | 17,830 | |
| Prepaid expenses and other current assets | | | 5,465 | | | | 7,253 | |
| Deferred tax asset | | | 4,326 | | | | 2,474 | |
| Total current assets | | | 142,712 | | | | 121,669 | |
| Property and equipment, net | | | 37,808 | | | | 39,682 | |
| Marketable securities, long-term | | | 7,205 | | | | 8,688 | |
| Investments in affiliates | | | 4,799 | | | | 13,697 | |
| Intangible assets, net | | | 32,251 | | | | 26,264 | |
| Goodwill | | | 67,002 | | | | 55,876 | |
| Other assets | | | 3,328 | | | | 1,271 | |
| Total assets | | $ | 295,105 | | | $ | 267,147 | |
| | | | | | | | | |
| | | | | | | | | |
| Liabilities and Stockholders’ Equity | | | | | | | | |
| Current liabilities: | | | | | | | | |
| Accounts payable | | $ | 11,070 | | | $ | 10,371 | |
| Other accrued expenses | | | 14,938 | | | | 11,174 | |
| Customer deposits | | | 3,259 | | | | 4,279 | |
| Deferred revenues | | | 32,521 | | | | 34,158 | |
| Deferred tax liability | | | 717 | | | | 800 | |
| Total current liabilities | | | 62,505 | | | | 60,782 | |
| Deferred revenue, long-term | | | 12,864 | | | | 12,635 | |
| Long term liabilities | | | 11,087 | | | | 6,574 | |
| Distribution and losses in excess of investment | | | 1,836 | | | | 1,469 | |
| Deferred tax liabilities | | | 7,516 | | | | 7,765 | |
| Total liabilities | | | 95,808 | | | | 89,225 | |
| | | | | | | | | |
| Stockholders’ equity: | | | | | | | | |
| Common stock | | | 316 | | | | 326 | |
| Additional paid-in capital | | | 205,487 | | | | 211,504 | |
| Treasury stock | | | (1 | ) | | | (8,757 | ) |
| Accumulated earning (deficit) | | | 1,166 | | | | (17,450 | ) |
| Accumulated other comprehensive loss | | | (7,671 | ) | | | (7,701 | ) |
| Total stockholders’ equity | | | 199,297 | | | | 177,922 | |
| Total liabilities and stockholders’ equity | | $ | 295,105 | | | $ | 267,147 | |
(more)
SeaChange Q3 FY11 Earnings/Page 8
| SeaChange International, Inc. | |
| Condensed Consolidated Statement of Operations - Unaudited | |
| (in thousands, except per share data) | |
| | | | | | | | | | | | | |
| | | Three Months Ended | | | Nine Months Ended | |
| | | October 31, 2010 | | | October 31, 2009 | | | October 31, 2010 | | | October 31, 2009 | |
| | | | | | | | | | | | | |
| Revenues | | $ | 49,135 | | | $ | 53,290 | | | $ | 155,360 | | | $ | 148,673 | |
| Cost of revenues | | | 25,894 | | | | 25,733 | | | | 79,881 | | | | 72,384 | |
| Gross profit | | | 23,241 | | | | 27,557 | | | | 75,479 | | | | 76,289 | |
| | | | | | | | | | | | | | | | | |
| Operating expenses: | | | | | | | | | | | | | | | | |
| Research and development | | | 11,570 | | | | 13,353 | | | | 37,351 | | | | 37,433 | |
| Selling and marketing | | | 5,726 | | | | 7,067 | | | | 18,315 | | | | 19,582 | |
| General and administrative | | | 6,112 | | | | 5,986 | | | | 18,089 | | | | 16,036 | |
| Amortization of intangibles | | | 805 | | | | 571 | | | | 2,512 | | | | 1,844 | |
| Restructuring | | | 2,435 | | | | - | | | | 6,944 | | | | - | |
| | | | 26,648 | | | | 26,977 | | | | 83,211 | | | | 74,895 | |
| (Loss) income from operations | | | (3,407 | ) | | | 580 | | | | (7,732 | ) | | | 1,394 | |
| Gain on sale of investment in affiliate | | | - | | | | - | | | | 25,188 | | | | - | |
| Other income (expense), net | | | 173 | | | | 455 | | | | (257 | ) | | | 739 | |
| Income (loss) before income taxes and equity loss in earnings of affiliates | | | (3,234 | ) | | | 1,035 | | | | 17,199 | | | | 2,133 | |
| Income tax (provision) benefit | | | (1,942 | ) | | | (105 | ) | | | 1,700 | | | | (337 | ) |
| Equity loss in earnings of affiliates | | | (39 | ) | | | (273 | ) | | | (284 | ) | | | (517 | ) |
| Net (loss) income | | $ | (5,215 | ) | | $ | 657 | | | $ | 18,615 | | | $ | 1,279 | |
| Basic (loss) income per share | | $ | (0.17 | ) | | $ | 0.02 | | | $ | 0.59 | | | $ | 0.04 | |
| Diluted (loss) income per share | | $ | (0.17 | ) | | $ | 0.02 | | | $ | 0.58 | | | $ | 0.04 | |
| Weighted average common shares outstanding: | | | | | | | | | | | | | | | | |
| Basic | | | 31,496 | | | | 30,871 | | | | 31,409 | | | | 30,838 | |
| Diluted | | | 31,496 | | | | 31,659 | | | | 31,929 | | | | 31,407 | |
(more)
SeaChange Q3 FY11 Earnings/Page 9
| SeaChange International, Inc. | |
| Condensed Consolidated Operating Segments - Unaudited | |
| (in thousands) | |
| | | | | | | | | | | | | |
| | | Three Months Ended | | | Nine Months Ended | |
| | | October 31, 2010 | | | October 31, 2009 | | | October 31, 2010 | | | October 31, 2009 | |
| Software | | | | | | | | | | | | |
| Revenue: | | | | | | | | | | | | |
| Products | | $ | 15,543 | | | $ | 19,167 | | | $ | 51,712 | | | $ | 49,876 | |
| Services | | | 19,293 | | | | 16,578 | | | | 58,789 | | | | 46,547 | |
| Total revenue | | | 34,836 | | | | 35,745 | | | | 110,501 | | | | 96,423 | |
| Gross profit | | | 18,940 | | | | 22,416 | | | | 59,902 | | | | 58,354 | |
| Operating expenses: | | | | | | | | | | | | | | | | |
| Research and development | | | 9,074 | | | | 10,437 | | | | 28,934 | | | | 29,233 | |
| Selling and marketing | | | 4,395 | | | | 4,868 | | | | 13,241 | | | | 12,550 | |
| General and administrative | | | 421 | | | | 173 | | | | 935 | | | | 173 | |
| Amortization of intangibles | | | 733 | | | | 635 | | | | 2,300 | | | | 1,404 | |
| Restructuring | | | 344 | | | | - | | | | 878 | | | | - | |
| | | | 14,967 | | | | 16,113 | | | | 46,288 | | | | 43,360 | |
| Income from operations | | $ | 3,973 | | | $ | 6,303 | | | $ | 13,614 | | | $ | 14,994 | |
| | | | | | | | | | | | | | | | | |
| Servers and Storage | | | | | | | | | | | | | | | | |
| Revenue: | | | | | | | | | | | | | | | | |
| Products | | $ | 2,835 | | | $ | 8,182 | | | $ | 13,281 | | | $ | 26,441 | �� |
| Services | | | 3,358 | | | | 4,179 | | | | 9,973 | | | | 11,804 | |
| Total revenue | | | 6,193 | | | | 12,361 | | | | 23,254 | | | | 38,245 | |
| Gross profit | | | 3,089 | | | | 4,238 | | | | 11,147 | | | | 16,392 | |
| Operating expenses: | | | | | | | | | | | | | | | | |
| Research and development | | | 2,497 | | | | 2,916 | | | | 8,417 | | | | 8,200 | |
| Selling and marketing | | | 1,331 | | | | 2,199 | | | | 5,074 | | | | 7,032 | |
| Restructuring | | | 2,090 | | | | - | | | | 5,155 | | | | - | |
| | | | 5,918 | | | | 5,115 | | | | 18,646 | | | | 15,232 | |
| Income (loss) from operations | | $ | (2,829 | ) | | $ | (877 | ) | | $ | (7,499 | ) | | $ | 1,160 | |
| | | | | | | | | | | | | | | | | |
| Media Services | | | | | | | | | | | | | | | | |
| Service revenue | | $ | 8,106 | | | $ | 5,184 | | | $ | 21,605 | | | $ | 14,005 | |
| Gross profit | | | 1,213 | | | | 903 | | | | 4,431 | | | | 1,543 | |
| Operating expenses: | | | | | | | | | | | | | | | | |
| General and administrative | | | 1,408 | | | | 824 | | | | 3,114 | | | | 2,247 | |
| Amortization of intangibles | | | 73 | | | | (64 | ) | | | 213 | | | | 440 | |
| | | | 1,481 | | | | 760 | | | | 3,327 | | | | 2,687 | |
| Income (loss) from operations | | $ | (268 | ) | | $ | 143 | | | $ | 1,104 | | | $ | (1,144 | ) |
| | | | | | | | | | | | | | | | | |
| Unallocated Corporate | | | | | | | | | | | | | | | | |
| Operating expenses: | | | | | | | | | | | | | | | | |
| General and administrative | | $ | 4,283 | | | $ | 4,989 | | | $ | 14,039 | | | $ | 13,616 | |
| Restructuring | | | - | | | | - | | | | 912 | | | | - | |
| Total unallocated corporate expenses | | $ | 4,283 | | | $ | 4,989 | | | $ | 14,951 | | | $ | 13,616 | |
| | | | | | | | | | | | | | | | | |
| Consolidated income (loss) from operations | | $ | (3,407 | ) | | $ | 580 | | | $ | (7,732 | ) | | $ | 1,394 | |
(more)
SeaChange Q3 FY11 Earnings/Page 10
| SeaChange International, Inc. | | | | | | | | | | | | | | | | | | | |
| Reconciliation of Selected GAAP Measures to Non-GAAP Measures - Unaudited | | | | | | | | | | | | | | | | | | | |
| (in thousands) | | | | | | | | | | | | | | | | | | | |
| | | | | | | | | | | | | | | | | | | | | | | | | | | | | | | | | | | | | |
| | | Three months Ended | | | Three months Ended | | | Nine Months Ended | | | Nine Months Ended | |
| | | October 31, 2010 | | | October 31, 2009 | | | October 31, 2010 | | | October 31, 2009 | |
| | | GAAP | | | Adjustment | | | Non-GAAP | | | GAAP | | | Adjustment | | | Non-GAAP | | | GAAP | | | Adjustment | | | Non-GAAP | | | GAAP | | | Adjustment | | | Non-GAAP | |
Revenues (1) | | $ | 49,135 | | | $ | 785 | | | $ | 49,920 | | | | 53,290 | | | $ | 731 | | | $ | 54,021 | | | $ | 155,360 | | | $ | 3,888 | | | $ | 159,248 | | | $ | 148,673 | | | $ | 731 | | | $ | 149,404 | |
| | | | | | | | | | | | | | | | | | | | | | | | | | | | | | | | | | | | | | | | | | | | | | | | | |
| Operating expenses | | | 26,648 | | | | | | | | 26,648 | | | | 26,977 | | | | | | | | 26,977 | | | | 83,211 | | | | | | | | 83,211 | | | | 74,895 | | | | | | | | 74,895 | |
| Stock-based compensation (2) | | | - | | | | 413 | | | | 413 | | | | - | | | | 870 | | | | 870 | | | | - | | | | 1,258 | | | | 1,258 | | | | - | | | | 2,365 | | | | 2,365 | |
| Amortization of intangible assets (3) | | | - | | | | 1,271 | | | | 1,271 | | | | - | | | | 1,016 | | | | 1,016 | | | | - | | | | 3,916 | | | | 3,916 | | | | - | | | | 2,393 | | | | 2,393 | |
| Restructuring (4) | | | - | | | | 2,435 | | | | 2,435 | | | | - | | | | - | | | | - | | | | - | | | | 6,944 | | | | 6,944 | | | | - | | | | - | | | | - | |
| Acquisition related costs (5) | | | - | | | | 105 | | | | 105 | | | | - | | | | 430 | | | | 430 | | | | - | | | | 1,134 | | | | 1,134 | | | | - | | | | 960 | | | | 960 | |
| | | | 26,648 | | | | 4,224 | | | | 22,424 | | | | 26,977 | | | | 2,316 | | | | 24,661 | | | | 83,211 | | | | 13,252 | | | | 69,959 | | | | 74,895 | | | | 5,718 | | | | 69,177 | |
| | | | | | | | | | | | | | | | | | | | | | | | | | | | | | | | | | | | | | | | | | | | | | | | | |
| (Loss) income from operations | | | (3,407 | ) | | | 5,009 | | | | 1,602 | | | | 580 | | | | 3,047 | | | | 3,627 | | | | (7,732 | ) | | | 17,140 | | | | 9,408 | | | | 1,394 | | | | 6,449 | | | | 7,843 | |
| | | | | | | | | | | | | | | | | | | | | | | | | | | | | | | | | | | | | | | | | | | | | | | | | |
| Income from sale of investment in affiliate (6) | | | - | | | | - | | | | - | | | | - | | | | - | | | | - | | | | 25,188 | | | | (25,188 | ) | | | - | | | | - | | | | - | | | | - | |
| | | | | | | | | | | | | | | | | | | | | | | | | | | | | | | | | | | | | | | | | | | | | | | | | |
| Income tax benefit (provision) impact (7) | | | (1,942 | ) | | | 1,667 | | | | (275 | ) | | | (105 | ) | | | (309 | ) | | | (414 | ) | | | 1,700 | | | | (3,118 | ) | | | (1,418 | ) | | | (337 | ) | | | (1,019 | ) | | | (1,356 | ) |
| | | | | | | | | | | | | | | | | | | | | | | | | | | | | | | | | | | | | | | | | | | | | | | | | |
| Net (loss) income | | | (5,215 | ) | | $ | 6,676 | | | $ | 1,461 | | | $ | 657 | | | $ | 2,738 | | | $ | 3,395 | | | $ | 18,615 | | | $ | (11,166 | ) | | $ | 7,449 | | | $ | 1,279 | | | $ | 5,430 | | | $ | 6,709 | |
| Diluted income per share | | $ | (0.17 | ) | | $ | 0.22 | | | $ | 0.05 | | | $ | 0.02 | | | $ | 0.09 | | | $ | 0.11 | | | $ | 0.58 | | | $ | (0.34 | ) | | $ | 0.24 | | | $ | 0.04 | | | $ | 0.17 | | | $ | 0.21 | |
| Diluted weighted average common shares outstanding | | | 31,496 | | | | 31,496 | | | | 31,496 | | | | 31,659 | | | | 31,659 | | | | 31,659 | | | | 31,929 | | | | 31,929 | | | | 31,929 | | | | 31,407 | | | | 31,407 | | | | 31,407 | |
| (1) | Business combination accounting rules require us to account for the fair value of deferred revenue assumed in connection with an acquisition. This non-GAAP adjustment reflects the full amount of software contract revenue that would otherwise have been recorded subsequent to our acquisitions of eventIS Group B.V. and VividLogic Inc. |
| | | | | | | | | | | | | | | | |
| (2) | For GAAP purposes, stock-based compensation is included in the following expense categories: |
| | | Three Months Ended | | | Nine Months Ended | |
| | | October 31, 2010 | | | October 31, 2009 | | | October 31, 2010 | | | October 31, 2009 | |
| Cost of revenues | | $ | 27 | | | $ | 168 | | | $ | 147 | | | $ | 479 | |
| Research and development | | | 108 | | | | 245 | | | | 339 | | | | 634 | |
| Selling and marketing | | | 72 | | | | 134 | | | | 270 | | | | 425 | |
| General and administrative | | | 206 | | | | 323 | | | | 502 | | | | 827 | |
| Total stock-based compensation | | $ | 413 | | | $ | 870 | | | $ | 1,258 | | | $ | 2,365 | |
| (3) | The intangible assets recorded at fair value as a result of our acquisitions are amortized over the estimated useful life of the related asset. Amortization expense related to intangible assets is included in the following expense categories: |
| | | Three Months Ended | | | Nine Months Ended | |
| | | October 31, 2010 | | | October 31, 2009 | | | October 31, 2010 | | | October 31, 2009 | |
| | | | | | | | | | | | | |
| Cost of revenues: | | $ | 466 | | | $ | 445 | | | $ | 1,404 | | | $ | 549 | |
| Operating expenses: | | | 805 | | | | 571 | | | | 2,512 | | | | 1,844 | |
| Total amortization of intangibles | | $ | 1,271 | | | $ | 1,016 | | | $ | 3,916 | | | $ | 2,393 | |
| (4) | We incurred severance costs in connection with selected reductions that impacted all but the Media Services segment. We also incurred charges to reflect the write-down of inventory to net realizable value reflecting the discontinuance of certain inventory components within the Servers and Storage segment due to technology changes and the disposal of fixed assets resulting from the restructuring. These expenses would not have otherwise occurred in the periods presented as part of our operating expenses. |
| | | | | | | | | | | | | | | | |
| (5) | We incurred expenses in connection with our acquisition of VividLogic Inc. which would not have otherwise occurred in the periods presented as part of our operating expenses and the change in the fair value of the contingent consideration. |
| | | | | | |
| | | | | | | | | | | | | | | | |
| (6) | Reflects the gain on the sale of the equity investment in Casa Systems. |
| | | | | | | | | | | | | | | | |
| (7) | The non-GAAP income tax adjustment reflects the effective income tax rate in which the non-GAAP adjustment occurs andexcludes any changes in the tax valuation allowance arising from the gain on the sale of the equity investment in Casa Systems, Inc. |
(more)
SeaChange Q3 FY11 Earnings/Page 11
SeaChange International, Inc.
Third Quarter Fiscal 2011 Financial Results
Prepared Remarks
Dec. 9, 2010
SeaChange is providing a copy of these prepared remarks in combination with its press release. This process and these remarks are offered to provide investors and analysts with additional time and detail for analyzing our financial results in advance of our quarterly conference call. As previously scheduled, the conference call will begin today, Dec. 9, 2010, at 5:00 p.m. E.T. and will include only brief comments followed by questions and answers. These prepared remarks will not be read on the call.
The conference call may be accessed using the following information:
- Telephone: 866-322-1550 (U.S.) and 973-200-3380 (international)
- Conference ID: 2701 5091
- Live webcast: www.schange.com/IR (An archived webcast will be available at this site.)
Fiscal 2011 Third Quarter Financial Discussion
Revenues for the third quarter of fiscal 2011 amounted to $49.1 million, which was $4.2 million lower than revenues of $53.3 million recorded in the third quarter of last year. Non-GAAP revenues for the third quarter were $49.9 million which were $4.1 million lower than last year’s third quarter revenue. This year’s third quarter revenue included a reduction in previously recorded Servers and Storage revenue of $1.9 million related to a return of VOD servers from a customer due to a warranty claim.
From an operating segment perspective, revenues from our Software segment for the quarter were $34.8 million which were $0.9 million lower than revenues of $35.7 million for the third quarter of fiscal 2010. Lower VOD software licensing revenues from North American customers were partially offset by higher Advertising Insertion software licensing revenues and the inclusion of eventIS and VividLogic revenues for a full quarter in this year’s third quarter compared to last year.
(more)
SeaChange Q3 FY11 Earnings/Page 12
Servers and Storage segment revenues of $6.2 million were $6.2 million lower than revenues of $12.4 million included in the third quarter of last year. The decrease in Servers and Storage revenues between years was due primarily to decreased shipments of VOD servers to North American and Latin American customers. In addition, as previously mentioned, this year’s third quarter revenue was adversely impacted by the return of VOD server product due to a customer warranty claim.
The Media Services segment generated revenues for the third quarter of $8.1 million which was $2.9 million or 56% higher than revenues of $5.2 million in the third quarter of fiscal 2010. The substantial increase in Media Services revenue in this year’s third quarter compared to last year was the result of revenue contributions from new contracts from customers in Dubai and France combined with increased content processing revenue from a customer in Greece. The impact of exchange rate differences on Media Services revenue between years was negligible.
Geographically, revenue for the third quarter of fiscal 2011 included 55% in North America, 33% in Europe, Middle East and Africa, 9% in Asia Pacific and 3% in Latin America. Comcast, Virgin Media and Cox Communications were 10% or greater customers in the third quarter of fiscal 2011.
Revenues for the first nine months of fiscal 2011 amounted to $155.4 million which were $6.7 million or 4.5% higher than the $148.7 million of revenues generated in the first nine months of fiscal 2010. Higher Media Services revenues derived from recent content processing contracts from customers in Dubai and France combined with the inclusion of eventIS and VividLogic revenues were partially offset by lower VOD and Broadcast server shipments principally to North American customers and lower VOD software licensing revenues.
Total gross margin of 47.3% for the third quarter of fiscal 2011 was 4.4 points lower than total gross margin of 51.7% for last year’s third quarter. Reviewing gross margin by business segment, Software segment gross margin for this year’s third quarter of 54.4% was 8.3 points lower than the gross margin of 62.7% for the third quarter of fiscal 2010. The decrease in software gross margin was primarily the result of lower Advertising software margins as well as lower VOD software subscription margins that were partially offset by higher middleware margins.
Servers and Storage gross margin of 49.9% for the third quarter for fiscal 2010 was 15.6 points higher than gross margin of 34.3% for the third quarter of fiscal 2010. The significant
(more)
SeaChange Q3 FY11 Earnings/Page 13
increase in gross margin for the Servers and Storage segment between years was due principally to last year’s third quarter including a sizable amount of shipments of lower margin VOD servers to a North American customer, while this year’s third quarter included favorable margin VOD server shipments to international customers.
Media Services gross margin of 15.0% for the third quarter of this year was 2.4 points lower than gross margin of 17.4% for the third quarter of last year. The decrease in gross margin between years was due mainly to delays in new launches that required the Q3 expenses of headcount and content acquisition specific to these upcoming launches.
Total gross margin for the first nine months of fiscal 2011 was 48.6% which was 2.7 points lower than total gross margin of 51.3% for the first nine months of last year. The decrease in gross margin for the first nine months of fiscal 2011 compared to the first nine months of fiscal 2010 was due primarily to lower VOD and Advertising software margins that were partially offset by higher customer mix-related VOD server margins and higher sales volume-related Media Services margins.
Operating expenses for the third quarter of $26.6 million were $0.4 million lower than the $27.0 million of operating expense incurred in the third quarter of last year. Additionally, the third quarter of last year did not include the full operating expenses of eventIS and VividLogic. This year’s third quarter included restructuring charges amounting to $2.4 million relating to severance costs for the reduction of 34 employees primarily in the Servers and Storage business segment and the write down of fixed assets in the Servers and Storage unit. Excluding the restructuring charges, the $2.8 million year over year reduction in operating expenses was the result of lower Servers and Storage and domestic Software headcount-related expenses combined with lower sales commission expense that were partially offset by higher domestic legal fees and higher professional fees related to the exploration of a public stock offering for Media Services.
For the first nine months of fiscal 2011, operating expense of $83.2 million were $8.3 million higher than operating expenses of $74.9 million for the first nine months of fiscal 2010. The increase in operating expenses between years is due to the restructuring charges incurred in fiscal 2011 combined with higher Media Services general and administrative expenses and higher legal expenses.
(more)
SeaChange Q3 FY11 Earnings/Page 14
Non-GAAP net income for this year’s third quarter of $1.5 million was $1.9 million lower that non-GAAP net income of $3.4 million for last year’s third quarter. The corresponding non-GAAP earnings per share for the third quarter of this year was $0.05 per share compared to $0.11 per share for the same period last year.
GAAP net loss for this year’s third quarter of $5.2 million or $0.17 per share compares to GAAP net income of $0.7 million or $0.02 per share for the third quarter of last year.
For the first nine months of fiscal 2011, non GAAP net income of $7.4 million or $0.24 per share was higher than non-GAAP net income of $6.7 million or $0.21 per share for the first nine months of last year.
For the first nine months of this fiscal year, GAAP net income of $18.6 million or $0.58 per share was significantly higher than GAAP net income of $1.3 million or $0.04 per share for the same period last year.
From a balance sheet perspective, the Company ended the third quarter of fiscal 2011 with cash and investments of $75.0 million and no debt compared to $76.3 million and no debt at July 31, 2010. The decrease in cash and investments in this year’s third quarter was the result of $3.3 million of acquisition payments made to the former shareholders of eventIS and VividLogic, $1.9 million of capital expenditures and an increase in accounts receivable that were partially offset by higher accounts payable.
(more)
SeaChange Q3 FY11 Earnings/Page 15
Strategic Update - Streaming and Storage
Transition underway: Q3 marks an important transition for the SeaChange server and storage business as it is executing on plans to make it breakeven by Q3, FY12.
Focus on the customer: As mentioned on the Q2 earnings call, SeaChange had looked at various strategic options earlier in the calendar year for the hardware business unit. It is critical that the customers’ best interest be kept in mind, as these customers are key to both the software and hardware side of the business. As SeaChange discussed the transition with customers, they have expressed an open-ness to the split of the two businesses, as long as their investments are protected. With the overseas move of the business and additional focus on next generation products, this can be assured as customers get to reap the benefit of additional R&D efforts and a solid upgrade path, while at the same time addressing the business unit’s breakeven goal for investors.
Next steps: The current actions have reduced the Servers & Storage business unit costs by approximately $3.2M annually primarily in R&D. Even though SeaChange is planning on a decline in revenue for the server business, with the restructuring SeaChange sees this as a profitable business once the transition is completed by the third quarter of next year. SeaChange has established an enviable customer base for servers and storage and believes the business plan ensures the best for SeaChange customers as well as maximizing the value of this asset for shareholders as the company continues to evolve as a software company.
(more)
SeaChange Q3 FY11 Earnings/Page 16
Software Margin Update
Gross Margin: SeaChange has given much thought to the current situation of lower margins, especially given the VividLogic and eventIS acquisitions. The company is in a technology and market transition. As the world moves to multiple screens R&D costs for software development are being controlled through lower margin professional services work, managed services, hardware intensive trials and small deployments. All of these are very positive signs for SeaChange, as customers are helping the company financially in developing next generation products, which SeaChange plans to evolve into higher margin software licensing revenue as customers deploy these products.
Operating Margin: The table below shows traditional GAAP and non-GAAP year to date operating margin performance for the software unit.
| | Q3 YTD FY 2011 |
| | Actual |
| Gross Margin | 54% |
| R&D | 26% |
| Sales & Marketing | 12% |
| G&A (incl. alloc. of Corp. G&A) | 12% |
| Amortization | 2% |
| Operating Margin - GAAP | 2% |
| Operating Margin – non-GAAP | 11% |
There have been investor questions regarding the 10% operating margin goal being GAAP vs. non-GAAP. Through this year’s third quarter, SeaChange met the 10% operating margin target non-GAAP, the difference between non-GAAP and GAAP being non-GAAP adjustments that improve reported GAAP operating margins including deferred revenue (4%), amortization and stock compensation expense (3%), restructuring (1%) and acquisition-related costs (1%). SeaChange expects to exceed the 10% non-GAAP operating margin target in the fourth quarter.
(more)
SeaChange Q3 FY11 Earnings/Page 17
Growth: SeaChange continues to focus on its revenue growth in the software sector. Year over year growth through Q3 is 15%, much of which was achieved through the acquisitions. SeaChange was fortunate enough to create dominant market share during the years of wide scale local ad insertion, it then created dominant market share in video on demand in North America during the time of rapid stream expansion. When the streaming growth in the US slowed, SeaChange focused on China, India, Latin America, and EMEA. The company now has leading market share in VOD software in three of these four areas, and the eventIS acquisition helped with this. The streaming growth is still in its infancy in these areas and the eventIS acquisition revenue is on track with the acquisition plan. The company likewise focused on forward looking products such as mobile, through the acquisition of Mobix, and next generation device software, through the acquisition of VividLogic. The VividLogic plan is currently exceeding the initial acquisition plan. These acquisitions are enabling SeaChange to focus on the next generation of product and licensing growth, although the company sees itself in a transition to the next big thing, which is multi-screen video.
Video services across the internet still represent a fraction of paid multichannel services. As cable operators add multiple screen services, the SeaChange platform, both in home and back office are helping them succeed. The goal for SeaChange has been to focus on market expansion and investment in the next generation product while waiting for this new growth, and the market indicators all show that there is indeed a great focus on television and VOD over new devices that generate new revenue opportunities for SeaChange. The current milestones for the company are early trials and deployments as were announced with Virgin Media (UK) and StarHub (Singapore) throughout Q3. This quarter SeaChange announced the next generation back office: Adrenalin, which provides a web centric IP-based back office platform that easily manages all screens and the transition of legacy systems to next generation systems. SeaChange will continue on its parallel tracks of market expansion through its acquisitions and new streaming growth through multiple screens through initial trials and early deployments.
(more)
SeaChange Q3 FY11 Earnings/Page 18
Market Overview
Software: SeaChange had several software milestones in Q3 as depicted below:
| 1. | SeaChange gained four new subscription customers, furthering the recurring revenue strategy. |
| 2. | There were three new customers that were competitive replacements in the US – one VOD, two advertising. |
| 3. | SeaChange is working an iPAD trial with a US operator. |
| 4. | The company is seeing very positive interest and opportunities in multi screen video, both in managed and over the top networks. |
| 5. | SeaChange announced two major three screen deployments: StarHub and Virgin Media. StarHub has mostly mobile subscribers and Virgin Media has mostly television subscribers, but both are offering television programming to all three screens: mobile, PC, and TV using SeaChange’s software and managed services. Although there is much multi-screen interest throughout the world, there are few customers that are actually providing video services to all three screens under one brand, so this is a major achievement for the industry as well as for SeaChange. |
| 6. | SeaChange continues to implement its linear ad solution with a large US telco, as started and announced in Q2 and announced a working relationship with Black Arrow to deliver on demand advertising solutions throughout North America. |
| 7. | The company won a new back office replacement order in Europe and obtained a new second-screen customer in Europe, which is targeted for operation in Q1. |
| 8. | The company expanded a new advertising and a new mobile customer in Asia. |
Streaming and Storage: SeaChange had several milestones in Q3 as depicted below:
| 1. | SeaChange video servers were selected for expansion business with a large North American operator. |
| 2. | SeaChange has several good international opportunities in the next six months. |
| 3. | The company expanded systems in Japan and was selected by a large operator in China. |
(more)
SeaChange Q3 FY11 Earnings/Page 19
On Demand Group (ODG): Media Services saw another period of rapid growth with revenue increasing 14% on the previous quarter to reach $8.1M. This result was 56% higher than the same quarter last year and now represents the eighth quarter of continuous growth for ODG. The increase in sales in the quarter was driven by the launch of the first ever subscription video on demand (SVOD) service in the Middle East (Du), the rapid launch of a Movie subscription Video on Demand service in France and the soft launch of mobile SVOD services on the mobile platform of Vodacom in South Africa (second largest brand in the Territory). All three launches represent major steps towards achieving the stated goal of lessening ODG’s dependence on U.K. cable. Gross margins were adversely affected this quarter for Media Services and have fallen from 17% to 15% due to delayed launches. In periods of growth ODG has to incur the content acquisition costs prior to new launches. This dip can reduce margins for several quarters.
As a result of the market success of the business, SeaChange hired a banker earlier this year to evaluate the possibility of the ODG business pursuing an IPO. The company received encouraging feedback from the bankers, but the recommendation was to not proceed at this time in order to maximize value for SeaChange shareholders. In the quarter, ODG expensed the IPO banking, legal and accounting work of over $300.000. In the mean time, ODG continues to invest in expansion and has a significant pipeline.
There has been much discussion about combining the ODG business unit with the software business unit as many SeaChange competitors, especially in the Over the Top (OTT) business, offer significant managed services as a means of offering software products. Likewise, SeaChange is seeing customers request managed services offerings in the multi-screen arena for their back-office software, and ODG is currently evaluating a FY12 OTT offering. This and the potential IPO remain strategic options for SeaChange and the company will evaluate the overall growth of the managed service business and the growth in multi screen closely in the upcoming 6 months to determine the best direction for the company’s success and shareholder value.
(more)
SeaChange Q3 FY11 Earnings/Page 20
Guidance
As mentioned on the Q2 earnings call, the business outlook for Q4 remains strong and Q3 was expected to be weaker in comparison to other quarters. The company expects a non-GAAP revenue in Q4 in the range of $55M to $59M and non-GAAP earnings in Q4 in the range of $0.15 to $0.19. The increase in revenue is primarily due to an expected increase in software licensing revenue in Q4 FY11.
Closing
SeaChange is proud of what it has accomplished in enabling video and advertising in new ways worldwide and the company is looking forward to continuing that as the world moves to more video on more devices. As a result of what the company has accomplished, it is ranked amongst the Software Magazine Software 500. The company plans to improve the top and bottom line performance and continues to look at monetizing or divesting non software businesses. Q3 R&D is 23.6% of revenue, and 45% of revenue in Q3 was international, thereby further diversifying the company. SeaChange would have been in the range for Q3 with the unexpected exception of the revenue adjustment in servers and the ODG IPO expense. With the transition to a software company well underway, the next goal is for SeaChange to address its valuation as a software company, as is discussed in the following section. SeaChange is in a great position given its customer base and 60% recurring revenue and the company sees investor value as the company strengthens its position as a software company. SeaChange is looking forward to talking with everyone on the Q3 earnings call.
(more)
SeaChange Q3 FY11 Earnings/Page 21
ADDENDUM
SeaChange is adding this Addendum to help explain the shareholder value proposition in its Software focus.
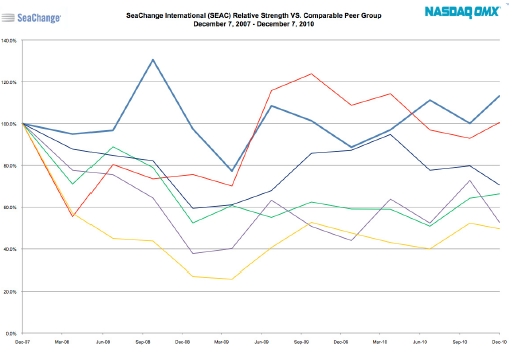
In Q3 SeaChange was listed as number 168 on the Software Magazines Software 500, which ranks software companies worldwide by revenue. Considering the company’s software and services growth this year, it is expected to move up further on this list in next year’s report. SeaChange is looking at modifying its stock comparables to be software centric as opposed to hardware centric. Typical companies that SeaChange is compared against today include Motorola, Cisco, Harmonic and Arris. The performance over the last three years of SeaChange vs. these companies is depicted in the chart below which is also linked here.
http://www.schange.com/Images/news/FY-2011-Q3-Press-Release/SeaChange_Relative_Strength_Chart
(more)
SeaChange Q3 FY11 Earnings/Page 22
Although SeaChange is often challenged about being flat over this time period, it is clear that most of SeaChange’s comparables have performed worse than SeaChange. However, given the performance of the SeaChange software business in comparison to similar software companies, the enterprise value of the SeaChange stock has the potential to be much higher. For the purpose of this exercise, SeaChange has compared several software companies around its position in the Software Magazine Software 500. Highlights of these companies are listed below:
| | | Software | | | | | | | | | | | | | | | | | | | | | Enterprise | |
| | | Magazine | | | | | | Revenue | | | Gross | | | | | | | | | Enterprise | | | Value/ | |
| Company | | Ranking | | | Revenue | | | Growth | | | Margin % | | | EBITDA | | | EBITDA % | | | Value * | | | Revenue | |
| Openwave | | | 155 | | | $ | 191.7 | | | | -4.6 | % | | | 60.9 | % | | | (63.4 | ) | | | -33.1 | % | | | 85.8 | | | | 0.45 | |
| Art Tech | | | 157 | | | $ | 179.4 | | | | 9.0 | % | | | 66.0 | % | | | 26.0 | | | | 14.5 | % | | | 795.7 | | | | 4.44 | |
| iPass | | | 161 | | | $ | 171.4 | | | | -10.4 | % | | | 39.7 | % | | | (8.3 | ) | | | -4.8 | % | | | 33.9 | | | | 0.20 | |
| NetSuite | | | 163 | | | $ | 166.5 | | | | 9.2 | % | | | 66.3 | % | | | 7.2 | | | | 4.3 | % | | | 1,640.0 | | | | 9.85 | |
| Kenexa | | | 165 | | | $ | 157.7 | | | | -22.6 | % | | | 66.1 | % | | | (14.4 | ) | | | -9.1 | % | | | 383.4 | | | | 2.43 | |
| Right Now | | | 167 | | | $ | 152.7 | | | | 8.7 | % | | | 68.9 | % | | | 10.2 | | | | 6.7 | % | | | 697.9 | | | | 4.57 | |
| SeaChange Software | | | 168 | | | $ | 151.1 | | | | 2.0 | % | | | 54.8 | % | | | 29.9 | | | | 19.8 | % | | | n/a | | | | n/a | |
SeaChange International, Inc | | | - | | | $ | 201.7 | | | | -0.1 | % | | | 51.2 | % | | | 13.8 | | | | 6.8 | % | | | 196.6 | | | | 0.97 | |
| Magma Design | | | 170 | | | $ | 147.0 | | | | -31.5 | % | | | 67.1 | % | | | (84.7 | ) | | | -57.7 | % | | | 269.1 | | | | 1.83 | |
| Analysts Int'l | | | 172 | | | $ | 143.2 | | | | -49.6 | % | | | 20.0 | % | | | (13.2 | ) | | | -9.2 | % | | | 6.1 | | | | 0.04 | |
| Synchronoss | | | 180 | | | $ | 128.8 | | | | 16.1 | % | | | 50.0 | % | | | 27.7 | | | | 21.5 | % | | | 837.9 | | | | 6.51 | |
| Bottomline | | | 181 | | | $ | 138.0 | | | | 5.2 | % | | | 55.9 | % | | | 7.6 | | | | 5.5 | % | | | 491.9 | | | | 3.56 | |
| Opnet | | | 184 | | | $ | 122.9 | | | | 21.2 | % | | | 74.5 | % | | | 11.9 | | | | 9.7 | % | | | 441.1 | | | | 3.59 | |
| | | | | | | | | | | | | | | | | | | | | | | | | | | | | | | | | |
| Median (ex SEAC) | | | | | | $ | 152.7 | | | | 5.2 | % | | | 66.0 | % | | | 7.2 | | | | 4.3 | % | | | 441.1 | | | | 3.56 | |
Note: Includes companies ranked 155-184, excluding companies where certain information not available
* Enterprise Value as of 12/06/10
By comparing SeaChange’s enterprise value vs. revenue to the composite enterprise value of these software companies, we can see that the valuation of SeaChange can be much higher.
Therefore moving towards a software valuation is a high priority for the company.
--end--