Exhibit 99.1
UBS 2007 MLP Conference Frank Semple – President and Chief Executive Officer Nancy Buese – Senior Vice President and Chief Financial Officer September 20, 2007 |
Forward-Looking Statements This presentation contains forward-looking statements and information. These forward-looking statements, which in many instances can be identified by words like “could,” “may,” “will,” “should,” “expects,” “plans,” “project,” “anticipates,” “believes,” “potential,” and other comparable words, regarding future or contemplated performance, transaction, or events, are based on MarkWest’s current information, expectations and beliefs, concerning future developments and their potential effects on MarkWest. Although we believe that the expectations reflected in the forward-looking statements, including those referring to future performance, growth, cash flow, income, distributions, coverage ratios, dividends, or other items or events, are reasonable, we can give no assurance that such expectations or the assumptions behind them will prove to be correct, or that projected performance or distributions will be achieved. The forward-looking statements involve a variety of risks and uncertainties as identified below, which should be carefully reviewed and considered. If any of the uncertainties or risks develop into actual events, or if underlying assumptions prove incorrect, it could cause actual results to vary significantly from those expressed in the presentation, and our business, financial condition, or results of operations could be materially adversely affected. Key uncertainties and risks that may directly affect MarkWest’s performance, future growth, results of operations, and financial condition, include: Fluctuations and volatility of natural gas, NGL products, and oil prices; A reduction in natural gas or refinery off-gas production which we gather, transport, process, and/or fractionate; A reduction in the demand for the products we produce and sell; Financial credit risks / failure of customers to satisfy payment or other obligations under our contracts; Effects of our debt and other financial obligations on our future financial or operational flexibility; Construction, procurement, and regulatory risks in our development projects; Hurricanes, fires, and other natural and accidental events impacting our operations; Terrorist attacks directed at our facilities or related facilities; Changes in and impacts of laws and regulations affecting our operations; and Failure to integrate recent or future acquisitions. |
Joint Proxy Statement / Prospectus MarkWest Energy Partners and MarkWest Hydrocarbon will file a joint proxy statement/prospectus and other documents with the Securities and Exchange Commission (the "SEC") in relation to the merger transaction announced on September 5, 2007. Investors and security holders are urged to read these documents carefully when they become available because they will contain important information regarding MarkWest Energy Partners, MarkWest Hydrocarbon, and the transaction. A definitive joint proxy statement/prospectus will be sent to security holders of MarkWest Energy Partners and MarkWest Hydrocarbon seeking their approval of the transactions contemplated by the redemption and merger agreement. Investors and security holders may obtain a free copy of the joint proxy statement/prospectus (when it is available) and other documents containing information about MarkWest Energy Partners and MarkWest Hydrocarbon, without charge, at the SEC’s website at www.sec.gov. Copies of the joint proxy statement/prospectus and the SEC filings that will be incorporated by reference in the joint proxy statement/prospectus may also be obtained free of charge by directing a request to the entities' investor relations department at 866-858-0482, or by accessing their website at www.markwest.com. MarkWest Energy Partners, MarkWest Hydrocarbon, the officers and directors of the general partner of MarkWest Energy Partners, and the officers and directors of MarkWest Hydrocarbon may be deemed to be participants in the solicitation of proxies from their security holders. Information about these persons can be found in the Annual Report on Form 10-K for each of MarkWest Energy Partners and MarkWest Hydrocarbon, as filed with the SEC, and additional information about such persons may be obtained from the joint proxy statement/prospectus when it becomes available. This document shall not constitute an offer to sell or the solicitation of an offer to buy any securities, nor shall there be any sale of securities in any jurisdiction in which such offer, solicitation, or sale would be unlawful prior to registration or qualification under the securities laws of any such jurisdiction. No offering of securities shall be made except by means of a prospectus meeting the requirements of the Securities Act of 1933, as amended. |
Non-GAAP Measures This presentation utilizes the Non-GAAP financial measures of Adjusted EBITDA and Distributable Cash Flow. We define Adjusted EBITDA as net income or loss before interest, provision for income taxes, depreciation and amortization expense, non-cash compensation expense, and non-cash unrealized derivative gain / loss . Adjusted EBITDA is not a measure of performance calculated in accordance with GAAP, and should not be considered in isolation or as a substitute for net income, income from operations, or cash flow as reflected in our financial statements. Adjusted EBITDA is presented because such information is relevant and is used by management, industry analysts, investors, lenders, and rating agencies to assess the financial performance and operating results of our fundamental business activities. Management believes that the presentation of Adjusted EBITDA is useful to lenders and investors because of its use in the midstream natural gas industry and for master limited partnerships as an indicator of the strength and performance of our ongoing business operations. Additionally, management believes that Adjusted EBITDA provides additional and useful information to our investors for trending, analyzing, and benchmarking our operating results from period to period as compared to other companies that may have different financing and capital structures. The presentation of Adjusted EBITDA allows investors to view our performance in a manner similar to the methods used by management and provides additional insight to our operating results. In general, we define Distributable Cash Flow as net income or loss plus (i) depreciation, amortization, and accretion expense; (ii) non-cash earnings from unconsolidated affiliates; (iii) contributions to unconsolidated affiliates net of expansion capital expenditures; (iv) non-cash compensation expense; (v) non-cash derivative activity; (vi) gains and losses on the sale of assets; and (vii) the subtraction of sustaining capital expenditures. Distributable Cash Flow is a significant liquidity metric used by our senior management to compare basic cash flows generated by us to the cash distributions we expect to pay partners. Distributable cash flow is also an important Non-GAAP financial measure for our limited partners since it serves as an indicator of our success in providing a cash return on investment. Distributable cash flow is also a quantitative standard used by the investment community with respect to publicly traded partnerships such as ours because the value of a partnership unit is in part measured by its yield (which in turn is based on the amount of cash distributions a partnership pays to a unit holder). The GAAP measure most directly comparable to Distributable Cash Flow and Adjusted EBITDA is net income. Please see the Appendix for our calculations of Adjusted EBITDA and Distributable Cash Flow along with the appropriate reconciliations. |
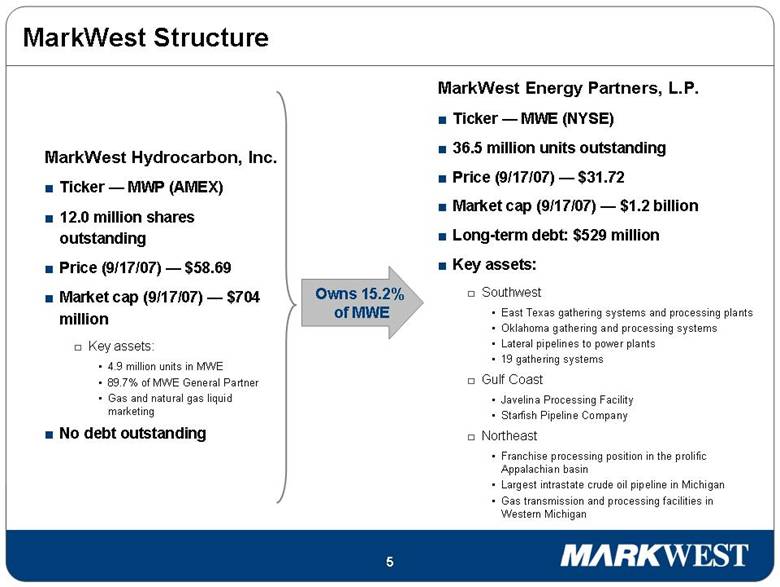
Owns 15.2% of MWE MarkWest Structure MarkWest Hydrocarbon, Inc. Ticker — MWP (AMEX) 12.0 million shares outstanding Price (9/17/07) — $58.69 Market cap (9/17/07) — $704 million Key assets: 4.9 million units in MWE 89.7% of MWE General Partner Gas and natural gas liquid marketing No debt outstanding MarkWest Energy Partners, L.P. Ticker — MWE (NYSE) 36.5 million units outstanding Price (9/17/07) — $31.72 Market cap (9/17/07) — $1.2 billion Long-term debt: $529 million Key assets: Southwest East Texas gathering systems and processing plants Oklahoma gathering and processing systems Lateral pipelines to power plants 19 gathering systems Gulf Coast Javelina Processing Facility Starfish Pipeline Company Northeast Franchise processing position in the prolific Appalachian basin Largest intrastate crude oil pipeline in Michigan Gas transmission and processing facilities in Western Michigan |
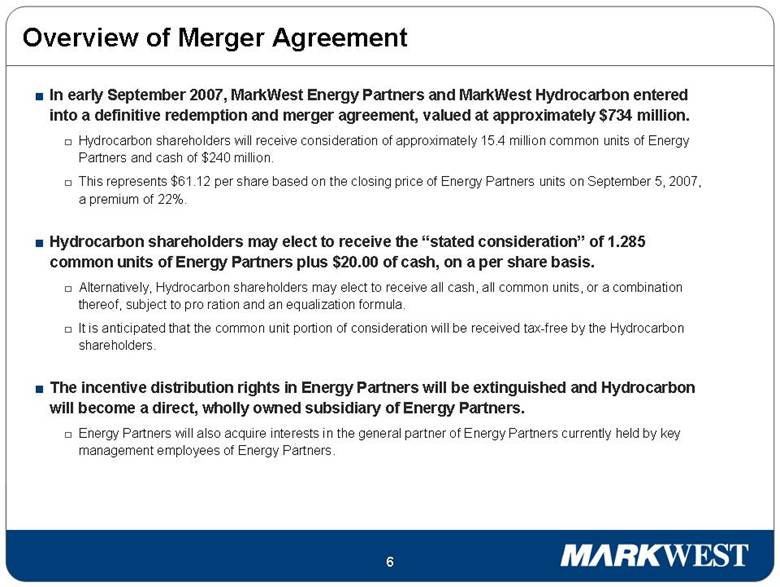
Overview of Merger Agreement In early September 2007, MarkWest Energy Partners and MarkWest Hydrocarbon entered into a definitive redemption and merger agreement, valued at approximately $734 million. Hydrocarbon shareholders will receive consideration of approximately 15.4 million common units of Energy Partners and cash of $240 million. This represents $61.12 per share based on the closing price of Energy Partners units on September 5, 2007, a premium of 22%. Hydrocarbon shareholders may elect to receive the “stated consideration” of 1.285 common units of Energy Partners plus $20.00 of cash, on a per share basis. Alternatively, Hydrocarbon shareholders may elect to receive all cash, all common units, or a combination thereof, subject to pro ration and an equalization formula. It is anticipated that the common unit portion of consideration will be received tax-free by the Hydrocarbon shareholders. The incentive distribution rights in Energy Partners will be extinguished and Hydrocarbon will become a direct, wholly owned subsidiary of Energy Partners. Energy Partners will also acquire interests in the general partner of Energy Partners currently held by key management employees of Energy Partners. |
Overview of Merger Agreement continued Other than the issuance of common units to acquire the outstanding shares of Hydrocarbon and to acquire certain interests in the general partner of Energy Partners, Energy Partners does not anticipate issuing units to raise equity capital to consummate the merger. The transaction is expected to be accretive in 2008 to the Energy Partners unitholders as measured by distributable cash flow per unit. The Energy Partners management team will continue in their roles and will manage the combined company. Three members of the board of directors of Hydrocarbon will join the board of directors of the general partner of Energy Partners. Timing Our goal is to file the proxy within 60 days of the September 5 announcement. The transaction requires shareholder and unitholder approval. Depending on the length of the SEC review process, we anticipate the transaction will close in the first quarter of 2008. |
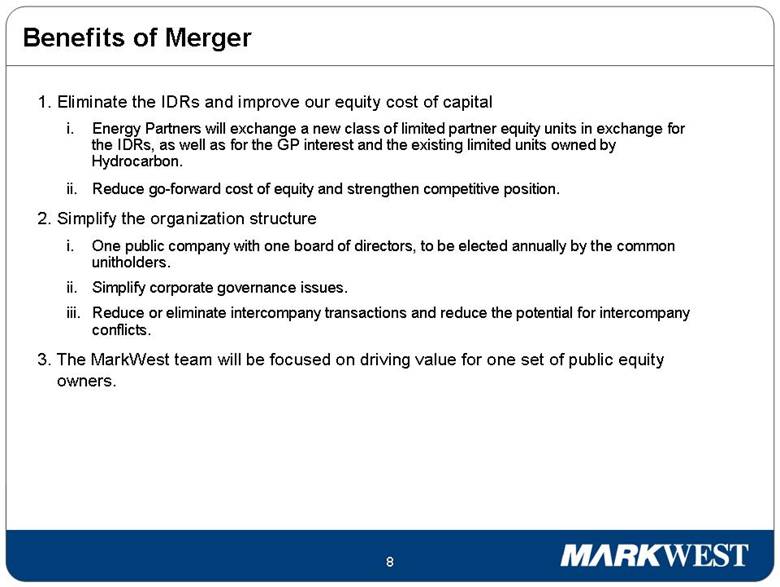
Benefits of Merger 1. Eliminate the IDRs and improve our equity cost of capital i. Energy Partners will exchange a new class of limited partner equity units in exchange for the IDRs, as well as for the GP interest and the existing limited units owned by Hydrocarbon. ii. Reduce go-forward cost of equity and strengthen competitive position. 2. Simplify the organization structure i. One public company with one board of directors, to be elected annually by the common unitholders. ii. Simplify corporate governance issues. iii. Reduce or eliminate intercompany transactions and reduce the potential for intercompany conflicts. 3. The MarkWest team will be focused on driving value for one set of public equity owners. |
Overview of Corporate Structure After the Merger Ownership Structure – Pro Forma Ownership Structure – Current Public 31.4MM MWE Common Units MarkWest Energy GP, L.L.C. MarkWest Energy Partners, L.P. 36.5MM Total Common Units 2.0% G.P. Interest and IDRs MarkWest Hydrocarbon, Inc. 4.9MM MWE Common Units 89.7% Officers / Directors 0.2MM MWE Common Units 5.5MM MWP Common Stock 10.3% 13.3% L.P. Interest 0.5% L.P. Interest 84.2% L.P. Interest Public 6.5MM MWP Common Stock 53.9% 46.1% MarkWest Energy Partners, L.P. 48.0MM total common units Public 100% L.P. Interest MarkWest Operating Subsidiaries MarkWest Energy GP, L.L.C. 100% Interest “Non-economic” G.P. Interest MarkWest Hydrocarbon, Inc. MWE Class A Units 100.0% Interest Dividend MarkWest Operating Subsidiaries |
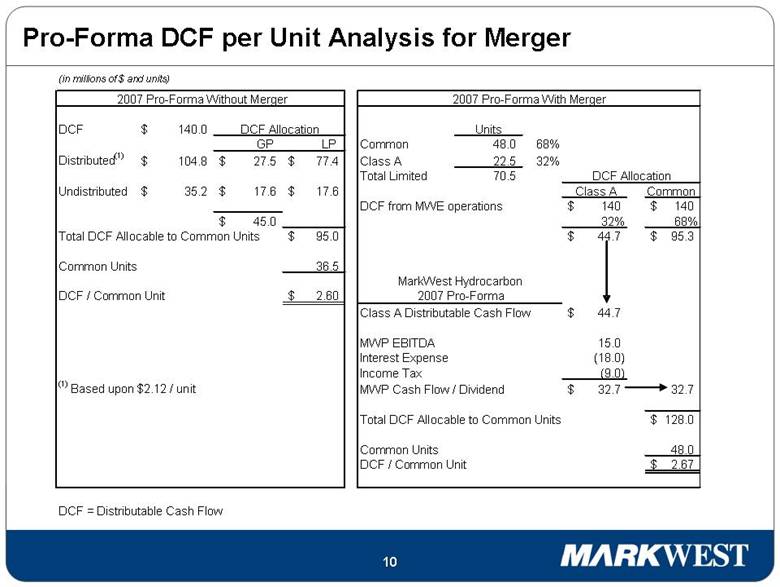
Pro-Forma DCF per Unit Analysis for Merger (in millions of $ and units) 2007 Pro-Forma Without Merger 2007 Pro-Forma With Merger DCF 140.0 $ DCF Allocation Units GP LP Common 48.0 68% Distributed (1) 104.8 $ 27.5 $ 77.4 $ Class A 22.5 32% Total Limited 70.5 DCF Allocation Undistributed 35.2 $ 17.6 $ 17.6 $ Class A Common DCF from MWE operations 140 $ 140 $ 45.0 $ 32% 68% Total DCF Allocable to Common Units 95.0 $ 44.7 $ 95.3 $ Common Units 36.5 MarkWest Hydrocarbon DCF / Common Unit 2.60 $ 2007 Pro-Forma Class A Distributable Cash Flow 44.7 $ MWP EBITDA 15.0 Interest Expense (18.0) Income Tax (9.0) (1) Based upon $2.12 / unit MWP Cash Flow / Dividend 32.7 $ 32.7 Total DCF Allocable to Common Units 128.0 $ Common Units 48.0 DCF / Common Unit 2.67 $ DCF = Distributable Cash Flow |
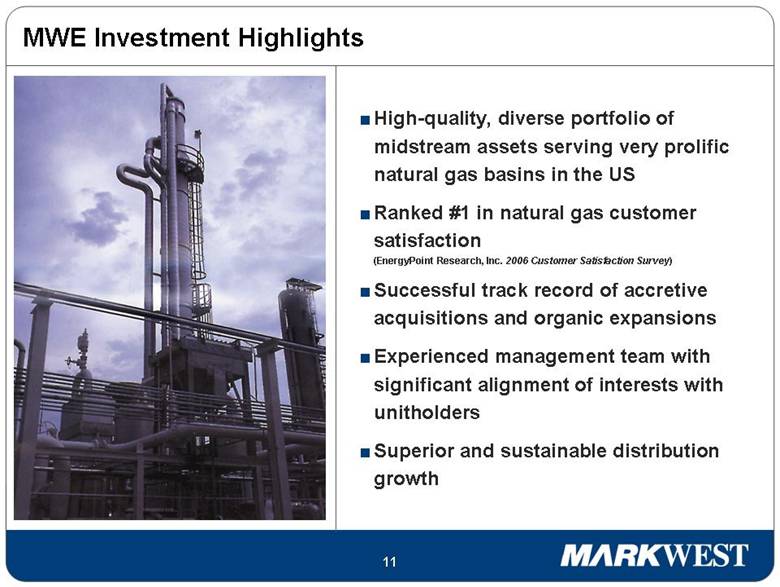
MWE Investment Highlights High-quality, diverse portfolio of midstream assets serving very prolific natural gas basins in the US Ranked #1 in natural gas customer satisfaction (EnergyPoint Research, Inc. 2006 Customer Satisfaction Survey) Successful track record of accretive acquisitions and organic expansions Experienced management team with significant alignment of interests with unitholders Superior and sustainable distribution growth |
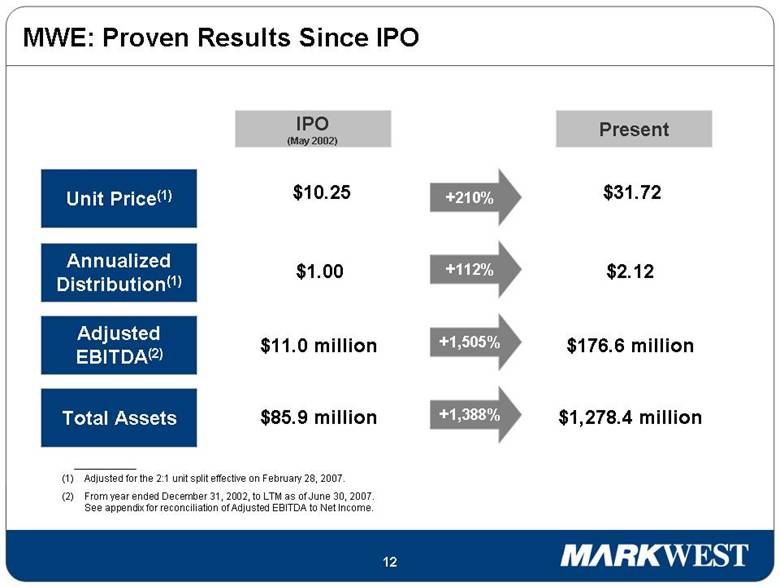
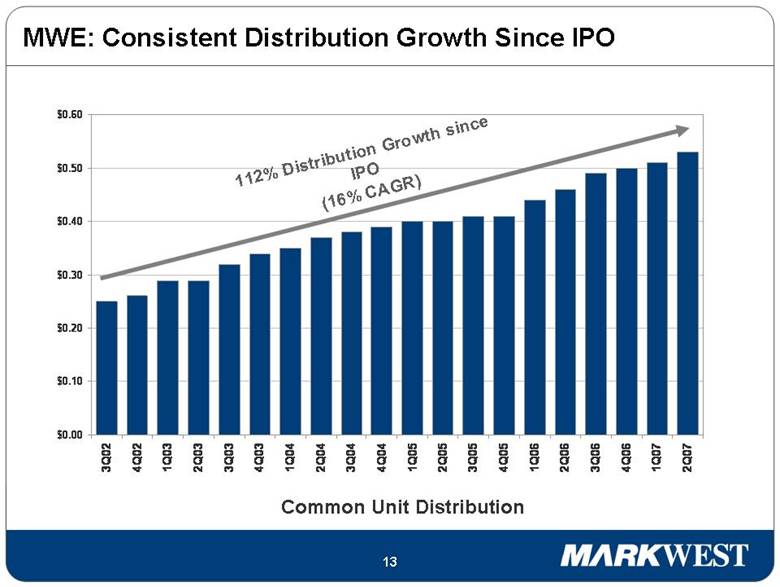
Adjusted for the 2:1 unit split effective on February 28, 2007. From year ended December 31, 2002, to LTM as of June 30, 2007. See appendix for reconciliation of Adjusted EBITDA to Net Income. MWE: Proven Results Since IPO $85.9 million $1,278.4 million +1,388% Total Assets $11.0 million $176.6 million Adjusted EBITDA(2) +1,505% $1.00 $2.12 Annualized Distribution(1) +112% $10.25 $31.72 Unit Price(1) +210% IPO (May 2002) Present |
MWE: Consistent Distribution Growth Since IPO 112% Distribution Growth since IPO (16% CAGR) Common Unit Distribution $0.00 $0.10 $0.20 $0.30 $0.40 $0.50 $0.60 3Q02 4Q02 1Q03 2Q03 3Q03 4Q03 1Q04 2Q04 3Q04 4Q04 1Q05 2Q05 3Q05 4Q05 1Q06 2Q06 3Q06 4Q06 1Q07 2Q07 |
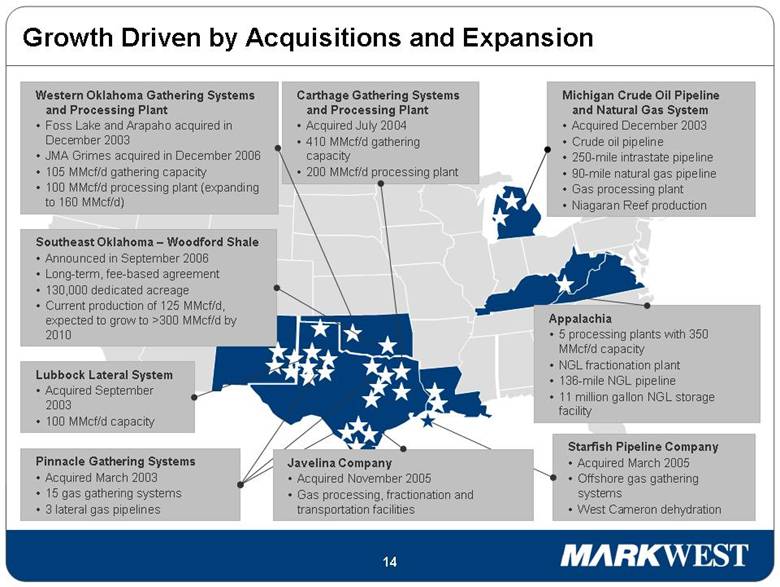
Western Oklahoma Gathering Systems and Processing Plant Foss Lake and Arapaho acquired in December 2003 JMA Grimes acquired in December 2006 105 MMcf/d gathering capacity 100 MMcf/d processing plant (expanding to 160 MMcf/d) Appalachia 5 processing plants with 350 MMcf/d capacity NGL fractionation plant 136-mile NGL pipeline 11 million gallon NGL storage facility Carthage Gathering Systems and Processing Plant Acquired July 2004 410 MMcf/d gathering capacity 200 MMcf/d processing plant Michigan Crude Oil Pipeline and Natural Gas System Acquired December 2003 Crude oil pipeline 250-mile intrastate pipeline 90-mile natural gas pipeline Gas processing plant Niagaran Reef production Pinnacle Gathering Systems Acquired March 2003 15 gas gathering systems 3 lateral gas pipelines Lubbock Lateral System Acquired September 2003 100 MMcf/d capacity Starfish Pipeline Company Acquired March 2005 Offshore gas gathering systems West Cameron dehydration Southeast Oklahoma – Woodford Shale Announced in September 2006 Long-term, fee-based agreement 130,000 dedicated acreage Current production of 125 MMcf/d, expected to grow to >300 MMcf/d by 2010 Growth Driven by Acquisitions and Expansion Javelina Company Acquired November 2005 Gas processing, fractionation and transportation facilities |
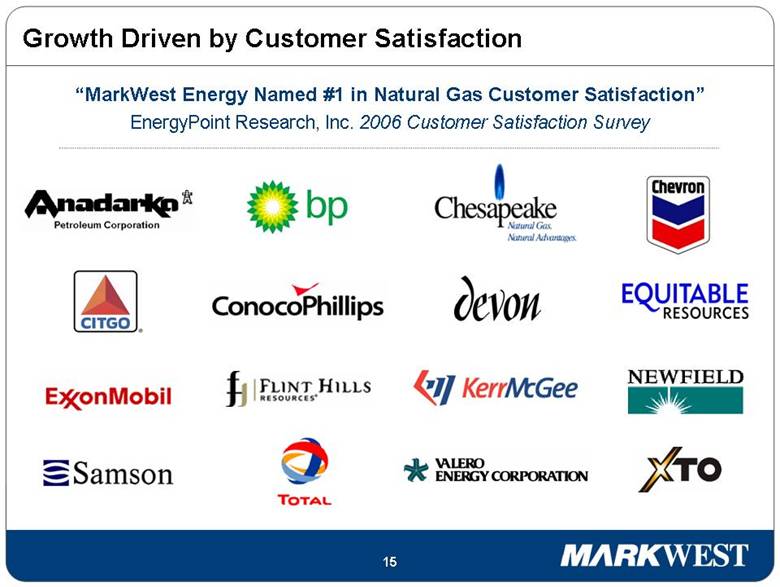
“MarkWest Energy Named #1 in Natural Gas Customer Satisfaction” EnergyPoint Research, Inc. 2006 Customer Satisfaction Survey Growth Driven by Customer Satisfaction |
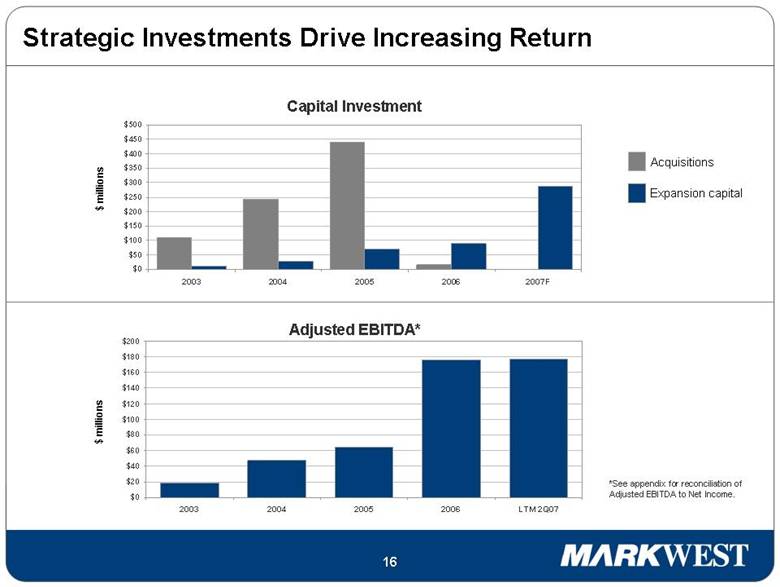
Capital Investment $ millions $ millions Adjusted EBITDA* *See appendix for reconciliation of Adjusted EBITDA to Net Income. Acquisitions Expansion capital Strategic Investments Drive Increasing Return $0 $50 $100 $150 $200 $250 $300 $350 $400 $450 $500 2003 2004 2005 2006 2007F $0 $20 $40 $60 $80 $100 $120 $140 $160 $180 $200 2003 2004 2005 2006 LTM 2Q07 |
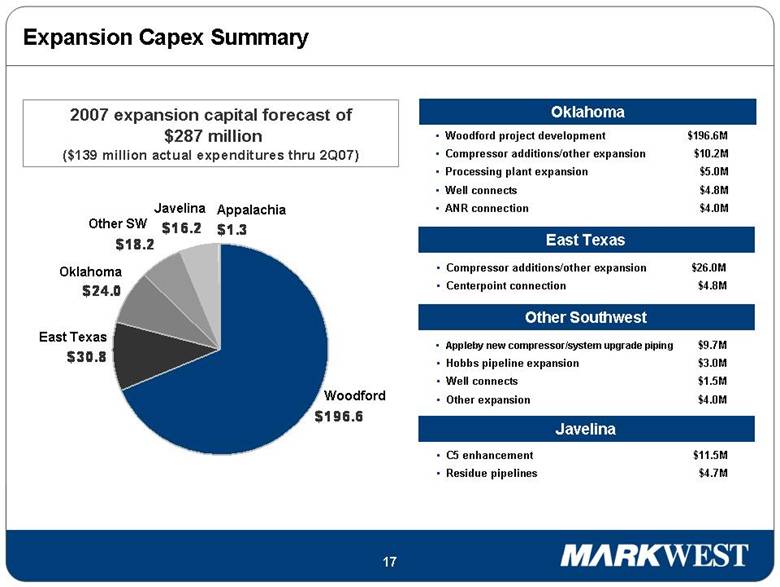
Expansion Capex Summary 2007 expansion capital forecast of $287 million ($139 million actual expenditures thru 2Q07) Woodford Appalachia Other SW Javelina Oklahoma East Texas Oklahoma Woodford project development $196.6M Compressor additions/other expansion $10.2M Processing plant expansion $5.0M Well connects $4.8M ANR connection $4.0M Compressor additions/other expansion $26.0M Centerpoint connection $4.8M Appleby new compressor/system upgrade piping $9.7M Hobbs pipeline expansion $3.0M Well connects $1.5M Other expansion $4.0M C5 enhancement $11.5M Residue pipelines $4.7M East Texas Other Southwest Javelina |
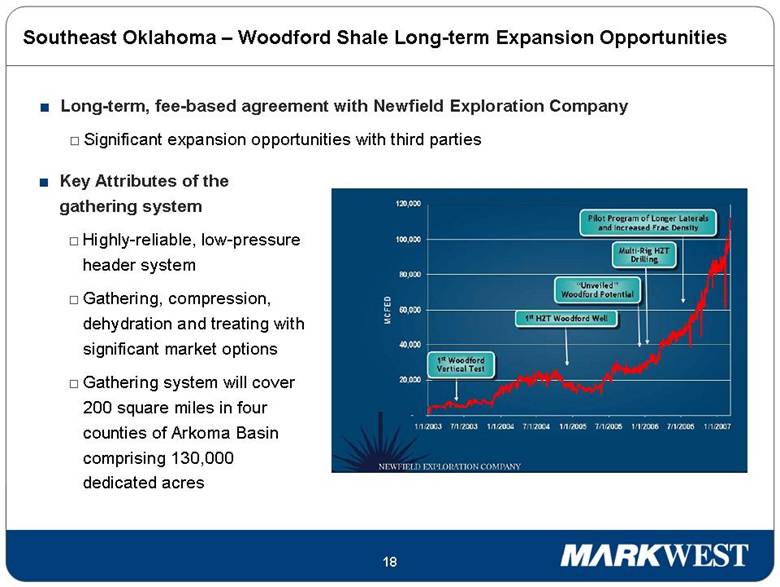
Southeast Oklahoma – Woodford Shale Long-term Expansion Opportunities Key Attributes of the gathering system Highly-reliable, low-pressure header system Gathering, compression, dehydration and treating with significant market options Gathering system will cover 200 square miles in four counties of Arkoma Basin comprising 130,000 dedicated acres Long-term, fee-based agreement with Newfield Exploration Company Significant expansion opportunities with third parties |
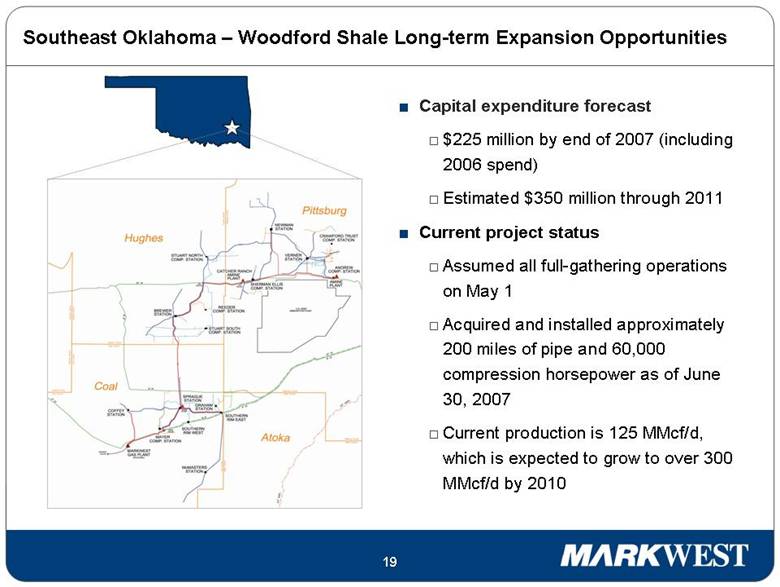
Southeast Oklahoma – Woodford Shale Long-term Expansion Opportunities Capital expenditure forecast $225 million by end of 2007 (including 2006 spend) Estimated $350 million through 2011 Current project status Assumed all full-gathering operations on May 1 Acquired and installed approximately 200 miles of pipe and 60,000 compression horsepower as of June 30, 2007 Current production is 125 MMcf/d, which is expected to grow to over 300 MMcf/d by 2010 |
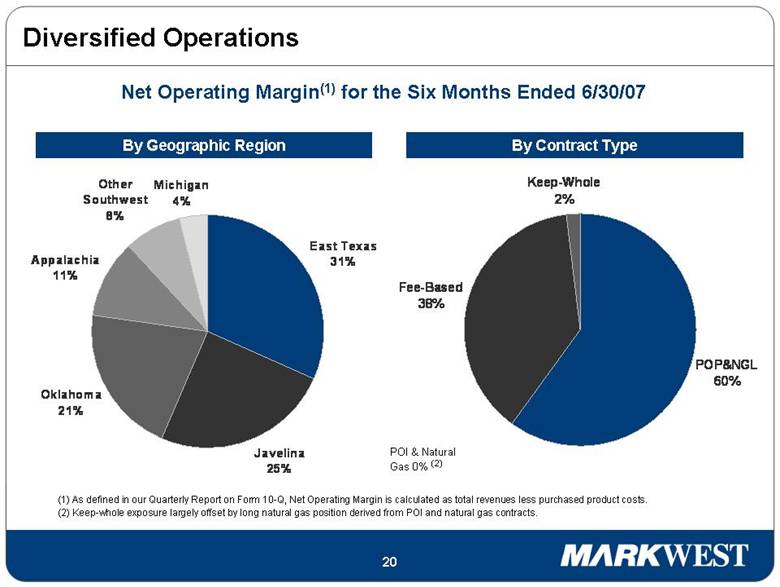
Diversified Operations (1) As defined in our Quarterly Report on Form 10-Q, Net Operating Margin is calculated as total revenues less purchased product costs. (2) Keep-whole exposure largely offset by long natural gas position derived from POI and natural gas contracts. POI & Natural Gas 0% (2) Net Operating Margin(1) for the Six Months Ended 6/30/07 By Geographic Region By Contract Type By Geographic Region Oklahoma 21% Appalachia 11% Other Southwest 8% Michigan 4% East Texas 31% Javelina 25% Keep-Whole 2% POP&NGL 60% Fee-Based 38% |
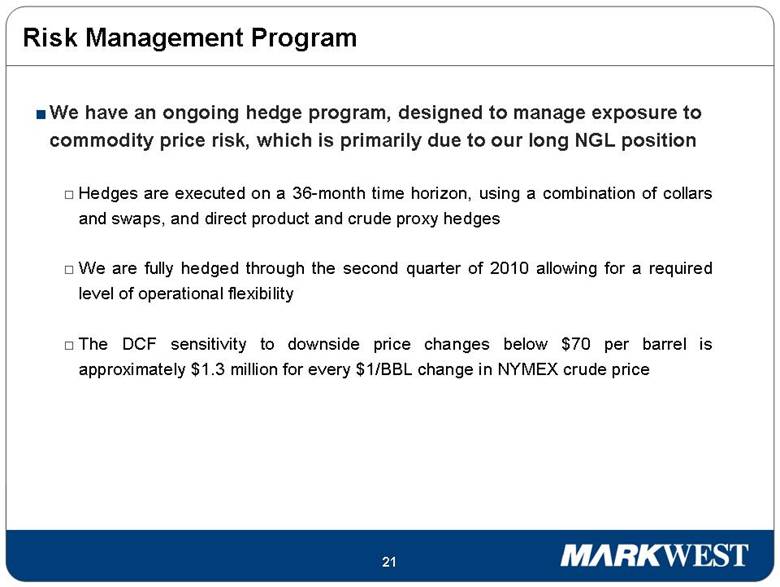
Risk Management Program We have an ongoing hedge program, designed to manage exposure to commodity price risk, which is primarily due to our long NGL position Hedges are executed on a 36-month time horizon, using a combination of collars and swaps, and direct product and crude proxy hedges We are fully hedged through the second quarter of 2010 allowing for a required level of operational flexibility The DCF sensitivity to downside price changes below $70 per barrel is approximately $1.3 million for every $1/BBL change in NYMEX crude price |
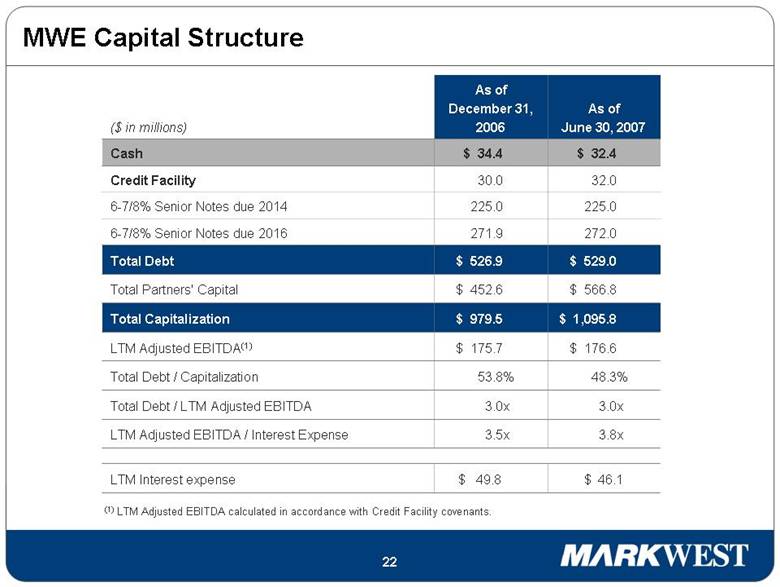
MWE Capital Structure As of June 30, 2007 As of December 31, 2006 ($ in millions) LTM Adjusted EBITDA / Interest Expense $ 46.1 LTM Interest expense Total Debt / Capitalization Total Debt / LTM Adjusted EBITDA $ 1,095.8 Total Capitalization Total Debt 6-7/8% Senior Notes due 2016 Total Partners' Capital 6-7/8% Senior Notes due 2014 Credit Facility LTM Adjusted EBITDA(1) Cash (1) LTM Adjusted EBITDA calculated in accordance with Credit Facility covenants. $ 34.4 $ 32.4 $ 175.7 $ 176.6 30.0 32.0 225.0 225.0 $ 452.6 $ 566.8 271.9 272.0 $ 526.9 $ 529.0 $ 979.5 3.0x 3.0x 53.8% 48.3% $ 49.8 3.5x 3.8x |
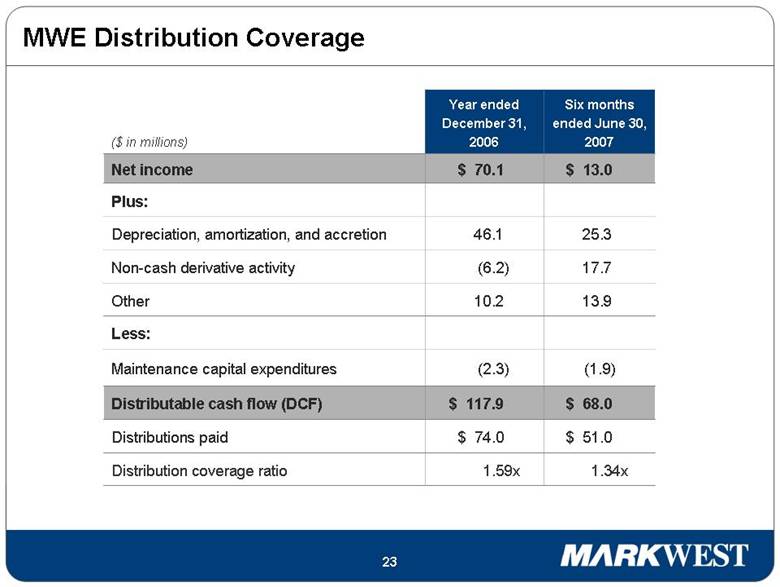
Six months ended June 30, 2007 Year ended December 31, 2006 ($ in millions) 25.3 46.1 Depreciation, amortization, and accretion 17.7 (6.2) Non-cash derivative activity 1.59x $ 74.0 $ 117.9 (2.3) 10.2 $ 70.1 Plus: 1.34x Distribution coverage ratio $ 51.0 Distributions paid Maintenance capital expenditures Less: $ 68.0 Distributable cash flow (DCF) 13.9 Other $ 13.0 Net income MWE Distribution Coverage (1.9) |
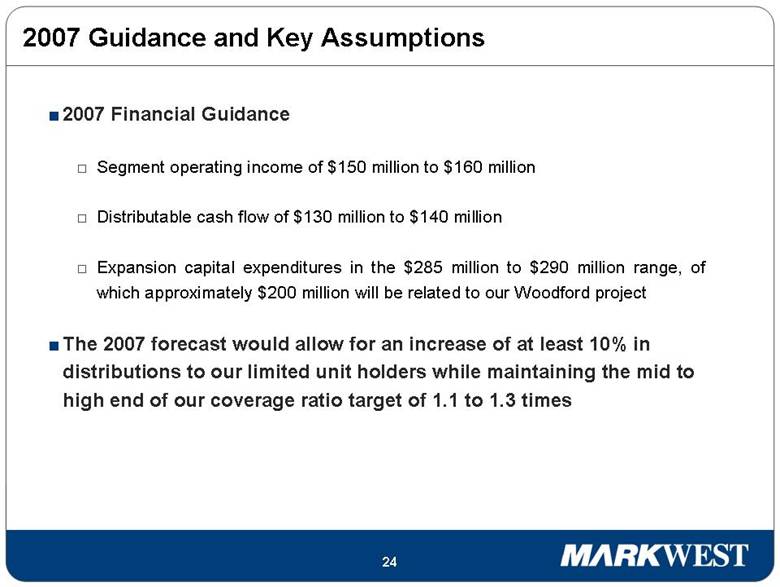
2007 Guidance and Key Assumptions 2007 Financial Guidance Segment operating income of $150 million to $160 million Distributable cash flow of $130 million to $140 million Expansion capital expenditures in the $285 million to $290 million range, of which approximately $200 million will be related to our Woodford project The 2007 forecast would allow for an increase of at least 10% in distributions to our limited unit holders while maintaining the mid to high end of our coverage ratio target of 1.1 to 1.3 times |
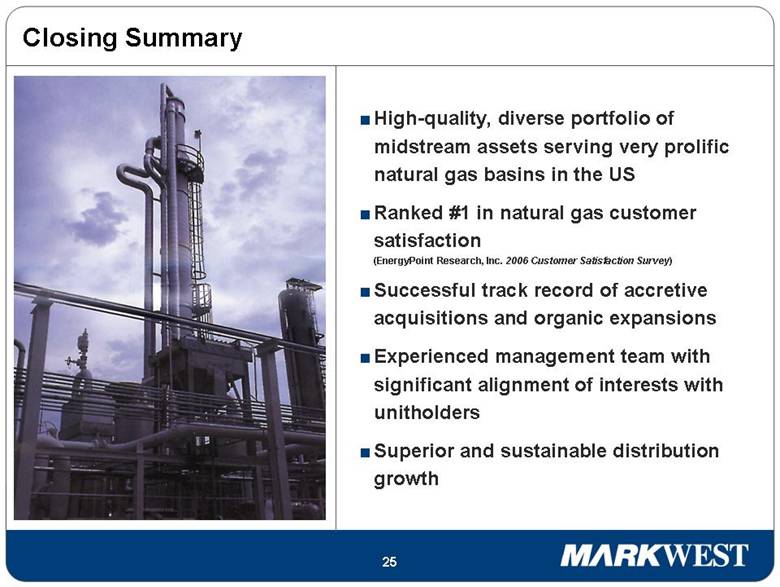
Closing Summary High-quality, diverse portfolio of midstream assets serving very prolific natural gas basins in the US Ranked #1 in natural gas customer satisfaction (EnergyPoint Research, Inc. 2006 Customer Satisfaction Survey) Successful track record of accretive acquisitions and organic expansions Experienced management team with significant alignment of interests with unitholders Superior and sustainable distribution growth |
1515 Arapahoe Street Tower 2 Suite 700 Denver, CO 80202 Phone: 303-925-9200 Investor Relations: 866-858-0482 Email: investorrelations@markwest.com Website: www.markwest.com |
Appendix |
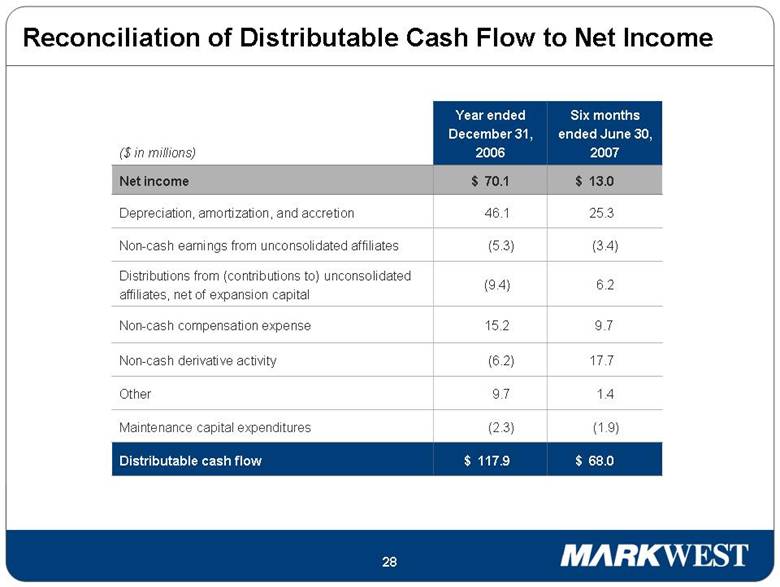
Six months ended June 30, 2007 Year ended December 31, 2006 ($ in millions) (1.9) (2.3) Maintenance capital expenditures 17.7 (6.2) Non-cash derivative activity 25.3 46.1 Depreciation, amortization, and accretion (3.4) (5.3) Non-cash earnings from unconsolidated affiliates $ 117.9 9.7 (9.4) $ 70.1 $ 68.0 Distributable cash flow 1.4 Other Non-cash compensation expense 6.2 Distributions from (contributions to) unconsolidated affiliates, net of expansion capital $ 13.0 Net income Reconciliation of Distributable Cash Flow to Net Income 9.7 15.2 |
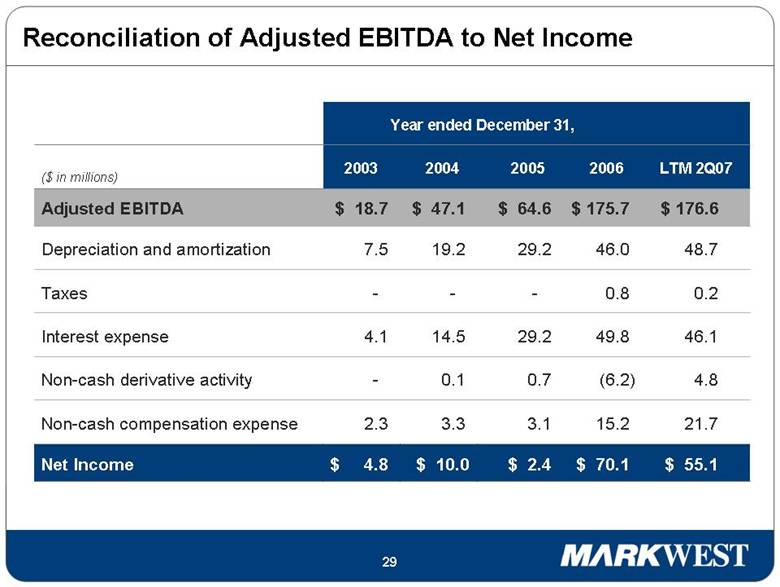
Year ended December 31, $ 4.8 - 2003 46.1 49.8 29.2 Interest expense 0.2 0.8 - - Taxes 4.8 (6.2) 0.7 Non-cash derivative activity $ 10.0 48.7 46.0 29.2 Depreciation and amortization 21.7 15.2 3.1 Non-cash compensation expense $ 2.4 $ 64.6 LTM 2Q07 ($ in millions) $ 55.1 $ 70.1 Net Income Adjusted EBITDA Reconciliation of Adjusted EBITDA to Net Income $ 175.7 $ 176.6 2006 2005 2004 $ 47.1 3.3 19.2 0.1 14.5 $ 18.7 7.5 4.1 - 2.3 |