UNITED STATES
SECURITIES AND EXCHANGE COMMISSION
Washington, D.C. 20549
Form 10-K
| | | | | |
| ☒ | ANNUAL REPORT PURSUANT TO SECTION 13 OR 15(d) OF THE SECURITIES EXCHANGE ACT OF 1934 |
| For the fiscal year ended December 31, 2024 |
| ☐ | TRANSITION REPORT PURSUANT TO SECTION 13 OR 15(d) OF THE SECURITIES EXCHANGE ACT OF 1934 |
For the transition period from to
Commission file number 1-12297
Penske Automotive Group, Inc.
(Exact name of registrant as specified in its charter)
| | | | | |
Delaware (State or other jurisdiction of incorporation or organization) | 22-3086739 (I.R.S. Employer Identification No.) |
| |
2555 Telegraph Road Bloomfield Hills Michigan (Address of principal executive offices) | 48302-0954 (Zip Code) |
(248) 648-2500
(Registrant's telephone number, including area code)
Securities registered pursuant to Section 12(b) of the Act:
| | | | | | | | |
| Title of each class | Trading symbol(s) | Name of each exchange on which registered |
| Voting Common Stock, par value $0.0001 per share | PAG | New York Stock Exchange |
Securities registered pursuant to Section 12(g) of the Act: None.
Indicate by check mark if the registrant is a well-known seasoned issuer, as defined in Rule 405 of the Securities Act. Yes x No o
Indicate by check mark if the registrant is not required to file reports pursuant to Section 13 or Section 15(d) of the Exchange Act. Yes o No x
Indicate by check mark whether the registrant (1) has filed all reports required to be filed by Section 13 or 15(d) of the Securities Exchange Act of 1934 during the preceding 12 months (or for such shorter period that the registrant was required to file such reports), and (2) has been subject to such filing requirements for the past 90 days. Yes x No o
Indicate by check mark whether the registrant has submitted electronically every Interactive Data File required to be submitted pursuant to Rule 405 of Regulation S-T (§232.405 of this chapter) during the preceding 12 months (or for such shorter period that the registrant was required to submit such files). Yes x No o
Indicate by check mark whether the registrant is a large accelerated filer, an accelerated filer, a non-accelerated filer, a smaller reporting company, or an emerging growth company. See the definitions of “large accelerated filer,” “accelerated filer,” “smaller reporting company,” and “emerging growth company” in Rule 12b-2 of the Exchange Act.
| | | | | | | | | | | |
Large Accelerated Filer x | Accelerated filer o | Non-accelerated filer o | Smaller reporting company ☐ |
| | | Emerging growth company ☐ |
If an emerging growth company, indicate by check mark if the registrant has elected not to use the extended transition period for complying with any new or revised financial accounting standards provided pursuant to Section 13(a) of the Exchange Act. o
Indicate by check mark whether the registrant has filed a report on and attestation to its management's assessment of the effectiveness of its internal control over financial reporting under Section 404(b) of the Sarbanes-Oxley Act (15 U.S.C. 7262(b)) by the registered public accounting firm that prepared or issued its audit report. x
If securities are registered pursuant to Section 12(b) of the Act, indicate by check mark whether the financial statements of the registrant included in the filing reflect the correction of an error to previously issued financial statements. o
Indicate by check mark whether any of those error corrections are restatements that required a recovery analysis of incentive-based compensation received by any of the registrant’s executive officers during the relevant recovery period pursuant to §240.10D-1(b). o
Indicate by check mark whether the registrant is a shell company (as defined in Rule 12b-2 of the Exchange Act). Yes ☐ No x
The aggregate market value of the voting common stock held by non-affiliates as of June 28, 2024 (the last trading day of the registrant's second fiscal quarter), was $2,759,410,642. As of February 11, 2025, there were 66,749,222 shares of voting common stock outstanding.
Documents Incorporated by Reference
Certain portions, as expressly described in this report, of the registrant's proxy statement for the 2025 Annual Meeting of the Stockholders to be held May 14, 2025, are incorporated by reference into Part III, Items 10-14.
TABLE OF CONTENTS
PART I
Item 1. Business
We are a diversified international transportation services company and one of the world's premier automotive and commercial truck retailers. We operate dealerships in the United States, the United Kingdom, Canada, Germany, Italy, Japan, and Australia, and we are one of the largest retailers of commercial trucks in North America for Freightliner. We also distribute and retail commercial vehicles, diesel and gas engines, power systems, and related parts and services principally in Australia and New Zealand. We employ over 28,900 people worldwide. Additionally, we own 28.9% of Penske Transportation Solutions, a business that employs over 44,500 people worldwide, manages one of the largest, most comprehensive and modern trucking fleets in North America with over 435,000 trucks, tractors, and trailers under lease, rental, and/or maintenance contracts, and provides innovative transportation, supply chain, and technology solutions to its customers.
Business Overview
In 2024, our business generated $30.5 billion in total revenue, which is comprised of approximately $26.2 billion from retail automotive dealerships, $3.5 billion from retail commercial truck dealerships, and $777.9 million from commercial vehicle distribution and other operations. We generated $5.0 billion in gross profit, which is comprised of $4.3 billion from retail automotive dealerships, $584.5 million from retail commercial truck dealerships, and $178.2 million from commercial vehicle distribution and other operations.
Retail Automotive. We are one of the largest global automotive retailers as measured by the $26.2 billion in total retail automotive dealership revenue we generated in 2024. We are diversified geographically with 56% of our total retail automotive dealership revenues in 2024 generated in the U.S. and Puerto Rico and 44% generated outside of the U.S. We offer over 40 vehicle brands with 72% of our retail automotive franchised dealership revenue in 2024 generated from premium brands, such as Audi, BMW, Land Rover, Mercedes-Benz, and Porsche. As of December 31, 2024, we operated 353 retail automotive franchised dealerships, of which 148 are located in the U.S. and 205 are located outside of the U.S., principally in the U.K. As of December 31, 2024, we also operated 16 used vehicle dealerships, with six dealerships in the U.S. operating under the brand name CarShop, nine dealerships in the U.K. operating under the brand name Sytner Select, and one dealership in Australia operating under the brand name Penske Select. We retailed and wholesaled, including agency units, more than 594,000 vehicles in 2024.
In addition to selling new and used vehicles, we generate higher-margin revenue at each of our dealerships through maintenance and repair services, the sale and placement of third-party finance and insurance products, third-party extended service and maintenance contracts, replacement and aftermarket automotive products, and at certain of our locations, collision repair services. We operate our franchised dealerships under franchise agreements with a number of automotive manufacturers and distributors that are subject to certain rights and restrictions typical of the industry. Some of our dealerships in the U.K. and Europe operate under an agency model where we receive a fee for facilitating the sale by the manufacturer of a new vehicle but do not hold the vehicle in inventory. Vehicles sold under this agency model are counted as new agency units sold instead of new retail units sold by us, and only the fee we receive from the manufacturer, not the price of the vehicle, is reported as new revenue with no corresponding cost of sale.
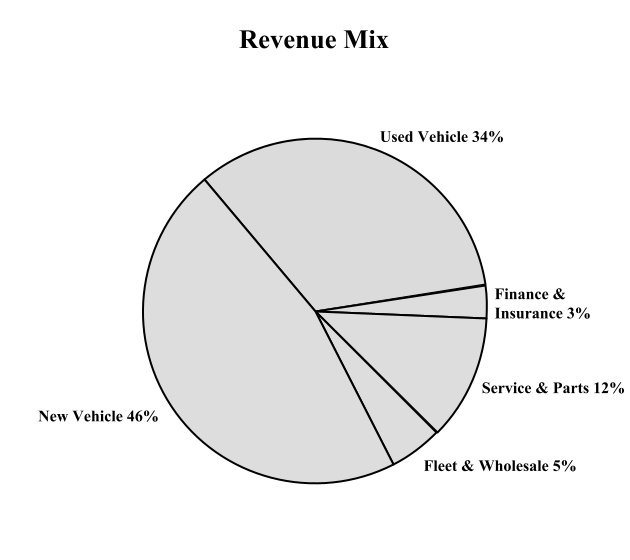
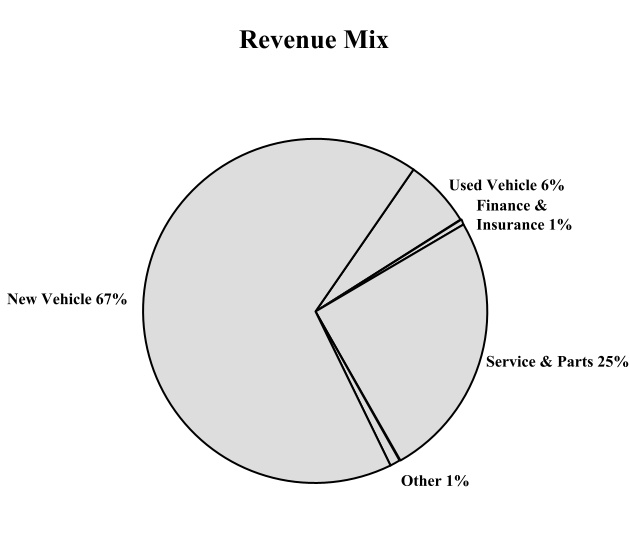
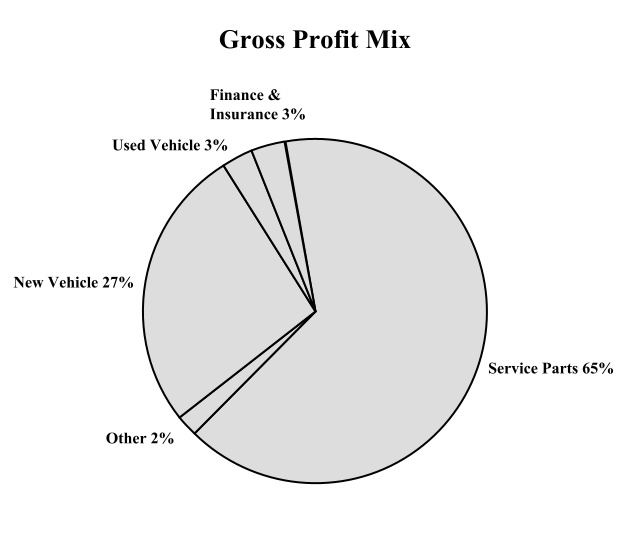
We believe our diversified retail automotive income streams help to mitigate the historical cyclicality found in some elements of the automotive sector. Revenues from higher margin service and parts sales include warranty work, customer-paid work, rapid repair, collision repair services, and wholesale parts sales. Service and parts sales are typically less cyclical than retail vehicle sales and generate the largest part of our retail automotive gross profit.
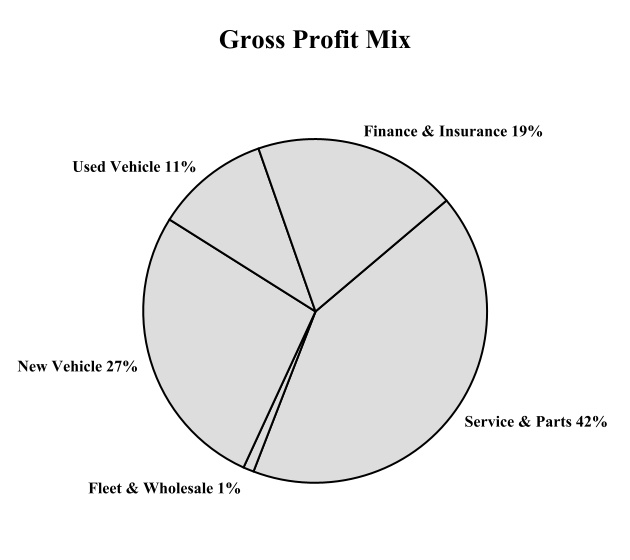
The following graphics show the percentage of our total retail automotive dealership revenues by product type and their respective contribution to our retail automotive gross profit:
Retail Commercial Truck Dealership. We operate Premier Truck Group ("PTG"), a heavy- and medium-duty truck dealership group offering primarily Freightliner and Western Star trucks (both Daimler brands), with locations across 10 U.S. states and the Canadian provinces of Ontario and Manitoba. As of December 31, 2024, PTG operated 45 locations selling new and/or used trucks, performing service and parts operations, or offering collision repair services. We retailed and wholesaled 20,947 new and used trucks in 2024. These businesses represented 11.6% of our total revenues and 11.7% of our total gross profit in 2024.
While our retail commercial truck business benefits from diversified income streams similar to those of the retail automotive sector, there are several key differences. As exhibited in the following charts, a greater part of our gross profit is derived from the sale of service and parts in the retail truck business given the large volume of parts business, in many cases, to fleet customers. In addition, the commercial truck business has a historically lower selling, general, and administrative expense as a percentage of gross profit as compared to retail automotive as approximately 65% of PTG's gross profit is attributable to higher margin service and parts compared to retail automotive which is approximately 42%. The following graphics show the percentage of our total retail commercial truck dealership revenues by product type and their respective contribution to our retail commercial truck gross profit:
Penske Australia. Penske Australia is the exclusive importer and distributor of Western Star heavy-duty trucks (a Daimler brand), MAN heavy- and medium-duty trucks and buses (a VW Group brand), and Dennis Eagle refuse collection
vehicles, together with associated parts, across Australia, New Zealand, and portions of the Pacific. In most of these same markets, we are also a leading distributor of diesel and gas engines and power systems, principally representing MTU (a Rolls-Royce solution), Detroit Diesel, Allison Transmission, and Bergen Engines. Penske Australia offers products across the on- and off-highway markets, including in the trucking, mining, power generation, energy solutions, defense, marine, rail, and construction sectors and supports full parts and aftersales service through a network of branches, field service locations, and dealers across the region. These businesses represented 2.5% of our total revenues and 3.5% of our total gross profit in 2024.
Penske Transportation Solutions. We hold a 28.9% ownership interest in Penske Truck Leasing Co., L.P. ("PTL"). PTL is owned 41.1% by Penske Corporation, 28.9% by us, and 30.0% by Mitsui & Co., Ltd. ("Mitsui"). We account for our investment in PTL under the equity method, and we therefore record our share of PTL's earnings on our statements of income under the caption "Equity in earnings of affiliates," which also includes the results of our other equity method investments. Penske Transportation Solutions ("PTS") is the universal brand name for PTS' various businesses, which articulates the breadth of its services. Its business was founded over 50 years ago, and today it is a leading provider of transportation and supply chain services. PTS is capable of meeting customers' needs across the supply chain with a broad product offering that includes full-service truck leasing, truck rental, and contract maintenance along with logistics services, such as dedicated contract carriage, distribution center management, freight management, and dry van truckload carrier services. We recorded $198.0 million and $289.5 million in equity earnings from this investment in 2024 and 2023, respectively, and during 2024 and 2023, we received $98.4 million and $168.8 million, respectively, of pro rata cash distributions relating to this investment.
Outlook
Retail Automotive. During 2024, U.S. industry new light vehicle sales increased 2.5%, to 16.0 million units, including a 3.0% increase in retail sales, partially offset by a 2.5% decrease in fleet sales, as compared to 2023. U.K. new vehicle registrations increased 2.6% to 2.0 million registrations, including an 11.8% increase in fleet sales, partially offset by an 8.7% decrease in retail sales, as compared to 2023. New vehicle sales are being positively impacted by continued strong consumer demand in the U.S. and manufacturer incentives. Government incentives on electric vehicles ("EVs") also impact vehicle sales. Our new vehicle days' supply is 49 as of December 31, 2024, compared to 39 as of December 31, 2023, including vehicles which are unable to be sold due to open recalls. Our used vehicle days' supply is 47 as of December 31, 2024, compared to 48 as of December 31, 2023, and is being impacted by a lower supply of 1-4 year old used vehicles as a result of the lower number of new vehicles sold in recent years and fewer lease returns in the U.S. As a reference, our new and used days' supply was 71 and 52, respectively, as of December 31, 2019 (pre-COVID). According to the National Automobile Dealers Association, sales for the U.S. light vehicle market are expected to grow to 16.2 million units in 2025 compared to a 16.0 million market in 2024.
As the supply of new vehicles has improved, we have experienced, and may continue to experience, reduced new and used vehicle gross profit. The regulatory authorities in our markets have adopted emissions limits on new vehicles which are designed to incent adoption of electric or other zero-emissions vehicles. We believe there is a direct correlation between the availability of government incentives for EVs and EV sale levels. New vehicle sales levels could be impacted by changes to these regulatory mandates as well as vehicle affordability challenges, inflation, interest rates, or a reduction in consumer spending resulting in decreased demand. The unavailability of 1-4 year old quality, low-mileage used vehicles for sale may adversely impact our used vehicle operations.
Representatives of the U.K. government have proposed a ban on the sale of internal combustion engines in new cars and new vans that may take effect as early as 2030 while also providing government incentives on certain EVs to entice consumers to transition from internal combustion vehicles to EVs. In part due to these incentives, U.K. new registrations of EVs, excluding hybrid, represented 19.6% of the overall market during 2024, as compared to 16.5% during 2023, and represented 24.3% of our U.K. new unit sales, as compared to 22.4% during 2023. U.K. new registrations of hybrid vehicles represented 21.9% of the overall market during 2024, as compared to 20.0% during 2023, and represented 13.2% of our U.K. new unit sales, as compared to 11.9% during 2023. In the U.S., sales of EVs increased 7.3% to 1.3 million units as compared to 2023. EV sales (excluding hybrid) represented 8.1% of the overall U.S. market during 2024, as compared to 7.7% during 2023. In the U.S., sales of hybrid vehicles were 1.9 million units in 2024 as compared to 1.2 million units in 2023. EV sales may increase or decrease in our markets as a result of government policy, manufacturer incentives, and consumer acceptance of vehicle range or vehicle charging infrastructure. During 2024, 4.2% of new vehicle sales in the U.S., and 2.6% of the new vehicle sales in the U.K., were sold by vehicle manufacturers directly to consumers outside of the retail automotive franchised system, principally consisting of one manufacturer. We expect continued strong demand for our service and parts operations driven by increases in demand in light of increasing vehicle sales in recent years, recall campaigns, increased miles driven, and vehicle complexity.
Retail Commercial Truck Dealership. During 2024, North American sales of Class 6-8 medium- and heavy-duty trucks, the vehicles sold by our PTG business, decreased 3.0% from last year to 473,159 units, primarily due to increased deliveries in 2023 as a result of deliveries expected in 2022 being delayed into 2023 due to supply constraints as well as continued lower freight rates in the U.S. The Class 6-7 medium-duty truck market increased 0.5% from last year to 157,260 units, and Class 8 heavy-duty trucks, the largest North American market, decreased 4.7% from last year to 315,899 units. We expect replacement demand to continue in 2025, although a continued weak freight market may impact unit sales and service and parts demand. As of December 31, 2024, the Class 6-8 medium- and heavy-duty truck backlog is 213,366 units according to data published by ACT Research compared to 278,616 as of December 31, 2023. See Item 1. Business, "Retail Commercial Truck Dealership Operations."
Commercial Vehicle Distribution and Other. During 2024, the Australian heavy-duty truck market reported sales of 17,153 units, representing a decrease of 2.4% from last year, while the New Zealand market reported sales of 3,439 units, representing a decrease of 13.7% from the same period last year. Our power system operations continue to grow through sales in the off-highway segments such as energy solutions, which provide power systems for large data centers, mining, and military applications.
Penske Transportation Solutions. A majority of PTS' revenue is generated by multi-year contracts for full-service leasing, contract maintenance, and logistics services. PTS also rents additional trucks to commercial customers in response to demand for freight as well as consumer customers. With a managed fleet of over 435,000 vehicles at December 31, 2024, PTS regularly sells trucks in order to maintain a low fleet age as well as in response to changes in demand for truck leasing and records a gain or loss on those sales. PTS is currently experiencing positive revenue growth in its business despite adverse global economic freight conditions. This growth is being driven by its full-service leasing, contract maintenance and logistics businesses, partially offset by lower revenues in its commercial and consumer rental product lines. The weaker freight environment and higher interest rates have directly impacted demand for its transactional products as well as used vehicle pricing. PTS has decreased, and expects to continue to decrease, the size of its consumer and commercial rental fleets in connection with this lower demand, aimed at improving the utilization rate of the fleet. PTS further anticipates that these market conditions will continue through 2025, and possibly longer, before improving. Additionally, increased market interest rates compared to prior years have resulted in meaningful increases to its interest expense, both in its variable rate indebtedness and as it refinances existing fixed rate indebtedness, while lower average selling prices for used trucks has resulted in a meaningful decrease in gain on sale from remarketing activities.
As described in Item 1A. Risk Factors, there are a number of factors that could cause actual results to differ materially from our expectations. For a detailed discussion of our financial and operating results, see Part II, Item 7. Management's Discussion and Analysis of Financial Condition and Results of Operations.
Diversification
Our business benefits from a diversified revenue and gross profit mix, including multiple revenue and gross profit streams in our traditional vehicle and commercial truck dealerships (new vehicles, used vehicles, finance and insurance, and service and parts operations) across many geographies, our commercial vehicle distribution and power systems operations, and returns relating to our joint venture investments, which we believe helps to mitigate the cyclicality that has historically impacted some elements of the automotive sector. Furthermore, PTG provides diversification both by business line and by its business being represented across the U.S. and in Canada. Finally, our ownership interest in PTS provides us with additional diversification as well as equity earnings, cash dividends, and significant cash savings on taxes.
We are also diversified geographically as established by the following table, which shows our consolidated revenue and gross profit by country as a percentage of our total revenue and total gross profit:
| | | | | | | | | | | | | | |
| Country | | % of Total 2024 Revenue | | % of Total 2024 Gross Profit |
| United States | | 58 | % | | 61 | % |
| United Kingdom | | 31 | % | | 27 | % |
| Germany/Italy | | 5 | % | | 5 | % |
| Japan | | 1 | % | | 1 | % |
| Canada | | 2 | % | | 2 | % |
| Australia/New Zealand | | 3 | % | | 4 | % |
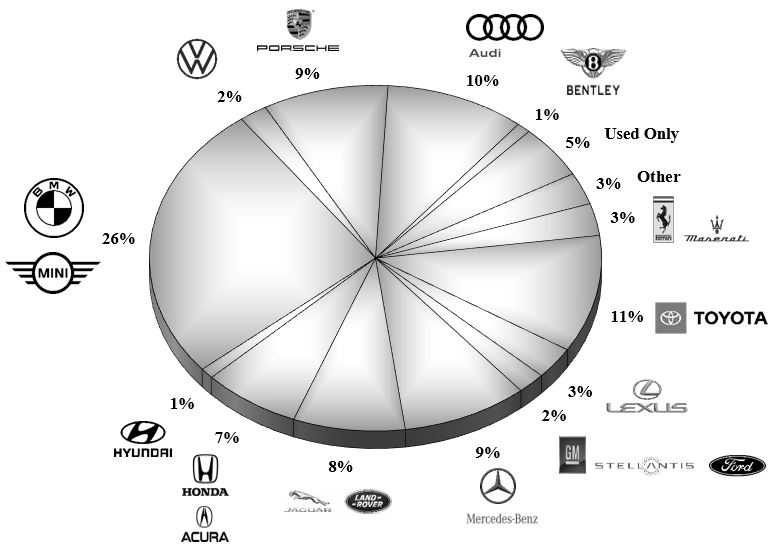
We are also diversified within our automotive retail operations by brand. We represent over 40 brands in our markets and our automotive dealership revenue mix consists of 72% related to premium brands, 21% related to volume non-U.S. brands, 2% related to brands of U.S. based manufacturers, and 5% related to our used vehicle dealerships as further detailed in the chart below:
Corporate Responsibility
As a leading international, diversified transportation services company, we recognize it is our responsibility to ensure that we contribute to a healthy environment, economic opportunity, and social equity in the communities where we operate around the world. We recognize we are accountable to key stakeholders and the communities in which we do business. We are committed to responsible business practices, continuous improvement of our operations, and strengthening relationships with our stakeholders. We focus our efforts where we can have the most positive impact on our business and society and are driven by our core values that ensures we enrich our communities, manage our environmental impact, protect the health and safety of our team members and customers, and promote opportunities for our personnel – all while creating value for our stakeholders. The most important investments we make are in our people. Everything we aspire to be as a company builds on our ability to come together as one team.
Retail Automotive Dealership Operations
Retail Automotive Franchises. We routinely acquire and dispose of retail automotive franchises. The following table exhibits our retail automotive franchises by location and manufacturer as of December 31, 2024:
| | | | | | | | | | | | | | | | | | | | | | | | | | | | | | | | |
| Location | | Franchises | | Franchises | | U.S. | | Non-U.S. | | Total |
| Arizona | | 24 | | BMW/MINI | | 26 | | 66 | | 92 |
| Arkansas | | 4 | | Toyota/Lexus | | 23 | | — | | 23 |
| California | | 30 | | Mercedes-Benz/Sprinter/smart | | 18 | | 29 | | 47 |
| Connecticut | | 8 | | Audi/Volkswagen/Bentley | | 17 | | 35 | | 52 |
| Florida | | 3 | | Chrysler/Jeep/Dodge/Ram | | 4 | | — | | 4 |
| Georgia | | 4 | | Honda/Acura | | 19 | | — | | 19 |
| Indiana | | 4 | | Ferrari/Maserati | | 2 | | 12 | | 14 |
| Maryland | | 1 | | Porsche | | 10 | | 15 | | 25 |
| Massachusetts | | 5 | | Jaguar/Land Rover | | 7 | | 19 | | 26 |
| Michigan | | 2 | | Lamborghini | | 1 | | 5 | | 6 |
| Minnesota | | 2 | | Nissan/Infiniti | | 3 | | — | | 3 |
| New Jersey | | 18 | | Cadillac/Chevrolet | | 4 | | — | | 4 |
| North Carolina | | 4 | | Others | | 14 | | 24 | | 38 |
| Ohio | | 7 | | Total | | 148 | | 205 | | 353 |
| Puerto Rico | | 4 | | | | | | | | |
| Rhode Island | | 8 | | | | | | | | |
| Tennessee | | 1 | | | | | | | | |
| Texas | | 11 | | | | | | | | |
| Virginia | | 7 | | | | | | | | |
| Wisconsin | | 1 | | | | | | | | |
| Total U.S. | | 148 | | | | | | | | |
| U.K. | | 141 | | | | | | | | |
| Germany | | 23 | | | | | | | | |
| Italy | | 26 | | | | | | | | |
| Japan | | 12 | | | | | | | | |
| Australia | | 3 | | | | | | | | |
| Total Non-U.S. | | 205 | | | | | | | | |
| Total Worldwide | | 353 | | | | | | | | |
Retail Automotive Used Vehicle Dealerships. The following table exhibits our used vehicle dealerships we operated by geographic location as of December 31, 2024:
| | | | | | | | |
| Location | | Number of Dealerships |
| U.S. (CarShop) | | |
| Pennsylvania | | 5 | |
| New Jersey | | 1 | |
| Total U.S. | | 6 | |
| U.K. (Sytner Select) | | 9 | |
| Australia (Penske Select) | | 1 | |
| Total | | 16 | |
New Vehicle Retail Sales. In 2024, we retailed, including agency units, more than 244,990 new vehicles which generated 46.1% of our retail automotive dealership revenue and 27.0% of our retail automotive dealership gross profit. We strive to maintain outstanding relationships with the automotive manufacturers based in part on our long-term presence
in the retail automotive market, our commitment to providing premium facilities, our commitment to drive customer satisfaction, the reputation of our management team, and the consistent sales volume at our dealerships. Our dealerships finance the purchase of most new vehicles from the manufacturers through floor plan financing provided primarily by various manufacturers' captive finance companies.
Used Vehicle Retail Sales. In 2024, we retailed 246,608 used vehicles, which generated 33.5% of our retail automotive dealership revenue and 10.7% of our retail automotive dealership gross profit. We acquire used vehicles from various sources, including trade-ins from consumers in connection with their purchase of a new or used vehicle from us, purchases of used vehicles directly from consumers, lease expirations, public auctions, and auctions open only to authorized new vehicle dealers. To improve customer confidence in our used vehicle inventory, we provide vehicle history reports for all used vehicles, and virtually all of our franchised new vehicle dealerships participate in manufacturer certification processes for used vehicles. If certification is obtained, the used vehicle owner is typically provided benefits and warranties similar to those offered to new vehicle owners by the applicable manufacturer.
Vehicle Finance and Insurance Sales. Finance and insurance sales represented 3.1% of our retail automotive dealership revenue and 19.1% of our retail automotive dealership gross profit in 2024. At our customers' option, our dealerships can arrange third-party financing or leasing in connection with vehicle purchases. We typically receive a flat fee or a portion of the cost of the financing or leasing paid by the customer for each transaction. While these services are generally non-recourse to us, we are subject to chargebacks in certain circumstances, such as default under a financing arrangement or pre-payment. These chargebacks vary by finance product but typically are limited to the fee we receive.
We also offer our customers various vehicle warranty and extended protection products, including extended service contracts, maintenance programs, and voluntary vehicle protection products. The extended service contracts and other products that our dealerships currently offer to customers are underwritten by independent third parties, including the vehicle manufacturers' captive finance companies. Similar to finance transactions, we are subject to chargebacks relating to fees earned in connection with the sale of certain protection products. We also offer for sale other aftermarket products, including security systems and protective coatings.
We offer finance and insurance products using a "menu" process, which is designed to ensure that we offer our customers a complete range of finance, insurance, protection, and other aftermarket products in a transparent manner. We utilize docuPAD® at our U.S. dealerships, an interactive electronic interface designed to improve document processing and menu presentation of finance and insurance options during the purchase or lease transaction.
Service and Parts Sales. Service and parts sales represented 11.7% of our retail automotive dealership revenue and 41.7% of our retail automotive dealership gross profit in 2024. We generate service and parts revenue in connection with providing a wide range of services such as vehicle maintenance, cosmetic repair, manufacturer recalls, warranty, out-of-warranty, rapid repair, and collision repair services. We also recondition used vehicles that we intend to sell in our dealerships. We look to generate higher revenue by driving higher levels of customer satisfaction, marketing, and the use of technology such as videos which allow our technicians to interact directly with the customer, obtain digital approvals, and increase efficiency. Additionally, our AI-driven service scheduling and reception system at certain of our dealerships enhances the customer experience by providing instant support, reducing wait times, and offering 24/7 assistance, enabling seamless service even outside regular hours. By accurately interpreting customer needs and automating appointment bookings, the system streamlines operations, allowing staff to focus on more complex tasks while providing customers with access to human support when necessary. We also believe our service and parts revenues benefit from the increasingly complex technology built into vehicles today. We believe this offers an advantage to our automotive dealerships as the complexity makes it increasingly difficult for independent repair shops and do-it-yourself enthusiasts to maintain and repair today’s vehicles, including the components and systems used in battery and hybrid EVs. We also offer rapid repair services, such as paintless dent repair, tire sales, and windshield replacement at most of our facilities in order to offer our customers the convenience of one-stop shopping for all of their automotive requirements.
We also operate 36 automotive collision repair centers, each of which is operated as an integral part of our dealership operations. The collision centers are staffed with factory-certified technicians with broad capabilities, extending to complete vehicle reconstruction and mechanical engine repairs. Our collision centers also carry an extensive inventory of parts for the new and used vehicles they repair.
Fleet and Wholesale Sales. Fleet and wholesale sales represented 5.6% of our retail automotive dealership revenue and 1.5% of our retail automotive dealership gross profit in 2024. Fleet activities represent the sale of new units to customers that are deemed to not be retail customers, such as cities, municipalities, or rental car companies and are generally sold at
contracted amounts. Wholesale activities relate to the sale of used vehicles generally to other dealers and occur at auction. In the U.K., we offer used vehicles to wholesalers and other dealers via a proprietary online auction.
Retail Commercial Truck Dealership Operations
Premier Truck Group (“PTG”) is a heavy- and medium-duty truck dealership group offering primarily Freightliner and Western Star trucks (both Daimler brands) with 45 locations across 10 U.S. states and the Canadian provinces of Ontario and Manitoba. PTG dealerships provide a similar suite of services as our automotive dealerships, offering new trucks and a large selection of used trucks for sale, a full range of parts, maintenance and repair services, collision centers, and finance and insurance options by facilitating truck and trailer financing and leasing, extended maintenance plans, voluntary vehicle protection products, and other programs.
The maintenance and repair of commercial trucks is an essential service and a key area of differentiation for our business. We offer “Elite Support” certified locations to help maximize vehicle uptime. Elite Support certified locations provide an express assessment whereby we communicate a primary diagnosis, check parts availability, and provide an estimate of cost and repair time within a few hours of service write-up. As part of this service, many of our locations offer a comfortable environment for customers with amenities such as customer lounges, lockers, showers, and laundry facilities. We also offer roadside remote service for certain repairs and provide 24/7 technician support for breakdown/emergency service in select locations.
The collision centers at PTG are full-service, heavy-duty paint and collision repair facilities with certified professionals that can handle everything from light cosmetic issues to complete vehicle reconstruction, including mechanical engine repairs. PTG also carries an extensive inventory of parts for the new and used trucks they sell and service. The service and parts business of our PTG commercial truck dealerships represents approximately 65% of our retail commercial truck dealership gross profit.
A significant portion of our new commercial vehicle sales are to customers with large fleets of commercial vehicles. Because of the size and geographic scope of our dealership locations, our strong relationships with our fleet customers and our ability to manage large quantities of used commercial vehicle trade-ins, we are able to successfully market and sell to large fleet customers. We believe that we have a competitive advantage over many dealerships because we can absorb multi-unit trade-ins often associated with fleet sales and effectively disperse the used commercial vehicles for resale throughout our dealership network. We believe that the broad range of products and services we offer to purchasers of commercial vehicles at the time of purchase and post-purchase results in a high level of customer loyalty.
Backlog is a key industry metric for commercial vehicle retailers. Backlog is the number of new commercial vehicles ordered by customers, however, such orders are subject to cancellation. In the event of order cancellation, retailers generally have no contractual right to require the customer to purchase the vehicle. The delivery time for a customer ordered commercial vehicle varies depending on the truck specifications and demand for the model ordered. We sell the majority of our new heavy-duty commercial vehicles by customer special order and we sell the majority of our medium duty commercial vehicles out of inventory. As of December 31, 2024, the Class 6-8 medium- and heavy-duty truck backlog is 213,366 units according to data published by ACT Research compared to 278,616 at December 31, 2023.
Fixed Absorption Ratio. We believe the fixed absorption ratio is useful to investors as it improves the transparency of our disclosures and provides a meaningful metric evidencing the impact of our commercial truck businesses' parts and service operations on PTG's overall operating profitability. Our fixed absorption ratio is calculated by dividing PTG's gross profit from our parts and service departments by PTG's total overhead expenses, except for the variable selling expenses of the new and used commercial vehicle departments, advertising expense, and carrying costs of new and used commercial vehicle inventory. Our commercial truck dealerships achieved a 125.0% fixed absorption ratio for 2024, compared to a 129.2% fixed absorption ratio for 2023.
Commercial Vehicle Distribution and Other Operations
Penske Australia. Penske Australia is the exclusive importer and distributor of Western Star heavy-duty trucks (a Daimler brand), MAN heavy- and medium-duty trucks and buses (a VW Group brand), and Dennis Eagle refuse collection vehicles, together with associated parts, across Australia, New Zealand, and portions of the Pacific. In most of these same markets, we are also a leading distributor of diesel and gas engines and power systems, principally representing MTU (a Rolls-Royce solution), Detroit Diesel, Allison Transmission, and Bergen Engines. Penske Australia offers products across the on- and off-highway markets, including in the trucking, mining, power generation, energy solutions, defense, marine, rail, and construction sectors and supports full parts and aftersales service through a network of branches, field service locations, and dealers across the region.
Penske Australia distributes commercial vehicles and parts for Western Star, MAN, and Dennis Eagle to a network which comprises on average of more than 70 dealership locations across Australia, New Zealand, and portions of the Pacific. Of these dealership locations, 12 are company-owned retail commercial vehicle and/or service and parts dealerships in Australia and three are company-owned retail commercial vehicle dealerships in New Zealand.
Western Star trucks are manufactured by Daimler Trucks North America in Portland, Oregon. These technologically advanced, custom-built vehicles are ordered by customers to meet their particular needs for line haul, long distance road train, mining, logging, and other heavy-duty applications. We are also the exclusive importer of MAN trucks and buses. MAN Truck and Bus, a VW Group company, is a leading producer of medium- and heavy-duty trucks as well as city and coach buses. These cab-forward, fuel efficient vehicles are principally produced in several sites in Germany and are ordered by customers for line haul, local distribution, mining, and other off-road applications. Dennis Eagle refuse collection vehicles are manufactured by Ros Roca in Warwick, England. These brands represented 4.1% of heavy-duty truck units sold in Australia and 2.0% in New Zealand during 2024.
We also distribute diesel gas engines and power systems to over 100 dealer locations that are strategically located throughout Australia, New Zealand, and portions of the Pacific. Most of the dealers represent the Detroit Diesel brand, with the majority aligned to Western Star and/or Freightliner truck manufacturers. The remaining dealers represent the MTU and Allison Transmission brands. The “off-highway” business principally includes the sale and servicing of power systems directly to customers in the commercial, defense, mining, maritime, power generation, and energy solutions sectors from 20 facilities we operate across Australia and New Zealand. We also utilize mobile remote field service units to travel directly to customer premises.
Penske Transportation Solutions
We hold a 28.9% ownership interest in Penske Truck Leasing Co., L.P. (“PTL”). Penske Transportation Solutions (“PTS”) is the universal brand name for PTL's various business lines through which it is capable of meeting customers' needs across the supply chain with a broad product offering that includes full-service truck leasing, truck rental, and contract maintenance along with logistics services, such as dedicated contract carriage, distribution center management, freight management, and dry van truckload carrier services. PTS has a highly diversified customer base ranging from multi-national corporations across industries, such as food and beverage, transportation, manufacturing, automotive, retail, and healthcare, with whom they have long-term contracts to individual consumers who rent a single truck on a daily basis.
PTS manages one of the largest, most comprehensive and modern trucking fleets in North America, with approximately 435,000 trucks, tractors and trailers under lease, rental and/or maintenance contracts as of December 31, 2024, through their network of locations throughout North America. Furthermore, PTS has consistently been among the largest purchasers of commercial trucks in North America and had an average full-service leasing Class 8 tractor fleet age of approximately 3.4 years as of December 31, 2024, which is substantially lower than the overall Class 8 tractor fleet age in the United States.
Full-service truck leasing, truck rental, and contract maintenance. Full-service truck leasing, truck rental, and contract maintenance of commercial trucks, tractors, and trailers constitutes PTS' largest business. PTS manages a fleet of over 435,000 trucks, tractors, and trailers, consisting of over 282,900 vehicles owned by PTS and leased to customers under full-service lease or rental agreements and over 152,300 customer-owned and -operated vehicles for which they provided contract maintenance services. Lease terms under its full-service leases generally range from four to seven years for tractors and trucks and six to twelve years for trailers. Its commercial and consumer rental fleet as of December 31, 2024, consisted of approximately 94,800 vehicles for use by its full-service truck leasing, small business, and consumer customers for periods generally ranging from less than a day to 12 months. Most of its leased vehicles are configured according to customer specifications, including custom painting and lettering, while its rental trucks bear Penske branding.
Commercial customers often outsource to PTS to reduce the complexity, cost, and total capital associated with vehicle ownership. Under a full-service lease, PTS provides and fully maintains the vehicle, which is generally configured for the customer. The services provided under full-service lease and contract maintenance agreements generally include preventive and regular maintenance, advanced diagnostics, emergency road service, fleet services, safety programs, and fuel services through PTS' network of company-operated facilities and a nationwide network of independent truck stops. In addition, PTS makes available to its full-service leasing and contract maintenance customers additional vehicles on a rental basis. PTS' commercial rental operations offer short-term availability of tractors, trucks, and trailers typically to accommodate seasonal, emergency, and other temporary needs. A significant portion of these rentals are to existing full-service leasing and contract maintenance customers who are seeking flexibility in their fleet management. PTS has established a network of approximately 930 locations to provide full-service truck leasing, truck rental, and contract maintenance services to
customers. This network enables PTS to meet multi-location customer requirements. PTS' commercial rental business generated 19% of its revenue for 2024 and its full-service lease and contract maintenance business generated 50% of its revenue in 2024.
For consumer customers, PTS provides short-term rental of light- and medium-duty vehicles on a one-way and local basis, typically to transport household goods. Customers typically include local small businesses and individuals seeking a do-it-yourself solution to their moving needs. PTS' consumer fleet generally consists of late model vehicles ranging in size from small vans to 26-foot trucks, and its consumer rentals are conducted through approximately 1,910 independent rental agents and approximately 410 of its company-operated leasing and rental facilities. PTS' consumer business generated 3% of its revenue for 2024.
Logistics. PTS' logistics business offers an extensive variety of services, including dedicated contract carriage, distribution center management, freight management, lead logistics provider, and dry van truckload carrier services. PTS coordinates services for its customers across the supply chain, including inbound material flow, handling and packaging, inventory management, distribution and technologies, and sourcing of third-party carriers. These services are available individually or on a combined basis and often involve its associates performing services at the customer's location. By offering a scalable series of services to its customers, PTS can manage the customer's entire supply chain or any stand-alone service. PTS also utilizes specialized software that enables real-time fleet visibility and provides reporting metrics, giving customers detailed information on fuel economy and other critical supply chain costs. PTS' international logistics business has approximately 520 locations in North America, South America, and Europe. PTS' logistics business generated 28% of its revenue for 2024.
Industry Information
Retail Automotive. Approximately 56% of our retail automotive dealership revenues are generated in the U.S. and Puerto Rico, which in 2024 was one of the world's largest automotive retail markets as measured by units sold. In 2024, sales of new cars and light trucks were approximately 16.0 million units, an increase of 2.5% from 2023, and were generated at approximately 16,900 franchised new-car dealerships. According to data from the National Automobile Dealers Association, dealership revenue is generally derived as follows: 54% from new vehicle sales, 33% from used vehicle sales (in each case including related finance and insurance revenues), and 13% from service and parts sales.
In the U.S., the franchised automotive dealer industry is one of the largest retail businesses by revenue in a market of approximately $1.2 trillion. Although significant consolidation has already taken place, the industry remains highly fragmented with approximately 90% of the U.S. industry's market share remaining in the hands of smaller regional and independent dealers. Our other markets are similarly fragmented. We believe that further consolidation in these markets is probable due to the significant capital requirements of maintaining manufacturer facility standards and the limited number of viable alternative exit strategies for dealership owners.
Our international automotive retail dealerships operate in the U.K., the European Union, Japan, and Australia. In the U.K., new vehicle registrations in 2024 totaled 1.95 million, which increased 2.6% from 1.90 million new vehicle registrations in 2023. Our European Union markets consist of Germany, Italy, and Spain, which represented the first, third, and fourth largest automotive retail markets, respectively, in the European Union in 2024 and accounted for approximately 51% of the total vehicle sales in the European Union markets. Unit sales of automobiles in the European Union were approximately 10.6 million in 2024, a 0.8% increase compared to 2023. In Germany, Italy, and Spain, new car sales were approximately 2.8 million, 1.6 million, and 1.0 million units, respectively, in 2024, new car sales in Japan were approximately 4.4 million in 2024, and new car sales in Australia were approximately 1.2 million in 2024.
As of December 31, 2024, we also operated 16 used vehicle dealerships. Used vehicle sales are even more fragmented than new vehicle sales and are generated by new car dealerships, used vehicle dealerships, individual small lot sellers, as well as individual to individual sales. In 2024, used vehicle sales were approximately 36.8 million units in the U.S. according to data from Cox Automotive, compared to 35.9 million in the prior year, and approximately 7.6 million units in the U.K. according to data from the Society of Motor Manufacturers and Traders, compared to 7.2 million in the prior year.
Retail Commercial Truck Dealership. The retail heavy-duty truck market is affected by a number of factors, including general economic conditions, fuel prices, other methods of transportation, environmental and other government regulation, interest rate fluctuations, freight metrics, and customer business cycles. According to data published by ACT Research, in recent years, total U.S. retail sales of new Class 8 commercial vehicles have ranged from a low of approximately 97,000 in 2009 to a high of approximately 334,000 in 2019. Class 8 trucks are defined by the American Automobile Association as trucks with a minimum gross vehicle weight rating above 33,000 pounds. Typically, Class 8 trucks are assembled by manufacturers utilizing certain components that may be manufactured by other companies, including engines,
transmissions, axles, wheels and other components. As commercial vehicles and certain commercial vehicle components have become increasingly complex, the ability to provide service for commercial vehicles has become an increasingly competitive factor in the industry. The ability to provide such service requires a significant capital investment in diagnostic and other equipment, parts inventory and highly trained service personnel. The EPA and Department of Transportation regulatory guidelines for service processes, including collision center, paint work and waste disposal, require sophisticated equipment to ensure compliance with environmental and safety standards. In 2024, North American sales of Class 6-8 medium- and heavy-duty trucks, the principal vehicles sold by our PTG business, decreased 3.0% from last year to 473,159 units and were generated at approximately 3,800 new-truck dealerships. The Class 6-7 medium-duty truck market increased 0.5% from last year to 157,260 units, and Class 8 heavy-duty trucks, the largest North American market, decreased 4.7% from last year to 315,899 units. Our principal brands, Freightliner and Western Star, represent approximately 42.9% of the Class 8 heavy-duty truck market during 2024.
Commercial Vehicle Distribution and Other. Our commercial vehicle distribution and other business operates principally in Australia and New Zealand. In 2024, heavy-duty truck sales in Australia and New Zealand combined were 20,592 units, representing a decrease of 4.5% from 2023. The brands we sell represented 4.1% of the heavy-duty truck units sold in Australia and 2.0% in New Zealand during 2024.
Penske Transportation Solutions. PTS participates broadly in the global supply chain, estimated at $11.2 trillion annually, and particularly, in the U.S. supply chain, estimated at $2.3 trillion annually. Only 13.2% of the total U.S. supply chain function is outsourced to third parties, such as PTS. We estimate, based on R. L. Polk registration data, that there are approximately 9.6 million commercial trucks operating in the United States and Canada, of which up to 5.0 million could be potential opportunities for PTS' full-service leasing and contract maintenance offerings.
Business Description
Marketing Strategy
Our integrated marketing strategies empower each dealership to capitalize on local branding while being supported by corporate programs and web presence, allowing us to leverage scale. We align ourselves with the marketing implemented by our vehicle manufacturer partners for their respective brands and integrate those initiatives and resources across the brands we represent.
We are focused on executing a comprehensive data-driven digital strategy with emphasis on customization, personalization, and creating a connection with our customers. We endeavor to build and optimize our presence across all digital platforms and deliver a seamless, convenient, and transparent experience that gives customers the ability to purchase, sell, or schedule service for their vehicles on their terms.
To stay at the forefront of technological innovations, we leverage software and systems to support our customers regardless of how they want to engage with us, from fully online to in-person or anywhere in between. In addition, we have implemented AI-driven technologies at certain of our dealerships, including a voice assistant to answer and appoint inbound service calls and an engagement system to address customer lead inquiries and schedule sales and service appointments. These technologies are designed to improve our customer experience and allow customers to engage with us 24/7.
We monitor customer satisfaction data to gain insight into our business performance and enhance the areas of our business that drive customer referral and loyalty. Social media is a highly valued element of our marketing strategy that enables us to engage with customers, increase dealership awareness, improve customer satisfaction, and enhance repeat and referral business. Additionally, we leverage corporate social media efforts and partners to benefit our dealerships and create a strong sense of community. Online reputation management sites are proactively monitored to ensure we are offering superior customer experience.
Agreements with Vehicle and Equipment Manufacturers
We operate our new vehicle dealerships under separate agreements with the manufacturers or distributors of each brand of vehicle sold at that dealership. These agreements are typical throughout the industry and may contain provisions and standards governing almost every aspect of the dealership including ownership, management, personnel, training, maintenance of a minimum of working capital, net worth requirements, maintenance of minimum lines of credit, advertising and marketing activities, facilities, signs, products and services, maintenance of minimum amounts of insurance, achievement of minimum customer service standards, and monthly financial reporting. In addition, the General Manager and/or the owner of a dealership typically cannot be changed without the manufacturer's consent. In exchange for
complying with these provisions and standards, we are granted the non-exclusive right to sell the manufacturer's or distributor's brand of vehicles and related parts and warranty services at our dealerships. The agreements also grant us a non-exclusive license to use each manufacturer's trademarks, service marks, and designs in connection with our sales and service of its brand at our dealership.
Many of these agreements also grant the manufacturer or distributor a security interest in the vehicles and/or parts sold by them to the dealership as well as other dealership assets and permit them to terminate or not renew the agreement for a variety of causes, including failure to adequately operate the dealership, insolvency or bankruptcy, impairment of the dealer's reputation or financial standing, changes in the dealership's management, owners, or location without consent, sales of the dealership's assets without consent, failure to maintain adequate working capital or floor plan financing, changes in the dealership's financial or other condition, failure to submit required information to them on a timely basis, failure to have any permit or license necessary to operate the dealership, and material breaches of other provisions of the agreement. In the U.S., these termination rights are subject to state franchise laws that limit a manufacturer's right to terminate a franchise. In the U.K., we operate without such local franchise law protection (see “Regulation” below).
In the U.S., some of our franchise agreements, including those with BMW, Daimler Truck North America, Honda, Hyundai, and Toyota, expire after a specified period of time ranging from one to six years. Manufacturers have not historically terminated our franchise agreements, and our franchise agreements with fixed terms have typically been renewed. We currently expect the manufacturers to renew all of our U.S. franchise agreements as they expire. In the U.K., many of our agreements have two-year rolling terms. Our agreements with BMW, our largest U.K. manufacturer, expire in December 2025. Similar to the U.S., the manufacturers in the U.K. have not historically terminated our agreements, and our agreements with fixed terms have typically been renewed.
In addition, we are subject to certain framework agreements with manufacturers that allow us as a multi-point, public company to own and operate multiple franchises in exchange for us agreeing, among other things, to limit the total number of dealerships of that brand that we may own in a particular geographic area and in some cases, limit the total number of their vehicles that we may sell as a percentage of a particular manufacturer's overall sales. Manufacturers may also limit the ownership of stores in contiguous markets. Certain of our franchise agreements have similar limits. We have reached certain national and regional geographical limitations under the agreements from time to time. Where these limits are reached or we otherwise fail to satisfy certain performance or other conditions specified in the framework agreements, we cannot acquire additional franchises of those brands in the relevant market unless we can negotiate modifications or waivers to the agreements.
These agreements also typically restrict the acquisition of additional dealerships unless the Company’s dealerships of that brand individually and/or in the aggregate are meeting certain requirements. These framework agreements typically provide the manufacturer or distributor the right in some circumstances (including upon a merger, sale, change of control of the Company, or in some cases a material change in our business or capital structure) to acquire the dealerships from us at fair market value or other predetermined values, including upon the acquisition of 20% or more of our voting stock by a person, entity, group, or another manufacturer (subject to certain exceptions), an extraordinary corporate transaction (such as a merger, reorganization, or sale of a material amount of assets), or a change of control of our board of directors. See Item 1A. Risk Factors, "Vehicle manufacturers exercise significant control over us and our success is largely dependent on the success of our manufacturer partners."
With respect to our commercial vehicle distribution and other operations in Australia and New Zealand, we are party to distributor agreements with each manufacturer of products we distribute pursuant to which we are the distributor of these products in those countries and nearby markets. The agreements govern all aspects of our distribution rights, including sales and service activities, service and warranty terms, use of intellectual property, promotion and advertising provisions, pricing and payment terms, and indemnification requirements. The agreement with Western Star expires in 2031, the agreement with MTU expires in 2029, and the agreement with Detroit Diesel expires in 2031. We also are party to shipping agreements with respect to importing those products. For each of our non-company-owned dealers, we have signed a franchise agreement with terms that set forth the dealer's obligations with respect to the sales and servicing of commercial vehicles and associated parts.
Competition
Dealerships. We believe that the principal factors consumers consider when determining where to purchase a vehicle are vehicle pricing (including manufacturer rebates and other special offers), marketing campaigns conducted by manufacturers, the ability of dealerships to offer a wide selection of the most popular vehicles, offering a multi-channel experience to customers so they may purchase a vehicle on site or remotely, the location of dealerships, and the quality of
the customer experience. Other factors include customer preference for particular brands of vehicles and warranties. We believe that our dealerships are competitive in all of these areas.
The automotive and truck retail industry is currently served by franchised or agency dealerships, automotive manufacturers that sell directly to consumers, independent used vehicle dealerships, and individual consumers who sell used vehicles in private transactions. For new vehicle sales, we compete primarily with other franchised dealers in each of our marketing areas and automotive manufacturers that sell directly to consumers, relying on our premium facilities, superior customer service, advertising and merchandising, management experience, sales expertise, reputation, and the location of our dealerships to attract and retain customers. Each of our markets may include a number of well-capitalized competitors, including in certain instances dealerships owned by manufacturers and national and regional retail chains. In our retail commercial truck dealership operations, we compete with other manufacturers and retailers of medium- and heavy-duty trucks, such as Ford, International Kenworth, Mack, Peterbilt, and Volvo. We also compete with dealers that sell the same brands of new vehicles that we sell and with dealers that sell other brands of new vehicles that we do not represent in a particular market. Our new vehicle dealership competitors have franchise agreements which give them access to new vehicles on the same terms as us. Automotive dealers also face competition in the sale of new vehicles from purchasing services, and electric vehicle manufacturers that sell directly to consumers. With respect to arranging financing for our customers' vehicle purchases, we compete with a broad range of financial institutions, such as banks and local credit unions.
For used vehicle sales, we compete in a highly fragmented market which sells approximately 36.8 million units in the U.S. and approximately 7.6 million units in the U.K. annually through other franchised dealers, independent used vehicle dealers, automobile rental agencies, purchasing services, private parties, online retailers, and used vehicle “superstores” for the procurement and resale of used vehicles.
We compete with other franchised dealers to perform warranty repairs and with other dealers, franchised and non-franchised service center chains, and independent garages for non-warranty repair and routine maintenance business. We compete with other dealers, franchised and independent aftermarket repair shops, and parts retailers in our parts operations. We believe that the principal factors consumers consider when determining where to purchase vehicle parts and service are price, the use of factory-approved replacement parts, facility location, the familiarity with a manufacturer's brands, and the quality of customer service. A number of regional or national chains offer selected parts and services at prices that may be lower than our prices.
We believe the majority of consumers are utilizing the Internet and other digital media in connection with the purchase of new and used vehicles. Accordingly, we face increased competition from online vehicle websites, including those developed by manufacturers and other dealership groups.
Commercial Vehicle Distribution and Other. With respect to our commercial vehicle distribution and other operations in Australia and New Zealand, we compete with manufacturers, distributors, and retailers of other vehicles and products in our markets.
PTS. As an alternative to using PTS' full-service truck leasing or contract maintenance services, we believe that most potential customers perform some or all of these services themselves. They may also purchase similar or alternative services from other third-party vendors. Its full-service truck leasing operations compete with companies providing similar services on a national, regional, and local level. Many regional and local competitors provide services on a national level through their participation in various cooperative programs. Competitive factors include price, maintenance, service, and geographic coverage. PTS competes with finance lessors, truck and trailer manufacturers, and independent dealers, each of which provides full-service lease products, finance leases, extended warranty maintenance, rental, and other transportation services. Its contract maintenance offering competes primarily with truck and trailer manufacturers and independent dealers who provide maintenance services.
PTS' commercial and consumer rental operations compete with several other nationwide vehicle rental systems, a large number of vehicle leasing, and rental companies with multiple branches operating on a regional basis and many similar companies operating primarily on a local basis. Because a significant portion of its consumer rentals are used for moving and relocation, PTS competes with local and national moving and storage companies as well as alternatives such as portable container-based transportation and storage. In its commercial and consumer rental operations, it competes primarily on the basis of equipment availability, geographic location, and customer service.
PTS' logistics business competes with other dedicated logistics providers, freight management businesses, freight brokers, warehouse providers, and truckload carriers on a national, regional, and local level as well as with the internal supply chain functions of prospective customers who rely on their own resources for logistics management. Competitive
factors include price, efficient logistical design offerings, equipment, maintenance, service, technology, geographic coverage, and driver and operations expertise. PTS seeks to combine its logistics services with its existing full-service truck leasing and truck rental business to create an integrated transportation solution for its customers.
Human Capital
We believe that our Human Capital is our greatest asset and is an integral component of our growth and value creation strategy. We understand that exceptional customer service can only be consistently delivered by attracting, motivating, training, and retaining the very best team members. We strive to provide a work environment that promotes opportunity and is free from any form of discrimination based on any protected status in accordance with all applicable federal, state, and local laws. With this in mind, we put our employees at the heart of everything that we do by developing their talent and enabling them to build long-term careers.
In recognition of our people-first philosophy, in 2024, 79 of our dealerships were named to the "Automotive News Best Dealerships To Work For", which ranks the top 150 dealerships in the United States, including nine of the top ten spots and 17 of the top 20 spots nationally in 2024's rankings with one of our dealerships claiming the number one spot, more than any other dealership group. Our dealerships were also recognized for their commitment to promoting inclusive workplaces, receiving accolades for being among the best in the following categories: Best Dealerships for Employees 30 or Younger; Best Dealerships for Diversity, Equity and Inclusion; Best Dealerships for Minority Leadership; Best Dealerships for Family Friendliness. PTG was also named as one of the 2024 "Top Companies for Women to Work in Transportation." Also, in January 2024, we were notified that Penske Automotive Group was named by Fortune as a "World's Most Admired Company".
As of December 31, 2024, we employed approximately 28,900 people, of which approximately 683 were covered by collective bargaining agreements with labor unions. We believe our relations with our employees, including those represented by collective bargaining agreements, are generally good. We believe our inclusive culture enhances our ability to attract and retain the most talented leadership and workforce, thereby enabling us to better serve and broaden our customer base.
We maintain a culture grounded in safety and endeavor to eliminate workplace incidents, risks, and hazards. We have partnered with environmental and safety consulting firms to assist in compliance with specific local and federal laws and regulations relating to environmental and safety issues and to promote best safety practices. Audits are regularly performed to ensure and maintain compliance.
We believe our employee turnover of approximately 20% is below the industry averages for our businesses. We seek to motivate our key managers and salespersons through, among other things, variable compensation programs tied principally to local profitability and customer satisfaction. We also annually survey our employees to gauge their satisfaction and address any resulting concerns.
Regulation
We operate in a highly regulated industry and a number of regulations affect the marketing, selling, financing, servicing, and distribution of vehicles. Under the laws of the jurisdictions in which we currently operate, we typically must obtain a license in order to establish, operate, relocate a dealership, or operate a repair facility. These laws also regulate our business conduct, including our advertising, operating, financing, employment, distribution, and sales practices. Other laws and regulations include franchise laws and regulations, environmental laws and regulations (see “Environmental Matters” below), laws and regulations applicable to new and used motor vehicle dealers as well as customer and employee privacy, identity theft prevention, wage-hour, anti-discrimination, and other employment practices laws. With respect to online sales, many laws and regulations applicable to our business were adopted prior to the introduction of the Internet, certain digital technologies, and e-commerce, generally. As a result, we are tasked with maintaining compliance in an uncertain regulatory environment.
Our financing activities with customers are subject to truth-in-lending, consumer leasing, equal credit opportunity, and similar regulations as well as motor vehicle finance laws, installment finance laws, insurance laws, usury laws, and other installment sales laws. Some jurisdictions regulate finance fees that may be paid as a result of vehicle sales. In the U.K., the Financial Conduct Authority (the "FCA") regulates financial services firms and financial markets, including our activities in acting as broker for the financing of vehicle sales. The FCA has announced that it will investigate the historic use of discretionary commission arrangements ("DCAs") amid concerns that this practice may have been unfair to customers. The purpose of the investigation is to consider whether the historic use of DCAs caused customers to pay too much for their car loans and, if so, to consider potential remediation measures. The investigation is being undertaken after the Financial
Ombudsman Service (a public body, which resolves financial complaints) determined that DCAs, in two separate cases which do not involve us, had caused financial losses to customers. We await the outcome of the FCA’s investigation which is expected in May of 2025. Any regulatory or judicial outcome that ultimately results in the refund of historical commissions paid to us or that reduces the commissions paid to us could materially and adversely affect us. Further, on October 25, 2024, the U.K. Court of Appeal (the second highest court in the U.K.) issued a judgment requiring lenders to repay certain customers the commissions paid to dealers for vehicle finance agreements determining that there was a duty to the customers to disclose the amount of the commissions paid to those dealers. Although this judgment has been appealed by the relevant lenders to the U.K. Supreme Court (the highest court in the U.K.), our U.K. consumer lending partners have required that we now disclose to customers the commissions we receive from their vehicle financing. The ultimate resolution of these matters may impact our procedural processes and expose us to claims for repayment of historical commissions. See Item 1A. Risk Factors, "Other Regulatory Issues".
In the U.S., we benefit from the protection of numerous state franchise laws that generally provide that a manufacturer or distributor may not terminate or refuse to renew a franchise agreement unless it has first provided the dealer with written notice setting forth good cause and stating the grounds for termination or non-renewal. Some state franchise laws allow dealers to file protests or petitions or to attempt to comply with the manufacturer's criteria within the notice period to avoid termination or non-renewal. Our international locations generally do not have these laws, and as a result, our international operations operate without these types of protections. See Item 1. Business, "Agreements with Vehicle and Equipment Manufacturers."
Environmental Matters
We are subject to a wide range of environmental laws and regulations, including those governing discharges into the air and water, the operation and removal of aboveground and underground storage tanks, the use, handling, storage, and disposal of hazardous substances and other materials, and the investigation and remediation of environmental contamination. Our business involves the generation, use, handling, and contracting for recycling or disposal of hazardous or toxic substances or waste, including environmentally sensitive materials such as motor oil, filters, transmission fluid, antifreeze, refrigerant, batteries, solvents, lubricants, tires, and fuel. EVs pose additional risks regarding the use, maintenance, and disposal of electric batteries which may be subject to additional regulations. We have incurred, and will continue to incur, capital and operating expenditures and other costs in complying with such laws and regulations.
Our operations involving the management of hazardous and other environmentally sensitive materials are subject to numerous requirements. Our business also involves the operation of storage tanks containing such materials. Storage tanks are subject to periodic testing, containment, upgrading, and removal under applicable law. Furthermore, investigation or remediation may be necessary in the event of leaks or other discharges from current or former underground or aboveground storage tanks. In addition, water quality protection programs govern certain discharges from some of our operations. Similarly, certain air emissions from our operations, such as vehicle painting, may be subject to relevant laws. Various health and safety standards also apply to our operations.
We may have liability in connection with materials that are sent to third-party recycling, treatment, and/or disposal facilities under the U.S. Comprehensive Environmental Response, Compensation, and Liability Act and comparable statutes. These statutes impose liability for investigation and remediation of contamination without regard to fault or the legality of the conduct that contributed to the contamination. Responsible parties under these statutes may include the owner or operator of the site where the contamination occurred and companies that disposed or arranged for the disposal of the hazardous substances released at these sites.
We have a proactive strategy related to environmental, health, and safety compliance, which includes contracting with third parties to inspect our facilities periodically. We believe that we do not have any material environmental liabilities and that compliance with environmental laws and regulations will not, individually or in the aggregate, have a material effect on us. However, soil and groundwater contamination are known to exist at certain of our current or former properties. Further, environmental laws and regulations are complex and subject to change. In addition, in connection with our acquisitions, it is possible that we will assume or become subject to new or unforeseen environmental costs or liabilities, some of which may be material. Compliance with current, amended, new, or more stringent laws or regulations, stricter interpretations of existing laws, or the future discovery of environmental conditions could require additional expenditures by us, and such expenditures could be material.
Vehicle Emissions Regulation
Federal and state governments and regulators in our markets have increasingly placed restrictions and limitations on new vehicles in an effort to combat perceived negative environmental effects. In response to concerns that emissions of
carbon dioxide and certain other gases, referred to as "greenhouse gases" or "GHGs," may be contributing to warming of the Earth's atmosphere, climate change-related legislation and policy changes to restrict GHGs have been implemented at state and federal levels in a manner that impacts our business. The impact of the new U.S. presidential administration on U.S. federal policy in this area is uncertain. See Item 1A. Risk Factors, "Vehicle Emissions and Other Environmental Regulations".
Retail Automotive. Many jurisdictions in which we operate have placed restrictions on new vehicle GHG emissions. The U.S. Environmental Protection Agency ("EPA") has adopted standards that require vehicle manufacturers achieve progressively lower emissions for new vehicles in model years 2027 through 2032. The standards apply to all new light-duty and medium-duty vehicles, which includes passenger vehicles, light trucks and large pickups and vans. The standards require an industry-wide average target for light-duty vehicles of 85 grams of carbon dioxide per mile in model year 2032, a nearly 50% reduction from the 2026 standard. Medium-duty vehicles must achieve a final standard of 274 grams of carbon dioxide per mile by 2032, a 44% reduction from the 2026 standard. The EPA regulates motor vehicle emissions through performance-based standards that impose fleet-wide average emissions limits—individual vehicles with higher emissions are allowable if the fleet average achieves the EPA's emissions targets. The standards do not require the adoption of specific technologies. Automakers may decide which technologies will achieve the standards, such as advanced gasoline engines and transmissions, improvements to tailpipe controls, and electrification. Nonetheless, the EPA projects that the influence of these standards, in conjunction with other market developments like incentives available under the Inflation Reduction Act, will result in plug-in EVs accounting for 68% of new light-duty vehicles by model year 2032.
Moreover, the EPA has allowed the State of California Air Resource Board (“CARB”) to adopt its Advanced Clean Cars II program which requires that new vehicle sales by vehicle manufacturers to be 35% Zero Emissions Vehicles (ZEVs) for model year 2026 which increases to 100% ZEVs by model year 2035 (with certain allowances for hybrid gas/EVs). Certain states have also adopted California’s mandate, in whole or in part.
Some jurisdictions outside the U.S. have implemented similar regulations. The European Parliament requires most automakers to reduce the emissions of new cars sold by 55% in 2030 and achieve a zero carbon-emission standard by 2035, effectively banning the sale of new gasoline and diesel cars and vans by 2035. The U.K. Department for Transport has proposed a ban on the sale of gasoline and diesel engines in new cars that would take effect in as early as 2030 while also providing government incentives on certain EVs to entice consumers to transition from internal combustion vehicles to EVs, although certain reports indicate that the U.K. government may delay the implementation date of these requirements.
Significant increases in fuel economy requirements and new restrictions on emissions of vehicles and fuels could adversely affect prices of and demand for the vehicles that we sell, which could materially adversely affect us. Such vehicles may also not be able to be produced in the quantities required, or, if produced, may not be able to be sold to consumers in light of customer reluctance to transition to EVs. While increasing consumer adoption of EVs may present new service opportunities, including with respect to range maintenance and optimization, cooling protection, torque protection, tire replacement, battery replacement, and warranty on newly released models, our service revenue per vehicle may decline over time as these EVs may require less physical maintenance than gas and hybrid vehicles due to the absence of certain parts systems. However, due to the complexity and training required for the electrical components of the vehicle, we believe a larger percentage of EV customers will be retained for service.
Retail Commercial Truck. Similar regulations apply to the commercial vehicles sold by PTG in the U.S. and Canada and purchased and operated by PTS. The EPA Clean Trucks Plan is designed to incent market shifts to zero-emission technologies in certain segments of the heavy-duty vehicle sector and calls for new more stringent GHG emissions standards for heavy-duty engines and vehicles starting as soon as model year 2027. The first rulemaking under the Clean Trucks Plan was a final rule signed on December 20, 2022, which focuses on reducing emissions that form smog and soot and will apply to heavy-duty engines and vehicles beginning in model year 2027. On March 20, 2024, the EPA published final rules setting new, more stringent, emissions standards for criteria pollutants and GHGs for light-duty and medium-duty vehicles starting in model year 2027 through model year 2032. On March 29, 2024, the EPA published final rules setting more stringent emissions standards for heavy-duty vehicles starting in model year 2027. For example, GHG emissions in light-duty vehicles are required to decrease 49% for model year 2032 as compared to model year 2026. Moreover, beginning with model year 2027, the EPA is requiring electric batteries and related components to have at least an 8-year, 80,000-mile warranty.
Similarly, CARB has adopted performance requirements known as the Advanced Clean Trucks regulation for diesel trucks with periodic compliance dates, and recently set a goal for all heavy-duty trucks in California to be zero emissions by 2045. Some states have followed California in enacting emissions standards and others may choose to do so in the future. For example, several states, including New York, New Jersey, Washington, Oregon, Massachusetts, Colorado and
Vermont, have followed California in adopting an Advanced Clean Trucks regulation, which mandates truck manufacturers who certify Class 2b-8 chassis or complete vehicles with combustion engines to sell zero-emission trucks as an increasing percentage of their annual sales in these states from 2024 to 2035 as well as fleet reporting requirements. In March 2023, CARB was provided a legal waiver by the EPA to require that half of all heavy truck sales be all-electric by 2035. On December 18, 2024, the EPA granted a waiver allowing CARB to implement its Low-NOx Heavy-Duty Omnibus Regulation that, among other things, sets significantly lower NOx and particulate matter emissions standards for model 2024 and later heavy-duty engines and vehicles.
Furthermore, the Advanced Clean Fleet rule, issued by CARB in April 2023, and which may be adopted in other jurisdictions, will require certain larger fleets, including PTS’, to purchase zero-emission trucks to comprise over time an increasing percentage of their fleets from 2025 to 2042. On December 28, 2023, CARB announced that it would defer enforcement of the rule while it requested a waiver from EPA to authorize the rule. In addition, several lawsuits have been filed seeking to invalidate the rule, including by the California Trucking Association, the American Free Enterprise Chamber of Commerce, the Associated Equipment Dealers, Nebraska Truck Association, the National Truck Equipment Association and the Specialty Equipment Market Association and a number of states and the Arizona state legislature. However, on January 14, 2025, CARB withdrew its waiver request with the EPA and the status of the Advanced Clean Fleets rule is uncertain.
On January 20, 2025, President Trump signed Executive Order "Unleashing American Energy", which may have direct implications on the policies and regulations that impact the automotive and transportation industries. The Executive Order seeks to rescind waivers granted by the EPA for California's zero emission vehicle regulations with a focus on eliminating any "electric vehicle mandates" and terminating "state emission waivers that function to limit sales of gasoline-powered vehicles" (which would include the Advanced Clean Trucks regulation), and modify and/or eliminate the GHG standards for trucks discussed above. As a result, the status of the emission regulations discussed above remain uncertain.
Foreign, federal, state, provincial and local lawmakers also are considering a variety of other climate change proposals. These and any other future requirements could result in higher prices for vehicles, diesel engines, materials and fuel, as well as higher maintenance costs and uncertainty as to reliability of the new engines. Any of these factors could increase operating costs in the transportation industry, which would directly affect PTS’ and PTG’s customers, could reduce demand for vehicles, lead to decreased lease and rental business as customers reevaluate their needs, and affect resale values of these vehicles when PTS or PTG attempts to sell them in the future.
Self-Insurance
Our business is subject to substantial risk of loss due to significant concentrations of property value, including inventory at our locations, as well as other liabilities arising out of our operations. We retain risk relating to certain of our general liability insurance, workers' compensation insurance, vehicle physical damage insurance, property insurance, information security risk insurance, directors' and officers' insurance, and employee medical benefits in the U.S. As a result, we are likely to be responsible for a significant portion of the claims and losses incurred under these programs. The amount of risk we retain varies by program, and for certain exposures, we either have no insurance or we have pre-determined maximum loss limits for certain individual claims and/or insurance periods. Losses, if any, above the pre-determined loss limits are paid by third-party insurance carriers. Certain insurers have limited available property coverage in response to the natural catastrophes experienced in recent years.
Available Information
For selected financial information concerning our various operating and geographic segments, see Note 17 to our consolidated financial statements included in Item 8 of this report. Our Annual Report on Form 10-K, Quarterly Reports on Form 10-Q, current reports on Form 8-K, and amendments to those reports filed or furnished pursuant to section 13(a) or 15(d) of the Exchange Act are available free of charge through our website, www.penskeautomotive.com, under the tab “Investors” as soon as reasonably practicable after they are electronically filed with, or furnished to, the Securities and Exchange Commission (“SEC”). The SEC maintains an internet site that contains reports, proxy, and information statements and other information that issuers file with the SEC. The address of the SEC's website is www.sec.gov. We also make available on our website copies of materials regarding our corporate governance, policies, and other matters involving the Company, including our Corporate Governance Guidelines, our Code of Business Ethics, and the charters relating to the committees of our Board of Directors. The content of any website referred to in this Form 10-K is not deemed incorporated by reference into this Form 10-K unless expressly noted. You may obtain a printed copy of any of the foregoing materials by sending a written request to Investor Relations, Penske Automotive Group, Inc., 2555 S. Telegraph Road, Bloomfield Hills, MI 48302 or by calling 248-648-2500. The information on or linked to our website is not part of
this document. We plan to disclose changes to our Code of Business Ethics or waivers, if any, for our executive officers or directors on our website. We incorporated in the state of Delaware in 1990 and began dealership operations in October 1992.
Item 1A. Risk Factors
Our business, financial condition, results of operations, cash flows, prospects, and the prevailing market price and performance of our common stock may be affected by a number of factors, including the matters discussed below. Certain statements and information set forth herein as well as other written or oral statements made from time to time by us or by our authorized officers on our behalf, constitute “forward-looking statements” within the meaning of the Federal Private Securities Litigation Reform Act of 1995. Words such as “anticipate,” “believe,” “estimate,” “expect,” “intend,” “may,” “goal,” “plan,” “seek,” “project,” “continue,” “will,” “would,” and variations of such words and similar expressions are intended to identify such forward-looking statements. We intend for our forward-looking statements to be covered by the safe harbor provisions for forward-looking statements contained in the Private Securities Litigation Reform Act of 1995, and we set forth this statement in order to comply with such safe harbor provisions. You should note that our forward-looking statements speak only as of the date of this Annual Report on Form 10-K or when made, and we undertake no duty or obligation to update or revise our forward-looking statements, whether as a result of new information, future events, or otherwise.
Although we believe that the expectations, plans, intentions, and projections reflected in our forward-looking statements are reasonable, such statements are subject to known and unknown risks, uncertainties, and other factors that may cause our actual results, performance, or achievements to be materially different from any future results, performance, or achievements expressed or implied by the forward-looking statements.
The material risks, uncertainties, and other factors that our stockholders and prospective investors should consider include the following:
Operational Risks
Macro-economic and geo-political conditions. Our performance is impacted by geo-political conditions and by general economic conditions overall and in particular by economic conditions in the markets in which we operate. These economic conditions include levels of new and used vehicle sales, availability of consumer credit, changes in consumer demand, consumer confidence levels, fuel prices, demand for trucks to move freight with respect to PTS and PTG, the rate of inflation, personal discretionary spending levels, interest rates, and unemployment rates. When the worldwide economy faltered early in 2020, we were adversely affected, and we expect a similar relationship between general economic and industry conditions and our performance in the future. Any geo-political developments that adversely affect the economies of our markets will also likely affect us. Moreover, geo-political conditions, including international conflict, can affect the vehicle supply chain as has happened with the war in Ukraine. Certain vehicle manufacturers and suppliers have experienced, and may continue to experience, difficulty sourcing certain parts which is further exacerbating the supply chain difficulties resulting from the demand for labor and the shortage of microchips and other components.
Many of our market countries have recently experienced a high rate of inflation. Inflation affects the price of vehicles, the price of parts, the rate of pay of our employees, the cost and availability of consumer credit, consumer demand, and our borrowing expenses. High rates of inflation may adversely affect consumer demand and increase our costs, which may materially and adversely affect us. Similarly, periods of rapid deflation in vehicle prices may materially and adversely affect our ability to profitably sell the affected vehicles.
Adverse conditions affecting one or more significant automotive manufacturers or suppliers will affect us. Our success depends on the overall success of the automotive and commercial vehicle industries generally and in particular, on the success of the brands of vehicles that each of our dealerships sell. In 2024, revenue generated at our BMW/MINI, Audi/Volkswagen/Porsche/Bentley, Toyota/Lexus, and Mercedes-Benz/Sprinter/smart dealerships represented 26%, 22%, 14%, and 9%, respectively, or 71% in aggregate, of our total automotive dealership revenues. In addition, our retail commercial truck operations rely principally on Freightliner and Western Star trucks (both Daimler brands). These manufacturers operate independently of us and we have no control over their operational decisions and future plans. We are subject to a concentration of risk in the event of adverse events or financial distress, including bankruptcy, impacting one or more of these manufacturers.
Significant adverse geo-political events, weather-related events, supply chain issues, or other events that interrupt vehicle or parts supply to our dealerships would likely have a significant and adverse impact on the automotive or commercial vehicle industries, including us, particularly if the events impact any of the manufacturers whose franchises
generate a significant percentage of our revenue. In the first quarter of 2024, vehicle shipments of certain brands were delayed as a sub-component was determined to be violative of certain legal requirements relating to its place of origin. In March 2024, a cargo ship crashed into the Francis Scott Key Bridge in the Port of Baltimore resulting in closure of that port, which was the largest U.S. port by volume for deliveries of automotive vehicles and components. In April 2024, a Freightliner truck supplier experienced a fire at its facility. These events affected the timing of new vehicles deliveries to our dealerships and similar events may similarly affect the timing of deliveries or aggregate availability of inventories, which may materially and adversely affect us.
Other national and international events, conditions, and conflicts may impact the supply of vehicles or parts to the markets in which we operate, and our business could be materially adversely affected. The supply chain required to manufacture and supply parts for the vehicles we sell is highly complex and integrated. Any failure of that supply chain could materially and adversely affect us. Production disruptions and supply shortages could result in suppressed new and used vehicle sales volumes which would impact the availability and affordability of new and used vehicles and may adversely affect us.
Vehicle manufacturers exercise significant control over us and our success is largely dependent on the success of our manufacturer partners. Each of our new vehicle dealerships and distributor operations operate under franchise and other agreements with automotive manufacturers, commercial vehicle manufacturers, or related distributors. These agreements, and in certain cases, related framework agreements, govern almost every aspect of the operation of our dealerships and give manufacturers the discretion to terminate or not renew our franchise agreements for a variety of reasons, including certain events outside our control such as accumulation of our stock by third parties. In certain cases, they also limit our ability to acquire dealerships on a national, regional, and local basis, and from time to time, we are precluded from acquiring additional franchises of certain manufacturers, or subject to other adverse actions, to the extent we are not meeting specified performance criteria at our existing stores (with respect to matters such as sales volume, sales effectiveness, and customer satisfaction or loyalty) until our performance improves in accordance with the agreements, subject to applicable state franchise laws.
Without franchise or distributor agreements, we would be unable to sell or distribute new vehicles or perform manufacturer authorized warranty service. If a significant number of our franchise agreements are terminated, not renewed, or, with respect to our distributor operations, a competing distributor were introduced, we would be materially affected. Manufacturers also have the right to establish new franchises or relocate existing franchises, subject, in the U.S., to applicable state franchise laws. While we expect that we will be able to renew our franchise agreements in the ordinary course, we cannot guarantee that all of our franchise agreements will be renewed, that the terms of the renewals will be favorable to us or that the manufacturers will not take other adverse actions under our arrangements with them. It is also possible that our stores will not be able to comply with manufacturers’ sales, customer satisfaction, loyalty, performance, facility, and other requirements in the future, which may affect our ability to acquire new stores or renew our franchise agreements, or subject us to other adverse actions, including the termination or compelled sale of a franchise, any of which could have a material adverse effect on our financial condition and results of operations.
In addition to the control afforded to manufacturers as a result of our franchise and other agreements, we also rely on our manufacturer partners for many aspects of our business and the success of our dealerships is dependent, in large part, on their success. For instance, we rely on our manufacturer partners exclusively for new vehicle inventory, and our ability to successful sell new vehicles is dependent on the manufacturers' ability to design, manufacture and allocate to our dealerships a desirable mix of high-quality, competitively priced, technologically current and legally compliant vehicle inventories in quantities sufficient to meet our and our customers' demand. We also receive direct financial support and assistance from certain manufacturers and their affiliates, including captive finance companies, across various aspects of our business, including floorplan assistance and advertising assistance, and rely on manufacturers to pay us for warranty and service contract work for vehicles under manufacturer product warranties and service contracts where we directly bill the manufacturer instead of invoicing the customer directly. Our business, results of operations, and financial condition could be materially adversely affected as a result of any event that has an adverse effect on the vehicle manufacturers on which we rely for inventory, support and payment, or in the event such manufacturers fail to maintain the goodwill associated with their respective brands, which adverse consequences may be wholly outside of our control. See the risks captioned "Adverse conditions affecting one or more significant automotive manufacturers or suppliers will affect us" above and "Brand reputation" below.
The success of our commercial vehicle distribution and other business is directly impacted by availability and demand for the vehicles and other products we distribute. We are the exclusive distributor of Western Star commercial trucks, MAN commercial trucks and buses, and Dennis Eagle refuse collection vehicles, together with associated parts, across Australia, New Zealand, and portions of the Pacific. We are also the distributor of diesel and gas engines and power
systems in these same markets. The profitability of these businesses depends upon the number of vehicles, engines, power systems, and parts we distribute, which in turn is impacted by demand for these products. We believe demand is subject to general economic conditions, exchange rate fluctuations, regulatory changes, competitiveness of the products, and other factors over which we have limited control. In the event sales of these products are fewer than we expect, our related results of operations and cash flows for this aspect of our business may be materially adversely affected. The products we distribute are principally manufactured at a limited number of locations. In the event of a supply disruption, sufficient quantities of vehicles, engines, power systems, and parts are not made available to us, or if we accept these products and are unable to economically distribute them, our cash flows or results of operations may be materially adversely affected.
Australian economic conditions. Our commercial vehicle distribution and other operations in Australia and New Zealand may be impacted by local and regional economic conditions and in particular, the price of commodities such as copper and iron ore, which may impact the desire of our customers to operate their mining operations and replace their vehicle fleets. Adverse pricing concerns of those, and other commodities, may have a material adverse effect on our ability to distribute, and/or retail, commercial vehicles and other products profitably. These same conditions may also negatively impact the value of the Australian and New Zealand Dollar versus the U.S. Dollar, which negatively impacts our U.S. Dollar reported financial results and the pricing of products sold by Penske Australia, which are manufactured in the U.S., U.K., and Germany.
Additional risks relating to PTS. PTS' business has additional risks to those in the retail business, including:
Customers. PTS has a more concentrated customer base than we do and is subject to changes in the financial health of its customers, changes in their asset utilization rates, and increased competition for those customers.
Workforce. PTS requires a significant number of qualified drivers and technicians, which may be difficult to hire, and is subject to increased compliance costs or work stoppages relating to those employees, particularly in regard to changes in labor laws and time of work rules regarding those employees. PTS contributes to several U.S. multi-employer pension plans that provide defined benefits to approximately 2,430 associates covered by collective bargaining agreements. If they withdraw or are deemed to withdraw from participation in any of these plans, then applicable law could require them to make withdrawal liability payments to the plan. If any of those plans were deemed to be underfunded, PTS could be subject to additional assessments, which could be substantial.
Fleet risk. As one of the largest purchasers of commercial trucks in North America, PTS requires continued availability from truck manufacturers and suppliers of vehicles and parts for its fleet, which may be uncertain, in particular if a significant recall were to occur. PTS is affected by the same supply issues noted above and any failure of the supply chain resulting in limited availability of new trucks or parts may have a material adverse impact on PTS. In addition, because PTS sells a large number of trucks each year and is subject to residual risk for the vehicles it leases to customers, changes in values of used trucks affect PTS' profitability.
PTS also bears the residual risk on the value of its vehicles when a customer's lease for those vehicles expires or when its holding period for rental vehicles ends. If demand for used vehicles declines, PTS may obtain lower sales proceeds upon their sale. A reduction in proceeds from sales of used vehicles in PTS’ fleet could cause them to sustain a substantial loss or require them to depreciate those vehicles at a more accelerated rate. Any reduction in the resale values of the vehicles in its fleet could adversely affect its profitability.
Capital markets risk. PTS relies on banks and capital markets to fund its operations and capital commitments. PTS has a significant amount of total indebtedness, which it uses in part to purchase its vehicle fleet and therefore, is subject to changes in, and continued access to, capital markets.
Regulatory Requirements and Vehicle Mandates. Increasing efforts to control greenhouse gas emissions are likely to have an effect on PTS' (and PTG's) business and results of operations as further discussed below under "Vehicles Emissions Regulation". Any of the factors noted could increase operating costs in the transportation industry, which would directly affect PTS' and PTG's customers and could reduce demand for vehicles. The new technology and legal requirements may also affect resale values of these vehicles when PTS or PTG attempts to sell them in the future.
Centralized Information Systems. PTS relies heavily on centralized information systems to process lease and rental transactions, manage its fleet of vehicles, account for its activities, and otherwise conduct its business. A failure of a major system, or a major disruption of communications between the system and the locations it serves, could cause a loss of reservations, interfere with PTS' ability to manage its fleet, impede real-time diagnostics of vehicles, slow leasing, rental, and sales processes, and otherwise adversely affect PTS' ability to manage its business.
Strategic Risks
Brand reputation. Our businesses and our commercial vehicle operations, in particular, as those are more concentrated with a particular manufacturer, are impacted by consumer demand and brand preference, including consumers' perception of the quality of those brands. A decline in the quality and brand reputation of the vehicles or other products we sell or distribute, as a result of events such as manufacturer recalls or legal proceedings, may adversely affect our business. If such events were to occur, the profitability of our business related to those manufacturers could be adversely affected.
Our business is very competitive. We generally compete with other franchised dealerships in our markets, used vehicle dealerships, private market buyers and sellers of used vehicles, an increasing number of internet-based vehicle sellers, electric vehicle manufacturers that sell directly to consumers, national and local service and repair shops and parts retailers with respect to commercial vehicles, distributors of similar products, and manufacturers in certain markets. Purchase decisions by consumers when shopping for a vehicle are extremely price sensitive. The level of competition in the market can lead to lower selling prices and related profits. If there is a prolonged drop in retail prices or if new vehicle sales are allowed to be made over the internet or otherwise without the involvement of franchised dealers, our business could be materially adversely affected.
Changes to the retail delivery model, including increased digital retailer competition, efforts to sell vehicles directly outside the franchise system, and transition to an agency model of distribution could adversely affect our business, results of operations, financial condition, and cash flows.
Competition from online retailers. The automotive retail industry is experiencing competition in the used vehicle market from companies with a primarily online business model, including companies such as Carvana and others. We may face increased competition for market share with these non-traditional delivery models and digital retailers over time, which could materially and adversely affect our results of operations. We cannot be sure that our initiatives will be successful or that the amount we invest in these initiatives will result in our maintaining or enhancing our market share and continued or improved financial performance.
Sales outside the franchise system. In recent years, new electric vehicle manufacturers have been able to conduct new vehicle sales outside of the franchised automotive system as new entrants. While the sales levels of these new entrants were approximately 4.2% of new vehicles in the U.S. and approximately 2.6% of new vehicles in the U.K. for the year ended December 31, 2024, continued market share gains by manufacturers operating outside the franchise system may materially and adversely affect us. Moreover, while we expect continued good relations with our manufacturer partners, should U.S. franchise laws be repealed or amended to allow our existing manufacturer partners to effectively operate outside the franchised system, our results of operations may be materially and adversely impacted. Our franchised automotive dealers in the U.K., European Union, Australia, and Japan operate effectively without U.S. franchise law protections.
Agency. Some of our key automotive manufacturer partners have either implemented or announced plans to explore the agency model of selling new vehicles in the U.K. and other countries. We receive a fee for facilitating the sale by the manufacturer of a new vehicle but do not hold the vehicle in inventory. Vehicles sold under this agency model are counted as new agency units sold instead of new retail units sold by us, and only the fee we receive from the manufacturer, not the price of the vehicle, is reported as new revenue with no corresponding cost of sale. The long-term impact of the agency model at these dealerships as well as other agency models proposed by our manufacturer partners remains uncertain. We believe transition to an agency model in the U.S. would be difficult for the manufacturers in light of U.S. franchise laws. See Item 1. Business, "Regulations" and Item 1A. Risk Factors, "Sales outside the franchise system" and "Other Regulatory Issues."
New mobility models and vehicle electrification will continue to result in rapid changes to the automotive and trucking industries. Shared vehicle services such as Uber and Lyft provide consumers with increased choice in their personal mobility options. The effect of these and similar mobility options on the retail automotive industry is uncertain and may include lower levels of new vehicles sales but with increasing miles driven, which could require additional demand for vehicle maintenance. Most major vehicle manufacturers have announced plans to electrify some or all of their new vehicle fleets in response to concerns about the environment and due to regulatory requirements to limit vehicle emissions. We expect to continue to sell electric and hybrid gas/EVs through our franchised dealerships; however, our service revenues may decline over time as these vehicles may require less physical maintenance than gas and hybrid vehicles due to the absence of certain parts systems. Conversely, increasing consumer adoption of EVs may present new service opportunities, including with respect to range maintenance and optimization, cooling protection, torque protection, tire replacement, battery replacement, and warranty on newly released models.
The effects of the eventual adoption of driverless vehicles are uncertain. Technological advances are facilitating the evolution of driverless vehicles. While many manufacturers offer varying degrees of driver assistance technology, the timing of adoption of true driverless vehicles remains uncertain due to regulatory requirements, additional technological requirements, and uncertain consumer acceptance of these vehicles. The effect of driverless vehicles on the automotive retail and trucking industries is uncertain and could include changes in the level of new and used vehicles sales, the price of new and used vehicles, the levels of service required by driverless vehicles and the role of franchised dealers, any of which could materially and adversely affect our business.
Key personnel. We believe that our success depends to a significant extent upon the efforts and abilities of our senior management and in particular, upon Roger Penske who is our Chair and Chief Executive Officer. To the extent Mr. Penske, or other key personnel, were to depart from our Company unexpectedly, our business could be significantly disrupted.
Financial Risks
Leverage. Our significant debt and other commitments expose us to a number of risks, including:
Cash requirements for debt and lease obligations. A significant portion of the cash flow we generate must be used to service the interest and principal payments relating to our various financial commitments, including $4.0 billion of floor plan notes payable, $1.9 billion of non-vehicle long-term debt, and $5.3 billion of future lease commitments (including extension periods that are reasonably assured of being exercised and assuming constant consumer price indices). A sustained or significant decrease in our operating cash flows could lead to an inability to meet our debt service or lease requirements or to a failure to meet specified financial and operating covenants included in certain of our agreements. If this were to occur, it may lead to a default under one or more of our commitments and potentially the acceleration of amounts due, which could have a significant and adverse effect on us.
Credit Availability. Because we finance the majority of our operating and strategic initiatives using a variety of commitments, including floor plan notes payable and revolving credit facilities, we are dependent on continued availability of these sources of funds. If these agreements are terminated or we are unable to access them because of a breach of financial or operating covenants or otherwise, we will likely be materially affected.
Interest rate variability. The interest rates we are charged on a substantial portion of our debt, including the floor plan notes payable we issue to purchase the majority of our inventory, are variable, increasing or decreasing based on changes in certain published interest rates. Increases to such interest rates have resulted in and may continue to result in higher interest expense for us, which negatively affects our operating results. Because many of our customers finance their vehicle purchases, increased interest rates may also decrease vehicle sales due to affordability, which would negatively affect our operating results.
Impairment of our goodwill or other indefinite-lived intangible assets has in the past had, and in the future could have, a material adverse impact on our earnings. We evaluate goodwill and other indefinite-lived intangible assets for impairment annually and upon the occurrence of an indicator of impairment. Our process and results for impairment testing of these assets is described further under “Impairment Testing” in Part II, Item 7. Management's Discussion and Analysis of Financial Condition and Results of Operations — Critical Accounting Policies and Estimates. If we determine that the amount of our goodwill or other indefinite-lived intangible assets are impaired at any point in time, we would be required to reduce the value of these assets on our balance sheet, which could also result in a material non-cash impairment charge that could also have a material adverse effect on our results of operations for the period in which the impairment occurs.
Performance of sublessees. In connection with the sale, relocation, and closure of certain of our businesses, we have entered into a number of third-party sublease agreements. The rent paid by our sub-tenants on such properties in 2024 totaled approximately $16.2 million. In the aggregate, we remain ultimately liable for approximately $130.8 million of such lease payments including payments relating to all available renewal periods. We rely on our sub-tenants to pay the rent and maintain the properties covered by these leases. In the event a subtenant does not perform under the terms of their lease with us, we could be required to fulfill such obligations, which could have a significant and adverse effect on us.
International and foreign currency exchange risk. We have significant operations outside of the U.S. that expose us to changes in foreign currency exchange rates and to the impact of economic and political conditions in the markets where we operate. As exchange rates fluctuate, our results of operations as reported in U.S. Dollars fluctuate. For example, if the U.S. Dollar strengthens against the British Pound, our U.K. results of operations would translate into less U.S. Dollar reported results. Sustained levels or an increase in the value of the U.S. Dollar, particularly as compared to the British Pound, could result in a significant and adverse effect on our reported results.
Joint ventures. We have significant investments in a variety of joint ventures, including retail automotive operations in Italy and Spain. We have a 28.9% interest in PTS. We expect to receive annual operating distributions from PTS and the other ventures and in the case of PTS, realize significant cash savings on taxes. These benefits may not be realized if the joint ventures do not perform as expected, or if changes in tax, financial, or regulatory requirements negatively impact the results of the joint venture operations. Our ability to dispose of these investments may be limited. In addition, the relevant joint venture agreement and other contractual restrictions may limit our access to the cash flows of these joint ventures. For example, certain of PTS' debt agreements allow partner distributions only as long as it is not in default under those agreements and the amount it pays does not exceed 50% of its consolidated net income, unless its debt-to-equity ratio is less than 3.0 to 1.0, in which case its distributions may not exceed 80% of its consolidated net income.
Legal and Compliance Risks
Vehicle Emissions and Other Environmental Regulations. Federal and state governments and regulators in our markets have increasingly placed restrictions and limitations on new vehicles in an effort to combat perceived negative environmental effects. In response to concerns that emissions of carbon dioxide and certain other gases, referred to as "greenhouse gases" or "GHGs," may be contributing to warming of the Earth's atmosphere, climate change-related legislation and policy changes to restrict GHGs have been implemented, at state and federal levels in a manner that impacts our business. The most significant of these regulations and other requirements are described above under Item 1. Business, "Regulation" and "Vehicle Emissions Regulation".
Significant increases in fuel economy requirements, new battery warranty standards, and new restrictions on emissions on vehicles and fuels could adversely affect prices, availability, and demand for the vehicles that we sell, which could materially adversely affect us. Such vehicles may also not be able to be produced in the quantities required, or, if produced, may not be able to be sold to consumers in light of customer reluctance to transition to EVs. Adoption of EVs will increasingly require the generation of additional electricity and nationwide electric charging infrastructures which may be unavailable in our markets. While increasing consumer adoption of EVs may present new service opportunities, including with respect to range maintenance and optimization, cooling protection, torque protection, tire replacement, battery replacement, and warranty on newly released models, our service revenue per vehicle may decline over time as these EVs may require less physical maintenance than gas and hybrid vehicles due to the absence of certain parts systems.
PTG sells new and used heavy- and medium-duty commercial trucks, parts and service, and offers collision repair services. PTS, with its broad product offering including full-service truck leasing, contract maintenance, and truck rental, along with logistics services, is one of the largest purchasers of commercial trucks in North America. Should future regulations or consumer sentiment hinder our or PTS' ability to maintain, acquire, sell, service, or operate trucks, we may be adversely affected. Should additional states adopt CARB regulations, PTG and PTS could experience increased compliance costs, additional operating restrictions, or changes in demand for their products and services, which could have a material adverse effect on our business, financial condition and results of operations. New regulations could be adopted that require moving to zero emission formats and/or the implementation of more stringent emissions controls. For example, original equipment manufacturers may be required to install additional engine components, additional aerodynamic features or low-rolling resistance tires to comply with fuel economy regulations, which may result in higher costs associated with more complex components and a shorter useful tread life for tires, increasing operating costs for customers, suppliers, and our businesses. Foreign, federal, state, provincial and local lawmakers also are considering a variety of other climate change proposals, including prohibiting the use of certain substances with high "global warming potential."
On January 20, 2025, President Trump signed Executive Order "Unleashing American Energy", which may have direct implications on the policies and regulations that impact the automotive and transportation industries. The Executive Order seeks to rescind waivers granted by the EPA for California's zero emission vehicle regulations with a focus on eliminating any "electric vehicle mandates" and terminating "state emission waivers that function to limit sales of gasoline-powered vehicles" and modify and/or eliminate certain GHG standards for trucks. As a result, the status of the emission regulations discussed above and the impact of the new presidential administration on these or other U.S. federal policies in this area remains uncertain.
Other Regulatory Issues. We are subject to a wide variety of regulatory activities and oversight, including:
Governmental regulations, claims, and legal proceedings. Governmental regulations affect almost every aspect of our business, including the fair treatment of our employees, wage and hour issues, and our financing activities with customers. In California, previous judicial decisions have called into question whether long-standing methods for compensating dealership employees comply with the local wage and hour rules and may do so again. We could be susceptible to claims or related actions if we fail to operate our business in accordance with applicable laws or it is
determined that long-standing compensation methods did not comply with local laws. Many laws and regulations applicable to our business were adopted prior to the introduction of online vehicle sales, the Internet and certain digital technology, generally. As a result, we are tasked with maintaining compliance in an uncertain regulatory environment. Claims arising out of actual or alleged violations of law which may be asserted against us or any of our dealers by individuals, through class actions, or by governmental entities in civil or criminal investigations and proceedings, may expose us to substantial monetary damages which may adversely affect us.
Our financing activities with customers are subject to truth-in-lending, consumer leasing, equal credit opportunity, and similar regulations as well as motor vehicle finance laws, installment finance laws, insurance laws, usury laws, and other installment sales laws. In the U.K., the Financial Conduct Authority (the "FCA") regulates financial services firms and financial markets, including our activities in acting as broker for the financing of vehicle sales. The FCA is investigating the historic use of discretionary commission arrangements ("DCAs") amid concerns that this practice may have been unfair to customers. The purpose of the investigation is to consider whether the historic use of DCAs caused customers to pay too much for their car loans and, if so, to consider potential remediation measures. The investigation is being undertaken after the Financial Ombudsman Service (a public body, which resolves financial complaints) determined that DCAs, in two separate cases which do not involve us, had caused financial losses to customers. We await the outcome of the FCA’s investigation which is expected in May of 2025. Any regulatory or judicial outcome that ultimately results in the refund of historical commissions paid to us or that reduces the commissions paid to us could materially and adversely affect us.
On October 25, 2024, the U.K. Court of Appeal (the second highest court in the U.K.) issued a judgment in the case Johnson v Firstrand Bank Ltd, Wrench v Firstrand Bank Ltd and Hopcraft v Close Brothers Ltd, which required those lenders to repay those customers the commissions paid to the dealers for their vehicle finance agreements, determining that, in those cases, there was a duty to the customers to disclose the amount of the commissions paid to those dealers. We believe this judgment is contrary to existing guidance issued by the FCA, and the U.K. Supreme Court (the highest court in the U.K.) has granted the lenders permission to appeal the Judgment, with an expedited judgment by the Supreme Court expected in the first half of 2025. Our U.K. consumer lending partners now require us to disclose to customers the commissions we receive from financing the purchase of their vehicle.
While the focus of the FCA’s potential redress to customers, and the Judgment above, has been on the lenders and not dealers, we may experience changes to our processes and/or claims for repayment of historical commissions we have received from customers, which amounts could materially and adversely affect us.
Privacy Regulation. We are subject to numerous laws and regulations in the U.S. and internationally designed to protect the information of clients, customers, employees, and other third parties that we collect and maintain, including the European Union General Data Protection Regulation (the "EUGDPR") and the United Kingdom General Data Protection Regulation (the "UKGDPR"). Both the EUGDPR and UKGDPR, among other things, mandate requirements regarding the handling of personal data of employees and customers, including its use, protection, and the ability of persons whose data is stored to correct or delete such data about themselves. The state of California has similar laws which includes a private right of action for certain violations of law. Multiple other U.S. states have also enacted comprehensive consumer privacy laws, and additional states may follow. These laws pose increasingly complex and rigorous compliance challenges, which may increase our compliance costs and related risk. If we fail to comply with these laws or other similar regulations applicable to our business, we could be subject to reputational harm and significant litigation, monetary damages, regulatory enforcement actions, or fines in one or more jurisdictions. For example, a failure to comply with the UKGDPR could result in fines up to the greater of £17.5 million or 4% of annual global revenues.
Recalls. Legislative and regulatory bodies from time to time have considered laws or regulations that would prohibit companies from renting or selling any vehicle that is subject to a recall until the recall service is performed. Whether any such prohibition may be enacted, and its ultimate scope, cannot be determined at this time. If a law or regulation is enacted that prevents the sale of vehicles until recall service has been performed, we could be required to reserve a significant portion of our vehicles from being available for sale for even a minor recall unrelated to vehicle safety. In addition, various manufacturers have issued stop sale notices in relation to certain recalls that require that we retain vehicles until the recall can be performed, whether or not parts are then available. While servicing recall vehicles yields parts and service revenue to us, the inability to sell a significant portion of our vehicles could increase our costs and have an adverse effect on our results of operations if a large number of our vehicles are the subject of simultaneous recalls or if needed replacement parts are not in adequate supply.
Tariff and trade risk. Changes or increases in tariffs, trade restrictions, the negotiation of new trade agreements, non-tariff trade barriers, local content requirements, uncertainty surrounding global trade policies, and the imposition of new or retaliatory tariffs against certain countries or covering certain products, including vehicles and parts may affect our competitive position and impair our ability to sell foreign vehicles and parts profitably. On February 1, 2025, President Trump issued executive orders imposing a 25% tariff on certain product imports from Mexico and Canada, and a 10% tariff on product imports from China, although certain of these tariffs have been temporarily stayed. Further, on February 10, 2025, President Trump implemented a 25% tariff on imported steel and aluminum, proposed to be effective beginning on March 12, 2025, and has suggested the implementation of a 25% tariff on imported automobiles. If maintained, these and other newly announced tariffs and the potential escalation of trade disputes are expected to broadly affect the automotive industry, including manufacturers of vehicles, parts and supplies. The extent of the tariffs and the resulting impact on general economic conditions and on our business are uncertain and depend on various factors, such as negotiations between the U.S. and affected countries, the duration of such tariffs, the responses of other countries or regions to such tariffs, the actual increases in the costs of imported vehicles, products and raw materials, and exemptions or exclusions that may be granted. Should tariffs increase and be sustained, our inventory acquisition and carrying costs, and the production costs for many of our manufacturer and supplier partners, may be increased, which costs may be passed on to us and consumers through higher prices for many new vehicles and certain parts we sell. These increased prices may adversely affect our new vehicle sales and related finance and insurance sales and may adversely impact demand for such vehicles and parts, potentially impacting our ability to sell them profitably. Moreover, new rules in place after the Brexit accord between the European Union and the U.K. require varying levels of content in vehicles to originate in either the U.K. or the European Union to remain tariff free. If automotive manufacturers cannot meet these content rules, there may be import tariffs on any affected vehicles, which could adversely affect our U.K. results.
Franchise laws in the U.S. In the U.S., state law generally provides protections to franchised vehicle dealers from discriminatory practices by manufacturers and from unreasonable termination or non-renewal of their franchise agreements. In many states, the laws require that new vehicle sales be conducted exclusively by automotive retailers (not manufacturers). Should U.S. franchise laws be repealed or amended to allow our existing manufacturer partners to effectively operate outside the franchised system, our results of operations may be materially and adversely impacted. See the risk factor captioned “Sales outside the franchise system” above.
Changes in law. New laws and regulations at the state and federal level may be enacted which could materially adversely impact our business. For example, in December 2023, the U.S. Federal Trade Commission announced its new Combating Auto Retail Scams Rule, which would change the way vehicles are advertised and sold in the U.S. The rule originally was to take effect in July 2024. However, as a result of legal challenges, the rule was vacated in January 2025. Similar rules or state laws, all of which could be imposed on our business, could complicate the transaction process and increase compliance costs and risk, among other effects, which could have a significant and adverse effect on us.
Climate change and environmental regulations. Scientific evidence suggests that the globe is warming potentially resulting in an environment more prone to natural disasters, such as flooding or wild fires. To date, we have seen increases in our cost to insure against such risks, which costs could continue to increase should this trend continue. We are subject to a wide range of environmental laws and regulations, including those governing discharges into the air and water; the operation and removal of storage tanks; and the use, storage, and disposal of hazardous substances. In the normal course of our operations we use, generate, and dispose of materials covered by these laws and regulations. In the face of climate change, these laws could become more stringent. We face potentially significant costs relating to claims, penalties, and remediation efforts in the event of non-compliance with existing and future laws and regulations. Furthermore, should climate change continue, we expect further regulation of internal combustion engines and vehicle emissions which may affect the types of vehicles we sell and service. We cannot predict the future costs to our businesses for these developments.
Accounting and disclosure rules and regulations. Significant changes to generally accepted accounting principles in the U.S. ("GAAP") could significantly affect our reported financial position, earnings, and cash flows upon adoption and effectiveness. For example, a change to lease accounting could affect PTS customers' decisions to purchase or lease trucks, which could adversely affect their business if leasing becomes a less favorable option. See the disclosure provided under "Recent Accounting Pronouncements" in Part II, Item 8, Note 1 of the Notes to our Consolidated Financial Statements for additional detail on accounting standard updates that could have an impact on us. In addition, we are subject to various reporting regimes in the U.S. and internationally. In the U.K., we are subject to the Climate-related Financial Disclosure Regulations which require disclosure of climate risks and opportunities, among other matters. In Australia, we are subject to the mandatory climate-related financial disclosures under the Treasury Laws
Amendment (Financial Market Infrastructure and Other Measures) Act 2024. We are also subject to California’s Climate Corporate Data Accountability Act and Climate-Related Financial Risk Act which require disclosure of emissions and other matters. Further, we are subject to the European Sustainability Reporting Standards which also require emissions and other disclosures, as well as any regulations regarding climate and sustainability disclosures eventually adopted by the U.S. Securities and Exchange Commission. We are also subject to regulations and corporate financial reporting and auditing obligations in other jurisdictions that we operate in. These multiple sets of disclosures standards are not yet clearly defined and require duplicative and sometimes conflicting disclosures across our individual and consolidated business units, and the failure to comply with these standards may result in fines, penalties and reputational harm. Compliance with these standards will subject us to additional expenses and compliance risk which may adversely affect our business.
Related parties. Our two largest stockholders, Penske Corporation and its affiliates (“Penske Corporation”) and Mitsui & Co., Ltd. and its affiliates (“Mitsui”), together beneficially own approximately 71% of our outstanding common stock. The presence of such significant stockholders results in several risks, including:
Our principal stockholders have substantial influence. Penske Corporation and Mitsui have entered into a stockholders agreement pursuant to which they have agreed to vote together as to the election of our directors. As a result, Penske Corporation has the ability to control the composition of our Board of Directors, which may allow it to control our affairs and business. This concentration of ownership coupled with certain provisions contained in our agreements with manufacturers, our certificate of incorporation, and our bylaws could discourage, delay, or prevent a change in control of us.
Some of our directors and officers may have conflicts of interest with respect to certain related party transactions and other business interests. Roger Penske, our Chair and Chief Executive Officer and a director, holds the same offices at Penske Corporation. Robert Kurnick, Jr., our President and a director, is also the Vice Chair and a director of Penske Corporation and an Advisory Board member of PTS. Bud Denker, our Executive Vice President, Human Resources, is also the President of Penske Corporation. Each of these officers is paid much of their compensation by Penske Corporation. The compensation they receive from us is based on their efforts on our behalf; however, they are not required to spend any specific amount of time on our matters. The Vice Chair of our Board of Directors, Greg Penske, is the son of our Chair and also serves as a director of Penske Corporation. Michael Eisenson, one of our directors, is also a director of Penske Corporation and an Advisory Board member of PTS. Lisa Davis, one of our directors, is also an Advisory Board member of PTS. Kota Odagiri, one of our directors, is also an employee of Mitsui. Roger Penske also serves as Chairman of Penske Transportation Solutions, for which he is compensated by PTS.
Penske Corporation ownership levels. Certain of our agreements have clauses that are triggered in the event of a material change in the level of ownership of our common stock by Penske Corporation, such as our trademark agreement between us and Penske Corporation that governs our use of the “Penske” name which can be terminated 24 months after the date that Penske Corporation no longer owns at least 20% of our voting stock. We may not be able to renegotiate such agreements on terms that are acceptable to us, if at all, in the event of a significant change in Penske Corporation's ownership.
We have a significant number of shares of common stock eligible for future sale. Penske Corporation and Mitsui own approximately 71% of our common stock, and each has two demand registration rights that could result in a substantial number of shares being introduced for sale in the market. We also have a significant amount of authorized but unissued shares. Penske Corporation has pledged a substantial portion of its shares of our common stock as collateral to secure a loan facility. A default by Penske Corporation could result in the foreclosure on those shares by the lenders, after which the lenders could attempt to sell those shares on the open market or to a third party. The introduction of any of these shares into the market could have a material adverse effect on our stock price.
General Risks
We rely on third parties for the majority of our information systems and the availability and efficient operation of such systems is critical to the operation of our business.
Our information systems are fully integrated into our operations, and we rely on them to operate effectively, including with respect to electronic interfaces with manufacturers and other vendors, customer relationship management, sales and service efforts, data storage, and financial and operational reporting. The majority of our systems are provided by or licensed from third-party vendors and suppliers; the most significant of which are the dealer management systems (“DMS”) and customer relationship management ("CRM") systems used across our retail operations, which are provided by a limited number of suppliers. We also rely on third-party vendors to supply other key products and services to us and our
customers. One or more of these third-party vendors or suppliers may experience financial distress, technology challenges, cybersecurity incidents, ransomware demands, programming errors, staffing shortages or liquidity challenges, file for bankruptcy protection, go out of business, or suffer other disruptions in their business, each of which could affect the vendors’ ability to provide services to us and our customers. If any of our vendors or suppliers fail to deliver their products or services for any reason, our business and results of operations and financial condition could be adversely impacted, and such failures may lead to broader disruptions or failures across our information systems which may expose us to customer, employee, manufacturing partner, governmental, or third-party claims or other legal liabilities.
The failure of our information systems, the failure to protect the integrity of these systems, or the interruption of these systems as discussed herein or otherwise due to natural disasters, power loss, unexpected termination of our agreements, cyber-attacks, ransomware encryptions, or other reasons such as those which resulted from the CDK Cybersecurity Incident (described below), could significantly and adversely disrupt our business operations, impact our sales, service, inventory, customer relationship management, and accounting functions and otherwise adversely affect our results of operations. For example, on June 19, 2024, we became aware that CDK Global, LLC (“CDK”), a third-party provider of information systems, including DMS software to support retail automotive and commercial truck dealership operations, was experiencing a cybersecurity incident and its systems were rendered inoperable (the “CDK Cybersecurity Incident”). Although we do not utilize CDK's DMS in our U.S. or international automotive dealership operations, our Premier Truck Group business does utilize CDK’s dealer management system and was impacted by the CDK Cybersecurity Incident. In response to the CDK Cybersecurity Incident, we immediately took precautionary containment steps to protect our systems and commenced an investigation of the incident. PTG implemented its business continuity response plans and continued to operate without the DMS at all locations through manual or alternate processes developed to respond to such incidents. On July 2, 2024, PTG was able to reconnect all of its locations to CDK’s DMS servers and restore core functionality of the software platform.
Even where business continuity responses and contingency plans, such as those noted above, are implemented to minimize disruptions caused by information systems failures, such mitigation efforts may result in decreased operational efficiencies and limit dealership productivity. Further, despite our efforts to assess, identify, and manage material risks from cybersecurity threats to our business and operations, including through evaluating key partners and third parties with whom we share our information as well as certain customer and employee information, we may not be able to protect our various systems from disruptions.
Cybersecurity. In the ordinary course of our business, we receive confidential information about our customers, employees, associates, and vendors. We collect, process, retain, and in some cases share this information in the normal course of our business, and such information is collected and stored primarily in our core information systems, including our DMS and CRM platforms. Our internal and third-party systems, including our DMS and CRM systems, are under a heightened level of risk from state actors, cyber criminals or other individuals with malicious intent to gain unauthorized access to our systems and exploit the information, including the confidential information of our customers and employees, that we gather. Cyber-attacks, such as the CDK Cybersecurity Incident described above, and threats to information systems and network and data security are becoming increasingly diverse and sophisticated, with attacks increasing in frequency, scope, and potential harm. In addition, some of our software applications are utilized by third parties who, in turn, subcontract or otherwise outsource various processes and administrative functions to additional third parties. Such third parties may have access to confidential information that is critical to our business operations and services. While our information security program includes enhanced controls to monitor third party providers' security programs, these third parties are subject to their own risks of data breaches, cyber-attacks, and other events or actions that could damage, disrupt, or close down their networks or systems, which in turn may adversely impact our business operations. For an overview of certain of our efforts related to cybersecurity risk management, strategy, and governance and our written Information Security Program, see Item 1C. Cybersecurity.
Despite the security measures we have in place or may implement in the future, we may be unable to fully detect, mitigate, or protect against cyber-attacks, ransomware attacks, computer viruses, security breaches, social engineering, malicious software, lost or misplaced data, programming errors, human errors, burglary, acts of vandalism, misdirected wire transfers or other events impacting us or our third-party service providers. Any security breach or event, whether by us directly or our third-party service providers, may result in an authorized party obtaining trade secrets, personally identifiable information or confidential information and may result in loss of revenue, increase the costs of doing business, harm our competitiveness, reputation or customer, vendor or manufacturer relationships, and have other negative operational impacts. In addition, such security breaches or events resulting in the loss or exposure of this information could result in liabilities and other significant financial exposures, including those derived from investigations, regulatory fines, penalties for violations of applicable laws and regulations, costs related to the remediation of ransomware events, litigation including consumer class actions, the imposition of penalties, or other means, any of which could have a material
adverse effect on our business, results of operations or financial condition. In addition, our failure to respond quickly and appropriately to such a security breach, or our failure to adequately test and verify the remediation of security incidents involving third parties prior to reintegration into our information systems, could exacerbate the consequences of the breach.
Property loss, business interruption, or other liabilities. Our business is subject to substantial risk of loss due to the significant concentration of property values, including vehicle and parts inventories at our operating locations; claims by employees, customers, and third parties for personal injury or property damage; and fines and penalties in connection with alleged violations of regulatory requirements. While we have insurance for many of these risks, we retain risk relating to certain of these perils, including through self-insurance, and certain perils are not covered by our insurance. Certain insurers have limited available property coverage in response to the natural catastrophes experienced in recent years. If we experience significant losses that are not covered by our insurance, whether due to adverse weather conditions or otherwise, or we are required to retain a significant portion of a loss, it could have a significant and adverse effect on us.
Item 1B. Unresolved Staff Comments
Not applicable.
Item 1C. Cybersecurity
Risk Management Processes. We recognize the importance of assessing, identifying, and managing material risks from cybersecurity threats to our business and operations and developing, implementing, and maintaining robust cybersecurity measures to safeguard our information systems. As a result, we have integrated the management of cybersecurity threats into our broader risk management efforts, implementing policies and procedures to promote cybersecurity risk management and enhance mitigation efforts against cyber-attacks and similar threats. To help secure our systems that store or transmit electronic information, we have implemented multi-layered preventive controls which use aggregated intelligence to proactively detect, block and evaluate attacks. We also maintain a Chief Information Officer who is charged with implementing and overseeing our comprehensive written Information Security Program. In connection with our Information Security Program, we perform cybersecurity risk assessments at least annually to analyze the materiality of identified risks, the likelihood of such risks materializing, and the scope and intensity of adverse impacts if such risks result in the compromise of our information systems or sensitive information stored by us or on our behalf.
Our Information Security Program includes proactive measures to manage cybersecurity risks and threats, including mandatory annual security awareness training for all personnel with enhanced training for designated information security personnel; enterprise-wide phishing simulations and security assessments; a business continuity and recovery plan in the event of a cybersecurity incident; and the implementation of targeted access controls and various other measures, including multi-factor authentication, with respect to certain systems containing sensitive information. We have also implemented an incident response plan to guide our response to cybersecurity incidents, with a dedicated, cross-functional response team, including senior management from our information technology, information security, operations, finance, risk management, investor relations and legal teams, responsible for overseeing efforts related to detection, containment, threat mitigation and notification, as appropriate. We identify vulnerabilities in our information systems through proactive scanning of system assets for known vulnerabilities. Our outsourced managed security source operates 24/7, identifying threats and vulnerabilities, and our information security team regularly monitors alerts and meets to discuss trends in cybersecurity threats. We proactively manage vulnerabilities from major software publishers through a global patching program. To prevent unauthorized access to our information systems, we have a system of controls in place to manage user access to our information systems. Our employees acknowledge an acceptable use policy and are trained in how to identify information security risks in the workplace.
Third Party Engagement and Oversight. We engage third-party service providers, including consultants and auditors, to monitor and protect critical assets from cyber-attacks and to enhance certain components of our Information Security Program, including to assist us with annual security assessments, penetration and vulnerability testing, email and web filtering, endpoint protection, and consultation on certain cybersecurity enhancements. These partnerships enable us to leverage specialized knowledge and insights, ensuring our cybersecurity strategies and processes remain current. To oversee and identify cybersecurity threats associated with our use of third-party service providers, we periodically audit and review certain information security practices of critical vendors in possession of sensitive information, including through seeking responses to cybersecurity questionnaires. In the ordinary course of business, we also rely on contractual obligations from certain third-party service providers to meet certain information security standards and to notify and cooperate with us in the event of qualifying cybersecurity incidents.
Board of Directors Oversight. Our business is managed under the direction of our Board of Directors ("the Board"), which guides our long-term strategy and represents the highest level of oversight at the Company. Our Board views the
identification and effective management of cybersecurity threats as a critical component of overall risk management and oversight responsibilities. To that end, the Board assures that we maintain robust corporate governance policies designed to promote our culture of uncompromised integrity that have been implemented in a manner that facilitates active oversight and engagement regarding various cybersecurity matters. Consistent with these policies, the Board receives updates regarding cybersecurity threats and events in connection with its regularly scheduled meetings, as appropriate, and as part of its ongoing strategy and risk management sessions, engages in discussions regarding cybersecurity threats to our operations. In addition to this direct oversight, the Board has delegated oversight responsibilities with respect to cybersecurity risks to the Audit Committee of the Board. In addition to its oversight of the quality and integrity of the Company’s financial statements and internal audit functions, the Audit Committee is also responsible for reviewing the Company’s key risk areas, including cybersecurity risks, and regularly receives updates regarding cybersecurity threats and incidents involving the Company or our vendors and suppliers.
Management's Role in Managing Risk. As noted above, we have a designated Chief Information Officer who is charged with implementing and overseeing our comprehensive written Information Security Program. With over 25 years of experience in the field of information technology and cybersecurity, our Chief Information Officer brings a wealth of expertise to his role and maintains both Certified Information Systems Security Professional (CISSP) and Certified Information Systems Auditor (CISA) certifications and additional personnel on our information security team have cybersecurity experience and certifications. Our Chief Information Officer’s background includes extensive experience as an enterprise chief information officer and is well-recognized within our industry. Our Chief Information Officer reviews with senior management, at least quarterly, the status of our Information Security Program, identified threats to our data security, and cyber incidents relevant to our operations and reviews these matters with our Board and/or Audit Committee at least annually, or more frequently when appropriate. Further, at least quarterly, our senior leadership team, including our Chief Financial Officer, General Counsel, Chief Information Officer, Executive Vice President of Financial Services, and Global Risk Management, prepares a comprehensive summary of certain key risks facing the Company (the “Risk Report”). The Risk Report includes feedback from multiple constituencies within the Company, incorporating and evaluating heightened risk areas identified by senior management, functional area teams within the organization, and management at the regional and local dealership levels. In addition to various enterprise-wide risks identified throughout this management-led process, the Risk Report highlights cybersecurity risks, tasking the Chief Information Officer or his designees with the responsibility to monitor such risks and, as appropriate, implement risk mitigation strategies. The Risk Report also clarifies that both the Board and the Audit Committee retain oversight of such risks. The Risk Report is shared and discussed at least quarterly with the Audit Committee and periodically with the full Board, with certain specified risks and mitigation efforts reported to the Board or designated standing committees on a more frequent basis, as appropriate.
We and others across our industry face a number of cybersecurity risks in connection with our business and operations. Although such risks have not materially affected our business strategy, results of operations, or financial condition to date, we have, from time to time, experienced threats to, and incidents in connection with, our information systems. Any security breach or event resulting in the unauthorized disclosure of our information or the information of our customers or the degradation of services provided by our critical business systems, whether by us directly or our third-party service providers, could adversely affect our business operations, sales, reputation with current and potential customers, associates, or vendors as well as other operational and financial impacts derived from investigations, litigation, the imposition of penalties, or other means. For more information about the information technology and cybersecurity risks we face, see the risk factors entitled "We rely on third parties for the majority of our information systems and the availability and efficient operation of such systems is critical to the operation of our business," "Cybersecurity," and "Regulatory Issues – Privacy Regulation" in discussed in Item 1A. Risk Factors.
Item 2. Properties
We own our headquarters building in Bloomfield Hills, Michigan and many of our operating or management facilities. We also lease or sublease many of our other properties and other facilities. These leases are generally for a period of between 5 and 20 years and are typically structured to include renewal options at our election. We believe that our facilities are sufficient for our needs and are in good repair.
Item 3. Legal Proceedings
From time to time, we are a party to litigation and other legal proceedings, including class action claims and purported class action claims, in the ordinary course of business. Such claims may be brought by governmental authorities, customers, vendors, stockholders, or employees. We are not a party to any legal proceedings, including class action lawsuits, that individually or in the aggregate are reasonably expected to have a material effect on us. However, the results
of these matters cannot be predicted with certainty, and an unfavorable resolution of one or more of these matters could have a material adverse effect.
Item 4. Mine Safety Disclosures
Not applicable.
PART II
Item 5. Market for Registrant's Common Equity, Related Stockholder Matters, and Issuer Purchases of Equity Securities
Our common stock is traded on the New York Stock Exchange under the symbol “PAG.” As of February 11, 2025, there were 224 holders of record of our common stock.
Dividends
We have announced a cash dividend of $1.22 per share payable on March 6, 2025, to stockholders of record as of February 24, 2025. While future quarterly or other cash dividends will depend upon a variety of factors considered relevant by our Board of Directors, which may include our expectations regarding the severity and duration of vehicle production issues, the rate of inflation, including its impact on vehicle affordability, earnings, cash flow, capital requirements, restrictions relating to any then-existing indebtedness, financial condition, alternative uses of capital, and other factors, we currently expect to continue to pay comparable dividends in the future.
Securities Repurchases
The table below sets forth information with respect to shares of common stock repurchased by the Company during the three months ended December 31, 2024.
| | | | | | | | | | | | | | | | | | | | | | | | | | |
| Period | | Total Number of Shares Purchased (1) | | Average Price Paid per Share | | Total Number of Shares Purchased as Part of Publicly Announced Plans or Programs (2) | | Approximate Dollar Value of Shares that May Yet be Purchased Under the Plans or Program (in millions) (2) |
| October 1 to October 31, 2024 | | — | | | $ | — | | | — | | | $ | 157.4 | |
| November 1 to November 30, 2024 | | 3,475 | | | $ | 149.97 | | | 3,475 | | | $ | 156.8 | |
| December 1 to December 31, 2024 | | 2,697 | | | $ | 156.80 | | | — | | | $ | 156.8 | |
| | 6,172 | | | | | 3,475 | | | |
| _____________________________ |
| (1) During December, 2,697 shares were acquired from employees in connection with a net share settlement feature of employee equity awards. |
|
(2) From time to time, our Board of Directors authorizes the repurchase of Company securities up to a certain monetary limit. As of December 31, 2024, $156.8 million remained outstanding and available for repurchases under our securities repurchase program approved by our Board of Directors. This authority has no expiration. For further information with respect to repurchases of our shares by us, see Item 7. Management's Discussion and Analysis of Financial Condition and Results of Operations — Liquidity and Capital Resources — "Securities Repurchases" and Part II, Item 8, Note 14 of the Notes to our Consolidated Financial Statements. |
SHARE INVESTMENT PERFORMANCE
The following graph compares the cumulative total stockholder returns on our common stock based on an investment of $100 on December 31, 2019, and the close of the market on December 31 of each year thereafter against (i) the Standard & Poor's 500 Index and (ii) an industry/peer group consisting of Asbury Automotive Group, Inc., AutoNation, Inc., Group 1 Automotive, Inc., Lithia Motors, Inc., and Sonic Automotive, Inc (the "Peer Group"). The graph assumes the reinvestment of all dividends.
COMPARISON OF 5 YEAR CUMULATIVE TOTAL RETURN*
Among Penske Automotive Group, Inc., the S&P 500 Index, and a Peer Group
________________________
* $100 invested on 12/31/19 in stock or index, including reinvestment of dividends. Fiscal year ending December 31.
| | | | | | | | | | | | | | | | | | | | | | | | | | | | | | | | | | | |
| Cumulative Total Return |
| 12/19 | | 12/20 | | 12/21 | | 12/22 | | 12/23 | | 12/24 |
| Penske Automotive Group, Inc. | 100.00 | | | 120.06 | | | 221.35 | | | 241.76 | | | 344.02 | | | 335.24 | |
| S&P 500 | 100.00 | | | 118.40 | | | 152.39 | | | 124.79 | | | 157.59 | | | 197.02 | |
| Peer Group | 100.00 | | | 152.87 | | | 200.63 | | | 174.37 | | | 253.43 | | | 292.01 | |
Item 6. Reserved
Reserved.
Item 7. Management's Discussion and Analysis of Financial Condition and Results of Operations
This Management's Discussion and Analysis of Financial Condition and Results of Operations contains forward-looking statements that involve risks and uncertainties. Our actual results may differ materially from those discussed in the forward-looking statements as a result of various factors, including those discussed in "Item 1A. Risk Factors" and "Forward-Looking Statements." We have acquired and initiated a number of businesses during the periods presented and addressed in this Management's Discussion and Analysis of Financial Condition and Results of Operations. Our financial statements include the results of operations of those businesses from the date acquired or when they commenced operations. Our period-to-period results of operations may vary depending on the dates of acquisitions or disposals.
Overview
We are a diversified international transportation services company and one of the world's premier automotive and commercial truck retailers. We operate dealerships in the United States, the United Kingdom, Canada, Germany, Italy, Japan, and Australia, and we are one of the largest retailers of commercial trucks in North America for Freightliner. We also distribute and retail commercial vehicles, diesel and gas engines, power systems, and related parts and services principally in Australia and New Zealand. We employ over 28,900 people worldwide. Additionally, we own 28.9% of Penske Transportation Solutions, a business that employs over 44,500 people worldwide, manages one of the largest, most comprehensive and modern trucking fleets in North America with over 435,000 trucks, tractors, and trailers under lease, rental, and/or maintenance contracts, and provides innovative transportation, supply chain, and technology solutions to its customers.
Business Overview
In 2024, our business generated $30.5 billion in total revenue, which is comprised of approximately $26.2 billion from retail automotive dealerships, $3.5 billion from retail commercial truck dealerships, and $777.9 million from commercial vehicle distribution and other operations. We generated $5.0 billion in gross profit, which is comprised of $4.3 billion from retail automotive dealerships, $584.5 million from retail commercial truck dealerships, and $178.2 million from commercial vehicle distribution and other operations.
Retail Automotive. We are one of the largest global automotive retailers as measured by the $26.2 billion in total retail automotive dealership revenue we generated in 2024. We are diversified geographically with 56% of our total retail automotive dealership revenues in 2024 generated in the U.S. and Puerto Rico and 44% generated outside of the U.S. We offer over 40 vehicle brands with 72% of our retail automotive franchised dealership revenue in 2024 generated from premium brands, such as Audi, BMW, Land Rover, Mercedes-Benz, and Porsche. As of December 31, 2024, we operated 353 retail automotive franchised dealerships, of which 148 are located in the U.S. and 205 are located outside of the U.S., principally in the U.K. As of December 31, 2024, we also operated 16 used vehicle dealerships, with six dealerships in the U.S. operating under the brand name CarShop, nine dealerships in the U.K. operating under the brand name Sytner Select, and one dealership in Australia operating under the brand name Penske Select. We retailed and wholesaled, including agency units, more than 594,000 vehicles in 2024.
In addition to selling new and used vehicles, we generate higher-margin revenue at each of our dealerships through maintenance and repair services, the sale and placement of third-party finance and insurance products, third-party extended service and maintenance contracts, replacement and aftermarket automotive products, and at certain of our locations, collision repair services. We operate our franchised dealerships under franchise agreements with a number of automotive manufacturers and distributors that are subject to certain rights and restrictions typical of the industry. Some of our dealerships in the U.K. and Europe operate under an agency model where we receive a fee for facilitating the sale by the manufacturer of a new vehicle but do not hold the vehicle in inventory. Vehicles sold under this agency model are counted as new agency units sold instead of new retail units sold by us, and only the fee we receive from the manufacturer, not the price of the vehicle, is reported as new revenue with no corresponding cost of sale.
During 2024, we acquired 16 retail automotive franchises and opened one retail automotive franchise in the U.K., acquired two franchises and one Chrysler/Jeep/Dodge/Ram dealership in the U.S., acquired two retail automotive franchises in Italy, acquired three retail automotive franchises and one used vehicle dealership in Australia, and opened one retail automotive franchise in Germany.
During 2024, in the U.S., we closed one Jaguar franchise, one Chrysler/Jeep/Dodge/Ram dealership, one used vehicle dealership, and sold one Lexus franchise. In the U.K., we closed two Jaguar franchises, two Land Rover franchises, two Audi franchises, one Mercedes-Benz franchise, one used vehicle dealership, and sold two used vehicle dealerships. During 2024, we also transitioned our U.K. CarShop locations to Sytner Select dealerships, incorporating them within the broader Sytner network. In December 2024, we sold the remaining 50% interest in our joint venture in Frankfurt, Germany. During 2024, in aggregate we acquired dealerships representing approximately $2.1 billion in expected annualized revenue and disposed of dealerships representing approximately $650 million of expected annualized revenue. Retail automotive dealerships represented 85.9% of our total revenues and 84.8% of our total gross profit in 2024.
Retail Commercial Truck Dealership. We operate Premier Truck Group ("PTG"), a heavy- and medium-duty truck dealership group offering primarily Freightliner and Western Star trucks (both Daimler brands), with locations across 10 U.S. states and the Canadian provinces of Ontario and Manitoba. During 2024, we acquired three full-service dealerships and two independent repair facilities in the U.S. As of December 31, 2024, PTG operated 45 locations selling new and/or used trucks, performing service and parts operations, or offering collision repair services. We retailed and wholesaled
20,947 new and used trucks in 2024. This business represented 11.6% of our total revenues and 11.7% of our total gross profit in 2024.
On June 19, 2024, we became aware that CDK Global, LLC (“CDK”), a third-party provider of information systems, including dealer management software systems (“DMS”) to support retail automotive and commercial truck dealership operations, was experiencing a cybersecurity incident and its systems were rendered inoperable (the “CDK Cybersecurity Incident”). Although we do not utilize CDK's DMS in our U.S. or international automotive dealership operations, our Premier Truck Group business does utilize CDK’s dealer management system and was impacted by the CDK Cybersecurity Incident. On June 19th, we immediately took precautionary containment steps to protect our systems and commenced an investigation of the incident. PTG implemented its business continuity response plans and continued to operate without the DMS at all locations through manual or alternate processes developed to respond to such incidents. On July 2, PTG was able to reconnect all of its locations to CDK’s DMS servers and restore core functionality of the software platform. However, key industry partners, such as Daimler Truck North America, did not immediately reconnect to the CDK systems at that time. Full connectivity and functionality of the CDK systems were completed in the third quarter.
Penske Australia. Penske Australia is the exclusive importer and distributor of Western Star heavy-duty trucks (a Daimler brand), MAN heavy- and medium-duty trucks and buses (a VW Group brand), and Dennis Eagle refuse collection vehicles, together with associated parts, across Australia, New Zealand, and portions of the Pacific. In most of these same markets, we are also a leading distributor of diesel and gas engines and power systems, principally representing MTU (a Rolls-Royce solution), Detroit Diesel, Allison Transmission, and Bergen Engines. Penske Australia offers products across the on- and off-highway markets, including in the trucking, mining, power generation, energy solutions, defense, marine, rail, and construction sectors and supports full parts and aftersales service through a network of branches, field service locations, and dealers across the region. These businesses represented 2.5% of our total revenues and 3.5% of our total gross profit in 2024.
Penske Transportation Solutions. We hold a 28.9% ownership interest in Penske Truck Leasing Co., L.P. ("PTL"). PTL is owned 41.1% by Penske Corporation, 28.9% by us, and 30.0% by Mitsui & Co., Ltd. ("Mitsui"). We account for our investment in PTL under the equity method, and we therefore record our share of PTL's earnings on our statements of income under the caption "Equity in earnings of affiliates," which also includes the results of our other equity method investments. Penske Transportation Solutions ("PTS") is the universal brand name for PTL's various business lines through which it is capable of meeting customers' needs across the supply chain with a broad product offering that includes full-service truck leasing, truck rental, and contract maintenance along with logistics services, such as dedicated contract carriage, distribution center management, freight management, and dry van truckload carrier services. We recorded $198.0 million and $289.5 million in equity earnings from this investment in 2024 and 2023, respectively.
Outlook
Please see “Outlook” in Part I, Item 1 for a discussion of our outlook in our markets.
Operating Overview
Automotive and commercial truck dealerships represent 97.5% of our revenue and 80.4% of our earnings before taxes during 2024. Income from our PTS investment represents 16.0% of our earnings before taxes during 2024. New and used vehicle revenues typically include sales to retail customers, agency customers, fleet customers, and leasing companies providing consumer leasing. We generate finance and insurance revenues from sales of third-party extended service contracts, sales of third-party insurance policies, commissions relating to the sale of finance and lease contracts to third parties, and the sales of certain other products. Service and parts revenues include fees paid by customers for repair, maintenance and collision services, and the sale of replacement parts and other aftermarket accessories as well as warranty repairs that are reimbursed directly by vehicle manufacturers.
Our gross profit tends to vary with the mix of revenues we derive from the sale of new vehicles, used vehicles, finance and insurance products, and service and parts transactions. Our gross profit varies across product lines with vehicle sales usually resulting in lower gross profit margins and our other revenues resulting in higher gross profit margins. Factors such as inventory and vehicle availability, customer demand, consumer confidence, unemployment, general economic conditions, seasonality, weather, credit availability, fuel prices, and manufacturers' advertising and incentives also impact the mix of our revenues and therefore, influence our gross profit margin. The results of our commercial vehicle distribution and other business in Australia and New Zealand are principally driven by the number and types of products and vehicles ordered by our customers. Aggregate revenue and gross profit increased $927.8 million, or 3.1%, and $79.5 million, or 1.6%, respectively, during 2024 compared to 2023.
As exchange rates fluctuate, our revenue and results of operations as reported in U.S. Dollars fluctuate. For example, if the British Pound were to weaken against the U.S. Dollar, our U.K. results of operations would translate into less U.S. Dollar reported results. Foreign currency average rate fluctuations increased revenue and gross profit by $223.2 million and $31.1 million, respectively, in 2024. Foreign currency average rate fluctuations increased earnings per share by approximately $0.06 per share in 2024. Excluding the impact of foreign currency average rate fluctuations, aggregate revenue and gross profit increased 2.4% and 1.0%, respectively, in 2024.
Our selling expenses consist of advertising and compensation for sales personnel, including commissions and related bonuses. General and administrative expenses include compensation, finance, legal and management personnel costs, rent, insurance, utilities, and other expenses. As the majority of our selling expenses are variable and a significant portion of our general and administrative expenses are subject to our control, we believe our expenses can be adjusted over time to reflect economic trends.
Equity in earnings of affiliates principally represents our share of the earnings from PTS, along with our investments in other joint ventures and other non-consolidated investments.
Floor plan interest expense relates to financing incurred in connection with the acquisition of new and used vehicle inventories that are secured by those vehicles. Other interest expense consists of interest charges on all of our interest-bearing debt, other than interest relating to floor plan financing. The cost of our variable rate indebtedness is based on the prevailing benchmark interest rates in our various markets.
The future success of our business is dependent upon, among other things, macro-economic, geo-political, and industry conditions and events, including their impact on sales of new and used vehicles, service and parts, and repair and maintenance services, the availability of consumer credit, changes in consumer demand, consumer confidence levels, fuel prices, demand for trucks to move freight with respect to PTS and PTG and other freight metrics such as spot rates or miles driven, personal discretionary spending levels, interest rates, foreign currency exchange rates, unemployment rates; our ability to obtain vehicles and parts from our manufacturers, especially in light of supply chain disruptions due to natural disasters, any shortages of vehicle components, international conflicts, challenges in sourcing labor or labor strikes or work stoppages, or other disruptions; the control our manufacturer partners can exert over our operations and our reliance on them for various aspects of our business; risks to our reputation and those of our manufacturer partners; changes in the retail model either from direct sales by manufacturers, a transition to an agency model of sales, sales by online competitors or from the expansion of EVs; disruptions to the security and availability of our information technology systems and those of our third party providers, which systems are increasingly threatened by ransomware and other cyber-attacks; the effects of a pandemic on the global economy, including our ability to react effectively to changing business conditions in light of any pandemic; the rate of inflation, including its impact on vehicle affordability; changes in interest rates and foreign currency exchange rates; our ability to consummate, integrate, and realize returns on acquisitions; with respect to PTS, changes in the financial health of its customers, labor strikes, or work stoppages by its employees, a reduction in PTS' asset utilization rates, continued availability from truck manufacturers and suppliers of vehicles and parts for its fleet, including with respect to the effect of various government mandates concerning the electrification of its vehicle fleet, changes in values of used trucks which affects PTS' profitability on truck sales and regulatory risks and related compliance costs; our ability to realize returns on our significant capital investments in new and upgraded dealership facilities; our ability to navigate a rapidly changing automotive and truck landscape; our ability to respond to new or enhanced regulations in both our domestic and international markets relating to dealerships and vehicles sales, including those related to the sales process, emissions standards or electrification, as well as changes in consumer sentiment relating to commercial truck sales that may hinder our or PTS' ability to maintain, acquire, sell, or operate trucks; the success of our distribution of commercial vehicles, engines, and power systems; natural disasters; recall initiatives or other disruptions that interrupt the supply of vehicles or parts to us; the outcome of legal and administrative matters, and other factors over which management has limited control. See Part I, Item 1A. Risk Factors above and "Forward-Looking Statements" below.
Critical Accounting Policies and Estimates
The preparation of financial statements in accordance with accounting principles generally accepted in the United States of America requires the application of accounting policies that often involve making estimates and employing judgments. Such judgments influence the assets, liabilities, revenues, and expenses recognized in our financial statements. Management, on an ongoing basis, reviews these estimates and assumptions. Management may determine that modifications in assumptions and estimates are required, which may result in a material change in our results of operations or financial position.
The following are the accounting policies applied in the preparation of our financial statements that management believes are most dependent upon the use of estimates and assumptions.
Revenue Recognition
Dealership Vehicle, Parts, and Service Sales. We record revenue for vehicle sales at a point in time when vehicles are delivered, which is when the transfer of title, risks and rewards of ownership, and control are considered passed to the customer. For dealerships operating under a franchise model, the amount of consideration we receive for vehicle sales is stated within the executed contract with our customer and is reduced by any non-cash consideration representing the fair value of trade-in vehicles, if applicable. We record revenue for vehicle service and collision work over time as work is completed and when parts are delivered to our customers. Sales promotions that we offer to customers are accounted for as a reduction of revenues at the time of sale. Rebates and other incentives offered directly to us by manufacturers are recognized as a reduction in the cost of sales. Reimbursements of qualified advertising expenses are treated as a reduction of selling, general, and administrative expenses. The amounts received under certain manufacturer rebate and incentive programs are based on the attainment of program objectives, and such earnings are recognized either upon the sale of the vehicle for which the award was received or upon attainment of the particular program goals if not associated with individual vehicles. Taxes collected from customers and remitted to governmental authorities are recorded on a net basis (excluded from revenue). During 2024, 2023, and 2022, we earned $714.6 million, $611.8 million, and $571.1 million, respectively, of rebates, incentives, and reimbursements from manufacturers, of which $695.1 million, $593.8 million, and $554.6 million, respectively, was recorded as a reduction of cost of sales. The remaining $19.5 million, $18.0 million, and $16.5 million was recorded as a reduction of selling, general, and administrative expenses during 2024, 2023, and 2022, respectively.
Dealership Finance and Insurance Sales. Subsequent to the sale of a vehicle to a customer, we sell installment sale contracts to various financial institutions on a non-recourse basis (with specified exceptions). We receive a commission from the lender equal to either the difference between the interest rate charged to the customer and the interest rate set by the financing institution or a flat fee. We also receive commissions for facilitating the sale of various products to customers, including vehicle protection products, vehicle theft protection, and extended service contracts. These commissions are recorded as revenue at a point in time when the customer enters into the contract. Payment is typically due and collected within 30 days subsequent to the execution of the contract with the customer. In the case of finance contracts, a customer may prepay or fail to pay their contract, thereby terminating the contract. Customers may also terminate extended service contracts and other insurance products, which are fully paid at purchase, and become eligible for refunds of unused premiums. In these circumstances, a portion of the commissions we received may be charged back based on the terms of the contracts. The revenue we record relating to these transactions is net of an estimate of the amount of chargebacks we will be required to pay. Our estimate is based upon our historical experience with similar contracts, including the impact of refinance and default rates on retail finance contracts and cancellation rates on extended service contracts and other insurance products. Aggregate reserves relating to chargeback activity were $48.2 million and $42.7 million as of December 31, 2024, and December 31, 2023, respectively.
Commercial Vehicle Distribution and Other. We record revenue from the distribution of vehicles, engines, and other products at a point in time when delivered, which is when the transfer of title, risks and rewards of ownership, and control are considered passed to the customer. We record revenue for service or repair work as work is completed and when parts are delivered to our customers. For our long-term power generation contracts, we record revenue as services are provided in accordance with contract milestones.
Refer to the disclosures provided in Part II, Item 8, Note 2 of the Notes to our Consolidated Financial Statements for additional detail on revenue recognition.
Impairment Testing
Except for goodwill discussed below, indefinite-lived intangible assets are assessed for impairment annually on October 1 and upon the occurrence of an indicator of impairment through a comparison of its fair value to its carrying value. These indefinite-lived intangible assets relate to franchise agreements with manufacturers and distributors, which represent the estimated value of franchises acquired in business combinations, and distribution agreements with commercial vehicle manufacturers and other manufacturers, which represent the estimated value for distribution rights acquired in business combinations. An indicator of impairment exists if the carrying value exceeds its estimated fair value, and an impairment loss may be recognized up to that excess. The fair value is determined using an income approach, which includes assumptions about revenue growth, terminal growth rates, and earnings before interest, taxes, depreciation, and amortization (“EBITDA”) margins, and the selection of the weighted average cost of capital. Changes in these assumptions
could have a significant effect on the fair value of these intangible assets and the amount of any impairment charge. Each of the significant assumptions to the fair value model are considered level 3 inputs within the fair value hierarchy. We also evaluate in connection with the annual impairment testing whether events and circumstances continue to support our assessment that the other indefinite-lived intangible assets continue to have an indefinite life.
Goodwill impairment is assessed at the reporting unit level annually on October 1 and upon the occurrence of an indicator of impairment. Our operations are organized by management into operating segments by line of business and geography. We have determined that we have four reportable segments as defined in generally accepted accounting principles for segment reporting: (i) Retail Automotive, consisting of our retail automotive dealership operations; (ii) Retail Commercial Truck, consisting of our retail commercial truck dealership operations in the U.S. and Canada; (iii) Other, consisting of our commercial vehicle and power systems distribution operations; and (iv) Non-Automotive Investments, consisting of our equity method investments in non-automotive operations which includes our investment in PTS and other various investments. We have determined that the dealerships in each of our operating segments within the Retail Automotive reportable segment are components that were aggregated into two reporting units for the purpose of goodwill impairment testing as of October 1, 2024, as they (A) have similar economic characteristics (all are automotive dealerships having similar margins), (B) offer similar products and services (all sell new and/or used vehicles, service, parts, and third-party finance and insurance products), (C) have similar target markets and customers (generally individuals), and (D) have similar distribution and marketing practices (all distribute products and services through dealership facilities that market to customers in similar fashions). The reporting units are United States Retail Automotive and International Retail Automotive. Our Retail Commercial Truck reportable segment has been determined to represent one operating segment and reporting unit. The goodwill included in our Other reportable segment relates primarily to our commercial vehicle distribution operating segment. There is no goodwill recorded in our Non-Automotive Investments reportable segment.
For reporting units within our Retail Automotive, Retail Commercial Truck, and Other reportable segments, we prepared a quantitative assessment of the carrying value of goodwill. We estimated the fair value of our reporting units using an income approach. The income approach measures fair value by discounting expected future cash flows at a weighted average cost of capital. We also validate the fair value for each reporting unit using the income approach by calculating a cash earnings multiple and determining whether the multiple was reasonable compared to recent market transactions completed by the Company or in the industry. As part of that assessment, we also reconcile the estimated aggregate fair values of our reporting units to our market capitalization. We believe this reconciliation process is consistent with a market participant perspective. This consideration would also include a control premium that represents the estimated amount an investor would pay for our equity securities to obtain a controlling interest and other significant assumptions, including revenue growth, terminal growth rates, EBITDA margin, and the weighted average cost of capital.
Based on our assessment as of October 1, 2024, and in conjunction with our fourth quarter annual forecasting process for 2025 which impacts key assumptions used in our goodwill impairment assessment, we concluded that for each of our reporting units that the fair values were more likely than not greater than their carrying values. As a result, we had no goodwill impairment charges in 2024. Based on our assessment as of October 1, 2023, we recorded a non-cash goodwill impairment charge in 2023 of $40.7 million related to our former Used Vehicle Dealerships International reporting unit to reduce the carrying value to fair value.
For our other indefinite-lived intangible assets, we prepared a quantitative assessment as of October 1, 2024, by comparing the fair value to its carrying value. We estimated the fair value using an income approach, applying similar methodology as discussed above. As a result of this assessment, and in conjunction with the closure of certain franchised dealerships in the U.K. during 2024, we had $1.8 million of impairment charges relating to our other indefinite-lived intangible assets. We had no impairment charges relating to our other indefinite-lived intangible assets during 2023.
Investments
We account for each of our investments under the equity method, pursuant to which we record our proportionate share of the investee's income each period. The net book value of our investments was $1,827.0 million and $1,774.9 million as of December 31, 2024, and 2023, respectively, including $1,803.9 million and $1,725.1 million relating to PTS as of December 31, 2024, and 2023, respectively. We currently hold a 28.9% ownership interest in PTS.
Income Taxes
Tax regulations may require items to be included in our tax return at different times than when those items are reflected in our financial statements. Some of the differences are permanent, such as expenses that are not deductible on our tax return, and some are temporary differences, such as the timing of depreciation expense. Temporary differences create deferred tax assets and liabilities. Deferred tax assets generally represent items that will be used as a tax deduction or
credit in our tax return in future years which we have already recorded in our financial statements. Deferred tax liabilities generally represent deductions taken on our tax return that have not yet been recognized as an expense in our financial statements. We establish valuation allowances for our deferred tax assets if the amount of expected future taxable income is not more likely than not to allow for the use of the deduction or credit.
Refer to the disclosures provided in Part II, Item 8, Note 16 of the Notes to our Consolidated Financial Statements for additional detail on our accounting for income taxes.
Leases
We determine if an arrangement is a lease at inception. Our operating leases primarily consist of land and facilities, including certain dealerships and office space. We also have equipment leases that primarily relate to office and computer equipment, service and shop equipment, company vehicles, and other miscellaneous items. We do not have any material leases, individually or in the aggregate, classified as a finance leasing arrangement.
Operating leases are included in “operating lease right-of-use assets,” “accrued expenses and other current liabilities,” and “long-term operating lease liabilities” on our Consolidated Balance Sheet. Operating lease right-of-use assets and liabilities are recognized at commencement date based on the present value of lease payments over the lease term. Our property leases are generally for an initial period between 5 and 20 years and are typically structured to include renewal options at our election. We include renewal options that we are reasonably certain to exercise in the measurement of our lease liabilities and right-of-use assets. As the rate implicit in the lease is generally not readily determinable for our operating leases, the discount rates used to determine the present value of our lease liability are based on our incremental borrowing rate at the lease commencement date and commensurate with the remaining lease term. Our incremental borrowing rate for a lease is the rate of interest we would have to pay to borrow on a collateralized basis over a similar term for an amount equal to the lease payments in a similar economic environment. Lease expense is recognized on a straight-line basis over the lease term.
Refer to the disclosures provided in Part II, Item 8, Note 3 and Note 11 of the Notes to our Consolidated Financial Statements for a description of our operating leases.
Recent Accounting Pronouncements
Please see the disclosures provided under “Recent Accounting Pronouncements” in Part II, Item 8, Note 1 of the Notes to our Consolidated Financial Statements set forth below which are incorporated by reference herein.
Tax Developments
Global Minimum Tax
The Organization for Economic Co-operation and Development (“OECD”), an international association of thirty-eight countries including the United States, has proposed reform of international taxation known as Pillar Two, which imposes a global minimum corporate income tax rate of 15% on multinational companies. In December 2022, the European Union (“EU”) Member States formally adopted a directive that implements the OECD Pillar Two framework, which is expected to be enacted into the national laws of the EU member states. Certain countries in which we operate have enacted legislation to adopt the Pillar Two framework effective for the Company for the calendar year 2024. Several other countries are also considering changes to their local tax laws to implement this framework in the future. We expect the enacted Pillar Two legislation to increase tax compliance obligations; however, we do not anticipate any monetary impact from any Pillar Two legislation as all of the jurisdictions in which we operate are expected to have an effective tax rate greater than the minimum threshold of 15%. We will continue to monitor new guidance in this area including proposed and enacted legislative changes as further information becomes available.
Results of Operations
The following tables present comparative financial data relating to our operating performance in the aggregate and on a "same-store" basis. Dealership results are included in same-store comparisons when we have consolidated the acquired entity during the entirety of both periods being compared. As an example, if a dealership were acquired on January 15, 2022, the results of the acquired entity would be included in annual same-store comparisons beginning with the year ended December 31, 2024, and in quarterly same-store comparisons beginning with the quarter ended June 30, 2023.
Some of our dealerships in the U.K. and Europe operate under an agency model where we receive a fee for facilitating the sale by the manufacturer of a new vehicle but do not hold the vehicle in inventory. Vehicles sold under this agency model are counted as new agency units sold instead of new retail units sold by us, and only the fee we receive from the manufacturer, not the price of the vehicle, is reported as new revenue with no corresponding cost of sale. We have presented below units sold under this agency model as "Agency units". Moreover, our retail automotive revenue per unit retailed and related gross profit per unit retailed for new vehicles excludes agency unit sales and associated revenue.
As discussed above, the results for 2023 include a goodwill impairment charge of $40.7 million (before and after tax), or $0.60 per share, relating to our former Used Vehicle Dealerships International reporting unit.
For the discussion and analysis comparing the results of operations for 2022 to 2023, we refer you to Part II, Item 7. Management's Discussion and Analysis of Financial Condition and Results of Operations in the 2023 Form 10-K filed on February 16, 2024.
Retail Automotive Dealership New Vehicle Data
(In millions, except unit and per unit amounts)
| | | | | | | | | | | | | | | | | | | | | | | | | | | | | | | | | | | | | | | | | | | | | | | | | | |
| | | | | | 2024 vs. 2023 | | | | | | 2023 vs. 2022 |
| New Vehicle Data | | 2024 | | 2023 | | Change | | % Change | | 2023 | | 2022 | | Change | | % Change |
| New retail unit sales (excluding agency) | | 204,442 | | 197,070 | | 7,372 | | | 3.7 | % | | 197,070 | | 185,831 | | 11,239 | | | 6.0 | % |
| Same-store new retail unit sales (excluding agency) | | 191,816 | | 193,937 | | (2,121) | | | (1.1) | % | | 191,039 | | 179,703 | | 11,336 | | | 6.3 | % |
| New agency unit sales | | 40,548 | | 32,672 | | 7,876 | | | 24.1 | % | | 32,672 | | — | | 32,672 | | | nm |
| Same-store new agency unit sales | | 34,740 | | 29,645 | | 5,095 | | | 17.2 | % | | 27,563 | | — | | 27,563 | | | nm |
| New sales revenue | | $ | 12,055.9 | | $ | 11,273.3 | | $ | 782.6 | | | 6.9 | % | | $ | 11,273.3 | | $ | 10,050.5 | | $ | 1,222.8 | | | 12.2 | % |
| Same-store new sales revenue | | $ | 11,284.6 | | $ | 11,099.7 | | $ | 184.9 | | | 1.7 | % | | $ | 10,946.9 | | $ | 9,765.9 | | $ | 1,181.0 | | | 12.1 | % |
| New retail sales revenue per unit (excluding agency) | | $ | 58,503 | | $ | 56,857 | | $ | 1,646 | | | 2.9 | % | | $ | 56,857 | | $ | 54,084 | | $ | 2,773 | | | 5.1 | % |
| Same-store new retail sales revenue per unit (excluding agency) | | $ | 58,397 | | $ | 56,903 | | $ | 1,494 | | | 2.6 | % | | $ | 57,013 | | $ | 54,345 | | $ | 2,668 | | | 4.9 | % |
| Gross profit — new | | $ | 1,148.4 | | $ | 1,238.5 | | $ | (90.1) | | | (7.3) | % | | $ | 1,238.5 | | $ | 1,246.1 | | $ | (7.6) | | | (0.6) | % |
| Same-store gross profit — new | | $ | 1,066.1 | | $ | 1,217.8 | | $ | (151.7) | | | (12.5) | % | | $ | 1,200.1 | | $ | 1,219.4 | | $ | (19.3) | | | (1.6) | % |
| Average gross profit per new vehicle (excluding agency) | | $ | 5,187 | | $ | 5,967 | | $ | (780) | | | (13.1) | % | | $ | 5,967 | | $ | 6,705 | | $ | (738) | | | (11.0) | % |
| Same-store average gross profit per new vehicle (excluding agency) | | $ | 5,164 | | $ | 5,979 | | $ | (815) | | | (13.6) | % | | $ | 6,024 | | $ | 6,786 | | $ | (762) | | | (11.2) | % |
| Gross margin % — new | | 9.5 | % | | 11.0 | % | | (1.5) | % | | (13.6) | % | | 11.0 | % | | 12.4 | % | | (1.4) | % | | (11.3) | % |
| Same-store gross margin % — new | | 9.4 | % | | 11.0 | % | | (1.6) | % | | (14.5) | % | | 11.0 | % | | 12.5 | % | | (1.5) | % | | (12.0) | % |
| nm – not meaningful |
Units
Retail unit deliveries of new vehicles increased from 2023 to 2024 due to a 12,274 unit increase from net dealership acquisitions, coupled with a 2,974 unit, or 1.3%, increase in same-store new retail unit deliveries. Same-store retail units delivered increased 3.0% in the U.S. and decreased 1.0% internationally. Overall, new retail unit deliveries increased 5.3% in the U.S. and increased 8.4% internationally. We believe the increase in same-store retail unit sales in the U.S. is primarily due to continued consumer demand for new vehicles and increasing new vehicle availability, coupled with the pent-up demand resulting from lower vehicle availability in prior years. We believe the decrease in same-store unit sales internationally is primarily due to a decline in sales of certain premium brand sales in the U.K. driven in part by a decline in retail and private registrations in lieu of fleet sales.
Revenues
New vehicle sales revenue increased from 2023 to 2024 due to a $597.7 million increase from net dealership acquisitions, coupled with a $184.9 million, or 1.7%, increase in same-store revenues. Excluding $75.3 million of favorable foreign currency fluctuations, same-store new revenue increased 1.0%. Same-store revenue (excluding agency) increased due to a $1,494 per unit increase in same-store comparative average retail selling price (including a $383 per retail unit increase attributable to favorable foreign currency fluctuations), which increased revenue by $286.6 million, partially offset by the decrease in same-store new retail unit sales (excluding agency), which decreased revenue by $120.7 million. We believe the increase in same-store comparative average retail selling price (excluding agency) is primarily due to changes in the mix of higher-priced units sold and the increased costs of acquiring vehicles from the manufacturer.
Gross Profit
Retail gross profit from new vehicle sales decreased from 2023 to 2024 due to a $151.7 million, or 12.5%, decrease in same-store gross profit, partially offset by a $61.6 million increase from net dealership acquisitions. Excluding $7.2 million of favorable foreign currency fluctuations, same-store gross profit decreased 13.1%. Same-store gross profit (excluding agency) decreased due to an $815 per unit decrease in same-store comparative average gross profit (despite a $28 per retail unit increase attributable to favorable foreign currency fluctuations), which decreased gross profit by $156.3 million, coupled with the decrease in same-store new retail sales (excluding agency), which decreased retail gross profit by $12.7 million. We believe the decrease in same-store comparative average retail gross profit per unit (excluding agency) is primarily due to an improved supply of many of the new vehicles we sell and the mix of sales. We believe the resulting compression on gross margin is due to higher gross profit realized in the prior year as vehicle supply was constrained, coupled with affordability challenges and a more competitive environment due to higher supply of vehicles as our days' supply increased to 49 from 39 as of December 31, 2024, and 2023, respectively.
Retail Automotive Dealership Used Vehicle Data
(In millions, except unit and per unit amounts)
| | | | | | | | | | | | | | | | | | | | | | | | | | | | | | | | | | | | | | | | | | | | | | | | | | |
| | | | | | 2024 vs. 2023 | | | | | | 2023 vs. 2022 |
| Used Vehicle Data | | 2024 | | 2023 | | Change | | % Change | | 2023 | | 2022 | | Change | | % Change |
| Used retail unit sales | | 246,608 | | 256,721 | | (10,113) | | | (3.9) | % | | 256,721 | | 261,739 | | (5,018) | | | (1.9) | % |
| Same-store used retail unit sales | | 224,759 | | 236,152 | | (11,393) | | | (4.8) | % | | 245,107 | | 252,458 | | (7,351) | | | (2.9) | % |
| Used retail sales revenue | | $ | 8,770.7 | | $ | 8,919.5 | | $ | (148.8) | | | (1.7) | % | | $ | 8,919.5 | | $ | 9,011.6 | | $ | (92.1) | | | (1.0) | % |
| Same-store used retail sales revenue | | $ | 8,039.3 | | $ | 8,428.7 | | $ | (389.4) | | | (4.6) | % | | $ | 8,529.1 | | $ | 8,742.2 | | $ | (213.1) | | | (2.4) | % |
| Used retail sales revenue per unit | | $ | 35,565 | | $ | 34,744 | | $ | 821 | | | 2.4 | % | | $ | 34,744 | | $ | 34,430 | | $ | 314 | | | 0.9 | % |
| Same-store used retail sales revenue per unit | | $ | 35,769 | | $ | 35,692 | | $ | 77 | | | 0.2 | % | | $ | 34,797 | | $ | 34,628 | | $ | 169 | | | 0.5 | % |
| Gross profit — used | | $ | 455.1 | | $ | 432.4 | | $ | 22.7 | | | 5.2 | % | | $ | 432.4 | | $ | 543.1 | | $ | (110.7) | | | (20.4) | % |
| Same-store gross profit — used | | $ | 418.7 | | $ | 417.7 | | $ | 1.0 | | | 0.2 | % | | $ | 417.5 | | $ | 531.8 | | $ | (114.3) | | | (21.5) | % |
| Average gross profit per used vehicle retailed | | $ | 1,845 | | $ | 1,685 | | $ | 160 | | | 9.5 | % | | $ | 1,685 | | $ | 2,075 | | $ | (390) | | | (18.8) | % |
| Same-store average gross profit per used vehicle retailed | | $ | 1,863 | | $ | 1,769 | | $ | 94 | | | 5.3 | % | | $ | 1,703 | | $ | 2,106 | | $ | (403) | | | (19.1) | % |
| Gross margin % — used | | 5.2 | % | | 4.8 | % | | 0.4 | % | | 8.3 | % | | 4.8 | % | | 6.0 | % | | (1.2) | % | | (20.0) | % |
| Same-store gross margin % — used | | 5.2 | % | | 5.0 | % | | 0.2 | % | | 4.0 | % | | 4.9 | % | | 6.1 | % | | (1.2) | % | | (19.7) | % |
Units
Retail unit sales of used vehicles decreased from 2023 to 2024 due to an 11,393 unit, or 4.8%, decrease in same-store used retail unit sales, partially offset by a 1,280 unit increase from net dealership acquisitions. Excluding the decrease of 11,758 units across the U.K. Sytner Select dealerships, same-store used retail unit sales of used vehicles increased by 365
units. Our same-store units increased 1.2% in the U.S. and decreased 10.1% internationally. Overall, our used units increased 2.0% in the U.S. and decreased 8.5% internationally. Same-store unit sales are being impacted by the transition of our U.K. CarShop locations to Sytner Select dealerships which sell fewer units as well as a lower supply of 1-4 year old used vehicles due to the fewer number of new vehicles sold in recent years and lower lease returns particularly in the U.S. Excluding the U.K. Sytner Select dealerships from both periods, used vehicles retailed increased 7.4% internationally and same-store used units decreased 1.2% internationally, and including the U.K. Sytner Select dealerships, used vehicles retailed increased 4.4% and same-store used units increased 0.2%.
Revenues
Used vehicle retail sales revenue decreased from 2023 to 2024 due to a $389.4 million, or 4.6%, decrease in same-store revenues, partially offset by a $240.6 million increase from net dealership acquisitions. Excluding $105.5 million of favorable foreign currency fluctuations, same-store used retail revenue decreased 5.9%. The decrease in same-store revenue is due to the decrease in same-store used retail unit sales, which decreased revenue by $406.7 million, partially offset by a $77 per unit increase in same-store comparative average selling price (including a $469 per unit increase attributable to favorable foreign currency fluctuations), which increased revenue by $17.3 million. We believe the decrease in same-store comparative average selling price, excluding favorable foreign currency, is primarily due to the decrease in used vehicle acquisition costs when compared to the same period last year.
Gross Profit
Retail gross profit from used vehicle sales increased from 2023 to 2024 due to a $21.7 million increase from net dealership acquisitions, coupled with a $1.0 million, or 0.2%, increase in same-store gross profit. Excluding $4.8 million of favorable foreign currency fluctuations, same-store gross profit decreased 0.9%. The increase in same-store gross profit is due to a $94 per unit increase in same-store comparative average gross profit (including a $21 per unit increase attributable to favorable foreign currency fluctuations), which increased gross profit by $21.1 million, partially offset by the decrease in same-store used retail unit sales, which decreased gross profit by $20.1 million. We believe the increase in same-store comparative average gross profit per unit is primarily due to the stabilization of the used car market compared to the same period last year, coupled with the transition of our U.K. CarShop locations to Sytner Select dealerships which has improved our sourcing of more profitable vehicles.
Retail Automotive Dealership Finance and Insurance Data
(In millions, except unit and per unit amounts)
| | | | | | | | | | | | | | | | | | | | | | | | | | | | | | | | | | | | | | | | | | | | | | | | | | |
| | | | | | 2024 vs. 2023 | | | | | | 2023 vs. 2022 |
| Finance and Insurance Data | | 2024 | | 2023 | | Change | | % Change | | 2023 | | 2022 | | Change | | % Change |
| Total retail unit sales | | 451,050 | | | 453,791 | | | (2,741) | | | (0.6) | % | | 453,791 | | | 447,570 | | | 6,221 | | | 1.4 | % |
| Total same-store retail unit sales | | 416,575 | | | 430,089 | | | (13,514) | | | (3.1) | % | | 436,146 | | | 432,161 | | | 3,985 | | | 0.9 | % |
| Total agency unit sales | | 40,548 | | | 32,672 | | | 7,876 | | | 24.1 | % | | 32,672 | | | — | | | 32,672 | | | nm |
| Total same-store agency unit sales | | 34,740 | | | 29,645 | | | 5,095 | | | 17.2 | % | | 27,563 | | | — | | | 27,563 | | | nm |
| Finance and insurance revenue | | $ | 811.1 | | | $ | 838.6 | | | $ | (27.5) | | | (3.3) | % | | $ | 838.6 | | | $ | 848.1 | | | $ | (9.5) | | | (1.1) | % |
| Same-store finance and insurance revenue | | $ | 772.8 | | | $ | 808.2 | | | $ | (35.4) | | | (4.4) | % | | $ | 812.0 | | | $ | 828.7 | | | $ | (16.7) | | | (2.0) | % |
| Finance and insurance revenue per unit (excluding agency) | | $ | 1,767 | | | $ | 1,825 | | | $ | (58) | | | (3.2) | % | | $ | 1,825 | | | $ | 1,895 | | | $ | (70) | | | (3.7) | % |
| Same-store finance and insurance revenue per unit (excluding agency) | | $ | 1,845 | | | $ | 1,878 | | | $ | (33) | | | (1.8) | % | | $ | 1,861 | | | $ | 1,918 | | | $ | (57) | | | (3.0) | % |
| nm – not meaningful |
Finance and insurance revenue decreased from 2023 to 2024 due to a $35.4 million, or 4.4%, decrease in same-store revenue, partially offset by a $7.9 million increase from net dealership acquisitions. Excluding $6.9 million of favorable foreign currency fluctuations, same-store finance and insurance revenue decreased 5.2%. Same-store revenue (excluding agency) decreased due to the decrease in combined same-store new and used retail unit sales, which decreased revenue by
$25.4 million, coupled with a $33 per unit decrease in same-store comparative average finance and insurance retail revenue (despite a $16 per retail unit increase attributable to favorable foreign currency fluctuations), which decreased revenue by $13.7 million. Same-store finance and insurance revenue per unit (excluding agency) decreased 0.4% in the U.S. and decreased 6.6% in the U.K. We believe the decrease in same-store finance and insurance revenue per unit (excluding agency) is primarily due to high interest rates impacting overall customer affordability, coupled with an increase in lease penetration in the U.S. and the increase in fleet transactions in the U.K. which limits our finance and insurance product sale opportunities.
Retail Automotive Dealership Service and Parts Data
(In millions)
| | | | | | | | | | | | | | | | | | | | | | | | | | | | | | | | | | | | | | | | | | | | | | | | | | |
| | | | | | 2024 vs. 2023 | | | | | | 2023 vs. 2022 |
| Service and Parts Data | | 2024 | | 2023 | | Change | | % Change | | 2023 | | 2022 | | Change | | % Change |
| Service and parts revenue | | $ | 3,047.4 | | | $ | 2,734.3 | | | $ | 313.1 | | | 11.5 | % | | $ | 2,734.3 | | | $ | 2,426.7 | | | $ | 307.6 | | | 12.7 | % |
| Same-store service and parts revenue | | $ | 2,856.8 | | | $ | 2,691.0 | | | $ | 165.8 | | | 6.2 | % | | $ | 2,571.1 | | | $ | 2,350.9 | | | $ | 220.2 | | | 9.4 | % |
| Gross profit — service and parts | | $ | 1,771.4 | | | $ | 1,605.7 | | | $ | 165.7 | | | 10.3 | % | | $ | 1,605.7 | | | $ | 1,439.4 | | | $ | 166.3 | | | 11.6 | % |
| Same-store service and parts gross profit | | $ | 1,674.4 | | | $ | 1,577.6 | | | $ | 96.8 | | | 6.1 | % | | $ | 1,522.5 | | | $ | 1,398.7 | | | $ | 123.8 | | | 8.9 | % |
| Gross margin % — service and parts | | 58.1 | % | | 58.7 | % | | (0.6) | % | | (1.0) | % | | 58.7 | % | | 59.3 | % | | (0.6) | % | | (1.0) | % |
| Same-store service and parts gross margin % | | 58.6 | % | | 58.6 | % | | — | % | | — | % | | 59.2 | % | | 59.5 | % | | (0.3) | % | | (0.5) | % |
Revenues
Service and parts revenue increased from 2023 to 2024, with an increase of 7.5% in the U.S. and an increase of 18.4% internationally. The increase in service and parts revenue is due to a $165.8 million, or 6.2%, increase in same-store revenues, coupled with a $147.3 million increase from net dealership acquisitions. Excluding $19.3 million of favorable foreign currency fluctuations, same-store revenue increased 5.4%. The increase in same-store revenue is due to an $84.7 million, or 15.5%, increase in warranty revenue, a $72.7 million, or 3.7%, increase in customer pay revenue, and an $8.4 million, or 4.6%, increase in vehicle preparation and body shop revenue. We believe the increase in same-store revenue is primarily due to vehicles remaining on the road longer due to affordability considerations and increasing vehicle complexity, as well as increases in effective labor rates, repair orders, the retail cost of parts due to inflation, and additional warranty opportunities due to manufacturer recalls.
Gross Profit
Service and parts gross profit increased from 2023 to 2024 due to a $96.8 million, or 6.1%, increase in same-store gross profit, coupled with a $68.9 million increase from net dealership acquisitions. Excluding $11.6 million of favorable foreign currency fluctuations, same-store gross profit increased 5.4%. The increase in same-store gross profit is primarily due to the increase in same-store revenues, which increased gross profit by $97.2 million. The increase in same-store gross profit is due to a $45.5 million, or 15.3%, increase in warranty gross profit, a $37.7 million, or 4.0%, increase in customer pay gross profit, and a $13.6 million, or 3.9%, increase in vehicle preparation and body shop gross profit. However we believe the decrease in gross margin is primarily due to a shift in sales mix in the U.K. from customer pay to warranty, which typically has a lower gross margin.
Retail Commercial Truck Dealership Data
(In millions, except unit and per unit amounts)
As discussed above under “Overview - Retail Commercial Truck Dealership,” the CDK Cybersecurity Incident impacted PTG’s operations beginning June 19, 2024, and into the third quarter, primarily impacting service and parts sales, but also impacting to a lesser extent sales of used trucks.
| | | | | | | | | | | | | | | | | | | | | | | | | | | | | | | | | | | | | | | | | | | | | | | | | | |
| | | | | | 2024 vs. 2023 | | | | | | 2023 vs. 2022 |
| New Commercial Truck Data | | 2024 | | 2023 | | Change | | % Change | | 2023 | | 2022 | | Change | | % Change |
| New retail unit sales | | 16,923 | | 18,242 | | (1,319) | | | (7.2) | % | | 18,242 | | 17,932 | | 310 | | | 1.7 | % |
| Same-store new retail unit sales | | 15,856 | | 17,876 | | (2,020) | | | (11.3) | % | | 16,988 | | 17,220 | | (232) | | | (1.3) | % |
| New retail sales revenue | | $ | 2,359.5 | | $ | 2,480.2 | | $ | (120.7) | | | (4.9) | % | | $ | 2,480.2 | | $ | 2,308.7 | | $ | 171.5 | | | 7.4 | % |
| Same-store new retail sales revenue | | $ | 2,196.6 | | $ | 2,424.0 | | $ | (227.4) | | | (9.4) | % | | $ | 2,312.8 | | $ | 2,227.7 | | $ | 85.1 | | | 3.8 | % |
| New retail sales revenue per unit | | $ | 139,428 | | $ | 135,959 | | $ | 3,469 | | | 2.6 | % | | $ | 135,959 | | $ | 128,750 | | $ | 7,209 | | | 5.6 | % |
| Same-store new retail sales revenue per unit | | $ | 138,537 | | $ | 135,603 | | $ | 2,934 | | | 2.2 | % | | $ | 136,144 | | $ | 129,364 | | $ | 6,780 | | | 5.2 | % |
| Gross profit — new | | $ | 155.9 | | $ | 148.2 | | $ | 7.7 | | | 5.2 | % | | $ | 148.2 | | $ | 126.4 | | $ | 21.8 | | | 17.2 | % |
| Same-store gross profit — new | | $ | 142.5 | | $ | 142.9 | | $ | (0.4) | | | (0.3) | % | | $ | 133.8 | | $ | 120.9 | | $ | 12.9 | | | 10.7 | % |
| Average gross profit per new truck retailed | | $ | 9,214 | | $ | 8,126 | | $ | 1,088 | | | 13.4 | % | | $ | 8,126 | | $ | 7,048 | | $ | 1,078 | | | 15.3 | % |
| Same-store average gross profit per new truck retailed | | $ | 8,985 | | $ | 7,996 | | $ | 989 | | | 12.4 | % | | $ | 7,877 | | $ | 7,018 | | $ | 859 | | | 12.2 | % |
| Gross margin % — new | | 6.6 | % | | 6.0 | % | | 0.6 | % | | 10.0 | % | | 6.0 | % | | 5.5 | % | | 0.5 | % | | 9.1 | % |
| Same-store gross margin % — new | | 6.5 | % | | 5.9 | % | | 0.6 | % | | 10.2 | % | | 5.8 | % | | 5.4 | % | | 0.4 | % | | 7.4 | % |
Units
Retail unit sales of new trucks decreased from 2023 to 2024 due to a 2,020 unit, or 11.3%, decrease in same-store new retail unit sales, partially offset by a 701 unit increase from net dealership acquisitions. We believe the decrease in same-store unit sales is primarily due to the unusually high number of deliveries in 2023 resulting from production timing and delivery delays throughout 2022 caused by manufacturer supply chain challenges and the on-going freight recession in our markets, partially offset by replacement demand for medium- and heavy-duty trucks.
Revenues
New commercial truck retail sales revenue decreased from 2023 to 2024 due to a $227.4 million, or 9.4%, decrease in same-store revenues, partially offset by a $106.7 million increase from net dealership acquisitions. The decrease in same-store revenue is due to the decrease in same-store new retail unit sales, which decreased revenue by $273.9 million, partially offset by a $2,934 per unit increase in same-store comparative average selling price, which increased revenue by $46.5 million. We believe the increase in same-store comparative average selling price is primarily due to higher prices driven by replacement demand and the mix of higher-priced units sold due to an increase in units sold to smaller fleets and retail customers.
Gross Profit
New commercial truck retail gross profit increased from 2023 to 2024 due to an $8.1 million increase from net dealership acquisitions, partially offset by a $0.4 million, or 0.3%, decrease in same-store gross profit. The decrease in same-store gross profit is due to the decrease in same-store new retail unit sales, which decreased gross profit by $16.1 million, partially offset by a $989 per unit increase in same-store comparative average gross profit, which increased gross profit by $15.7 million. We believe the increase in same-store comparative average gross profit per unit is primarily due to a change in sales mix when compared to last year.
| | | | | | | | | | | | | | | | | | | | | | | | | | | | | | | | | | | | | | | | | | | | | | | | | | |
| | | | | | 2024 vs. 2023 | | | | | | 2023 vs. 2022 |
| Used Commercial Truck Data | | 2024 | | 2023 | | Change | | % Change | | 2023 | | 2022 | | Change | | % Change |
| Used retail unit sales | | 3,628 | | | 3,138 | | | 490 | | | 15.6 | % | | 3,138 | | | 2,669 | | | 469 | | | 17.6 | % |
| Same-store used retail unit sales | | 3,498 | | | 3,109 | | | 389 | | | 12.5 | % | | 3,046 | | | 2,630 | | | 416 | | | 15.8 | % |
| Used retail sales revenue | | $ | 227.0 | | | $ | 229.9 | | | $ | (2.9) | | | (1.3) | % | | $ | 229.9 | | | $ | 301.3 | | | $ | (71.4) | | | (23.7) | % |
| Same-store used retail sales revenue | | $ | 217.8 | | | $ | 228.3 | | | $ | (10.5) | | | (4.6) | % | | $ | 224.2 | | | $ | 298.3 | | | $ | (74.1) | | | (24.8) | % |
| Used retail sales revenue per unit | | $ | 62,580 | | | $ | 73,263 | | | $ | (10,683) | | | (14.6) | % | | $ | 73,263 | | | $ | 112,900 | | | $ | (39,637) | | | (35.1) | % |
| Same-store used retail sales revenue per unit | | $ | 62,277 | | | $ | 73,428 | | | $ | (11,151) | | | (15.2) | % | | $ | 73,593 | | | $ | 113,416 | | | $ | (39,823) | | | (35.1) | % |
| Gross profit — used | | $ | 16.7 | | | $ | 19.6 | | | $ | (2.9) | | | (14.8) | % | | $ | 19.6 | | | $ | 22.0 | | | $ | (2.4) | | | (10.9) | % |
| Same-store gross profit — used | | $ | 17.1 | | | $ | 19.7 | | | $ | (2.6) | | | (13.2) | % | | $ | 19.5 | | | $ | 21.6 | | | $ | (2.1) | | | (9.7) | % |
| Average gross profit per used truck retailed | | $ | 4,612 | | | $ | 6,251 | | | $ | (1,639) | | | (26.2) | % | | $ | 6,251 | | | $ | 8,247 | | | $ | (1,996) | | | (24.2) | % |
| Same-store average gross profit per used truck retailed | | $ | 4,885 | | | $ | 6,331 | | | $ | (1,446) | | | (22.8) | % | | $ | 6,395 | | | $ | 8,207 | | | $ | (1,812) | | | (22.1) | % |
| Gross margin % — used | | 7.4 | % | | 8.5 | % | | (1.1) | % | | (12.9) | % | | 8.5 | % | | 7.3 | % | | 1.2 | % | | 16.4 | % |
| Same-store gross margin % — used | | 7.9 | % | | 8.6 | % | | (0.7) | % | | (8.1) | % | | 8.7 | % | | 7.2 | % | | 1.5 | % | | 20.8 | % |
Units
Retail unit sales of used trucks increased from 2023 to 2024 due to a 389 unit, or 12.5%, increase in same-store retail unit sales, coupled with a 101 unit increase from net dealership acquisitions. We believe the increase in same-store unit sales is primarily due to the increase in availability and affordability of used trucks when compared with the prior year period, partially offset by the impact of the CDK cybersecurity incident.
Revenues
Used commercial truck retail sales revenue decreased from 2023 to 2024 due to a $10.5 million, or 4.6%, decrease in same-store revenues, partially offset by a $7.6 million increase from net dealership acquisitions. The decrease in same-store revenue is due to an $11,151 per unit decrease in same-store comparative average selling price, which decreased revenue by $34.7 million, partially offset by the increase in same-store used retail unit sales, which increased revenue by $24.2 million. We believe the decrease in same-store comparative average selling price is primarily due to the declining value of used trucks, as a result of prolonged lower freight spot rates and improved availability of new trucks when compared to the prior year period.
Gross Profit
Used commercial truck retail gross profit decreased from 2023 to 2024 primarily due to a $2.6 million, or 13.2%, decrease in same-store gross profit, coupled with a $0.3 million decrease from net dealership acquisitions. The decrease in same-store gross profit is due to a $1,446 per unit decrease in same-store comparative average gross profit, which decreased gross profit by $4.5 million, partially offset by the increase in same-store used retail unit sales, which increased gross profit by $1.9 million. We believe the decrease in same-store comparative average gross profit per unit is primarily due to the decreased value of used trucks over the prior year, as a result of prolonged lower freight spot rates when compared to the prior year period.
| | | | | | | | | | | | | | | | | | | | | | | | | | | | | | | | | | | | | | | | | | | | | | | | | | |
| | | | | | 2024 vs. 2023 | | | | | | 2023 vs. 2022 |
| Service and Parts Data | | 2024 | | 2023 | | Change | | % Change | | 2023 | | 2022 | | Change | | % Change |
| Service and parts revenue | | $ | 886.3 | | $ | 907.3 | | $ | (21.0) | | | (2.3) | % | | $ | 907.3 | | $ | 852.2 | | $ | 55.1 | | | 6.5 | % |
| Same-store service and parts revenue | | $ | 826.1 | | $ | 881.3 | | $ | (55.2) | | | (6.3) | % | | $ | 829.5 | | $ | 807.9 | | $ | 21.6 | | | 2.7 | % |
| Gross profit — service and parts | | $ | 380.3 | | $ | 383.6 | | $ | (3.3) | | | (0.9) | % | | $ | 383.6 | | $ | 360.5 | | $ | 23.1 | | | 6.4 | % |
| Same-store service and parts gross profit | | $ | 355.2 | | $ | 373.1 | | $ | (17.9) | | | (4.8) | % | | $ | 352.5 | | $ | 343.3 | | $ | 9.2 | | | 2.7 | % |
| Gross margin % — service and parts | | 42.9% | | 42.3% | | 0.6 | % | | 1.4 | % | | 42.3% | | 42.3% | | — | % | | — | % |
| Same-store service and parts gross margin % | | 43.0% | | 42.3% | | 0.7 | % | | 1.7 | % | | 42.5% | | 42.5% | | — | % | | — | % |
Revenues
Service and parts revenue decreased from 2023 to 2024 due to a $55.2 million, or 6.3%, decrease in same-store revenues, partially offset by a $34.2 million increase from net dealership acquisitions. Customer pay work represented approximately 78.0% of PTG's service and parts revenue, largely due to the significant amount of retail sales of parts and accessories. The decrease in same-store revenue is due to a $57.4 million, or 8.1%, decrease in customer pay revenue and a $4.1 million, or 13.4%, decrease in body shop revenue, partially offset by a $6.3 million, or 4.3%, increase in warranty revenue. We believe the decrease in same-store service and parts revenue is due to customers delaying maintenance costs due to prolonged lower freight spot rates, coupled with lower service and parts revenue in June and July resulting from the CDK Cybersecurity Incident discussed above.
Gross Profit
Service and parts gross profit decreased from 2023 to 2024 due to a $17.9 million, or 4.8%, decrease in same-store gross profit, partially offset by a $14.6 million increase from net dealership acquisitions. The decrease in same-store gross profit is due to the decrease in same-store revenues, which decreased gross profit by $23.7 million, partially offset by a 0.7% increase in same-store gross margin, which increased gross profit by $5.8 million. The decrease in same-store gross profit is due to a $20.8 million, or 7.9%, decrease in customer pay gross profit and a $1.8 million, or 5.8%, decrease in body shop gross profit, partially offset by a $4.7 million, or 5.9%, increase in warranty gross profit.
Commercial Vehicle Distribution and Other Data
(In millions, except unit amounts)
| | | | | | | | | | | | | | | | | | | | | | | | | | | | | | | | | | | | | | | | | | | | | | | | | | |
| | | | | | 2024 vs. 2023 | | | | | | 2023 vs. 2022 |
| Penske Australia Data | | 2024 | | 2023 | | Change | | % Change | | 2023 | | 2022 | | Change | | % Change |
| Commercial vehicle units (wholesale and retail) | | 1,421 | | 1,344 | | 77 | | | 5.7 | % | | 1,344 | | 1,229 | | 115 | | | 9.4 | % |
| Power systems units | | 1,251 | | 1,216 | | 35 | | | 2.9 | % | | 1,216 | | 1,430 | | (214) | | | (15.0) | % |
| Sales revenue | | $ | 777.9 | | $ | 634.0 | | $ | 143.9 | | | 22.7 | % | | $ | 634.0 | | $ | 578.8 | | $ | 55.2 | | | 9.5 | % |
| Gross profit | | $ | 178.2 | | $ | 165.2 | | $ | 13.0 | | | 7.9 | % | | $ | 165.2 | | $ | 157.3 | | $ | 7.9 | | | 5.0 | % |
Penske Australia primarily distributes and services commercial vehicles, engines, and power systems. This business generated $777.9 million of revenue during 2024 compared to $634.0 million of revenue during 2023, an increase of
22.7%. This business also generated $178.2 million of gross profit during 2024 compared to $165.2 million of gross profit during 2023, an increase of 7.9%.
Excluding $5.8 million of unfavorable foreign currency fluctuations, revenue increased 23.6% primarily due to an increase in service and parts sales revenue and an increase in higher value power generation units sold. Excluding $1.3 million of unfavorable foreign currency fluctuations, gross profit increased 8.5% primarily due to an increase in higher value power generation units sold and higher margin service and parts sales.
Selling, General, and Administrative Data
(In millions)
| | | | | | | | | | | | | | | | | | | | | | | | | | | | | | | | | | | | | | | | | | | | | | | | | | |
| | | | | | 2024 vs. 2023 | | | | | | 2023 vs. 2022 |
| Selling, General, and Administrative Data | | 2024 | | 2023 | | Change | | % Change | | 2023 | | 2022 | | Change | | % Change |
| Personnel expense | | $ | 2,112.1 | | | $ | 2,035.8 | | | $ | 76.3 | | | 3.7 | % | | $ | 2,035.8 | | | $ | 2,013.3 | | | $ | 22.5 | | | 1.1 | % |
| Advertising expense | | $ | 134.4 | | | $ | 135.9 | | | $ | (1.5) | | | (1.1) | % | | $ | 135.9 | | | $ | 122.0 | | | $ | 13.9 | | | 11.4 | % |
| Rent & related expense | | $ | 418.2 | | | $ | 389.3 | | | $ | 28.9 | | | 7.4 | % | | $ | 389.3 | | | $ | 370.7 | | | $ | 18.6 | | | 5.0 | % |
| Other expense | | $ | 873.8 | | | $ | 839.6 | | | $ | 34.2 | | | 4.1 | % | | $ | 839.6 | | | $ | 717.7 | | | $ | 121.9 | | | 17.0 | % |
| Total SG&A expenses | | $ | 3,538.5 | | | $ | 3,400.6 | | | $ | 137.9 | | | 4.1 | % | | $ | 3,400.6 | | | $ | 3,223.7 | | | $ | 176.9 | | | 5.5 | % |
| Same-store SG&A expenses | | $ | 3,305.2 | | | $ | 3,306.8 | | | $ | (1.6) | | | — | % | | $ | 3,231.2 | | | $ | 3,125.2 | | | $ | 106.0 | | | 3.4 | % |
| | | | | | | | | | | | | | | | |
| Personnel expense as % of gross profit | | 42.1 | % | | 41.3 | % | | 0.8 | % | | 1.9 | % | | 41.3 | % | | 41.6 | % | | (0.3) | % | | (0.7) | % |
| Advertising expense as % of gross profit | | 2.7 | % | | 2.8 | % | | (0.1) | % | | (3.6) | % | | 2.8 | % | | 2.5 | % | | 0.3 | % | | 12.0 | % |
| Rent & related expense as % of gross profit | | 8.3 | % | | 7.9 | % | | 0.4 | % | | 5.1 | % | | 7.9 | % | | 7.7 | % | | 0.2 | % | | 2.6 | % |
| Other expense as % of gross profit | | 17.5 | % | | 16.9 | % | | 0.6 | % | | 3.6 | % | | 16.9 | % | | 14.8 | % | | 2.1 | % | | 14.2 | % |
| Total SG&A expenses as % of gross profit | | 70.6 | % | | 68.9 | % | | 1.7 | % | | 2.5 | % | | 68.9 | % | | 66.6 | % | | 2.3 | % | | 3.5 | % |
| Same-store SG&A expenses as % of same-store gross profit | | 70.1 | % | | 68.6 | % | | 1.5 | % | | 2.2 | % | | 68.4 | % | | 66.3 | % | | 2.1 | % | | 3.2 | % |
Selling, general, and administrative expenses ("SG&A") increased from 2023 to 2024 due to a $139.5 million increase from net acquisitions, partially offset by a $1.6 million decrease in same-store SG&A. Excluding $21.6 million of unfavorable foreign currency fluctuations, same-store SG&A decreased 0.7%. We believe the increase in SG&A as a percentage of gross profit is primarily due to increases in personnel expenses, rent expenses, customer service vehicle loaner expenses, and information technology expenses, relative to gross profit, in part due to inflation.
SG&A expenses as a percentage of total revenue were 11.6%, 11.5%, and 11.6% in 2024, 2023, and 2022, respectively, and as a percentage of gross profit were 70.6%, 68.9%, and 66.6%, in 2024, 2023, and 2022, respectively.
Depreciation
(In millions)
| | | | | | | | | | | | | | | | | | | | | | | | | | | | | | | | | | | | | | | | | | | | | | | | | | |
| | | | | | 2024 vs. 2023 | | | | | | 2023 vs. 2022 |
| | 2024 | | 2023 | | Change | | % Change | | 2023 | | 2022 | | Change | | % Change |
| Depreciation | | $ | 158.0 | | | $ | 141.0 | | | $ | 17.0 | | | 12.1 | % | | $ | 141.0 | | | $ | 127.3 | | | $ | 13.7 | | | 10.8 | % |
Depreciation increased from 2023 to 2024 due to an $11.8 million, or 8.6%, increase in same-store depreciation due to capital expenditures, coupled with a $5.2 million increase from net dealership acquisitions.
Floor Plan Interest Expense
(In millions)
| | | | | | | | | | | | | | | | | | | | | | | | | | | | | | | | | | | | | | | | | | | | | | | | | | |
| | | | | | 2024 vs. 2023 | | | | | | 2023 vs. 2022 |
| | 2024 | | 2023 | | Change | | % Change | | 2023 | | 2022 | | Change | | % Change |
| Floor plan interest expense | | $ | 189.8 | | | $ | 133.1 | | | $ | 56.7 | | | 42.6 | % | | $ | 133.1 | | | $ | 52.4 | | | $ | 80.7 | | | 154.0 | % |
Floor plan interest expense increased from 2023 to 2024 due to a $45.7 million, or 35.0%, increase in same-store floor plan interest expense, coupled with an $11.0 million increase from net acquisitions. The overall increase is due to increases in average amounts outstanding under floor plan arrangements due to increasing levels of inventory, coupled with increases in applicable rates throughout much of the year.
Other Interest Expense
(In millions)
| | | | | | | | | | | | | | | | | | | | | | | | | | | | | | | | | | | | | | | | | | | | | | | | | | |
| | | | | | 2024 vs. 2023 | | | | | | 2023 vs. 2022 |
| | 2024 | | 2023 | | Change | | % Change | | 2023 | | 2022 | | Change | | % Change |
| Other interest expense | | $ | 87.8 | | | $ | 92.6 | | | $ | (4.8) | | | (5.2) | % | | $ | 92.6 | | | $ | 70.4 | | | $ | 22.2 | | | 31.5 | % |
Other interest expense decreased from 2023 to 2024 due to decreases in average revolver borrowing amounts outstanding under our credit agreements, partially offset by increases in applicable rates throughout much of the year.
Equity in Earnings of Affiliates
(In millions)
| | | | | | | | | | | | | | | | | | | | | | | | | | | | | | | | | | | | | | | | | | | | | | | | | | |
| | | | | | 2024 vs. 2023 | | | | | | 2023 vs. 2022 |
| | 2024 | | 2023 | | Change | | % Change | | 2023 | | 2022 | | Change | | % Change |
| Equity in earnings of affiliates | | $ | 200.7 | | | $ | 293.7 | | | $ | (93.0) | | | (31.7) | % | | $ | 293.7 | | | $ | 494.2 | | | $ | (200.5) | | | (40.6) | % |
Equity in earnings of affiliates decreased from 2023 to 2024 due to a $91.5 million, or 31.6%, decrease in earnings from our investment in PTS, coupled with the decrease in earnings from our other joint ventures. We believe the decrease in our PTS equity earnings is primarily due to lower commercial and consumer rental revenue as a result of the prolonged decline in freight rates, higher interest rates on fixed rate long term debt, higher average debt balances, higher maintenance expenses on full service leasing, and lower gains from the sale of revenue earning vehicles, partially offset by improved operating results in full-service leasing and logistics.
Income Taxes
(In millions)
| | | | | | | | | | | | | | | | | | | | | | | | | | | | | | | | | | | | | | | | | | | | | | | | | | |
| | | | | | 2024 vs. 2023 | | | | | | 2023 vs. 2022 |
| | 2024 | | 2023 | | Change | | % Change | | 2023 | | 2022 | | Change | | % Change |
| Income taxes | | $ | 316.5 | | | $ | 360.9 | | | $ | (44.4) | | | (12.3) | % | | $ | 360.9 | | | $ | 473.0 | | | $ | (112.1) | | | (23.7) | % |
Income taxes decreased from 2023 to 2024 primarily due to a $179.6 million decrease in our pre-tax income compared to the prior year. Our effective tax rate was 25.5% during 2024 compared to 25.4% during 2023 primarily due to fluctuations in our geographic pre-tax income mix, coupled with an increase to the U.K. corporate tax rate in April 2023.
Liquidity and Capital Resources
Our cash requirements are primarily for working capital, inventory financing, the acquisition of new businesses, the improvement and expansion of existing facilities, the purchase or construction of new facilities, debt service and repayments, dividends, and potential repurchases of our outstanding securities under the program discussed below. Historically, these cash requirements have been met through cash flow from operations, borrowings under our credit agreements and floor plan arrangements, the issuance of debt securities, sale-leaseback transactions, real estate financings, and dividends and distributions from joint venture investments.
We have historically expanded our operations through organic growth and the acquisition of dealerships and other businesses. We believe that cash flow from operations, dividends and distributions from PTS and our joint venture investments, and our existing capital resources, including the liquidity provided by our credit agreements and floor plan financing arrangements, will be sufficient to fund our existing operations and current commitments for at least the next twelve months. In the event that economic conditions are more severely impacted than we expect due to geo-political conditions, any pandemic or vehicle shortages resulting from supply chain difficulties, we pursue significant acquisitions or other expansion opportunities, pursue significant repurchases of our outstanding securities, or refinance or repay existing debt, we may need to raise additional capital either through the public or private issuance of equity or debt securities or through additional borrowings, which sources of funds may not necessarily be available on terms acceptable to us, if at all. In addition, our liquidity could be negatively impacted in the event we fail to comply with the covenants under our various financing and operating agreements or in the event our floor plan financing is withdrawn. Future events, including acquisitions, divestitures, new or revised operating lease agreements, borrowings or repayments under our credit agreements and our floor plan arrangements, raising capital, and purchases or refinancing of our securities, may also impact our liquidity.
We expect that scheduled payments of our debt instruments will be funded through cash flows from operations or borrowings under our credit agreements. Upon the maturity of our $550 million of 3.50% senior subordinated notes due September 1, 2025, we expect to repay those notes from cash flows from operations or borrowings under our credit agreement. In the case of payments upon the maturity or termination dates of our other debt instruments, we currently expect to be able to repay or refinance such instruments from cash flows from operations or borrowings under our credit agreements. Refer to the disclosures provided in Part II, Item 8, Note 10 of the Notes to our Consolidated Financial Statements set forth below for a detailed description of our long-term debt obligations and scheduled interest payments.
Floor plan notes payable are revolving inventory-secured financing arrangements. Refer to the disclosures provided in Part II, Item 8, Note 9 of the Notes to our Consolidated Financial Statements for a detailed description of financing for the vehicles we purchase, including discussion of our floor plan and other revolving arrangements.
Refer to the disclosures provided in Part II, Item 8, Note 11 of the Notes to our Consolidated Financial Statements for a description of our off-balance sheet arrangements which includes a repurchase commitment related to our floor plan credit agreement with Daimler Truck Financial Services Australia and Mercedes-Benz Financial Services New Zealand.
As of December 31, 2024, we had $72.4 million of cash available to fund our operations and capital commitments. In addition, we had an aggregate of approximately $1.8 billion available for borrowing under our U.S. credit agreement, U.K. credit agreement, the revolving mortgage facility through Toyota Motor Credit Corporation in the U.S., and other various credit facilities.
Securities Repurchases
From time to time, our Board of Directors has authorized securities repurchase programs pursuant to which we may, as market conditions warrant, purchase our outstanding common stock or debt on the open market, in privately negotiated transactions, via a tender offer, through a pre-arranged trading plan, pursuant to the terms of an accelerated share repurchase program, or by other means. We have historically implemented pre-arranged trading plans as part of our securities repurchase programs. These plans authorize share repurchases based on parameters outlined in the specific plan during periods when we otherwise would not trade in our securities, such as the period approaching the end of a quarter through our public announcement of earnings. We have historically funded any such repurchases using cash flow from operations, borrowings under our U.S. credit agreement, and borrowings under our U.S. floor plan arrangements. The decision to make repurchases will be based on factors such as general economic and industry conditions, the market price of the relevant security versus our view of its intrinsic value, the potential impact of such repurchases on our capital structure, and our consideration of any alternative uses of our capital, such as for acquisitions, dividends, the repayment of our existing indebtedness, and strategic investments in our current businesses, in addition to any then-existing limits imposed by our finance agreements and securities trading policy. As of December 31, 2024, $156.8 million remained outstanding and available for repurchases under our securities repurchase program approved by our Board of Directors. This authority has no expiration. Refer to the disclosures provided in Part II, Item 8, Note 14 of the Notes to our Consolidated Financial Statements for a summary of shares repurchased during 2024.
Dividends
We paid the following cash dividends on our common stock in 2023 and 2024:
Per Share Dividends
| | | | | |
| 2023 | |
| |
| First Quarter | $ | 0.61 | |
| Second Quarter | $ | 0.66 | |
| Third Quarter | $ | 0.72 | |
| Fourth Quarter | $ | 0.79 | |
| | | | | |
| 2024 | |
| |
| First Quarter | $ | 0.87 | |
| Second Quarter | $ | 0.96 | |
| Third Quarter | $ | 1.07 | |
| Fourth Quarter | $ | 1.19 | |
We also announced a cash dividend of $1.22 per share payable on March 6, 2025, to stockholders of record on February 24, 2025. While future quarterly or other cash dividends will depend upon a variety of factors considered relevant by our Board of Directors, which may include our expectations regarding vehicle availability, the rate of inflation, including its impact on vehicle affordability, earnings, cash flow, capital requirements, restrictions relating to any then-existing indebtedness, financial condition, alternative uses of capital, and other factors, we currently expect to continue to pay comparable dividends in the future.
Vehicle Financing
Refer to the disclosures provided in Part II, Item 8, Note 9 of the Notes to our Consolidated Financial Statements for a detailed description of financing for the vehicles we purchase, including discussion of our floor plan and other revolving arrangements.
Long-Term Debt Obligations
As of December 31, 2024, we had the following long-term debt obligations outstanding:
| | | | | |
| (In millions) | December 31,
2024 |
| U.S. credit agreement — revolving credit line | $ | — | |
| U.K. credit agreement — revolving credit line | 171.4 | |
| |
| 3.50% senior subordinated notes due 2025 | 549.1 | |
| 3.75% senior subordinated notes due 2029 | 496.6 | |
| |
| |
| |
| |
| Mortgage facilities | 474.8 | |
| Other debt | 160.1 | |
| Total long-term debt | $ | 1,852.0 | |
| Less: current portion | (721.2) | |
| Net long-term debt | $ | 1,130.8 | |
As of December 31, 2024, we were in compliance with all financial covenants under our credit agreements, and we believe we will remain in compliance with such covenants for the next twelve months. Refer to the disclosures provided in Part II, Item 8, Note 10 of the Notes to our Consolidated Financial Statements set forth below for a detailed description of our long-term debt obligations.
Short-Term Borrowings
As of December 31, 2024, we had five principal sources of short-term borrowings: our U.S. credit agreement, U.K. credit agreement, other local country credit agreements, the revolving mortgage facility through Toyota Motor Credit Corporation, and the floor plan agreements that we utilize to finance our vehicle inventories. We are also able to access availability under the floor plan agreements to fund our cash needs. Our borrowings vary over time based on our cash flows, capital requirements and investment activities. The amounts outstanding under our floor plan agreements varied based on the timing of the receipt and expenditure of cash in our operations, driven principally by the levels of our vehicle inventories. Of our approximately $1.8 billion available for borrowing under our various credit facilities, our U.S. credit facility provides for up to $1.5 billion in borrowing capacity. During 2024, our outstanding revolving commitments under the U.S. credit agreement varied between $0.0 million and $297.0 million.
PTS Dividends
We hold a 28.9% ownership interest in PTS as noted above. Their partnership agreement requires PTS, subject to applicable law and the terms of its credit agreements, to make quarterly distributions to the partners with respect to each fiscal year by no later than 45 days after the end of each of the first three quarters of the year and by April 15 of the following year. PTS' partnership agreement and certain of its debt agreements allow partner distributions only as long as it is not in default under those agreements and the amount it pays does not exceed 50% of its consolidated net income, unless its debt-to-equity ratio is less than 3.0 to 1.0, in which case its distributions may not exceed 80% of its consolidated net income. We receive pro rata cash distributions relating to this investment, typically in April, May, August, and November of each year. During 2024, 2023, and 2022, we received $98.4 million, $168.8 million, and $356.6 million, respectively, of pro rata cash distributions relating to this investment. We currently expect to continue to receive future distributions from PTS quarterly, subject to its financial performance.
Operating Leases
We estimate the total rent obligations under our operating leases, including any extension periods that we are reasonably certain to exercise at our discretion and assuming constant consumer price indices, to be $5.3 billion. As of December 31, 2024, we were in compliance with all financial covenants under these leases consisting principally of leases for dealerships and other properties, and we believe we will remain in compliance with such covenants for the next twelve months. Refer to the disclosures provided in Part II, Item 8, Note 3 and Note 11 of the Notes to our Consolidated Financial Statements for a description of our operating leases.
Supplemental Guarantor Financial Information
The following is a description of the terms and conditions of the guarantees with respect to senior subordinated notes of Penske Automotive Group, Inc. ("PAG") as the issuer of the 3.50% Notes and the 3.75% Notes (collectively the "Senior Subordinated Notes").
Each of the Senior Subordinated Notes are unsecured, senior subordinated obligations and are guaranteed on an unsecured senior subordinated basis by our 100% owned U.S. subsidiaries ("Guarantor subsidiaries"). Each of the Senior Subordinated Notes also contains customary negative covenants and events of default. If we experience certain "change of control" events specified in their respective indentures, holders of these Senior Subordinated Notes will have the option to require us to purchase for cash all or a portion of their Senior Subordinated Notes at a price equal to 101% of the principal amount of the Senior Subordinated Notes, plus accrued and unpaid interest. In addition, if we make certain asset sales and do not reinvest the proceeds thereof or use such proceeds to repay certain debt, we will be required to use the proceeds of such asset sales to make an offer to purchase the Senior Subordinated Notes at a price equal to 100% of the principal amount of the Senior Subordinated Notes, plus accrued and unpaid interest.
Guarantor subsidiaries are directly or indirectly 100% owned by PAG, and the guarantees are full and unconditional and joint and several. The guarantees may be released under certain circumstances upon resale or transfer by us of the stock of the related guarantor or all or substantially all of the assets of the guarantor to a non-affiliate. Non-wholly owned and foreign subsidiaries of PAG do not guarantee the Senior Subordinated Notes ("Non-Guarantor subsidiaries"). The following tables present summarized financial information for PAG and the Guarantor subsidiaries on a combined basis. The financial information of PAG and Guarantor subsidiaries is presented on a combined basis; intercompany balances and transactions between PAG and Guarantor subsidiaries have been eliminated; PAG's or Guarantor subsidiaries' amounts due from, amounts due to, and transactions with non-issuer and Non-Guarantor subsidiaries and related parties are disclosed separately.
Condensed income statement information:
| | | | | | | | | | | |
| PAG and Guarantor Subsidiaries |
| Year Ended December 31, 2024 | | Year Ended December 31, 2023 |
| Revenues | $ | 17,008.9 | | | $ | 16,439.2 | |
| Gross profit | 2,960.3 | | | 2,948.4 | |
| Equity in earnings of affiliates | 198.0 | | | 289.5 | |
| Net income | 716.7 | | | 835.5 | |
| Net income attributable to Penske Automotive Group | 716.7 | | | 835.5 | |
Condensed balance sheet information:
| | | | | | | | | | | |
| PAG and Guarantor Subsidiaries |
| December 31, 2024 | | December 31, 2023 |
| Current assets (1) | $ | 3,334.8 | | | $ | 3,066.2 | |
| Property and equipment, net | 1,611.6 | | | 1,447.6 | |
| Equity method investments | 1,806.4 | | | 1,727.7 | |
| Other noncurrent assets | 3,870.3 | | | 3,693.2 | |
| Current liabilities | 3,343.6 | | | 2,546.6 | |
| Noncurrent liabilities | 3,443.7 | | | 3,946.7 | |
_______________
(1)Includes $535.4 million and $535.1 million as of December 31, 2024, and 2023, respectively, due from Non-Guarantor subsidiaries.
During the years ended December 31, 2024, and 2023, PAG received $110.3 million and $142.9 million, respectively, from Non-Guarantor subsidiaries.
Cash Flows
The following table summarizes the changes in our cash provided by (used in) operating, investing, and financing activities. The major components of these changes are discussed below.
| | | | | | | | | | | | | | | | | |
| Year Ended December 31, |
| (In millions) | 2024 | | 2023 | | 2022 |
| Net cash provided by operating activities | $ | 1,179.8 | | | $ | 1,093.6 | | | $ | 1,459.0 | |
| Net cash used in investing activities | (1,037.0) | | | (572.3) | | | (641.7) | |
| Net cash used in financing activities | (164.7) | | | (531.1) | | | (798.0) | |
| | | | | |
| Effect of exchange rate changes on cash and cash equivalents | (2.1) | | | (0.3) | | | (13.5) | |
| Net change in cash and cash equivalents | $ | (24.0) | | | $ | (10.1) | | | $ | 5.8 | |
Cash Flows from Operating Activities
Cash flows from operating activities include net income, as adjusted for non-cash items and the effects of changes in working capital.
We finance substantially all of the commercial vehicles we purchase for distribution, new vehicles for retail sale (however, see Item 1A. Risk Factors for a discussion of the agency model of distribution), and a portion of our used vehicle inventories for retail sale under floor plan and other revolving arrangements with various lenders, including the captive finance companies associated with automotive manufacturers. We retain the right to select which, if any, financing source to utilize in connection with the procurement of vehicle inventories. Many vehicle manufacturers provide vehicle financing for the dealers representing their brands; however, it is not a requirement that we utilize this financing. Historically, our floor plan finance source has been based on aggregate pricing considerations.
In accordance with generally accepted accounting principles relating to the statement of cash flows, we report all cash flows arising in connection with floor plan notes payable with the manufacturer of a particular new vehicle as an operating activity in our statement of cash flows, and we report all cash flows arising in connection with floor plan notes payable to a party other than the manufacturer of a particular new vehicle and all floor plan notes payable relating to pre-owned vehicles as a financing activity in our statement of cash flows. Currently, the majority of our non-trade vehicle financing is with other manufacturer captive lenders. To date, we have not experienced any material limitation with respect to the amount or availability of financing from any institution providing us with vehicle financing.
We believe that changes in aggregate floor plan liabilities are typically linked to changes in vehicle inventory and therefore, are an integral part of understanding changes in our working capital and operating cash flow. As a result, we have prepared the following reconciliation to highlight our operating cash flows with all changes in vehicle floor plan being classified as an operating activity for informational purposes:
| | | | | | | | | | | | | | | | | |
| Year Ended December 31, |
| (In millions) | 2024 | | 2023 | | 2022 |
| Net cash provided by operating activities as reported | $ | 1,179.8 | | | $ | 1,093.6 | | | $ | 1,459.0 | |
| Floor plan notes payable — non-trade as reported | (15.4) | | | 46.5 | | | 82.9 | |
| Net cash provided by operating activities including all floor plan notes payable | $ | 1,164.4 | | | $ | 1,140.1 | | | $ | 1,541.9 | |
Cash Flows from Investing Activities
Cash flows from investing activities consist primarily of cash used for capital expenditures, proceeds from the sale of dealerships, proceeds from the sale of property and equipment, and net expenditures for acquisitions and other investments. Capital expenditures were $368.7 million, $375.3 million, and $282.5 million during 2024, 2023, and 2022, respectively. Capital expenditures relate primarily to improvements to our existing dealership facilities, the construction of new facilities, the acquisition of the property or buildings associated with existing leased facilities, and the acquisition of land for future development. We currently expect to finance our capital expenditures with operating cash flows or borrowings under our credit agreements. Proceeds from the sale of dealerships were $82.1 million and $13.1 million during 2024 and 2022, respectively, compared to no proceeds during 2023. Proceeds from the sale of property and equipment were $26.2 million, $30.7 million, and $32.3 million during 2024, 2023, and 2022, respectively. Cash used in acquisitions and other investments, net of cash acquired, was $786.2 million, $214.9 million, and $393.4 million during 2024, 2023, and 2022, respectively, and included cash used to repay sellers' floor plan liabilities in such business acquisitions of $212.5 million, $24.3 million, and $51.3 million, respectively.
Cash Flows from Financing Activities
Cash flows from financing activities include net borrowings or repayments of debt, net repayments or borrowings of floor plan notes payable non-trade, repurchases of common stock, dividends, and payments for debt issuance costs.
We had net borrowings of debt of $232.0 million and $160.1 million during 2024 and 2022, respectively, and net repayments of $4.3 million during 2023. We had net repayments of floor plan notes payable non-trade of $15.4 million during 2024 and net borrowings of $46.5 million and $82.9 million during 2023 and 2022, respectively. In 2024, 2023, and 2022, we repurchased 0.4 million, 2.6 million, and 8.1 million shares of common stock under our securities repurchase program for $58.7 million, $358.7 million, and $869.3 million, respectively. In 2024, 2023, and 2022, we acquired 0.12 million, 0.17 million, and 0.15 million shares from employees in connection with a net share settlement feature of employee equity awards for 18.8 million, $23.5 million, and $17.2 million, respectively. We also paid 274.4 million, $189.1 million, and $154.1 million of cash dividends to our stockholders during 2024, 2023, and 2022, respectively. We made payments of $1.0 million, $2.1 million, and $0.3 million for debt issuance costs during 2024, 2023, and 2022, respectively.
Related Party Transactions
Stockholders Agreement
Several of our directors and officers are affiliated with Penske Corporation or related entities. Roger Penske, our Chair of the Board and Chief Executive Officer, is also Chair of the Board and Chief Executive Officer of Penske Corporation and through entities affiliated with Penske Corporation is our largest stockholder owning approximately 51.5% of our outstanding common stock. Mitsui & Co., Ltd. and Mitsui & Co. (USA), Inc. (collectively, "Mitsui") own approximately 19.9% of our outstanding common stock. Mitsui, Penske Corporation and Penske Automotive Holdings Corp. (together
with Penske Corporation, the "Penske companies") are parties to a stockholders agreement which expires March 26, 2030 (the "Stockholders Agreement"). Pursuant to the Stockholders Agreement, in connection with any shareholder election of directors, the Penske companies agreed to vote their shares for two directors who are representatives of Mitsui as long as Mitsui owns in excess of 20% of our outstanding common stock, and for one director as long as Mitsui owns in excess of 10% of our outstanding common stock. Mitsui agreed to vote its shares for up to fourteen directors voted for by the Penske companies.
Voting Agreement
Penske Corporation (“PC”) and the Company entered into a voting agreement (the “Voting Agreement”) pursuant to which PC agreed, on each matter brought to a vote at any annual or special meeting of our stockholders and in connection with any action proposed to be taken by consent of our stockholders in lieu of a meeting, to vote all shares of Voting Common Stock, or other voting or equity securities of ours which could be issued (together with the Voting Common Stock, the “Voting Securities”) beneficially owned by PC, that, together with the Voting Securities held by Roger S. Penske, our Chair and Chief Executive Officer, and any entity that Roger S. Penske controls, exceed 43.57% of the outstanding Voting Securities (the “Excess Voting Securities”), in the same proportion as all votes cast by stockholders other than PC, Roger S. Penske or any entity that Roger S. Penske controls (except as otherwise required by the existing Stockholders Agreement. Any Voting Securities that are not Excess Voting Securities may be voted at the discretion of PC. The Voting Agreement will terminate per its terms at the time that PC ceases to beneficially own 30% or more of the Voting Securities then outstanding. Notwithstanding the foregoing, the Voting Agreement does not impact the provisions of the Stockholders Agreement noted above as currently in effect.
Other Related Party Interests and Transactions
Robert Kurnick, Jr., our President and a director, is also the Vice Chair and a director of Penske Corporation and an Advisory Board member of PTS. Bud Denker, our Executive Vice President, Human Resources, is also the President of Penske Corporation. Greg Penske, the Vice Chair of our Board of Directors, is the son of our Chair and is also a director of Penske Corporation. Michael Eisenson, one of our directors, is also a director of Penske Corporation. Kota Odagiri, one of our directors, is also an employee of Mitsui & Co.
We sometimes pay to and/or receive fees from Penske Corporation, its subsidiaries, and its affiliates for services rendered in the ordinary course of business or to reimburse payments made to third parties on each other's behalf. These transactions are reviewed periodically by our Audit Committee and reflect the provider's cost or an amount mutually agreed upon by both parties.
We own a 28.9% interest in PTS. PTS, discussed previously, is owned 41.1% by Penske Corporation, 28.9% by us, and 30.0% by Mitsui. The PTS partnership agreement, among other things, provides us with specified partner distribution and governance rights and restricts our ability to transfer our interest. The partnership has an eleven-member Advisory Board. We have the right to appoint one Advisory Board member and appointed Robert H. Kurnick, Jr., our President. Lisa Davis and Michael Eisenson, our directors, are also members of the Advisory Board. We have the right to pro rata quarterly distributions equal to at least 50% of PTS' consolidated net income, as well as specified minority rights which require our and/or Mitsui's consent for certain actions taken by PTS as specified in the PTS partnership agreement. We have also entered into other joint ventures with certain related parties as more fully discussed in Part II, Item 8, Note 12 of the Notes to our Consolidated Financial Statements.
Cyclicality
Unit sales of motor vehicles, particularly new vehicles, have been cyclical historically, fluctuating with general economic cycles. During economic downturns, the automotive and truck retailing industries tend to experience periods of decline and recession similar to those experienced by the general economy. We believe that these industries are influenced by general economic conditions and particularly, by consumer confidence, the level of personal discretionary spending, the rate of inflation, including its impact on vehicle affordability, fuel prices, utility prices, interest rates, and credit availability.
U.S. light vehicle sales have ranged from a low of 10.4 million units in 2009 to a high of 17.5 million units in 2016. Unit sales of new commercial vehicles have historically been subject to substantial cyclical variation based on these general economic conditions. According to data published by ACT Research, in recent years, total U.S. retail sales of new Class 8 commercial vehicles have ranged from a low of approximately 97,000 in 2009 to a high of approximately 334,000 in 2019. Through geographic diversification, concentration on higher margin regular service and parts revenues, and
diversification of our customer base, we have attempted to reduce the negative impact of adverse general economic conditions or cyclical trends affecting any one industry or geographic area on our earnings.
Seasonality
Retail Automotive Dealership. Our business is modestly seasonal overall. Our U.S. operations generally experience higher volumes of vehicle sales in the second and third quarters of each year due in part to consumer buying trends and the introduction of new vehicle models. Also, vehicle demand, and to a lesser extent demand for service and parts, is generally lower during the winter months than in other seasons, particularly in regions of the U.S. where dealerships may be subject to severe winters. Our U.K. operations generally experience higher volumes of new vehicle sales in the first and third quarters of each year, due primarily to new vehicle registration practices in the U.K.
Inflation
Many of the markets in which we operate have recently experienced higher rates of inflation when compared to historical norms. Inflation affects the price of vehicles, the price of parts, the rate of pay of our employees, consumer credit availability, and consumer demand. During 2022, used vehicle prices in particular experienced periods of significant inflation, and higher rates of inflation may adversely affect consumer demand and increase our costs, which may materially and adversely affect us.
Forward-Looking Statements
Certain statements and information set forth herein, as well as other written or oral statements made from time to time by us or by our authorized officers on our behalf, constitute "forward-looking statements" within the meaning of the Federal Private Securities Litigation Reform Act of 1995. Words such as "anticipate," "believe," "estimate," "expect," "intend," "may," "goal," "plan," "seek," "project," "continue," "will," "would," and variations of such words and similar expressions are intended to identify such forward-looking statements. We intend for our forward-looking statements to be covered by the safe harbor provisions for forward-looking statements contained in the Private Securities Litigation Reform Act of 1995, and we set forth this statement in order to comply with such safe harbor provisions. You should note that our forward-looking statements speak only as of the date of this report or when made, and we undertake no duty or obligation to update or revise our forward-looking statements, whether as a result of new information, future events, or otherwise. Forward-looking statements include, without limitation, statements with respect to:
•the impact of macro-economic and geo-political conditions and events, including their impact on new and used vehicle sales, availability of consumer credit, changes in consumer demand, consumer confidence levels, fuel prices, the rate of inflation, personal discretionary spending levels, consumer credit availability, interest rates, and unemployment rates;
•our future financial and operating performance;
•future dealership openings, acquisitions, and dispositions;
•future potential capital expenditures and securities repurchases;
•our ability to realize cost savings and synergies;
•our ability to respond to economic cycles;
•our expectations regarding new vehicle availability and the renewal of our existing franchise agreements and arrangements;
•trends and sales levels in the automotive retail industry, commercial vehicles industries, and in the general economy in the various countries in which we operate;
•the rate of adoption of EVs and their effect on our business;
•our liquidity and ability to access the remaining availability under our credit agreements;
•the performance of our joint ventures, including PTS;
•future foreign currency exchange rates;
•the outcome of various regulatory matters and legal proceedings;
•results of self-insurance plans or other insured matters;
•trends affecting the automotive or trucking industries generally, such as changes to an agency model of distribution, and our future financial condition or results of operations; and
•our business strategy.
Forward-looking statements involve known and unknown risks and uncertainties and are not assurances of future performance. Actual results may differ materially from anticipated results due to a variety of factors, including the factors identified under Part I, Item 1A. Risk Factors. Important factors that could also cause actual results to differ materially from our expectations include those mentioned in Part I, Item 1A. Risk Factors and the following:
•our business and the automotive retail and commercial vehicles industries in general are susceptible to adverse macro-economic and geo-political conditions, including their impact on new and used vehicle sales, the availability of consumer credit, changes in consumer demand, consumer confidence levels, fuel prices, demand for trucks to move freight with respect to PTS and PTG, personal discretionary spending levels, interest rates, foreign currency exchange rates, customer confidence, the rate of inflation, including its impact on vehicle affordability, fuel and utility prices and unemployment rates
•we depend on the success, popularity and availability of the brands we sell, and adverse conditions affecting one or more of these vehicle manufacturers, including the adverse impact on the vehicle and parts supply chain due to natural disasters, the shortage of vehicle components, international conflicts, challenges in sourcing labor, labor strikes, or work stoppages, or other disruptions that interrupt the supply of vehicles and parts to us may negatively impact our revenues and profitability;
•the number of new and used vehicles sold in our markets, which impacts our ability to generate new and used vehicle gross profit and future service and parts operations;
•the effect on our businesses of the changing retail environment due to certain manufacturers selling direct to consumers outside the franchise system, changes to an agency model of distribution, and the growing number of EVs;
•the effect on our businesses of mobility technologies, such as Uber and Lyft, and the eventual availability of driverless vehicles;
•vehicle manufacturers exercise significant control over our operations, and we depend on them and the continuation of our franchise and distribution agreements in order to operate our business;
•we are subject to the risk that a substantial number of our new or used inventory may be unavailable due to inventory shortages, recalls, or other reasons;
•the success of our commercial vehicle distribution operations and engine and power systems distribution operations depends upon continued availability of the vehicles, engines, power systems, and other parts we distribute, demand for those vehicles, engines, power systems, and parts and general economic conditions in those markets;
•a restructuring of any significant vehicle manufacturer or supplier;
•our operations may be affected by severe weather or other periodic business interruptions;
•with respect to PTS, changes in the financial health of its customers, compliance costs, labor strikes or work stoppages with respect to its employees, a reduction in PTS' asset utilization rates, continued availability from truck manufacturers and suppliers of vehicles and parts for its fleet, including with respect to the effect of various government mandates concerning the electrification of its vehicle fleet, potential decreases in the resale value of used vehicles which may affect PTS' ability to sell its used vehicles after the expiration of its customers' leases or at the end of its holding period for rental vehicles, which may affect PTS' profitability, compliance costs in regard to its trucking fleet and truck drivers, its ability to retain qualified drivers and technicians, risks associated with its participation in multi-employer pension plans, conditions in the capital markets to assure PTS' continued availability of capital to purchase trucks, the effect of changes in lease accounting rules on PTS customers'
purchase/lease decisions, industry competition, new or enhanced regulatory requirements, emissions standards, vehicle mandates, changes in consumer sentiment regarding the transportation industry, and vulnerabilities with respect to its centralized information systems, each of which could impact equity earnings and distributions to us;
•we have substantial risk of loss not covered by insurance;
•we may not be able to satisfy our capital requirements for acquisitions, facility renovation projects, financing the purchase of our inventory, or refinancing of our debt when it becomes due;
•our level of indebtedness and cash required for lease obligations may limit our ability to obtain financing generally and may require that a significant portion of our cash flow be used for debt service;
•non-compliance with the financial ratios and other covenants under our credit agreements and operating leases;
•higher interest rates may significantly increase our variable rate interest costs and because many customers finance their vehicle purchases, adversely impact vehicle affordability, and decrease vehicle sales;
•our operations outside of the U.S. subject our profitability to fluctuations relating to changes in foreign currency values;
•we are dependent on the continued security and availability of our information technology systems and those of certain third-party providers to avoid significant business interruptions, which systems are increasingly threatened by ransomware and other cyber-attacks, such as the CDK Cybersecurity Incident discussed above;
•we may be subject to significant litigation, fines, penalties, and other costs under applicable privacy laws and regulations if we do not maintain our confidential customer and employee information properly;
•if we lose key personnel, especially our Chief Executive Officer, or are unable to attract additional qualified personnel;
•new or enhanced regulations in both our domestic and international markets relating to automobile dealerships and vehicle sales, including those enacted in certain European countries and various U.S. states banning or taking actions to ban the sale of new vehicles with gasoline engines;
•new or enhanced regulations, including those related to emissions standards, or changes in consumer sentiment relating to commercial truck sales that may hinder our or PTS' ability to maintain, acquire, sell, or operate trucks;
•increased tariffs, import product restrictions, and foreign trade risks that may increase costs to us and consumers and impact our ability to sell vehicles profitably;
•changes in tax, financial or regulatory rules, or requirements, including new regulations proposed by the Federal Trade Commission for automotive dealers that would change industry-accepted practices with regard to sales and advertising, require an extensive series of oral and written disclosures to consumers in regard to the sale price of vehicles, credit terms, and voluntary protection products, and impose burdensome recordkeeping requirements that may lead to additional transaction times for the sale of vehicles, complicate the transaction process, decrease customer satisfaction, and increase compliance costs and risk, among other effects;
•we could be subject to legal and administrative proceedings which, if the outcomes are adverse to us, could have a material adverse effect on our business, including the result of the U.K. Financial Conduct Authority’s investigation of discretionary commission arrangements and potential remediation measures amid concerns these arrangements were unfair to customers as well as the resulting impact of a recent U.K. court judgment requiring the lenders in that case to repay the customers in that case the commissions paid to the dealers for their vehicle finance agreements;
•if state dealer laws in the U.S. are repealed or weakened or new manufacturers such as those selling EVs are able to conduct significant vehicle sales outside of the franchised automotive system, our automotive dealerships may be subject to increased competition and may be more susceptible to termination, non-renewal, or renegotiation of their franchise agreements;
•we are subject to a wide range of environmental laws and regulations governing the use, generation, and disposal of materials used in our ordinary course of operations, and we face potentially significant costs relating to claims,
penalties, and remediation efforts in the event of non-compliance with existing and future laws and regulations which may become more stringent in the face of climate change;
•some of our directors and officers may have conflicts of interest with respect to certain related party transactions and other business interests; and
•shares of our common stock eligible for future sale may cause the market price of our common stock to drop significantly, even if our business is doing well.
We urge you to carefully consider these risk factors and further information under Part I, Item 1A. Risk Factors in evaluating all forward-looking statements regarding our business. Readers of this report are cautioned not to place undue reliance on the forward-looking statements contained in this report. All forward-looking statements attributable to us are qualified in their entirety by this cautionary statement. Except to the extent required by the federal securities laws and the Securities and Exchange Commission's rules and regulations, we have no intention or obligation to update publicly any forward-looking statements whether as a result of new information, future events, or otherwise.
Additional Information
Investors and others should note that we may announce material financial information using our company website (www.penskeautomotive.com), our investor relations website (investors.penskeautomotive.com), SEC filings, press releases, public conference calls, and webcasts. Information about the Company, its business, and its results of operations may also be announced by posts on the following social media channels:
•Penske Automotive Group's X feed (www.x.com/penskecars)
•Penske Automotive Group's Facebook page (www.facebook.com/penskecars)
•Penske Automotive Group's Instagram page (www.instagram.com/penskecars)
•Penske Automotive Group's Social website (www.penskesocial.com)
The information that we post on these social media channels could be deemed to be material information. As a result, we encourage investors, the media, and others interested in Penske Automotive Group to review the information that we post on these social media channels. These channels may be updated from time to time on Penske Automotive Group's investor relations website. The information on or accessible through our websites and social media channels is not incorporated by reference in this Annual Report on Form 10-K, and our references to such content are intended to be inactive textual or oral references only.
Item 7A. Quantitative and Qualitative Disclosures About Market Risk
Interest Rates. We are exposed to market risk from changes in the interest rates on a significant portion of our outstanding debt. Outstanding revolving balances under our credit agreements bear interest at the prevailing benchmark interest rates in our various markets. Based on an average of the aggregate amounts outstanding under these facilities during the year ended December 31, 2024, a 100-basis-point change in interest rates would result in an approximate $4.4 million change to our annual other interest expense.
Similarly, amounts outstanding under floor plan financing arrangements also bear interest at the prevailing benchmark interest rates in our various markets. Based on an average of the aggregate amounts outstanding under our floor plan financing arrangements subject to variable interest payments during the year ended December 31, 2024, a 100 basis point change in interest rates would result in an approximate $38.6 million change to our annual floor plan interest expense.
We evaluate our exposure to interest rate fluctuations and follow established policies and procedures to implement strategies designed to manage the amount of variable rate indebtedness outstanding at any point in time in an effort to mitigate the effect of interest rate fluctuations on our earnings and cash flows. These policies include:
•the maintenance of our overall debt portfolio with fixed and variable rate components;
•the use of authorized derivative instruments;
•the prohibition of using derivatives for trading or other speculative purposes; and
•the prohibition of highly leveraged derivatives, derivatives which we are unable to reliably value, or derivatives which we are unable to obtain a market quotation.
Interest rate fluctuations affect the fair market value of our fixed rate debt, including our swaps, mortgages, and certain seller financed promissory notes but with respect to such fixed rate debt instruments, do not impact our earnings or cash flows.
Foreign Currency Exchange Rates. As of December 31, 2024, we had consolidated operations in the U.K., Germany, Italy, Japan, Canada, Australia, and New Zealand. In each of these markets, the local currency is the functional currency. In the event we change our intent with respect to the investment in any of our international operations, we would expect to implement strategies designed to manage those risks in an effort to mitigate the effect of foreign currency fluctuations on our earnings and cash flows. A ten percent change in average exchange rates versus the U.S. Dollar would have resulted in an approximate $1.27 billion change to our revenues for the year ended December 31, 2024.
We purchase certain of our new vehicles, parts, and other products from non-U.S. manufacturers. Although we purchase the majority of our inventories in the local functional currency, our business is subject to certain risks, including, but not limited to, differing economic conditions, changes in political climate, differing tax structures, changes in tax and tariff rates, other regulations and restrictions, and foreign currency exchange rate volatility, which may influence such manufacturers' ability to provide their products at competitive prices in the local jurisdictions. Our future results could be materially and adversely impacted by changes in these or other factors.
Item 8. Financial Statements and Supplementary Data
The consolidated financial statements listed in the accompanying Index to Consolidated Financial Statements are incorporated by reference into this Item 8.
Item 9. Changes in and Disagreements with Accountants on Accounting and Financial Disclosure
Not applicable.
Item 9A. Controls and Procedures
Under the supervision and with the participation of our management, including our principal executive officer and principal financial officer, we conducted an evaluation of the effectiveness of our disclosure controls and procedures (as such term is defined in Rules 13a-15(e) and 15d-15(e) under the Securities Exchange Act of 1934, as amended (the "Exchange Act")) as of the end of the period covered by this report. Our disclosure controls and procedures are designed to ensure that information required to be disclosed by us in the reports we file under the Exchange Act is recorded, processed, summarized, and reported within the time periods specified in the SEC's rules and forms and that such information is accumulated and communicated to management, including our principal executive officer and principal financial officer, to allow timely discussions regarding required disclosure.
Based upon this evaluation, our principal executive officer and principal financial officer concluded that our disclosure controls and procedures were effective as of the end of the period covered by this report. In addition, we maintain internal controls designed to provide us with the information required for accounting and financial reporting purposes. There were no changes in our internal control over financial reporting that occurred during the most recent quarter that materially affected, or are reasonably likely to materially affect, our internal control over financial reporting.
Management's and our auditor's reports on our internal control over financial reporting are included with our financial statements filed as part of this Annual Report on Form 10-K.
Item 9B. Other Information
(b)
During the three months ended December 31, 2024, none of our directors or officers (as defined in Rule 16a-1(f) of the Exchange Act) adopted or terminated a “Rule 10b5-1 trading arrangement” or “non-Rule 10b5-1 trading arrangement,” as each term is defined in Item 408 of Regulation S-K.
Item 9C. Disclosure Regarding Foreign Jurisdictions that Prevent Inspections
Not applicable.
PART III
Except for the information provided pursuant to Item 10 and Item 12 below, the information required by Items 10 through 14 will be included in our definitive proxy statement, which will be filed with the SEC no later than 120 days after the close of the fiscal year ended December 31, 2024, under the captions "Election of Directors," "Our Corporate Governance," "Ratification of the Selection of our Independent Auditor," "Independent Auditing Firm Fees," "Executive Officers," "Compensation Committee Report," "Compensation Discussion and Analysis," "Executive Compensation," "Director Compensation," "Security Ownership of Certain Beneficial Owners and Management," and "Related Party Transactions." Such information is incorporated herein by reference.
Item 10. Directors, Executive Officers and Corporate Governance
We have adopted securities trading policies and procedures applicable to all of our directors, officers, and employees, as well as the Company itself when we repurchase our own securities in the open market, that we believe are reasonably designed to promote compliance with insider trading laws, rules, and regulations, and the applicable listing standards of the New York Stock Exchange. A copy of our Insider Trading Policy is filed as Exhibit 19.1 to this Annual Report on Form 10-K.
Item 12. Security Ownership of Certain Beneficial Owners and Management and Related Stockholder Matters
Securities Authorized for Issuance Under Equity Compensation Plans
The following table provides details regarding the shares of common stock issuable upon the exercise of outstanding options, warrants, and rights granted under our equity compensation plans (including individual equity compensation arrangements) as of December 31, 2024. Our equity plan is described in more detail in Part II, Item 8, Note 13 of the Notes to our Consolidated Financial Statements appearing below in this report.
| | | | | | | | | | | | | | | | | |
| Plan Category | Number of securities to be
issued upon exercise of
outstanding options, warrants, and rights
(A) | | Weighted average
exercise price of
outstanding options,
warrants, and rights
(B) | | Number of securities
remaining available for
future issuance under
equity compensation
plans (excluding
securities reflected in
column (A))
(C) |
| Equity compensation plans approved by security holders | — | | | $ | — | | | 3,760,000 | |
| Equity compensation plans not approved by security holders | — | | | — | | | — | |
| Total | — | | | $ | — | | | 3,760,000 | |
PART IV
Item 15. Exhibits and Financial Statement Schedules
(1)Financial Statements
The consolidated financial statements listed in the accompanying Index to Consolidated Financial Statements are filed as part of this Annual Report on Form 10-K.
(2)Financial Statement Schedule
The Schedule II — Valuation and Qualifying Accounts following the Consolidated Financial Statements is filed as part of this Annual Report on Form 10-K.
(3)Exhibits
The Exhibits listed below are filed as part of this Annual Report on Form 10-K.
Item 16. Form 10-K Summary
None.
INDEX OF EXHIBITS
Each management contract or compensatory plan or arrangement is identified with an asterisk.
| | | | | |
| 3.1 | |
| 3.2 | |
| 4.1.1 | |
| 4.1.2 | |
| 4.1.3 | |
| 4.1.4 | |
| 4.1.5 | |
| 4.1.6 | |
| 4.1.7 | |
| 4.1.8 | |
| 4.1.9 | |
| 4.1.10 | |
| 4.2.1 | |
| 4.2.2 | |
| 4.3.1 | |
| 4.3.2 | |
| 4.4 | |
| *10.1 | |
| *10.2 | |
| *10.3 | |
| | | | | |
| *10.4 | |
| *10.5.1 | |
| *10.5.2 | |
| 10.6 | |
| 10.7 | |
| 10.8.1 | |
| 10.8.2 | |
| 10.8.3 | |
| 10.9 | |
| 10.10 | |
| 10.11 | |
| 10.12 | |
| 10.13.1 | |
| 10.13.2 | Amendment No. 1, dated February 6, 2023, to Seventh Amended and Restated Agreement of Limited Partnership of Penske Truck Leasing Co., L.P., dated September 8, 2017, by and among Penske Truck Leasing Corporation, PTL GP, LLC, MBK USA Commercial Vehicles Inc. and us (incorporated by reference to exhibit 10.1 to our Form 8-K filed February 8, 2023). |
| 10.14 | |
| 10.15 | |
| 19.1 | |
| 21 | |
| 22.1 | |
| 23.1 | |
| 31.1 | |
| 31.2 | |
| 32 | |
| 97 | |
| | | | | |
| 101.INS | XBRL Instance Document - the instance document does not appear in the Interactive Data File because its XBRL tags are embedded within the Inline XBRL document. |
| 101.SCH | XBRL Taxonomy Extension Schema. |
| 101.CAL | XBRL Taxonomy Extension Calculation Linkbase. |
| 101.DEF | XBRL Taxonomy Extension Definition Linkbase. |
| 101.LAB | XBRL Taxonomy Extension Label Linkbase. |
| 101.PRE | XBRL Taxonomy Extension Presentation Linkbase. |
| 104 | Cover Page Interactive Data File (formatted in Inline XBRL and contained in Exhibit 101) – The cover page interactive data file does not appear in the Interactive Data File because its XBRL tags are embedded within the Inline XBRL document |
________________________
* Compensatory plans or contracts
In accordance with Item 601(b)(4)(iii)(A) of Regulation S-K, copies of certain instruments defining the rights of holders of long-term debt of the Company or its subsidiaries are not filed herewith. We hereby agree to furnish a copy of any such instrument to the Commission upon request.
SIGNATURES
Pursuant to the requirements of Section 13 or 15(d) of the Securities Exchange Act of 1934, the registrant has duly caused this report to be signed on its behalf by the undersigned, thereunto duly authorized on February 21, 2025.
| | | | | | | | |
| PENSKE AUTOMOTIVE GROUP, INC. |
| | |
| By: | /s/ Roger S. Penske |
| | Roger S. Penske Chair of the Board and Chief Executive Officer |
Pursuant to the requirements of the Securities Exchange Act of 1934, this report has been signed below by the following persons on behalf of the registrant and in the capacities and on the dates indicated.
| | | | | | | | | | | | | | |
| Signature | | Title | | Date |
| | | | |
| /s/ Roger S. Penske | | Chair of the Board and | | February 21, 2025 |
| Roger S. Penske | | Chief Executive Officer (Principal Executive Officer) | | |
| | | | |
| /s/ Michelle Hulgrave | | Executive Vice President and Chief Financial Officer | | February 21, 2025 |
| Michelle Hulgrave | | (Principal Financial Officer and Principal Accounting Officer) | | |
| | | | |
| /s/ John D. Barr | | Director | | February 21, 2025 |
| John D. Barr | | | | |
| | | | |
| /s/ Lisa Davis | | Director | | February 21, 2025 |
| Lisa Davis | | | | |
| | | | |
| /s/ Michael R. Eisenson | | Director | | February 21, 2025 |
| Michael R. Eisenson | | | | |
| | | | |
| /s/ Robert H. Kurnick, Jr. | | Director | | February 21, 2025 |
| Robert H. Kurnick, Jr. | | | | |
| | | | |
| /s/ Wolfgang Dürheimer | | Director | | February 21, 2025 |
| Wolfgang Dürheimer | | | | |
| | | | |
| /s/ Kimberly J. McWaters | | Director | | February 21, 2025 |
| Kimberly J. McWaters | | | | |
| | | | |
| /s/ Greg Penske | | Director | | February 21, 2025 |
| Greg Penske | | | | |
| | | | |
| /s/ Sandra E. Pierce | | Director | | February 21, 2025 |
| Sandra E. Pierce | | | | |
| | | | |
| /s/ Kota Odagiri | | Director | | February 21, 2025 |
| Kota Odagiri | | | | |
| | | | |
| /s/ Greg C. Smith | | Director | | February 21, 2025 |
| Greg C. Smith | | | | |
| | | | |
| /s/ Ronald G. Steinhart | | Director | | February 21, 2025 |
| Ronald G. Steinhart | | | | |
| | | | |
| /s/ H. Brian Thompson | | Director | | February 21, 2025 |
| H. Brian Thompson | | | | |
INDEX TO CONSOLIDATED FINANCIAL STATEMENTS
PENSKE AUTOMOTIVE GROUP, INC.
As of December 31, 2024, and 2023 and For the Years Ended
December 31, 2024, 2023, and 2022
MANAGEMENT REPORT ON INTERNAL CONTROL OVER FINANCIAL REPORTING
The management of Penske Automotive Group, Inc. and subsidiaries (the “Company”) is responsible for establishing and maintaining adequate internal control over financial reporting. The Company's internal control system was designed to provide reasonable assurance to the Company's management and board of directors that the Company's internal control over financial reporting provides reasonable assurance regarding the reliability of financial reporting and the preparation and presentation of financial statements for external purposes in accordance with accounting principles generally accepted in the United States of America.
All internal control systems, no matter how well designed, have inherent limitations. Therefore, even those systems determined to be effective can provide only reasonable assurance with respect to financial statement preparation and presentation.
Management assessed the effectiveness of the Company's internal control over financial reporting as of December 31, 2024. In making this assessment, it used the criteria set forth by the Committee of Sponsoring Organizations of the Treadway Commission in Internal Control — Integrated Framework (2013). Based on our assessment, we believe that as of December 31, 2024, the Company's internal control over financial reporting is effective based on those criteria.
Management excluded from its assessment the internal control over financial reporting at Rybrook Group Limited in the U.K., which was acquired in January 2024; Jaguar/Land Rover in Italy, which was acquired in March 2024; Porsche Centre Brighton, Porsche Centre Doncaster, and Essendon Used Vehicle Dealership in Australia, which were acquired in June 2024; River States Truck and Trailer in Wisconsin and Minnesota, which was acquired in June 2024; Bill Brown Ford in Michigan, which was acquired in July 2024; and Porsche Centre Melbourne in Australia, which was acquired in December 2024. These acquisitions constitute less than 3% of total assets and less than 4% of total revenues of the Company’s consolidated financial statement amounts as of and for the year ended December 31, 2024. Accordingly, the internal control over financial reporting at the retail automotive and retail commercial truck acquisitions made during the year ended December 31, 2024 were unaudited.
The Company's independent registered public accounting firm that audited the consolidated financial statements included in the Company's Annual Report on Form 10-K has issued an audit report on the effectiveness of the Company's internal control over financial reporting. This report appears on page F-3.
Penske Automotive Group, Inc.
February 21, 2025
REPORT OF INDEPENDENT REGISTERED PUBLIC ACCOUNTING FIRM
To the Stockholders and the Board of Directors of Penske Automotive Group, Inc.
Opinions on the Financial Statements and Internal Control over Financial Reporting
We have audited the accompanying consolidated balance sheets of Penske Automotive Group, Inc. and subsidiaries (the "Company") as of December 31, 2024 and 2023, the related consolidated statements of income, comprehensive income, cash flows and equity for each of the three years in the period ended December 31, 2024, and the related notes and the schedule listed in the Index at Item 15 (collectively referred to as the "financial statements"). We also have audited the Company’s internal control over financial reporting as of December 31, 2024, based on criteria established in Internal Control — Integrated Framework (2013) issued by the Committee of Sponsoring Organizations of the Treadway Commission (COSO).
In our opinion, the financial statements referred to above present fairly, in all material respects, the financial position of the Company as of December 31, 2024 and 2023, and the results of its operations and its cash flows for each of the three years in the period ended December 31, 2024, in conformity with accounting principles generally accepted in the United States of America. Also, in our opinion, the Company maintained, in all material respects, effective internal control over financial reporting as of December 31, 2024, based on criteria established in Internal Control — Integrated Framework (2013) issued by COSO.
As described in the accompanying Management Report on Internal Control Over Financial Reporting, management excluded from its assessment the internal control over financial reporting at Rybrook Group Limited in the U.K., which was acquired in January 2024; Jaguar/Land Rover in Italy, which was acquired in March 2024; Porsche Centre Brighton, Porsche Centre Doncaster, and Essendon Used Vehicle Dealership in Australia, which were acquired in June 2024; River States Truck and Trailer in Wisconsin and Minnesota, which was acquired in June 2024; Bill Brown Ford in Michigan, which was acquired in July 2024; and Porsche Centre Melbourne in Australia, which was acquired in December 2024. These acquisitions constitute less than 3% of total assets and less than 4% of total revenues of the Company’s consolidated financial statement amounts as of and for the year ended December 31, 2024. Accordingly, our audit did not include the internal control over financial reporting at these retail automotive and retail commercial truck acquisitions made during the year ended December 31, 2024.
Basis for Opinions
The Company’s management is responsible for these financial statements, for maintaining effective internal control over financial reporting, and for its assessment of the effectiveness of internal control over financial reporting, included in the accompanying Management Report on Internal Control Over Financial Reporting. Our responsibility is to express an opinion on these financial statements and an opinion on the Company’s internal control over financial reporting based on our audits. We are a public accounting firm registered with the Public Company Accounting Oversight Board (United States) (PCAOB) and are required to be independent with respect to the Company in accordance with the U.S. federal securities laws and the applicable rules and regulations of the Securities and Exchange Commission and the PCAOB.
We conducted our audits in accordance with the standards of the PCAOB. Those standards require that we plan and perform the audits to obtain reasonable assurance about whether the financial statements are free of material misstatement, whether due to error or fraud, and whether effective internal control over financial reporting was maintained in all material respects.
Our audits of the financial statements included performing procedures to assess the risks of material misstatement of the financial statements, whether due to error or fraud, and performing procedures to respond to those risks. Such procedures included examining, on a test basis, evidence regarding the amounts and disclosures in the financial statements. Our audits also included evaluating the accounting principles used and significant estimates made by management, as well as evaluating the overall presentation of the financial statements. Our audit of internal control over financial reporting included obtaining an understanding of internal control over financial reporting, assessing the risk that a material weakness exists, and testing and evaluating the design and operating effectiveness of internal control based on the assessed risk. Our audits also included performing such other procedures as we considered necessary in the circumstances. We believe that our audits provide a reasonable basis for our opinions.
Definition and Limitations of Internal Control over Financial Reporting
A company’s internal control over financial reporting is a process designed to provide reasonable assurance regarding the reliability of financial reporting and the preparation of financial statements for external purposes in accordance with generally accepted accounting principles. A company’s internal control over financial reporting includes those policies and procedures that (1) pertain to the maintenance of records that, in reasonable detail, accurately and fairly reflect the transactions and dispositions of the assets of the company; (2) provide reasonable assurance that transactions are recorded as necessary to permit preparation of financial statements in accordance with generally accepted accounting principles, and that receipts and expenditures of the company are being made only in accordance with authorizations of management and directors of the company; and (3) provide reasonable assurance regarding prevention or timely detection of unauthorized acquisition, use, or disposition of the company’s assets that could have a material effect on the financial statements.
Because of its inherent limitations, internal control over financial reporting may not prevent or detect misstatements. Also, projections of any evaluation of effectiveness to future periods are subject to the risk that controls may become inadequate because of changes in conditions, or that the degree of compliance with the policies or procedures may deteriorate.
Critical Audit Matter
The critical audit matter communicated below is a matter arising from the current-period audit of the financial statements that was communicated or required to be communicated to the audit committee and that (1) relates to accounts or disclosures that are material to the financial statements and (2) involved our especially challenging, subjective, or complex judgments. The communication of critical audit matters does not alter in any way our opinion on the financial statements, taken as a whole, and we are not, by communicating the critical audit matter below, providing a separate opinion on the critical audit matter or on the accounts or disclosures to which it relates.
Other Indefinite-lived Intangible Assets – Refer to Notes 1 and 8 to the financial statements
Critical Audit Matter Description
The Company records indefinite-lived intangible assets from business combinations, including franchise and distribution agreements (“other indefinite-lived intangible assets”). These intangible assets are assessed for impairment as of October 1 annually through a comparison of the fair value of other indefinite-lived intangible asset to its carrying value.
The Company estimates fair value using an income approach, which requires management to make assumptions about terminal growth rates and forecasted earnings before interest, taxes, depreciation, and amortization (“EBITDA”), and to select the weighted average cost of capital for each intangible asset impairment analysis. Changes in these assumptions could have a significant effect on the fair value of these intangible assets, the amount of any impairment charge, or both.
We identified the valuation of the franchise and distribution agreements as a critical audit matter because of the significant judgments made by management to estimate the fair value of these intangible assets. This required a high degree of auditor judgment and an increased extent of effort, including the need to involve our fair value specialists when performing audit procedures to evaluate the reasonableness of management’s estimates and assumptions related to the selection of the weighted average cost of capital and terminal growth rates for these intangible assets.
How the Critical Audit Matter Was Addressed in the Audit
Our audit procedures related to the selection of the weighted average cost of capital, EBITDA, and terminal growth rates for these intangible assets included the following, among others:
•We tested the effectiveness of controls over management’s impairment evaluation, including the controls related to management’s assumptions about the terminal growth rate, EBITDA, and selection of the weighted average cost of capital.
•We evaluated the reasonableness of management's EBITDA assumption by comparing the forecasts to:
◦Historical EBITDA.
◦Forecasted information included in industry and market reports as well as information from certain of its peer companies.
•With the assistance of our fair value specialists, we evaluated the reasonableness of (1) the valuation methodology, (2) terminal growth rate, and (3) weighted average cost of capital by:
◦Testing the source information underlying the determination of the weighted average cost of capital and the mathematical accuracy of the calculation.
◦Developing a range of independent estimates and comparing those to the weighted average cost of capital selected by management.
/s/ Deloitte & Touche LLP
Detroit, Michigan
February 21, 2025
We have served as the Company's auditor since 1999.
PENSKE AUTOMOTIVE GROUP, INC.
CONSOLIDATED BALANCE SHEETS
| | | | | | | | | | | |
| December 31, |
| 2024 | | 2023 |
| (In millions, except share and
per share amounts) |
| ASSETS | | | |
| Cash and cash equivalents | $ | 72.4 | | | $ | 96.4 | |
| Accounts receivable, net of allowance for doubtful accounts of $6.3 and $6.8 | 1,002.1 | | | 1,114.6 | |
| Inventories | 4,640.2 | | | 4,293.1 | |
| Other current assets | 213.1 | | | 175.6 | |
| Total current assets | 5,927.8 | | | 5,679.7 | |
| Property and equipment, net | 3,006.2 | | | 2,765.2 | |
| Operating lease right-of-use assets | 2,467.2 | | | 2,405.5 | |
| Goodwill | 2,371.3 | | | 2,234.9 | |
| Other indefinite-lived intangible assets | 1,011.6 | | | 748.2 | |
| Equity method investments | 1,827.0 | | | 1,774.9 | |
| Other long-term assets | 109.8 | | | 63.1 | |
| Total assets | $ | 16,720.9 | | | $ | 15,671.5 | |
| LIABILITIES AND EQUITY | | | |
| Floor plan notes payable | $ | 2,535.8 | | | $ | 2,255.6 | |
| Floor plan notes payable — non-trade | 1,488.2 | | | 1,515.9 | |
| Accounts payable | 851.7 | | | 866.9 | |
| Accrued expenses and other current liabilities | 889.0 | | | 809.8 | |
| Current portion of long-term debt | 721.2 | | | 209.7 | |
| | | |
| Total current liabilities | 6,485.9 | | | 5,657.9 | |
| Long-term debt | 1,130.8 | | | 1,419.5 | |
| Long-term operating lease liabilities | 2,392.6 | | | 2,336.0 | |
| Deferred tax liabilities | 1,231.0 | | | 1,231.7 | |
| Other long-term liabilities | 253.3 | | | 270.8 | |
| Total liabilities | 11,493.6 | | | 10,915.9 | |
| Commitments and contingent liabilities (Note 11) | | | |
| Equity | | | |
| Penske Automotive Group stockholders' equity: | | | |
| Preferred Stock, $0.0001 par value; 100,000 shares authorized; none issued and outstanding | — | | | — | |
| Common Stock, $0.0001 par value, 240,000,000 shares authorized; 66,774,651 shares issued and outstanding at December 31, 2024; 67,111,181 shares issued and outstanding at December 31, 2023 | — | | | — | |
| Non-voting Common Stock, $0.0001 par value; 7,125,000 shares authorized; none issued and outstanding | — | | | — | |
| Class C Common Stock, $0.0001 par value; 20,000,000 shares authorized; none issued and outstanding | — | | | — | |
| Additional paid-in capital | 9.1 | | | — | |
| Retained earnings | 5,565.2 | | | 4,990.3 | |
| Accumulated other comprehensive loss | (364.5) | | | (264.1) | |
| Total Penske Automotive Group stockholders' equity | 5,209.8 | | | 4,726.2 | |
| Non-controlling interest | 17.5 | | | 29.4 | |
| Total equity | 5,227.3 | | | 4,755.6 | |
| Total liabilities and equity | $ | 16,720.9 | | | $ | 15,671.5 | |
See Notes to Consolidated Financial Statements.
PENSKE AUTOMOTIVE GROUP, INC.
CONSOLIDATED STATEMENTS OF INCOME
| | | | | | | | | | | | | | | | | |
| Year Ended December 31, |
| 2024 | | 2023 | | 2022 |
| (In millions, except share and per share amounts) |
| Revenue: | | | | | |
| Retail automotive dealership | $ | 26,156.2 | | $ | 25,209.1 | | $ | 23,694.7 |
| Retail commercial truck dealership | 3,521.1 | | 3,684.3 | | 3,541.3 |
| Commercial vehicle distribution and other | 777.9 | | 634.0 | | 578.8 |
| Total revenues | 30,455.2 | | 29,527.4 | | 27,814.8 |
| Cost of sales: | | | | | |
| Retail automotive dealership | 21,905.6 | | 21,032.9 | | 19,568.3 |
| Retail commercial truck dealership | 2,936.6 | | 3,091.9 | | 2,986.2 |
| Commercial vehicle distribution and other | 599.7 | | 468.8 | | 421.5 |
| Total cost of sales | 25,441.9 | | 24,593.6 | | 22,976.0 |
| Gross profit | 5,013.3 | | 4,933.8 | | 4,838.8 |
| Selling, general, and administrative expenses | 3,538.5 | | 3,400.6 | | 3,223.7 |
| Goodwill impairment charges | — | | 40.7 | | — |
| Depreciation | 158.0 | | 141.0 | | 127.3 |
| Operating income | 1,316.8 | | 1,351.5 | | 1,487.8 |
| Floor plan interest expense | (189.8) | | | (133.1) | | | (52.4) | |
| Other interest expense | (87.8) | | | (92.6) | | | (70.4) | |
| | | | | |
| | | | | |
| Equity in earnings of affiliates | 200.7 | | 293.7 | | 494.2 |
| Income before income taxes | 1,239.9 | | 1,419.5 | | 1,859.2 |
| Income taxes | (316.5) | | | (360.9) | | | (473.0) | |
| | | | | |
| | | | | |
| Net income | 923.4 | | 1,058.6 | | 1,386.2 |
| Less: Income attributable to non-controlling interests | 4.5 | | 5.4 | | 6.2 |
| Net income attributable to Penske Automotive Group common stockholders | $ | 918.9 | | $ | 1,053.2 | | $ | 1,380.0 |
| Basic earnings per share attributable to Penske Automotive Group common stockholders: | | | | | |
| | | | | |
| | | | | |
| Net income attributable to Penske Automotive Group common stockholders | $ | 13.74 | | $ | 15.50 | | $ | 18.55 |
| Shares used in determining basic earnings per share | 66,882,731 | | 67,963,956 | | 74,394,799 |
| Diluted earnings per share attributable to Penske Automotive Group common stockholders: | | | | | |
| | | | | |
| | | | | |
| Net income attributable to Penske Automotive Group common stockholders | $ | 13.74 | | $ | 15.50 | | $ | 18.55 |
| Shares used in determining diluted earnings per share | 66,882,731 | | 67,963,956 | | 74,394,799 |
| Amounts attributable to Penske Automotive Group common stockholders: | | | | | |
| Net income | $ | 923.4 | | $ | 1,058.6 | | $ | 1,386.2 |
| Less: Income attributable to non-controlling interests | 4.5 | | 5.4 | | 6.2 |
| | | | | |
| | | | | |
| Net income attributable to Penske Automotive Group common stockholders | $ | 918.9 | | $ | 1,053.2 | | $ | 1,380.0 |
| Cash dividends per share | $ | 4.09 | | $ | 2.78 | | $ | 2.07 |
See Notes to Consolidated Financial Statements.
PENSKE AUTOMOTIVE GROUP, INC.
CONSOLIDATED STATEMENTS OF COMPREHENSIVE INCOME
| | | | | | | | | | | | | | | | | |
| Year Ended December 31, |
| 2024 | | 2023 | | 2022 |
| (In millions) |
| Net income | $ | 923.4 | | | $ | 1,058.6 | | | $ | 1,386.2 | |
| Other comprehensive (loss) income, net of tax: | | | | | |
| Foreign currency translation adjustment | (91.9) | | | 66.1 | | | (154.6) | |
| | | | | |
| | | | | |
| | | | | |
| | | | | |
| Other adjustments to comprehensive income, net of tax: | (9.0) | | | 5.7 | | | (12.8) | |
| Other comprehensive (loss) income, net of tax | (100.9) | | | 71.8 | | | (167.4) | |
| Comprehensive income | 822.5 | | | 1,130.4 | | | 1,218.8 | |
| Less: Comprehensive income attributable to non-controlling interests | 4.0 | | | 6.0 | | | 5.3 | |
| Comprehensive income attributable to Penske Automotive Group common stockholders | $ | 818.5 | | | $ | 1,124.4 | | | $ | 1,213.5 | |
See Notes to Consolidated Financial Statements.
PENSKE AUTOMOTIVE GROUP, INC.
CONSOLIDATED STATEMENTS OF CASH FLOWS
| | | | | | | | | | | | | | | | | |
| Year Ended December 31, |
| 2024 | | 2023 | | 2022 |
| (In millions) |
| Operating Activities: | | | | | |
| Net income | $ | 923.4 | | | $ | 1,058.6 | | | $ | 1,386.2 | |
| Adjustments to reconcile net income to net cash from operating activities: | | | | | |
| Depreciation | 158.0 | | | 141.0 | | | 127.3 | |
| | | | | |
| Earnings of equity method investments, net of distributions | (127.9) | | | (174.6) | | | (183.3) | |
| | | | | |
| Deferred income taxes | (13.0) | | | 101.8 | | | 124.2 | |
| | | | | |
| Stock-based compensation | 29.4 | | | 28.1 | | | 26.7 | |
| Goodwill impairment charges | — | | | 40.7 | | | — | |
| Changes in operating assets and liabilities: | | | | | |
| Accounts receivable | 125.4 | | | (194.7) | | | (192.9) | |
| Inventories | (196.7) | | | (666.2) | | | (444.4) | |
| Other current assets | (43.8) | | | (29.5) | | | (36.2) | |
| Floor plan notes payable | 316.1 | | | 659.7 | | | 487.1 | |
| Accounts payable and accrued expenses | 42.9 | | | (13.0) | | | 81.7 | |
| Other | (34.0) | | | 141.7 | | | 82.6 | |
| Net cash provided by operating activities | 1,179.8 | | | 1,093.6 | | | 1,459.0 | |
| Investing Activities: | | | | | |
| Purchases of property, equipment, and improvements | (368.7) | | | (375.3) | | | (282.5) | |
| Proceeds from sale of dealerships | 82.1 | | | — | | | 13.1 | |
| Proceeds from sale of property and equipment | 26.2 | | | 30.7 | | | 32.3 | |
| Proceeds from sale of equity method investment | 20.7 | | | — | | | — | |
| Acquisitions net, including repayment of sellers' floor plan notes payable of $212.5, $24.3, and $51.3, respectively | (786.2) | | | (214.9) | | | (393.4) | |
| Other | (11.1) | | | (12.8) | | | (11.2) | |
| Net cash used in investing activities | (1,037.0) | | | (572.3) | | | (641.7) | |
| Financing Activities: | | | | | |
| Proceeds from borrowings under revolving U.S. credit agreement and mortgage facilities | 4,301.4 | | | 3,150.3 | | | 2,101.0 | |
| Repayments under revolving U.S. credit agreement and mortgage facilities | (4,182.7) | | | (3,227.8) | | | (2,101.0) | |
| | | | | |
| | | | | |
| Net cash borrowings of other debt | 113.3 | | | 73.2 | | | 160.1 | |
| Net (repayments) borrowings of floor plan notes payable — non-trade | (15.4) | | | 46.5 | | | 82.9 | |
| Repurchases of common stock | (58.7) | | | (358.7) | | | (869.3) | |
| Payments of tax withholding for stock-based compensation | (18.8) | | | (23.5) | | | (17.2) | |
| Dividends | (274.4) | | | (189.1) | | | (154.1) | |
| Payment of debt issuance costs | (1.0) | | | (2.1) | | | (0.3) | |
| Purchase of subsidiary shares from non-controlling interest | (16.7) | | | — | | | — | |
| Other | (11.7) | | | 0.1 | | | (0.1) | |
| Net cash used in financing activities | (164.7) | | | (531.1) | | | (798.0) | |
| | | | | |
| | | | | |
| | | | | |
| Effect of exchange rate changes on cash and cash equivalents | (2.1) | | | (0.3) | | | (13.5) | |
| Net change in cash and cash equivalents | (24.0) | | | (10.1) | | | 5.8 | |
| Cash and cash equivalents, beginning of period | 96.4 | | | 106.5 | | | 100.7 | |
| Cash and cash equivalents, end of period | $ | 72.4 | | | $ | 96.4 | | | $ | 106.5 | |
| Supplemental disclosures of cash flow information: | | | | | |
| Cash paid for: | | | | | |
| Interest | $ | 271.6 | | | $ | 214.3 | | | $ | 112.8 | |
| Income taxes | 317.4 | | | 288.1 | | | 343.4 | |
| Non-cash activities: | | | | | |
| Receivable from sale of investment | $ | 10.4 | | | $ | — | | | $ | — | |
See Notes to Consolidated Financial Statements.
PENSKE AUTOMOTIVE GROUP, INC.
CONSOLIDATED STATEMENTS OF EQUITY
| | | | | | | | | | | | | | | | | | | | | | | | | | | | | | | | | | | | | | | | | | | | | | | |
| Voting and Non-voting
Common Stock | | Additional
Paid-in Capital | | Retained Earnings | | Accumulated Other Comprehensive Loss | | Total
Penske Automotive Group
Stockholders' Equity | | Non-controlling
Interest | | Total
Equity |
| Issued
Shares | | Amount | |
| (Dollars in millions) |
| Balance, January 1, 2022 | 77,574,172 | | | $ | — | | | $ | 42.2 | | | $ | 4,196.6 | | | $ | (168.8) | | | $ | 4,070.0 | | | $ | 25.0 | | | $ | 4,095.0 | |
| Penske Transportation Solutions adoption of ASC 842 | — | | | — | | | — | | | (121.6) | | | — | | | (121.6) | | | — | | | (121.6) | |
| Equity compensation | 321,866 | | | — | | | 26.7 | | | — | | | — | | | 26.7 | | | — | | | 26.7 | |
| Repurchases of common stock | (8,214,147) | | | — | | | (68.9) | | | (817.6) | | | — | | | (886.5) | | | — | | | (886.5) | |
| Dividends ($2.07 per share) | — | | | — | | | — | | | (154.1) | | | — | | | (154.1) | | | — | | | (154.1) | |
| Distributions to non-controlling interest | — | | | — | | | — | | | — | | | — | | | — | | | (3.5) | | | (3.5) | |
| Foreign currency translation | — | | | — | | | — | | | — | | | (153.7) | | | (153.7) | | | (0.9) | | | (154.6) | |
| Other | — | | | — | | | — | | | — | | | (12.8) | | | (12.8) | | | — | | | (12.8) | |
| Net income | — | | | — | | | — | | | 1,380.0 | | | — | | | 1,380.0 | | | 6.2 | | | 1,386.2 | |
| Balance, December 31, 2022 | 69,681,891 | | | — | | | — | | | 4,483.3 | | | (335.3) | | | 4,148.0 | | | 26.8 | | | 4,174.8 | |
| Equity compensation | 237,906 | | | — | | | 28.1 | | | — | | | — | | | 28.1 | | | — | | | 28.1 | |
| Repurchases of common stock | (2,808,616) | | | — | | | (28.1) | | | (357.1) | | | — | | | (385.2) | | | — | | | (385.2) | |
| Dividends ($2.78 per share) | — | | | — | | | — | | | (189.1) | | | — | | | (189.1) | | | — | | | (189.1) | |
| Distributions to non-controlling interest | — | | | — | | | — | | | — | | | — | | | — | | | (3.4) | | | (3.4) | |
| Foreign currency translation | — | | | — | | | — | | | — | | | 65.5 | | | 65.5 | | | 0.6 | | | 66.1 | |
| Other | — | | | — | | | — | | | — | | | 5.7 | | | 5.7 | | | — | | | 5.7 | |
| Net income | — | | | — | | | — | | | 1,053.2 | | | — | | | 1,053.2 | | | 5.4 | | | 1,058.6 | |
| Balance, December 31, 2023 | 67,111,181 | | | — | | | — | | | 4,990.3 | | | (264.1) | | | 4,726.2 | | | 29.4 | | | 4,755.6 | |
| Equity compensation | 180,715 | | | — | | | 29.4 | | | — | | | — | | | 29.4 | | | — | | | 29.4 | |
| Repurchases of common stock | (517,245) | | | — | | | (16.7) | | | (61.3) | | | — | | | (78.0) | | | — | | | (78.0) | |
| Dividends ($4.09 per share) | — | | | — | | | — | | | (274.4) | | | — | | | (274.4) | | | — | | | (274.4) | |
| Purchase of subsidiary shares from non-controlling interest | — | | | — | | | (3.6) | | | — | | | — | | | (3.6) | | | (13.1) | | | (16.7) | |
| Distributions to non-controlling interest | — | | | — | | | — | | | — | | | — | | | — | | | (2.8) | | | (2.8) | |
| Foreign currency translation | — | | | — | | | — | | | — | | | (91.4) | | | (91.4) | | | (0.5) | | | (91.9) | |
| Other | — | | | — | | | — | | | (8.3) | | | (9.0) | | | (17.3) | | | — | | | (17.3) | |
| Net income | — | | | — | | | — | | | 918.9 | | | — | | | 918.9 | | | 4.5 | | | 923.4 | |
| Balance, December 31, 2024 | 66,774,651 | | | $ | — | | | $ | 9.1 | | | $ | 5,565.2 | | | $ | (364.5) | | | $ | 5,209.8 | | | $ | 17.5 | | | $ | 5,227.3 | |
See Notes to Consolidated Financial Statements.
PENSKE AUTOMOTIVE GROUP, INC.
NOTES TO CONSOLIDATED FINANCIAL STATEMENTS
(In millions, except share and per share amounts)
1. Organization and Summary of Significant Accounting Policies
Unless the context otherwise requires, the use of the terms "PAG," "we," "us," and "our" in these Notes to the Consolidated Financial Statements refers to Penske Automotive Group, Inc. and its consolidated subsidiaries.
Business Overview and Concentrations
We are a diversified international transportation services company and one of the world's premier automotive and commercial truck retailers. We operate dealerships in the United States, the United Kingdom, Canada, Germany, Italy, Japan, and Australia, and we are one of the largest retailers of commercial trucks in North America for Freightliner. We also distribute and retail commercial vehicles, diesel and gas engines, power systems, and related parts and services principally in Australia and New Zealand. Additionally, we own 28.9% of Penske Transportation Solutions, a business that manages one of the largest, most comprehensive and modern trucking fleets in North America with trucks, tractors, and trailers under lease, rental, and/or maintenance contracts, and provides innovative transportation, supply chain, and technology solutions to its customers.
Retail Automotive. As of December 31, 2024, we operated 353 retail automotive franchised dealerships, of which 148 are located in the U.S. and 205 are located outside of the U.S., principally in the U.K. As of December 31, 2024, we also operated 16 used vehicle dealerships, with six dealerships in the U.S. operating under the brand name CarShop, nine dealerships in the U.K. operating under the brand name Sytner Select, and one dealership in Australia operating under the brand name Penske Select.
In addition to selling new and used vehicles, we generate higher-margin revenue at each of our dealerships through maintenance and repair services, the sale and placement of third-party finance and insurance products, third-party extended service and maintenance contracts, replacement and aftermarket automotive products, and at certain of our locations, collision repair services. We operate our franchised dealerships under franchise agreements with a number of automotive manufacturers and distributors that are subject to certain rights and restrictions typical of the industry. Some of our dealerships in the U.K. and Europe operate under an agency model where we receive a fee for facilitating the sale by the manufacturer of a new vehicle but do not hold the vehicle in inventory. Vehicles sold under this agency model are counted as new agency units sold instead of new retail units sold by us, and only the fee we receive from the manufacturer, not the price of the vehicle, is reported as new revenue with no corresponding cost of sale.
During 2024, we acquired 16 retail automotive franchises and opened one retail automotive franchise in the U.K., acquired two franchises and one Chrysler/Jeep/Dodge/Ram dealership in the U.S., acquired two retail automotive franchises in Italy, acquired three retail automotive franchises and one used vehicle dealership in Australia, and opened one retail automotive franchise in Germany.
During 2024, in the U.S., we closed one Jaguar franchise, one Chrysler/Jeep/Dodge/Ram dealership, one used vehicle dealership, and sold one Lexus franchise. In the U.K., we closed two Jaguar franchises, two Land Rover franchises, two Audi franchises, one Mercedes-Benz franchise, one used vehicle dealership, and sold two used vehicle dealerships. During 2024, we also transitioned our U.K. CarShop locations to Sytner Select dealerships, incorporating them within the broader Sytner network. The impact from the sale and closure of these dealerships was not material to the Consolidated Statements of Income for the year ended December 31, 2024.
Retail Commercial Truck Dealership. We operate Premier Truck Group ("PTG"), a heavy- and medium-duty truck dealership group offering primarily Freightliner and Western Star trucks (both Daimler brands), with locations across 10 U.S. states and the Canadian provinces of Ontario and Manitoba. As of December 31, 2024, PTG operated 45 locations selling new and/or used trucks, performing service and parts operations, or offering collision repair services.
Penske Australia. Penske Australia is the exclusive importer and distributor of Western Star heavy-duty trucks (a Daimler brand), MAN heavy- and medium-duty trucks and buses (a VW Group brand), and Dennis Eagle refuse collection vehicles, together with associated parts, across Australia, New Zealand, and portions of the Pacific. In most of these same markets, we are also a leading distributor of diesel and gas engines and power systems, principally representing MTU (a Rolls-Royce solution), Detroit Diesel, Allison Transmission, and Bergen Engines. Penske Australia offers products across
PENSKE AUTOMOTIVE GROUP, INC.
NOTES TO CONSOLIDATED FINANCIAL STATEMENTS (Continued)
(In millions, except share and per share amounts)
the on- and off-highway markets, including in the trucking, mining, power generation, energy solutions, defense, marine, rail, and construction sectors and supports full parts and aftersales service through a network of branches, field service locations, and dealers across the region.
Penske Transportation Solutions. We hold a 28.9% ownership interest in Penske Truck Leasing Co., L.P. ("PTL"). PTL is owned 41.1% by Penske Corporation, 28.9% by us, and 30.0% by Mitsui & Co., Ltd. ("Mitsui"). We account for our investment in PTL under the equity method, and we therefore record our share of PTL's earnings on our statements of income under the caption "Equity in earnings of affiliates," which also includes the results of our other equity method investments. Penske Transportation Solutions ("PTS") is the universal brand name for PTL's various business lines through which it is capable of meeting customers' needs across the supply chain with a broad product offering that includes full-service truck leasing, truck rental, and contract maintenance along with logistics services, such as dedicated contract carriage, distribution center management, freight management, and dry van truckload carrier services.
Basis of Presentation
The consolidated financial statements include all majority-owned subsidiaries. Investments in affiliated companies, representing an ownership interest in the voting stock of the affiliate of between 20% and 50% or an investment in a limited partnership or a limited liability corporation for which our investment is more than minor, are stated at the cost of acquisition plus our equity in undistributed net earnings since acquisition. All intercompany accounts and transactions have been eliminated in consolidation.
Estimates
The preparation of financial statements in accordance with accounting principles generally accepted in the United States of America requires management to make estimates and assumptions that affect the reported amounts of assets and liabilities, the disclosure of contingent assets and liabilities at the date of the financial statements, and the reported amounts of revenues and expenses during the reporting period. Actual results could differ from those estimates. The accounts requiring the use of estimates include accounts receivable, inventories, income taxes, intangible assets, leases, and certain reserves.
Cash and Cash Equivalents
Cash and cash equivalents include all highly liquid investments that have an original maturity of three months or less at the date of purchase.
Contracts in Transit
Contracts in transit represent receivables from unaffiliated finance companies relating to the sale of customers' installment sales and lease contracts arising in connection with the sale of a vehicle by us. Contracts in transit, included in accounts receivable, net in our consolidated balance sheets, amounted to $281.7 million and $361.9 million as of December 31, 2024, and 2023, respectively.
Inventory Valuation
Inventories are stated at the lower of cost or net realizable value. Cost for new and used vehicle inventories includes acquisition, reconditioning, dealer installed accessories, and transportation expenses and is determined using the specific identification method. Inventories of dealership parts and accessories are accounted for using the “first-in, first-out” (“FIFO”) method of inventory accounting, and the cost is based on factory list prices.
Property and Equipment
Property and equipment are recorded at cost and depreciated over estimated useful lives using the straight-line method. Useful lives for purposes of computing depreciation for assets, other than leasehold improvements, range between 2 and 15 years. Leasehold improvements and equipment under capital leases are depreciated over the shorter of the term of the lease or the estimated useful life of the asset, not to exceed 40 years.
PENSKE AUTOMOTIVE GROUP, INC.
NOTES TO CONSOLIDATED FINANCIAL STATEMENTS (Continued)
(In millions, except share and per share amounts)
Expenditures relating to recurring repair and maintenance are expensed as incurred. Expenditures that increase the useful life or substantially increase the serviceability of an existing asset are capitalized. When equipment is sold or otherwise disposed of, the cost and related accumulated depreciation are removed from the balance sheet, with any resulting gain or loss being reflected in income.
Income Taxes
Tax regulations may require items to be included in our tax return at different times than when those items are reflected in our financial statements. Some of the differences are permanent, such as expenses that are not deductible on our tax return, and some are temporary differences, such as the timing of depreciation expense. Temporary differences create deferred tax assets and liabilities. Deferred tax assets generally represent items that will be used as a tax deduction or credit in our tax return in future years which we have already recorded in our financial statements. Deferred tax liabilities generally represent deductions taken on our tax return that have not yet been recognized as an expense in our financial statements. We establish valuation allowances for our deferred tax assets if the amount of expected future taxable income is not more likely than not to allow for the use of the deduction or credit.
Refer to Note 16 "Income Taxes" for additional detail on our accounting for income taxes.
Intangible Assets
Our principal intangible assets relate to our agreements with vehicle manufacturers and distributors, which represent the estimated value of franchises acquired in business combinations; our distribution agreements with commercial vehicle manufacturers, which represent the estimated value of distribution rights acquired in business combinations; and goodwill, which represents the excess of cost over the fair value of tangible and identified intangible assets acquired in business combinations. We believe the franchise values of our automotive dealerships and the distribution agreements of our commercial vehicle distribution operations have an indefinite useful life based on the following:
•Automotive retailing and commercial vehicle distribution are mature industries and are based on franchise, agency, and distribution agreements with the vehicle manufacturers and distributors;
•Certain franchise agreement terms are indefinite;
•Franchise and distribution agreements that have limited terms have historically been renewed by us without substantial cost; and
•Manufacturers and distributors have not historically terminated our agreements.
Impairment Testing
Other indefinite-lived intangible assets are assessed for impairment annually on October 1 and upon the occurrence of an indicator of impairment through a comparison of its fair value to its carrying value. An indicator of impairment exists if the carrying value exceeds its fair value, and an impairment loss may be recognized up to that excess. We also evaluate in connection with the annual impairment testing whether events and circumstances continue to support our assessment that the other indefinite-lived intangible assets continue to have an indefinite life.
Goodwill impairment is assessed at the reporting unit level annually on October 1 and upon the occurrence of an indicator of impairment. Our operations are organized by management into operating segments by line of business and geography. We have determined that we have four reportable segments as defined in generally accepted accounting principles for segment reporting: (i) Retail Automotive, consisting of our retail automotive dealership operations; (ii) Retail Commercial Truck, consisting of our retail commercial truck dealership operations in the U.S. and Canada; (iii) Other, consisting of our commercial vehicle and power systems distribution operations; and (iv) Non-Automotive Investments, consisting of our equity method investments in non-automotive operations which includes our investment in PTS and other various investments. We have determined that the dealerships in each of our operating segments within the Retail Automotive reportable segment are components that were aggregated into two reporting units for the purpose of goodwill impairment testing as of October 1, 2024, as they (A) have similar economic characteristics (all are automotive dealerships having similar margins), (B) offer similar products and services (all sell new and/or used vehicles, service, parts, and third-party finance and insurance products), (C) have similar target markets and customers (generally individuals), and (D) have
PENSKE AUTOMOTIVE GROUP, INC.
NOTES TO CONSOLIDATED FINANCIAL STATEMENTS (Continued)
(In millions, except share and per share amounts)
similar distribution and marketing practices (all distribute products and services through dealership facilities that market to customers in similar fashions). The reporting units are United States Retail Automotive and International Retail Automotive. Our Retail Commercial Truck reportable segment has been determined to represent one operating segment and reporting unit. The goodwill included in our Other reportable segment relates primarily to our commercial vehicle distribution operating segment. There is no goodwill recorded in our Non-Automotive Investments reportable segment.
Refer to Note 8 "Intangible Assets" for detail on our impairment testing.
Investments
We account for each of our investments under the equity method, pursuant to which we record our proportionate share of the investee's income each period. The net book value of our investments was $1,827.0 million and $1,774.9 million as of December 31, 2024, and 2023, respectively, including $1,803.9 million and $1,725.1 million relating to PTS as of December 31, 2024, and 2023, respectively. We currently hold a 28.9% ownership interest in PTS.
Foreign Currency Translation
For all of our non-U.S. operations, the functional currency is the local currency. The revenue and expense accounts of our non-U.S. operations are translated into U.S. dollars using the average exchange rates that prevailed during the period. Assets and liabilities of non-U.S. operations are translated into U.S. dollars using period end exchange rates. Cumulative translation adjustments relating to foreign functional currency assets and liabilities are recorded in accumulated other comprehensive income (loss), a separate component of equity.
Foreign currency translation gains and losses related to intercompany loans with foreign subsidiaries determined to be repayable are included in selling, general, and administrative expenses on the consolidated statements of income. For long-term intercompany loans with foreign subsidiaries, for which repayment has not been scheduled or planned, foreign currency gains and losses are included in accumulated other comprehensive loss on the consolidated balance sheets.
Fair Value of Financial Instruments
Accounting standards define fair value as the price that would be received from selling an asset, or paid to transfer a liability in the principal or most advantageous market for the asset or liability, in an orderly transaction between market participants at the measurement date. Accounting standards establish a fair value hierarchy which requires an entity to maximize the use of observable inputs and minimize the use of unobservable inputs when measuring fair value and also establishes the following three levels of inputs that may be used to measure fair value:
| | | | | |
| Level 1 | Quoted prices in active markets for identical assets or liabilities |
| Level 2 | Observable inputs other than Level 1 prices such as quoted prices for similar assets or liabilities, quoted market prices in markets that are not active, or model-derived valuations or other inputs that are observable or can be corroborated by observable market data for substantially the full term of the assets or liabilities |
| Level 3 | Unobservable inputs that are supported by little or no market activity and that are significant to the fair value of the assets or liabilities |
Our financial instruments consist of cash and cash equivalents, debt, floor plan notes payable, and forward exchange contracts used to hedge future cash flows. Other than our fixed rate debt, the carrying amount of all significant financial instruments approximates fair value due either to length of maturity, the existence of variable interest rates that approximate prevailing market rates, or as a result of mark to market accounting.
PENSKE AUTOMOTIVE GROUP, INC.
NOTES TO CONSOLIDATED FINANCIAL STATEMENTS (Continued)
(In millions, except share and per share amounts)
Our fixed rate debt consists of amounts outstanding under our senior subordinated notes and mortgage facilities. We estimate the fair value of our senior unsecured notes using quoted prices for the identical liability (Level 2), and we estimate the fair value of our mortgage facilities using a present value technique based on our current market interest rates for similar types of financial instruments (Level 2). A summary of our fixed rate debt is as follows:
| | | | | | | | | | | | | | | | | | | | | | | |
| December 31, 2024 | | December 31, 2023 |
| Carrying Value | | Fair Value | | Carrying Value | | Fair Value |
| 3.50% senior subordinated notes due 2025 | $ | 549.1 | | | $ | 543.0 | | | $ | 547.7 | | | $ | 529.7 | |
| 3.75% senior subordinated notes due 2029 | 496.6 | | | 451.8 | | | 495.8 | | | 444.4 | |
Mortgage facilities (1) | 474.8 | | | 450.6 | | | 402.1 | | | 378.5 | |
| _____________________ | | | | | | | |
(1)In addition to fixed rate debt, our mortgage facilities also include a revolving mortgage facility with Toyota Motor Credit Corporation in the U.S. and other revolving mortgage facilities that bear interest at variable rates. The fair value equals the carrying value. |
Revenue Recognition
Dealership Vehicle, Parts, and Service Sales
We record revenue for vehicle sales at a point in time when vehicles are delivered, which is when the transfer of title, risks and rewards of ownership, and control are considered passed to the customer. For dealerships operating under a franchise model, the amount of consideration we receive for vehicle sales is stated within the executed contract with our customer and is reduced by any non-cash consideration representing the fair value of trade-in vehicles, if applicable. We record revenue for vehicle service and collision work over time as work is completed and when parts are delivered to our customers. Sales promotions that we offer to customers are accounted for as a reduction of revenues at the time of sale. Rebates and other incentives offered directly to us by manufacturers are recognized as a reduction in the cost of sales. Reimbursements of qualified advertising expenses are treated as a reduction of selling, general, and administrative expenses. The amounts received under certain manufacturer rebate and incentive programs are based on the attainment of program objectives, and such earnings are recognized either upon the sale of the vehicle for which the award was received or upon attainment of the particular program goals if not associated with individual vehicles.
Dealership Finance and Insurance Sales
Subsequent to the sale of a vehicle to a customer, we sell installment sale contracts to various financial institutions on a non-recourse basis (with specified exceptions). We receive a commission from the lender equal to either the difference between the interest rate charged to the customer and the interest rate set by the financing institution or a flat fee. We also receive commissions for facilitating the sale of various products to customers, including vehicle protection products, vehicle theft protection, and extended service contracts. These commissions are recorded as revenue at a point in time when the customer enters into the contract. Payment is typically due and collected within 30 days subsequent to the execution of the contract with the customer. In the case of finance contracts, a customer may prepay or fail to pay their contract, thereby terminating the contract. Customers may also terminate extended service contracts and other insurance products, which are fully paid at purchase, and become eligible for refunds of unused premiums. In these circumstances, a portion of the commissions we received may be charged back based on the terms of the contracts. The revenue we record relating to these transactions is net of an estimate of the amount of chargebacks we will be required to pay. Our estimate is based upon our historical experience with similar contracts, including the impact of refinance and default rates on retail finance contracts and cancellation rates on extended service contracts and other insurance products. Aggregate reserves relating to chargeback activity were $48.2 million and $42.7 million as of December 31, 2024, and December 31, 2023, respectively.
Commercial Vehicle Distribution and Other
We record revenue from the distribution of vehicles, engines, and other products at a point in time when delivered, which is when the transfer of title, risks and rewards of ownership, and control are considered passed to the customer. We
PENSKE AUTOMOTIVE GROUP, INC.
NOTES TO CONSOLIDATED FINANCIAL STATEMENTS (Continued)
(In millions, except share and per share amounts)
record revenue for service or repair work as work is completed and when parts are delivered to our customers. For our long-term power generation contracts, we record revenue as services are provided in accordance with contract milestones.
Refer to Note 2 “Revenues” for additional disclosures on revenue recognition.
Defined Contribution Plans
We sponsor a number of defined contribution plans covering a significant majority of our employees. Our contributions to such plans are discretionary and are based on the level of compensation and contributions by plan participants. We incurred expenses of $40.2 million, $39.2 million, and $36.1 million relating to such plans during the years ended December 31, 2024, 2023, and 2022, respectively.
Advertising
Advertising costs are expensed as incurred or when such advertising takes place. We incurred net advertising costs of $134.4 million, $135.9 million, and $122.0 million during the years ended December 31, 2024, 2023, and 2022, respectively. Qualified advertising expenditures reimbursed by manufacturers, which are treated as a reduction of advertising expense, were $19.3 million, $17.8 million, and $16.4 million during the years ended December 31, 2024, 2023, and 2022, respectively.
Self-Insurance
We retain risk relating to certain of our general liability insurance, workers' compensation insurance, vehicle physical damage insurance, property insurance, information security risk insurance, directors' and officers' insurance, and employee medical benefits in the U.S. As a result, we are likely to be responsible for a significant portion of the claims and losses incurred under these programs. The amount of risk we retain varies by program, and for certain exposures, we either have no insurance or we have pre-determined maximum loss limits for certain individual claims and/or insurance periods. Losses, if any, above the pre-determined loss limits are paid by third-party insurance carriers. Certain insurers have limited available property coverage in response to the natural catastrophes experienced in recent years. Our estimate of future losses is prepared by management using our historical loss experience and industry-based development factors. Aggregate reserves relating to retained risk were $33.1 million and $33.2 million as of December 31, 2024, and 2023, respectively.
Earnings Per Share
Basic earnings per share is computed by dividing net income attributable to common stockholders by the number of weighted average shares of voting common stock outstanding, including unvested restricted stock awards which contain rights to non-forfeitable dividends. Diluted earnings per share is computed by dividing net income attributable to common stockholders by the number of weighted average shares of voting common stock outstanding, adjusted for the dilutive impact of unissued shares paid to directors during the year as compensation.
A reconciliation of the number of shares used in the calculation of basic and diluted earnings per share for the years ended December 31, 2024, 2023, and 2022 follows:
| | | | | | | | | | | | | | | | | |
| Year Ended December 31, |
| 2024 | | 2023 | | 2022 |
| | | | | |
| Weighted average number of common shares outstanding | 66,882,731 | | | 67,963,956 | | | 74,394,799 | |
| Effect of non-participatory equity compensation | — | | | — | | | — | |
| Weighted average number of common shares outstanding, including effect of dilutive securities | 66,882,731 | | | 67,963,956 | | | 74,394,799 | |
PENSKE AUTOMOTIVE GROUP, INC.
NOTES TO CONSOLIDATED FINANCIAL STATEMENTS (Continued)
(In millions, except share and per share amounts)
Hedging
Generally accepted accounting principles relating to derivative instruments and hedging activities require all derivatives, whether designated in hedging relationships or not, to be recorded on the balance sheet at fair value. These accounting principles also define requirements for designation and documentation of hedging relationships as well as ongoing effectiveness assessments, which must be met in order to qualify for hedge accounting. For a derivative that does not qualify as a hedge, changes in fair value are recorded in earnings immediately. If the derivative is designated as a fair-value hedge, the changes in the fair value of the derivative and the hedged item are recorded in earnings. If the derivative is designated as a cash-flow hedge, effective changes in the fair value of the derivative are recorded in accumulated other comprehensive income (loss), a separate component of equity, and recorded in the income statement only when the hedged item affects earnings. Changes in the fair value of the derivative attributable to hedge ineffectiveness are recorded in earnings immediately.
Stock-Based Compensation
Generally accepted accounting principles relating to share-based payments require us to record compensation expense for all awards based on their grant-date fair value. Our share-based payments have generally been in the form of “non-vested shares,” the fair value of which are measured as if they were vested and issued on the grant date.
Recent Accounting Pronouncements
Reference Rate Reform
In March 2020, the FASB issued ASU 2020-04, "Reference Rate Reform (Topic 848): Facilitation of the Effects of Reference Rate Reform on Financial Reporting." This ASU provided optional guidance for a limited time to ease the potential burden in accounting for reference rate reform. The guidance provided optional expedients and exceptions for applying U.S. GAAP to contracts, hedging relationships, and other transactions affected by reference rate reform if certain criteria are met. The amendments apply only to contracts and hedging relationships that reference the London Interbank Offered Rate ("LIBOR") or another reference rate expected to be discontinued due to reference rate reform. Additionally, entities can elect to continue applying hedge accounting for hedging relationships affected by reference rate reform if certain conditions are met. In January 2021, the FASB issued ASU 2021-01, "Reference Rate Reform (Topic 848): Scope." This ASU refines the scope of ASC 848 and clarifies some of its guidance as part of the Board's monitoring of global reference rate reform activities. The ASU permits entities to elect certain optional expedients and exceptions when accounting for derivative contracts and certain hedging relationships affected by changes in the interest rates used for discounting cash flows, for computing variation margin settlements, and for calculating price alignment interest in connection with reference rate reform activities. In December 2022, the FASB issued ASU 2022-06, "Reference Rate Reform (Topic 848): Deferral of the Sunset Date of Topic 848." This ASU defers the sunset date of Topic 848 from December 31, 2022, to December 31, 2024, after which entities will no longer be permitted to apply the relief in Topic 848. These new standards were effective upon issuance and generally can be applied to applicable contract modifications. While some of our floorplan arrangements and certain credit agreements had historically used LIBOR as a benchmark for calculating the applicable interest rate, all of our agreements previously utilizing LIBOR transitioned to an alternative benchmark rate on or before July 1, 2023. These changes have not had a significant impact on our consolidated financial position, results of operations, and cash flows.
Segment Reporting
In November 2023, the FASB issued ASU 2023-07, "Segment Reporting (Topic 280): Improvements to Reportable Segment Disclosures." This ASU expands public entities’ segment disclosures by requiring disclosure of significant segment expenses that are regularly provided to the chief operating decision maker and included within each reported measure of segment profit or loss and also requires that public entities provide all annual disclosures about a reportable segment’s profit or loss and assets in interim periods. This ASU is effective for financial statements issued for annual periods beginning after December 15, 2023, and interim periods within fiscal years beginning after December 15, 2024. Early adoption was permitted. The amendments should be applied retrospectively to all prior periods presented in the financial statements. We adopted this ASU on the effective date for our first annual period beginning on January 1, 2024.
PENSKE AUTOMOTIVE GROUP, INC.
NOTES TO CONSOLIDATED FINANCIAL STATEMENTS (Continued)
(In millions, except share and per share amounts)
Other than the revised presentation of our “Segment Information” footnote, the adoption of this accounting standard update has not had a material impact on our consolidated financial statements and disclosures.
Income Taxes
In December 2023, the FASB issued ASU 2023-09, "Income Taxes (Topic 740): Improvements to Income Tax Disclosures." This ASU expands public entities’ annual income tax disclosures by requiring disclosure of specific categories in the rate reconciliation and disclosure of additional information for reconciling items that meet a quantitative threshold. This ASU is effective for financial statements issued for annual periods beginning after December 15, 2024, with early adoption permitted. The amendments should be applied on a prospective basis with retrospective application permitted. We are currently evaluating the impact of adopting this ASU on our consolidated financial statements and disclosures.
Disaggregation of Income Statement Expenses
In November 2024, the FASB issued ASU 2024-03, "Income Statement—Reporting Comprehensive Income—Expense Disaggregation Disclosures (Subtopic 220-40): Disaggregation of Income Statement Expenses." This ASU requires public business entities to disclose in the notes to financial statements specific categories within relevant expense captions presented on the face of the income statement. The ASU is effective for annual reporting periods beginning after December 15, 2026, and interim reporting periods beginning after December 15, 2027. Early adoption is permitted. The amendments should be applied on a prospective basis with retrospective application permitted. We are currently evaluating the impact of adopting this ASU on our consolidated financial statements and disclosures.
2. Revenues
Automotive and commercial truck dealerships generate the majority of our revenues. New and used vehicle revenues typically include sales to retail customers, to fleet customers, and to leasing companies providing consumer leasing. We generate finance and insurance revenues from sales of third-party extended service contracts, sales of third-party insurance policies, commissions relating to the sale of finance and lease contracts to third parties, and the sales of certain other products. Service and parts revenues include fees paid by customers for repair, maintenance and collision services, and the sale of replacement parts and other aftermarket accessories as well as warranty repairs that are reimbursed directly by various vehicle manufacturers. Revenues are recognized upon satisfaction of our performance obligations under contracts with our customers and are measured at the amount of consideration we expect to be entitled to in exchange for transferring goods or providing services. A discussion of revenue recognition by reportable segment is included below.
Retail Automotive and Retail Commercial Truck Dealership Revenue Recognition
Dealership Vehicle Sales. We record revenue for vehicle sales at a point in time when vehicles are delivered, which is when the transfer of title, risks and rewards of ownership, and control are considered passed to the customer. The amount of consideration we receive for vehicle sales, including any non-cash consideration representing the fair value of trade-in vehicles if applicable, is stated within the executed contract with our customer. Payment is typically due and collected within 30 days subsequent to transfer of control of the vehicle. For dealerships operating under an agency model, we receive a commission for each vehicle sale that we facilitate under the terms of the agency agreement with the manufacturer, which is recorded as new vehicle revenue.
Dealership Parts and Service Sales. We record revenue for vehicle service and collision work over time as work is completed and when parts are delivered to our customers. For service and parts revenues recorded over time, we utilize a method that considers total costs incurred to date and the applicable margin in relation to total expected efforts to complete our performance obligation in order to determine the appropriate amount of revenue to recognize over time. Recognition of this revenue over time reflects the amount of consideration we expect to be entitled to for the transfer of goods and services performed to date, representative of the amount for which we have a right to payment. The amount of consideration we receive for parts and service sales, including collision repair work, is based upon labor hours expended and parts utilized to perform and complete the necessary services to our customers. Payment is typically due upon delivery or within a period of time shortly thereafter. We receive payment from our customers upon transfer of control or within a period typically less
PENSKE AUTOMOTIVE GROUP, INC.
NOTES TO CONSOLIDATED FINANCIAL STATEMENTS (Continued)
(In millions, except share and per share amounts)
than 30 days subsequent to the completion of services for the customer. We allow for customer returns of parts sales up to 30 days after the sale.
Dealership Finance and Insurance Sales. Subsequent to the sale of a vehicle to a customer, we sell installment sale contracts to various financial institutions on a non-recourse basis (with specified exceptions). We receive a commission from the lender equal to either the difference between the interest rate charged to the customer and the interest rate set by the financing institution or a flat fee. We also receive commissions for facilitating the sale of various products to customers, including vehicle protection products, vehicle theft protection, and extended service contracts. These commissions are recorded as revenue at a point in time when the customer enters into the contract. Payment is typically due and collected within 30 days subsequent to the execution of the contract with the customer.
In the case of finance contracts, a customer may prepay or fail to pay their contract, thereby terminating the contract. Customers may also terminate extended service contracts and other insurance products, which are fully paid at purchase, and become eligible for refunds of unused premiums. In these circumstances, a portion of the commissions we received may be charged back based on the terms of the contracts. The revenue we record relating to these transactions is net of an estimate of the amount of chargebacks we will be required to pay. Our estimate is based upon our historical experience with similar contracts, including the impact of refinance and default rates on retail finance contracts and cancellation rates on extended service contracts and other insurance products. Aggregate reserves relating to chargeback activity were $48.2 million and $42.7 million as of December 31, 2024, and December 31, 2023, respectively.
Commercial Vehicle Distribution and Other Revenue Recognition
Penske Australia. We record revenue from the distribution of vehicles and other products at a point in time when delivered, which is when the transfer of title, risks and rewards of ownership, and control are considered passed to the customer. We record revenue for service or repair work over time as work is completed and when parts are delivered to our customers. For service and parts revenues recorded over time, we utilize a method that considers total costs incurred to date and the applicable margin in relation to total expected efforts to complete our performance obligation in order to determine the appropriate amount of revenue to recognize over time. Recognition of this revenue over time reflects the amount of consideration we expect to be entitled to for the transfer of goods and services performed to date, representative of the amount for which we have a right to payment.
The amount of consideration we receive for vehicle and product sales is stated within the executed contract with our customer. The amount of consideration we receive for parts and service sales is based upon labor hours expended and parts utilized to perform and complete the necessary services to our customers. Payment is typically due upon delivery, upon invoice, or within a period of time shortly thereafter. We receive payment from our customers upon transfer of control or within a period typically within 45 days subsequent to transfer of control or invoice.
We record revenue from the distribution of engines and other products at a point in time when delivered, which is when the transfer of title, risks and rewards of ownership, and control are considered passed to the customer. We record revenue for service or repair work over time as work is completed and when parts are delivered to our customers. For service and parts revenues recorded over time, we utilize a method that considers total costs incurred to date and the applicable margin in relation to total expected efforts to complete our performance obligation in order to determine the appropriate amount of revenue to recognize over time. Recognition of revenue over time reflects the amount of consideration we expect to be entitled to for the transfer of goods and services performed to date, representative of the amount for which we have a right to payment.
For our long-term power generation contracts, we record revenue over time as services are provided in accordance with contract milestones, which is considered an output method that requires judgment to determine our progress towards contract completion and the corresponding amount of revenue to recognize. Any revisions to estimates related to revenues or costs to complete contracts are recorded in the period in which the revisions to estimates are identified and the amounts can be reasonably estimated.
The amount of consideration we receive for engine, product, and power generation sales is stated within the executed contract with our customer. The amount of consideration we receive for service sales is based upon labor hours expended
PENSKE AUTOMOTIVE GROUP, INC.
NOTES TO CONSOLIDATED FINANCIAL STATEMENTS (Continued)
(In millions, except share and per share amounts)
and parts utilized to perform and complete the necessary services to our customers. Payment is typically due upon delivery, upon invoice, or within a period of time shortly thereafter. We receive payment from our customers upon transfer of control or within a period typically within 45 days subsequent to transfer of control or invoice.
Retail Automotive Dealership
The following tables disaggregate our retail automotive segment revenue by product type and geographic location for the years ended December 31, 2024, 2023, and 2022:
| | | | | | | | | | | | | | | | | |
| Year Ended December 31, |
| Retail Automotive Dealership Revenue | 2024 | | 2023 | | 2022 |
| New vehicle | $ | 12,055.9 | | | $ | 11,273.3 | | | $ | 10,050.5 | |
| Used vehicle | 8,770.7 | | | 8,919.5 | | | 9,011.6 | |
| Finance and insurance, net | 811.1 | | | 838.6 | | | 848.1 | |
| Service and parts | 3,047.4 | | | 2,734.3 | | | 2,426.7 | |
| Fleet and wholesale | 1,471.1 | | | 1,443.4 | | | 1,357.8 | |
| Total retail automotive dealership revenue | $ | 26,156.2 | | | $ | 25,209.1 | | | $ | 23,694.7 | |
| | | | | | | | | | | | | | | | | |
| Year Ended December 31, |
| Retail Automotive Dealership Revenue | 2024 | | 2023 | | 2022 |
| U.S. | $ | 14,777.6 | | | $ | 14,160.5 | | | $ | 13,712.7 | |
| U.K. | 9,322.0 | | | 9,240.4 | | | 8,443.4 | |
| Germany, Italy, Japan, and Australia | 2,056.6 | | | 1,808.2 | | | 1,538.6 | |
| Total retail automotive dealership revenue | $ | 26,156.2 | | | $ | 25,209.1 | | | $ | 23,694.7 | |
Retail Commercial Truck Dealership
The following table disaggregates our retail commercial truck segment revenue by product type for the years ended December 31, 2024, 2023, and 2022:
| | | | | | | | | | | | | | | | | |
| Year Ended December 31, |
| Retail Commercial Truck Dealership Revenue | 2024 | | 2023 | | 2022 |
| New truck | $ | 2,359.5 | | | $ | 2,480.2 | | | $ | 2,308.7 | |
| Used truck | 227.0 | | | 229.9 | | | 301.3 | |
| Finance and insurance, net | 18.8 | | | 21.9 | | | 20.5 | |
| Service and parts | 886.3 | | | 907.3 | | | 852.2 | |
| Other | 29.5 | | | 45.0 | | | 58.6 | |
| Total retail commercial truck dealership revenue | $ | 3,521.1 | | | $ | 3,684.3 | | | $ | 3,541.3 | |
PENSKE AUTOMOTIVE GROUP, INC.
NOTES TO CONSOLIDATED FINANCIAL STATEMENTS (Continued)
(In millions, except share and per share amounts)
Commercial Vehicle Distribution and Other
Our other reportable segment relates to our Penske Australia business. Commercial vehicle distribution and other revenue was $777.9 million, $634.0 million, and $578.8 million, including $274.1 million, $265.2 million, and $241.0 million of service and parts revenue, during the years ended December 31, 2024, 2023, and 2022, respectively.
Contract Balances
The following table summarizes our accounts receivable and unearned revenues as of December 31, 2024, and December 31, 2023:
| | | | | | | | | | | |
| December 31,
2024 | | December 31,
2023 |
| Accounts receivable | | | |
| Contracts in transit | $ | 281.7 | | $ | 361.9 |
| Vehicle receivables | 136.3 | | 170.6 |
| Manufacturer receivables | 233.3 | | 218.9 |
| Trade receivables | 326.9 | | 344.1 |
| | | |
| Accrued expenses | | | |
| Unearned revenues | $ | 266.8 | | $ | 280.2 |
Contracts in transit represent receivables from unaffiliated finance companies relating to the sale of customers' installment sales and lease contracts arising in connection with the sale of a vehicle by us. Vehicle receivables represent receivables for any portion of the vehicle sales price not paid by the finance company. Manufacturer receivables represent amounts due from manufacturers, including incentives, holdbacks, rebates, warranty claims, and other receivables due from the factory. Trade receivables represent receivables due from customers, including amounts due for parts and service sales as well as receivables due from finance companies and others for the commissions earned on financing and commissions earned on insurance and extended service products provided by third parties. We evaluate collectability of receivables and estimate an allowance for doubtful accounts based on the age of the receivable, contractual life, historical collection experience, current conditions, and forecasts of future economic conditions, which is recorded within "Accounts receivable" on our consolidated balance sheets with our receivables presented net of the allowance.
Unearned revenues primarily relate to payments received from customers prior to satisfaction of our performance obligations, such as refundable customer deposits, non-refundable customer deposits, and deferred revenues from operating leases. These amounts are presented within "Accrued expenses and other current liabilities" on our consolidated balance sheets. Of the amounts recorded as unearned revenues as of December 31, 2023, $199.4 million was recognized as revenue during the year ended December 31, 2024.
Additional Revenue Recognition Related Policies
We do not have any material significant payment terms associated with contracts with our customers. Payment is due and collected as previously detailed for each reportable segment. We do not offer material rights of return or service-type warranties.
Taxes collected from customers and remitted to governmental authorities are recorded on a net basis (excluded from revenue). Shipping costs incurred subsequent to transfer of control to our customers are recognized as cost of sales. Sales promotions that we offer to customers are accounted for as a reduction of revenues at the time of sale.
3. Leases
We lease land and facilities, including certain dealerships and office space. Our property leases are generally for an initial period between 5 and 20 years and are typically structured to include renewal options at our election. We include
PENSKE AUTOMOTIVE GROUP, INC.
NOTES TO CONSOLIDATED FINANCIAL STATEMENTS (Continued)
(In millions, except share and per share amounts)
renewal options that we are reasonably certain to exercise in the measurement of our lease liabilities and right-of-use assets. We also have equipment leases that primarily relate to office and computer equipment, service and shop equipment, company vehicles, and other miscellaneous items. These leases are generally for a period of less than 5 years. We do not have any material leases, individually or in the aggregate, classified as a finance leasing arrangement.
We estimate the total undiscounted rent obligations under these leases, including any extension periods that we are reasonably certain to exercise, to be $5.3 billion as of December 31, 2024. Some of our lease arrangements include rental payments that are adjusted based on an index or rate, such as the Consumer Price Index (CPI). As the rate implicit in the lease is generally not readily determinable for our operating leases, the discount rates used to determine the present value of our lease liability are based on our incremental borrowing rate at the lease commencement date and commensurate with the remaining lease term. Our incremental borrowing rate for a lease is the rate of interest we would have to pay to borrow on a collateralized basis over a similar term for an amount equal to the lease payments in a similar economic environment. Leases with an initial term of 12 months or less are not recorded on the balance sheet.
Pursuant to the leases for some of our larger facilities, we are required to comply with specified financial ratios, including a "rent coverage" ratio and a ratio of debt to earnings before interest, taxes, depreciation, and amortization ("EBITDA"), each as defined. For these leases, non-compliance with the ratios may require us to post collateral in the form of a letter of credit. A breach of the other lease covenants gives rise to certain remedies by the landlord, the most severe of which include the termination of the applicable lease and acceleration of the total rent payments due under the lease.
In connection with the sale, relocation, and closure of certain of our dealerships, we have entered into a number of third-party sublease agreements. The rent paid by our sub-tenants on such properties for the years ended December 31, 2024, 2023, and 2022 was $16.2 million, $17.0 million, and $17.9 million, respectively. We have in the past and may in the future enter into sale-leaseback transactions to finance certain property acquisitions and capital expenditures, pursuant to which we sell property to third parties and agree to lease those assets back for a certain period of time. Such sales generate proceeds that vary from period to period. We do not have any material leases that have not yet commenced as of December 31, 2024.
The following table summarizes our net operating lease cost during the years ended December 31, 2024, 2023, and 2022:
| | | | | | | | | | | | | | | | | |
| Year Ended December 31, 2024 | | Year Ended December 31, 2023 | | Year Ended December 31, 2022 |
| Lease Cost | | | | | |
Operating lease cost (1) | $ | 269.9 | | | $ | 258.0 | | | $ | 254.3 | |
| Sublease income | (16.2) | | | (17.0) | | | (17.9) | |
| Total lease cost | $ | 253.7 | | | $ | 241.0 | | | $ | 236.4 | |
| _________________ | | | | | |
(1)Includes short-term leases and variable lease costs, which are immaterial. |
The following table summarizes supplemental cash flow information related to our operating leases:
| | | | | | | | | | | | | | | | | |
| Year Ended December 31, 2024 | | Year Ended December 31, 2023 | | Year Ended December 31, 2022 |
| Other Information | | | | | |
| | | | | |
| Cash paid for amounts included in the measurement of lease liabilities | | | | | |
| Operating cash flows from operating leases | 270.5 | | | 258.1 | | | 248.5 | |
| Right-of-use assets modified or obtained in exchange for operating lease liabilities, net | 156.1 | | | 30.4 | | | 116.2 | |
PENSKE AUTOMOTIVE GROUP, INC.
NOTES TO CONSOLIDATED FINANCIAL STATEMENTS (Continued)
(In millions, except share and per share amounts)
Supplemental balance sheet information related to the weighted average remaining lease term and discount rate of our leases is as follows:
| | | | | | | | | | | |
| December 31, 2024 | | December 31, 2023 |
| Lease Term and Discount Rate | | | |
| Weighted-average remaining lease term - operating leases | 24 years | | 24 years |
| Weighted-average discount rate - operating leases | 6.7% | | 6.7% |
The following table summarizes the maturity of our lease liabilities on an undiscounted cash flow basis and a reconciliation to the operating lease liabilities recognized on our consolidated balance sheet as of December 31, 2024:
| | | | | |
| Maturity of Lease Liabilities | December 31, 2024 |
| 2025 | $ | 256.8 | |
| 2026 | 250.3 | |
| 2027 | 240.7 | |
| 2028 | 237.5 | |
| 2029 | 231.4 | |
| 2030 and thereafter | 4,122.3 | |
| Total future minimum lease payments | $ | 5,339.0 | |
| Less: Imputed interest | (2,853.0) | |
| Present value of future minimum lease payments | $ | 2,486.0 | |
| |
Current operating lease liabilities (1) | $ | 93.4 | |
| Long-term operating lease liabilities | 2,392.6 | |
| Total operating lease liabilities | $ | 2,486.0 | |
| ____________________ | |
(1)Included within "Accrued expenses and other current liabilities" on Consolidated Balance Sheet as of December 31, 2024. |
4. Equity Method Investees
As of December 31, 2024, we had investments in the following companies that are accounted for under the equity method: Barcelona Premium SL (50%) operating automotive dealerships in Spain and Penske Commercial Leasing Australia (28%). In December 2024, we sold the remaining 50% interest in the Nix Group, our joint venture in Frankfurt, Germany.
We also have a 28.9% ownership interest in PTS, a leading provider of transportation and supply chain services. The partnership agreement requires PTS, subject to applicable law and the terms of its credit agreements, to make quarterly distributions to the partners with respect to each fiscal year by no later than 45 days after the end of each of the first three quarters of the year and by April 15 of the following year. PTS' partnership agreement and certain of its debt agreements allow partner distributions only as long as it is not in default under those agreements and the amount it pays does not exceed 50% of its consolidated net income, unless its debt-to-equity ratio is less than 3.0 to 1.0, in which case its distributions may not exceed 80% of its consolidated net income. Our investment in PTS, which is accounted for under the equity method, amounted to $1,803.9 million and $1,725.1 million at December 31, 2024, and 2023, respectively.
The net book value of our equity method investments was $1,827.0 million and $1,774.9 million as of December 31, 2024, and 2023, respectively. We recorded $200.7 million, $293.7 million, and $494.2 million during the years ended December 31, 2024, 2023, and 2022, respectively, on our statements of income under the caption “Equity in earnings of affiliates” related to earnings from our equity method investments. We received $99.1 million, $169.9 million, and
PENSKE AUTOMOTIVE GROUP, INC.
NOTES TO CONSOLIDATED FINANCIAL STATEMENTS (Continued)
(In millions, except share and per share amounts)
$356.6 million of dividends from our equity method investments during the years ended December 31, 2024, 2023, and 2022, respectively. Retained earnings as of December 31, 2024, included undistributed earnings from our equity method investments of $927.5 million.
The combined results of operations and financial position of our equity method investees as of December 31 for each of the years presented are summarized as follows:
Condensed income statement information:
| | | | | | | | | | | | | | | | | |
| Year Ended December 31, |
| 2024 | | 2023 | | 2022 |
| Revenues | $ | 13,967.4 | | | $ | 13,884.1 | | | $ | 13,587.3 | |
| Gross profit | 2,960.9 | | | 2,917.3 | | | 3,025.5 | |
| Net income | 691.9 | | | 1,008.3 | | | 1,701.3 | |
Condensed balance sheet information:
| | | | | | | | | | | |
| December 31, |
| 2024 | | 2023 |
| Current assets | $ | 2,272.2 | | | $ | 2,355.5 | |
| Noncurrent assets | 21,564.1 | | | 20,966.4 | |
| Total assets | $ | 23,836.3 | | | $ | 23,321.9 | |
| Current liabilities | $ | 5,971.8 | | | $ | 3,140.9 | |
| Noncurrent liabilities | 13,004.9 | | | 15,545.7 | |
| Equity | 4,859.6 | | | 4,635.3 | |
| Total liabilities and equity | $ | 23,836.3 | | | $ | 23,321.9 | |
5. Business Combinations
During 2024, we acquired 16 retail automotive franchises in the U.K., acquired two retail automotive franchises in Italy, and acquired three retail automotive franchises and one used vehicle dealership in Australia, and acquired one retail automotive franchise in the U.S. We also acquired three full-service dealerships and two independent repair facilities in the U.S. adding to PTG's operations. The companies acquired in 2024 generated $1.2 billion of revenue and $27.8 million of pre-tax income from our date of acquisition through December 31, 2024. During 2023, we acquired three full-service commercial truck dealerships and two service and parts centers in Canada, acquired two retail automotive franchises in the U.S., acquired two retail automotive franchises and one body shop in Italy, and acquired one service center in Australia. Our financial statements include the results of operations of the acquired entities from the date of acquisition. The fair value of the assets acquired and liabilities assumed have been recorded in our consolidated financial statements and may be subject to adjustment pending completion of final valuation. The following table summarizes the aggregate consideration
PENSKE AUTOMOTIVE GROUP, INC.
NOTES TO CONSOLIDATED FINANCIAL STATEMENTS (Continued)
(In millions, except share and per share amounts)
paid and the aggregate amounts of the assets acquired and liabilities assumed for the years ended December 31, 2024 and 2023:
| | | | | | | | | | | |
| Year Ended December 31, |
| 2024 | | 2023 |
| Accounts receivable | $ | 32.3 | | | $ | — | |
| Inventories | 256.5 | | | 34.2 | |
| Other current assets | 0.3 | | | 0.2 | |
| Property and equipment | 125.4 | | | 38.7 | |
| Operating lease right-of-use assets | 66.1 | | | — | |
| Indefinite-lived intangibles | 460.0 | | | 145.2 | |
| Other noncurrent assets | — | | | — | |
| Current liabilities | (67.2) | | | (3.4) | |
| Long-term operating lease liabilities | (66.1) | | | — | |
| Other noncurrent liabilities | (21.1) | | | — | |
| Total cash used in acquisitions | $ | 786.2 | | | $ | 214.9 | |
| | | |
| | | |
Our following unaudited consolidated pro forma results of operations for the years ended December 31, 2024 and 2023 give effect to acquisitions consummated during 2024 and 2023 as if they had occurred on January 1, 2023. This pro forma information is based on historical results of operations, adjusted for the income statement effects of incremental interest expense directly resulting from the acquisitions and the related tax effects. The pro forma information is not necessarily indicative of the results that would have been achieved had the transactions occurred on the first day of each of the periods presented or that may be achieved in the future:
| | | | | | | | | | | |
| Year Ended December 31, |
| 2024 | | 2023 |
| Revenues | $ | 31,087.2 | | | $ | 31,790.3 | |
| | | |
| Net income attributable to Penske Automotive Group common stockholders | 928.2 | | | 1,091.1 | |
| | | |
| Net income per diluted common share | $ | 13.88 | | | $ | 16.05 | |
6. Inventories
Inventories consisted of the following:
| | | | | | | | | | | |
| December 31, |
| 2024 | | 2023 |
| Retail automotive dealership new vehicles | $ | 2,345.7 | | | $ | 1,951.3 | |
| Retail automotive dealership used vehicles | 1,119.2 | | | 1,186.3 | |
| Retail automotive parts, accessories, and other | 167.8 | | | 156.2 | |
| Retail commercial truck dealership vehicles and parts | 518.4 | | | 543.7 | |
| Commercial vehicle distribution vehicles, parts, and engines | 489.1 | | | 455.6 | |
| Total inventories | $ | 4,640.2 | | | $ | 4,293.1 | |
We receive credits from certain vehicle manufacturers that reduce the cost of sales when the vehicles are sold. Such credits amounted to $69.4 million, $49.1 million, and $53.3 million during the years ended December 31, 2024, 2023, and 2022, respectively.
PENSKE AUTOMOTIVE GROUP, INC.
NOTES TO CONSOLIDATED FINANCIAL STATEMENTS (Continued)
(In millions, except share and per share amounts)
7. Property and Equipment
Property and equipment consisted of the following:
| | | | | | | | | | | |
| December 31, |
| 2024 | | 2023 |
| Buildings and leasehold improvements | $ | 3,040.8 | | | $ | 2,763.2 | |
| Furniture, fixtures, and equipment | 1,105.2 | | | 1,024.1 | |
| Total | $ | 4,146.0 | | | $ | 3,787.3 | |
| Less: Accumulated depreciation | (1,139.8) | | | (1,022.1) | |
| Property and equipment, net | $ | 3,006.2 | | | $ | 2,765.2 | |
Approximately $34.6 million and $30.9 million of net capitalized interest is included in buildings and leasehold improvements as of December 31, 2024 and 2023, respectively, and is being depreciated over the useful life of the related assets.
8. Intangible Assets
The following is a summary of the changes in the carrying amount of goodwill and other indefinite-lived intangible assets during the years ended December 31, 2024, and 2023:
| | | | | | | | | | | |
| Goodwill | | Other Indefinite-Lived Intangible
Assets |
Balance — December 31, 2022 (1) | $ | 2,154.7 | | | $ | 690.9 | |
| Additions | 95.9 | | | 51.3 | |
| Disposals | — | | | (0.1) | |
| Impairment | (40.7) | | | — | |
| Foreign currency translation | 25.0 | | | 6.1 | |
Balance — December 31, 2023 (2) | $ | 2,234.9 | | | $ | 748.2 | |
| Additions | 175.8 | | | 284.2 | |
| Disposals | (9.0) | | | (3.7) | |
| Impairment | — | | | (1.8) | |
| Foreign currency translation | (30.4) | | | (15.3) | |
Balance — December 31, 2024 (2) | $ | 2,371.3 | | | $ | 1,011.6 | |
| ____________________ |
(1)Net of accumulated goodwill impairment losses of $606.3 million recorded prior to December 31, 2012 |
(2)Net of accumulated goodwill impairment losses of $647.0 million |
PENSKE AUTOMOTIVE GROUP, INC.
NOTES TO CONSOLIDATED FINANCIAL STATEMENTS (Continued)
(In millions, except share and per share amounts)
The following is a summary of the changes in the carrying amount of goodwill by reportable segment during the years ended December 31, 2024, and 2023:
| | | | | | | | | | | | | | | | | | | | | | | |
| Retail
Automotive | | Retail
Commercial
Truck | | Other | | Total |
| Balance — December 31, 2022 | $ | 1,617.6 | | | $ | 462.3 | | | $ | 74.8 | | | $ | 2,154.7 | |
| Additions | 64.3 | | | 29.9 | | | 1.7 | | | 95.9 | |
| Disposals | — | | | — | | | — | | | — | |
| Impairment | (40.7) | | | — | | | — | | | (40.7) | |
| Foreign currency translation | 22.8 | | | 2.1 | | | 0.1 | | | 25.0 | |
| Balance — December 31, 2023 | $ | 1,664.0 | | | $ | 494.3 | | | $ | 76.6 | | | $ | 2,234.9 | |
| Additions | 162.5 | | | 13.3 | | | — | | | 175.8 | |
| Disposals | (6.0) | | | (3.0) | | | — | | | (9.0) | |
| | | | | | | |
| Foreign currency translation | (16.7) | | | (7.1) | | | (6.6) | | | (30.4) | |
| Balance — December 31, 2024 | $ | 1,803.8 | | | $ | 497.5 | | | $ | 70.0 | | | $ | 2,371.3 | |
For reporting units within our Retail Automotive, Retail Commercial Truck, and Other reportable segments, we prepared a quantitative assessment of the carrying value of goodwill. We estimated the fair value of our reporting units using an income approach. The income approach measures fair value by discounting expected future cash flows at a weighted average cost of capital. We also validate the fair value for each reporting unit using the income approach by calculating a cash earnings multiple and determining whether the multiple was reasonable compared to recent market transactions completed by the Company or in the industry. As part of that assessment, we also reconcile the estimated aggregate fair values of our reporting units to our market capitalization. We believe this reconciliation process is consistent with a market participant perspective. This consideration would also include a control premium that represents the estimated amount an investor would pay for our equity securities to obtain a controlling interest and other significant assumptions, including revenue growth, terminal growth rates, EBITDA margin, and the weighted average cost of capital.
Based on our assessment as of October 1, 2024, and in conjunction with our fourth quarter annual forecasting process for 2025 which impacts key assumptions used in our goodwill impairment assessment, we concluded that for each of our reporting units that the fair values were more likely than not greater than their carrying values. As a result, we had no goodwill impairment charges in 2024. Based on our assessment as of October 1, 2023, we recorded a non-cash goodwill impairment charge in 2023 of $40.7 million related to our former Used Vehicle Dealerships International reporting unit to reduce the carrying value to fair value.
For our other indefinite-lived intangible assets, we prepared a quantitative assessment as of October 1, 2024, by comparing the fair value to its carrying value. We estimated the fair value using an income approach, applying similar methodology as discussed above. As a result of this assessment, and in conjunction with the closure of certain franchised dealerships in the U.K. during 2024, we had $1.8 million of impairment charges relating to our other indefinite-lived intangible assets. We had no impairment charges relating to our other indefinite-lived intangible assets during 2023.
9. Vehicle Financing
We finance substantially all of the commercial vehicles we purchase for distribution, new vehicles for retail sale, and a portion of our used vehicle inventories for retail sale under floor plan and other revolving arrangements with various lenders, including the captive finance companies associated with automotive manufacturers. In the U.S., the floor plan arrangements are due on demand; however, we have not historically been required to repay floor plan advances prior to the sale of the vehicles that have been financed. We typically make monthly interest payments on the amount financed. Outside of the U.S., substantially all of the floor plan arrangements are payable on demand or have an original maturity of 90 days or less, and we are generally required to repay floor plan advances at the earlier of the sale of the vehicles that have been financed or the stated maturity.
PENSKE AUTOMOTIVE GROUP, INC.
NOTES TO CONSOLIDATED FINANCIAL STATEMENTS (Continued)
(In millions, except share and per share amounts)
The agreements typically grant a security interest in substantially all of the assets of our dealership and distribution subsidiaries and in the U.S., Australia, and New Zealand and in some cases are guaranteed or partially guaranteed by us. Interest rates under the arrangements are variable and increase or decrease based on changes in the prevailing benchmark interest rates in our various markets. To date, we have not experienced any material limitation with respect to the amount or availability of financing from any institution providing us with vehicle financing. We also receive non-refundable credits from certain of our vehicle manufacturers, which are treated as a reduction in the cost of sales as vehicles are sold.
The weighted average interest rate on floor plan borrowings was 4.9%, 4.5%, and 1.9% for 2024, 2023, and 2022, respectively. We classify floor plan notes payable to a party other than the manufacturer of a particular new vehicle and all floor plan notes payable relating to pre-owned vehicles as "Floor plan notes payable — non-trade" on our consolidated balance sheets and classify related cash flows as a financing activity on our consolidated statements of cash flows.
10. Long-Term Debt
Long-term debt consisted of the following:
| | | | | | | | | | | |
| December 31, |
| 2024 | | 2023 |
| U.S. credit agreement — revolving credit line | $ | — | | | $ | — | |
| U.K. credit agreement — revolving credit line | 171.4 | | | — | |
| | | |
| 3.50% senior subordinated notes due 2025 | 549.1 | | | 547.7 | |
| | | |
| 3.75% senior subordinated notes due 2029 | 496.6 | | | 495.8 | |
| | | |
| | | |
| | | |
| | | |
| Mortgage facilities | 474.8 | | | 402.1 | |
| Other debt | 160.1 | | | 183.6 | |
| Total long-term debt | $ | 1,852.0 | | | $ | 1,629.2 | |
| Less: current portion | (721.2) | | | (209.7) | |
| Net long-term debt | $ | 1,130.8 | | | $ | 1,419.5 | |
Scheduled maturities of long-term debt for each of the next five years and thereafter are as follows:
| | | | | |
| 2025 | $ | 721.2 | |
| 2026 | 22.2 | |
| 2027 | 36.6 | |
| 2028 | 378.1 | |
| 2029 | 521.9 | |
| 2030 and thereafter | 172.0 | |
| Total long-term debt reported | $ | 1,852.0 | |
U.S. Credit Agreement
On December 2, 2024, we entered into the Eleventh Amendment (the “Amendment”) to our U.S. credit agreement with Mercedes-Benz Financial Services USA LLC, Toyota Motor Credit Corporation, and Daimler Truck Financial Services USA LLC (as amended, the “U.S. Credit Agreement”) principally to increase the facility borrowing capacity from $1.2 billion to $1.5 billion.
As amended, the U.S. Credit Agreement provides for up to $1.5 billion in revolving loans for working capital, acquisitions, capital expenditures, investments and other general corporate purposes, and provides up to an additional $75 million of letters of credit. The U.S. Credit Agreement provides for a maximum of $400 million of borrowings for foreign acquisitions and expires on September 30, 2027. The interest rate on revolving loans is based on an adjusted
PENSKE AUTOMOTIVE GROUP, INC.
NOTES TO CONSOLIDATED FINANCIAL STATEMENTS (Continued)
(In millions, except share and per share amounts)
Secured Overnight Financing Rate ("SOFR") plus 1.50%, with uncollateralized borrowings in excess of a defined borrowing base bearing interest at adjusted SOFR plus 2.00%.
The U.S. credit agreement is fully and unconditionally guaranteed on a joint and several basis by substantially all of our U.S. subsidiaries and contains a number of significant operating covenants that, among other things, restrict our ability to dispose of assets, incur additional indebtedness, repay certain other indebtedness, pay dividends, create liens on assets, make investments or acquisitions, and engage in mergers or consolidations. We are also required to comply with specified financial and other tests and ratios, each as defined in the U.S. credit agreement, including a ratio of current assets to current liabilities, a fixed charge coverage ratio, a ratio of debt to stockholders' equity, and a ratio of debt to earnings before interest, taxes, depreciation, and amortization ("EBITDA"). A breach of these requirements would give rise to certain remedies under the agreement, the most severe of which is the termination of the agreement and acceleration of the amounts owed.
The U.S. credit agreement also contains typical events of default, including change of control, non-payment of obligations, and cross-defaults to our other material indebtedness. Substantially all of our U.S. assets are subject to security interests granted to the lenders under the U.S. credit agreement. As of December 31, 2024, we had no revolver borrowings under the U.S. credit agreement.
U.K. Credit Agreement
Our U.K. credit agreement with National Westminster Bank Plc and BMW Financial Services (GB) Limited provides up to a £200.0 million revolving line of credit to be used for working capital, acquisitions, capital expenditures, investments, and general corporate purposes. The revolving loans bear interest between defined Sterling Overnight Index Average (“SONIA”) plus 1.10% and defined SONIA plus 2.10%. In addition, the U.K. credit agreement includes a £100.0 million “accordion” feature which allows the U.K. subsidiaries to request up to an additional £100.0 million of facility capacity, subject to certain limitations. The lenders may agree to provide additional capacity, and, if not, the U.K. subsidiaries may add an additional lender, if available, to the facility to provide such additional capacity. Our U.K. credit agreement expires in January 2028. As of December 31, 2024, we had £137.0 million ($171.4 million) revolver borrowings under the U.K. credit agreement.
The U.K. credit agreement is fully and unconditionally guaranteed on a joint and several basis by the holding company of a majority of our international subsidiaries, PAG International Ltd. and our U.K. subsidiaries, and contains a number of significant covenants that, among other things, limit the ability of our U.K. subsidiaries to pay dividends, dispose of assets, incur additional indebtedness, repay other indebtedness, create liens on assets, make investments or acquisitions and engage in mergers or consolidations. In addition, our U.K. subsidiaries are required to comply with defined ratios and tests, including: a ratio of earnings before interest, taxes, amortization, and rental payments (“EBITAR”) to interest plus rental payments, a measurement of maximum capital expenditures, and a debt to EBITDA ratio. A breach of these requirements would give rise to certain remedies under the U.K. credit agreement, the most severe of which is the termination of the agreement and acceleration of any amounts owed.
The U.K. credit agreement also contains typical events of default, including change of control and non-payment of obligations and cross-defaults to other material indebtedness of our U.K. subsidiaries. Substantially all of our U.K. subsidiaries’ assets are subject to security interests granted to the lenders under the U.K. credit agreement.
Senior Subordinated Notes
We have issued the following senior subordinated notes:
| | | | | | | | | | | | | | | | | | | | |
| Description | | Maturity Date | | Interest Payment Dates | | Principal Amount |
| 3.50% Notes | | September 1, 2025 | | February 15, August 15 | | $550 million |
| 3.75% Notes | | June 15, 2029 | | June 15, December 15 | | $500 million |
Each of these notes are our unsecured, senior subordinated obligations and are guaranteed on an unsecured senior subordinated basis by our 100% owned U.S. subsidiaries. Each also contains customary negative covenants and events of
PENSKE AUTOMOTIVE GROUP, INC.
NOTES TO CONSOLIDATED FINANCIAL STATEMENTS (Continued)
(In millions, except share and per share amounts)
default. If we experience certain "change of control" events specified in the indentures, holders of these notes will have the option to require us to purchase for cash all or a portion of their notes at a price equal to 101% of the principal amount of the notes, plus accrued and unpaid interest. In addition, if we make certain asset sales and do not reinvest the proceeds thereof or use such proceeds to repay certain debt, we will be required to use the proceeds of such asset sales to make an offer to purchase the notes at a price equal to 100% of the principal amount of the notes, plus accrued and unpaid interest. We may redeem the 3.50% Notes and the 3.75% Notes at the redemption prices noted in the respective indentures. Our 3.50% Notes that mature on September 1, 2025, were reclassified as current liabilities during the third quarter of 2024.
Mortgage Facilities
We are party to mortgages that bear interest at defined rates and require monthly principal and interest payments. We also have a revolving mortgage facility with Toyota Motor Credit Corporation in the U.S. Our maximum borrowing capacity under the mortgage facility is $350.0 million, contingent on property values. Our actual borrowing capacity as of December 31, 2024, was $336.6 million. The facility bears interest at the prime rate minus 1.68% and expires in December 2028. As of December 31, 2024, we had $150.0 million outstanding borrowings under this mortgage facility. Our mortgage facilities also contain typical events of default, including non-payment of obligations, cross-defaults to our other material indebtedness, certain change of control events, and the loss or sale of certain dealerships operated at the properties. Substantially all of the buildings and improvements on the properties financed pursuant to the mortgage facilities are subject to security interests granted to the lender. As of December 31, 2024, we owed $474.8 million of principal under all of our mortgage facilities.
Other Debt
Our other debt consists primarily of various credit agreements and working capital loans in countries that we operate outside of the U.S. and the U.K.
11. Commitments and Contingent Liabilities
We are involved in litigation which may relate to claims brought by governmental authorities, issues with customers, and employment related matters, including class action claims and purported class action claims. As of December 31, 2024, we were not party to any legal proceedings, including class action lawsuits that, individually or in the aggregate, are reasonably expected to have a material adverse effect on our results of operations, financial condition, or cash flows. However, the results of these matters cannot be predicted with certainty, and an unfavorable resolution of one or more of these matters could have a material adverse effect on our results of operations, financial condition, or cash flows.
We lease land and facilities, including certain dealerships and office space. Pursuant to the leases for some of our larger facilities, we are required to comply with specified financial ratios, including a "rent coverage" ratio and a debt to EBITDA ratio, each as defined. For these leases, non-compliance with the ratios may require us to post collateral in the form of a letter of credit. A breach of the other lease covenants gives rise to certain remedies by the landlord, the most severe of which include the termination of the applicable lease and acceleration of the total rent payments due under the lease. Refer to the disclosures provided in Note 3 for further description of our leases. Rent expense for land and facilities for the years ended December 31, 2024, 2023, and 2022 amounted to $263.1 million, $247.9 million, and $243.3 million, respectively.
We have sold a number of dealerships to third parties and as a condition to certain of those sales, remain liable for the lease payments relating to the properties on which those businesses operate in the event of non-payment by the buyer. We are also party to lease agreements on properties that we no longer use in our retail operations that we have sublet to third parties. We rely on subtenants to pay the rent and maintain the property at these locations. In the event the subtenant does not perform as expected, we may not be able to recover amounts owed to us, and we could be required to fulfill these obligations. We believe we have made appropriate reserves relating to these locations. We currently guarantee or are otherwise liable for approximately $130.8 million of these lease payments, including lease payments during available renewal periods.
PENSKE AUTOMOTIVE GROUP, INC.
NOTES TO CONSOLIDATED FINANCIAL STATEMENTS (Continued)
(In millions, except share and per share amounts)
Our floor plan credit agreements with Daimler Truck Financial Services Australia and Mercedes-Benz Financial Services New Zealand ("MBA") provide us revolving loans for the acquisition of commercial vehicles for distribution to our retail network. These facilities include a commitment to repurchase dealer vehicles in the event the dealer's floor plan agreement with MBA is terminated.
We have $14.0 million of letters of credit outstanding and $18.3 million of bank guarantees as of December 31, 2024, and have posted $24.7 million of surety bonds in the ordinary course of business.
12. Related Party Transactions
We sometimes pay to and/or receive fees from Penske Corporation, its subsidiaries, and its affiliates for services rendered in the ordinary course of business or to reimburse payments made to third parties on each other's behalf. These transactions are reviewed periodically by our Audit Committee and reflect the provider's cost or an amount mutually agreed upon by both parties. During 2024, 2023, and 2022, Penske Corporation and its affiliates billed us $6.0 million, $5.3 million, and $5.1 million, respectively, and we billed Penske Corporation and its affiliates $1.4 million, $1.3 million, and $1.3 million, respectively, for such services. As of December 31, 2024, and 2023, we had $51 thousand and $44 thousand of receivables from, and $0.6 million and $0.5 million of payables to, Penske Corporation and its subsidiaries, respectively.
Our officers, directors, and their affiliates periodically purchase, lease, or sell vehicles and parts from us or PTS at fair market value. This includes purchases and sales of trucks, logistics, and other services and parts as between our subsidiaries and those of PTS (principally consisting of purchases of $34.9 million of trucks and parts by PTS from our PTG subsidiaries and purchases of $5.0 million of used trucks and towing services by PTG from PTS during 2024). In December 2024, we sold substantially all of the assets and real property relating to a collision and body shop repair facility operated by PTG in Eagan, Minnesota to PTS for $6.9 million.
PTS is owned 41.1% by Penske Corporation, 28.9% by us, and 30.0% by Mitsui. The PTS partnership agreement, among other things, provides us with specified partner distribution and governance rights and restricts our ability to transfer our interest. The partnership has an eleven-member Advisory Board. We have the right to appoint one Advisory Board member and appointed Robert H. Kurnick, Jr., our President. Lisa Davis and Michael Eisenson, our directors, are also members of the Advisory Board. We have the right to pro rata quarterly distributions equal to at least 50% of PTS' consolidated net income, as well as specified minority rights which require our and/or Mitsui's consent for certain actions taken by PTS as specified in the PTS partnership agreement.
We are able to transfer our directly owned interests with the unanimous consent of the other partners or if we provide the remaining partners with a right of first offer to acquire our interests, except that we may transfer up to 9.02% of our interest to Penske Corporation without complying with the right of first offer to the remaining partner. We and Penske Corporation have agreed that (1) in the event of any transfer by Penske Corporation of their partnership interests to a third party, we will be entitled to “tag-along” by transferring a pro rata amount of our partnership interests on similar terms and conditions, and (2) Penske Corporation is entitled to a right of first refusal in the event of any transfer of our partnership interests, subject to the terms of the partnership agreement. Additionally, PTS has agreed to indemnify the general partner for any actions in connection with managing PTS, except those taken in bad faith or in violation of the partnership agreement.
The partnership agreement allows each of the partners to give notice to require PTS to begin to effect an initial public offering of equity securities, subject to certain limitations, as soon as practicable after the first anniversary of the initial notice. The term of the partnership agreement is indefinite.
In 2024, 2023, and 2022, we received $98.4 million, $168.8 million, and $356.6 million, respectively, from PTS in pro rata cash dividends. In 2014, we formed a venture with PTS, Penske Commercial Leasing Australia. This venture combines PTS' fleet operations expertise with our market knowledge of commercial vehicles to rent heavy-duty commercial vehicles in Australia. This venture is accounted for as an equity method investment as discussed in Note 4.
PENSKE AUTOMOTIVE GROUP, INC.
NOTES TO CONSOLIDATED FINANCIAL STATEMENTS (Continued)
(In millions, except share and per share amounts)
Joint Venture Relationships
From time to time, we enter into joint venture relationships in the ordinary course of business, pursuant to which we own and operate automotive dealerships together with other investors. We may also provide these dealerships with working capital and other debt financing at costs that are based on our incremental borrowing rate. As of December 31, 2024, our automotive joint venture relationships were as follows:
| | | | | | | | | | | | | | | | | |
| Location | | Dealerships | | Ownership Interest |
| Fairfield, Connecticut | | Audi, Mercedes-Benz, Sprinter, Porsche | | 80.00% | (A) |
| Greenwich, Connecticut | | Mercedes-Benz | | 80.00% | (A) |
| Northern Italy | | BMW, MINI, Maserati, Porsche, Audi, Jaguar, Land Rover, Volvo, Mercedes-Benz, smart, Lamborghini | | 95.00% | (A) |
| Barcelona, Spain | | BMW, MINI, Dongfeng, Xpeng | | 50.00% | (B) |
| _________________ |
| (A) Entity is consolidated in our financial statements. |
| (B) Entity is accounted for using the equity method of accounting. |
As noted above, we are party to non-automotive joint ventures representing our investments in PTS (28.9%) and Penske Commercial Leasing Australia (28%) that are accounted for under the equity method, as more fully discussed in Note 4.
In September 2024, we purchased the remaining 33.33% interest in our joint venture in Kerpen, Germany. In October 2024, we also purchased an additional 10.9% interest in our joint venture in Northern Italy resulting in our owning 95% of this joint venture. In December 2024, we sold the remaining 50% interest in the Nix Group, our joint venture in Frankfurt, Germany.
13. Stock-Based Compensation
Our key employees, outside directors, consultants, and advisors are eligible to receive stock-based compensation pursuant to the terms of our 2020 Equity Incentive Plan (the “2020 Plan”). This plan allows for the issuance of shares for stock options, stock appreciation rights, restricted stock, restricted stock units, performance shares, and other awards. The 2020 Plan allows for up to 5,000,000 awards, of which 3,760,000 shares of common stock were available for grant as of December 31, 2024, and terminates once all awards have been issued. Compensation expense related to our equity incentive plans were $29.1 million, $27.9 million, and $25.5 million during 2024, 2023, and 2022, respectively.
Restricted Stock
During 2024, 2023, and 2022, we granted 164,528, 210,222, and 291,832 shares, respectively, of restricted common stock at no cost to participants under the plan. These awards provide dividend rights and voting rights prior to vesting. The awards are subject to forfeiture and are non-transferable, which restrictions generally lapse over a four-year period from the grant date at a rate of 15%, 15%, 20% and 50% per year. We have determined that the grant date quoted market price of the underlying common stock is the appropriate measure of compensation cost. This cost is amortized as expense over the restriction period. As of December 31, 2024, there was $42.2 million of unrecognized compensation cost related to the restricted stock, which is expected to be recognized over the restricted period.
PENSKE AUTOMOTIVE GROUP, INC.
NOTES TO CONSOLIDATED FINANCIAL STATEMENTS (Continued)
(In millions, except share and per share amounts)
Presented below is a summary of the changes of our restricted common stock during the years ended December 31, 2024 and 2023:
| | | | | | | | | | | | | | | | | |
| Shares | | Weighted Average
Grant Date Fair Value | | Aggregate
Intrinsic Value |
| December 31, 2022 | 1,018,020 | | | $ | 70.03 | | | |
| Granted | 210,222 | | | 146.48 | | | |
| Vested | (399,362) | | | 58.62 | | | |
| Forfeited | (5,407) | | | 87.40 | | | |
| December 31, 2023 | 823,473 | | | $ | 94.98 | | | $ | 132.2 | |
| Granted | 164,528 | | | 150.64 | | | |
| Vested | (278,293) | | | 79.97 | | | |
| Forfeited | (10,804) | | | 106.65 | | | |
| December 31, 2024 | 698,904 | | | $ | 113.87 | | | $ | 106.5 | |
In certain non-U.S. markets, we issue restricted stock units similar to the restricted common stock discussed above. However, these awards do not provide voting rights prior to vesting. As of December 31, 2024, 2023, and 2022, we had 33,497, 37,839, and 49,611 units outstanding, respectively, and 14,160 and 19,088 restricted stock units vested during 2024 and 2023, respectively.
14. Equity
A summary of shares repurchased under our securities repurchase program, and shares acquired, is as follows:
| | | | | | | | | | | | | | | | | |
| Year Ended December 31, |
| 2024 | | 2023 | | 2022 |
Shares repurchased (1) | 394,010 | | | 2,640,152 | | | 8,065,707 | |
| Aggregate purchase price | $ | 58.7 | | | $ | 358.7 | | | $ | 869.3 | |
| Average purchase price per share | $ | 148.88 | | | $ | 135.86 | | | $ | 107.78 | |
| | | | | |
Shares acquired (2) | 123,235 | | | 168,464 | | | 148,440 | |
| Aggregate purchase price | $ | 18.8 | | | $ | 23.5 | | | $ | 17.2 | |
| Average purchase price per share | $ | 152.26 | | | $ | 139.45 | | | $ | 115.97 | |
| ________________________ |
(1)Shares were repurchased under our securities repurchase program. We had $156.8 million in repurchase authorization remaining under the repurchase program as of December 31, 2024. |
(2)Shares were acquired from employees in connection with a net share settlement feature of employee equity awards. |
PENSKE AUTOMOTIVE GROUP, INC.
NOTES TO CONSOLIDATED FINANCIAL STATEMENTS (Continued)
(In millions, except share and per share amounts)
15. Accumulated Other Comprehensive Loss
Changes in accumulated other comprehensive loss by component during the years ended December 31, 2024, 2023, and 2022, respectively, attributable to Penske Automotive Group common stockholders follows:
| | | | | | | | | | | | | | | | | | | |
| Foreign
Currency
Translation | | | | Other | | Accumulated Other Comprehensive Loss |
| Balance at January 1, 2022 | $ | (174.4) | | | | | $ | 5.6 | | | $ | (168.8) | |
| Other comprehensive loss, net of tax | (153.7) | | | | | (12.8) | | | (166.5) | |
| | | | | | | |
| | | | | | | |
| Balance at December 31, 2022 | $ | (328.1) | | | | | $ | (7.2) | | | $ | (335.3) | |
| Other comprehensive income, net of tax | 65.5 | | | | | 5.7 | | | 71.2 | |
| | | | | | | |
| | | | | | | |
| Balance at December 31, 2023 | $ | (262.6) | | | | | $ | (1.5) | | | $ | (264.1) | |
| Other comprehensive loss, net of tax | (91.4) | | | | | (9.0) | | | (100.4) | |
| | | | | | | |
| | | | | | | |
| Balance at December 31, 2024 | $ | (354.0) | | | | | $ | (10.5) | | | $ | (364.5) | |
16. Income Taxes
Income before income taxes by geographic region was as follows:
| | | | | | | | | | | | | | | | | |
| Year Ended December 31, |
| 2024 | | 2023 | | 2022 |
| U.S. | $ | 976.4 | | | $ | 1,119.9 | | | $ | 1,474.5 | |
| Non-U.S. | 263.5 | | | 299.6 | | | 384.7 | |
| Income before income taxes | $ | 1,239.9 | | | $ | 1,419.5 | | | $ | 1,859.2 | |
Income taxes consisted of the following:
| | | | | | | | | | | | | | | | | |
| Year Ended December 31, |
| 2024 | | 2023 | | 2022 |
| Current: | | | | | |
| Federal | $ | 215.4 | | | $ | 131.0 | | | $ | 200.6 | |
| State and local | 43.1 | | | 53.4 | | | 71.6 | |
| Non-U.S. | 71.0 | | | 74.7 | | | 76.6 | |
| Total current | $ | 329.5 | | | $ | 259.1 | | | $ | 348.8 | |
| Deferred: | | | | | |
| Federal | (19.7) | | | 85.5 | | | 98.8 | |
| State and local | 4.1 | | | 10.0 | | | 17.1 | |
| Non-U.S. | 2.6 | | | 6.3 | | | 8.3 | |
| Total deferred | $ | (13.0) | | | $ | 101.8 | | | $ | 124.2 | |
| Income taxes | $ | 316.5 | | | $ | 360.9 | | | $ | 473.0 | |
PENSKE AUTOMOTIVE GROUP, INC.
NOTES TO CONSOLIDATED FINANCIAL STATEMENTS (Continued)
(In millions, except share and per share amounts)
Income taxes varied from the U.S. federal statutory income tax rate due to the following:
| | | | | | | | | | | | | | | | | |
| Year Ended December 31, |
| 2024 | | 2023 | | 2022 |
| Income taxes at federal statutory rate | $ | 260.3 | | | $ | 298.1 | | | $ | 390.4 | |
| State and local income taxes, net of federal taxes | 40.5 | | | 47.7 | | | 67.3 | |
| Non-U.S. income taxed at other rates | 18.3 | | | 18.2 | | | 4.1 | |
| | | | | |
| | | | | |
| | | | | |
| | | | | |
| Other | (2.6) | | | (3.1) | | | 11.2 | |
| Income taxes | $ | 316.5 | | | $ | 360.9 | | | $ | 473.0 | |
The components of deferred tax assets and liabilities as of December 31, 2024 and 2023 were as follows:
| | | | | | | | | | | |
| December 31, |
| 2024 | | 2023 |
| Deferred Tax Assets | | | |
| Accrued liabilities | $ | 79.9 | | | $ | 77.3 | |
| Net operating loss and credit carryforwards | 47.0 | | | 49.3 | |
| Leasing liabilities | 641.7 | | | 624.8 | |
| Other | 44.5 | | | 36.6 | |
| Total deferred tax assets | 813.1 | | | 788.0 | |
| Valuation allowance | (59.2) | | | (58.2) | |
| Net deferred tax assets | $ | 753.9 | | | $ | 729.8 | |
| Deferred Tax Liabilities | | | |
| Depreciation and amortization | (402.2) | | | (354.2) | |
| Partnership investments | (930.0) | | | (972.1) | |
| Leasing assets | (641.7) | | | (624.8) | |
| Other | (11.0) | | | (10.4) | |
| Total deferred tax liabilities | (1,984.9) | | | (1,961.5) | |
| Net deferred tax liabilities | $ | (1,231.0) | | | $ | (1,231.7) | |
We are not permanently reinvested in a portion of our previously taxed unremitted foreign earnings, which may be distributed in the future. At December 31, 2024, we have accrued the appropriate amount of U.S. state income taxes and foreign withholding taxes for the unremitted foreign earnings that are not permanently reinvested. We have not provided any U.S. taxes on a total temporary difference of $436.1 million related to the excess of financial reporting basis over tax basis in our non-U.S. subsidiaries, as it is our position that we are permanently reinvested for this basis difference.
At December 31, 2024, we have $93.3 million of state net operating loss carryforwards in the U.S. that expire at various dates beginning in 2025 through 2045, a U.S. foreign tax credit carryforward of $32.0 million that will expire beginning in 2027, U.K. capital loss carryforwards of $6.3 million that will not expire, Germany net operating loss carryforwards of $23.9 million that will not expire, Italy net operating loss carryforwards of $0.1 million that will not expire, and New Zealand net operating loss carryforwards of $0.3 million that will not expire. The Company used $16.2 million of state net operating loss carryforwards in the U.S. in 2024.
A valuation allowance of $0.7 million has been recorded against the state net operating loss carryforwards in the U.S. and a valuation allowance of $32.0 million has been recorded against the U.S. foreign tax credit carryforward as of December 31, 2024. A valuation allowance of $2.3 million has been recorded against German net operating losses and other deferred tax assets. A valuation allowance of $24.2 million has been recorded against U.K. deferred tax assets related to buildings as of December 31, 2024.
PENSKE AUTOMOTIVE GROUP, INC.
NOTES TO CONSOLIDATED FINANCIAL STATEMENTS (Continued)
(In millions, except share and per share amounts)
Generally accepted accounting principles relating to uncertain income tax positions prescribe a minimum recognition threshold that a tax position is required to meet before being recognized and provides guidance on the derecognition, measurement, classification, and disclosure relating to income taxes.
We have elected to include interest and penalties in our income tax expense. There were no amounts of interest or penalties to be included within uncertain tax positions at December 31, 2024. We do not expect a significant change to the amount of uncertain tax positions within the next twelve months. Our U.S. federal returns remain open to examination for 2021, 2022, and 2023 and various U.S. state jurisdictions are open for periods ranging from 2019 through 2023. The portion of the total amount of uncertain tax positions that would, if recognized, impact the effective tax rate was $0.5 million as of December 31, 2024, 2023, and 2022, respectively.
17. Segment Information
We have determined that we have four reportable segments as defined in generally accepted accounting principles for segment reporting: (i) Retail Automotive, consisting of our retail automotive dealership operations; (ii) Retail Commercial Truck, consisting of our retail commercial truck dealership operations in the U.S. and Canada; (iii) Other, consisting of our commercial vehicle and power systems distribution operations; and (iv) Non-Automotive Investments, consisting of our equity method investments in non-automotive operations which includes our investment in PTS and other various investments. The Retail Automotive reportable segment includes all automotive dealerships and all departments relevant to the operation of the dealerships and our retail automotive joint ventures. The individual dealership operations included in the Retail Automotive reportable segment represent two operating segments: United States Retail Automotive and International Retail Automotive. These operating segments have been aggregated into one reportable segment as their operations (A) have similar economic characteristics (all are automotive dealerships having similar margins), (B) offer similar products and services (all sell new and/or used vehicles, service, parts, and third-party finance and insurance products), (C) have similar target markets and customers (generally individuals), and (D) have similar distribution and marketing practices (all distribute products and services through dealership facilities that market to customers in similar fashions). The accounting policies of the segments are the same and are described in Note 1.
The following table summarizes revenues; cost of sales; selling, general, and administrative expenses; depreciation; floor plan interest expense; other interest expense; equity in earnings of affiliates; and income before income taxes, which is the measure of segment performance by which management allocates resources to its segments and which we refer to as segment income, for each of our reportable segments. Our company's Chief Operating Decision Maker ("CODM") is our Chief Executive Officer. Our CODM uses segment income to evaluate the profitability of our reportable segments, which helps guide decisions on resource allocation. Segment income is also used to analyze budget versus actual results and actual results versus the comparable prior period. This analysis is utilized in assessing the performance of our reportable segments.
| | | | | | | | | | | | | | | | | | | | | | | | | | | | | | | |
| Retail
Automotive | | Retail Commercial
Truck | | Other | | Non-Automotive
Investments | | | | Total |
| Revenues | | | | | | | | | | | |
| 2024 | $ | 26,156.2 | | | $ | 3,521.1 | | | $ | 777.9 | | | $ | — | | | | | $ | 30,455.2 | |
| 2023 | 25,209.1 | | | 3,684.3 | | | 634.0 | | | — | | | | | 29,527.4 | |
| 2022 | 23,694.7 | | | 3,541.3 | | | 578.8 | | | — | | | | | 27,814.8 | |
| Cost of sales | | | | | | | | | | | |
| 2024 | $ | 21,905.6 | | | $ | 2,936.6 | | | $ | 599.7 | | | $ | — | | | | | $ | 25,441.9 | |
| 2023 | 21,032.9 | | | 3,091.9 | | | 468.8 | | | — | | | | | 24,593.6 | |
| 2022 | 19,568.3 | | | 2,986.2 | | | 421.5 | | | — | | | | | 22,976.0 | |
| | | | | | | | | | | |
| | | | | | | | | | | |
| | | | | | | | | | | |
| | | | | | | | | | | |
PENSKE AUTOMOTIVE GROUP, INC.
NOTES TO CONSOLIDATED FINANCIAL STATEMENTS (Continued)
(In millions, except share and per share amounts)
| | | | | | | | | | | | | | | | | | | | | | | | | | | | | | | |
| Selling, general, and administrative expenses: | | | | | | | | | | | |
| Personnel expenses | | | | | | | | | | | |
| 2024 | $ | 1,775.6 | | | $ | 264.3 | | | $ | 72.2 | | | $ | — | | | | | $ | 2,112.1 | |
| 2023 | 1,709.9 | | | 253.6 | | | 72.3 | | | — | | | | | 2,035.8 | |
| 2022 | 1,709.1 | | | 234.0 | | | 70.2 | | | — | | | | | 2,013.3 | |
| Advertising expenses | | | | | | | | | | | |
| 2024 | $ | 129.4 | | | $ | 3.2 | | | $ | 1.8 | | | $ | — | | | | | $ | 134.4 | |
| 2023 | 130.8 | | | 3.3 | | | 1.8 | | | — | | | | | 135.9 | |
| 2022 | 116.7 | | | 3.5 | | | 1.8 | | | — | | | | | 122.0 | |
| Rent & related expenses | | | | | | | | | | | |
| 2024 | $ | 378.6 | | | $ | 25.7 | | | $ | 13.9 | | | $ | — | | | | | $ | 418.2 | |
| 2023 | 350.6 | | | 25.8 | | | 12.9 | | | — | | | | | 389.3 | |
| 2022 | 333.1 | | | 24.7 | | | 12.9 | | | — | | | | | 370.7 | |
| Other expenses (1) | | | | | | | | | | | |
| 2024 | $ | 797.0 | | | $ | 53.4 | | | $ | 23.4 | | | $ | — | | | | | $ | 873.8 | |
| 2023 | 756.6 | | | 57.3 | | | 25.7 | | | — | | | | | 839.6 | |
| 2022 | 630.7 | | | 56.8 | | | 30.2 | | | — | | | | | 717.7 | |
| Depreciation | | | | | | | | | | | |
| 2024 | $ | 137.4 | | | $ | 15.1 | | | $ | 5.5 | | | $ | — | | | | | $ | 158.0 | |
| 2023 | 124.7 | | | 11.6 | | | 4.7 | | | — | | | | | 141.0 | |
| 2022 | 112.7 | | | 10.0 | | | 4.6 | | | — | | | | | 127.3 | |
| Floor plan interest expense | | | | | | | | | | | |
| 2024 | $ | 160.9 | | | $ | 19.2 | | | $ | 9.7 | | | $ | — | | | | | $ | 189.8 | |
| 2023 | 116.0 | | | 14.5 | | | 2.6 | | | — | | | | | 133.1 | |
| 2022 | 44.5 | | | 7.5 | | | 0.4 | | | — | | | | | 52.4 | |
| Other interest expense | | | | | | | | | | | |
| 2024 | $ | 82.1 | | | $ | — | | | $ | 5.7 | | | $ | — | | | | | $ | 87.8 | |
| 2023 | 90.3 | | | 1.3 | | | 1.0 | | | — | | | | | 92.6 | |
| 2022 | 65.1 | | | 3.9 | | | 1.4 | | | — | | | | | 70.4 | |
| Equity in earnings of affiliates | | | | | | | | | | | |
| 2024 | $ | 3.1 | | | $ | — | | | $ | — | | | $ | 197.6 | | | | | $ | 200.7 | |
| 2023 | 3.9 | | | — | | | — | | | 289.8 | | | | | 293.7 | |
| 2022 | 3.5 | | | — | | | — | | | 490.7 | | | | | 494.2 | |
PENSKE AUTOMOTIVE GROUP, INC.
NOTES TO CONSOLIDATED FINANCIAL STATEMENTS (Continued)
(In millions, except share and per share amounts)
| | | | | | | | | | | | | | | | | | | | | | | | | | | | | | | |
| Segment income | | | | | | | | | | | |
| 2024 | $ | 792.7 | | | $ | 203.6 | | | $ | 46.0 | | | $ | 197.6 | | | | | $ | 1,239.9 | |
| 2023 (2) | 860.5 | | | 225.0 | | | 44.2 | | | 289.8 | | | | | 1,419.5 | |
| 2022 | 1,118.0 | | | 214.7 | | | 35.8 | | | 490.7 | | | | | 1,859.2 | |
| __________________________ |
(1)Other expenses within SG&A primarily consist of information technology expenses, customer service vehicle loaner expenses, vehicle delivery expenses, utility expenses, and various other miscellaneous expenses. These expenses are individually not significant to the performance of our segments and are not regularly used by the CODM on a disaggregated basis for purposes of evaluating segment profit or loss. |
|
(2)Retail automotive segment income includes $40.7 million of goodwill impairment charges in 2023 related to our former Used Vehicle Dealerships International reporting unit. |
|
Total capital expenditures by reportable segment are set forth in the table below. As segment assets are not regularly provided to or used by the CODM to measure business performance or allocate resources, total segment assets are not presented.
| | | | | | | | | | | | | | | | | | | | | | | | | | | | | | | |
| Retail
Automotive | | Retail Commercial
Truck | | Other | | Non-Automotive
Investments | | | | Total |
| | | | | | | | | | | |
| | | | | | | | | | | |
| | | | | | | | | | | |
| | | | | | | | | | | |
| | | | | | | | | | | |
| | | | | | | | | | | |
| Capital expenditures | | | | | | | | | | | |
| 2024 | $ | 322.3 | | | $ | 41.0 | | | $ | 5.4 | | | $ | — | | | | | $ | 368.7 | |
| 2023 | 306.9 | | | 60.1 | | | 8.3 | | | — | | | | | 375.3 | |
| 2022 | 245.6 | | | 31.2 | | | 5.7 | | | — | | | | | 282.5 | |
The following table presents revenue and long-lived assets (all non-current assets except goodwill, other indefinite-lived intangible assets, and operating lease right-of-use assets) by geographic area:
| | | | | | | | | | | | | | | | | |
| Year Ended December 31, |
| 2024 | | 2023 | | 2022 |
| Revenue from external customers: | | | | | |
| U.S. | $ | 17,715.1 | | | $ | 17,186.5 | | | $ | 16,801.7 | |
| U.K. | 9,322.0 | | | 9,240.4 | | | 8,443.4 | |
| Other International | 3,418.1 | | | 3,100.5 | | | 2,569.7 | |
| Total revenue from external customers | $ | 30,455.2 | | | $ | 29,527.4 | | | $ | 27,814.8 | |
| Long-lived assets, net: | | | | | |
| U.S. | $ | 3,529.0 | | | $ | 3,255.4 | | | |
| U.K. | 975.5 | | | 953.6 | | | |
| Other International | 438.5 | | | 394.2 | | | |
| Total long-lived assets | $ | 4,943.0 | | | $ | 4,603.2 | | | |
No individual country other than the U.S. and the U.K. represented more than 10% of our total revenue from external customers or our total long-lived assets.
Schedule II
PENSKE AUTOMOTIVE GROUP, INC.
VALUATION AND QUALIFYING ACCOUNTS
(In millions)
| | | | | | | | | | | | | | | | | | | | | | | | | | |
| Description | | Balance at
Beginning
of Year | | Additions | | Deductions,
Recoveries,
& Other | | Balance
at End
of Year |
| Year Ended December 31, 2024 | | | | | | | | |
| Allowance for doubtful accounts | | $ | 6.8 | | | $ | 3.0 | | | $ | (3.5) | | | $ | 6.3 | |
| Tax valuation allowance | | 58.2 | | | 1.2 | | | (0.2) | | | 59.2 | |
| Year Ended December 31, 2023 | | | | | | | | |
| Allowance for doubtful accounts | | $ | 6.6 | | | $ | 2.2 | | | $ | (2.0) | | | $ | 6.8 | |
| Tax valuation allowance | | 62.8 | | | 3.4 | | | (8.0) | | | 58.2 | |
| Year Ended December 31, 2022 | | | | | | | | |
| Allowance for doubtful accounts | | $ | 6.8 | | | $ | 3.7 | | | $ | (3.9) | | | $ | 6.6 | |
| Tax valuation allowance | | 67.0 | | | 0.6 | | | (4.8) | | | 62.8 | |