As filed with the Securities and Exchange Commission on [date]
UNITED STATES
SECURITIES AND EXCHANGE COMMISSION
Washington, D.C. 20549
FORM N-CSR
CERTIFIED SHAREHOLDER REPORT OF REGISTERED
MANAGEMENT INVESTMENT COMPANIES
Investment Company Act file number | 811-07737 | |||||||
| ||||||||
The Purisima Funds | ||||||||
(Exact name of registrant as specified in charter) | ||||||||
| ||||||||
5525 NW Fisher Creek Dr. Camas, WA |
| 98607 | ||||||
(Address of principal executive offices) |
| (Zip code) | ||||||
| ||||||||
U. S. Bancorp Fund Services, LLC 2020 East Financial Way, Suite 100 Glendora, California 91741 | ||||||||
(Name and address of agent for service) | ||||||||
| ||||||||
Registrant’s telephone number, including area code: | (650) 851-3334 |
| ||||||
| ||||||||
Date of fiscal year end: | August 31 |
| ||||||
| ||||||||
Date of reporting period: | August 31, 2013 |
| ||||||
Item 1. Reports to Stockholders.

Annual Report
August 31, 2013
The Purisima Total Return Fund

Table of Contents
A Letter to Our Shareholders | 2 | ||||||
Performance Summary | 6 | ||||||
Sector Breakdown | 7 | ||||||
Expense Example | 7 | ||||||
Schedule of Investments | 9 | ||||||
Statement of Assets and Liabilities | 15 | ||||||
Statement of Operations | 16 | ||||||
Statement of Changes in Net Assets | 17 | ||||||
Financial Highlights | 18 | ||||||
Notes to Financial Statements | 19 | ||||||
Report of Independent Registered Public Accounting Firm | 28 | ||||||
Other Information | 29 | ||||||
Trustees and Officer Information | 30 | ||||||
Privacy Notice | 34 | ||||||

Investment Objectives
Purisima Total Return Fund
The Purisima Total Return Fund ("the Fund") seeks a high total return. (Total return includes capital appreciation, dividend and interest income, and distributions).
Each Fund reserves the right to reject any order for the purchase of its shares or to limit or suspend, without prior notice, the offering of its shares. The required minimum investments may be waived in the case of certain qualified retirement plans. The Funds will not accept your account if you are investing for another person as attorney-in-fact. The Funds also will not accept accounts with a "Power of Attorney" in the registration section of the Purchase Application.
1

A Letter to Our Shareholders
Welcome to the annual report for the Purisima Total Return Fund for the 12-month period ending August 31, 2013. The primary investment objective of the Fund is achieving high total return for shareholders.
Market Review and Outlook
Global stocks finished the 12-months ending August 31, 2013 with nicely positive returns, led by US stocks relative to foreign. Global stocks were up 17.63% over the period, as measured by the MSCI World Index, and are up 11.71% in calendar 2013(i) — in our view, we believe the returns so far this year bode well for full-year stock returns.
The positive returns in the last year largely reflect a brighter-than-widely appreciated fundamental reality surprising too-dour investors with its persistence. US Gross Domestic Product (GDP) grew throughout the period, pushing further into all-time high territory. The eurozone, long a global economic laggard, saw its recession ebb — and growth return in Q2 2013. The UK economy also began growing again. While growing at slower paces, Emerging Markets economies have continued to expand relatively quickly. All told, the global economy has continued expanding.
The private sector is at the forefront of US economic growth. Folks frequently bemoan the slow pace of US GDP — and headline growth is tepid overall — but this is due in large part to falling government spending, at least in the parts that count toward GDP and particularly at the state and local level. Under the hood, housing, business investment, exports and consumer spending have all risen. As have non-petroleum imports, a sign of healthy domestic demand. Corporate profits have been high and rising. Corporate America is flush with cash — fuel for continued investment, Merger and Acquisitions (M&A), potentially higher dividends and/or share buybacks. These factors have been at work for the majority of the ongoing bull market and look likely to persist for some time in our opinion.
We believe global growth appears likely to continue as well. Most Leading Economic Index series globally — including the US — have been high and rising. The forward-looking new orders sub-indexes of services and manufacturing purchasing managers' indexes (PMI) are also showing prospects for accelerating growth ahead. And the yield curve — no thanks to the Fed — has steepened, a traditional leading indicator of growth.
Yet sentiment largely doesn't see this correctly. Hence, equity valuations have remained attractive despite the big run up since March 9, 2009. Legendary investor Sir John Templeton famously stated: "Bull markets are born on pessimism, grow on skepticism, mature on optimism and die on euphoria."(ii) For the most part, the trade-off between skepticism and optimism has historically occurred about halfway through a bull market's duration. Right now, investor sentiment remains stuck — one foot in skepticism and the other in optimism.
i Thomson Reuters as of 8/31/2013.
ii http://www.sirjohntempleton.org/quotes.asp
2

Investors rationally notice strength in certain areas (e.g., corporate profits at all-time highs, ongoing global growth) but still fret many of the cud-like, re-chewed fears (e.g., eurozone weakness, America's debt) that have persisted throughout this bull market.
One underappreciated positive is continued gridlock in Congress. With Congress still split, it's likely no controversial legislation gets passed — at least not in the near term. Gridlock doesn't mean nothing happens — gridlocked Congress can still compromise on key issues, including the looming debt ceiling. Congress made similar compromises over the past year, including on the so-called Fiscal Cliff debate that closed 2012. If Congress hadn't reached a budget agreement by December 31, billions of dollars in budget cuts and tax hikes would have set in automatically, causing fears the US would slide back into recession. Yet Congress reached an agreement just after the deadline, making many of the tax cuts permanent. The spending cuts, known as the sequester, remained, but in the months since they took effect, Congress has watered down or cancelled some of the more material cuts, including those for air traffic control.
In international political news, Shinzo Abe returned to Japan's Prime Ministerial post (he was also prime minister from 2006 to 2007) in December 2012 and, shortly thereafter, announced a three-point economic plan, dubbed Abenomics — including fiscal stimulus, aggressive monetary easing and structural reforms. So far, these policies have weakened the yen (a secondary goal), but Japan has yet to receive a net benefit from this. Export values have surged, but volumes didn't begin growing until August. Meanwhile, import costs have surged — particularly for the natural gas and other energy imports Japan relies on while nuclear plants remain closed. Additionally, the structural reforms announced thus far fall short of the deep economic and labor market changes Japan needs to regain competitiveness. Overall, Abenomics expectations have greatly surpassed their true economic benefit, in our view, and investors are likely to be disappointed by reality. This is a large reason we've remained underweight to Japanese stocks.
Eurozone political theatrics continued, too, but markets largely yawned. Peripheral Europe's sovereign yields remained manageable, creeping up only marginally. Markets, it seems, are moving on from this long-familiar worry. With the troika (International Monetary Fund, European Central Bank and European Commission) and key European leaders continuing to support the troubled periphery, the commitment to keep the eurozone intact remains strong, largely assuaging investor fears. Many problems still exist, like the need for long-term structural reforms, but political progress and nascent economic improvement demonstrate the region isn't in as bad of shape as many originally thought. Markets don't need all the eurozone's problems solved overnight in order to rise — continued progress, however incremental, should suffice to surpass still-dour expectations and propel stocks higher.
China's economic growth rate slowed to 7.8% for full-year 2012 and 7.6% for the first half of 2013(iii), renewing hard-landing jitters for the world's second largest economy. Yet relative to the global economy, China has still been growing at an enviable pace, and in dollar terms, it appears that it should still contribute heavily to global trade and GDP growth. Growth may not
iii National Bureau of Statistics of China.
3

reach double digits moving forward, but this makes sense as its economy is growing off a larger base and officials are engineering a shift from investment-led to consumption-driven growth. A liquidity crunch sparked rumors of a credit crunch in June, but evidence suggests the strain was intentional and temporary and the issue more political than economic — in the months following, funding pressures eased significantly. Looking forward, China's new leadership — led by President Xi Jinping and Premier Wen Jiabao — have signaled a rash of market-oriented reforms. Liberalizing interest rates, increasing foreign investment quotas and expanding derivatives markets should help the nation become more of a market force over time.
The Fed expanded its quantitative easing (QE) program in December 2012, announcing indefinite monthly asset purchases of $85 billion. Investors cheered — and have since fretted the possibility of the program's wind down — but to us this sentiment is backward. In our view, the economy has grown despite QE, not because of it. The Fed's asset purchases weigh on long-term interest rates, narrowing the yield curve spread and compressing banks' net interest margins — the potential profit on the next loan made. A smaller spread creates a disincentive to lend, which prevents the broad money supply from expanding quickly — a headwind to growth. This is a key reason the monetary base is expanding with QE, but the money supply (as measured by M2*) has been growing at a tepid pace. Once asset purchases stop, the yield curve should steepen, aiding growth — just as growth accelerated in the UK after Britain's QE ended late in 2012. That investors see this backward — false fears are typically bullish, and the bigger the misperception, the bigger its potential positive surprise power.
Fund Positioning
For the 12-month period ending August 31, 2013, the Fund underperformed the MSCI World Index benchmark (12.87% versus 17.63%, respectively).
The Fund's overweight to the US and France and underweights to Canada, Australia and Singapore helped returns while overweights to Emerging Markets and underweights to Japan and Germany detracted.
The Fund's overweights to Consumer Discretionary and Healthcare and underweights to Utilities, Energy and Materials contributed positively to relative returns while overweights to Information Technology and Consumer Staples and underweights to Financial and Industrials detracted.
Stock selection in aggregate detracted from the Fund's returns on a country and sector basis.
Closing Remarks
Looking ahead, economic reality in the US and globally may continue surpassing investors' muted expectations — a bullish feature in our view. If investors' perceptions of reality improve, they may gain more confidence in publicly traded firms future profitability, and they should
* M2 is defined as a measure of money supply, including: the sum of currency in circulation and reserve balances, savings deposits, small-denomination time deposits and retail money market mutual fund shares.(iv)
iv http://www.federalreserve.gov/faqs/money_12845.htm
4

become willing to pay ever-larger premiums for those future earnings. Investors today aren't uniformly optimistic, suggesting confidence could gradually ascend for quite some time before sentiment reaches the euphoric heights typically associated with market peaks. We believe this bull market has room to run.
Thank you, as always, for being clients.
Sincerely,

Kenneth L. Fisher
Chairman and Co-Chief Investment Officer
Fisher Investments
Opinions expressed above are those of Kenneth L. Fisher and are subject to change, are not guaranteed and should not be considered investment advice.
Past performance does not guarantee future results.
Fund holdings and sector allocations are subject to change and are not recommendations to buy or sell any security.
Mutual fund investing involves risk of loss. Principal loss is possible. The Fund may use short sales of securities, which involve the risk that losses may exceed the original amount invested. Foreign investing involves special risks, including a greater volatility and political, economic and currency risks and differences in accounting methods. These risks are greater for emerging markets. Small- and medium-capitalization companies tend to have limited liquidity and greater price volatility than large capitalization companies. Growth stocks typically are more volatile than value stocks; however, value stocks have a lower expected growth rate in earnings and sales. Investments in debt securities typically decrease in value when interest rates rise. This risk is greater for longer-term debt securities.
The MSCI World Index is a broad-based unmanaged capitalization-weighted stock index designed to measure global developed market equity performance. It consists of 24 developed market country indices. One cannot invest directly in an index.
This material must be preceded or accompanied by a prospectus.
Fisher Investments is the Adviser to The Purisima Funds. The Purisima Funds are distributed by Quasar Distributors, LLC 09/13
5

Performance Summary
for year ended August 31, 2013
Purisima Total Return Fund
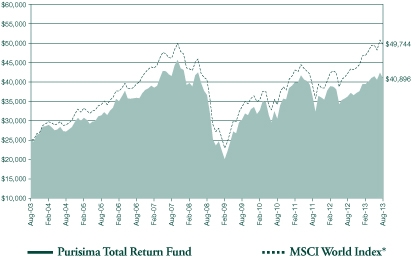
Growth of $25,000
Purisima Total Return Fund cumulative total return versus MSCI World Index $25,000 invested from 8/31/03 to 8/31/13*
One-year | One-year | ||||||||||||||
Average Annual Total Return2** | 12.87 | % | Average Annual Total Return2** | 17.63 | % | ||||||||||
Five-year | Five-year | ||||||||||||||
Average Annual Total Return2** | 2.24 | % | Average Annual Total Return2** | 4.12 | % | ||||||||||
Ten-year | Ten-year | ||||||||||||||
Cumulative Total Return1** | 63.59 | % | Cumulative Total Return1** | 98.97 | % | ||||||||||
Average Annual Total Return2** | 5.04 | % | Average Annual Total Return2** | 7.12 | % | ||||||||||
Please note past performance is not predictive of future results. Share price and return will fluctuate, and investors may experience a gain or loss when they sell their shares. To obtain a prospectus on the Purisima Funds please call 1-800-841-0199. The prospectus contains more information, including the political, economic, currency risks and potential volatility of foreign investing. Read the prospectus carefully before investing.
1 Cumulative total return measures the change in value of an investment over the periods indicated and reflects all fund fees and expenses.
2 Average annual total return represents the average annual change in value of an investment over the periods indicated and reflects all fund fees and expenses. Average annual total return and cumulative total return for the one-year period would be identical.
* The MSCI World Index is an unmanaged global stock index comprised of various world stock markets, including the U.S. The total return of a $25,000 investment includes all expenses.
** The total returns shown do not reflect the deduction of taxes a shareholder would pay on fund distributions or redemption of fund shares. The total return reflects the rate an investment would have earned (or lost) on an investment in the Fund, assuming reinvestment of all dividends and distributions.
6

Sector Breakdown(1) (Unaudited)
Purisima Total Return Fund | |||||||
Information Technology | 20.70 | % | |||||
Financials | 18.00 | % | |||||
Consumer Discretionary | 14.27 | % | |||||
Health Care | 13.71 | % | |||||
Consumer Staples | 12.22 | % | |||||
Exchange Traded Notes | 8.99 | % | |||||
Industrials | 4.38 | % | |||||
Energy | 4.05 | % | |||||
Materials | 2.41 | % | |||||
Telecommunication Services | 0.94 | % | |||||
Mutual Funds | 0.33 | % | |||||
Total | 100.00 | % | |||||
(1) Percentage of Total Investments as of August 31, 2013.
Important Information
The following disclosure provides important information regarding the Fund's Expense Example. Refer to this information when reviewing the Expense Example for the Fund.
Expense Example (Unaudited)
As a shareholder of the Fund, you incur two types of costs: (1) transaction costs; and (2) ongoing costs, including management fees; distribution and/or service (12b-1) fees; and other fund expenses. This Example is intended to help you understand your ongoing costs (in dollars) of investing in the Fund and to compare these costs with the ongoing costs of investing in other mutual funds.
The Example is based on an investment of $1,000 invested at the beginning of the period indicated and held for the entire period from March 1, 2013 to August 31, 2013, for the Total Return Fund.
Actual Expenses
The information in the table under the heading "Actual Performance" provides information about actual account values and actual expenses. You may use the information in these columns together with the amount you invested, to estimate the expenses that you paid over the period. Simply divide your account value by $1,000 (for example, an $8,600 account value divided by $1,000 = 8.6), then multiply the result by the number in the row entitled "Expenses Paid During Period" to estimate the expenses you paid on your account during this period.
7

Hypothetical Example for Comparison Purposes
The information in the table under the heading "Hypothetical Performance (5% return before expenses)" provides information about hypothetical account values and hypothetical expenses based on the Fund's actual expense ratios and assumed rates of return of 5% per year before expenses, which are not the Fund's actual returns. Hypothetical account values and expenses may not be used to estimate the actual ending account balance or expenses you paid for the period. You may use this information to compare the ongoing costs of investing in the Fund and other funds. To do so, compare this 5% hypothetical example with the 5% hypothetical examples that appear in the shareholder reports of the other funds.
Please note that the expenses shown in the table are meant to highlight your ongoing costs only and do not reflect any transaction costs, such as sales charges (loads), or redemption fees. Therefore, the information under the heading "Hypothetical Performance (5% return before expenses)" is useful in comparing ongoing costs only, and will not help you determine the relative total costs of owning different funds. In addition, if these transactional costs were included, your costs would have been higher.
| Purisima Total Return Fund | Actual Performance | Hypothetical Performance (5% return before expenses) | |||||||||
Beginning Account Value (03/01/13) | $ | 1,000.00 | $ | 1,000.00 | |||||||
Ending Account Value (08/31/13) | $ | 1,037.20 | $ | 1,018.40 | |||||||
Expenses Paid During Period(1) | $ | 6.93 | $ | 6.87 | |||||||
(1) Expenses are equal to the Fund's expense ratio for the six month period of 1.35% for the Purisima Total Return Fund multiplied by the average account value over the period, multiplied by 184/365 (to reflect the one-half year period).
8

Purisima Total Return Fund
Schedule of Investments
August 31, 2013
Number of Shares | Value | ||||||||||
COMMON STOCKS: 90.48% | |||||||||||
Canada: 1.48% | |||||||||||
| 81,850 | Royal Bank of Canada | $ | 5,054,237 | ||||||||
China: 0.33% | |||||||||||
| 635 | Baidu.com – ADR (a) | 86,062 | |||||||||
| 157,025 | Bank Of China Ltd. | 66,014 | |||||||||
| 48,000 | Beijing Capital International Airport Co. Ltd. | 31,445 | |||||||||
| 48,000 | Brilliance China Automotive Holdings Ltd. (a) | 70,566 | |||||||||
| 100,400 | China Construction Bank Corp. | 73,541 | |||||||||
| 6,000 | China Mobile Ltd. | 64,492 | |||||||||
| 19,000 | China Pacific Insurance Group Co. Ltd. | 63,460 | |||||||||
| 26,625 | China Resources Enterprise Ltd. | 75,881 | |||||||||
| 35,000 | CITIC Securities Co. Ltd. | 68,154 | |||||||||
| 215 | CNOOC Ltd. – ADR | 43,107 | |||||||||
| 8,800 | Hengan International Group Co. Ltd. | 96,404 | |||||||||
| 95,000 | Industrial & Commercial Bank of China | 62,358 | |||||||||
| 96,000 | Lenovo Group Ltd. | 92,850 | |||||||||
| 8,500 | Ping An Insurance Group Co. | 59,576 | |||||||||
| 3,500 | Tencent Holdings Ltd. | 164,112 | |||||||||
1,118,022 | |||||||||||
Denmark: 1.61% | |||||||||||
| 7,475 | Novo Nordisk A/S – ADR | 1,247,876 | |||||||||
| 25,435 | Novo Nordisk A/S – Class B | 4,249,494 | |||||||||
5,497,370 | |||||||||||
France: 5.76% | |||||||||||
| 21,235 | L'Oreal SA | 3,543,236 | |||||||||
| 24,400 | L'Oreal SA – ADR | 814,814 | |||||||||
| 45,600 | LVMH Moet Hennessy Louis Vuitton SA | 7,988,422 | |||||||||
| 76,205 | Sanofi | 7,321,070 | |||||||||
19,667,542 | |||||||||||
The accompanying notes are an integral part of these financial statements.
9

Number of Shares | Value | ||||||||||
Germany: 2.41% | |||||||||||
| 33,300 | BASF SE | $ | 2,910,444 | ||||||||
| 5,700 | Daimler AG | 391,134 | |||||||||
| 66,515 | SAP AG | 4,916,781 | |||||||||
8,218,359 | |||||||||||
Hong Kong: 0.09% | |||||||||||
| 14,050 | AIA Group Ltd. | 61,694 | |||||||||
| 5,000 | Cheung Kong Holdings Ltd. | 71,378 | |||||||||
| 3,400 | Hong Kong Exchanges and Clearing Ltd. | 52,177 | |||||||||
| 20,800 | Sands China Ltd. | 119,632 | |||||||||
| 8,000 | Shangri-La Asia Ltd. | 12,318 | |||||||||
317,199 | |||||||||||
India: 0.10% | |||||||||||
| 9,450 | Cipla Ltd. – GDR | 59,144 | |||||||||
| 1,750 | Dr. Reddy's Laboratories Ltd. – ADR | 58,223 | |||||||||
| 2,810 | HDFC Bank Ltd. – ADR | 81,434 | |||||||||
| 700 | Infosys Ltd. – ADR | 32,459 | |||||||||
| 1,165 | Reliance Industries Ltd. – GDR | 29,311 | |||||||||
| 11,475 | Tata Global Beverages Ltd. – GDR | 23,943 | |||||||||
| 3,300 | Tata Motors Ltd. – ADR | 73,656 | |||||||||
358,170 | |||||||||||
Indonesia: 0.09% | |||||||||||
| 71,000 | Bank Mandiri Tbk PT | 46,163 | |||||||||
| 78,000 | Bank Rakyat Tbk PT | 47,143 | |||||||||
| 9,000 | Gudang Garam Tbk PT | 31,278 | |||||||||
| 58,500 | Jasa Marga Persero Tbk PT | 29,197 | |||||||||
| 35,500 | Semen Gresik Tbk PT | 40,961 | |||||||||
| 197,500 | Telekomunikasi Indonesia Persero Tbk PT | 39,789 | |||||||||
| 30,500 | Unilever Indonesia Tbk PT | 87,143 | |||||||||
321,674 | |||||||||||
Japan: 1.92% | |||||||||||
| 54,375 | Toyota Motor Corp. – ADR | 6,567,956 | |||||||||
Malaysia: 0.02% | |||||||||||
| 22,600 | CIMB Group Holdings BHD | 50,088 | |||||||||
| 7,500 | Genting BHD | 21,303 | |||||||||
71,391 | |||||||||||
The accompanying notes are an integral part of these financial statements.
10

Number of Shares | Value | ||||||||||
Singapore: 0.04% | |||||||||||
| 8,300 | DBS Group Holdings Ltd. | $ | 102,806 | ||||||||
| 12,000 | Singapore Telecommunications Ltd. | 33,020 | |||||||||
135,826 | |||||||||||
South Korea: 0.19% | |||||||||||
| 2,750 | Hynix Semiconductor, Inc. (a) | 69,986 | |||||||||
| 225 | Hyundai Mobis | 56,552 | |||||||||
| 455 | Hyundai Motor Co. | 102,063 | |||||||||
| 840 | KT&G Corp. | 54,938 | |||||||||
| 158 | NAVER Corp. | 63,363 | |||||||||
| 72 | NHN Entertainment Corp. (a) | 7,084 | |||||||||
| 165 | Samsung Electronics Co. Ltd. | 203,342 | |||||||||
| 580 | Samsung Life Insurance Co. Ltd. | 55,385 | |||||||||
| 235 | SK Innovation Co. Ltd. | 29,638 | |||||||||
642,351 | |||||||||||
Switzerland: 4.07% | |||||||||||
| 110,225 | Nestle SA | 7,232,238 | |||||||||
| 84,450 | Novartis AG | 6,158,238 | |||||||||
| 26,100 | UBS AG | 505,478 | |||||||||
13,895,954 | |||||||||||
Taiwan: 0.10% | |||||||||||
| 13,204 | Advanced Semiconductor Engineering, Inc. – ADR | 56,381 | |||||||||
| 39,247 | Fubon Financial Holdings Co. Ltd. | 53,773 | |||||||||
| 36,780 | Hon Hai Precision Industry Co. Ltd. | 99,802 | |||||||||
| 41,800 | Taiwan Semiconductor Manufacturing Co. Ltd. | 140,384 | |||||||||
350,340 | |||||||||||
Thailand: 0.02% | |||||||||||
| 5,250 | Bangkok Bank PCL | 29,194 | |||||||||
| 50,950 | Charoen Pokphand Foods PCL | 36,721 | |||||||||
65,915 | |||||||||||
United Kingdom: 7.89% | |||||||||||
| 180,725 | BHP Billiton PLC | 5,259,675 | |||||||||
| 76,925 | British American Tobacco PLC | 3,880,284 | |||||||||
| 124,620 | GlaxoSmithKline PLC – ADR | 6,341,912 | |||||||||
| 801,150 | HSBC Holdings PLC | 8,392,775 | |||||||||
| 955,100 | Vodafone Group PLC | 3,052,726 | |||||||||
26,927,372 | |||||||||||
The accompanying notes are an integral part of these financial statements.
11

Number of Shares | Value | ||||||||||
United States: 64.36% | |||||||||||
| 27,865 | Amazon.com, Inc. (a) | $ | 7,829,508 | ||||||||
| 125,580 | American Express Co. | 9,030,458 | |||||||||
| 18,525 | Apple, Inc. | 9,022,601 | |||||||||
| 431,000 | Bank Of America Corp. | 6,085,720 | |||||||||
| 59,500 | Berkshire Hathaway, Inc. – Class B (a) | 6,617,590 | |||||||||
| 37,625 | Chevron Corp. | 4,531,179 | |||||||||
| 289,840 | Cisco Systems, Inc. | 6,756,170 | |||||||||
| 140,250 | Citigroup, Inc. | 6,778,283 | |||||||||
| 126,950 | Comcast Corp. – Class A | 5,343,325 | |||||||||
| 57,550 | Exxon Mobil Corp. | 5,016,058 | |||||||||
| 349,395 | General Electric Co. | 8,085,000 | |||||||||
| 8,340 | Google, Inc. – Class A (a) | 7,063,146 | |||||||||
| 216,495 | Intel Corp. | 4,758,560 | |||||||||
| 39,275 | International Business Machines Corp. | 7,158,654 | |||||||||
| 120,260 | Johnson & Johnson | 10,391,667 | |||||||||
| 169,185 | JPMorgan Chase & Co. | 8,548,918 | |||||||||
| 70,790 | McDonald's Corp. | 6,679,744 | |||||||||
| 193,320 | Microsoft Corp. | 6,456,888 | |||||||||
| 234,950 | Oracle Corp. | 7,485,507 | |||||||||
| 99,400 | PepsiCo, Inc. | 7,925,162 | |||||||||
| 385,405 | Pfizer, Inc. | 10,872,275 | |||||||||
| 77,625 | Philip Morris International, Inc. | 6,477,030 | |||||||||
| 89,240 | Procter & Gamble Co. | 6,950,903 | |||||||||
| 117,625 | Qualcomm, Inc. | 7,796,185 | |||||||||
| 51,305 | Schlumberger Ltd. | 4,152,627 | |||||||||
| 6,100 | The Boeing Co. | 633,912 | |||||||||
| 115,320 | The Coca-Cola Co. | 4,402,918 | |||||||||
| 97,925 | The Home Depot, Inc. | 7,294,433 | |||||||||
| 99,875 | The Walt Disney Co. | 6,075,396 | |||||||||
| 61,505 | United Technologies Corp. | 6,156,651 | |||||||||
| 46,430 | Visa, Inc. – Class A | 8,098,321 | |||||||||
| 225,560 | Wells Fargo & Co. | 9,266,005 | |||||||||
219,740,794 | |||||||||||
| TOTAL COMMON STOCKS (Cost $260,341,022) | $ | 308,950,472 | |||||||||
The accompanying notes are an integral part of these financial statements.
12

Number of Shares | Value | ||||||||||
EXCHANGE TRADED NOTES: 8.98% | |||||||||||
| 37,000 | Barclays + FI Enhanced Europe 50 | $ | 3,476,890 | ||||||||
| 127,050 | Barclays + FI Enhanced Global High Yield | 11,763,559 | |||||||||
| 424,175 | UBS AG FI Enhanced Big Cap Growth | 15,406,036 | |||||||||
30,646,485 | |||||||||||
| TOTAL EXCHANGE TRADED NOTES (Cost $27,009,375) | 30,646,485 | ||||||||||
SHORT-TERM INVESTMENTS: 0.33% | |||||||||||
Mutual Funds: 0.33% | |||||||||||
| 1,131,340 | SEI Daily Income Trust Government Fund | 1,131,340 | |||||||||
| TOTAL SHORT-TERM INVESTMENTS (Cost $1,131,340) | 1,131,340 | ||||||||||
| TOTAL INVESTMENTS: 99.79% (Cost $288,481,737) | 340,728,297 | ||||||||||
Other Assets in Excess of Liabilities: 0.21% | 715,220 | ||||||||||
TOTAL NET ASSETS: 100.00% | $ | 341,443,517 | |||||||||
ADR - American Depository Receipt.
GDR - Global Depository Receipt.
(a) Non-Income Producing.
The accompanying notes are an integral part of these financial statements.
13

Industry | % of Net Assets | ||||||
Pharmaceuticals | 13.68 | % | |||||
Exchange Traded Notes | 8.98 | % | |||||
Diversified Financial Services | 8.24 | % | |||||
Commercial Banks | 6.82 | % | |||||
Software | 5.53 | % | |||||
IT Services | 4.48 | % | |||||
Communications Equipment | 4.26 | % | |||||
Beverages | 3.61 | % | |||||
Media | 3.34 | % | |||||
Tobacco | 3.06 | % | |||||
Oil, Gas & Consumable Fuels | 2.82 | % | |||||
Computers & Peripherals | 2.67 | % | |||||
Consumer Finance | 2.64 | % | |||||
Industrial Conglomerates | 2.37 | % | |||||
Textiles, Apparel & Luxury Goods | 2.34 | % | |||||
Internet & Catalog Retail | 2.29 | % | |||||
Internet Software & Services | 2.16 | % | |||||
Specialty Retail | 2.14 | % | |||||
Food Products | 2.14 | % | |||||
Automobiles | 2.11 | % | |||||
Household Products | 2.06 | % | |||||
Hotels, Restaurants & Leisure | 2.00 | % | |||||
Aerospace & Defense | 1.99 | % | |||||
Metals & Mining | 1.54 | % | |||||
Semiconductors & Semiconductor Equipment | 1.53 | % | |||||
Personal Products | 1.30 | % | |||||
Energy Equipment & Services | 1.22 | % | |||||
Wireless Telecommunication Services | 0.91 | % | |||||
Chemicals | 0.85 | % | |||||
Capital Markets | 0.17 | % | |||||
Insurance | 0.07 | % | |||||
Electronic Equipment, Instruments & Components | 0.03 | % | |||||
Food & Staples Retailing | 0.02 | % | |||||
Diversified Telecommunication Services | 0.02 | % | |||||
Real Estate Management & Development | 0.02 | % | |||||
Transportation Infrastructure | 0.02 | % | |||||
Auto Components | 0.02 | % | |||||
Construction Materials | 0.01 | % | |||||
Total Investment in Securities | 99.46 | % | |||||
Cash Equivalent | 0.33 | % | |||||
Other Assets in Excess of Liabilities | 0.21 | % | |||||
TOTAL NET ASSETS | 100.00 | % | |||||
The accompanying notes are an integral part of these financial statements.
14

Purisima Total Return Fund
Statement of Assets and Liabilities
August 31, 2013
ASSETS: | |||||||
Investments at value (cost $288,481,737) | $ | 340,728,297 | |||||
Foreign currency at value (cost $522,022) | 516,324 | ||||||
Cash | 252 | ||||||
Receivables: | |||||||
Interest and dividends receivable | 1,049,524 | ||||||
Receivable for Fund shares sold | 61,617 | ||||||
Receivable for foreign currency | 1,666,428 | ||||||
Receivable for investments sold | 2,983,582 | ||||||
Prepaid expenses | 21,722 | ||||||
Total Assets | 347,027,746 | ||||||
LIABILITIES: | |||||||
Payable for investments purchased | 3,062,866 | ||||||
Payable for Fund shares redeemed | 227,546 | ||||||
Payable for foreign currency | 1,665,355 | ||||||
Payable to the Adviser (Note 3) | 301,343 | ||||||
Accrued distribution fees (Note 4) | 162,698 | ||||||
Accrued fund administration, fund accounting, transfer agent and custody fees | 115,258 | ||||||
Accrued expenses | 49,163 | ||||||
Total Liabilities | 5,584,229 | ||||||
NET ASSETS | $ | 341,443,517 | |||||
| Number of shares issued and outstanding (unlimited shares authorized, $0.01 par value) | 16,324,820 | ||||||
Net asset value, redemption price and offering price per share | $ | 20.92 | |||||
COMPONENTS OF NET ASSETS: | |||||||
Paid-in capital | $ | 281,638,783 | |||||
Undistributed net investment income | 2,574,894 | ||||||
Accumulated net realized gain on investments | 4,985,631 | ||||||
Net unrealized appreciation/depreciation on: | |||||||
Investments | 52,246,560 | ||||||
Foreign currency | (2,351 | ) | |||||
Net Assets | $ | 341,443,517 | |||||
The accompanying notes are an integral part of these financial statements.
15

Purisima Total Return Fund
Statement of Operations
For the Year Ended August 31, 2013
INVESTMENT INCOME: | |||||||
Dividend income(1) | $ | 8,244,985 | |||||
Interest income | 475 | ||||||
Total Investment Income | 8,245,460 | ||||||
EXPENSES: | |||||||
Investment advisory fees (Note 3) | 3,549,055 | ||||||
Distribution fees (Note 4) | 319,415 | ||||||
Administration fees (Note 3) | 277,344 | ||||||
Transfer agent fees | 164,529 | ||||||
Fund accounting fees | 121,107 | ||||||
Custody fees | 123,796 | ||||||
Miscellaneous expenses | 102,193 | ||||||
Legal fees | 39,827 | ||||||
Reports to shareholders | 30,396 | ||||||
Registration fees | 30,409 | ||||||
Trustees fees | 22,996 | ||||||
Audit fees | 17,985 | ||||||
Interest expense | 337 | ||||||
Total expenses | 4,799,389 | ||||||
Net investment income | 3,446,071 | ||||||
| REALIZED AND UNREALIZED GAIN (LOSS) ON INVESTMENTS AND FOREIGN CURRENCY: | |||||||
Net realized gain (loss) on: | |||||||
Investments | 7,086,697 | ||||||
Foreign currency transactions | (90,718 | ) | |||||
Change in net unrealized appreciation/depreciation on: | |||||||
Investments | 32,627,406 | ||||||
Foreign currency translation | (23,801 | ) | |||||
Net realized and unrealized gain on investments and foreign currency | 39,599,584 | ||||||
Net increase in net assets resulting from operations | $ | 43,045,655 | |||||
(1) Net of $371,525 in foreign withholding taxes.
The accompanying notes are an integral part of these financial statements.
16

Purisima Total Return Fund
Statement of Changes in Net Assets
| Year Ended August 31, 2013 | Year Ended August 31, 2012 | ||||||||||
OPERATIONS: | |||||||||||
Net investment income | $ | 3,446,071 | $ | 3,723,574 | |||||||
Net realized gain (loss) on: | |||||||||||
Investments | 7,086,697 | 18,056,381 | |||||||||
Foreign currency transactions | (90,718 | ) | (5,334 | ) | |||||||
| Change in net unrealized appreciation/depreciation on: | |||||||||||
Investments | 32,627,406 | (20,851,680 | ) | ||||||||
Foreign currency translation | (23,801 | ) | (67,606 | ) | |||||||
Net increase in net assets resulting from operations | 43,045,655 | 855,335 | |||||||||
DISTRIBUTIONS TO SHAREHOLDERS: | |||||||||||
From net investment income | (4,498,664 | ) | (3,796,140 | ) | |||||||
From net realized gain on investments | (2,670,531 | ) | – | ||||||||
| Net decrease in net assets resulting from distributions paid | (7,169,195 | ) | (3,796,140 | ) | |||||||
CAPITAL SHARE TRANSACTIONS: | |||||||||||
Proceeds from shares sold | 27,138,252 | 34,041,432 | |||||||||
Proceeds from reinvestment of distributions | 6,720,245 | 3,570,973 | |||||||||
Cost of shares redeemed | (90,865,856 | ) | (60,812,105 | ) | |||||||
Net decrease from capital share transactions | (57,007,359 | ) | (23,199,700 | ) | |||||||
Total decrease in net assets | (21,130,899 | ) | (26,140,505 | ) | |||||||
NET ASSETS: | |||||||||||
Beginning of period | 362,574,416 | 388,714,921 | |||||||||
| End of period (includes undistributed net investment income of $2,574,894 and $3,718,205 respectively) | $ | 341,443,517 | $ | 362,574,416 | |||||||
CHANGE IN CAPITAL SHARES: | |||||||||||
Shares outstanding, beginning of period | 19,167,716 | 20,373,549 | |||||||||
Shares sold | 1,345,495 | 1,806,482 | |||||||||
Shares issued on reinvestment of distributions | 344,805 | 199,051 | |||||||||
Shares repurchased | (4,533,196 | ) | (3,211,366 | ) | |||||||
Net decrease in capital shares | (2,842,896 | ) | (1,205,833 | ) | |||||||
Shares Outstanding, end of period | 16,324,820 | 19,167,716 | |||||||||
The accompanying notes are an integral part of these financial statements.
17

Purisima Total Return Fund
Financial Highlights
For a capital share outstanding throughout each year.
The following information should be read in conjunction with the financial statements and notes thereto appearing elsewhere in this Annual Report.
Year Ended August 31, | |||||||||||||||||||||||
2013 | 2012 | 2011 | 2010 | 2009 | |||||||||||||||||||
Net asset value, beginning of the period | $ | 18.92 | $ | 19.08 | $ | 16.14 | $ | 16.24 | $ | 20.25 | |||||||||||||
Income from investment operations: | |||||||||||||||||||||||
Net investment income | 0.20 | (1) | 0.20 | 0.20 | 0.14 | 0.19 | |||||||||||||||||
| Net realized and unrealized gain (loss) on investments | 2.20 | (0.17 | ) | 2.88 | (0.06 | ) | (3.79 | ) | |||||||||||||||
Total from investment operations | 2.40 | 0.03 | 3.08 | 0.08 | (3.60 | ) | |||||||||||||||||
Less distributions: | |||||||||||||||||||||||
From net investment income | (0.25 | ) | (0.19 | ) | (0.14 | ) | (0.17 | ) | (0.12 | ) | |||||||||||||
From net realized gain | (0.15 | ) | – | – | (0.01 | ) | (0.29 | ) | |||||||||||||||
Total distributions | (0.40 | ) | (0.19 | ) | (0.14 | ) | (0.18 | ) | (0.41 | ) | |||||||||||||
Net asset value, end of period | $ | 20.92 | $ | 18.92 | $ | 19.08 | $ | 16.14 | $ | 16.24 | |||||||||||||
Total return | 12.87 | % | 0.21 | % | 19.05 | % | 0.42 | % | (17.37 | %) | |||||||||||||
Ratios/supplemental data: | |||||||||||||||||||||||
Net assets, end of period (millions) | $ | 341.4 | $ | 362.6 | $ | 388.7 | $ | 343.2 | $ | 361.4 | |||||||||||||
Ratio of expenses to average net assets: | |||||||||||||||||||||||
| Before fees waived and expenses absorbed or recouped | 1.35 | % | 1.36 | % | 1.34 | % | 1.35 | % | 1.51 | % | |||||||||||||
| After fees waived and expenses absorbed or recouped | 1.35 | % | 1.36 | % | 1.34 | % | 1.36 | % | 1.50 | % | |||||||||||||
| Ratio of net investment income to average net assets | 0.97 | % | 0.99 | % | 0.92 | % | 0.75 | % | 1.37 | %(2) | |||||||||||||
Portfolio turnover rate | 12.54 | % | 101.90 | % | 35.06 | % | 10.82 | % | 22.04 | % | |||||||||||||
(1) Per share net investment income has been calculated using the daily average share method.
(2) Net of fees waived.
The accompanying notes are an integral part of these financial statements.
18

Purisima Total Return Fund
Notes to Financial Statements
August 31, 2013
NOTE 1 – ORGANIZATION
The Purisima Funds (the "Trust") was organized as a Delaware statutory trust on June 27, 1996 and is registered under the Investment Company Act of 1940, as amended (the "1940 Act") as an open-end management investment company issuing its shares in series. Each series represents a distinct portfolio with its own investment objectives and policies. The accompanying financial statements include the Total Return Fund (the "Fund"), which commenced operations on October 28, 1996, one of the two portfolios comprising the Trust. Fisher Asset Management, LLC (doing business as Fisher Investments) (the "Adviser") serves as the investment adviser to the Funds.
The investment objective of the Total Return Fund is as follows:
The Total Return Fund is a diversified fund and seeks a high total return. The Fund seeks to achieve its objective by investing in a portfolio allocated between domestic and foreign common stocks, fixed-income securities, money market instruments and other equity-type securities. The Fund's investments in different types of securities may vary significantly.
NOTE 2 – SIGNIFICANT ACCOUNTING POLICIES
The following is a summary of significant accounting policies consistently followed by the Fund in the preparation of its financial statements. These policies are in conformity with accounting principles generally accepted in the United States of America.
A. Security Valuation. Investments in securities traded on a national securities exchange are valued at the last sales price on the business day as of which such value is being determined. If on a particular day, an exchange-listed security does not trade, then the mean between the bid and asked prices will be used. Foreign exchange traded equity securities are valued based upon the price on the exchange or market on which they trade as of the close of business of such market or exchange immediately preceding the time the Fund's net asset value is determined. Investments in securities traded on the NASDAQ Global Market, the NASDAQ Global Select Market and the NASDAQ Capital Market will be valued at the NASDAQ Official Closing Price ("NOCP"), which may not necessarily represent the last sale price. Securities traded on an exchange or NASDAQ for which there have been no sales and other over-the-counter securities are valued at the closing price. Securities for which quotations are not readily available are valued at their respective fair values as determined in good faith by the Board of Trustees or their designee, taking into consideration: (I) fundamental analytical data relating to the investment; (II) the nature and duration of restrictions on disposition of the securities; and (III) an evaluation of the forces which influence the market in which these securities are purchased and sold. Debt securities with remaining maturities of 60
19

days or less are valued at amortized cost which, when combined with accrued interest, approximates market value.
B. Foreign Currency Translation. The Fund's records are maintained in U.S. dollars. The value of securities, currencies and other assets and liabilities denominated in currencies other than U.S. dollars are translated into U.S. dollars based upon foreign exchange rates prevailing at the end of the reporting period. Purchases and sales of investment securities, income and expenses are translated on the respective dates of such transactions.
The Fund does not isolate that portion of their net realized and unrealized gains and losses on investments resulting from changes in foreign exchange rates from the impact arising from changes in market prices. Such fluctuations are included with net realized and unrealized gain or loss from investments and foreign currency.
Net realized foreign currency transaction gains and losses arise from sales of foreign currencies, currency gains or losses realized between the trade and settlement dates on securities transactions, and the differences between the amounts of dividends, interest, and foreign withholding taxes recorded on the Fund books and the U.S. dollar equivalent of the amounts actually received or paid. Net unrealized foreign currency translation gains and losses arise from changes in the value of assets and liabilities, other than investments in securities, resulting from changes in the exchange rates.
C. Federal Income and Excise Taxes. The Fund intends to comply with the requirements of the Internal Revenue Code applicable to regulated investment companies and to distribute substantially all of its income to its shareholders. Therefore, no federal income or excise tax provision is required.
The Fund may be subject to foreign taxes on income, gains on investments or currency repatriation, a portion of which may be recoverable. The Fund will accrue such taxes and recoveries as applicable based upon its current interpretations of the tax rules and regulation that exist in the markets in which it invests.
The Fund recognizes the tax benefits of uncertain tax positions only where the position is "more likely then not" to be sustained assuming examination by tax authorities. Management has analyzed the Fund's tax positions, and has concluded that no liability for unrecognized tax benefits should be recorded related to uncertain tax positions taken on returns filed for open tax years (2010 – 2012), or expected to be taken in the Fund's 2013 tax returns. The Fund identifies its major tax jurisdictions as U.S. Federal and State of California. The Fund is not aware of any tax positions for which it is reasonably possible that the total amounts of unrecognized tax benefits will change materially in the next twelve months.
D. Security Transactions, Investment Income and Distributions. Security transactions are accounted for on trade date. Dividend income and distributions to shareholders are recorded on the ex-dividend date and interest income is recognized on the accrual basis. Realized gains and losses are evaluated on the bases of identified costs.
20

E. Use of Estimates. The presentation of financial statements in conformity with accounting principles generally accepted in the United States of America requires management to make estimates and assumptions that affect the reported amounts of assets and liabilities at the date of the financial statements and the reported amounts of revenue and expenses during the reporting period. Actual results could differ from those estimates and assumptions.
F. Concentration of Risk. Investments in securities of non-U.S. issues in certain countries involve special investment risks. These risks may include but are not limited to, investment restrictions, adverse political, social and economic developments, government involvement in the private sector, limited and less reliable investor information, lack of liquidity, certain local tax law considerations, and limited regulation of the securities markets.
G. Securities Sold Short. To the extent the Fund engages in selling securities short, it is obligated to replace a security borrowed by purchasing the same security at the current market value. The Fund would incur a loss if the price of the security increases between the date of the short sale and the date on which the Fund replaces the borrowed security. The Fund would realize a gain if the price of the security declines between those dates.
The Fund is required to establish a margin account with the broker lending the security sold short. While the short sale is outstanding, the broker retains the proceeds of the short sale and the Fund must also maintain a deposit with the broker consisting of cash having a value equal to a specified percentage of the value of the securities sold short.
H. Exchange-Traded Notes, Index-Linked Notes and Similar Instruments. The Fund may invest in leveraged and unleveraged exchange-traded notes, index-linked notes and similar instruments (collectively known as "Linked Notes"), which are senior, unsecured, unsubordinated debt securities whose returns are linked to the performance of a particular market benchmark or strategy minus applicable fees. Some Linked Notes are traded on an exchange (e.g., the New York Stock Exchange) during normal trading hours. Other Linked Notes may be directly sold by the issuer, such as a larger broker-dealer, and are not traded. At maturity, the issuer pays to the investor a cash amount equal to the principal amount, subject to the applicable market benchmark or strategy factor. Linked Notes that are not traded may be subject to a holding period until maturity during which an early redemption fee or other charges may apply.
Linked Notes are subject to credit risk and the value of a Linked Note may drop because of a downgrade in the issuer's credit rating, despite the underlying market benchmark or strategy remaining unchanged. Linked Notes may not make periodic coupon payments or provide principal protection. The value of a Linked Note may also be influenced by time to maturity, level of supply and demand for the Linked Note, volatility and lack of liquidity in underlying assets, changes in the applicable interest rates, changes in the issuer's credit rating, and economic, legal, political, or geographic events that affect the referenced underlying asset. The issuer of a Linked Note may not
21

be required to maintain the listing and there can be no assurance that a secondary market will exist for a Linked Note. In addition, no assurance can be given that the Internal Revenue Service will accept, or a court will uphold, how the Fund characterizes and treats Linked Notes for tax purposes. Some Linked Notes that use leverage may multiply the market effect on the value of the instrument and, at times, be relatively illiquid and, thus, they may be difficult to purchase or sell at a fair price. Leveraged Linked Notes are subject to the same risks, such as greater volatility, costs and the potential for increased losses, as other instruments that use leverage in any form.
A Linked Note that is tied to a specific market benchmark or strategy may not be able to replicate and maintain exactly the composition and relative weighting of securities, commodities or other components in the applicable market benchmark or strategy. The market value of Linked Notes may differ from their market benchmark or strategy because the supply and demand in the market for Linked Notes at any point in time is not always identical to the supply and demand in the market for the securities, commodities or other components underlying the market benchmark or strategy that the Linked Note seeks to track. As a result, there may be times when a traded Linked Note trades at a premium or discount to its market benchmark or strategy.
I. Accounting for Derivatives. The Fund is required to disclose additional information regarding use of derivatives. This is the risk that an investment in derivatives may not correlate completely to the performance of the underlying securities and may be volatile and that the insolvency of the counterparty to a derivative instrument could cause the Fund to lose all or substantially all of its investment in the derivative instrument, as well as the benefits derived therefrom.
The Fund currently invests in derivatives to give the Fund additional exposure to the Russell 1000 Growth Index without investing directly in each of the underlying securities of the index.
J. Reclassification of Capital Accounts. Accounting principles generally accepted in the United States of America require that certain components of net assets relating to permanent difference be reclassified between financial and tax reporting. These reclassifications are primarily related to gains or losses on foreign currency and foreign tax gains and have no effect on net assets or net asset value per share. For the year ended August 31, 2013, the Total Return Fund decreased accumulated undistributed net investment income by $90,718, and increased accumulated net realized gain on investments by $90,718.
K. Indemnification Obligations. Under the Fund's organizational documents, its current and former officers and trustees are indemnified against certain liabilities arising out of the performance of their duties to the Fund. In addition, in the normal course of business, the Fund enters into contracts that contain a variety of representations and warranties that provide general indemnifications. The Fund's maximum exposure under these arrangements is unknown as this would involve future claims that may be made against the Fund that have not yet occurred or that would be covered by other parties.
22

L. Line of Credit. The Fund has a Loan Agreement with U.S. Bank N.A. Under the terms of the Loan Agreement, the Fund's borrowings cannot exceed the lesser of $8,000,000 or 33 1/3% of the net assets of the Fund. The interest rate paid on the Loan equals the prime rate per annum, payable monthly.
Borrowing activity under the Loan Agreement for the year ended August 31, 2013, was as follows:
| Maximum Amount Outstanding | Interest Expense | Amount Outstanding at August 31, 2013 | Average Amount Outstanding | Average Interest Rate | |||||||||||||||
| $ | 2,878,000 | $ | 337 | $ | – | $ | 10,364 | 2.75 | % | ||||||||||
NOTE 3 – COMMITMENTS, OTHER RELATED PARTY TRANSACTIONS AND OTHER SERVICE PROVIDERS
The Fund has an Investment Management Agreement with the Adviser to provide investment advisory services to the Fund. The Adviser furnishes all investment advice, office space, facilities, and most of the personnel needed by the Fund. As compensation for its services, the Adviser is entitled to a monthly fee at the annual rate of 1.00% of the Fund's average daily net assets.
The Fund is responsible for its own operating expenses. The Adviser has contractually agreed to limit the Fund's total expenses (exclusive of brokerage, interest, taxes, dividends on securities sold short, acquired fund fees, and extraordinary expenses) to not more than 1.50% of the average daily net assets.
Any fee withheld and/or any Fund expense absorbed by the Adviser pursuant to an agreed upon expense cap shall be reimbursed by the Fund to the Adviser, if so requested by the Adviser, anytime before the end of the third fiscal year following the year to which the fee reduction, waiver, or expense absorption relates, provided the aggregate amount of the Fund's current operating expenses for such fiscal year does not exceed the applicable limitation on Fund expenses in place at the time the expenses were waived. Any such reimbursement is also contingent upon Board of Trustees review and approval prior to the time the reimbursement is initiated. The Fund must pay its current ordinary operating expenses before the Adviser is entitled to any reimbursement of fees and/or expenses. For the year ended August 31, 2013, the Advisor had previously recouped all fees previously waived and expenses absorbed from the Total Return Fund.
U.S. Bank, N.A. serves as the Fund's Custodian. U.S. Bancorp Fund Services, LLC ("USBFS"), an affiliate of U.S. Bank, N.A., serves as the Administrator, Fund Accountant and Transfer Agent. In its capacity as the Fund's Administrator, USBFS provides general fund management including corporate secretarial services, coordinates the preparation of materials for the Board of Trustees, assists with the annual audit of the Fund's financial statements, monitors the Fund's compliance with federal and state regulations as well as investment restrictions, coordinates the payment of Fund expenses and monitors expense accruals, prepares
23

financial statements and non-investment related statistical data and makes required tax reporting calculations. For the year ended August 31, 2013, Purisima Total Return Fund paid USBFS $277,344 for services rendered in its capacity as the Trust's Administrator.
Quasar Distributors, LLC, an affiliate of U.S. Bank, N.A. and USBFS, serves as principal underwriter of the Fund and acts as the Fund's distributor in a continuous public offering of the Fund's shares.
NOTE 4 – SERVICE AND DISTRIBUTION PLAN
The Trust has adopted a Service and Distribution Plan (the "Plan") pursuant to Rule 12b-1 under the 1940 Act. Under the Plan, the Total Return Fund is authorized to pay expenses incurred for the purpose of financing activities, including the employment of other dealers, intended to result in the sale of shares of the Fund. The fee accrues at an annual rate not to exceed 0.25% of the Fund's average daily net assets. For the year ended August 31, 2013, the Fund incurred $319,415 in distribution fees. Quasar Distributors, LLC, an affiliate of U.S. Bank, N.A. and USBFS, serves as distributor of the Fund pursuant to a Distribution Agreement with the Trust.
NOTE 5 – INVESTMENT TRANSACTIONS
The cost of purchases and the proceeds from sales of securities, excluding U.S. Government securities and short-term investments, for the year ended August 31, 2013 were as follows:
Fund | Purchases | Sales | |||||||||
Total Return Fund | $ | 43,854,424 | $ | 104,064,556 | |||||||
NOTE 6 – OTHER DERIVATIVES INFORMATION
At August 31, 2013, the Fund had invested in exchange traded notes reflected in the Statement of Assets and Liabilities as follows:
| Statement of Assets and Liabilities Location | Fair Value Amount | ||||||||||
Exchange Traded Notes | Investments at value | $ | 30,646,485 | ||||||||
For the period ended August 31, 2013, the effect of the exchange traded notes on the Fund's Statement of Operations was as follows:
| Net Realized Gain (Loss) | Net Change in Unrealized Appreciation/Depreciation on Investments | ||||||||||
Exchange Traded Notes | $ | 588,542 | $ | 1,989,701 | |||||||
NOTE 7 – FAIR VALUE OF FINANCIAL INSTRUMENTS
The Funds follow a fair value hierarchy that distinguishes between market data obtained from independent sources (observable inputs) and the Funds' own market assumptions
24

(unobservable inputs). These inputs are used in determining the value of each Fund's investments and are summarized in the following fair value hierarchy:
Level 1 – Unadjusted quoted prices in active markets for identical assets and liabilities that the Fund has the ability to access.
Level 2 – Observable inputs other than quoted prices included in Level 1 that are observable for the asset or liability, either directly or indirectly. These inputs may include quoted prices for the identical instrument on an inactive market, prices for similar instruments, interest rates, prepayment speeds, credit risk, yield curves, default rates and similar data.
Level 3 – Unobservable inputs for the asset or liability, to the extent relevant observable inputs are not available, representing the Fund's own assumptions, based on the best information available, about the assumptions a market participant would use in valuing the asset or liability.
The availability of observable inputs can vary from security to security and is affected by a wide variety of factors, including, for example, the type of security, whether the security is new and not yet established in the marketplace, the liquidity of markets, and other characteristics particular to the security. To the extent that valuation is based on models or inputs that are less observable or unobservable in the market, the determination of fair value requires more judgment. Accordingly, the degree of judgment exercised in determining fair value is greatest for instruments categorized in Level 3.
The inputs used to measure fair value may fall into different levels of the fair value hierarchy. In such cases, for disclosure purpose, the level in the fair value hierarchy within which the fair value measurement falls in its entirety, is determined based on the lowest level input that is significant to the fair value measurement in its entirety.
The inputs or methodology used for valuing securities are not necessarily an indication of the risk associated with investing in those securities. The following tables summarize the inputs used as of August 31, 2013 for the Fund's assets and liabilities measured at fair value:
Description | Level 1 | Level 2 | Level 3 | Total | |||||||||||||||
Equity | |||||||||||||||||||
Common Stocks | $ | 308,867,385 | $ | 83,087 | $ | – | $ | 308,950,472 | |||||||||||
Exchange Traded Notes | 30,646,485 | – | – | 30,646,485 | |||||||||||||||
Total Equity | 339,513,870 | 83,087 | – | 339,596,957 | |||||||||||||||
Short-Term Investments | 1,131,340 | – | – | 1,131,340 | |||||||||||||||
| Total Investments in Securities* | $ | 340,645,210 | $ | 83,087 | $ | – | $ | 340,728,297 | |||||||||||
* Please refer to the Schedule of Investments for country breakdown.
25

There were no transfers between Level 1 and Level 2 during the period as compared to their classification in the previous annual report. The Fund did not hold any Level 3 securities during the year ended August 31, 2013.
NOTE 8 – FEDERAL INCOME TAX MATTERS
The difference between the book and tax basis components of the distributable earnings relate principally to the timing of recognition of income and gains for federal income tax purposes. These differences are primarily attributable to the tax deferral of losses on wash sales, the realization for tax purposes of unrealized gains on passive foreign investment companies and return of capital distributions and income adjustments recognized for tax purposes on real estate investment trusts. Short-term gains distributions reported in the Statements of Changes of Net Assets, if any, are reported as ordinary income for federal tax purposes.
As of August 31, 2013, the Fund's most recent fiscal year end, the components of distributable earnings on a tax basis were as follows:
Total Return | |||||||
Cost of investments for tax purposes | $ | 289,341,460 | |||||
Gross tax unrealized appreciation | $ | 56,653,237 | |||||
Gross tax unrealized depreciation | (5,266,400 | ) | |||||
Net unrealized currency appreciation | (2,351 | ) | |||||
Net tax unrealized appreciation | 51,384,486 | ||||||
Undistributed ordinary income | 5,884,302 | ||||||
Undistributed long-term capital gains | 2,535,946 | ||||||
Total distributable earnings | 8,420,248 | ||||||
Other accumulated loss | – | ||||||
Total accumulated gain | $ | 59,804,734 | |||||
The tax character of distributions paid during the fiscal years ended August 31, 2013 and 2012 were as follows:
| Ordinary Income | Long Term Capital Gains | ||||||||||
Total Return Fund | |||||||||||
8/31/2013 | $ | 4,812,521 | $ | 2,356,674 | |||||||
8/31/2012 | $ | 3,796,140 | $ | – | |||||||
NOTE 9 – RECENT ACCOUNTING PRONOUNCEMENT
In December 2011, the Financial Accounting Standards Board issued Accounting Standards Update 2011-11 Disclosures about Offsetting Assets and Liabilities ("ASU 2011-11"). Effective for annual reporting periods beginning on or after January 1, 2013 and interim periods within those annual periods, ASU 2011-11 is intended to enhance disclosure requirements on the offsetting of financial assets and liabilities. At this time, Management is evaluating the implications of ASU 2011-11 and its impact on the financial statements.
26

NOTE 10 – SUBSEQUENT EVENTS
The Fund is required to recognize in the financial statements the effect of all subsequent events that provide additional evidence about conditions that existed at the date of the Statement of Assets and Liabilities. For non-recognized subsequent events that must be disclosed to keep the financial statements from being misleading, the Fund is required to disclose the nature of the event as well as an estimate of its financial effect, or a statement that such an estimate cannot be made. Management has evaluated subsequent events through the issuance of these financial statements and has noted no such events.
27

REPORT OF INDEPENDENT REGISTERED PUBLIC ACCOUNTING FIRM
TO THE SHAREHOLDERS AND BOARD OF TRUSTEES
THE PURISIMA FUNDS
WOODSIDE, CALIFORNIA
We have audited the accompanying statement of assets and liabilities of the Purisima Total Return Fund (the "Fund"), a series of The Purisima Funds, including the schedule of investments as of August 31, 2013, and the related statement of operations for the year then ended, the statements of changes in net assets for each of the two years in the period then ended, and the financial highlights for each of the five years in the period then ended. These financial statements and financial highlights are the responsibility of the Fund's management. Our responsibility is to express an opinion on these financial statements and financial highlights based on our audits.
We conducted our audits in accordance with the standards of the Public Company Accounting Oversight Board (United States). Those standards require that we plan and perform the audit to obtain reasonable assurance about whether the financial statements and financial highlights are free of material misstatement. The Fund is not required to have, nor were we engaged to perform, an audit of its internal control over financial reporting. Our audits included consideration of internal control over financial reporting as a basis for designing audit procedures that are appropriate in the circumstances, but not for the purpose of expressing an opinion on the effectiveness of the Fund's internal control over financial reporting. Accordingly, we express no such opinion. An audit includes examining, on a test basis, evidence supporting the amounts and disclosures in the financial statements, assessing the accounting principles used and significant estimates made by management, as well as evaluating the overall financial statement presentation. Our procedures included confirmation of securities owned as of August 31, 2013, by correspondence with the custodian and brokers or by other appropriate auditing procedures where replies from brokers were not received. We believe that our audits provide a reasonable basis for our opinion.
In our opinion, the financial statements and financial highlights referred to above present fairly, in all material respects, the financial position of the Purisima Total Return Fund as of August 31, 2013, the results of its operations for the year then ended, the changes in its net assets for each of the two years in the period then ended, and the financial highlights for each of the five years in the period then ended, in conformity with accounting principles generally accepted in the United States of America.
TAIT, WELLER & BAKER LLP
Philadelphia, Pennsylvania
October 25, 2013
28

Purisima Total Return Fund
Other Information
PROXY VOTING PROCEDURES (UNAUDITED)
The Adviser votes proxies relating to portfolio securities in accordance with procedures that have been approved by the Trust's Board of Trustees. You may obtain a description of these procedures, free of charge, by calling toll-free 1-800-841-0199. This information is also available through the Securities and Exchange Commission's website at http://www.sec.gov.
Information regarding how the Fund voted proxies relating to the portfolio securities during the most recent 12-month period ended June 30 is available without charge, upon request, by calling toll-free 1-800-841-0199. This information is also available through the Securities and Exchange Commission's website at http://www.sec.gov.
FORM N-Q DISCLOSURE (UNAUDITED)
The Fund files its complete schedule of portfolio holdings with the SEC for the first and third fiscal quarters on Form N-Q. The Fund's Form N-Q is available without charge, upon request, by calling 1-800-841-0199. Furthermore, you can obtain the Form N-Q on the SEC's website at www.sec.gov.
TAX NOTICE (UNAUDITED)
For the fiscal year ended August 31, 2013, certain dividends paid by the Fund may be subject to a maximum tax rate of 15%, as provided by the Jobs and Growth Tax Relief Reconciliation Act of 2003. The Fund designates 100% of dividends declared from ordinary income as qualified dividend income.
For corporate shareholders, the percent of the Fund's ordinary income distribution qualifying for the corporate dividends received deduction for the fiscal year ended August 31, 2013 was 90.27%.
Additional information applicable to foreign shareholders only: The percent of taxable ordinary income distributions that are designated as short-term capital gain distributions for the year ended August 31, 2013 was 6.52%.
29

Purisima Total Return Fund
Trustees and Officer Information (Unaudited)
The Board of Trustees is responsible for the overall management of the Trust's business. The Board of Trustees approves all significant agreements between the Trust and persons or companies furnishing services to it, including all agreements with the Adviser, Administrator, Custodian and Transfer Agent. The Board of Trustees delegates the day-to-day operations of the Trust to its Officers, subject to the Fund's investment objective and policies and to general supervision by the Board of Trustees. The Statement of Additional Information includes additional information about the Trust's Trustees and is available, without charge, by calling 1-800-841-0199.
The Trustees and Officers of the Trust, their business addresses and principal occupations during the past five years are:
| Name, Address, Date of Birth | Position(s) Held with Trust | Year Elected1 | Principal Occupation(s) During Past Five Years | Number of Portfolios in Fund Complex Overseen by Director | Other Directorships Held | ||||||||||||||||||
| Kenneth L. Fisher* (born 1950) 5525 NW Fisher Creek Dr. Camas, WA 98607 | President | 1996 | Chief Executive Officer and majority shareholder of Fisher Investments, Inc., the sole shareholder of the Adviser, and has served in such capacities since the incorporation of the Adviser in 1986. Prior thereto, he was the founder of Fisher Investments, a sole proprietorship which commenced operations in 1979. | N/A | None | ||||||||||||||||||
| Pierson E. Clair III (born 1948) 5525 NW Fisher Creek Dr. Camas, WA 98607 | Trustee | 1996 | President and Chief Executive Officer of Brown & Haley since 1998 (fine confectioners); Vice President of Blummer Chocolate Company from 1980 to 1997, where he had been employed since 1970. | 2 | Signature Foods, Inc. | ||||||||||||||||||
| Scott LeFevre (born 1957) 5525 NW Fisher Creek Dr. Camas, WA 98607 | Trustee | 2001 | Sole proprietor of LeFevre Capital Management. | 2 | None | ||||||||||||||||||
| Alfred D. McKelvy, Jr. (born 1948) 5525 NW Fisher Creek Dr. Camas, WA 98607 | Trustee | 2003 | Executive Director of the law firm of Berding & Weil, LLP since 1990. | 2 | Diablo Valley Bank; East Bay BOMA. | ||||||||||||||||||
| Bryan F. Morse (born 1952) 5525 NW Fisher Creek Dr. Camas, WA 98607 | Trustee | 1996 | Retired. Prior to retirement, sole proprietor of Bryan F. Morse, RIA, a registered investment adviser from 1990 to 2010. | 2 | None | ||||||||||||||||||
30

31

| Name, Address, Date of Birth | Position(s) Held with Trust | Year Elected1 | Principal Occupation(s) During Past Five Years | Number of Portfolios in Fund Complex Overseen by Director | Other Directorships Held | ||||||||||||||||||
| Grover T. Wickersham (born 1949) 5525 NW Fisher Creek Dr. Camas, WA 98607 | Trustee | 1996 | Attorney in private practice in Palo Alto, California. Prior to entering private practice in June of 1981, served as a Branch Chief of the Los Angeles Regional Office of the U.S. Securities and Exchange Commission. | 2 | None | ||||||||||||||||||
| Tom Fishel (born 1960) 5525 NW Fisher Creek Dr. Camas, WA 98607 | Chief Compliance Officer | 2005 | Chief Compliance Officer of the Adviser. Vice President of Charles Schwab & Co., Inc. from 1995 to 2004, where he had been employed since 1983. | ||||||||||||||||||||
| Katherine Taylor (born 1966) 5525 NW Fisher Creek Dr. Camas, WA 98607 | Treasurer | 2011 | Group Vice President of Finance and Treasurer of the Advisor where she has been employed since 2003. | ||||||||||||||||||||
| Nicole Gerrard Lightner (born 1970) 5525 NW Fisher Creek Dr. Camas, WA 98607 | Secretary | 2011 | In-house legal counsel for the Adviser since 2006 and Secretary of the Adviser since 2008. Prior to joining the Adviser, she was an attorney at Paul Hastings LLP from 2000-2006 and at a Canadian law firm from 1998-2000. | ||||||||||||||||||||
1 Trustees and officers of the Funds serve until their resignation, removal or retirement.
* "Interested person" of the Trust, as defined in the 1940 Act.
32

33

PRIVACY NOTICE
FACTS | WHAT DOES THE PURISIMA FUNDS DO WITH YOUR PERSONAL INFORMATION? | ||||||
Why? | Financial companies choose how they share your personal information. Federal law gives consumers the right to limit some but not all sharing. Federal law also requires us to tell you how we collect, share, and protect your personal information. Please read this notice carefully to understand what we do. | ||||||
What? | The types of personal information we collect and share depend on the product or service you have with us. This information can include: • Social Security number and payment history • Account balances and account transactions • Assets and transaction history When you are no longer our customer, we continue to share your information as described in this notice. | ||||||
How? | All financial companies need to share customers' personal information to run their everyday business. In the section below, we list the reasons financial companies can share their customers' personal information; the reasons The Purisima Funds chooses to share; and whether you can limit this sharing. | ||||||
Reasons we can share your personal information | Does The Purisima Funds share? | Can you limit this sharing? | |||||||||
| For our everyday business purposes – such as to process your transactions, maintain your account(s), respond to court orders and legal investigations, or report to credit bureaus | Yes | No | |||||||||
| For our marketing purposes – to offer our products and services to you | Yes | No | |||||||||
For joint marketing with other financial companies | No | No | |||||||||
| For our affiliates' everyday business purposes – information about your transactions and experiences | Yes | No | |||||||||
| For our affiliates' everyday business purposes – information about your creditworthiness | No | No | |||||||||
For nonaffiliates to market to you | No | No | |||||||||
Questions? | Call 1-800-550-1071 | ||||||
Who we are | |||||||
Who is providing this notice? | The Purisima Funds | ||||||
34

What we do | |||||||
How does The Purisima Funds protect my personal information? | To protect your personal information from unauthorized access and use, we use security measures that comply with federal law. These measures include computer safeguards and secured files and buildings. The Purisima Funds has adopted internal policies to protect your non-public personal information. | ||||||
How does The Purisima Funds collect my personal information? | We collect your personal information, for example, when you • Open an account or provide account information • Make deposits or withdrawals from your account or make a wire transfer • Give us your contact information We also collect your personal information from others, such as credit bureaus, affiliates, or other companies. | ||||||
Why can't I limit all sharing? | Federal law gives you the right to limit only • sharing for affiliates' everyday business purposes-information about your creditworthiness • affiliates from using your information to market to you • sharing for nonaffiliates to market to you State laws and individual companies may give you additional rights to limit sharing. | ||||||
Definitions | |||||||
Affiliates | Companies related by common ownership or control. They can be financial and nonfinancial companies. • Our affiliate is Fisher Investments. | ||||||
Nonaffiliates | Companies not related by common ownership or control. They can be financial and nonfinancial companies. • The Purisima Funds does not share with nonaffiliates so they can market to you. | ||||||
Joint marketing | A formal agreement between nonaffiliated financial companies that together market financial products or services to you. • The Purisima Funds does not jointly market. | ||||||
Other important information | |||||||
This privacy notice applies to individual consumers who are customers or former customers. This privacy notice replaces all previous notices of our consumer privacy policy, and may be amended at any time. We will keep you informed of changes or amendments as required by law.
35
This page is intentionally left blank.

The Purisima Funds
Annual Report
August 31, 2013
The Purisima All-Purpose Fund
Table of Contents
A Letter to Our Shareholders | 1 |
Performance Summary | 2 |
Sector Breakdown | 3 |
Expense Example | 4 |
Schedule of Investments | 6 |
Statement of Assets and Liabilities | 7 |
Statement of Operations | 8 |
Statement of Changes in Net Assets | 9 |
Financial Highlights | 10 |
Notes to Financial Statements | 11 |
Report of Independent Registered Public Accounting Firm | 19 |
Other Information | 20 |
Trustees and Officer Information | 21 |
Privacy Notice | 23 |
A Letter to Our Shareholders
Welcome to the annual report for the Purisima All-Purpose Fund for the 12-month period ending August 31, 2013. The Fund seeks positive total returns over the long-term regardless of market conditions in the U.S. and foreign equity markets. During the period, the Fund was primarily invested in US government securities and cash equivalents.
Thank you for your continued interest and support.
Sincerely,
Kenneth L. Fisher
Chairman and Co-Chief Investment Officer
Fisher Investments
Opinions expressed above are those of Kenneth L. Fisher and are subject to change, are not guaranteed and should not be considered recommendations to buy or sell any security.
Fund holdings and sector allocations are subject to change and are not recommendations to buy or sell any security.
Mutual fund investing involves risk. Principal loss is possible. The Fund may use short sales of securities, which involve the risk that losses may exceed the original amount invested. Derivative securities, which derive their performance from the performance of an underlying asset, index, interest rate or currency exchange rate can be volatile and involve various types and degrees of risks. Depending on the characteristics of the particular derivative, it could become illiquid. The Fund may also use options and futures contracts, which have the risks of unlimited losses of the underlying holdings due to unanticipated market movements and failure to correctly predict the direction of securities prices, interest rates and currency exchange rates. The Fund may invest in foreign securities which involve greater volatility and political, economic and currency risks and differences in accounting methods. The Fund may invest in debt securities which typically decrease in value when interest rates rise. This risk is greater for longer-term debt securities. The fund may invest in small capitalization companies which tend to have limited liquidity and greater price volatility than larger-capitalization companies. The Fund may use leverage, which may adversely impact performance. Because the funds may invest in ETFs, they are subject to additional risks that do not apply to conventional mutual funds, including the risks that the market price of an ETF’s shares may trade at a discount to its net asset value (“NAV”), an active secondary trading market may not develop or be maintained, or trading may be halted by the exchange in which they trade, which may impact a Fund’s ability to sell its shares.
The Fund is non-diversified, meaning it may concentrate its assets in fewer individual holdings than a diversified fund. Therefore, the Fund is more exposed to individual stock volatility than a diversified fund. An investment in the Fund is not suitable for all investors.
This material must be preceded or accompanied by a prospectus.
Fisher Investments is the Adviser to The Purisima Funds. The Purisima Funds are distributed by Quasar Distributors, LLC. 09/13
Performance Summary (Unaudited)
For year ended August 31, 2013
Purisima All-Purpose Fund
Growth of $25,000
Purisima All-Purpose Fund cumulative total return versus Merrill Lynch U.S. Treasury Bills 0-3 Months Index $25,000 invested from Fund inception on 11/01/05 to 8/31/13*
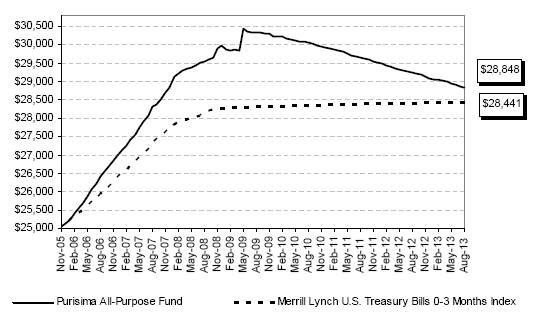
One-Year |
|
|
|
|
|
|
|
Annual Total Return** |
| -1.34 | % |
|
|
|
|
Since Inception (11/01/2005) |
|
|
|
|
|
|
|
Cumulative Total Return(1)** |
| 15.39 | % |
Average Annual Total Return(2)** |
| 1.85 | % |
|
|
|
|
One-Year |
|
|
|
|
|
|
|
Annual Total Return** |
| 0.11 | % |
|
|
|
|
Since Fund Inception (11/01/2005) |
|
|
|
|
|
|
|
Cumulative Total Return(1)** |
| 13.76 | % |
Average Annual Total Return(2)** |
| 1.66 | % |
Please note past performance is not predictive of future results. Share price and return will fluctuate, and investors may experience a gain or loss when they sell their shares. To obtain a prospectus on the Purisima Funds please call 1-800-841-0199. The prospectus contains more information, including the political, economic, currency risks and potential volatility of foreign investing. Read the prospectus carefully before investing.
(1) Cumulative total return measures the change in value of an investment over the periods indicated and reflects all fund fees and expenses.
(2) Average annual total return represents the average annual change in value of an investment over the periods indicated and reflects all fund fees and expenses. Average annual total return and cumulative total return for the one-year period would be identical.
* The Merrill Lynch US Treasury Bills 0-3 Months Index is an unmanaged index of Treasury securities that assumes reinvestment of all income.
** The total returns shown do not reflect the deduction of taxes a shareholder would pay on fund distributions or redemption of fund shares. The total return reflects the rate an investment would have earned (or lost) on an investment in the Fund, assuming reinvestment of all dividends and distributions.
Sector Breakdown(1) (Unaudited)
Purisima All-Purpose Fund
U.S. Treasury Obligations |
| 67.53 | % |
Mutual Funds |
| 32.47 |
|
Total |
| 100.00 | % |
(1)Percentage of Total Investments as of August 31, 2013.
Important Information
The following disclosure provides important information regarding the Fund’s Expense Example. Please refer to this information when reviewing the Expense Example for the Fund.
Expense Example (Unaudited)
As a shareholder of the Fund, you incur two types of costs: (1) transaction costs; and (2) ongoing costs, including management fees and other fund expenses. This Example is intended to help you understand your ongoing costs (in dollars) of investing in the Fund and to compare these costs with the ongoing costs of investing in other mutual funds.
The Example is based on an investment of $1,000 invested at the beginning of the period indicated and held for the entire period from March 1, 2013 to August 31, 2013 for the Purisima All-Purpose Fund.
Actual Expenses
The information in the table under the heading “Actual Performance” provides information about actual account values and actual expenses. You may use the information in these columns together with the amount you invested, to estimate the expenses that you paid over the period. Simply divide your account value by $1,000 (for example, an $8,600 account value divided by $1,000 = 8.6), then multiply the result by the number in the row entitled “Expenses Paid During Period” to estimate the expenses you paid on your account during this period.
Hypothetical Example for Comparison Purposes
The information in the table under the heading “Hypothetical Performance (5% return before expenses)” provides information about hypothetical account values and hypothetical expenses based on the Fund’s actual expense ratios and assumed rates of return of 5% per year before expenses, which are not the Fund’s actual returns. The hypothetical account values and expenses may not be used to estimate the actual ending account balance or expenses you paid for the period. You may use this information to compare the ongoing costs of investing in the Fund and other funds. To do so, compare this 5% hypothetical example with the 5% hypothetical examples that appear in the shareholder reports of the other funds.
Please note that the expenses shown in the table are meant to highlight your ongoing costs only and do not reflect any transaction costs, such as sales charges (loads), or redemption fees. Therefore, the information under the heading “Hypothetical Performance (5% return before expenses)” is useful in comparing ongoing costs only, and will not help you determine the relative total costs of owning different funds. In addition, if these transactional costs were included, your costs would have been higher.
EXPENSE EXAMPLE (Unaudited)
Purisima All-Purpose Fund |
| Actual |
| Hypothetical Performance |
| ||
Beginning Account Value (03/01/13) |
| $ | 1,000.00 |
| $ | 1,000.00 |
|
Ending Account Value (08/31/13) |
| $ | 992.70 |
| $ | 1,017.64 |
|
Expenses Paid During Period(1) |
| $ | 7.53 |
| $ | 7.63 |
|
(1)Expenses are equal to the Fund’s annualized expense ratio of 1.50%, multiplied by the average account value over the period, multiplied by 184/365 to reflect the one-half year period.
Purisima All-Purpose Fund
Schedule of Investments
August 31, 2013
Principal Amount |
|
|
| Value |
| ||
|
| U.S. TREASURY NOTES: 63.67% |
|
|
| ||
$ | 30,000 |
| 2.375%, 08/31/2014 |
| $ | 30,660 |
|
|
|
|
|
|
| ||
|
| TOTAL U.S. TREASURY NOTES |
| 30,660 |
| ||
|
|
|
|
|
| ||
Number of Shares |
|
|
| Value |
| ||
|
| MUTUAL FUNDS: 30.61% |
|
|
| ||
14,743 |
| SEI Daily Income Trust Government Fund |
| 14,743 |
| ||
|
|
|
|
|
| ||
|
| TOTAL MUTUAL FUNDS |
| 14,743 |
| ||
|
|
|
|
|
| ||
|
| TOTAL INVESTMENTS: 94.28% |
| 45,403 |
| ||
|
|
|
|
|
| ||
|
| Other Assets in Excess of Liabilities: 5.72% |
| 2,753 |
| ||
|
|
|
|
|
| ||
|
| TOTAL NET ASSETS: 100.00% |
| $ | 48,156 |
| |
The accompanying notes are an integral part of these financial statements.
Purisima All-Purpose Fund
Statement of Assets and Liabilities
August 31, 2013
ASSETS: |
|
|
| |
Investments at value (cost $45,384) |
| $ | 45,403 |
|
Interest and dividends receivable |
| 359 |
| |
Receivable from Adviser |
| 10,859 |
| |
Prepaid expenses |
| 15,088 |
| |
Total Assets |
| 71,709 |
| |
|
|
|
| |
LIABILITIES: |
|
|
| |
Accrued fund administration, fund accounting, transfer agent and custody fees |
| 15,980 |
| |
Accrued expenses |
| 7,573 |
| |
Total Liabilities |
| 23,553 |
| |
|
|
|
| |
NET ASSETS |
| $ | 48,156 |
|
|
|
|
| |
Number of shares issued and outstanding (unlimited shares authorized, $0.01 par value) |
| 5,041 |
| |
|
|
|
| |
Net asset value, redemption price and offering price per share |
| $ | 9.55 |
|
|
|
|
| |
COMPONENTS OF NET ASSETS: |
|
|
| |
Paid-in capital |
| $ | 48,569 |
|
Undistributed net investment loss |
| (432 | ) | |
Net unrealized appreciation on investments |
| 19 |
| |
Net Assets |
| $ | 48,156 |
|
The accompanying notes are an integral part of these financial statements.
Purisima All-Purpose Fund
Statement of Operations
For the Year Ended August 31, 2013
INVESTMENT INCOME: |
|
|
| |
Interest income |
| $ | 65 |
|
Total Investment Income |
| 65 |
| |
|
|
|
| |
EXPENSES: |
|
|
| |
Investment advisory fees (Note 3) |
| 485 |
| |
Administration fees (Note 3) |
| 39,137 |
| |
Fund accounting fees |
| 35,465 |
| |
Trustees fees |
| 23,000 |
| |
Registration fees |
| 22,144 |
| |
Transfer agent fees |
| 15,018 |
| |
Reports to shareholders |
| 5,755 |
| |
Audit fees |
| 4,515 |
| |
Custody fees |
| 3,101 |
| |
Legal fees |
| 1,415 |
| |
Miscellaneous expenses |
| 492 |
| |
Total expenses |
| 150,527 |
| |
Expenses waived and reimbursed by Adviser (Note 3) |
| (149,800 | ) | |
|
|
|
| |
Net expenses |
| 727 |
| |
|
|
|
| |
Net investment loss |
| (662 | ) | |
|
|
|
| |
UNREALIZED GAIN ON INVESTMENTS: |
|
|
| |
Change in net unrealized appreciation/depreciation on investments |
| 19 |
| |
Net unrealized gain on investments |
| 19 |
| |
|
|
|
| |
Net decrease in net assets resulting from operations |
| $ | (643 | ) |
The accompanying notes are an integral part of these financial statements.
Purisima All-Purpose Fund
Statement of Changes in Net Assets
|
| Year Ended |
| Year Ended |
| ||
OPERATIONS: |
|
|
|
|
| ||
Net investment loss |
| $ | (662 | ) | $ | (688 | ) |
Change in net unrealized appreciation/depreciation on investments |
| 19 |
| (16 | ) | ||
Net decrease in net assets resulting from operations |
| (643 | ) | (704 | ) | ||
|
|
|
|
|
| ||
CAPITAL SHARE TRANSACTIONS: |
|
|
|
|
| ||
Proceeds from shares sold |
| — |
| 145 |
| ||
Cost of shares redeemed |
| (75 | ) | (70 | ) | ||
Net increase (decrease) from capital share transactions |
| (75 | ) | 75 |
| ||
|
|
|
|
|
| ||
Total decrease in net assets |
| (718 | ) | (629 | ) | ||
|
|
|
|
|
| ||
NET ASSETS: |
|
|
|
|
| ||
Beginning of period |
| 48,874 |
| 49,503 |
| ||
End of period |
| $ | 48,156 |
| $ | 48,874 |
|
|
|
|
|
|
| ||
Undistributed net investment loss |
| $ | (432 | ) | $ | (464 | ) |
|
|
|
|
|
| ||
CHANGE IN CAPITAL SHARES: |
|
|
|
|
| ||
Shares outstanding, beginning of period |
| 5,049 |
| 5,041 |
| ||
Shares sold |
| — |
| 15 |
| ||
Shares repurchased |
| (8 | ) | (7 | ) | ||
Net increase (decrease) in capital shares |
| (8 | ) | 8 |
| ||
Shares outstanding, end of period |
| 5,041 |
| 5,049 |
| ||
The accompanying notes are an integral part of these financial statements.
Purisima All-Purpose Fund
Financial Highlights
For a capital share outstanding throughout each year.
The following information should be read in conjunction with the financial statements and notes thereto appearing elsewhere in this Annual Report.
|
| Year Ended August 31, |
| |||||||||||||
|
| 2013 |
| 2012 |
| 2011 |
| 2010 |
| 2009 |
| |||||
|
|
|
|
|
|
|
|
|
|
|
| |||||
Net asset value, beginning of the period |
| $ | 9.68 |
| $ | 9.82 |
| $ | 9.95 |
| $ | 10.19 |
| $ | 10.27 |
|
|
|
|
|
|
|
|
|
|
|
|
| |||||
Income (loss) from investment operations: |
|
|
|
|
|
|
|
|
|
|
| |||||
Net investment income (loss) |
| (0.13 | )(1) | (0.14 | ) | (0.10 | ) | (0.10 | ) | 0.19 |
| |||||
Net realized and unrealized gain (loss) on investments |
| — |
| — | (2) | (0.03 | ) | — |
| 0.08 |
| |||||
Total income (loss) from investment operations |
| (0.13 | ) | (0.14 | ) | (0.13 | ) | (0.10 | ) | 0.27 |
| |||||
|
|
|
|
|
|
|
|
|
|
|
| |||||
Less distributions: |
|
|
|
|
|
|
|
|
|
|
| |||||
From net investment income |
| — |
| — |
| — |
| (0.14 | ) | (0.35 | ) | |||||
From net realized gain |
| — |
| — |
| — |
| — |
| — | (2) | |||||
Total distributions |
| — |
| — |
| — |
| (0.14 | ) | (0.35 | ) | |||||
|
|
|
|
|
|
|
|
|
|
|
| |||||
Net asset value, end of period |
| $ | 9.55 |
| $ | 9.68 |
| $ | 9.82 |
| $ | 9.95 |
| $ | 10.19 |
|
|
|
|
|
|
|
|
|
|
|
|
| |||||
Total return |
| (1.34 | )% | (1.43 | )% | (1.31 | )% | (0.96 | )% | 2.71 | % | |||||
|
|
|
|
|
|
|
|
|
|
|
| |||||
Ratios/supplemental data: |
|
|
|
|
|
|
|
|
|
|
| |||||
Net assets, end of period (thousands) |
| $ | 48.2 |
| $ | 48.9 |
| $ | 49.5 |
| $ | 50.2 |
| $ | 50.7 |
|
|
|
|
|
|
|
|
|
|
|
|
| |||||
Ratio of expenses to average net assets: |
|
|
|
|
|
|
|
|
|
|
| |||||
Before fees waived and expenses absorbed or recouped |
| 310.49 | % | 315.77 | % | 304.53 | % | 294.12 | % | 357.92 | % | |||||
After fees waived and expenses absorbed or recouped |
| 1.50 | % | 1.50 | % | 1.50 | % | 1.50 | % | 1.50 | % | |||||
|
|
|
|
|
|
|
|
|
|
|
| |||||
Ratio of net investment income to average net assets(3) |
| (1.37 | )% | (1.40 | )% | (1.06 | )% | (0.96 | )% | 2.28 | % | |||||
|
|
|
|
|
|
|
|
|
|
|
| |||||
Portfolio turnover rate |
| 0.00 | % | 0.00 | % | 0.00 | % | 0.00 | % | 0.00 | % | |||||
(1)Per share net investment loss has been calculated using the daily average share method.
(2)Amount represents less than $0.01 per share.
(3)Net of fees waived.
The accompanying notes are an integral part of these financial statements.
PURISIMA ALL-PURPOSE FUND
NOTES TO FINANCIAL STATEMENTS
August 31, 2013
NOTE 1 — ORGANIZATION
The Purisima Funds (the “Trust”) was organized as a Delaware statutory trust on June 27, 1996 and is registered under the Investment Company Act of 1940, as amended (the “1940 Act”), as an open-end management investment company issuing its shares in a series. Each series represents a distinct portfolio with its own investment objectives and policies. The accompanying financial statements include the Purisima All-Purpose Fund (the “Fund”), a non-diversified fund which commenced operations on November 1, 2005. The Fund is one of the two portfolios comprising the Trust. Fisher Asset Management, LLC (doing business as Fisher Investments) (the “Adviser”) serves as the investment adviser to the Fund.
The investment objective of the Fund is as follows:
The Fund seeks positive total returns over the long-term regardless of market conditions in the U.S. and foreign equity markets. The Fund may invest in foreign and/or domestic securities, derivatives, money market instruments, fixed-income securities, shares of other mutual funds, exchange-traded funds and other equity-like securities. From its inception through August 31, 2013, the Fund has invested exclusively in U.S. government securities and cash equivalents.
For the year ended August 31, 2013, the Fund invested 30.61% of its net assets in the SEI Daily Income Trust Government Fund. The SEI Daily Income Trust Government invests in U.S. Government securities. The Financial Statements of the SEI Daily Income Trust Government Fund, including disclosure of the risks, performance, expenses or other information is available through the SEC website at http://www.sec.gov.
NOTE 2 — SIGNIFICANT ACCOUNTING POLICIES
The following is a summary of significant accounting policies consistently followed by the Fund in the preparation of the financial statements. These policies are in conformity with accounting principles generally accepted in the United States of America.
A. Security Valuation. Investments in securities traded on a national securities exchange are valued at the last sales price on the business day as of which such value is being determined. If on a particular day, an exchange-listed security does not trade, then the mean between the bid and asked prices will be used. Foreign exchange traded equity securities are valued based upon the price on the exchange or market on which they trade as of the close of business of such market or exchange immediately preceding the time the Fund’s net asset value is determined. Investments in securities traded on the NASDAQ Global Market, the NASDAQ Global Select Market and the NASDAQ Capital Market will be valued at the NASDAQ Official Closing Price (“NOCP”), which may not necessarily represent the last sale price. Securities traded on an exchange or NASDAQ for which there have been no sales and other over-the-counter securities are valued at the closing price. Securities for which quotations are not readily available are valued at their respective fair values as determined in good faith by the Board of Trustees or their designee, taking into consideration: (I)
fundamental analytical data relating to the investment; (II) the nature and duration of restrictions on disposition of the securities; and (III) an evaluation of the forces which influence the market in which these securities are purchased and sold. Debt securities with remaining maturities of 60 days or less are valued at amortized cost which, when combined with accrued interest, approximates market value.
B. Foreign Currency Translation. The Fund’s records are maintained in U.S. dollars. The value of securities, currencies and other assets and liabilities denominated in currencies other than U.S. dollars are translated into U.S. dollars based upon foreign exchange rates prevailing at the end of the reporting period. Purchases and sales of investment securities, income and expenses are translated on the respective dates of such transactions.
The Fund does not isolate that portion of their net realized and unrealized gains and losses on investments resulting from changes in foreign exchange rates from the impact arising from changes in market prices. Such fluctuations are included with net realized and unrealized gain or loss from investments and foreign currency.
Net realized foreign currency transaction gains and losses arise from sales of foreign currencies, currency gains or losses realized between the trade and settlement dates on securities transactions, and the differences between the amounts of dividends, interest, and foreign withholding taxes recorded on the Fund’s books and the U.S. dollar equivalent of the amounts actually received or paid. Net unrealized foreign currency translation gains and losses arise from changes in the value of assets and liabilities, other than investments in securities, resulting from changes in the exchange rates.
C. Federal Income and Excise Taxes. The Fund has elected to be taxed as a “regulated investment company” and intends to distribute substantially all taxable income to its shareholders and otherwise comply with the provisions of the Internal Revenue Code applicable to regulated investment companies. Therefore, no federal income or excise tax provision is required.
In order to avoid imposition of the excise tax applicable to regulated investment companies, the Fund intends to declare each year as dividends in each calendar year at least 98% of its net investment income (earned during the calendar year) and 98% of its net realized capital gains (earned during the twelve months ended October 31) plus undistributed amounts, if any, from prior years.
The Fund may be subject to foreign taxes on income, gains on investments or currency repatriation, a portion of which may be recoverable. The Fund will accrue such taxes and recoveries as applicable based upon its current interpretations of the tax rules and regulation that exist in the markets in which it invests.
The Fund recognizes the tax benefits of uncertain tax positions only where the position is “more likely then not” to be sustained assuming examination by tax authorities. Management has analyzed the Fund’s tax positions, and has concluded that no liability for
unrecognized tax benefits should be recorded related to uncertain tax positions taken on returns filed for open tax years (2010 – 2012), or expected to be taken in the Fund’s 2013 tax returns. The Fund identifies its major tax jurisdictions as U.S. Federal and State of California. The Fund is not aware of any tax positions for which it is reasonably possible that the total amounts of unrecognized tax benefits will change materially in the next twelve months.
D. Security Transactions, Investment Income and Distributions. Security transactions are accounted for on the trade date. Dividend income and distributions to shareholders are recorded on the ex-dividend date and interest income is recognized on the accrual basis. Realized gains and losses are evaluated on the bases of identified costs.
E. Use of estimates. The presentation of financial statements in conformity with accounting principles generally accepted in the United States of America requires management to make estimates and assumptions that affect the reported amounts of assets and liabilities at the date of the financial statements and the reported amounts of revenue and expenses during the reporting period. Actual results could differ from those estimates and assumptions.
F. Concentration of Risk. Investments in securities of non-U.S. issues in certain countries involve special investment risks. These risks may include, but are not limited to, investment restrictions, adverse political, social and economic developments, government involvement in the private sector, limited and less reliable investor information, lack of liquidity, certain local tax law considerations, and limited regulation of the securities markets.
G. Options. Exchange traded options are valued at the last reported sale price at the close of the exchange on which the security is primarily traded. Certain markets are not closed at the time that a Fund prices portfolio securities. In these situations, snapshot prices are provided by the individual pricing services or other alternate sources at the close of the NYSE as appropriate. If no sales are reported, the mean between the last reported bid and asked prices will be used. Non-exchange traded options will also be valued at the mean between bid and asked prices. “Fair value” of other private options is valued after consulting with the Adviser using a mathematical model.
Options purchased are recorded as investments; options written (sold) are accounted for as liabilities. When an option expires, the premium (original option value) is realized as a gain if the option was written or as a loss if the option was purchased. When the exercise of an option results in a cash settlement, the difference between the premium and the settlement proceeds is realized as a gain or loss. When securities are acquired or delivered upon exercise of an option, the acquisition cost or sale proceeds are adjusted by the amount of the premium. When an option is closed, the difference between the premium and the cost to close the position is realized as a gain or loss. The Fund may purchase options which are included in the Fund’s Schedules of Investments and subsequently marked to market to reflect the current value of the option. At August 31, 2013, the Fund had no options outstanding.
H. Securities Sold Short. To the extent the Fund engages in selling securities short, they are obligated to replace a security borrowed by purchasing the same security at the current market value. The Fund would incur a loss if the price of the security increases between the date of the short sale and the date on which the Fund replaces the borrowed security. The Fund would realize a gain if the price of the security declines between those dates.
The Fund is required to establish a margin account with the broker lending the security sold short. While the short sale is outstanding, the broker retains the proceeds of the short sale and the Fund must also maintain a deposit with the broker consisting of cash having a value equal to a specified percentage of the value of the securities sold short.
I. Exchange-Traded Notes, Index-Linked Notes and Similar Instruments. The Fund may invest in leveraged and unleveraged exchange-traded notes, index-linked notes and similar instruments (collectively known as “Linked Notes”), which are senior, unsecured, unsubordinated debt securities whose returns are linked to the performance of a particular market benchmark or strategy minus applicable fees. Some Linked Notes are traded on an exchange (e.g., the New York Stock Exchange) during normal trading hours. Other Linked Notes may be directly sold by the issuer, such as a larger broker-dealer, and are not traded. At maturity, the issuer pays to the investor a cash amount equal to the principal amount, subject to the applicable market benchmark or strategy factor. Linked Notes that are not traded may be subject to a holding period until maturity during which an early redemption fee or other charges may apply.
Linked Notes are subject to credit risk and the value of a Linked Note may drop because of a downgrade in the issuer’s credit rating, despite the underlying market benchmark or strategy remaining unchanged. Linked Notes may not make periodic coupon payments or provide principal protection. The value of a Linked Note may also be influenced by time to maturity, level of supply and demand for the Linked Note, volatility and lack of liquidity in underlying assets, changes in the applicable interest rates, changes in the issuer’s credit rating, and economic, legal, political, or geographic events that affect the referenced underlying asset. The issuer of a Linked Note may not be required to maintain the listing and there can be no assurance that a secondary market will exist for a Linked Note. In addition, no assurance can be given that the Internal Revenue Service will accept, or a court will uphold, how the Fund characterizes and treats Linked Notes for tax purposes. Some Linked Notes that use leverage may multiply the market effect on the value of the instrument and, at times, be relatively illiquid and, thus, they may be difficult to purchase or sell at a fair price. Leveraged Linked Notes are subject to the same risks, such as greater volatility, costs and the potential for increased losses, as other instruments that use leverage in any form.
A Linked Note that is tied to a specific market benchmark or strategy may not be able to replicate and maintain exactly the composition and relative weighting of securities, commodities or other components in the applicable market benchmark or strategy. The market value of Linked Notes may differ from their market benchmark or strategy because the supply and demand in the market for Linked Notes at any point in time is not always
identical to the supply and demand in the market for the securities, commodities or other components underlying the market benchmark or strategy that the Linked Note seeks to track. As a result, there may be times when a traded Linked Note trades at a premium or discount to its market benchmark or strategy.
J. Indemnification Obligations. Under the Fund’s organizational documents, its current and former officers and trustees are indemnified against certain liabilities arising out of the performance of their duties to the Fund. In addition, in the normal course of business, the Fund enters into contracts that contain a variety of representations and warranties that provide general indemnifications. The Fund’s maximum exposure under these arrangements is unknown as this would involve future claims that may be made against the Fund that have not yet occurred or that would be covered by other parties.
NOTE 3 — COMMITMENTS, OTHER RELATED PARTY TRANSACTIONS AND OTHER SERVICE PROVIDERS
The Fund has an Investment Management Agreement with the Adviser to provide investment advisory services to the Fund. The Adviser furnishes all investment advice, office space, facilities, and most of the personnel needed by the Fund. As compensation for its services, the Adviser is entitled to a monthly fee at the annual rate of 1.00% of the Fund’s average daily net assets.
The Fund is responsible for its own operating expenses. The Adviser has contractually agreed to limit the Fund’s total expenses (exclusive of brokerage, interest, taxes, dividends on securities sold short and extraordinary expenses) to not more than 1.50% of the average daily net assets.
Any fee withheld or voluntarily reduced and/or any Fund expense absorbed by the Adviser pursuant to an agreed upon expense cap shall be reimbursed by the Fund to the Adviser, if so requested by the Adviser, anytime before the end of the third fiscal year following the year to which the fee reduction, waiver, or expense absorption relates, provided the aggregate amount of the Fund’s current operating expenses for such fiscal year does not exceed the applicable limitation on Fund expenses. Any such reimbursement is also contingent upon Board of Trustees review and approval prior to the time the reimbursement is initiated. The Fund must pay its current ordinary operating expenses before the Adviser is entitled to any reimbursement of fees and/or expenses. For the year ended August 31, 2013, the Fund paid the Adviser $485.
As of August 31, 2013, the Adviser has reimbursed the Fund $149,800 to limit its total expenses to not more than 1.50% of the average daily net assets.
At August 31, 2013 the Adviser may recapture a portion of the following amounts that have been paid and/or waived on behalf of the Fund no later than the date as stated below:
Fund |
| August 31, 2014 |
| August 31, 2015 |
| August 31, 2016 |
| |||
All-Purpose Fund |
| $ | 151,032 |
| $ | 154,468 |
| $ | 149,800 |
|
U.S. Bank, N.A. serves as the Fund’s Custodian. U.S. Bancorp Fund Services, LLC (“USBFS”), an affiliate of U.S. Bank, N.A., serves as the Administrator, Fund Accountant and Transfer Agent. In its capacity as the Fund’s Administrator, USBFS provides general fund management including corporate secretarial services, coordinates the preparation of materials for the Board of Trustees, assists with the annual audit of the Fund’s financial statements, monitors the Fund’s compliance with federal and state regulations as well as investment restrictions, coordinates the payment of Fund expenses and monitors expense accruals, prepares financial statements and non-investment related statistical data and makes required tax reporting calculations. During the year ended August 31, 2013, the Fund paid USBFS $39,137 for services rendered in its capacity as the Fund’s Administrator.
Quasar Distributors, LLC, an affiliate of U.S. Bank, N.A. and USBFS, serves as principal underwriter of the Fund and acts as the Fund’s distributor, pursuant to a Distribution Agreement with the Trust, in a continuous public offering of the Fund’s shares.
NOTE 4 — SERVICE AND DISTRIBUTION PLAN
The Trust has adopted a Service and Distribution Plan (the “Plan”) pursuant to Rule 12b-1 under the 1940 Act. Under the Plan, the Fund is authorized to pay expenses incurred for the purpose of distribution activities, including the engagement of other dealers, intended to result in the sale of shares of the Fund. The fee accrues at an annual rate not to exceed 0.25% of the Fund’s average daily net assets. For the year ended August 31, 2013, the Fund did not utilize the Plan.
NOTE 5 — INVESTMENT TRANSACTIONS
The cost of purchases and the proceeds from sales of securities, excluding short-term investments, for the year ended August 31, 2013, were as follows:
Fund |
| Purchases |
| Sales |
| ||
Purisima All-Purpose Fund |
| $ | 31,090 |
| $ | 0 |
|
NOTE 6 — FAIR VALUE OF FINANCIAL INSTRUMENTS
The Funds follow a fair value hierarchy that distinguishes between market data obtained from independent sources (observable inputs) and the Funds’ own market assumptions (unobservable inputs). These inputs are used in determining the value of each Fund’s investments and are summarized in the following fair value hierarchy:
Level 1 — Quoted prices in active markets for identical securities
Level 2 — Evaluated prices based on other significant observable inputs (including quoted prices for similar securities, foreign security indices, foreign exchange rates, fair value estimates for foreign securities and changes in benchmark securities indices).
Level 3 — Significant unobservable inputs (including the Fund’s own assumptions in determining fair value of investments)
The availability of observable inputs can vary from security to security and is affected by a wide variety of factors, including, for example, the type of security, whether the security is new and not yet established in the marketplace, the liquidity of markets, and other characteristics particular to the security. To the extent that valuation is based on models or inputs that are less observable or unobservable in the market, the determination of fair value requires more judgment. Accordingly, the degree of judgment exercised in determining fair value is greatest for instruments categorized in Level 3.
The inputs used to measure fair value may fall into different levels of the fair value hierarchy. In such cases, for disclosure purpose, the level in the fair value hierarchy within which the fair value measurement falls in its entirety, is determined based on the lowest level input that is significant to the fair value measurement in its entirety.
The inputs or methodology used for valuing securities are not necessarily an indication of the risk associated with investing in those securities. The following tables summarize the inputs used as of August 31, 2013 for the Fund’s assets and liabilities measured at fair value:
Description |
| Level 1 |
| Level 2 |
| Level 3 |
| Total |
| ||||
Fixed Income |
|
|
|
|
|
|
|
|
| ||||
U.S. Treasury Notes |
| $ | — |
| $ | 30,660 |
| $ | — |
| $ | 30,660 |
|
Total Fixed Income |
| — |
| 30,660 |
| — |
| 30,660 |
| ||||
Short-Term Investments |
| 14,743 |
| — |
| — |
| 14,743 |
| ||||
Total Investments in Securities |
| $ | 14,743 |
| $ | 30,660 |
| $ | — |
| $ | 45,403 |
|
There were no transfers between Levels 1 and 2 during the period as compared to their classification in the previous annual report. The Fund did not hold any Level 3 securities during the year ended August 31, 2013.
NOTE 7 — FEDERAL INCOME TAX MATTERS
The difference between the book and tax basis components of the distributable earnings relates principally to the timing of recognition of income and gains for federal income tax purposes. These differences, if any, are primarily attributable to the tax deferral of losses on wash sales, the realization for tax purposes of unrealized gains on passive foreign investment companies and return of capital distributions and income adjustments recognized for tax purposes on real estate investment trusts. Short-term gains distributions reported in the Statements of Changes of Net Assets, if any, are reported as ordinary income for federal tax purposes. For the year ended August 31, 2013, the Fund decreased undistributed net investment loss and paid-in capital by $694 and $694, respectively.
As of August 31, 2013, the Fund’s most recent fiscal year end, the components of distributable earnings on a tax basis were as follows:
|
| All-Purpose |
| |
|
|
|
| |
Cost of investments for tax purposes |
| $ | 45,384 |
|
Gross tax unrealized appreciation |
| $ | 19 |
|
Gross tax unrealized depreciation |
| — |
| |
Net tax unrealized appreciation |
| $ | 19 |
|
Undistributed long-term gains |
| $ | — |
|
Other accumulated gains (losses) |
| (432 | ) | |
Total accumulated earnings (losses) |
| $ | (413 | ) |
The Fund did not pay any distributions during the fiscal years ended August 31, 2013 and August 31, 2012.
In order to meet certain excise tax requirements, the Fund is required to measure and distribute annually, net capital gains realized during the twelve month period ending October 31st. Under current tax regulations, the Fund is permitted, for tax purposes, to defer into its next fiscal year any net capital losses incurred from November 1st through the end of the fiscal year. Under the Act the Fund may also defer any realized late-year ordinary losses as occurring on the first day of the following fiscal year. Late-year ordinary losses represent ordinary losses realized on investment transactions after December and specified losses (ordinary losses from sale, exchange or other disposition of property, net foreign currency losses and net passive foreign investment mark to market losses) realized on investments transactions after October. As of August 31, 2013, the Fund deferred, on a tax basis, post December late- year losses of $432.
NOTE 8 — RECENT ACCOUNTING PRONOUNCEMENT
In December 2011, the Financial Accounting Standards Board issued Accounting Standards Update 2011-11 Disclosures about Offsetting Assets and Liabilities (“ASU 2011-11”). Effective for annual reporting periods beginning on or after January 1, 2013 and interim periods within those annual periods, ASU 2011-11 is intended to enhance disclosure requirements on the offsetting of financial assets and liabilities. At this time, Management is evaluating the implications of ASU 2011-11 and its impact on the financial statements.
NOTE 9 — SUBSEQUENT EVENTS
The Fund is required to recognize in the financial statements the effect of all subsequent events that provide additional evidence about conditions that existed at the date of the Statement of Assets and Liabilities. For non-recognized subsequent events that must be disclosed to keep the financial statements from being misleading, the Fund is required to disclosed the nature of the event as well as an estimate of its financial effect, or a statement that such an estimate cannot be made. Management has evaluated subsequent events through the issuance of these financial statements and has noted no such events.

REPORT OF INDEPENDENT REGISTERED PUBLIC ACCOUNTING FIRM
TO THE SHAREHOLDERS AND BOARD OF TRUSTEES
THE PURISIMA FUNDS
WOODSIDE, CALIFORNIA
We have audited the accompanying statement of assets and liabilities of the Purisima All- Purpose Fund (the “Fund”), a series of The Purisima Funds, including the schedule of investments as of August 31, 2013, and the related statement of operations for the year then ended, the statements of changes in net assets for each of the two years in the period then ended, and the financial highlights for each of the five years in the period then ended. These financial statements and financial highlights are the responsibility of the Fund’s management. Our responsibility is to express an opinion on these financial statements and financial highlights based on our audits.
We conducted our audits in accordance with the standards of the Public Company Accounting Oversight Board (United States). Those standards require that we plan and perform the audit to obtain reasonable assurance about whether the financial statements and financial highlights are free of material misstatement. The Fund is not required to have, nor were we engaged to perform, an audit of its internal control over financial reporting. Our audits included consideration of internal control over financial reporting as a basis for designing audit procedures that are appropriate in the circumstances, but not for the purpose of expressing an opinion on the effectiveness of the Fund’s internal control over financial reporting. Accordingly, we express no such opinion. An audit includes examining, on a test basis, evidence supporting the amounts and disclosures in the financial statements, assessing the accounting principles used and significant estimates made by management, as well as evaluating the overall financial statement presentation. Our procedures included confirmation of securities owned as of August 31, 2013, by correspondence with the custodian and brokers or by other appropriate auditing procedures where replies from brokers were not received. We believe that our audits provide a reasonable basis for our opinion.
In our opinion, the financial statements and financial highlights referred to above present fairly, in all material respects, the financial position of the Purisima All-Purpose Fund as of August 31, 2013, the results of its operations for the year then ended, the changes in its net assets for each of the two years in the period then ended, and the financial highlights for each of the five years in the period then ended, in conformity with accounting principles generally accepted in the United States of America.
| Tait, Weller & Baker LLP |
|
|
|
|
Philadelphia, Pennsylvania |
|
October 25, 2013 |
|
Other Information
PROXY VOTING PROCEDURES (Unaudited)
The Adviser votes proxies relating to portfolio securities in accordance with procedures that have been approved by the Trust’s Board of Trustees. You may obtain a description of these procedures, free of charge, by calling toll-free 1-800-841-0199. This information is also available through the Securities and Exchange Commission’s website at http://www.sec.gov.
Information regarding how the Fund voted proxies relating to the portfolio securities during the most recent 12-month period ended June 30 is available without charge, upon request, by calling toll-free 1-800-841-0199. This information is also available through the Securities and Exchange Commission’s website at http://www.sec.gov.
FORM N-Q DISCLOSURE (Unaudited)
The Fund files its complete schedule of portfolio holdings with the SEC for the first and third fiscal quarters on Form N-Q. The Fund’s Form N-Q is available without charge, upon request, by calling 1-800-841-0199. Furthermore, you can obtain the Form N-Q on the SEC’s website at www.sec.gov.
TAX NOTICE (Unaudited)
Additional Information applicable to foreign shareholders only: The percentage of taxable ordinary income distributions that are designated as short-term capital gain distributions under Internal Revenue Code Section 871(k)(2)(C) for the year ended August 31, 2013 is 0.00%.
Trustees and Officer Information (Unaudited)
The Board of Trustees is responsible for the overall management of the Trust’s business. The Board of Trustees approves all significant agreements between the Trust and persons or companies furnishing services to it, including all agreements with the Adviser, Administrator, Custodian and Transfer Agent. The Board of Trustees delegates the day-to-day operations of the Trust to its Officers, subject to the Fund’s investment objective and policies and to general supervision by the Board of Trustees. The Statement of Additional Information includes additional information about the Trust’s Trustees and is available, without charge, by calling 1- 800-841-0199.
The Trustees and Officers of the Trust, their business addresses and principal occupations during the past five years are:
|
|
|
|
|
|
|
| Number of |
|
|
|
|
|
|
|
|
|
|
| Portfolios in |
|
|
|
|
|
|
|
|
|
|
| Fund |
|
|
|
|
|
|
|
|
|
|
| Complex |
| Other |
|
Name, Address, |
| Position(s) Held |
| Year |
| Principal |
| Overseen by |
| Director-ships |
|
|
|
|
|
|
|
|
|
|
|
|
|
Kenneth L. Fisher* |
| President |
| 1996 |
| Chief Executive Officer and majority shareholder of Fisher Investments, Inc., the sole shareholder of the Adviser, and has served in such capacities since the incorporation of the Adviser in 1986. Prior thereto, he was the founder of Fisher Investments, a sole proprietorship which commenced operations in 1979. |
| N/A |
| None |
|
|
|
|
|
|
|
|
|
|
|
|
|
Pierson E. Clair III |
| Trustee |
| 1996 |
| President and Chief Executive Officer of Brown & Haley since 1998 (fine confectioners); Vice President of Blummer Chocolate Company from 1980 to 1997, where he had been employed since 1970. |
| 2 |
| Signature Foods, Inc. |
|
|
|
|
|
|
|
|
|
|
|
|
|
Scott LeFevre |
| Trustee |
| 2001 |
| Sole proprietor of LeFevre Capital Management. |
| 2 |
| None |
|
|
|
|
|
|
|
|
|
|
|
|
|
Alfred D. McKelvy, Jr. |
| Trustee |
| 2003 |
| Executive Director of the law firm of Berding & Weil, LLP since 1990. |
| 2 |
| Diablo Valley Bank; East Bay BOMA. |
|
|
|
|
|
|
|
|
|
|
|
|
|
Bryan F. Morse |
| Trustee |
| 1996 |
| Retired. Prior to retirement, sole proprietor of Bryan F. Morse, RIA, a registered investment adviser from 1990 to 2010. |
| 2 |
| None |
|
|
|
|
|
|
|
|
|
|
|
|
|
Grover T. Wickersham |
| Trustee |
| 1996 |
| Attorney in private practice in Palo Alto, California. Prior to entering private practice in June of 1981, served as a Branch Chief of the Los Angeles Regional Office of the U.S. Securities and Exchange Commission. |
| 2 |
| None |
|
|
|
|
|
|
|
|
|
|
|
|
|
Tom Fishel |
| Chief Compliance Officer |
| 2005 |
| Chief Compliance Officer of the Adviser. Vice President of Charles Schwab & Co., Inc. from 1995 to 2004, where he had been employed since 1983. |
|
|
|
|
|
|
|
|
|
|
|
|
|
|
|
|
|
Katherine Taylor |
| Treasurer |
| 2011 |
| Group Vice President of Finance and Treasurer of the Advisor where she has been employed since 2003. |
|
|
|
|
|
(1) Trustees and officers of the Funds serve until their resignation, removal or retirement.
* “Interested person” of the Trust, as defined in the 1940 Act.
|
|
|
|
|
|
|
| Number of |
|
|
|
|
|
|
|
|
|
|
| Portfolios in |
|
|
|
|
|
|
|
|
|
|
| Fund |
|
|
|
|
|
|
|
|
|
|
| Complex |
| Other |
|
Name, Address, |
| Position(s) Held |
| Year |
| Principal |
| Overseen by |
| Director-ships |
|
|
|
|
|
|
|
|
|
|
|
|
|
Nicole Gerrard Lightner |
| Secretary |
| 2011 |
| In-house legal counsel for the Adviser since 2006 and Secretary of the Adviser since 2008. Prior to joining the Adviser, she was an attorney at Paul Hastings LLP from 2000-2006 and at a Canadian law firm from 1998-2000. |
|
|
|
|
|
(2) Trustees and officers of the Funds serve until their resignation, removal or retirement.
FACTS | WHAT DOES THE PURISIMA FUNDS DO WITH YOUR PERSONAL INFORMATION? |
|
|
Why? | Financial companies choose how they share your personal information. Federal law gives consumers the right to limit some but not all sharing. Federal law also requires us to tell you how we collect, share, and protect your personal information. Please read this notice carefully to understand what we do. |
|
|
What? | The types of personal information we collect and share depend on the product or service you have with us. This information can include: |
| · Social Security number |
| · Account balances and account transactions |
| · Assets and transaction history |
|
|
| When you are no longer our customer, we continue to share your information as described in this notice. |
|
|
How? | All financial companies need to share customers’ personal information to run their everyday business. In the section below, we list the reasons financial companies can share their customers’ personal information; the reasons The Purisima Funds chooses to share; and whether you can limit this sharing. |
Reasons we share your personal |
| Does The Purisima |
| Can you limit |
|
|
|
|
|
For our everyday business purposes—such as to process your transactions, maintain your account(s), respond to court orders and legal investigations, or report to credit bureaus |
| Yes |
| No |
|
|
|
|
|
For our marketing purposes—to offer our products and services to you |
| Yes |
| No |
|
|
|
|
|
For joint marketing with other financial companies |
| No |
| No |
|
|
|
|
|
For our affiliates’ everyday business purposes—information about your transactions and experiences |
| Yes |
| No |
|
|
|
|
|
For our affiliates’ everyday business purposes—information about your creditworthiness |
| No |
| No |
|
|
|
|
|
For nonaffiliates to market to you |
| No |
| No |
Questions? | Call 1-800-550-1071 |
Who we are |
|
|
|
|
|
Who is providing this notice? |
| The Purisima Funds |
|
|
|
What we do |
|
|
|
|
|
How does The Purisima Funds protect my personal information? |
| To protect your personal information from unauthorized access and use, we use security measures that comply with federal law. These measures include computer safeguards and secured files and buildings. |
|
|
|
How does The Purisima Funds collect my personal information? |
| We collect your personal information, for example, when you · Open an account · Provide account information · Make deposits or withdrawals from your account · Use your credit or debit card · Make a wire transfer We also collect your personal information from third parties, such as credit bureaus, affiliates, or other companies. |
|
|
|
Why can’t I limit all sharing? |
| Federal law gives you the right to limit only Sharing for affiliates’ everyday business purposes-information about your creditworthiness Affiliates from using your information to market to you Sharing for nonaffiliates to market to you State laws and individual companies may give you additional rights to limit sharing. |
|
|
|
Definitions |
|
|
|
|
|
Affiliates |
| Companies related by common ownership or control. They can be financial and nonfinancial companies. |
|
|
|
Nonaffiliates |
| Companies not related by common ownership or control. They can be financial and nonfinancial companies. · THE PURISIMA FUNDS does not share information with nonaffiliates so they can market to you. |
|
|
|
Joint marketing |
| A formal agreement between nonaffiliated financial companies that together market financial products or services to you. · THE PURISIMA FUNDS does not joint market. |
Other important information
This notice applies to individual consumers who are customers or former customers. This notice replaces all previous notices of our consumer privacy policy, and may be amended at any time. We will keep you informed of changes or amendments as required by law.
Item 2. Code of Ethics.
The registrant has adopted a code of ethics that applies to the registrant’s principal executive officer and principal financial officer. The registrant has not made any amendments to its code of ethics during the period covered by this report. The registrant has not granted any waivers from any provisions of the code of ethics during the period covered by this report.
The registrant undertakes to provide to any person without charge, upon request, a copy of its code of ethics by mail when they call the registrant at 1-800-851-8845.
Item 3. Audit Committee Financial Expert.
The registrant’s board of trustees has determined that it does not have an audit committee financial expert serving on its audit committee. At this time, the registrant believes that the experience provided by each member of the audit committee together offers the registrant adequate oversight for the registrant’s level of financial complexity.
Item 4. Principal Accountant Fees and Services.
The registrant has engaged its principal accountant to perform audit services, audit-related services, tax services and other services during the past two fiscal years. “Audit services” refer to performing an audit of the registrant’s annual financial statements or services that are normally provided by the accountant in connection with statutory and regulatory filings or engagements for those fiscal years. “Audit-related services” refer to the assurance and related services by the principal accountant that are reasonably related to the performance of the audit. “Tax services” refer to professional services rendered by the principal accountant for tax compliance, tax advice, and tax planning including the review of the registrant’s federal and state tax returns. There were no “Other services” provided by the principal accountant. The following table details the aggregate fees billed or expected to be billed for each of the last two fiscal years for audit fees, audit-related fees, tax fees and other fees by the principal accountant.
|
| FYE 08/31/2013 |
| FYE 08/31/2012 |
|
Audit Fees |
| 18,500 |
| 42,300 |
|
Audit-Related Fees |
| — |
| — |
|
Tax Fees |
| 4,000 |
| 6,600 |
|
All Other Fees |
| — |
| — |
|
The audit committee has adopted pre-approval policies and procedures that require the audit committee to pre-approve all audit and non-audit services of the registrant, including services provided to any entity affiliated with the registrant with respect to any engagement that directly relates to the operations and financial reporting of the registrant. In accordance with its pre-
approval policies and procedures, the audit committee pre-approved all audit and tax services provided by the principal accountant during fiscal year 2013. During the last two fiscal years, there were no non-audit services rendered by the principal accountant to the registrant’s investment adviser or any entity controlling, controlled by or under common control with the investment adviser that provides ongoing services to the registrant. All of the hours spent on auditing the registrant’s financial statements were attributed to work performed by full-time permanent employees of the principal accountant.
Item 5. Audit Committee of Listed Registrants.
Not applicable to registrants who are not listed issuers (as defined in Rule 10A-3 under the Securities Exchange Act of 1934).
Item 6. Investments.
(a) Schedule of Investments is included as part of the report to shareholders filed under Item 1 of this Form.
(b) Not Applicable
Item 7. Disclosure of Proxy Voting Policies and Procedures for Closed-End Management Investment Companies.
Not applicable to open-end investment companies.
Item 8. Portfolio Managers of Closed-End Management Investment Companies.
Not applicable to open-end investment companies.
Item 9. Purchases of Equity Securities by Closed-End Management Investment Company and Affiliated Purchasers.
Not applicable to open-end investment companies.
Item 10. Submission of Matters to a Vote of Security Holders.
There have been no material changes to the procedures by which shareholders may recommend nominees to the registrant’s board of trustees.
Item 11. Controls and Procedures.
(a) The Registrant’s President and Treasurer have reviewed the Registrant’s disclosure controls and procedures (as defined in Rule 30a-3(c) under the Investment Company Act of 1940 (the “Act”)) as of a date within 90 days of the filing of this report, as required by Rule 30a-3(b) under the Act and Rules 13a-15(b) or 15d-15(b) under the Securities Exchange Act of 1934. Based on their review, such officers have concluded that the disclosure controls and
procedures are effective in ensuring that information required to be disclosed in this report is appropriately recorded, processed, summarized and reported and made known to them by others within the Registrant and by the Registrant’s service provider.
(b) There were no changes in the Registrant’s internal control over financial reporting (as defined in Rule 30a-3(d) under the Act) that occurred during the second fiscal quarter of the period covered by this report that has materially affected, or is reasonably likely to materially affect, the Registrant’s internal control over financial reporting.
Item 12. Exhibits.
(a) (1) Any code of ethics or amendment thereto, that is the subject of the disclosure required by Item 2, to the extent that the registrant intends to satisfy Item 2 requirements through filing an exhibit. 1) Incorporated by reference to the Registrant’s Form N-CSR filed November 10, 2003.
(2) A separate certification for each principal executive and principal financial officer pursuant to Section 302 of the Sarbanes-Oxley Act of 2002. Filed herewith.
(3) Any written solicitation to purchase securities under Rule 23c-1 under the Act sent or given during the period covered by the report by or on behalf of the registrant to 10 or more persons. Not applicable to open-end investment companies.
(b) Certifications pursuant to Section 906 of the Sarbanes-Oxley Act of 2002. Furnished herewith.
SIGNATURES
Pursuant to the requirements of the Securities Exchange Act of 1934 and the Investment Company Act of 1940, the registrant has duly caused this report to be signed on its behalf by the undersigned, thereunto duly authorized.
The Purisima Funds |
| |
|
|
|
By | /s/ Kenneth L. Fisher |
|
| Kenneth L. Fisher, President |
|
|
|
|
Date | 10/29/13 |
|
Pursuant to the requirements of the Securities Exchange Act of 1934 and the Investment Company Act of 1940, this report has been signed below by the following persons on behalf of the registrant and in the capacities and on the dates indicated.
By | /s/ Kenneth L. Fisher |
|
| Kenneth L. Fisher, President |
|
|
|
|
Date | 10/29/13 |
|
|
|
|
|
|
|
By | /s/ Katherine Taylor |
|
| Katherine Taylor, Treasurer |
|
|
|
|
Date | 10/28/13 |
|