SECURITIES AND EXCHANGE COMMISSION
Washington, D.C. 20549
FORM 8-K
CURRENT REPORT
Pursuant to Section 13 or 15(d) of
the Securities and Exchange Act of 1934
Date of Report: (Date of earliest event reported): September 30, 2004 (November 3, 2004)
I-Sector Corporation
(Exact name of registrant as specified in its charter)
| | | | | |
| Delaware | | 0-21479 | | 76-0515249 |
| (State of Incorporation) | | (Commission File Number) | | (IRS Employer Identification No.) |
6401 Southwest Freeway
Houston, Texas 77074
(Address of Registrant’s principal executive offices)
(713) 795-2000
(Registrant’s telephone number, including area code)
(Not Applicable)
(Former name or former address, if changed since last report)
TABLE OF CONTENTS
ITEM 2.02. Other Events
The following announcement of earnings for the quarter ended September 30, 2004 and the attached Exhibit “I Sector Corporation — Third Quarter Ended September 30, 2004 — Results and Outlook” Powerpoint presentation was released on November 3, 2004:
HOUSTON—(BUSINESS WIRE)—November 3, 2004—I-Sector Corporation (AMEX:ISR - News; the “Company”) announced today its preliminary financial results for its third quarter ended September 30, 2004.
For the Company’s third quarter ended September 30, 2004, compared to the corresponding prior year period:
| | • | | Revenue increased 55.4% to $32,612,000. |
| |
| | • | | Gross margin percentage decreased from 22.8% to 18.7%. |
| |
| | • | | Gross profit dollars increased 27.5%. |
| |
| | • | | Selling, general and administrative expenses increased 18.1%. |
| |
| | • | | Net profit improved by 219% from $194,000 to $618,000. |
| |
| | • | | Diluted earnings per share improved 175% from $0.04 per share on 3,974,298 shares to $0.11 per share on 5,547,912 shares. |
Performance for the third quarter, as compared to the corresponding prior year, for revenue sources and reportable segments, and excluding intra-company eliminations of $212,000, was as follows:
| | • | | Product sales revenue increased 67.2% to $27,255,000 and gross margin percentage on product sales increased from 13.7% to 14.4%. |
| |
| | • | | Services revenue increased 24.8% to $2,826,000 million and gross margin percentage on services revenue declined from 38.3% to 34.6%. |
| |
| | • | | Custom project/Stratasoft software revenue increased 4.8% to $2,531,000 and gross margin percentage declined from 69.9% to 47.7%. |
| | • | | Internetwork Experts revenue increased 65.4% to $28,695,000 with product sales revenue increasing 70.0% to $27,179,000 and services revenue increasing 8.9% to $1,516,000. Gross margin declined from 16.1% to 15.1%. Net operating income improved by 51.9% from $667,000 to $1,013,000. |
| |
| | • | | Stratasoft revenue increased 4.8% to $2,531,000, with gross margin declining from 69.9% to 47.7%. Stratasoft’s net operating loss increased 214.9% from $67,000 to $211,000. |
| |
| | • | | Valerent revenue increased 14.8% to $1,598,000 with product sales revenue declining 44.1% to $288,000 and services revenue increasing 49.4% to $1,310,000. Gross margin improved from 22.4% to 34.8%. Net operating income improved from a loss of $143,000 to a profit of $34,000. |
| |
| | • | | “Corporate,” expenses, which consist of corporate-level expenses that are not allocated to subsidiaries, decreased 36.2% to $183,000. |
The results set forth above are preliminary and subject to change between now and the time the Company files its quarterly report on Form 10-Q. The Company currently expects to file its quarterly report on Form 10-Q on or before approximately November 12, 2004.
Commenting on the preliminary third quarter results, James H. Long, CEO of the Company, stated, “We are pleased to announce record results for our third quarter. Our strong revenue growth and net profit growth
achieved this quarter, compared to a strong year ago period, are a testament to the hard and intelligent work put forth by our employees and reflect the improving market demand for the products and services we provide our customers, particularly in light of the fact that such results were achieved without the benefit of any acquisitions during the past year. We continued to see improving momentum in customer demand for IP Telephony solutions and increasing numbers of customers committing to moving forward with deploying IP Telephony/VoIP systems. The investments we have made in building a leading IP Telephony solutions provider, with the technical competency to help enterprise customers transition to IP Telephony technology, is beginning to pay off as the adoption of IP Telephony by enterprise organizations begins to accelerate. The strong year-over-year net profit performance was achieved in spite of several anomalies in the third quarter of this year that reduced gross profit margin and increased SG&A expenses as compared to normalized levels. We continued to produce outstanding financial results while also achieving other critical business objectives that we believe will add value to the company moving forward. We continued to foster new customer relationships and win new contracts that will help drive future revenue growth. We also announced several new proprietary products, including Internetwork Expert’s VIPRE portable IP video surveillance product, Stratasoft’s StrataWFM work force management application for Cisco IP Telephony systems, and our Stratasoft StrataSIP SIP-based VoIP soft phone for contact center agents using Stratasoft’s StrataDial contact center system; critical for building the long-term value of the organization. In addition, we made progress towards our goal of geographic expansion by opening a new branch office in San Antonio, Texas in July, and laying the foundation for making acquisitions that we hope will give us a growing geographic presence in other parts of the United States into 2005 and beyond.”
Outlook:
The following statements are made by the Company and are based upon current expectations. These statements are forward-looking, and actual results may differ materially. We caution readers to consider this fact and to pay particular attention to the statements made in the Safe Harbor Statement below. We do not have contracts in hand that will generate the revenue that we expect for the current and future quarters for which we provide our outlook, and there are numerous risk factors that could negatively impact actual results. We base our outlook for the future on input received from our customers, sales staff and vendor partners input, our current view of market conditions, our internal goals for financial performance, our anticipated sales and marketing efforts, our anticipated vendor pricing for products that we resell to our customers, anticipated vendor incentive programs and our anticipated expense structure, some or all of which are impossible to predict with certainty.
| | • | | We are providing a wider range of expectations for our fourth quarter than we have in the past. There are three principal reasons for this: |
| | • | | There are several significant expected contract awards that we believe will likely occur during our fourth quarter, but since we do not have signed contracts in hand at the time of this announcement, we must provide a larger than normal range of expected revenue. |
| |
| | • | | We have experienced payment delays associated with the large Dallas Independent School District project that we announced in June, 2004, and which contributed substantial amounts of revenue to our third quarter. These payment delays are due to administrative issues within the Schools and Libraries Division of the Universal Services Administration Corporation, the Federal government organization that administers the E-Rate program, the program that is funding a majority of the project. For this reason, we recently made the decision to temporarily delay further product shipments for this project until the administrative issues causing the payment delays have been resolved. Because we cannot predict when these delays will be resolved, we do not currently know whether or not we will recognize any product sales revenues related to this large project in the fourth quarter, but if such payment delays are resolved to our satisfaction, substantial product sales revenues could possibly be realized during the fourth quarter. Otherwise, we expect that such product sales revenue will shift into the following quarter and the period over which we recognize the revenue on this project will be extended. In addition, there are other, lesser sized contracts other than the large DISD contract that are also dependent upon E-Rate funding for payment, which are also dependent upon a resolution of the administrative issues with E-Rate invoice payment. |
| |
| | • | | Our third quarter revenue was stronger than we had previously expected, and we believe that a portion of the higher than expected third quarter revenue was revenue that we previously had expected to be recognized in our fourth quarter. |
| | • | | Taking into consideration the items discussed above, we expect revenue for our fourth quarter ending December 31, 2004 of approximately $23,000,000 to $30,000,000, which represents revenue growth of approximately 51% to 97% as compared to the corresponding prior year period revenue of $15,221,000. The midpoint of this range of expected revenue is approximately $1,000,000 higher than our previously provided outlook for the fourth quarter. |
| |
| | • | | Based upon, and contingent upon, the above expected levels of revenue, we expect a net profit of approximately $100,000 to $500,000 for our fourth quarter ending December 31, 2004, which compares to a net loss of $299,000 for the corresponding prior year period. The variance between the high and low end of the expected net profit range, is primarily dependent upon the level of revenue, the mix of low-margin and high-margin components of revenue, anticipated variances in the amount of vendor incentive rebates expected for the quarter and fluctuations in variable expense items. The significant improvement compared to the prior year period is based on expected higher levels of revenue, expected improvement in gross margins on product and services revenues and comparatively lower growth in selling, general and administrative expenses as compared to the expected higher levels of revenue and gross profit. The midpoint of this range of expected net profit is the same as our previously provided outlook for the fourth quarter. |
| |
| | • | | Based on an estimated 5.6 million diluted shares outstanding, we expect diluted per share earnings of $0.02 to $0.09 based on the range of expected net profit, which compares to a diluted per share net loss of $0.08 per share on approximately 3.9 million diluted shares for the corresponding prior year period. |
| |
| | • | | Providing an outlook for any period further out than the current quarter is more challenging and is subject to a lesser degree of accuracy than our current outlook. Attempts to predict results for periods further in the future than the current quarter are subject to increased risk and uncertainty as compared to our attempt to predict the current quarter results and are based upon limited information available to us at this time. That said, our current expectations for our first quarter ending March 31, 2005, are for revenue of approximately $25 million to $31 million, with net profit ranging from approximately $600,000 to $1,000,000. Our first quarter ending March 31, 2005 is expected to be positively influenced by vendor incentive programs, which reduce cost of goods sold in our first and third quarters. |
| |
| | • | | The forecasts set forth above are for the current organization and do not include the effect of any future acquisitions. We anticipate making selective acquisitions during the next twelve months, and beyond, however, there is no guarantee that any acquisitions will be consummated. |
| |
| | • | | We currently anticipate a possibility that we might begin accruing for the primary vendor incentive rebates that have in the past caused our first and third quarters to be more profitable than our second and fourth quarter. If we do begin to accrue such incentive rebates in the fourth quarter, such accrual would have the effect of moving a portion of the profit we expect to realize in the first quarter ending March 31, 2005 into our fourth quarter ending December 31, 2004 and will have the effect of smoothing out the quarter-to-quarter fluctuations in net profitability that have resulted from these vendor incentive rebates being recognized every six months. |
Regarding the Company’s outlook for the future, Mr. Long stated, “We are announcing our third quarter results about a week earlier than we have historically announced quarterly results, which slightly reduces our visibility for the near-term quarter. Because our third quarter revenue came in substantially above the high end of our previously announced expectations, we believe that some portion of such higher than expected revenue came at the expense of the fourth quarter. Also, we expect lower amounts of revenue during our fourth quarter from the large DISD project, which has been delayed due to payment delays caused by the customer’s administrative issues, the positive aspect of this issue being that this should lead to higher levels of revenue from this project in 2005. In addition, to add further complexity, there are several contracts that we are relatively confident that we will be awarded in the fourth quarter that could provide material upside to fourth quarter revenue, but since we do not have such contracts in hand at this time we must provide a range of outlook for the fourth quarter that takes this into consideration. While the range of possible results is somewhat wide for the fourth quarter, the currently expected revenue for our fourth quarter, which represents year-over-year growth of 51% to 97%, without the benefit of acquisitions during the past year, and slightly higher than our previously provided outlook for revenue for our fourth quarter in spite of the fact that previously expected revenue from the large DISD project is now going to be pushed out into 2005, reflects the strength we are seeing in the industry and our business. I believe we are in the right place, at the right time, to take advantage
of what we see as the beginning of the move by enterprise organizations towards the adoption of IP Telephony and VoIP technology, and I am excited about our prospects for the future.”
Conference Call:
An investor conference call and webcast will be held by the Company today at 11:00 a.m. Eastern Standard Time to present the results and updated outlook as well as provide an opportunity to answer investor’s questions in a public format. James H. Long, Chairman and Chief Executive Officer, and Mark T. Hilz, President and Chief Operating Officer will be on the call to present and answer investor’s questions. The call is expected to last approximately 45 to 60 minutes.
Investors will have three choices for participating in the call:
| | • | | Webcast only: A webcast slide presentation and streaming audio will enable investors to view a slide presentation, listen to the conference call and submit written questions to the Company during the presentation. |
| |
| | • | | Dial in: Investors that wish to listen to the conference call via traditional telephone without viewing the slide presentation may do so by dialing into the call, and will be able to submit questions during the question and answer period via telephone. |
| |
| | • | | Webcast slides and telephone participation during Q&A: Investors may use the Webcast to view slides and dial into the conference call in order to submit questions via telephone during the question and answer session. |
The conference call and webcast will begin promptly at 11:00 a.m. Eastern Standard Time, and investors should visit the webcast site and/or call into the conference call telephone number at least 10 minutes prior to that time. In order participate via the webcast, either Real Player or Windows Media Player will be required. Investor’s can go through a system test by visiting the above Internet URL the day prior to the conference call, and links to download either Real Player or Windows Media Player will be available on the web page.
Access to the live webcast and/or conference call will be via:
| | • | | Web access: www.I-Sector.com/Q3call |
| |
| | • | | U.S. toll free dial-in conference call number: (866) 814-1912 |
| |
| | • | | International/toll dial-in conference call number: (703) 639-1356 |
The content of the conference call will be available approximately one hour after the end of the call, for at least ninety days. The webcast, including synchronized audio and slide presentation, will be available by visiting the above Internet URL, or investors may call (888) 266-2081 or (703) 925-2533 and use access code 589466 to listen to the audio only portion of the call.
Safe Harbor Statement:
The statements contained in this document and during the related conference call that are not statements of historical fact (including in particular the statements made in the Outlook section and Mr. Long’s quotes above) including but not limited to, statements identified by the use of terms such as “anticipate,” “appear,” “believe,” “could,” “estimate,” “expect,” “hope,” “indicate,” “intend,” “likely,” “may,” “might,” “plan,” “potential,” “project,” “seek,” “should,” “will,” “would,” and other variations or negative expressions of these terms, are “forward-looking statements” within the meaning of the Private Securities Litigation Reform Act of 1995 and involve a number of risks and uncertainties. The actual results of the future events described in the forward-looking statements in this document could differ materially from those stated in the forward-looking statements due to numerous factors, including:
| | • | | Market and economic conditions, including capital expenditures by enterprises for communications products and services |
| |
| | • | | Whether anticipated contracts from which we expect revenues, if any, in fact produce revenues, and whether that revenue, if any, is recognized in the quarters in which we expect it |
| |
| | • | | The estimated needs of customers as conveyed to the Company and the nature and volume of products and services anticipated to be delivered |
| |
| | • | | The Company’s ability to obtain sufficient volumes of products for resale and maintain its relationship with its key supplier, Cisco Systems, Inc. |
| |
| | • | | The continuance of, and the Company’s ability to qualify for, sales incentive programs from its key supplier |
| |
| | • | | The Company’s ability to attract and retain key management, sales and technical staff |
| |
| | • | | Risks associated with entry into new markets |
| |
| | • | | The Company’s ability to identify suitable acquisition candidates and successfully integrate acquired companies |
| |
| | • | | Broad market acceptance of Cisco-centric IP telephony products and technology |
| |
| | • | | The Company’s ability to finance continued growth |
| |
| | • | | Unexpected losses related to customer credit risk |
| |
| | • | | Catastrophic events |
| |
| | • | | Uncertainties related to rapid changes in the information and communications technology industries |
| |
| | • | | Other risks and uncertainties set forth from time to time in the Company’s public statements and its most recent Annual Report filed with the SEC on Form 10-K for the year 2003, which is available on the Internet at
www.I-Sector.com/Information/SECFilings/2004/03_12_10K.pdf. |
Recipients of this document are cautioned to consider these risks and uncertainties and to not place undue reliance on these forward-looking statements. The financial information contained in this release should be read in conjunction with the consolidated financial statements and notes thereto included in the Company’s most recent reports on Form 10-K and Form 10-Q, each as it may be amended from time to time. The Company’s past results of operations are not necessarily indicative of its operating results for any future periods. The Company expressly disclaims any obligation or undertaking to update or revise any forward-looking statement contained herein to reflect any change in the Company’s expectations with regard thereto, or any change in events, conditions or circumstances upon which any statement is based.
About I-Sector Corporation:
I-Sector Corporation, headquartered in Houston, Texas (AMEX:ISR — News), is engaged in the area of providing information and communications technology, with a particular focus on Cisco-centric IP Communications solutions. Additional information about I-Sector is available on the Internet at www.I-Sector.com.
I-SECTOR CORPORATION AND SUBSIDIARIES
CONSOLIDATED STATEMENTS OF INCOME
(In thousands, except share and per share amounts)
(Unaudited)
| | | | | | | | | |
| | | Three months ended |
| | | September 30,
|
| | | 2003
| | 2004
|
| Revenue: | | | | | | | | |
| Products | | $ | 16,302 | | | $ | 27,255 | |
| Services | | | 2,264 | | | | 2,826 | |
| Custom projects | | | 2,415 | | | | 2,531 | |
| | | |
| | | |
| |
| Total revenue | | | 20,981 | | | | 32,612 | |
| | | |
| | | |
| |
| Cost of goods and services: | | | | | | | | |
| Products | | | 14,066 | | | | 23,331 | |
| Services | | | 1,396 | | | | 1,849 | |
| Custom projects | | | 728 | | | | 1,323 | |
| | | |
| | | |
| |
| Total cost of goods and services | | | 16,190 | | | | 26,503 | |
| | | |
| | | |
| |
| Gross profit | | | 4,791 | | | | 6,109 | |
| Selling, general and administrative expenses | | | 4,621 | | | | 5,456 | |
| | | |
| | | |
| |
| Operating income (loss) | | | 170 | | | | 653 | |
| Interest and other income, net | | | (11 | ) | | | 17 | |
| | | |
| | | |
| |
| Income (loss) from continuing operations before benefit from income taxes | | | 159 | | | | 670 | |
| Income tax benefit | | | (12 | ) | | | 2 | |
| | | |
| | | |
| |
| Net income (loss) from continuing operations | | | 171 | | | | 668 | |
| Minority interest | | | — | | | | (50 | ) |
| Discontinued operations: | | | | | | | | |
| Gain on disposal of discontinued operations, net of taxes | | | 23 | | | | — | |
| | | |
| | | |
| |
| Net income (loss) | | $ | 194 | | | $ | 618 | |
| | | |
| | | |
| |
| Net income (loss) per share | | | | | | | | |
| Basic: | | | | | | | | |
| Net income (loss) from continuing operations | | $ | 0.04 | | | $ | 0.12 | |
| Minority interest | | | — | | | | (0.01 | ) |
| Gain on disposal of discontinued operations, net of taxes | | | 0.01 | | | | — | |
| | | |
| | | |
| |
| Net income (loss) per share | | $ | 0.05 | | | $ | 0.11 | |
| | | |
| | | |
| |
| Diluted: | | | | | | | | |
| Net income (loss) from continuing operations | | $ | 0.03 | | | $ | 0.11 | |
| Minority interest | | | — | | | | (0.01 | ) |
| Gain on disposal of discontinued operations, net of taxes | | | 0.01 | | | | — | |
| | | |
| | | |
| |
| Net income (loss) per share | | $ | 0.05 | | | $ | 0.10 | |
| | | |
| | | |
| |
| Shares used in computing net income (loss) per share: | | | | | | | | |
| Basic | | | 3,703,206 | | | | 5,148,837 | |
| | | |
| | | |
| |
| Diluted | | | 3,974,298 | | | | 5,547,912 | |
| | | |
| | | |
| |
See notes to consolidated financial statements
I-SECTOR CORPORATION AND SUBSIDIARIES
CONSOLIDATED STATEMENTS OF INCOME
(In thousands, except share and per share amounts)
(Unaudited)
| | | | | | | | | |
| | | Nine months ended |
| | | September 30,
|
| | | 2003
| | 2004
|
| Revenue: | | | | | | | | |
| Products | | $ | 35,655 | | | $ | 54,058 | |
| Services | | | 5,282 | | | | 7,879 | |
| Custom projects | | | 5,995 | | | | 6,837 | |
| | | |
| | | |
| |
| Total revenue | | | 46,932 | | | | 68,774 | |
| | | |
| | | |
| |
| Cost of goods and services: | | | | | | | | |
| Products | | | 31,181 | | | | 46,472 | |
| Services | | | 3,852 | | | | 5,187 | |
| Custom projects | | | 2,104 | | | | 3,171 | |
| | | |
| | | |
| |
| Total cost of goods and services | | | 37,137 | | | | 54,830 | |
| | | |
| | | |
| |
| Gross profit | | | 9,795 | | | | 13,944 | |
| Selling, general and administrative expenses | | | 11,556 | | | | 13,191 | |
| | | |
| | | |
| |
| Operating income (loss) | | | (1,761 | ) | | | 753 | |
| Interest and other income, net | | | 93 | | | | 10 | |
| | | |
| | | |
| |
| Income (loss) from continuing operations before benefit from income taxes | | | (1,668 | ) | | | 763 | |
| Income tax benefit | | | 93 | | | | — | |
| | | |
| | | |
| |
| Net income (loss) from continuing operations | | | (1,575 | ) | | | 763 | |
| Minority interest | | | — | | | | (56 | ) |
| Discontinued operations: | | | | | | | | |
| Gain on disposal of discontinued operations, net of taxes | | | 39 | | | | 1 | |
| | | |
| | | |
| |
| Net income (loss) | | $ | (1,536 | ) | | $ | 708 | |
| | | |
| | | |
| |
| Net income (loss) per share | | | | | | | | |
| Basic: | | | | | | | | |
| Net income (loss) from continuing operations | | $ | (0.43 | ) | | $ | 0.15 | |
| Minority interest | | | — | | | | (0.01 | ) |
| Gain on disposal of discontinued operations, net of taxes | | | 0.01 | | | | — | |
| | | |
| | | |
| |
| Net income (loss) per share | | $ | (0.42 | ) | | $ | 0.14 | |
| | | |
| | | |
| |
| Diluted: | | | | | | | | |
| Net income (loss) from continuing operations | | $ | (0.43 | ) | | $ | 0.14 | |
| Minority interest | | | — | | | | (0.01 | ) |
| Gain on disposal of discontinued operations, net of taxes | | | 0.01 | | | | — | |
| | | |
| | | |
| |
| Net income (loss) per share | | $ | (0.42 | ) | | $ | 0.13 | |
| | | |
| | | |
| |
| Shares used in computing net income (loss) per share: | | | | | | | | |
| Basic | | | 3,643,346 | | | | 4,572,124 | |
| | | |
| | | |
| |
| Diluted | | | 3,643,346 | | | | 5,014,378 | |
| | | |
| | | |
| |
See notes to consolidated financial statements
I-SECTOR CORPORATION AND SUBSIDIARIES
SEGMENT STATEMENTS OF INCOME
(In thousands, except share and per share amounts)
(Unaudited)
| | | | | | | | | | | | | | | | | |
| | | Three months ended September 30,
|
| | | 2003
| | 2004
|
| | | Amount
| | %
| | Amount
| | %
|
| Revenue: | | | | | | | | | | | | | | | | |
| INX product | | $ | 15,954 | | | | 76.0 | | | $ | 27,179 | | | | 83.3 | |
| INX service | | | 1,392 | | | | 6.7 | | | | 1,516 | | | | 4.6 | |
| | | |
| | | |
| | | |
| | | |
| |
| Total INX revenue | | | 17,346 | | | | 82.7 | | | | 28,695 | | | | 87.9 | |
| | | |
| | | |
| | | |
| | | |
| |
| Stratasoft — Custom projects | | | 2,415 | | | | 11.5 | | | | 2,531 | | | | 7.8 | |
| Valerent product | | | 515 | | | | 2.4 | | | | 288 | | | | 0.9 | |
| Valerent service | | | 877 | | | | 4.2 | | | | 1,310 | | | | 4.0 | |
| | | |
| | | |
| | | |
| | | |
| |
| Total Valerent revenue | | | 1,392 | | | | 6.6 | | | | 1,598 | | | | 4.9 | |
| Eliminations revenue | | | (172 | ) | | | (0.8 | ) | | | (212 | ) | | | (0.6 | ) |
| | | |
| | | |
| | | |
| | | |
| |
| Total revenue | | | 20,981 | | | | 100.0 | | | | 32,612 | | | | 100.0 | |
| Cost of sales and service: | | | | | | | | | | | | | | | | |
| INX product | | | 13,758 | | | | 86.2 | | | | 23,251 | | | | 85.5 | |
| INX service | | | 795 | | | | 57.1 | | | | 1,099 | | | | 72.5 | |
| | | |
| | | |
| | | |
| | | |
| |
| Total INX cost of sales and service | | | 14,553 | | | | 83.9 | | | | 24,350 | | | | 84.9 | |
| Stratasoft — Custom projects | | | 728 | | | | 30.1 | | | | 1,323 | | | | 52.3 | |
| Valerent product | | | 474 | | | | 92.0 | | | | 292 | | | | 101.4 | |
| Valerent service | | | 606 | | | | 69.1 | | | | 750 | | | | 57.3 | |
| | | |
| | | |
| | | |
| | | |
| |
| Total Valerent cost of sales and service | | | 1,080 | | | | 77.6 | | | | 1,042 | | | | 65.2 | |
| Eliminations of cost of sales and service | | | (171 | ) | | | 99.4 | | | | (212 | ) | | | 100.0 | |
| Total cost of sales and service | | | 16,190 | | | | 77.2 | | | | 26,503 | | | | 81.3 | |
| Gross profit: | | | | | | | | | | | | | | | | |
| INX product | | | 2,196 | | | | 13.8 | | | | 3,928 | | | | 14.5 | |
| INX service | | | 597 | | | | 42.9 | | | | 417 | | | | 27.5 | |
| | | |
| | | |
| | | |
| | | |
| |
| Total INX gross profit | | | 2,793 | | | | 16.1 | | | | 4,345 | | | | 15.1 | |
| Stratasoft — Custom projects | | | 1,687 | | | | 69.9 | | | | 1,208 | | | | 47.7 | |
| Valerent product | | | 41 | | | | 8.0 | | | | (4 | ) | | | (1.4 | ) |
| Valerent service | | | 271 | | | | 30.9 | | | | 560 | | | | 42.7 | |
| | | |
| | | |
| | | |
| | | |
| |
| Total Valerent gross profit | | | 312 | | | | 22.4 | | | | 556 | | | | 34.8 | |
| Eliminations gross profit | | | (1 | ) | | | 0.0 | | | | — | | | | 0.0 | |
| | | |
| | | |
| | | |
| | | |
| |
| Total gross profit | | | 4,791 | | | | 22.8 | | | | 6,109 | | | | 18.7 | |
| Selling, general and administrative expenses: | | | | | | | | | | | | | | | | |
| INX | | | 2,126 | | | | 12.3 | | | | 3,332 | | | | 11.6 | |
| Stratasoft | | | 1,754 | | | | 72.6 | | | | 1,419 | | | | 56.1 | |
| Valerent | | | 455 | | | | 32.7 | | | | 522 | | | | 32.7 | |
| Corporate | | | 287 | | | | (NA | ) | | | 183 | | | | (NA | ) |
| Eliminations | | | (1 | ) | | | (NA | ) | | | — | | | | (NA | ) |
| | | |
| | | |
| | | |
| | | |
| |
| Total selling, general and administrative expenses | | | 4,621 | | | | 22.0 | | | | 5,456 | | | | 16.7 | |
| Operating income (loss): | | | | | | | | | | | | | | | | |
| INX | | | 667 | | | | 3.8 | | | | 1,013 | | | | 3.5 | |
| Stratasoft | | | (67 | ) | | | (2.8 | ) | | | (211 | ) | | | (8.3 | ) |
| Valerent | | | (143 | ) | | | (10.3 | ) | | | 34 | | | | 2.1 | |
| Corporate | | | (287 | ) | | | (NA | ) | | | (183 | ) | | | (NA | ) |
| | | |
| | | |
| | | |
| | | |
| |
| Total operating income (loss) | | | 170 | | | | 0.8 | | | | 653 | | | | 2.0 | |
| Interest and other income (expense), net | | | (11 | ) | | | (0.1 | ) | | | 17 | | | | 0.1 | |
| | | |
| | | |
| | | |
| | | |
| |
| Income (loss) from continuing operations before benefit for income tax benefit | | | 159 | | | | 0.8 | | | | 670 | | | | 2.1 | |
| Benefit for income taxes | | | (12 | ) | | | (0.1 | ) | | | 2 | | | | 0.0 | |
| | | |
| | | |
| | | |
| | | |
| |
| Net income (loss) from continuing operations | | | 171 | | | | 0.8 | | | | 668 | | | | 2.0 | |
| Minority interest | | | — | | | | 0.0 | | | | (50 | ) | | | (0.2 | ) |
| Discontinued operations: | | | | | | | | | | | | | | | | |
| Gain on disposal, net of taxes | | | 23 | | | | 0.1 | | | | — | | | | 0.0 | |
| | | |
| | | |
| | | |
| | | |
| |
| Net income (loss) | | $ | 194 | | | | 0.9 | | | $ | 618 | | | | 1.9 | |
| | | |
| | | |
| | | |
| | | |
| |
I-SECTOR CORPORATION AND SUBSIDIARIES
SEGMENT STATEMENTS OF INCOME
(In thousands, except share and per share amounts)
(Unaudited)
| | | | | | | | | | | | | | | | | |
| | | Nine months ended September 30,
|
| | | 2003
| | 2004
|
| | | Amount
| | %
| | Amount
| | %
|
| Revenue: | | | | | | | | | | | | | | | | |
| INX product | | $ | 34,795 | | | | 74.1 | | | $ | 53,594 | | | | 77.9 | |
| INX service | | | 2,725 | | | | 5.8 | | | | 4,054 | | | | 5.9 | |
| | | |
| | | |
| | | |
| | | |
| |
| Total INX revenue | | | 37,520 | | | | 79.9 | | | | 57,648 | | | | 83.8 | |
| | | |
| | | |
| | | |
| | | |
| |
| Stratasoft — Custom projects | | | 5,995 | | | | 12.8 | | | | 6,837 | | | | 9.9 | |
| Valerent product | | | 1,219 | | | | 2.6 | | | | 1,127 | | | | 1.6 | |
| Valerent service | | | 2,562 | | | | 5.5 | | | | 3,825 | | | | 5.6 | |
| | | |
| | | |
| | | |
| | | |
| |
| Total Valerent revenue | | | 3,781 | | | | 8.1 | | | | 4,952 | | | | 7.2 | |
| Eliminations revenue | | | (364 | ) | | | (0.8 | ) | | | (663 | ) | | | (0.9 | ) |
| | | |
| | | |
| | | |
| | | |
| |
| Total revenue | | | 46,932 | | | | 100.0 | | | | 68,774 | | | | 100.0 | |
| Cost of sales and service: | | | | | | | | | | | | | | | | |
| INX product | | | 30,448 | | | | 87.5 | | | | 46,073 | | | | 86.0 | |
| INX service | | | 2,068 | | | | 75.9 | | | | 2,833 | | | | 69.9 | |
| | | |
| | | |
| | | |
| | | |
| |
| Total INX cost of sales and service | | | 32,516 | | | | 86.7 | | | | 48,906 | | | | 84.8 | |
| Stratasoft — Custom projects | | | 2,104 | | | | 35.1 | | | | 3,171 | | | | 46.4 | |
| Valerent product | | | 1,090 | | | | 89.4 | | | | 1,062 | | | | 94.2 | |
| Valerent service | | | 1,789 | | | | 69.8 | | | | 2,354 | | | | 61.5 | |
| | | |
| | | |
| | | |
| | | |
| |
| Total Valerent cost of sales and service | | | 2,879 | | | | 76.1 | | | | 3,416 | | | | 69.0 | |
| Eliminations of cost of sales and service | | | (362 | ) | | | 99.5 | | | | (663 | ) | | | 100.0 | |
| | | |
| | | |
| | | |
| | | |
| |
| Total cost of sales and service | | | 37,137 | | | | 79.1 | | | | 54,830 | | | | 79.7 | |
| Gross profit: | | | | | | | | | | | | | | | | |
| INX product | | | 4,347 | | | | 12.5 | | | | 7,521 | | | | 14.0 | |
| INX service | | | 657 | | | | 24.1 | | | | 1,221 | | | | 30.1 | |
| | | |
| | | |
| | | |
| | | |
| |
| Total INX gross profit | | | 5,004 | | | | 13.3 | | | | 8,742 | | | | 15.2 | |
| Stratasoft — Custom projects | | | 3,891 | | | | 64.9 | | | | 3,666 | | | | 53.6 | |
| Valerent product | | | 129 | | | | 10.6 | | | | 65 | | | | 5.8 | |
| Valerent service | | | 773 | | | | 30.2 | | | | 1,471 | | | | 38.5 | |
| | | |
| | | |
| | | |
| | | |
| |
| Total Valerent gross profit | | | 902 | | | | 23.9 | | | | 1,536 | | | | 31.0 | |
| Eliminations gross profit | | | (2 | ) | | | (0.5 | ) | | | — | | | | 0.0 | |
| | | |
| | | |
| | | |
| | | |
| |
| Total gross profit | | | 9,795 | | | | 20.9 | | | | 13,944 | | | | 20.3 | |
| Selling, general and administrative expenses: | | | | | | | | | | | | | | | | |
| INX | | | 4,518 | | | | 12.0 | | | | 7,534 | | | | 13.1 | |
| Stratasoft | | | 4,694 | | | | 78.3 | | | | 3,570 | | | | 52.2 | |
| Valerent | | | 1,551 | | | | 41.0 | | | | 1,398 | | | | 28.2 | |
| Corporate | | | 795 | | | | (NA | ) | | | 689 | | | | (NA | ) |
| Eliminations | | | (2 | ) | | | (NA | ) | | | — | | | | (NA | ) |
| | | |
| | | |
| | | |
| | | |
| |
| Total selling, general and administrative expenses | | | 11,556 | | | | 24.6 | | | | 13,191 | | | | 19.2 | |
| Operating income (loss): | | | | | | | | | | | | | | | | |
| INX | | | 486 | | | | 1.3 | | | | 1,208 | | | | 2.1 | |
| Stratasoft | | | (803 | ) | | | (13.4 | ) | | | 96 | | | | 1.4 | |
| Valerent | | | (649 | ) | | | (17.2 | ) | | | 138 | | | | 2.8 | |
| Corporate | | | (795 | ) | | | (NA | ) | | | (689 | ) | | | (NA | ) |
| | | |
| | | |
| | | |
| | | |
| |
| Total operating income (loss) | | | (1,761 | ) | | | (3.8 | ) | | | 753 | | | | 1.1 | |
| Interest and other income (expense), net | | | 93 | | | | 0.2 | | | | 10 | | | | 0.0 | |
| | | |
| | | |
| | | |
| | | |
| |
| Income (loss) from continuing operations before benefit for income tax benefit | | | (1,668 | ) | | | (3.6 | ) | | | 763 | | | | 1.1 | |
| Benefit for income taxes | | | 93 | | | | (0.2 | ) | | | — | | | | 0.0 | |
| | | |
| | | |
| | | |
| | | |
| |
| Net income (loss) from continuing operations | | | (1,575 | ) | | | (3.4 | ) | | | 763 | | | | 1.1 | |
| Minority interest | | | — | | | | 0.0 | | | | (56 | ) | | | (0.0 | ) |
| Discontinued operations: | | | | | | | | | | | | | | | | |
| Gain on disposal, net of taxes | | | 39 | | | | 0.1 | | | | 1 | | | | 0.0 | |
| | | |
| | | |
| | | |
| | | |
| |
| Net income (loss) | | $ | (1,536 | ) | | | (3.3 | ) | | $ | 708 | | | | 1.0 | |
| | | |
| | | |
| | | |
| | | |
| |
Contact:
I-Sector Corporation
James H. Long, Chairman & CEO, 713-795-2000
or
PR Financial Marketing LLC
Jim Blackman, 713-256-0369
jimblackman@prfinancialmarketing.com
SIGNATURE
Pursuant to the requirements of the Securities Exchange Act of 1934, the registrant has duly caused this report to be signed on its behalf by the undersigned hereunto duly authorized.
Date: November 3, 2004
| | | | | |
| | I-SECTOR CORPORATION
| |
| | By: | /s/ JAMES H. LONG | |
| | | James H. Long | |
| | | Chief Executive Officer, Chief Financial Officer, President and Chairman of the Board | |
| |
| I-Sector Corporation AMEX: ISR Third Quarter Ended September 30, 2004 Preliminary Results and Outlook |
| Safe Harbor Statement This presentation contains "forward-looking statements" within the meaning of the Private Securities Litigation Reform Act of 1995. Statements associated with words such as "anticipate," "believe," "expect," "hope," "should," "will" or other similar words are forward-looking statements. Actual events, performance or results may differ materially from those indicated due to numerous factors, many of which we have little or no control over, and some of which we may not be successful in addressing. Numerous of these factors are set forth in our financial results press release issued today as well as in our 2003 annual report on Form 10-K, which we urge you to read. This presentation is made as of November 3, 2004. We will not undertake to revise or update the forward looking statements contained herein as events and circumstances change. AMEX: ISR |
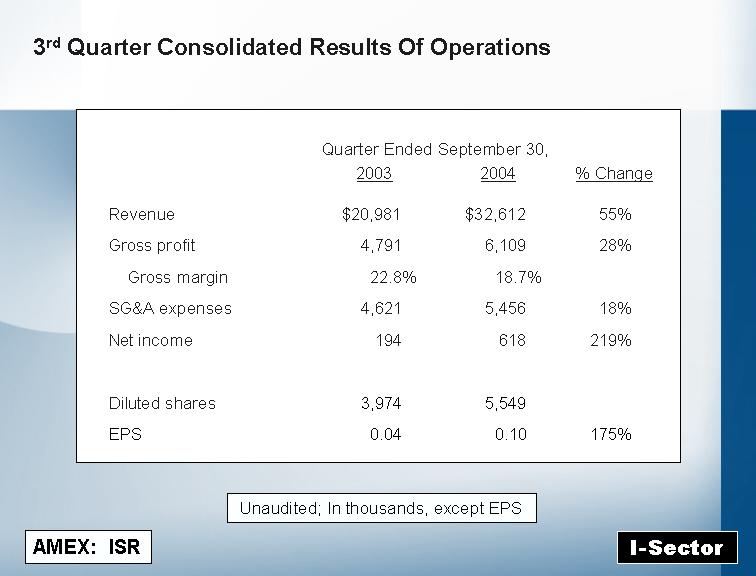
| 3rd Quarter Consolidated Results Of Operations AMEX: ISR Quarter Ended September 30, 2003 2004 % Change Revenue $20,981 $32,612 55% Gross profit 4,791 6,109 28% Gross margin 22.8% 18.7% SG&A expenses 4,621 5,456 18% Net income 194 618 219% Diluted shares 3,974 5,549 EPS 0.04 0.10 175% Unaudited; In thousands, except EPS |
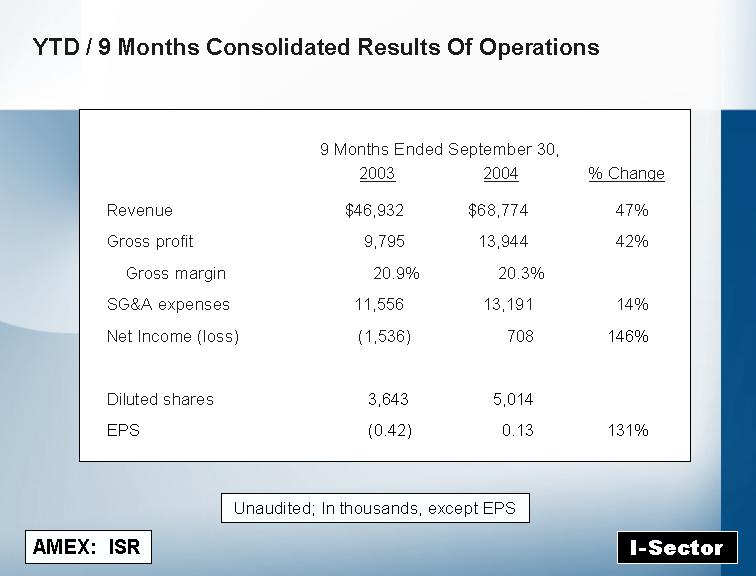
| YTD / 9 Months Consolidated Results Of Operations AMEX: ISR 9 Months Ended September 30, 2003 2004 % Change Revenue $46,932 $68,774 47% Gross profit 9,795 13,944 42% Gross margin 20.9% 20.3% SG&A expenses 11,556 13,191 14% Net Income (loss) (1,536) 708 146% Diluted shares 3,643 5,014 EPS (0.42) 0.13 131% Unaudited; In thousands, except EPS |

| 3rd Quarter Achievements Record revenue and earnings. Numerous new customer relationships and contract wins. Introduced three new proprietary products: Stratasoft's "StrataWFM" - work flow management application for VoIP. Stratasoft's "StrataSIP" - a SIP-based VoIP soft phone for StrataDial. INX's "VIPRE" - IP video surveillance product Increased Textron credit facility used for Cisco product purchases to $25 million. Opened San Antonio, Texas office; 5th branch office including Washington DC federal government business office. Progress on acquisition expansion effort. AMEX: ISR |
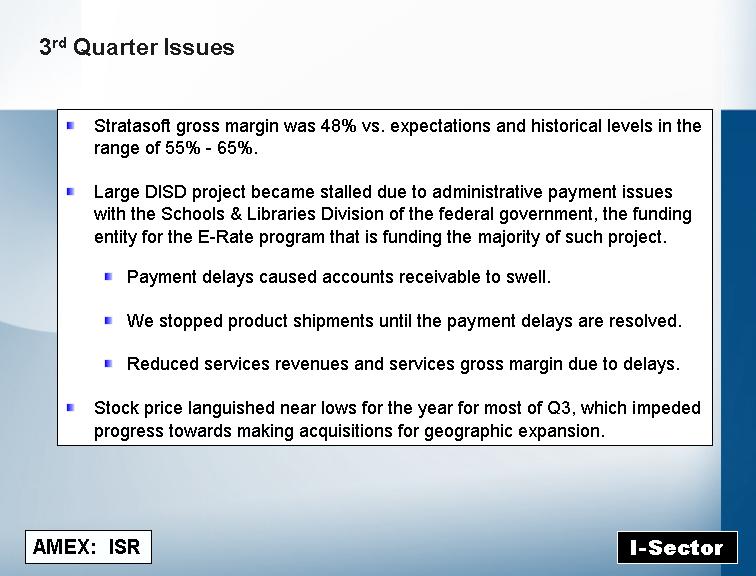
| 3rd Quarter Issues Stratasoft gross margin was 48% vs. expectations and historical levels in the range of 55% - 65%. Large DISD project became stalled due to administrative payment issues with the Schools & Libraries Division of the federal government, the funding entity for the E-Rate program that is funding the majority of such project. Payment delays caused accounts receivable to swell. We stopped product shipments until the payment delays are resolved. Reduced services revenues and services gross margin due to delays. Stock price languished near lows for the year for most of Q3, which impeded progress towards making acquisitions for geographic expansion. AMEX: ISR |
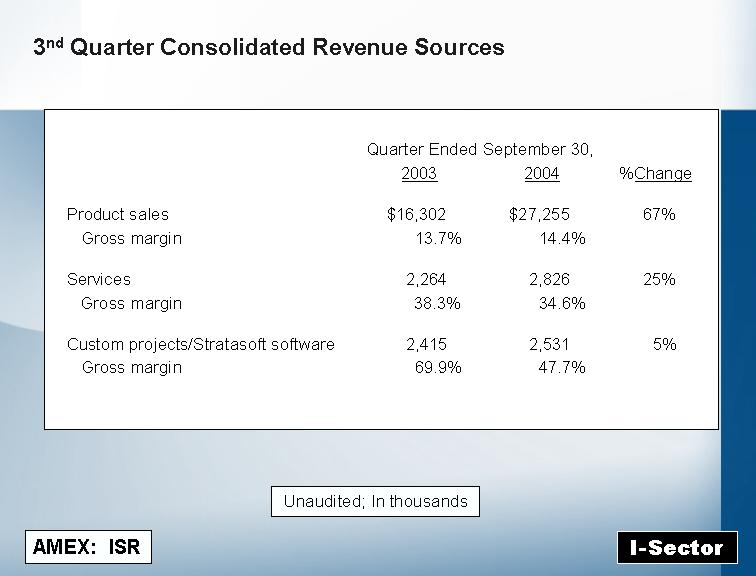
| 3nd Quarter Consolidated Revenue Sources AMEX: ISR Quarter Ended September 30, 2003 2004 %Change Product sales $16,302 $27,255 67% Gross margin 13.7% 14.4% Services 2,264 2,826 25% Gross margin 38.3% 34.6% Custom projects/Stratasoft software 2,415 2,531 5% Gross margin 69.9% 47.7% Unaudited; In thousands |

| Internetwork Experts, Inc. AMEX: ISR Quarter Ended September 30, 2003 2004 Change Unaudited, In thousands 3rd Qtr Subsidiary / Segment Results Operating Results Revenue Sources Product sales $15,954 $27,179 70% Gross profit 2,196 3,928 79% Gross margin 13.8% 14.5% Services $ 1,392 $ 1,516 9% Gross profit 597 417 (30%) Gross margin 42.9% 27.5% Revenue $17,346 $28,695 65% Gross profit 2,793 4,345 56% Gross margin 16.1% 15.1% SG&A expenses 2,126 3,332 57% Operating income 667 1,013 52% |
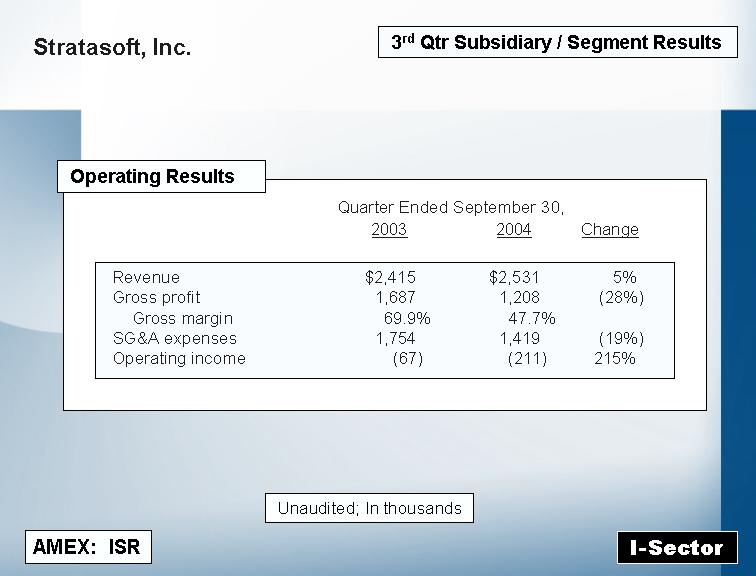
| Stratasoft, Inc. AMEX: ISR Quarter Ended September 30, 2003 2004 Change Operating Results Revenue $2,415 $2,531 5% Gross profit 1,687 1,208 (28%) Gross margin 69.9% 47.7% SG&A expenses 1,754 1,419 (19%) Operating income (67) (211) 215% Unaudited; In thousands 3rd Qtr Subsidiary / Segment Results |
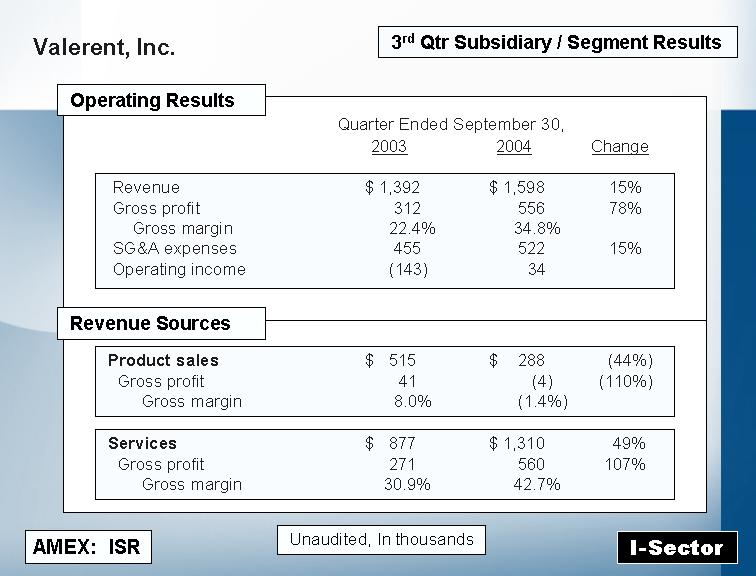
| Valerent, Inc. AMEX: ISR Quarter Ended September 30, 2003 2004 Change Unaudited, In thousands Operating Results Revenue Sources Product sales $ 515 $ 288 (44%) Gross profit 41 (4) (110%) Gross margin 8.0% (1.4%) Services $ 877 $ 1,310 49% Gross profit 271 560 107% Gross margin 30.9% 42.7% Revenue $ 1,392 $ 1,598 15% Gross profit 312 556 78% Gross margin 22.4% 34.8% SG&A expenses 455 522 15% Operating income (143) 34 3rd Qtr Subsidiary / Segment Results |
| Selected Balance Sheet Information AMEX: ISR In thousands Dec 31, Sep 30, 2003 2004 (unaudited) Assets: Cash $ 2,172 $ 4,424 Accounts receivables, net 9,802 27,053 Inventory 1,038 1,420 Non-current assets 3,124 3,341 Liabilities: Debt $ 2,013 $ 6,367 Accounts payable 6,524 12,175 Accrued expenses 2,676 4,574 Stockholders' equity $ 6,619 $14,831 Working capital $ 3,724 $11,993 |
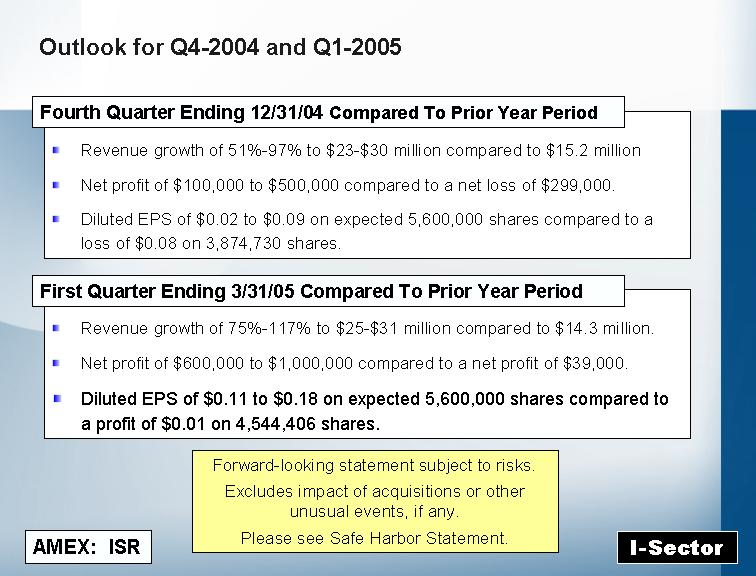
| Outlook for Q4-2004 and Q1-2005 Revenue growth of 51%-97% to $23-$30 million compared to $15.2 million Net profit of $100,000 to $500,000 compared to a net loss of $299,000. Diluted EPS of $0.02 to $0.09 on expected 5,600,000 shares compared to a loss of $0.08 on 3,874,730 shares. AMEX: ISR Fourth Quarter Ending 12/31/04 Compared To Prior Year Period Revenue growth of 75%-117% to $25-$31 million compared to $14.3 million. Net profit of $600,000 to $1,000,000 compared to a net profit of $39,000. Diluted EPS of $0.11 to $0.18 on expected 5,600,000 shares compared to a profit of $0.01 on 4,544,406 shares. First Quarter Ending 3/31/05 Compared To Prior Year Period Forward-looking statement subject to risks. Excludes impact of acquisitions or other unusual events, if any. Please see Safe Harbor Statement. |