Exhibit 99.1
Kaufman Brothers Conference Mark Hilz President & COO May 16, 2007 INX Inc. Nasdaq: INXI www.INXI.com
Forward-Looking Statements This presentation contains “forward-looking statements” within the meaning of the Private Securities Litigation Reform Act of 1995, including future operating results expectations. Statements associated with words such as “anticipate,” “believe,” “expect,” “hope,” “should,” “target,” “will” or other similar words are forward-looking statements. These projections and other forward-looking statements are only projections. Actual events, performance or results may differ materially from those indicated due to numerous factors, many of which we have little or no control over, and some of which we may not be successful in addressing. Numerous of these factors are set forth in INX’s Form 10-K for 2006, which is available on INX’s web site at www.INXI.com, and which we urge you to read. All financial results shown are for continuing operations unless otherwise noted
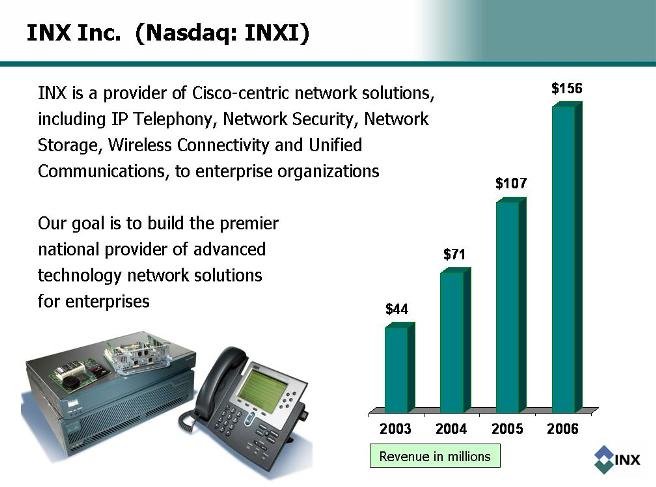
INX Inc. (Nasdaq: INXI) $44 $71 $107 $156 2003 2004 2005 2006 INX is a provider of Cisco-centric network solutions, including IP Telephony, Network Security, Network Storage, Wireless Connectivity and Unified Communications, to enterprise organizations Our goal is to build the premier national provider of advanced technology network solutions for enterprises Revenue in millions
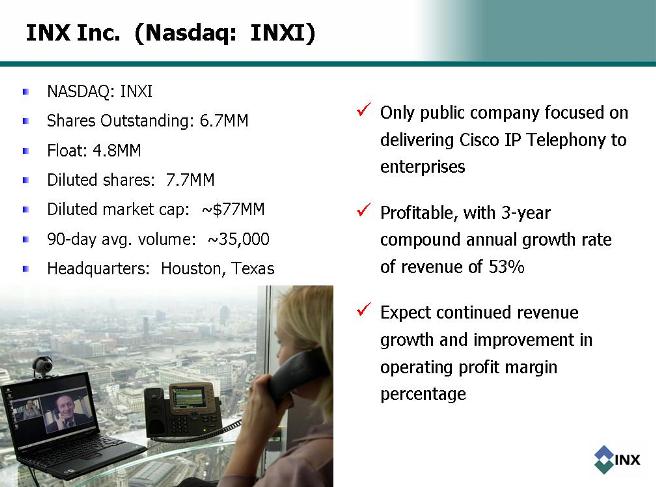
INX Inc. (Nasdaq: INXI) NASDAQ: INXI Shares Outstanding: 6.7MM Float: 4.8MM Diluted shares: 7.7MM Diluted market cap: ~$77MM 90-day avg. volume: ~35,000 Headquarters: Houston, Texas Only public company focused on delivering Cisco IP Telephony to enterprises Profitable, with 3-year compound annual growth rate of revenue of 53% Expect continued revenue growth and improvement in operating profit margin percentage
Management Jim Long – Chairman & CEO – founded the company in 1982. Mark Hilz – President & COO – experience as CEO of larger public company; acquisitions experience; served on INX board prior to joining management in July 2000. Brian Fontana – CFO – since January 2005; experience as CFO with larger public companies; acquisitions experience. Ex-Cisco management: VP of Sales; VP of Federal; VP of managed services business
Mass Adoption Of IP Telephony By Enterprises Is Just Beginning A 2006 survey of North American enterprises demonstrates adoption of VoIP is still at an early stage of market maturity: 78% planned to migrate to IP Telephony technology Less than 14% were “fully deployed” Only 62% are expected to be fully deployed by 2011 Source: Forrester’s Business Technographics March 2006 North American and European Enterprise Network and Telecommunications Survey
Increasing IP Network Importance & Complexity Drives Demand For INX Solutions Enterprises are realizing the IP network is rapidly becoming the platform for all forms of communications IP Network Importance & Complexity Collaboration Security Storage Wireless Access Voice Video Routing & Switching Demand for INX Services
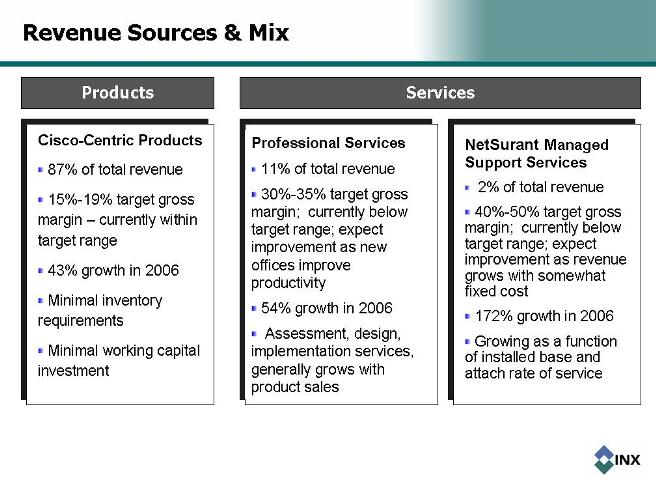
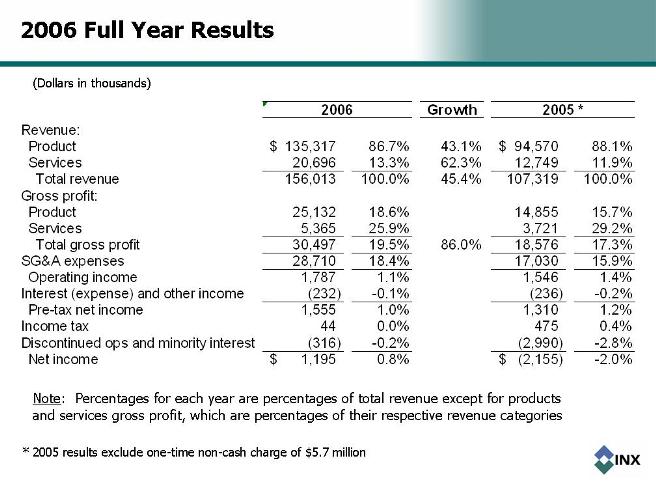
Revenue Sources & Mix Cisco-Centric Products 87% of total revenue 15%-19% target gross margin – currently within target range 43% growth in 2006 Minimal inventory requirements Minimal working capital investment Professional Services 11% of total revenue 30%-35% target gross margin; currently below target range; expect improvement as new offices improve productivity 54% growth in 2006 Assessment, design, implementation services, generally grows with product sales NetSurant Managed Support Services 2% of total revenue 40%-50% target gross margin; currently below target range; expect improvement as revenue grows with somewhat fixed cost 172% growth in 2006 Growing as a function of installed base and attach rate of service
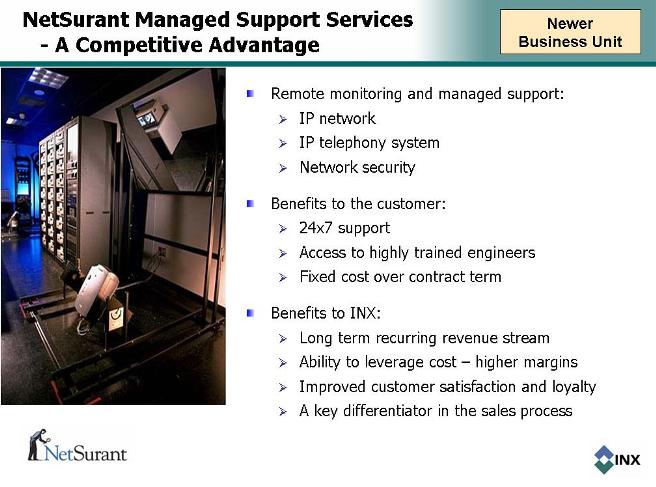
NetSurant Managed Support Services A Competitive Advantage Remote monitoring and managed support: IP network IP telephony system Network security Benefits to the customer: 24x7 support Access to highly trained engineers Fixed cost over contract term Benefits to INX: Long term recurring revenue stream Ability to leverage cost – higher margins Improved customer satisfaction and loyalty A key differentiator in the sales process
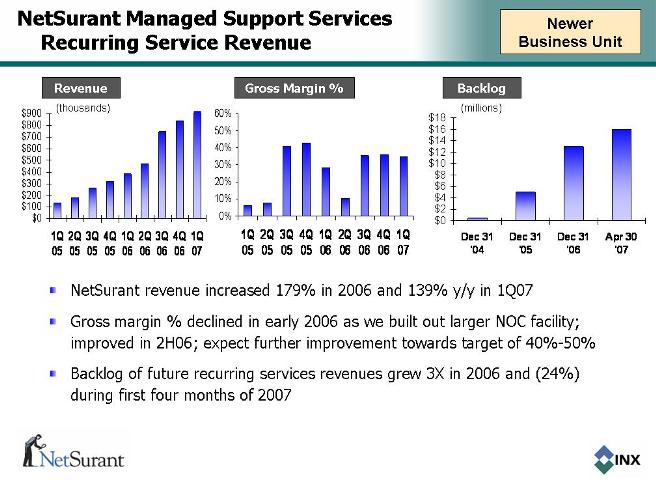
NetSurant Managed Support Services Recurring Service Revenue $0 $100 $200 $300 $400 $500 $600 $700 $800 $900 1Q 05 2Q 05 3Q 05 4Q 05 1Q 06 2Q 06 3Q 06 4Q 06 1Q 07 $0 $2 $4 $6 $8 $10 $12 $14 $16 $18 Dec 31 '04 Dec 31 '05 Dec 31 '06 Apr 30 '07 NetSurant revenue increased 179% in 2006 and 139% y/y in 1Q07 Gross margin % declined in early 2006 as we built out larger NOC facility; improved in 2H06; expect further improvement towards target of 40%-50% Backlog of future recurring services revenues grew 3X in 2006 and (24%) during first four months of 2007 Backlog (thousands) (millions) Revenue 0% 10% 20% 30% 40% 50% 60% 1Q 05 2Q 05 3Q 05 4Q 05 1Q 06 2Q 06 3Q 06 4Q 06 1Q 07 Gross Margin % Newer Business Unit
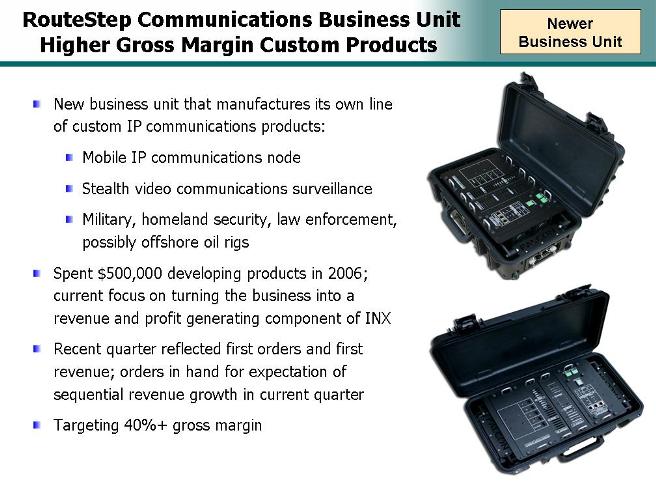
RouteStep Communications Business Unit Higher Gross Margin Custom Products New business unit that manufactures its own line of custom IP communications products: Mobile IP communications node Stealth video communications surveillance Military, homeland security, law enforcement, possibly offshore oil rigs Spent $500,000 developing products in 2006; current focus on turning the business into a revenue and profit generating component of INX Recent quarter reflected first orders and first revenue; orders in hand for expectation of sequential revenue growth in current quarter Targeting 40%+ gross margin
Our Longer-Term Financial Expectations We believe the industry we are participating in is growing at 20%-30% We expect to grow faster than industry growth rates over the long run by: gaining market share because of our focus and expertise increasing revenue per customer by selling to larger customers and introducing related new offerings to customers (such as storage and security) expanding geographically (primarily through acquisitions) We have a target for operating income margin % in the range of 4% to 7%, which we expect to achieve by: improving gross margin on service revenue leveraging certain categories of operating expenses against higher revenue We currently expect to achieve the lower end of target operating profit margin percentage within several quarters
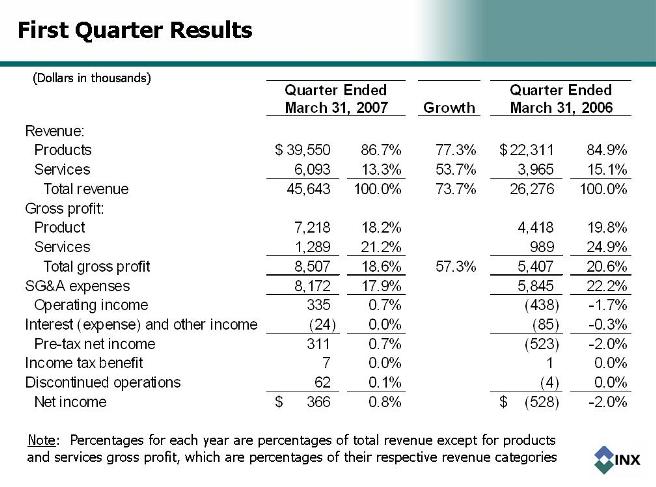
First Quarter Results Growth Revenue: Products 39,550 $ 86.7% 77.3% 22,311 $ 84.9% Services 6,093 13.3% 53.7% 3,965 15.1% Total revenue 45,643 100.0% 73.7% 26,276 100.0% Gross profit: Product 7,218 18.2% 4,418 19.8% Services 1,289 21.2% 989 24.9% Total gross profit 8,507 18.6% 57.3% 5,407 20.6% SG&A expenses 8,172 17.9% 5,845 22.2% Operating income 335 0.7% (438) -1.7% Interest (expense) and other income (24) 0.0% (85) -0.3% Pre-tax net income 311 0.7% (523) -2.0% Income tax benefit 7 0.0% 1 0.0% Discontinued operations 62 0.1% (4) 0.0% Net income 366 $ 0.8% (528) $ -2.0% March 31, 2007 March 31, 2006 Quarter Ended Quarter Ended Note: Percentages for each year are percentages of total revenue except for products and services gross profit, which are percentages of their respective revenue categories (Dollars in thousands)
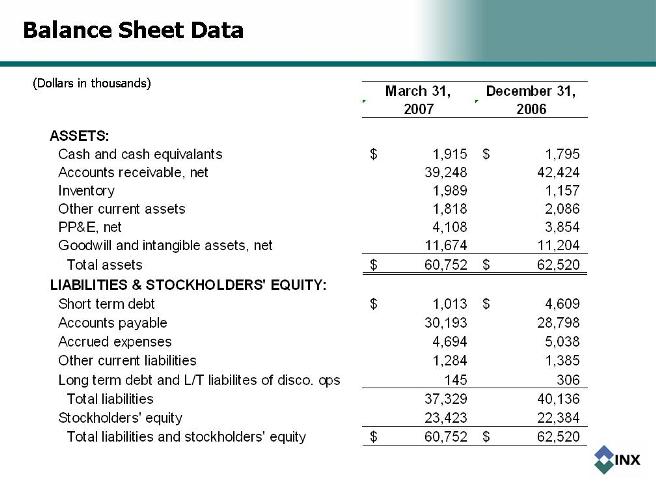
Balance Sheet Data March 31, December 31, 2007 2006 ASSETS: Cash and cash equivalants 1,915 $ 1,795 $ Accounts receivable, net 39,248 42,424 Inventory 1,989 1,157 Other current assets 1,818 2,086 PP&E, net 4,108 3,854 Goodwill and intangible assets, net 11,674 11,204 Total assets 60,752 $ 62,520 $ LIABILITIES & STOCKHOLDERS' EQUITY: Short term debt 1,013 $ 4,609 $ Accounts payable 30,193 28,798 Accrued expenses 4,694 5,038 Other current liabilities 1,284 1,385 Long term debt and L/T liabilites of disco. ops 145 306 Total liabilities 37,329 40,136 Stockholders' equity 23,423 22,384 Total liabilities and stockholders' equity 60,752 $ 62,520 $ (Dollars in thousands)
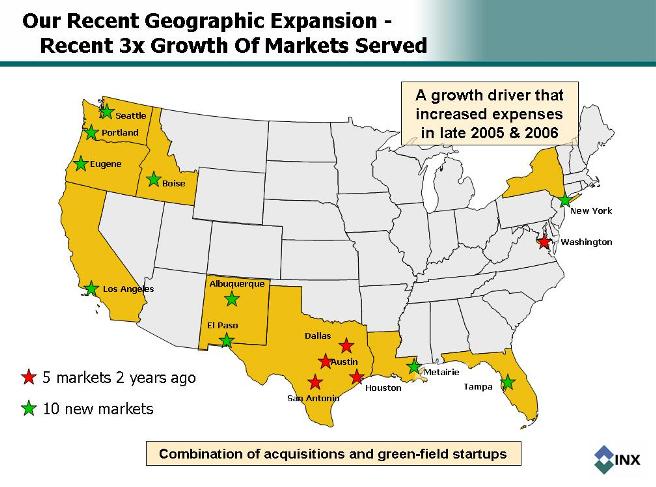
Our Recent Geographic Expansion - Recent 3x Growth Of Markets Served A growth driver that increased expenses in late 2005 & 2006 Seattle Portland Eugene Boise Los Angeles Albuquerque El Paso Dallas Austin San Antonio Houston Metairie Tampa Washington New York 5 markets 2 years ago 10 new markets Combination of acquisitions and green-field startups
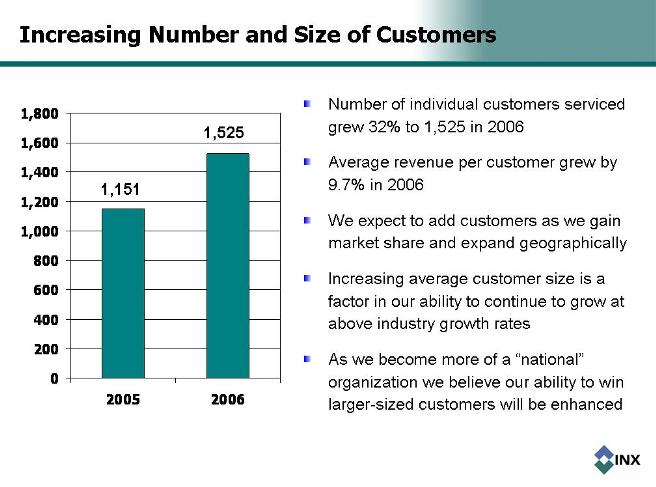
Increasing Number and Size of Customers 0 200 400 600 800 1,000 1,200 1,400 1,600 1,800 2005 2006 Number of individual customers serviced grew 32% to 1,525 in 2006 Average revenue per customer grew by 9.7% in 2006 We expect to add customers as we gain market share and expand geographically Increasing average customer size is a factor in our ability to continue to grow at above industry growth rates As we become more of a “national” organization we believe our ability to win larger-sized customers will be enhanced 1,151 1,525
Blue Chip Customer Base (page 1 of 2) Corporate Contractor to Other Cisco Partners
Blue Chip Customer Base (page 2 of 2) Government Education (Deemphasized In 2006)
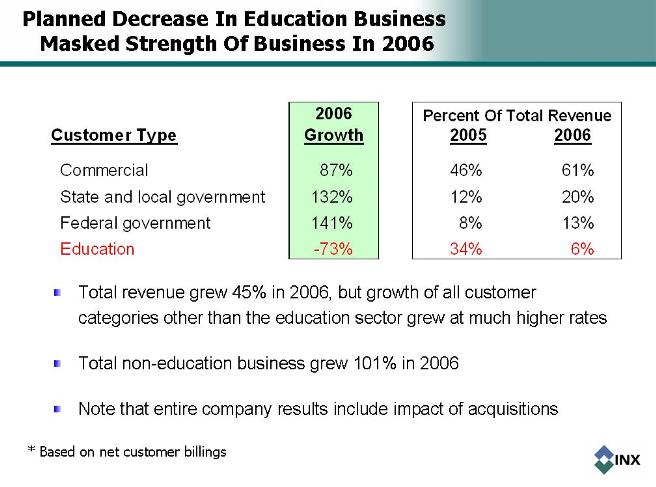
Planned Decrease In Education Business Masked Strength Of Business In 2006 Customer Type Commercial 87% 46% 61% State and local government 132% 12% 20% Federal government 141% 8% 13% Education -73% 34% 6% Growth Percent Of Total Revenue 2006 2005 2006 Total revenue grew 45% in 2006, but growth of all customer categories other than the education sector grew at much higher rates Total non-education business grew 101% in 2006 Note that entire company results include impact of acquisitions * Based on net customer billings
Acquisitions 3 acquisitions in past 2 years (all more than 1 year ago) All acquisitions have been successful and accretive We add value to acquired operations due to our balance sheet, industry focus and expertise and relationship with Cisco For most recently reported quarter, revenue from the acquired operations increased 101% compared to prior year period We expect to do more acquisitions of two categories: Regional firms for geographic expansion To strengthen newer “practice areas” such as storage and security
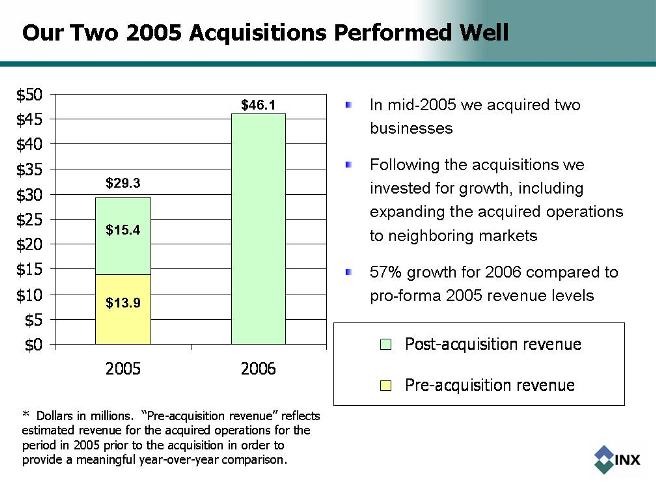
Our Two 2005 Acquisitions Performed Well $0 $5 $10 $15 $20 $25 $30 $35 $40 $45 $50 2005 2006 Post-acquisition revenue Pre-acquisition revenue In mid-2005 we acquired two businesses Following the acquisitions we invested for growth, including expanding the acquired operations to neighboring markets 57% growth for 2006 compared to pro-forma 2005 revenue levels $29.3 $46.1 * Dollars in millions. “Pre-acquisition revenue” reflects estimated revenue for the acquired operations for the period in 2005 prior to the acquisition in order to provide a meaningful year-over-year comparison
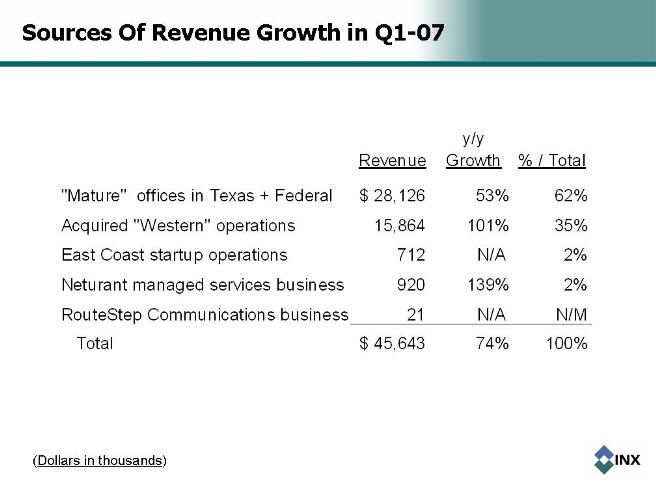
Sources Of Revenue Growth in Q1-07 (Dollars in thousands) y/y Revenue Growth % / Total "Mature" offices in Texas + Federal 28,126 $ 53% 62% Acquired "Western" operations 15,864 101% 35% East Coast startup operations 712 N/A 2% Neturant managed services business 920 139% 2% RouteStep Communications business 21 N/A N/M Total 45,643 $ 74% 100%
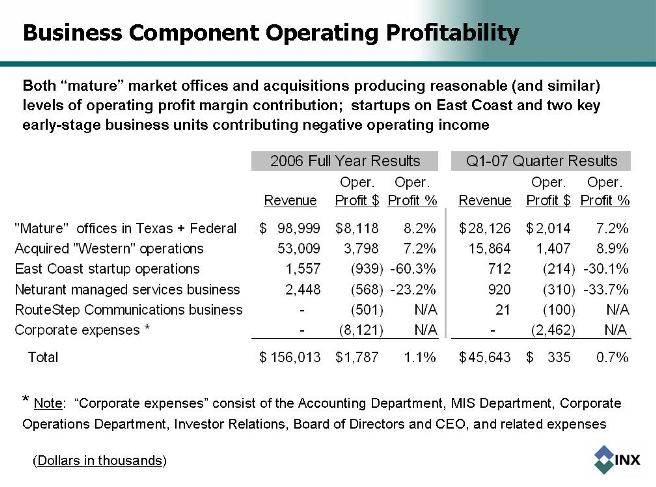
Business Component Operating Profitability Both “mature” market offices and acquisitions producing reasonable (and similar) levels of operating profit margin contribution; startups on East Coast and two key early-stage business units contributing negative operating income Note: “Corporate expenses” consist of the Accounting Department, MIS Department, Corporate
Business Component Operating Profitability Oper. Oper. Oper. Oper. Revenue Profit $ Profit % Revenue Profit $ Profit % "Mature" offices in Texas + Federal 98,999 $ 8,118 $ 8.2% 28,126 $ 2,014 $ 7.2% Acquired "Western" operations 53,009 3,798 7.2% 15,864 1,407 8.9% East Coast startup operations 1,557 (939) -60.3% 712 (214) -30.1% Neturant managed services business 2,448 (568) -23.2% 920 (310) -33.7% RouteStep Communications business - (501) N/A 21 (100) N/A Corporate expenses * - (8,121) N/A - (2,462) N/A Total 156,013 $ 1,787 $ 1.1% 45,643 $ 335 $ 0.7% 2006 Full Year Results Q1-07 Quarter Results * Note: “Corporate expenses” consist of the Accounting Department, MIS Department, Corporate Operations Department, Investor Relations, Board of Directors and CEO, and related expenses (Dollars in thousands) Both “mature” market offices and acquisitions producing reasonable (and similar) levels of operating profit margin contribution; startups on East Coast and two key early-stage business units contributing negative operating income
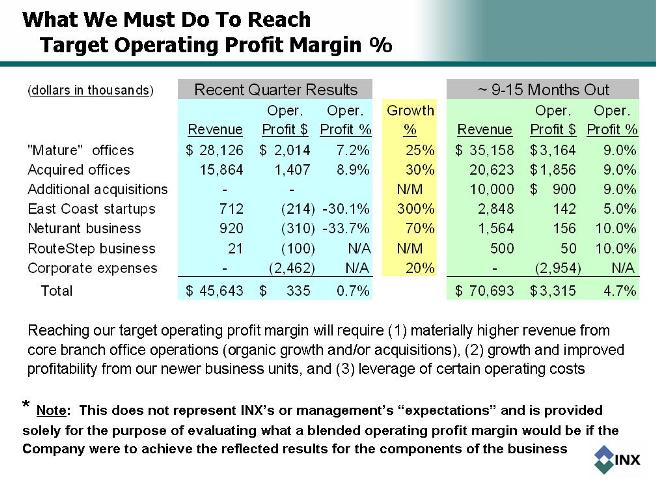
What We Must Do To Reach Target Operating Profit Margin % (dollars in thousands) Oper. Oper. Growth Oper. Oper. Revenue Profit $ Profit % % Revenue Profit $ Profit % "Mature" offices 28,126 $ 2,014 $ 7.2% 25% 35,158 $ 3,164 $ 9.0% Acquired offices 15,864 1,407 8.9% 30% 20,623 1,856 $ 9.0% Additional acquisitions - - N/M 10,000 900 $ 9.0% East Coast startups 712 (214) -30.1% 300% 2,848 142 5.0% Neturant business 920 (310) -33.7% 70% 1,564 156 10.0% RouteStep business 21 (100) N/A N/M 500 50 10.0% Corporate expenses - (2,462) N/A 20% - (2,954) N/A Total 45,643 $ 335 $ 0.7% 70,693 $ 3,315 $ 4.7% Recent Quarter Results ~ 9-15 Months Out * Note: This does not represent INX’s or management’s “expectations” and is provided solely for the purpose of evaluating what a blended operating profit margin would be if the Company were to achieve the reflected results for the components of the business Reaching our target operating profit margin will require (1) materially higher revenue from core branch office operations (organic growth and/or acquisitions), (2) growth and improved profitability from our newer business units, and (3) leverage of certain operating costs
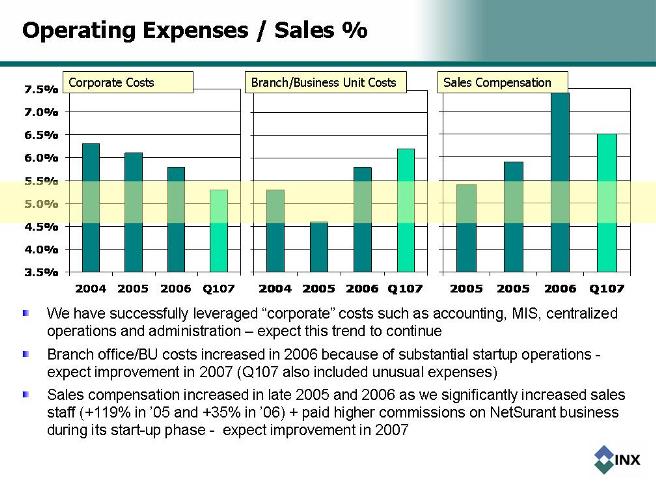
Operating Expenses / Sales % 3.5% 4.0% 4.5% 5.0% 5.5% 6.0% 6.5% 7.0% 7.5% 2004 2005 2006 Q107 Sales Compensation 3.5% 4.0% 4.5% 5.0% 5.5% 6.0% 6.5% 7.0% 7.5% 2004 2005 2006 Q107 Corporate Costs Branch/Business Unit Costs 2005 2005 2006 Q107 We have successfully leveraged “corporate” costs such as accounting, MIS, centralized operations and administration - expect this trend to continue Branch office/BU costs increased in 2006 because of substantial startup operations - expect improvement in 2007 (Q107 also included unusual expenses) Sales compensation increased in late 2005 and 2006 as we significantly increased sales staff (+119% in ’05 and +35% in ’06) + paid higher commissions on NetSurant business during its start-up phase - expect improvement in 2007
Financial Highlights Strong balance sheet; generating positive cash flow and earnings Proven growth strategy execution, with 53% CAGR of revenue over past 3 years Expect continued revenue growth driven by: 20%+ industry market growth Growing average size of customer Increasing number of customers Selling “deeper” into customer base We expect operating
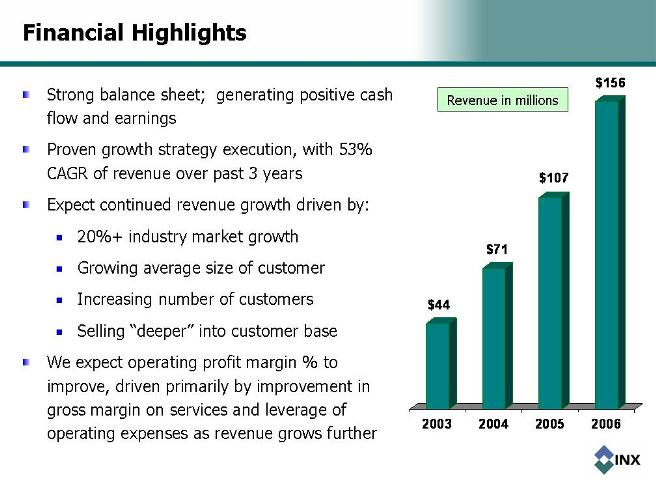
Financial Highlights Strong balance sheet; generating positive cash flow and earnings Proven growth strategy execution, with 53% CAGR of revenue over past 3 years Expect continued revenue growth driven by: 20%+ industry market growth Growing average size of customer Increasing number of customers Selling “deeper” into customer base We expect operating profit margin % to improve, driven primarily by improvement in gross margin on services and leverage of operating expenses as revenue grows further $44 $71 $107 $156 2003 2004 2005 2006 Revenue in millions
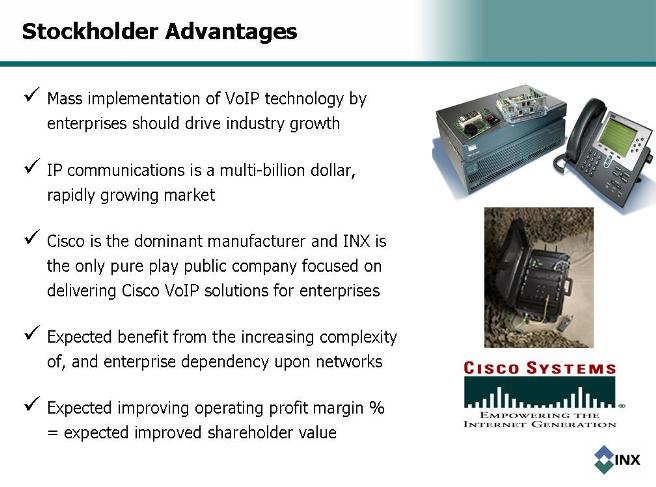
Stockholder Advantages Mass implementation of VoIP technology by enterprises should drive industry growth IP communications is a multi-billion dollar, rapidly growing market Cisco is the dominant manufacturer and INX is the only pure play public company focused on delivering Cisco VoIP solutions for enterprises Expected benefit from the increasing complexity of, and enterprise dependency upon networks Expected improving operating profit margin % = expected improved shareholder value