Exhibit 13
Providing personal, prompt, efficient service is the goal of Bank of Walterboro. We are committed to the concept of “Hometown Banking” and hope we can be of service to you. “Strong roots – strong branches.”
Contents:
| | |
Shareholder Letter | | 2 |
Summary of Selected Financial Data | | 3 |
Financial Charts | | 4-7 |
Management’s Discussion and Analysis | | 8-24 |
Management’s Annual Report on Internal Control Over Financial Reporting | | 25 |
Report of Independent Registered Public Accounting Firm | | 26 |
Consolidated Balance Sheets | | 27 |
Consolidated Statements of Income | | 28 |
Consolidated Statements of Changes in Shareholders’ Equity and Comprehensive Income | | 29 |
Consolidated Statements of Cash Flows | | 30 |
Notes to Consolidated Financial Statements | | 31-50 |
Directors, Officers and Staff | | 51 |
Corporate Data | | 52 |
Services | | 53 |
Member FDIC
COMMUNITYCORP AND SUBSIDIARY
Dear Shareholder,
It is a pleasure to report the progress of Communitycorp and its subsidiary, Bank of Walterboro, during 2008. More detailed information follows, but we are pleased to report return on average assets of 0.91%, a sound capital to asset ratio of 10.75% and an allowance for loan losses to loans of 1.74%.
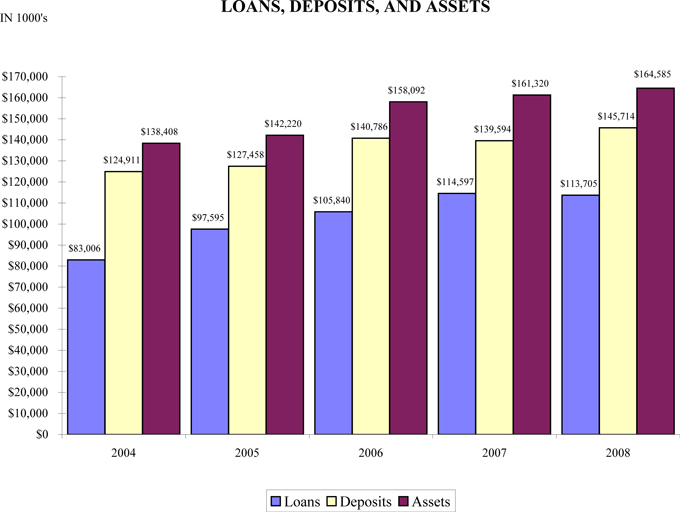
Deposits at year-end were $145,713,985 an increase of $6,119,673, or 4.38%, from 2007 year-end. Net loans decreased from $112,668,059 to $111,722,883, a decrease of $945,176, or 0.84%. The allowance for loan losses increased from a December 31, 2007 balance of $1,929,319 to $1,981,637 or 1.74% of gross loans. Total assets increased from $161,319,687 to a December 31, 2008 total of $164,585,287 an increase of $3,265,600, or 2.02%.
2008 was a challenging year for the banking industry and decreased earnings occurred through the industry.
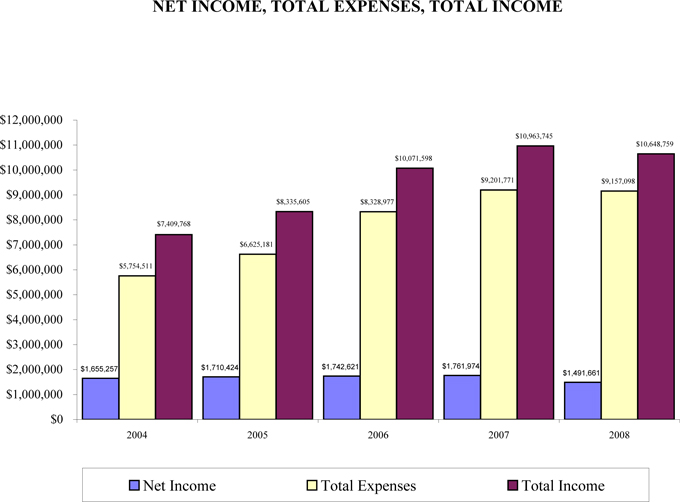
Earnings decreased in 2008 for the Company with net income of $1,491,661, a decrease of $270,253, or 15.34%, less than 2007 earnings of $1,761,914. For 2008 we earned $6.22 per share compared to $7.32 for 2007. Our net interest margin increased from 3.64% in 2007 to 3.69% in 2008.
Please read the following financial information so you may become aware of your Company’s progress. We believe the information contained in this Annual Report shows that a local, well-managed, independent bank can compete successfully in a deregulated market against national, regional, and state-wide banking institutions. Our success can be attributed to the teamwork of our shareholders, directors, officers, and employees. We most importantly want to thank our customers for allowing us to be of service to them.
The Board of Directors, officers, and employees thank you for your past support and solicit your continued support as we continue our efforts to provide prompt, efficient, and courteous service to our customers. We welcome any suggestions you may have.
We invite and encourage you to attend our Annual Meeting on Wednesday, April 29, 2009.
| | | | |
| Very truly yours, | | | | |
| | |
| | | | | |
| W. Roger Crook | | | | Peden B. McLeod |
| President and CEO | | | | Chairman of the Board |
2
COMMUNITYCORP AND SUBSIDIARY
SELECTED FINANCIAL DATA
The following selected consolidated financial data for the five years ended December 31, 2008 are derived from our consolidated financial statements and other data. The selected consolidated financial data should be read in conjunction with our consolidated financial statements, including the accompanying notes, and Management’s Discussion and Analysis of Financial Condition and Results of Operations, included elsewhere herein.
| | | | | | | | | | | | | | | | | | | | |
Year Ended December 31, (Dollars in thousands, except per share) | | 2008 | | | 2007 | | | 2006 | | | 2005 | | | 2004 | |
Results of Operations: | | | | | | | | | | | | | | | | | | | | |
Interest income | | $ | 9,958 | | | $ | 10,392 | | | $ | 9,358 | | | $ | 7,737 | | | $ | 6,831 | |
Interest expense | | | 4,213 | | | | 4,767 | | | | 3,871 | | | | 2,225 | | | | 1,607 | |
| | | | | | | | | | | | | | | | | | | | |
Net interest income | | | 5,745 | | | | 5,625 | | | | 5,487 | | | | 5,512 | | | | 5,224 | |
Provision for loan losses | | | 400 | | | | 202 | | | | 225 | | | | 381 | | | | 471 | |
| | | | | | | | | | | | | | | | | | | | |
Net interest income after provision for loan losses | | | 5,345 | | | | 5,423 | | | | 5,262 | | | | 5,131 | | | | 4,753 | |
Noninterest income | | | 691 | | | | 666 | | | | 713 | | | | 599 | | | | 579 | |
Noninterest expense | | | 3,845 | | | | 3,533 | | | | 3,411 | | | | 3,232 | | | | 2,875 | |
| | | | | | | | | | | | | | | | | | | | |
Income before income taxes | | | 2,191 | | | | 2,556 | | | | 2,565 | | | | 2,498 | | | | 2,457 | |
Income tax expense | | | 699 | | | | 794 | | | | 823 | | | | 788 | | | | 802 | |
| | | | | | | | | | | | | | | | | | | | |
Net income | | $ | 1,492 | | | $ | 1,762 | | | $ | 1,742 | | | $ | 1,710 | | | $ | 1,655 | |
| | | | | | | | | | | | | | | | | | | | |
Balance Sheet Data: | | | | | | | | | | | | | | | | | | | | |
Securities available-for-sale | | $ | 27,815 | | | $ | 34,585 | | | $ | 32,468 | | | $ | 30,856 | | | $ | 25,310 | |
Securities held-to-maturity | | | 1,320 | | | | 1,819 | | | | 1,574 | | | | 1,875 | | | | 2,181 | |
Allowance for loan losses | | | 1,982 | | | | 1,929 | | | | 1,857 | | | | 1,665 | | | | 1,456 | |
Net loans | | | 111,723 | | | | 112,668 | | | | 103,983 | | | | 95,930 | | | | 81,550 | |
Premises and equipment, net | | | 3,029 | | | | 2,989 | | | | 3,131 | | | | 3,266 | | | | 3,441 | |
Total assets | | | 164,585 | | | | 161,320 | | | | 158,092 | | | | 142,220 | | | | 138,408 | |
Noninterest-bearing deposits | | | 15,652 | | | | 16,461 | | | | 19,765 | | | | 18,021 | | | | 16,532 | |
Interest-bearing deposits | | | 130,062 | | | | 123,133 | | | | 121,021 | | | | 109,437 | | | | 108,379 | |
Total deposits | | | 145,714 | | | | 139,594 | | | | 140,786 | | | | 127,458 | | | | 124,911 | |
Short-term borrowings | | | — | | | | 3,068 | | | | 250 | | | | 370 | | | | 390 | |
Total liabilities | | | 146,892 | | | | 144,583 | | | | 142,955 | | | | 128,576 | | | | 125,772 | |
Total shareholders’ equity | | | 17,693 | | | | 16,736 | | | | 15,137 | | | | 13,643 | | | | 12,636 | |
Per Share Data: | | | | | | | | | | | | | | | | | | | | |
Weighted-average common shares outstanding | | | 239,634 | | | | 240,708 | | | | 242,636 | | | | 244,788 | | | | 247,446 | |
Net income | | $ | 6.22 | | | $ | 7.32 | | | $ | 7.18 | | | $ | 6.99 | | | $ | 6.69 | |
Cash dividends paid | | $ | 1.05 | | | $ | 1.00 | | | $ | 0.90 | | | $ | 0.82 | | | $ | 0.72 | |
Period end book value | | $ | 74.69 | | | $ | 69.60 | | | $ | 62.62 | | | $ | 56.13 | | | $ | 51.26 | |
Equity and Assets Ratios: | | | | | | | | | | | | | | | | | | | | |
Return on average assets | | | 0.91 | % | | | 1.08 | % | | | 1.11 | % | | | 1.23 | % | | | 1.29 | % |
Return on average equity | | | 8.70 | % | | | 11.24 | % | | | 12.35 | % | | | 13.11 | % | | | 14.04 | % |
Equity to assets ratio | | | 10.75 | % | | | 10.37 | % | | | 9.58 | % | | | 9.35 | % | | | 9.16 | % |
Dividend payout ratio | | | 16.93 | % | | | 13.65 | % | | | 12.57 | % | | | 11.79 | % | | | 10.85 | % |
3


4
5
6
7
COMMUNITYCORP AND SUBSIDIARY
Management’s Discussion and Analysis of
Financial Condition and Results of Operations
GENERAL
Communitycorp is a South Carolina corporation organized on March 13, 1995 to be a bank holding company (the “Company”). The Company’s subsidiary, Bank of Walterboro, (the “Bank”) is a state-chartered commercial bank with four banking locations. The Bank’s main office and operations center is in Walterboro, South Carolina. In addition, the Bank has branches in Ravenel, and Ridgeland, South Carolina. The Company’s primary market area includes Colleton, Jasper and Charleston Counties. Depository accounts are insured by the Federal Deposit Insurance Corporation up to the maximum amount permitted by law. The Bank, which received its charter on October 11, 1988 and opened for business on May 1, 1989, is dedicated to providing prompt, efficient, personal service to its customers. The Bank offers a full range of deposit services for individuals and businesses. Deposit products include checking accounts, savings accounts, certificates of deposit, money market accounts, and IRA’s.
The Company primarily is engaged in the business of attracting deposits from the general public and using these deposits together with other funds to make commercial, consumer, and real estate loans. The Company’s operating results depend to a substantial extent on the difference between interest and fees earned on loans, investments, and services, and the Company’s interest expense, consisting principally of interest paid on deposits. Unlike most industrial companies, virtually all of the assets and liabilities of financial institutions are monetary. As a result, interest rates have a greater effect on the financial institution’s performance. In addition to competing with other traditional financial institutions, the Company also competes for savings dollars with nontraditional financial intermediaries such as mutual funds. This has resulted in a highly competitive market area, which demands the type of personal service and attention provided by the Bank.
The earnings and growth of the banking industry and the Company are and will be affected by general conditions of the economy and by the fiscal and monetary policies of the federal government and its agencies, including the Board of Governors of the Federal Reserve System (the “Board”). The Board regulates money and credit conditions and, as a result, has a strong influence on interest rates and on general economic conditions. The effect of such policies in the future on the business and earnings of the Company cannot be predicted with certainty.
As of December 31, 2008, the Company had forty-two full-time employees and five part time employees.
This discussion and analysis is intended to assist the reader in understanding the financial condition and results of operations of the Company and its subsidiary, the Bank. This commentary should be read in conjunction with the consolidated financial statements and the related notes and the other statistical information in this report.
CRITICAL ACCOUNTING POLICIES
The Company has adopted various accounting policies, which govern the application of account principles generally accepted in the United States of America in the preparation of the Company’s consolidated financial statements. The significant accounting policies of the Company are described in the notes to the consolidated financial statements.
Certain accounting policies involve significant judgments and assumptions by management, which have a material impact on the carrying value of certain assets and liabilities. Management considers such accounting policies to be critical accounting policies. The judgments and assumptions used by management are based on historical experience and other factors, which are believed to be reasonable under the circumstances. Because of the nature of the judgments and assumptions made by management, actual results could differ from these judgments and estimates, which could have a material impact on the carrying values of assets and liabilities and the results of operations of the Company.
The Company believes the allowance for loan losses is a critical accounting policy that requires the most significant judgments and estimates used in preparation of its consolidated financial statements. Refer to the section “Provision and Allowance for Loan Losses” and Note 1 to the consolidated financial statements for a detailed description of the Company’s estimation process and methodology related to the allowance for loan losses.
8
COMMUNITYCORP AND SUBSIDIARY
Management’s Discussion and Analysis of
Financial Condition and Results of Operations
FORWARD-LOOKING STATEMENTS
Statements included in Management’s Discussion and Analysis which are not historical in nature are intended to be, and are hereby identified, as “forward looking statements” for purposes of the safe harbor provided by Section 21E of the Securities Exchange Act of 1934, as amended. Forward-looking statements include statements concerning plans, objectives, goals, strategies, future events or performance and underlying assumptions and other statements which are other than statements of historical facts. Such forward-looking statements may be identified, without limitation, by the use of the words “anticipates,” “believes,” “estimates,” “expects,” “intends,” “plans,” “predicts,” “projects,” and similar expressions. The Company’s expectations, beliefs and projections are expressed in good faith and are believed by the Company to have a reasonable basis, including without limitation, management’s examination of historical operating trends, data contained in the Company’s records and other data available from third parties, but there can be no assurance that management’s expectations, beliefs or projections will result or be achieved or accomplished. The Company cautions readers that forward looking statements, including without limitation, those relating to future business prospects, revenues, working capital, liquidity, capital needs, interest costs, and income, are subject to certain risks and uncertainties that could cause actual results to differ materially from those indicated in the forward looking statements, due to several important factors herein identified, among others, and other risks and factors identified from time to time in the Company’s reports filed with the Securities and Exchange Commission.
RESULTS OF OPERATIONS
OVERVIEW
Net income for the year ended December 31, 2008 was $1,491,661 or $6.22 per share, compared to $1,761,914, or $7.32 per share, for the year ended December 31, 2007. Interest income decreased $433,756 from the 2007 amount of $10,391,728. Total interest expense also decreased $554,206 from the 2007 amount of $4,767,080. Net interest income increased $120,450 from the 2007 amount of $5,624,648. For the year ended December 31, 2008 net interest margin increased from 3.64% in 2007 to 3.69% in 2008. Non-interest income increased $24,366 from the 2007 amount of $666,421. Non-interest expense was $3,844,714, which is an increase of $311,532 over the 2007 amount.
9
COMMUNITYCORP AND SUBSIDIARY
Management’s Discussion and Analysis of
Financial Condition and Results of Operations
NET INTEREST INCOME
General.The largest component of total income is net interest income, the difference between the income earned on assets and the interest accrued or paid on deposits and borrowings used to support such assets. The volume and mix of assets and liabilities and their sensitivity to interest rate movement determine changes in net interest income. Net interest margin is determined by dividing annualized net interest income by average earning assets. Net interest spread is derived from determining the weighted-average rate of interest paid on deposits and borrowings and subtracting it from the weighted-average yield on earning assets.
Net interest income for 2008 was $5,745,097 compared to $5,624,648 for 2007, an increase of 2.14%. The increase was mainly attributable to the increase in the average balances of our earning assets, which increased by 0.75% while our average interest bearing liabilities increased only 0.83%.
For 2008 average-earning assets totaled approximately $155,677,000 with an annualized average yield of 6.40% compared to approximately $154,524,000 and 6.73%, respectively, for 2007. Average interest-bearing liabilities totaled approximately $129,211,000 with an annualized average cost of 3.26% for 2008 compared to approximately $128,153,000 and 3.72%, respectively, for 2007.
Our net interest margin and net interest spread was 3.69% and 3.14%, respectively, for 2008 compared to 3.64% and 3.01% respectively for 2007.
Our annualized yield on average earning assets decreased 33 basis points for 2008 compared to 2007, while our annualized average cost of our interest-bearing liabilities decreased 46 basis points for 2008 compared to 2007. These decreases were reflective of the decreasing interest rate environment during 2008.
Details of certain components of our earning assets and interest-bearing liabilities are discussed in the following paragraphs.
Because loans often provide a higher yield than other types of earning assets, one of our goals it to maintain our loan portfolio as the largest component of total earning assets. Loans comprised approximately 72.33% and 70.42% of average earning assets for December 31, 2008 and 2007, respectively. Loan interest income for the years ended December 31, 2008 and 2007 was $8,322,422 and $8,270,237, respectively. The annualized average yield on loans was 7.39% and 7.60% for 2008 and 2007, respectively. Average balances of loans increased to approximately $112,597,000 during 2008, an increase of approximately $3,788,000 over the average of approximately $108,809,000 during 2007. The decrease in the annualized yield on loans is mainly attributable to the decline in market interest rates.
Investment securities averaged approximately $33,915,000 or 21.79% of average earning assets, for December 31, 2008 compared to approximately $36,961,000 or 23.92% of average earning assets, for 2007. Interest earned on investment securities amounted to $1,460,722 for the year ended December 31, 2008, compared to $1,667,782 for the same period last year. Investment securities yielded 4.31% and 4.51% for the period ended December 31, 2008 and 2007, respectively.
Total interest expense for the years ended December 31, 2008 and 2007 was $4,212,875 and $4,767,080, respectively. The largest component of interest expense is interest on deposit accounts. Interest expense on deposit accounts was $4,207,282 and $4,756,053, for the years ended December 31, 2008 and 2007, respectively. The average balance of interest bearing deposits increased to approximately $128,880,00 for the year ended December 31, 2008 from approximately $127,904,00 during the same period last year. The annualized average cost of deposits was approximately 3.26% for the year ended December 31, 2008 compared to 3.72% for the same period in 2007.
For the year ended December 31, 2008 and 2007, the total annualized average cost of funds was 3.26% and 3.72%, respectively.
10
COMMUNITYCORP AND SUBSIDIARY
Management’s Discussion and Analysis of
Financial Condition and Results of Operations
NET INTEREST INCOME(continued)
Average Balances, Income, Expenses, Yields, and Rates. The following table sets forth, for the periods indicated, the weighted average yields earned, the weighted average rates paid, the net interest spread, and the net interest margin on earning assets. The table also indicates the average balance during the year and the interest income or expense by specific categories.
Average Balances, Income, Expenses, and Rates
| | | | | | | | | | | | | | | | | | | | |
| | | 2008 | | | 2007 | |
(Dollars in thousands) | | Average
Balance | | | Income/
Expense | | Yield/
Rate | | | Average
Balance | | | Income/
Expense | | Yield/
Rate | |
Assets: | | | | | | | | | | | | | | | | | | | | |
Earning assets: | | | | | | | | | | | | | | | | | | | | |
Securities, taxable (1) | | $ | 24,172 | | | $ | 1,070 | | 4.43 | % | | $ | 27,684 | | | $ | 1,305 | | 4.71 | % |
Securities, tax-exempt (1) | | | 9,278 | | | | 353 | | 3.80 | | | | 8,937 | | | | 344 | | 3.85 | |
Nonmarketable equity securities | | | 465 | | | | 38 | | 8.17 | | | | 340 | | | | 19 | | 5.59 | |
Federal funds sold | | | 8,954 | | | | 167 | | 1.87 | | | | 8,683 | | | | 444 | | 5.11 | |
Time deposits with other banks | | | 211 | | | | 8 | | 3.79 | | | | 71 | | | | 10 | | 14.08 | |
Loans (2) | | | 112,597 | | | | 8,322 | | 7.39 | | | | 108,809 | | | | 8,270 | | 7.60 | |
| | | | | | | | | | | | | | | | | | | | |
Total earning assets | | | 155,677 | | | | 9,958 | | 6.40 | | | | 154,524 | | | | 10,392 | | 6.73 | |
| | | | | | | | | | | | | | | | | | | | |
Cash and due from banks | | | 4,815 | | | | | | | | | | 5,268 | | | | | | | |
Allowance for loan losses | | | (1,933 | ) | | | | | | | | | (1,896 | ) | | | | | | |
Premises and equipment | | | 2,999 | | | | | | | | | | 3,064 | | | | | | | |
Accrued interest and other assets | | | 1,795 | | | | | | | | | | 1,962 | | | | | | | |
| | | | | | | | | | | | | | | | | | | | |
Total assets | | $ | 163,353 | | | | | | | | | $ | 162,922 | | | | | | | |
| | | | | | | | | | | | | | | | | | | | |
Liabilities and Shareholders’ Equity: | | | | | | | | | | | | | | | | | | | | |
Interest-bearing liabilities: | | | | | | | | | | | | | | | | | | | | |
Interest-bearing deposits | | $ | 128,880 | | | $ | 4,207 | | 3.26 | % | | $ | 127,904 | | | $ | 4,756 | | 3.72 | % |
Short-term borrowings | | | 331 | | | | 6 | | 1.81 | | | | 249 | | | | 11 | | 4.42 | |
| | | | | | | | | | | | | | | | | | | | |
Total interest-bearing liabilities | | | 129,211 | | | | 4,213 | | 3.26 | | | | 128,153 | | | | 4,767 | | 3.72 | |
| | | | | | | | | | | | | | | | | | | | |
Noninterest-bearing deposits | | | 15,440 | | | | | | | | | | 17,495 | | | | | | | |
Accrued interest and other liabilities | | | 1,566 | | | | | | | | | | 1,603 | | | | | | | |
Shareholders’ equity | | | 17,136 | | | | | | | | | | 15,671 | | | | | | | |
| | | | | | | | | | | | | | | | | | | | |
Total liabilities and shareholders’ equity | | $ | 163,353 | | | | | | | | | $ | 162,922 | | | | | | | |
| | | | | | | | | | | | | | | | | | | | |
Net interest spread | | | | | | | | | 3.14 | % | | | | | | | | | 3.01 | % |
Net interest income | | | | | | $ | 5,745 | | | | | | | | | $ | 5,625 | | | |
| | | | | | | | | | | | | | | | | | | | |
Net interest margin | | | | | | | | | 3.69 | % | | | | | | | | | 3.64 | % |
| (1) | Averages for securities are stated at historical cost. |
| (2) | The effect of loans in nonaccrual status and fees collected is not significant to the computations. All loans and deposits are domestic. |
11
COMMUNITYCORP AND SUBSIDIARY
Management’s Discussion and Analysis of
Financial Condition and Results of Operations
NET INTEREST INCOME(continued)
Analysis of Changes in Net Interest Income. Net interest income can also be analyzed in terms of the impact of changing rates and changing volume. The following table describes the extent to which changes in interest rates and changes in the volume of earning assets and interest-bearing liabilities have affected the Company’s interest income and interest expense during the periods indicated. Information on changes in each category attributable to (i) changes due to volume (change in volume multiplied by prior period rate), (ii) changes due to rates (changes in rates multiplied by prior period volume) and (iii) changes in rate and volume (change in rate multiplied by the change in volume) is provided as follows:
Analysis of Changes in Net Interest Income
| | | | | | | | | | | | | | | | | | | | | | | | | | | | | | | | |
| | | 2008 Compared With 2007 | | | 2007 Compared With 2006 | |
| | | Variance Due to Changes in | | | Variance Due to Changes in | |
(Dollars in thousands) | | Volume | | | Rate | | | Volume/
Rate | | | Total | | | Volume | | | Rate | | | Volume/
Rate | | | Total | |
Earning Assets | | | | | | | | | | | | | | | | | | | | | | | | | | | | | | | | |
Securities, taxable | | $ | (166 | ) | | $ | (80 | ) | | $ | 11 | | | $ | (235 | ) | | $ | 22 | | | $ | 215 | | | $ | 4 | | | $ | 241 | |
Securities, tax-exempt | | | 13 | | | | (4 | ) | | | 0 | | | | 9 | | | | 80 | | | | — | | | | — | | | | 80 | |
Nonmarketable equity securities | | | 7 | | | | 9 | | | | 3 | | | | 19 | | | | — | | | | 10 | | | | — | | | | 10 | |
Federal funds sold | | | 14 | | | | (282 | ) | | | (9 | ) | | | (277 | ) | | | (125 | ) | | | 17 | | | | (3 | ) | | | (111 | ) |
Time deposits with other banks | | | 20 | | | | (7 | ) | | | (15 | ) | | | (2 | ) | | | (5 | ) | | | 6 | | | | (2 | ) | | | (1 | ) |
Loans | | | 288 | | | | (228 | ) | | | (8 | ) | | | 52 | | | | 482 | | | | 313 | | | | 20 | | | | 815 | |
| | | | | | | | | | | | | | | | | | | | | | | | | | | | | | | | |
Total interest income | | | 176 | | | | (592 | ) | | | (18 | ) | | | 434 | | | | 454 | | | | 561 | | | | 19 | | | | 1,034 | |
| | | | | | | | | | | | | | | | | | | | | | | | | | | | | | | | |
Interest-Bearing Liabilities | | | | | | | | | | | | | | | | | | | | | | | | | | | | | | | | |
Interest-bearing deposits | | | 36 | | | | (581 | ) | | | (4 | ) | | | (549 | ) | | | 161 | | | | 708 | | | | 30 | | | | 899 | |
Short-term borrowings | | | (4 | ) | | | (6 | ) | | | (3 | ) | | | (5 | ) | | | (6 | ) | | | 4 | | | | (1 | ) | | | (3 | ) |
| | | | | | | | | | | | | | | | | | | | | | | | | | | | | | | | |
Total interest expense | | | 40 | | | | (587 | ) | | | (7 | ) | | | (554 | ) | | | 155 | | | | 712 | | | | 29 | | | | 896 | |
| | | | | | | | | | | | | | | | | | | | | | | | | | | | | | | | |
Net interest income | | $ | 136 | | | $ | (5 | ) | | $ | (11 | ) | | $ | 120 | | | $ | 299 | | | $ | (151 | ) | | $ | (10 | ) | | $ | 138 | |
| | | | | | | | | | | | | | | | | | | | | | | | | | | | | | | | |
Interest Sensitivity. The Company monitors and manages the pricing and maturity of its assets and liabilities in order to diminish the potential adverse impact that changes in interest rates could have on its net interest income. The principal monitoring technique employed by the Company is the measurement of the Company’s interest sensitivity “gap,” which is the positive or negative dollar difference between assets and liabilities that are subject to interest rate repricing within a given period of time. Interest rate sensitivity can be managed by repricing assets or liabilities, selling securities available-for-sale, replacing an asset or liability at maturity, or adjusting the interest rate during the life of an asset or liability. Managing the amount of assets and liabilities repricing in this same time interval helps to manage the risk and minimize the impact on net interest income of rising or falling interest rates.
12
COMMUNITYCORP AND SUBSIDIARY
Management’s Discussion and Analysis of
Financial Condition and Results of Operations
NET INTEREST INCOME(continued)
The following table presents the Company’s rate sensitivity at each of the time intervals indicated as of December 31, 2008. The table may not be indicative of the Company’s rate sensitivity position at other points in time.
Interest Sensitivity Analysis
| | | | | | | | | | | | | | | | | | | |
(Dollars in thousands) | | Within
Three
Months | | | After Three
Through
Twelve
Months | | | After One
Through
Five
Years | | | Greater
Than
Five
Years | | | Total |
Assets | | | | | | | | | | | | | | | | | | | |
Earning assets: | | | | | | | | | | | | | | | | | | | |
Federal funds sold and securities purchased under agreements to resell | | $ | 13 146 | | | $ | — | | | $ | — | | | $ | — | | | $ | 13,146 |
Investment securities | | | 1,834 | | | | 2,086 | | | | 11,076 | | | | 14,647 | | | | 29,643 |
Loans (1) | | | 20,194 | | | | 34,829 | | | | 56,554 | | | | 152 | | | | 111,729 |
| | | | | | | | | | | | | | | | | | | |
Total earning assets | | | 35,174 | | | | 36,915 | | | | 67,630 | | | | 14,799 | | | | 154,518 |
| | | | | | | | | | | | | | | | | | | |
Liabilities | | | | | | | | | | | | | | | | | | | |
Interest-bearing liabilities: | | | | | | | | | | | | | | | | | | | |
Interest-bearing deposits: | | | | | | | | | | | | | | | | | | | |
Demand | | | 21,065 | | | | — | | | | — | | | | — | | | | 21,065 |
Savings and money market | | | 16,442 | | | | — | | | | — | | | | — | | | | 16,442 |
Time | | | 25,696 | | | | 61,608 | | | | 5,214 | | | | 36 | | | | 92,554 |
| | | | | | | | | | | | | | | | | | | |
Total interest-bearing deposits and liabilities | | | 63,203 | | | | 61,608 | | | | 5,214 | | | | 36 | | | | 130,061 |
| | | | | | | | | | | | | | | | | | | |
Period gap | | $ | (28,029 | ) | | $ | (24,693 | ) | | $ | 62,416 | | | $ | 14,763 | | | | |
| | | | | | | | | | | | | | | | | | | |
Cumulative gap | | $ | (28,029 | ) | | $ | (52,722 | ) | | $ | 9,694 | | | $ | 24,457 | | | | |
| | | | | | | | | | | | | | | | | | | |
Ratio of cumulative gap to total earning assets | | | (18.14 | )% | | | (34.12 | )% | | | 6.27 | % | | | 15.83 | % | | | |
| (1) | Excludes nonaccrual loans. |
The above table reflects the balances of earning assets and interest-bearing liabilities at the earlier of their repricing or maturity dates. Overnight federal funds are reflected at the earliest pricing interval due to the immediately available nature of the instruments. Scheduled payment amounts of fixed rate amortizing loans are reflected at each scheduled payment date. Scheduled payment amounts of variable rate amortizing loans are reflected at each scheduled payment date until the loan may be repriced contractually; the unamortized balance is reflected at that point. Interest-bearing liabilities with no contractual maturity, such as savings deposits and interest-bearing transaction accounts, are reflected in the earliest repricing period due to contractual arrangements which give the Company the opportunity to vary the rates paid on those deposits within a thirty-day or shorter period. Fixed rate time deposits, principally certificates of deposit, are reflected at their contractual maturity date. Short-term borrowings are reflected in the earliest repricing period since these borrowings mature daily.
13
COMMUNITYCORP AND SUBSIDIARY
Management’s Discussion and Analysis of
Financial Condition and Results of Operations
NET INTEREST INCOME(continued)
The Company generally would benefit from increasing market rates of interest when it has an asset-sensitive gap and generally would benefit from decreasing market rates of interest when it is liability sensitive. The Company currently is liability-sensitive over periods with maturity dates of less than twelve months. However, the Company’s gap analysis is not a precise indicator of its interest sensitive position. The analysis presents a static view of the timing of maturities and repricing opportunities, without taking into consideration that changes in interest rates do not affect all assets and liabilities equally. Net interest income is also impacted by other significant factors, including changes in the volume and mix of earning assets and interest-bearing liabilities.
PROVISION AND ALLOWANCE FOR LOAN LOSSES
We provide for loan losses using the allowance method. Increases to the allowance are charged by recording a provision for loan losses in the consolidated statement of income. Loan losses and recoveries are charged to the allowance. Charge-offs to the allowance are made when all or a portion of the loan is confirmed as a loss based on our review of the loan, through possession of the underlying security, or through a troubled debt restructuring transaction. Likewise, recoveries offset these increases through credits to the allowance.
The allowance is maintained at a level that we believe is sufficient to cover losses in the loan portfolio at a specific point in time. Assessing the adequacy of the allowance requires considerable judgment. The adequacy of the allowance is analyzed on a monthly basis using an internal analysis model. For purposes of this analysis, adequacy is defined as a level sufficient to absorb probable losses in the portfolio. This methodology relies upon our judgment. Our judgments are based on our assessment of various issues, including, but not limited to, the pace of loan growth, emerging portfolio concentrations, the risk management system relating to lending activities, entry into new markets, new product offerings, loan portfolio quality trends, and uncertainty in current economic and business conditions. An allowance model is used that takes into account factors including the composition of the loan portfolio such as risk grade classifications, historical asset quality trends including, but not limited to, previous loss experience ratios, our assessment of current economic conditions, and reviews of specific high risk sectors of the portfolio. Loans are graded at inception and are reviewed on a periodic basis to ensure that assigned risk grades are proper based on the definition of such classification. The value of underlying collateral is also considered during such analysis. The resulting monthly model and the related conclusions are reviewed and approved by Senior Management. Our analysis of allowance adequacy includes consideration for loan impairment. While we use the best information available to make evaluations, future adjustments to the allowance may be necessary if results differ substantially from the assumptions used in making the evaluations.
The methodology for assessing the adequacy of the allowance establishes both an allocated and unallocated component of the allowance. The allocated component is based principally on current loan grades and historical loss rates. The unallocated component is the result of the portion of the assessment that estimates probable losses in the portfolio that are not fully captured in the allocated allowance. This analysis includes, but is not necessarily limited to, industry concentrations, future market expansions, model imprecision, and the estimated impact of current economic conditions on historical loss rates. On a continual basis, we monitor trends within the portfolio, both quantitative and qualitative, and assess the reasonableness of the unallocated component.
The allowance is subject to examination and adequacy testing by regulatory agencies. In addition, such regulatory agencies could require allowance adjustments based on information available to them at the time of their examination.
The allowance for loan losses was 1.74% and 1.68% of total loans on December 31, 2008 and 2007, respectively. Although there has been an increase in classified loans from December 31, 2007 to December 31, 2008, we believe the allowance for loan losses at December 31, 2008 is reflective of the results of our allowance model methodology. We monitor and evaluate the adequacy of the allowance and loss exposure in the loan portfolio by considering the borrowers’ financial conditions and other factors in the unallocated component of the allowance. Accordingly, we believe the allowance as of December 31, 2008 is adequate, based on our assessment of probable losses, and available facts and circumstances then prevailing.
14
COMMUNITYCORP AND SUBSIDIARY
Management’s Discussion and Analysis of
Financial Condition and Results of Operations
PROVISION AND ALLOWANCE FOR LOAN LOSSES(continued)
Allowance for Loan Losses
| | | | | | | | |
| | | Year ended December 31, | |
| | | 2008 | | | 2007 | |
Total loans outstanding at end of year | | $ | 113,704,520 | | | $ | 114,597,378 | |
| | | | | | | | |
Average loans outstanding | | $ | 112,596,835 | | | $ | 108,808,888 | |
| | | | | | | | |
Balance of allowance for loan losses at beginning of period | | $ | 1,929,319 | | | $ | 1,856,888 | |
Loan losses: | | | | | | | | |
Real estate - construction | | | — | | | | — | |
Real estate - mortgage | | | — | | | | — | |
Commercial and industrial | | | 261,094 | | | | 110,508 | |
Consumer | | | 102,037 | | | | 41,191 | |
| | | | | | | | |
Total loan losses | | | 363,131 | | | | 151,699 | |
| | | | | | | | |
Recoveries of previous loan losses: | | | | | | | | |
Real estate - construction | | | — | | | | — | |
Real estate - mortgage | | | — | | | | — | |
Commercial and industrial | | | 1,030 | | | | 10,537 | |
Consumer | | | 14,419 | | | | 11,593 | |
| | | | | | | | |
Total recoveries | | | 15,449 | | | | 22,130 | |
| | | | | | | | |
Net charge-offs | | | (347,682 | ) | | | (129,569 | ) |
Provision charged to operations | | | 400,000 | | | | 202,000 | |
| | | | | | | | |
Balance of allowance for loan losses at end of year | | $ | 1,981,637 | | | $ | 1,929,319 | |
| | | | | | | | |
Ratios: | | | | | | | | |
Net charge-offs to average loans outstanding | | | 0.31 | % | | | 0.12 | % |
Net charge-offs to loans at end of year | | | 0.31 | % | | | 0.11 | % |
Allowance for loan losses to average loans | | | 1.76 | % | | | 1.77 | % |
Allowance for loan losses to loans at end of year | | | 1.74 | % | | | 1.68 | % |
Net charge-offs to allowance for loan losses | | | 17.55 | % | | | 6.72 | % |
Net charge-offs to provisions for loan losses | | | 86.92 | % | | | 64.14 | % |
Nonperforming Assets.
The following table sets forth the Company’s nonperforming assets at the dates indicated:
| | | | | | | | |
| | | December 31, | |
| | | 2008 | | | 2007 | |
Impaired Loans | | $ | 4,712,038 | | | $ | 814,874 | |
Loans 90 days or more past due and still accruing interest | | | 2,951 | | | | 3,433 | |
| | | | | | | | |
Total impaired and nonperforming loans | | | 4,714,989 | | | | 818,307 | |
Other real estate owned | | | 75,000 | | | | — | |
| | | | | | | | |
Total impaired and nonperforming assets | | $ | 4,789,989 | | | $ | 818,307 | |
| | | | | | | | |
Impaired and nonperforming assets to year end loans | | | 4.21 | % | | | 0.71 | % |
Loans on the Company’s problem loan watch list are considered potentially impaired loans. These loans are evaluated in determining whether all outstanding principal and interest are expected to be collected. At December 31, 2008 and 2007 impaired totaled $4,712,038 and $814,874, respectively. Nonaccrual loans of $1,975,834 and $814,874 were included in impaired loans at December 31, 2008 and 2007, respectively. The impaired loans had specific valuation allowances of $275,548 and $122,146 at December 31, 2008 and 2007, respectively. The average balances of impaired loans during 2008 and 2007 were $3,940,498 and $808,868, respectively.
15
COMMUNITYCORP AND SUBSIDIARY
Management’s Discussion and Analysis of
Financial Condition and Results of Operations
PROVISION AND ALLOWANCE FOR LOAN LOSSES(continued)
Potential Problem Loans. The following is a summary of potential problems loans at December 31, 2008 and 2007, which were identified through our internal review mechanisms.
| | | | | | |
| | | December 31, |
| | | 2008 | | 2007 |
Criticized loans | | $ | 1,872,889 | | $ | 90,586 |
Classified loans | | | 3,939,110 | | | 1,480,047 |
Criticized loans have potential weaknesses that deserve close attention and could, if uncorrected, result in deterioration of the prospects for repayment or the Bank’s credit position at a future date. Classified loans are inadequately protected by the sound worth and paying capacity of the borrower or any collateral and there is a distinct possibility or probability that the Bank will sustain a loss if the deficiencies are not corrected. During 2008, we employed a more robust process for reviewing and categorizing loans, which caused part of the increase of the levels of criticized, classified and impaired loans.
At December 31, 2008 real estate or other collateral secured practically all of the loans that were criticized and classified. In the event of foreclosure on these loans, there can be no assurance that in liquidation, the collateral can be sold for its estimated fair market value or even for an amount at least equal to or greater than the loan amount.
The results of this internal review process and applying the allowance model methodology are the primary determining factors in management’s assessment of the adequacy of the allowance for loan losses.
NONINTEREST INCOME AND EXPENSE
Noninterest Income. Noninterest income for the year ended December 31, 2008 was $690,787, an increase of $24,366 or 3.66% from the comparable period in 2007. Service charges on deposit accounts increased $62,054 or 12.97% from the year ended December 31, 2007 to $540,457 for the comparable period in 2008. This increase is primarily attributable to the increase in service charges on deposit accounts, which increased because of increasing the charge for non-sufficient checks. All other categories of noninterest income decreased 20.05% to $150,330 for the year ended December 31, 2008 when compared to the year ended December 31, 2007. The decline in other income is attributable to the decline in rates paid for certain types of miscellaneous income.
Noninterest Expense.Total noninterest expenses for the year ended December 31, 2008 were $3,844,714, an increase of $311,532 or 8.82%, higher when compared to total noninterest expenses of $3,533,182 for the year ended December 31, 2007. Salaries and employee benefits increased 4.52% from $1,924,825 for the year ended December 31, 2007 to $2,011,830 for the year ended December 31, 2008. This increase is primarily attributable to normal salary increases. Net occupancy and equipment expense increased 5.37% from $571,313 for the year ended December 31, 2007 to $601,965 for the year ended December 31, 2008. Other operating expenses increased $193,875 from the year ended December 31, 2007 to $1,230,921 for the year ended December 31, 2008. This increase is primarily attributable to the increase of $31,372 in our ATM networking fees due to increased usage of our ATM machines, a $41,464 increase in our FDIC deposit insurance premiums, and increased professional fees of $61,495, most of which were related to the cost of complying with the provisions of section 404 of the Sarbanes-Oxley Act.
16
COMMUNITYCORP AND SUBSIDIARY
Management’s Discussion and Analysis of
Financial Condition and Results of Operations
NONINTEREST INCOME AND EXPENSE(continued)
Income Taxes. The Company’s income tax expense for 2008 was $699,509, a decrease of $94,464 over the 2007 expense of $793,973. The Company’s effective tax rates for the years ended December 31, 2008 and 2007 were 31.92% and 31.06%, respectively.
Net Income.The combination of the above factors resulted in net income for the year ended December 31, 2008 of $1,491,661 as compared to $1,761,914 for the same period in 2007. This represents a decrease of $270,253 or 15.34% over the same period in 2007.
EARNING ASSETS
Loans. Loans are the largest category of earning assets and typically provide higher yields than other types of earning assets. Associated with the higher loan yields are the inherent credit and liquidity risks which management attempts to control and counterbalance. Loans averaged approximately $112,597,000 in 2008 compared to approximately $108,809,000 in 2007, an increase of approximately $3,788,000 or 3.48%. Total loans were $113,704,520 and $114,597,378 at December 31, 2008 and 2007, respectively. Fixed rates loans comprised approximately 98% and 99% of our loan portfolio at December 31, 2008 and 2007, respectively.
The Company’s ratio of loans to deposits was 78.03% at December 31, 2008 as compared to 82.09% at December 31, 2007. The loan to deposit ratio is used to monitor a financial institution’s potential profitability and efficiency of asset distribution and utilization. Generally, a higher loan to deposit ratio is indicative of higher interest income since loans yield a higher return than alternative investment vehicles. Management has concentrated on maintaining quality in the loan portfolio while continuing to increase the deposit base.
The Company extends credit primarily to consumers and small businesses in Walterboro, Ravenel and Ridgeland, South Carolina, and to customers in surrounding areas. The Company’s service area is mixed in nature. Walterboro is a regional business center whose economy contains elements of medium and light manufacturing, higher education, regional health care, and distribution facilities. Outside the incorporated city limits of Walterboro, the economy includes manufacturing, agriculture, timber, and recreational activities. Loan growth in the Ravenel and Ridgeland area is expected to come primarily from consumer loans and small businesses in neighboring Charleston and Jasper Counties. No particular category or segment of the economies previously described is expected to grow or contract disproportionately in 2008. Management believes that the loan portfolio is adequately diversified. There are no significant concentrations of loans in any particular individuals, industry, or group of related individuals or industries. The loan demand remains strong in the Company’s market area.
The Company considers a loan to be impaired when, based upon current information and events, Management believes it is probable that the Company will be unable to collect all amounts due according to the contractual terms of the loan agreement. The Company’s impaired loans include loans identified as impaired through review of the nonhomogeneous portfolio and troubled debt restructurings. Specific allowances are established on impaired loans, if deemed necessary, for the difference between the loan amount and the fair market value less estimated selling costs. Impaired loans may be left on accrual status during the period the Company is pursuing repayment of the loan. Impairment losses are recognized through an increase in the allowance for loan losses and a corresponding charge to the provision for loan losses. Adjustments to impairment losses due to changes in the fair market value of the collateral properties for impaired loans are also recognized through an increase in the allowance for loan losses and a corresponding charge to the provision for loan losses. When an impaired loan is sold, transferred to other real estate owned, or written-down, the loan is removed from the portfolio through a charge-off to the allowance for loan losses.
17
COMMUNITYCORP AND SUBSIDIARY
Management’s Discussion and Analysis of
Financial Condition and Results of Operations
EARNING ASSETS(continued)
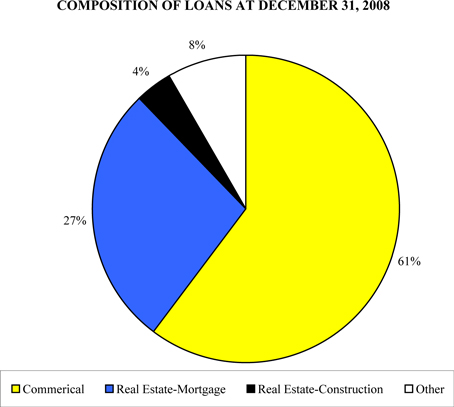
The following table sets forth the composition of the loan portfolio by category at December 31, 2008 and 2007 and highlights our general emphasis on commercial and mortgage lending.
Loan Portfolio Composition
| | | | | | | | | | | | | | |
| | | 2008 | | | 2007 | |
| | | Amount | | | Percent
of Total | | | Amount | | | Percent
of Total | |
Commercial and industrial | | $ | 68,540,891 | | | 60.28 | % | | $ | 65,995,943 | | | 57.59 | % |
Real estate | | | | | | | | | | | | | | |
Construction | | | 4,564,879 | | | 4.01 | | | | 4,791,125 | | | 4.18 | |
Mortgage | | | 31,204,675 | | | 27.44 | | | | 32,249,064 | | | 28.14 | |
Consumer and other loans | | | 9,394,075 | | | 8.26 | | | | 11,561,246 | | | 10.09 | |
| | | | | | | | | | | | | | |
Total loans | | | 113,704,520 | | | 100.00 | % | | | 114,597,378 | | | 100.00 | % |
| | | | | | | | | | | | | | |
Allowance for loan losses | | | (1,981,637 | ) | | | | | | (1,929,319 | ) | | | |
| | | | | | | | | | | | | | |
Net loans | | $ | 111,722,883 | | | | | | $ | 112,668,059 | | | | |
| | | | | | | | | | | | | | |
Commercial and industrial loans increased $2,544,948 or 3.86% from $65,995,943 at December 31, 2007. Real estate loans, including construction and mortgage loans, decreased $1,270,635 or 3.43% to $35,769,554 at December 31, 2008. Consumer and all other loans decreased $2,167,171 or 18.75% to $9,394,075 at December 31, 2008.
Maturities and Sensitivity of Loans to Changes in Interest Rates
The following table summarizes the loan maturity distribution, by type, at December 31, 2008 and related interest rate characteristics:
| | | | | | | | | | | | |
| | | One Year or
Less | | Over One Year
Through Five
Years | | Over Five
Years | | Total |
Real estate - construction | | $ | 3,782,344 | | $ | 782,535 | | $ | — | | $ | 4,564,879 |
Real estate - mortgage | | | 9,681,682 | | | 20,527,908 | | | 995,085 | | | 31,204,675 |
Commercial and industrial | | | 30,816,306 | | | 37,144,668 | | | 579,917 | | | 68,540,891 |
Consumer and other | | | 2,936,599 | | | 6,250,803 | | | 206,673 | | | 9,394,075 |
| | | | | | | | | | | | |
| | $ | 47,216,931 | | $ | 64,705,914 | | $ | 1,781,675 | | $ | 113,704,520 |
| | | | | | | | | | | | |
Loans maturing after one year with: | | | | | | | | | | | | |
Fixed interest rates | | | | | | | | | | | $ | 65,462,557 |
Floating interest rates | | | | | | | | | | | | 1,025,032 |
| | | | | | | | | | | | |
| | | | | | | | | | | $ | 66,487,589 |
| | | | | | | | | | | | |
18
COMMUNITYCORP AND SUBSIDIARY
Management’s Discussion and Analysis of
Financial Condition and Results of Operations
EARNING ASSETS(continued)
The information presented in the above table is based on the contractual maturities of the individual loans, including loans, which may be subject to renewal at their contractual maturity. Renewal of such loans is subject to review and credit approval as well as modification of terms upon their maturity. Consequently, management believes the treatment shown in the above table presents fairly the maturity and repricing structure of the loan portfolio.
Short-Term Investments. Short-term investments, which consist of federal funds sold, averaged approximately $8,954,126 in 2008, compared to approximately $8,683,000 in 2007. At December 31, 2008, we had no short-term investments. Short-term investments are a primary source of the Company’s liquidity and are generally invested in an earning capacity on an overnight basis.
Investment Securities. The investment securities portfolio is a significant component of the Company’s total earning assets. Total investment securities, stated at carrying amount, averaged approximately $33,916,000 in 2008, compared to approximately $36,961,000 in 2007. At December 31, 2008, the carrying value of the securities portfolio was $29,643,306. Securities designated as available-for-sale totaled $27,815,275 and were recorded at estimated fair value. Securities designated as held-to-maturity totaled $1,319,596 and were recorded at amortized cost. Securities designated as nonmarketable equity securities totaled $508,435 at December 31, 2008. The investment objectives of the Company include maintaining and investing in a portfolio of high quality and highly liquid investments with competitive returns. Based on these objectives, the Company’s investments primarily consist of obligations of government-sponsored enterprises and obligations of states and local governments.
Investment Portfolio. The following tables summarize the carrying value of investment securities at December 31, 2008 and 2007 and the weighted average yields of those securities at December 31, 2008.
Investment Securities Portfolio Composition
| | | | | | |
| | | 2008 | | 2007 |
Available-for-Sale (1) | | | | | | |
Government-sponsored enterprises | | $ | 11,554,710 | | $ | 21,028,089 |
Obligations of states and local governments | | | 8,330,464 | | | 7,803,335 |
Other | | | 446,356 | | | 202,160 |
| | | | | | |
| | | 20,331,530 | | | 29,033,584 |
Mortgage-backed securities | | | 7,483,745 | | | 5,551,489 |
| | | | | | |
Total available-for-sale securities | | $ | 27,815,275 | | $ | 34,585,073 |
| | | | | | |
Held-to-Maturity (1) | | | | | | |
Government-sponsored enterprises | | $ | — | | $ | 300,000 |
Obligations of states and local governments | | | 1,319,596 | | | 1,519,481 |
| | | | | | |
Total held-to-maturity securities | | $ | 1,319,596 | | $ | 1,819,481 |
| | | | | | |
| (1) | Held-to-maturity securities are stated at amortized cost and available-for-sale securities are stated at estimated fair value. |
19
COMMUNITYCORP AND SUBSIDIARY
Management’s Discussion and Analysis of
Financial Condition and Results of Operations
EARNING ASSETS(continued)
Investment Securities Maturity Distribution and Yields
Available-for-Sale
| | | | | | | | | | | | | | | | | | | | | | | | |
December 31, 2008 (Dollars in thousands) | | Within One Year | | | After One But
Within Five Years | | | After Five But
Within Ten Years | | | Over Ten Years | |
| | Amount | | Yield (1) | | | Amount | | Yield (1) | | | Amount | | Yield (1) | | | Amount | | Yield (1) | |
Government-sponsored enterprises (2) | | $ | 2,716 | | 3.16 | % | | $ | 8,086 | | 3.84 | % | | $ | 753 | | 5.42 | % | | $ | — | | — | % |
Obligations of states and local governments | | | 732 | | 6.31 | % | | | 1,243 | | 5.86 | % | | | 4,952 | | 5.51 | % | | | 1,403 | | 5.42 | % |
Other | | | — | | — | % | | | — | | — | % | | | 446 | | 7.22 | % | | | — | | — | % |
| | | | | | | | | | | | | | | | | | | | | | | | |
Total available-for-sale securities | | $ | 3,448 | | 3.82 | % | | $ | 9,329 | | 4.11 | % | | $ | 6,152 | | 5.62 | % | | $ | 1,403 | | 5.42 | % |
| | | | | | | | | | | | | | | | | | | | | | | | |
|
| Held-to-Maturity | |
| | | | |
December 31, 2008 (Dollars in thousands) | | Within One Year | | | After One But
Within Five Years | | | After Five But
Within Ten Years | | | Over Ten Years | |
| | Amount | | Yield (1) | | | Amount | | Yield (1) | | | Amount | | Yield (1) | | | Amount | | Yield (1) | |
Obligations of states and local governments | | $ | 255 | | 6.41 | % | | $ | 765 | | 6.78 | % | | $ | 300 | | 6.18 | % | | $ | — | | — | |
| | | | | | | | | | | | | | | | | | | | | | | | |
| (1) | Tax equivalent yield has been calculated using an incremental rate of 34%. |
| (2) | Excludes mortgage-backed securities totaling $7,483,745 with a yield of 4.77%. |
DEPOSITS AND OTHER INTEREST-BEARING LIABILITIES
Deposits. Deposits account for practically all of our interest bearing liabilities. Total average deposits decreased from approximately $145,399,000 in 2007 to approximately $144,320,000 in 2008. This represents a decrease of approximately $1,079 or 0.74% from the 2007 amount.
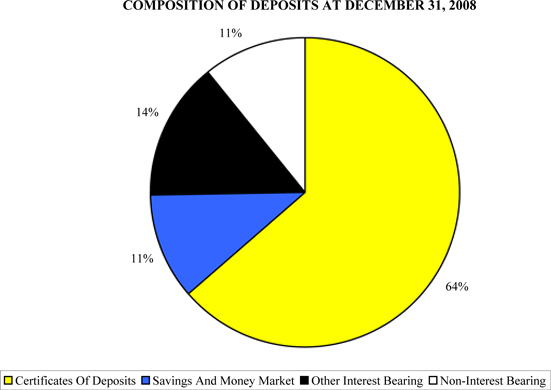
The following table summarizes the Company’s deposits for the years ended December 31, 2008 and 2007.
| | | | | | | | | | | | |
| | | 2008 | | | 2007 | |
| | | Amount | | Percent of
Deposits | | | Amount | | Percent of
Deposits | |
Noninterest-bearing demand | | $ | 15,652,393 | | 10.74 | % | | $ | 16,461,238 | | 11.79 | % |
Interest-bearing demand | | | 21,065,476 | | 14.46 | | | | 20,840,913 | | 14.93 | |
Savings accounts | | | 16,442,403 | | 11.28 | | | | 14,270,926 | | 10.22 | |
Time deposits of $100,000 or over | | | 53,994,171 | | 37.06 | | | | 55,118,795 | | 39.49 | |
Other time deposits | | | 38,559,542 | | 26.46 | | | | 32,902,440 | | 23.57 | |
| | | | | | | | | | | | |
Total deposits | | $ | 145,713,985 | | 100.00 | % | | $ | 139,594,312 | | 100.00 | % |
| | | | | | | | | | | | |
20
COMMUNITYCORP AND SUBSIDIARY
Management’s Discussion and Analysis of
Financial Condition and Results of Operations
DEPOSITS AND OTHER INTEREST-BEARING LIABILITIES(continued)
Core deposits, which exclude certificates of deposit of $100,000 or more, provide a relatively stable funding source for the Company’s loan portfolio and other earning assets. The Company’s core deposits were $91,719,814 and $84,475,517 at December 31, 2008 and 2007, respectively. A stable base of deposits is expected to be the Company’s primary source of funding to meet both its short-term and long-term liquidity needs in the future.
Maturities of Certificates of Deposit of $100,000 or More
The maturity distribution of the Company’s time deposits of $100,000 or more at December 31, 2008, is shown in the following table.
| | | | | | | | | | | | | | | |
| | | Within Three
Months | | After Three
Through Six
Months | | After Six
Through Twelve
Months | | After Twelve
Months | | Total |
Certificates of deposit of $100,000 or more | | $ | 15,827,452 | | $ | 14,726,078 | | $ | 20,379,515 | | $ | 3,061,126 | | $ | 53,994,171 |
Large balance certificates of deposit customers tend to be extremely sensitive to interest rate levels, making these deposits less reliable sources of funding for liquidity planning purposes than core deposits. During 2008 and 2007, the Company did not have any certificates of deposits that were obtained through brokers.
Short-term Borrowings. At December 31, 2008 and 2007, the Company had securities sold under agreements to repurchase, which are classified as secured borrowings and generally mature within one to seven day periods. Either party may cancel the arrangement without penalty. Information concerning securities sold under agreements to repurchase is summarized as follows:
| | | | | | | | |
| | | Years ended December 31, | |
| | | 2008 | | | 2007 | |
Average balance during the year | | $ | 308,449 | | | $ | 249,074 | |
Average interest rate during the year | | | 1.81 | % | | | 4.29 | % |
Maximum month-end balance during the year | | $ | 515,000 | | | $ | 3,068,000 | |
End of period average interest rate | | | 0.25 | % | | | 4.72 | % |
CAPITAL
Total shareholders’ equity increased by $957,017 from $16,736,401 at December 31, 2007 to $17,693,418 at December 31, 2008. The increase is attributable to the sale of treasury stock of $24,000, the increase in other comprehensive income of $4,773 and net income of $1,491,661. The increase was offset by the purchase of treasury stock during the period of $310,880, and the payment of dividends of $252,537.
21
COMMUNITYCORP AND SUBSIDIARY
Management’s Discussion and Analysis of
Financial Condition and Results of Operations
CAPITAL(continued)
The Bank is subject to various regulatory capital requirements administered by the federal banking agencies. Failure to meet minimum capital requirements can initiate certain mandatory, and possibly additional discretionary actions by regulators that, if undertaken, could have a direct material effect on the Bank’s financial statements. Under capital adequacy guidelines and the regulatory framework for prompt corrective action, the Bank must meet specific capital guidelines that involve quantitative measures of the Bank’s assets, liabilities, and certain off-balance-sheet items as calculated under regulatory accounting practices. The Bank’s capital amounts and classification are also subject to qualitative judgments by the regulators about components, risk weightings, and other factors.
Quantitative measures established by regulation to ensure capital adequacy require the Bank to maintain minimum ratios of Tier 1 and total capital as a percentage of assets and off-balance-sheet exposures, adjusted for risk weights ranging from 0% to 100%. Tier 1 capital consists of common shareholders’ equity, excluding the unrealized gain or loss on securities available for sale, minus certain intangible assets. Tier 2 capital consists of the allowance for loan losses subject to certain limitations. Total capital for purposes of computing the capital ratios consists of the sum of Tier 1 and Tier 2 capital. Total regulatory minimum requirements are 4% for Tier 1 and 8% for total risk-based capital.
As of December 31, 2008, management believes that the Bank is well capitalized under the regulatory framework for prompt-corrective action.
The following table summarizes the capital amounts and ratios of the Bank and the regulatory minimum requirements.
| | | | | | | | | | | | | | | | | | |
| | | Actual | | | For Capital
Adequacy Purposes | | | To Be Well-
Capitalized Under
Prompt Corrective
Action Provisions | |
| | | | | | | | Minimum | | | Minimum | |
| | | Amount | | Ratio | | | Amount | | Ratio | | | Amount | | Ratio | |
December 31, 2008 | | | | | | | | | | | | | | | | | | |
Total capital (to risk-weighted assets) | | $ | 19,125,823 | | 15.31 | % | | $ | 9,995,920 | | 8.00 | % | | $ | 12,494,900 | | 10.00 | % |
Tier 1 capital (to risk-weighted assets) | | | 17,563,961 | | 14.06 | | | | 4,997,960 | | 4.00 | | | | 7,496,940 | | 6.00 | |
Tier 1 capital (to average assets) | | | 17,563,961 | | 10.84 | | | | 6,481,960 | | 4.00 | | | | 8,102,450 | | 5.00 | |
December 31, 2007 | | | | | | | | | | | | | | | | | | |
Total capital (to risk-weighted assets) | | $ | 18,058,801 | | 15.08 | % | | $ | 9,578,000 | | 8.00 | % | | $ | 11,972,500 | | 10.00 | % |
Tier 1 capital (to risk-weighted assets) | | | 16,562,238 | | 13.83 | | | | 4,789,000 | | 4.00 | | | | 7,183,500 | | 6.00 | |
Tier 1 capital (to average assets) | | | 16,562,238 | | 10.19 | | | | 6,499,360 | | 4.00 | | | | 8,124,200 | | 5.00 | |
The Federal Reserve Board has similar requirements for bank holding companies. The Company is currently not subject to these requirements because the Federal Reserve guidelines contain an exemption for bank holding companies with less than $500,000,000 in consolidated assets.
LIQUIDITY MANAGEMENT
Liquidity is the ability to meet current and future obligations through liquidation or maturity of existing assets or the acquisition of additional liabilities. Adequate liquidity is necessary to meet the requirements of customers for loans and deposit withdrawals in the most timely and economical manner. Some liquidity is ensured by maintaining assets, which may be immediately converted into cash at minimal cost (amounts due from banks and federal funds sold). However, the most manageable sources of liquidity are composed of liabilities, with the primary focus of
22
COMMUNITYCORP AND SUBSIDIARY
Management’s Discussion and Analysis of
Financial Condition and Results of Operations
LIQUIDITY MANAGEMENT(continued)
liquidity management being on the ability to obtain deposits within the Company’s market area. Core deposits (total deposits, less time deposits of $100,000 and over) provide a relatively stable funding base. At December 31, 2008 and 2007 core deposits represented 62.95% and 60.52%, respectively of total deposits.
The Bank had available at the end of 2008 unused short-term lines of credit to purchase up to $6,300,000 of federal funds from unrelated correspondent institutions. The Bank also has a credit availability agreement with the Federal Home Loan Bank totaling 15 percent of the Bank’s qualifying assets as of any quarter end. As of December 31, 2008, the available credit totaled approximately $24,686,000 and there were no borrowings outstanding. Any borrowings from the FHLB will be secured by a blanket lien on all of the Bank’s 1-4 family residential first lien mortgage loans and or investment securities.
Asset liquidity is provided from several sources, including amounts due from banks and federal funds sold. Available for sale securities, particularly those maturing within one year, provide a secondary source of liquidity. In addition, funds from maturing loans are a source of liquidity.
The Company’s ability to meet its cash obligations or to pay any possible future cash dividends to shareholders is dependent primarily on the successful operation of the Bank and its ability to pay cash dividends to the Company. Any of the Bank’s cash dividends in an amount exceeding current year-to-date earnings are subject to the prior approval of the South Carolina Commissioner of Banking and are generally allowable only from its undivided profits. In addition, dividends paid by the Bank to the Company would be prohibited if such payment would cause the Bank’s capital to be reduced below applicable minimum regulatory requirements. At December 31, 2008, the Bank’s available undivided profits totaled $14,332,252. Under Federal Reserve Board regulations, the amounts of loans or advances from the Bank to the Company are also restricted.
Management believes that the overall liquidity sources of both the Company the Bank are adequate to meet their operating needs in the ordinary course of business.
IMPACT OF OFF-BALANCE-SHEET INSTRUMENTS
The Company is a party to financial instruments with off-balance-sheet risk in the normal course of business to meet the financing needs of our customers. These financial instruments consist of commitments to extend credit and standby letters of credit. Commitments to extend credit are legally binding agreements to lend to a customer at predetermined interest rates as long as there is no violation of any condition established in the contract. Commitments generally have fixed expiration dates or other termination clauses and may require payment of a fee. A commitment involves, to varying degrees, elements of credit and interest rate risk in excess of the amount recognized in the balance sheet. Our exposure to credit loss in the event of nonperformance by the other party to the instrument is represented by the contractual notional amount of the instrument. Since certain commitments are expected to expire without being drawn upon, the total commitment amounts do not necessarily represent future cash requirements. Letters of credit are conditional commitments issued to guarantee a customer’s performance to a third party and have essentially the same credit risk as other lending facilities. Standby letters of credit often expire without being used. Management believes that through various sources of liquidity, they have the necessary resources to meet obligations arising from these financial instruments.
We use the same credit underwriting procedures for commitments to extend credit and standby letters of credit as we do for our on-balance-sheet instruments. The credit worthiness of each borrower is evaluated and the amount of collateral, if deemed necessary, is based on the credit evaluation. Collateral held for commitments to extend credit and standby letters of credit varies but may include accounts receivable, inventory, property, plant, equipment, and income-producing commercial properties.
There are no off-balance-sheet contractual relationships, other than those disclosed in this report, that could result in liquidity needs or other commitments or that could significantly impact earnings.
23
COMMUNITYCORP AND SUBSIDIARY
Management’s Discussion and Analysis of
Financial Condition and Results of Operations
IMPACT OF OFF-BALANCE-SHEET INSTRUMENTS(continued)
Through its operations, the Bank has made contractual commitments to extend credit in the ordinary course of its business activities. These commitments are legally binding agreements to lend money to the Bank’s customers at predetermined interest rates for a specified period of time. At December 31, 2008, the Bank had issued commitments to extend credit of $10,580,736 and standby letters of credit of $1,112,932 through various types of commercial lending arrangements. Approximately $188,616 of these commitments to extend credit had variable rates.
The following table sets forth the length of time until maturity for unused commitments to extend credit and standby letters of credit at December 31, 2008.
| | | | | | | | | | | | | | | | | | |
| | | Within One
Month | | After One
Through
Three
Months | | After Three
Through
Twelve
Months | | Within One
Year | | Greater
Than One
Year | | Total |
Unused commitments to extend credit | | $ | 286,184 | | $ | 1,842,435 | | $ | 6,094,508 | | $ | 8,223,127 | | $ | 2,357,609 | | $ | 10,580,736 |
Standby letters of credit | | | — | | | 267,000 | | | 830,932 | | | 1,097,932 | | | 15,000 | | | 1,112,932 |
| | | | | | | | | | | | | | | | | | |
Totals | | $ | 286,184 | | $ | 2,109,435 | | $ | 6,925,440 | | $ | 9,321,059 | | $ | 2,372,609 | | $ | 11,693,668 |
| | | | | | | | | | | | | | | | | | |
The Bank evaluates each customer’s credit worthiness on a case-by-case basis. The amount of collateral obtained, if deemed necessary by the Bank upon extension of credit, is based on its credit evaluation of the borrower. Collateral varies but may include accounts receivable, inventory, property, plant and equipment, commercial and residential real estate.
IMPACT OF INFLATION
The consolidated financial statements and related financial data presented herein have been prepared in accordance with accounting principles generally accepted in the United States of America which require the measurement of financial position and operating results in terms of historical dollars, without considering changes in relative purchasing power over time due to inflation. Unlike most industrial companies, virtually all of the assets and liabilities of a financial institution are monetary in nature. As a result, interest rates generally have a more significant impact on a financial institution’s performance than does the effect of inflation.
While the effect of inflation on a bank is normally not as significant as its influence on those businesses that have large investments in plant and inventories, it does have an effect. Interest rates generally increase as the rate of inflation increases, but the magnitude of the change in rates may not be the same. While interest rates have traditionally moved with inflation, the effect on income is diminished because both interest earned on assets and interest paid on liabilities vary directly with each other. Also, increases in the price of goods and services will generally result in increased operating expenses.
IMPACT OF RECENT ACCOUNTING CHANGES
For a summary of recent authoritative pronouncements that affect accounting, reporting, and disclosure of financial information by the Company see Note 1 to the consolidated financial statements.
24
MANAGEMENT’S ANNUAL REPORT ON INTERNAL
CONTROL OVER FINANCIAL REPORTING
Our Management is responsible for establishing and maintaining adequate internal control over financial reporting, as defined inRules 13a-15(f) and 15d-15(f) under the Securities Exchange Act of 1934. Our internal control over financial reporting is a process designed to provide reasonable assurance that assets are safeguarded against loss from unauthorized use or disposition, transactions are executed in accordance with appropriate management authorization and accounting records are reliable for the preparation of financial statements in accordance with generally accepted accounting principles.
Because of its inherent limitations, internal control over financial reporting may not prevent or detect misstatements. Also, projections of any evaluation of effectiveness to future periods are subject to the risk that controls may become inadequate because of changes in conditions, or that the degree of compliance with the policies or procedures may deteriorate.
Management assessed the effectiveness of our internal control over financial reporting as of December 31, 2008. Management based this assessment on criteria for effective internal control over financial reporting described in“Internal Control - Integrated Framework issued by the Committee of Sponsoring Organizations of the Treadway Commission.”Management’s assessment included an evaluation of the design of our internal control over financial reporting and testing of the operational effectiveness of its internal control over financial reporting. Management reviewed the results of its assessment with the Audit Committee of the Board of Directors. Based on this assessment, management believes that Communitycorp maintained effective internal control over financial reporting as of December 31, 2008.
This annual report does not include an attestation report of the Company’s independent registered public accounting firm regarding internal control over financial reporting. Management’s report was not subject to attestation by the Company’s independent registered public accounting firm pursuant to temporary rules of the Securities and Exchange Commission that permit the Company to provide only management’s report in this annual report
25
REPORT OF INDEPENDENT REGISTERED PUBLIC ACCOUNTING FIRM
To the Shareholders and Board of Directors
Communitycorp and subsidiary
Walterboro, South Carolina
We have audited the accompanying consolidated balance sheets of Communitycorp and subsidiary as of December 31, 2008 and 2007 and the related consolidated statements of income, changes in shareholders’ equity and comprehensive income and cash flows for the years then ended. These consolidated financial statements are the responsibility of the company’s management. Our responsibility is to express an opinion on these consolidated financial statements based on our audits.
We conducted our audits in accordance with the standards of the Public Company Accounting Oversight Board (United States). Those standards require that we plan and perform the audit to obtain reasonable assurance about whether the consolidated financial statements are free of material misstatement. An audit includes examining, on a test basis, evidence supporting the amounts and disclosures in the financial statements. An audit also includes assessing the accounting principles used and significant estimates made by management, as well as evaluating the overall financial statement presentation. We believe that our audits provide a reasonable basis for our opinion.
In our opinion, the consolidated financial statements referred to above present fairly, in all material respects, the financial position of Communitycorp and subsidiary as of December 31, 2008 and 2007 and the results of their operations and their cash flows for the years then ended in conformity with accounting principles generally accepted in the United States of America.
We were not engaged to examine management’s assertion about the effectiveness of Communitycorp and subsidiary’s internal control over financial reporting as of December 31, 2008, included in the accompanying Management’s Report on Internal Controls Over Financial Reporting, and, accordingly, we do not express an opinion thereon.
|
| /s/ Elliott Davis, LLC |
|
| Charleston, South Carolina |
| March 16, 2009 |
26
COMMUNITYCORP AND SUBSIDIARY
Consolidated Balance Sheets
| | | | | | | | |
| | | December 31, | |
| | | 2008 | | | 2007 | |
Assets: | | | | | | | | |
Cash and cash equivalents: | | | | | | | | |
Cash and due from banks | | $ | 3,468,965 | | | $ | 4,929,768 | |
Federal funds sold | | | 13,146,000 | | | | 1,991,000 | |
| | | | | | | | |
Total cash and cash equivalents | | | 16,614,965 | | | | 6,920,768 | |
| | | | | | | | |
Time deposits with other banks | | | 1,500,000 | | | | — | |
Investment securities: | | | | | | | | |
Securities available-for-sale | | | 27,815,275 | | | | 34,585,073 | |
Securities held-to-maturity (estimated fair value of $1,335,226 in 2008 and $1,836,967 in 2007) | | | 1,319,596 | | | | 1,819,481 | |
Nonmarketable equity securities | | | 508,435 | | | | 347,257 | |
| | | | | | | | |
Total investment securities | | | 29,643,306 | | | | 36,751,811 | |
| | | | | | | | |
Loans receivable | | | 113,704,520 | | | | 114,597,378 | |
Less allowance for loan losses | | | (1,981,637 | ) | | | (1,929,319 | ) |
| | | | | | | | |
Loans receivable, net | | | 111,722,883 | | | | 112,668,059 | |
Premises and equipment, net | | | 3,028,604 | | | | 2,989,119 | |
Accrued interest receivable | | | 1,125,714 | | | | 1,297,946 | |
Other real estate owned | | | 75,000 | | | | — | |
Other assets | | | 874,815 | | | | 691,984 | |
| | | | | | | | |
Total assets | | $ | 164,585,287 | | | $ | 161,319,687 | |
| | | | | | | | |
Liabilities: | | | | | | | | |
Deposits: | | | | | | | | |
Noninterest-bearing transaction accounts | | $ | 15,652,393 | | | $ | 16,461,238 | |
Interest-bearing transaction accounts | | | 21,065,476 | | | | 20,840,913 | |
Money market savings accounts | | | 3,251,083 | | | | 2,437,697 | |
Savings | | | 13,191,320 | | | | 11,833,229 | |
Time deposits $100,000 and over | | | 53,994,171 | | | | 55,118,795 | |
Other time deposits | | | 38,559,542 | | | | 32,902,440 | |
| | | | | | | | |
Total deposits | | | 145,713,985 | | | | 139,594,312 | |
Short-term borrowings | | | — | | | | 3,068,000 | |
Accrued interest payable | | | 953,278 | | | | 1,767,670 | |
Other liabilities | | | 224,606 | | | | 153,304 | |
| | | | | | | | |
Total liabilities | | | 146,891,869 | | | | 144,583,286 | |
| | | | | | | | |
Commitments and contingencies - Notes 4 and 10 | | | | | | | | |
Shareholders’ Equity: | | | | | | | | |
Preferred stock, $5 par value, 3,000,000 shares authorized and unissued | | | — | | | | — | |
Common stock, $5 par value, 3,000,000 shares authorized; 300,000 shares issued | | | 1,500,000 | | | | 1,500,000 | |
Capital surplus | | | 1,728,328 | | | | 1,723,196 | |
Retained earnings | | | 18,392,614 | | | | 17,153,490 | |
Accumulated other comprehensive income | | | 75,701 | | | | 70,928 | |
Treasury stock (63,123 shares in 2008 and 59,537 shares in 2007) | | | (4,003,225 | ) | | | (3,711,213 | ) |
| | | | | | | | |
Total shareholders’ equity | | | 17,693,418 | | | | 16,736,401 | |
| | | | | | | | |
Total liabilities and shareholders’ equity | | $ | 164,585,287 | | | $ | 161,319,687 | |
| | | | | | | | |
The accompanying notes are an integral part of the consolidated financial statements.
27
COMMUNITYCORP AND SUBSIDIARY
Consolidated Statements of Income
| | | | | | |
| | | Years Ended December 31, |
| | | 2008 | | 2007 |
Interest income: | | | | | | |
Loans, including fees | | $ | 8,322,422 | | $ | 8,270,237 |
Investment securities: | | | | | | |
Taxable | | | 1,069,573 | | | 1,305,174 |
Tax-exempt | | | 353,366 | | | 343,968 |
Nonmarketable equity securities | | | 37,783 | | | 18,640 |
Federal funds sold | | | 166,567 | | | 443,588 |
Time deposits with other banks | | | 8,261 | | | 10,121 |
| | | | | | |
Total interest income | | | 9,957,972 | | | 10,391,728 |
| | | | | | |
Interest expense: | | | | | | |
Deposits | | | 4,207,282 | | | 4,756,053 |
Short-term borrowings | | | 5,593 | | | 11,027 |
| | | | | | |
Total interest expense | | | 4,212,875 | | | 4,767,080 |
| | | | | | |
Net interest income | | | 5,745,097 | | | 5,624,648 |
Provision for loan losses | | | 400,000 | | | 202,000 |
| | | | | | |
Net interest income after provision for loan losses | | | 5,345,097 | | | 5,422,648 |
| | | | | | |
Noninterest income: | | | | | | |
Service charges on deposit accounts | | | 540,457 | | | 478,403 |
Commissions on credit life insurance | | | 5,121 | | | 10,289 |
Other charges, fees, and commissions | | | 107,203 | | | 115,953 |
Other | | | 38,006 | | | 61,776 |
| | | | | | |
Total noninterest income | | | 690,787 | | | 666,421 |
| | | | | | |
Noninterest expenses: | | | | | | |
Salaries and employee benefits | | | 2,011.830 | | | 1,924,825 |
Net occupancy and equipment expense | | | 601,965 | | | 571,313 |
Other operating | | | 1,230,919 | | | 1,037,044 |
| | | | | | |
Total noninterest expenses | | | 3,844,714 | | | 3,533,182 |
| | | | | | |
Income before income taxes | | | 2,191,170 | | | 2,555,887 |
Income tax expense | | | 699,509 | | | 793,973 |
| | | | | | |
Net income | | $ | 1,491,661 | | $ | 1,761,914 |
| | | | | | |
Earnings per share: | | | | | | |
Weighted-average common shares outstanding | | | 239,634 | | | 240,708 |
Basic | | $ | 6.22 | | $ | 7.32 |
The accompanying notes are an integral part of the consolidated financial statements.
28
COMMUNITYCORP AND SUBSIDIARY
Consolidated Statements of Changes in Shareholders’ Equity and Comprehensive Income
For the years ended December 31, 2008 and 2007
| | | | | | | | | | | | | | | | | | | | | | | | |
| | | Common stock | | Capital
surplus | | Retained
earnings | | | Accumulated
other
comprehensive
income (loss) | | | Treasury
stock,
at cost | | | Total
shareholders’
equity | |
| | | Shares | | Amount | | | | | |
Balance, December 31, 2006 | | 300,000 | | $ | 1,500,000 | | $ | 1,720,382 | | $ | 15,632,119 | | | $ | (95,015 | ) | | $ | (3,620,051 | ) | | $ | 15,137,435 | |
Net income | | | | | | | | | | | 1,761,914 | | | | | | | | | | | | 1,761,914 | |
Other comprehensive income, net of tax expense of $84,196 | | | | | | | | | | | | | | | 165,943 | | | | | | | | 165,943 | |
| | | | | | | | | | | | | | | | | | | | | | | | |
Comprehensive income | | | | | | | | | | | | | | | | | | | | | | | 1,927,857 | |
Cash dividends paid
($1.00 per share) | | | | | | | | | | | (240,543 | ) | | | | | | | | | | | (240,543 | ) |
Purchase of treasury stock | | | | | | | | | | | | | | | | | | | (119,900 | ) | | | (119,900 | ) |
Sale of treasury stock | | | | | | | | 2,814 | | | | | | | | | | | 28,738 | | | | 31,552 | |
| | | | | | | | | | | | | | | | | | | | | | | | |
Balance, December 31, 2007 | | 300,000 | | | 1,500,000 | | | 1,723,196 | | | 17,153,490 | | | | 70,928 | | | | (3,711,213 | ) | | | 16,736,401 | |
Net income | | | | | | | | | | | 1,491,661 | | | | | | | | | | | | 1,491,661 | |
Other comprehensive income, net of tax expense of $5,723 | | | | | | | | | | | | | | | 4,773 | | | | | | | | 4,773 | |
| | | | | | | | | | | | | | | | | | | | | | | | |
Comprehensive income | | | | | | | | | | | | | | | | | | | | | | | 1,496,434 | |
Cash dividends paid
($1.05 per share) | | | | | | | | | | | (252,537 | ) | | | | | | | | | | | (252,537 | ) |
Purchase of treasury stock | | | | | | | | | | | | | | | | | | | (310,880 | ) | | | (310,880 | ) |
Sale of treasury stock | | | | | | | | 5,132 | | | | | | | | | | | 18,868 | | | | 24,000 | |
| | | | | | | | | | | | | | | | | | | | | | | | |
Balance, December 31, 2008 | | 300,000 | | $ | 1,500,000 | | $ | 1,728,328 | | $ | 18,392,614 | | | $ | 75,701 | | | $ | (4,003,225 | ) | | $ | 17,693,418 | |
| | | | | | | | | | | | | | | | | | | | | | | | |
The accompanying notes are an integral part of the consolidated financial statements.
29
COMMUNITYCORP AND SUBSIDIARY
Consolidated Statements of Cash Flows
| | | | | | | | |
| | | Years Ended December 31, | |
| | | 2008 | | | 2007 | |
Cash flows from operating activities: | | | | | | | | |
Net income | | $ | 1,491,661 | | | $ | 1,761,914 | |
Adjustments to reconcile net income to net cash provided by operating activities: | | | | | | | | |
Provision for loan losses | | | 400,000 | | | | 202,000 | |
Depreciation expense | | | 229,227 | | | | 225,292 | |
Premium amortization less discount accretion on investment securities | | | 32,014 | | | | (107,045 | ) |
Deferred income tax expense (benefit) | | | 56,838 | | | | (77,305 | ) |
Amortization of loan fees and costs | | | (30,121 | ) | | | (2,956 | ) |
(Increase) decrease in accrued interest receivable | | | 172,232 | | | | (81,532 | ) |
Increase (decrease) in accrued interest payable | | | (814,392 | ) | | | 233,139 | |
(Increase) decrease in other assets | | | (205,519 | ) | | | 172,424 | |
Increase (decrease) in other liabilities | | | 31,429 | | | | (230,452 | ) |
| | | | | | | | |
Net cash provided by operating activities | | | 1,363,369 | | | | 2,095,479 | |
| | | | | | | | |
Cash flows from investing activities: | | | | | | | | |
Proceeds from maturities of securities available-for-sale | | | 26,279,054 | | | | 30,824,513 | |
Purchases of securities available-for-sale | | | (19,530,889 | ) | | | (32,584,170 | ) |
Proceeds from maturities of securities held-to-maturity | | | 500,000 | | | | 55,000 | |
Purchases of securities held-to-maturity | | | — | | | | (300,000 | ) |
Purchases of nonmarketable equity securities | | | (161,178 | ) | | | (4,400 | ) |
(Increase) decrease in time deposits with other banks | | | (1,500,000 | ) | | | 100,000 | |
Net (increase) decrease in loans to customers | | | 500,297 | | | | (8,883,631 | ) |
Purchases of premises and equipment | | | (268,712 | ) | | | (83,497 | ) |
| | | | | | | | |
Net cash provided (used) for investing activities | | | 5,818,572 | | | | (10,876,185 | ) |
| | | | | | | | |
Cash flows from financing activities: | | | | | | | | |
Net increase (decrease) in demand deposits, interest-bearing transaction accounts and savings accounts | | | 1,587,195 | | | | (8,718,112 | ) |
Net increase in time deposits | | | 4,532,478 | | | | 7,526,160 | |
Net increase (decrease) in short-term borrowings | | | (3,068,000 | ) | | | 2,818,000 | |
Cash dividends paid | | | (252,537 | ) | | | (240,543 | ) |
Purchase of treasury stock | | | (310,880 | ) | | | (119,900 | ) |
Sale of treasury stock | | | 24,000 | | | | 31,552 | |
| | | | | | | | |
Net cash provided by financing activities | | | 2,512,256 | | | | 1,297,157 | |
| | | | | | | | |
Net increase (decrease) in cash and cash equivalents | | | 9,694,197 | | | | (7,483,549 | ) |
Cash and cash equivalents, beginning of year | | | 6,920,768 | | | | 14,404,317 | |
| | | | | | | | |
Cash and cash equivalents, end of year | | $ | 16,614,965 | | | $ | 6,920,768 | |
| | | | | | | | |
Cash paid during the year for: | | | | | | | | |
Income taxes | | $ | 765,700 | | | $ | 915,280 | |
Interest | | | 5,027,267 | | | | 4,533,941 | |
Supplemental non cash activities | | | | | | | | |
Changes in unrealized gains (losses) on securities available-for-sale | | $ | 4,773 | | | $ | 165,943 | |
Foreclosures on loans | | | 75,000 | | | | — | |
The accompanying notes are an integral part of the consolidated financial statements.
30
COMMUNITYCORP AND SUBSIDIARY
Notes to Consolidated Financial Statements
NOTE 1 - SUMMARY OF SIGNIFICANT ACCOUNTING POLICIES
Basis of Presentation - Communitycorp, a bank holding company, (the “Company”), and its subsidiary, Bank of Walterboro (the Bank), provide commercial banking services to domestic markets principally in Colleton, Charleston, and Jasper counties South Carolina. The consolidated financial statements include the accounts of the parent company and its wholly-owned subsidiary after elimination of all significant intercompany balances and transactions.
Disclosure Regarding Segments - The Company reports as one operating segment, as the chief operating decision-maker reviews the results of operations of the Company as a single enterprise.
Management’s Estimates - The preparation of consolidated financial statements in conformity with accounting principles generally accepted in the United States of America requires management to make estimates and assumptions that affect the reported amounts of assets and liabilities and disclosure of contingent assets and liabilities at the date of the financial statements and the reported amounts of income and expenses during the reporting period. Actual results could differ from those estimates.
Material estimates that are particularly susceptible to significant change relate to the determination of the allowance for losses on loans, including valuation allowances for impaired loans, and the valuation of real estate acquired in connection with foreclosures or in satisfaction of loans. In connection with the determination of the value of foreclosed real estate, management obtains independent appraisals for significant properties. Management must also make estimates in determining the estimated useful lives and methods for depreciating premises and equipment.
While management uses available information to recognize losses on loans, future additions to the allowance may be necessary based on changes in local economic conditions. In addition, regulatory agencies, as an integral part of their examination process, periodically review the Company’s allowance for losses on loans. Such agencies may require the Company to recognize additions to the allowance based on their judgments about information available to them at the time of their examination. Because of these factors, it is possible that the allowance for losses on loans and may change in the near term.
Securities Available-for-Sale - Investment securities available-for-sale are carried at amortized cost and adjusted to estimated fair value by recognizing the aggregate unrealized gains or losses in a valuation account. Aggregate market valuation adjustments are recorded in shareholders’ equity net of deferred income taxes. Reductions in fair value considered by management to be other than temporary are reported as a realized loss and a reduction in the cost basis of the security. The adjusted cost basis of securities available-for-sale is determined by specific identification and is used in computing the gain or loss upon sale.
Securities Held-to-Maturity - Investment securities held-to-maturity are stated at cost, adjusted for amortization of premium and accretion of discount computed by the straight-line method. The Company has the ability and management has the intent to hold designated investment securities to maturity. Reductions in market value considered by management to be other than temporary are reported as a realized loss and a reduction in the cost basis of the security.
Nonmarketable Equity Securities - At December 31, 2008 and 2007, non-marketable equity securities consist of the following:
| | | | | | |
| | | December 31, |
| | | 2008 | | 2007 |
Federal Home Loan Bank | | $ | 290,500 | | $ | 284,400 |
Silverton Financial Services, Inc. | | | 211,935 | | | 56,857 |
Other Community Banks | | | 6,000 | | | 6,000 |
| | | | | | |
Total | | $ | 508,435 | | $ | 347,257 |
| | | | | | |
31
COMMUNITYCORP AND SUBSIDIARY
Notes to Consolidated Financial Statements
NOTE 1 - SUMMARY OF SIGNIFICANT ACCOUNTING POLICIES(continued)
Nonmarketable Equity Securities -continued
The stocks are carried at cost because they have no quoted market value and no ready market exists. Investment in Federal Home Loan Bank stock is a condition of borrowing from the Federal Home Loan Bank, and the stock is pledged to collateralize the borrowings. Dividends received on these stocks are included as a separate component of interest income.
Loans Receivable and Interest Income - Loans are stated at the amount of unpaid principal reduced by an allowance for loan losses. Interest income on all loans is computed based upon the unpaid principal balance. Interest income is computed using the simple interest method and is recorded in the period earned.
The Company determines a loan to be delinquent when payments have not been made according to contractual terms, typically evidenced by nonpayment of a monthly installment by the due date. The accrual of interest income is discontinued when a loan becomes 90 days past due as to principal or interest. Management may elect to continue the accrual of interest when the estimated net realizable value of collateral exceeds the principal balance and accrued interest.
Loan origination and commitment fees and certain direct loan origination costs (principally salaries and employee benefits) are being deferred and amortized to income over the contractual life of the related loans or commitments, adjusted for prepayments, using the level yield method.
Allowance for Loan Losses (the “Allowance”) - The allowance for loan losses is established as losses are estimated to have occurred through a provision for loan losses charger to earnings. Loan losses are charged against the allowance when management believes the uncollectibility of a loan balance is confirmed. Subsequent recoveries, if any, are credited to the allowance.
The allowance for loan losses is evaluated on a regular basis by management and is based upon management’s periodic review of the collectibility of the loans in light of historical experience, the nature and volume of the loan portfolio, adverse situations that may affect the borrower’s ability to repay, estimated value of any underlying collateral and prevailing economic conditions. This evaluation is inherently subjective as it requires estimates that are susceptible to significant revision as more information becomes available.
The allowance consists of specific, general, and unallocated components. The specific component relates to loans that are classified as either doubtful, substandard or special mention. For such loans that are also classified as impaired, an allowance is established when the discounted cash flows (or collateral value or observable market price) of the impaired loan is lower than the carrying value of that loan. The general component covers non-classified loans and is based on historical loss experience adjusted for qualitative factors. An unallocated component is maintained to cover uncertainties that could affect management’s estimate of probable losses. The unallocated component of the allowance reflects the margin of imprecision inherent in the underlying assumptions used in the methodologies for estimating specific and general losses in the portfolio.
A loan is considered impaired when, based on current information and events, it is probable that the Company will be unable to collect the scheduled payments of principal or interest when due according to the contractual terms of the loan agreement. Factors considered by management in determining impairment include payment status, collateral value, and the probability of collecting scheduled principal and interest payments when due. Loans that experience insignificant payment delays and payment shortfalls generally are not classified as impaired. Management determines the significance of payment delays and payment shortfalls on a case-by-case basis, taking into consideration all of the circumstances surrounding the loan and the borrower, including the length of the delay, the reasons for the delay, the borrower’s prior payment record, and the amount of the shortfall in relation to the principal and interest owed. Impairment is measured on a loan by loan basis for commercial and construction loans by either the present value of expected future cash flows discounted at the loan’s effective interest rate, the loan’s obtainable market price, or the fair value of the collateral if the loan is collateral dependent.
32
COMMUNITYCORP AND SUBSIDIARY
Notes to Consolidated Financial Statements
NOTE 1 - SUMMARY OF SIGNIFICANT ACCOUNTING POLICIES(continued)
Allowance for Loan Losses (the “Allowance”) -continued
Large groups of smaller balance homogeneous loans are collectively evaluated for impairment. Accordingly, the Company does not separately identify individual consumer and residential loans for impairment disclosures, unless such loans are the subject of a restructuring agreement.
All cash receipts on impaired loans are applied to principal until such time as the principal is brought current. After principal has been satisfied, future cash receipts are applied to interest income, to the extent that any interest has been foregone.
Loan Fees and Costs - Nonrefundable fees and certain direct costs associated with the origination of loans are deferred and recognized as a yield adjustment over the contractual life of the related loans, or if the related loan is held for resale, until such time that the loan is sold. At of December 31, 2008 and 2007 the Bank did not have any loans held for sale. Recognition of deferred fees and costs is discontinued on nonaccrual loans until they return to accrual status or are charged-off.
Concentrations of Credit Risk -Financial instruments, which potentially subject the Company to concentrations of credit risk, consist principally of loans receivable, investment securities, federal funds sold and amounts due from banks.
The Company makes loans to individuals and small businesses for various personal and commercial purposes principally in Colleton, Charleston, and Jasper counties South Carolina. The Company’s loan portfolio is not concentrated in loans to any single borrower or a relatively small number of borrowers. Additionally, management is not aware of any concentrations of loans to classes of borrowers or industries that would be similarly affected by economic conditions.
In addition to monitoring potential concentrations of loans to particular borrowers or groups of borrowers, industries and geographic regions, management monitors exposure to credit risk from concentrations of lending products and practices such as loans that subject borrowers to substantial payment increases (e.g. principal deferral periods, loans with initial interest-only periods, etc), and loans with high loan-to-value ratios. Management has determined that there is no concentration of credit risk associated with its lending policies or practices. Additionally, there are industry practices that could subject the Company to increased credit risk should economic conditions change over the course of a loan’s life. For example, the Company makes variable rate loans and fixed rate principal-amortizing loans with maturities prior to the loan being fully paid (i.e. balloon payment loans). These loans are underwritten and monitored to manage the associated risks. Therefore, management believes that these particular practices do not subject the Company to unusual credit risk.
The Company’s investment portfolio consists principally of obligations of the United States, its agencies or its corporations and general obligation municipal securities. In the opinion of management, there is no concentration of credit risk in its investment portfolio. The Company places its deposits and correspondent accounts with and sells its federal funds to high quality institutions. Management believes credit risk associated with correspondent accounts is not significant.
33
COMMUNITYCORP AND SUBSIDIARY
Notes to Consolidated Financial Statements
NOTE 1 - SUMMARY OF SIGNIFICANT ACCOUNTING POLICIES(continued)
Premises and Equipment - Premises and equipment are stated at cost, less accumulated depreciation. The provision for depreciation is computed by the straight-line method. Rates of depreciation are generally based on the following estimated useful lives: buildings - 40 years; furniture and equipment - 5 to 10 years. The cost of assets sold or otherwise disposed of, and the related accumulated depreciation are eliminated from the accounts and the resulting gains or losses are reflected in the income statement. Maintenance and repairs are charged to current expense as incurred, and the costs of major renewals and improvements are capitalized.
Other Real Estate Owned - Other real estate owned includes real estate acquired through foreclosure. Other real estate owned is initially recorded at the lower of cost (principal balance of the former loan plus costs of improvements) or estimated fair value. Any write-downs at the dates of acquisition are charged to the allowance for loan losses. Expenses to maintain such assets, subsequent write-downs and gains and losses on disposal are included in other expenses.
Income and Expense Recognition - The accrual method of accounting is used for all significant categories of income and expense. Immaterial amounts of insurance commissions and other miscellaneous fees are reported when received.
Advertising - Advertising, promotional, and other business development costs generally are expensed as incurred. External costs incurred in producing media advertising are expensed the first time the advertising takes place. External costs relating to direct mailing costs are expensed in the period in which the direct mailings are sent. Expenses charged for advertising were $45,834 and $35,793 at December 31, 2008 and 2007, respectively.
Income Taxes- Deferred income taxes are computed using the asset and liability approach. The tax effects of differences between the tax and financial accounting bases of assets and liabilities are reflected in the balance sheet at the tax rates expected to be in effect when the differences reverse. A valuation allowance is provided against deferred tax assets when realization is deemed not to be likely. As changes in tax laws or rates are enacted, deferred tax assets and liabilities are adjusted through the provision for income taxes.
In July 2007, the FASB issued Financial Interpretation No. 48, “Accounting for Uncertainty in Income Taxes-an interpretation of FASB Statement No. 109”(“FIN 48”), which is a change in accounting for income taxes. FIN 48 specifies how tax benefits for uncertain tax positions are to be recognized, measured, and derecognized in financial statements; requires certain disclosures of uncertain tax matters; specifies how reserves for uncertain tax positions should be classified on the balance sheet; and provides transition and interim period guidance, among other provisions. FIN 48 is effective for fiscal years beginning after December 15, 2007 and as a result, was effective for the Company in the first quarter of fiscal 2008. The adoption of FIN 48 did not have any impact on the Company’s Consolidated Financial Statements.
Retirement and Deferred Compensation Plans - The Company has a trusteed noncontributory profit-sharing plan which provides retirement and other benefits to all full-time employees who have worked 1,000 or more hours during the calendar year and have put in one year of service. All eligible employees must be at least age 21. Contributions are determined annually by the Board of Directors. Expenses charged to earnings for the profit-sharing plan were $72,572 and $82,055 in 2008 and 2007, respectively. The Company’s policy is to fund contributions to the profit-sharing plan in the amount approved by the Board of Directors. In addition, the plan includes a “salary reduction” feature pursuant to Section 401(k) of the Internal Revenue Code. Under the plan and present policies, participants are permitted to make discretionary contributions up to 10% of annual compensation. The Company makes no matching contributions to this plan.
34
COMMUNITYCORP AND SUBSIDIARY
Notes to Consolidated Financial Statements
NOTE 1 - SUMMARY OF SIGNIFICANT ACCOUNTING POLICIES(continued)
Retirement and Deferred Compensation Plans -(continued)
Additionally, the Company has a nonqualified voluntary salary deferral plan for certain officers of the Company. Under the plan, these officers may defer up to 25% of their compensation and earn interest on the deferred amount. Upon retirement, the total amount deferred and interest earned is to be paid to each participant over a period not to exceed fifteen years. The total amount deferred and unpaid under this plan was $385,238 and $344,357 at December 31, 2008 and 2007, respectively. Expenses charged to earnings for the salary deferral plan were $30,295 and $27,000 in 2008 and 2007, respectively. The Company does not provide post employment benefits to employees beyond the plans described above.
Earnings Per Share - Earnings per share is calculated by dividing earnings by the weighted-average number of common shares outstanding during the year. The Company has no instruments which are considered common stock equivalents and therefore, dilutive earnings per share is not presented.
Statement of Cash Flows - For purposes of reporting cash flows, the Company considers certain highly liquid debt instruments purchased with a maturity of three months or less to be cash equivalents. Cash equivalents include amounts due from banks, federal funds sold, and securities purchased under agreements to resell.
Comprehensive Income - Accounting principles generally accepted in the United States of America require that recognized revenue, expenses, gains, and losses be included in net income. Although certain changes in assets and liabilities, such as unrealized gains and losses on available-for-sale securities, are reported as a separate component of the equity section of the balance sheet, such items, along with net income, are components of comprehensive income.
The components of other comprehensive income and related tax effects are as follows:
| | | | | | | | |
| | | Year Ended December 31, | |
| | | 2008 | | | 2007 | |
Net unrealized gains on available-for-sale securities | | $ | 10,496 | | | $ | 250,139 | |
Reclassification adjustment for gains realized in net income | | | — | | | | — | |
| | | | | | | | |
Net unrealized gains on securities | | | 10,496 | | | | 250,139 | |
Tax effect | | | (5,723 | ) | | | (84,196 | ) |
| | | | | | | | |
Net-of-tax amount | | $ | 4,773 | | | $ | 165,943 | |
| | | | | | | | |
Off-Balance-Sheet Financial Instruments - In the ordinary course of business, the Company has entered into off-balance-sheet financial instruments consisting of commitments to extend credit and standby letters of credit. These financial instruments are recorded in the financial statements when they become payable by the customer.
35
COMMUNITYCORP AND SUBSIDIARY
Notes to Consolidated Financial Statements
NOTE 1 - SUMMARY OF SIGNIFICANT ACCOUNTING POLICIES(continued)
Recent Accounting Pronouncements - The following is a summary of recent authoritative pronouncements that affect accounting, reporting, and disclosure of financial information by the Company:
In March 2008, the FASB issued SFAS No. 161, “Disclosures about Derivative Instruments and Hedging Activities,” (“SFAS 161”). SFAS 161 requires enhanced disclosures about an entity’s derivative and hedging activities, thereby improving the transparency of financial reporting. It is intended to enhance the current disclosure framework in SFAS 133 by requiring that objectives for using derivative instruments be disclosed in terms of underlying risk and accounting designation. This disclosure is intended to convey the purpose of derivative use in terms of the risks that the entity is intending to manage. SFAS 161 was effective for the Company on January 1, 2009 and will result in additional disclosures if the Company enters into any material derivative or hedging activities.
In February 2008, the FASB issued FASB Staff Position No. 140-3, “Accounting for Transfers of Financial Assets and Repurchase Financing Transactions,” (“FSP 140-3”). This FSP provides guidance on accounting for a transfer of a financial asset and the transferor’s repurchase financing of the asset. This FSP presumes that an initial transfer of a financial asset and a repurchase financing are considered part of the same arrangement (linked transaction) under SFAS 140. However, if certain criteria are met, the initial transfer and repurchase financing are not evaluated as a linked transaction and are evaluated separately under SFAS 140. FSP 140-3 was effective for the Company on January 1, 2009. The adoption of FSP 140-3 had no impact on the Company’s financial position, results of operations or cash flows.
In June 2008, the FASB issued FASB Staff Position No. EITF 03-6-1, “Determining Whether Instruments Granted in Share-Based Payment Transactions are Participating Securities,” (“FSP EITF 03-6-1”). The Staff Position provides that unvested share-based payment awards that contain nonforfeitable rights to dividends or dividend equivalents are participating securities and must be included in the earnings per share computation. FSP EITF 03-6-1 was effective January 1, 2009 and had no effect on the Company’s financial position, results of operations, earnings per share or cash flows.
FSP SFAS 133-1 and FIN 45-4, “Disclosures about Credit Derivatives and Certain Guarantees: An Amendment of FASB Statement No. 133 and FASB Interpretation No. 45; and Clarification of the Effective Date of FASB Statement No. 161,” (“FSP SFAS 133-1 and FIN 45-4”) was issued September 2008, effective for reporting periods (annual or interim) ending after November 15, 2008. FSP SFAS 133-1 and FIN 45-4 amends SFAS 133 to require the seller of credit derivatives to disclose the nature of the credit derivative, the maximum potential amount of future payments, fair value of the derivative, and the nature of any recourse provisions. Disclosures must be made for entire hybrid instruments that have embedded credit derivatives.
The Staff Position also amends FASB Interpretation No. (“FIN”) 45 to require disclosure of the current status of the payment/performance risk of the credit derivative guarantee. If an entity utilizes internal groupings as a basis for the risk, how the groupings are determined must be disclosed as well as how the risk is managed.
The Staff Position encourages that the amendments be applied in periods earlier than the effective date to facilitate comparisons at initial adoption. After initial adoption, comparative disclosures are required only for subsequent periods.
FSP SFAS 133-1 and FIN 45-4 clarifies the effective date of SFAS 161 such that required disclosures should be provided for any reporting period (annual or quarterly interim) beginning after November 15, 2008. The adoption of this Staff Position had no material effect on the Company’s financial position, results of operations or cash flows.
The SEC’s Office of the Chief Accountant and the staff of the FASB issued press release 2008-234 on September 30, 2008 (“Press Release”) to provide clarifications on fair value accounting. The Press Release includes guidance on the use of management’s internal assumptions and the use of “market” quotes. It also reiterates the factors in SEC Staff Accounting Bulletin (“SAB”) Topic 5M which should be considered when determining other-than-temporary impairment: the length of time and extent to which the market value has been less than cost; financial condition and near-term prospects of the issuer; and the intent and ability of the holder to retain its investment for a period of time sufficient to allow for any anticipated recovery in market value.
36
COMMUNITYCORP AND SUBSIDIARY
Notes to Consolidated Financial Statements
NOTE 1 - SUMMARY OF SIGNIFICANT ACCOUNTING POLICIES(continued)
Recent Accounting Pronouncements -(continued)
On October 10, 2008, the FASB issued FSP SFAS 157-3, “Determining the Fair Value of a Financial Asset When the Market for That Asset Is Not Active” (“FSP SFAS 157-3”). This FSP clarifies the application of SFAS No. 157, “Fair Value Measurements” (see Note 14) in a market that is not active and provides an example to illustrate key considerations in determining the fair value of a financial asset when the market for that asset is not active. The FSP is effective upon issuance, including prior periods for which financial statements have not been issued. For the Company, this FSP was effective for the quarter ended September 30, 2008.
The Company considered the guidance in the Press Release and in FSP SFAS 157-3 when conducting its review for other-than-temporary impairment as of December 31, 2008 as discussed in Note 14.
FSP SFAS 140-4 and FIN 46(R)-8, “Disclosures by Public Entities (Enterprises) about Transfers of Financial Assets and Interests in Variable Interest Entities,” (“FSP SFAS 140-4 and FIN 46(R)-8”) was issued in December 2008 to require public entities to disclose additional information about transfers of financial assets and to require public enterprises to provide additional disclosures about their involvement with variable interest entities. The FSP also requires certain disclosures for public enterprises that are sponsors and servicers of qualifying special purpose entities. The FSP is effective for the first reporting period ending after December 15, 2008. This FSP had no material impact on the financial position of the Company.
FSP SFAS 132(R)-1, “Employers’ Disclosures about Postretirement Benefit Plan Assets,” (“FSP SFAS 132(R)-1”) issued in December 2008, provides guidance on an employer’s disclosures about plan assets of a defined benefit pension or other postretirement plan to provide the users of financial statements with an understanding of: (a) how investment allocation decisions are made, including the factors that are pertinent to an understanding of investment policies and strategies; (b) the major categories of plan assets; (c) the inputs and valuation techniques used to measure the fair value of plan assets; (d) the effect of fair value measurements using significant unobservable inputs (Level 3) on changes in plan assets for the period; and (e) significant concentrations of risk within plan assets.
The Staff Position also requires a nonpublic entity, as defined in SFAS 132, to disclose net periodic benefit cost for each period for which a statement of income is presented. FSP SFAS 132(R)-1 is effective for fiscal years ending after December 15, 2009. The Staff Position will require the Company to provide additional disclosures related it to its benefit plans.
FSP EITF 99-20-1, “Amendments to the Impairment Guidance of EIFT Issue No. 99-20,” (“FSP EITF 99-20-1”) was issued in January 2009. Prior to the Staff Position, other-than-temporary impairment was determined by using either EITF Issue No. 99-20, “Recognition of Interest Income and Impairment on Purchased Beneficial Interests and Beneficial Interests that Continue to be Held by a Transferor in Securitized Financial Assets,” (“EITF 99-20”) or SFAS No. 115, “Accounting for Certain Investments in Debt and Equity Securities,” (“SFAS 115”) depending on the type of security. EITF 99-20 required the use of market participant assumptions regarding future cash flows regarding the probability of collecting all cash flows previously projected. SFAS 115 determined impairment to be other than temporary if it was probable that the holder would be unable to collect all amounts due according to the contractual terms. To achieve a more consistent determination of other-than-temporary impairment, the Staff Position amends EITF 99-20 to determine any other-than-temporary impairment based on the guidance in SFAS 115, allowing management to use more judgment in determining any other-than-temporary impairment. The Staff Position is effective for interim and annual reporting periods ending after December 15, 2008 and shall be applied prospectively. Retroactive application is not permitted. Management has reviewed the Company’s security portfolio and evaluated the portfolio for any other-than-temporary impairments as discussed in Note 3.
37
COMMUNITYCORP AND SUBSIDIARY
Notes to Consolidated Financial Statements
NOTE 1 - SUMMARY OF SIGNIFICANT ACCOUNTING POLICIES(continued)
Recent Accounting Pronouncements -(continued)
Other accounting standards that have been issued or proposed by the FASB or other standards-setting bodies are not expected to have a material impact on the Company’s financial position, results of operations or cash flows.
Reclassifications - Certain captions and amounts in the consolidated financial statements of 2007 were reclassified to conform with the 2008 presentation. These reclassifications had no effect on previously reported net income or shareholders’ equity.
NOTE 2 - CASH AND DUE FROM BANKS
The Company is required by regulation to maintain an average cash reserve balance based on a percentage of deposits. The average amounts of the cash reserve balances at December 31, 2008 and 2007 were approximately $756,000 and $702,000 respectively. These requirements were satisfied by vault cash.
NOTE 3 - INVESTMENT SECURITIES
Securities Available-for-Sale
The amortized cost and estimated fair values of securities available-for-sale were:
| | | | | | | | | | | | |
| | | Amortized
Cost | | Gross Unrealized | | Fair Value |
| | | | Gains | | Losses | |
December 31, 2008 | | | | | | | | | | | | |
Government-sponsored enterprises | | $ | 18,786,403 | | $ | 260,935 | | $ | 8,883 | | $ | 19,038,455 |
Obligations of state and local governments | | | 8,463,297 | | | 50,340 | | | 183,173 | | | 8,330,464 |
Other | | | 450,000 | | | — | | | 3,644 | | | 446,356 |
| | | | | | | | | | | | |
Total | | $ | 27,699,700 | | $ | 311,275 | | $ | 195,700 | | $ | 27,815,275 |
| | | | | | | | | | | | |
December 31, 2007 | | | | | | | | | | | | |
Government-sponsored enterprises | | $ | 26,487,264 | | $ | 118,945 | | $ | 26,631 | | $ | 26,579,578 |
Obligations of state and local governments | | | 7,792,731 | | | 37,713 | | | 27,109 | | | 7,803,335 |
Other | | | 200,000 | | | 2,160 | | | — | | | 202,160 |
| | | | | | | �� | | | | | |
Total | | $ | 34,479,995 | | $ | 158,818 | | $ | 53,740 | | $ | 34,585,073 |
| | | | | | | | | | | | |
38
COMMUNITYCORP AND SUBSIDIARY
Notes to Consolidated Financial Statements
NOTE 3 - INVESTMENT SECURITIES(continued)
The following table shows gross unrealized losses and fair value, aggregated by investment category, and length of time that individual securities have been in a continuous unrealized loss position, at December 31, 2008 and 2007.
| | | | | | | | | | | | | | | | | | |
| | | Less Than 12 Months | | 12 Months Or More | | Total |
| | | Fair Value | | Unrealized
Losses | | Fair Value | | Unrealized
Losses | | Fair Value | | Unrealized
Losses |
December 31, 2008 | | | | | | | | | | | | | | | | | | |
Government-sponsored enterprises | | $ | 505,611 | | $ | 8,883 | | $ | — | | $ | — | | $ | 505,611 | | $ | 8,883 |
Obligations of state and local governments | | | 3,742,860 | | | 148,416 | | | 205,243 | | | 34,757 | | | 3,948,103 | | | 183,173 |
Other | | | 196,356 | | | 3,644 | | | — | | | — | | | 196,356 | | | 3,644 |
| | | | | | | | | | | | | | | | | | |
Total | | $ | 4,444,827 | | $ | 160,943 | | $ | 205,243 | | $ | 34,757 | | $ | 4,650,070 | | $ | 195,700 |
| | | | | | | | | | | | | | | | | | |
December 31, 2007 | | | | | | | | | | | | | | | | | | |
Government-sponsored enterprises | | $ | 4,853,173 | | $ | 7,965 | | $ | 4,980,800 | | $ | 18,667 | | $ | 9,833,973 | | $ | 26,632 |
Obligations of state and local governments | | | 1,861,500 | | | 23,121 | | | 1,405,575 | | | 3,987 | | | 3,267,075 | | | 27,108 |
| | | | | | | | | | | | | | | | | | |
Total | | $ | 6,714,673 | | $ | 31,086 | | $ | 6,386,375 | | $ | 22,654 | | $ | 13,101,048 | | $ | 53,740 |
| | | | | | | | | | | | | | | | | | |
There were a total of twenty-four available-for-sale securities that were in a loss position at December 31, 2008. Of these securities, twenty-three were in a loss position of twelve months or more, which consisted of sixteen obligations of state and local governments, and six mortgage-backed securities, which are included in the government-sponsored enterprises, and one other security. The mortgage-backed securities are protected by mortgage insurance as well as the direct credit to the related agencies. The Company believes that the deterioration in value is attributable to changes in market interest rates and not in credit quality and considers these losses to be temporary. The Company has the ability and intent to hold these securities until such time as the value recovers. At December 31, 2008 and 2007, there were no held-to-maturity securities that were in a continuous loss position for twelve or more months.
The amortized cost and estimated fair values of securities available-for-sale based on their contractual maturities are summarized below. Actual maturities may differ from contractual maturities because borrowers may have the right to call or prepay obligations without penalty.
| | | | | | |
| | | December 31, 2008 |
| | | Amortized
Cost | | Fair Value |
Due in one year or less | | $ | 3,425,651 | | $ | 3,447,641 |
Due after one year but within five years | | | 9,237,898 | | | 9,328,693 |
Due after five years but within ten years | | | 6,206,885 | | | 6,152,222 |
Due after ten years | | | 1,511,343 | | | 1,402,974 |
| | | | | | |
| | | 20,381,777 | | | 20,331,530 |
Mortgage-backed securities | | | 7,317,923 | | | 7,483,745 |
| | | | | | |
Total | | $ | 27,699,700 | | $ | 27,815,275 |
| | | | | | |
39
COMMUNITYCORP AND SUBSIDIARY
Notes to Consolidated Financial Statements
NOTE 3 - INVESTMENT SECURITIES(continued)
Securities Held-To-Maturity
The amortized cost and estimated fair values of securities held-to-maturity were:
| | | | | | | | | | | | |
| | | Amortized
Cost | | Gross Unrealized | | Fair Value |
| | | | Gains | | Losses | |
December 31, 2008 - | | | | | | | | | | | | |
Obligations of state and local governments | | $ | 1,319,596 | | $ | 15,630 | | $ | — | | $ | 1,335,226 |
| | | | | | | | | | | | |
December 31, 2007 | | | | | | | | | | | | |
Government-sponsored enterprises | | $ | 300,000 | | $ | 189 | | $ | | | $ | 300,189 |
Obligations of state and local governments | | | 1,519,481 | | | 17,297 | | | — | | | 1,536,778 |
| | | | | | | | | | | | |
Total | | $ | 1,819,481 | | $ | 17,486 | | $ | — | | $ | 1,836,967 |
| | | | | | | | | | | | |
The amortized cost and estimated fair values of securities held-to-maturity based on their contractual maturities are summarized below. Actual maturities may differ from contractual maturities because borrowers may have the right to call or prepay obligations without penalty.
| | | | | | |
| | | December 31, 2008 |
| | | Amortized
Cost | | Fair Value |
Due in one year or less | | $ | 255,000 | | $ | 255,507 |
Due after one year but within five years | | | 764,784 | | | 771,831 |
Due after five years but within ten years | | | 299,812 | | | 307,888 |
| | | | | | |
Total | | $ | 1,319,596 | | $ | 1,335,226 |
| | | | | | |
At December 31, 2008 and 2007, investment securities with an amortized cost of $19,589,952 and $29,659,673, respectively, and a fair value of $19,682,825 and $30,250,496, respectively, were pledged as collateral to secure public deposits and short-term borrowings. There were no sales of investment securities for the years ended December 31, 2008 and 2007.
NOTE 4 - LOANS RECEIVABLE
Loans consisted of the following:
| | | | | | |
| | | December 31, |
| | | 2008 | | 2007 |
Real estate - construction | | $ | 4,564,879 | | $ | 4,791,125 |
Real estate - mortgage | | | 31,204,675 | | | 32,249,064 |
Commercial and industrial | | | 68,540,891 | | | 65,995,943 |
Consumer and other | | | 9,394,075 | | | 11,561,246 |
| | | | | | |
Total gross loans | | $ | 113,704,520 | | $ | 114,597,378 |
| | | | | | |
As of December 31, 2008 and 2007, management had placed loans totaling $1,975,835 and $814,874, respectively, in nonaccrual status, because the loans were not performing as originally contracted. For 2008 and 2007 the total amount of interest earned on nonaccrual loans was approximately $10,000 and $53,000, respectively. The gross interest income, which would have been recorded under the original terms of the nonaccrual loans, amounted to approximately $89,000 and $52,000 for 2008 and 2007, respectively.
40
COMMUNITYCORP AND SUBSIDIARY
Notes to Consolidated Financial Statements
NOTE 4 - LOANS RECEIVABLE(continued)
Loans ninety days or more past due and still accruing interest were $2,951 and $3,433 at December 31, 2008 and 2007, respectively.
At December 31, 2008 and 2007 impaired totaled $4,712,038 and $814,874, respectively. Nonaccrual loans of $1,975,835 and $814,874 were included in impaired loans at December 31, 2008 and 2007, respectively. The impaired loans had specific valuation allowances of $275,548 and $122,146 at December 31, 2008 and 2007, respectively. The average balances of impaired loans during 2008 and 2007 were $3,940,498 and $808,868, respectively.
Transactions in the allowance for loan losses are summarized below:
| | | | | | | | |
| | | Years ended December 31, | |
| | | 2008 | | | 2007 | |
Balance, beginning of year | | $ | 1,929,319 | | | $ | 1,856,888 | |
Provision charged to operations | | | 400,000 | | | | 202,000 | |
Recoveries on loans previously charged-off | | | 15,449 | | | | 22,130 | |
Loans charged-off | | | (363,131 | ) | | | (151,699 | ) |
| | | | | | | | |
Balance, end of year | | $ | 1,981,637 | | | $ | 1,929,319 | |
| | | | | | | | |
The Company is a party to financial instruments with off-balance-sheet risk in the normal course of business to meet the financing needs of its customers. These financial instruments consist of commitments to extend credit and standby letters of credit. Commitments to extend credit are legally binding agreements to lend to a customer at predetermined interest rates as long as there is no violation of any condition established in the contract. Commitments generally have fixed expiration dates or other termination clauses and may require payment of a fee. A commitment involves, to varying degrees, elements of credit and interest rate risk in excess of the amount recognized in the balance sheets. The Company’s exposure to credit loss in the event of nonperformance by the other party to the instrument is represented by the contractual notional amount of the instrument. Since certain commitments are expected to expire without being drawn upon, the total commitment amounts do not necessarily represent future cash requirements. Standby letters of credit are conditional commitments issued to guarantee a customer’s performance to a third party and have essentially the same credit risk as other lending facilities. Standby letters of credit often expire without being used. The Company believes that through various sources of liquidity, it has the necessary resources to meet obligations arising from these financial instruments.
The Company uses the same credit underwriting procedures for commitments to extend credit and standby letters of credit as it does for on-balance sheet instruments. The credit worthiness of each borrower is evaluated and the amount of collateral, if deemed necessary, is based on the credit evaluation. Collateral held for commitments to extend credit and standby letters of credit varies but may include accounts receivable, inventory, property, plant, equipment, and income-producing commercial properties.
The Company is not involved in off-balance-sheet contractual relationships, other than those disclosed in this report, that could result in liquidity needs or other commitments or could significantly impact earnings.
The following table summarizes the Company’s off-balance-sheet financial instruments whose contractual amounts represent credit risk:
| | | | | | |
| | | December 31, |
| | | 2008 | | 2007 |
Commitments to extend credit | | $ | 10,580,736 | | $ | 11,335,642 |
Standby letters of credit | | | 1,112,932 | | | 978,332 |
41
COMMUNITYCORP AND SUBSIDIARY
Notes to Consolidated Financial Statements
NOTE 4 - LOANS RECEIVABLE(continued)
Management is not aware of any significant concentrations of loans to classes of borrowers or industries that would be affected similarly by economic conditions. At December 31, 2008, the Company was not committed to lend additional funds to borrowers having loans in nonaccrual status.
NOTE 5 - PREMISES AND EQUIPMENT
Premises and equipment consisted of the following:
| | | | | | | | |
| | | December 31, | |
| | | 2008 | | | 2007 | |
Land | | $ | 710,605 | | | $ | 710,605 | |
Building and land improvements | | | 2,568,105 | | | | 2,611,083 | |
Furniture and equipment | | | 2,345,656 | | | | 2,033,966 | |
| | | | | | | | |
Total | | | 5,624,366 | | | | 5,355,654 | |
Less, accumulated depreciation | | | (2,595,762 | ) | | | (2,366,535 | ) |
| | | | | | | | |
Premises and equipment, net | | $ | 3,028,604 | | | $ | 2,989,119 | |
| | | | | | | | |
Depreciation expense totaled $229,227 and $225,292 in 2008 and 2007, respectively.
NOTE 6 - DEPOSITS
At December 31, 2008, the scheduled maturities of time deposits were as follows:
| | | |
Maturing in | | Amount |
2009 | | $ | 87,303,656 |
2010 | | | 797,954 |
2011 | | | 4,078,240 |
2012 | | | 163,282 |
2013 | | | 175,008 |
After five years | | | 35,573 |
| | | |
Total | | $ | 92,553,713 |
| | | |
Included in total time deposits at December 31, 2008 and 2007 were brokered time deposits of $3,305,000 and $0, respectively.
NOTE 7 - RELATED PARTY TRANSACTIONS
Certain parties (principally certain directors and officers of the Company, their immediate families and business interests) were loan customers of, and had other transactions in the normal course of business with the Company. Related party loans are made on substantially the same terms, including interest rates and collateral, as those prevailing at the time for comparable transactions with unrelated persons and do not involve more than normal risk of collectibility. The aggregate dollar amount of loans to related parties was $4,810,058 and $5,169,310 at December 31, 2008 and 2007, respectively. During 2008, $1,233,697 of new loans was made to related parties, and repayments totaled $1,592,949.
Legal services were provided to the Company in the ordinary course of business by a law firm in which two of the partners are directors of the Company. The amount paid to this law firm for services rendered during 2008 and 2007 was $3,019 and $431, respectively.
42
COMMUNITYCORP AND SUBSIDIARY
Notes to Consolidated Financial Statements
NOTE 8 - SHORT-TERM BORROWINGS
At December 31, 2008 and 2007, the Company had securities sold under agreements to repurchase, which are classified as short-term borrowings and generally mature within one to seven day periods. Either party may cancel the arrangement without penalty. Information concerning securities sold under agreements to repurchase is summarized as follows:
| | | | | | | | |
| | | Years ended December 31, | |
| | | 2008 | | | 2007 | |
Average balance during the year | | $ | 308,449 | | | $ | 249,074 | |
Average interest rate during the year | | | 1.81 | % | | | 4.29 | % |
Maximum month-end balance during the year | | $ | 515,000 | | | $ | 3,068,000 | |
End of period average interest rate | | | 0.25 | % | | | 4.72 | % |
The Company has an agreement with its safekeeping agent (an independent third party) to pledge certain of the Company’s U.S. Government obligation securities as collateral for the agreements. As of December 31, 2008, the par value and fair value of the securities underlying the agreements were $630,000 and $623,783, respectively.
NOTE 9 - UNUSED LINES OF CREDIT
The Bank had available at the end of 2008 unused short-term lines of credit to purchase up to $6,300,000 of federal funds from unrelated correspondent institutions. The Bank also has a credit availability agreement with the Federal Home Loan Bank totaling 15 percent of the Bank’s qualifying assets as of any quarter end. As of December 31, 2008, the available credit totaled approximately $24,686,000 and there were no borrowings outstanding. Any borrowings from the FHLB will be secured by a blanket lien on all of the Bank’s 1-4 family residential first lien mortgage loans and or investment securities.
NOTE 10 - COMMITMENTS AND CONTINGENCIES
The Company is subject to claims and lawsuits which arise primarily in the ordinary course of business. At December 31, 2008, management is not aware of any pending or threatened litigation or unasserted claims that could result in losses, if any, that would be material to the financial statements and should be disclosed.
The Company makes loans to individuals and small businesses for various personal and commercial purposes. Although the Company’s loan portfolio is diversified, a substantial portion of its borrowers’ ability to honor the terms of their loans is dependent on business and economic conditions in Colleton, Charleston, and Jasper counties and surrounding areas. The Company’s loan portfolio is not concentrated in loans to any single borrower or in a relatively small number of borrowers. Additionally, management is not aware of any concentrations of loans to classes of borrowers or industries that would be similarly affected by economic conditions.
In addition to monitoring potential concentrations of loans to particular borrowers or groups of borrowers, industries and geographic regions, management monitors exposure to credit risk that could arise from potential concentrations of lending products and practices such as loans that subject borrowers to substantial payment increases (e.g. principal deferral periods, loans with initial interest-only periods, etc), and loans with high loan-to-value ratios. Additionally, there are industry practices that could subject the Company to increased credit risk should economic conditions change over the course of a loan’s life. For example, the Company makes variable rate loans and fixed rate principal-amortizing loans with maturities prior to the loan being fully paid (i.e. balloon payment loans). These loans are underwritten and monitored to manage the associated risks. Management has determined that there is no concentration of credit risk associated with its lending policies or practices.
43
COMMUNITYCORP AND SUBSIDIARY
Notes to Consolidated Financial Statements
NOTE 10 - COMMITMENTS AND CONTINGENCIES(continued)
The Company’s investment portfolio consists principally of obligations of the United States, its agencies or its corporations and general obligation municipal securities.
The Company places its deposits and correspondent accounts with and sells its federal funds to high quality institutions. By policy, time deposits are limited to amounts insured by the Federal Deposit Insurance Corporation. Management believes credit risk associated with correspondent accounts is not significant.
NOTE 11 - SHAREHOLDERS’ EQUITY
At December 31, 2008 and 2007, the Company had 63,123 and 59,537 shares, respectively held in treasury stock. During 2008 and 2007, the Company purchased 3,886 and 1,750 shares respectively, and sold 300 and 464 shares respectively.
The ability of the Company to pay cash dividends is dependent upon receiving cash in the form of dividends from the Bank. However, certain restrictions exist regarding the ability of the Bank to transfer funds to Communitycorp in the form of cash dividends. Dividends to the Company are payable only from the undivided profits of the Bank. At December 31, 2008, the Bank’s undivided profits were $14,332,252. The Bank is authorized to pay cash dividends up to 100% of net income in any calendar year without obtaining the prior approval of the S.C. Commissioner of Banking provided that the Bank received a composite rating of one or two at the last Federal or State regulatory examination. Under Federal Reserve Board regulations, the amounts of loans or advances from the Bank to the parent company are also restricted.
NOTE 12 - OTHER OPERATING EXPENSES
Other operating expenses are summarized as follows:
| | | | | | |
| | | Years ended December 31, |
| | | 2008 | | 2007 |
Stationary, printing, and postage | | $ | 217,832 | | $ | 206,138 |
Advertising and promotion | | | 45,834 | | | 35,793 |
Professional fees | | | 287,514 | | | 226,119 |
Directors’ fees | | | 66,500 | | | 65,800 |
Telephone expenses | | | 73,531 | | | 65,910 |
ATM surcharges | | | 63,000 | | | 31,628 |
ACH charges | | | 35,035 | | | 41,600 |
Armored Car/Courier Services | | | 58,644 | | | 54,565 |
Membership Dues/Subscriptions | | | 30,257 | | | 30,069 |
Other | | | 352,772 | | | 279,422 |
| | | | | | |
Total | | $ | 1,230,919 | | $ | 1,037,044 |
| | | | | | |
44
COMMUNITYCORP AND SUBSIDIARY
Notes to Consolidated Financial Statements
NOTE 13 - INCOME TAXES
Income tax expense included in the consolidated statements of operations is summarized as follows:
| | | | | | | |
| | | Years ended December 31, | |
| | | 2008 | | 2007 | |
Currently payable: | | | | | | | |
Federal | | $ | 575,544 | | $ | 791,991 | |
State | | | 67,127 | | | 79,287 | |
| | | | | | | |
Total current | | | 642,671 | | | 871,278 | |
Deferred income tax expense (benefit) | | | 56,838 | | | (77,305 | ) |
| | | | | | | |
Income tax expense | | $ | 699,509 | | $ | 793,973 | |
| | | | | | | |
The gross amounts of deferred tax assets and deferred tax liabilities were as follows:
| | | | | | | | |
| | | December 31, | |
| | | 2008 | | | 2007 | |
Deferred tax assets: | | | | | | | | |
Allowance for loan losses | | $ | 578,024 | | | $ | 565,723 | |
Deferred compensation | | | 130,981 | | | | 117,081 | |
Nonaccrual loan interest income | | | 26,711 | | | | 16,513 | |
Other | | | — | | | | 29,184 | |
| | | | | | | | |
Total deferred tax assets | | | 735,716 | | | | 728,501 | |
| | | | | | | | |
Deferred tax liabilities: | | | | | | | | |
Securities available for sale | | | (39,873 | ) | | | (34,150 | ) |
Accumulated depreciation | | | (162,657 | ) | | | (134,129 | ) |
Other | | | (35,525 | ) | | | — | |
| | | | | | | | |
Total deferred tax liabilities | | | (216,351 | ) | | | (168,279 | ) |
| | | | | | | | |
Net deferred tax asset | | $ | 497,661 | | | $ | 560,222 | |
| | | | | | | | |
The net deferred tax assets are included in other assets in the consolidated balance sheets at December 31, 2008 and 2007.
A reconciliation between the income tax expense and the amount computed by applying the Federal statutory rate of 34% to income before income taxes follows:
| | | | | | | | |
| | | Years ended December 31 | |
| | | 2008 | | | 2007 | |
Tax expense at statutory rate | | $ | 744,998 | | | $ | 869,002 | |
State income tax, net of federal income tax benefit | | | 44,304 | | | | 52,329 | |
Tax-exempt interest income | | | (122,621 | ) | | | (122,151 | ) |
Disallowed interest expense | | | 16,802 | | | | 20,569 | |
Other, net | | | 16,026 | | | | (25,776 | ) |
| | | | | | | | |
Total | | $ | 699,509 | | | $ | 793,973 | |
| | | | | | | | |
The Company adopted the provisions of FASB Interpretation No. 48 (“FIN 48”). There was no material impact from the adoption of FIN 48. It is the Company’s policy to recognize interest and penalties associated with uncertain tax positions as components of income taxes. There were no interest or penalties accrued during the year. The Company’s federal and state tax returns are subject to examination for the years 2005, 2006 and 2007.
45
COMMUNITYCORP AND SUBSIDIARY
Notes to Consolidated Financial Statements
NOTE 14 - FAIR VALUE MEASUREMENTS
Effective January 1, 2008, the Company adopted SFAS No. 157, “Fair Value Measurements” (“SFAS 157”) which provides a framework for measuring and disclosing fair value under generally accepted accounting principles. SFAS 157 requires disclosures about the fair value of assets and liabilities recognized in the balance sheet in periods subsequent to initial recognition, whether the measurements are made on a recurring basis (for example, available-for-sale investment securities) or on a nonrecurring basis (for example, impaired loans).
SFAS 157 defines fair value as the exchange price that would be received for an asset or paid to transfer a liability (an exit price) in the principal or most advantageous market for the asset or liability in an orderly transaction between market participants on the measurement date. SFAS 157 also establishes a fair value hierarchy which requires an entity to maximize the use of observable inputs and minimize the use of unobservable inputs when measuring fair value. The standard describes three levels of inputs that may be used to measure fair value:
| | |
| Level 1 | | Quoted prices in active markets for identical assets or liabilities. Level 1 assets and liabilities include debt and equity securities and derivative contracts that are traded in an active exchange market, as well as U.S. Treasury, other U.S. Government and agency mortgage-backed debt securities that are highly liquid and are actively traded in over-the-counter markets. |
| |
| Level 2 | | Observable inputs other than Level 1 prices such as quoted prices for similar assets or liabilities; quoted prices in markets that are not active; or other inputs that are observable or can be corroborated by observable market data for substantially the full term of the assets or liabilities. Level 2 assets and liabilities include debt securities with quoted prices that are traded less frequently than exchange-traded instruments and derivative contracts whose value is determined using a pricing model with inputs that are observable in the market or can be derived principally from or corroborated by observable market data. This category generally includes certain derivative contracts and impaired loans. |
| |
| Level 3 | | Unobservable inputs that are supported by little or no market activity and that are significant to the fair value of the assets or liabilities. Level 3 assets and liabilities include financial instruments whose value is determined using pricing models, discounted cash flow methodologies, or similar techniques, as well as instruments for which the determination of fair value requires significant management judgment or estimation. For example, this category generally includes certain private equity investments, retained residual interests in securitizations, residential mortgage servicing rights, and highly-structured or long-term derivative contracts. |
Available-for-sale investment securities ($27,815,275 and $34,585,073 at December 31,2008 and 2007, respectively) are the only assets whose fair values are measured on a recurring basis using Level 2 inputs (active market quotes). The Company has no liabilities carried at fair value or measured at fair value on a nonrecurring basis.
The Company is predominantly an asset based lender with real estate serving as collateral on a substantial majority of loans. Loans, which are deemed to be impaired, are primarily valued at the fair values of the underlying real estate collateral. Such fair values are obtained using independent appraisals, which the Company considers to be level 2 inputs. The aggregate carrying amount of impaired loans at December 31, 2008 and 2007 was $4,712,038 and $814,874, respectively.
46
COMMUNITYCORP AND SUBSIDIARY
Notes to Consolidated Financial Statements
NOTE 15 - FAIR VALUE OF FINANCIAL INSTRUMENTS
The fair value of a financial instrument is the amount at which the asset or obligation could be exchanged in a current transaction between willing parties, other than in a forced or liquidation sale. Fair value estimates are made at a specific point in time based on relevant market information and information about the financial instruments. Because no market value exists for a significant portion of the financial instruments, fair value estimates are based on judgments regarding future expected loss experience, current economic conditions, risk characteristics of various financial instruments, and other factors. Certain items are specifically excluded in accordance with SFAS No. 107, including premise and equipment, accrued interest receivable, other assets, accrued interest payable and other liabilities. The following methods and assumptions were used to estimate the fair value of significant financial instruments:
Cash and Due from Banks - The carrying amount is a reasonable estimate of fair value.
Federal Funds Sold - Federal funds sold are typically for a term of one day, and the carrying amount approximates the fair value.
Time Deposits with Other Banks- The carrying value of these instruments is a reasonable estimate of fair value.
Investment Securities - The fair values of marketable securities held-to-maturity are based on quoted market prices or dealer quotes. For securities available-for-sale, fair value equals the carrying amount, which is the quoted market price. If quoted market prices are not available, fair values are based on quoted market prices of comparable securities. The carrying amount of nonmarketable securities is a reasonable estimate of fair value since no ready market exists for these securities.
Loans Receivable - For certain categories of loans receivable, such as variable rate loans which are repriced frequently and have no significant change in credit risk and credit card receivables, fair values are based on the carrying amounts. The fair value of other types of loans is estimated by discounting the future cash flows using the current rates at which similar loans would be made to the borrowers with similar credit ratings and for the same remaining maturities.
Demand Deposits - The fair value of demand deposits, interest–bearing transaction, savings, and money market accounts is the amount payable on demand at the reporting date. The fair values of time deposits are estimated using a discounted cash flow calculation that applies current interest rates to a schedule of aggregated expected maturities.
Short-term Borrowings - The carrying value of securities sold under agreements to repurchase is a reasonable estimate of fair value because these instruments typically have terms of one to seven days.
Off-Balance-Sheet Financial Instruments - The notional amount represents the amounts of loan commitments and letters of credit, which are off-balance-sheet financial instruments. The fair value of these instruments is not material.
47
COMMUNITYCORP AND SUBSIDIARY
Notes to Consolidated Financial Statements
NOTE 15 - FAIR VALUE OF FINANCIAL INSTRUMENTS(continued)
The carrying values and estimated fair values of the Company’s financial instruments were as follows:
| | | | | | | | | | | | |
| | | December 31, |
| | | 2008 | | 2007 |
| | | Carrying
Amount | | Estimated
Fair Value | | Carrying
Amount | | Estimated
Fair Value |
Financial Assets: | | | | | | | | | | | | |
Cash and due from banks | | $ | 3,468,965 | | $ | 3,468,965 | | $ | 4,929,768 | | $ | 4,929,768 |
Federal funds sold | | | 13,146,000 | | | 13,146,000 | | | 1,991,000 | | | 1,991,000 |
Time deposits with other banks | | | 1,500,000 | | | 1,500,000 | | | — | | | — |
Securities available-for-sale | | | 27,815,275 | | | 27,815,275 | | | 34,585,073 | | | 34,585,073 |
Securities held-to-maturity | | | 1,319,596 | | | 1,335,226 | | | 1,819,481 | | | 1,836,967 |
Nonmarketable equity securities | | | 508,435 | | | 508,435 | | | 347,257 | | | 347,257 |
Loans receivable, gross | | | 113,704,520 | | | 115,087,126 | | | 114,597,378 | | | 113,009,843 |
Financial Liabilities: | | | | | | | | | | | | |
Demand deposit, interest-bearing transaction, money market, and savings accounts | | $ | 53,160,272 | | $ | 53,160,272 | | $ | 51,573,077 | | $ | 51,573,077 |
Time deposits | | | 92,553,713 | | | 93,215,467 | | | 88,021,235 | | | 88,534,485 |
Short-term borrowings | | | — | | | — | | | 3,068,000 | | | 3,068,000 |
NOTE 16 - REGULATORY MATTERS
The Bank is subject to various regulatory capital requirements administered by the federal banking agencies. Failure to meet minimum capital requirements can initiate certain mandatory, and possibly additional discretionary actions by regulators that, if undertaken, could have a direct material effect on the Bank’s financial statements. Under capital adequacy guidelines and the regulatory framework for prompt corrective action, the Bank must meet specific capital guidelines that involve quantitative measures of the Bank’s assets, liabilities, and certain off-balance-sheet items as calculated under regulatory accounting practices. The Bank’s capital amounts and classification are also subject to qualitative judgments by the regulators about components, risk weightings, and other factors.
Quantitative measures established by regulation to ensure capital adequacy require the Bank to maintain minimum ratios of Tier 1 and total capital as a percentage of assets and off-balance-sheet exposures, adjusted for risk weights ranging from 0% to 100%. Tier 1 capital consists of common shareholders’ equity, excluding the unrealized gain or loss on securities available for sale, minus certain intangible assets. Tier 2 capital consists of the allowance for loan losses subject to certain limitations. Total capital for purposes of computing the capital ratios consists of the sum of Tier 1 and Tier 2 capital. Total regulatory minimum requirements are 4% for Tier 1 and 8% for total risk-based capital.
48
COMMUNITYCORP AND SUBSIDIARY
Notes to Consolidated Financial Statements
NOTE 16 - REGULATORY MATTERS(continued)
As of December 31, 2008, management believes that the Bank is well capitalized under the regulatory framework for prompt-corrective action.
The following table summarizes the capital amounts and ratios of the Bank and the regulatory minimum requirements.
| | | | | | | | | | | | | | | | | | |
| | | Actual | | | For Capital
Adequacy Purposes | | | To Be Well-
Capitalized Under
Prompt Corrective
Action Provisions | |
| | | | | | | | Minimum | | | Minimum | |
| | | Amount | | Ratio | | | Amount | | Ratio | | | Amount | | Ratio | |
December 31, 2008 | | | | | | | | | | | | | | | | | | |
Total capital (to risk-weighted assets) | | $ | 19,125,823 | | 15.31 | % | | $ | 9,995,920 | | 8.00 | % | | $ | 12,494,900 | | 10.00 | % |
Tier 1 capital (to risk-weighted assets) | | | 17,563,961 | | 14.06 | | | | 4,997,960 | | 4.00 | | | | 7,496,940 | | 6.00 | |
Tier 1 capital (to average assets) | | | 17,563,961 | | 10.84 | | | | 6,481,600 | | 4.00 | | | | 8,102,450 | | 5.00 | |
December 31, 2007 | | | | | | | | | | | | | | | | | | |
Total capital (to risk-weighted assets) | | $ | 18,058,801 | | 15.08 | % | | $ | 9,578,000 | | 8.00 | % | | $ | 11,972,500 | | 10.00 | % |
Tier 1 capital (to risk-weighted assets) | | | 16,562,238 | | 13.83 | | | | 4,789,000 | | 4.00 | | | | 7,183,500 | | 6.00 | |
Tier 1 capital (to average assets) | | | 16,562,238 | | 10.19 | | | | 6,499,360 | | 4.00 | | | | 8,124,200 | | 5.00 | |
The Federal Reserve Board has similar requirements for bank holding companies. The Company is currently not subject to these requirements because the Federal Reserve guidelines contain an exemption for bank holding companies with less than $500,000,000 in consolidated assets.
NOTE 17 - COMMUNITYCORP (PARENT COMPANY ONLY)
Presented below are the condensed financial statements for Communitycorp (Parent Company Only).
Condensed Balance Sheets
| | | | | | |
| | | December 31, |
| | | 2008 | | 2007 |
Assets | | | | | | |
Cash | | $ | 44,089 | | $ | 93,614 |
Investment in banking subsidiary | | | 17,639,662 | | | 16,633,166 |
Non-marketable equity securities | | | 6,000 | | | 6,000 |
Other assets | | | 3,667 | | | 3,621 |
| | | | | | |
Total assets | | $ | 17,693,418 | | $ | 16,736,401 |
| | | | | | |
Shareholders’ equity | | $ | 17,693,418 | | $ | 16,736,401 |
| | | | | | |
49
COMMUNITYCORP AND SUBSIDIARY
Notes to Consolidated Financial Statements
NOTE 17 - COMMUNITYCORP (PARENT COMPANY ONLY)(continued)
Condensed Statements of Income
| | | | | | | | |
| | | Years ended December 31, | |
| | | 2008 | | | 2007 | |
Income | | | | | | | | |
Dividends from banking subsidiary | | $ | 490,000 | | | $ | 400,000 | |
Other income | | | 39 | | | | 47 | |
| | | | | | | | |
Total income | | | 490,039 | | | | 400,047 | |
Expenses | | | 145 | | | | 95 | |
| | | | | | | | |
Income before income taxes and equity in undistributed earnings of banking subsidiary | | | 489,894 | | | | 399,952 | |
Income tax benefit | | | (45 | ) | | | (27 | ) |
Equity in undistributed earnings of banking subsidiary | | | 1,001,722 | | | | 1,361,935 | |
| | | | | | | | |
Net income | | $ | 1,491,661 | | | $ | 1,761,914 | |
| | | | | | | | |
Condensed Statements of Cash Flows
| | | | | | | | |
| | | Years ended December 31, | |
| | | 2008 | | | 2007 | |
Cash flows from operating activities | | | | | | | | |
Net income | | $ | 1,491,661 | | | $ | 1,761,914 | |
Adjustments to reconcile net income to net cash provided by operating activities: | | | | | | | | |
Equity in undistributed earnings of banking subsidiary | | | (1,001,722 | ) | | | (1,361,935 | ) |
Increase in other assets | | | (47 | ) | | | (27 | ) |
| | | | | | | | |
Net cash provided by operating activities | | | 489,892 | | | | 399,952 | |
| | | | | | | | |
Cash flows from financing activities | | | | | | | | |
Cash dividends paid | | | (252,537 | ) | | | (240,543 | ) |
Purchases of treasury stock | | | (310,880 | ) | | | (119,900 | ) |
Sale of treasury stock | | | 24,000 | | | | 31,552 | |
| | | | | | | | |
Net cash used by financing activities | | | (539,417 | ) | | | (328,891 | ) |
| | | | | | | | |
Increase (decrease) in cash | | | (49,525 | ) | | | 71,061 | |
Cash, beginning of year | | | 93,614 | | | | 22,553 | |
| | | | | | | | |
Cash, ending of year | | $ | 44,089 | | | $ | 93,614 | |
| | | | | | | | |
50
COMMUNITYCORP AND SUBSIDIARY
BOARD OF DIRECTORS
George W. Cone
Attorney
McLeod, Fraser & Cone
Steven Murdaugh
Certified Public Accountant
Harold M. Robertson
Retired
John Reaves McLeod
Attorney
McLeod, Fraser & Cone
Harry L. Hill
Retired
J. Barnwell Fishburne
Owner, Fishburne & Co
Real Estate
W. Roger Crook
Chief Executive Officer and President
Bank of Walterboro
Peden B. McLeod
Chairman of the Board
Attorney
McLeod, Fraser & Cone
Calvert Huffines
President, Huffines Co
Real Estate Broker
OFFICERS
W. Roger Crook
Chief Executive Officer and President
Gwendolyn P. Bunton
Vice President and Cashier
Lynn H. Murdaugh
Assistant Vice President and Administrative Assistant
Bruce Tate
Loan Officer
Cynthia Mills
Branch Manager
M. Ellison Young
Vice President
James M. Bunton Jr.
Loan Officer
Lawton Huggins
Loan Officer
Joanne Herndon
Branch Manager
William Fowler
Loan Officer
STAFF MEMBERS
Annette Lyons
Melissa Connelly
Danielle Mock
Casey Beach
Carolyn Brant
Dorothy Brunson
Natalie Powers
Jennifer Crosby
Betty Ford
Melissa T. Smyly
Sarah Herndon
Sharon Hillier
Carolyn Rahn
Stephanie Kelly
Kathy Breland
Stephanie Strickland
Melissa McMillan
Pam Nelson
Brittany Adams
Dodd Hulsey
Sharon Milligan
Melanie Todd
Debra Bowers
Lynn Hiott
Lindsey Turner
Cathy Groves
Pam O’Quinn
Kelly Strickland
Jeanne Raven
Tracy Valentine
Candice Kubik
Rose Walker
Jessica Pahl
Bonnie Via
Louie Whidden
Joy Koth
Melinda Tanner
51
COMMUNITYCORP AND SUBSIDIARY
CORPORATE DATA
ANNUAL MEETING:
The Annual Meeting of Shareholders of Communitycorp will be held at 6 p.m. on Wednesday, April 29, 2009 at Bank of Walterboro, 1100 North Jefferies Boulevard, Walterboro, South Carolina.
| | |
| CORPORATE OFFICE: | | GENERAL COUNSEL: |
| |
| P.O. Box 1707 | | McLeod, Fraser & Cone |
| 1100 North Jefferies Blvd. | | P.O. Box 230 |
| Walterboro, S.C. 29488 | | Washington Street |
| (843) 549-2265 | | Walterboro, S.C. 29488 |
| |
| STOCK TRANSFER DEPARTMENT: | | INDEPENDENT REGISTERED PUBLIC ACCOUNTING FIRM: |
| |
| Bank of Walterboro | | Elliott Davis, LLC |
| P.O. Box 1707 | | 200 East Broad Street |
| Walterboro, S.C. 29488 | | Greenville, SC 29601 |
STOCK INFORMATION:
The Common Stock of Communitycorp is not listed on any exchange, nor is there a recognized or established market. There is limited trading in the Company’s shares of Common Stock. Management believes that the Common Stock has traded for a price per share of $68.00 to $80.00 during the past two years. There were approximately 547 shareholders of record as of December 31, 2008.
The ability of Communitycorp to pay cash dividends is dependent upon receiving cash in the form of dividends from Bank of Walterboro. However, certain restrictions exist regarding the ability of the Bank to transfer funds to Communitycorp in the form of cash dividends. All of the Bank’s dividends to the Company are payable only from the undivided profits of the Bank.
FORM 10-K
The Company will furnish upon request, free of charge, copies of the Annual Report and the Company’s Report to the Securities and Exchange Commission (Form 10-K) by contacting Gwen P. Bunton, Vice President, Communitycorp, P.O. Box 1707, Walterboro, South Carolina 29488.
This Annual Report serves as the ANNUAL FINANCIAL DISCLOSURE STATEMENT furnished pursuant to Part 350 of the Federal Deposit Insurance Corporation’s Rules and Regulations. THIS STATEMENT HAS NOT BEEN REVIEWED, OR CONFIRMED FOR ACCURACY OR RELEVANCE BY THE FEDERAL DEPOSIT INSURANCE CORPORATION.
52
COMMUNITYCORP AND SUBSIDIARY
SERVICES
All Day Banking
American Express Travelers Checks
ATM Service
Bank By Mail
Bond Coupon Redemption
Business Checking
Canceled Checks Returned with Statement
Cashiers Checks
Certificates of Deposit
Christmas Clubs
Collection Items
Commercial Loans
Direct Deposits
Discount Brokerage Service
Drive-In Service
Individual Retirement Accounts
Interest Checking
Internet Banking
Letters of Credit
Money Market Accounts
Money Orders
Mortgage Loans
Night Depository
Overdraft Protection
Personal Checking
Personal Lines of Credit
Personal Loans
Regular Savings
Safe Deposit Boxes
Senior Checking
Treasury, Tax & Loan Deposits
U.S. Savings Bonds
Visa and Master Card
Wire Transfers
§
110 Forest Hills Road, Walterboro, S.C. 29488
1100 North Jefferies Boulevard, Walterboro, S.C. 29488
6225 Savannah Highway, Ravenel, S.C. 29470
8058 East Main Street, Ridgeland, SC 29936
Member FDIC
53