Table of Contents
UNITED STATES
SECURITIES AND EXCHANGE COMMISSION
Washington, D.C. 20549
FORMN-CSR
CERTIFIED SHAREHOLDER REPORT OF REGISTERED
MANAGEMENT INVESTMENT COMPANIES
Investment Company Act file number:811-07763
LITMAN GREGORY FUNDS TRUST
(Exact name of registrant as specified in charter)
1676 N. California Blvd., Suite 500
Walnut Creek, CA 94596
(Address of principal executive offices)(Zip code)
(Name and Address of Agent for Service)
Jeremy L. DeGroot
1676 N. California Blvd., Suite 500
Walnut Creek, CA 94596
Registrant’s telephone number, including area code: (925)254-8999
Date of fiscal year end: December 31
Date of reporting period: December 31, 2019
Table of Contents
Item 1. Report to Shareholders.
The following is a copy of the report transmitted to shareholders pursuant to Rule30e-1 under the Investment Company Act of 1940, as amended (the “Act”):
Table of Contents
LITMAN GREGORY FUNDS TRUST

Annual Report
Litman Gregory Masters Equity Fund
Litman Gregory Masters International Fund
Litman Gregory Masters Smaller Companies Fund
Litman Gregory Masters Alternative Strategies Fund
Litman Gregory Masters High Income Alternatives Fund
December 31, 2019
Beginning on January 1, 2021, as permitted by regulations adopted by the Securities and Exchange Commission, paper copies of the Litman Gregory Masters Funds’ shareholder reports will no longer be sent by mail, unless you specifically request paper copies of the reports from the Litman Gregory Masters Funds or from your financial intermediary, such as a broker-dealer or bank. Instead, the reports will be made available on www.mastersfunds.com, and you will be notified by mail each time a report is posted and provided with a website link to access the report.
If you already elected to receive shareholder reports electronically, you will not be affected by this change; and you need not take any action. You may elect to receive shareholder reports and other communications from the Litman Gregory Masters Funds or your financial intermediary electronically by notifying your financial intermediary directly or, if you are a direct investor, by calling 800-960-0188.
You may elect to receive all future reports in paper free of charge. If you invest through a financial intermediary, you can contact your financial intermediary to request that you continue to receive paper copies of your reports. If you invest directly with the Litman Gregory Masters Funds, you can call 800-960-0188. Your election to receive reports in paper will apply to all funds held with the Litman Gregory Masters Funds or your financial intermediary.

Table of Contents
Litman Gregory Masters Funds Concept
Investment Philosophy: Alternative Strategies and High Income Alternatives Fund
The Alternative Strategies Fund and the High Income Alternatives Fund were created based on the following fundamental beliefs:
First, Litman Gregory believes it is possible to identify investment managers who will deliver superior long-term performance relative to their passive benchmarks and peer groups. This belief is based on Litman Gregory’s extensive experience evaluating managers and mutual funds on behalf of their clients. The managers in these funds were chosen for their specialized and demonstrated expertise, as well as for their complementary,non-correlated investment approaches.
Second, not only do we want high-quality managers, but we want to offer access to them at an acceptable cost. We spent years engaged in research to find the right mix of managers we believe can deliver on both fronts.
Third, these funds don’t seek to simply replicate what each manager is already doing elsewhere, but to bring investors additionalvalue-add through flexibility, and the ability to be more opportunistic.
The Litman Gregory Masters Alternative Strategies Fund Concept
The Alternative Strategies Fund is a multi-manager fund that combines alternative and absolute-return-oriented strategies chosen based on Litman Gregory’s conviction that each individual strategy is compelling and that collectively the overall fund portfolio is well-diversified. This fund is intended to complement traditional stock and bond portfolios by offering diversification, seeking to reduce volatility, and to potentially enhance returns relative to various measures of risk.
This fund will contain many risk-control factors including the selection of strategies that seek lower risk exposure than conventional stock or stock-bond strategies, the risk-sensitive nature of the managers, the skill of the managers, and the overall strategy diversification.
Typically, each manager will run between 18% to 25% of the portfolio, but Litman Gregory may tactically alter the managers’ allocations to attempt to take advantage of particularly compelling opportunities for a specific strategy or to further manage risk. We will have a high hurdle for making a tactical allocation shift and don’t expect suchtop-down shifts to happen frequently.
The Litman Gregory Masters High Income Alternatives Fund Concept
The High Income Alternatives Fund is a multi-managed fund created to include multiple types of income-producing investments that could improve returns and diversify risks while playing an important strategic role in navigating interest rate and credit cycles.
We partnered with skilled, experienced managers running differentiated strategies. Each offers access to alternative sources of income that clients may otherwise not own, or to which they may be under-allocated. We seek to generate a high level of income with an eye toward capital preservation—meaning that we don’t want to chase high income without consideration for valuations and risk.
Investment Philosophy: The Equity Funds
Our equity funds are based on two fundamental beliefs:
First,it is possible to identify investment managers who will deliver superior long-term performance relative to their passive benchmarks and peer groups. This belief is based on our extensive experience evaluating stock pickers and mutual funds on behalf of our investment management clients.
Second, thatmost stock pickers have an unusually high level of conviction in only a small number of stocks and that a portfolio limited to these stocks will, on average, outperform a more diversified portfolio over a market cycle. However, most stock pickers typically manage portfolios that are diversified beyond these highest-conviction holdings in order to reduce risk and to facilitate the management of the larger amounts of money they oversee.
The Concept Behind Our Equity Funds
Based on the above beliefs, these funds seek to isolate the stock-picking skills of a group of highly regarded investment managers. To meet this objective, the funds are designed with both risk and return in mind, placing particular emphasis on the following factors:
| • | We only choose stock pickers we believe to be exceptionally skilled. |
| • | Each stock picker runs a very concentratedsub-portfolio of not more than 15 of his or her “highest-conviction” stocks. |
| • | Although each manager’s portfolio is concentrated, our equity funds seek to manage risk partly by building diversification into each fund. |
| ¡ | The Equity and International funds offer diversification by including managers with differing investment styles andmarket-cap orientations. |
| ¡ | The Smaller Companies Fund brings together managers who use different investment approaches, though each focuses on the securities of smaller companies. |
| • | We believe that excessive asset growth often results in diminished performance. Therefore, each fund may close to new investors at a level that Litman Gregory believes will preserve each manager’s ability to effectively implement the Litman Gregory Masters Funds concept. If moresub-advisors are added to a particular fund, the fund’s closing asset level may be increased. |
Diversification does not assure a profit or protect against a loss in a declining market.
| ii | Litman Gregory Funds Trust | |||||
Table of Contents

| 2 | ||
| 5 | ||
| 6 | ||
Litman Gregory Masters Equity Fund | ||
| 8 | ||
| 12 | ||
| 13 | ||
Litman Gregory Masters International Fund | ||
| 15 | ||
| 21 | ||
| 22 | ||
Litman Gregory Masters Smaller Companies Fund | ||
| 25 | ||
| 29 | ||
| 30 | ||
Litman Gregory Masters Alternative Strategies Fund | ||
| 31 | ||
| 42 | ||
| 43 | ||
Litman Gregory Masters High Income Alternatives Fund | ||
| 88 | ||
| 96 | ||
| 97 | ||
| 111 | ||
| 112 | ||
| 114 | ||
Statements of Changes in Net Assets | ||
| 115 | ||
| 115 | ||
| 116 | ||
| 116 | ||
| 117 | ||
Financial Highlights | ||
| 118 | ||
| 119 | ||
| 120 | ||
| 121 | ||
| 122 | ||
| 123 | ||
| 124 | ||
| 125 | ||
| 147 | ||
| 153 | ||
| 154 | ||
| 156 | ||
| 161 | ||
| 162 | ||
| 164 |
This report is intended for shareholders of the funds and may not be used as sales literature unless preceded or accompanied by a current prospectus for the Litman Gregory Masters Funds. Statements and other information in this report are dated and are subject to change.
Litman Gregory Fund Advisors, LLC has ultimate responsibility for the funds’ performance due to its responsibility to oversee its investment managers and recommend their hiring, termination and replacement.
| Table of Contents | 1 | |||||
Table of Contents
Litman Gregory Fund Advisors’
We are deeply committed to making each Litman Gregory Masters Fund a highly satisfying long-term investment for shareholders. In following through on this commitment we are guided by our core values, which influence four specific areas of service:
First, we are committed to the Litman Gregory Masters concept.
| • | We will only hire managers who we strongly believe will deliver exceptional long-term returns relative to their benchmarks. We base this belief on extremely thorough due diligence research. This not only requires us to assess their stock-picking skills, but also to evaluate their ability to add incremental performance by investing in a concentrated portfolio of their highest conviction ideas. |
| • | We will monitor each of the managers so that we can maintain our confidence in their ability to deliver the long-term performance we expect. In addition, our monitoring will seek to assess whether they are staying true to their Litman Gregory Masters Funds mandate. Consistent with this mandate, we focus on long-term performance evaluation so that the Masters managers will not be distracted by short-term performance pressure. |
Second, we will do all we can to ensure that the framework within which our stock pickers do their work further increases the odds of success.
| • | Investments from new shareholders in each fund are expected to be limited so that each fund’s asset base remains small enough to retain flexibility to add value. |
| • | The framework also includes the diversified multi-manager structure that makes it possible for each manager to invest, when appropriate, in an opportunistic manner knowing that the potential volatility within his or her portfolio will be diluted at the fund level by the performance of the other managers. In this way, the multi-manager structure seeks to provide fund-level diversification. |
| • | We will work hard to discourage short-term speculators so that cash flows into the funds are not volatile. Lower volatility helps prevent our managers from being forced to sell stocks at inopportune times or to hold excessive cash for non-investment purposes. |
Third, is our commitment to do all we can from an operational standpoint to maximize shareholder returns.
| • | We will remain attentive to fund overhead, and whenever we achieve savings we will pass them through to shareholders. For example, we have had several manager changes that resulted in lower sub-advisory fees to our funds. In every case we have passed through the full savings to shareholders in the form of fee waivers. |
| • | We will provide investors with a low minimum, no-load, no 12b-1 Institutional share class for all Litman Gregory Masters Funds, and a low minimum, no-load Investor share class for the Alternative Strategies and High Income Alternatives funds |
| • | We also will work closely with our managers to make sure they are aware of tax-loss selling opportunities (only to be taken if there are equally attractive stocks to swap into). We account for partial sales on a specific tax lot basis so that shareholders will benefit from the most favorable tax treatment. The goal is not to favor taxable shareholders over tax-exempt shareholders but to make sure that the managers are taking advantage of tax savings opportunities when doing so is not expected to reduce pre-tax returns. |
Fourth, is our commitment to communicate honestly about all relevant developments and expectations.
| • | We will continue to do this by providing thorough and educational shareholder reports. |
| • | We will continue to provide what we believe are realistic assessments of the investment environment. |
Our commitment to Litman Gregory Masters Funds is also evidenced by our own investment. Our employees have, collectively, substantial investments in the funds, as does our company retirement plan. In addition, we use the funds extensively in the client accounts of our investment advisor practice (through our affiliate Litman Gregory Asset Management, LLC). We have no financial incentive to do so because the fees we receive from Litman Gregory Masters Funds held in client accounts are fully offset against the advisory fees paid by our clients. In fact, we have a disincentive to use the funds in our client accounts because each Litman Gregory Masters Fund is capacity constrained (they may be closed as mentioned above), and by using them in client accounts we are using up capacity for which we may not be paid. But we believe these funds offer value that we can’t get elsewhere and this is why we enthusiastically invest in them ourselves and on behalf of clients.
While we believe highly in the ability of the Funds’ sub-advisors, our commitments are not intended as guarantees of future results.
While the funds are no-load, there are management fees and operating expenses that do apply, as well as a 12b-1 fee that applies to Investor class shares. Please refer to the prospectus for further details.
Diversification does not assure a profit or protect against loss in a declining market.
| 2 | Litman Gregory Funds Trust | |||||
Table of Contents
Must be preceded or accompanied by a prospectus.
Each of the funds may invest in foreign securities. Investing in foreign securities exposes investors to economic, political, and market risks and fluctuations in foreign currencies. Each of the funds may invest in the securities of small companies. Small-company investing subjects investors to additional risks, including security price volatility and less liquidity than investing in larger companies. Debt obligations of distressed companies typically are unrated, lower rated, in default or close to default and may become worthless. The International Fund will invest in emerging markets. Investments in emerging market countries involve additional risks such as government dependence on a few industries or resources, government-imposed taxes on foreign investment or limits on the removal of capital from a country, unstable government, and volatile markets. Investments in debt securities typically decrease when interest rates rise. This risk is usually greater for longer-term debt securities. Investments in mortgage-backed securities include additional risks that investor should be aware of including credit risk, prepayment risk, possible illiquidity, and default, as well as increased susceptibility to adverse economic developments. Investments in lower-rated and non-rated securities present a greater risk of loss to principal and interest than higher-rated securities. The funds may invest in master limited partnership units. Investing in MLP units may expose investors to additional liability and tax risks. Derivatives may involve certain costs and risks such as liquidity, interest rate, market, credit, management, and the risk that a position could not be closed when most advantageous. Investing in derivatives could lose more than the amount invested. The funds may make short sales of securities, which involves the risk that losses may exceed the original amount invested.
The Morningstar Rating for funds, or “star rating”, is calculated for managed products (including mutual funds, variable annuity and variable life subaccounts, exchange-traded funds, closed end funds, and separate accounts) with at least a three-year history. Exchange-traded funds and open ended mutual funds are considered a single population for comparative purposes. It is calculated based on a Morningstar Risk-Adjusted Return measure that accounts for variation in a managed products monthly excess performance, placing more emphasis on downward variations and rewarding consistent performance. The top 10% of products in each product category receive 5 stars, the next 22.5% receive 4 stars, the next 35% receive 3 stars the next 22.5% receive 2 stars, and the bottom 10% receive 1 star. The Overall Morningstar Rating for a managed product is derived from a weighted average of the performance figures associated with its three-, five, and 10-year (if applicable) Morningstar Rating metrics. The weights are 100% three-year rating for 36-59 months of total returns, 60% five-year rating/40% three-year rating for 60-119 months of total returns, and 50% 10-year rating/30% five-year rating/20% three-year rating for 120 or more months of total returns. While the 10 year overall rating formula seems to give the most weight to the 10-year period, the most recent three-year period actually has the greatest impact because it is included in all three rating periods. Litman Gregory Masters Alternative Strategies Fund was rated against the following numbers of Multialternative funds over the following time periods as of 12/31/2019: 237 funds in the last three years, and 187 funds in the last five years. With respect to these Multialternative funds, Litman Gregory Masters Alternative Strategies (MASFX) received a Morningstar Rating of 3 stars and 4 stars for the three- and five-year periods, respectively. Ratings for other share classes may be different. Morningstar rating is for the Institutional share class only; other classes may have different performance characteristics. The Investor share class received a rating of 3 stars and 4 stars for the three- and five-year periods, respectively.
Merger arbitrage investments risk loss if a proposed reorganization in which the fund invests is renegotiated or terminated.
Investments in absolute return strategies are not untended to outperform stocks and bonds during strong market rallies.
Multi-investment management styles may lead to higher transaction expenses compared to single investment management styles. Outcomes depend on the skill of the sub-advisors and advisor and the allocation of assets amongst them.
Past performance does not guarantee future results.
Mutual fund investing involves risk; loss of principal is possible.
Performance discussions for the Alternative Strategies Fund and the High Income Alternatives Fund are specifically related to the Institutional share class.
Some of the comments are based on current management expectation and are considered “forward-looking statements”. Actual future results, however, may prove to be different from our expectations. You can identify forward-looking statement by words such as “estimate”, “may”, “expect”, “should”, “could”, “believe”, “plan”, and similar terms. We cannot promise future returns and our opinions are a reflection of our best judgment at the time this report is compiled.
Opinions expressed are subject to change, are not guaranteed and should not be considered recommendations to buy or sell any security.
Sharpe ratio is the measure of a fund’s return relative to its risk. The Sharpe ratio uses standard deviation to measure a fund’s risk-adjusted returns. The higher a fund’s Sharpe ratio, the better a fund’s returns have been relative to the risk it has taken on. Because it uses standard deviation, the Sharpe ratio can be used to compare risk-adjusted returns across all fund categories. The Litman Gregory Masters Alternative Strategies Fund’s Sharpe ratio ranked 1 out of 105 in its Peer Group, US OE Multialternative Morningstar Category from 10/1/2011 to 12/31/2019. Past performance is no guarantee of future results.
| Fund Summary | 3 | |||||
Table of Contents
See pages 9, 16, and 26 for each fund’s top contributors. See pages 10, 19 and 28 for each fund’s portfolio composition. See pages 41 for the Alternative Strategies Fund’s individual strategy portfolio allocations. See pages 94 for the High Income Alternative Fund’s individual strategy portfolio allocations. Fund holdings and/or sector allocations are subject to change at any time and are not recommendations to buy or sell any security.
Diversification does not assure a profit or protect against a loss in a declining market.
Leverage may cause the effect of an increase or decrease in the value of the portfolio securities to be magnified and the fund to be more volatile than if leverage was not used.
References to other mutual funds should not be interpreted as an offer of these securities.
Litman Gregory Fund Advisors LLC has ultimate responsibility for the performance of the Masters Funds due to its responsibility to oversee the investment managers and recommend their hiring, termination and replacement.
Any tax or legal information provided is merely a summary of our understanding and interpretation of some of the current income tax regulations and it is not exhaustive. Investors must consult their tax advisor or legal counsel for advice and information concerning their particular situation. Neither the Funds nor any of their representatives may give legal or tax advice.
Please see page 154 for index definitions. You cannot invest directly in an index.
Please see page 156 for industry definitions.
| 4 | Litman Gregory Funds Trust | |||||
Table of Contents
Litman Gregory Masters Funds’ Performance
| Average Annual Total Returns | ||||||||||||||||||||||||||||
| Institutional Class Performance as of 12/31/2019 | Three- Month | 1-Year | 3-Year | 5-Year | 10-Year | 15-Year | Since Inception | |||||||||||||||||||||
Litman Gregory Masters Equity Fund (12/31/96) | 10.10% | 27.55% | 11.66% | 8.87% | 11.56% | 6.98% | 8.32% | |||||||||||||||||||||
Russell 3000 Index | 9.10% | 31.02% | 14.57% | 11.24% | 13.42% | 9.03% | 8.71% | |||||||||||||||||||||
Morningstar Large Blend Category Average | 8.10% | 28.59% | 13.25% | 9.53% | 11.47% | 7.66% | 7.24% | |||||||||||||||||||||
Gross Expense Ratio: 1.29% Net Expense Ratio as of 4/30/19*: 1.17% | ||||||||||||||||||||||||||||
Litman Gregory Masters International Fund (12/1/97) | 10.68% | 30.45% | 8.50% | 2.85% | 4.70% | 5.42% | 7.08% | |||||||||||||||||||||
MSCI ACWI ex-U.S. Index | 8.92% | 21.51% | 9.87% | 5.51% | 4.97% | 5.25% | 5.38% | |||||||||||||||||||||
MSCI EAFE Index | 8.17% | 22.01% | 9.56% | 5.67% | 5.50% | 4.84% | 5.02% | |||||||||||||||||||||
Morningstar Foreign Large Blend Category Average | 8.36% | 21.40% | 9.15% | 5.18% | 5.07% | 4.56% | 4.21% | |||||||||||||||||||||
Gross Expense Ratio: 1.33% Net Expense Ratio as of 4/30/19*: 1.09% | ||||||||||||||||||||||||||||
Litman Gregory Masters Smaller Companies Fund (6/30/2003) | 6.28% | 23.72% | 8.21% | 5.49% | 9.58% | 6.11% | 7.91% | |||||||||||||||||||||
Russell 2000 Index | 9.94% | 25.52% | 8.59% | 8.23% | 11.83% | 7.92% | 9.74% | |||||||||||||||||||||
Morningstar Small Blend Category Average | 7.98% | 23.33% | 6.59% | 6.67% | 10.59% | 7.11% | 8.99% | |||||||||||||||||||||
Gross Expense Ratio: 1.80% Net Expense Ratio as of 4/30/19*: 1.38% | ||||||||||||||||||||||||||||
Litman Gregory Masters Alternative Strategies Fund (9/30/2011) | 1.91% | 8.52% | 3.56% | 3.33% | n/a | n/a | 4.76% | |||||||||||||||||||||
3-Month LIBOR | 0.54% | 2.61% | 1.93% | 1.33% | n/a | n/a | 0.94% | |||||||||||||||||||||
Bloomberg Barclays Aggregate Bond Index | 0.18% | 8.72% | 4.03% | 3.05% | n/a | n/a | 2.95% | |||||||||||||||||||||
Morningstar Multialternative Category Average | 1.64% | 7.48% | 2.71% | 1.22% | n/a | n/a | 1.92% | |||||||||||||||||||||
HFRX Global Hedge Fund Index | 2.62% | 8.68% | 2.42% | 1.20% | n/a | n/a | 1.82% | |||||||||||||||||||||
Russell 1000 Index | 9.04% | 31.43% | 15.05% | 11.48% | n/a | n/a | 15.90% | |||||||||||||||||||||
Gross Expense Ratio as of 10/31/19: 1.64% | ||||||||||||||||||||||||||||
Net Expense Ratio as of 10/31/19: 1.36% | | The Net Expense Ratio reflects a contractual fee waiver and/or expense reimbursement, which is in place through 4/30/2021. See the Fund’s prospectus for more information. | | |||||||||||||||||||||||||
Adjusted Expense Ratio as of 10/31/19: 1.28% | | The Adjusted Expense Ratio is the same as the Net Expense Ratio exclusive of certain investment expenses, such as interest expense from borrowings and repurchase agreements, dividend expense from investments on short sales, and acquired fund fees and expenses. | | |||||||||||||||||||||||||
Litman Gregory Masters High Income Alternatives Fund (9/28/2018) | 1.44% | 8.37% | n/a | n/a | n/a | n/a | 3.99% | |||||||||||||||||||||
Bloomberg Barclays Aggregate Bond Index | 0.18% | 8.72% | n/a | n/a | n/a | n/a | 8.27% | |||||||||||||||||||||
ICE BofAML U.S. High Yield TR USD Index | 2.61% | 14.41% | n/a | n/a | n/a | n/a | 7.18% | |||||||||||||||||||||
HFRX Fixed Income—Credit Index | 2.52% | 6.20% | n/a | n/a | n/a | n/a | 2.36% | |||||||||||||||||||||
Gross Expense Ratio as of 4/30/19: 2.06% | ||||||||||||||||||||||||||||
Net Expense Ratio as of 4/30/19: 1.70% | | The Net Expense Ratio reflects a contractual fee waiver and/or expense reimbursement, which is in place through 4/30/2021. See the Fund’s prospectus for more information. | | |||||||||||||||||||||||||
Adjusted Expense Ratio as of 4/30/19: 0.98% | | The Adjusted Expense Ratio is the same as the Net Expense Ratio exclusive of certain investment expenses, such as interest expense from borrowings and repurchase agreements, dividend expense from investments on short sales, and acquired fund fees and expenses. | | |||||||||||||||||||||||||
Performance quoted represents past performance and does not guarantee future results. The investment return and principal value of an investment will fluctuate so that an investor’s shares, when redeemed, may be worth more or less than their original cost. Current performance of the funds may be lower or higher than the performance quoted. To obtain the performance of the funds as of the most recently completed calendar month, please visitwww.mastersfunds.com.
The performance quoted does not include a deduction for taxes that a shareholder would pay on distributions or the redemption of fund shares.
*Gross and net expense ratios per the Prospectus dated 4/30/2019. There are contractual fee waivers in effect through 4/30/2021. Indexes are unmanaged, do not incur expenses, taxes or fees and cannot be invested in directly.
MSCI index returns source: MSCI. Neither MSCI nor any other party involved in or related to compiling, computing, or creating the MSCI data makes any express or implied warranties or representations with respect to such data (or the results to be obtained by the use thereof), and all such parties hereby expressly disclaim all warranties of originality, accuracy, completeness, merchantability, or fitness for a particular purpose with respect to any of such data. Without limiting any of the foregoing, in no event shall MSCI, any of its affiliates, or any third party involved in or related to compiling, computing, or creating the data have any liability for any direct, indirect, special, punitive, consequential, or any other damages (including lost profits) even if notified of the possibility of such damages.No further distribution or dissemination of the MSCI data is permitted without MSCI’s express written consent.Source note: Returns prior to 1999 are the MSCI ACWI ex-US GR index. Returns from 1999 onwards are MSCI ACWI ex-US NR index.
| Fund Summary | 5 | |||||
Table of Contents
What a difference a year makes. 2019 began with investors reeling from the nearly 20% decline in global equity markets in the fourth quarter of 2018. However, following the Federal Reserve’s (the Fed’s) pivot to looser monetary policy and a break in the U.S./China trade war, markets rebounded strongly and finished the year on a high note.
Across global equity markets, U.S. large-cap stocks were once again at the top of the leader board. The S&P 500 Index posted gains in every quarter and ended the year at an all-time high. The index’s 31.5% total return was its second-best year since 1997, trailing only its 33% gain in 2013. Growth stocks again trounced value stocks, with the Russell 1000 Growth Stock Index beating its Value Index counterpart by ten percentage points, extending a record 12-year trend. Smaller-cap U.S. stocks (Russell 2000 Index) rose 25.5% for the year, with small-cap growth beating small-cap value by six percentage points.
Foreign equity markets were also strong but trailed the U.S. market. Developed International stocks (MSCI EAFE Index) gained 22.0% for the year. After struggling in the third quarter, emerging-market (EM) stocks (MSCI Emerging Markets Index) shot up almost 12% in the fourth quarter and returned 18.4% for the year.
Domestic credit markets also did very well, with high-yield bonds (BofA Merrill Lynch U.S. High-Yield Cash Pay Index) gaining 14.4%. Somewhat surprisingly, core bonds also posted strong returns in what could be considered a “risk-on” market environment. On the back of three Fed rate cuts, the 10-year Treasury yield declined nearly 80 basis points and the core bond index (Bloomberg Barclays Aggregate Bond Index) returned 8.7%, its best annual return since 2002 (a year when the S&P 500lost 22%).
Note that it wasn’t corporate profit growth that drove stocks higher in 2019. Reported earnings for the S&P 500 were flat over the first three quarters of the year, with a low single-digit percentage increase projected for the fourth quarter. Instead, roughly two-thirds or more of the S&P’s return came from a sharp expansion in valuation multiples. The index’s price-to-earnings (P/E) ratio shot up from 19x trailing GAAP1 earnings to 23x at year-end. Meanwhile, the forward P/E, based on analyst earnings expectations, ended the year above 18x, close to its highest level outside of the tech stock bubble of 1999-2000. Many other valuations metrics also suggest the U.S. market is overvalued.
For the year, the Litman Gregory Masters International Fund gained 30.45%, strongly outperforming the 21.51% return for the MSCI ACWI ex USA Index. The Litman Gregory Masters Equity Fund gained 27.55%, trailing the 31.02% for its Russell 3000 Index benchmark. The Litman Gregory Masters Smaller Companies Fund was up 23.72%, compared to 25.52% for the Russell 2000 Index. The Litman Gregory Masters Alternative Strategies Fund returned 8.52%, compared to 2.61% for 3-month LIBOR and 7.50% for the Morningstar Multialternative category. Since inception, the Masters Alternative Strategies Fund has the highest risk-adjusted return (as measured by both the Sharpe and Sortino ratios) in its Morningstar category. Finally, the Litman Gregory Masters High Income Alternatives Fund gained 8.37%, compared to an 8.72% return for the Bloomberg Barclays Aggregate Bond Index, 14.41% for the BofA Merrill Lynch U.S. High-Yield Cash Pay Index and 6.22% for the HFRX Fixed Income – Credit Index.
Please see the individual fund annual reports for additional performance details and portfolio manager commentary.
We believe the Litman Gregory Masters Funds can fill a valuable role within a diversified investment portfolio. Each of the Masters Funds is sub-advised by a group of highly disciplined, experienced, and skilled investors who we believe can outperform their benchmark over a market cycle. On our three equity funds, each manager runs a distinctive, concentrated, high-conviction stock portfolio, with the goal of materially outperforming their respective market index over the long term. Our Alternative Strategies Fund can serve as a core, lower-risk yet opportunistic holding that provides access to proven managers and strategies, differentiated sources of return, and beneficial diversification relative to traditional bond and stock investments. The High Income Alternatives Fund is intended to be a complement to traditional fixed-income allocations, seeking long-term returns that are significantly higher than core fixed-income and comparable to high-yield bonds, but with lower volatility and downside risk than high-yield due to the fund’s diversified sources of return and manager strategy flexibility.
As always, we thank you for your continued trust and confidence. Our commitment and confidence are reflected in the collective personal investments in the funds by Litman Gregory principals, employees, and the Funds’ trustees of over $20 million, as of December 31, 2019.
| 6 | Litman Gregory Funds Trust | |||||
| 1 | GAAP= generally accepted accounting principles. A combination of authoritative standards (set by policy boards) and the commonly accepted ways of recording and reporting accounting information. |
Table of Contents
Sincerely,
Jeremy DeGroot, President and Portfolio Manager

Jack Chee, Portfolio Manager

Rajat Jain, Portfolio Manager

Jason Steuerwalt, Portfolio Manager

| Fund Summary | 7 | |||||
Table of Contents
Litman Gregory Masters Equity Fund Review
The Litman Gregory Masters Equity Fund returned 27.55% in 2019, underperforming both the 31.02% return for the Russell 3000 Index benchmark and the 28.59% return for the Morningstar Large Blend category. Since its inception on December 31, 1996, the Fund’s 8.32% average annual return slightly trails the benchmark but is ahead of its peer group’s 7.24% return.
Performance as of 12/31/2019 |
| |||||||||||||||||||||||||||
| Average Annual Total Returns | ||||||||||||||||||||||||||||
| Three Month | One- Year | Three- Year | Five- Year | Ten- Year | Fifteen- Year | Since Inception | ||||||||||||||||||||||
Litman Gregory Masters Equity Fund Institutional (12/31/96) | 10.10% | 27.55% | 11.66% | 8.87% | 11.56% | 6.98% | 8.32% | |||||||||||||||||||||
Russell 3000 Index | 9.10% | 31.02% | 14.57% | 11.24% | 13.42% | 9.03% | 8.71% | |||||||||||||||||||||
Morningstar Large Blend Category* | 8.10% | 28.59% | 13.25% | 9.53% | 11.47% | 7.66% | 7.24% | |||||||||||||||||||||
| Performance quoted represents past performance and does not guarantee future results. The investment return and principal value of an investment will fluctuate so that an investor’s shares, when redeemed, may be worth more or less than their original cost. Current performance of the funds may be lower or higher than the performance quoted. To obtain standardized performance of the funds, and performance as of the most recently completed calendar month, please visitwww.mastersfunds.com.As of the prospectus dated 4/30/2019, the gross and net expense ratios for the Institutional Class were1.29% and1.17%, respectively. There are contractual fee waivers in effect through April 30, 2021. |
| |||||||||||||||||||||||||||
Performance of Managers
2019 was a stark reversal from the prior year. 2018 was the equity market’s first negative calendar year return since 2008, but a pivot from the Federal Reserve helped markets soar in 2019. Three out of the seven managers outperformed their respective benchmarks. Dick Weiss of Wells Capital was the top performing manager in 2019 – tacking 31.80% onto his track record that goes back to the Fund’s 1996 inception. Weiss has outperformed his Russell 3000 benchmark by almost six percentage points (an average) since inception. Scott Moore from Nuance Investments and Bill Nygren from Harris Associates also outpaced their respective value benchmarks last year. (Returns are net of sub-advisor management fees.)
Longer term, five of the seven managers are outperforming their respective benchmarks since their inception on the fund. We expect the two managers currently underperforming will make up relative ground during downdrafts in the stock market. Neither manager during their tenure on the fund has yet experienced an extended market environment where the benefits of their investment process would add the most value.
Key Performance Drivers
For the 2019 calendar-year period, both stock selection and sector allocations detracted from fund performance. It is important to understand that the portfolio is built stock by stock and that sector weightings are a residual of the bottom-up fundamental stock-picking process employed by each sub-advisor. That said, we do report on the short-term relative performance of both sector weights and stock selection to help shareholders understand the drivers of recent performance. It is also important to remember that the performance of a stock over a relatively short period tells us nothing about whether it will be a successful position; that is only known at the point when the stock is sold.
The Fund’s top performing position in 2019 was Visa. The stock price increased 43.32% last year. At year-end, Visa is the fund’s largest position and is owned by two sub-advisors (Clyde McGregor of Harris Associates and Sands Capital). Both managers have owned the stock for several years and point to Visa’s deep payments network that serves as a critical link connecting merchants, merchant acquirers, and card issuers as part of the appeal of the business. Additionally, Visa’s growth driver—the trend of paper payments to electronic payments—remains intact. Frank Sands, Jr. and Mike Sramek of Sands Capital note that electronic consumer payments are still only 40 to 50 percent penetrated globally. Many developed markets are over 60 percent penetrated, but some—like Germany, Italy, and Japan—are only around 30 percent penetrated. In addition, most emerging markets outside of China are under 30 percent penetrated.
Another top contributor in 2019 was Alphabet, which is owned by Nygren and Sands Capital. As traditional modes of advertising continue to shift online, both sub-advisors point to Alphabet’s dominance and ability to capitalize on targeted advertising. Alphabet’s infrastructure takes advantage of search intent, which is among the most powerful types of data that can be used to target advertisements, supporting high return on investment (ROI) for the company’s advertiser customers. Sands Capital expects Google Search and YouTube, in their opinion, both highly differentiated businesses to continue driving growth going forward, as more commerce moves online and YouTube continues to improve its capabilities for direct response advertisers.
Alibaba, the global e-commerce giant based in China, is a top-10 position at year-end. It was among the top contributor in 2019. Both Sands Capital and Chris Davis and Danton Goei of Davis Advisors own the stock. The duo at Davis Advisors initiated a position in Alibaba in the first quarter of 2019. They say Alibaba connects businesses and consumers in close to 200 countries via its online
| 8 | Litman Gregory Funds Trust | |||||
Table of Contents
platforms. The company is the largest e-commerce marketplace in the world. Given the company’s enviable competitive position, increasing use as an advertising platform, and promising investments abroad, Davis and Goei expect Alibaba to grow e-commerce revenues at a faster rate than the e-commerce market overall. When also considering the company’s leadership position in emerging businesses with large potential such as internet payments (Alipay), internet finance (ANT Financial), cloud computing (Alibaba Cloud), digital media (Youku Tudou), and offline retail (multiple investments), they believe Alibaba is uniquely positioned in the world’s largest online market.
Hilton Worldwide, owned by McGregor, was also among the top returners in 2019. The stock price increased 55.47% during the year. McGregor contends that Hilton recently transformed into an asset-light, fee-driven company with a more resilient earnings profile that he believes is currently under appreciated by the market. He says Hilton generates over 90% of its profits from franchise, management and incentive fees with long-term contracts; this model requires minimal capital investment and allows Hilton to convert its net income into free cash flow, which it can use to capitalize on attractive acquisition opportunities and fund share repurchases. The company continues to gain market share across all brands and regions and full-year 2019 is on pace to be the fifth consecutive year of net unit growth in excess of 6%. Importantly, Hilton’s development pipeline remained robust through the third quarter (with more than 2,530 hotels consisting of nearly 379,000 rooms throughout 111 countries and territories) and was tracking modestly above management’s expectations. Hilton has a wide spectrum of competitive advantages including the ability to leverage technology to offer guests superior quality and convenience, broad geographic coverage, diversity across brands from mid-range to luxury lodgings and loyalty programs that provide benefits to guests that choose accommodations within its collection.
The fund’s largest detractor in 2019 was Qurate Retail. The stock was owned by Nygren and sold during the third quarter. Quarte owns television shopping channels QVC and HSN (Home Shopping Network). Nygren says earnings results last year were weaker than market expectations. Revenues within QVC, HSN and Zulily declined mid-single digits, while investors were expecting revenue growth from these divisions. Margins were decent, in Nygren’s assessment, considering the surprising revenue decline, which led to earnings per share of $0.35, which exceeded market projections of $0.32. Synergy from the HSN acquisition was on target, and management committed to providing a quarterly update to report actual progress compared with goals. However, Nygren opted to eliminate the position in the company in July to pursue other investment opportunities where they thought there is more upside potential.
Mylan, a healthcare company owned by Weiss, was a detractor during 2019. The company announced quarterly results earlier in the year which were below expectations highlighted by weakness in Europe and this led to some skepticism about the back ended nature of the year. He felt this was sufficiently explained, however, management also announced that after eight months, a corporate strategic review was still ongoing and it was likely they would detail the outcome of this review in late-July at their analyst day. Given how long it’s been (almost a year by that point), the street was highly disappointed and shares underperformed in the first half of the year. Further, concerns over the company’s potential growth trajectory and strategic vision have been a headwind for the company. However, Weiss believes there are several events, including some business line rationalizations and corporate governance changes that could occur and that would be positive. In addition, recent launches of gAdvair and biosimilar Neulasts are gaining traction and should aid revenue growth in the quarters ahead. The company looks attractive on private market value estimates, creating a compelling risk-reward scenario.
| Top 10 Individual Contributors as of the Year Ended December 31, 2019 | ||||||||||||||||||
| Company Name | Fund Weight (%) | Benchmark Weight (%) | 12-Month Return (%) | Contribution to Return (%) | Economic Sector | |||||||||||||
Visa Inc. Class A | 3.29 | 1.00 | 43.32 | 1.32 | Information Technology | |||||||||||||
Alphabet Inc. A | 3.80 | 1.23 | 28.18 | 1.18 | Communication Services | |||||||||||||
Capital One Financial Corp. | 3.05 | 0.14 | 38.63 | 1.16 | Financials | |||||||||||||
Alibaba Group Holding | 2.17 | 0.00 | 54.74 | 0.97 | Consumer Discretionary | |||||||||||||
Hilton Worldwide Hldgs. | 1.76 | 0.00 | 55.47 | 0.88 | Consumer Discretionary | |||||||||||||
ServiceNow Inc. | 1.75 | 0.16 | 58.56 | 0.87 | Information Technology | |||||||||||||
TE Connectivity | 2.80 | 0.00 | 29.38 | 0.81 | Information Technology | |||||||||||||
Amazon.com Inc. | 3.30 | 2.53 | 23.03 | 0.76 | Consumer Discretionary | |||||||||||||
Alphabet Inc. C | 2.00 | 1.24 | 29.10 | 0.62 | Communication Services | |||||||||||||
United Technologies Corp. | 1.46 | 0.37 | 43.80 | 0.62 | Industrials | |||||||||||||
Portfolio contribution for a holding represents the product of the average portfolio weight and the total return earned by the holding during the period. Past performance is no guarantee of future results. Fund holdings and/or sector allocations are subject to change at any time and are not recommendations to buy or sell any security.
| Fund Summary | 9 | |||||
Table of Contents
| Top 10 Individual Detractors as of the Year Ended December 31, 2019 | ||||||||||||||||||
| Company Name | Fund Weight (%) | Benchmark Weight (%) | 12-Month Return (%) | Contribution to Return (%) | Economic Sector | |||||||||||||
Qurate Retail Inc. | 0.36 | 0.02 | -38.27 | -0.37 | Consumer Discretionary | |||||||||||||
US Silica Holdings Inc. | 0.46 | 0.00 | -42.04 | -0.35 | Energy | |||||||||||||
Mylan NV | 0.54 | 0.04 | -23.83 | -0.19 | Health Care | |||||||||||||
DXC Technology Co. | 0.35 | 0.05 | -30.41 | -0.18 | Information Technology | |||||||||||||
American Airlines Group Inc. | 0.68 | 0.04 | -12.00 | -0.12 | Industrials | |||||||||||||
Global Eagle Entertainment Inc. | 0.06 | 0.00 | -77.58 | -0.11 | Communication Services | |||||||||||||
C.H. Robinson Worldwide Inc | 1.32 | 0.04 | -4.71 | -0.09 | Industrials | |||||||||||||
ViacomCBS Inc. Class B | 0.73 | 0.05 | -2.34 | -0.03 | Communication Services | |||||||||||||
Henkel AG & Co. KGaA | 0.99 | 0.00 | -1.65 | -0.03 | Consumer Staples | |||||||||||||
Markel Corp. | 0.15 | 0.05 | -2.67 | -0.03 | Financials | |||||||||||||
Portfolio contribution for a holding represents the product of the average portfolio weight and the total return earned by the holding during the period. Past performance is no guarantee of future results. Fund holdings and/or sector allocations are subject to change at any time and are not recommendations to buy or sell any security.
Portfolio Mix
The Equity Fund is the result of seven bottom-up stock pickers with diverse investment approaches building concentrated portfolios. Therefore, the portfolio often looks quite different from its benchmark. It is common for the fund to have meaningful sector over- and/or underweights. At year-end, the fund was more than seven percentage points overweight to the financials sector (20.7% vs. 13.5%), and underweight to the information technology sector by a similar amount (15.2% vs. 22.4%).
Over the year, the fund’s allocation to the financials sector decreased by about five percentage points. There were no other notable changes to sector weightings during the year. The fund’s cash position did increase over the year—going from 0.8% to 4.6% at year-end.
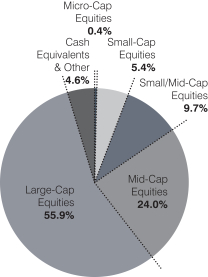
Over the course of the year, the fund’s market-cap exposure did not change materially, with mid- and smaller-cap companies accounting for about 40% of the portfolio (down from about three percentage points). Large-cap stocks make up roughly 56% of the portfolio, the same level it was at year-end 2018. (The balance of the decrease to mid- and smaller-cap names went to an increased cash position.) The fund’s weighted-average market cap stood at $185.6 billion at the year of 2019, while its median market was $38.8 billion. Foreign holdings account for approximately 16% of the portfolio, which is virtually unchanged from the prior year.
By Sector
| Sector Allocation | ||||||||||||
| Fund as of 12/31/19 | Fund as of 12/31/18 | Russell 3000 as of 12/31/19 | ||||||||||
Communication Services | 11.6% | 12.1% | 9.4% | |||||||||
Consumer Discretionary | 17.2% | 17.2% | 10.0% | |||||||||
Consumer Staples | 3.5% | 3.8% | 6.4% | |||||||||
Energy | 2.6% | 3.1% | 4.1% | |||||||||
Finance | 20.7% | 25.6% | 13.5% | |||||||||
Health Care & Pharmaceuticals | 9.9% | 7.3% | 14.2% | |||||||||
Industrials | 12.1% | 11.2% | 9.9% | |||||||||
Information Technology | 15.2% | 16.5% | 22.4% | |||||||||
Materials | 0.8% | 1.5% | 2.9% | |||||||||
Real Estate | 1.8% | 0.9% | 4.0% | |||||||||
Utilities | 0.0% | 0.0% | 3.2% | |||||||||
Cash Equivalents & Other | 4.6% | 0.8% | 0.0% | |||||||||
|
|
|
|
|
| |||||||
| 100.0% | 100.0% | 100.0% | ||||||||||
|
|
|
|
|
| |||||||
Fund holdings and/or sector allocations are subject to change at any time and are not recommendations to buy or sell any security.
| 10 | Litman Gregory Funds Trust | |||||
Table of Contents
| By Market Capitalization | By Domicile | |
Market Capitalization: Micro-Cap < $981 million Small-Cap $981 million - $4.4 billion Small/Mid-Cap $4.4 billion - $10.6 billion Mid-Cap $10.6 billion - $29.4 billion Large-Cap > $29.4 billion Totals may not add up to 100% due to rounding | 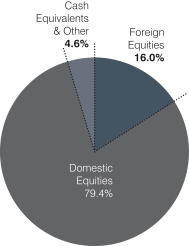 | |
| Fund Summary | 11 | |||||
Table of Contents
Litman Gregory Masters Equity Fund Managers
| INVESTMENT MANAGER | FIRM | TARGET MANAGER ALLOCATION | MARKET CAPITALIZATION OF COMPANIES IN PORTFOLIO | STOCK-PICKING STYLE | BENCHMARK | |||||
| Christopher Davis Danton Goei | Davis Selected Advisers, L.P. | 15% | Mostly large companies | Blend | S&P 500 Index | |||||
| Pat English Jonathan Bloom | Fiduciary Management, Inc. | 15% | All sizes | Blend | S&P 500 Index | |||||
| Bill Nygren | Harris Associates L.P. | 15% | Mostly large- and mid-sized companies | Value | Russell 3000 Value Index | |||||
| Clyde McGregor | Harris Associates L.P. | 15% | All sizes, but mostly large- and mid-sized companies | Value | Russell 3000 Value Index | |||||
| Scott Moore | Nuance Investments, LLC | 10% | All sizes | Value | Russell 3000 Value Index | |||||
Frank Sands, Jr. A. Michael Sramek | Sands Capital Management, LLC | 17% | All sizes, but mostly large- and mid-sized companies | Growth | Russell 1000 Growth Index | |||||
| Richard Weiss | Wells Capital Management, Inc. | 13% | All sizes, but mostly small- and mid-sized companies | Blend | Russell 2000 Index |
Equity Fund Value of Hypothetical $10,000
The value of a hypothetical $10,000 investment in the Litman Gregory Masters Equity Fund from December 31, 1996 to December 31, 2019 compared with the Russell 3000 Index and Morningstar Large Blend Category.
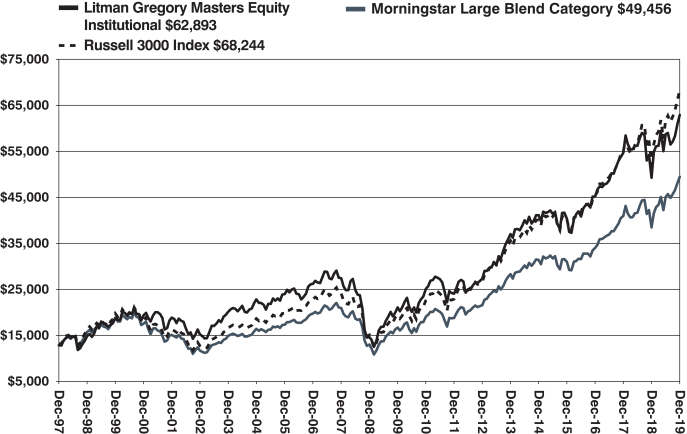
The hypothetical $10,000 investment at fund inception includes changes due to share price and reinvestment of dividends and capital gains. The chart does not imply future performance. Indexes are unmanaged, do not incur fees, expenses or taxes, and cannot be invested in directly.
| 12 | Litman Gregory Funds Trust | |||||
Table of Contents
Litman Gregory Masters Equity Fund
SCHEDULE OF INVESTMENTS IN SECURITIES at December 31, 2019
| Shares | Value | |||||||
| COMMON STOCKS: 94.7% | ||||||||
| Communication Services: 11.6% | ||||||||
| 7,560 | Alphabet, Inc. - Class A* | $ | 10,125,788 | |||||
| 3,736 | Alphabet, Inc. - Class C* | 4,995,107 | ||||||
| 5,500 | Charter Communications, Inc. - Class A* | 2,667,940 | ||||||
| 12,125 | Facebook, Inc. - Class A* | 2,488,656 | ||||||
| 139,849 | Global Eagle Entertainment, Inc.* | 69,925 | ||||||
| 10,200 | MultiChoice Group - ADR* | 83,130 | ||||||
| 19,275 | Netflix, Inc.* | 6,236,812 | ||||||
| 14,350 | Spotify Technology S.A.* | 2,146,043 | ||||||
| 45,725 | Tencent Holdings Ltd. | 2,205,015 | ||||||
| 53,250 | ViacomCBS, Inc. - Class B | 2,234,902 | ||||||
|
| |||||||
| 33,253,318 | ||||||||
|
| |||||||
| Consumer Discretionary: 17.2% | ||||||||
| 33,755 | Alibaba Group Holding Ltd. - ADR* | 7,159,435 | ||||||
| 4,660 | Amazon.com, Inc.* | 8,610,934 | ||||||
| 22,700 | Dollar General Corp. | 3,540,746 | ||||||
| 143,308 | Fiat Chrysler Automobiles N.V. | 2,105,195 | ||||||
| 119,700 | General Motors Co. | 4,381,020 | ||||||
| 48,005 | Hilton Worldwide Holdings, Inc. | 5,324,235 | ||||||
| 37,300 | Lear Corp. | 5,117,560 | ||||||
| 51,200 | Naspers Ltd. - Class N, ADR | 1,667,072 | ||||||
| 50,100 | Nordstrom, Inc. | 2,050,593 | ||||||
| 51,200 | Prosus N.V. - ADR* | 762,885 | ||||||
| 18,825 | Royal Caribbean Cruises Ltd. | 2,513,326 | ||||||
| 34,450 | Thor Industries, Inc. | 2,559,290 | ||||||
| 58,000 | TJX Cos., Inc. (The) | 3,541,480 | ||||||
|
| |||||||
| 49,333,771 | ||||||||
|
| |||||||
| Consumer Staples: 3.5% | ||||||||
| 25,945 | Cal-Maine Foods, Inc. | 1,109,149 | ||||||
| 60,000 | Conagra Brands, Inc. | 2,054,400 | ||||||
| 8,754 | Diageo Plc - ADR | 1,474,348 | ||||||
| 29,400 | Henkel AG & Co. KGaA | 2,772,495 | ||||||
| 30,300 | Monster Beverage Corp.* | 1,925,565 | ||||||
| 4,758 | Sanderson Farms, Inc. | 838,455 | ||||||
|
| |||||||
| 10,174,412 | ||||||||
|
| |||||||
| Energy: 2.6% | ||||||||
| 26,820 | Apache Corp. | 686,324 | ||||||
| 49,700 | Concho Resources, Inc. | 4,352,229 | ||||||
| 131,600 | Parsley Energy, Inc. - Class A | 2,488,556 | ||||||
|
| |||||||
| 7,527,109 | ||||||||
|
| |||||||
| Financials: 20.7% | ||||||||
| 89,200 | Ally Financial, Inc. | 2,725,952 | ||||||
| 45,500 | American International Group, Inc. | 2,335,515 | ||||||
| 77,000 | Bank of America Corp. | 2,711,940 | ||||||
| 49,475 | Bank of New York Mellon Corp. (The) | 2,490,077 | ||||||
| 19 | Berkshire Hathaway, Inc. - Class A* | 6,452,210 | ||||||
| 20,750 | Berkshire Hathaway, Inc. - Class B* | 4,699,875 | ||||||
| 25,000 | Blackstone Group, Inc. (The) - Class A | 1,398,500 | ||||||
| 83,460 | Capital One Financial Corp. | 8,588,868 | ||||||
| 7,338 | Chubb Ltd. | 1,142,233 | ||||||
| 36,300 | Citigroup, Inc. | 2,900,007 | ||||||
| 8,100 | Fairfax Financial Holdings Ltd. | 3,799,791 | ||||||
| 46,800 | HDFC Bank Ltd. - ADR | 2,965,716 | ||||||
| 15,030 | JPMorgan Chase & Co. | 2,095,182 | ||||||
| 19,450 | MetLife, Inc. | 991,366 | ||||||
| 36,250 | Pinnacle Financial Partners, Inc. | 2,320,000 | ||||||
| Shares | Value | |||||||
| Financials (continued) | ||||||||
| 8,513 | Reinsurance Group of America, Inc. | $ | 1,388,130 | |||||
| 16,688 | Travelers Cos., Inc. (The) | 2,285,422 | ||||||
| 48,640 | US Bancorp | 2,883,866 | ||||||
| 93,280 | Wells Fargo & Co. | 5,018,464 | ||||||
|
| |||||||
| 59,193,114 | ||||||||
|
| |||||||
| Health Care: 9.9% | ||||||||
| 20,500 | Alexion Pharmaceuticals, Inc.* | 2,217,075 | ||||||
| 30,000 | Cerner Corp. | 2,201,700 | ||||||
| 10,750 | Edwards Lifesciences Corp.* | 2,507,867 | ||||||
| 40,791 | Envista Holdings Corp.* | 1,209,045 | ||||||
| 6,782 | ICU Medical, Inc.* | 1,269,048 | ||||||
| 7,425 | Illumina, Inc.* | 2,463,170 | ||||||
| 10,970 | Johnson & Johnson | 1,600,194 | ||||||
| 31,823 | Merit Medical Systems, Inc.* | 993,514 | ||||||
| 101,200 | Mylan N.V.* | 2,034,120 | ||||||
| 29,000 | Quest Diagnostics, Inc. | 3,096,910 | ||||||
| 7,850 | Regeneron Pharmaceuticals, Inc.* | 2,947,518 | ||||||
| 37,636 | Smith & Nephew Plc - ADR | 1,809,163 | ||||||
| 13,200 | UnitedHealth Group, Inc. | 3,880,536 | ||||||
|
| |||||||
| 28,229,860 | ||||||||
|
| |||||||
| Industrials: 12.1% | ||||||||
| 11,214 | 3M Co. | 1,978,374 | ||||||
| 65,000 | American Airlines Group, Inc. | 1,864,200 | ||||||
| 68,400 | Arconic, Inc. | 2,104,668 | ||||||
| 21,100 | Carlisle Cos., Inc. | 3,414,824 | ||||||
| 42,955 | CH Robinson Worldwide, Inc. | 3,359,081 | ||||||
| 48,000 | Ferguson Plc | 4,362,849 | ||||||
| 208,000 | General Electric Co. | 2,321,280 | ||||||
| 17,400 | Honeywell International, Inc. | 3,079,800 | ||||||
| 31,500 | Knight-Swift Transportation Holdings, Inc. | 1,128,960 | ||||||
| 10,223 | Lindsay Corp. | 981,305 | ||||||
| 23,400 | ManpowerGroup, Inc. | 2,272,140 | ||||||
| 72,000 | Southwest Airlines Co. | 3,886,560 | ||||||
| 26,480 | United Technologies Corp. | 3,965,645 | ||||||
|
| |||||||
| 34,719,686 | ||||||||
|
| |||||||
| Information Technology: 14.5% | ||||||||
| 12,300 | Accenture Plc - Class A | 2,590,011 | ||||||
| 15,300 | Atlassian Corp. Plc - Class A* | 1,841,202 | ||||||
| 33,500 | Marvell Technology Group Ltd. | 889,760 | ||||||
| 67,100 | NCR Corp.* | 2,359,236 | ||||||
| 8,100 | Palo Alto Networks, Inc.* | 1,873,125 | ||||||
| 18,900 | salesforce.com, Inc.* | 3,073,896 | ||||||
| 18,475 | ServiceNow, Inc.* | 5,215,862 | ||||||
| 87,100 | TE Connectivity Ltd. | 8,347,664 | ||||||
| 55,000 | Visa, Inc. - Class A | 10,334,500 | ||||||
| 16,025 | Workday, Inc. - Class A* | 2,635,311 | ||||||
| 29,400 | Zendesk, Inc.* | 2,252,922 | ||||||
|
| |||||||
| 41,413,489 | ||||||||
|
| |||||||
| Materials: 0.8% | ||||||||
| 35,400 | Agnico Eagle Mines Ltd. | 2,180,994 | ||||||
|
| |||||||
| Real Estate: 1.8% | ||||||||
| 51,900 | CBRE Group, Inc. - Class A* | 3,180,951 | ||||||
| 57,496 | Equity Commonwealth | 1,887,594 | ||||||
|
| |||||||
| 5,068,545 | ||||||||
|
| |||||||
| | TOTAL COMMON STOCKS | 271,094,298 | ||||||
|
| |||||||
The accompanying notes are an integral part of these financial statements.
| Schedule of Investments | 13 | |||||
Table of Contents
Litman Gregory Masters Equity Fund
SCHEDULE OF INVESTMENTS IN SECURITIES at December 31, 2019 (Continued)
| Shares | Value | |||||||
| PREFERRED STOCK: 0.7% | ||||||||
| Information Technology: 0.7% | ||||||||
| 55,000 | Samsung Electronics Co. Ltd. - (Preference Shares) | $ | 2,159,194 | |||||
|
| |||||||
| | TOTAL PREFERRED STOCK | 2,159,194 | ||||||
|
| |||||||
| Principal Amount | ||||||||
| SHORT-TERM INVESTMENTS: 4.4% | ||||||||
| REPURCHASE AGREEMENTS : 4.4% | ||||||||
| $12,612,000 | Fixed Income Clearing Corp. 0.120%, 12/31/2019, due 01/02/2020 [collateral: par value $12,865,000, U.S. Treasury Note, 1.625%, due 12/31/2021, value $12,882,227] (proceeds $12,612,084) | 12,612,000 | ||||||
|
| |||||||
| | TOTAL SHORT-TERM INVESTMENTS | 12,612,000 | ||||||
|
| |||||||
| | TOTAL INVESTMENTS | 285,865,492 | ||||||
|
| |||||||
| Other Assets in Excess of Liabilities: 0.2% | 433,280 | |||||||
|
| |||||||
| NET ASSETS: 100.0% | $ | 286,298,772 | ||||||
|
| |||||||
Percentages are stated as a percent of net assets.
| ADR | American Depositary Receipt |
| * | Non-Income Producing Security. |
The accompanying notes are an integral part of these financial statements.
| 14 | Litman Gregory Funds Trust | |||||
Table of Contents
Litman Gregory Masters International Fund Review
The Litman Gregory Masters International Fund generated a strong 30.45% return in 2019, well ahead of its benchmarks, the MSCI ACWI ex. USA Index and the MSCI EAFE Index, which rose 21.51% and 22.01%, respectively. The fund also beat its average peer (up 21.40%) in the Morningstar Foreign Large Blend Category. The fund’s strong performance was driven in part by the easing of trade tensions. As a result, many cyclical and China-related holdings in the fund that had sold off materially in the second half of 2018 performed well in 2019.
Performance as of 12/31/2019 |
| |||||||||||||||||||||||||||
| Average Annual Total Returns | ||||||||||||||||||||||||||||
| Three Month Return | One- Year | Three- Year | Five- Year | Ten- Year | Fifteen- Year | Since Inception | ||||||||||||||||||||||
Litman Gregory Masters International Fund Institutional Class (12/1/1997) | 10.68% | 30.45% | 8.50% | 2.85% | 4.70% | 5.42% | 7.08% | |||||||||||||||||||||
MSCI ACWI (ex- U.S.) Index | 8.92% | 21.51% | 9.87% | 5.51% | 4.97% | 5.25% | 5.38% | |||||||||||||||||||||
MSCI EAFE Index | 8.17% | 22.01% | 9.56% | 5.67% | 5.50% | 4.84% | 5.02% | |||||||||||||||||||||
Morningstar Foreign Large Blend Category Average | 8.36% | 21.40% | 9.15% | 5.18% | 5.07% | 4.56% | 4.21% | |||||||||||||||||||||
| Performance quoted represents past performance and does not guarantee future results. The investment return and principal value of an investment will fluctuate so that an investor’s shares, when redeemed, may be worth more or less than their original cost. Current performance of the funds may be lower or higher than the performance quoted. To obtain standardized performance of the funds, and performance as of the most recently completed calendar month, please visitwww.mastersfunds.com.As of the prospectus dated 4/30/2019, the gross and net expense ratios were1.33% and1.09%, respectively. There are contractual fee waivers in effect through April 30, 2021. |
| |||||||||||||||||||||||||||
MSCI index returns source: MSCI. Neither MSCI nor any other party involved in or related to compiling, computing, or creating the MSCI data makes any express or implied warranties or representations with respect to such data (or the results to be obtained by the use thereof), and all such parties hereby expressly disclaim all warranties of originality, accuracy, completeness, merchantability, or fitness for a particular purpose with respect to any of such data. Without limiting any of the foregoing, in no event shall MSCI, any of its affiliates, or any third party involved in or related to compiling, computing, or creating the data have any liability for any direct, indirect, special, punitive, consequential, or any other damages (including lost profits) even if notified of the possibility of such damages.Nofurther distribution or dissemination of the MSCI data is permitted without MSCI’s express written consent.Source note: Returns prior to 1999 are the MSCI ACWIex-US GR index. Returns from 1999 onwards are MSCI ACWIex-US NR index.
The fund’s long-term performance remains strong. Since inception, the fund has gained 7.08% and is ahead of the MSCI ACWI ex. USA Index return of 5.38%, the MSCI EAFE Index return of 5.02%, and the Morningstar Foreign Large Blend Category return of 4.21%. This long-term record, in our opinion, is a validation of the Masters Funds concept and our belief that concentration in the right hands can add significant value.
Performance of Managers
In 2019, all fivesub-advisors on the fund outperformed their respective benchmarks. The calendar-year performance of these fivesub-advisors ranged from 24.23% to 42.68% (returns are net of the management fee eachsub-advisor charges the fund). Four of the five managers are ahead of their benchmarks since they became a subadvisor on Litman Gregory Masters International. The fifth subadvisor has been with the fund for less than four years and is behind its primary benchmark by about 75 basis points (bps).
Key Performance Drivers
Below we discuss some of the key drivers of both absolute and relative performance. It is important to understand that the portfolio’s sector and country weightings are a residual of thebottom-up, fundamental stock-picking process employed by eachsub-advisor. That said, we do report on the relative performance contributions from stock selection, as well as sector and region weightings, to help shareholders better understand drivers of performance.
Stock selection was the primary driver of outperformance in 2019, while sector allocation, a residual of subadvsiors’bottom-up stock picking, was a slight headwind to relative performance. Stock picking within communication services, energy, and financial sectors were key areas of outperformance for the year. Regionally, stock selection was particularly strong in the UK and the eurozone.
| Fund Summary | 15 | |||||
Table of Contents
| Top 10 Individual Contributors as of the Year Ended December 31, 2019 | ||||||||||||||||||||
| Company Name | Fund Weight (%) | Benchmark Weight (%) | 12-Month Return (%) | Contribution to Return (%) | Country | Economic Sector | ||||||||||||||
Frontline Ltd. | 2.40 | 0.00 | 134.57 | 2.63 | Bermuda | Energy | ||||||||||||||
Informa PLC | 4.48 | 0.07 | 45.43 | 1.96 | United Kingdom | Communication Services | ||||||||||||||
ASML Holding NV ADR | 1.76 | 0.43 | 76.89 | 1.56 | Netherlands | Information Technology | ||||||||||||||
Teekay Lng Partners LP MLP | 3.46 | 0.00 | 48.46 | 1.39 | Bermuda | Energy | ||||||||||||||
Lloyds Banking Group PLC | 2.98 | 0.25 | 32.59 | 1.22 | United Kingdom | Financials | ||||||||||||||
Israel Discount Bank Ltd. Class A | 2.49 | 0.00 | 52.08 | 1.15 | Israel | Financials | ||||||||||||||
Vivendi SA | 5.27 | 0.14 | 21.45 | 1.12 | France | Communication Services | ||||||||||||||
JD.com Inc. ADR | 1.62 | 0.10 | 41.95 | 1.08 | China | Consumer Discretionary | ||||||||||||||
CNH Industrial NV | 3.43 | 0.06 | 24.75 | 1.05 | Netherlands | Industrials | ||||||||||||||
IWG PLC | 1.16 | 0.00 | 120.65 | 0.99 | Switzerland | Real Estate | ||||||||||||||
Portfolio contribution for a holding represents the product of the average portfolio weight and the total return earned by the holding during the period. Past performance is no guarantee of future results. Fund holdings and/or sector allocations are subject to change at any time and are not recommendations to buy or sell any security.
| Top 10 Individual Detractors as of the Year Ended December 31, 2019 | ||||||||||||||||||||
| Company Name | Fund (%) | Benchmark Weight (%) | 12-Month Return (%) | Contribution to Return (%) | Country | Economic Sector | ||||||||||||||
Trip.com Group Ltd. | 0.33 | 0.07 | -6.18 | -0.16 | China | Consumer Discretionary | ||||||||||||||
B2 Holding ASA | 0.19 | 0.00 | -43.50 | -0.14 | Norway | Financials | ||||||||||||||
Japan Tobacco Inc. | 1.02 | 0.13 | -5.27 | -0.14 | Japan | Consumer Staples | ||||||||||||||
Rolls-Royce Holdings PLC | 0.17 | 0.10 | -8.93 | -0.10 | United Kingdom | Industrials | ||||||||||||||
Borr Drilling Ltd. | 0.20 | 0.00 | -26.08 | -0.09 | Norway | Energy | ||||||||||||||
Incitec Pivot Ltd. | 1.12 | 0.00 | -3.41 | -0.08 | Australia | Materials | ||||||||||||||
Bombardier Inc. B | 0.22 | 0.02 | -17.84 | -0.05 | Canada | Industrials | ||||||||||||||
Nexon Co. ltd. | 1.25 | 0.03 | 3.60 | -0.04 | Japan | Communication Services | ||||||||||||||
Prosus NV Ordinary Shares Class N | 0.11 | 0.05 | -4.27 | -0.03 | Netherlands | Consumer Discretionary | ||||||||||||||
Codere SA | 1.04 | 0.00 | -21.44 | -0.01 | Spain | Consumer Discretionary | ||||||||||||||
Portfolio contribution for a holding represents the product of the average portfolio weight and the total return earned by the holding during the period. Past performance is no guarantee of future results. Fund holdings and/or sector allocations are subject to change at any time and are not recommendations to buy or sell any security.
Informa, owned by Lazard and Pictet, is a global information services group and academic publisher with a sizeable exhibitions business. Its niches in specific industry data, in market-leading journals, and in essential trade exhibitions, are highly defendable, according to Lazard’s Mark Little. He believes the stock has suffered from a historic perception of cyclicality in its exhibitions business as well as its over-levered status around the financial crisis.
Informa is slowly repairing this reputation through its consistent organic delivery, and by the successful execution of its merger with rival UBM. The company is gradually increasing the quality and defensiveness of its businesses and, as a result, Little says it has accelerated its organic growth from a lumpy1-2% to a steadier 3.5%.
Informa is the largest player in the exhibitions market, which benefits from structural growth and has attractive working capital characteristics and business visibility (on average 50% of customers book a year ahead). They have improved the quality of their conferences business and are increasingly focusing on more specialist areas as well as trying to layer in higher value-added analytics products.
In the more challenged publishing space, they operate in a more protected part of the market, and Little thinks the high-quality nature of their brands means this business will continue to grow low single-digits. He says its current valuation of around 14x earnings, with decent cash-flow conversion looks too low relative to its profitability, competitive moat, and steady growth profile. Little says Informa trades well below its industry peers with similar financial profiles, and well below the multiples seen in private transactions in exhibitions, an area where private equity interest is high. ln 2019, the stock was a strong performer on the back of solid results, but it was also among the stocks that rebounded from a very weak end to 2018, when Informa fell on overblown fears over its Chinese exhibition exposure.
| 16 | Litman Gregory Funds Trust | |||||
Table of Contents
Frontline, a stock owned by David Marcus of Evermore, is one of the largest owners and operators of modern crude tanker vessels with a market cap of $2.5 billion. Frontline has one of the youngest, modern fleets among its peers with an average age of 3.8 years. It is controlled by John Fredriksen (44% stake), a proven value creator in the shipping industry. Frontline’s stock was up 134.6% in 2019 due to several factors.
Throughout 2019, the incremental oil demand continued to be strong with the U.S. becoming atop-four global exporter with current exports amounting to over 3 million barrels per day. (In February 2019 the US became a net exporter after over 70 years.) With the U.S. becoming a net long crude exporter, crude tanker operators (especially Frontline) are the beneficiaries of longer ton miles as underscored by the increasing long-haul Atlantic basin exports. In addition, the new International Maritime Organisation (IMO) 2020 sulphur cap regulation (that went into effect in January 2020) will lead to longer trade routes, require additional crude runs and increase floating storage demand as refineries demand specific grades of fuel to refine into low-sulphur compliant fuel. This should also benefit Frontline.
Finally, scrapping of older vessels accelerated during the year, with the current run rate on track to reaching one of the highest levels in the last 20 years. The new IMO 2020 regulation has put increased pressure on older vessel operators, especially those with fleets older than 15 years old. (The regulations are aimed at curbing pollution caused by ships.) Marcus believes there will be additional scrapping of these older vessels, which will continue to reduce capacity further. In 2019, day/spot rates or pricing for shipping improved considerably from about $30,000 per day to $100,000. Marcus says the rise in spot rates reflects a fundamentally tighter tanker market driven by 1) widening spread between low and high sulphur fuels; 2) shortage of compliant fuels; 3) longer delays to retrofit scrubbers; and 4) order book at the lowest since 1996 with a growing scrapping pool of older tonnage. In summary, the recent movement in tankers rates provide affirmation on the tight supply and growing underlying freight demand.
While Frontline’s share price has performed well in 2019, Marcus sees significant additional upside from current levels. While the spot rates have improved, current asset values do not commensurately capture the improvement in underlying rates. Marcus believes the market has yet to fully appreciate the cash-flow generation potential that tanker companies offer. This is especially true in the case of Frontline, which has one of the lowestall-in cash breakeven levels among its peers (around $20,000), implying strong cash-flow generation at current spot rates.
Moscow Exchange, a Pictet stock, is the leading securities exchange in Russia. The company possesses all the attractive characteristics Pictet likes to see in its purchases: high recurrent revenues, a limited capital requirement, and high margins that lead to a high rate of cash conversion, attractive returns on capital, and substantial cash distributions to shareholders.
Moscow Exchange differs from its European peers in several compelling ways: (1) its market is relatively immature, which creates the opportunity for significant growth through the expansion of its product range; (2) it has a vertically integrated business model—trading and post-trade services—that both generates higher and steadier revenues raising the barrier to new entrants; (3) its customer base is highly diversified; and (4) it holds a near monopoly on trading in virtually all asset classes in Russia. Another characteristic of Moscow Exchange profitability has been a relatively high component of interest income on the customer cash (margin) balances. The stock was purchased in the third quarter of 2018 when sentiment towards Russian stocks was poor, resulting in part due to US sanctions on Russia.
Through 2019, growth in fee and commission income progressed at a healthy level. Pictet continues to believe that the low level of maturity of Russian capital markets should ensure the continuation of this upward trajectory. At the same time, and despite the reduction in local currency rates, net interest income (NII) revenue for the company has stabilized. This is largely due to a growth in client base (i.e. higher balances earning interest in all currencies) and is a development that shifts the balance of NII risk to the upside should hard currency rates begin to rise back to more ‘normal’ levels. One benefit of lower rates is that they are also reflected in Russia being accorded a lower risk premium. This latter effect helped drive Moscow Exchange’s (and the broad Russian market’s) strong performance in the second half of 2019. Moscow Exchange continues to trade at a significant discount to Pictet’s assessment of its intrinsic value.
Among the detractors, Trip.com, Chinese online travel agent and a Pictet holding, saw its stock price decline over 6% for the year in part due to US/China trade tensions and then Hong Kong political protests and civil unrest, which has meant that visitation to the region has almost dried up from mainland China, an effect Pictet estimates lowered Trip.com’s consolidated sales by close to 10%. However, despite revenues and RevPAR (revenues per available room) running on the light side versus Pictet’s expectations, the business has shown much higher than expected operating leverage, which is seen in a more positive progression in the bottom line.Pictet believes this is just the beginning of a profitability improvement for Trip.com that stems from an improved competitive environment and the company’s 60% market share—both generate significant network advantages in terms of number of listings and improving customer acquisition/stickiness.
From a valuation perspective the stock trades on amid-20s earnings multiple (and a lower free cash flow multiple given that the business operates with substantial negative working capital) and is achieving mid to high teens margins. Pictet estimates normalized operating margins (given a largely fixed cost structure) will be in themid-20s percentage and don’t believe this improvement in margins is factored in current valuations. As a result, Pictet has been adding to Trip.com in recent months during periods of weakness and remain holders.
| Fund Summary | 17 | |||||
Table of Contents
Another top detractor wasRolls Royce, held in David Herro’s sleeve. Its strong market position provides him visibility into earnings and free cash flow growth.Herro saysCEO Warren East’s overhaul of a weak management team, efforts to improve accountability and incentives to emphasize cash flow are all part of the restructuring that’s designed to increase efficiency and cost competitiveness.
Rolls Royce stock was down less than 10% in 2019, underperforming a strong market. Investors were disappointed with the company’s first-half earnings report that showed free cash flow was off to a sluggish start in 2019. In the third quarter, Rolls-Royce stated that full-year free cash flow and earnings would be at the low end of the previously issued guidance range, which weighed on its share price. Shortly after, the U.S. Navy awarded Rolls-Royce a $1.21 billion contract to provide maintenance, repair and other services for theV-22 AE1107C aircraft engine.
Herro and team believe Rolls-Royce’s civil aerospace business is positioning the company for future success. The development of wide-body aircraft engines with improved fuel efficiency resulted in a loss-making phase, including a material erosion of cash profits for the company in recent years. Herro and team believe Rolls-Royce is emerging from this period of major restructuring, and the company now holds strong market shares in the production of a number of wide-body engines with large order books and robust aftermarket business.
Portfolio Mix
Please see below for sector, regional, andmarket-cap allocations as ofyear-end.
The International Fund is built stock by stock from thebottom-up and can at times look very different from its benchmark. As we have stated in earlier reports, we believe this is key to generating excess long-term returns. If we aren’t willing to look much different than the benchmark, we shouldn’t expect to achieve returns much different from the benchmark.
Over the last 12 months, the overall portfolio mix changed modestly. Noteworthy items include the following:
| • | The fund’s weighting to the consumer discretionary sector decreased by six percentage points. This was the largest shift in sector allocation over the past 12 months. The fund is now slightly underweight this sector versus its primary benchmark (10.4% vs 11.6%). |
| • | Correspondingly, the fund saw its weighting to industrials and communication services increase by 4.6 and 2.3 percentage points, respectively. At the end of 2019, the fund had a 17.7% weighting to communication services, making it the fund’s largest overweighting, with the benchmark at 6.5%. Several of the holdings in this sector, such as Informa (discussed above), Vivendi, and Modern times are trading at attractive valuations. |
| • | The fund’s second largest overweighting is to industrials (22.6% versus 11.8%). The fund’s sector exposures reflect wheresub-advisors are finding attractive valuations in relation to the underlying fundamentals. As stable or “quality” and high-growing areas of the market have performed strongly over the past few years, the fund’s subadvisors are finding more value in the cyclical areas of the market. |
| • | The financial sector (17.5%) is the third largest sector weighting in the fund. The fund is underweight this sector versus the benchmark, which has a weighting to 20.6% to financials. |
| • | The fund’s weighting in the energy sector has gradually increased over the year from 4.8% to 7.7%. The fund is only slightly overweight this sector, with benchmark weighting at 6.1%. Frontline, discussed above, falls in this sector. |
| • | Regional and major-country allocations did not change significantly year-over-year. The fund remains significantly overweight to European companies (66.6% compared to 42.0% in the MSCI ACWI ex USA index). With European stocks trading at decades low valuations versus U.S. stocks on normalized earnings, the fund’s subadvisors continue to find Europe extremely attractive. |
| • | The fund is underweight Japan (9.4% versus 16.1%). |
| • | Atyear-end, the fund had a 10.2% weighting to emerging-markets stocks (compared with the benchmark weighting of 18.8%) This is higher than the 5.7% in the fund one year ago. |
| • | Themarket-cap exposure changed year-over-year. The fund’s allocation to large-caps(market-cap greater than $15 billion) decreased by about seven percentage points, whilesmall-cap exposure ($5.5 billion or less) increased by about eight percentage points.Mid-cap stocks(market-cap between $5.5 billion and $15 billion) comprised 22.6% of the fund assets. At the end of 2019, the fund had over 50% allocated to stocks below $15 billion market cap. We believe this is an area that remains relatively inefficient and where we believe the fundsub-advisors have added and can add value. |
| • | A modest amount of the fund’s currency exposure was being hedged at the end of the year. 3.5% of the fund’s exposure to the euro, 3.6% of Swiss Franc, and 16.8% of its exposure to the British Pound was hedged at year end. |
| 18 | Litman Gregory Funds Trust | |||||
Table of Contents
By Sector
| Sector Allocation | ||||||||||||
| Fund as of 12/31/19 | Fund as of 12/31/18 | iShares MSCI ACWI ex-U.S. as of 12/31/19 | ||||||||||
Commuinication Services | 17.7% | 15.5% | 6.5% | |||||||||
Consumer Discretionary | 10.4% | 16.4% | 11.6% | |||||||||
Consumer Staples | 6.2% | 8.2% | 9.1% | |||||||||
Energy | 7.7% | 4.8% | 6.1% | |||||||||
Finance | 17.5% | 20.7% | 20.6% | |||||||||
Health Care & Pharmaceuticals | 1.6% | 3.1% | 8.7% | |||||||||
Industrials | 22.6% | 17.9% | 11.8% | |||||||||
Information Technology | 5.3% | 3.6% | 9.0% | |||||||||
Materials | 6.6% | 5.9% | 7.2% | |||||||||
Real Estate | 1.3% | 1.3% | 3.3% | |||||||||
Utilities | 0.0% | 0.0% | 3.3% | |||||||||
Cash Equivalents & Other | 3.1% | 2.6% | 2.8% | |||||||||
|
|
|
|
|
| |||||||
| 100.0% | 100.0% | 100.0% | ||||||||||
|
|
|
|
|
| |||||||
By Region
| Regional Allocation | ||||||||||||
| Fund as of 12/31/19 | Fund as of 12/31/18 | iShares MSCI ACWI ex-U.S. as of 12/31/19 | ||||||||||
Africa | 1.0% | 1.3% | 1.3% | |||||||||
Australia/New Zealand | 1.0% | 0.7% | 4.6% | |||||||||
Asia (ex Japan) | 12.6% | 12.2% | 21.1% | |||||||||
Japan | 9.4% | 8.3% | 16.1% | |||||||||
Western Europe & UK | 66.6% | 67.8% | 42.0% | |||||||||
Latin America | 1.3% | 0.9% | 3.1% | |||||||||
North America | 2.7% | 4.0% | 7.5% | |||||||||
Middle East | 2.2% | 2.1% | 1.4% | |||||||||
Cash Equivalents & Other | 3.1% | 2.6% | 2.9% | |||||||||
|
|
|
|
|
| |||||||
| 100.0% | 100.0% | 100.0% | ||||||||||
|
|
|
|
|
| |||||||
Fund holdings and/or sector allocations are subject to change at any time and are not recommendations to buy or sell any security.
By Asset Class Fund as of 12/31/19 | By Market Capitalization Fund as of 12/31/19 | |
Market Capitalization: Developed MarketsSmall-Cap < $5.5 billion Developed Markets Large andMid-Cap > $5.5 billion
* Totals may not add up to 100% due to rounding |
Market Capitalization: Small-Cap < $5.5 billion Mid-Cap $5.5 billion - $15 billion Large-Cap > $15 billion | |
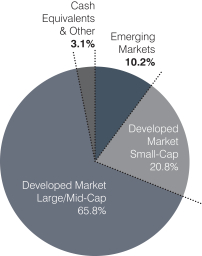
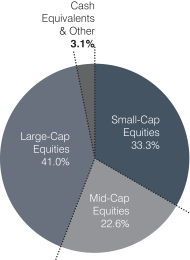
| Fund Summary | 19 | |||||
Table of Contents
Taxes
MSILX entered 2019 with a $43 million perpetual loss carryforward. For the year, the fund realized $3 million in capital gains, all of which have been sheltered by the carryforward and leaving the fund with approximately $40 million of unused losses to carryforward into the future
Closing Thoughts
The unprecedented monetary policies across the world has resulted in significant divergence between quality/growth and value-oriented/cyclical segments of the markets. Litman Gregory Masters International subadvisors for the past few years have been gravitating towards the more attractively valued cyclical segments of the market. This benefited the fund in 2019 as trade tensions eased and prospects of a global economic recovery improved.
Mark Little of Lazard notes expansive monetary policy has pushed valuations of structural growth and higher-profitability companies (which he calls compounders) to a level where they are now generally unattractive. His challenge is to find great businesses that have not yet been discovered andre-rated to high valuations, and/or cheap stocks that are temporarily (but not structurally) depressed. The Pictet team shares this view and notes that the impact of very low rates has meant a flight to quality and “long duration” businesses, inflating their valuations. They say many business models they have traditionally liked and would want to own do not meet their absolute return criteria of 5% to 10% steady-state cash-flow yield.
David Marcus of Evermore Global continues to believe Europe is exceptionally attractive and is finding many special-situations and ideas there. David Herro of Harris Associates believes European financials are extremely attractive given their relatively strong operating performance (despite zero to negative interest rates), sustainablemid- to high-single digit dividend yields in an environment where sovereign bonds are yielding zero or worse, and their much enhanced capital position or safety profile compared to a decade ago.
So, our managers continue to find ideas that meet their investment criteria and offer good risk-reward. We remain optimistic about the fund’s prospects because we are invested with skilled, proven stock pickers who continue to adhere to their investment discipline in what remains an unprecedented and an extremely challenging macro and geopolitical environment.
We thank shareholders for their trust and will continue to work hard to earn it.
Earnings growth for a fund holding does not guarantee a corresponding increase in the market value of the holding or the fund.
| 20 | Litman Gregory Funds Trust | |||||
Table of Contents
Litman Gregory Masters International Fund Managers
| INVESTMENT MANAGER | FIRM | TARGET MANAGER ALLOCATION | MARKET CAPITALIZATION OF COMPANIES IN PORTFOLIO | STOCK-PICKING STYLE | BENCHMARK | |||||
| David Marcus | Evermore Global Advisors | 20.00% | All Sizes | Value | MSCI World ex U.S. Value Index | |||||
| David Herro | Harris Associates L.P. | 20.00% | All sizes, but mostly large- andmid-sized companies | Value | MSCI World ex U.S. Value Index | |||||
| Mark Little | Lazard Asset Management, LLC | 20.00% | All sizes | Blend/Relative Value | MSCI All Countries World Free ex U.S. Index | |||||
Fabio Paolini Benjamin Beneche | Pictet Asset Management, Ltd. | 20.00% | All sizes | Blend | MSCI EAFE Index | |||||
| Vinson Walden | Thornburg Investment Management, Inc. | 20.00% | All sizes | Eclectic, may invest in traditional value stocks or growth stocks | MSCI All Countries World Free ex U.S. Index |
International Fund Value of Hypothetical $10,000
The value of a hypothetical $10,000 investment in the Litman Gregory Masters International Fund from December 1, 1997 to December 31, 2019 compared with the MSCI ACWIex-U.S. Index and Morningstar Foreign Large Blend Category.
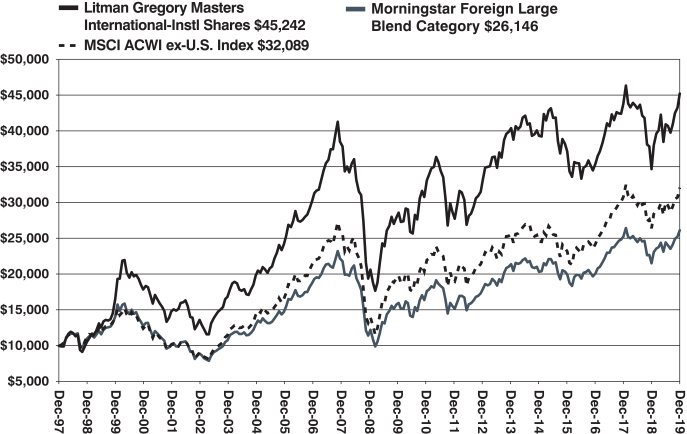
The hypothetical $10,000 investment at fund inception includes changes due to share price and reinvestment of dividends and capital gains. The chart does not imply future performance. Indexes are unmanaged, do not incur fees, expenses or taxes, and cannot be invested in directly.
| Fund Summary | 21 | |||||
Table of Contents
Litman Gregory Masters International Fund
SCHEDULE OF INVESTMENTS IN SECURITIES at December 31, 2019
| Shares | Value | |||||||
| COMMON STOCKS: 96.9% | ||||||||
| Australia: 1.0% | ||||||||
| 1,846,275 | Incitec Pivot Ltd. | $ | 4,127,422 | |||||
|
| |||||||
| Austria: 1.1% | ||||||||
| 190,300 | S&T AG | 4,546,263 | ||||||
|
| |||||||
| Belgium: 1.6% | ||||||||
| 293,762 | Fagron | 6,374,874 | ||||||
|
| |||||||
| Bermuda: 7.2% | ||||||||
| 1,101,285 | Frontline Ltd. | 14,162,525 | ||||||
| 955,581 | Teekay LNG Partners L.P. | 14,868,840 | ||||||
|
| |||||||
| 29,031,365 | ||||||||
|
| |||||||
| Canada: 1.8% | ||||||||
| 670,600 | Bombardier, Inc. - Class B* | 998,271 | ||||||
| 239,800 | CAE, Inc. | 6,358,908 | ||||||
|
| |||||||
| 7,357,179 | ||||||||
|
| |||||||
| Cayman Islands: 3.9% | ||||||||
| 129,400 | GDS Holdings Ltd. - ADR* | 6,674,452 | ||||||
| 261,787 | Trip.com Group Ltd. - ADR* | 8,780,336 | ||||||
|
| |||||||
| 15,454,788 | ||||||||
|
| |||||||
| Denmark: 1.0% | ||||||||
| 27,185 | Carlsberg A/S - Class B | 4,058,962 | ||||||
|
| |||||||
| Finland: 2.0% | ||||||||
| 181,856 | Sampo Oyj - Class A | 7,943,887 | ||||||
|
| |||||||
| France: 12.2% | ||||||||
| 100,100 | BNP Paribas S.A. | 5,936,888 | ||||||
| 10,354 | Bollore S.A.* | 44,101 | ||||||
| 1,780,983 | Bollore S.A. | 7,777,742 | ||||||
| 286,106 | Elis S.A. | 5,942,140 | ||||||
| 49,239 | Safran S.A. | 7,609,035 | ||||||
| 747,185 | Vivendi S.A. | 21,658,509 | ||||||
|
| |||||||
| 48,968,415 | ||||||||
|
| |||||||
| Germany: 4.4% | ||||||||
| 17,855 | Allianz SE | 4,377,808 | ||||||
| 140,672 | AURELIUS Equity Opportunities SE & Co. KGaA | 6,159,088 | ||||||
| 127,350 | Daimler AG | 7,058,400 | ||||||
|
| |||||||
| 17,595,296 | ||||||||
|
| |||||||
| Hong Kong: 6.3% | ||||||||
| 713,000 | CK Hutchison Holdings Ltd. | 6,801,592 | ||||||
| 4,720,537 | MGM China Holdings Ltd. | 7,709,225 | ||||||
| 3,699,000 | New World Development Co. Ltd. | 5,072,100 | ||||||
| 2,284,592 | Wynn Macau Ltd. | 5,631,734 | ||||||
|
| |||||||
| 25,214,651 | ||||||||
|
| |||||||
| Ireland: 1.1% | ||||||||
| 52,200 | Ryanair Holdings Plc - ADR* | 4,573,242 | ||||||
|
| |||||||
| Israel: 2.2% | ||||||||
| 1,943,224 | Israel Discount Bank Ltd. - Class A | 9,012,070 | ||||||
|
| |||||||
| Japan: 9.4% | ||||||||
| 178,200 | Asahi Group Holdings Ltd. | 8,171,634 | ||||||
| 114,500 | Cocokara fine, Inc. | 6,680,440 | ||||||
| 47,300 | Hoshizaki Corp. | 4,239,654 | ||||||
| 574,648 | Nexon Co. Ltd.* | 7,667,967 | ||||||
| 9,500 | Nintendo Co. Ltd. | 3,844,062 | ||||||
| Shares | Value | |||||||
| Japan (continued) | ||||||||
| 39,700 | Toyota Motor Corp. | $ | 2,818,256 | |||||
| 126,934 | Universal Entertainment Corp. | 4,339,574 | ||||||
|
| |||||||
| 37,761,587 | ||||||||
|
| |||||||
| Mexico: 1.3% | ||||||||
| 444,546 | Grupo Televisa SAB - ADR | 5,214,525 | ||||||
|
| |||||||
| Monaco: 1.2% | ||||||||
| 693,643 | Scorpio Bulkers, Inc. | 4,418,506 | ||||||
| 9,935 | Scorpio Tankers, Inc. | 390,843 | ||||||
|
| |||||||
| 4,809,349 | ||||||||
|
| |||||||
| Netherlands: 8.6% | ||||||||
| 1,060,455 | CNH Industrial N.V. | 11,655,183 | ||||||
| 102,531 | EXOR N.V. | 7,951,548 | ||||||
| 708,090 | OCI N.V.* | 14,905,066 | ||||||
|
| |||||||
| 34,511,797 | ||||||||
|
| |||||||
| Norway: 0.4% | ||||||||
| 64,000 | Borr Drilling Ltd.* | 579,200 | ||||||
| 126,418 | Borr Drilling Ltd.* | 1,090,395 | ||||||
|
| |||||||
| 1,669,595 | ||||||||
|
| |||||||
| Russia: 1.6% | ||||||||
| 3,662,490 | Moscow ExchangeMICEX-RTS PJSC | 6,347,815 | ||||||
|
| |||||||
| South Africa: 1.0% | ||||||||
| 24,420 | Naspers Ltd. - Class N | 4,002,224 | ||||||
|
| |||||||
| South Korea: 2.5% | ||||||||
| 19,255 | NAVER Corp.* | 3,105,243 | ||||||
| 85,000 | SK Hynix, Inc.* | 6,916,425 | ||||||
|
| |||||||
| 10,021,668 | ||||||||
|
| |||||||
| Spain: 0.7% | ||||||||
| 1,023,255 | Codere S.A.(a)* | 2,779,991 | ||||||
|
| |||||||
| Sweden: 3.4% | ||||||||
| 666,959 | Modern Times Group MTG AB - Class B* | 7,969,218 | ||||||
| 174,900 | Nordic Entertainment Group AB - Class B | 5,667,657 | ||||||
|
| |||||||
| 13,636,875 | ||||||||
|
| |||||||
| Switzerland: 7.9% | ||||||||
| 32,370 | Cie Financiere Richemont S.A. | 2,543,321 | ||||||
| 469,633 | Credit Suisse Group AG | 6,357,668 | ||||||
| 2,414,800 | Glencore Plc | 7,541,083 | ||||||
| 1,504,555 | IWG Plc | 8,694,300 | ||||||
| 125,270 | Julius Baer Group Ltd. | 6,461,165 | ||||||
|
| |||||||
| 31,597,537 | ||||||||
|
| |||||||
| United Kingdom: 12.2% | ||||||||
| 122,471 | Coca-Cola European Partners Plc | 6,139,018 | ||||||
| 472,958 | easyJet Plc | 8,939,709 | ||||||
| 1,677,888 | Informa Plc | 19,080,166 | ||||||
| 11,475,350 | Lloyds Banking Group Plc | 9,516,655 | ||||||
| 563,400 | Rolls-Royce Holdings Plc | 5,107,438 | ||||||
|
| |||||||
| 48,782,986 | ||||||||
|
| |||||||
| United States: 0.9% | ||||||||
| 333,287 | Genco Shipping & Trading Ltd. | 3,539,508 | ||||||
|
| |||||||
| | TOTAL COMMON STOCKS | 388,933,871 | ||||||
|
| |||||||
The accompanying notes are an integral part of these financial statements.
| 22 | Litman Gregory Funds Trust | |||||
Table of Contents
Litman Gregory Masters International Fund
SCHEDULE OF INVESTMENTS IN SECURITIES at December 31, 2019 (Continued)
| Principal Amount | Value | |||||||
| SHORT-TERM INVESTMENTS: 3.1% | ||||||||
| REPURCHASE AGREEMENTS : 3.1% | ||||||||
| $12,670,000 | Fixed Income Clearing Corp. 0.120%, 12/31/2019, due 01/02/2020 [collateral: par value $12,915,000, U.S. Treasury Note, 1.625%, due 12/31/2021, value 12,932,294] (proceeds $12,670,084) | $ | 12,670,000 | |||||
|
| |||||||
| | TOTAL SHORT-TERM INVESTMENTS | 12,670,000 | ||||||
|
| |||||||
| | TOTAL INVESTMENTS | 401,603,871 | ||||||
|
| |||||||
| Liabilities in Excess of Other Assets: (0.0)% | (133,336 | ) | ||||||
|
| |||||||
| NET ASSETS: 100.0% | $ | 401,470,535 | ||||||
|
| |||||||
Percentages are stated as a percent of net assets.
| ADR | American Depositary Receipt |
| PJSC | Public Joint-Stock Company |
| * | Non-Income Producing Security. |
| (a) | Security is valued using significant unobservable inputs in good faith in accordance with procedures approved by the Board of Trustees. |
CURRENCY ABBREVIATIONS:
| CHF | Swiss Franc |
| EUR | Euro |
| GBP | British Pound |
| USD | U.S. Dollar |
The accompanying notes are an integral part of these financial statements.
| Schedule of Investments | 23 | |||||
Table of Contents
Litman Gregory Masters International Fund
SCHEDULE OF FORWARD FOREIGN CURRENCY EXCHANGE CONTRACTS at December 31, 2019
At December 31, 2019, the Fund had the following forward foreign currency exchange contracts:
| Asset Derivatives | Liability Derivatives | |||||||||||||||||||||||
| Counterparty | Settlement Date | Fund Receiving | U.S. $ Value at December 31, 2019 | Fund Delivering | U.S. $ Value at December 31, 2019 | Unrealized Appreciation | Unrealized Depreciation | |||||||||||||||||
State Street Bank and Trust Company | 1/10/2020 | USD | $ | 8,412,049 | GBP | $ | 9,118,261 | $ | — | $ | (706,212 | ) | ||||||||||||
| 2/18/2020 | USD | 4,511,887 | EUR | 4,589,102 | — | (77,215 | ) | |||||||||||||||||
| 6/17/2020 | USD | 855,968 | CHF | 869,383 | — | (13,415 | ) | |||||||||||||||||
|
|
|
|
|
|
|
|
| ||||||||||||||||
| $ | 13,779,904 | $ | 14,576,746 | $ | — | $ | (796,842 | ) | ||||||||||||||||
|
|
|
|
|
|
|
|
| ||||||||||||||||
The accompanying notes are an integral part of these financial statements.
| 24 | Litman Gregory Funds Trust | |||||
Table of Contents
Litman Gregory Masters Smaller Companies Fund Review
Litman Gregory Masters Smaller Companies Fund gained 23.72% in 2019. Despite the strong absolute return, the fund trailed the 25.52% return for the Fund’s Russell 2000 Index benchmark. The fund did, however, outperform the 23.33% gain for the Morningstar Small Blend category.
Performance as of 12/31/2019 |
| |||||||||||||||||||||||||||
| Average Annual Total Returns | ||||||||||||||||||||||||||||
| Three Month | One- Year | Three- Year | Five- Year | Ten- Year | Fifteen- Year | Since Inception | ||||||||||||||||||||||
Litman Gregory Masters Smaller Companies Fund (6/30/03) | 6.28% | 23.72% | 8.21% | 5.49% | 9.58% | 6.11% | 7.91% | |||||||||||||||||||||
Russell 2000 Index | 9.94% | 25.52% | 8.59% | 8.23% | 11.83% | 7.92% | 9.74% | |||||||||||||||||||||
Morningstar Small Blend Category | 7.98% | 23.33% | 6.59% | 6.67% | 10.59% | 7.11% | 8.99% | |||||||||||||||||||||
| Performance quoted represents past performance and does not guarantee future results. The investment return and principal value of an investment will fluctuate so that an investor’s shares, when redeemed, may be worth more or less than their original cost. Current performance of the funds may be lower or higher than the performance quoted. To obtain standardized performance of the funds, and performance as of the most recently completed calendar month, please visitwww.mastersfunds.com.As of the prospectus dated 4/30/2019, the gross and net expense ratios for the Smaller Companies Fund were1.80% and1.38%, respectively. There are contractual fee waivers in effect through April 30, 2021. |
| |||||||||||||||||||||||||||
Performance of Managers
It was a strong year for domestic equities of all sizes, andsmall-cap stocks, as measured by the Russell 2000 Index were up 25.52%. Two of the fund’s threesub-advisors convincingly outperformed their respective benchmark, while the thirdsub-advisor lagged meaningfully. The fund’s two value-oriented managers Jeff Bronchick of Cove Street Capital and Mark Dickherber and Shaun Nicholson of Segall Bryant & Hamill (SBH) returned 28.63% and 33.49%, respectively in the12-month period. Dick Weiss of Wells Capital, who has a blend/growth approach gained 12.70% but lagged his Russell 2000 benchmark. (All returns are net of advisory fees.)
Taking a longer-term view, Weiss, who has been on this fund since its June 2003 inception, is outperforming the Russell 2000 by a margin of 1.40%, annualized. Bronchick is modestly ahead of his Russell 2000 value benchmark over his 12.5 years on the fund. The fund’s newest manager, SBH, has been on the fund for roughly two and a half years. Over that brief period, the team has decisively outperformed their Russell 2000 Value benchmark with a 14.21% average annual gain versus 5.52% for the index.
Key Performance Drivers
The Fund’s relative performance during the year was helped by security selection but that was more than offset by sector allocation. As is always the case, at the stock level there were noteworthy contributors and detractors in the period. We should remind investors that in the short term, the performance of a stock does not determine whether a position will be successful or not; that is only known when the stock is sold.
From a sector perspective, industrials, consumer staples and materials were the largest contributors, while consumer discretionary, health care, and communication services were the largest detractors. Within industrials, stock selection was particularly strong, while sector exposure had a negligible effect. One of best performing industrial holdings in the period was Gardner Denver Holdings, held by Dick Weiss. A key catalyst during the year was the announcement of the merger between Gardner and the industrial division of Ingersoll Rand. The deal creates the second largest global manufacturer of industrial pumps/compressors. Weiss believes Gardner can unlock significant value in Ingersoll’s compressor business, which trails Gardner’s margins by500-600 basis points (bps), while also diluting the firm’s energy business, which Weiss feels could improve the firm’s valuation. Concurrent with the transaction announcement, first-quarter results from Gardner were solidly above expectations, and the company posted several strong quarters throughout the year. Weiss continues to believe that the synergies from the merger are conservative as approximately half of what management is classifying as synergies could be achieved without combining the businesses. He has trimmed the position.
The Fund’s consumer staples exposures (8% of assets), is made up of two stocks. Both are owned by SBH. Hain Celestial Group, a food and personal care products company, saw its stock rise 55.86% in the12-month period. The stock is the largest holding in the SBH sleeve (17.7% of their assets) and was a top contributor to performance. Theco-managers at SBH bought the stock in November 2018 and have maintained their position with the expectation for continued positive transformation of the company through its divestitures, mergers & acquisitions (M&A) and significant return on invested capital (ROIC) improvement.
In the materials sector, stock selection was solid. A big contributor there was Innophos Holdings, held by SBH. The thesis for owning the stock was due to management taking an aggressive plan to eliminate commodity lines of business and redeploy capital into much higher margin areas where they could integrate their core product portfolio. However, management began a process of putting the company up for sale around the middle of 2019 and when the market sensed an acquisition might be likely the stock traded up to
| Fund Summary | 25 | |||||
Table of Contents
as high as $35 before announcing a takeout at $32 per share. SBH expects the deal to close in the first quarter of 2020. The team was disappointed in the takeout price.
Health care was a net detractor due to stock selection. One of the culprits was Orthofix, owned by SBH. The combination of quarterly results missing expectations and an uncertain CEO transition until late summer caused the stock to underperform. Orthofix has low embedded expectations priced in despite continued above cost of capital returns and the potential for above market growth for the next several years, in addition to a balance sheet that theco-managers feel is very underutilized. SBH met the current CEO before he took the reins, and have spoken with him a couple times since he became CEO. He brings with him a talent pool from decades of experience that is already being deployed internally, surgeon and sales contacts to help with added outside relationships, along with a charisma that instills confidence that the direction forthcoming will be measured and appropriate for the inside and outside followers. The previous CEO likely overstayed his welcome, so to speak, by about one year which Dickherber and Nicholson didn’t recognize fully. They have continued accumulating shares on the weakness post the third quarter reported results and see significant value creation opportunities with strong prospects for growth with above cost of capital returns.
Within communication services, Millicom International Cellular underperformed this year. Bronchick says the decline in the stock price was prompted by the last act of a truly dysfunctional Swedish investment group—Kinnevik—that owns 37% of the stock. After milking Millicom for cash flow to fund new investment schemes, then trying to put it up for sale to Liberty Latin America without the backing of the rest of the Board or management, Kinnevik is now distributing the stock to its shareholders. MIllicom is a collection of Latin American cable and mobile assets run with relatively modest leverage by anex-Liberty CEO in whom Bronchick has great confidence. The CEO has personally invested millions through open market purchase, something the Cove Street team would really like to see a lot more of from other CEOs. The stock is statistically and thematically dirt cheap, according to Bronchick. The main risk is the risk associated with investing in any emerging market countries.
One of the single largest detractors this year was Qurate Retail. The company owns QVC, HSN, and Zulily among other brands, and underperformed for the year largely due to downward earnings estimate revisions. Weiss says that after speaking with the company following the fourth quarter earnings miss, he developed a thesis that the issues could be easily remedied. Weiss added to the position believing the stock over-reacted, and he saw several ways to win as an equity holder by virtue of the free cash flow generation (debt paydown and buybacks). However, the subsequent earnings announcement proved that several elements of his thesis were broken, and he exited the position.
Within information technology, ViaSat was a winner gaining nearly 25% in the period.Viasatis a provider of satellite communications and defense encryption services. The stock is owned by Bronchick and he says the market has increasingly appreciated the success of the company’s new second-generation satellite(ViaSat-2) in capturing revenue across terrestrial broadband, commercial airlines and defense services. Continued market penetration by the company into airborne services for the military and government are providing excellent high margin growth to the government segment and generating additional request for proposal (RFP) wins for future deployments. Bronchick continues to see this as a long-term compounder driven by technological moats that its competitors cannot surmount in the short or medium-term as well as the company’s continued buildout of a global Ka-band satellite constellation.
| Top 10 Individual Contributors as of the Year Ended December 31, 2019 | ||||||||||||||||||
| Company Name | Fund Weight (%) | Benchmark Weight (%) | 12-Month Return (%) | Contribution to Return (%) | Economic Sector | |||||||||||||
The Hain Celestial Group Inc | 4.44 | 0.00 | 63.65 | 2.57 | Consumer Staples | |||||||||||||
Avid Technology Inc. | 1.40 | 0.01 | 28.00 | 2.50 | Information Technology | |||||||||||||
Viasat Inc. | 4.07 | 0.13 | 24.16 | 2.28 | Information Technology | |||||||||||||
Innophos Holdings Inc. | 5.04 | 0.03 | 36.88 | 2.22 | Materials | |||||||||||||
MAM Software Group Inc. | 2.98 | 0.00 | 52.28 | 2.14 | Information Technology | |||||||||||||
Compass Minerals International Inc. | 4.14 | 0.09 | 54.43 | 2.11 | Materials | |||||||||||||
NCR Corp. | 3.06 | 0.00 | 52.34 | 1.50 | Information Technology | |||||||||||||
Gardner Denver Holdings Inc. | 1.62 | 0.00 | 79.36 | 1.21 | Industrials | |||||||||||||
Axon Enterprise Inc. | 1.77 | 0.18 | 67.50 | 1.19 | Industrials | |||||||||||||
Great Lakes Dredge + Dock Co. | 0.87 | 0.03 | 61.93 | 1.12 | Industrials | |||||||||||||
Portfolio contribution for a holding represents the product of the average portfolio weight and the total return earned by the holding during the period. Past performance is no guarantee of future results. Fund holdings and/or sector allocations are subject to change at any time and are not recommendations to buy or sell any security.
| 26 | Litman Gregory Funds Trust | |||||
Table of Contents
| Top 10 Individual Detractors as of the Year Ended December 31, 2019 | ||||||||||||||||||
| Company Name | Fund Weight (%) | Benchmark Weight (%) | 12-Month Return (%) | Contribution to Return (%) | Economic Sector | |||||||||||||
Millicom International Cellular SA | 3.63 | 0.00 | -20.21 | -0.92 | Communication Services | |||||||||||||
American Eagle Outfitters Inc. | 0.94 | 0.15 | -16.03 | -0.35 | Consumer Discretionary | |||||||||||||
Groupon Inc. | 1.65 | 0.07 | -25.31 | -0.53 | Consumer Discretionary | |||||||||||||
Qurate Retail Inc. | 0.69 | 0.00 | -35.25 | -0.89 | Consumer Discretionary | |||||||||||||
Urban Outfitters Inc. | 0.42 | 0.00 | -23.02 | -0.41 | Consumer Discretionary | |||||||||||||
Capital Senior Living Corp. | 1.36 | 0.00 | -23.13 | -0.55 | Health Care | |||||||||||||
CommVault Systems Inc. | 0.97 | 0.10 | -25.74 | -0.49 | Information Technology | |||||||||||||
Dropbox Inc. Class C | 0.72 | 0.00 | -23.98 | -0.45 | Information Technology | |||||||||||||
GTT Communications Inc. | 0.52 | 0.04 | -65.13 | -1.65 | Information Technology | |||||||||||||
Freeport-McMoRan Inc. | 0.10 | 0.00 | -24.06 | -0.34 | Materials | |||||||||||||
Portfolio contribution for a holding represents the product of the average portfolio weight and the total return earned by the holding during the period. Past performance is no guarantee of future results. Fund holdings and/or sector allocations are subject to change at any time and are not recommendations to buy or sell any security.
Portfolio Mix
As is typically the case given its high active share, the Litman Gregory Masters Smaller Companies Fund’s individual holdings are quite different from its Russell 2000 Index benchmark. It is also common for the Fund to have meaningful sector over- and underweights. For example, as of 12/31/2019 the Fund was more than eight percentage points overweight to the materials sector (17.25% vs. 3.90%), and meaningfully underweight to financials (3.88% vs. 17.74%).
At the sector level, the largest portfolio change was a 10.6 percentage point decrease to information technology, which coincided with increases in materials (11.5% up to 17.25%) and communication services (4.6% up to 8.27%). The Fund’s cash allocation increased slightly from 9.4% at the start of the year to 11.15% atyear-end. The Fund’s weighted average market capitalization was virtually unchanged during the year at inching up from $2.9 billion at the beginning of the year to $3.05 billion at the end of the year.
The Fund remains sufficiently diversified by investment style across the three managers. With 43 stocks, the portfolio is well-diversified in terms of holdings and sector exposures.
We believe Litman Gregory Masters Smaller Companies Fund comprises an eclectic mix of highly skilled, disciplined and opportunistic stock pickers who have the potential to add significant additional value through concentrating in only their highest-conviction names. We continue to expect the fund to be successful relative to its benchmark and peers over complete market cycles.
We thank shareholders for their trust and will continue to work hard to earn it.
| Fund Summary | 27 | |||||
Table of Contents
By Sector
| Sector Allocation | ||||||||||||
| Fund as of 12/31/19 | Fund as of 12/31/18 | Russell 2000 Index as of 12/31/19 | ||||||||||
Communication Services | 8.3% | 5.1% | 2.3% | |||||||||
Consumer Discretionary | 7.8% | 7.3% | 10.9% | |||||||||
Consumer Staples | 7.3% | 6.1% | 3.0% | |||||||||
Energy | 5.1% | 1.7% | 3.2% | |||||||||
Finance | 3.9% | 5.2% | 17.7% | |||||||||
Health Care & Pharmaceuticals | 8.1% | 6.2% | 18.2% | |||||||||
Industrials | 18.7% | 22.4% | 15.8% | |||||||||
Information Technology | 12.4% | 23.1% | 13.5% | |||||||||
Materials | 17.3% | 11.4% | 3.9% | |||||||||
Real Estate | 0.0% | 2.1% | 7.8% | |||||||||
Utilities | 0.0% | 0.0% | 3.7% | |||||||||
Cash Equivalents & Other | 11.1% | 9.4% | 0.0% | |||||||||
|
|
|
|
|
| |||||||
| 100.0% | 100.0% | 100.0% | ||||||||||
|
|
|
|
|
| |||||||
| By Market Capitalization | By Domicile | |
Market Capitalization: Micro-Cap < $981 million Small-Cap $981 million - $4.4 billion Small/Mid-Cap $4.4 billion - $10.6 billion Mid-Cap $10.6 billion - $29.4 billion Large-Cap > $29.4 billion Totals may not add up to 100% due to rounding |  | |
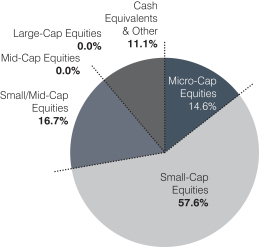
| 28 | Litman Gregory Funds Trust | |||||
Table of Contents
Litman Gregory Masters Smaller Companies Fund Managers
| INVESTMENT MANAGER | FIRM | TARGET MANAGER ALLOCATION | MARKET CAPITALIZATION OF COMPANIES IN PORTFOLIO | STOCK-PICKING STYLE | BENCHMARK | |||||
| Jeff Bronchick | Cove Street Capital, LLC | 33-1/3% | Small- andmid-sized companies | Value | Russell 2000 Value Index | |||||
| Mark Dickherber & Shaun Nicholson | Segall Bryant & Hamill | 33-1/3% | Small- andmid-sized companies | Value | Russell 2000 Value Index | |||||
| Richard Weiss | Wells Capital Management, Inc. | 33-1/3% | Small- andmid-sized companies | Blend | Russell 2000 Index |
Smaller Companies Fund Value of Hypothetical $10,000
The value of a hypothetical $10,000 investment in the Litman Gregory Masters Smaller Companies Fund from June 30, 2003 to December 31, 2019 compared with the Russell 2000 Index and Morningstar Small Blend Category.
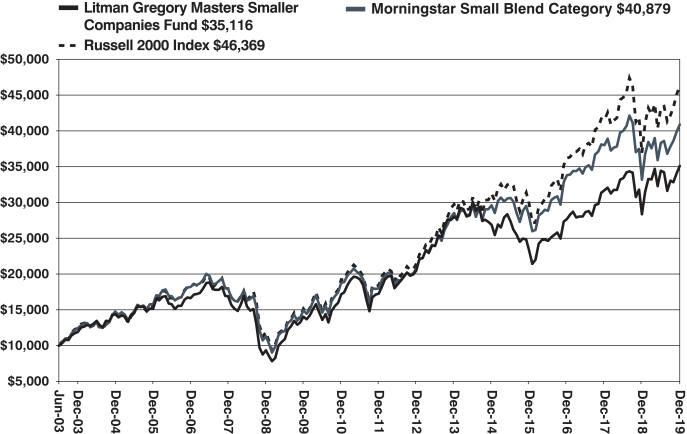
The hypothetical $10,000 investment at fund inception includes changes due to share price and reinvestment of dividends and capital gains. The chart does not imply future performance. Indexes are unmanaged, do not incur fees, expenses or taxes, and cannot be invested in directly.
| Fund Summary | 29 | |||||
Table of Contents
Litman Gregory Masters Smaller Companies Fund
SCHEDULE OF INVESTMENTS IN SECURITIES at December 31, 2019
| Shares | Value | |||||||
| COMMON STOCKS: 88.9% | ||||||||
| Communication Services: 8.3% | ||||||||
| 9,400 | Emerald Expositions Events, Inc. | $ | 99,170 | |||||
| 65,000 | EW Scripps Co. (The) - Class A | 1,021,150 | ||||||
| 75,998 | MDC Partners, Inc. - Class A* | 211,275 | ||||||
| 21,593 | Millicom International Cellular S.A.* | 1,041,430 | ||||||
|
| |||||||
| 2,373,025 | ||||||||
|
| |||||||
| Consumer Discretionary: 7.8% | ||||||||
| 37,500 | American Eagle Outfitters, Inc. | 551,250 | ||||||
| 11,000 | Cheesecake Factory, Inc. (The) | 427,460 | ||||||
| 166,000 | Groupon, Inc.* | 396,740 | ||||||
| 6,786 | Jack in the Box, Inc. | 529,511 | ||||||
| 12,200 | Tapestry, Inc. | 329,034 | ||||||
|
| |||||||
| 2,233,995 | ||||||||
|
| |||||||
| Consumer Staples: 7.3% | ||||||||
| 65,612 | Hain Celestial Group, Inc. (The)* | 1,702,959 | ||||||
| 8,416 | TreeHouse Foods, Inc.* | 408,176 | ||||||
|
| |||||||
| 2,111,135 | ||||||||
|
| |||||||
| Energy: 5.1% | ||||||||
| 24,600 | Noble Energy, Inc. | 611,064 | ||||||
| 9,788 | PDC Energy, Inc.* | 256,152 | ||||||
| 43,153 | WPX Energy, Inc.* | 592,922 | ||||||
|
| |||||||
| 1,460,138 | ||||||||
|
| |||||||
| Financials: 3.9% | ||||||||
| 18,200 | AllianceBernstein Holding L.P. | 550,732 | ||||||
| 15,200 | Bank of NT Butterfield & Son Ltd. (The) | 562,704 | ||||||
|
| |||||||
| 1,113,436 | ||||||||
|
| |||||||
| Health Care: 8.1% | ||||||||
| 14,000 | Avantor, Inc.* | 254,100 | ||||||
| 135,700 | Capital Senior Living Corp.* | 419,313 | ||||||
| 6,735 | Integer Holdings Corp.* | 541,696 | ||||||
| 3,833 | Magellan Health, Inc.* | 299,932 | ||||||
| 17,285 | Orthofix Medical, Inc.* | 798,222 | ||||||
|
| |||||||
| 2,313,263 | ||||||||
|
| |||||||
| Industrials: 18.7% | ||||||||
| 7,900 | ASGN, Inc.* | 560,663 | ||||||
| 16,500 | Avis Budget Group, Inc.* | 531,960 | ||||||
| 7,875 | Axon Enterprise, Inc.* | 577,080 | ||||||
| 5,800 | Gardner Denver Holdings, Inc.* | 212,744 | ||||||
| 74,500 | GP Strategies Corp.* | 985,635 | ||||||
| 15,000 | Heritage-Crystal Clean, Inc.* | 470,550 | ||||||
| 22,600 | Macquarie Infrastructure Corp. | 968,184 | ||||||
| 5,363 | Regal Beloit Corp. | 459,126 | ||||||
| 8,025 | Sensata Technologies Holding Plc* | 432,307 | ||||||
| 3,296 | SPX Corp.* | 167,701 | ||||||
|
| |||||||
| 5,365,950 | ||||||||
|
| |||||||
| Information Technology: 12.4% | ||||||||
| 4,840 | Arrow Electronics, Inc.* | 410,142 | ||||||
| 29,900 | Dropbox, Inc. - Class A* | 535,509 | ||||||
| 31,808 | FireEye, Inc.* | 525,786 | ||||||
| 9,000 | FLIR Systems, Inc. | 468,630 | ||||||
| 25,031 | NCR Corp.* | 880,090 | ||||||
| 10,300 | ViaSat, Inc.* | 753,908 | ||||||
|
| |||||||
| 3,574,065 | ||||||||
|
| |||||||
| Shares | Value | |||||||
| Materials: 17.3% | ||||||||
| 31,100 | Axalta Coating Systems Ltd.* | $ | 945,440 | |||||
| 32,080 | Compass Minerals International, Inc. | 1,955,597 | ||||||
| 37,598 | Innophos Holdings, Inc. | 1,202,384 | ||||||
| 17,000 | Norbord, Inc. | 454,410 | ||||||
| 22,875 | Olin Corp. | 394,594 | ||||||
|
| |||||||
| 4,952,425 | ||||||||
|
| |||||||
| | TOTAL COMMON STOCKS | 25,497,432 | ||||||
|
| |||||||
| Principal Amount | ||||||||
| SHORT-TERM INVESTMENTS: 11.2% | ||||||||
| REPURCHASE AGREEMENTS : 11.2% | ||||||||
| $3,215,000 | Fixed Income Clearing Corp. 0.120%, 12/31/2019, due 01/02/2020 [collateral: par value $3,280,000, U.S. Treasury Note, 1.625%, due 12/31/2021, value $3,284,392] (proceeds $3,215,021) | 3,215,000 | ||||||
|
| |||||||
| | TOTAL SHORT-TERM INVESTMENTS | 3,215,000 | ||||||
|
| |||||||
| | TOTAL INVESTMENTS | 28,712,432 | ||||||
|
| |||||||
| Liabilities in Excess of Other Assets: (0.1)% | (18,038 | ) | ||||||
|
| |||||||
| NET ASSETS: 100.0% | $ | 28,694,394 | ||||||
|
| |||||||
Percentages are stated as a percent of net assets.
| L.P. | Limited Partnership |
| * | Non-Income Producing Security. |
The accompanying notes are an integral part of these financial statements.
| 30 | Litman Gregory Funds Trust | |||||
Table of Contents
Litman Gregory Masters Alternative Strategies Fund Review
The Litman Gregory Masters Alternative Strategies Fund (Institutional Share Class) gained 8.52% in 2019. During the same period,3-month LIBOR gained 2.61%, the Morningstar Multialternative Category gained 7.50%, the Bloomberg Barclays U.S. Aggregate Bond Index gained 8.72%, and the HFRX Global Hedge Fund Index rose 8.68%.
QUARTER END PERFORMANCE – 12/31/2019 |
| |||||||||||||||||||||||
| Average Annual Total Returns | ||||||||||||||||||||||||
| Three Month | Year-to- Date | One- Year | Three- Year | Five- Year | Since Inception | |||||||||||||||||||
Litman Gregory Masters Alternative Strategies Fund Institutional Class | 1.91% | 8.52% | 8.52% | 3.56% | 3.33% | 4.76% | ||||||||||||||||||
Litman Gregory Masters Alternative Strategies Fund Investor Class | 1.84% | 8.22% | 8.22% | 3.25% | 3.07% | 4.51% | ||||||||||||||||||
3-Month LIBOR | 0.54% | 2.61% | 2.61% | 1.93% | 1.33% | 0.94% | ||||||||||||||||||
Bloomberg Barclays Aggregate Bond Index | 0.18% | 8.72% | 8.72% | 4.03% | 3.05% | 2.95% | ||||||||||||||||||
Morningstar Multialternative Category | 1.64% | 7.48% | 7.48% | 2.71% | 1.22% | 1.92% | ||||||||||||||||||
HFRX Global Hedge Fund Index | 2.62% | 8.68% | 8.68% | 2.42% | 1.20% | 1.82% | ||||||||||||||||||
Russell 1000 Index | 9.04% | 31.43% | 31.43% | 15.05% | 11.48% | 15.90% | ||||||||||||||||||
SEC30-Day Yield1 as of 12/31/19 Institutional: 2.20% Investor: 1.95% |
| |||||||||||||||||||||||
Unsubsidized SEC30-Day Yield2 as of 12/31/19 Institutional: 1.92% Investor: 1.67% |
| |||||||||||||||||||||||
1. The30-day SEC Yield is computed under an SEC standardized formula based on net income earned over the past 30 days. It is a “subsidized” yield, which means it includes contractual expense reimbursements, and it would be lower without those reimbursements. |
| |||||||||||||||||||||||
2. The unsubsidized30-day SEC Yield is computed under an SEC standardized formula based on net income earned over the past 30 days. It excludes contractual expense reimbursements, resulting in a lower yield. |
| |||||||||||||||||||||||
| EXPENSE RATIOS as of 10/31/19 | MASFX | MASNX | ||||||
Gross Expense Ratio | 1.64% | 1.89% | ||||||
Net Expense Ratio | 1.36% | 1.61% | ||||||
| The Net Expense Ratio reflects a contractual fee waiver and/or expense reimbursement, which is in place through 4/30/2021. See the Fund’s prospectus for more information. | ||||||||
Adjusted Expense Ratio | 1.28% | 1.53% | ||||||
| The Adjusted Expense Ratio is the same as the Net Expense Ratio exclusive of certain investment expenses, such as interest expense from borrowings and repurchase agreements, dividend expense from investments on short sales, and acquired fund fees and expenses. | ||||||||
| Performance quoted represents past performance and does not guarantee future results. The investment return and principal value of an investment will fluctuate so that an investor’s shares, when redeemed, may be worth more or less than their original cost. Current performance of the funds may be lower or higher than the performance quoted. To obtain standardized performance of the funds, and performance as of the most recently completed calendar month, please visitwww.mastersfunds.com.All performance discussions in this report refer to the performance of the Institutional share class. |
| |||||||
The Alternative Strategies Fund returned 2.53% in the second half of the year and 8.52% for the full year. This is the second-highest calendar-year return since the fund’s inception over eight years ago, trailing only the 9.41% gain achieved in 2012 when the fund benefited in particular from the tailwind of extremely cheapnon-agency residential mortgage-backed securities. It is also a satisfying bounce-back from the slight negative performance in 2018 and was achieved without taking undue risk. Considering the myriad macro perils present, along with what we consider quite stretched U.S. equity valuations and compressed credit spreads, we believe maintaining a generally cautious posture was (and is still) warranted.
Since its inception on September 30, 2011, the fund’s average annual return is 4.76% with a volatility (standard deviation) of 3.12% and a beta to the stock market of 0.23. This return is towards the lower end of what we think is a reasonable expected-return range for the fund over the longer term (full market cycles). Meanwhile, the fund’s volatility has been well below our expected range of 4% to 8%, and its equity beta has been in line with our expectations.
Overall, we are pleased with the fund’s risk-adjusted returns. It has the highest Sharpe and Sortino ratios within its Morningstar Multialternative peer group category, since inception. And it has more than doubled the total return of both its Morningstar category and the HFRX Global Hedge Fund Index, with lower volatility and beta than both.
| Fund Summary | 31 | |||||
Table of Contents
The “Risk/Return Statistics” table below provides some of the key performance metrics we track for the fund and its benchmarks.
Litman Gregory Masters Alternative Strategies Fund Risk/Return Statistics 12/31/19 |
| |||||||||||||||||||
| MASFX | Bloomberg Barclays Agg Bond | Morningstar Multi-Alternative Category | HFRX Global Hedge Fund | Russell 1000 | ||||||||||||||||
Annualized Return | 4.76 | 2.95 | 1.92 | 1.82 | 15.90 | |||||||||||||||
Total Cumulative Return | 46.74 | 27.13 | 16.81 | 15.94 | 237.98 | |||||||||||||||
Annualized Std. Deviation | 3.12 | 2.88 | 3.39 | 3.62 | 11.48 | |||||||||||||||
Sharpe Ratio (Annualized) | 1.27 | 0.79 | 0.37 | 0.32 | 1.29 | |||||||||||||||
Beta (to Russell 1000) | 0.23 | -0.03 | 0.27 | 0.26 | 1.00 | |||||||||||||||
Correlation of MASFX to | 1.00 | -0.12 | 0.80 | 0.72 | 0.78 | |||||||||||||||
Worst Drawdown | -6.94 | -4.52 | -8.21 | -10.82 | -17.42 | |||||||||||||||
Worst12-Month Return | -4.49 | -2.47 | -6.08 | -8.19 | -7.21 | |||||||||||||||
% Positive12-Month Periods | 86.81% | 78.02% | 76.92% | 67.03% | 94.51% | |||||||||||||||
Upside Capture (vs. Russell 1000) | 28.04 | 7.68 | 21.60 | 21.08 | 100.00 | |||||||||||||||
Downside Capture (vs. Russell 1000) | 23.46 | -11.65 | 36.80 | 36.40 | 100.00 | |||||||||||||||
Since inception (9/30/11) | ||||||||||||||||||||
Worst Drawdown based on weekly returns Past performance is no guarantee of future results | ||||||||||||||||||||
Portfolio Commentary
Performance of Managers
For the year, all five managers produced positive returns. FPA’s Contrarian Opportunity strategy gained 20.05%, the DoubleLine Opportunistic Income strategy gained 9.06%, DCI’s Long-Short Credit strategy gained 8.56%, the Water Island Arbitrage and Event-Driven strategy gained 5.61% and the Loomis Sayles Absolute Return strategy rose 3.46%. (All returns are net of the management fee eachsub-advisor charges the fund.)
Manager Commentaries
DCI, Long-Short Credit Strategy
The DCI Long-Short Credit strategy returned 8.56% (net) in 2019. Account performance was positive across the board for the year, rising in each quarter on widespread security-selection (alpha) gains that were well-balanced across both the credit default swap (CDS) and bond sleeves. (As a reminder, the strategy incorporates both a CDS long-short sleeve and a corporate bond sleeve with interest rate and credit beta hedges.)
DCI’s proprietary model focuses on fundamental factors to identify quality and improving credits. Security selection gains in the portfolio were broad based. Gains were led by long positions from within consumer durables (housing—Beazer, KB homes—and autos—GM, Volkswagen, Ford), telecoms (Dish, Altice, Telecom Italia, AT&T), insurance (MBIA, Radian, MetLife), financing and rentals (Avis, OneMain, Hertz, Navient), technology (Motorola, Ericsson, AMD, Sirius XM), and real estate investment trusts (Medical Properties Trust, Starwood, Hilton) as well as short positions from materials (steel companies) and some of the troubledoil-patch firms. Other notable positive contributors to the portfolio returns were: long Avon, short Dean Foods, short Whiting Petroleum.
Security selection underperformed a bit in the retail and equipment sectors, and the portfolio’s underweight in banking was a performance drag (although one that was more than offset by the corresponding overweight in other financial sectors).
The portfolio construction, by design, is always focused on asset selection—favoring firms with lower default risk (as measured by DCI’s proprietary default probability model) and improving fundamentals—and is constructed to realize neutral to credit beta, which was underlined by the strategy performance over the divergent environments of the year.
The strategy continues to hedge the rates, foreign exchange, and credit beta exposures and invests only in liquid securities. This disciplined risk control remains a defining feature of the DCI approach and the DCI excess returns are designed to remain low to negative correlation with market drivers. Net beta effects were a modest positive contributor for the year, with the hedging performing as expected and the moves in the underlying credit and rates both positive.
Broad fixed income market returns were boosted for the year by large positive returns from both credit spreads (up almost 5%) and rates (up about 7%). Default-free government bond returns soared as an emergent global manufacturing slowdown (centered around China and Europe) spurred central banks worldwide to pivot from policy tightening to outright rate cuts and asset purchases. Credit returns followed suit as spreads narrowed on the back of the global monetary easing and confidence that the slowdown and trade-policy concerns would be only temporary setbacks.
| 32 | Litman Gregory Funds Trust | |||||
Table of Contents
The Long-Short Credit Strategy’s portfolio positioning has rotated of late, moving more neutral in the financials sectors, buying some more banks and selling some insurance and other financials, though the broad underweight in banking remains. The portfolio has also moved to about neutral in the technology (previously long) and energy sectors (previously short) and to somewhat offsetting views in telecom (long satellites and Europe versus short domestic telecom). The portfolio positioning currently favors attractive longs within the financial companies and consumer durables sectors versus underweighting utilities, banks, and consumer retailing.
DCI’s 2020 outlook anticipates continued market differentiation across company fundamentals and underlying credit quality. Theyear-end rally has clouded the forward picture a bit by increasing the pricing pressure on all risk assets. Nonetheless we have taken heart from the significant dispersion in credit performance that realized last year. Lower quality firms began to detach from the baseline, median performance. This effect was most prominent at the lower end of the junk credit spectrum (CCCs), but also was evident in investment grade (albeit to a smaller extent).
This bifurcation remains a key theme for us and we expect it to continue: the bulk of firms are likely to remain safe and their credit should continue to price constructively/tread water, while a growing/continued tail of firms will be challenged at the intersection of their cash earnings and debt coverage.
Macro trends should remain supportive. Geopolitical risks remain the largest source of uncertainty. DCI generally expects pressure for yields to edge up (on economic improvement/reversion) and for spreads to edge up (as credit tail risk gets priced) without generating negative returns. The environment for selection should be better than that for carry.
DoubleLine, Opportunistic Income Strategy
For the trailing12-month period ended December 31, 2019, the DoubleLine Opportunistic Income portfolio outperformed the Bloomberg Barclays US Aggregate Bond Index. The primary driver of outperformance was security selection as the portfolio was able to outperform the Index despite consistently maintaining a shorter duration as rates fell. The largest contributor to returns was agency residential mortgage-backed securities (RMBS), which benefitted from the10-year U.S. Treasury rate declining 77 basis points (bps) over the course of the year. This sector of the portfolio makes use of inverse floating rate and inverse interest only securities that are not held in the index, which is why it was able to outperform the Bloomberg Barclays US MBS cohort. Another standout performer for the portfolio was bank loans, which is a sector that requires especially active credit risk management.BB-rated andB-rated bank loans performed well in 2019, however,CCC-rated bank loans underperformed severely. The investment team was able to generally avoid many of the credit issues that occurred in theCCC-rated segment, which is why this portion of the portfolio performed well. The worst-performing sectors in the portfolio for the year were commercial MBS and infrastructure-related assets. While these sectors did not experience any meaningful negative returns, they struggled to keep pace with the index due to their shorter durations.
As for portfolio positioning over the course of 2019, allocation percentages and leverage ratios generally remained constant. When the global interest rate rally began to pick up steam over the summer, the portfolio duration shortened slightly as prepayments and refinancings increased. Rather thanre-extending duration, the investment team took the necessary steps to thoughtfully maintain an attractive convexity profile for the portfolio and generally rotated into securitized credit assets rather than long duration assets. As of December 31, the portfolio has a leveredyield-to-maturity of approximately 5.12% and an effective duration of 4.56.
Looking ahead to 2020, we are skeptical of the corporate bond market’s ability to generate another year of 14% returns and we think current market pricing is closer to the top than the bottom for corporate credit. For these reasons, the portfolio is likely to remain skewed towards residential, commercial, and consumer credit exposures in securitized form. It is our view that the forward-looking, risk-adjusted return profile of these assets is better suited to handle any macroeconomic volatility.
FPA, Contrarian Opportunity Strategy
Global stock markets ended 2019 on a high note, with the global MSCI ACWI Index returning 8.95% and 26.60% for the fourth quarter and full year, respectively, and the domestic S&P 500 Index returning 9.06% and 31.49% for the same periods. It was a “risk on” year with even U.S. investment grade bonds delivering 14.23% for the year, approximately in line with the high yield bond market’s 14.41% performance.1 The FPA Contrarian Opportunity strategy increased 5.47% and 20.05% (net of fees) for 2019’s fourth quarter and full year.
Portfolio
The portfolio has unusual breadth, having the ability to invest in more diverse regions, sectors and asset classes than almost any other mutual fund. Yet we will only commit capital when we have determined that upside opportunity exceeds downside risk. If we believe prices are attractive, we buy. If not, we hold or sell. Importantly, we don’t (because we can’t) try and pick market tops or bottoms.
| 1 | US investment grade bonds is represented by the ICE BofA US Corporate Index (2019 return: 14.23%); High Yield bond market is represented by the ICE BofA US HY Index (2019 return: 14.41%). |
| Fund Summary | 33 | |||||
Table of Contents
Santa left coal in our stockings at Christmas 2018 as global markets swooned. Like good little children, we did the right thing and took advantage of lower prices, increasing the Fund’s risk exposure by approximately six percentage points in the second half of 2018. Then Christmas came early last year as markets rebounded, ultimately reaching new highs. We similarly took advantage of rising prices in 2019 and reduced or sold positions that we could no longer justify holding at given valuations, and therefore ended the year with 6.5% less risk exposure. While the portfolio was less invested in 2019, we have no doubt that in the future we will deploy more of its capital.
We continue to focus on companies that have at least a small breeze at their backs and avoid those businesses with wind in their faces. Over time, we generally expect the companies we own to sell an increasing number of units as well as have at least enough pricing power to offset cost inflation.
Contributors to and detractors from the portfolio’s trailing12-month returns are listed in the following table.
Contributors and Detractors2
| Contributors | Performance Contribution | Percent of Portfolio | Detractors | Performance Contribution | Percent of Portfolio | |||||||||||||
| TTM | ||||||||||||||||||
Arconic | 1.91% | 3.8% | PG&E/Utilities (hedge) | -0.53% | -0.1% | |||||||||||||
Citigroup | 1.15% | 2.6% | Baidu | -0.45% | 1.3% | |||||||||||||
Charter Comm. | 1.14% | 2.1% | Mylan | -0.40% | 0.0% | |||||||||||||
AIG | 1.06% | 3.7% | O-I Glass | -0.38% | 0.4% | |||||||||||||
Alphabet | 1.01% | 4.7% | CIT/Regional Banks (hedge) | -0.18% | -0.8% | |||||||||||||
|
|
|
| |||||||||||||||
6.30% | 17.0% | -1.95% | 0.8% | |||||||||||||||
Our investment in the cable industry via Charter Communications (up approximately 70%) along with Comcast (up approximately 34%) were two notable contributors in 2019.3 We made these investments inmid-2018, when many investors were concerned that subscribers would cut the cord in favor of streaming and when wireless 5G threatened to damage these companies’ dominant broadband franchise. Our belief remains that while video will continue to shrink, video is less profitable on a cash basis than many believe it to be. Thus, we think broadband should remain vibrant, as it is likely to take many years and many billions of dollars before the potential impact of the competitive threats is known. The market has sidled over to our thinking on this, at least for the time being.
Value investing means investing with a margin of safety so if all doesn’t go according to plan, whether ours or a company’s, then investors may nonetheless come out close to whole. This may mean having the protection of business and/or balance sheet, but without that protection, the emperor wakes up one day to realize he’s not wearing clothes.
Being a value investor in 2019 was like wearing a crew cut in Haight Ashbury in 1969—not only do youstand-out, you invite a bit of ridicule. We value investors must not acquiesce to the fear of missing out, however, and instead make our peace with a different kind of FOMO,the fate of missing out. To do well over long periods of time means accepting that we won’t do well for lengths of time in between. We realize that has made us appear both smart and dumb at different moments in time, but our goal is to deliver over the long run rather than at any one point in time.
When all appears easy, it generally isn’t. What we won’t do is redefine value. We believe we can help ourselves and our shareholders by staying the course and continuing to invest bottoms up.
Looking from the top down, though, helps explain why we find it more challenging to unearth suitable investments today. We end up struggling to find great risk/rewards against the following backdrop.
Low interest rates and a lack of investment alternatives have lifted the price of risk assets globally. Global stock markets trade at or near their highs as a percent of their respective economies, as shown in the chart below.
| 34 | Litman Gregory Funds Trust | |||||
| 2 | Reflects the top five contributors and detractors to the portfolio’s performance based on contribution to return for the trailing twelve months (“TTM”). Contribution is presented gross of investment management fees, transactions costs, and portfolio operating expenses, which if included, would reduce the returns presented. The information provided does not reflect all positions purchased, sold or recommended by FPA during the quarter. A copy of the methodology used and a list of every holding’s contribution to the overall portfolio’s performance during the TTM is available by contacting FPA Client Service at crm@fpa.com. It should not be assumed that recommendations made in the future will be profitable or will equal the performance of the securities listed. |
| 3 | Percentage change reflects total return including the reinvestment of dividends and interest. The total return of the security may not equate with the performance of the holding in the Fund. |
Table of Contents
Stock Market as Percent of GDP4
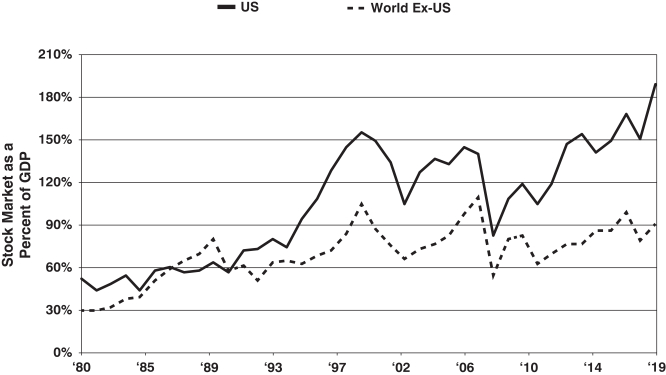
Looking at the stock market from aprice-to-earnings basis, it becomes clear that when earnings are smoothed, valuations have only been this high once before. This is shown in below, using the Shiller P/E methodology that divides current price byten-year average earnings, adjusted for inflation.
| Fund Summary | 35 | |||||
| 4 | Source: The World Bank, IMF, MSCI, as of December 31, 2019. Q4 2019 market cap data based on 2018 market cap data provided by The World Bank adjusted by 2019 Index (MSCI US for US and MSCI World for World) performance. 2019 GDP assumes 2019 IMF real GDP growth projections plus year over year inflation change provided by IMF. Data shown represents total value of all listed shares in the stock market as a percentage of GDP in each respective region/country, as defined by The World Bank. The World Bank releases this data annually. Stock market is the market capitalization of stocks. Market capitalization (also known as market value) is the share price times the number of shares outstanding (including their several classes) for listed domestic companies. Investment funds, unit trusts, and companies whose only business goal is to hold shares of other listed companies are excluded. Annual data, end of year values. |
Table of Contents
Shiller P/E5
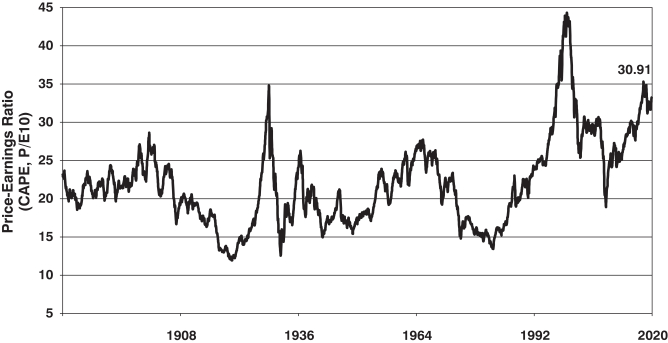
However, current P/E ratios are not so outlandish in the context of low interest rates and a reasonably good economy. Should rates remain low and economies avoid weakening measurably, markets could reasonably remain at today’s elevated levels.
The long outperformance of growth stocks compared to value stocks has left value much less expensive, trading at a relative P/E that’s about as low as we have ever seen it in our careers. This does not make value stocks cheap, just less pricey than growth stocks.
In fact, value stocks have performed reasonably well over the last decade. The S&P 500 Value Index has compounded at a rate of 12.14%. Value investments just haven’t done as well as growth stocks, which have annualized at 14.76%.6 However, growth stocks have outperformed their fundamentals, which has led to P/E multiple expansion, while value stocks have not.
Judging what a company is worth and where its stock should trade requires a great deal of interpretation. Analyzing a bond’s performance is generally easier, as the most you can get as a return is the contracted amount, though an appreciation for the underlying company’s solvency will cause one to accept a higher or lower yield. ‘Credit investors’ current acceptance of historically low yields reflects their greater concern for return than for risk, whether it be in investment grade, high yield or levered loans.
The investment grade, or IG, bond market today has the lowest yield and lowest credit quality in its history. For instance, lowly BBB credits have more than quadrupled in value. Low yield and low credit quality don’t generally go hand in hand. In addition, at 7.9 years, the IG market has the longest duration in its history.7 Any increase in interest rates or spread will therefore have a larger impact than has been the case previously.
The levered loan market has trebled from $527 billion to $1.5 trillion over the last ten years and yields just 6.2%. Cracks are beginning to show. About 4% of the leveraged loan universe was trading below 80 cents on the dollar at the end of the year, versus just 2% in May 2019.8 We suspect that busted levered loans will be a future opportunity under the Fund’s broad mandate.
The high yield segment of the credit market has been important to the Fund since its inception. Today, however, we are not getting paid anywhere near enough to invest broadly in high yield. We said the same thing a year ago – and the high yield market soared.
| 36 | Litman Gregory Funds Trust | |||||
| 5 | Source: Robert Shiller, http://www.econ.yale.edu/~shiller/data.htm, as of December 31, 2019. CAPE = Cyclically adjustedprice-to-earnings ratio, and is also commonly known as theShiller P/E ratioorP/E 10 ratio. |
| 6 | Source: Bloomberg. Growth stocks represented by the S&P 500 Growth Index. |
| 7 | Source: Bloomberg. The IG bond market is represented by the Bloomberg Barclays US Corporate Bond Index. Index data as of December 31, 2019. |
| 8 | Source: The leverage loan market is represented by the S&P/LSTA Leveraged Loan Index. |
Table of Contents
But more than half of its 14% return came from tighter spreads and lower yields due to a decline in interest rates. We were under no illusion that just because we didn’t think the risk/reward then in high yield was attractive, the market would collapse, and we don’t mean to suggest it will collapse now. We do want to make sure that a prospective return justifies the risk assumed. As much as that wasn’t the case a year ago, we believe it is even less so now.
Economy and Macro
We offer limited value when speaking of the larger global macro environment, so here we provide only a skeletal view to help explain the challenge in finding good investments today.
As David Rosenberg of Gluskin Sheff pointed out, “In a normal cycle, the stock market has a correlation of roughly 60% with the economy. The other 40% is explained by factors like valuations, sentiment, technicals and momentum. This cycle was literally off the charts in that respect—because only 7% of this entire bull market was due to the economy. And that’s a good thing if you are long the stock market because this did go down as the weakest economic expansion on record and yet one of the most powerful bull markets ever.” Mr. Gluskin concluded, “The fundamentals do win out in the end, but it could take time.”9
We don’t think the stock market’s link to the economy has been severed, but it has at least been largely suspended. When and how deep a future recession might be and how the market might react remain open questions. Risk does seem skewed to the downside today.
The show goes on as long as the government puppet masters allow, or when the audience leaves. The U.S. deficit climbed just over $1 trillion in 2019, despite a growing economy and the tightest labor market on record. Central banks have successfully inflated asset prices but failed to ignite real economic activity. Most Americans are not better off today than they were a decade ago.
Extremely low interest rates continue to pervert capital allocation decisions. Whether or not to buy a piece of equipment, repurchase shares, or make an acquisition, a lower cost of capital can improve an otherwise impractical or marginal decision. This doesn’t seem likely to change anytime soon. The global monetization experiment took a pause but has since restarted, and a more expansive fiscal policy is under discussion.
Indebted governments, companies and individuals have recalibrated to this low level of rates. When or if rates eventually rise, many of these same parties may find their finances dangerously askew.
Conclusion
We will continue to seek to capitalize when equities (both domestic and foreign) and credit (mostly public but some private) are ripe. If not, we shall maintain our more conservative posture. There are those who take liquidity and those who provide it. We prefer to be the latter, a function of temperament and having cash on hand for investment.
We look for shareholder partners of a like mind, those who also prefer an equity-like rate of return over time while trying to avoid a permanent impairment of capital.
We try to field a balanced team, playing both offense and defense. Since we believe that the stock market will generally rise over time, we do tilt more towards offense but not indiscriminately. If we are given lemons, we will make lemonade, but we can’t even do that if there’s a drought.
It is generally psychologically easier to invest when a rising market validates an investor’s purchases. We take greater comfort when choppier markets challenge an investor’s conviction, even more so when a lower price follows each new purchase. For now anyway, it seems to be buy high and sell higher.
Loomis Sayles, Absolute Return Strategy
Portfolio Review
With a net return of 3.46%, the Loomis Sayles Absolute Return strategy outperformed its benchmark, the three-month LIBOR Index, which returned 2.61%. The Fund’s positive performance was diversified across several sectors, with the majority generated from securitized, investment grade corporate bonds, and bank loans. emerging markets and convertibles issues also buoyed performance to lesser extents. These gains more than offset losses from global rates, equities, and currency positioning.
Securitized assets across all major sectors contributed to returns during the year. Asset-backed securities (ABS),non-agency RMBS (residential mortgage-backed securities), and CMBS (commercial mortgage-backed securities) issues in particular bolstered
| 9 | Gluskin Sheff. Breakfast with Dave. December 19, 2019. |
| Fund Summary | 37 | |||||
Table of Contents
performance. Our ABS exposure had positive results from many of the sub-sectors including subprime auto loans, aircraft related, and credit card debt.Non-agency RMBS also added positive contribution as housing generally continued to do well. Sentiment remained optimistic as rates continue to remain attractive for borrowers.
Investment-grade corporates, including the ones we hold for reserves, aided performance over the period. A continuation of accommodative Fed policy and the search for yield, particularly among foreign investors, have been supportive of performance. Despite these tailwinds, U.S./China trade talks, the absence of prospective global growth catalysts, and Brexit risks remained in focus throughout the year. Consumer, financial, and technology issues had the largest positive impacts. We expect spreads to remain range bound and dominated by central bank actions. While the default outlook remains favorable, we remain focused on idiosyncratic stories within the asset class.
Our allocation to bank loans aided performance, despite headwinds faced by floating rate assets due to generally accommodative monetary policy over the period. Communications, capital goods, and consumernon-cyclical names contributed the most.
Our global rates tools, primarily sovereign bonds, interest rate swaps (IRS), and interest rate futures, reduced performance. Within the portfolio, the negative performance can largely be attributed to a short Euro-Bund futures position and exposure to Argentina. Fernandez beating Macri in Argentina’s general election was a largely unexpected outcome and markets have spent much of the subsequent period weighing the odds that Fernandez unwinds Macri’spro-market policies. Equities also weighed on returns for the year, due largely to energy-related and building materials names.
Market Conditions
Subdued inflation has allowed central banks to maintain largely accommodative policies, which have supported risk assets. The Federal Reserve’s (the “Fed”)indication that it will pause has given way to the expectation for yields to be tightly range bound. Despite persistently soft data, some signs indicate that the easy monetary policy has helped, and the manufacturing slowdown may be bottoming out.
Risk assets have been supported by the macro risk landscape softening in several regards since the end of the previous year. Central banks have shown a willingness to continue economic stimulus through monetary policy. The likelihood of a no-deal Brexit appears to have diminished with negotiations spanning multiple Brexit deadlines. Trade negotiations between China and the U.S. seem to have taken on a less tenuous tone, suggesting a lower probability of escalation and higher probability of a “phase one” agreement being reached.
Outlook
We expect to exit the manufacturing slowdown without an economy-wide recession; however, downside risks remain in the near term. This view hinges on the idea that the Fed will remain supportive and continue accommodative monetary policy.
We project the Fed to remain on hold for the next twelve months. Chair Powell has indicated that a rate hike is unlikely in the near term, barring any significant, unexpected increase in inflation acceleration.
We maintain our cautious outlook on risk sentiment. The Fed looks more likely to continue to provide stimulus by maintaining accommodative monetary policy. China’s economic recovery is faltering and risk related to the U.S./China trade war remains present despite being tempered somewhat by an increased likelihood of a phase one agreement. Markets will remain focused on Chinese stimulus as a potential catalyst for global growth. So far, however, policy makers have been reluctant to utilize all options available to them; instead favoring an incremental approach that emphasizes leverage stabilization.
The U.S. dollar has been choppy and range bound. We expect a continuation of these themes, which should be supportive for risk assets in general. We saw some dollar weakening during October, but haven’t seen much of a breakout in either direction since. The perception of softening risks related to U.S./China trade talks has caused the dollar’s recent bid as a safe-haven to largely evaporate. Volatility shocks and weakening risk appetite are factors that could prove constructive for the dollar.
Water Island, Arbitrage and Event Driven Strategy
At the end of 2019, attitudes amongst investors were markedly different than mere months prior. The third quarter had concluded with a sense that a recession was likely imminent in the United States. Uncertainty fuels fear, and the combination of a seemingly endless U.S./China trade war plus an intractable Brexit process fostered a lack of clarity around the future direction of some of the world’s largest economies. Fast forward three months, and suddenly investors seem far more assured. Throughout the fourth quarter, President Trump repeatedly messaged positive developments in the trade war, most recently stating he would sign a Phase 1 deal with China on January 15. Additionally, in December’s UK general election, the Conservative Party claimed a decisive majority, significantly easing Prime Minister Johnson’s path to extract the UK from the EU in the near term. Byyear-end, anxiety had abated, investors had pushed U.S. equities to further record highs, and Goldman Sachs economists had nearly declared the U.S. economy recession-proof. That said, we would be remiss if we ignored a healthy level of support for the market’s gains from the Federal Reserve (Fed), which cut interest rates 75 basis points over the course of the year, prompted by a combination of political pressure,
| 38 | Litman Gregory Funds Trust | |||||
Table of Contents
weakening economies outside the U.S., and the severesell-off of Q4 2018 which heightened near-term recession fears. While things may not be as rosy as they seem, as event-driven investors we continue to be focused more on the universe of corporate catalysts at our disposal than on the direction of broader credit and equity markets.
For the year, our event-driven portfolio generated positive performance across both hard catalyst merger arbitrage investments and soft catalyst special situations. The top contributor in the portfolio for the year was a competitive bidding situation for Anadarko Petroleum. In April 2019, Chevron—a U.S.-based integrated oil and gas company—publicly announced it had agreed to acquire Anadarko—a U.S.-based upstream energy company—for $32.5 billion in cash and stock. Prior to the announcement of the deal, Anadarko had also been conducting negotiations with another bidder—Occidental Petroleum—though the company deemed Chevron’s bid to be the superior offer. Two weeks after the deal with Chevron was announced, Occidental publicly announced an unsolicited revised offer that valued Anadarko at $38.0 billion in cash and stock, topping Chevron’s bid. Anadarko subsequently agreed to return to the negotiating table. Anadarko ultimately declared Occidental to have the superior offer, at which point Chevron abandoned its pursuit of the company. We initiated a position in Anadarko shortly after the deal with Chevron was announced as we saw potential for topping bids, and our investment paid off as the subsequent bidding war led to gains in the fund. The transaction with Occidental successfully closed in Q3 2019. Other top contributors for the year included our special situations investment in Xerox and our merger arbitrage investment in the acquisition of WellCare Health Plans by Centene. Xerox benefited in the first half of the year from better-than-expected earnings guidance after replacing its CEO, initiating strategic review, and embarking upon a turnaround process. The WellCare/Centene transaction saw its deal spread narrow after the merger received all necessary state-level regulatory approvals, leaving only Department of Justice (DOJ) signoff remaining.
Conversely, the top detractor for the period was Illumina’s proposed acquisition of Pacific Biosciences. In November 2018, Illumina—a U.S. developer of tools for analysis of genetic variation and function—agreed to acquire Pacific Biosciences—a U.S. DNA sequencing technology firm—for $1.1 billion in cash. This deal spread first widened in Q2 2019 when the UK’s Competition and Markets Authority (CMA) initiated a regulatory review, thus extending the timeline for completion to late 2019. The spread further widened during Q3 as the CMA forwarded the transaction to a Phase II review, pushing the timeline out to 2020. The CMA’s primary objection to the transaction was a belief that Illumina was pursuing the transaction solely to prevent potential competition from Pacific Biosciences in the future. The last straw was the Federal Trade Commission’s objection to the deal in December 2019, based on a similar potential competition argument. Rather than fight the regulators in court, the companies chose to terminate the transaction shortly into the New Year. Other detractors in 2019 included our special situations investment in Conduent and our merger arbitrage investment in Newmont Mining’s acquisition of Goldcorp. We exited our position in Conduent after it became clear any progress toward a strategic review would be a longer-term affair once the company surprised investors with poor Q1 earnings, reduced guidance for 2019, and the CEO’s resignation—all on the same call. The Goldcorp/Newmont transaction saw its deal terms revised down to satisfy complaints from Newmont shareholders about the distribution of proceeds from a preexisting joint venture between Newmont and Barrick Gold Corp.
For our hard catalyst merger arbitrage investments, we remain highly constructive on the strategy. Though the Fed cut rates—which typically acts as a tailwind to merger arbitrage returns—during 2019, current deal spread levels remain attractive overall. In addition, while we witnessed stagnation in the pace of newly announced deal flow amidst the widespread uncertainty of Q3, further clarity around trade tensions and Brexit caused consolidation activity to swiftly resume. By the end of the year, over $4 trillion in mergers and acquisitions (M&A) transactions had been announced—on par with 2018 figures. With much of Europe in “wait and see” mode for the bulk of 2019 due to Brexit uncertainty, the vast majority of activity stemmed from the US. Mega deals—that is, transactions valued at $10 billion or greater—were also a significant contributor to 2019 activity (accounting for 31% of total volume—the highest percentage on record—according to Dealogic data). We anticipate overall levels of deal flow to remain healthy throughout 2020, though we may see pockets of subdued activity in certain sectors (for example, in health care, where corporations may elect to hold off on M&A until they have further clarity on the Democratic primary and U.S. elections later in 2020). Private equity (PE) should continue to spur activity, with the amount of unspent cash at PE firms reaching anall-time high of $1.5 trillion by some measures, about half of which is earmarked for dealmaking in North America.
On the regulatory front, concerns around the security and privacy of user data have come to the forefront. Most notably, Google’s pending acquisition of Fitbit has experienced volatility on concerns that regulators may view Google as a less diligent steward of sensitive health data and attempt to block the transaction. In addition, regulators—including the DOJ in the U.S. and the CMA in the UK—have become more bold in fighting transactions on the grounds of “potential competition” (which may never materialize) in instances where they believe large, established players may be attempting to take out nascent competitors in order to maintain monopolies, such as Illumina’s aforementioned acquisition of Pacific Biosciences. While these developments add new twists to assessing the likelihood of a deal’s success, we believe we navigated them well in 2019 and are well prepared to monitor them going forward.
Atyear-end, the portfolio’s allocation was heavily weighted toward hard catalyst events, particularly equity- and credit-based merger arbitrage situations. In the current environment, we intend to be opportunistic around soft catalyst special situations. While we see ample opportunity here, with a pipeline of spin-offs already announced for 2020 and a healthy flow of news around speculated M&A situations, these types of investments will likely become more attractive from a risk/reward perspective if the market experiences a
| Fund Summary | 39 | |||||
Table of Contents
pullback or encounters increased volatility. In the meantime, we have found several attractive opportunities to overweight merger arbitrage positions in definitive, announced transactions where our team sees avenues to profit through tangential catalysts even in the event of a deal break. As always, we intend to do so with a keen eye toward risk mitigation, attempting to isolate the portfolio from external forces as much as possible as we seek to generate returns sourced from the outcomes of idiosyncratic corporate events rather than the direction of broader markets.
Strategy Allocations
The fund remains weighted according to our strategic target allocation: 25% to DoubleLine; 19% each to DCI, Loomis Sayles and Water Island; and 18% to FPA. We use the fund’s daily cash flows to bring the manager allocations toward their targets when differences in shorter-term relative performance cause divergences.
CURRENT TARGET STRATEGY ALLOCATIONS AS OF DECEMBER 31, 2019
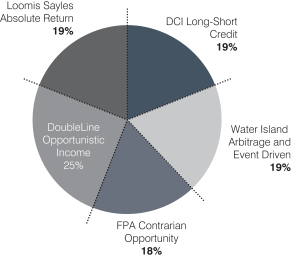
Closing Thoughts
As usual, our managers were selectively opportunistic throughout the year. The fund also benefited from a broad-based recovery in many asset classes. All things considered, we are pleased with the absolute performance, but more so when considering the relatively low level of risk assumed to produce it.
Overall, most of our managers remain relatively defensively positioned within their strategies, given the late stage of the economic and valuation cycles. We believe this bodes very well for the fund when the inevitable period of extended market volatility finally hits. Not only should the fund hold up well on the downside, but our managers should be well positioned to then go on the offensive, taking advantage of lower prices, wider credit and merger deal spreads, and other compelling opportunities.
In the meantime, all five managers had positive returns in 2019, which we don’t expect to always be the case. But there was wide divergence in performance (as there should be for strategies that have differing return drivers). FPA achieved the highest performance, which is consistent with having the most equity market exposure in a very strong year for the market. DoubleLine posted the lowest return in the fourth quarter, but the second highest for the year, continuing its consistently strong performance. DCI was also a standout, rebounding impressively from a subpar 2018.
Despite the fund’s solid year, we note that it slightly trailed the core bond index’s (Bloomberg Barclays U.S. Aggregate Bond Index, the “Agg”) surprisingly strong return, as Treasury yields dropped sharply on the year thanks to the Federal Reserve’s policyU-turn. Since inception, however, the fund’s cumulative return is over 70% more than the Agg with similar volatility and a slightly negative correlation.
We also prefer the fund’s risk/return profile compared to the Agg’s effective duration of almost 6 years and yield of only about 2.3%. (In other words, the core bond index is highly exposed to interest rate and inflation risk.) But in any given year, good investment decisions and sound portfolio construction can be trumped by simply owning duration and credit beta. While there are no guarantees in life or markets, we don’t expect this to be the case very frequently from the current yield and spread starting points.
In closing, we would like to highlight to fellow shareholders that during the year, with the cooperation of our outstandingsub-advisors, we were able to reduce the fund’s fees significantly. The adjusted expense ratio (before variable investment related expenses) is now
| 40 | Litman Gregory Funds Trust | |||||
Table of Contents
1.28%. This is down from 1.47% prior to the fee reduction. (The net expense ratio, which includes investment expenses like shorting and interest expenses, was 1.36% atyear-end, down from 1.54%.) We have always tried to provide a very strong and distinctive investment option at a very competitive fee, and we are happy to be able to improve the value proposition further through this fee reduction.
Sub-Advisor Portfolio Composition as of December 31, 2019
DCI Long-Short Credit Strategy
Bond Portfolio Top Five Sector Exposures
Consumer Discretionary | 17.9% | |||
Energy | 14.1% | |||
High Tech | 10.9% | |||
ConsumerNon-Discretionary | 9.9% | |||
Media | 8.0% |
CDS Portfolio Statistics
| Long | Short | |||||||
Number of Issuers | 93 | 76 | ||||||
Average Credit Duration | 4.7 | 4.7 | ||||||
Spread | 88 bps | 97 bps | ||||||
DoubleLine Opportunistic Income Strategy
Sector Exposures
Cash | -3.9% | |||
Agency Inverse Floaters | 7.0% | |||
Agency Inverse Interest-Only | 5.5% | |||
Agency CMO | 8.5% | |||
Agency PO | 2.6% | |||
Collateralized Loan Obligations | 5.8% | |||
Commercial MBS | 9.7% | |||
ABS | 5.7% | |||
Bank Loan | 5.3% | |||
Emerging Markets | 5.1% | |||
High Yield/Other | 0.2 | |||
Non-Agency Residential MBS | 48.5% | |||
|
| |||
TOTAL | 100.0% | |||
|
|
FPA Contrarian Opportunity Strategy
Asset Class Exposures
U.S. Stocks | 44.5% | |||
Foreign Stocks | 21.4% | |||
Bonds and Loans | 5.0% | |||
Limited Partnerships | 0.8% | |||
Short Sales | -6.5% | |||
Cash | 34.9% | |||
|
| |||
TOTAL | 100.0% | |||
|
|
Loomis Sayles Absolute Return Strategy
Strategy Exposures
| Long Total | Short Total | Net Exposure | ||||||||||
Investment-Grade Corp. | 34.9% | -0.6% | 34.4% | |||||||||
Securitized | 33.0% | -0.6% | 32.5% | |||||||||
High-Yield Corporate | 8.2% | 0.0% | 8.2% | |||||||||
Emerging Market | 3.8% | 0.0% | 3.8% | |||||||||
Bank Loans | 3.2% | 0.0% | 3.2% | |||||||||
Convertibles | 2.3% | 0.0% | 2.3% | |||||||||
Dividend Equity | 1.9% | -0.1% | 1.8% | |||||||||
Currency | 4.1% | -3.1% | 0.9% | |||||||||
Global Credit | 0.9% | 0.0% | 0.9% | |||||||||
Global Rates | 2.3% | -3.0% | -0.7% | |||||||||
Risk Management | 0.0% | -1.1% | -1.1% | |||||||||
Subtotal | 94.6% | -8.4% | 86.2% | |||||||||
Cash & Equivalents | 10.1% | 0.0% | 10.1% | |||||||||
Water Island Arbitrage and Event-Driven Strategy
Sub-Strategy Exposures
| Long | Short | Net | ||||||||||
Merger Arbitrage –Equity | 74.2% | -10.5% | 63.7% | |||||||||
Merger Arbitrage –Credit | 6.9% | -0.3% | 6.6% | |||||||||
Total Merger-Related | 81.0% | -10.8% | 70.3% | |||||||||
Special Situations –Equity | 1.9% | -0.7% | 1.2% | |||||||||
Special Situations –Credit | 2.7% | -0.1% | 2.6% | |||||||||
Total Special Situations | 4.7% | -0.8% | 3.8% | |||||||||
|
|
|
|
|
| |||||||
Total | 85.7% | -11.6% | 74.1% | |||||||||
|
|
|
|
|
| |||||||
| Fund Summary | 41 | |||||
Table of Contents
Litman Gregory Masters Alternative Strategies Fund Managers
| INVESTMENT MANAGER | FIRM | TARGET MANAGER ALLOCATION | Strategy | |||
| Stephen Kealhofer Paul Harrison Adam Dwinells | DCI, LLC | 19% | Long-Short Credit | |||
| Jeffrey Gundlach Jeffrey Sherman | DoubleLine Capital LP | 25% | Opportunistic Income | |||
| Steven Romick Brian Selmo Mark Landecker | First Pacific Advisors, LLC | 18% | Contrarian Opportunity | |||
| Matt Eagan Kevin Kearns Todd Vandam | Loomis Sayles & Company, LP | 19% | Absolute-Return | |||
| John Orrico Todd Munn Roger Foltynowicz Gregg Loprete | Water Island Capital, LLP | 19% | Arbitrage |
Alternative Strategies Fund Value of Hypothetical $100,000
The value of a hypothetical $100,000 investment in the Litman Gregory Masters Alternative Strategies Fund from September 30, 2011 to December 31, 2019 compared with the3-Month LIBOR, and Morningstar Multialternative Category.
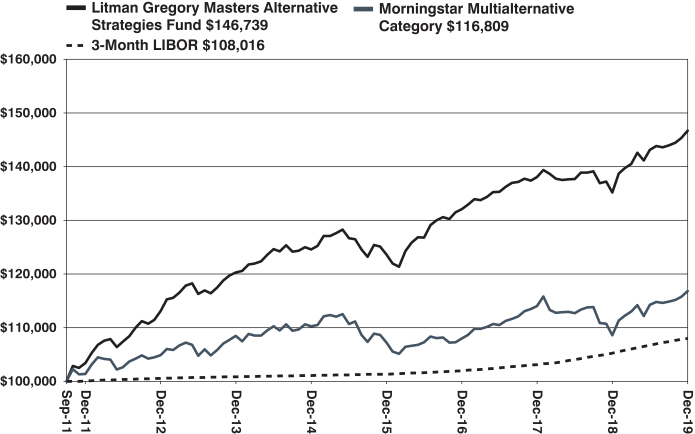
The hypothetical $100,000 investment at fund inception includes changes due to share price and reinvestment of dividends and capital gains. The chart does not imply future performance. Indexes are unmanaged, do not incur fees, expenses or taxes, and cannot be invested in directly.
| 42 | Litman Gregory Funds Trust | |||||
Table of Contents
Litman Gregory Masters Alternative Strategies Fund
SCHEDULE OF INVESTMENTS IN SECURITIES at December 31, 2019
| Shares | Value | |||||||
| COMMON STOCKS: 25.5% | ||||||||
| Communication Services: 4.6% | ||||||||
| 6,534 | Alphabet, Inc. - Class A* | $ | 8,751,574 | |||||
| 6,243 | Alphabet, Inc. - Class C*(a) | 8,347,016 | ||||||
| 1,359 | AT&T, Inc. | 53,110 | ||||||
| 37,729 | Baidu, Inc. - ADR* | 4,768,946 | ||||||
| 16,065 | Charter Communications, Inc. - Class A* | 7,792,810 | ||||||
| 63,157 | Clear Channel Outdoor Holdings, Inc.* | 180,629 | ||||||
| 192,735 | Comcast Corp. - Class A(a) | 8,667,293 | ||||||
| 26,056 | Discovery, Inc. - Class C*(a) | 794,448 | ||||||
| 114,390 | Escrow Altegrity, Inc.*(b) | 2,309,534 | ||||||
| 42,042 | Facebook, Inc. - Class A*(a) | 8,629,121 | ||||||
| 26,858 | iHeartMedia, Inc. - Class A* | 453,900 | ||||||
| 13,628 | NAVER Corp. | 2,197,779 | ||||||
| 169,600 | Nexon Co. Ltd.* | 2,263,102 | ||||||
| 662 | Omnicom Group, Inc. | 53,635 | ||||||
| 859 | Verizon Communications, Inc. | 52,743 | ||||||
| 1,157 | ViacomCBS, Inc. - Class B | 48,559 | ||||||
| 895,502 | Zayo Group Holdings, Inc.*(a) | 31,029,144 | ||||||
|
| |||||||
| 86,393,343 | ||||||||
|
| |||||||
| Consumer Discretionary: 2.0% | ||||||||
| 9,139 | Alibaba Group Holding Ltd. - ADR* | 1,938,382 | ||||||
| 591 | Best Buy Co., Inc. | 51,890 | ||||||
| 373 | Expedia Group, Inc. | 40,336 | ||||||
| 531 | Garmin Ltd. | 51,804 | ||||||
| 236 | Home Depot, Inc. (The) | 51,538 | ||||||
| 146,380 | JD.com, Inc. - ADR* | 5,156,968 | ||||||
| 228 | McDonald’s Corp. | 45,055 | ||||||
| 11,384 | Mohawk Industries, Inc.* | 1,552,550 | ||||||
| 39,924 | Naspers Ltd. - Class N | 6,543,195 | ||||||
| 47,290 | Porsche Automobil Holding SE - (Preference Shares) | 3,537,924 | ||||||
| 38,283 | Prosus N.V.* | 2,859,352 | ||||||
| 68,191 | Regis Corp.* | 1,218,573 | ||||||
| 597 | Starbucks Corp. | 52,488 | ||||||
| 404 | Target Corp. | 51,797 | ||||||
| 103,728 | Tiffany & Co.(a) | 13,863,247 | ||||||
| 521 | Yum! Brands, Inc. | 52,480 | ||||||
|
| |||||||
| 37,067,579 | ||||||||
|
| |||||||
| Consumer Staples: 0.2% | ||||||||
| 1,005 | Altria Group, Inc. | 50,159 | ||||||
| 600 | Philip Morris International, Inc. | 51,054 | ||||||
| 426,458 | Pioneer Foods Group Ltd. | 3,351,559 | ||||||
| 442 | Procter & Gamble Co. (The) | 55,206 | ||||||
| 569 | Tyson Foods, Inc. - Class A | 51,802 | ||||||
|
| |||||||
| 3,559,780 | ||||||||
|
| |||||||
| Energy: 0.3% | ||||||||
| 167,176 | Bellatrix Exploration Ltd.*(b) | 0 | ||||||
| 220 | Dommo Energia S.A. - ADR* | 2,139 | ||||||
| 1,848 | Enterprise Products Partners L.P. | 52,040 | ||||||
| 18,829 | Halcon Resources Corp.*(b) | 269,820 | ||||||
| 272,954 | Kinder Morgan, Inc. | 5,778,436 | ||||||
| 828 | Magellan Midstream Partners L.P. | 52,056 | ||||||
| 1,578 | McDermott International, Inc.* | 0 | ||||||
| 480 | Phillips 66 | 53,477 | ||||||
| 2,642 | Plains GP Holdings L.P. - Class A* | 50,066 | ||||||
| Shares | Value | |||||||
| Energy (continued) | ||||||||
| 21,289 | Whiting Petroleum Corp.* | $ | 156,261 | |||||
|
| |||||||
| 6,414,295 | ||||||||
|
| |||||||
| Financials: 3.8% | ||||||||
| 137,819 | Ally Financial, Inc.(a) | 4,211,749 | ||||||
| 264,556 | American International Group, Inc.(a) | 13,579,660 | ||||||
| 18,812 | Aon Plc | 3,918,351 | ||||||
| 147 | Apollo Global Management, Inc. | 7,013 | ||||||
| 189,317 | Bank of America Corp. | 6,667,745 | ||||||
| 100,374 | CIT Group, Inc.(a) | 4,580,066 | ||||||
| 116,462 | Citigroup, Inc.(a) | 9,304,149 | ||||||
| 74,253 | Groupe Bruxelles Lambert S.A. | 7,832,514 | ||||||
| 235,722 | Jefferies Financial Group, Inc.(a) | 5,037,379 | ||||||
| 27,677 | LPL Financial Holdings, Inc. | 2,553,203 | ||||||
| 1,020 | MetLife, Inc. | 51,989 | ||||||
| 882 | Popular, Inc. | 51,818 | ||||||
| 729 | Progressive Corp. (The) | 52,772 | ||||||
| 439 | Prudential Financial, Inc. | 41,152 | ||||||
| 1,226,744 | Royal Bank of Scotland Group Plc | 3,911,525 | ||||||
| 10,566 | Signature Bank | 1,443,421 | ||||||
| 1,761 | Unum Group | 51,351 | ||||||
| 132,636 | Wells Fargo & Co.(a) | 7,135,817 | ||||||
|
| |||||||
| 70,431,674 | ||||||||
|
| |||||||
| Health Care: 5.5% | ||||||||
| 582 | AbbVie, Inc. | 51,530 | ||||||
| 142,134 | Allergan Plc(a) | 27,171,757 | ||||||
| 582 | AmerisourceBergen Corp. | 49,482 | ||||||
| 215 | Amgen, Inc. | 51,830 | ||||||
| 130,394 | Audentes Therapeutics, Inc.* | 7,802,777 | ||||||
| 823 | Bristol-Myers Squibb Co. | 52,828 | ||||||
| 789 | Gilead Sciences, Inc. | 51,269 | ||||||
| 141 | Humana, Inc. | 51,679 | ||||||
| 368 | Johnson & Johnson | 53,680 | ||||||
| 218,342 | Medicines Co. (The)* | 18,545,970 | ||||||
| 608 | Merck & Co., Inc. | 55,298 | ||||||
| 170,800 | Olympus Corp. | 2,654,776 | ||||||
| 1,074,481 | Pacific Biosciences of California, Inc.*(a) | 5,522,832 | ||||||
| 137,303 | Paratek Pharmaceuticals, Inc.*(a) | 553,331 | ||||||
| 1,332 | Pfizer, Inc. | 52,188 | ||||||
| 175 | UnitedHealth Group, Inc. | 51,447 | ||||||
| 110,867 | WellCare Health Plans, Inc.* | 36,609,392 | ||||||
| 107,982 | Wright Medical Group N.V.*(a) | 3,291,291 | ||||||
|
| |||||||
| 102,673,357 | ||||||||
|
| |||||||
| Industrials: 3.5% | ||||||||
| 416,411 | Advanced Disposal Services, Inc.*(a) | 13,687,430 | ||||||
| 448,042 | Arconic, Inc.(a) | 13,786,252 | ||||||
| 354 | Caterpillar, Inc. | 52,279 | ||||||
| 4,162,075 | Cobham Plc | 9,070,968 | ||||||
| 287 | Cummins, Inc. | 51,362 | ||||||
| 242 | Delta Air Lines, Inc. | 14,152 | ||||||
| 547 | Eaton Corp. Plc | 51,812 | ||||||
| 22,826 | HD Supply Holdings, Inc.*(a) | 918,062 | ||||||
| 9,456 | Herc Holdings, Inc.*(a) | 462,777 | ||||||
| 303 | Honeywell International, Inc. | 53,631 | ||||||
| 290 | Illinois Tool Works, Inc. | 52,093 | ||||||
| 54,870 | Jardine Strategic Holdings Ltd. | 1,681,765 | ||||||
| 135 | Lockheed Martin Corp. | 52,566 | ||||||
| 312,879 | Meggitt Plc | 2,726,766 | ||||||
| 159 | Rockwell Automation, Inc. | 32,225 | ||||||
| 28,613 | Rush Enterprises, Inc. - Class A(a) | 1,330,504 | ||||||
The accompanying notes are an integral part of these financial statements.
| Schedule of Investments | 43 | |||||
Table of Contents
Litman Gregory Masters Alternative Strategies Fund
SCHEDULE OF INVESTMENTS IN SECURITIES at December 31, 2019 (Continued)
| Shares | Value | |||||||
| COMMON STOCKS (CONTINUED) | ||||||||
| Industrials (continued) | ||||||||
| 17,500 | Sound Holding FP Luxemburg*(b) | $ | 634,304 | |||||
| 51,848 | United Technologies Corp.(a) | 7,764,756 | ||||||
| 67,419 | Univar, Inc.* | 1,634,237 | ||||||
| 79,794 | WABCO Holdings, Inc.*(a) | 10,812,087 | ||||||
|
| |||||||
| 64,870,028 | ||||||||
|
| |||||||
| Information Technology: 4.1% | ||||||||
| 119,216 | Altran Technologies S.A. | 1,895,143 | ||||||
| 82,603 | Analog Devices, Inc.(a) | 9,816,540 | ||||||
| 111,265 | Anixter International, Inc.*(a) | 10,247,506 | ||||||
| 60 | Apple, Inc. | 17,619 | ||||||
| 863 | Applied Materials, Inc. | 52,677 | ||||||
| 316 | Automatic Data Processing, Inc. | 53,878 | ||||||
| 30,603 | Broadcom, Inc. | 9,671,160 | ||||||
| 1,107 | Cisco Systems, Inc. | 53,092 | ||||||
| 395 | Fidelity National Information Services, Inc. | 54,941 | ||||||
| 1,432 | Hewlett Packard Enterprise Co. | 22,712 | ||||||
| 50,621 | HP, Inc.(a) | 1,040,262 | ||||||
| 900 | Intel Corp. | 53,865 | ||||||
| 26 | Intuit, Inc. | 6,810 | ||||||
| 299 | KLA-Tencor Corp. | 53,273 | ||||||
| 64 | Lam Research Corp. | 18,714 | ||||||
| 545 | Leidos Holdings, Inc. | 53,350 | ||||||
| 52,277 | LogMeIn, Inc. | 4,482,230 | ||||||
| 176 | MasterCard, Inc. - Class A | 52,552 | ||||||
| 130,939 | Mellanox Technologies Ltd.* | 15,343,432 | ||||||
| 46,760 | Microsoft Corp. | 7,374,052 | ||||||
| 159,124 | MINDBODY, Inc. - Class A* | 5,808,026 | ||||||
| 56,952 | NortonLifeLock, Inc. | 1,453,415 | ||||||
| 925 | Oracle Corp. | 49,006 | ||||||
| 613 | Paychex, Inc. | 52,142 | ||||||
| 590 | Qualcomm, Inc. | 52,056 | ||||||
| 240,839 | Sophos Group Plc(c) | 1,783,197 | ||||||
| 78,786 | TE Connectivity Ltd.(a) | 7,550,850 | ||||||
| 394 | Texas Instruments, Inc. | 50,546 | ||||||
| 262 | Universal Display Corp. | 53,990 | ||||||
| 90 | Visa, Inc. - Class A | 16,911 | ||||||
|
| |||||||
| 77,233,947 | ||||||||
|
| |||||||
| Materials: 1.2% | ||||||||
| 41,538 | Axalta Coating Systems Ltd.*(a) | 1,262,755 | ||||||
| 9,089 | Cabot Corp. | 431,909 | ||||||
| 357,443 | Cemex SAB de C.V. - ADR | 1,351,135 | ||||||
| 1,055 | CF Industries Holdings, Inc. | 50,366 | ||||||
| 1,281,923 | Glencore Plc | 4,003,266 | ||||||
| 69,860 | HeidelbergCement AG | 5,094,702 | ||||||
| 58,729 | Hexion Holdings Corp. - Class B* | 707,684 | ||||||
| 149,438 | LafargeHolcim Ltd. | 8,289,676 | ||||||
| 86 | LyondellBasell Industries N.V. - Class A | 8,125 | ||||||
| 129,990 | O-I Glass, Inc. | 1,550,781 | ||||||
|
| |||||||
| 22,750,399 | ||||||||
|
| |||||||
| Real Estate: 0.0% | ||||||||
| 1,574 | Iron Mountain, Inc. | 50,163 | ||||||
|
| |||||||
| Shares | Value | |||||||
| Utilities: 0.3% | ||||||||
| 503 | Duke Energy Corp. | $ | 45,879 | |||||
| 562 | Evergy, Inc. | 36,580 | ||||||
| 1,145 | Exelon Corp. | 52,200 | ||||||
| 653 | FirstEnergy Corp. | 31,736 | ||||||
| 151,932 | Pattern Energy Group, Inc. - Class A(a) | 4,064,941 | ||||||
| 51,738 | PG&E Corp.* | 562,392 | ||||||
|
| |||||||
| 4,793,728 | ||||||||
|
| |||||||
| | TOTAL COMMON STOCKS | 476,238,293 | ||||||
|
| |||||||
| RIGHTS/WARRANTS: 0.0% | ||||||||
| 17,471 | Avaya Holdings Corp. (Expiration date 12/15/22)* | 34,942 | ||||||
|
| |||||||
| | TOTAL RIGHTS/WARRANTS | 34,942 | ||||||
|
| |||||||
| PREFERRED STOCKS: 0.2% | ||||||||
| Consumer Staples: 0.1% | ||||||||
| Bunge Ltd. |
| |||||||
| 16,579 | 4.875%, 12/20/2165(d) | 1,721,232 | ||||||
|
| |||||||
| Energy: 0.0% | ||||||||
Chesapeake Energy Corp. |
| |||||||
| 506 | 5.750%, 08/15/2166(d) | 103,730 | ||||||
El Paso Energy Capital Trust I |
| |||||||
| 528 | 4.750%, 03/31/2028 | 27,171 | ||||||
|
| |||||||
| 130,901 | ||||||||
|
| |||||||
| Industrials: 0.1% | ||||||||
Element Communication Aviation |
| |||||||
| 170 | 12.000%, 03/16/2040(b) | 1,468,800 | ||||||
|
| |||||||
| | TOTAL PREFERRED STOCKS | 3,320,933 | ||||||
|
| |||||||
| Principal Amount^ | ||||||||
| ASSET-BACKED SECURITIES: 9.5% | ||||||||
ACC Trust | ||||||||
| $8,248 | Series2018-1-A | 8,254 | ||||||
Accelerated Assets LLC | ||||||||
| 233,729 | Series2018-1-B | 239,485 | ||||||
Adams Outdoor Advertising L.P. | ||||||||
| 919,665 | Series2018-1-A | 955,568 | ||||||
AIM Aviation Finance Ltd. | ||||||||
| 689,636 | Series2015-1A-B1 | 689,122 | ||||||
Ajax Mortgage Loan Trust | ||||||||
| 350,635 | Series2017-B-A | 351,658 | ||||||
Ally Auto Receivables Trust | ||||||||
| 639,082 | Series2017-4-A3 | 638,648 | ||||||
| 1,625,000 | Series2019-4-A3 | 1,622,982 | ||||||
The accompanying notes are an integral part of these financial statements.
| 44 | Litman Gregory Funds Trust | |||||
Table of Contents
Litman Gregory Masters Alternative Strategies Fund
SCHEDULE OF INVESTMENTS IN SECURITIES at December 31, 2019 (Continued)
| Principal Amount^ | Value | |||||||
| ASSET-BACKED SECURITIES (CONTINUED) | ||||||||
| American Express Credit Account Master Trust | ||||||||
| $ 525,000 | Series2019-1-A | $ | 537,061 | |||||
| American Homes 4 Rent | ||||||||
| 875,000 | Series2014-SFR2-E | 974,215 | ||||||
| 600,000 | Series2014-SFR3-E | 674,856 | ||||||
| 845,000 | Series2015-SFR1-E | 911,393 | ||||||
| AmeriCredit Automobile Receivables Trust | ||||||||
| 795,000 | Series2018-2-D | 828,433 | ||||||
| Americredit Automobile Receivables Trust | ||||||||
| 1,010,000 | Series2018-3-D | 1,055,576 | ||||||
| AmeriCredit Automobile Receivables Trust | ||||||||
| 630,000 | Series2019-3-A3 | 630,684 | ||||||
| AMSR Trust | ||||||||
| 335,000 | Series2019-SFR1-B | 331,233 | ||||||
| Apidos CLO XX | ||||||||
| 265,000 | Series2015-20A-BRR | 260,445 | ||||||
| Apidos CLO XXI | ||||||||
| 500,000 | Series2015-21A-ER | 441,519 | ||||||
Apidos CLO XXII | ||||||||
| 500,000 | Series2015-22A-D | 500,493 | ||||||
Apidos CLO XXIV | ||||||||
| 1,000,000 | Series2016-24A-DR | 956,955 | ||||||
| Ascentium Equipment Receivables Trust | ||||||||
| 95,000 | Series2017-2A-C | 95,887 | ||||||
Atrium XII | ||||||||
| 260,000 | Series12A-AR | 259,636 | ||||||
Atrium XIII | ||||||||
| 500,000 | Series13A-E | 490,345 | ||||||
Atrium XIV LLC | ||||||||
| 750,000 | Series14A-E | 722,412 | ||||||
| Principal Amount^ | Value | |||||||
Avid Automobile Receivables Trust | ||||||||
| $ 180,000 | Series2019-1-C | $ | 179,511 | |||||
BA Credit Card Trust | ||||||||
| 1,940,000 | Series2018-A1-A1 | 1,959,357 | ||||||
Barings CLO Ltd. | ||||||||
| 1,000,000 | Series2018-3A-E | 949,114 | ||||||
| 500,000 | Series2018-4A-E | 481,250 | ||||||
| Bayview Opportunity Master Fund IVa Trust | ||||||||
| 178,647 | Series2019-RN2-A1 | 179,054 | ||||||
| Bayview Opportunity Master Fund IVb Trust | ||||||||
| 183,518 | Series2019-RN1-A1 | 183,704 | ||||||
| Blackbird Capital Aircraft Lease Securitization Ltd. | ||||||||
| 286,198 | Series2016-1A-A | 292,469 | ||||||
| 265,755 | Series2016-1A-B | 276,179 | ||||||
Buttermilk Park CLO Ltd. | ||||||||
| 750,000 | Series2018-1A-E | 716,387 | ||||||
| California Republic Auto Receivables Trust | ||||||||
| 520,000 | Series2018-1-D | 538,386 | ||||||
| Canyon Capital CLO Ltd. | ||||||||
| 1,000,000 | Series2016-1A-ER | 914,523 | ||||||
| 500,000 | Series2018-1A-E | 460,617 | ||||||
| Capital One Multi-Asset Execution Trust | ||||||||
| 745,000 | Series2019-A1-A1 | 760,449 | ||||||
| Carlyle Global Market Strategies CLO Ltd. | ||||||||
| 500,000 | Series2014-2RA-D | 440,892 | ||||||
| CarMax Auto Owner Trust | ||||||||
| 8,384 | Series2018-1-A2B | 8,384 | ||||||
| 445,000 | Series2018-2-D | 458,444 | ||||||
| 641,607 | Series2018-3-A2B | 641,740 | ||||||
| 305,000 | Series2018-4-D | 316,441 | ||||||
The accompanying notes are an integral part of these financial statements.
| Schedule of Investments | 45 | |||||
Table of Contents
Litman Gregory Masters Alternative Strategies Fund
SCHEDULE OF INVESTMENTS IN SECURITIES at December 31, 2019 (Continued)
| Principal Amount^ | Value | |||||||
| ASSET-BACKED SECURITIES (CONTINUED) | ||||||||
| Castlelake Aircraft Securitization Trust | ||||||||
| $ 227,442 | Series2018-1-B | $ | 231,704 | |||||
| 3,705,609 | Series2018-1-C | 3,730,661 | ||||||
| Castlelake Aircraft Structured Trust | ||||||||
| 3,000,000 | Series2019-1A-E | 2,962,500 | ||||||
| Catskill Park CLO Ltd. | ||||||||
| 1,000,000 | Series2017-1A-D | 982,592 | ||||||
| CCG Receivables Trust | ||||||||
| 100,000 | Series2018-1-C | 101,211 | ||||||
| Chenango Park CLO Ltd. | ||||||||
| 500,000 | Series2018-1A-D | 478,304 | ||||||
| Chesapeake Funding II LLC | ||||||||
| 180,000 | Series2017-2A-D | 182,431 | ||||||
| 338,778 | Series2017-4A-A2 | 338,971 | ||||||
| 250,000 | Series2018-1A-C | 254,905 | ||||||
| 640,000 | Series2018-1A-D | 650,304 | ||||||
| CIG Auto Receivables Trust | ||||||||
| 24,226 | Series2017-1A-A | 24,254 | ||||||
| Citibank Credit Card Issuance Trust | ||||||||
| 2,000,000 | Series2018-A1-A1 | 2,014,004 | ||||||
| Citigroup Mortgage Loan Trust, Inc. | ||||||||
| 1,033,531 | Series2019-E-A1 | 1,035,540 | ||||||
| Coinstar Funding LLC | ||||||||
| 1,072,500 | Series2017-1A-A2 | 1,101,419 | ||||||
| Colony American Finance Ltd. | ||||||||
| 480,000 | Series2015-1-D | 483,619 | ||||||
| 230,000 | Series2016-1-C | 232,309 | ||||||
| Cook Park CLO Ltd. | ||||||||
| 1,000,000 | Series2018-1A-E | 947,922 | ||||||
| CPS Auto Receivables Trust | ||||||||
| 220,000 | Series2017-D-D | 223,149 | ||||||
| 105,000 | Series2018-A-C | 105,584 | ||||||
| 490,000 | Series2018-D-C | 499,133 | ||||||
| 310,000 | Series2019-D-D | 308,978 | ||||||
| Principal Amount^ | Value | |||||||
| Credit Acceptance Auto Loan Trust | ||||||||
| $ 775,000 | Series2018-2A-C | $ | 801,280 | |||||
| CSAB Mortgage-Backed Trust | ||||||||
| 1,857,684 | Series2006-2-A6B | 274,323 | ||||||
| CVP CascadeCLO-2 Ltd. | ||||||||
| 618,841 | Series2014-2A-A1R | 618,911 | ||||||
| DB Master Finance LLC | ||||||||
| 330,340 | Series2019-1A-A23 | 342,911 | ||||||
| Diamond Resorts Owner Trust | ||||||||
| 99,840 | Series2017-1A-C | 102,317 | ||||||
| 437,183 | Series2018-1-C | 447,271 | ||||||
| 362,437 | Series2019-1A-B | 362,452 | ||||||
| Discover Card Execution Note Trust | ||||||||
| 1,585,000 | Series2018-A3-A3 | 1,588,388 | ||||||
| Domino’s Pizza Master Issuer LLC | ||||||||
| 720,300 | Series2017-1A-A23 | 747,227 | ||||||
| 59,250 | Series2018-1A-A2I | 61,041 | ||||||
| 325,875 | Series2018-1A-A2II | 339,895 | ||||||
| 500,000 | Series2019-1A-A2 | 500,710 | ||||||
| Dorchester Park CLO Ltd. | ||||||||
| 500,000 | Series2015-1A-ER | 490,893 | ||||||
| Drive Auto Receivables Trust | ||||||||
| 975,000 | Series2018-1-D | 991,311 | ||||||
| 85,000 | Series2018-3-D | 87,210 | ||||||
| 630,000 | Series2018-5-D | 650,886 | ||||||
| Driven Brands Funding LLC | ||||||||
| 231,475 | Series2018-1A-A2 | 240,477 | ||||||
| Dryden 40 Senior Loan Fund | ||||||||
| 1,000,000 | Series2015-40A-ER | 949,854 | ||||||
| Dryden 45 Senior Loan Fund | ||||||||
| 275,000 | Series2016-45A-ER | 263,801 | ||||||
| Dryden 55 CLO Ltd. | ||||||||
| 500,000 | Series2018-55A-F | 412,014 | ||||||
The accompanying notes are an integral part of these financial statements.
| 46 | Litman Gregory Funds Trust | |||||
Table of Contents
Litman Gregory Masters Alternative Strategies Fund
SCHEDULE OF INVESTMENTS IN SECURITIES at December 31, 2019 (Continued)
| Principal Amount^ | Value | |||||||
| ASSET-BACKED SECURITIES (CONTINUED) | ||||||||
DT Auto Owner Trust | ||||||||
| $ 416,611 | Series2016-1A-D | $ | 417,121 | |||||
| 410,000 | Series2018-2A-D | 420,518 | ||||||
| 585,000 | Series2018-3A-C | 594,537 | ||||||
Earnest Student Loan Program LLC | ||||||||
| 13,000 | Series2016-D-R | 320,600 | ||||||
Elevation CLO Ltd. | ||||||||
| 649,597 | Series2015-4A-AR | 649,676 | ||||||
Fairstone Financial Issuance Trust | ||||||||
| 670,000 (CAD) | Series2019-1A-A | 519,303 | ||||||
Fillmore Park CLO Ltd. | ||||||||
| 500,000 | Series2018-1A-E | 476,777 | ||||||
First Investors Auto Owner Trust | ||||||||
| 160,000 | Series2019-2A-D | 159,931 | ||||||
| 365,000 | Series2019-2A-E | 364,001 | ||||||
Five Guys Funding LLC | ||||||||
| 674,900 | Series2017-1A-A2 | 701,024 | ||||||
Flagship Credit Auto Trust | ||||||||
| 300,000 | Series2016-3-E | 313,004 | ||||||
| 700,000 | Series2019-2-D | 713,705 | ||||||
Flatiron CLO Ltd. | ||||||||
| 276,636 | Series2015-1A-AR | 276,643 | ||||||
Galaxy XXVI CLO Ltd. | ||||||||
| 715,000 | Series2018-26A-E | 677,025 | ||||||
Genesis Sales Finance Master Trust | ||||||||
| 145,000 | Series2019-AA-A | 147,645 | ||||||
Gilbert Park CLO Ltd. | ||||||||
| 500,000 | Series2017-1A-E | 495,095 | ||||||
| Global Container Assets 2014 Holdings Ltd. | ||||||||
| 743,957 | Series2014-1-C | 619,642 | ||||||
| 336,501 | Series2014-1-D | 199,377 | ||||||
| 1,185,000 | Series2014-1-E | 0 | ||||||
| Principal Amount^ | Value | |||||||
Global Container Assets Ltd. | ||||||||
| $ 163,418 | Series2015-1A-B | $ | 161,536 | |||||
| GM Financial Consumer Automobile Receivables Trust | ||||||||
| 244,674 | Series2018-3-A2B | 244,633 | ||||||
GSAA Home Equity Trust | ||||||||
| 660,073 | Series2006-10-AF5 | 292,227 | ||||||
Halcyon Loan Advisors Funding Ltd. | ||||||||
| 399,824 | Series2014-2A-A1BR | 399,873 | ||||||
Harbour Aircraft Investments Ltd. | ||||||||
| 1,340,295 | Series2017-1-C | 1,345,872 | ||||||
Harley Marine Financing LLC | ||||||||
| 946,973 | Series2018-1A-A2 | 846,198 | ||||||
Hertz Vehicle Financing II L.P. | ||||||||
| 365,000 | Series2017-2A-A | 373,365 | ||||||
Highbridge Loan Management Ltd. | ||||||||
| 500,000 | Series2013-2A-DR | 490,247 | ||||||
Honda Auto Receivables Owner Trust | ||||||||
| 227,865 | Series2017-3-A3 | 227,769 | ||||||
| 690,000 | Series2019-1-A3 | 700,687 | ||||||
Horizon Aircraft Finance I Ltd. | ||||||||
| 2,613,401 | Series2018-1-C | 2,620,648 | ||||||
InSite Issuer LLC | ||||||||
| 3,500,000 | Series2016-1A-C | 3,640,221 | ||||||
Invitation Homes Trust | ||||||||
| 714,902 | Series2018-SFR1-E | 716,660 | ||||||
| 1,225,000 | Series2018-SFR2-E | 1,229,995 | ||||||
Jamestown CLO VII Ltd. | ||||||||
| 734,477 | Series2015-7A-A1R | 733,394 | ||||||
| JP Morgan Mortgage Acquisition Trust | ||||||||
| 1,000,000 | Series2007-CH1-AF5 | 1,068,204 | ||||||
Kestrel Aircraft Funding Ltd. | ||||||||
| 553,327 | Series2018-1A-A | 562,949 | ||||||
LCM 26 Ltd. | ||||||||
| 500,000 | Series26A-E | 455,229 | ||||||
The accompanying notes are an integral part of these financial statements.
| Schedule of Investments | 47 | |||||
Table of Contents
Litman Gregory Masters Alternative Strategies Fund
SCHEDULE OF INVESTMENTS IN SECURITIES at December 31, 2019 (Continued)
| Principal Amount^ | Value | |||||||
| ASSET-BACKED SECURITIES (CONTINUED) | ||||||||
| LCM Loan Income Fund I Income Note Issuer Ltd. | ||||||||
| $ 500,000 | Series27A-E | $ | 466,970 | |||||
LCM XVII L.P. | ||||||||
| 1,000,000 | Series17A-ER | 916,012 | ||||||
LCM XX L.P. | ||||||||
| 500,000 | Series20A-ER | 484,780 | ||||||
| Lehman XS Trust | ||||||||
| 2,734,522 | Series2005-6-3A3A | 1,889,866 | ||||||
| 533,455 | Series2006-8-3A3 | 538,408 | ||||||
| Limerock CLO III LLC | ||||||||
| 142,869 | Series2014-3A-A1R | 142,944 | ||||||
| Madison Park Funding XII Ltd. | ||||||||
| 250,000 | Series2014-12A-B1R | 250,060 | ||||||
| Madison Park Funding XIV Ltd. | ||||||||
| 1,000,000 | Series2014-14A-ER | 940,239 | ||||||
| Madison Park Funding XXXI Ltd. | ||||||||
| 270,000 | Series2018-31A-C | 268,739 | ||||||
| MAPS Ltd. | ||||||||
| 645,132 | Series2018-1A-A | 657,292 | ||||||
| 293,577 | Series2019-1A-A | 302,933 | ||||||
| Marlette Funding Trust | ||||||||
| 209,881 | Series2019-1A-A | 211,445 | ||||||
| 341,656 | Series2019-3A-A | 342,993 | ||||||
| Master Asset-Backed Securities Trust | ||||||||
| 11,297,531 | Series2006-NC3-A3 | 7,361,697 | ||||||
| Milos CLO Ltd. | ||||||||
| 310,000 | Series2017-1A-E | 306,803 | ||||||
| Mosaic Solar Loans LLC | ||||||||
| 1,823,431 | Series2017-2A-B | 1,868,487 | ||||||
| Motor Plc | ||||||||
| 229,625 | Series2017-1A-A1 | 229,698 | ||||||
| Principal Amount^ | Value | |||||||
| Mountain View CLO X Ltd. | ||||||||
| $ 865,000 | Series2015-10A-AR | $ | 863,702 | |||||
| MVW Owner Trust | ||||||||
| 142,624 | Series2019-1A-C | 144,282 | ||||||
| Myers Park CLO Ltd. | ||||||||
| 1,000,000 | Series2018-1A-E | 965,497 | ||||||
| Navient Private Education Refi Loan Trust | ||||||||
| 260,000 | Series2018-A-B | 264,997 | ||||||
| 855,000 | Series2019-FA-B | 832,610 | ||||||
| 180,000 | Series2019-GA-B | 176,723 | ||||||
| Navistar Financial Dealer Note Master Owner Trust | ||||||||
| 310,000 | Series2018-1-A | 310,564 | ||||||
| Neuberger Berman CLOXVI-S Ltd. | ||||||||
| 500,000 | Series2017-16SA-E | 497,531 | ||||||
| Neuberger Berman CLO XXIII Ltd. | ||||||||
| 1,000,000 | Series2016-23A-ER | 983,931 | ||||||
| Neuberger Berman Loan Advisers CLO 24 Ltd. | ||||||||
| 1,000,000 | Series2017-24A-E | 985,313 | ||||||
| Neuberger Berman Loan Advisers CLO 26 Ltd. | ||||||||
| 1,000,000 | Series2017-26A-INC | 744,323 | ||||||
| NextGear Floorplan Master Owner Trust | ||||||||
| 1,940,000 | Series2017-1A-A1 | 1,942,735 | ||||||
| 1,210,000 | Series2017-2A-A1 | 1,212,917 | ||||||
| 845,000 | Series2018-1A-A1 | 847,297 | ||||||
| Nissan Auto Receivables Owner Trust | ||||||||
| 1,041,225 | Series2018-A-A3 | 1,045,749 | ||||||
| 343,901 | Series2018-B-A2B | 343,884 | ||||||
| NRZ Excess Spread-Collateralized Notes | ||||||||
| 1,865,412 | Series2018-PLS2-D | 1,880,106 | ||||||
The accompanying notes are an integral part of these financial statements.
| 48 | Litman Gregory Funds Trust | |||||
Table of Contents
Litman Gregory Masters Alternative Strategies Fund
SCHEDULE OF INVESTMENTS IN SECURITIES at December 31, 2019 (Continued)
| Principal Amount^ | Value | |||||||
| ASSET-BACKED SECURITIES (CONTINUED) | ||||||||
| OCP CLO Ltd. | ||||||||
| $ 415,000 | Series2015-10A-A1R | $ | 414,764 | |||||
| Octagon Investment Partners 26 Ltd. | ||||||||
| 1,000,000 | Series2016-1A-FR | 843,421 | ||||||
| Octagon Investment Partners 39 Ltd. | ||||||||
| 275,000 | Series2018-3A-E | 264,075 | ||||||
| Octagon Investment Partners XVI Ltd. | ||||||||
| 1,000,000 | Series2013-1A-ER | 934,323 | ||||||
| 1,500,000 | Series2013-1A-SUB | 458,670 | ||||||
| Octagon Investment Partners XXI Ltd. | ||||||||
| 500,000 | Series2014-1A-DRR | 492,490 | ||||||
| OneMain Financial Issuance Trust | ||||||||
| 675,000 | Series2015-3A-B | 678,216 | ||||||
| 1,000,000 | Series2016-1A-C | 1,017,617 | ||||||
| Oxford Finance Funding LLC | ||||||||
| 180,000 | Series2019-1A-A2 | 182,779 | ||||||
| Parallel Ltd. | ||||||||
| 840,000 | Series2015-1A-AR | 839,464 | ||||||
| Park Place Securities, Inc. Asset-Backed Pass-Through Certificates | ||||||||
| 8,000,000 | Series2005-WHQ1-M5 | 7,992,579 | ||||||
| Penarth Master Issuer Trust | ||||||||
| 300,000 | Series2019-1A | 300,010 | ||||||
| Planet Fitness Master Issuer LLC | ||||||||
| 854,188 | Series2018-1A-A2I | 870,611 | ||||||
| 630,000 | Series2019-1A-A2 | 621,815 | ||||||
| PNMAC FMSR Issuer Trust | ||||||||
| 7,300,000 | Series2018-FT1-A | 7,318,634 | ||||||
| Prestige Auto Receivables Trust | ||||||||
| 200,000 | Series2019-1A-E | 201,602 | ||||||
| Preston Ridge Partners Mortgage LLC | ||||||||
| 217,705 | Series2017-3A-A1 | 218,391 | ||||||
| Principal Amount^ | Value | |||||||
| $ 120,000 | Series2017-3A-A2 | $ | 119,712 | |||||
| 275,000 | Series2018-1A-A2 | 276,116 | ||||||
| 480,793 | Series2019-4A-A1 | 482,130 | ||||||
| Progress Residential Trust | ||||||||
| 210,000 | Series2017-SFR2-E | 211,399 | ||||||
| 125,000 | Series2018-SFR2-E | 127,914 | ||||||
| 530,000 | Series2019-SFR1-E | 541,020 | ||||||
| 235,000 | Series2019-SFR3-D | 232,087 | ||||||
| Republic FInance Issuance Trust | ||||||||
| 1,000,000 | Series2019-A-A | 998,893 | ||||||
| S-Jets Ltd. | ||||||||
| 1,181,234 | Series2017-1-A | 1,183,603 | ||||||
| Santander Drive Auto Receivables Trust | ||||||||
| 1,120,000 | Series2018-2-D | 1,147,383 | ||||||
| 975,000 | Series2018-3-D | 1,001,009 | ||||||
| 735,000 | Series2018-5-C | 746,127 | ||||||
| 875,000 | Series2019-2-D | 893,038 | ||||||
| SCF Equipment Leasing LLC | ||||||||
| 1,135,000 | Series2018-1A-C | 1,140,637 | ||||||
| SLM Private Credit Student Loan Trust | ||||||||
| 313,000 | Series2003-A-A3 | 313,356 | ||||||
| 812,000 | Series2003-B-A3 | 812,516 | ||||||
| 71,000 | Series2003-B-A4 | 71,136 | ||||||
| SMB Private Education Loan Trust | ||||||||
| 323,955 | Series2017-B-A2B | 323,013 | ||||||
| SoFi Consumer Loan Program Trust | ||||||||
| 620,000 | Series2018-2-A2 | 623,851 | ||||||
| 435,000 | Series2018-2-B | 443,339 | ||||||
| 380,000 | Series2019-4-C | 379,343 | ||||||
| SoFi Professional Loan Program LLC | ||||||||
| 229,688 | Series2016-A-B | 233,009 | ||||||
| 133,000 | Series2017-F-R1 | 7,747,615 | ||||||
| 63,855 | Series2019-B-R1 | 2,360,824 | ||||||
The accompanying notes are an integral part of these financial statements.
| Schedule of Investments | 49 | |||||
Table of Contents
Litman Gregory Masters Alternative Strategies Fund
SCHEDULE OF INVESTMENTS IN SECURITIES at December 31, 2019 (Continued)
| Principal Amount^ | Value | |||||||
| ASSET-BACKED SECURITIES (CONTINUED) | ||||||||
| Soundview Home Loan Trust | ||||||||
| $ 5,684,832 | Series2007-OPT3-2A3 | $ | 5,493,035 | |||||
| SpringCastle Funding Asset-Backed Notes | ||||||||
| 109,864 | Series2019-AA-A | 110,355 | ||||||
| Sprite Ltd. | ||||||||
| 306,898 | Series2017-1-B | 318,159 | ||||||
| Staniford Street CLO Ltd. | ||||||||
| 263,308 | Series2014-1A-AR | 263,862 | ||||||
| Stanwich Mortgage Loan Trust | ||||||||
| 6,226 | Series2012-2-A | 12 | ||||||
| Stewart Park CLO Ltd. | ||||||||
| 500,000 | Series2015-1A-ER | 459,051 | ||||||
| Terwin Mortgage Trust | ||||||||
| 818,028 | Series2006-3-2A2 | 807,454 | ||||||
| THL Credit Wind River CLO Ltd. | ||||||||
| 2,000,000 | Series2014-2A-INC | 665,274 | ||||||
| 500,000 | Series2018-2A-E | 468,794 | ||||||
| Tidewater Auto Receivables Trust | ||||||||
| 110,000 | Series2018-AA-D | 112,084 | ||||||
| Towd Point Mortgage Trust | ||||||||
| 295,419 | Series2017-6-A1 | 297,397 | ||||||
| Trestles CLO II Ltd. | ||||||||
| 335,000 | Series2018-2A-D | 323,041 | ||||||
| Tricon American Homes Trust | ||||||||
| 415,000 | Series2019-SFR1-A | 416,519 | ||||||
| Tryon Park CLO Ltd. | ||||||||
| 1,000,000 | Series2013-1A-DR | 995,452 | ||||||
| United Auto Credit Securitization Trust | ||||||||
| 640,000 | Series2019-1-C | 644,980 | ||||||
| Venture XXI CLO Ltd. | ||||||||
| 618,860 | Series2015-21A-AR | 618,864 | ||||||
| Principal Amount^ | Value | |||||||
| Vericrest Opportunity Loan Trust | ||||||||
| $ 473,191 | Series2019-NPL3-A1 | $ | 476,802 | |||||
| 1,448,968 | Series2019-NPL5-A1A | 1,451,948 | ||||||
| Verizon Owner Trust | ||||||||
| 486,916 | Series2017-3A-A1B | 487,736 | ||||||
| Volkswagen Auto Loan Enhanced Trust | ||||||||
| 326,542 | Series2018-1-A2B | 326,564 | ||||||
| VOLT LXXII LLC | ||||||||
| 1,878,998 | Series2018-NPL8-A1A | 1,881,803 | ||||||
| VOLT LXXV LLC | ||||||||
| 683,225 | Series2019-NPL1-A1A | 689,006 | ||||||
| VOLT LXXXIII LLC | ||||||||
| 427,040 | Series2019-NPL9-A1A | 427,363 | ||||||
| Voya CLO Ltd. | ||||||||
| 500,000 | Series2018-2A-E | 466,625 | ||||||
| WAVE Trust | ||||||||
| 288,879 | Series2017-1A-B | 297,828 | ||||||
| Webster Park CLO Ltd. | ||||||||
| 1,000,000 | Series2015-1A-DR | 950,529 | ||||||
| Wendy’s Funding LLC | ||||||||
| 872,200 | Series2018-1A-A2II | 888,013 | ||||||
| 189,050 | Series2019-1A-A2II | 194,672 | ||||||
| West CLO Ltd. | ||||||||
| 709,217 | Series2014-1A-A1R | 709,357 | ||||||
| Westlake Automobile Receivables Trust | ||||||||
| 245,000 | Series2018-1A-D | 247,814 | ||||||
| 565,000 | Series2018-2A-D | 578,117 | ||||||
| Wingstop Funding LLC | ||||||||
| 238,200 | Series2018-1-A2 | 245,487 | ||||||
| World Financial Network Credit Card Master Trust | ||||||||
| 1,765,000 | Series2019-C-M | 1,764,027 | ||||||
|
| |||||||
| | TOTAL ASSET-BACKED SECURITIES | 176,629,840 | ||||||
|
| |||||||
The accompanying notes are an integral part of these financial statements.
| 50 | Litman Gregory Funds Trust | |||||
Table of Contents
Litman Gregory Masters Alternative Strategies Fund
SCHEDULE OF INVESTMENTS IN SECURITIES at December 31, 2019 (Continued)
| Principal Amount^ | Value | |||||||
| BANK LOANS: 2.8% | ||||||||
| 1011778 B.C. Unlimited Liability Co. | ||||||||
| $ 522,211 | 3.549%, 11/19/2026(g) | $ | 523,449 | |||||
| Acrisure LLC | ||||||||
| 471,240 | 6.195%, 11/22/2023(g) | 473,302 | ||||||
| AES Corp. | ||||||||
| 37,914 | 3.659%, 05/31/2022(g) | 37,997 | ||||||
| Air Methods Corp. | ||||||||
| 1,188,903 | 5.445%, 04/22/2024(g) | 1,044,998 | ||||||
| Almonde, Inc. | ||||||||
| 467,782 | 5.696%, 06/13/2024(g) | 465,508 | ||||||
| American Builders & Contractors Supply Co., Inc. | ||||||||
| 498,750 | 3.799%, 01/15/2027(g) | 502,024 | ||||||
| American Tire Distributors Holdings, Inc. | ||||||||
| 1,154,196 | 9.316%, 09/02/2024(g) | 1,035,891 | ||||||
| Aramark Services, Inc. | ||||||||
| 170,000 | 0.000%, 01/27/2027(h) | 171,116 | ||||||
| Assured Partners, Inc. | ||||||||
| 472,328 | 5.299%, 10/22/2024(g) | 474,512 | ||||||
| Athenahealth, Inc. | ||||||||
| 163,763 | 6.401%, 02/11/2026(g) | 164,854 | ||||||
| Avaya, Inc. | ||||||||
| 535,000 | 5.990%, 12/15/2024(g) | 526,574 | ||||||
| Axalta Coating Systems US Holdings, Inc. | ||||||||
| 624,076 | 3.695%, 06/01/2024(g) | 626,329 | ||||||
| BellRing Brands LLC | ||||||||
| 285,000 | 6.799%, 10/21/2024(g) | 288,742 | ||||||
| BI-LO Holding LLC | ||||||||
| 718,177 | 9.879%, 05/31/2024(g) | 665,811 | ||||||
| BJ Services LLC | ||||||||
| 3,176,250 | 9.100%, 01/03/2023(b)(g) | 3,151,964 | ||||||
| California Resources Corp. | ||||||||
| 4,092,000 | 6.555%, 12/31/2022(g) | 3,689,613 | ||||||
| Capri Finance LLC | ||||||||
| 465,315 | 4.927%, 11/01/2024(g) | 461,767 | ||||||
| Cengage Learning, Inc. | ||||||||
| 1,044,588 | 6.049%, 06/07/2023(g) | 1,001,592 | ||||||
| CHG Healthcare Services, Inc. | ||||||||
| 478,174 | 4.799%, 06/07/2023(g) | 482,059 | ||||||
| Principal Amount^ | Value | |||||||
| Colorado Buyer, Inc. | ||||||||
| $ 475,906 | 4.740%, 05/01/2024(g) | $ | 422,963 | |||||
| Connect Finco S.A.R.L. | ||||||||
| 240,000 | 0.000%, 12/11/2026(h) | 241,781 | ||||||
| CSC Holdings LLC | ||||||||
| 232,873 | 4.240%, 04/15/2027(g) | 234,279 | ||||||
| Cvent, Inc. | ||||||||
| 454,663 | 5.549%, 11/29/2024(g) | 455,004 | ||||||
| Dell International LLC | ||||||||
| 450,000 | 3.800%, 09/19/2025(g) | 453,715 | ||||||
| Dhanani Group Inc. | ||||||||
| 508,709 | 5.549%, 07/20/2025(g) | 495,991 | ||||||
| Equinox Holdings, Inc. | ||||||||
| 481,707 | 4.799%, 03/08/2024(g) | 484,374 | ||||||
| Filtration Group Corp. | ||||||||
| 456,192 | 4.799%, 03/29/2025(g) | 458,664 | ||||||
| Financial & Risk US Holdings, Inc. | ||||||||
| 391,249 | 5.049%, 10/01/2025(g) | 395,063 | ||||||
| Flex Acquisition Co., Inc. | ||||||||
| 670,000 | 0.000%, 06/29/2025(h) | 666,650 | ||||||
| Flexential Intermediate Corp. | ||||||||
| 443,865 | 5.445%, 08/01/2024(g) | 371,340 | ||||||
| Gavilan Resources LLC | ||||||||
| 1,025,000 | 7.799%, 03/01/2024(g) | 410,000 | ||||||
| Global Medical Response, Inc. | ||||||||
| 249,364 | 0.000%, 03/14/2025(h) | 242,506 | ||||||
| Granite Holdings US Acquisition Co. | ||||||||
| 458,850 | 7.211%, 09/30/2026(g) | 461,144 | ||||||
| Gray Television, Inc. | ||||||||
| 556,000 | 3.947%, 02/07/2024(g) | 558,466 | ||||||
| 309,116 | 4.197%, 01/02/2026(g) | 311,507 | ||||||
| Gulf Finance LLC | ||||||||
| 1,308,406 | 7.044%, 08/25/2023(g) | 1,030,488 | ||||||
| Hayward Industries, Inc. | ||||||||
| 455,344 | 5.299%, 08/05/2024(g) | 453,068 | ||||||
| Hyland Software, Inc. | ||||||||
| 463,348 | 5.299%, 07/01/2024(g) | 466,643 | ||||||
| iHeartCommunications, Inc. | ||||||||
| 428,932 | 5.691%, 05/01/2026(g) | 433,132 | ||||||
| Informatica LLC | ||||||||
| 474,293 | 5.049%, 08/05/2022(g) | 476,919 | ||||||
| ION Trading Technologies S.A.R.L. | ||||||||
| 364,071 | 0.000%, 11/21/2024(h) | 349,508 | ||||||
The accompanying notes are an integral part of these financial statements.
| Schedule of Investments | 51 | |||||
Table of Contents
Litman Gregory Masters Alternative Strategies Fund
SCHEDULE OF INVESTMENTS IN SECURITIES at December 31, 2019 (Continued)
| Principal Amount^ | Value | |||||||
| BANK LOANS (CONTINUED) | ||||||||
| IQVIA, Inc. | ||||||||
| $ 930,825 | 3.695%, 06/11/2025(g) | $ | 936,936 | |||||
| IRB Holding Corp. | ||||||||
| 470,105 | 5.216%, 02/05/2025(g) | 473,729 | ||||||
| Iron Mountain, Inc. | ||||||||
| 1,125,827 | 3.549%, 01/02/2026(g) | 1,124,768 | ||||||
| Jeld-Wen, Inc. | ||||||||
| 928,143 | 3.945%, 12/14/2024(g) | 931,141 | ||||||
| KIK Custom Products, Inc. | ||||||||
| 380,000 | 5.792%, 05/15/2023(g) | 374,110 | ||||||
| Klockner-Pentaplast of America, Inc. | ||||||||
| 304,222 | 6.177%, 06/30/2022(g) | 275,093 | ||||||
| Lower Cadence Holdings LLC | ||||||||
| 288,550 | 5.799%, 05/22/2026(g) | 286,207 | ||||||
| McDermott International, Inc. | ||||||||
| 4,165,000 | 0.000%, 05/10/2023(h) | 2,374,050 | ||||||
| 650,000 | 0.000%, 05/10/2023(h) | 470,168 | ||||||
| McDermott Technology Americas, Inc. | ||||||||
| 1,646,455 | 7.559%, 10/21/2021(g) | 1,685,559 | ||||||
| 98,381 | 7.559%, 10/21/2021(g) | 100,718 | ||||||
| 4,097,326 | 6.945%, 05/09/2025(g) | 2,396,936 | ||||||
| 417,747 | 6.945%, 05/09/2025(g) | 248,142 | ||||||
| Mediaco Holding, Inc. | ||||||||
| 2,240,124 | 8.400%, 11/21/2024(g) | 2,218,177 | ||||||
| Minotaur Acquisition, Inc. | ||||||||
| 1,089,511 | 6.799%, 03/27/2026(g) | 1,075,892 | ||||||
| MLN U.S. Holding Co. LLC | ||||||||
| 470,773 | 6.191%, 11/30/2025(g) | 446,841 | ||||||
| MPH Acquisition Holdings LLC | ||||||||
| 1,094,041 | 4.695%, 06/07/2023(g) | 1,081,339 | ||||||
| Murray Energy Corp. | ||||||||
| 1,005,435 | 11.500%, 02/12/2021(b)(g) | 1,005,435 | ||||||
| NCI Building Systems, Inc. | ||||||||
| 296,241 | 5.486%, 04/12/2025(g) | 296,516 | ||||||
| Parexel InternationalCorp. | ||||||||
| 99,717 | 4.549%, 09/27/2024(g) | 98,097 | ||||||
| Project Alpha Intermediate Holding, Inc. | ||||||||
| 363,691 | 5.490%, 04/26/2024(g) | 365,057 | ||||||
| Principal Amount^ | Value | |||||||
| Radiology Partners Holdings LLC | ||||||||
| $ 527,237 | 6.661%, 07/09/2025(g) | $ | 530,753 | |||||
| Science Applications International Corp. | ||||||||
| 82,524 | 3.549%, 10/31/2025(g) | 82,898 | ||||||
| Securus Technologies Holdings, Inc. | ||||||||
| 45,138 | 6.299%, 11/01/2024(g) | 33,823 | ||||||
| Solenis Holdings LLC | ||||||||
| 543,620 | 5.909%, 06/26/2025(g) | 539,271 | ||||||
| Sophia L.P. | ||||||||
| 431,731 | 5.195%, 09/30/2022(g) | 433,274 | ||||||
| Sprint Communications, Inc. | ||||||||
| 471,365 | 4.313%, 02/02/2024(g) | 468,065 | ||||||
| Team Health Holdings, Inc. | ||||||||
| 842,833 | 0.000%, 02/06/2024(h) | 686,382 | ||||||
| Transform SR Holdings LLC | ||||||||
| 2,235,000 | 9.184%, 02/12/2024(g) | 2,240,588 | ||||||
| Travelport Finance (Luxembourg) S.A.R.L. | ||||||||
| 533,663 | 6.945%, 05/29/2026(g) | 500,576 | ||||||
| Uber Technologies | ||||||||
| 645,728 | 5.299%, 07/13/2023(g) | 646,303 | ||||||
| United Natural Foods, Inc. | ||||||||
| 449,560 | 6.049%, 10/22/2025(g) | 386,341 | ||||||
| Verscend Holding Corp. | ||||||||
| 271,563 | 6.299%, 08/27/2025(g) | 274,051 | ||||||
| Vertafore, Inc. | ||||||||
| 404,224 | 5.049%, 07/02/2025(g) | 400,434 | ||||||
| Western Digital Corp. | ||||||||
| 758,226 | 3.452%, 04/29/2023(g) | 763,598 | ||||||
| Zelis HealthcareCorp. | ||||||||
| 160,000 | 6.549%, 09/30/2026(g) | 161,084 | ||||||
| Ziggo B.V. | ||||||||
| 490,000 (EUR) | 3.000%, 01/31/2029(g) | 550,945 | ||||||
|
| |||||||
| | TOTAL BANK LOANS | 52,624,604 | ||||||
|
| |||||||
| CONVERTIBLE BONDS: 0.3% | ||||||||
| Communications: 0.2% | ||||||||
| CalAmp Corp. | ||||||||
| 1,090,000 | 2.000%, 08/01/2025 | 910,215 | ||||||
| DISH Network Corp. | ||||||||
| 1,615,000 | 2.375%, 03/15/2024 | 1,480,713 | ||||||
| 1,360,000 | 3.375%, 08/15/2026 | 1,311,584 | ||||||
|
| |||||||
| 3,702,512 | ||||||||
|
| |||||||
The accompanying notes are an integral part of these financial statements.
| 52 | Litman Gregory Funds Trust | |||||
Table of Contents
Litman Gregory Masters Alternative Strategies Fund
SCHEDULE OF INVESTMENTS IN SECURITIES at December 31, 2019 (Continued)
| Principal Amount^ | Value | |||||||
| CONVERTIBLE BONDS (CONTINUED) | ||||||||
| Consumer,Non-cyclical: 0.1% | ||||||||
| BioMarin Pharmaceutical, Inc. | ||||||||
| $ 1,755,000 | 0.599%, 08/01/2024 | $ | 1,858,543 | |||||
|
| |||||||
| Energy: 0.0% | ||||||||
| Chesapeake Energy Corp. | ||||||||
| 440,000 | 5.500%, 09/15/2026 | 214,009 | ||||||
|
| |||||||
| Industrial: 0.0% | ||||||||
| Greenbrier Cos., Inc. (The) | ||||||||
| 180,000 | 2.875%, 02/01/2024 | 175,108 | ||||||
|
| |||||||
| | TOTAL CONVERTIBLE BONDS | 5,950,172 | ||||||
|
| |||||||
| CORPORATE BONDS: 28.4% | ||||||||
| Basic Materials: 1.3% | ||||||||
| AK Steel Corp. | ||||||||
| 5,095,000 | 7.500%, 07/15/2023 | 5,313,652 | ||||||
| Braskem Idesa SAPI | ||||||||
| 300,000 | 7.450%, 11/15/2029(c) | 320,178 | ||||||
| CSN Islands XII Corp. | ||||||||
| 600,000 | 7.000%, 03/23/2020(d) | 553,317 | ||||||
| First Quantum Minerals Ltd. | ||||||||
| 600,000 | 7.500%, 04/01/2025(c) | 614,751 | ||||||
| 600,000 | 6.875%, 03/01/2026(c) | 608,610 | ||||||
| FMG Resources August 2006 Pty Ltd. | ||||||||
| 6,460,000 | 5.125%, 03/15/2023(c) | 6,839,460 | ||||||
| Freeport-McMoRan, Inc. | ||||||||
| 600,000 | 5.450%, 03/15/2043 | 622,560 | ||||||
| IAMGOLD Corp. | ||||||||
| 733,000 | 7.000%, 04/15/2025(c) | 765,820 | ||||||
| Methanex Corp. | ||||||||
| 945,000 | 5.250%, 12/15/2029 | 978,390 | ||||||
| Metinvest B.V. | ||||||||
| 200,000 | 7.750%, 10/17/2029 | 205,201 | ||||||
| Minera Mexico S.A. de C.V. | ||||||||
| 925,000 | 4.500%, 01/26/2050(c) | 941,992 | ||||||
| Mineral Resources Ltd. | ||||||||
| 1,200,000 | 8.125%, 05/01/2027(c) | 1,319,787 | ||||||
| POSCO | ||||||||
| 1,730,000 | 2.375%, 11/12/2022(c) | 1,729,787 | ||||||
| Schweitzer-Mauduit International, Inc. | ||||||||
| 2,580,000 | 6.875%, 10/01/2026(c) | 2,787,297 | ||||||
| Vedanta Resources Finance II Plc | ||||||||
| 250,000 | 9.250%, 04/23/2026(c) | 248,709 | ||||||
| 200,000 | 9.250%, 04/23/2026 | 198,967 | ||||||
|
| |||||||
| 24,048,478 | ||||||||
|
| |||||||
| Communications: 4.1% | ||||||||
| Altice Luxembourg S.A. | ||||||||
| 6,100,000 | 10.500%, 05/15/2027(c) | 6,965,590 | ||||||
| AT&T, Inc. | ||||||||
| 275,000 | 3.200%, 03/01/2022 | 281,615 | ||||||
| 1,375,000 | 3.800%, 03/15/2022 | 1,427,698 | ||||||
| Bharti Airtel Ltd. | ||||||||
| 465,000 | 4.375%, 06/10/2025 | 474,700 | ||||||
| C&W Senior Financing DAC | ||||||||
| 550,000 | 6.875%, 09/15/2027 | 589,409 | ||||||
| Principal Amount^ | Value | |||||||
| Communications (continued) | ||||||||
| Cable Onda S.A. | ||||||||
| $ 360,000 | 4.500%, 01/30/2030(c) | $ | 379,746 | |||||
| Cincinnati Bell, Inc. | ||||||||
| 850,000 | 8.000%, 10/15/2025(c) | 903,478 | ||||||
| CommScope Technologies LLC | ||||||||
| 100,000 | 6.000%, 06/15/2025(c) | 100,363 | ||||||
| 1,795,000 | 5.000%, 03/15/2027(c) | 1,691,832 | ||||||
| DISH DBS Corp. | ||||||||
| 1,610,000 | 7.750%, 07/01/2026 | 1,708,596 | ||||||
| iHeartCommunications, Inc. | ||||||||
| 735,000 | 4.750%, 01/15/2028(c) | 754,735 | ||||||
| Intelsat Jackson Holdings S.A. | ||||||||
| 965,000 | 8.500%, 10/15/2024(c) | 880,963 | ||||||
| Kenbourne Invest S.A. | ||||||||
| 825,000 | 6.875%, 11/26/2024(c) | 860,355 | ||||||
| Match Group, Inc. | ||||||||
| 2,900,000 | 5.000%, 12/15/2027(c) | 3,031,508 | ||||||
| 2,485,000 | 5.625%, 02/15/2029(c) | 2,653,601 | ||||||
| MDC Partners, Inc. | ||||||||
| 1,732,000 | 6.500%, 05/01/2024(c) | 1,571,790 | ||||||
| Millicom International Cellular S.A. | ||||||||
| 205,000 | 5.125%, 01/15/2028(c) | 215,528 | ||||||
| 550,000 | 6.250%, 03/25/2029 | 607,827 | ||||||
| NBCUniversal Enterprise, Inc. | ||||||||
| 520,000 | 5.250%, 03/19/2021(c)(d) | 537,082 | ||||||
| Netflix, Inc. | ||||||||
| 750,000 | 4.875%, 06/15/2030(c) | 763,106 | ||||||
| Network i2i Ltd. | ||||||||
| 550,000 | 5.650%, 01/15/2025(c)(d)(f) | 544,225 | ||||||
| Outfront Media Capital LLC/Outfront Media Capital Corp. | ||||||||
| 280,000 | 4.625%, 03/15/2030(c) | 285,418 | ||||||
| Quebecor Media, Inc. | ||||||||
| 6,140,000 | 5.750%, 01/15/2023 | 6,682,377 | ||||||
| Sirius XM Radio, Inc. | ||||||||
| 3,918,000 | 5.000%, 08/01/2027(c) | 4,140,738 | ||||||
| 2,340,000 | 5.500%, 07/01/2029(c) | 2,534,431 | ||||||
| Telecom Argentina S.A. | ||||||||
| 300,000 | 8.000%, 07/18/2026(c) | 288,941 | ||||||
| Telecom Italia SpA | ||||||||
| 4,700,000 | 5.303%, 05/30/2024(c) | 5,064,203 | ||||||
| Uber Technologies, Inc. | ||||||||
| 1,615,000 | 8.000%, 11/01/2026(c) | 1,687,388 | ||||||
| 1,080,000 | 7.500%, 09/15/2027(c) | 1,110,742 | ||||||
| VeriSign, Inc. | ||||||||
| 6,440,000 | 4.750%, 07/15/2027 | 6,806,114 | ||||||
| ViaSat, Inc. | ||||||||
| 4,895,000 | 5.625%, 09/15/2025(c) | 5,052,056 | ||||||
| VTR Finance B.V. | ||||||||
| 550,000 | 6.875%, 01/15/2024 | 563,522 | ||||||
| Walt Disney Co. (The) | ||||||||
| 3,430,000 | 2.297%, 09/01/2022(g) | 3,452,361 | ||||||
| Windstream Services LLC/Windstream Finance Corp. | ||||||||
| 3,595,000 | 8.625%, 10/31/2025(c)(i) | 3,458,696 | ||||||
| Zayo Group LLC/Zayo Capital, Inc. | ||||||||
| 4,544,000 | 6.000%, 04/01/2023(a) | 4,655,714 | ||||||
| 2,632,000 | 5.750%, 01/15/2027(a)(c) | 2,682,265 | ||||||
The accompanying notes are an integral part of these financial statements.
| Schedule of Investments | 53 | |||||
Table of Contents
Litman Gregory Masters Alternative Strategies Fund
SCHEDULE OF INVESTMENTS IN SECURITIES at December 31, 2019 (Continued)
| Principal Amount^ | Value | |||||||
| CORPORATE BONDS (CONTINUED) | ||||||||
| Communications (continued) | ||||||||
| Ziggo B.V. | ||||||||
| $ 440,000 | 4.875%, 01/15/2030(c) | $ | 455,238 | |||||
|
| |||||||
| 75,863,951 | ||||||||
|
| |||||||
| Consumer, Cyclical: 5.4% | ||||||||
| 1011778 BC ULC/New Red Finance, Inc. | ||||||||
| 1,285,000 | 4.375%, 01/15/2028(c) | 1,290,590 | ||||||
| Allison Transmission, Inc. | ||||||||
| 3,317,000 | 4.750%, 10/01/2027(c) | 3,450,833 | ||||||
| American Honda Finance Corp. | ||||||||
| 685,000 | 1.950%, 05/20/2022 | 687,724 | ||||||
| Aramark Services, Inc. | ||||||||
| 1,470,000 | 5.000%, 02/01/2028(c) | 1,551,732 | ||||||
| Beazer Homes USA, Inc. | ||||||||
| 2,600,000 | 5.875%, 10/15/2027 | 2,632,565 | ||||||
| 2,105,000 | 7.250%, 10/15/2029(c) | 2,252,403 | ||||||
| BMW US Capital LLC | ||||||||
| 1,870,000 | 2.411%, 04/12/2021(c)(g) | 1,873,462 | ||||||
| Boyd Gaming Corp. | ||||||||
| 990,000 | 4.750%, 12/01/2027(c) | 1,030,194 | ||||||
| Carvana Co. | ||||||||
| 3,800,000 | 8.875%, 10/01/2023(c) | 4,016,106 | ||||||
| Century Communities, Inc. | ||||||||
| 1,200,000 | 6.750%, 06/01/2027(c) | 1,289,427 | ||||||
| Churchill Downs, Inc. | ||||||||
| 948,000 | 5.500%, 04/01/2027(c) | 1,006,634 | ||||||
| 5,670,000 | 4.750%, 01/15/2028(c) | 5,864,764 | ||||||
| Daimler Finance North America LLC | ||||||||
| 965,000 | 3.100%, 05/04/2020(c) | 968,243 | ||||||
| 2,425,000 | 2.810%, 02/15/2022(c)(g) | 2,444,459 | ||||||
| General Motors Financial Co., Inc. | ||||||||
| 695,000 | 3.700%, 11/24/2020 | 703,370 | ||||||
| 1,110,000 | 2.862%, 04/09/2021(g) | 1,112,451 | ||||||
| Hasbro, Inc. | ||||||||
| 1,735,000 | 3.900%, 11/19/2029 | 1,751,072 | ||||||
| Hilton Domestic Operating Co., Inc. | ||||||||
| 5,473,000 | 4.875%, 01/15/2030 | 5,810,835 | ||||||
| Home Depot, Inc. (The) | ||||||||
| 1,535,000 | 2.217%, 03/01/2022(g) | 1,538,920 | ||||||
| Hyundai Capital America | ||||||||
| 1,730,000 | 3.950%, 02/01/2022(c) | 1,779,555 | ||||||
| Installed Building Products, Inc. | ||||||||
| 1,100,000 | 5.750%, 02/01/2028(c) | 1,178,757 | ||||||
| Jack Ohio Finance LLC/Jack Ohio Finance 1 Corp. | ||||||||
| 650,000 | 6.750%, 11/15/2021(c) | 664,462 | ||||||
| KB Home | ||||||||
| 3,313,000 | 6.875%, 06/15/2027 | 3,844,231 | ||||||
| 639,000 | 4.800%, 11/15/2029 | 654,975 | ||||||
| KFC Holding Co./Pizza Hut Holdings LLC/Taco Bell of America LLC | ||||||||
| 3,331,000 | 4.750%, 06/01/2027(c) | 3,513,614 | ||||||
| Principal Amount^ | Value | |||||||
| Consumer, Cyclical (continued) | ||||||||
| Latam Airlines2015-1 Pass Through Trust | ||||||||
| $ 1,566,348 | 4.500%, 11/15/2023 | $ | 1,576,124 | |||||
| Latam Finance Ltd. | ||||||||
| 550,000 | 7.000%, 03/01/2026 | 596,390 | ||||||
| LGI Homes, Inc. | ||||||||
| 2,185,000 | 6.875%, 07/15/2026(c) | 2,295,009 | ||||||
| Marriott International, Inc. | ||||||||
| 850,000 | 2.125%, 10/03/2022 | 852,201 | ||||||
| Murphy Oil USA, Inc. | ||||||||
| 2,780,000 | 4.750%, 09/15/2029 | 2,941,018 | ||||||
| Nissan Motor Acceptance Corp. | ||||||||
| 960,000 | 3.650%, 09/21/2021(c) | 980,263 | ||||||
| PulteGroup, Inc. | ||||||||
| 3,050,000 | 5.000%, 01/15/2027 | 3,328,534 | ||||||
| Rite Aid Corp. | ||||||||
| 250,000 | 6.125%, 04/01/2023(c) | 230,625 | ||||||
| Scientific Games International, Inc. | ||||||||
| 2,090,000 | 8.250%, 03/15/2026(c) | 2,308,142 | ||||||
| 319,000 | 7.000%, 05/15/2028(c) | 342,718 | ||||||
| 319,000 | 7.250%, 11/15/2029(c) | 346,705 | ||||||
| ScottsMiracle-Gro Co. (The) | ||||||||
| 490,000 | 4.500%, 10/15/2029(c) | 502,115 | ||||||
| Stars Group Holdings B.V./Stars Group USCo-Borrower LLC | ||||||||
| 4,194,000 | 7.000%, 07/15/2026(a)(c) | 4,547,764 | ||||||
| Suburban Propane Partners L.P./Suburban Energy Finance Corp. | ||||||||
| 4,185,000 | 5.875%, 03/01/2027 | 4,364,317 | ||||||
| Taylor Morrison Communities, Inc. | ||||||||
| 2,632,000 | 5.875%, 06/15/2027(c) | 2,901,313 | ||||||
| 750,000 | 5.750%, 01/15/2028(c) | 819,636 | ||||||
| Tesla, Inc. | ||||||||
| 4,185,000 | 5.300%, 08/15/2025(c) | 4,069,871 | ||||||
| Toll Brothers Finance Corp. | ||||||||
| 300,000 | 4.350%, 02/15/2028 | 313,604 | ||||||
| Toyota Motor Credit Corp. | ||||||||
| 740,000 | 2.281%, 04/13/2021(g) | 741,386 | ||||||
| 1,725,000 | 2.333%, 10/07/2021(g) | 1,729,034 | ||||||
| United Airlines Pass Through Trust | ||||||||
| 1,755,000 | Series2019-2-B | 1,768,399 | ||||||
| Vista Outdoor, Inc. | ||||||||
| 500,000 | 5.875%, 10/01/2023 | 480,062 | ||||||
| Volkswagen Group of America Finance LLC | ||||||||
| 1,760,000 | 2.795%, 09/24/2021(c)(g) | 1,772,759 | ||||||
| Walmart, Inc. | ||||||||
| 1,940,000 | 2.158%, 06/23/2021(g) | 1,943,809 | ||||||
| William Lyon Homes, Inc. | ||||||||
| 2,895,000 | 6.625%, 07/15/2027(c) | 3,149,318 | ||||||
| Yum! Brands, Inc. | ||||||||
| 1,400,000 | 3.875%, 11/01/2023 | 1,446,081 | ||||||
| 1,876,000 | 4.750%, 01/15/2030(c) | 1,968,581 | ||||||
|
| |||||||
| 101,227,156 | ||||||||
|
| |||||||
The accompanying notes are an integral part of these financial statements.
| 54 | Litman Gregory Funds Trust | |||||
Table of Contents
Litman Gregory Masters Alternative Strategies Fund
SCHEDULE OF INVESTMENTS IN SECURITIES at December 31, 2019 (Continued)
| Principal Amount^ | Value | |||||||
| CORPORATE BONDS (CONTINUED) | ||||||||
| Consumer,Non-cyclical: 3.7% | ||||||||
| AbbVie, Inc. | ||||||||
| $ 865,000 | 2.545%, 11/21/2022(c)(g) | $ | 869,641 | |||||
| Avon International Operations, Inc. | ||||||||
| 2,981,000 | 7.875%, 08/15/2022(a)(c) | 3,115,124 | ||||||
| Bausch Health Cos., Inc. | ||||||||
| 1,547,000 | 7.250%, 05/30/2029(c) | 1,770,309 | ||||||
| BRF S.A. | ||||||||
| 1,110,000 | 4.875%, 01/24/2030(c) | 1,146,364 | ||||||
| Brink’s Co. (The) | ||||||||
| 1,425,000 | 4.625%, 10/15/2027(c) | 1,471,060 | ||||||
| Bristol-Myers Squibb Co. | ||||||||
| 1,735,000 | 2.600%, 05/16/2022(c) | 1,764,470 | ||||||
| Campbell Soup Co. | ||||||||
| 985,000 | 2.394%, 03/16/2020(g) | 985,354 | ||||||
| Carriage Services, Inc. | ||||||||
| 2,130,000 | 6.625%, 06/01/2026(c) | 2,274,515 | ||||||
| Cimpress N.V. | ||||||||
| 2,905,000 | 7.000%, 06/15/2026(c) | 3,123,884 | ||||||
| Coty, Inc. | ||||||||
| 244,000 | 6.500%, 04/15/2026(c) | 257,426 | ||||||
| CVS Health Corp. | ||||||||
| 1,970,000 | 2.605%, 03/09/2021(g) | 1,982,541 | ||||||
| Diageo Capital Plc | ||||||||
| 590,000 | 3.000%, 05/18/2020 | 592,441 | ||||||
| Encompass Health Corp. | ||||||||
| 1,170,000 | 4.750%, 02/01/2030 | 1,216,040 | ||||||
| Hologic, Inc. | ||||||||
| 3,750,000 | 4.625%, 02/01/2028(c) | 3,985,678 | ||||||
| JBS USA LUX S.A./JBS USA Food Co./JBS USA Finance, Inc. | ||||||||
| 670,000 | 5.500%, 01/15/2030(c) | 720,887 | ||||||
| Lamb Weston Holdings, Inc. | ||||||||
| 2,550,000 | 4.875%, 11/01/2026(c) | 2,707,717 | ||||||
| Minerva Luxembourg S.A. | ||||||||
| 600,000 | 5.875%, 01/19/2028 | 631,116 | ||||||
| NBM US Holdings, Inc. | ||||||||
| 1,860,000 | 7.000%, 05/14/2026(c) | 2,018,811 | ||||||
| Nielsen Co. Luxembourg S.A.R.L. (The) | ||||||||
| 5,732,000 | 5.500%, 10/01/2021(a)(c) | 5,766,392 | ||||||
| Pfizer, Inc. | ||||||||
| 1,925,000 | 3.000%, 09/15/2021 | 1,966,302 | ||||||
| Pilgrim’s Pride Corp. | ||||||||
| 5,178,000 | 5.875%, 09/30/2027(c) | 5,608,292 | ||||||
| Post Holdings, Inc. | ||||||||
| 3,000,000 | 5.750%, 03/01/2027(c) | 3,224,467 | ||||||
| 1,750,000 | 5.625%, 01/15/2028(c) | 1,888,862 | ||||||
| 1,500,000 | 5.500%, 12/15/2029(c) | 1,602,225 | ||||||
| Select Medical Corp. | ||||||||
| 325,000 | 6.250%, 08/15/2026(c) | 352,415 | ||||||
| Service Corp. International | ||||||||
| 5,010,000 | 4.625%, 12/15/2027 | 5,234,561 | ||||||
| 1,500,000 | 5.125%, 06/01/2029 | 1,596,525 | ||||||
| Principal Amount^ | Value | |||||||
| Consumer,Non-cyclical (continued) | ||||||||
| Teleflex, Inc. | ||||||||
| $ 3,700,000 | 4.625%, 11/15/2027 | $ | 3,928,142 | |||||
| Teva Pharmaceutical Finance Netherlands II B.V. | ||||||||
| 650,000 (EUR) | 6.000%, 01/31/2025(c) | 773,505 | ||||||
| Teva Pharmaceutical Finance Netherlands III B.V. | ||||||||
| 725,000 | 7.125%, 01/31/2025(c) | 746,232 | ||||||
| 925,000 | 3.150%, 10/01/2026 | 772,398 | ||||||
| 4,795,000 | 4.100%, 10/01/2046 | 3,464,867 | ||||||
| Vector Group Ltd. | ||||||||
| 2,000,000 | 10.500%, 11/01/2026(c) | 2,071,200 | ||||||
|
| |||||||
| 69,629,763 | ||||||||
|
| |||||||
| Energy: 3.1% | ||||||||
| AI Candelaria Spain SLU | ||||||||
| 550,000 | 7.500%, 12/15/2028(c) | 618,254 | ||||||
| Bellatrix Exploration Ltd. | ||||||||
| 417,000 | 8.500%, 09/11/2023(b) | 250,200 | ||||||
| 454,000 | 12.500%, 12/15/2023*(b)(j) | 0 | ||||||
| Bruin E&P Partners LLC | ||||||||
| 2,820,000 | 8.875%, 08/01/2023(c) | 1,841,220 | ||||||
| California Resources Corp. | ||||||||
| 4,117,000 | 8.000%, 12/15/2022(c) | 1,848,430 | ||||||
| 23,000 | 6.000%, 11/15/2024 | 6,965 | ||||||
| Calumet Specialty Products Partners L.P./Calumet Finance Corp. | ||||||||
| 1,627,000 | 7.750%, 04/15/2023 | 1,627,675 | ||||||
| Canacol Energy Ltd. | ||||||||
| 550,000 | 7.250%, 05/03/2025 | 581,309 | ||||||
| Cheniere Corpus Christi Holdings LLC | ||||||||
| 1,405,000 | 3.700%, 11/15/2029(c) | 1,436,509 | ||||||
| Cheniere Energy Partners L.P. | ||||||||
| 2,173,000 | 5.625%, 10/01/2026 | 2,302,020 | ||||||
| CNX Midstream Partners L.P./CNX Midstream Finance Corp. | ||||||||
| 945,000 | 6.500%, 03/15/2026(c) | 874,453 | ||||||
| CNX Resources Corp. | ||||||||
| 1,120,000 | 7.250%, 03/14/2027(c) | 982,492 | ||||||
| Compania General Combust | ||||||||
| 600,000 | 9.500%, 11/07/2021 | 502,740 | ||||||
| Crestwood Midstream Partners L.P./Crestwood Midstream Finance Corp. | ||||||||
| 4,500,000 | 5.625%, 05/01/2027(c) | 4,573,237 | ||||||
| Eclipse Resources Corp. | ||||||||
| 985,000 | 8.875%, 07/15/2023 | 911,115 | ||||||
| Exxon Mobil Corp. | ||||||||
| 1,735,000 | 2.234%, 08/16/2022(g) | 1,743,764 | ||||||
| Fermaca Enterprises S de RL de C.V. | ||||||||
| 262,403 | 6.375%, 03/30/2038 | 286,267 | ||||||
| Genesis Energy L.P./Genesis Energy Finance Corp. | ||||||||
| 3,666,000 | 6.500%, 10/01/2025 | 3,555,983 | ||||||
| 3,195,000 | 6.250%, 05/15/2026 | 3,060,323 | ||||||
| Geopark Ltd. | ||||||||
| 550,000 | 6.500%, 09/21/2024 | 574,984 | ||||||
The accompanying notes are an integral part of these financial statements.
| Schedule of Investments | 55 | |||||
Table of Contents
Litman Gregory Masters Alternative Strategies Fund
SCHEDULE OF INVESTMENTS IN SECURITIES at December 31, 2019 (Continued)
| Principal Amount^ | Value | |||||||
| CORPORATE BONDS (CONTINUED) | ||||||||
| Energy (continued) | ||||||||
| Global Partners L.P./GLP Finance Corp. | ||||||||
| $ 1,088,000 | 7.000%, 08/01/2027(c) | $ | 1,159,098 | |||||
| Gran Tierra Energy, Inc. | ||||||||
| 550,000 | 7.750%, 05/23/2027(c) | 515,822 | ||||||
| Gulfport Energy Corp. | ||||||||
| 2,260,000 | 6.000%, 10/15/2024 | 1,610,250 | ||||||
| Kinder Morgan, Inc. | ||||||||
| 2,000,000 | 4.300%, 03/01/2028 | 2,182,600 | ||||||
| Lonestar Resources America, Inc. | ||||||||
| 380,000 | 11.250%, 01/01/2023(c) | 261,250 | ||||||
| Magnolia Oil & Gas Operating LLC/Magnolia Oil & Gas Finance Corp. | ||||||||
| 2,870,000 | 6.000%, 08/01/2026(c) | 2,949,922 | ||||||
| Medco Oak Tree Pte Ltd. | ||||||||
| 550,000 | 7.375%, 05/14/2026 | 561,408 | ||||||
| Northern Oil and Gas, Inc. | ||||||||
| 971,000 | 8.500%, 05/15/2023(j) | 1,007,412 | ||||||
| NuStar Logistics L.P. | ||||||||
| 2,975,000 | 6.000%, 06/01/2026 | 3,151,638 | ||||||
| Parkland Fuel Corp. | ||||||||
| 3,585,000 | 6.000%, 04/01/2026(c) | 3,793,468 | ||||||
| 2,675,000 | 5.875%, 07/15/2027(c) | 2,881,537 | ||||||
| Petrobras Global Finance B.V. | ||||||||
| 885,000 | 5.750%, 02/01/2029 | 999,829 | ||||||
| 550,000 | 6.900%, 03/19/2049 | 646,126 | ||||||
| Sinopec Group Overseas Development 2018 Ltd. | ||||||||
| 1,730,000 | 2.500%, 11/12/2024(c) | 1,736,384 | ||||||
| Sunoco L.P./Sunoco Finance Corp. | ||||||||
| 4,801,000 | 6.000%, 04/15/2027 | 5,136,218 | ||||||
| Tennessee Gas Pipeline Co. LLC | ||||||||
| 325,000 | 7.000%, 03/15/2027 | 405,131 | ||||||
| Vine Oil & Gas L.P./Vine Oil & Gas Finance Corp. | ||||||||
| 955,000 | 9.750%, 04/15/2023(c) | 482,275 | ||||||
| YPF S.A. | ||||||||
| 780,000 | 63.354%, 07/07/2020(c)(g) | 193,986 | ||||||
| 450,000 | 8.500%, 07/28/2025 | 426,562 | ||||||
| 450,000 | 6.950%, 07/21/2027(c) | 401,781 | ||||||
|
| |||||||
| 58,080,637 | ||||||||
|
| |||||||
| Financial: 5.8% | ||||||||
| Agile Group Holdings Ltd. | ||||||||
| 200,000 | 6.875%, 03/07/2023(d)(f) | 200,070 | ||||||
| AIA Group Ltd. | ||||||||
| 765,000 | 2.428%, 09/20/2021(c)(g) | 765,656 | ||||||
| AIG Global Funding | ||||||||
| 925,000 | 2.300%, 07/01/2022(c) | 930,485 | ||||||
| Aircastle Ltd. | ||||||||
| 1,295,000 | 4.250%, 06/15/2026 | 1,372,378 | ||||||
| Principal Amount^ | Value | |||||||
| Financial (continued) | ||||||||
| Alliance Data Systems Corp. | ||||||||
| $ 1,315,000 | 4.750%, 12/15/2024(c) | $ | 1,315,000 | |||||
| American Express Co. | ||||||||
| 1,300,000 | 2.491%, 11/05/2021(g) | 1,305,971 | ||||||
| Ameriprise Financial, Inc. | ||||||||
| 680,000 | 3.000%, 03/22/2022 | 695,804 | ||||||
| Assurant, Inc. | ||||||||
| 1,960,000 | 3.700%, 02/22/2030 | 1,991,253 | ||||||
| Banco BTG Pactual S.A. | ||||||||
| 550,000 | 7.750%, 02/15/2029(f) | 583,335 | ||||||
| Banco do Brasil S.A. | ||||||||
| 600,000 | 6.250%, 04/15/2024(d)(f) | 609,906 | ||||||
| Banco Hipotecario S.A. | ||||||||
| | 4,228,722 (ARS) | | 50.667%, 01/12/2020(c)(g) | 72,855 | ||||
| | 12,020,000 (ARS) | | 44.313%, 11/07/2022(c)(g) | 178,942 | ||||
| Banco Macro S.A. | ||||||||
| | 7,805,000 (ARS) | | 17.500%, 05/08/2022(c) | 62,995 | ||||
| 250,000 | 6.750%, 11/04/2026(f) | 203,212 | ||||||
| Banco Mercantil del Norte S.A. | ||||||||
| 500,000 | 7.625%, 01/10/2028(d)(f) | 535,268 | ||||||
| Banco Santander Mexico S.A. | ||||||||
| 500,000 | 8.500%, 01/20/2022(d)(f) | 530,468 | ||||||
| Banco Supervielle S.A. | ||||||||
| | 15,000,000 (ARS) | | 52.771%, 08/09/2020(c)(g) | 245,508 | ||||
| Bank of America Corp. | ||||||||
| 1,750,000 | 3.499%, 05/17/2022(f) | 1,785,494 | ||||||
| 1,575,000 | 2.597%, 06/25/2022(g) | 1,583,903 | ||||||
| BBVA Bancomer S.A. | ||||||||
| 600,000 | 5.125%, 01/18/2033(f) | 606,771 | ||||||
| Capital One N.A. | ||||||||
| 1,905,000 | 2.150%, 09/06/2022 | 1,908,952 | ||||||
| CFLD Cayman Investment Ltd. | ||||||||
| 200,000 | 6.500%, 12/21/2020 | 200,500 | ||||||
| CIFI Holdings Group Co. Ltd. | ||||||||
| 200,000 | 5.500%, 01/23/2022 | 201,601 | ||||||
| Citibank N.A. | ||||||||
| 1,110,000 | 2.251%, 02/12/2021(g) | 1,112,357 | ||||||
| Citigroup, Inc. | ||||||||
| 1,780,000 | 2.350%, 08/02/2021 | 1,791,442 | ||||||
| 855,000 | 2.425%, 11/04/2022(g) | 859,505 | ||||||
| Credit Suisse AG | ||||||||
| 290,000 | 2.100%, 11/12/2021 | 291,452 | ||||||
| Credito Real SAB de C.V. | ||||||||
| 550,000 | 9.125%, 11/29/2022(d)(f) | 580,082 | ||||||
The accompanying notes are an integral part of these financial statements.
| 56 | Litman Gregory Funds Trust | |||||
Table of Contents
Litman Gregory Masters Alternative Strategies Fund
SCHEDULE OF INVESTMENTS IN SECURITIES at December 31, 2019 (Continued)
| Principal Amount^ | Value | |||||||
| CORPORATE BONDS (CONTINUED) | ||||||||
| Financial (continued) | ||||||||
| Danske Bank A/S | ||||||||
| $ 360,000 | 3.244%, 12/20/2025(c)(f) | $ | 364,604 | |||||
| Docuformas SAPI de C.V. | ||||||||
| 550,000 | 10.250%, 07/24/2024(c) | 559,171 | ||||||
| Easy Tactic Ltd. | ||||||||
| 345,000 | 8.125%, 02/27/2023 | 354,876 | ||||||
| Enova International, Inc. | ||||||||
| 1,120,000 | 8.500%, 09/01/2024(c) | 1,070,065 | ||||||
| 580,000 | 8.500%, 09/15/2025(c) | 549,550 | ||||||
| Financiera de Desarrollo Territorial S.A. | ||||||||
| | 6,675,000,000 (COP) | | 7.875%, 08/12/2024(c) | 2,153,052 | ||||
| Financiera Independencia SAB de C.V. | ||||||||
| 600,000 | 8.000%, 07/19/2024 | 561,255 | ||||||
| Gilex Holding S.A.R.L | ||||||||
| 510,000 | 8.500%, 05/02/2023 | 549,104 | ||||||
| goeasy Ltd. | ||||||||
| 3,850,000 | 5.375%, 12/01/2024(c) | 3,928,598 | ||||||
| Greenland Global Investment Ltd. | ||||||||
| 410,000 | 5.875%, 07/03/2024 | 398,148 | ||||||
| Hall of Fame | ||||||||
| 387,300 | 10.822%, 10/31/2020(b)(f) | 387,300 | ||||||
| HSBC Holdings Plc | ||||||||
| 1,910,000 | 2.537%, 09/11/2021(g) | 1,914,393 | ||||||
| Icahn Enterprises L.P./Icahn Enterprises Finance Corp. | ||||||||
| 2,314,000 | 4.750%, 09/15/2024(c) | 2,380,527 | ||||||
| 4,225,000 | 6.250%, 05/15/2026 | 4,507,543 | ||||||
| iStar, Inc. | ||||||||
| 6,625,000 | 4.750%, 10/01/2024 | 6,878,969 | ||||||
| JPMorgan Chase Bank N.A. | ||||||||
| 1,780,000 | 3.086%, 04/26/2021(f) | 1,786,218 | ||||||
| Kaisa Group Holdings Ltd. | ||||||||
| 435,000 | 11.950%, 10/22/2022(c) | 454,305 | ||||||
| KeyBank N.A. | ||||||||
| 1,050,000 | 3.300%, 02/01/2022 | 1,079,026 | ||||||
| Logan Property Holdings Co. Ltd. | ||||||||
| 200,000 | 5.250%, 02/23/2023 | 200,042 | ||||||
| Marsh & McLennan Cos., Inc. | ||||||||
| 1,210,000 | 3.500%, 12/29/2020 | 1,228,034 | ||||||
| MGM Growth Properties Operating Partnership L.P./MGP FinanceCo-Issuer, Inc. | ||||||||
| 3,070,000 | 5.625%, 05/01/2024 | 3,364,183 | ||||||
| 3,100,000 | 5.750%, 02/01/2027(c) | 3,460,375 | ||||||
| Mitsubishi UFJ Financial Group, Inc. | ||||||||
| 1,935,000 | 2.586%, 07/26/2021(g) | 1,943,986 | ||||||
| 1,935,000 | 3.535%, 07/26/2021 | 1,981,031 | ||||||
| MPT Operating Partnership L.P./MPT Finance Corp. | ||||||||
| 5,050,000 | 5.000%, 10/15/2027 | 5,365,751 | ||||||
| Principal Amount^ | Value | |||||||
| Financial (continued) | ||||||||
| Navient Corp. | ||||||||
| $ 40,000 | 6.750%, 06/15/2026 | $ | 44,038 | |||||
| New York Life Global Funding | ||||||||
| 2,575,000 | 2.233%, 01/21/2022(c)(g) | 2,581,214 | ||||||
| 880,000 | 2.441%, 07/12/2022(c)(g) | 883,727 | ||||||
| PNC Bank N.A. | ||||||||
| 3,520,000 | 2.403%, 07/22/2022(g) | 3,526,741 | ||||||
| Radian Group, Inc. | ||||||||
| 2,570,000 | 4.500%, 10/01/2024 | 2,725,267 | ||||||
| 3,550,000 | 4.875%, 03/15/2027 | 3,746,484 | ||||||
| RKP Overseas Finance 2016 A Ltd. | ||||||||
| 200,000 | 7.950%, 02/17/2022(d) | 192,547 | ||||||
| Shimao Property Holdings Ltd. | ||||||||
| 200,000 | 4.750%, 07/03/2022 | 204,740 | ||||||
| Springleaf Finance Corp. | ||||||||
| 575,000 | 7.125%, 03/15/2026 | 665,893 | ||||||
| 500,000 | 6.625%, 01/15/2028 | 565,325 | ||||||
| Standard Chartered Plc | ||||||||
| 1,760,000 | 3.091%, 09/10/2022(c)(g) | 1,772,082 | ||||||
| 955,000 | 3.116%, 01/20/2023(c)(g) | 962,072 | ||||||
| 955,000 | 4.247%, 01/20/2023(c)(f) | 989,619 | ||||||
| Starwood Property Trust, Inc. | ||||||||
| 6,458,000 | 4.750%, 03/15/2025 | 6,832,015 | ||||||
| Sumitomo Mitsui Banking Corp. | ||||||||
| 1,960,000 | 2.352%, 01/17/2020(g) | 1,960,393 | ||||||
| Sunac China Holdings Ltd. | ||||||||
| 335,000 | 7.250%, 06/14/2022 | 345,036 | ||||||
| Unifin Financiera SAB de C.V. | ||||||||
| 600,000 | 8.875%, 01/29/2025(d)(f) | 553,158 | ||||||
| US Bank N.A. | ||||||||
| 1,735,000 | 3.000%, 02/04/2021 | 1,756,195 | ||||||
| 1,860,000 | 2.284%, 11/16/2021(g) | 1,866,297 | ||||||
| USAA Capital Corp. | ||||||||
| 1,940,000 | 3.000%, 07/01/2020(c) | 1,950,782 | ||||||
| Wells Fargo Bank N.A. | ||||||||
| 940,000 | 3.625%, 10/22/2021 | 967,708 | ||||||
| 2,475,000 | 2.545%, 09/09/2022(g) | 2,488,972 | ||||||
| Yanlord Land Hong Kong Co. Ltd. | ||||||||
| 200,000 | 5.875%, 01/23/2022 | 202,195 | ||||||
|
| |||||||
| 107,723,771 | ||||||||
|
| |||||||
| Industrial: 3.1% | ||||||||
| 3M Co. | ||||||||
| 1,750,000 | 2.750%, 03/01/2022 | 1,782,277 | ||||||
| Aeropuertos Dominicanos Siglo XXI S.A. | ||||||||
| 350,000 | 6.750%, 03/30/2029 | 387,750 | ||||||
| APX Group, Inc. | ||||||||
| 1,963,000 | 8.750%, 12/01/2020 | 1,965,454 | ||||||
| Arconic, Inc. | ||||||||
| 6,280,000 | 5.125%, 10/01/2024 | 6,849,690 | ||||||
The accompanying notes are an integral part of these financial statements.
| Schedule of Investments | 57 | |||||
Table of Contents
Litman Gregory Masters Alternative Strategies Fund
SCHEDULE OF INVESTMENTS IN SECURITIES at December 31, 2019 (Continued)
| Principal Amount^ | Value | |||||||
| CORPORATE BONDS (CONTINUED) | ||||||||
| Industrial (continued) | ||||||||
| Ball Corp. | ||||||||
| $ 5,472,000 | 4.875%, 03/15/2026 | $ | 5,947,243 | |||||
| Boeing Co. (The) | ||||||||
| 1,555,000 | 2.700%, 05/01/2022 | 1,579,893 | ||||||
| Bombardier, Inc. | ||||||||
| 768,000 | 7.500%, 03/15/2025(c) | 793,912 | ||||||
| 790,000 | 7.875%, 04/15/2027(c) | 814,707 | ||||||
| C10 Capital SPV Ltd. | ||||||||
| 200,000 | 6.655%, 03/31/2020(g) | 198,000 | ||||||
| C5 Capital SPV Ltd. | ||||||||
| 200,000 | 6.222%, 03/31/2020(g) | 196,000 | ||||||
| Cascades, Inc./Cascades USA, Inc. | ||||||||
| 318,000 | 5.125%, 01/15/2026(c) | 327,540 | ||||||
| Caterpillar Financial Services Corp. | ||||||||
| 1,650,000 | 2.190%, 09/04/2020(g) | 1,651,963 | ||||||
| 680,000 | 3.150%, 09/07/2021 | 695,268 | ||||||
| Clean Harbors, Inc. | ||||||||
| 500,000 | 4.875%, 07/15/2027(c) | 527,175 | ||||||
| FedEx Corp. | ||||||||
| 695,000 | 3.400%, 01/14/2022 | 714,091 | ||||||
| General Dynamics Corp. | ||||||||
| 2,030,000 | 2.191%, 05/11/2020(g) | 2,031,306 | ||||||
| General Electric Co. | ||||||||
| 363,000 | 5.000%, 01/21/2021(d)(f) | 356,096 | ||||||
| GMR Hyderabad International Airport Ltd. | ||||||||
| 735,000 | 5.375%, 04/10/2024 | 762,151 | ||||||
| Honeywell International, Inc. | ||||||||
| 1,755,000 | 2.150%, 08/08/2022 | 1,771,807 | ||||||
| 1,755,000 | 2.274%, 08/08/2022(g) | 1,765,376 | ||||||
| Hornbeck Offshore Services, Inc. | ||||||||
| 186,000 | 5.875%, 04/01/2020 | 66,960 | ||||||
| IHS Netherlands Holdco B.V. | ||||||||
| 500,000 | 7.125%, 03/18/2025(c) | 523,113 | ||||||
| John Deere Capital Corp. | ||||||||
| 2,000,000 | 2.377%, 06/13/2022(g) | 2,009,304 | ||||||
| 700,000 | 2.365%, 09/08/2022(g) | 703,643 | ||||||
| JSL Europe S.A. | ||||||||
| 550,000 | 7.750%, 07/26/2024 | 594,327 | ||||||
| Klabin Austria GmbH | ||||||||
| 550,000 | 7.000%, 04/03/2049 | 602,525 | ||||||
| Koppers, Inc. | ||||||||
| 1,194,000 | 6.000%, 02/15/2025(c) | 1,253,688 | ||||||
| Leonardo US Holdings, Inc. | ||||||||
| 438,000 | 6.250%, 01/15/2040(c) | 484,078 | ||||||
| OSX 3 Leasing B.V. | ||||||||
| 1,216,328 | 13.000%, 03/20/2015(c)(i) | 316,245 | ||||||
| 39,531 | 0.000%, 12/31/2099(b)(d) | 0 | ||||||
| 39,531 | 0.000%, 12/31/2099(b)(d) | 0 | ||||||
| Principal Amount^ | Value | |||||||
| Industrial (continued) | ||||||||
| Park-Ohio Industries, Inc. | ||||||||
| $ 500,000 | 6.625%, 04/15/2027 | $ | 510,451 | |||||
| Patrick Industries, Inc. | ||||||||
| 300,000 | 7.500%, 10/15/2027(c) | 320,354 | ||||||
| Rolls-Royce Plc | ||||||||
| 1,750,000 | 2.375%, 10/14/2020(c) | 1,756,894 | ||||||
| Sensata Technologies, Inc. | ||||||||
| 3,191,000 | 4.375%, 02/15/2030(c) | 3,261,026 | ||||||
| Silgan Holdings, Inc. | ||||||||
| 159,000 | 4.125%, 02/01/2028(c) | 159,445 | ||||||
| TopBuild Corp. | ||||||||
| 2,810,000 | 5.625%, 05/01/2026(c) | 2,944,451 | ||||||
| TransDigm UK Holdings Plc | ||||||||
| 1,200,000 | 6.875%, 05/15/2026 | 1,281,417 | ||||||
| TransDigm, Inc. | ||||||||
| 2,225,000 | 6.375%, 06/15/2026 | 2,363,974 | ||||||
| 2,900,000 | 7.500%, 03/15/2027 | 3,177,385 | ||||||
| Tutor Perini Corp. | ||||||||
| 1,179,000 | 6.875%, 05/01/2025(c) | 1,140,683 | ||||||
| Vertiv Group Corp. | ||||||||
| 3,107,000 | 9.250%, 10/15/2024(a)(c) | 3,346,503 | ||||||
|
| |||||||
| 57,934,165 | ||||||||
|
| |||||||
| Technology: 1.6% | ||||||||
| Amkor Technology, Inc. | ||||||||
| 3,699,000 | 6.625%, 09/15/2027(c) | 4,080,367 | ||||||
| Apple, Inc. | ||||||||
| 2,275,000 | 1.700%, 09/11/2022 | 2,274,292 | ||||||
| Broadcom, Inc. | ||||||||
| 2,675,000 | 4.750%, 04/15/2029(c) | 2,927,666 | ||||||
| CDW LLC/CDW Finance Corp. | ||||||||
| 1,800,000 | 4.250%, 04/01/2028 | 1,891,080 | ||||||
| Entegris, Inc. | ||||||||
| 2,930,000 | 4.625%, 02/10/2026(c) | 3,037,971 | ||||||
| Fair Isaac Corp. | ||||||||
| 2,879,000 | 5.250%, 05/15/2026(c) | 3,175,098 | ||||||
| 160,000 | 4.000%, 06/15/2028(c) | 161,600 | ||||||
| Hewlett Packard Enterprise Co. | ||||||||
| 1,760,000 | 2.567%, 03/12/2021(g) | 1,766,857 | ||||||
| International Business Machines Corp. | ||||||||
| 1,740,000 | 2.850%, 05/13/2022 | 1,779,931 | ||||||
| MSCI, Inc. | ||||||||
| 3,064,000 | 4.000%, 11/15/2029(c) | 3,111,798 | ||||||
| NCR Corp. | ||||||||
| 2,750,000 | 6.125%, 09/01/2029(c) | 2,989,168 | ||||||
| Nuance Communications, Inc. | ||||||||
| 1,770,000 | 5.625%, 12/15/2026 | 1,890,462 | ||||||
|
| |||||||
| 29,086,290 | ||||||||
|
| |||||||
| Utilities: 0.3% | ||||||||
| AES Gener S.A. | ||||||||
| 200,000 | 7.125%, 03/26/2079(f) | 210,403 | ||||||
| 400,000 | 6.350%, 10/07/2079(c)(f) | 410,600 | ||||||
| Cometa Energia S.A. de C.V. | ||||||||
| 581,400 | 6.375%, 04/24/2035 | 634,270 | ||||||
| Empresa Electrica Guacolda S.A. | ||||||||
| 300,000 | 4.560%, 04/30/2025 | 273,656 | ||||||
The accompanying notes are an integral part of these financial statements.
| 58 | Litman Gregory Funds Trust | |||||
Table of Contents
Litman Gregory Masters Alternative Strategies Fund
SCHEDULE OF INVESTMENTS IN SECURITIES at December 31, 2019 (Continued)
| Principal Amount^ | Value | |||||||
| CORPORATE BONDS (CONTINUED) | ||||||||
| Utilities (continued) | ||||||||
| Enel SpA | ||||||||
| $ 740,000 | 8.750%, 09/24/2073(c)(f) | $ | 870,499 | |||||
| Energuate Trust | ||||||||
| 550,000 | 5.875%, 05/03/2027 | 569,441 | ||||||
| Pampa Energia S.A. | ||||||||
| 150,000 | 7.500%, 01/24/2027 | 128,329 | ||||||
| 150,000 | 9.125%, 04/15/2029(c) | 129,802 | ||||||
| Star Energy Geothermal Wayang Windu Ltd. | ||||||||
| 552,000 | 6.750%, 04/24/2033 | 585,588 | ||||||
| Stoneway Capital Corp. | ||||||||
| 177,117 | 10.000%, 03/01/2027 | 112,597 | ||||||
| Vistra Operations Co. LLC | ||||||||
| 2,465,000 | 3.700%, 01/30/2027(c) | 2,451,659 | ||||||
|
| |||||||
| 6,376,844 | ||||||||
|
| |||||||
| | TOTAL CORPORATE BONDS | 529,971,055 | �� | |||||
|
| |||||||
| GOVERNMENT SECURITIES & AGENCY ISSUE: 1.0% | ||||||||
| Argentina POM Politica Monetaria | ||||||||
| | 10,815,000 (ARS) | | 56.590%, 06/21/2020(g) | 119,574 | ||||
| Dominican Republic International Bond | ||||||||
| 550,000 | 6.400%, 06/05/2049(c) | 604,827 | ||||||
| Export-Import Bank of Korea | ||||||||
| 895,000 | 2.472%, 06/25/2022(g) | 897,663 | ||||||
| Provincia de Buenos Aires Government Bonds | ||||||||
| | 72,825,000 (ARS) | | 45.979%, 05/31/2022(g) | 693,219 | ||||
| | 15,545,000 (ARS) | | 52.270%, 04/12/2025(c)(g) | 144,000 | ||||
| Republic of South Africa Government Bond | ||||||||
| | 57,275,000 (ZAR) | | 8.750%, 01/31/2044 | 3,605,764 | ||||
| | 24,010,000 (ZAR) | | 8.750%, 02/28/2048 | 1,517,301 | ||||
| United States Treasury Note | ||||||||
| 10,500,000 | 2.750%, 09/30/2020(a) | 10,585,312 | ||||||
|
| |||||||
| | TOTAL GOVERNMENT SECURITIES & | 18,167,660 | ||||||
|
| |||||||
| LIMITED PARTNERSHIPS: 0.2% | ||||||||
| 33,031 | GACP II L.P. | 1,887,184 | ||||||
| 1,300,000 | U.S. Farming Realty Trust II L.P.(b) | 1,063,211 | ||||||
|
| |||||||
| | TOTAL LIMITED PARTNERSHIPS | 2,950,395 | ||||||
|
| |||||||
| Principal Amount^ | Value | |||||||
| MORTGAGE-BACKED SECURITIES: 19.4% | ||||||||
| Adjustable Rate Mortgage Trust | ||||||||
| $ 2,056,771 | Series2005-2-6M2 | $ | 2,077,869 | |||||
| 355,188 | Series2006-1-2A1 | 273,770 | ||||||
| American Home Mortgage Investment Trust | ||||||||
| 358,532 | Series2006-1-11A1 | 342,037 | ||||||
| AREIT Trust | ||||||||
| 1,000,000 | Series2019-CRE3-D | 1,003,201 | ||||||
| Banc of America Alternative Loan Trust | ||||||||
| 73,991 | Series2003-8-1CB1 | 78,157 | ||||||
| 659,906 | Series2006-7-A4 | 346,714 | ||||||
| Banc of America Funding Trust | ||||||||
| 71,081 | Series2005-7-3A1 | 77,344 | ||||||
| 132,665 | Series2006-6-1A2 | 133,424 | ||||||
| 734,769 | Series2006-7-T2A3 | 713,124 | ||||||
| 430,654 | Series2006-B-7A1 | 411,568 | ||||||
| 3,348,310 | Series2007-1-TA4 | 3,326,924 | ||||||
| 76,505 | Series2007-4-5A1 | 76,667 | ||||||
| 3,069,822 | Series2010-R5-1A3 | 2,971,174 | ||||||
| 796,993 | Series2010-R9-3A3 | 660,389 | ||||||
| Banc of America Merrill Lynch Commercial Mortgage Securities Trust | ||||||||
| 1,474,000 | Series2019-AHT-D | 1,481,453 | ||||||
| Banc of America Mortgage Trust | ||||||||
| 22,032 | Series2005-A-2A1 | 22,055 | ||||||
| Bancorp Commercial Mortgage Trust | ||||||||
| 665,000 | Series2019-CRE5-D | 666,641 | ||||||
| BBCMS Trust | ||||||||
| 750,000 | Series2018-CBM-E | 755,176 | ||||||
| BCAP LLC Trust | ||||||||
| 230,180 | Series2010-RR6-6A2 | 193,099 | ||||||
| 3,057,354 | Series2011-R11-2A4 | 2,604,344 | ||||||
The accompanying notes are an integral part of these financial statements.
| Schedule of Investments | 59 | |||||
Table of Contents
Litman Gregory Masters Alternative Strategies Fund
SCHEDULE OF INVESTMENTS IN SECURITIES at December 31, 2019 (Continued)
| Principal Amount^ | Value | |||||||
| MORTGAGE-BACKED SECURITIES (CONTINUED) | ||||||||
| Bear Stearns Adjustable Rate Mortgage Trust | ||||||||
| $ 4,167,569 | Series2005-12-25A1 | $ | 3,450,138 | |||||
| Bear Stearns Asset-Backed Securities I Trust | ||||||||
| 537,900 | Series2006-AC1-1A1 | 395,179 | ||||||
| BF Mortgage Trust | ||||||||
| 666,000 | Series2019-NYT-F | 671,672 | ||||||
| BHP Trust | ||||||||
| 710,000 | Series2019-BXHP-E | 708,022 | ||||||
| BX Commercial Mortgage Trust | ||||||||
| 1,517,000 | Series2019-IMC-G | 1,528,542 | ||||||
| BX Trust | ||||||||
| 709,000 | Series2019-MMP-F | 711,075 | ||||||
| Carbon Capital VI Commercial Mortgage Trust | ||||||||
| 649,000 | Series2019-FL2-B | 654,172 | ||||||
| CF Trust | ||||||||
| 1,420,000 | Series2019-MF1-F | 1,423,186 | ||||||
| CFCRE Commercial Mortgage Trust | ||||||||
| 16,323,000 | Series2016-C7-XE | 1,012,248 | ||||||
| 7,346,000 | Series2016-C7-XF | 438,882 | ||||||
| CG-CCRE Commercial Mortgage Trust | ||||||||
| 105,000 | Series2014-FL2-COL1 | 104,780 | ||||||
| 205,000 | Series2014-FL2-COL2 | 204,355 | ||||||
| Chase Mortgage Finance Trust | ||||||||
| 3,434,366 | Series2007-S2-1A9 | 2,767,175 | ||||||
| 1,732,345 | Series2007-S3-1A15 | 1,339,160 | ||||||
| ChaseFlex Trust | ||||||||
| 1,225,639 | Series2007-3-2A1 | 1,097,078 | ||||||
| CIM Trust | ||||||||
| 6,000,000 | Series2016-1RR-B2 | 5,989,051 | ||||||
| Principal Amount^ | Value | |||||||
| $ 10,000,000 | Series2016-2RR-B2 | $ | 10,000,054 | |||||
| 10,000,000 | Series2016-3RR-B2 | 9,958,970 | ||||||
| 7,860,000 | Series2017-3RR-B2 | 8,125,193 | ||||||
| Citicorp Mortgage Securities Trust | ||||||||
| 2,768,896 | Series2006-7-1A1 | 2,645,796 | ||||||
| Citigroup Commercial Mortgage Trust | ||||||||
| 668,000 | Series2015-GC27-D | 634,896 | ||||||
| 1,497,000 | Series2018-TBR-F | 1,511,254 | ||||||
| Citigroup Mortgage Loan Trust, Inc. | ||||||||
| 225,660 | Series2005-5-2A2 | 182,705 | ||||||
| 2,946,761 | Series2005-5-3A2A | 2,176,512 | ||||||
| 404,851 | Series2009-6-8A2 | 425,906 | ||||||
| 3,106,716 | Series2011-12-1A2 | 2,474,517 | ||||||
| 335,313 | Series2018-A-A1 | 337,190 | ||||||
| 779,669 | Series2018-C-A1 | 789,503 | ||||||
| CitiMortgage Alternative Loan Trust | ||||||||
| 277,120 | Series2006-A5-1A13 | 224,454 | ||||||
| 272,712 | Series2006-A5-1A2 | 45,944 | ||||||
| 486,789 | Series2007-A4-1A13 | 474,878 | ||||||
| 249,251 | Series2007-A4-1A6 | 243,263 | ||||||
| 2,408,513 | Series2007-A6-1A5 | 2,365,291 | ||||||
| COMM Mortgage Trust | ||||||||
| 40,000 | Series2012-LC4-C | 41,560 | ||||||
| 1,868,035 | Series2014-UBS4-F | 672,493 | ||||||
| 3,345,369 | Series2014-UBS4-G | 367,991 | ||||||
| 7,000 | Series2014-UBS4-V | 1 | ||||||
| 1,000,000 | Series2015-CR26-E | 873,088 | ||||||
| 1,989,000 | Series2018-HCLV-D | 1,985,473 | ||||||
| Countrywide Alternative Loan Trust | ||||||||
| 137,670 | Series2003-22CB-1A1 | 142,108 | ||||||
| 519,546 | Series2004-13CB-A4 | 451,099 | ||||||
| 104,069 | Series2004-16CB-1A1 | 107,079 | ||||||
The accompanying notes are an integral part of these financial statements.
| 60 | Litman Gregory Funds Trust | |||||
Table of Contents
Litman Gregory Masters Alternative Strategies Fund
SCHEDULE OF INVESTMENTS IN SECURITIES at December 31, 2019 (Continued)
| Principal Amount^ | Value | |||||||
| MORTGAGE-BACKED SECURITIES (CONTINUED) | ||||||||
| Countrywide Alternative Loan Trust (Continued) | ||||||||
| $ 115,661 | Series2004-16CB-3A1 | $ | 118,999 | |||||
| 251,797 | Series2004-J10-2CB1 | 260,575 | ||||||
| 5,409,552 | Series 2005-64CB-1A10 | 5,420,886 | ||||||
| 82,896 | Series2005-J1-2A1 | 85,168 | ||||||
| 2,702,568 | Series2006-13T1-A13 | 2,064,749 | ||||||
| 432,320 | Series2006-31CB-A7 | 369,142 | ||||||
| 4,228,557 | Series2006-36T2-2A1 | 2,883,192 | ||||||
| 451,887 | Series2006-J1-2A1 | 123,240 | ||||||
| 227,536 | Series2007-16CB-2A1 | 111,030 | ||||||
| 65,889 | Series2007-16CB-2A2 | 150,857 | ||||||
| 434,271 | Series2007-19-1A34 | 351,691 | ||||||
| 1,270,632 | Series2007-20-A12 | 1,053,817 | ||||||
| 435,603 | Series2007-22-2A16 | 287,026 | ||||||
| 2,927,268 | Series2007-HY2-1A | 2,841,799 | ||||||
| 2,049,979 | Series2007-HY7C-A4 | 1,939,862 | ||||||
| Countrywide Alternative Loan Trust Resecuritization | ||||||||
| 593,973 | Series2008-2R-2A1 | 413,105 | ||||||
| 3,919,810 | Series2008-2R-4A1 | 3,308,067 | ||||||
| Countrywide Home Loan GMSR Issuer Trust | ||||||||
| 1,980,000 | Series2018-GT1-A | 1,987,777 | ||||||
| Countrywide Home Loan Mortgage Pass-Through Trust | ||||||||
| 9,305 | Series2004-HYB4-2A1 | 9,117 | ||||||
| 670,121 | Series2005-23-A1 | 564,536 | ||||||
| 403,751 | Series2005-HYB8-4A1 | 403,586 | ||||||
| 3,385,250 | Series2006-9-A1 | 2,795,262 | ||||||
| 181,271 | Series2007-10-A5 | 147,989 | ||||||
| 719,971 | Series2007-13-A5 | 594,569 | ||||||
| Principal Amount^ | Value | |||||||
| Credit Suisse Commercial Mortgage Securities Corp. | ||||||||
| $ 175,000 | Series2019-SKLZ-D | $ | 176,393 | |||||
| Credit Suisse First Boston Mortgage Securities Corp. | ||||||||
| 1,339,571 | Series2005-11-7A1 | 1,107,136 | ||||||
| Credit Suisse First Boston Mortgage- Backed Pass-Through Certificates | ||||||||
| 52,133 | Series2003-27-4A4 | 53,815 | ||||||
| 2,478,622 | Series2005-10-10A3 | 1,229,751 | ||||||
| Credit Suisse Mortgage-Backed Trust | ||||||||
| 809,329 | Series2006-6-1A10 | 666,392 | ||||||
| 652,549 | Series2007-1-4A1 | 152,160 | ||||||
| 75,836 | Series2007-2-2A5 | 73,562 | ||||||
| 1,683,583 | Series2011-17R-1A2 | 1,810,230 | ||||||
| 635,000 | Series2014-USA-D | 625,935 | ||||||
| 1,475,000 | Series2014-USA-E | 1,393,617 | ||||||
| 818,360 | Series2018-RPL2-A1 | 820,229 | ||||||
| 313,814 | Series2018-RPL7-A1 | 317,175 | ||||||
| 675,000 | Series2019-RP10-A1 | 675,916 | ||||||
| DBUBS Mortgage Trust | ||||||||
| 310,000 | Series2017-BRBK-D | 314,871 | ||||||
| Deutsche Mortgage and Asset Receiving Corp. | ||||||||
| 3,114,563 | Series2014-RS1-1A2 | 2,998,682 | ||||||
| Deutsche Mortgage Securities, Inc. Mortgage Loan Trust | ||||||||
| 110,092 | Series2006-PR1-3A1 | 103,323 | ||||||
| DSLA Mortgage Loan Trust | ||||||||
| 137,035 | Series2005-AR5-2A1A | 112,967 | ||||||
| Dukinfield II Plc | ||||||||
| 394,644 (GBP) | Series2-A | 528,439 | ||||||
| Eurosail-UK Plc | ||||||||
| 131,250 (GBP) | Series2007-2X-A3C | 170,648 | ||||||
The accompanying notes are an integral part of these financial statements.
| Schedule of Investments | 61 | |||||
Table of Contents
Litman Gregory Masters Alternative Strategies Fund
SCHEDULE OF INVESTMENTS IN SECURITIES at December 31, 2019 (Continued)
| Principal Amount^ | Value | |||||||
| MORTGAGE-BACKED SECURITIES (CONTINUED) | ||||||||
| Federal Home Loan Mortgage Corp. REMICS | ||||||||
| $ 632,561 | Series3118-SD | $ | 103,996 | |||||
| 247,534 | Series3301-MS | 45,856 | ||||||
| 331,574 | Series3303-SE | 55,135 | ||||||
| 215,523 | Series3303-SG | 39,820 | ||||||
| 62,808 | Series3382-SB | 6,626 | ||||||
| 301,004 | Series3382-SW | 44,835 | ||||||
| 85,038 | Series3384-S | 10,237 | ||||||
| 193,009 | Series3384-SG | 35,278 | ||||||
| 2,118,512 | Series3404-SA | 389,575 | ||||||
| 110,810 | Series3417-SX | 11,439 | ||||||
| 69,074 | Series3423-GS | 7,803 | ||||||
| 623,074 | Series3423-TG | 6,310 | ||||||
| 2,739,209 | Series3435-S | 432,932 | ||||||
| 95,614 | Series3445-ES | 10,416 | ||||||
| 376,162 | Series3523-SM | 59,143 | ||||||
| 228,395 | Series3560-KS | 29,382 | ||||||
| 134,521 | Series3598-SA | 16,554 | ||||||
| 169,389 | Series3641-TB | 184,092 | ||||||
| 616,374 | Series3728-SV | 57,830 | ||||||
| Principal Amount^ | Value | |||||||
| $ 232,052 | Series3758-S | $ | 38,076 | |||||
| 871,811 | Series3770-SP | 86,352 | ||||||
| 296,657 | Series3815-ST | 43,404 | ||||||
| 646,147 | Series3859-SI | 121,893 | ||||||
| 198,134 | Series3872-SL | 27,160 | ||||||
| 158,407 | Series3900-SB | 20,369 | ||||||
| 30,651 | Series3946-SM | 39,196 | ||||||
| 1,167,294 | Series3957-DZ | 1,203,494 | ||||||
| 1,258,669 | Series3972-AZ | 1,287,489 | ||||||
| 3,349,834 | Series3984-DS | 516,287 | ||||||
| 4,293,780 | Series4223-AT | 4,107,907 | ||||||
| 2,066,704 | Series4229-MS | 2,124,305 | ||||||
| 4,568,025 | Series4239-OU | 3,598,000 | ||||||
| 3,197,103 | Series4291-MS | 610,580 | ||||||
| 3,135,027 | Series4314-MS | 403,037 | ||||||
| 10,000,000 | Series4435-SA | 12,075,138 | ||||||
| 8,849,242 | Series4657-VZ | 8,943,130 | ||||||
| Federal Home Loan Mortgage Corp. Structured Agency Credit Risk Debt Notes | ||||||||
| 39,633 | Series2014-DN2-M2 | 39,754 | ||||||
| 283,476 | Series2015-DNA1-M2 | 285,345 | ||||||
| 40,000 | Series2018-DNA1-M2 | 40,119 | ||||||
The accompanying notes are an integral part of these financial statements.
| 62 | Litman Gregory Funds Trust | |||||
Table of Contents
Litman Gregory Masters Alternative Strategies Fund
SCHEDULE OF INVESTMENTS IN SECURITIES at December 31, 2019 (Continued)
| Principal Amount^ | Value | |||||||
| MORTGAGE-BACKED SECURITIES (CONTINUED) | ||||||||
| Federal National Mortgage Association Connecticut Avenue Securities | ||||||||
| $ 430,000 | Series2017-C05-1M2 | $ | 437,745 | |||||
| 95,000 | Series2017-C07-1M2 | 96,847 | ||||||
| Federal National Mortgage Association REMICS | ||||||||
| 354,512 | Series2003-84-PZ | 392,090 | ||||||
| 717,464 | Series2005-42-SA | 72,003 | ||||||
| 2,362,142 | Series2006-92-LI | 423,503 | ||||||
| 599,799 | Series2007-39-AI | 100,573 | ||||||
| 176,240 | Series2007-57-SX | 29,159 | ||||||
| 33,054 | Series2007-68-SA | 3,903 | ||||||
| 34,540 | Series2008-1-CI | 3,673 | ||||||
| 1,807,215 | Series2008-33-SA | 292,201 | ||||||
| 72,492 | Series2008-56-SB | 8,878 | ||||||
| 3,688,336 | Series2009-110-SD | 529,980 | ||||||
| 46,733 | Series2009-111-SE | 5,876 | ||||||
| 235,446 | Series2009-86-CI | 22,650 | ||||||
| 146,828 | Series2009-87-SA | 17,863 | ||||||
| 73,099 | Series2009-90-IB | 8,332 | ||||||
| 83,804 | Series2010-11-SC | 7,037 | ||||||
| 51,675 | Series2010-115-SD | 7,240 | ||||||
| Principal Amount^ | Value | |||||||
| $ 3,775,709 | Series2010-123-SK | $ | 693,372 | |||||
| 947,119 | Series2010-134-SE | 77,034 | ||||||
| 243,796 | Series2010-15-SL | 30,774 | ||||||
| 74,305 | Series2010-9-GS | 5,622 | ||||||
| 6,420 | Series2011-110-LS | 8,183 | ||||||
| 274,352 | Series2011-111-VZ | 288,990 | ||||||
| 1,228,554 | Series2011-141-PZ | 1,318,993 | ||||||
| 143,182 | Series2011-5-PS | 11,554 | ||||||
| 2,233,997 | Series2011-93-ES | 395,932 | ||||||
| 1,512,468 | Series2012-106-SA | 261,158 | ||||||
| 2,994,607 | Series2012-131-BS | 2,799,414 | ||||||
| 11,100,940 | Series2013-109-BO | 7,921,846 | ||||||
| 2,002,333 | Series2013-15-SC | 2,075,318 | ||||||
| 5,787,725 | Series2013-51-HS | 5,387,655 | ||||||
| 8,526,370 | Series2013-53-ZC | 8,653,762 | ||||||
| 3,711,610 | Series2013-67-NS | 3,568,054 | ||||||
| 6,075,076 | Series2013-74-HZ | 6,089,160 | ||||||
| 3,744,214 | Series2014-50-WS | 544,556 | ||||||
| 10,526,446 | Series2016-72-ZG | 9,908,266 | ||||||
| First Horizon Alternative Mortgage Securities Trust | ||||||||
| 805,784 | Series2006-FA6-1A4 | 597,756 | ||||||
| 312,238 | Series2007-FA4-1A7 | 225,812 | ||||||
The accompanying notes are an integral part of these financial statements.
| Schedule of Investments | 63 | |||||
Table of Contents
Litman Gregory Masters Alternative Strategies Fund
SCHEDULE OF INVESTMENTS IN SECURITIES at December 31, 2019 (Continued)
| Principal Amount^ | Value | |||||||
| MORTGAGE-BACKED SECURITIES (CONTINUED) | ||||||||
| First Horizon Mortgage Pass-Through Trust | ||||||||
| $ 189,526 | Series2006-1-1A10 | $ | 151,342 | |||||
| Fontainebleau Miami Beach Trust | ||||||||
| 693,000 | Series 2019-FBLU H | 650,307 | ||||||
| GCAT Trust | ||||||||
| 755,672 | Series2019-RPL1-A1 | 756,645 | ||||||
| Gosforth Funding Plc | ||||||||
| 370,245 | Series2018-1A-A1 | 370,122 | ||||||
| Government National Mortgage Association | ||||||||
| 658,147 | Series2007-21-S | 105,438 | ||||||
| 235,743 | Series2008-69-SB | 49,953 | ||||||
| 276,773 | Series2009-104-SD | 49,505 | ||||||
| 44,095 | Series2010-98-IA | 5,270 | ||||||
| 634,628 | Series2011-45-GZ | 676,214 | ||||||
| 170,905 | Series2011-69-OC | 156,170 | ||||||
| 3,468,769 | Series2011-69-SC | 514,535 | ||||||
| 560,763 | Series2011-89-SA | 82,116 | ||||||
| 2,752,021 | Series2013-102-BS | 381,888 | ||||||
| 50,784,705 | Series2013-155-IB | 807,482 | ||||||
| 4,470,152 | Series2014-145-CS | 648,827 | ||||||
| 2,931,549 | Series2014-156-PS | 479,115 | ||||||
| 4,829,570 | Series2014-5-SA | 789,578 | ||||||
| 4,863,582 | Series2014-58-SG | 742,993 | ||||||
| 4,852,532 | Series2014-76-SA | 763,589 | ||||||
| Principal Amount^ | Value | |||||||
| $ 5,250,504 | Series2014-95-CS | $ | 975,407 | |||||
| 6,416,597 | Series2018-105-SH | 801,282 | ||||||
| 83,413,501 | Series2018-111-SA | 7,362,351 | ||||||
| 27,710,294 | Series2018-134-CS | 3,481,286 | ||||||
| 7,957,462 | Series2018-153-AS | 1,139,181 | ||||||
| GPMT Ltd. | ||||||||
| 1,507,000 | Series2018-FL1-D | 1,508,893 | ||||||
| GS Mortgage Securities Corp. Trust | ||||||||
| 1,503,000 | Series2018-TWR-G | 1,516,475 | ||||||
| GS Mortgage Securities Trust | ||||||||
| 1,010,000 | Series2011-GC5-D | 1,006,360 | ||||||
| 2,216,000 | Series2014-GC26-D | 1,942,358 | ||||||
| GSCG Trust | ||||||||
| 710,000 | Series2019-600C-H | 643,018 | ||||||
| GSR Mortgage Loan Trust | ||||||||
| 42,607 | Series2005-4F-6A1 | 42,376 | ||||||
| 813,558 | Series2005-9F-2A1 | 643,317 | ||||||
| 125,769 | Series2005-AR4-6A1 | 128,661 | ||||||
| �� | 195,147 | Series2005-AR6-4A5 | 199,998 | |||||
| 279,064 | Series2006-7F-3A4 | 158,024 | ||||||
| 137,718 | Series2006-8F-2A1 | 131,084 | ||||||
| HarborView Mortgage Loan Trust | ||||||||
| 300,610 | Series2004-11-2A2A | 286,995 | ||||||
| 9,479,782 | Series2006-8-1A1 | 7,090,433 | ||||||
| 4,617,305 | Series2007-7-2A1B | 3,878,017 | ||||||
| Hawaii Hotel Trust | ||||||||
| 1,297,000 | Series2019-MAUI-F | 1,300,851 | ||||||
| Hilton Orlando Trust | ||||||||
| 873,000 | Series2018-ORL-F | 877,014 | ||||||
The accompanying notes are an integral part of these financial statements.
| 64 | Litman Gregory Funds Trust | |||||
Table of Contents
Litman Gregory Masters Alternative Strategies Fund
SCHEDULE OF INVESTMENTS IN SECURITIES at December 31, 2019 (Continued)
| Principal Amount^ | Value | |||||||
| MORTGAGE-BACKED SECURITIES (CONTINUED) | ||||||||
| Hilton USA Trust | ||||||||
| $ 1,073,000 | Series2016-SFP-E | $ | 1,078,532 | |||||
| Hospitality Mortgage Trust | ||||||||
| 1,208,104 | Series2019-HIT-G | 1,211,334 | ||||||
| Impac Secured Assets Trust | ||||||||
| 7,299,438 | Series2007-2-1A1C | 6,306,531 | ||||||
| IndyMac INDA Mortgage Loan Trust | ||||||||
| 295,033 | Series2006-AR3-1A1 | 282,193 | ||||||
| IndyMac INDX Mortgage Loan Trust | ||||||||
| 196,820 | Series2004-AR7-A5 | 186,470 | ||||||
| 318,273 | Series2005-AR11-A3 | 289,339 | ||||||
| 758,879 | Series2006-AR2-2A1 | 648,631 | ||||||
| 2,322,566 | Series2006-AR5-2A1 | 2,114,018 | ||||||
| 4,090,714 | Series2006-R1-A3 | 3,853,173 | ||||||
| 1,477,296 | Series2007-AR5-2A1 | 1,414,943 | ||||||
| JP Morgan Chase Commercial Mortgage Securities Trust | ||||||||
| 1,285,000 | Series2011-C3-E | 1,250,455 | ||||||
| 1,531,000 | Series2019-MFP-F | 1,537,226 | ||||||
| 219,000 | Series2019-UES-C | 231,196 | ||||||
| 224,000 | Series2019-UES-D | 233,614 | ||||||
| 261,000 | Series2019-UES-E | 268,305 | ||||||
| 274,000 | Series2019-UES-F | 272,921 | ||||||
| 299,000 | Series2019-UES-G | 287,111 | ||||||
| JP Morgan Mortgage Trust | ||||||||
| 384,076 | Series2004-S1-2A1 | 397,468 | ||||||
| 2,602,533 | Series2005-ALT1-3A1 | 2,292,290 | ||||||
| 63,825 | Series2007-A1-4A2 | 65,272 | ||||||
| 17,608 | Series2007-S1-1A2 | 16,996 | ||||||
| 792,673 | Series2007-S3-1A97 | 646,539 | ||||||
| 393,934 | Series2008-R2-2A | 393,340 | ||||||
| Principal Amount^ | Value | |||||||
| JP Morgan Resecuritization Trust | ||||||||
| $ 7,581,976 | Series2015-4-1A7 | $ | 5,543,106 | |||||
| JPMBB Commercial Mortgage Securities Trust | ||||||||
| 1,616,000 | Series2014-C23-D | 1,603,982 | ||||||
| 300,000 | Series2014-C23-E | 254,963 | ||||||
| 78,000 | Series2015-C27-D | 75,561 | ||||||
| 4,749,500 | Series2015-C27-XFG | 283,361 | ||||||
| Lanark Master Issuer Plc | ||||||||
| 329,333 | Series2019-1A-1A1 | 330,333 | ||||||
| Lehman Mortgage Trust | ||||||||
| 1,898,353 | Series2006-2-2A3 | 1,952,923 | ||||||
| Lehman XS Trust | ||||||||
| 138,341 | Series2006-2N-1A1 | 128,791 | ||||||
| LoanCore Issuer Ltd. | ||||||||
| 1,296,000 | Series2019-CRE3-D | 1,301,754 | ||||||
| Ludgate Funding Plc | ||||||||
| 117,162 (EUR) | Series2007-1-A2B | 125,065 | ||||||
| 456,149 (GBP) | Series2008-W1X-A1 | 588,284 | ||||||
| Master Alternative Loan Trust | ||||||||
| 36,140 | Series2003-9-4A1 | 37,041 | ||||||
| 34,881 | Series2004-5-1A1 | 35,907 | ||||||
| 41,527 | Series2004-5-2A1 | 43,003 | ||||||
| 175,680 | Series2004-8-2A1 | 184,841 | ||||||
| Merrill Lynch Alternative Note Asset Trust | ||||||||
| 504,793 | Series2007-AF1-1AF2 | 484,747 | ||||||
| Merrill Lynch Mortgage Investors Trust | ||||||||
| 11,413 | Series2006-2-2A | 11,530 | ||||||
| Morgan Stanley Bank of America Merrill Lynch Trust | ||||||||
| 15,000 | Series2015-C20-D | 13,979 | ||||||
| 1,000,000 | Series2015-C26-E | 811,323 | ||||||
| Morgan Stanley Capital I Trust | ||||||||
| 285,000 | Series2011-C2-D | 287,457 | ||||||
The accompanying notes are an integral part of these financial statements.
| Schedule of Investments | 65 | |||||
Table of Contents
Litman Gregory Masters Alternative Strategies Fund
SCHEDULE OF INVESTMENTS IN SECURITIES at December 31, 2019 (Continued)
| Principal Amount^ | Value | |||||||
| MORTGAGE-BACKED SECURITIES (CONTINUED) | ||||||||
| Morgan Stanley Capital I Trust (Continued) | ||||||||
| $ 235,000 | Series2011-C2-E | $ | 228,908 | |||||
| 1,508,000 | Series2019-PLND-F | 1,514,504 | ||||||
| Morgan Stanley Mortgage Loan Trust | ||||||||
| 2,647,809 | Series2005-9AR-2A | 2,547,149 | ||||||
| 3,133,012 | Series2006-11-2A2 | 2,446,676 | ||||||
| 397,044 | Series2006-7-3A | 334,779 | ||||||
| 261,332 | Series2007-13-6A1 | 210,967 | ||||||
| Morgan StanleyRe-Remic Trust | ||||||||
| 397,810 | Series2010-R9-3C | 409,705 | ||||||
| Motel 6 Trust | ||||||||
| 1,218,120 | Series2017-M6MZ-M | 1,239,664 | ||||||
| Newgate Funding Plc | ||||||||
| 180,543 (EUR) | Series2007-3X-A2B | 197,144 | ||||||
| OBX Trust | ||||||||
| 588,307 | Series2019-EXP3-1A8 | 593,922 | ||||||
| Prime Mortgage Trust | ||||||||
| 1,410,830 | Series2006-DR1-2A1 | 1,239,233 | ||||||
| Residential Accredit Loans, Inc. | ||||||||
| 1,024,313 | Series2006-QS10-A9 | 1,013,588 | ||||||
| 636,688 | Series2006-QS14-A18 | 573,419 | ||||||
| 483,977 | Series2006-QS17-A5 | 458,774 | ||||||
| 489,788 | Series2006-QS2-1A4 | 473,139 | ||||||
| 578,350 | Series2006-QS7-A3 | 537,988 | ||||||
| 618,665 | Series2007-QS1-2A10 | 574,386 | ||||||
| 967,646 | Series2007-QS3-A1 | 910,942 | ||||||
| 2,169,616 | Series2007-QS6-A6 | 2,088,814 | ||||||
| 537,023 | Series2007-QS8-A8 | 496,538 | ||||||
| 1,608,890 | Series2007-QS9-A33 | 1,529,880 | ||||||
| Residential Asset Securitization Trust | ||||||||
| 177,751 | Series2005-A8CB-A9 | 161,746 | ||||||
| 288,096 | Series2006-A8-1A1 | 249,425 | ||||||
| 259,181 | Series2007-A1-A8 | 151,176 | ||||||
| Principal Amount^ | Value | |||||||
| $ 502,878 | Series2007-A5-2A5 | $ | 426,005 | |||||
| 16,208,413 | Series2007-A9-A1 | 5,593,713 | ||||||
| 16,208,413 | Series2007-A9-A2 | 5,478,742 | ||||||
| Residential Funding Mortgage Securities I Trust | ||||||||
| 582,269 | Series2006-S4-A5 | 577,319 | ||||||
| RMAC Securities No 1 Plc | ||||||||
| 99,434 (EUR) | Series2006-NS1X-A2C | 107,424 | ||||||
| Sequoia Mortgage Trust | ||||||||
| 268,541 | Series2018-CH1-A1 | 273,557 | ||||||
| 984,701 | Series2019-CH1-A1 | 1,003,273 | ||||||
| SLIDE | ||||||||
| 2,400,644 | Series2018-FUN-F | 2,412,037 | ||||||
| Starwood Retail Property Trust | ||||||||
| 235,000 | Series2014-STAR-C | 232,795 | ||||||
| 980,000 | Series2014-STAR-D | 840,133 | ||||||
| 950,000 | Series2014-STAR-E | 736,102 | ||||||
| Structured Adjustable Rate Mortgage Loan Trust | ||||||||
| 810,209 | Series2005-14-A1 | 645,115 | ||||||
| 338,796 | Series2005-15-1A1 | 270,376 | ||||||
| 421,113 | Series2005-22-3A1 | 358,647 | ||||||
| 985,198 | Series2008-1-A2 | 888,034 | ||||||
| Structured Asset Mortgage Investments II Trust | ||||||||
| 7,451,830 | Series2007-AR1-2A1 | 7,218,396 | ||||||
| Structured Asset Securities Corp. Trust | ||||||||
| 850,314 | Series2005-5-2A2 | 797,758 | ||||||
| 9,021,461 | Series2007-4-1A3 | 1,438,319 | ||||||
| Tharaldson Hotel Portfolio Trust | ||||||||
| 1,382,807 | Series2018-THL-F | 1,390,042 | ||||||
The accompanying notes are an integral part of these financial statements.
| 66 | Litman Gregory Funds Trust | |||||
Table of Contents
Litman Gregory Masters Alternative Strategies Fund
SCHEDULE OF INVESTMENTS IN SECURITIES at December 31, 2019 (Continued)
| Principal Amount^ | Value | |||||||
| MORTGAGE-BACKED SECURITIES (CONTINUED) | ||||||||
| UBS-Barclays Commercial Mortgage Trust | ||||||||
| $ 305,000 | Series2012-C2-E | $ | 256,142 | |||||
| Washington Mutual Mortgage Pass-Through Certificates Trust | ||||||||
| 442,903 | Series2005-1-5A1 | 451,822 | ||||||
| 645,223 | Series2006-5-1A5 | 615,525 | ||||||
| 476,744 | Series2006-8-A6 | 259,185 | ||||||
| 3,206,740 | Series2007-5-A3 | 2,250,440 | ||||||
| Wells Fargo Alternative Loan Trust | ||||||||
| 185,015 | Series2007-PA2-3A1 | 133,364 | ||||||
| 272,555 | Series2007-PA2-3A2 | 37,136 | ||||||
| Wells Fargo Commercial Mortgage Trust | ||||||||
| 19,971,000 | Series2015-C28-XE | 1,102,755 | ||||||
| 750,000 | Series2016-C33-D | 692,373 | ||||||
| 1,225,000 | Series2019-JWDR-C | 1,203,180 | ||||||
| Wells Fargo Mortgage-Backed Securities Trust | ||||||||
| 125,208 | Series2006-AR19-A1 | 121,652 | ||||||
| WFRBS Commercial Mortgage Trust | ||||||||
| 155,000 | Series2011-C2-D | 157,855 | ||||||
| 510,000 | Series2011-C3-D | 390,922 | ||||||
| 500,000 | Series2012-C6-D | 524,943 | ||||||
| 160,000 | Series2012-C7-C | 163,490 | ||||||
| 290,000 | Series2012-C7-E | 221,009 | ||||||
|
| |||||||
| | TOTAL MORTGAGE-BACKED SECURITIES | 362,187,767 | ||||||
|
| |||||||
| MUNICIPAL BONDS: 0.2% | ||||||||
| Puerto Rico: 0.2% | ||||||||
| Commonwealth of Puerto Rico | ||||||||
| 1,330,000 | Series A | 849,537 | ||||||
| Puerto Rico Commonwealth Aqueduct & Sewer Authority | ||||||||
| 100,000 | Series A | 104,775 | ||||||
| Principal Amount^ | Value | |||||||
| Puerto Rico (continued) | ||||||||
| $ 311,000 | Series A | $ | 323,518 | |||||
| 890,000 | Series A | 928,047 | ||||||
| 280,000 | Series A | 296,870 | ||||||
| Puerto Rico Public Buildings Authority | ||||||||
| 675,000 | Series U | 526,500 | ||||||
| Puerto Rico Sales Tax Financing Corp. Sales Tax Revenue | ||||||||
| 21,000 | SeriesA-1 | 18,458 | ||||||
| 40,000 | SeriesA-1 | 31,990 | ||||||
| 39,000 | SeriesA-1 | 28,988 | ||||||
| 50,000 | SeriesA-1 | 34,391 | ||||||
| 56,000 | SeriesA-1 | 35,696 | ||||||
| 41,000 | SeriesA-1 | 43,852 | ||||||
| 21,000 | SeriesA-1 | 21,794 | ||||||
| 536,000 | SeriesA-1 | 144,270 | ||||||
| 437,000 | SeriesA-1 | 85,836 | ||||||
| 151,000 | SeriesA-1 | 158,025 | ||||||
| 383,000 | SeriesA-1 | 407,332 | ||||||
| 210,000 | SeriesA-2 | 213,406 | ||||||
| 7,000 | SeriesA-2 | 7,171 | ||||||
| 84,000 | SeriesA-2 | 87,456 | ||||||
|
| |||||||
| | TOTAL MUNICIPAL BONDS | 4,347,912 | ||||||
|
| |||||||
| SHORT-TERM INVESTMENTS: 11.3% | ||||||||
| TREASURY BILLS: 2.2% | ||||||||
| United States Treasury Bill | ||||||||
| 3,550,000 | 1.770%, 04/23/2020(n) | 3,530,778 | ||||||
| 2,190,000 | 1.986%, 07/16/2020(a)(n) | 2,166,960 | ||||||
| 5,290,000 | 1.559%, 09/10/2020(n) | 5,233,528 | ||||||
| 5,295,000 | 1.568%, 10/08/2020(n) | 5,231,930 | ||||||
| 26,000,000 | 1.506%, 11/05/2020(a)(n) | 25,666,037 | ||||||
|
| |||||||
| | TOTAL TREASURY BILLS | 41,829,233 | ||||||
|
| |||||||
The accompanying notes are an integral part of these financial statements.
| Schedule of Investments | 67 | |||||
Table of Contents
Litman Gregory Masters Alternative Strategies Fund
SCHEDULE OF INVESTMENTS IN SECURITIES at December 31, 2019 (Continued)
| Principal Amount^ | Value | |||||||
| REPURCHASE AGREEMENTS : 9.1% | ||||||||
| $170,800,000 | Fixed Income Clearing Corp. 0.120%, 12/31/2019, due 01/02/2020 [collateral: par value $92,840,000 U.S. Treasury Note, 2.750%, due 09/15/2021, value $95,379,423; par value $70,865,000 U.S. Treasury Bond, 2.875%, due 08/15/2045, value $78,877,460] (proceeds $170,801,139) | $ | 170,800,000 | |||||
|
| |||||||
| | TOTAL REPURCHASE AGREEMENTS | 170,800,000 | ||||||
|
| |||||||
| | TOTAL SHORT-TERM INVESTMENTS | 212,629,233 | ||||||
|
| |||||||
| | TOTAL PURCHASED OPTIONS(o) | 146,012 | ||||||
|
| |||||||
| | TOTAL INVESTMENTS BEFORE INVESTMENTS | 1,845,198,818 | ||||||
|
| |||||||
| Other Assets in Excess of Liabilities: 1.2% | 23,118,636 | |||||||
|
| |||||||
| NET ASSETS: 100.0% | $ | 1,868,317,454 | ||||||
|
| |||||||
Percentages are stated as a percent of net assets.
| ADR | American Depositary Receipt |
| BADLARPP | Argentina Badlar Floating Rate Notes |
| CLO | Collateralized Loan Obligation |
| CMT | Constant Maturity Treasury Index |
| ETF | Exchange Traded Fund |
| EURIBOR | Euro Interbank Offered Rate |
| LIBOR | London Interbank Offered Rate |
| L.P. | Limited Partnership |
| PIK | Payment-in-kind |
| REMICS | Real Estate Mortgage Investment Conduit |
| SOFRRATE | Secured Overnight Financing Rate |
| * | Non-Income Producing Security. |
| ^ | The principal amount is stated in U.S. Dollars unless otherwise indicated. |
| (a) | Securities with an aggregate fair value of $242,200,689 have been pledged as collateral for options, total return swaps, credit default swaps, securities sold short and futures positions. |
| (b) | Security is valued using significant unobservable inputs in good faith in accordance with procedures approved by the Board of Trustees. |
| (c) | Security was purchased pursuant to Rule 144A under the Securities Act of 1933 and may be sold in transactions exempt from registration only to qualified institutional buyers or in a public offering registered under Securities Act of 1933. |
| (d) | Perpetual Call. |
| (e) | Coupon increases periodically based upon a predetermined schedule. Stated interest rate in effect at December 31, 2019. |
| (f) | Variable rate security. Interest rate or distribution rate disclosed is that which is in effect at December 31, 2019. |
| (g) | Floating Interest Rate at December 31, 2019. |
| (h) | This position represents an unsettled loan commitment at period end. Certain details associated with this purchase are not known prior to the settlement date, including coupon rate, which will be adjusted on settlement date. |
| (i) | Security is currently in default and/ornon-income producing. |
| (j) | Pay-in-kind securities. |
| (k) | Interest Only security. Security with a notional or nominal principal amount. |
| (l) | Principal Only security. |
| (m) | Issued with a zero coupon. Income is recognized through the accretion of discount. |
| (n) | The rate shown representsyield-to-maturity. |
| (o) | For a breakout of open positions, see details shown in the Schedule of Purchased Options table that follows. |
CURRENCY ABBREVIATIONS:
| ARS | Argentine Peso |
| AUD | Australian Dollar |
| BRL | Brazilian Real |
| CAD | Canadian Dollar |
| COP | Colombian Peso |
| EUR | Euro |
| GBP | British Pound |
| HUF | Hungary Forint |
| MYR | Malaysian Ringgit |
| NOK | Norwegian Krone |
| SGD | Singapore Dollar |
| THB | Thai Baht |
| USD | U.S. Dollar |
| ZAR | South African Rand |
UNFUNDED LOAN COMMITMENTS — At December 31, 2019, the Fund had unfunded loan commitments which could be extended at the option of the borrowers, pursuant to the following agreements:
| Borrower | Principal Amount | Current Value | Unrealized Gain (Loss) | |||||||||
McDermott Technology Americas, Inc., 7.559%, 10/21/2021 | $ | 61,488 | $ | 62,948 | $ | 1,460 | ||||||
The accompanying notes are an integral part of these financial statements.
| 68 | Litman Gregory Funds Trust | |||||
Table of Contents
Litman Gregory Masters Alternative Strategies Fund
SCHEDULE OF PURCHASED OPTIONS at December 31, 2019
| Description | Counterparty | Exercise Price | Expiration Date | Number of Contracts | Notional Amount | Market Value | Premiums Paid | Unrealized Appreciation/ (Depreciation) | ||||||||||||||||||||||
COMMON STOCKS |
| |||||||||||||||||||||||||||||
Call |
| |||||||||||||||||||||||||||||
Northern Oil And Gas, Inc. | Goldman Sachs & Co. | $ | 2.00 | 3/20/2020 | 458 | $ | 107,172 | $ | 20,610 | $ | 9,544 | $ | 11,066 | |||||||||||||||||
Stars Group, Inc. (The) | Goldman Sachs & Co. | 22.50 | 2/21/2020 | 106 | 276,554 | 42,400 | 9,057 | 33,343 | ||||||||||||||||||||||
Xerox Holdings Corp. | Goldman Sachs & Co. | 40.00 | 1/17/2020 | 708 | 2,610,396 | 7,080 | 98,403 | (91,323 | ) | |||||||||||||||||||||
Put |
| |||||||||||||||||||||||||||||
Front Yard Residential Corp. | Goldman Sachs & Co. | 10.00 | 1/17/2020 | 566 | 698,444 | 2,830 | 8,670 | (5,840 | ) | |||||||||||||||||||||
iShares iBoxx High Yield Corp. | Morgan Stanley & Co. | 86.00 | 3/20/2020 | 1,490 | 13,103,060 | 71,520 | 81,348 | (9,828 | ) | |||||||||||||||||||||
Lowe’s Cos., Inc. | Goldman Sachs & Co. | 100.00 | 1/17/2020 | 99 | 1,185,624 | 396 | 27,212 | (26,816 | ) | |||||||||||||||||||||
Nortonlifelock, Inc. | Goldman Sachs & Co. | 20.00 | 1/17/2020 | 146 | 372,592 | 292 | 8,141 | (7,849 | ) | |||||||||||||||||||||
Tiffany & Co. | Goldman Sachs & Co. | 110.00 | 2/21/2020 | 57 | 761,805 | 884 | 10,165 | (9,281 | ) | |||||||||||||||||||||
| �� | |||||||||||||||||||||||||||||
Total Purchased Options | $ | 146,012 | $ | 252,540 | $ | (106,528 | ) | |||||||||||||||||||||||
|
| |||||||||||||||||||||||||||||
The accompanying notes are an integral part of these financial statements.
| Schedule of Investments | 69 | |||||
Table of Contents
Litman Gregory Masters Alternative Strategies Fund
SCHEDULE OF SECURITIES SOLD SHORT at December 31, 2019
| Shares | Value | |||||||
| COMMON STOCKS: (1.9)% | ||||||||
| (27,372) | AbbVie, Inc. | $ | (2,423,517 | ) | ||||
| (4,312) | Bayerische Motoren Werke AG | (354,061 | ) | |||||
| (780) | Beacon Roofing Supply, Inc.* | (24,944 | ) | |||||
| (1,496) | Builders FirstSource, Inc.* | (38,013 | ) | |||||
| (374,541) | Centene Corp.* | (23,547,393 | ) | |||||
| (5,517) | Daimler AG | (305,781 | ) | |||||
| (23,965) | Discovery, Inc. Class A* | (784,614 | ) | |||||
| (3,549) | Fastenal Co. | (131,136 | ) | |||||
| (16,825) | Fiat Chrysler Automobiles N.V. | (249,216 | ) | |||||
| (34,023) | Ford Motor Co. | (316,414 | ) | |||||
| (10,301) | General Motors Co. | (377,017 | ) | |||||
| (13,780) | Honda Motor Co. Ltd. | (392,990 | ) | |||||
| (442) | MSC Industrial Direct Co., Inc. Class A | (34,684 | ) | |||||
| (11,535) | Nielsen Holdings Plc | (234,160 | ) | |||||
| (43,904) | Northern Oil and Gas, Inc.* | (102,735 | ) | |||||
| (8,508) | Pennsylvania Real Estate Investment Trust | (45,348 | ) | |||||
| (9,547) | Peugeot S.A. | (228,292 | ) | |||||
| (1,994) | PPG Industries, Inc. | (266,179 | ) | |||||
| (2,588) | Renault S.A. | (122,550 | ) | |||||
| (3,365) | RPM International, Inc. | (258,297 | ) | |||||
| (457) | Sherwin-Williams Co. (The) | (266,678 | ) | |||||
| (10,568) | Stars Group, Inc. (The)* | (275,719 | ) | |||||
| (618) | Tesla, Inc.* | (258,528 | ) | |||||
| (7,260) | Toyota Motor Corp. | (515,379 | ) | |||||
| (1,050) | United Rentals, Inc.* | (175,108 | ) | |||||
| (708) | Watsco, Inc. | (127,546 | ) | |||||
| (34,483) | WESCO International, Inc.* | (2,047,945 | ) | |||||
| (1,427) | WW Grainger, Inc. | (483,068 | ) | |||||
| (6,586) | Xerox Holdings Corp. | (242,826 | ) | |||||
| (19,205) | Zayo Group Holdings, Inc.* | (665,453 | ) | |||||
|
| |||||||
| | TOTAL COMMON STOCKS | (35,295,591 | ) | |||||
|
| |||||||
| EXCHANGE-TRADED FUNDS: (1.1)% | ||||||||
| (11,536) | iShares Core S&P 500 ETF | (3,728,897 | ) | |||||
| (18,514) | iShares Russell 1000 ETF | (3,303,268 | ) | |||||
| (16,794) | iShares US Financials ETF | (2,313,877 | ) | |||||
| (127,747) | SPDR S&P Regional Banking ETF | (7,441,263 | ) | |||||
| (30,902) | Vanguard Financials ETF | (2,357,204 | ) | |||||
| (6,903) | Vanguard Utilities ETF | (986,370 | ) | |||||
|
| |||||||
| | TOTAL EXCHANGE-TRADED FUNDS | (20,130,879 | ) | |||||
|
| |||||||
| Principal Amount^ | Value | |||||||
| CORPORATE BONDS: (0.1)% | ||||||||
| Dell International LLC/EMC Corp. |
| |||||||
| $(450,000) | 7.125%, 06/15/2024(c) | $ | (475,313 | ) | ||||
| Gray Television, Inc. |
| |||||||
| (556,000) | 5.125%, 10/15/2024(c) | (578,009 | ) | |||||
| Gray Television, Inc. |
| |||||||
| (362,000) | 5.875%, 07/15/2026(c) | (385,747 | ) | |||||
| Western Digital Corp. |
| |||||||
| (848,000) | 4.750%, 02/15/2026 | (885,630 | ) | |||||
|
| |||||||
| | TOTAL CORPORATE BONDS | (2,324,699 | ) | |||||
|
| |||||||
| | TOTAL SECURITIES SOLD SHORT | $ | (57,751,169 | ) | ||||
|
| |||||||
The accompanying notes are an integral part of these financial statements.
| 70 | Litman Gregory Funds Trust | |||||
Table of Contents
Litman Gregory Masters Alternative Strategies Fund
SCHEDULE OF FORWARD FOREIGN CURRENCY EXCHANGE CONTRACTS at December 31, 2019
At December 31, 2019, the Fund had the following forward foreign currency exchange contracts:
| Asset Derivatives | Liability Derivatives | |||||||||||||||||||||||
| Counterparty | Settlement Date | Fund Receiving | U.S. $ Value at December 31, 2019 | Fund Delivering | U.S. $ Value at December 31, 2019 | Unrealized Appreciation | Unrealized Depreciation | |||||||||||||||||
Bank of America N.A. | 1/15/2020 | NOK | $ | 3,444,753 | USD | $ | 3,319,163 | $ | 125,590 | $ | — | |||||||||||||
| 1/21/2020 | USD | 495,851 | CAD | 505,267 | — | (9,416 | ) | |||||||||||||||||
| 2/21/2020 | USD | 724,564 | EUR | 731,962 | — | (7,398 | ) | |||||||||||||||||
Barclays Bank Plc | 1/21/2020 | USD | 554,303 | EUR | 556,340 | — | (2,037 | ) | ||||||||||||||||
| 3/16/2020 | MYR | 3,543,924 | USD | 3,488,540 | 55,384 | — | ||||||||||||||||||
Citibank N.A. | 1/30/2020 | BRL | 1,739,854 | USD | 1,749,719 | — | (9,865 | ) | ||||||||||||||||
| 2/18/2020 | USD | 7,035,711 | SGD | 7,127,243 | — | (91,532 | ) | |||||||||||||||||
Credit Suisse International | 1/2/2020 | USD | 1,890,865 | COP | 2,002,133 | — | (111,268 | ) | ||||||||||||||||
Deutsche Bank AG | 1/31/2020 | GBP | 590,950 | USD | 575,344 | 15,606 | — | |||||||||||||||||
| 1/31/2020 | USD | 618,624 | EUR | 623,039 | — | (4,415 | ) | |||||||||||||||||
| 1/31/2020 | USD | 1,854,337 | GBP | 1,909,631 | — | (55,294 | ) | |||||||||||||||||
Goldman Sachs & Co. | 3/16/2020 | EUR | 6,146,889 | USD | 6,101,437 | 45,452 | — | |||||||||||||||||
| 3/16/2020 | USD | 7,968,672 | EUR | 8,029,165 | — | (60,493 | ) | |||||||||||||||||
| 3/16/2020 | USD | 9,923,768 | GBP | 10,002,722 | — | (78,954 | ) | |||||||||||||||||
| 3/16/2020 | USD | 3,228,512 | ZAR | 3,380,263 | — | (151,751 | ) | |||||||||||||||||
HSBC Holdings Plc | 1/22/2020 | AUD | 1,772,404 | USD | 1,729,914 | 42,490 | — | |||||||||||||||||
| 1/22/2020 | AUD | 1,723,171 | USD | 1,689,383 | 33,788 | — | ||||||||||||||||||
JPMorgan Chase Bank N.A. | 1/10/2020 | EUR | 979,840 | USD | 967,842 | 11,998 | — | |||||||||||||||||
| 1/10/2020 | EUR | 780,068 | USD | 773,883 | 6,185 | — | ||||||||||||||||||
| 1/10/2020 | EUR | 938,570 | USD | 934,142 | 4,428 | — | ||||||||||||||||||
| 1/10/2020 | USD | 256,499 | EUR | 256,871 | — | (372 | ) | |||||||||||||||||
| 1/10/2020 | USD | 207,369 | EUR | 208,557 | — | (1,188 | ) | |||||||||||||||||
| 1/10/2020 | USD | 114,116 | EUR | 115,356 | — | (1,240 | ) | |||||||||||||||||
| 1/10/2020 | USD | 136,416 | EUR | 138,478 | — | (2,062 | ) | |||||||||||||||||
| 1/10/2020 | USD | 398,291 | EUR | 401,607 | — | (3,316 | ) | |||||||||||||||||
| 1/10/2020 | USD | 232,739 | EUR | 236,657 | — | (3,918 | ) | |||||||||||||||||
| 1/10/2020 | USD | 538,799 | EUR | 543,945 | — | (5,146 | ) | |||||||||||||||||
| 1/10/2020 | USD | 1,068,335 | EUR | 1,074,369 | — | (6,034 | ) | |||||||||||||||||
| 1/10/2020 | USD | 516,605 | EUR | 522,929 | — | (6,324 | ) | |||||||||||||||||
| 1/10/2020 | USD | 752,599 | EUR | 761,033 | — | (8,434 | ) | |||||||||||||||||
| 1/10/2020 | USD | 927,476 | EUR | 937,286 | — | (9,810 | ) | |||||||||||||||||
| 1/10/2020 | USD | 3,525,037 | EUR | 3,537,826 | — | (12,789 | ) | |||||||||||||||||
| 1/10/2020 | USD | 1,656,106 | EUR | 1,677,205 | — | (21,099 | ) | |||||||||||||||||
Morgan Stanley & Co. | 1/2/2020 | COP | 2,002,133 | USD | 1,976,653 | 25,480 | — | |||||||||||||||||
| 1/31/2020 | USD | 5,096,827 | ZAR | 5,374,725 | — | (277,898 | ) | |||||||||||||||||
| 4/7/2020 | USD | 1,966,536 | COP | 1,991,679 | — | (25,143 | ) | |||||||||||||||||
UBS AG | 1/15/2020 | HUF | 1,304,264 | USD | 1,281,073 | 23,191 | — | |||||||||||||||||
| 1/15/2020 | HUF | 484,686 | USD | 476,843 | 7,843 | — | ||||||||||||||||||
| 1/22/2020 | USD | 3,599,584 | THB | 3,643,317 | — | (43,733 | ) | |||||||||||||||||
|
|
|
|
|
|
|
|
| ||||||||||||||||
| $ | 80,740,047 | $ | 81,353,541 | $ | 397,435 | $ | (1,010,929 | ) | ||||||||||||||||
|
|
|
|
|
|
|
|
| ||||||||||||||||
The accompanying notes are an integral part of these financial statements.
| Schedule of Investments | 71 | |||||
Table of Contents
Litman Gregory Masters Alternative Strategies Fund
SCHEDULE OF FINANCIAL FUTURES CONTRACTS at December 31, 2019
| Description | Number of Contracts | Notional Amount | Notional Value | Expiration Date | Unrealized Appreciation/ (Depreciation) | |||||||||||||||
Futures Contracts – Long | ||||||||||||||||||||
2YR U.S. Treasury Notes | 534 | $ | 106,800,000 | $ | 115,077,000 | 3/31/2020 | $ | (13,025 | ) | |||||||||||
|
| |||||||||||||||||||
Total Long | $ | (13,025 | ) | |||||||||||||||||
|
| |||||||||||||||||||
Futures Contracts – Short | ||||||||||||||||||||
5YR U.S. Treasury Notes | (1,200 | ) | $ | (120,000,000 | ) | $ | (142,331,250 | ) | 3/31/2020 | $ | 399,241 | |||||||||
10YR U.S. Treasury Notes | (54 | ) | (5,400,000 | ) | (6,934,781 | ) | 3/20/2020 | (6,342 | ) | |||||||||||
Ultra-Long U.S. Treasury Bonds | (46 | ) | (4,600,000 | ) | (8,356,187 | ) | 3/20/2020 | (845 | ) | |||||||||||
Ultra 10YR U.S. Treasury Notes | (132 | ) | (13,200,000 | ) | (18,572,813 | ) | 3/20/2020 | 133,275 | ||||||||||||
|
| |||||||||||||||||||
Total Short | $ | 525,329 | ||||||||||||||||||
|
| |||||||||||||||||||
Total Futures Contracts | $ | 512,304 | ||||||||||||||||||
|
| |||||||||||||||||||
SCHEDULE OF SWAPS at December 31, 2019
| CENTRALLY CLEARED CREDIT DEFAULT SWAP CONTRACTS (1)(2)(3) | ||||||||||||||||||||||||||||||
| Description | Maturity Date | Fixed Deal (Pay) Rate | Implied Credit Spread at December 31, 2019 | Notional Amount(4) | Periodic Payment Frequency | Fair Value | Upfront Premiums Paid / (Received) | Unrealized Appreciation / (Depreciation) | ||||||||||||||||||||||
Buy Protection |
| |||||||||||||||||||||||||||||
Accor S.A. | 12/20/2024 | (1.000 | %) | 0.596 | % | EUR | (150,000 | ) | Quarterly | $ | (3,363 | ) | $ | (3,106 | ) | $ | (257 | ) | ||||||||||||
Akzo Nobel N.V. | 12/20/2024 | (1.000 | %) | 0.270 | % | (2,100,000 | ) | Quarterly | (86,258 | ) | (75,014 | ) | (11,244 | ) | ||||||||||||||||
Ally Financial, Inc. | 12/20/2024 | (5.000 | %) | 0.707 | % | $ | (7,800,000 | ) | Quarterly | (1,569,341 | ) | (1,534,612 | ) | (34,729 | ) | |||||||||||||||
Alstom S.A. | 12/20/2024 | (1.000 | %) | 0.315 | % | EUR | (2,000,000 | ) | Quarterly | (77,013 | ) | (70,561 | ) | (6,452 | ) | |||||||||||||||
American Axle & Manufacturing, Inc. | 12/20/2024 | (5.000 | %) | 2.739 | % | $ | (11,000,000 | ) | Quarterly | (1,074,456 | ) | (9,821 | ) | (1,064,635 | ) | |||||||||||||||
American International Group, Inc. | 12/20/2024 | (1.000 | %) | 0.606 | % | (150,000 | ) | Quarterly | (2,782 | ) | (2,313 | ) | (469 | ) | ||||||||||||||||
Amgen, Inc. | 12/20/2024 | (1.000 | %) | 0.371 | % | (100,000 | ) | Quarterly | (2,988 | ) | (2,946 | ) | (42 | ) | ||||||||||||||||
Amkor Technology, Inc. | 12/20/2024 | (5.000 | %) | 0.656 | % | (2,900,000 | ) | Quarterly | (591,695 | ) | (580,177 | ) | (11,518 | ) | ||||||||||||||||
Anheuser-Busch InBev S.A. | 12/20/2024 | (1.000 | %) | 0.440 | % | EUR | (2,150,000 | ) | Quarterly | (67,245 | ) | (66,050 | ) | (1,195 | ) | |||||||||||||||
Apache Corp. | 12/20/2024 | (1.000 | %) | 1.299 | % | $ | (11,800,000 | ) | Quarterly | 161,264 | 403,495 | (242,231 | ) | |||||||||||||||||
ArcelorMittal S.A. | 12/20/2024 | (5.000 | %) | 1.444 | % | EUR | (8,700,000 | ) | Quarterly | (1,658,528 | ) | (1,585,254 | ) | (73,274 | ) | |||||||||||||||
Assicurazioni Generali SpA | 12/20/2024 | (1.000 | %) | 0.649 | % | (150,000 | ) | Quarterly | (2,915 | ) | (3,337 | ) | 422 | |||||||||||||||||
AT&T, Inc. | 12/20/2024 | (1.000 | %) | 0.669 | % | $ | (250,000 | ) | Quarterly | (3,881 | ) | (2,651 | ) | (1,230 | ) | |||||||||||||||
The accompanying notes are an integral part of these financial statements.
| 72 | Litman Gregory Funds Trust | |||||
Table of Contents
Litman Gregory Masters Alternative Strategies Fund
SCHEDULE OF SWAPS at December 31, 2019 (Continued)
| CENTRALLY CLEARED CREDIT DEFAULT SWAP CONTRACTS (1)(2)(3) (CONTINUED) | ||||||||||||||||||||||||||||||
| Description | Maturity Date | Fixed Deal (Pay) Rate | Implied Credit Spread at December 31, 2019 | Notional Amount(4) | Periodic Payment Frequency | Fair Value | Upfront Premiums Paid / (Received) | Unrealized Appreciation / (Depreciation) | ||||||||||||||||||||||
Buy Protection (Continued) |
| |||||||||||||||||||||||||||||
AutoZone, Inc. | 12/20/2024 | (1.000 | %) | 0.313 | % | $ | (2,900,000) | Quarterly | $ | (94,833 | ) | $ | (93,217 | ) | $ | (1,616 | ) | |||||||||||||
Avis Budget Car Rental LLC/Avis Budget Finance, Inc. | 12/20/2024 | (5.000 | %) | 1.990 | % | (300,000) | Quarterly | (40,187 | ) | (37,637 | ) | (2,550 | ) | |||||||||||||||||
Avnet, Inc. | 12/20/2024 | (1.000 | %) | 0.775 | % | (7,050,000) | Quarterly | (74,137 | ) | (12,620 | ) | (61,517 | ) | |||||||||||||||||
Bank of America Corp. | 12/20/2024 | (1.000 | %) | 0.361 | % | (4,750,000) | Quarterly | (144,357 | ) | (130,881 | ) | (13,476 | ) | |||||||||||||||||
Bayer AG | 12/20/2024 | (1.000 | %) | 0.603 | % | EUR | (10,050,000) | Quarterly | (221,494 | ) | (181,290 | ) | (40,204 | ) | ||||||||||||||||
Beazer Homes USA, Inc. | 12/20/2024 | (5.000 | %) | 1.958 | % | $ | (500,000) | Quarterly | (67,781 | ) | (63,631 | ) | (4,150 | ) | ||||||||||||||||
Berkshire Hathaway, Inc. | 12/20/2024 | (1.000 | %) | 0.326 | % | (100,000) | Quarterly | (3,208 | ) | (3,079 | ) | (129 | ) | |||||||||||||||||
Best Buy Co., Inc. | 12/20/2024 | (5.000 | %) | 0.525 | % | (9,150,000) | Quarterly | (1,933,555 | ) | (1,855,592 | ) | (77,963 | ) | |||||||||||||||||
Block Financial LLC | 12/20/2024 | (5.000 | %) | 0.698 | % | (9,300,000) | Quarterly | (1,875,965 | ) | (1,894,443 | ) | 18,478 | ||||||||||||||||||
Boeing Co. (The) | 12/20/2024 | (1.000 | %) | 0.528 | % | (6,300,000) | Quarterly | (140,339 | ) | (135,793 | ) | (4,546 | ) | |||||||||||||||||
Bouygues S.A. | 12/20/2024 | (1.000 | %) | 0.199 | % | EUR | (5,950,000) | Quarterly | (269,026 | ) | (250,973 | ) | (18,053 | ) | ||||||||||||||||
British Telecommunications Plc | 12/20/2024 | (1.000 | %) | 0.682 | % | EUR | (4,300,000) | Quarterly | (75,543 | ) | (52,688 | ) | (22,855 | ) | ||||||||||||||||
Campbell Soup Co. | 12/20/2024 | (1.000 | %) | 0.588 | % | $ | (100,000) | Quarterly | (1,940 | ) | (1,939 | ) | (1 | ) | ||||||||||||||||
Canadian Natural Resources Ltd. | 12/20/2024 | (1.000 | %) | 0.550 | % | (2,250,000) | Quarterly | (47,754 | ) | (42,771 | ) | (4,983 | ) | |||||||||||||||||
Carnival Corp. | 12/20/2024 | (1.000 | %) | 0.329 | % | (10,950,000) | Quarterly | (350,461 | ) | (308,341 | ) | (42,120 | ) | |||||||||||||||||
Carrefour S.A. | 12/20/2024 | (1.000 | %) | 0.667 | % | EUR | (2,300,000) | Quarterly | (42,434 | ) | (35,723 | ) | (6,711 | ) | ||||||||||||||||
CDX North America High Yield Index Series 33 | 12/20/2024 | (5.000 | %) | 2.805 | % | $ | (94,050,000) | Quarterly | (9,062,875 | ) | (6,019,200 | ) | (3,043,675 | ) | ||||||||||||||||
CDX North America Investment Grade Index Series 33 | 12/20/2024 | (1.000 | %) | 0.453 | % | (80,000,000) | Quarterly | (2,074,588 | ) | (1,563,272 | ) | (511,316 | ) | |||||||||||||||||
Centrica Plc | 12/20/2024 | (1.000 | %) | 0.842 | % | EUR | (10,400,000) | Quarterly | (90,205 | ) | 152,451 | (242,656 | ) | |||||||||||||||||
The accompanying notes are an integral part of these financial statements.
| Schedule of Investments | 73 | |||||
Table of Contents
Litman Gregory Masters Alternative Strategies Fund
SCHEDULE OF SWAPS at December 31, 2019 (Continued)
| CENTRALLY CLEARED CREDIT DEFAULT SWAP CONTRACTS (1)(2)(3) (CONTINUED) | ||||||||||||||||||||||||||||||
| Description | Maturity Date | Fixed Deal (Pay) Rate | Implied Credit Spread at December 31, 2019 | Notional Amount(4) | Periodic Payment Frequency | Fair Value | Upfront Premiums Paid / (Received) | Unrealized Appreciation / (Depreciation) | ||||||||||||||||||||||
Buy Protection (Continued) |
| |||||||||||||||||||||||||||||
CenturyLink, Inc. | 12/20/2024 | (1.000 | %) | 2.162 | % | $ | (11,300,000) | Quarterly | $ | 579,931 | $ | 916,044 | $ | (336,113 | ) | |||||||||||||||
CIT Group, Inc. | 12/20/2024 | (5.000 | %) | 0.519 | % | (9,150,000) | Quarterly | (1,936,489 | ) | (1,846,429 | ) | (90,060 | ) | |||||||||||||||||
CNH Industrial Finance Europe S.A. | 12/20/2024 | (5.000 | %) | 0.843 | % | EUR | (2,650,000) | Quarterly | (605,535 | ) | (600,268 | ) | (5,267 | ) | ||||||||||||||||
Comcast Corp. | 12/20/2024 | (1.000 | %) | 0.346 | % | $ | (200,000) | Quarterly | (6,217 | ) | (6,420 | ) | 203 | |||||||||||||||||
Commerzbank AG | 12/20/2024 | (1.000 | %) | 0.685 | % | EUR | (10,100,000) | Quarterly | (175,840 | ) | (150,313 | ) | (25,527 | ) | ||||||||||||||||
Conagra Brands, Inc. | 12/20/2024 | (1.000 | %) | 0.605 | % | $ | (7,900,000) | Quarterly | (147,006 | ) | (85,365 | ) | (61,641 | ) | ||||||||||||||||
Continental AG | 12/20/2024 | (1.000 | %) | 0.606 | % | EUR | (11,700,000) | Quarterly | (256,027 | ) | (181,402 | ) | (74,625 | ) | ||||||||||||||||
Credit Suisse Group AG | 12/20/2024 | (1.000 | %) | 0.415 | % | (2,000,000) | Quarterly | (65,498 | ) | (53,918 | ) | (11,580 | ) | |||||||||||||||||
CSC Holdings LLC | 12/20/2024 | (5.000 | %) | 0.793 | % | $ | (850,000) | Quarterly | (166,988 | ) | (164,877 | ) | (2,111 | ) | ||||||||||||||||
Danske Bank A/S | 12/20/2024 | (1.000 | %) | 0.778 | % | EUR | (10,200,000) | Quarterly | (124,529 | ) | (99,013 | ) | (25,516 | ) | ||||||||||||||||
Darden Restaurants, Inc. | 12/20/2024 | (1.000 | %) | 0.269 | % | $ | (10,800,000) | Quarterly | (376,913 | ) | (339,765 | ) | (37,148 | ) | ||||||||||||||||
Dell, Inc. | 12/20/2024 | (1.000 | %) | 1.515 | % | (10,850,000) | Quarterly | 253,262 | 504,364 | (251,102 | ) | |||||||||||||||||||
Deutsche Lufthansa AG | 12/20/2024 | (1.000 | %) | 0.533 | % | EUR | (10,100,000) | Quarterly | (262,494 | ) | (133,422 | ) | (129,072 | ) | ||||||||||||||||
Devon Energy Corp. | 12/20/2024 | (1.000 | %) | 0.697 | % | $ | (11,200,000) | Quarterly | (159,327 | ) | 73,967 | (233,294 | ) | |||||||||||||||||
Diamond Offshore Drilling, Inc. | 12/20/2024 | (1.000 | %) | 6.632 | % | (1,300,000) | Quarterly | 271,921 | 338,000 | (66,079 | ) | |||||||||||||||||||
DISH DBS Corp. | 12/20/2024 | (5.000 | %) | 3.571 | % | (400,000) | Quarterly | (23,905 | ) | (20,291 | ) | (3,614 | ) | |||||||||||||||||
Domtar Corp. | 12/20/2024 | (1.000 | %) | 0.769 | % | (11,200,000) | Quarterly | (121,197 | ) | (16,498 | ) | (104,699 | ) | |||||||||||||||||
DR Horton, Inc. | 12/20/2024 | (1.000 | %) | 0.425 | % | $ | (150,000) | Quarterly | (4,093 | ) | (3,930 | ) | (163 | ) | ||||||||||||||||
DXC Technology Co. | 12/20/2024 | (5.000 | %) | 1.277 | % | (9,650,000) | Quarterly | (1,645,374 | ) | (1,610,873 | ) | (34,501 | ) | |||||||||||||||||
Eastman Chemical Co. | 12/20/2024 | (1.000 | %) | 0.582 | % | (9,250,000) | Quarterly | (182,092 | ) | (155,304 | ) | (26,788 | ) | |||||||||||||||||
Electricite de France S.A. | 12/20/2024 | (1.000 | %) | 0.487 | % | EUR | (10,000,000) | Quarterly | (285,925 | ) | (237,343 | ) | (48,582 | ) | ||||||||||||||||
Electrolux AB | 12/20/2024 | (1.000 | %) | 0.193 | % | (9,800,000) | Quarterly | (446,921 | ) | (427,835 | ) | (19,086 | ) | |||||||||||||||||
The accompanying notes are an integral part of these financial statements.
| 74 | Litman Gregory Funds Trust | |||||
Table of Contents
Litman Gregory Masters Alternative Strategies Fund
SCHEDULE OF SWAPS at December 31, 2019 (Continued)
| CENTRALLY CLEARED CREDIT DEFAULT SWAP CONTRACTS (1)(2)(3) (CONTINUED) | ||||||||||||||||||||||||||||||
| Description | Maturity Date | Fixed Deal (Pay) Rate | Implied Credit Spread at December 31, 2019 | Notional Amount(4) | Periodic Payment Frequency | Fair Value | Upfront Premiums Paid / (Received) | Unrealized Appreciation / (Depreciation) | ||||||||||||||||||||||
Buy Protection (Continued) |
| |||||||||||||||||||||||||||||
Enbridge, Inc. | 12/20/2024 | (1.000 | %) | 0.537 | % | $ | (100,000) | Quarterly | $ | (2,186 | ) | $ | (1,445 | ) | $ | (741 | ) | |||||||||||||
Encana Corp. | 12/20/2024 | (1.000 | %) | 1.246 | % | (11,600,000) | Quarterly | 130,660 | 422,722 | (292,062 | ) | |||||||||||||||||||
Enel SpA | 12/20/2024 | (1.000 | %) | 0.584 | % | EUR | (200,000) | Quarterly | (4,622 | ) | (4,754 | ) | 132 | |||||||||||||||||
Expedia Group, Inc. | 12/20/2024 | (1.000 | %) | 0.688 | % | $ | (10,950,000) | Quarterly | (160,099 | ) | (157,568 | ) | (2,531 | ) | ||||||||||||||||
FirstEnergy Corp. | 12/20/2024 | (1.000 | %) | 0.320 | % | (2,750,000) | Quarterly | (89,053 | ) | (84,381 | ) | (4,672 | ) | |||||||||||||||||
Ford Motor Co. | 12/20/2024 | (5.000 | %) | 1.472 | % | (150,000) | Quarterly | (24,044 | ) | (22,031 | ) | (2,013 | ) | |||||||||||||||||
Freeport-McMoRan, Inc. | 12/20/2024 | (1.000 | %) | 1.125 | % | (6,400,000) | Quarterly | 36,661 | 415,746 | (379,085 | ) | |||||||||||||||||||
General Electric Co. | 12/20/2024 | (1.000 | %) | 0.856 | % | (200,000) | Quarterly | (1,345 | ) | (383 | ) | (962 | ) | |||||||||||||||||
General Motors Co. | 12/20/2024 | (5.000 | %) | 1.005 | % | (3,200,000) | Quarterly | (591,991 | ) | (586,546 | ) | (5,445 | ) | |||||||||||||||||
Glencore Finance Europe Ltd. | 12/20/2024 | (5.000 | %) | 1.263 | % | EUR | (8,700,000) | Quarterly | (1,756,215 | ) | (1,655,816 | ) | (100,399 | ) | ||||||||||||||||
Goodyear Tire & Rubber Co. (The) | 12/20/2024 | (5.000 | %) | 1.502 | % | $ | (11,850,000) | Quarterly | (1,880,818 | ) | (1,004,812 | ) | (876,006 | ) | ||||||||||||||||
Halliburton Co. | 12/20/2024 | (1.000 | %) | 0.608 | % | (11,200,000) | Quarterly | (206,641 | ) | (30,581 | ) | (176,060 | ) | |||||||||||||||||
HCA, Inc. | 12/20/2024 | (5.000 | %) | 0.541 | % | (7,050,000) | Quarterly | (1,483,389 | ) | (1,342,382 | ) | (141,007 | ) | |||||||||||||||||
Hess Corp. | 12/20/2024 | (1.000 | %) | 0.698 | % | (7,550,000) | Quarterly | (107,097 | ) | (59,041 | ) | (48,056 | ) | |||||||||||||||||
Host Hotels & Resorts L.P. | 12/20/2024 | (1.000 | %) | 0.428 | % | (11,050,000) | Quarterly | (299,514 | ) | (221,752 | ) | (77,762 | ) | |||||||||||||||||
HSBC Holdings Plc | 12/20/2024 | (1.000 | %) | 0.492 | % | EUR | (9,850,000) | Quarterly | (278,896 | ) | (271,172 | ) | (7,724 | ) | ||||||||||||||||
Imperial Brands Finance Plc | 12/20/2024 | (1.000 | %) | 0.862 | % | (10,100,000) | Quarterly | (76,391 | ) | 67,976 | (144,367 | ) | ||||||||||||||||||
ING Groep N.V. | 12/20/2024 | (1.000 | %) | 0.382 | % | (6,650,000) | Quarterly | (230,357 | ) | (163,735 | ) | (66,622 | ) | |||||||||||||||||
International Paper Co. | 12/20/2024 | (1.000 | %) | 0.389 | % | $ | (11,050,000) | Quarterly | (320,872 | ) | (234,235 | ) | (86,637 | ) | ||||||||||||||||
ITV Plc | 12/20/2024 | (5.000 | %) | 0.913 | % | EUR | (250,000) | Quarterly | (56,007 | ) | (53,217 | ) | (2,790 | ) | ||||||||||||||||
KB Home | 12/20/2024 | (5.000 | %) | 1.097 | % | $ | (200,000) | Quarterly | (36,010 | ) | (37,088 | ) | 1,078 | |||||||||||||||||
Kinder Morgan, Inc. | 12/20/2024 | (1.000 | %) | 0.587 | % | (150,000) | Quarterly | (2,918 | ) | (2,381 | ) | (537 | ) | |||||||||||||||||
The accompanying notes are an integral part of these financial statements.
| Schedule of Investments | 75 | |||||
Table of Contents
Litman Gregory Masters Alternative Strategies Fund
SCHEDULE OF SWAPS at December 31, 2019 (Continued)
| CENTRALLY CLEARED CREDIT DEFAULT SWAP CONTRACTS (1)(2)(3) (CONTINUED) | ||||||||||||||||||||||||||||||
| Description | Maturity Date | Fixed Deal (Pay) Rate | Implied Credit Spread at December 31, 2019 | Notional Amount(4) | Periodic Payment Frequency | Fair Value | Upfront Premiums Paid / (Received) | Unrealized Appreciation / (Depreciation) | ||||||||||||||||||||||
Buy Protection (Continued) |
| |||||||||||||||||||||||||||||
Kohl’s Corp. | 12/20/2024 | (1.000 | %) | 1.164 | % | $ | (13,550,000) | Quarterly | $ | 101,732 | $ | 274,172 | $ | (172,440 | ) | |||||||||||||||
Koninklijke KPN N.V. | 12/20/2024 | (1.000 | %) | 0.647 | % | EUR | (300,000) | Quarterly | (5,868 | ) | (5,106 | ) | (762 | ) | ||||||||||||||||
L Brands, Inc. | 12/20/2024 | (1.000 | %) | 2.994 | % | $ | (12,450,000) | Quarterly | 1,060,395 | 1,356,557 | (296,162 | ) | ||||||||||||||||||
LafargeHolcim Ltd. | 12/20/2024 | (1.000 | %) | 0.629 | % | EUR | (100,000) | Quarterly | (2,056 | ) | (1,860 | ) | (196 | ) | ||||||||||||||||
Lennar Corp. | 12/20/2024 | (5.000 | %) | 0.758 | % | $ | (100,000) | Quarterly | (19,843 | ) | (20,500 | ) | 657 | |||||||||||||||||
Liberty Interactive LLC | 12/20/2024 | (5.000 | %) | 2.036 | % | (4,750,000) | Quarterly | (625,372 | ) | (878,508 | ) | 253,136 | ||||||||||||||||||
Macy’s Retail Holdings, Inc. | 12/20/2024 | (1.000 | %) | 1.669 | % | (11,900,000) | Quarterly | 358,329 | 633,984 | (275,655 | ) | |||||||||||||||||||
Marks & Spencer Plc | 12/20/2024 | (1.000 | %) | 1.682 | % | EUR | (10,800,000) | Quarterly | 391,308 | 742,484 | (351,176 | ) | ||||||||||||||||||
MBIA, Inc. | 12/20/2024 | (5.000 | %) | 1.318 | % | $ | (300,000) | Quarterly | (50,490 | ) | (52,450 | ) | 1,960 | |||||||||||||||||
McKesson Corp. | 12/20/2024 | (1.000 | %) | 0.814 | % | (7,500,000) | Quarterly | (65,275 | ) | (77,812 | ) | 12,537 | ||||||||||||||||||
MDC Holdings, Inc. | 12/20/2024 | (1.000 | %) | 0.705 | % | (7,250,000) | Quarterly | (100,283 | ) | (79,271 | ) | (21,012 | ) | |||||||||||||||||
Mediobanca Banca di Credito Finanziario SpA | 12/20/2024 | (1.000 | %) | 0.783 | % | EUR | (200,000) | Quarterly | (2,395 | ) | (1,903 | ) | (492 | ) | ||||||||||||||||
Meritor, Inc. | 12/20/2024 | (5.000 | %) | 1.025 | % | $ | (8,400,000) | Quarterly | (1,544,702 | ) | (1,267,586 | ) | (277,116 | ) | ||||||||||||||||
MetLife, Inc. | 12/20/2024 | (1.000 | %) | 0.491 | % | (300,000) | Quarterly | (7,227 | ) | (5,531 | ) | (1,696 | ) | |||||||||||||||||
METRO AG | 12/20/2024 | (1.000 | %) | 1.529 | % | EUR | (10,500,000) | Quarterly | 297,087 | 283,158 | 13,929 | |||||||||||||||||||
Motorola Solutions, Inc. | 12/20/2024 | (1.000 | %) | 0.552 | % | $ | (100,000) | Quarterly | (2,111 | ) | (1,929 | ) | (182 | ) | ||||||||||||||||
National Grid Plc | 12/20/2024 | (1.000 | %) | 0.408 | % | EUR | (200,000) | Quarterly | (6,630 | ) | (5,639 | ) | (991 | ) | ||||||||||||||||
Navient Corp. | 12/20/2024 | (5.000 | %) | 1.981 | % | $ | (250,000) | Quarterly | (33,597 | ) | (33,742 | ) | 145 | |||||||||||||||||
Newell Brands, Inc. | 12/20/2024 | (1.000 | %) | 1.005 | % | (2,600,000) | Quarterly | 585 | 8,483 | (7,898 | ) | |||||||||||||||||||
Next Group Plc | 12/20/2024 | (1.000 | %) | 0.756 | % | EUR | (350,000) | Quarterly | (4,717 | ) | (197 | ) | (4,520 | ) | ||||||||||||||||
Nokia Oyj | 12/20/2024 | (5.000 | %) | 1.007 | % | (8,400,000) | Quarterly | (1,830,966 | ) | (1,937,256 | ) | 106,290 | ||||||||||||||||||
Nordstrom, Inc. | 12/20/2024 | (1.000 | %) | 1.111 | % | $ | (15,900,000) | Quarterly | 80,715 | 792,638 | (711,923 | ) | ||||||||||||||||||
Olin Corp. | 12/20/2024 | (1.000 | %) | 1.173 | % | (11,700,000) | Quarterly | 92,908 | 318,902 | (225,994 | ) | |||||||||||||||||||
The accompanying notes are an integral part of these financial statements.
| 76 | Litman Gregory Funds Trust | |||||
Table of Contents
Litman Gregory Masters Alternative Strategies Fund
SCHEDULE OF SWAPS at December 31, 2019 (Continued)
| CENTRALLY CLEARED CREDIT DEFAULT SWAP CONTRACTS (1)(2)(3) (CONTINUED) | ||||||||||||||||||||||||||||||
| Description | Maturity Date | Fixed Deal (Pay) Rate | Implied Credit Spread at December 31, 2019 | Notional Amount(4) | Periodic Payment Frequency | Fair Value | Upfront Premiums Paid / (Received) | Unrealized Appreciation / (Depreciation) | ||||||||||||||||||||||
Buy Protection (Continued) |
| |||||||||||||||||||||||||||||
Omnicom Group, Inc./Omnicom Capital, Inc. | 12/20/2024 | (1.000 | %) | 0.315 | % | $ | (4,600,000) | Quarterly | $ | (150,071 | ) | $ | (143,888 | ) | $ | (6,183 | ) | |||||||||||||
Pearson Funding Plc | 12/20/2024 | (1.000 | %) | 0.688 | % | EUR | (9,950,000) | Quarterly | (171,545 | ) | (158,148 | ) | (13,397 | ) | ||||||||||||||||
Peugeot S.A. | 12/20/2024 | (5.000 | %) | 0.807 | % | (7,050,000) | Quarterly | (1,627,134 | ) | (1,628,933 | ) | 1,799 | ||||||||||||||||||
PostNL N.V. | 12/20/2024 | (1.000 | %) | 0.605 | % | (10,150,000) | Quarterly | (222,279 | ) | (155,943 | ) | (66,336 | ) | |||||||||||||||||
Publicis Groupe S.A. | 12/20/2024 | (1.000 | %) | 0.677 | % | EUR | (10,050,000) | Quarterly | (179,527 | ) | (193,966 | ) | 14,439 | |||||||||||||||||
PulteGroup, Inc. | 12/20/2024 | (5.000 | %) | 0.647 | % | $ | (150,000) | Quarterly | (30,674 | ) | (31,570 | ) | 896 | |||||||||||||||||
Renault S.A. | 12/20/2024 | (1.000 | %) | 1.110 | % | EUR | (10,200,000) | Quarterly | 61,306 | (13,159 | ) | 74,465 | ||||||||||||||||||
Rexel S.A. | 12/20/2024 | (5.000 | %) | 0.864 | % | (8,350,000) | Quarterly | (1,896,855 | ) | (1,830,881 | ) | (65,974 | ) | |||||||||||||||||
Rolls-Royce Plc | 12/20/2024 | (1.000 | %) | 0.994 | % | (10,050,000) | Quarterly | (3,332 | ) | (46,434 | ) | 43,102 | ||||||||||||||||||
Royal Bank of Scotland Group Plc | 12/20/2024 | (1.000 | %) | 0.591 | % | (4,850,000) | Quarterly | (110,264 | ) | 27,211 | (137,475 | ) | ||||||||||||||||||
Ryder System, Inc. | 12/20/2024 | (1.000 | %) | 0.702 | % | $ | (11,100,000) | Quarterly | (155,323 | ) | (68,303 | ) | (87,020 | ) | ||||||||||||||||
SES S.A. | 12/20/2024 | (1.000 | %) | 0.834 | % | EUR | (6,100,000) | Quarterly | (55,658 | ) | (20,457 | ) | (35,201 | ) | ||||||||||||||||
Sherwin-Williams Co. (The) | 12/20/2024 | (1.000 | %) | 0.509 | % | $ | (200,000) | Quarterly | (4,639 | ) | (4,361 | ) | (278 | ) | ||||||||||||||||
Simon Property Group L.P. | 12/20/2024 | (1.000 | %) | 0.421 | % | (10,900,000) | Quarterly | (299,194 | ) | (251,063 | ) | (48,131 | ) | |||||||||||||||||
Springleaf Finance Corp. | 12/20/2024 | (5.000 | %) | 1.164 | % | (200,000) | Quarterly | (35,288 | ) | (35,362 | ) | 74 | ||||||||||||||||||
SSE Plc | 12/20/2024 | (1.000 | %) | 0.494 | % | EUR | (200,000) | Quarterly | (5,643 | ) | (4,119 | ) | (1,524 | ) | ||||||||||||||||
Standard Chartered Plc | 12/20/2024 | (1.000 | %) | 0.477 | % | (4,300,000) | Quarterly | (125,511 | ) | (108,767 | ) | (16,744 | ) | |||||||||||||||||
Teck Resources Ltd. | 12/20/2024 | (5.000 | %) | 1.080 | % | $ | (9,500,000) | Quarterly | (1,719,189 | ) | (1,645,759 | ) | (73,430 | ) | ||||||||||||||||
Telecom Italia SpA | 12/20/2024 | (1.000 | %) | 1.281 | % | EUR | (250,000) | Quarterly | 3,795 | 8,342 | (4,547 | ) | ||||||||||||||||||
Telefonica Emisiones S.A. | 12/20/2024 | (1.000 | %) | 0.570 | % | (250,000) | Quarterly | (5,970 | ) | (4,559 | ) | (1,411 | ) | |||||||||||||||||
Telenor ASA | 12/20/2024 | (1.000 | %) | 0.165 | % | (9,650,000) | Quarterly | (455,834 | ) | (416,563 | ) | (39,271 | ) | |||||||||||||||||
The accompanying notes are an integral part of these financial statements.
| Schedule of Investments | 77 | |||||
Table of Contents
Litman Gregory Masters Alternative Strategies Fund
SCHEDULE OF SWAPS at December 31, 2019 (Continued)
| CENTRALLY CLEARED CREDIT DEFAULT SWAP CONTRACTS (1)(2)(3) (CONTINUED) | ||||||||||||||||||||||||||||||
| Description | Maturity Date | Fixed Deal (Pay) Rate | Implied Credit Spread at December 31, 2019 | Notional Amount(4) | Periodic Payment Frequency | Fair Value | Upfront Premiums Paid / (Received) | Unrealized Appreciation / (Depreciation) | ||||||||||||||||||||||
Buy Protection (Continued) |
| |||||||||||||||||||||||||||||
Tesco Plc | 12/20/2024 | (1.000 | %) | 0.818 | % | EUR | (250,000 | ) | Quarterly | $ | (2,507 | ) | $ | (417 | ) | $ | (2,090 | ) | ||||||||||||
thyssenkrupp AG | 12/20/2024 | (1.000 | %) | 2.173 | % | (8,600,000 | ) | Quarterly | 525,070 | 565,557 | (40,487 | ) | ||||||||||||||||||
Toll Brothers Finance Corp. | 12/20/2024 | (1.000 | %) | 0.786 | % | $ | (3,000,000 | ) | Quarterly | (29,985 | ) | (31,756 | ) | 1,771 | ||||||||||||||||
UBS Group AG | 12/20/2024 | (1.000 | %) | 0.379 | % | EUR | (4,500,000 | ) | Quarterly | (156,724 | ) | (139,268 | ) | (17,456 | ) | |||||||||||||||
United Rentals North America, Inc. | 12/20/2024 | (5.000 | %) | 0.710 | % | $ | (6,350,000 | ) | Quarterly | (1,276,444 | ) | (1,148,324 | ) | (128,120 | ) | |||||||||||||||
Valeo S.A. | 12/20/2024 | (1.000 | %) | 0.818 | % | EUR | (10,650,000 | ) | Quarterly | (106,749 | ) | 89,623 | (196,372 | ) | ||||||||||||||||
Valero Energy Corp. | 12/20/2024 | (1.000 | %) | 0.457 | % | $ | (11,050,000 | ) | Quarterly | (284,179 | ) | (179,909 | ) | (104,270 | ) | |||||||||||||||
Verizon Communications, Inc. | 12/20/2024 | (1.000 | %) | 0.386 | % | (200,000 | ) | Quarterly | (5,830 | ) | (5,676 | ) | (154 | ) | ||||||||||||||||
Vodafone Group Plc | 12/20/2024 | (1.000 | %) | 0.554 | % | EUR | (5,850,000 | ) | Quarterly | (144,969 | ) | (131,460 | ) | (13,509 | ) | |||||||||||||||
Volkswagen International Finance N.V. | 12/20/2024 | (1.000 | %) | 0.742 | % | (700,000 | ) | Quarterly | (9,955 | ) | (4,246 | ) | (5,709 | ) | ||||||||||||||||
Whirlpool Corp. | 12/20/2024 | (1.000 | %) | 0.682 | % | $ | (8,500,000 | ) | Quarterly | (126,869 | ) | (99,863 | ) | (27,006 | ) | |||||||||||||||
Williams Cos, Inc. (The) | 12/20/2024 | (1.000 | %) | 0.750 | % | (10,950,000 | ) | Quarterly | (128,064 | ) | (127,374 | ) | (690 | ) | ||||||||||||||||
|
|
|
|
|
| |||||||||||||||||||||||||
Total Buy Protection |
| $ | (45,772,790 | ) | $ | (33,289,460 | ) | $ | (12,483,330 | ) | ||||||||||||||||||||
|
|
|
|
|
| |||||||||||||||||||||||||
Sell Protection |
| |||||||||||||||||||||||||||||
Accor S.A. | 12/20/2024 | 1.000 | % | 0.596 | % | EUR | 10,050,000 | Quarterly | $ | 225,322 | $ | 140,134 | $ | 85,188 | ||||||||||||||||
Aegon N.V. | 12/20/2024 | 1.000 | % | 0.604 | % | 2,200,000 | Quarterly | 48,349 | 47,550 | 799 | ||||||||||||||||||||
Akzo Nobel N.V. | 12/20/2024 | 1.000 | % | 0.270 | % | 9,800,000 | Quarterly | 402,538 | 393,748 | 8,790 | ||||||||||||||||||||
Ally Financial, Inc. | 12/20/2024 | 5.000 | % | 0.707 | % | $ | 9,300,000 | Quarterly | 1,871,137 | 1,877,697 | (6,560 | ) | ||||||||||||||||||
Altria Group, Inc. | 12/20/2024 | 1.000 | % | 0.490 | % | 2,650,000 | Quarterly | 63,897 | 63,028 | 869 | ||||||||||||||||||||
American Axle & Manufacturing, Inc. | 12/20/2024 | 5.000 | % | 2.739 | % | 800,000 | Quarterly | 78,143 | 65,438 | 12,705 | ||||||||||||||||||||
American International Group, Inc. | 12/20/2024 | 1.000 | % | 0.606 | % | 11,100,000 | Quarterly | 205,890 | 127,367 | 78,523 | ||||||||||||||||||||
The accompanying notes are an integral part of these financial statements.
| 78 | Litman Gregory Funds Trust | |||||
Table of Contents
Litman Gregory Masters Alternative Strategies Fund
SCHEDULE OF SWAPS at December 31, 2019 (Continued)
| CENTRALLY CLEARED CREDIT DEFAULT SWAP CONTRACTS (1)(2)(3) (CONTINUED) | ||||||||||||||||||||||||||||||
| Description | Maturity Date | Fixed Deal (Pay) Rate | Implied Credit Spread at December 31, 2019 | Notional Amount(4) | Periodic Payment Frequency | Fair Value | Upfront Premiums Paid / (Received) | Unrealized Appreciation / (Depreciation) | ||||||||||||||||||||||
Sell Protection (Continued) |
| |||||||||||||||||||||||||||||
Amgen, Inc. | 12/20/2024 | 1.000 | % | 0.371 | % | $ | 10,950,000 | Quarterly | $ | 327,120 | $ | 334,230 | $ | (7,110 | ) | |||||||||||||||
Amkor Technology, Inc. | 12/20/2024 | 5.000 | % | 0.656 | % | 5,600,000 | Quarterly | 1,142,584 | 1,010,040 | 132,544 | ||||||||||||||||||||
Anglo American Capital Plc | 12/20/2024 | 5.000 | % | 0.838 | % | EUR | 8,350,000 | Quarterly | 1,910,918 | 1,791,934 | 118,984 | |||||||||||||||||||
Apache Corp. | 12/20/2024 | 1.000 | % | 1.299 | % | $ | 300,000 | Quarterly | (4,099 | ) | (8,819 | ) | 4,720 | |||||||||||||||||
ArcelorMittal S.A. | 12/20/2024 | 5.000 | % | 1.444 | % | EUR | 4,750,000 | Quarterly | 905,517 | 866,104 | 39,413 | |||||||||||||||||||
Arconic, Inc. | 12/20/2024 | 1.000 | % | 0.769 | % | $ | 8,400,000 | Quarterly | 90,863 | (7,798 | ) | 98,661 | ||||||||||||||||||
Arrow Electronics, Inc. | 12/20/2024 | 1.000 | % | 0.582 | % | 8,000,000 | Quarterly | 157,674 | 139,067 | 18,607 | ||||||||||||||||||||
Assicurazioni Generali SpA | 12/20/2024 | 1.000 | % | 0.649 | % | EUR | 10,100,000 | Quarterly | 196,293 | 163,925 | 32,368 | |||||||||||||||||||
AT&T, Inc. | 12/20/2024 | 1.000 | % | 0.669 | % | $ | 11,250,000 | Quarterly | 174,632 | 58,611 | 116,021 | |||||||||||||||||||
AutoZone, Inc. | 12/20/2024 | 1.000 | % | 0.313 | % | 10,900,000 | Quarterly | 356,443 | 328,867 | 27,576 | ||||||||||||||||||||
Avis Budget Car Rental LLC/Avis Budget Finance, Inc. | 12/20/2024 | 5.000 | % | 1.990 | % | 10,150,000 | Quarterly | 1,359,636 | 1,139,345 | 220,291 | ||||||||||||||||||||
Avnet, Inc. | 12/20/2024 | 1.000 | % | 0.775 | % | 2,600,000 | Quarterly | 27,341 | 23,234 | 4,107 | ||||||||||||||||||||
Barrick Gold Corp. | 12/20/2024 | 1.000 | % | 0.500 | % | 10,900,000 | Quarterly | 257,840 | 284,286 | (26,446 | ) | |||||||||||||||||||
BAT International Finance Plc | 12/20/2024 | 1.000 | % | 0.627 | % | EUR | 2,050,000 | Quarterly | 42,348 | 42,001 | 347 | |||||||||||||||||||
Bayer AG | 12/20/2024 | 1.000 | % | 0.603 | % | 4,900,000 | Quarterly | 107,993 | 96,748 | 11,245 | ||||||||||||||||||||
Beazer Homes USA, Inc. | 12/20/2024 | 5.000 | % | 1.958 | % | $ | 10,200,000 | Quarterly | 1,382,718 | 914,686 | 468,032 | |||||||||||||||||||
Berkshire Hathaway, Inc. | 12/20/2024 | 1.000 | % | 0.326 | % | 10,950,000 | Quarterly | 351,207 | 268,735 | 82,472 | ||||||||||||||||||||
BMW Finance N.V. | 12/20/2024 | 1.000 | % | 0.406 | % | EUR | 8,500,000 | Quarterly | 282,621 | 260,342 | 22,279 | |||||||||||||||||||
Bombardier, Inc. | 12/20/2024 | 5.000 | % | 3.650 | % | $ | 5,100,000 | Quarterly | 286,976 | 27,698 | 259,278 | |||||||||||||||||||
Campbell Soup Co. | 12/20/2024 | 1.000 | % | 0.588 | % | 11,100,000 | Quarterly | 215,410 | 232,476 | (17,066 | ) | |||||||||||||||||||
The accompanying notes are an integral part of these financial statements.
| Schedule of Investments | 79 | |||||
Table of Contents
Litman Gregory Masters Alternative Strategies Fund
SCHEDULE OF SWAPS at December 31, 2019 (Continued)
| CENTRALLY CLEARED CREDIT DEFAULT SWAP CONTRACTS (1)(2)(3) (CONTINUED) | ||||||||||||||||||||||||||||||
| Description | Maturity Date | Fixed Deal (Pay) Rate | Implied Credit Spread at December 31, 2019 | Notional Amount(4) | Periodic Payment Frequency | Fair Value | Upfront Premiums Paid / (Received) | Unrealized Appreciation / (Depreciation) | ||||||||||||||||||||||
Sell Protection (Continued) |
| |||||||||||||||||||||||||||||
Canadian Natural Resources Ltd. | 12/20/2024 | 1.000 | % | 0.550 | % | $ | 2,950,000 | Quarterly | $ | 62,612 | $ | 42,548 | $ | 20,064 | ||||||||||||||||
Cardinal Health, Inc. | 12/20/2024 | 1.000 | % | 1.020 | % | 11,150,000 | Quarterly | (10,301 | ) | (31,009 | ) | 20,708 | ||||||||||||||||||
Carnival Corp. | 12/20/2024 | 1.000 | % | 0.329 | % | 1,450,000 | Quarterly | 46,409 | 45,179 | 1,230 | ||||||||||||||||||||
Centrica Plc | 12/20/2024 | 1.000 | % | 0.842 | % | EUR | 300,000 | Quarterly | 2,602 | (1,512 | ) | 4,114 | ||||||||||||||||||
CenturyLink, Inc. | 12/20/2024 | 1.000 | % | 2.162 | % | $ | 15,500,000 | Quarterly | (795,480 | ) | (941,414 | ) | 145,934 | |||||||||||||||||
CNH Industrial Finance Europe S.A. | 12/20/2024 | 5.000 | % | 0.843 | % | EUR | 10,900,000 | Quarterly | 2,490,691 | 2,525,487 | (34,796 | ) | ||||||||||||||||||
Comcast Corp. | 12/20/2024 | 1.000 | % | 0.346 | % | $ | 10,950,000 | Quarterly | 340,404 | 318,889 | 21,515 | |||||||||||||||||||
Commerzbank AG | 12/20/2024 | 1.000 | % | 0.685 | % | EUR | 150,000 | Quarterly | 2,612 | 2,184 | 428 | |||||||||||||||||||
Conagra Brands, Inc. | 12/20/2024 | 1.000 | % | 0.605 | % | $ | 2,750,000 | Quarterly | 51,173 | 36,678 | 14,495 | |||||||||||||||||||
Continental AG | 12/20/2024 | 1.000 | % | 0.606 | % | EUR | 1,800,000 | Quarterly | 39,389 | 35,412 | 3,977 | |||||||||||||||||||
CVS Health Corp. | 12/20/2024 | 1.000 | % | 0.606 | % | $ | 11,000,000 | Quarterly | 204,299 | 153,008 | 51,291 | |||||||||||||||||||
Danske Bank A/S | 12/20/2024 | 1.000 | % | 0.778 | % | EUR | 200,000 | Quarterly | 2,442 | 2,234 | 208 | |||||||||||||||||||
Deutsche Lufthansa AG | 12/20/2024 | 1.000 | % | 0.533 | % | 4,600,000 | Quarterly | 119,552 | 98,027 | 21,525 | ||||||||||||||||||||
Devon Energy Corp. | 12/20/2024 | 1.000 | % | 0.697 | % | $ | 50,000 | Quarterly | 712 | (71 | ) | 783 | ||||||||||||||||||
DISH DBS Corp. | 12/20/2024 | 5.000 | % | 3.571 | % | 10,900,000 | Quarterly | 651,410 | 168,886 | 482,524 | ||||||||||||||||||||
Domtar Corp. | 12/20/2024 | 1.000 | % | 0.769 | % | 150,000 | Quarterly | 1,623 | 1,544 | 79 | ||||||||||||||||||||
DR Horton, Inc. | 12/20/2024 | 1.000 | % | 0.425 | % | 11,000,000 | Quarterly | 300,159 | 274,212 | 25,947 | ||||||||||||||||||||
DXC Technology Co. | 12/20/2024 | 5.000 | % | 1.277 | % | 150,000 | Quarterly | 25,576 | 24,981 | 595 | ||||||||||||||||||||
Eastman Chemical Co. | 12/20/2024 | 1.000 | % | 0.582 | % | 5,600,000 | Quarterly | 110,240 | 114,708 | (4,468 | ) | |||||||||||||||||||
Electricite de France S.A. | 12/20/2024 | 1.000 | % | 0.487 | % | EUR | 200,000 | Quarterly | 5,719 | 5,216 | 503 | |||||||||||||||||||
Electrolux AB | 12/20/2024 | 1.000 | % | 0.193 | % | 100,000 | Quarterly | 4,561 | 4,511 | 50 | ||||||||||||||||||||
Enbridge, Inc. | 12/20/2024 | 1.000 | % | 0.537 | % | $ | 11,100,000 | Quarterly | 242,625 | 133,849 | 108,776 | |||||||||||||||||||
Encana Corp. | 12/20/2024 | 1.000 | % | 1.246 | % | 100,000 | Quarterly | (1,126 | ) | (3,246 | ) | 2,120 | ||||||||||||||||||
The accompanying notes are an integral part of these financial statements.
| 80 | Litman Gregory Funds Trust | |||||
Table of Contents
Litman Gregory Masters Alternative Strategies Fund
SCHEDULE OF SWAPS at December 31, 2019 (Continued)
| CENTRALLY CLEARED CREDIT DEFAULT SWAP CONTRACTS (1)(2)(3) (CONTINUED) | ||||||||||||||||||||||||||||||
| Description | Maturity Date | Fixed Deal (Pay) Rate | Implied Credit Spread at December 31, 2019 | Notional Amount(4) | Periodic Payment Frequency | Fair Value | Upfront Premiums Paid / (Received) | Unrealized Appreciation / (Depreciation) | ||||||||||||||||||||||
Sell Protection (Continued) |
| |||||||||||||||||||||||||||||
Enel SpA | 12/20/2024 | 1.000 | % | 0.584 | % | EUR | 10,100,000 | Quarterly | $ | 233,399 | $ | 231,710 | $ | 1,689 | ||||||||||||||||
Expedia Group, Inc. | 12/20/2024 | 1.000 | % | 0.688 | % | $ | 4,350,000 | Quarterly | 63,601 | 63,800 | (199 | ) | ||||||||||||||||||
Experian Finance Plc | 12/20/2024 | 1.000 | % | 0.331 | % | EUR | 8,100,000 | Quarterly | 304,315 | 319,927 | (15,612 | ) | ||||||||||||||||||
FirstEnergy Corp. | 12/20/2024 | 1.000 | % | 0.320 | % | $ | 10,800,000 | Quarterly | 349,734 | 331,370 | 18,364 | |||||||||||||||||||
Ford Motor Co. | 12/20/2024 | 5.000 | % | 1.472 | % | 9,800,000 | Quarterly | 1,570,916 | 1,456,540 | 114,376 | ||||||||||||||||||||
Fortum Oyj | 12/20/2024 | 1.000 | % | 0.493 | % | EUR | 4,300,000 | Quarterly | 121,683 | 112,388 | 9,295 | |||||||||||||||||||
Freeport-McMoRan, Inc. | 12/20/2024 | 1.000 | % | 1.125 | % | $ | 14,000,000 | Quarterly | (80,194 | ) | (378,208 | ) | 298,014 | |||||||||||||||||
General Electric Co. | 12/20/2024 | 1.000 | % | 0.856 | % | 11,300,000 | Quarterly | 75,965 | (147,417 | ) | 223,382 | |||||||||||||||||||
General Motors Co. | 12/20/2024 | 5.000 | % | 1.005 | % | 9,450,000 | Quarterly | 1,748,224 | 1,756,597 | (8,373 | ) | |||||||||||||||||||
Glencore Finance Europe Ltd. | 12/20/2024 | 5.000 | % | 1.263 | % | EUR | 200,000 | Quarterly | 40,372 | 38,213 | 2,159 | |||||||||||||||||||
Goodyear Tire & Rubber Co. (The) | 12/20/2024 | 5.000 | % | 1.502 | % | $ | 2,150,000 | Quarterly | 341,245 | 279,628 | 61,617 | |||||||||||||||||||
Halliburton Co. | 12/20/2024 | 1.000 | % | 0.608 | % | 1,600,000 | Quarterly | 29,520 | 25,253 | 4,267 | ||||||||||||||||||||
HeidelbergCement AG | 12/20/2024 | 5.000 | % | 0.694 | % | EUR | 2,200,000 | Quarterly | 523,989 | 514,032 | 9,957 | |||||||||||||||||||
Hess Corp. | 12/20/2024 | 1.000 | % | 0.698 | % | $ | 11,400,000 | Quarterly | 161,709 | (172,221 | ) | 333,930 | ||||||||||||||||||
International Lease Finance Corp. | 12/20/2024 | 5.000 | % | 0.488 | % | 9,100,000 | Quarterly | 1,941,523 | 1,936,243 | 5,280 | ||||||||||||||||||||
International Paper Co. | 12/20/2024 | 1.000 | % | 0.389 | % | 3,100,000 | Quarterly | 90,019 | 89,466 | 553 | ||||||||||||||||||||
Intesa Sanpaolo SpA | 12/20/2024 | 1.000 | % | 0.850 | % | EUR | 10,000,000 | Quarterly | 82,304 | 53,083 | 29,221 | |||||||||||||||||||
ITV Plc | 12/20/2024 | 5.000 | % | 0.913 | % | 8,650,000 | Quarterly | 1,937,838 | 1,773,467 | 164,371 | ||||||||||||||||||||
KB Home | 12/20/2024 | 5.000 | % | 1.097 | % | $ | 9,600,000 | Quarterly | 1,728,479 | 1,705,331 | 23,148 | |||||||||||||||||||
Kinder Morgan, Inc. | 12/20/2024 | 1.000 | % | 0.587 | % | 11,100,000 | Quarterly | 215,888 | 166,001 | 49,887 | ||||||||||||||||||||
Kohl’s Corp. | 12/20/2024 | 1.000 | % | 1.164 | % | 2,200,000 | Quarterly | (16,518 | ) | (34,245 | ) | 17,727 | ||||||||||||||||||
Koninklijke KPN N.V. | 12/20/2024 | 1.000 | % | 0.647 | % | EUR | 10,150,000 | Quarterly | 198,525 | 17,532 | 180,993 | |||||||||||||||||||
The accompanying notes are an integral part of these financial statements.
| Schedule of Investments | 81 | |||||
Table of Contents
Litman Gregory Masters Alternative Strategies Fund
SCHEDULE OF SWAPS at December 31, 2019 (Continued)
| CENTRALLY CLEARED CREDIT DEFAULT SWAP CONTRACTS (1)(2)(3) (CONTINUED) | ||||||||||||||||||||||||||||||
| Description | Maturity Date | Fixed Deal (Pay) Rate | Implied Credit Spread at December 31, 2019 | Notional Amount(4) | Periodic Payment Frequency | Fair Value | Upfront Premiums Paid / (Received) | Unrealized Appreciation / (Depreciation) | ||||||||||||||||||||||
Sell Protection (Continued) |
| |||||||||||||||||||||||||||||
Kraft Heinz Foods Co. | 12/20/2024 | 1.000 | % | 0.841 | % | $ | 5,900,000 | Quarterly | $ | 43,900 | $ | 39,731 | $ | 4,169 | ||||||||||||||||
L Brands, Inc. | 12/20/2024 | 1.000 | % | 2.994 | % | 150,000 | Quarterly | (12,776 | ) | (12,975 | ) | 199 | ||||||||||||||||||
LafargeHolcim Ltd. | 12/20/2024 | 1.000 | % | 0.629 | % | EUR | 10,050,000 | Quarterly | 206,594 | 195,752 | 10,842 | |||||||||||||||||||
Lennar Corp. | 12/20/2024 | 5.000 | % | 0.758 | % | $ | 9,300,000 | Quarterly | 1,845,323 | 1,907,856 | (62,533 | ) | ||||||||||||||||||
Macy’s Retail Holdings, Inc. | 12/20/2024 | 1.000 | % | 1.669 | % | 350,000 | Quarterly | (10,539 | ) | (14,767 | ) | 4,228 | ||||||||||||||||||
Marks & Spencer Plc | 12/20/2024 | 1.000 | % | 1.682 | % | EUR | 5,000,000 | Quarterly | (181,161 | ) | (173,037 | ) | (8,124 | ) | ||||||||||||||||
Marriott International, Inc. | 12/20/2024 | 1.000 | % | 0.349 | % | $ | 450,000 | Quarterly | 13,936 | 13,824 | 112 | |||||||||||||||||||
MBIA, Inc. | 12/20/2024 | 5.000 | % | 1.318 | % | 9,700,000 | Quarterly | 1,632,506 | 1,541,344 | 91,162 | ||||||||||||||||||||
MDC Holdings, Inc. | 12/20/2024 | 1.000 | % | 0.705 | % | 11,150,000 | Quarterly | 154,226 | 97,875 | 56,351 | ||||||||||||||||||||
Mediobanca Banca di Credito Finanziario SpA | 12/20/2024 | 1.000 | % | 0.783 | % | EUR | 10,200,000 | Quarterly | 122,157 | (9,589 | ) | 131,746 | ||||||||||||||||||
Meritor, Inc. | 12/20/2024 | 5.000 | % | 1.025 | % | $ | 5,150,000 | Quarterly | 947,051 | 884,039 | 63,012 | |||||||||||||||||||
MetLife, Inc. | 12/20/2024 | 1.000 | % | 0.491 | % | 11,250,000 | Quarterly | 271,011 | 174,059 | 96,952 | ||||||||||||||||||||
METRO AG | 12/20/2024 | 1.000 | % | 1.529 | % | EUR | 150,000 | Quarterly | (4,244 | ) | (4,161 | ) | (83 | ) | ||||||||||||||||
Mondelez International, Inc. | 12/20/2024 | 1.000 | % | 0.364 | % | $ | 10,900,000 | Quarterly | 329,723 | 369,368 | (39,645 | ) | ||||||||||||||||||
Motorola Solutions, Inc. | 12/20/2024 | 1.000 | % | 0.552 | % | 11,050,000 | Quarterly | 233,354 | 217,904 | 15,450 | ||||||||||||||||||||
Nabors Industries, Inc. | 12/20/2024 | 1.000 | % | 5.503 | % | 1,250,000 | Quarterly | (218,177 | ) | (206,250 | ) | (11,927 | ) | |||||||||||||||||
National Grid Plc | 12/20/2024 | 1.000 | % | 0.408 | % | EUR | 9,900,000 | Quarterly | 328,172 | 257,856 | 70,316 | |||||||||||||||||||
Navient Corp. | 12/20/2024 | 5.000 | % | 1.981 | % | $ | 5,100,000 | Quarterly | 685,390 | 596,812 | 88,578 | |||||||||||||||||||
Newell Brands, Inc. | 12/20/2024 | 1.000 | % | 1.005 | % | 11,250,000 | Quarterly | (2,535 | ) | (82,102 | ) | 79,567 | ||||||||||||||||||
Next Group Plc | 12/20/2024 | 1.000 | % | 0.756 | % | EUR | 10,350,000 | Quarterly | 139,489 | (67,301 | ) | 206,790 | ||||||||||||||||||
Nordstrom, Inc. | 12/20/2024 | 1.000 | % | 1.111 | % | $ | 4,600,000 | Quarterly | (23,351 | ) | (227,947 | ) | 204,596 | |||||||||||||||||
Olin Corp. | 12/20/2024 | 1.000 | % | 1.173 | % | 350,000 | Quarterly | (2,779 | ) | (2,505 | ) | (274 | ) | |||||||||||||||||
The accompanying notes are an integral part of these financial statements.
| 82 | Litman Gregory Funds Trust | |||||
Table of Contents
Litman Gregory Masters Alternative Strategies Fund
SCHEDULE OF SWAPS at December 31, 2019 (Continued)
| CENTRALLY CLEARED CREDIT DEFAULT SWAP CONTRACTS (1)(2)(3) (CONTINUED) | ||||||||||||||||||||||||||||||
| Description | Maturity Date | Fixed Deal (Pay) Rate | Implied Credit Spread at December 31, 2019 | Notional Amount(4) | Periodic Payment Frequency | Fair Value | Upfront Premiums Paid / (Received) | Unrealized Appreciation / (Depreciation) | ||||||||||||||||||||||
Sell Protection (Continued) |
| |||||||||||||||||||||||||||||
Peugeot S.A. | 12/20/2024 | 5.000 | % | 0.807 | % | EUR | 8,400,000 | Quarterly | $ | 1,938,713 | $ | 1,892,581 | $ | 46,132 | ||||||||||||||||
PostNL N.V. | 12/20/2024 | 1.000 | % | 0.605 | % | 250,000 | Quarterly | 5,474 | 5,065 | 409 | ||||||||||||||||||||
Publicis Groupe S.A. | 12/20/2024 | 1.000 | % | 0.677 | % | 150,000 | Quarterly | 2,679 | 2,362 | 317 | ||||||||||||||||||||
PulteGroup, Inc. | 12/20/2024 | 5.000 | % | 0.647 | % | $ | 9,350,000 | Quarterly | 1,911,988 | 1,861,705 | 50,283 | |||||||||||||||||||
Radian Group, Inc. | 12/20/2024 | 5.000 | % | 0.605 | % | 9,400,000 | Quarterly | 1,944,173 | 1,729,115 | 215,058 | ||||||||||||||||||||
Rexel S.A. | 12/20/2024 | 5.000 | % | 0.864 | % | EUR | 4,200,000 | Quarterly | 954,107 | 927,923 | 26,184 | |||||||||||||||||||
Royal Caribbean Cruises Ltd. | 12/20/2024 | 5.000 | % | 0.523 | % | $ | 550,000 | Quarterly | 116,270 | 114,917 | 1,353 | |||||||||||||||||||
Sempra Energy | 12/20/2024 | 1.000 | % | 0.353 | % | 2,200,000 | Quarterly | 67,723 | 68,548 | (825 | ) | |||||||||||||||||||
Sherwin-Williams Co. (The) | 12/20/2024 | 1.000 | % | 0.509 | % | 11,150,000 | Quarterly | 258,616 | 162,039 | 96,577 | ||||||||||||||||||||
Springleaf Finance Corp. | 12/20/2024 | 5.000 | % | 1.164 | % | 9,650,000 | Quarterly | 1,702,661 | 1,559,020 | 143,641 | ||||||||||||||||||||
SSE Plc | 12/20/2024 | 1.000 | % | 0.494 | % | EUR | 10,100,000 | Quarterly | 284,997 | 185,188 | 99,809 | |||||||||||||||||||
Stora Enso Oyj | 12/20/2024 | 5.000 | % | 0.539 | % | 2,100,000 | Quarterly | 521,581 | 511,655 | 9,926 | ||||||||||||||||||||
Sudzucker International Finance B.V. | 12/20/2024 | 1.000 | % | 0.733 | % | 4,300,000 | Quarterly | 63,487 | 15,071 | 48,416 | ||||||||||||||||||||
Teck Resources Ltd. | 12/20/2024 | 5.000 | % | 1.080 | % | $ | 50,000 | Quarterly | 9,048 | 8,859 | 189 | |||||||||||||||||||
Telecom Italia SpA | 12/20/2024 | 1.000 | % | 1.281 | % | EUR | 10,550,000 | Quarterly | (160,110 | ) | (466,332 | ) | 306,222 | |||||||||||||||||
Telefonica Emisiones S.A. | 12/20/2024 | 1.000 | % | 0.570 | % | 10,100,000 | Quarterly | 241,206 | 135,069 | 106,137 | ||||||||||||||||||||
Tesco Plc | 12/20/2024 | 1.000 | % | 0.818 | % | 10,250,000 | Quarterly | 102,810 | (77,619 | ) | 180,429 | |||||||||||||||||||
Toll Brothers Finance Corp. | 12/20/2024 | 1.000 | % | 0.786 | % | $ | 11,100,000 | Quarterly | 110,943 | 82,520 | 28,423 | |||||||||||||||||||
Transocean, Inc. | 12/20/2024 | 1.000 | % | 6.167 | % | 1,450,000 | Quarterly | (283,175 | ) | (344,375 | ) | 61,200 | ||||||||||||||||||
Valeo S.A. | 12/20/2024 | 1.000 | % | 0.818 | % | EUR | 18,250,000 | Quarterly | 182,923 | (23,655 | ) | 206,578 | ||||||||||||||||||
Valero Energy Corp. | 12/20/2024 | 1.000 | % | 0.457 | % | $ | 21,950,000 | Quarterly | 564,501 | 408,549 | 155,952 | |||||||||||||||||||
The accompanying notes are an integral part of these financial statements.
| Schedule of Investments | 83 | |||||
Table of Contents
Litman Gregory Masters Alternative Strategies Fund
SCHEDULE OF SWAPS at December 31, 2019 (Continued)
| CENTRALLY CLEARED CREDIT DEFAULT SWAP CONTRACTS (1)(2)(3) (CONTINUED) | ||||||||||||||||||||||||||||||
| Description | Maturity Date | Fixed Deal (Pay) Rate | Implied Credit Spread at December 31, 2019 | Notional Amount(4) | Periodic Payment Frequency | Fair Value | Upfront Premiums Paid / (Received) | Unrealized Appreciation / (Depreciation) | ||||||||||||||||||||||
Sell Protection (Continued) |
| |||||||||||||||||||||||||||||
Verizon Communications, Inc. | 12/20/2024 | 1.000 | % | 0.386 | % | $ | 11,050,000 | Quarterly | $ | 322,124 | $ | 265,595 | $ | 56,529 | ||||||||||||||||
Vivendi S.A. | 12/20/2024 | 1.000 | % | 0.381 | % | EUR | 2,200,000 | Quarterly | 76,299 | 75,065 | 1,234 | |||||||||||||||||||
Vodafone Group Plc | 12/20/2024 | 1.000 | % | 0.554 | % | 10,000,000 | Quarterly | 247,811 | 214,728 | 33,083 | ||||||||||||||||||||
Volkswagen International Finance N.V. | 12/20/2024 | 1.000 | % | 0.742 | % | 10,650,000 | Quarterly | 151,450 | 84,677 | 66,773 | ||||||||||||||||||||
Wendel S.A. | 12/20/2024 | 5.000 | % | 0.548 | % | 8,150,000 | Quarterly | 2,019,137 | 2,010,600 | 8,537 | ||||||||||||||||||||
Whirlpool Corp. | 12/20/2024 | 1.000 | % | 0.682 | % | $ | 11,250,000 | Quarterly | 167,914 | 8,340 | 159,574 | |||||||||||||||||||
WPP Finance S.A. | 12/20/2024 | 1.000 | % | 0.592 | % | EUR | 2,200,000 | Quarterly | 49,805 | 50,031 | (226 | ) | ||||||||||||||||||
|
|
|
|
|
| |||||||||||||||||||||||||
Total Sell Protection |
| $ | 48,100,175 | $ | 40,792,492 | $ | 7,307,683 | |||||||||||||||||||||||
|
|
|
|
|
| |||||||||||||||||||||||||
Total | $ | 2,327,385 | $ | 7,503,032 | $ | (5,175,647 | ) | |||||||||||||||||||||||
|
|
|
|
|
| |||||||||||||||||||||||||
| (1) | For centrally cleared swaps, when a credit event occurs as defined under the terms of the swap contract, the Fund as a seller of credit protection will either (i) pay a net amount equal to the par value of the defaulted reference entity and deliver the reference entity or (ii) pay a net amount equal to the par value of the defaulted reference entity less its recovery value. |
| (2) | For centrally cleared swaps, implied credit spread, represented in absolute terms, utilized in determining the fair value of the credit default swap contracts as of period will serve as an indicator of the payment/ performance risk and represent the likelihood of risk of default for the credit derivative. The implied credit spread of a referenced entity reflects the cost of buying/ selling protection and may include upfront payments required to be made to enter into the contract. Generally, wider credit spreads represent a perceived deterioration of the referenced entity’s credit soundness and a greater likelihood or risk of default or other credit event occurring as defined under the terms of the swap contract. |
| (3) | For centrally cleared swaps, the notional amount represents the maximum potential the Fund may receive as a buyer of credit protection if a credit event occurs, as defined under the terms of the swap contract, for each security included in the CDX North America High Yield Index Series 33, and CDX North America Investment Grade Index Series 33. |
| (4) | Notional amounts are denominated in foreign currency where indicated. |
The accompanying notes are an integral part of these financial statements.
| 84 | Litman Gregory Funds Trust | |||||
Table of Contents
Litman Gregory Masters Alternative Strategies Fund
SCHEDULE OF SWAPS at December 31, 2019 (Continued)
| OVER THE COUNTER CREDIT DEFAULT SWAP CONTRACTS | ||||||||||||||||||||||||||||||||
| Description | Maturity Date | Counterparty | Fixed Deal (Pay) Rate | Implied Credit Spread at December 31, 2019 | Notional Amount(1) | Periodic Payment Frequency | Fair Value | Upfront Premiums Paid / (Received) | Unrealized Appreciation / (Depreciation) | |||||||||||||||||||||||
Buy Protection |
| |||||||||||||||||||||||||||||||
Whiting Petroleum Corp. | 12/20/2024 | JPMorgan Chase Bank N.A. | (5.000 | %) | 12.421 | % | $ | (4,300,000) | Quarterly | $ | 963,120 | $ | 787,125 | $ | 175,995 | |||||||||||||||||
Enel SpA | 12/20/2023 | Morgan Stanley & Co. | (1.000 | %) | 0.434 | % | EUR | (1,660,000) | Quarterly | (42,276 | ) | 11,425 | (53,701 | ) | ||||||||||||||||||
|
| |||||||||||||||||||||||||||||||
Total Buy Protection |
| $ | 920,844 | $ | 798,550 | $ | 122,294 | |||||||||||||||||||||||||
|
| |||||||||||||||||||||||||||||||
Sell Protection |
| |||||||||||||||||||||||||||||||
ADLER Real Estate AG 1.500%, 12/06/2021 | 12/20/2024 | JPMorgan Chase Bank N.A. | 5.000 | % | 1.245 | % | EUR | 4,300,000 | Quarterly | $ | 872,934 | $ | 802,092 | $ | 70,842 | |||||||||||||||||
Altice Finco S.A. | 12/20/2024 | JPMorgan Chase Bank N.A. | 5.000 | % | 2.489 | % | 9,100,000 | Quarterly | 1,173,987 | 889,240 | 284,747 | |||||||||||||||||||||
EDP Finance B.V. | 12/20/2024 | JPMorgan Chase Bank N.A. | 1.000 | % | 0.599 | % | 9,900,000 | Quarterly | 220,178 | 200,185 | 19,993 | |||||||||||||||||||||
Hapag-Lloyd AG | 12/20/2024 | JPMorgan Chase Bank N.A. | 5.000 | % | 2.108 | % | 4,450,000 | Quarterly | 671,443 | 370,129 | 301,314 | |||||||||||||||||||||
Intrum AB | 12/20/2024 | JPMorgan Chase Bank N.A. | 5.000 | % | 2.492 | % | 4,500,000 | Quarterly | 579,624 | 512,356 | 67,268 | |||||||||||||||||||||
Netflix, Inc. | 12/20/2024 | JPMorgan Chase Bank N.A. | 5.000 | % | 1.159 | % | $ | 2,250,000 | Quarterly | 397,605 | 366,857 | 30,748 | ||||||||||||||||||||
Realogy Group LLC/RealogyCo-Issuer Corp. | 12/20/2024 | JPMorgan Chase Bank N.A. | 5.000 | % | 5.337 | % | 4,250,000 | Quarterly | (55,595 | ) | (20,445 | ) | (35,150 | ) | ||||||||||||||||||
|
| |||||||||||||||||||||||||||||||
Total Sell Protection |
| $ | 3,860,176 | $ | 3,120,414 | $ | 739,762 | |||||||||||||||||||||||||
|
| |||||||||||||||||||||||||||||||
Total | $ | 4,781,020 | $ | 3,918,964 | $ | 862,056 | ||||||||||||||||||||||||||
|
| |||||||||||||||||||||||||||||||
| (1) | Notional amounts are denominated in foreign currency where indicated. |
The accompanying notes are an integral part of these financial statements.
| Schedule of Investments | 85 | |||||
Table of Contents
Litman Gregory Masters Alternative Strategies Fund
SCHEDULE OF SWAPS at December 31, 2019 (Continued)
OVER THE COUNTER TOTAL RETURN SWAP CONTRACTS
| Referenced Obligation | Maturity Date | Counterparty | Fund Pays/ Receives Floating Rate | Floating Rate Index and Spread | Notional Amount(1) | Periodic Payment Frequency | Fair Value | Upfront Premiums Paid/ (Received) | Unrealized Appreciation/ (Depreciation) | |||||||||||||||||||||
iBoxx USD Liquid High Yield Index USD | 3/20/2020 | JPMorgan Chase Bank N.A. | Receives | 3 Month USD LIBOR + 0.000% | $ | 40,000,000 | Quarterly | $ | (20,145 | ) | $ | 1 | $ | (20,146 | ) | |||||||||||||||
iBoxx USD Liquid High Yield Index USD | 3/20/2020 | JPMorgan Chase Bank N.A. | Receives | 3 Month USD LIBOR + 0.000% | 100,000,000 | Quarterly | (962,325 | ) | — | (962,325 | ) | |||||||||||||||||||
Abbvie, Inc. USD | 8/31/2020 | Morgan Stanley & Co. | Receives | 1 Month USD LIBOR - 0.400% | 8,474,606 | Monthly | — | — | — | |||||||||||||||||||||
Cobham Plc GBP | 10/30/2020 | Morgan Stanley & Co. | Pays | 1 Month GBP LIBOR + 0.900% | | GBP (3,068,629) | | Monthly | — | — | — | |||||||||||||||||||
|
| |||||||||||||||||||||||||||||
Total | $ | (982,470 | ) | $ | 1 | $ | (982,471 | ) | ||||||||||||||||||||||
|
| |||||||||||||||||||||||||||||
| (1) | Notional amounts are denominated in foreign currency where indicated. |
| SCHEDULE OF WRITTEN OPTIONS at December 31, 2019 | ||||||||||||||||||||||||||||||
| Description | Counterparty | Exercise Price | Expiration Date | Number of Contracts | Notional Amount | Market Value | Premiums Received | Unrealized Appreciation/ (Depreciation) | ||||||||||||||||||||||
COMMON STOCKS |
| |||||||||||||||||||||||||||||
Call |
| |||||||||||||||||||||||||||||
Abbvie, Inc. | Morgan Stanley & Co. | $ | 92.50 | 2/21/2020 | (2 | ) | $ | (17,708 | ) | $ | (242 | ) | $ | (361 | ) | $ | 119 | |||||||||||||
Amerisourcebergen Corp. | Morgan Stanley & Co. | 87.50 | 2/21/2020 | (2 | ) | (17,004 | ) | (450 | ) | (560 | ) | 110 | ||||||||||||||||||
Applied Materials, Inc. | Morgan Stanley & Co. | 62.50 | 2/21/2020 | (6 | ) | (36,624 | ) | (1,266 | ) | (1,420 | ) | 154 | ||||||||||||||||||
AT&T, Inc. | Morgan Stanley & Co. | 40.00 | 2/21/2020 | (13 | ) | (50,804 | ) | (767 | ) | (841 | ) | 74 | ||||||||||||||||||
Automatic Data Processing, Inc. | Morgan Stanley & Co. | 175.00 | 2/21/2020 | (2 | ) | (34,100 | ) | (560 | ) | (669 | ) | 109 | ||||||||||||||||||
Best Buy Co., Inc. | Morgan Stanley & Co. | 92.50 | 2/21/2020 | (4 | ) | (35,120 | ) | (636 | ) | (695 | ) | 59 | ||||||||||||||||||
Bristol-myers Squibb Co. | Morgan Stanley & Co. | 65.00 | 2/21/2020 | (5 | ) | (32,095 | ) | (830 | ) | (724 | ) | (106 | ) | |||||||||||||||||
Caterpillar, Inc. | Morgan Stanley & Co. | 150.00 | 2/21/2020 | (2 | ) | (29,536 | ) | (830 | ) | (885 | ) | 55 | ||||||||||||||||||
CF Industries Holdings, Inc. | Morgan Stanley & Co. | 50.00 | 2/21/2020 | (4 | ) | (19,096 | ) | (420 | ) | (515 | ) | 95 | ||||||||||||||||||
Citigroup, Inc. | Morgan Stanley & Co. | 80.00 | 2/21/2020 | (4 | ) | (31,956 | ) | (952 | ) | (763 | ) | (189 | ) | |||||||||||||||||
Comcast Corp. | Morgan Stanley & Co. | 45.00 | 2/21/2020 | (4 | ) | (17,988 | ) | (536 | ) | (391 | ) | (145 | ) | |||||||||||||||||
Delta Air Lines, Inc. | Morgan Stanley & Co. | 62.50 | 2/21/2020 | (1 | ) | (5,848 | ) | (61 | ) | (101 | ) | 40 | ||||||||||||||||||
Exelon Corp. | Morgan Stanley & Co. | 46.00 | 2/21/2020 | (4 | ) | (18,236 | ) | (324 | ) | (307 | ) | (17 | ) | |||||||||||||||||
Gilead Sciences, Inc. | Morgan Stanley & Co. | 70.00 | 2/21/2020 | (7 | ) | (45,486 | ) | (700 | ) | (1,111 | ) | 411 | ||||||||||||||||||
Hewlett Packard Enterprise Co. | Morgan Stanley & Co. | 17.00 | 2/21/2020 | (10 | ) | (15,860 | ) | (260 | ) | (277 | ) | 17 | ||||||||||||||||||
HP, Inc. | Morgan Stanley & Co. | 21.00 | 2/21/2020 | (17 | ) | (34,935 | ) | (867 | ) | (948 | ) | 81 | ||||||||||||||||||
Humana, Inc. | Morgan Stanley & Co. | 375.00 | 2/21/2020 | (1 | ) | (36,652 | ) | (1,125 | ) | (1,321 | ) | 196 | ||||||||||||||||||
Intel Corp. | Morgan Stanley & Co. | 60.00 | 2/21/2020 | (6 | ) | (35,910 | ) | (1,278 | ) | (1,216 | ) | (62 | ) | |||||||||||||||||
Johnson & Johnson | Morgan Stanley & Co. | 150.00 | 2/21/2020 | (2 | ) | (29,174 | ) | (378 | ) | (391 | ) | 13 | ||||||||||||||||||
Leidos Holdings, Inc. | Morgan Stanley & Co. | 100.00 | 2/21/2020 | (5 | ) | (48,945 | ) | (1,360 | ) | (1,295 | ) | (65 | ) | |||||||||||||||||
Merck & Co., Inc. | Morgan Stanley & Co. | 92.50 | 2/21/2020 | (2 | ) | (18,190 | ) | (320 | ) | (421 | ) | 101 | ||||||||||||||||||
Metlife, Inc. | Morgan Stanley & Co. | 52.50 | 2/21/2020 | (7 | ) | (35,679 | ) | (483 | ) | (523 | ) | 40 | ||||||||||||||||||
Microsoft Corp. | Morgan Stanley & Co. | 160.00 | 2/21/2020 | (1 | ) | (15,770 | ) | (370 | ) | (370 | ) | — | ||||||||||||||||||
Phillips 66 | Morgan Stanley & Co. | 115.00 | 2/21/2020 | (3 | ) | (33,423 | ) | (450 | ) | (722 | ) | 272 | ||||||||||||||||||
The accompanying notes are an integral part of these financial statements.
| 86 | Litman Gregory Funds Trust | |||||
Table of Contents
Litman Gregory Masters Alternative Strategies Fund
SCHEDULE OF WRITTEN OPTIONS at December 31, 2019 (Continued)
| Description | Counterparty | Exercise Price | Expiration Date | Number of Contracts | Notional Amount | Market Value | Premiums Received | Unrealized Appreciation/ (Depreciation) | ||||||||||||||||||||||
Plains GP Holdings L.P. | Morgan Stanley & Co. | $ | 20.00 | 2/21/2020 | (18 | ) | $ | (34,110 | ) | $ | (540 | ) | $ | (643 | ) | $ | 103 | |||||||||||||
Procter & Gamble Co. (The) | Morgan Stanley & Co. | 130.00 | 2/21/2020 | (3 | ) | (37,470 | ) | (345 | ) | (428 | ) | 83 | ||||||||||||||||||
Qualcomm, Inc. | Morgan Stanley & Co. | 95.00 | 2/21/2020 | (4 | ) | (35,292 | ) | (536 | ) | (687 | ) | 151 | ||||||||||||||||||
Starbucks Corp. | Morgan Stanley & Co. | 90.00 | 2/21/2020 | (2 | ) | (17,584 | ) | (346 | ) | (429 | ) | 83 | ||||||||||||||||||
Target Corp. | Morgan Stanley & Co. | 130.00 | 2/21/2020 | (2 | ) | (25,642 | ) | (700 | ) | (757 | ) | 57 | ||||||||||||||||||
Tyson Foods, Inc. | Morgan Stanley & Co. | 92.50 | 2/21/2020 | (4 | ) | (36,416 | ) | (1,120 | ) | (1,115 | ) | (5 | ) | |||||||||||||||||
Verizon Communications, Inc. | Morgan Stanley & Co. | 62.50 | 2/21/2020 | (6 | ) | (36,840 | ) | (378 | ) | (554 | ) | 176 | ||||||||||||||||||
|
| |||||||||||||||||||||||||||||
Total Written Options | $ | (19,430 | ) | $ | (21,440 | ) | $ | 2,010 | ||||||||||||||||||||||
|
| |||||||||||||||||||||||||||||
The accompanying notes are an integral part of these financial statements.
| Schedule of Investments | 87 | |||||
Table of Contents
Litman Gregory Masters High Income Alternatives Fund Review
The Litman Gregory Masters High Income Alternatives Fund (Institutional Share Class) gained 8.37%. During the same12-month period, the Bloomberg Barclays U.S. Aggregate Bond Index rose 8.72%, high-yield bonds (BofA Merrill Lynch US High-Yield Cash Pay Index) gained 14.41%, and the HFRX Fixed Income Credit Index rose 6.20%. Since the fund’s inception (9/28/18), its annualized return is 3.99% compared to 8.27%, 7.18%, and 2.36% for the Aggregate Bond, high-yield and HFRX Fixed Income benchmarks, respectively.
QUARTER END PERFORMANCE – 12/31/2019 |
| |||||||||||||||||||
| One- Month | Three- Month | Year-to- Date | One- Year | Since Inception | ||||||||||||||||
Litman Gregory Masters High Income Alternatives Fund INSTITUTIONAL | 0.84% | 1.44% | 8.37% | 8.37% | 3.99% | |||||||||||||||
Litman Gregory Masters High Income Alternatives Fund INVESTOR | 0.82% | 1.45% | 8.18% | 8.18% | 3.83% | |||||||||||||||
Barclays Aggregate Bond Index | -0.07% | 0.18% | 8.72% | 8.72% | 8.27% | |||||||||||||||
ICE BofAML U.S. High Yield TR USD Index | 2.09% | 2.61% | 14.41% | 14.41% | 7.18% | |||||||||||||||
HFRX Fixed Income – Credit Index | 1.39% | 2.54% | 6.22% | 6.22% | 2.37% | |||||||||||||||
| SEC30-Day Yield1 as of 12/31/2019 Institutional: 3.00% Investor: 2.75% |
| |||||||||||||||||||
| Unsubsidized SEC30-Day Yield2 as of 12/31/2019 Institutional: 2.39% Investor: 2.14% |
| |||||||||||||||||||
1. The30-day SEC Yield is computed under an SEC standardized formula based on net income earned over the past 30 days. It is a “subsidized” yield, which means it includes contractual expense reimbursements, and it would be lower without those reimbursements. |
| |||||||||||||||||||
2. The unsubsidized30-day SEC Yield is computed under an SEC standardized formula based on net income earned over the past 30 days. It excludes contractual expense reimbursements, resulting in a lower yield. |
| |||||||||||||||||||
| Distribution Yield: Trailing12-Month as of 12/31/2019 Institutional: 3.65% Investor: 3.38% |
| |||||||||||||||||||
| The trailing twelve month (TTM) distribution yield is the sum of a fund’s total trailing 12-month interest and dividend payments divided by the last month’s ending share price (NAV) plus any capital gains distributed over the sameperiod. 12-Month Yield gives you a good idea of the yield (interest and dividend payments) the fund is currently paying. |
| |||||||||||||||||||
| EXPENSE RATIOS as of 4/30/19 | MAHIX | MAHNX | ||||||
Gross Expense Ratio | 2.06 | % | 2.34 | % | ||||
Net Expense Ratio | 1.70 | % | 1.96 | % | ||||
| The Net Expense Ratio reflects a contractual fee waiver and/or expense reimbursement, which is in place through 4/30/2021. See the Fund’s prospectus for more information. | ||||||||
Adjusted Expense Ratio | 0.98 | % | 1.24 | % | ||||
| The Adjusted Expense Ratio is the same as the Net Expense Ratio exclusive of certain investment expenses, such as interest expense from borrowings and repurchase agreements, dividend expense from investments on short sales, and acquired fund fees and expenses. | ||||||||
| Performance quoted represents past performance and does not guarantee future results. The investment return and principal value of an investment will fluctuate so that an investor’s shares, when redeemed, may be worth more or less than their original cost. Current performance of the funds may be lower or higher than the performance quoted. To obtain standardized performance of the funds, and performance as of the most recently completed calendar month, please visitwww.mastersfunds.com.Investment performance reflects fee waivers in effect. In the absence of such waivers, total return would be reduced. All performance discussions in this report refer to the performance of the Institutional share class. |
| |||||||
| 88 | Litman Gregory Funds Trust | |||||
Table of Contents
Annual Review
The fund performed well in 2019. Although the fund’s performance lags the two benchmarks over its brief15-month history, we think there’s more to the story than the short-term performance numbers indicate. Last year was atypical in that there was a strong and simultaneous rally spanning “risk off” Treasuries to“risk-on” equities. Specific to the credit markets, it was also atypical in that higher-quality outperformed lower-quality in arisk-on year. We do not expect a repeat of last year’s broad-based rally, nor do we expect similar levels of returns for the benchmarks given today’s low levels of starting yields.
While the macro outlook varies slightly across our managers, one common concern is elevated valuations. Amid tightening corporate credit spreads and rising equity valuations, the fund’s managers took the opportunity to reduce valuation risk and move up in quality as the year progressed. The flexible credit managers (Brown Brothers Harriman and Guggenheim) increasingly emphasized credits with a low likelihood of default and minimal spread volatility under a range of scenarios. Our alternative equity income manager (Ares) took some profits during the year in areas that had appreciated and where the PMs felt there was a less favorable fundamental outlook. As ofyear-end, Ares is positioned relatively conservatively (although given the nature of their strategy, will still likely be the most volatile sleeve of the fund). The Neuberger Bermanout-of-the-moneyput-write option strategy took advantage of high implied volatility early in the year (following 2018’s fourth quartersell-off) and continued to generate attractive risk-adjusted performance over the course of the year even after implied volatility declined.
While the fund continues to have meaningful exposure to risk assets, it also has exposures to liquid, higher-quality, defensive assets and cash to opportunistically take advantage of market volatility and more attractive spreads and valuations. This relatively conservative positioning is consistent with our expectations and the fund’s investment mandate; i.e., the fund’s fully discretionary managers are valuation-sensitive and have the flexibility to increase and decrease risk exposures based on their assessment of the risk/reward.
We should highlight that throughout 2019 (and since inception), the fund’s risk characteristics have been in line with our long-term expectations. We have observed a few brief periods of volatility in the high-yield market and in each case the fund had a smaller drawdown. The fund has had a consistently lower standard deviation relative to the high-yield index (using rolling30-day returns). Interestingly, the fund also had lower volatility than the Aggregate Bond Index for most of 2019, though we suspect that is due to temporarily elevated levels of volatility for core bonds. Over the long term, we believe returns will be comparable to high-yield bonds, but with lower volatility and downside risk because of the diversified sources of return and manager flexibility.
Looking ahead, it’s highly unlikely that last year’s broad-based bond market rally will repeat. At current valuation levels, credit selection will be critical to performance. We believe the managers’ flexibility, broad opportunity sets, and risk-awareness will result in attractive long-term risk-adjusted returns, and that the fund’s diversenon-traditional sources of income are an attractive complement to core fixed-income allocations.
Portfolio Commentary
Performance of Managers
During the calendar-year, both flexible credit managers (Brown Brothers Harriman and Guggenheim) posted gains of 7.59% and 3.35%, respectively. Ares Management’s Alternative Equity Income sleeve gained 22.29%, while Neuberger Berman’s Option Income strategy rose 11.99%. (These returns are net of the management fees that eachsub-advisor charges the fund.)
Manager Commentaries
Ares
Market Overview and Backdrop
While 2019 will be remembered as a strong year for equity markets with the S&P 500 increasing 31.5%, a closer look indicates three distinct performance periods. In the first quarter of 2019, the market rebounded sharply from the dislocation in the fourth quarter of 2018, which brought equities back to September 2018 levels. During the second and third quarters of 2019 the market vacillated as investors were concerned about slower global growth driven by trade tensions between the U.S. and China and continued Brexit uncertainty in the United Kingdom. However, 2019 finished very strong as investors gained confidence as accommodative global central banks and expectations of a positive trade solution pushed equities to new highs. Our portfolio within MAHIX generated a total return of 22.29% compared to the S&P 500 return of 31.49% and the BofAML High Yield Master II Index of 14.40%. We maintain strong conviction in the current portfolio positioning and believe we will generate attractive risk-adjusted returns with our portfolio of equity income stocks with underlying fixed-income characteristics generating returns that are above fixed income products and lower than traditional equities.
| Fund Summary | 89 | |||||
Table of Contents
2019 Portfolio Positioning Recap
Our portfolio began 2019 with an aggressive position built from the discounted values we experienced at the end of 2018. In January, the portfolio was 45% business development companies (BDCs), 28% midstream energy, 12%closed-end funds (CEFs), 12% mortgage real-estate investment trusts (MREITs) and 3% cash. We took advantage of the quick rebound in the market and exited the CEFs at the end of January as the discounted valuations narrowed. As the Federal Reserve (the “Fed”) began to signal that it could begin lowering rates later in the year, we began to purchase agency MREITs which tend to benefit from declining interest rates. In addition, we also began investing in select mortgage preferred securities, which tend to be more defensive while still providing attractive yields.
Throughout April and May, we began to see some of the positive trends in the energy markets being outweighed by more challenging topics around the trade dispute with China and global growth concerns. As a result, we decided to meaningfully reduce our midstream exposure which was reduced to just 10% of the portfolio by the end of May. This underweight positioning led to strong relative outperformance as the energy markets struggled in the second half of 2019 and domestic exploration and production operators began to reduce their drilling expectations. Atmid-year our portfolio was 48% BDCs, 20% MREITs, 10% MREIT preferreds, 10% midstream energy & 12% cash.
The second half of 2019 was marked by profit taking in some of the BDC positions that had reached our price targets. While BDC credit quality remained sound in the underlying BDC portfolios, we started to experience some operational headwinds due to lower LIBOR rates, but this was partially offset by higher leverage utilization across the space. Combined with the fact that the group was trading at a 7% premium to its historical valuations (based onprice-to-book), we selectively reduced some of our morerisk-on positions and shifted to higher quality defensive names. By the end of the third quarter, our portfolio had a higher than normal cash balance of nearly 20% and our asset positioning had a significantly defensive focus.
In the fourth quarter of 2019, the midstream energy market continued to struggle due to oil production concerns and technical pressures aroundyear-end tax loss selling. Following these downward moves, we viewed the valuation declines as oversold and added to our energy positions in December. At year end, our portfolio consisted of approximately 37% BDCs, 21% MREITs, 20% midstream energy, 8% MREIT preferreds, 3% opportunistic investments and 12% cash.
Sector Commentary and Performance Contribution
The BDC industry generated strong returns in 2019 as credit issues remained benign and 9+% cash dividend yields were well covered by operating earnings. Our top performing BDCs included Apollo Investment Corporation (AINV) +57%, FS KKR Corporation (FSK) +32% and Ares Capital Corporation (ARCC) +31%. These investments all had strong returns and were large positions in our portfolio (~5+% each). We had one notable performance disappointment this year as BlackRock Capital Corporation (BKCC) experienced credit issues and was forced to cut its dividend. As a result, the stock meaningfully underperformed with a total return of only 5% during the calendar year.
TheMortgage REIT industry continues to be the most consistent of our target asset classes and has generated attractive returns with less volatility over the past two years. Our top performance contributors included Ellington Financial Inc. (EFC) +29% and New Residential Investment Corp. (NRZ) +29%. We also participated in a Special Purpose Acquisition Company (“SPAC”) that was purchasing a private commercial MREIT. We invested prior to the acquisition and conversion to the public REIT as we believed there was 15% upside to our target price alongside a double-digit dividend yield. We were pleasantly surprised that, following the REIT conversion, Broadmark Realty (BRMK) increased to our target price in one month and we subsequently exited the position. Granite Point (GPMT) and KKR Real Estate (KREF) were our weakest performers up 7% & 5%, respectively, as both companies experienced earnings pressure from lower LIBOR rates due the floating rate nature of their underlying assets.
Midstream Energy was a tale of big winners and big losers. Large diversified players were able to effectively weather the storm in the energy markets as Enterprise Products Partners LP (EPD) and Magellan Midstream Partners (MMP) were up 22% and 18%, respectively. On the other hand, smaller players with concentrations in weaker basins struggled with Enable Midstream Partners (ENBL) and Enlink Midstream (ENLC) down-20% and-18%, respectively, in 2019.
2020 Outlook
We believe the U.S. economy should continue on sound economic footing in 2020 and expect modest earnings growth. However, we do have some concern about broader equity market valuations, and as such, we continue to maintain our defensive positioning. Our current portfolio positioning of 13% cash and 8% in defensive preferred securities should allow us to take advantage of elevated market volatility. Even with the defensive positioning, our portfolio still generated an attractive 8.1% total dividend yield inclusive of the cash position.
| 90 | Litman Gregory Funds Trust | |||||
Table of Contents
Brown Brothers Harriman
2019 Credit Markets Commentary
Credit market returns in 2019 were exceptional by almost any measure. The Federal Reserve lowered rates three times this year to maintain growth amid trade tensions, slowing corporate earnings, slowing business investment, and a contracting manufacturing sector. Credit returns were supported by expansions of central bank balance sheets, flows from foreign investors, and a stable to shrinking supply of credit securities.
Given the prolonged economic expansion over the last decade, and the overextended state of yield and valuations, observers are keeping an eye out for signs of “late cycle” behavior, both in economic fundamentals and asset values.
However, the preponderance of economic data does not suggest a cyclical correction is imminent. Manufacturing is in a sectoral recession, U.S. exports areflat-to-declining, and business investment is still lagging. This is offset by strong data in the larger components of U.S. gross domestic product, as well as steady, if declining, growth in jobs and incomes, a healthy consumer sector, and very low unemployment claims.
Sensing economic weakness, the Fed dropped rates three times in 2019. In the fourth quarter the Fed added $200 billion of liquidity through open market operations to address supply and liquidity in short-term Treasuries. Considering the economy has been growing and unemployment is low, monetary policy is surprisingly accommodative. The European Central Bank also resumed corporate credit purchases in September of 2019.
Alevel-to-shrinking supply of U.S. dollar-denominated credit securities is now also supporting spreads. Corporate net issuance grew rapidly through 2017 but has leveled off since. The supply of high-yield bonds is shrinking, and direct lending is absorbing an increasing share of new deal-related lending. In 2019, “Yankee” issuance (USD issuance bynon-US issuers) fell and “Reverse Yankee” (U.S. issuers issuing in Euros or Yen) rose.
The growing dependence of U.S. bond markets on central bank stimulus and foreign purchases is worrisome. Foreign investment can be fickle, and reverse direction rapidly. Yet foreign investors easily constitute the largest single share of USD credit. The credit pullback in the fourth quarter of 2018 revealed this fragility.
Litman Gregory Commentary
The BBH sleeve of the Fund returned 7.59% for the full year 2019, net of fees. We are pleased to have posted such solid performance results. In the fourth quarter, the trend of generally expensive prices for corporate credit continued as spreads tightened 23 and 44 basis points (bps) acrossBBB-rated andBB-rated credit, respectively. For the full year, the BBH sleeve’s performance was achieved during a strong rally in U.S. Treasury yields, while continuing to carry just two years of duration. From an attribution perspective, our sleeve of the portfolio received contributions from sector, rating, and selection. At the selection level, the top contributors included multiple insurance company credits that caught up to our investment thesis, and credits where fear abated around our healthcare exposures. The bottom contributors were largely affected by lower commodity prices in the energy and power pricing markets.
Investing Activity
At the foundation of this strategy is the flexibility to invest across different segments of dollar-denominated U.S. credit where we find the most attractive valuations. We traded more actively this quarter, finding more bond and loan opportunities in corporate credit at new issuance and in the secondary market.
New Purchases
During the quarter we purchased the secured term loan of Innovacare (MMM Holding) at an attractive coupon of 575bps over3-month LIBOR for an 8.3% yield on this B1/B+ rated credit. The company is the leading healthcare insurance provider in its home market of Puerto Rico. The company has low starting leverage and an experienced management team. The buyout loan is well supported from a stable cash flow perspective as almost all revenues for the company derive from the U.S Federal government. The loan also benefits from a stronger covenant package than is typical for current loans in the market.
We initiated a position in Enable Midstream Partners LP,which is amid-cap master limited partnership owned primarily by two regulated utilities. The revenue base for this business is mainly derived from predictable andfee-based transportation contracts across multiple U.S. geographies. Management has maintained a low leverage profile and strong dividend coverage ratios. As oil and gas price declines impacted energy credits generally during the quarter, we were able to pick up this Baa1/BBB+ rated credit at an attractive spread of 323bps for a 5% yield in the secondary market.
An interesting new position in the Fund is a hybrid subordinated30-year bond issued by Apollo Global Management. This debt issuance was rated BBB+ and is callable in five years with a coupon that will also reset every five years based upon the issue spread over the then5-Year Treasury note. Apollo isA-rated at the senior parent company level and throws off significant cash flow across all its business lines from recurring management fees. We were comfortable with the structure of this transaction and found the spread of 308bps for a 4.9% yield very attractive for a credit of this high quality.
| Fund Summary | 91 | |||||
Table of Contents
ReadyCap Lending is one of the few independently licensed Small Business Administration (“SBA”) lenders. ReadyCap originates and services small business loans guaranteed by the SBA for acquiring real estate and equipment, or for working capital purposes. The company has an established10-year lending track record. In December, the company issued its second securitization consisting of a seasoned pool of loans with strong structural protections. The four-year notes were ratedBBB- and came at an attractive pricing spread of 250bps for a 4.3% yield.
Guggenheim
Recent U.S. economic data demonstrate that the expansion is being helped by lower rates. New homes sales have risen at a double-digit year-over-year pace for four consecutive months since August, spurred by lower mortgage rates but also base effects. Manufacturing production rose in both November and December, corroborating the signal seen in improving manufacturing surveys. Nonfarm payroll gains averaged 184,000 in the fourth quarter, above underlying labor force growth. Income gains and a positive wealth effect are also flowing through into retail sales, where “core” sales recovered in December after three months of declines.
The latest evidence suggests that the Fed’s easing efforts have given the U.S. economy the extra gas it needed to extend the cycle. Furthermore, the new year kicks off with some clarity on U.S.-China trade policy. The eleventh-hour Phase 1 U.S.-China trade agreement may give U.S. companies some comfort that they can expect tariffs on either side to remain where they are for now. This should help support U.S. manufacturing activity, especially if China steps up purchases of U.S. goods as promised.
Over the next several months, we expect the Fed will stay on hold as it watches incoming data to ensure that the current level of fed funds remains appropriate. Monetary policy acts on the economy with a lag, so the effects of the last rate cut in October 2019 might not be apparent untilmid-2020. More economic data improvements may come as low rates flow through to consumers and to the credit markets.
Encouraged by positive data, market participants welcomed the new decade with cautious optimism. Credit spreads are near historical tights, but theCCC-BB spread in high-yield corporates and bank loans remains above their five-year averages.10-year Treasury yields, while off their 2019 lows, have failed several times to rise above 2 percent. This reminds us that while the Fed has successfully pushed off a recession, 2020 arrives with many risks worth watching, including the U.S. presidential election, U.S.-Europe trade negotiations, the potential for a military conflict between the U.S. and Iran, and rising corporate and local government defaults in China.
Much of the global growth in this cycle has been driven by an accumulation of debt, which has a declining marginal return. Without a down cycle to deflate some of the bubble, easy credit availability at this stage keeps the weakest companies on life support as low rates force investors to provide capital to borrowers teetering on the brink of downgrade or default. In this environment, even if theCCC-BB spread compresses back to historical tights, it is not a credit rally we would chase.
Performance Review
The sleeve returned 3.35% for the year ending 12/31/2019. Positive return was largely attributed to the portfolio’s carry with modest spread tightening also contributing to performance. Most asset categories rallied over the year as global central bank easing and a flood of liquidity drove prices higher. At the forefront of policy easing was the Fed’s dovish pivot in late 2018 which prioritized extending the expansion and resulted in three rate cuts in 2019, and the expansion of the balance sheet via Treasury bill purchases and repo operations in the back half of the year.
Portfolio Strategy
The Fed, with its shift in policy, has decreased the odds of a recession near term and has likely extended the expansion. Within the U.S. economy weakness in manufacturing data looks to be bottoming, the consumer is in good shape, and the labor market remains extraordinarily resilient. The recovery in the U.S. is also helping to drive a pickup in global economic activity.
Fed Chair Jerome Powell referred to the first cut as a brief“mid-cycle” rate adjustment, as opposed to the beginning of a lengthy cutting cycle. The Fed’s 1998mid-cycle adjustment resulted in a liquidity driven rally that caused the Nasdaq index to double within a year before the bubble finally burst. It also led to a significant widening of credit spreads well in advance of the economy rolling over.
With that in mind and with corporate credit spreads near cycle tights, we continued to focus on income and capital preservation in a market where the risk/rewardtrade-off looks unattractive in many credit sectors. Low volatility and reducing drawdown risk remained a priority for us. As such the portfolio continued to invest in asset classes that have a low likelihood of default and are expected to exhibit minimal spread volatility with stable returns under a variety of credit and rate environments.
Over the year all sectors contributed positively to total return with no negative performers. Within our credit exposure we continued to favor structured credit over corporate credit given what we view as a compelling spread pickup to similarly rated corporates while providing defensive positioning through shorter spread duration profiles.
Over the longer-term, our relatively defensive credit positioning should help the portfolio to weather arisk-off environment and afford the Fund the opportunity to add below investment grade credit exposure at a more opportune time.
| 92 | Litman Gregory Funds Trust | |||||
Table of Contents
Portfolio Positioning
Asset Backed Securities (ABS), which constituted 21% of the portfolio at year’s end, generated positive total returns as the investor base for structured credit, including aircraft securitization and other commercial ABS, continues to grow. Lease and renewal rates for midlife aircraft (those securitized in aircraft ABS) are expected to be supported by new aircraft supply disruptions and relatively low fuel prices.
Collateralized Loan Obligations (CLOs), which constituted 14% of the portfolio at year’s end, contributed to performance despite minor spread widening over the year. New issue supply and intermittent weakness in the loan market led the sector to underperform other credit sectors. However, spreads remain considerably wider than many other asset categories, particularly those with a similar credit profile or spread duration. We continue to favor senior CLOs with short spread durations, as they offer a compelling spread pickup to similarly rated corporates.
Non-Agency Residential Mortgage-Backed Securities (RMBS), which constituted 21% of the portfolio at year’s end, also contributed positively as lower rates and improving credit fundamentals drove higher prepayments for discounted dollar price holdings. Limited home inventory and improving labor market conditions should support home prices and mortgage credit performance.Pre-crisis RMBS investment has benefited from a supply shortfall caused by ongoing paydowns and a lack of new issuance.
Bank loans, which constituted almost 8% of the portfolio at year’s end, were the highest returning category for the Fund. We incrementally added to its bank loan allocation over the period.
The remainder of the portfolio was invested across other credit sectors including short investment-grade corporates, high-yield, commercial mortgage-backed securities (CMBS) and short-term investments. All categories exhibited positive total return for the year.
Neuberger Berman
Historically speaking, 2019 was not a particularly exceptional year in volatility terms even though only three years in the past 30 have seen higher S&P 500 Index (S&P 500) calendar year returns while implied volatility levels and implied volatility premiums were around median levels. In our opinion, what made it seem so exceptional was how few investors anticipated the spectacular returns. Given the persistent outflows from equity mutual funds and exchange traded funds in 2019, estimated by Goldman Sachs to be over $100 billion in the first 10 months of the year, participation in S&P 500 gains in 2019 may not have been as widespread as most investors might perceive.
After years of waiting for risk to build in the system, 2020 looks to be a year in which any number of anticipated risks may evolve into real risk and unanticipated risks will come to weigh on the markets. We expect markets to continue drift towards a higher volatility environment while governments and their agencies may seek to dampen the risk. However, we believe their efforts are becoming increasingly limited relative to years past as global economic uncertainty has risen and central banks are already ‘printing’ money. Regardless of what we think, a lot happens in 365 days and the markets will surprise investors in 2020, so we will just have to wait and see.
For the fourth quarter, the S&P 500 gained 9.07%, which lagged the Russell 2000 Index’s return of 9.94%. The CBOE S&P 500 PutWrite Index (PUT) gained 4.45% finishing slightly behind the CBOE Russell 2000 PutWrite Index (PUTR)’s return of 4.80%. For the year, the S&P 500 produced an attractive return of 31.49%, substantially exceeding the 25.52% return of the Russell 2000 Index. Meanwhile, the PUT and the PUTR indexes returned 13.51% and 14.50%, respectively.
The sleeve appreciated 3.18% on the quarter, outperforming its benchmark (40% CBOE S&P 500 PutWrite Index / 60% ICE BofA0-3M US Treasury Bill Index) return of 2.03%. On the year, the sleeve rallied 11.99%, almost doubling its benchmark return of 6.66% and outperforming the CBOE S&P 500 2% OTM PutWrite Index (“PUTY”) return of 10.53%. Average option notional exposure over the quarter remained consistent with strategic targets of 85% S&P 500 and 15% Russell 2000 Index.
For the quarter, the sleeve’s S&P 500 put writing strategy (which makes up approximately 85% of the exposure) returned 3.18% exceeding the 2.96% return of the PUTY. Meanwhile, year to date, the sleeve’s S&P 500 Index put writing strategy has rallied 12.05% exceeding the 10.53% of the PUTY index.
The CBOE S&P 500 Volatility Index (“VIX”) increased a modest 1.2 points in the fourth quarter to end the year at 13.8, averaging 13.7 over the period. A realized volatility for the S&P 500 of 7.6 resulted in an estimated positive implied volatility premium of 6.1. On the year, the VIX level has fallen-11.6 points from 25.4 at the start of the year, averaging 15.4 for the period. Meanwhile,30-day volatility on the S&P 500 realized at 11.4, leading to a positive average implied volatility premium of 4.2 for the year.
For the quarter, the sleeve’s Russell 2000 Index put writing strategy posted a gain of 3.65% outperforming the S&P 500put-write strategy. Year to date, the sleeve’s Russell 2000 Index put writing strategy has rallied 12.28% capturing modestly more premium than the S&P 500put-write strategy despite the underperformance of the Russell 2000 vs. the S&P 500 on the year.
| Fund Summary | 93 | |||||
Table of Contents
The CBOE Russell 2000 Volatility Index (“RVX”) slipped-1.8 points in the fourth quarter to end 2019 at 15.2, averaging 16.2 over the period. A realized volatility for the Russell 2000 Index of 11.0 resulted in an estimated positive implied volatility premium of 5.2. On the year, the RVX level fell-13.3 points from 28.5 at the start of the year, averaging 18.9 for the period. Meanwhile, volatility on the Russell 2000 Index realized at 16.6, leading to a positive average implied volatility premium of 2.3 for the year.
Over the quarter,2-Year US Treasury Yields declined a modest 5bps. The collateral portion of the sleeve gained 0.48%, performingin-line with the 0.44% return of the ICE BofA0-3 Month UST-Bill Index over the period. Year to date, the collateral portion of the sleeve climbed 3.11%, as2-Year US Treasury Yields fell 92bps, outperforming the ICE BofA0-3 Month UST-Bill Index return of 2.21%.
Strategy Allocations
The fund’s allocation across the four managers are as follows: 32.5% to both Brown Brothers Harriman and Guggenheim Investments, 20% to Neuberger Berman, and 15% to Ares Management. We use the fund’s daily cash flows to bring each manager’s allocation toward their targets should differences in shorter-term relative performance cause divergences.
Sub-Advisor Portfolio Composition as of December 31, 2019
Ares Alternative Equity Income Strategy
BDCs | 36.7 | % | ||
Midstream | 20.1 | % | ||
Mortgage REITs | 20.6 | % | ||
CEFs | 1.1 | % | ||
Other | 9.1 | % | ||
Cash | 12.4 | % |
Brown Brothers Harriman Credit Value Strategy
ABS | 28.0 | % | ||
Bank Loans | 34.0 | % | ||
Corporate Bonds | 30.0 | % | ||
CMBS | 6.0 | % | ||
Cash | 2.0 | % |
Guggenheim Multi-Credit Strategy
ABS: | 35.2 | % | ||
RMBS: | 21.0 | % | ||
Corporate Bonds: | 10.4 | % | ||
Cash: | 10.1 | % | ||
Sovereign: | 9.6 | % | ||
Bank Loans: | 7.5 | % | ||
CMBS: | 3.1 | % | ||
Interest Rate Swaps: | -0.3 | % | ||
Other: | 3.4 | % |
Neuberger Berman Option Income Strategy
Equity Index Put Writing | 100 | % |
| 94 | Litman Gregory Funds Trust | |||||
Table of Contents
CURRENT TARGET STRATEGY ALLOCATIONS AS OF DECEMBER 31, 2019
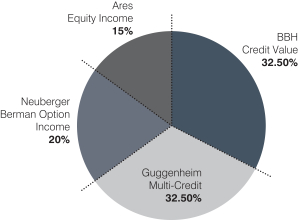
Source: Litman Gregory
PORTFOLIO
| ||||
Total Net Assets: | $ | 94,470,743 | ||
Total Holdings: | 392 | |||
Weighted Average Duration: | 1.24 Years | |||
30-Day SEC Yield: | 3.00% | |||
TTM Distribution Yield: | 3.65% | |||
SECTOR EXPOSURE – 12/31/2019
| ||||
Asset Backed | 22.1% | |||
Put Write | 19.3% | |||
Bank Loan | 14.4% | |||
Corporate | 13.0% | |||
CMO | 7.5% | |||
BDC | 6.8% | |||
Govt & Muni | 4.1% | |||
MREIT | 4.1% | |||
MLP | 2.3% | |||
Cash and Other | 6.4% | |||
CREDIT QUALITY
| ||||
AAA: | 17.72% | |||
AA: | 13.58% | |||
A: | 12.14% | |||
BBB: | 34.22% | |||
BB: | 10.72% | |||
B: | 0.75% | |||
CCC and Lower: | 7.97% | |||
Not Rated: | 2.90% | |||
Average Credit Quality: | BBB+ | |||
Equity: | 14.24% | |||
| *Does | not include Neuberger Berman’s collateral |
All bond ratings shown are provided by Moody’s Investor Services, Inc. or Standard & Poor’s Corporation
Credit ratings apply the underlying holdings of the fund, and not to the fund itself. S&P and Moody s study the financial condition of an entity to ascertain its creditworthiness. The credit ratings reflect the rating agency’s opinion of the holdings financial condition and histories. The ratings shown are all considered investment grade and are listed by highest to lowest in percentage of what the fund holds.
| Fund Summary | 95 | |||||
Table of Contents
Litman Gregory Masters High Income Alternatives Fund Managers
| INVESTMENT MANAGER | FIRM | TARGET MANAGER ALLOCATION | Strategy | |||
Greg Mason Troy Ward | Ares Management, LLC | 15% | Equity Income | |||
Andrew P. Hofer Neil Hohmann Paul Kunz | Brown Brothers Harriman & Co. | 33% | Credit Value | |||
Scott Minerd Anne Walsh Steven Brown Adam Bloch | Guggenheim Partners Investment Management, LLC | 33% | Multi-Credit | |||
| Derek Devens | Neuberger Berman Investment Advisers LLC | 20% | Option Income |
High Income Alternatives Fund Value of Hypothetical $100,000
The value of a hypothetical $100,000 investment in the Litman Gregory Masters High Income Alternatives Fund from September 28, 2018 to December 31, 2019 compared with the Bloomberg Barclays U.S. Aggregate Bond Index.
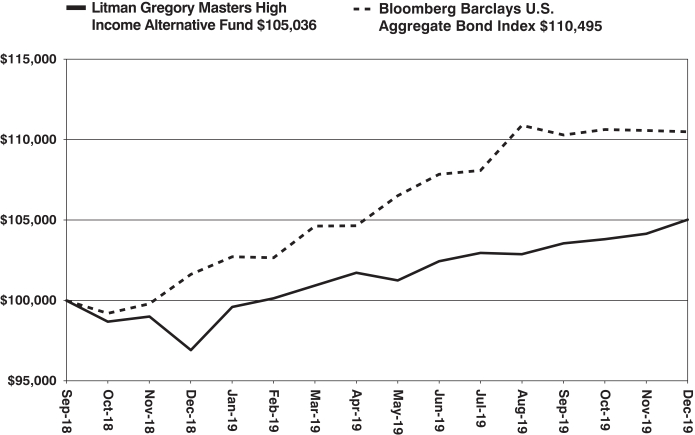
The hypothetical $100,000 investment at fund inception includes changes due to share price and reinvestment of dividends and capital gains. The chart does not imply future performance. Indexes are unmanaged, do not incur fees, expenses or taxes, and cannot be invested in directly.
| 96 | Litman Gregory Funds Trust | |||||
Table of Contents
Litman Gregory Masters High Income Alternatives Fund
SCHEDULE OF INVESTMENTS IN SECURITIES at December 31, 2019
| Shares | Value | |||||||
| COMMON STOCKS: 11.7% | ||||||||
| Energy: 2.6% | ||||||||
| 10,300 | CNX Midstream Partners L.P. | $ | 169,538 | |||||
| 8,200 | Crestwood Equity Partners L.P. | 252,724 | ||||||
| 18,900 | Enable Midstream Partners L.P. | 189,567 | ||||||
| 23,800 | Energy Transfer L.P. | 305,354 | ||||||
| 19,506 | EnLink Midstream LLC | 119,572 | ||||||
| 12,957 | Enterprise Products Partners L.P. | 364,869 | ||||||
| 4,600 | EQM Midstream Partners L.P. | 137,586 | ||||||
| 3,537 | Magellan Midstream Partners L.P. | 222,371 | ||||||
| 5,298 | MPLX L.P. | 134,887 | ||||||
| 13,188 | Plains All American Pipeline L.P. | 242,527 | ||||||
| 3,956 | Western Midstream Partners L.P. | 77,894 | ||||||
| 11,207 | Williams Cos., Inc. (The) | 265,830 | ||||||
|
| |||||||
| 2,482,719 | ||||||||
|
| |||||||
| Financials: 8.6% | ||||||||
| 23,100 | AGNC Investment Corp. | 408,408 | ||||||
| 23,668 | Alcentra Capital Corp. | 214,195 | ||||||
| 21,617 | Apollo Investment Corp. | 377,433 | ||||||
| 61,882 | Ares Capital Corp. | 1,154,099 | ||||||
| 49,200 | Barings BDC, Inc. | 505,776 | ||||||
| 58,290 | BlackRock Capital Investment Corp. | 289,410 | ||||||
| 11,300 | Ellington Financial, Inc. | 207,129 | ||||||
| 27,078 | Ellington Residential Mortgage REIT | 293,796 | ||||||
| 375 | Exantas Capital Corp. | 4,429 | ||||||
| 125,982 | FS KKR Capital Corp. | 772,270 | ||||||
| 9,648 | KKR Real Estate Finance Trust, Inc. | 197,012 | ||||||
| 19,200 | New Mountain Finance Corp. | 263,808 | ||||||
| 26,322 | New Residential Investment Corp. | 424,048 | ||||||
| 1,304 | Oaktree Specialty Lending Corp. | 7,120 | ||||||
| 46,401 | Oaktree Strategic Income Corp. | 380,024 | ||||||
| 25,119 | Ready Capital Corp. | 387,335 | ||||||
| 16,450 | Redwood Trust, Inc. | 272,083 | ||||||
| 19,947 | Solar Capital Ltd. | 411,307 | ||||||
| 26,575 | TCG BDC, Inc. | 355,574 | ||||||
| 20,655 | TPG RE Finance Trust, Inc. | 418,677 | ||||||
| 23,437 | Two Harbors Investment Corp. | 342,649 | ||||||
| 38,642 | WhiteHorse Finance, Inc. | 529,395 | ||||||
|
| |||||||
| 8,215,977 | ||||||||
|
| |||||||
| Industrials: 0.5% | ||||||||
| 10,111 | Macquarie Infrastructure Corp. | 433,155 | ||||||
|
| |||||||
| | TOTAL COMMON STOCKS | 11,131,851 | ||||||
|
| |||||||
| PREFERRED STOCKS: 1.4% | ||||||||
| Energy: 0.1% | ||||||||
| NuStar Energy L.P. |
| |||||||
| 3,000 | 7.625%, 06/15/2022(a)(b) | 64,950 | ||||||
|
| |||||||
| Financials: 1.3% | ||||||||
| AG Mortgage Investment Trust, Inc. |
| |||||||
| 2,350 | 8.000%, 09/17/2024(a)(b) | 62,017 | ||||||
| AGNC Investment Corp. |
| |||||||
| 4,700 | 6.500%, 10/15/2024(a)(b) | 120,555 | ||||||
| AmTrust Financial Services, Inc. |
| |||||||
| 50 | 7.250%, 02/12/2020(b) | 880 | ||||||
| AmTrust Financial Services, Inc. |
| |||||||
| 23 | 7.625%, 02/12/2020(b) | 405 | ||||||
| Shares | Value | |||||||
| Financials (continued) | ||||||||
| AmTrust Financial Services, Inc. |
| |||||||
| 205 | 7.500%, 03/19/2020(b) | $ | 3,639 | |||||
| AmTrust Financial Services, Inc. |
| |||||||
| 122 | 7.750%, 03/15/2021(b) | 2,152 | ||||||
| Annaly Capital Management, Inc. |
| |||||||
| 5,950 | 6.950%, 09/30/2022(a)(b) | 153,807 | ||||||
| Chimera Investment Corp. |
| |||||||
| 4,000 | 8.000%, 03/30/2024(a)(b) | 105,280 | ||||||
| Chimera Investment Corp. |
| |||||||
| 7,570 | 7.750%, 09/30/2025(a)(b) | 196,441 | ||||||
| Dynex Capital, Inc. |
| |||||||
| 1,800 | 8.500%, 02/12/2020(b) | 46,278 | ||||||
| Investcorp Credit Management BDC, Inc. |
| |||||||
| 5,650 | 6.125%, 07/01/2023 | 140,205 | ||||||
| New Residential Investment Corp. |
| |||||||
| 8,200 | 7.125%, 08/15/2024(a)(b) | 212,544 | ||||||
| New Residential Investment Corp. |
| |||||||
| 7,775 | 7.500%, 08/15/2024(a)(b) | 205,493 | ||||||
|
| |||||||
| 1,249,696 | ||||||||
|
| |||||||
| | TOTAL PREFERRED STOCKS | 1,314,646 | ||||||
|
| |||||||
| CLOSED-END FUND: 0.2% | ||||||||
| 11,150 | Kayne Anderson MLP/Midstream Investment Co. | 155,320 | ||||||
|
| |||||||
| | TOTALCLOSED-END FUND | 155,320 | ||||||
|
| |||||||
| EXCHANGE-TRADED FUND: 1.1% | ||||||||
| 9,150 | iShares Core U.S. Aggregate Bond ETF | 1,028,186 | ||||||
|
| |||||||
| | TOTAL EXCHANGE-TRADED FUND | 1,028,186 | ||||||
|
| |||||||
| Principal Amount^ | ||||||||
| ASSET-BACKED SECURITIES: 22.5% | ||||||||
| Aaset Trust | ||||||||
| $236,750 | Series2019-1-B | 236,938 | ||||||
| 246,525 | Series2019-2-B | 244,284 | ||||||
| AASET US Ltd. | ||||||||
| 225,479 | Series2018-2A-A | 229,992 | ||||||
| ACC Trust | ||||||||
| 156,492 | Series2019-1-A | 157,364 | ||||||
| Adams Outdoor Advertising L.P. | ||||||||
| 393,440 | Series2018-1-A | 408,799 | ||||||
| AIM Aviation Finance Ltd. | ||||||||
| 165,017 | Series2015-1A-A1 | 164,984 | ||||||
| 169,825 | Series2015-1A-B1 | 169,698 | ||||||
The accompanying notes are an integral part of these financial statements.
| Schedule of Investments | 97 | |||||
Table of Contents
Litman Gregory Masters High Income Alternatives Fund
SCHEDULE OF INVESTMENTS IN SECURITIES at December 31, 2019 (Continued)
| Principal Amount^ | Value | |||||||
| ASSET-BACKED SECURITIES (CONTINUED) | ||||||||
| American Express Credit Account Master Trust | ||||||||
| $ 500,000 | Series2018-1-A | $ | 500,779 | |||||
| Amur Equipment Finance Receivables VI LLC | ||||||||
| 175,165 | Series2018-2A-A2 | 177,940 | ||||||
| Avis Budget Rental Car Funding AESOP LLC | ||||||||
| 100,000 | Series2015-1A-A | 100,125 | ||||||
| Bain Capital Credit CLO Ltd. | ||||||||
| 250,000 | Series2016-2A-CR | 245,519 | ||||||
| Capital Automotive LLC | ||||||||
| 331,064 | Series2017-1A-A1 | 333,795 | ||||||
| Carmax Auto Owner Trust | ||||||||
| 64,540 | Series2019-3-A1 | 64,538 | ||||||
| Castlelake Aircraft Securitization Trust | ||||||||
| 351,670 | Series2017-1A | 356,623 | ||||||
| CFG Investments Ltd. | ||||||||
| 400,000 | Series2019-1-B | 405,604 | ||||||
| Citibank Credit Card Issuance Trust | ||||||||
| 600,000 | Series2017-A3-A3 | 599,983 | ||||||
| Colombia Cent CLO 27 Ltd. | ||||||||
| 266,666 | Series2018-27A-X | 266,669 | ||||||
| Drug Royalty III L.P. | ||||||||
| 380,026 | Series2018-1A-A1 | 379,683 | ||||||
| Elm Trust | ||||||||
| 300,000 | Series2018-2A-A2 | 301,636 | ||||||
| 100,000 | Series2018-2A-B | 101,573 | ||||||
| Falcon Aerospace Ltd. | ||||||||
| 475,530 | Series2017-1-B | 488,953 | ||||||
| FREED ABS Trust | ||||||||
| 400,000 | Series2018-2-B | 409,965 | ||||||
| Global SC Finance II SRL | ||||||||
| 275,000 | Series2014-1A-A1 | 274,862 | ||||||
| Greywolf CLO III Ltd. | ||||||||
| 250,000 | Series2018-3RA-A2 | 249,873 | ||||||
| Principal Amount^ | Value | |||||||
| $ 228,571 | Series2018-3RA-X | $ | 228,594 | |||||
| GSAMP Trust | ||||||||
| 285,696 | Series2007-NC1-A1 | 184,144 | ||||||
| Hercules Capital Funding Trust | ||||||||
| 400,000 | Series2018-1A-A | 401,619 | ||||||
| 100,000 | Series2019-1A-A | 100,662 | ||||||
| Hull Street CLO Ltd. | ||||||||
| 300,000 | Series2014-1A-CR | 299,070 | ||||||
| InSite Issuer LLC | ||||||||
| 480,000 | Series2018-1A-C | 500,549 | ||||||
| KREF Ltd. | ||||||||
| 400,000 | Series2018-FL1-A | 401,121 | ||||||
| Legacy Mortgage Asset Trust | ||||||||
| 238,417 | Series2019-GS5-A1 | 239,299 | ||||||
| Madison Avenue Secured Funding Trust | ||||||||
| 150,000 | Series2019-1-A | 150,385 | ||||||
| Marathon CLO V Ltd. | ||||||||
| 500,000 | Series2013-5A-A2R | 493,083 | ||||||
| Marathon CRE Ltd. | ||||||||
| 100,000 | Series2018-FL1-C | 100,228 | ||||||
| Monroe Capital CLO Ltd. | ||||||||
| 250,000 | Series2014-1A-CR | 249,216 | ||||||
| Morgan Stanley ABS Capital I, Inc. Trust | ||||||||
| 345,220 | Series2006-HE8-A2D | 221,421 | ||||||
| 404,356 | Series2007-HE4-A2C | 188,219 | ||||||
| Morgan Stanley IXIS Real Estate Capital Trust | ||||||||
| 415,167 | Series2006-2-A4 | 206,925 | ||||||
| NADG NNN Operating L.P. | ||||||||
| 160,000 | Series2019-1-A | 158,838 | ||||||
The accompanying notes are an integral part of these financial statements.
| 98 | Litman Gregory Funds Trust | |||||
Table of Contents
Litman Gregory Masters High Income Alternatives Fund
SCHEDULE OF INVESTMENTS IN SECURITIES at December 31, 2019 (Continued)
| Principal Amount^ | Value | |||||||
| ASSET-BACKED SECURITIES (CONTINUED) | ||||||||
| Nassau CFO LLC | ||||||||
| $ 244,593 | Series2019-1-A | $ | 242,799 | |||||
| Nationstar HECM Loan Trust | ||||||||
| 460,000 | Series2018-3A-M1 | 465,732 | ||||||
| Neuberger Berman CLO XX Ltd. | ||||||||
| 420,000 | Series2015-20A-AR | 419,957 | ||||||
| New Residential Advance Receivables Trust | ||||||||
| 600,000 | Series2019-T3-DT3 | 600,066 | ||||||
| 300,000 | Series2019-T4-DT4 | 299,715 | ||||||
| NewStar Clarendon Fund CLO LLC | ||||||||
| 250,000 | Series2014-1A-BR | 249,989 | ||||||
| 300,000 | Series2014-1A-CR | 299,985 | ||||||
| Newtek Small Business Loan Trust | ||||||||
| 180,648 | Series2018-1-A | 180,985 | ||||||
| 82,113 | Series2018-1-B | 82,831 | ||||||
| NextGear Floorplan Master Owner Trust | ||||||||
| 200,000 | Series2018-2A-A2 | 205,323 | ||||||
| Ocwen Master Advance Receivables Trust | ||||||||
| 100,000 | Series2019-T1-BT1 | 100,293 | ||||||
| 100,000 | Series2019-T1-CT1 | 100,294 | ||||||
| 100,000 | Series2019-T1-DT1 | 100,295 | ||||||
| Oportun Funding X LLC | ||||||||
| 400,000 | Series2018-C-B | 413,560 | ||||||
| Oxford Finance Funding LLC | ||||||||
| 260,000 | Series2019-1A-A2 | 264,014 | ||||||
| Palmer Square Loan Funding Ltd. | ||||||||
| 379,938 | Series2018-4A-A1 | 380,075 | ||||||
| 215,000 | Series2019-2A-B | 215,372 | ||||||
| 340,000 | Series2019-3A-B | 335,625 | ||||||
| Principal Amount^ | Value | |||||||
| Raspro Trust | ||||||||
| $ 584,129 | Series2005-1A-B | $ | 584,762 | |||||
| ReadyCap Lending Small Business Loan Trust | ||||||||
| 220,000 | Series2019-2-A | 220,000 | ||||||
| Regatta VI Funding Ltd. | ||||||||
| 500,000 | Series2016-1A-AR | 500,008 | ||||||
| Regional Management Issuance Trust | ||||||||
| 480,000 | Series2018-2-B | 491,887 | ||||||
| Republic FInance Issuance Trust | ||||||||
| 240,000 | Series2019-A-A | 239,734 | ||||||
| RMF Buyout Issuance Trust | ||||||||
| 460,000 | Series2018-1-M1 | 461,580 | ||||||
| Saganaw Insurance Recievables LLC | ||||||||
| 172,870 | Series2019-1A-A | 174,642 | ||||||
| Sapphire Aviation Finance I Ltd. | ||||||||
| 196,921 | Series2018-1A-A | 200,426 | ||||||
| Secured Tenant Site Contract Revenue Notes | ||||||||
| 121,897 | Series2018-1A-C | 123,521 | ||||||
| SPS Servicer Advance Receivables Trust | ||||||||
| 150,000 | Series2019-T1-DT1 | 150,184 | ||||||
| Stack Infrastructure Issuer LLC | ||||||||
| 456,167 | Series2019-1A-A2 | 478,107 | ||||||
| Staniford Street CLO Ltd. | ||||||||
| 186,479 | Series2014-1A-AR | 186,871 | ||||||
| STWD Ltd. | ||||||||
| 150,000 | Series2019-FL1-B | 150,386 | ||||||
| THL Credit Wind River CLO Ltd. | ||||||||
| 430,666 | Series2012-1A-AR2 | 430,720 | ||||||
| TPG Real Estate Finance Issuer Ltd. | ||||||||
| 470,000 | Series2018-FL2-A | 470,202 | ||||||
| Venture XIII CLO Ltd. | ||||||||
| 250,000 | Series2013-13A-SUB | 109,309 | ||||||
| Veros Automobile Receivables Trust | ||||||||
| 90,944 | Series2018-1-A | 91,166 | ||||||
The accompanying notes are an integral part of these financial statements.
| Schedule of Investments | 99 | |||||
Table of Contents
Litman Gregory Masters High Income Alternatives Fund
SCHEDULE OF INVESTMENTS IN SECURITIES at December 31, 2019 (Continued)
| Principal Amount^ | Value | |||||||
| ASSET-BACKED SECURITIES (CONTINUED) | ||||||||
| Wachovia Asset Securitization Issuance II LLC Trust | ||||||||
| $ 287,688 | Series2007-HE2A-A | $ | 274,063 | |||||
| Wingstop Funding LLC | ||||||||
| 99,250 | Series2018-1-A2 | 102,286 | ||||||
|
| |||||||
| | TOTAL ASSET-BACKED SECURITIES | 21,390,316 | ||||||
|
| |||||||
| BANK LOANS: 13.4% | ||||||||
| Accuride Corp. |
| |||||||
| 49,490 | 7.195%, 11/17/2023(e) | 39,344 | ||||||
| Air Newco LLC |
| |||||||
| 100,000 | 6.262%, 10/09/2026(e) | 99,250 | ||||||
| API Technologies Corp. |
| |||||||
| 99,500 | 6.049%, 05/09/2026(e) | 96,017 | ||||||
| Arctic Glacier U.S.A., Inc. |
| |||||||
| 100,000 | 5.299%, 03/20/2024(e) | 96,833 | ||||||
| Aria Energy Operating LLC |
| |||||||
| 296,873 | 6.299%, 05/27/2022(e) | 293,533 | ||||||
| Avolon TLB Borrower 1 (US) LLC |
| |||||||
| 454,422 | 3.515%, 01/15/2025(e) | 457,831 | ||||||
| AVSC Holding Corp. |
| |||||||
| 98,744 | 5.091%, 03/03/2025(e) | 98,620 | ||||||
| BCP Renaissance Parent LLC |
| |||||||
| 493,734 | 5.445%, 10/31/2024(e) | 440,349 | ||||||
| BCPE Empire Holdings, Inc. |
| |||||||
| 2,083 | 4.228%, 06/11/2026(e) | 2,092 | ||||||
| 83,335 | 5.799%, 06/11/2026(e) | 83,674 | ||||||
| Blue Ribbon LLC |
| |||||||
| 10,000 | 0.000%, 11/15/2021(g) | 8,644 | ||||||
| Buckeye Partners L.P. |
| |||||||
| 300,000 | 4.441%, 11/01/2026(e) | 303,084 | ||||||
| BWAY Holding Co. |
| |||||||
| 98,734 | 5.234%, 04/03/2024(e) | 98,580 | ||||||
| CD&R Hydra Buyer, Inc. |
| |||||||
| 99,492 | 6.049%, 12/11/2024(e) | 98,601 | ||||||
| CenturyLink, Inc. |
| |||||||
| 260,526 | 4.549%, 11/01/2022(e) | 261,667 | ||||||
| Cologix, Inc. |
| |||||||
| 100,000 | 5.549%, 03/20/2024(e) | 99,500 | ||||||
| Principal Amount^ | Value | |||||||
| Comet Acquisition, Inc. |
| |||||||
| $ 99,000 | 5.409%, 10/24/2025(e) | $ | 97,597 | |||||
| CPM Holdings, Inc. |
| |||||||
| 99,000 | 5.549%, 11/17/2025(e) | 98,307 | ||||||
| Cvent, Inc. |
| |||||||
| 98,744 | 5.549%, 11/29/2024(e) | 98,818 | ||||||
| Diamond (BC) B.V. |
| |||||||
| 98,741 | 4.927%, 09/06/2024(e) | 96,988 | ||||||
| Eastern Power LLC |
| |||||||
| 680,516 | 5.549%, 10/02/2023(e) | 683,334 | ||||||
| Emerald TopCo, Inc. |
| |||||||
| 99,750 | 5.299%, 07/24/2026(e) | 100,452 | ||||||
| Frontera Generation Holdings LLC |
| |||||||
| 492,401 | 5.990%, 05/02/2025(e) | 425,927 | ||||||
| Give & Go Prepared Foods Corp. |
| |||||||
| 99,745 | 6.195%, 07/29/2023(e) | 95,381 | ||||||
| GlobalFoundries, Inc. |
| |||||||
| 99,500 | 6.750%, 06/05/2026(e) | 96,391 | ||||||
| HCA Inc. |
| |||||||
| 593,977 | 3.549%, 03/13/2025(e) | 598,099 | ||||||
| Helix Gen Funding LLC |
| |||||||
| 600,000 | 5.549%, 06/03/2024(e) | 593,082 | ||||||
| IBC Capital Ltd. |
| |||||||
| 98,744 | 5.649%, 09/11/2023(e) | 98,991 | ||||||
| IRB Holding Corp. |
| |||||||
| 98,744 | 5.216%, 02/05/2025(e) | 99,505 | ||||||
| Kestrel Acquisition LLC |
| |||||||
| 284,266 | 6.050%, 06/02/2025(e) | 252,997 | ||||||
| LTI Holdings, Inc. |
| |||||||
| 98,750 | 5.299%, 09/06/2025(e) | 89,298 | ||||||
| MMM Holdings, Inc. |
| |||||||
| 780,000 | 9.500%, 12/24/2026(e) | 764,400 | ||||||
| Moran Foods LLC |
| |||||||
| 49,490 | 8.549%, 12/05/2023(e) | 18,126 | ||||||
| NFP Corp. |
| |||||||
| 49,364 | 4.799%, 01/08/2024(e) | 49,245 | ||||||
| NorthRiver Midstream Finance L.P. |
| |||||||
| 592,747 | 5.349%, 10/01/2025(e) | 594,786 | ||||||
| Panther BF Aggregator 2 L.P. |
| |||||||
| 653,363 | 5.305%, 04/30/2026(e) | 656,835 | ||||||
The accompanying notes are an integral part of these financial statements.
| 100 | Litman Gregory Funds Trust | |||||
Table of Contents
Litman Gregory Masters High Income Alternatives Fund
SCHEDULE OF INVESTMENTS IN SECURITIES at December 31, 2019 (Continued)
| Principal Amount^ | Value | |||||||
| BANK LOANS (CONTINUED) | ||||||||
| Playpower, Inc. |
| |||||||
| $ 99,500 | 7.461%, 05/08/2026(e) | $ | 98,754 | |||||
| RPI Finance Trust |
| |||||||
| 672,335 | 3.799%, 03/27/2023(e) | 678,746 | ||||||
| ScribeAmerica Intermediate Holdco LLC |
| |||||||
| 49,372 | 6.240%, 04/03/2025(e) | 48,570 | ||||||
| Sprint Communications, Inc. |
| |||||||
| 567,891 | 4.313%, 02/02/2024(e) | 563,916 | ||||||
| SS&C Technologies, Inc. |
| |||||||
| 342,543 | 4.049%, 04/16/2025(e) | 345,277 | ||||||
| Summit Midstream Partners Holdings LLC | ||||||||
| 15,964 | 7.799%, 05/13/2022(e) | 15,165 | ||||||
| Teneo Holdings LLC | ||||||||
| 49,875 | 6.990%, 07/11/2025(e) | 47,568 | ||||||
| Tivity Health, Inc. | ||||||||
| 738,886 | 7.049%, 03/06/2026(e) | 740,917 | ||||||
| TVC Albany, Inc. | ||||||||
| 98,750 | 5.300%, 07/23/2025(e) | 98,997 | ||||||
| U.S. Renal Care, Inc. | ||||||||
| 473,813 | 6.813%, 06/26/2026(e) | 471,510 | ||||||
| UGI Energy Services LLC | ||||||||
| 238,800 | 5.549%, 08/13/2026(e) | 240,591 | ||||||
| Vistra Operations Co. LLC | ||||||||
| 651,344 | 3.537%, 12/31/2025(e) | 656,155 | ||||||
| Wyndham Hotels & Resorts, Inc. | ||||||||
| 592,747 | 3.549%, 05/30/2025(e) | 596,452 | ||||||
|
| |||||||
| | TOTAL BANK LOANS | 12,788,796 | ||||||
|
| |||||||
| CORPORATE BONDS: 12.9% | ||||||||
| Basic Materials: 0.0% | ||||||||
| Georgia-Pacific LLC | ||||||||
| 20,000 | 5.400%, 11/01/2020(c) | 20,558 | ||||||
| Neon Holdings, Inc. | ||||||||
| 25,000 | 10.125%, 04/01/2026(c) | 24,934 | ||||||
|
| |||||||
| 45,492 | ||||||||
|
| |||||||
| Communications: 0.8% | ||||||||
| TEGNA, Inc. | ||||||||
| 260,000 | 5.000%, 09/15/2029(c) | 264,875 | ||||||
| Telefonica Emisiones S.A. | ||||||||
| 25,000 | 5.134%, 04/27/2020 | 25,238 | ||||||
| VeriSign, Inc. | ||||||||
| 400,000 | 5.250%, 04/01/2025 | 441,758 | ||||||
|
| |||||||
| 731,871 | ||||||||
|
| |||||||
| Principal Amount^ | Value | |||||||
| Consumer, Cyclical: 0.2% | ||||||||
| McDonald’s Corp. | ||||||||
| $ 50,000 | Series MTN | $ | 50,403 | |||||
| Panther BF Aggregator 2 L.P./Panther Finance Co., Inc. | ||||||||
| 10,000 | 8.500%, 05/15/2027(c) | 10,644 | ||||||
| Party City Holdings, Inc. | ||||||||
| 50,000 | 6.625%, 08/01/2026(c) | 35,366 | ||||||
| Starbucks Corp. | ||||||||
| 50,000 | 2.100%, 02/04/2021 | 50,135 | ||||||
|
| |||||||
| 146,548 | ||||||||
|
| |||||||
| Consumer,Non-cyclical: 2.2% | ||||||||
| AbbVie, Inc. | ||||||||
| 100,000 | 2.245%, 05/21/2021(c)(e) | 100,124 | ||||||
| Allergan Funding SCS | ||||||||
| 100,000 | 3.142%, 03/12/2020(e) | 100,194 | ||||||
| Ashtead Capital, Inc. | ||||||||
| 260,000 | 4.250%, 11/01/2029(c) | 266,175 | ||||||
| Carriage Services, Inc. | ||||||||
| 10,000 | 6.625%, 06/01/2026(c) | 10,678 | ||||||
| Centene Corp. | ||||||||
| 90,000 | 4.250%, 12/15/2027(c) | 92,754 | ||||||
| Cigna Corp. | ||||||||
| 65,000 | 2.250%, 03/17/2020(e) | 65,027 | ||||||
| Conagra Brands, Inc. | ||||||||
| 20,000 | 2.703%, 10/22/2020(e) | 20,002 | ||||||
| Constellation Brands, Inc. | ||||||||
| 160,000 | 2.250%, 11/06/2020 | 160,346 | ||||||
| CVS Pass-Through Trust | ||||||||
| 155,276 | 5.926%, 01/10/2034(c) | 181,195 | ||||||
| General Mills, Inc. | ||||||||
| 70,000 | 2.541%, 04/16/2021(e) | 70,243 | ||||||
| Ingredion, Inc. | ||||||||
| 70,000 | 4.625%, 11/01/2020 | 71,448 | ||||||
| KeHE Distributors LLC/KeHE Finance Corp. | ||||||||
| 10,000 | 8.625%, 10/15/2026(c) | 10,494 | ||||||
| MEDNAX, Inc. | ||||||||
| 415,000 | 6.250%, 01/15/2027(c) | 426,423 | ||||||
| Molson Coors Brewing Co. | ||||||||
| 70,000 | 2.250%, 03/15/2020 | 69,975 | ||||||
| Mondelez International, Inc. | ||||||||
| 100,000 | 3.000%, 05/07/2020 | 100,294 | ||||||
| Nathan’s Famous, Inc. | ||||||||
| 50,000 | 6.625%, 11/01/2025(c) | 51,250 | ||||||
| Quest Diagnostics, Inc. | ||||||||
| 70,000 | 4.700%, 04/01/2021 | 72,343 | ||||||
| Reynolds American, Inc. | ||||||||
| 100,000 | 3.250%, 06/12/2020 | 100,463 | ||||||
| Sotheby’s | ||||||||
| 50,000 | 7.375%, 10/15/2027(c) | 50,717 | ||||||
| Vector Group Ltd. | ||||||||
| 50,000 | 6.125%, 02/01/2025(c) | 49,312 | ||||||
| Zimmer Biomet Holdings, Inc. | ||||||||
| 60,000 | 2.700%, 04/01/2020 | 60,041 | ||||||
|
| |||||||
| 2,129,498 | ||||||||
|
| |||||||
The accompanying notes are an integral part of these financial statements.
| Schedule of Investments | 101 | |||||
Table of Contents
Litman Gregory Masters High Income Alternatives Fund
SCHEDULE OF INVESTMENTS IN SECURITIES at December 31, 2019 (Continued)
| Principal Amount^ | Value | |||||||
| CORPORATE BONDS (CONTINUED) | ||||||||
| Energy: 0.9% | ||||||||
| Enable Midstream Partners L.P. | ||||||||
| $ 405,000 | 4.150%, 09/15/2029 | $ | 385,423 | |||||
| Energy Transfer Operating L.P. | ||||||||
| 25,000 | 7.500%, 10/15/2020 | 25,986 | ||||||
| 320,000 | 6.250%, 02/15/2023(a)(b) | 301,286 | ||||||
| Florida Gas Transmission Co. LLC | ||||||||
| 60,000 | 5.450%, 07/15/2020(c) | 61,015 | ||||||
| Sabine Pass Liquefaction LLC | ||||||||
| 100,000 | 5.625%, 02/01/2021 | 102,807 | ||||||
|
| |||||||
| 876,517 | ||||||||
|
| |||||||
| Financial: 8.0% | ||||||||
| Alliance Data Systems Corp. | ||||||||
| 285,000 | 4.750%, 12/15/2024(c) | 285,000 | ||||||
| American Equity Investment Life Holding Co. | ||||||||
| 54,000 | 5.000%, 06/15/2027 | 57,700 | ||||||
| American Tower Corp. | ||||||||
| 70,000 | 3.300%, 02/15/2021 | 70,967 | ||||||
| Aon Corp. | ||||||||
| 70,000 | 5.000%, 09/30/2020 | 71,511 | ||||||
| Apollo Management Holdings L.P. | ||||||||
| 350,000 | 4.950%, 01/14/2050(a)(c) | 354,977 | ||||||
| Assurant, Inc. | ||||||||
| 17,000 | 3.197%, 03/26/2021(e) | 17,002 | ||||||
| AXIS Specialty Finance LLC | ||||||||
| 70,000 | 5.875%, 06/01/2020 | 71,108 | ||||||
| BlackRock TCP Capital Corp. | ||||||||
| 390,000 | 4.125%, 08/11/2022 | 404,009 | ||||||
| 50,000 | 3.900%, 08/23/2024 | 51,122 | ||||||
| Brazilian Merchant Voucher Receivables Ltd. | ||||||||
| 200,000 | 4.180%, 04/07/2028(f) | 206,510 | ||||||
| Business Development Corp. of America | ||||||||
| 375,000 | 4.750%, 12/30/2022(c) | 375,418 | ||||||
| 225,000 | 4.850%, 12/15/2024(c) | 225,229 | ||||||
| Capital One Financial Corp. | ||||||||
| 60,000 | 2.386%, 10/30/2020(e) | 60,128 | ||||||
| Credit Acceptance Corp. | ||||||||
| 200,000 | 7.375%, 03/15/2023 | 205,833 | ||||||
| 80,000 | 5.125%, 12/31/2024(c) | 83,277 | ||||||
| 285,000 | 6.625%, 03/15/2026(c) | 308,832 | ||||||
| Credit Agricole Corporate & Investment Bank S.A. | ||||||||
| 100,000 | Series MTN | 100,201 | ||||||
| Drawbridge Special Opportunities Fund L.P./Drawbridge Special Opportunities Finance | ||||||||
| 465,000 | 5.000%, 08/01/2021(c) | 472,301 | ||||||
| Enstar Group Ltd. | ||||||||
| 500,000 | 4.950%, 06/01/2029 | 536,754 | ||||||
| Principal Amount^ | Value | |||||||
| Financial (continued) | ||||||||
| HAT Holdings I LLC/HAT Holdings II LLC | ||||||||
| $ 230,000 | 5.250%, 07/15/2024(c) | $ | 242,267 | |||||
| Icahn Enterprises L.P./Icahn Enterprises Finance Corp. | ||||||||
| 50,000 | 5.875%, 02/01/2022 | 50,152 | ||||||
| Main Street Capital Corp. | ||||||||
| 200,000 | 5.200%, 05/01/2024 | 215,251 | ||||||
| Marsh & McLennan Cos., Inc. | ||||||||
| 20,000 | 4.800%, 07/15/2021 | 20,731 | ||||||
| Owl Rock Capital Corp. | ||||||||
| 250,000 | 5.250%, 04/15/2024 | 265,457 | ||||||
| 120,000 | 4.625%, 11/26/2024(c) | 121,524 | ||||||
| 185,000 | 4.000%, 03/30/2025 | 185,863 | ||||||
| RBC USA Holdco Corp. | ||||||||
| 100,000 | 5.250%, 09/15/2020 | 102,296 | ||||||
| Sirius International Group Ltd. | ||||||||
| 700,000 | 4.600%, 11/01/2026(c) | 690,355 | ||||||
| Solar Capital Ltd. | ||||||||
| 400,000 | 4.500%, 01/20/2023 | 400,635 | ||||||
| Swiss Re Finance Luxembourg S.A. | ||||||||
| 495,000 | 5.000%, 04/02/2049(a)(c) | 553,162 | ||||||
| Synchrony Bank | ||||||||
| 250,000 | Series BKNT | 250,203 | ||||||
| United Insurance Holdings Corp. | ||||||||
| 530,000 | 6.250%, 12/15/2027 | 542,917 | ||||||
|
| |||||||
| 7,598,692 | ||||||||
|
| |||||||
| Industrial: 0.3% | ||||||||
| Cleaver-Brooks, Inc. | ||||||||
| 15,000 | 7.875%, 03/01/2023(c) | 15,006 | ||||||
| Molex Electronic Technologies LLC | ||||||||
| 60,000 | 2.878%, 04/15/2020(c) | 60,083 | ||||||
| Northrop Grumman Corp. | ||||||||
| 30,000 | 3.500%, 03/15/2021 | 30,586 | ||||||
| Reynolds Group Issuer, Inc./Reynolds Group Issuer LLC/Reynolds Group Issuer Lu | ||||||||
| 48,455 | 5.750%, 10/15/2020 | 48,576 | ||||||
| Textron, Inc. | ||||||||
| 100,000 | 2.451%, 11/10/2020(e) | 100,004 | ||||||
|
| |||||||
| 254,255 | ||||||||
|
| |||||||
| Technology: 0.3% | ||||||||
| Broadcom Corp./Broadcom Cayman Finance Ltd. | ||||||||
| 60,000 | 2.375%, 01/15/2020 | 60,003 | ||||||
| Dell International LLC/EMC Corp. | ||||||||
| 200,000 | 6.020%, 06/15/2026(c) | 230,409 | ||||||
| Fiserv, Inc. | ||||||||
| 20,000 | 2.700%, 06/01/2020 | 20,051 | ||||||
|
| |||||||
| 310,463 | ||||||||
|
| |||||||
| Utilities: 0.2% | ||||||||
| Eversource Energy | ||||||||
| 20,000 | 2.500%, 03/15/2021 | 20,122 | ||||||
The accompanying notes are an integral part of these financial statements.
| 102 | Litman Gregory Funds Trust | |||||
Table of Contents
Litman Gregory Masters High Income Alternatives Fund
SCHEDULE OF INVESTMENTS IN SECURITIES at December 31, 2019 (Continued)
| Principal Amount^ | Value | |||||||
| CORPORATE BONDS (CONTINUED) | ||||||||
| Utilities (continued) | ||||||||
| Exelon Corp. | ||||||||
| $ 60,000 | 2.850%, 06/15/2020 | $ | 60,142 | |||||
| NextEra Energy Capital Holdings, Inc. | ||||||||
| 100,000 | 2.411%, 09/28/2020(e) | 100,153 | ||||||
|
| |||||||
| 180,417 | ||||||||
|
| |||||||
| | TOTAL CORPORATE BONDS | 12,273,753 | ||||||
|
| |||||||
| GOVERNMENT SECURITIES & AGENCY ISSUE: 22.2% | ||||||||
| Brazil Letras do Tesouro Nacional | ||||||||
| | 400,000 (BRL) |
| 0.000%, 04/01/2020(h) | 98,420 | ||||
| | 2,000,000 (BRL) |
| 0.000%, 07/01/2020(h) | 487,080 | ||||
| | 400,000 (BRL) |
| 0.000%, 07/01/2021(h) | 92,612 | ||||
| Israel Government Bond - Fixed | ||||||||
| | 2,350,000 (ILS) |
| 0.500%, 01/31/2021 | 686,556 | ||||
| | 2,110,000 (ILS) |
| 1.000%, 04/30/2021 | 622,307 | ||||
| | 690,000 (ILS) |
| 5.500%, 01/31/2022 | 232,035 | ||||
| Spain Government Bond | ||||||||
| | 250,000 (EUR) |
| 4.000%, 04/30/2020(c) | 284,776 | ||||
| | 350,000 (EUR) |
| 0.750%, 07/30/2021 | 400,356 | ||||
| United States Treasury Note | ||||||||
| 1,600,000 | 1.625%, 03/15/2020(i) | 1,599,906 | ||||||
| 1,600,000 | 1.500%, 06/15/2020 | 1,599,500 | ||||||
| 2,000,000 | 1.375%, 09/15/2020(i) | 1,996,484 | ||||||
| 1,800,000 | 1.875%, 12/15/2020 | 1,804,078 | ||||||
| 1,600,000 | 2.375%, 03/15/2021 | 1,614,125 | ||||||
| 1,600,000 | 2.625%, 06/15/2021 | 1,623,500 | ||||||
| 1,600,000 | 2.750%, 09/15/2021 | 1,631,000 | ||||||
| 1,800,000 | 2.625%, 12/15/2021 | 1,836,070 | ||||||
| 1,500,000 | 2.375%, 03/15/2022 | 1,526,221 | ||||||
| 1,500,000 | 1.750%, 06/15/2022 | 1,506,357 | ||||||
| 1,500,000 | 1.500%, 09/15/2022 | 1,496,777 | ||||||
|
| |||||||
| | TOTAL GOVERNMENT SECURITIES & AGENCY | 21,138,160 | ||||||
|
| |||||||
| MORTGAGE-BACKED SECURITIES: 7.5% | ||||||||
| Alternative Loan Trust | ||||||||
| 348,335 | Series2005-38-A3 | 346,068 | ||||||
| 200,994 | Series2007-OA4-A1 | 191,360 | ||||||
| 215,329 | Series2007-OA7-A1A | 206,521 | ||||||
| Principal Amount^ | Value | |||||||
| Cascade Funding Mortgage Trust | ||||||||
| $ 507,795 | Series2018-RM2-A | $ | 521,617 | |||||
| CD Mortgage Trust | ||||||||
| 1,025,052 | Series2017-CD4-XA | 71,302 | ||||||
| CGBAM Commercial Mortgage Trust | ||||||||
| 250,000 | Series2015-SMRT-F | 249,860 | ||||||
| CGBAM Mezzanine Securities Trust | ||||||||
| 100,000 | Series2015-SMMZ-MZ | 99,959 | ||||||
| CGMS Commercial Mortgage Trust | ||||||||
| 260,000 | Series2017-MDRC-E | 258,063 | ||||||
| Citigroup Mortgage Loan Trust | ||||||||
| 132,051 | Series2019-IMC1-A1 | 132,544 | ||||||
| COLT Mortgage Loan Trust | ||||||||
| 124,556 | Series2018-3-A1 | 125,521 | ||||||
| Credit Suisse Mortgage Trust | ||||||||
| 160,717 | Series2018-RPL9-A1 | 167,856 | ||||||
| 480,000 | Series2018-SITE-C | 503,231 | ||||||
| Exantas Capital Corp. Ltd. | ||||||||
| 150,000 | Series2018-RSO6-B | 149,739 | ||||||
| Federal National Mortgage Association | ||||||||
| 250,000 | Series AN0285 | 249,346 | ||||||
| Finance of America Structured Securities Trust | ||||||||
| 370,000 | Series2018-HB1-M1 | 371,863 | ||||||
| Freddie Mac Military Housing Bonds Resecuritization Trust Certificates | ||||||||
| 2,873,512 | Series2015-R1-XA1 | 229,932 | ||||||
| GPMT Ltd. | ||||||||
| 200,000 | Series2018-FL1-C | 200,233 | ||||||
| HarborView Mortgage Loan Trust | ||||||||
| 356,357 | Series2006-12-2A2A | 339,903 | ||||||
| Homeward Opportunities Fund I Trust | ||||||||
| 261,752 | Series2019-2-A1 | 261,393 | ||||||
| JP Morgan Chase Commercial Mortgage Securities Trust | ||||||||
| 1,851,292 | Series2016-JP2-XA | 178,991 | ||||||
| JPMDB Commercial Mortgage Securities Trust | ||||||||
| 214,360 | Series2017-C5-XA | 11,906 | ||||||
The accompanying notes are an integral part of these financial statements.
| Schedule of Investments | 103 | |||||
Table of Contents
Litman Gregory Masters High Income Alternatives Fund
SCHEDULE OF INVESTMENTS IN SECURITIES at December 31, 2019 (Continued)
| Principal Amount^ | Value | |||||||
| MORTGAGE-BACKED SECURITIES (CONTINUED) | ||||||||
| LSTAR Securities Investment Ltd. | ||||||||
| $ 876,489 | Series2019-5-A1 | $ | 876,489 | |||||
| LSTAR Securities Investment Trust | ||||||||
| 310,701 | Series2019-1-A1 | 311,640 | ||||||
| New Residential Mortgage Loan Trust | ||||||||
| 92,257 | Series2019-RPL1-A1 | 92,811 | ||||||
| NRPL Trust | ||||||||
| 245,822 | Series2019-3A-A1 | 245,512 | ||||||
| Residential Accredit Loans, Inc. Trust | ||||||||
| 438,581 | Series2006-QO6-A1 | 170,937 | ||||||
| Station Place Securitization Trust | ||||||||
| 50,000 | Series2019-2-A | 50,135 | ||||||
| 200,000 | Series2019-8-A | 200,500 | ||||||
| 50,000 | Series2019-9-A | 50,000 | ||||||
| 150,000 | Series2019-WL1-B | 150,397 | ||||||
| Wells Fargo Commercial Mortgage Trust | ||||||||
| 964,202 | Series2016-BNK1-XA | 89,648 | ||||||
|
| |||||||
| | TOTAL MORTGAGE-BACKED SECURITIES | 7,105,277 | ||||||
|
| |||||||
| MUNICIPAL BOND: 0.0% | ||||||||
| Indiana: 0.0% | ||||||||
| Knox County Industry Economic Development Revenue | ||||||||
| 5,000 | Series B | 5,100 | ||||||
|
| |||||||
| | TOTAL MUNICIPAL BOND | 5,100 | ||||||
|
| |||||||
| SHORT-TERM INVESTMENTS: 5.9% | ||||||||
| CERTIFICATE OF DEPOSITS: 0.3% | ||||||||
| Credit Suisse AG | ||||||||
| 100,000 | 2.327%, 07/31/2020(e) | 100,000 | ||||||
| Lloyds Bank Corporate Markets Plc | ||||||||
| 100,000 | 2.261%, 08/05/2020(e) | 100,000 | ||||||
| Standard Chartered Bank | ||||||||
| Principal Amount^ | Value | |||||||
| $ 100,000 | 2.302%, 08/04/2020(e) | $ | 100,000 | |||||
|
| |||||||
| | TOTAL CERTIFICATE OF DEPOSITS | 300,000 | ||||||
|
| |||||||
| Shares | ||||||||
| MONEY MARKET FUND: 0.9% | ||||||||
| 848,134 | State Street Institutional Treasury Money Market Fund - Premier Class, 1.520%(k) | 848,134 | ||||||
|
| |||||||
| | TOTAL MONEY MARKET FUND | 848,134 | ||||||
|
| |||||||
| Principal Amount^ | ||||||||
| REPURCHASE AGREEMENTS: 3.7% | ||||||||
| $53,495 | Barclays Capital Plc 2.031%, 11/26/2019, due 02/03/2020 [collateral: par value $52,000, Cheniere Corpus Christi Holdings LLC, 5.125%, due 06/30/2027, value $57,720] (proceeds $53,703) | 53,495 | ||||||
| 250,000 | BNP Paribas 2.071%, 11/1/2019, due 02/03/2020 [collateral: par value $292,000, Santander Drive Auto Receivables Trust Series2018-2-E, 5.020%, due 09/15/2025, value $299,963] (proceeds $251,352) | 250,000 | ||||||
| 110,000 | BNP Paribas 2.100%, 12/16/2019, due 03/16/2020 [collateral: par value $657,000, Citigroup Mortgage Loan Trust Series2007-AMC2-A2, 1.850%, due 01/25/2037, value $130,591] (proceeds $110,584) | 110,000 | ||||||
| 11,000 | Deutsche Bank AG 2.284%, 11/8/2019, due 02/07/2020 [collateral: par value $14,000, HMH Trust Series2017-NSS-F, 8.481%, due 07/05/2031, value $11,342] (proceeds $11,064) | 11,000 | ||||||
| 212,000 | Deutsche Bank AG 2.284%, 11/13/2019, due 02/07/2020 [collateral: par value $291,000, Regatta II Funding L.P. Series2013-2A-DR2, 8.951%, due 01/15/2029, value $214,976] (proceeds $213,157) | 212,000 | ||||||
| 2,914,000 | Fixed Income Clearing Corp. 0.120%, 12/31/2019, due 01/02/2020 [collateral: par value $2,630,000, U.S. Treasury Bond, 3.000%, due 11/15/2045, value $2,976,882] (proceeds $2,914,019) | 2,914,000 | ||||||
|
| |||||||
The accompanying notes are an integral part of these financial statements.
| 104 | Litman Gregory Funds Trust | |||||
Table of Contents
Litman Gregory Masters High Income Alternatives Fund
SCHEDULE OF INVESTMENTS IN SECURITIES at December 31, 2019 (Continued)
| Principal Amount^ | Value | |||||||
| REPURCHASE AGREEMENTS (CONTINUED) | ||||||||
| | TOTAL REPURCHASE AGREEMENTS | $ | 3,550,495 | |||||
|
| |||||||
| TREASURY BILLS: 1.0% | ||||||||
| Mexico Cetes | ||||||||
| | 5,079,000 (MXN) | | 0.000%, 01/02/2020(h) | 269,156 | ||||
| | 6,920,000 (MXN) | | 0.000%, 02/27/2020(h) | 362,633 | ||||
| Portugal Treasury Bill | ||||||||
| | 284,000 (EUR) |
| 0.000%, 01/17/2020(h) | 318,896 | ||||
| United Kingdom Treasury Bill | ||||||||
| | 10,000 (GBP) |
| 0.000%, 01/13/2020(h) | 13,265 | ||||
| | 10,000 (GBP) |
| 0.000%, 01/27/2020(h) | 13,262 | ||||
| United States Treasury Bill | ||||||||
| 25,000 | 1.535%, 05/21/2020(i)(l) | 24,852 | ||||||
|
| |||||||
| | TOTAL TREASURY BILLS | 1,002,064 | ||||||
|
| |||||||
| | TOTAL SHORT-TERM INVESTMENTS | 5,700,693 | ||||||
|
| |||||||
| | TOTAL INTEREST RATE SWAPTIONS | 39,487 | ||||||
|
| |||||||
| | TOTAL INVESTMENTS | 94,071,585 | ||||||
|
| |||||||
| Other Assets in Excess of Liabilities: 1.2% | 1,161,335 | |||||||
|
| |||||||
NET ASSETS: 100.0% | $ | 95,232,920 | ||||||
|
| |||||||
Percentages are stated as a percent of net assets.
| CLO | Collateralized Loan Obligation |
| CMT | Constant Maturity Treasury Index |
| ETF | Exchange Traded Fund |
| LIBOR | London Interbank Offered Rate |
| L.P. | Limited Partnership |
| MLP | Master Limited Partnership |
| ^ | The principal amount is stated in U.S. Dollars unless otherwise indicated. |
| (a) | Variable rate security. Interest rate or distribution rate disclosed is that which is in effect at December 31, 2019. |
| (b) | Perpetual Call. |
| (c) | Security was purchased pursuant to Rule 144A under the Securities Act of 1933 and may be sold in transactions exempt from registration only to qualified institutional buyers or in a public offering registered under Securities Act of 1933. |
| (d) | Coupon increases periodically based upon a predetermined schedule. Stated interest rate in effect at December 31, 2019. |
| (e) | Floating Interest Rate at December 31, 2019. |
| (f) | Security is valued using significant unobservable inputs in good faith in accordance with procedures approved by the Board of Trustees. |
| (g) | This position represents an unsettled loan commitment at period end. Certain details associated with this purchase are not known prior to the settlement date, including coupon rate, which will be adjusted on settlement date. |
| (h) | Issued with a zero coupon. Income is recognized through the accretion of discount. |
| (i) | Securities with an aggregate fair value of $3,321,260 have been pledged as collateral for options, total return swaps, credit default swaps, interest rate swaps, and futures positions. |
| (j) | Interest Only security. Security with a notional or nominal principal amount. |
| (k) | The rate disclosed is the 7 day net yield as of December 31, 2019. |
| (l) | The rate shown representsyield-to-maturity. |
CURRENCY ABBREVIATIONS:
| BRL | Brazilian Real |
| EUR | Euro |
| GBP | British Pound |
| ILS | Israeli New Shekel |
| MXN | Mexican Peso |
| USD | U.S. Dollar |
UNFUNDED LOAN COMMITMENTS — At December 31, 2019, the Fund had unfunded loan commitments which could be extended at the option of the borrowers, pursuant to the following agreements:
| Borrower | Principal Amount | Current Value | Unrealized Gain (Loss) | |||||||||
BCPE Empire Holdings, Inc., 4.228%, 06/11/2026 | $ | 14,367 | $ | 14,425 | $ | 58 | ||||||
The accompanying notes are an integral part of these financial statements.
| Schedule of Investments | 105 | |||||
Table of Contents
Litman Gregory Masters High Income Alternatives Fund
SCHEDULE OF PURCHASED OPTIONS at December 31, 2019
| Description | Counterparty | Exercise Price | Expiration Date | Number of Contracts | Notional Amount | Market Value | Premiums Paid | Unrealized Appreciation/ (Depreciation) | ||||||||||||||||||||||||
INTEREST RATE SWAPTIONS |
| |||||||||||||||||||||||||||||||
Call | ||||||||||||||||||||||||||||||||
Two Year Ten Year USD Constant Maturity Swaption | Bank of America N.A. | 0.40 | 7/29/2022 | 11,000,000 | $ | 11,000,000 | $ | 16,850 | $ | 25,410 | $ | (8,560 | ) | |||||||||||||||||||
Two Year Ten Year USD Constant Maturity Swaption | | Goldman Sachs International | | 0.40 | 7/29/2022 | 2,000,000 | 2,000,000 | 3,064 | 4,540 | (1,476 | ) | |||||||||||||||||||||
Two Year Ten Year USD Constant Maturity Swaption | | Goldman Sachs International | | 0.61 | 7/29/2022 | 7,000,000 | 7,000,000 | 5,787 | 10,150 | (4,363 | ) | |||||||||||||||||||||
Two Year Ten Year USD Constant Maturity Swaption | Morgan Stanley & Co. | 0.40 | 7/29/2022 | 9,000,000 | 9,000,000 | 13,786 | 21,600 | (7,814 | ) | |||||||||||||||||||||||
|
| |||||||||||||||||||||||||||||||
Total Purchased Options | $ | 39,487 | $ | 61,700 | $ | (22,213 | ) | |||||||||||||||||||||||||
|
| |||||||||||||||||||||||||||||||
The accompanying notes are an integral part of these financial statements.
| 106 | �� | Litman Gregory Funds Trust | ||||
Table of Contents
Litman Gregory Masters High Income Alternatives Fund
SCHEDULE OF FORWARD FOREIGN CURRENCY EXCHANGE CONTRACTS at December 31, 2019
At December 31, 2019, the Fund had the following forward foreign currency exchange contracts:
| Asset Derivatives | Liability Derivatives | |||||||||||||||||||||||
| Counterparty | Settlement Date | Fund Receiving | U.S. $ Value at December 31, 2019 | Fund Delivering | U.S. $ Value at December 31, 2019 | Unrealized Appreciation | Unrealized Depreciation | |||||||||||||||||
Bank of America N.A. | 1/17/2020 | USD | $ | 159,985 | EUR | $ | 161,804 | $ | — | $ | (1,819 | ) | ||||||||||||
| 1/31/2020 | USD | 4,747 | ILS | 4,799 | — | (52 | ) | |||||||||||||||||
| 4/30/2020 | USD | 292 | ILS | 292 | — | — | ||||||||||||||||||
| 6/15/2020 | USD | 67,489 | EUR | 66,560 | 929 | — | ||||||||||||||||||
| 2/1/2021 | USD | 4,821 | ILS | 4,887 | — | (66 | ) | |||||||||||||||||
| 4/30/2021 | USD | 29,953 | ILS | 30,048 | — | (95 | ) | |||||||||||||||||
| 1/31/2022 | USD | 93,834 | ILS | 95,452 | — | (1,618 | ) | |||||||||||||||||
Barclays Bank Plc | 1/17/2020 | USD | 155,616 | EUR | 157,309 | — | (1,693 | ) | ||||||||||||||||
| 4/8/2020 | USD | 44,420 | MXN | 44,950 | — | (530 | ) | |||||||||||||||||
Citibank N.A. | 1/2/2020 | USD | 37,110 | MXN | 38,648 | — | (1,538 | ) | ||||||||||||||||
| 1/13/2020 | USD | 12,937 | GBP | 13,273 | — | (336 | ) | |||||||||||||||||
| 1/27/2020 | USD | 12,967 | GBP | 13,278 | — | (311 | ) | |||||||||||||||||
| 2/27/2020 | USD | 37,409 | MXN | 37,859 | — | (450 | ) | |||||||||||||||||
| 4/23/2020 | USD | 43,772 | MXN | 44,330 | — | (558 | ) | |||||||||||||||||
| 4/30/2020 | USD | 3,981 | ILS | 3,977 | 4 | — | ||||||||||||||||||
| 7/1/2020 | USD | 495,761 | BRL | 493,101 | 2,660 | — | ||||||||||||||||||
| 4/30/2021 | USD | 406,848 | ILS | 408,654 | — | (1,806 | ) | |||||||||||||||||
Goldman Sachs International | 1/2/2020 | BRL | 546,896 | USD | 531,234 | 15,662 | — | |||||||||||||||||
| 1/2/2020 | USD | 545,811 | BRL | 546,896 | — | (1,085 | ) | |||||||||||||||||
| 1/2/2020 | USD | 109,616 | MXN | 113,983 | — | (4,367 | ) | |||||||||||||||||
| 1/2/2020 | USD | 112,054 | MXN | 116,633 | — | (4,579 | ) | |||||||||||||||||
| 1/16/2020 | MXN | 55,033 | USD | 54,674 | 359 | — | ||||||||||||||||||
| 1/16/2020 | USD | 52,838 | MXN | 55,033 | — | (2,195 | ) | |||||||||||||||||
| 1/31/2020 | USD | 2,906 | ILS | 2,901 | 5 | — | ||||||||||||||||||
| 1/31/2020 | USD | 501 | ILS | 508 | — | (7 | ) | |||||||||||||||||
| 1/31/2020 | USD | 6,150 | ILS | 6,222 | — | (72 | ) | |||||||||||||||||
| 2/6/2020 | MXN | 540,663 | USD | 537,381 | 3,282 | — | ||||||||||||||||||
| 2/27/2020 | USD | 312,651 | MXN | 326,006 | — | (13,355 | ) | |||||||||||||||||
| 4/8/2020 | MXN | 44,950 | USD | 44,728 | 222 | — | ||||||||||||||||||
| 4/23/2020 | MXN | 44,330 | USD | 44,084 | 246 | — | ||||||||||||||||||
| 4/30/2020 | USD | 298,168 | EUR | 294,043 | 4,125 | — | ||||||||||||||||||
| 4/30/2020 | USD | 926 | ILS | 936 | — | (10 | ) | |||||||||||||||||
| 4/30/2020 | USD | 951 | ILS | 965 | — | (14 | ) | |||||||||||||||||
| 6/15/2020 | USD | 60,290 | EUR | 59,429 | 861 | — | ||||||||||||||||||
| 7/30/2020 | USD | 1,449 | EUR | 1,450 | — | (1 | ) | |||||||||||||||||
| 2/1/2021 | USD | 6,281 | ILS | 6,370 | — | (89 | ) | |||||||||||||||||
| 2/1/2021 | USD | 102,448 | ILS | 104,182 | — | (1,734 | ) | |||||||||||||||||
| 2/1/2021 | USD | 593,208 | ILS | 595,327 | — | (2,119 | ) | |||||||||||||||||
| 4/30/2021 | USD | 94,794 | ILS | 96,154 | — | (1,360 | ) | |||||||||||||||||
| 4/30/2021 | USD | 97,471 | ILS | 99,159 | — | (1,688 | ) | |||||||||||||||||
| 7/30/2021 | USD | 198,958 | EUR | 198,948 | 10 | — | ||||||||||||||||||
| 1/31/2022 | USD | 121,980 | ILS | 124,087 | — | (2,107 | ) | |||||||||||||||||
JPMorgan Chase Bank N.A. | 1/2/2020 | BRL | 845,204 | USD | 843,526 | 1,678 | — | |||||||||||||||||
| 1/2/2020 | USD | 890,518 | BRL | 845,203 | 45,315 | — | ||||||||||||||||||
| 6/15/2020 | EUR | 125,990 | USD | 125,048 | 942 | — | ||||||||||||||||||
| 7/30/2020 | USD | 1,525 | EUR | 1,535 | — | (10 | ) | |||||||||||||||||
| 7/1/2021 | USD | 95,023 | BRL | 95,782 | — | (759 | ) | |||||||||||||||||
| 7/30/2021 | USD | 209,309 | EUR | 210,651 | — | (1,342 | ) | |||||||||||||||||
Morgan Stanley & Co. | 1/2/2020 | BRL | 298,307 | USD | 288,247 | 10,060 | — | |||||||||||||||||
| 1/2/2020 | USD | 297,715 | BRL | 298,307 | — | (592 | ) | |||||||||||||||||
| 2/6/2020 | USD | 529,087 | MXN | 540,663 | — | (11,576 | ) | |||||||||||||||||
| 4/1/2020 | USD | 53,985 | BRL | 54,480 | — | (495 | ) | |||||||||||||||||
| 4/1/2020 | USD | 44,069 | BRL | 44,575 | — | (506 | ) | |||||||||||||||||
|
|
|
|
|
|
|
|
| ||||||||||||||||
| $ | 8,953,997 | $ | 8,928,571 | $ | 86,360 | $ | (60,934 | ) | ||||||||||||||||
|
|
|
|
|
|
|
|
| ||||||||||||||||
The accompanying notes are an integral part of these financial statements.
| Schedule of Investments | 107 | |||||
Table of Contents
Litman Gregory Masters High Income Alternatives Fund
SCHEDULE OF FINANCIAL FUTURES CONTRACTS at December 31, 2019
| Description | Number of Contracts | Notional Amount | Notional Value | Expiration Date | Unrealized Appreciation/ (Depreciation) | |||||||||||||||
Futures Contracts — Long |
| |||||||||||||||||||
Ultra 10YR U.S. Treasury Notes | 3 | $ | 300,000 | $ | 422,110 | 3/20/2020 | $ | (5,258 | ) | |||||||||||
|
| |||||||||||||||||||
Total Long | $ | (5,258 | ) | |||||||||||||||||
|
| |||||||||||||||||||
Futures Contracts — Short |
| |||||||||||||||||||
10YR U.S. Treasury Notes | (3 | ) | $ | (300,000 | ) | $ | (385,266 | ) | 3/20/2020 | $ | 3,368 | |||||||||
|
| |||||||||||||||||||
Total Short | $ | 3,368 | ||||||||||||||||||
|
| |||||||||||||||||||
Total Futures Contracts | $ | (1,890 | ) | |||||||||||||||||
|
| |||||||||||||||||||
SCHEDULE OF SWAPS at December 31, 2019
CENTRALLY CLEARED INTEREST RATE SWAP CONTRACTS
| Rates Exchanged | ||||||||||||||||||||||||||
| Notional Amount | Maturity Date | Payment Received | Payment Made | Periodic Payment Frequency | Fair Value | Upfront Payment Made (Received) | Unrealized Appreciation/ (Depreciation) | |||||||||||||||||||
$ 2,600,000 | 11/06/2021 | 3 Month LIBOR | 3.144 | % | Quarterly | $ | (68,629 | ) | $ | 965 | $ | (69,594 | ) | |||||||||||||
$ 350,000 | 11/07/2023 | 3 Month LIBOR | 3.180 | Quarterly | (19,276 | ) | 80 | (19,356 | ) | |||||||||||||||||
|
|
|
|
|
| |||||||||||||||||||||
| $ | (87,905 | ) | $ | 1,045 | $ | (88,950 | ) | |||||||||||||||||||
|
|
|
|
|
| |||||||||||||||||||||
CENTRALLY CLEARED CREDIT DEFAULT SWAP CONTRACTS (1)(2)(3)
| Description | Maturity Date | Fixed Deal (Pay) Rate | Implied Credit Spread at December 31, 2019 | Notional Amount | Periodic Payment Frequency | Fair Value | Upfront Premiums Paid / (Received) | Unrealized Depreciation | ||||||||||||||||||||||||
Buy Protection |
| |||||||||||||||||||||||||||||||
CDX North American Investment Grade Index Series 31 | 12/20/2023 | (1.000 | %) | 0.350 | % | $ | (4,605,000 | ) | Quarterly | $ | (116,165 | ) | $ | (54,518 | ) | $ | (61,647 | ) | ||||||||||||||
|
|
|
|
|
| |||||||||||||||||||||||||||
Total Buy Protection |
| $ | (116,165 | ) | $ | (54,518 | ) | $ | (61,647 | ) | ||||||||||||||||||||||
|
|
|
|
|
| |||||||||||||||||||||||||||
| (1) | For centrally cleared swaps, when a credit event occurs as defined under the terms of the swap contract, the Fund as a seller of credit protection will either (i) pay a net amount equal to the par value of the defaulted reference entity and deliver the reference entity or (ii) pay a net amount equal to the par value of the defaulted reference entity less its recovery value. |
| (2) | For centrally cleared swaps, implied credit spread, represented in absolute terms, utilized in determining the fair value of the credit default swap contracts as of period will serve as an indicator of the payment/ performance risk and represent the likelihood of risk of default for the credit derivative. The implied credit spread of a referenced entity reflects the cost of buying/ selling protection and may include upfront payments required to be made to enter into the contract. Generally, wider credit spreads represent a perceived deterioration of the referenced entity’s credit soundness and a greater likelihood or risk of default or other credit event occurring as defined under the terms of the swap contract. |
| (3) | For centrally cleared swaps, the notional amount represents the maximum potential the Fund may receive as a buyer of credit protection if a credit event occurs, as defined under the terms of the swap contract, for each security included in the CDX North America Investment Grade Index Series 31. |
The accompanying notes are an integral part of these financial statements.
| 108 | Litman Gregory Funds Trust | |||||
Table of Contents
Litman Gregory Masters High Income Alternatives Fund
SCHEDULE OF SWAPS at December 31, 2019 (Continued)
| OVER THE COUNTER CREDIT DEFAULT SWAP CONTRACTS | ||||||||||||||||||||||||||||||||
| Description | Maturity Date | Counterparty | Fixed Deal (Pay) Rate | Implied Credit Spread at December 31, 2019 | Notional Amount | Periodic Payment Frequency | Fair Value | Upfront Premiums Paid / (Received) | Unrealized Depreciation | |||||||||||||||||||||||
Buy Protection |
| |||||||||||||||||||||||||||||||
CDX North American Investment Grade Index Series 31 | 12/20/2023 | Goldman Sachs International | (1.000 | %) | 0.350 | % | $ | (540,000 | ) | Quarterly | $ | (13,644 | ) | $ | (723 | ) | $ | (12,921 | ) | |||||||||||||
CDX North American Investment Grade Index Series 31 | 12/20/2023 | Morgan Stanley & Co. | (1.000 | %) | 0.350 | % | (240,000 | ) | Quarterly | (6,063 | ) | (20 | ) | (6,043 | ) | |||||||||||||||||
|
| |||||||||||||||||||||||||||||||
Total Buy Protection |
| $ | (19,707 | ) | $ | (743 | ) | $ | (18,964 | ) | ||||||||||||||||||||||
|
| |||||||||||||||||||||||||||||||
Total | $ | (19,707 | ) | $ | (743 | ) | $ | (18,964 | ) | |||||||||||||||||||||||
|
| |||||||||||||||||||||||||||||||
| OVER THE COUNTER TOTAL RETURN SWAP CONTRACTS | ||||||||||||||||||||||||||||
| Referenced Obligation | Maturity Date | Counterparty | Fund Pays/Receives Floating Rate | Floating Rate Index and Spread | Notional Amount | Periodic Payment Frequency | Fair Value | Upfront Premiums Paid (Received) | Unrealized (Depreciation) | |||||||||||||||||||
iShares Core Total U.S. Aggregate | 1/9/2020 | JPMorgan Chase Bank N.A. | Receives | 1 Month USD LIBOR + 0.800% | $ | 140,725 | Monthly | $ | 263 | $ | — | $ | 263 | |||||||||||||||
iShares Core Total U.S. Aggregate | 1/17/2020 | JPMorgan Chase Bank N.A. | Receives | 1 Month USD LIBOR + 0.920% | 298,364 | Monthly | 583 | — | 583 | |||||||||||||||||||
iShares Core Total U.S. Aggregate | 1/19/2020 | JPMorgan Chase Bank N.A. | Receives | 1 Month USD LIBOR + 1.000% | 533,425 | Monthly | (333 | ) | — | (333 | ) | |||||||||||||||||
iShares Core Total U.S. Aggregate | 1/23/2020 | JPMorgan Chase Bank N.A. | Receives | 1 Month USD LIBOR + 1.000% | 56,185 | Monthly | — | — | — | |||||||||||||||||||
|
| |||||||||||||||||||||||||||
Total |
| $ | 513 | $ | — | $ | 513 | |||||||||||||||||||||
|
| |||||||||||||||||||||||||||
The accompanying notes are an integral part of these financial statements.
| Schedule of Investments | 109 | |||||
Table of Contents
Litman Gregory Masters High Income Alternatives Fund
SCHEDULE OF WRITTEN OPTIONS at December 31, 2019
| Description | Counterparty | Exercise Price | Expiration Date | Number of Contracts | Notional Amount | Market Value | Premiums Received | Unrealized Appreciation/ (Depreciation) | ||||||||||||||||||||||||
INDEX OPTIONS |
| |||||||||||||||||||||||||||||||
Put |
| |||||||||||||||||||||||||||||||
Russell 2000 Index | UBS Securities LLC | $ | 1,625.00 | 1/3/2020 | (1 | ) | $ | (166,847 | ) | $ | (82 | ) | $ | (400 | ) | $ | 318 | |||||||||||||||
Russell 2000 Index | UBS Securities LLC | 1,595.00 | 1/10/2020 | (4 | ) | (667,388 | ) | (844 | ) | (6,608 | ) | 5,764 | ||||||||||||||||||||
Russell 2000 Index | UBS Securities LLC | 1,600.00 | 1/10/2020 | (1 | ) | (166,847 | ) | (236 | ) | (1,719 | ) | 1,483 | ||||||||||||||||||||
Russell 2000 Index | UBS Securities LLC | 1,600.00 | 1/17/2020 | (1 | ) | (166,847 | ) | (475 | ) | (1,590 | ) | 1,115 | ||||||||||||||||||||
Russell 2000 Index | UBS Securities LLC | 1,605.00 | 1/17/2020 | (1 | ) | (166,847 | ) | (546 | ) | (1,750 | ) | 1,204 | ||||||||||||||||||||
Russell 2000 Index | UBS Securities LLC | 1,615.00 | 1/17/2020 | (2 | ) | (333,694 | ) | (1,200 | ) | (2,379 | ) | 1,179 | ||||||||||||||||||||
Russell 2000 Index | UBS Securities LLC | 1,620.00 | 1/24/2020 | (2 | ) | (333,694 | ) | (2,104 | ) | (2,599 | ) | 495 | ||||||||||||||||||||
Russell 2000 Index | UBS Securities LLC | 1,635.00 | 1/24/2020 | (3 | ) | (500,541 | ) | (3,543 | ) | (3,748 | ) | 205 | ||||||||||||||||||||
Russell 2000 Index | UBS Securities LLC | 1,635.00 | 1/31/2020 | (3 | ) | (500,541 | ) | (4,890 | ) | (4,658 | ) | (232 | ) | |||||||||||||||||||
S&P 500 Index | UBS Securities LLC | 3,145.00 | 1/3/2020 | (3 | ) | (969,234 | ) | (396 | ) | (1,528 | ) | 1,132 | ||||||||||||||||||||
S&P 500 Index | UBS Securities LLC | 3,070.00 | 1/10/2020 | (5 | ) | (1,615,390 | ) | (1,550 | ) | (12,496 | ) | 10,946 | ||||||||||||||||||||
S&P 500 Index | UBS Securities LLC | 3,155.00 | 1/10/2020 | (2 | ) | (646,156 | ) | (1,380 | ) | (1,479 | ) | 99 | ||||||||||||||||||||
S&P 500 Index | UBS Securities LLC | 3,165.00 | 1/10/2020 | (6 | ) | (1,938,468 | ) | (5,124 | ) | (4,617 | ) | (507 | ) | |||||||||||||||||||
S&P 500 Index | UBS Securities LLC | 3,090.00 | 1/17/2020 | (2 | ) | (646,156 | ) | (1,320 | ) | (4,349 | ) | 3,029 | ||||||||||||||||||||
S&P 500 Index | UBS Securities LLC | 3,115.00 | 1/17/2020 | (11 | ) | (3,553,858 | ) | (9,460 | ) | (16,729 | ) | 7,269 | ||||||||||||||||||||
S&P 500 Index | UBS Securities LLC | 3,115.00 | 1/24/2020 | (5 | ) | (1,615,390 | ) | (8,300 | ) | (9,610 | ) | 1,310 | ||||||||||||||||||||
S&P 500 Index | UBS Securities LLC | 3,120.00 | 1/24/2020 | (3 | ) | (969,234 | ) | (3,765 | ) | (5,804 | ) | 2,039 | ||||||||||||||||||||
S&P 500 Index | UBS Securities LLC | 3,125.00 | 1/24/2020 | (2 | ) | (646,156 | ) | (2,860 | ) | (3,758 | ) | 898 | ||||||||||||||||||||
S&P 500 Index | UBS Securities LLC | 3,145.00 | 1/24/2020 | (1 | ) | (323,078 | ) | (2,140 | ) | (1,868 | ) | (272 | ) | |||||||||||||||||||
S&P 500 Index | UBS Securities LLC | 3,150.00 | 1/24/2020 | (2 | ) | (646,156 | ) | (3,518 | ) | (3,643 | ) | 125 | ||||||||||||||||||||
S&P 500 Index | UBS Securities LLC | 3,145.00 | 1/31/2020 | (2 | ) | (646,156 | ) | (4,688 | ) | (4,539 | ) | (149 | ) | |||||||||||||||||||
S&P 500 Index | UBS Securities LLC | 3,150.00 | 1/31/2020 | (2 | ) | (646,156 | ) | (4,400 | ) | (4,633 | ) | 233 | ||||||||||||||||||||
S&P 500 Index | UBS Securities LLC | 3,155.00 | 1/31/2020 | (1 | ) | (323,078 | ) | (2,598 | ) | (2,099 | ) | (499 | ) | |||||||||||||||||||
S&P 500 Index | UBS Securities LLC | 3,165.00 | 1/31/2020 | (4 | ) | (1,292,312 | ) | (10,400 | ) | (9,118 | ) | (1,282 | ) | |||||||||||||||||||
|
| |||||||||||||||||||||||||||||||
Total Written Options | $ | (75,819 | ) | $ | (111,721 | ) | $ | 35,902 | ||||||||||||||||||||||||
|
| |||||||||||||||||||||||||||||||
The accompanying notes are an integral part of these financial statements.
| 110 | Litman Gregory Funds Trust | |||||
Table of Contents
Litman Gregory Funds Trust
EXPENSE EXAMPLES – (Unaudited)
As a shareholder of the Funds, you incur two types of costs: (1) transaction costs and (2) ongoing costs, including advisory fees, and other fund expenses. The examples below are intended to help you understand your ongoing costs (in dollars) of investing in the Funds and to compare these costs with the ongoing costs of investing in other mutual funds.
The examples are based on an investment of $1,000 invested at the beginning of the period shown and held for the entire period from July 1, 2019 to December 31, 2019.
Actual Expenses
For each Fund, the first line of the table below provides information about actual account values and actual expenses. You may use the information in this line, together with the amount you invested, to estimate the expenses that you paid over the period. Simply divide your account value by $1,000 (for example, an $8,600 account value divided by $1,000 = 8.6), then multiply the result by the number in the first line under the heading entitled “Expenses Paid During Period” to estimate the expenses you paid on your account during this period.
Hypothetical Example for Comparison Purposes
For each Fund, the second line of the table below provides information about hypothetical account values and hypothetical expenses based on the Fund’s actual expense ratio and an assumed rate of return of 5% per year before expenses, which is not the Fund’s actual return. The hypothetical account values and expenses may not be used to estimate the actual ending account balance or expenses you paid for the period. You may use this information to compare the ongoing costs of investing in the Fund and other funds. To do so, compare this 5% hypothetical example with the 5% hypothetical examples that appear in the shareholder reports of the other funds.
| Beginning Account Value (7/1/19) | Ending Account Value (12/31/19) | Expenses Paid During Period* (7/1/19 to 12/31/19) | Expenses Ratio During Period* (7/1/19 to 12/31/19) | |||||||||||||
Litman Gregory Masters Equity Fund – Institutional Actual | $ | 1,000.00 | $ | 1,070.90 | $ | 6.47 | 1.24% | |||||||||
Litman Gregory Masters Equity Fund – Institutional Hypothetical - (5% return before expenses) | $ | 1,000.00 | $ | 1,018.95 | $ | 6.31 | 1.24% | |||||||||
Litman Gregory Masters International Fund – Institutional Actual | $ | 1,000.00 | $ | 1,104.80 | $ | 5.73 | 1.08% | |||||||||
Litman Gregory Masters International Fund – Institutional Hypothetical - (5% return before expenses) | $ | 1,000.00 | $ | 1,019.76 | $ | 5.50 | 1.08% | |||||||||
Litman Gregory Masters Smaller Companies Fund – Institutional Actual | $ | 1,000.00 | $ | 1,019.80 | $ | 7.69 | 1.51% | |||||||||
Litman Gregory Masters Smaller Companies Fund – Institutional Hypothetical – (5% return before expenses) | $ | 1,000.00 | $ | 1,017.59 | $ | 7.68 | 1.51% | |||||||||
Litman Gregory Masters Alternative Strategies Fund – Institutional Actual | $ | 1,000.00 | $ | 1,025.30 | $ | 7.45 | 1.46% | |||||||||
Litman Gregory Masters Alternative Strategies Fund – Investor Actual | $ | 1,000.00 | $ | 1,023.70 | $ | 8.72 | 1.71% | |||||||||
Litman Gregory Masters Alternative Strategies Fund – Institutional Hypothetical - (5% return before expenses) | $ | 1,000.00 | $ | 1,017.84 | $ | 7.43 | 1.46% | |||||||||
Litman Gregory Masters Alternative Strategies Fund – InvestorHypothetical - (5% return before expenses) | $ | 1,000.00 | $ | 1,016.58 | $ | 8.69 | 1.71% | |||||||||
Litman Gregory Masters High Income Alternatives Fund – Institutional Actual | $ | 1,000.00 | $ | 1,025.30 | $ | 5.00 | 0.98% | |||||||||
Litman Gregory Masters High Income Alternatives Fund – Investor Actual | $ | 1,000.00 | $ | 1,024.60 | $ | 6.28 | 1.23% | |||||||||
Litman Gregory Masters High Income Alternatives Fund – Institutional Hypothetical - (5% return before expenses) | $ | 1,000.00 | $ | 1,020.26 | $ | 4.99 | 0.98% | |||||||||
Litman Gregory Masters High Income Alternatives Fund – Investor Hypothetical - (5% return before expenses) | $ | 1,000.00 | $ | 1,019.00 | $ | 6.26 | 1.23% | |||||||||
* Expenses are equal to the Funds’ annualized expense ratio as indicated, multiplied by the average account value over the period, multiplied by the number of days in most recent fiscal half-year period (184), then divided by the number of days in the fiscal year (365) (to reflect theone-half-year period).
| Expense Examples | 111 | |||||
Table of Contents
Litman Gregory Funds Trust
STATEMENTS OF ASSETS AND LIABILITIES at December 31, 2019
| Equity Fund | International Fund | Smaller Companies Fund | Alternative Fund | High Income Alternatives Fund | ||||||||||||||||
ASSETS: | ||||||||||||||||||||
Investments in securities at cost | $ | 177,482,129 | $ | 343,027,193 | $ | 24,214,080 | $ | 1,576,896,239 | $ | 89,709,468 | ||||||||||
Repurchase agreements at cost | 12,612,000 | 12,670,000 | 3,215,000 | 170,800,000 | 3,550,495 | |||||||||||||||
|
|
|
|
|
|
|
|
|
| |||||||||||
Total investments at cost | $ | 190,094,129 | $ | 355,697,193 | $ | 27,429,080 | $ | 1,747,696,239 | $ | 93,259,963 | ||||||||||
|
|
|
|
|
|
|
|
|
| |||||||||||
Investments in securities at value | $ | 273,253,492 | $ | 388,933,871 | $ | 25,497,432 | $ | 1,674,398,818 | $ | 90,521,090 | ||||||||||
Repurchase agreements at value | 12,612,000 | 12,670,000 | 3,215,000 | 170,800,000 | 3,550,495 | |||||||||||||||
|
|
|
|
|
|
|
|
|
| |||||||||||
Total investments at value | $ | 285,865,492 | $ | 401,603,871 | $ | 28,712,432 | $ | 1,845,198,818 | $ | 94,071,585 | ||||||||||
|
|
|
|
|
|
|
|
|
| |||||||||||
Cash | 3,204 | 1,732 | 2,397 | — | 59,207 | |||||||||||||||
Cash, denominated in foreign currency | 313,640 | 17,415 | — | 10,080,958 | — | |||||||||||||||
Deposits at brokers for securities sold short | — | — | — | 43,214,320 | — | |||||||||||||||
Deposits at brokers for futures | — | — | — | 425,000 | 2,387 | |||||||||||||||
Deposits at brokers for written options | — | — | — | 3,282,472 | — | |||||||||||||||
Deposits at brokers for swaps | — | — | — | 7,298,190 | — | |||||||||||||||
Receivables: |
| |||||||||||||||||||
Securities sold | 500,372 | 351,678 | 30,971 | 12,960,321 | 148,077 | |||||||||||||||
Dividends and interest | 90,272 | 170,947 | 1,621 | 9,944,236 | 476,796 | |||||||||||||||
Fund shares sold | 3,549 | 36,940 | 817 | 6,360,342 | 606,596 | |||||||||||||||
Foreign tax reclaims | 67,049 | 844,278 | — | 153,993 | — | |||||||||||||||
Dividend and interest for swap resets | — | — | — | 152,605 | 925 | |||||||||||||||
Other Receivables | — | — | — | 7,309,028 | * | — | ||||||||||||||
Variation margin - Centrally Cleared Swaps | — | — | — | 50,125 | 1,290 | |||||||||||||||
Variation margin - Futures | — | — | — | 80,362 | — | |||||||||||||||
Net swap premiums paid | — | — | — | 3,918,965 | — | |||||||||||||||
Unrealized gain on unfunded loan commitment | — | — | — | 1,460 | 58 | |||||||||||||||
Unrealized gain on forward foreign currency exchange contracts | — | — | — | 397,435 | 86,360 | |||||||||||||||
Unrealized gain on swaps | — | — | — | 950,907 | 846 | |||||||||||||||
Prepaid expenses | 16,926 | 16,789 | 8,902 | 40,481 | 53,729 | |||||||||||||||
|
|
|
|
|
|
|
|
|
| |||||||||||
Total Assets | 286,860,504 | 403,043,650 | 28,757,140 | 1,951,820,018 | 95,507,856 | |||||||||||||||
|
|
|
|
|
|
|
|
|
| |||||||||||
LIABILITIES: | ||||||||||||||||||||
Written options (premium received, $0, $0, $0, $21,440 and $111,721, respectively) | — | — | — | 19,430 | 75,819 | |||||||||||||||
Securities sold short (proceeds, $0, $0, $0, $51,893,859 and $0, respectively) | — | — | — | 57,751,169 | — | |||||||||||||||
Deposits received from brokers for swaps | — | — | — | 3,000,000 | 6,800 | |||||||||||||||
Payables: |
| |||||||||||||||||||
Advisory fees | 243,752 | 303,764 | 17,815 | 1,766,492 | 27,333 | |||||||||||||||
Securities purchased | — | 242,959 | 14,068 | 12,675,529 | 8,800 | |||||||||||||||
Fund shares redeemed | 215,914 | 36,196 | — | 643,650 | — | |||||||||||||||
Foreign taxes withheld | — | 12,660 | — | — | — | |||||||||||||||
Trustees fees | 619 | 619 | 619 | 619 | 2 | |||||||||||||||
Professional fees | 22,882 | 28,025 | 13,556 | 110,570 | 25,554 | |||||||||||||||
Custodian | — | — | — | 4,105,228 | — | |||||||||||||||
Line of credit interest | 2,472 | 761 | — | — | — | |||||||||||||||
Dividend and interest for swap resets | — | — | — | 13,501 | 260 | |||||||||||||||
Variation margin - Futures | — | — | — | 16,373 | 203 | |||||||||||||||
Due to brokers for swaps | — | — | — | 828,210 | — | |||||||||||||||
Short dividend | — | — | — | 37,452 | — | |||||||||||||||
Chief Compliance Officer fees | 13,648 | 13,648 | 13,648 | 13,648 | 13,648 | |||||||||||||||
Net swap premiums received | — | — | — | — | 743 | |||||||||||||||
Unrealized loss on forward foreign currency exchange contracts | — | 796,842 | — | 1,010,929 | 60,934 | |||||||||||||||
Unrealized loss on swaps | — | — | — | 1,071,322 | 19,297 | |||||||||||||||
Distribution fees payable for investor class (see Note 4) | — | — | — | 30,601 | 297 | |||||||||||||||
Accrued other expenses | 62,445 | 137,641 | 3,040 | 407,841 | 35,246 | |||||||||||||||
|
|
|
|
|
|
|
|
|
| |||||||||||
Total Liabilities | 561,732 | 1,573,115 | 62,746 | 83,502,564 | 274,936 | |||||||||||||||
|
|
|
|
|
|
|
|
|
| |||||||||||
Commitments and Contingencies for Private Equity (See Note 8) | ||||||||||||||||||||
NET ASSETS | $ | 286,298,772 | $ | 401,470,535 | $ | 28,694,394 | $ | 1,868,317,454 | $ | 95,232,920 | ||||||||||
|
|
|
|
|
|
|
|
|
| |||||||||||
The accompanying notes are an integral part of these financial statements.
| 112 | Litman Gregory Funds Trust | |||||
Table of Contents
Litman Gregory Funds Trust
STATEMENTS OF ASSETS AND LIABILITIES at December 31, 2019 – (Continued)
| Equity Fund | International Fund | Smaller Companies Fund | Alternative Fund | High Income Alternatives Fund | ||||||||||||||||
Institutional Class: | ||||||||||||||||||||
Net Assets | $ | 286,298,772 | $ | 401,470,535 | $ | 28,694,394 | $ | 1,724,256,797 | $ | 93,832,285 | ||||||||||
Number of shares issued and outstanding (unlimited number of shares authorized, $0.01 par value) | 16,318,790 | 22,742,551 | 1,211,161 | 147,407,140 | 9,325,996 | |||||||||||||||
Net asset value, offering price and redemption price per share | $ | 17.54 | $ | 17.65 | $ | 23.69 | $ | 11.70 | $ | 10.06 | ||||||||||
|
|
|
|
|
|
|
|
|
| |||||||||||
Investor Class: | ||||||||||||||||||||
Net Assets | $ | — | $ | — | $ | — | $ | 144,060,657 | $ | 1,400,635 | ||||||||||
Number of shares issued and outstanding (unlimited number of shares authorized, $0.01 par value) | — | — | — | 12,298,380 | 139,127 | |||||||||||||||
Net asset value, offering price and redemption price per share | $ | — | $ | — | $ | — | $ | 11.71 | $ | 10.07 | ||||||||||
|
|
|
|
|
|
|
|
|
| |||||||||||
COMPONENTS OF NET ASSETS | ||||||||||||||||||||
Paid-in capital | $ | 183,639,276 | $ | 393,374,010 | $ | 27,445,865 | $ | 1,805,627,820 | $ | 94,330,602 | ||||||||||
Accumulated distributable earnings | 102,659,496 | 8,096,525 | 1,248,529 | 62,689,634 | 902,318 | |||||||||||||||
|
|
|
|
|
|
|
|
|
| |||||||||||
Net assets | $ | 286,298,772 | $ | 401,470,535 | $ | 28,694,394 | $ | 1,868,317,454 | $ | 95,232,920 | ||||||||||
|
|
|
|
|
|
|
|
|
| |||||||||||
| * | Other receivables include receivables from mergers and litigation settlements related to securities held during the year. |
The accompanying notes are an integral part of these financial statements.
| Statements of Assets and Liabilities | 113 | |||||
Table of Contents
Litman Gregory Funds Trust
STATEMENTS OF OPERATIONS For the Year Ended December 31, 2019
| Equity Fund | International Fund | Smaller Companies Fund | Alternative Strategies Fund | High Income Alternatives Fund | ||||||||||||||||
INVESTMENT INCOME: | ||||||||||||||||||||
Income |
| |||||||||||||||||||
Dividends (net of foreign taxes withheld of $37,841, $1,043,733, $10,386, $114,774 and $0, respectively) | $ | 3,819,942 | $ | 8,526,048 | $ | 405,641 | $ | 7,685,793 | $ | 1,115,505 | ||||||||||
Interest | 70,600 | 49,624 | 14,657 | 67,308,698 | 2,945,870 | |||||||||||||||
Non cash income | 962,732 | * | 2,344,934 | * | — | 3,675,928 | * | — | ||||||||||||
|
|
|
|
|
|
|
|
|
| |||||||||||
Total income | 4,853,274 | 10,920,606 | 420,298 | 78,670,419 | 4,061,375 | |||||||||||||||
|
|
|
|
|
|
|
|
|
| |||||||||||
Expenses |
| |||||||||||||||||||
Advisory fees | 3,174,715 | 4,339,134 | 336,370 | 26,180,508 | 850,341 | |||||||||||||||
Transfer agent fees | 172,276 | 207,446 | 51,614 | 1,076,228 | 52,707 | |||||||||||||||
Fund accounting fees | 99,662 | 83,777 | 34,486 | 225,381 | 92,305 | |||||||||||||||
Administration fees | 68,253 | 77,315 | 14,042 | 373,407 | 29,097 | |||||||||||||||
Professional fees | 38,424 | 54,860 | 15,943 | 223,264 | 31,020 | |||||||||||||||
Trustee fees | 52,085 | 56,884 | 40,424 | 122,996 | 42,462 | |||||||||||||||
Custody fees | 58,954 | 377,514 | 8,454 | 905,785 | 82,561 | |||||||||||||||
Reports to shareholders | 51,964 | 45,281 | 10,559 | 195,693 | 7,598 | |||||||||||||||
Registration expense | 36,704 | 38,267 | 22,142 | 92,252 | 37,451 | |||||||||||||||
Miscellaneous | 14,793 | 16,014 | 4,232 | 18,663 | 2,008 | |||||||||||||||
Insurance expense | 15,122 | 23,044 | 1,509 | 94,256 | 2,289 | |||||||||||||||
Dividend & interest expense | 87,728 | 32,403 | 922 | 1,020,850 | 2,329 | |||||||||||||||
Chief Compliance Officer fees | 13,648 | 13,648 | 13,648 | 13,648 | 13,648 | |||||||||||||||
Distribution fees for investor class (see Note 4) | 34 | 1 | 1,568 | 1 | — | 418,376 | 3,148 | |||||||||||||
|
|
|
|
|
|
|
|
|
| |||||||||||
Total expenses | 3,884,362 | 5,367,155 | 554,345 | 30,961,307 | 1,248,964 | |||||||||||||||
Less: fees waived (see Note 3) | (311,514 | ) | (963,627 | ) | (122,904 | ) | (2,325,569 | ) | (368,906 | ) | ||||||||||
|
|
|
|
|
|
|
|
|
| |||||||||||
Net expenses | 3,572,848 | 4,403,528 | 431,441 | 28,635,738 | 880,058 | |||||||||||||||
|
|
|
|
|
|
|
|
|
| |||||||||||
Net investment income (loss) | 1,280,426 | 6,517,078 | (11,143 | ) | 50,034,681 | 3,181,317 | ||||||||||||||
|
|
|
|
|
|
|
|
|
| |||||||||||
REALIZED AND UNREALIZED GAIN (LOSS) | ||||||||||||||||||||
Net realized gain (loss) on: | ||||||||||||||||||||
Investments (net of capital gains tax of $0, $0, $0, $7,057 and $0, respectively), excluding purchased options | 27,051,249 | 5,259,147 | (111,213 | ) | 30,334,723 | 133,570 | ||||||||||||||
Purchased options | — | — | — | (2,859,428 | ) | (42,332 | ) | |||||||||||||
Short sales | — | — | — | (3,328,353 | ) | — | ||||||||||||||
Written options | — | — | — | 194,745 | 1,607,543 | |||||||||||||||
Forward foreign currency exchange contracts | — | 723,027 | — | (104,188 | ) | 14,908 | ||||||||||||||
Foreign currency transactions | (8,048 | ) | 21,222 | 153 | (451,831 | ) | 84 | |||||||||||||
Futures | — | — | — | (10,795,387 | ) | 1,933 | ||||||||||||||
Swap contracts | — | — | — | (449,746 | ) | (70,753 | ) | |||||||||||||
|
|
|
|
|
|
|
|
|
| |||||||||||
Net realized gain (loss) | 27,043,201 | 6,003,396 | (111,060 | ) | 12,540,535 | 1,644,953 | ||||||||||||||
|
|
|
|
|
|
|
|
|
| |||||||||||
Net change in unrealized appreciation/depreciation on: | ||||||||||||||||||||
Investments, excluding purchased options | 40,482,686 | 92,908,787 | 6,252,526 | 121,253,668 | 2,373,004 | |||||||||||||||
Purchased options | — | — | — | 36,857 | (8,177 | ) | ||||||||||||||
Unfunded loan commitment | — | — | — | 1,460 | 58 | |||||||||||||||
Short sales | — | — | — | (16,397,164 | ) | — | ||||||||||||||
Written options | — | — | — | (49,755 | ) | (101,358 | ) | |||||||||||||
Forward foreign currency exchange contracts | — | (885,110 | ) | — | (507,752 | ) | 34,038 | |||||||||||||
Foreign currency transactions | (5,736 | ) | 3,915 | — | 83,321 | 178 | ||||||||||||||
Futures | — | — | — | 2,468,480 | (1,890 | ) | ||||||||||||||
Swap contracts | — | — | — | (17,149,530 | ) | (140,638 | ) | |||||||||||||
|
|
|
|
|
|
|
|
|
| |||||||||||
Net change in unrealized appreciation/depreciation | 40,476,950 | 92,027,592 | 6,252,526 | 89,739,585 | 2,155,215 | |||||||||||||||
|
|
|
|
|
|
|
|
|
| |||||||||||
Net realized and unrealized gain (loss) on investments, short sales, purchased options, written options, foreign currency transactions, futures and swap contracts | 67,520,151 | 98,030,988 | 6,141,466 | 102,280,120 | 3,800,168 | |||||||||||||||
|
|
|
|
|
|
|
|
|
| |||||||||||
Net increase in net assets resulting from operations | $ | 68,800,577 | $ | 104,548,066 | $ | 6,130,323 | $ | 152,314,801 | $ | 6,981,485 | ||||||||||
|
|
|
|
|
|
|
|
|
| |||||||||||
| * | Representsnon-cash distributions in connection with capital changes for certain investments held by the Fund recorded onex-date and based on fair value. |
| 1 | Investor Class shares were converted into Institutional Class shares at the close of business on April 29, 2019. |
The accompanying notes are an integral part of these financial statements.
| 114 | Litman Gregory Funds Trust | |||||
Table of Contents
Litman Gregory Funds Trust
STATEMENTS OF CHANGES IN NET ASSETS
| 1 | Investor Class shares were converted into Institutional Class shares at the close of business on April 29, 2019. |
The accompanying notes are an integral part of these financial statements.
| Statements of Changes in Net Assets | 115 | |||||
Table of Contents
Litman Gregory Funds Trust
STATEMENTS OF CHANGES IN NET ASSETS – (Continued)
The accompanying notes are an integral part of these financial statements.
| 116 | Litman Gregory Funds Trust | |||||
Table of Contents
Litman Gregory Funds Trust
STATEMENTS OF CHANGES IN NET ASSETS – (Continued)
| 1 | Commenced operations on September 28, 2018. |
The accompanying notes are an integral part of these financial statements.
| Statements of Changes in Net Assets | 117 | |||||
Table of Contents
Litman Gregory Masters Equity Fund – Institutional Class
FINANCIAL HIGHLIGHTS
For a capital share outstanding throughout each year
| Year Ended December 31, | ||||||||||||||||||||
| 2019 | 2018 | 2017 | 2016 | 2015 | ||||||||||||||||
Net asset value, beginning of year | $ | 15.02 | $ | 19.10 | $ | 17.02 | $ | 16.08 | $ | 18.01 | ||||||||||
|
| |||||||||||||||||||
Income from investment operations: |
| |||||||||||||||||||
Net investment income (loss) | 0.08 | 1,2 | (0.01 | )1 | (0.01 | )1 | 0.13 | 1 | 0.07 | 1 | ||||||||||
Net realized gain (loss) and net change in unrealized | 4.03 | (1.90 | ) | 3.61 | 1.81 | (0.41 | ) | |||||||||||||
|
| |||||||||||||||||||
Total income (loss) from investment operations | 4.11 | (1.91 | ) | 3.60 | 1.94 | (0.34 | ) | |||||||||||||
|
| |||||||||||||||||||
Less distributions: |
| |||||||||||||||||||
From net investment income | (0.08 | ) | — | — | (0.14 | ) | (0.06 | ) | ||||||||||||
From net realized gains | (1.51 | ) | (2.17 | ) | (1.52 | ) | (0.86 | ) | (1.53 | ) | ||||||||||
|
| |||||||||||||||||||
Total distributions | (1.59 | ) | (2.17 | ) | (1.52 | ) | (1.00 | ) | (1.59 | ) | ||||||||||
|
| |||||||||||||||||||
Net asset value, end of year | $ | 17.54 | $ | 15.02 | $ | 19.10 | $ | 17.02 | $ | 16.08 | ||||||||||
|
| |||||||||||||||||||
Total return | 27.55 | % | (9.91 | )% | 21.15 | % | 11.98 | % | (1.87 | )% | ||||||||||
|
| |||||||||||||||||||
Ratios/supplemental data: |
| |||||||||||||||||||
Net assets, end of year (millions) | $ | 286.3 | $ | 259.8 | $ | 339.5 | $ | 313.5 | $ | 321.2 | ||||||||||
|
| |||||||||||||||||||
Ratios of total expenses to average net assets: | ||||||||||||||||||||
Before fees waived | 1.35 | %4 | 1.29 | %3 | 1.27 | %3 | 1.27 | %3 | 1.28 | %3 | ||||||||||
|
| |||||||||||||||||||
After fees waived | 1.24 | %4,5 | 1.17 | %3,5 | 1.15 | %3,5 | 1.17 | %3,5 | 1.18 | %3,5 | ||||||||||
|
| |||||||||||||||||||
Ratio of net investment income (loss) to average net assets | 0.44 | %2,4 | (0.08 | )%3 | (0.07 | )%3 | 0.78 | %3 | 0.37 | %3 | ||||||||||
|
| |||||||||||||||||||
Portfolio turnover rate | 25.02 | %6 | 41.68 | %6 | 33.49 | %6 | 26.98 | %6 | 33.94 | %6 | ||||||||||
|
| |||||||||||||||||||
| 1 | Calculated based on the average shares outstanding methodology. |
| 2 | Includenon-cash distributions amounting to $0.06 per share and 0.33% of average daily net assets. |
| 3 | Includes Interest & Dividend expenses of 0.00% of average net assets. |
| 4 | Includes Interest & Dividend expense of 0.03% of average net assets. |
| 5 | Includes the impact of the voluntary waiver of less than 0.01% of average net assets. |
| 6 | Portfolio turnover is calculated on the basis of the Fund as a whole without distinguishing between classes of shares issued. |
The accompanying notes are an integral part of these financial statements.
| 118 | Litman Gregory Funds Trust | |||||
Table of Contents
Litman Gregory Masters International Fund – Institutional Class
FINANCIAL HIGHLIGHTS
For a capital share outstanding throughout each year
| Year Ended December 31, | ||||||||||||||||||||
| 2019 | 2018 | 2017 | 2016 | 2015 | ||||||||||||||||
Net asset value, beginning of year | $ | 13.94 | $ | 17.73 | $ | 14.77 | $ | 16.13 | $ | 17.36 | ||||||||||
|
| |||||||||||||||||||
Income from investment operations: |
| |||||||||||||||||||
Net investment income
| 0.27 | 1,4 | 0.30 | 1,3 | 0.20 | 1,2 | 0.23 | 1 | 0.22 | 1 | ||||||||||
Net realized gain (loss) and net change in unrealized | 3.97 | (3.99 | ) | 3.28 | (0.98 | ) | (1.18 | ) | ||||||||||||
|
| |||||||||||||||||||
Total income (loss) from investment operations | 4.24 | (3.69 | ) | 3.48 | (0.75 | ) | (0.96 | ) | ||||||||||||
|
| |||||||||||||||||||
Less distributions: |
| |||||||||||||||||||
From net investment income | (0.53 | ) | (0.10 | ) | (0.52 | ) | (0.61 | ) | (0.27 | ) | ||||||||||
From net realized gains | — | — | — | — | — | |||||||||||||||
|
| |||||||||||||||||||
Total distributions | (0.53 | ) | (0.10 | ) | (0.52 | ) | (0.61 | ) | (0.27 | ) | ||||||||||
|
| |||||||||||||||||||
Redemption fee proceeds | — | — | — | — | — | ^ | ||||||||||||||
|
| |||||||||||||||||||
Net asset value, end of year | $ | 17.65 | $ | 13.94 | $ | 17.73 | $ | 14.77 | $ | 16.13 | ||||||||||
|
| |||||||||||||||||||
Total return | 30.45 | % | (20.80 | )% | 23.61 | % | (4.61 | )% | (5.52 | )% | ||||||||||
|
| |||||||||||||||||||
Ratios/supplemental data: |
| |||||||||||||||||||
Net assets, end of year (millions) | $ | 401.5 | $ | 368.6 | $ | 681.1 | $ | 621.3 | $ | 1,021.1 | ||||||||||
|
| |||||||||||||||||||
Ratios of total expenses to average net assets: | ||||||||||||||||||||
Before fees waived | 1.36 | %6 | 1.33 | %6 | 1.26 | %5 | 1.28 | %6 | 1.24 | %5 | ||||||||||
|
| |||||||||||||||||||
After fees waived | 1.12 | %6,7 | 1.09 | %6,7 | 0.98 | %5,7 | 1.00 | %6,7 | 0.99 | %5,7 | ||||||||||
|
| |||||||||||||||||||
Ratio of net investment income to average net assets | 1.65 | %4,6 | 1.74 | %3,6 | 1.18 | %2,5 | 1.51 | %6 | 1.22 | %5 | ||||||||||
|
| |||||||||||||||||||
Portfolio turnover rate | 45.48 | %8 | 35.15 | %8 | 41.90 | %8 | 43.84 | %8 | 51.68 | %8 | ||||||||||
|
| |||||||||||||||||||
| ^ | Amount represents less than $0.01 per share. |
| 1 | Calculated based on the average shares outstanding methodology. |
| 2 | Includenon-cash distributions amounting to $0.06 per share and 0.35% of average daily net assets. |
| 3 | Includenon-cash distributions amounting to $0.05 per share and 0.29% of average daily net assets. |
| 4 | Includenon-cash distributions amounting to $0.10 per share and 0.60% of average daily net assets. |
| 5 | Includes Interest & Dividend expenses of 0.00% of average net assets. |
| 6 | Includes Interest & Dividend expenses of 0.01% of average net assets. |
| 7 | Includes the impact of the voluntary waiver of less than 0.01% of average net assets. |
| 8 | Portfolio turnover is calculated on the basis of the Fund as a whole without distinguishing between classes of shares issued. |
The accompanying notes are an integral part of these financial statements.
| Financial Highlights | 119 | |||||
Table of Contents
Litman Gregory Masters Smaller Companies Fund – Institutional Class
FINANCIAL HIGHLIGHTS
For a capital share outstanding throughout each year
| Year Ended December 31, | ||||||||||||||||||||
| 2019 | 2018 | 2017 | 2016 | 2015 | ||||||||||||||||
Net asset value, beginning of year | $ | 21.21 | $ | 23.70 | $ | 20.71 | $ | 17.43 | $ | 20.09 | ||||||||||
|
|
|
|
|
|
|
|
|
| |||||||||||
Income from investment operations: |
| |||||||||||||||||||
Net investment income (loss) | (0.01 | )1 | 0.02 | 1 | (0.07 | )1 | (0.01 | )1 | (0.15 | )1 | ||||||||||
Net realized gain (loss) and net change in unrealized | 5.01 | (2.51 | ) | 3.06 | 3.29 | (2.51 | ) | |||||||||||||
|
|
|
|
|
|
|
|
|
| |||||||||||
Total income (loss) from investment operations | 5.00 | (2.49 | ) | 2.99 | 3.28 | (2.66 | ) | |||||||||||||
|
|
|
|
|
|
|
|
|
| |||||||||||
Less distributions: |
| |||||||||||||||||||
From net investment income | — | ^ | — | — | — | — | ||||||||||||||
From net realized gains | (2.52 | ) | — | — | — | — | ||||||||||||||
|
|
|
|
|
|
|
|
|
| |||||||||||
Total distributions | (2.52 | ) | — | — | — | — | ||||||||||||||
|
|
|
|
|
|
|
|
|
| |||||||||||
Net asset value, end of year | $ | 23.69 | $ | 21.21 | $ | 23.70 | $ | 20.71 | $ | 17.43 | ||||||||||
|
|
|
|
|
|
|
|
|
| |||||||||||
Total return | 23.72 | % | (10.51 | )% | 14.44 | % | 18.82 | % | (13.24 | )% | ||||||||||
|
|
|
|
|
|
|
|
|
| |||||||||||
Ratios/supplemental data: |
| |||||||||||||||||||
Net assets, end of year (millions) | $ | 28.7 | $ | 26.6 | $ | 33.4 | $ | 37.2 | $ | 41.0 | ||||||||||
|
|
|
|
|
|
|
|
|
| |||||||||||
Ratios of total expenses to average net assets: | ||||||||||||||||||||
Before fees waived | 1.88 | %2 | 1.80 | %2 | 1.74 | %2 | 1.66 | %2 | 1.69 | %2 | ||||||||||
|
|
|
|
|
|
|
|
|
| |||||||||||
After fees waived | 1.46 | %2,3 | 1.38 | %2,3 | 1.32 | %2,3 | 1.24 | %2,3 | 1.59 | %2,3 | ||||||||||
|
|
|
|
|
|
|
|
|
| |||||||||||
Ratio of net investment income (loss) to average net assets | (0.04 | )%2 | 0.10 | %2 | (0.30 | )%2 | (0.06 | )%2 | (0.75 | )%2 | ||||||||||
|
|
|
|
|
|
|
|
|
| |||||||||||
Portfolio turnover rate | 64.88 | % | 75.00 | % | 107.51 | % | 51.32 | % | 60.73 | % | ||||||||||
|
|
|
|
|
|
|
|
|
| |||||||||||
| ^ | Amount represents less than $0.01 per share. |
| 1 | Calculated based on the average shares outstanding methodology. |
| 2 | Includes Interest & Dividend expenses of 0.00% of average net assets. |
| 3 | Includes the impact of the voluntary waiver of less than 0.01% of average net assets. |
The accompanying notes are an integral part of these financial statements.
| 120 | Litman Gregory Funds Trust | |||||
Table of Contents
Litman Gregory Masters Alternative Strategies Fund – Institutional Class
FINANCIAL HIGHLIGHTS
For a capital share outstanding throughout each year
| Year Ended December 31, | ||||||||||||||||||||
| 2019 | 2018 | 2017 | 2016 | 2015 | ||||||||||||||||
Net asset value, beginning of year | $ | 11.08 | $ | 11.69 | $ | 11.45 | $ | 10.99 | $ | 11.44 | ||||||||||
|
|
|
|
|
|
|
|
|
| |||||||||||
Income from investment operations: |
| |||||||||||||||||||
Net investment income | 0.31 | 1,2 | 0.26 | 1 | 0.26 | 1 | 0.31 | 1 | 0.30 | 1 | ||||||||||
Net realized gain (loss) and net change in unrealized | 0.64 | (0.51 | ) | 0.25 | 0.44 | (0.40 | ) | |||||||||||||
|
|
|
|
|
|
|
|
|
| |||||||||||
Total income (loss) from investment operations | 0.95 | (0.25 | ) | 0.51 | 0.75 | (0.10 | ) | |||||||||||||
|
|
|
|
|
|
|
|
|
| |||||||||||
Less distributions: |
| |||||||||||||||||||
From net investment income | (0.33 | ) | (0.36 | ) | (0.27 | ) | (0.29 | ) | (0.32 | ) | ||||||||||
From net realized gains | — | — | — | — | (0.03 | ) | ||||||||||||||
|
|
|
|
|
|
|
|
|
| |||||||||||
Total distributions | (0.33 | ) | (0.36 | ) | (0.27 | ) | (0.29 | ) | (0.35 | ) | ||||||||||
|
|
|
|
|
|
|
|
|
| |||||||||||
Net asset value, end of year | $ | 11.70 | $ | 11.08 | $ | 11.69 | $ | 11.45 | $ | 10.99 | ||||||||||
|
|
|
|
|
|
|
|
|
| |||||||||||
Total return | 8.52 | % | (2.08 | )% | 4.51 | % | 6.87 | % | (0.77 | )% | ||||||||||
|
|
|
|
|
|
|
|
|
| |||||||||||
Ratios/supplemental data: |
| |||||||||||||||||||
Net assets, end of year (millions) | $ | 1,724.2 | $ | 1,663.7 | $ | 1,828.1 | $ | 1,368.9 | $ | 1,176.9 | ||||||||||
|
|
|
|
|
|
|
|
|
| |||||||||||
Ratios of total expenses to average net assets: | ||||||||||||||||||||
Before fees waived | 1.63 | %7 | 1.63 | %6 | 1.75 | %5 | 1.83 | %4 | 1.94 | %3 | ||||||||||
|
|
|
|
|
|
|
|
|
| |||||||||||
After fees waived | 1.51 | %7,8 | 1.53 | %6,8 | 1.66 | %5,8 | 1.75 | %4,8 | 1.85 | %3,8 | ||||||||||
|
|
|
|
|
|
|
|
|
| |||||||||||
Ratio of net investment income to average net assets | 2.70 | %2,7 | 2.26 | %6 | 2.25 | %5 | 2.78 | %4 | 2.62 | %3 | ||||||||||
|
|
|
|
|
|
|
|
|
| |||||||||||
Portfolio turnover rate | 190.21 | %9 | 197.04 | %9 | 169.34 | %9 | 142.24 | %9 | 145.97 | %9 | ||||||||||
|
|
|
|
|
|
|
|
|
| |||||||||||
| 1 | Calculated based on the average shares outstanding methodology. |
| 2 | Includenon-cash distributions amounting to $0.02 per share and 0.20% of average daily net assets. |
| 3 | Includes Interest & Dividend expense of 0.36% of average net assets. |
| 4 | Includes Interest & Dividend expense of 0.28% of average net assets. |
| 5 | Includes Interest & Dividend expense of 0.20% of average net assets. |
| 6 | Includes Interest & Dividend expense of 0.07% of average net assets. |
| 7 | Includes Interest & Dividend expense of 0.05% of average net assets. |
| 8 | Includes the impact of the voluntary waiver of less than 0.01% of average net assets. |
| 9 | Portfolio turnover is calculated on the basis of the Fund as a whole without distinguishing between classes of shares issued. |
The accompanying notes are an integral part of these financial statements.
| Financial Highlights | 121 | |||||
Table of Contents
Litman Gregory Masters Alternative Strategies Fund – Investor Class
FINANCIAL HIGHLIGHTS
For a capital share outstanding throughout each year
| Year Ended December 31, | ||||||||||||||||||||
| 2019 | 2018 | 2017 | 2016 | 2015 | ||||||||||||||||
Net asset value, beginning of year | $ | 11.10 | $ | 11.70 | $ | 11.46 | $ | 11.00 | $ | 11.45 | ||||||||||
|
|
|
|
|
|
|
|
|
| |||||||||||
Income from investment operations: |
| |||||||||||||||||||
Net investment income | 0.28 | 1,2 | 0.23 | 1 | 0.23 | 1 | 0.28 | 1 | 0.28 | 1 | ||||||||||
Net realized gain (loss) and net change in unrealized | 0.63 | (0.50 | ) | 0.25 | 0.44 | (0.40 | ) | |||||||||||||
|
|
|
|
|
|
|
|
|
| |||||||||||
Total income (loss) from investment operations | 0.91 | (0.27 | ) | 0.48 | 0.72 | (0.12 | ) | |||||||||||||
|
|
|
|
|
|
|
|
|
| |||||||||||
Less distributions: |
| |||||||||||||||||||
From net investment income | (0.30 | ) | (0.33 | ) | (0.24 | ) | (0.26 | ) | (0.30 | ) | ||||||||||
From net realized gains | — | — | — | — | (0.03 | ) | ||||||||||||||
|
|
|
|
|
|
|
|
|
| |||||||||||
Total distributions | (0.30 | ) | (0.33 | ) | (0.24 | ) | (0.26 | ) | (0.33 | ) | ||||||||||
|
|
|
|
|
|
|
|
|
| |||||||||||
Net asset value, end of year | $ | 11.71 | $ | 11.10 | $ | 11.70 | $ | 11.46 | $ | 11.00 | ||||||||||
|
|
|
|
|
|
|
|
|
| |||||||||||
Total return | 8.22 | % | (2.32 | )% | 4.14 | % | 6.67 | % | (0.95 | )% | ||||||||||
|
|
|
|
|
|
|
|
|
| |||||||||||
Ratios/supplemental data: |
| |||||||||||||||||||
Net assets, end of year (millions) | $ | 144.1 | $ | 175.3 | $ | 206.0 | $ | 179.8 | $ | 190.6 | ||||||||||
|
|
|
|
|
|
|
|
|
| |||||||||||
Ratios of total expenses to average net assets: | ||||||||||||||||||||
Before fees waived | 1.88 | %7 | 1.88 | %6 | 2.00 | %5 | 2.08 | %4 | 2.18 | %3 | ||||||||||
|
|
|
|
|
|
|
|
|
| |||||||||||
After fees waived | 1.76 | %7,8 | 1.78 | %6,8 | 1.90 | %5,8 | 2.00 | %4,8 | 2.03 | %3,8 | ||||||||||
|
|
|
|
|
|
|
|
|
| |||||||||||
Ratio of net investment income to average net assets | 2.44 | %2,7 | 2.01 | %6 | 2.01 | %5 | 2.54 | %4 | 2.44 | %3 | ||||||||||
|
|
|
|
|
|
|
|
|
| |||||||||||
Portfolio turnover rate | 190.21 | %9 | 197.04 | %9 | 169.34 | %9 | 142.24 | %9 | 145.97 | %9 | ||||||||||
|
|
|
|
|
|
|
|
|
| |||||||||||
| 1 | Calculated based on the average shares outstanding methodology. |
| 2 | Includenon-cash distributions amounting to $0.02 per share and 0.20% of average daily net assets. |
| 3 | Includes Interest & Dividend expense of 0.36% of average net assets. |
| 4 | Includes Interest & Dividend expense of 0.28% of average net assets. |
| 5 | Includes Interest & Dividend expense of 0.20% of average net assets. |
| 6 | Includes Interest & Dividend expense of 0.07% of average net assets. |
| 7 | Includes Interest & Dividend expense of 0.05% of average net assets. |
| 8 | Includes the impact of the voluntary waiver of less than 0.01% of average net assets. |
| 9 | Portfolio turnover is calculated on the basis of the Fund as a whole without distinguishing between classes of shares issued. |
The accompanying notes are an integral part of these financial statements.
| 122 | Litman Gregory Funds Trust | |||||
Table of Contents
Litman Gregory Masters High Income Alternatives Fund – Institutional Class
FINANCIAL HIGHLIGHTS
For a capital share outstanding throughout each year
| Year Ended December 31, 2019 | Period Ended December 31, 2018** | |||||||
Net asset value, beginning of year | $ | 9.63 | $ | 10.00 | ||||
|
|
|
| |||||
Income from investment operations: |
| |||||||
Net investment income | 0.36 | 1 | 0.07 | 1 | ||||
Net realized gain (loss) and net change in unrealized appreciation/depreciation on | 0.44 | (0.38 | ) | |||||
|
|
|
| |||||
Total income (loss) from investment operations | 0.80 | (0.31 | ) | |||||
|
|
|
| |||||
Less distributions: |
| |||||||
From net investment income | (0.33 | ) | (0.06 | ) | ||||
From net realized gains | (0.04 | ) | — | |||||
|
|
|
| |||||
Total distributions | (0.37 | ) | (0.06 | ) | ||||
|
|
|
| |||||
Net asset value, end of year | $ | 10.06 | $ | 9.63 | ||||
|
|
|
| |||||
Total return | 8.37 | % | (3.08 | )%+ | ||||
|
|
|
| |||||
Ratios/supplemental data: |
| |||||||
Net assets, end of year (millions) | $ | 93.8 | $ | 77.2 | ||||
|
|
|
| |||||
Ratios of total expenses to average net assets: | ||||||||
Before fees waived | 1.39 | %2 | 1.34 | %* | ||||
|
|
|
| |||||
After fees waived | 0.98 | %2,3 | 0.98 | %*,3 | ||||
|
|
|
| |||||
Ratio of net investment income to average net assets | 3.56 | %2 | 2.89 | %* | ||||
|
|
|
| |||||
Portfolio turnover rate | 90.51 | %4 | 125.92 | %+,4 | ||||
|
|
|
| |||||
| + | Not annualized. |
| * | Annualized. |
| ** | Commenced operations on September 28, 2018. |
| 1 | Calculated based on the average shares outstanding methodology. |
| 2 | Includes Interest & Dividend expense of 0.00% of average net assets. |
| 3 | Includes the impact of the voluntary waiver of less than 0.01% of average net assets. |
| 4 | Portfolio turnover is calculated on the basis of the Fund as a whole without distinguishing between classes of shares issued. |
The accompanying notes are an integral part of these financial statements.
| Financial Highlights | 123 | |||||
Table of Contents
Litman Gregory Masters High Income Alternatives Fund – Investor Class
FINANCIAL HIGHLIGHTS
For a capital share outstanding throughout each year
| Year Ended December 31, 2019 | Period Ended December 31, 2018** | |||||||
Net asset value, beginning of year | $ | 9.63 | $ | 10.00 | ||||
|
|
|
| |||||
Income from investment operations: |
| |||||||
Net investment income | 0.34 | 1 | 0.08 | 1 | ||||
Net realized gain (loss) and net change in unrealized appreciation/depreciation on investments, foreign currency, futures, options and swap contracts | 0.44 | (0.39 | ) | |||||
|
|
|
| |||||
Total income (loss) from investment operations | 0.78 | (0.31 | ) | |||||
|
|
|
| |||||
Less distributions: |
| |||||||
From net investment income | (0.30 | ) | (0.06 | ) | ||||
From net realized gains | (0.04 | ) | — | |||||
|
|
|
| |||||
Total distributions | (0.34 | ) | (0.06 | ) | ||||
|
|
|
| |||||
Net asset value, end of year | $ | 10.07 | $ | 9.63 | ||||
|
|
|
| |||||
Total return | 8.18 | % | (3.09 | )%+ | ||||
|
|
|
| |||||
Ratios/supplemental data: |
| |||||||
Net assets, end of year (millions) | $ | 1.4 | $ | 0.5 | ||||
|
|
|
| |||||
Ratios of total expenses to average net assets: | ||||||||
Before fees waived | 1.67 | %2 | 1.62 | %* | ||||
|
|
|
| |||||
After fees waived | 1.23 | %2,3 | 1.23 | %*,3 | ||||
|
|
|
| |||||
Ratio of net investment income to average net assets | 3.36 | %2 | 3.25 | %* | ||||
|
|
|
| |||||
Portfolio turnover rate | 90.51 | %4 | 125.92 | %+,4 | ||||
|
|
|
| |||||
| + | Not annualized. |
| * | Annualized. |
| ** | Commenced operations on September 28, 2018. |
| 1 | Calculated based on the average shares outstanding methodology. |
| 2 | Includes Interest & Dividend expense of 0.00% of average net assets. |
| 3 | Includes the impact of the voluntary waiver of less than 0.01% of average net assets. |
| 4 | Portfolio turnover is calculated on the basis of the Fund as a whole without distinguishing between classes of shares issued. |
The accompanying notes are an integral part of these financial statements.
| 124 | Litman Gregory Funds Trust | |||||
Table of Contents
Litman Gregory Funds Trust
Note 1 – Organization
Litman Gregory Funds Trust (the “Trust”) was organized as a Delaware business trust on August 1, 1996, and is registered under the Investment Company Act of 1940 (the “1940 Act”) as anopen-end management investment company. Effective August 1, 2011, The Masters’ Select Funds Trust changed its name to the Litman Gregory Funds Trust. The Trust consists of five separate series: Litman Gregory Masters Equity Fund, Litman Gregory Masters International Fund, Litman Gregory Masters Smaller Companies Fund, Litman Gregory Masters Alternative Strategies Fund, and Litman Gregory Masters High Income Alternatives Fund (commenced operations on September 28, 2018) (each a “Fund” and collectively the “Funds”). Each Fund is diversified.
Litman Gregory Masters Equity Fund (“Equity Fund”) seeks to increase the value of an investment in the Fund over the long-term by using the combined talents and favorite stock-picking ideas of six highly regarded portfolio managers (each “Managers” or“Sub-Advisors”). The Equity Fund offers one class of shares: Institutional Class. Investor Class shares were converted into Institutional Class shares at the close of business on April 29, 2019.
Litman Gregory Masters International Fund (“International Fund”) seeks to increase the value of an investment in the Fund over the long-term by using the combined talents and favorite stock-picking ideas of five highly regarded international portfolio managers. The International Fund offers one class of shares: Institutional Class. Investor Class shares were converted into Institutional Class shares at the close of business on April 29, 2019.
Litman Gregory Masters Smaller Companies Fund (“Smaller Companies Fund”) seeks to increase the value of an investment in the Fund over the long-term by using the combined talents and favorite stock-picking ideas of three highly regarded smaller company portfolio managers. The Smaller Companies Fund offers one class of shares: Institutional Class.
Litman Gregory Masters Alternative Strategies Fund (“Alternative Strategies Fund”) seeks to achieve long-term returns with lower risk and lower volatility than the stock market, and with relatively low correlation to stock and bond market indexes by using the combined talents and favorite stock and bond market indexes-picking ideas of five highly regarded portfolio managers. The Alternative Strategies Fund offers two classes of shares: Institutional Class and Investor Class shares. The Investor Class shares charge a 0.25%12b-1 distribution fee to the shareholders of this class (see Note 4).
Litman Gregory Masters High Income Alternatives Fund (“High Income Alternatives Fund”) seeks to generate a high level of current income from diverse sources, consistent with capital preservation over time, with capital appreciation a secondary objective, by using the combined talents and favorite stock and bond market indexes-picking ideas of four highly regarded portfolio managers. The High Income Alternatives Fund offers two classes of shares: Institutional Class and Investor Class shares. The Investor Class shares charge a 0.25%12b-1 distribution fee to the shareholders of this class (see Note 4).
Note 2 – Significant Accounting Policies
The following is a summary of the significant accounting policies followed by the Funds. These policies are in conformity with accounting principles generally accepted in the United States of America (“GAAP”).
| A | Accounting Estimates. The preparation of financial statements in conformity with GAAP requires management to make estimates and assumptions. These estimates and assumptions affect the reported amounts of assets and liabilities and the disclosure of contingent assets and liabilities at the date of financial statements and the reported amounts of increases and decreases in net assets from operations during the reporting period. Actual results could differ from those estimates. |
The Funds are investment companies and accordingly follow the investment company accounting and reporting guidance of the Financial Accounting Standards Board (FASB) Accounting Standard Codification Topic 946Financial Services – Investment Companies.
| B | Security Valuation. Investments in securities and derivatives traded on a national securities exchange are valued at the last reported sales price at the close of regular trading on each day that the exchanges are open for trading. Securities listed on the NASDAQ Global Market, the NASDAQ Global Select Market and the NASDAQ Capital Market are valued using the NASDAQ Official Closing Price. Securities traded on an exchange for which there have been no sales are valued at the mean between the closing bid and asked prices. Debt securities maturing within 60 days or less are valued at amortized cost unless the Valuation Committee determines that amortized cost does not represent fair value. Securities for which market prices are not readily available or if a security’s value has materially changed after the close of the security’s primary market but before the close of trading on the New York Stock Exchange (“NYSE”), the securities are valued at fair value as determined in good faith by the Managers that selected the security for the Funds’ portfolio and the Trust’s Valuation Committee in accordance with procedures approved by the Board of Trustees (the “Board”). In determining fair value, the Funds take into account all relevant factors and available information. Consequently, the price of the security used by a Fund to calculate its net asset value may differ from quoted or published prices for the same security. Fair value pricing involves subjective judgments and there is no single standard for determining the fair value of a security. As a result, different mutual funds could reasonably arrive at a different value |
| Notes to Financial Statements | 125 | |||||
Table of Contents
Litman Gregory Funds Trust
NOTES TO FINANCIAL STATEMENTS – (Continued)
| for the same security. For securities that do not trade during NYSE hours, fair value determinations are based on analyses of market movements after the close of those securities’ primary markets, and include reviews of developments in foreign markets, the performance of U.S. securities markets, and the performance of instruments trading in U.S. markets that represent foreign securities and baskets of foreign securities. Pricing services are used to obtain closing market prices and to compute certain fair value adjustments utilizing computerized pricing models. It is possible that the fair value determined for a security is materially different from the value that could be realized upon the sale of that security or from the values that other mutual funds may determine. |
Investments in other funds are valued at their respective net asset values as determined by those funds in accordance with the 1940 Act.
Debt securities generally trade in theover-the-counter market rather than on a securities exchange. The Funds’ pricing services use multiple valuation techniques to determine fair value. In instances where sufficient market activity exists, the pricing services may utilize a market-based approach through which quotes from market makers are used to determine fair value. In instances where sufficient market activity may not exist or is limited, the pricing services also utilize proprietary valuation models which may consider market characteristics such as benchmark yield curves, option-adjusted spreads, credit spreads, estimated default rates, coupon rates, anticipated timing of principal repayments, underlying collateral, and other unique security features in order to estimate the relevant cash flows, which are then discounted to calculate the fair value. Securities denominated in a foreign currency are converted into their U.S. dollar equivalent at the foreign exchange rate in effect at the close of the NYSE on the date that the values of the foreign debt securities are determined. Repurchase agreements are valued at cost, which approximates fair value.
Certain derivatives trade in theover-the-counter market. The Funds’ pricing services use various techniques including industry standard option pricing models and proprietary discounted cash flow models to determine the fair value of those instruments. The Funds’ net benefit or obligation under the derivative contract, as measured by the fair value of the contract, is included in net assets.
The Funds have procedures to determine the fair value of securities and other financial instruments for which market prices are not readily available or which may not be reliably priced. Under these procedures, the Funds primarily employ a market-based approach which may use related or comparable assets or liabilities, recent transactions, market multiples, book values, and other relevant information for the investment to determine the fair value of the investment. The Funds may also use an income-based valuation approach in which the anticipated future cash flows of the investment are discounted to calculate fair value. Discounts may also be applied due to the nature or duration of any restrictions on the disposition of the investments. Due to the inherent uncertainty of valuations of such investments, the fair values may differ significantly from the values that would have been used had an active market existed.
| C | Senior Term Loans. The Alternative Strategies Fund and the High Income Alternatives Fund may invest in bank debt, which includes interests in loans to companies or their affiliates undertaken to finance a capital restructuring or in connection with recapitalizations, acquisitions, leveraged buyouts, refinancings or other financially leveraged transactions and may include loans which are designed to provide temporary or bridge financing to a borrower pending the sale of identified assets, the arrangement of longer-term loans or the issuance and sale of debt obligations. These loans, which may bear fixed or floating rates, have generally been arranged through private negotiations between a corporate borrower and one or more financial institutions (“Lenders”), including banks. The Alternative Strategies Fund’s and the High Income Alternatives Fund’s investments may be in the form of participations in loans (“Participations”) or of assignments of all or a portion of loans from third parties (“Assignments”). |
| D | Unfunded Loan Commitments. The Alternative Strategies Fund and the High Income Alternatives Fund may enter into certain credit agreements, all or a portion of which may be unfunded. The Fund is obligated to fund these commitments at the borrower’s discretion. These commitments, if any, are disclosed in the Schedule of Investments. |
| E | Short Sales.Each Fund may sell a security it does not own in anticipation of a decline in the fair value of that security. When each Fund sells a security short, it must borrow the security sold short and deliver it to the broker-dealer through which it made the short sale. In addition, cash and certain investments in securities may be used to collateralize the securities sold short. Each day the securities sold short transaction is open, the liability to replace the borrowed security is marked to market and an unrealized gain or loss is recorded. While the transaction remains open, the Fund may also incur expenses for any dividends or interest which will be paid to the lender of the securities as well as a fee to borrow the delivered security. During the term of the short sale, the value of the securities pledged as collateral on short sales is required to exceed the value of the securities sold short. A gain, limited to the price at which each Fund sold the security short, or a loss, unlimited in size, will be recognized upon the termination of a short sale. Each Fund is also subject to the risk that it may be unable to reacquire a security to terminate a short position except at a price substantially in excess of the last quoted price. |
| 126 | Litman Gregory Funds Trust | |||||
Table of Contents
Litman Gregory Funds Trust
NOTES TO FINANCIAL STATEMENTS – (Continued)
| F | Repurchase Agreements. Each Fund may enter into repurchase agreements through which the Fund acquires a security (the “underlying security”) from a seller, a well-established securities dealer or a bank that is a member of the Federal Reserve System. The bank or securities dealer agrees to repurchase the underlying security at the same price, plus a specified amount of interest, at a later date, generally for a period of less than one week. It is the Trust’s policy that its Custodian takes possession of securities as collateral under repurchase agreements and to determine on a daily basis that the value of such securities, including recorded interest, is sufficient to cover the value of the repurchase agreements. The Trust’s policy states that the value of the collateral is at least 102% of the value of the repurchase agreement. If the counterparty defaults and the value of the collateral declines or if bankruptcy proceedings are commenced with respect to the counterparty of the security, realization of the collateral by a Fund may be delayed or limited. At December 31, 2019, the Funds’ ongoing exposure to the economic return on repurchase agreements is shown on the Schedules of Investments. |
| G | Reverse repurchase agreements. The High Income Alternatives Fund may enter into reverse repurchase agreements with banks and brokers to enhance return. Under a reverse repurchase agreement a Fund sells portfolio assets subject to an agreement by that Fund to repurchase the same assets at an agreed upon price and date. The Fund can use the proceeds received from entering into a reverse repurchase agreement to make additional investments, which generally causes the Fund’s portfolio to behave as if it were leveraged. If the buyer in a reverse repurchase agreement files for bankruptcy or becomes insolvent, the Fund may be unable to recover the securities it sold and as a result may realize a loss on the transaction if the securities it sold are worth more than the purchase price it originally received from the buyer. The Fund has no outstanding reverse repurchase agreements at the end of the year. |
| H | Foreign Currency Translation. The Funds’ records are maintained in U.S. dollars. The value of securities, currencies and other assets and liabilities denominated in currencies other than U.S. dollars are translated into U.S. dollars based upon foreign exchange rates prevailing at the end of the reporting period. The currencies are translated into U.S. dollars by using the exchange rates quoted at the close of the London Stock Exchange prior to when each Fund’s net asset value is next determined. Purchases and sales of investment securities, income and expenses are translated on the respective dates of such transactions. |
The Funds do not isolate that portion of their net realized and unrealized gains and losses on investments resulting from changes in foreign exchange rates from the impact arising from changes in market prices. Such fluctuations are included with net realized and unrealized gain or loss from investments.
Net realized foreign currency transaction gains and losses arise from sales of foreign currencies, currency gains or losses realized between the trade and settlement dates on securities transactions, and the differences between the amounts of dividends, interest, and foreign withholding taxes recorded on the Funds’ books and the U.S. dollar equivalent of the amounts actually received or paid. Net unrealized foreign currency transactions gains and losses arise from changes in the value of assets and liabilities, other than investments in securities, resulting from changes in the exchange rates.
| I | Forward Foreign Currency Exchange Contracts. The Funds may utilize forward foreign currency exchange contracts (“forward contracts”) under which they are obligated to exchange currencies on specified future dates at specified rates, and are subject to foreign exchange rates fluctuations. All contracts are“marked-to-market” daily and any resulting unrealized gains or losses are recorded as unrealized appreciation or depreciation on foreign currency transactions. The Funds record realized gains or losses at the time the forward contract is settled. These gains and losses are reflected on the Statements of Operations as realized gain (loss) on foreign currency transactions. Counterparties to these forward contracts are major U.S. financial institutions (see Note 7). |
| J | Futures Contracts. The Alternative Strategies Fund and the High Income Alternatives Fund invest in financial futures contracts primarily for the purpose of hedging their existing portfolio securities, or securities that the Funds intend to purchase, against fluctuations in fair value caused by changes in prevailing market interest rates. Upon entering into a financial futures contract, a Fund is required to pledge to the broker an amount of cash, U.S. government securities, or other assets, equal to a certain percentage of the contract amount (initial margin deposit). Subsequent payments, known as variation margin, are made or received by a Fund each day, depending on the daily fluctuations in the fair value of the underlying security. Each Fund recognizes a gain or loss equal to the daily variation margin. If market conditions move unexpectedly, a Fund may not achieve the anticipated benefits of the financial futures contracts and may realize a loss. The use of futures transactions involves the risk of imperfect correlation in movements in the price of futures contracts, interest rates, and the underlying hedged assets (see Note 7). |
| K | Interest Rate Swaps. During the year ended December 31, 2019, the Alternative Strategies Fund and the High Income Alternatives Fund invest in interest rate swaps. An interest rate swap is an agreement that obligates two parties to exchange a series of cash flows at specified intervals, based upon or calculated by reference to changes in interest rates on a specified notional principal amount. The payment flows are usually netted against each other, with the difference being paid by one party |
| Notes to Financial Statements | 127 | |||||
Table of Contents
Litman Gregory Funds Trust
NOTES TO FINANCIAL STATEMENTS – (Continued)
| to the other. Bilateral swap contracts are agreements in which a Fund and a counterparty agree to exchange periodic payments on a specified notional amount or make a net payment upon termination. Bilateral swap transactions are privately negotiated in the OTC market and payments are settled through direct payments between a Fund and the counterparty. By contrast, certain swap transactions are subject to mandatory central clearing. These swaps are executed through a derivatives clearing member (“DCM”), acting in an agency capacity, and submitted to a central counterparty (“CCP”) (“centrally cleared swaps”), in which case all payments are settled with the CCP through the DCM. Swaps aremarked-to-market daily using pricing vendor quotations, counterparty or clearinghouse prices or model prices, and the change in value, if any, is recorded as an unrealized gain or loss. Upon entering into a swap contract, a Fund is required to satisfy an initial margin requirement by delivering cash or securities to the counterparty (or in some cases, segregated in a triparty account on behalf of the counterparty), which can be adjusted by anymark-to-market gains or losses pursuant to bilateral or centrally cleared arrangements. For centrally cleared swaps the daily change in valuation, and upfront payments, if any, are recorded as a receivable or payable for variation margin on the Statements of Assets and Liabilities (see Note 7). |
| L | Credit Default Swaps. During the year ended December 31, 2019, the Alternative Strategies Fund and the High Income Alternatives Fund entered into credit default swaps to manage their exposure to the market or certain sectors of the market, to reduce their risk exposure to defaults of corporate issuers or indexes or to create exposure to corporate issuers or indexes to which they are not otherwise exposed. In a credit default swap, the protection buyer makes a stream of payments based on a fixed percentage applied to the contract notional amount to the protection seller in exchange for the right to receive a specified return upon the occurrence of a defined credit event on the reference obligation which may be either a single security or a basket of securities issued by corporate or sovereign issuers. Although contract-specific, credit events are generally defined as bankruptcy, failure to pay, restructuring, obligation acceleration, obligation default, or repudiation/moratorium. Upon the occurrence of a defined credit event, the difference between the value of the reference obligation and the swap’s notional amount is recorded as realized gain (for protection written) or loss (for protection sold) in the Statements of Operations. In the case of credit default swaps where a Fund is selling protection, the notional amount approximates the maximum loss (see Note 7). For centrally cleared swaps the daily change in valuation, and upfront payments, if any, are recorded as a receivable or payable for variation margin on the Statements of Assets and Liabilities (see Note 7). |
| M | Total Return Swaps. During the year ended December 31, 2019, the Alternative Strategies Fund and the High Income Alternatives Fund invest in total return swaps. Total return swap is the generic name for anynon-traditional swap where one party agrees to pay the other the “total return” of a defined underlying asset, usually in return for receiving a stream of London Interbank Offered Rate (“LIBOR”) based cash flows. A total return swap may be applied to any underlying asset but is most commonly used with equity indices, single stocks, bonds and defined portfolios of loans and mortgages. Total return swap is a mechanism for the user to accept the economic benefits of asset ownership without utilizing the Statement of Assets and Liabilities. The other leg of the swap, usually LIBOR, is a spread to reflect thenon-Statement of Assets and Liabilities nature of the product. No notional amounts are exchanged with total return swaps. The total return receiver assumes the entire economic exposure – that is, both market and credit exposure – to the reference asset. The total return payer – often the owner of the reference obligation – gives up economic exposure to the performance of the reference asset and in return takes on counterparty credit exposure to the total return receiver in the event of a default or fall in value of the reference asset (see Note 7). |
| N | Purchasing Put and Call Options. Each Fund may purchase covered “put” and “call” options with respect to securities which are otherwise eligible for purchase by a Fund and with respect to various stock indices subject to certain restrictions. Each Fund will engage in trading of such derivative securities primarily for hedging purposes. |
If a Fund purchases a put option, a Fund acquires the right to sell the underlying security at a specified price at any time during the term of the option (for “American-style” options) or on the option expiration date (for “European-style” options). Purchasing put options may be used as a portfolio investment strategy when a portfolio manager perceives significant short-term risk but substantial long-term appreciation for the underlying security. The put option acts as an insurance policy, as it protects against significant downward price movement while it allows full participation in any upward movement. If a Fund is holding a stock which it feels has strong fundamentals, but for some reason may be weak in the near term, a Fund may purchase a put option on such security, thereby giving itself the right to sell such security at a certain strike price throughout the term of the option. Consequently, a Fund will exercise the put only if the price of such security falls below the strike price of the put. The difference between the put’s strike price and the market price of the underlying security on the date a Fund exercises the put, less transaction costs, will be the amount by which a Fund will be able to hedge against a decline in the underlying security. If during the period of the option the market price for the underlying security remains at or above the put’s strike price, the put will expire worthless, representing a loss of the price a Fund paid for the put, plus transaction costs. If the price of the underlying security increases, the profit a Fund realizes on the sale of the security will be reduced by the premium paid for the put option less any amount for which the put may be sold.
| 128 | Litman Gregory Funds Trust | |||||
Table of Contents
Litman Gregory Funds Trust
NOTES TO FINANCIAL STATEMENTS – (Continued)
If a Fund purchases a call option, it acquires the right to purchase the underlying security at a specified price at any time during the term of the option. The purchase of a call option is a type of insurance policy to hedge against losses that could occur if a Fund has a short position in the underlying security and the security thereafter increases in price. Each Fund will exercise a call option only if the price of the underlying security is above the strike price at the time of exercise. If during the option period the market price for the underlying security remains at or below the strike price of the call option, the option will expire worthless, representing a loss of the price paid for the option, plus transaction costs. If the call option has been purchased to hedge a short position of a Fund in the underlying security and the price of the underlying security thereafter falls, the profit a Fund realizes on the cover of the short position in the security will be reduced by the premium paid for the call option less any amount for which such option may be sold.
Prior to exercise or expiration, an option may be sold when it has remaining value by a purchaser through a “closing sale transaction,” which is accomplished by selling an option of the same series as the option previously purchased. Each Fund generally will purchase only those options for which a Manager believes there is an active secondary market to facilitate closing transactions (see Note 7).
Writing Call Options. Each Fund may write covered call options. A call option is “covered” if a Fund owns the security underlying the call or has an absolute right to acquire the security without additional cash consideration (or, if additional cash consideration is required, cash or cash equivalents in such amount as are held in a segregated account by the Custodian). The writer of a call option receives a premium and gives the purchaser the right to buy the security underlying the option at the exercise price. The writer has the obligation upon exercise of the option to deliver the underlying security against payment of the exercise price during the option period. If the writer of an exchange-traded option wishes to terminate his obligation, he may effect a “closing purchase transaction.” This is accomplished by buying an option of the same series as the option previously written. A writer may not effect a closing purchase transaction after it has been notified of the exercise of an option.
Effecting a closing transaction in the case of a written call option will permit a Fund to write another call option on the underlying security with either a different exercise price, expiration date or both. Also, effecting a closing transaction will permit the cash or proceeds from the concurrent sale of any securities subject to the option to be used for other investments of a Fund. If a Fund desires to sell a particular security from its portfolio on which it has written a call option, it will effect a closing transaction prior to or concurrent with the sale of the security.
Each Fund will realize a gain from a closing transaction if the cost of the closing transaction is less than the premium received from writing the option or if the proceeds from the closing transaction are more than the premium paid to purchase the option. Each Fund will realize a loss from a closing transaction if the cost of the closing transaction is more than the premium received from writing the option or if the proceeds from the closing transaction are less than the premium paid to purchase the option. However, because increases in the market price of a call option will generally reflect increases in the market price of the underlying security, any loss to a Fund resulting from the repurchase of a call option is likely to be offset in whole or in part by appreciation of the underlying security owned by a Fund (see Note 7).
Writing Put Options.Each Fund may write put options. By writing put options, the Fund takes on the risk of declines in the value of the underlying instrument, including the possibility of a loss up to the entire strike price of each option it sells, but without the corresponding opportunity to benefit from potential increases in the value of the underlying instrument. When the Fund writes a put option, it assumes the risk that it must purchase the underlying instrument at a strike price that may be higher than the market price of the instrument. If there is a broad market decline and the Fund is able to close out its written put options, it may result in substantial losses to the Fund.
Risks of Investing in Options. There are several risks associated with transactions in options on securities. Options may be more volatile than the underlying instruments and, therefore, on a percentage basis, an investment in options may be subject to greater fluctuation than an investment in the underlying instruments themselves. There are also significant differences between the securities and options markets that could result in an imperfect correlation between these markets, causing a given transaction not to achieve its objective. In addition, a liquid secondary market for particular options may be absent for reasons which include the following: there may be insufficient trading interest in certain options; restrictions may be imposed by an exchange on opening transactions or closing transactions or both; trading halts, suspensions or other restrictions may be imposed with respect to particular classes or series of option of underlying securities; unusual or unforeseen circumstances may interrupt normal operations on an exchange; the facilities of an exchange or clearing corporation may not at all times be adequate to handle current trading volume; or one or more exchanges could, for economic or other reasons, decide or be compelled at some future date to discontinue the trading of options (or a particular class or series of options), in which event the secondary market on that exchange (or in that class or series of options) would cease to exist, although outstanding options that had been issued by a clearing corporation as a result of trades on that exchange would continue to be exercisable in accordance with their terms.
A decision as to whether, when and how to use options involves the exercise of skill and judgment, and even a well-conceived transaction may be unsuccessful to some degree because of market behavior or unexpected events. The extent to which a Fund
| Notes to Financial Statements | 129 | |||||
Table of Contents
Litman Gregory Funds Trust
NOTES TO FINANCIAL STATEMENTS – (Continued)
may enter into options transactions may be limited by the requirements of the Internal Revenue Code of 1986, as amended (the “Code”), with respect to qualification of a Fund as a regulated investment company.
| O | Distributions to Shareholders. Distributions paid to shareholders are recorded on theex-dividend date. Net realized gains from securities transactions (if any) are generally distributed annually to shareholders. The amount of dividends and distributions from net investment income and net realized capital gains is determined in accordance with federal income tax regulations, which may differ from generally accepted accounting principles. To the extent these “book/tax” differences are permanent in nature (i.e., that they result from other than timing of recognition – “temporary differences”), such amounts are reclassified within the capital accounts based on their federaltax-basis. |
| P | Federal Income Taxes. The Funds intend to comply with the requirements of Subchapter M of the Code applicable to regulated investment companies and to distribute all of their taxable income to their shareholders. Accordingly, no provisions for federal income taxes are required. The Funds have reviewed the tax positions, taken on federal income tax returns, for each of the three open tax years (as applicable) and as of December 31, 2019, and have determined that no provision for income tax is required in the Funds’ financial statements. The Funds recognize interest and penalties, if any, related to unrecognized tax benefits as income tax expenses in the Statements of Operations. During the year ended December 31, 2019, the Funds did not incur any interest or penalties. Foreign securities held by the Funds may be subject to foreign taxation on dividend and interest income received. Foreign taxes, if any, net of any reclaims, are recorded based on the tax regulations and rates that exist in the foreign markets in which the Funds’ invest. |
Taxes on foreign interest and dividend income are generally withheld in accordance with the applicable country’s tax treaty with the United States. The foreign withholding rates applicable to a Fund’s investments in certain jurisdictions may be higher if a significant portion of the Fund is held bynon-U.S. shareholders. Each Fund may be subject to taxation on realized capital gains, repatriation proceeds and other transaction-based charges imposed by certain countries in which it invests. Taxes related to capital gains realized during the year ended December 31, 2019, if any, are reflected as part of net realized gain (loss) in the Statements of Operations.
Changes in tax liabilities related to capital gain taxes on unrealized investment gains, if any, are reflected as part of change in net unrealized appreciation (depreciation) in the Statements of Operations. Transaction-based charges are generally calculated as a percentage of the transaction amount.
The Funds may have previously filed for and/or may file for additional tax refunds with respect to certain taxes withheld by certain countries. Generally, the amount of such refunds that a Fund reasonably determines are collectible and free from significant contingencies are reflected in a Fund’s net asset value and are reflected as foreign tax reclaims receivable in the Statements of Assets and Liabilities. In certain circumstances, a Fund’s receipt of such refunds may cause the Fund and/or its shareholders to be liable for U.S. federal income taxes and interest charges.
Foreign taxes paid by each Fund may be treated, to the extent permissible by the Code (and other applicable U.S. federal tax guidance) and if that Fund so elects, as if paid by U.S. shareholders of that Fund.
| Q | Security Transactions, Dividend and Interest Income and Expenses. Security transactions are accounted for on the trade date. Realized gains and losses on securities transactions are reported on an identified cost basis. Dividend income and, where applicable, related foreign tax withholding expenses are recorded on theex-dividend date. Interest income is recorded on an accrual basis. Purchase discounts and premiums on fixed-income securities are accreted and amortized to maturity using the effective interest method and reflected within interest income on the Statements of Operations. Many expenses of the Trust can be directly attributed to a specific Fund. Each Fund is charged for expenses directly attributed to it. Expenses that cannot be directly attributed to a specific Fund are allocated among the Funds in the Trust in proportion to their respective net assets or other appropriate method. Realized and unrealized gains and losses and net investment income, not including class specific expenses, are allocated daily to each class of shares based upon the relative proportion of net assets of each class. Differences in per share distributions by class are generally due to differences in class specific expenses. Class specific expenses, such as12b-1 expenses, are directly attributed to that specific class. |
| R | Restricted Cash. At December 31, 2019, the Alternative Strategies Fund and the High Income Alternatives Fund held restricted cash in connection with investments in certain derivative securities. Restricted cash is held in a segregated account with the Alternative Strategies Fund’s and the High Income Alternatives Fund’s Custodian as well as with brokers and is reflected in the Statements of Assets and Liabilities as deposits at brokers for securities sold short, futures, options, and swaps. Restrictions may include legally restricted deposits held as compensating balances against short-term borrowing arrangements or contracts entered into with others. |
The Funds consider their investment in an Federal Deposits Insurance Corporation (“FDIC”) insured interest bearing savings account to be cash. The Funds maintain cash balances, which, at times, may exceed federally insured limits. The Funds maintain these balances with a high quality financial institution.
| 130 | Litman Gregory Funds Trust | |||||
Table of Contents
Litman Gregory Funds Trust
NOTES TO FINANCIAL STATEMENTS – (Continued)
| S | Restricted Securities. A restricted security cannot be resold to the general public without prior registration under the Securities Act of 1933. If the security is subsequently registered and resold, the issuers would typically bear the expense of all registrations at no cost to the Fund. Restricted securities are valued according to the guidelines and procedures adopted by the Funds’ Board of Trustees. As of December 31, 2019, there were no restricted securities held in the Funds. |
| T | Illiquid Securities. Each Fund may not invest more than 15% of the value of its net assets in illiquid securities, including restricted securities that are not deemed to be liquid by theSub-Advisors. The Advisor and theSub-Advisors will monitor the amount of illiquid securities in a Fund’s portfolio, under the supervision of the Board, to ensure compliance with a Fund’s investment restrictions. In accordance with procedures approved by the Board, these securities may be valued using techniques other than market quotations, and the values established for these securities may be different than what would be produced through the use of another methodology or if they had been priced using market quotations. Illiquid securities and other portfolio securities that are valued using techniques other than market quotations, including “fair valued” securities, may be subject to greater fluctuation in their value from one day to the next than would be the case if market quotations were used. In addition, there is no assurance that a Fund could sell a portfolio security for the value established for it at any time, and it is possible that a Fund would incur a loss because a portfolio security is sold at a discount to its established value. |
| U | Indemnification Obligations. Under the Trust’s organizational documents, its current and former officers and trustees are indemnified against certain liabilities arising out of the performance of their duties to the Funds. In addition, in the normal course of business, the Funds enter into contracts that contain a variety of representations and warranties that provide general indemnifications. The Funds’ maximum exposure under these arrangements is unknown as this would involve future claims that may be made against the Funds that have not yet occurred or that would be covered by other parties. |
Note 3 – Investment Advisory and Other Agreements
The Trust, on behalf of the Funds, entered into an Investment Advisory Agreement (the “Agreement”) with Litman Gregory Fund Advisors, LLC (the “Advisor”). Under the terms of the Agreement, each Fund pays a monthly investment advisory fee to the Advisor at the annual rate below of the respective Fund’s average daily net assets before any fee waivers:
| Contractual Management Rate | ||||||||||||||||||||||||||||||||||||||||||||
| Fund | First $450 million | Excess of $450 million | First $750 million | Excess of $750 million | First $1 billion | Excess of $1 billion | Between $1 and $2 billion | First $2 billion | Between $2 and $3 billion | Between $3 and $4 billion | Excess of $4 billion | |||||||||||||||||||||||||||||||||
Equity | — | — | 1.10 | % | 1.00 | % | — | — | — | — | — | — | — | |||||||||||||||||||||||||||||||
International | — | — | — | — | 1.10 | % | 1.00 | % | — | — | — | — | — | |||||||||||||||||||||||||||||||
Smaller Companies | 1.14 | % | 1.04 | % | — | — | — | — | — | — | — | — | — | |||||||||||||||||||||||||||||||
Alternative Strategies | — | — | — | — | — | — | — | 1.40 | % | 1.30 | % | 1.25 | % | 1.20 | % | |||||||||||||||||||||||||||||
High Income Alternatives | — | — | — | — | 0.95 | % | — | 0.925 | % | — | 0.90 | % | 0.875 | % | 0.85 | % | ||||||||||||||||||||||||||||
The Advisor engagessub-advisors to manage the Funds and pays thesub-advisors from its advisory fees.
Through April 30, 2021, the Advisor has contractually agreed to waive a portion of its advisory fees effectively reducing total advisory fees to approximately 0.99% of the average daily net assets of the Equity Fund, 0.86% of the average daily net assets of the International Fund, 0.72% of the average daily net assets of the Smaller Companies Fund, 1.28% of the average daily net assets of the Alternative Strategies Fund, and 0.75% of the average daily net assets of the High Income Alternatives Fund. Additionally, the Advisor has voluntarily agreed to waive its management fee on the daily cash values of the Funds not allocated to Managers. For the year ended December 31, 2019, the amount waived, contractual and voluntary, was $311,514, $963,627, $122,904, $2,325,569, and $368,906 for Equity Fund, International Fund, Smaller Companies Fund, Alternative Strategies Fund, and High Income Alternatives Fund, respectively. The Advisor has agreed not to seek recoupment of such waived fees. Through April 30, 2021, the Advisor has contractually agreed to waive a portion of its advisory fees and/or reimburse a portion of the High Income Alternatives Fund’s operating expenses (excluding any taxes, interest, brokerage commissions, expenses incurred in connection with any merger or reorganization, borrowing costs, (including commitment fees), dividend expenses, acquired fund fees and expenses and extraordinary expenses such as but not limited to litigation costs) to ensure that the total annual fund operating expenses after fee waiver and/or expense reimbursement for the Institutional and Investor Classes will not exceed 0.98% and 1.23% of the average daily net assets, respectively. During the year ended December 31, 2019, the amount waived contractually pursuant to an Expense Limitation Agreement was $185,435 for the High Income Alternatives Fund. The Advisor may be reimbursed by the Fund no later than the end of the third fiscal year following the year of the waiver provided that such reimbursement does not cause the Fund’s expenses to exceed the expense limitation. The Advisor is waiving its right to recoup these fees and any fees waived in prior years.
| Notes to Financial Statements | 131 | |||||
Table of Contents
Litman Gregory Funds Trust
NOTES TO FINANCIAL STATEMENTS – (Continued)
State Street Bank and Trust Company (“State Street”) serves as the Administrator, Custodian and Fund Accountant to the Funds.
DST Asset Manager Solutions, Inc. (“DST”) serves as the Funds’ Transfer Agent. The Funds’ principal underwriter is ALPS Distributors, Inc.
An employee of the Advisor serves as the Funds’ Chief Compliance Officer (“CCO”). The CCO receives no compensation from the Funds for his services, however, the Funds reimbursed the Advisor $68,240 for the year ended December 31, 2019 for the services of the CCO.
Wells Capital Management, Inc. used their respective affiliated entity for purchases of the Equity Fund and Smaller Companies Fund’s portfolio securities for the year ended December 31, 2019. There was no commissions paid for these transactions.
During the year ended December 31, 2019, each independent Trustee, within the meaning of the 1940 Act, was compensated by the Trust in the amount of $100,000.
Certain officers and Trustees of the Trust are also officers of the Advisor.
Note 4 – Distribution Plan
Certain Funds have adopted a Plan of Distribution (the “Plan”) dated February 25, 2009, as amended, pursuant to Rule12b-1 under the 1940 Act. Under the Plan, the Investor Classes of the Alternative Strategies Fund and High Income Alternatives Fund will compensate broker dealers or qualified institutions with whom each Fund has entered into a contract to distribute Fund shares (“Dealers”). Under the Plan, the amount of such compensation paid in any one year shall not exceed 0.25% annually of the average daily net assets of the Investor Classes, which may be payable as a service fee for providing recordkeeping, subaccounting, subtransfer agency and/or shareholder liaison services. Investor Class shares of the Equity Fund and International Fund were converted into Institutional Class shares at the close of business on April 29, 2019. For the year ended December 31, 2019, the Equity, International, Alternative Strategies, and High Income Funds’ Investor Classes incurred $34, $1,568, $418,376, and $3,148, respectively, pursuant to the Plan.
The Plan will remain in effect from year to year provided such continuance is approved at least annually by a vote either of a majority of the Trustees, including a majority of thenon-interested Trustees, or a majority of each Fund’s outstanding shares.
Note 5 – Investment Transactions
The cost of securities purchased and the proceeds from securities sold for the year ended December 31, 2019, excluding short-term investments and U.S. government obligations, were as follows:
| Fund | Purchases | Sales | ||||||
Equity Fund | $ | 67,962,243 | $ | 120,847,818 | ||||
International Fund | 172,574,240 | 243,529,495 | ||||||
Smaller Companies Fund | 16,639,676 | 21,349,108 | ||||||
Alternative Strategies Fund | 2,377,601,201 | 2,510,252,625 | ||||||
High Income Alternatives Fund | 88,205,260 | 61,216,463 | ||||||
During the year ended December 31, 2019, there were several purchases and sales transactions made in accordance with the established procedures pursuant to Rule17a-7 (the exemption of certain purchase or sale transactions between an investment company and certain affiliated persons thereof), arranged by DCI, LLC, on behalf of the Alternative Strategies Fund. The total of such purchases transactions were $6,092,615 and sales transactions were $7,813,523.
During the year ended December 31, 2019, there were several purchases and sales transactions made in accordance with the established procedures pursuant to Rule17a-7 (the exemption of certain purchase or sale transactions between an investment company and certain affiliated persons thereof), arranged by Guggenheim Partners Investment Management, LLC, on behalf of the High Income Alternatives Fund. The total of such purchases transactions were $237,250 and sales transactions were $31,146.
Note 6 – Fair Value of Financial Investments
The Funds follow a fair value hierarchy that distinguishes between market data obtained from independent sources (observable inputs) and the Funds’ own market assumptions (unobservable inputs). These inputs are used in determining the value of each Fund’s investments and are summarized in the following fair value hierarchy:
| Level 1 – | Quoted prices in active markets for identical securities. |
| Level 2 – | Other significant observable inputs (including quoted prices for similar securities, interest rates, foreign exchange rates, and fair value estimates for foreign securities indices). |
| Level 3 – | Significant unobservable inputs (including the Funds’ own assumptions in determining fair value of investments). |
| 132 | Litman Gregory Funds Trust | |||||
Table of Contents
Litman Gregory Funds Trust
NOTES TO FINANCIAL STATEMENTS – (Continued)
Fixed income securities including corporate, convertible and municipal bonds and notes, U.S. government agencies, U.S. Treasury obligations, U.S. Treasury inflation protected securities, sovereign issues, bank loans, convertible preferred securities andnon-U.S. bonds are normally valued on the basis of quotes obtained from brokers and dealers or independent pricing services or sources. Independent pricing services typically use information provided by market makers or estimates of market values obtained from yield data relating to investments or securities with similar characteristics. The service providers’ internal models use inputs that are observable such as, among other things, issuer details, interest rates, yield curves, prepayment speeds, credit risks/spreads, default rates and quoted prices for similar assets. Securities that use similar valuation techniques and inputs as described above are categorized as Level 2 of the fair value hierarchy.
Mortgage and asset-backed securities are usually issued as separate tranches, or classes, of securities within each deal. These securities are also normally valued by pricing service providers that use broker dealer quotations or valuation estimates from their internal pricing models. The pricing models for these securities usually consider tranche-level attributes, estimated cash flows and market-based yield spreads for each tranche, current market data and incorporates deal collateral performance, as available.
Stripped mortgage-backed securities are usually structured with two different classes: one that receives substantially all interest payments (interest-only, or “IO” and/or high coupon rate with relatively low principal amount, or “IOette”), and the other that receives substantially all principal payments (principal-only, or “PO”) from a pool of mortgage loans. Little to no principal will be received at the maturity of an IO; as a result, periodic adjustments are recorded to reduce the cost of the security until maturity. These adjustments are included in interest income.
Mortgage and asset-backed securities that use similar valuation techniques and inputs as described above are categorized as Level 2 of the fair value hierarchy.
Shares of the unregistered Underlying Funds are valued at their closing net asset value (“NAV”) as reported on each business day, as a practical expedient for fair value. Each of the unregistered Underlying Funds is daily valued and offer daily liquidity and hold no unfunded commitments. The shares of theopen-end registered Underlying Funds are valued at NAV each business day. If the Underlying Funds’ designated representative to the Trustee determines, based on its own due diligence and investment monitoring procedures, that the reported NAV per share does not represent fair value, Underlying Funds’ designated representative to the Trustee shall estimate the fair value of the Underlying Funds in good faith and in a manner that it reasonably chooses.
Financial derivative instruments, such as foreign currency contracts, options contracts, futures, or swap agreements, derive their value from underlying asset prices, indices, reference rates, and other inputs or a combination of these factors. These contracts are normally valued on the basis of broker dealer quotations or pricing service providers at the settlement price determined by the relevant exchange. Depending on the product and the terms of the transaction, the value of the derivative contracts can be estimated by a pricing service provider using a series of techniques, including simulation pricing models. The pricing models use inputs that are observed from actively quoted markets such as issuer details, indices, spreads, interest rates, curves, dividends and exchange rates. Derivatives that use similar valuation techniques and inputs as described above are categorized as Level 1 or Level 2 of the fair value hierarchy.
The following tables provide the fair value measurements of applicable Fund assets and liabilities by level within the fair value hierarchy for each Fund as of December 31, 2019. These assets and liabilities are measured on a recurring basis.
| Equity Fund | ||||||||||||||||
| Description | Level 1 - Quoted prices in active markets for identical assets | Level 2 - Significant other observable inputs | Level 3 - Significant unobservable inputs | Total | ||||||||||||
Equity(a) | ||||||||||||||||
Common Stocks | $ | 271,094,298 | $ | — | $ | — | $ | 271,094,298 | ||||||||
Preferred Stocks | 2,159,194 | — | — | 2,159,194 | ||||||||||||
|
| |||||||||||||||
Total Equity | 273,253,492 | — | — | 273,253,492 | ||||||||||||
|
| |||||||||||||||
Short-Term Investments | ||||||||||||||||
Repurchase Agreements | — | 12,612,000 | — | 12,612,000 | ||||||||||||
|
| |||||||||||||||
Total Investments in Securities | $ | 273,253,492 | $ | 12,612,000 | $ | — | $ | 285,865,492 | ||||||||
|
| |||||||||||||||
| (a) | See Fund’s Schedule of Investments in Securities for sector classifications. |
| Notes to Financial Statements | 133 | |||||
Table of Contents
Litman Gregory Funds Trust
NOTES TO FINANCIAL STATEMENTS – (Continued)
| International Fund | ||||||||||||||||
| Description | Level 1 - Quoted prices in active markets for identical assets | Level 2 - Significant other observable inputs | Level 3 - Significant unobservable inputs | Total | ||||||||||||
Equity | ||||||||||||||||
Common Stocks | ||||||||||||||||
Australia | $ | 4,127,422 | $ | — | $ | — | $ | 4,127,422 | ||||||||
Austria | 4,546,263 | — | — | 4,546,263 | ||||||||||||
Belgium | 6,374,874 | — | — | 6,374,874 | ||||||||||||
Bermuda | 29,031,365 | — | — | 29,031,365 | ||||||||||||
Canada | 7,357,179 | — | — | 7,357,179 | ||||||||||||
Cayman Islands | 15,454,788 | — | — | 15,454,788 | ||||||||||||
Denmark | 4,058,962 | — | — | 4,058,962 | ||||||||||||
Finland | 7,943,887 | — | — | 7,943,887 | ||||||||||||
France | 48,968,415 | — | — | 48,968,415 | ||||||||||||
Germany | 17,595,296 | — | — | 17,595,296 | ||||||||||||
Hong Kong | 25,214,651 | — | — | 25,214,651 | ||||||||||||
Ireland | 4,573,242 | — | — | 4,573,242 | ||||||||||||
Israel | 9,012,070 | — | — | 9,012,070 | ||||||||||||
Japan | 37,761,587 | — | — | 37,761,587 | ||||||||||||
Mexico | 5,214,525 | — | — | 5,214,525 | ||||||||||||
Monaco | 4,809,349 | — | — | 4,809,349 | ||||||||||||
Netherlands | 34,511,797 | — | — | 34,511,797 | ||||||||||||
Norway | 1,669,595 | — | — | 1,669,595 | ||||||||||||
Russia | 6,347,815 | — | — | 6,347,815 | ||||||||||||
South Africa | 4,002,224 | — | — | 4,002,224 | ||||||||||||
South Korea | 10,021,668 | — | — | 10,021,668 | ||||||||||||
Spain | — | — | 2,779,991 | ** | 2,779,991 | |||||||||||
Sweden | 13,636,875 | — | — | 13,636,875 | ||||||||||||
Switzerland | 31,597,537 | — | — | 31,597,537 | ||||||||||||
United Kingdom | 48,782,986 | — | — | 48,782,986 | ||||||||||||
United States | 3,539,508 | — | — | 3,539,508 | ||||||||||||
|
| |||||||||||||||
Total Equity | 386,153,880 | — | 2,779,991 | ** | 388,933,871 | |||||||||||
Short-Term Investments | ||||||||||||||||
Repurchase Agreements | — | 12,670,000 | — | 12,670,000 | ||||||||||||
|
| |||||||||||||||
Total Short-Term Investments | — | 12,670,000 | — | 12,670,000 | ||||||||||||
|
| |||||||||||||||
Total Investments in Securities | $ | 386,153,880 | $ | 12,670,000 | $ | 2,779,991 | ** | $ | 401,603,871 | |||||||
|
| |||||||||||||||
Other Financial Instruments* | ||||||||||||||||
Forward Foreign Currency Exchange Contracts | $ | (796,842 | ) | $ | — | $ | — | $ | (796,842 | ) | ||||||
| * | Other financial instruments are derivative instruments, such as futures, forward foreign currency exchange, swaps contracts and written options. Futures, forward foreign currency exchange and swap contracts are valued at the unrealized appreciation (depreciation) on the instrument, while written options are valued at fair value. |
| ** | Significant unobservable inputs were used in determining the value of portfolio securities for the International Fund. |
| Smaller Companies Fund | ||||||||||||||||
| Description | Level 1 - Quoted prices in active markets for identical assets | Level 2 - Significant other observable inputs | Level 3 - Significant unobservable inputs | Total | ||||||||||||
Equity(a) | ||||||||||||||||
Common Stocks | $ | 25,497,432 | $ | — | $ | — | $ | 25,497,432 | ||||||||
|
| |||||||||||||||
Total Equity | 25,497,432 | — | — | 25,497,432 | ||||||||||||
|
| |||||||||||||||
Short-Term Investments | ||||||||||||||||
Repurchase Agreements | — | 3,215,000 | — | 3,215,000 | ||||||||||||
|
| |||||||||||||||
Total Investments in Securities | $ | 25,497,432 | $ | 3,215,000 | $ | — | $ | 28,712,432 | ||||||||
|
| |||||||||||||||
| (a) | See Fund’s Schedule of Investments in Securities for sector classifications. |
| 134 | Litman Gregory Funds Trust | |||||
Table of Contents
Litman Gregory Funds Trust
NOTES TO FINANCIAL STATEMENTS – (Continued)
| Alternative Strategies Fund | ||||||||||||||||
| Description | Level 1 - Quoted prices in active markets for identical assets | Level 2 - Significant other observable inputs | Level 3 - Significant unobservable inputs | Total | ||||||||||||
Equity(a) | ||||||||||||||||
Common Stocks | $ | 467,214,470 | $ | 5,810,165 | $ | 3,213,658 | ** | $ | 476,238,293 | |||||||
Limited Partnerships | — | — | 1,063,211 | ** | 1,063,211 | |||||||||||
Preferred Stocks | 1,852,133 | — | 1,468,800 | ** | 3,320,933 | |||||||||||
|
| |||||||||||||||
Total Equity | 469,066,603 | 5,810,165 | 5,745,669 | ** | 480,622,437 | |||||||||||
|
| |||||||||||||||
Rights/Warrants | — | 34,942 | — | 34,942 | ||||||||||||
Fixed Income | ||||||||||||||||
Asset-Backed Securities | — | 175,810,821 | 819,019 | ** | 176,629,840 | |||||||||||
Bank Loans | — | 48,467,205 | 4,157,399 | ** | 52,624,604 | |||||||||||
Convertible Bonds | — | 5,950,172 | — | 5,950,172 | ||||||||||||
Corporate Bonds | — | 529,333,555 | 637,500 | ** | 529,971,055 | |||||||||||
Government Securities & Agency Issue | — | 18,167,660 | — | 18,167,660 | ||||||||||||
Mortgage-Backed Securities | — | 361,014,320 | 1,173,447 | (1) | 362,187,767 | |||||||||||
Municipal Bonds | — | 4,347,912 | — | 4,347,912 | ||||||||||||
|
| |||||||||||||||
Total Fixed Income | — | 1,143,091,645 | 6,787,365 | ** | 1,149,879,010 | |||||||||||
|
| |||||||||||||||
Short-Term Investments | ||||||||||||||||
Treasury Bills | — | 41,829,233 | — | 41,829,233 | ||||||||||||
Repurchase Agreements | — | 170,800,000 | — | 170,800,000 | ||||||||||||
|
| |||||||||||||||
Total Short-Term Investments | — | 212,629,233 | — | 212,629,233 | ||||||||||||
|
| |||||||||||||||
Purchased Options | 142,890 | 3,122 | — | 146,012 | ||||||||||||
|
| |||||||||||||||
Investments Valued at NAV(2) | — | — | — | 1,887,184 | ||||||||||||
|
| |||||||||||||||
Total Investments in Securities | $ | 469,209,493 | $ | 1,361,569,107 | $ | 12,533,034 | ** | $ | 1,845,198,818 | |||||||
|
| |||||||||||||||
Fixed Income | ||||||||||||||||
Unfunded Loan Commitments | — | 62,948 | — | 62,948 | ||||||||||||
|
| |||||||||||||||
Total Investments in Securities in Assets | $ | 469,209,493 | $ | 1,361,632,055 | $ | 12,533,034 | ** | $ | 1,845,261,766 | |||||||
|
| |||||||||||||||
Short Sales | ||||||||||||||||
Common Stocks | (35,295,591 | ) | — | — | (35,295,591 | ) | ||||||||||
Exchange-Traded Funds | (20,130,879 | ) | — | — | (20,130,879 | ) | ||||||||||
Corporate Bonds | — | (2,324,699 | ) | — | (2,324,699 | ) | ||||||||||
|
| |||||||||||||||
Total Short Sales | (55,426,470 | ) | (2,324,699 | ) | — | (57,751,169 | ) | |||||||||
|
| |||||||||||||||
Total Investments in Securities in Liabilities | $ | (55,426,470 | ) | $ | (2,324,699 | ) | $ | — | $ | (57,751,169 | ) | |||||
|
| |||||||||||||||
Other Financial Instruments* | ||||||||||||||||
Forward Foreign Currency Exchange Contracts | $ | (613,494 | ) | $ | — | $ | — | $ | (613,494 | ) | ||||||
Futures | 512,304 | — | — | 512,304 | ||||||||||||
Swaps - Credit Default | — | (4,313,591 | ) | — | (4,313,591 | ) | ||||||||||
Swaps - Total Return | — | (982,471 | ) | — | (982,471 | ) | ||||||||||
Written Options | (19,430 | ) | — | — | (19,430 | ) | ||||||||||
| (a) | See Fund’s Schedule of Investments in Securities for sector classifications. |
| * | Other financial instruments are derivative instruments, such as futures, forward foreign currency exchange, swaps contracts and written options. Futures, forward foreign currency exchange and swap contracts are valued at the unrealized appreciation (depreciation) on the instrument, while written options are valued at fair value. |
| ** | Significant unobservable inputs were used in determining the value of portfolio securities for the Alternative Strategies Fund. |
| (1) | These securities were priced by a pricing service; however, theAdvisor/Sub-Advisor used their fair value procedures based on other available inputs which more accurately reflected the current fair value of these securities. |
| (2) | As of December 31, 2019, certain of the Portfolio’s investments were valued using net asset value per unit as practical expedient (“NAV”) and have been excluded from the fair value hierarchy. |
| Notes to Financial Statements | 135 | |||||
Table of Contents
Litman Gregory Funds Trust
NOTES TO FINANCIAL STATEMENTS – (Continued)
There was $1,288,971 transferred from Level 2 to Level 3 in Alternative Strategies Fund. Securities transferred from Level 2 to Level 3 were due to the lack of third party pricing or other observable inputs.
| High Income Alternatives Fund | ||||||||||||||||
| Description | Level 1 - Quoted prices in active markets for identical assets | Level 2 - Significant other observable inputs | Level 3 - Significant unobservable inputs | Total | ||||||||||||
Equity(a) | ||||||||||||||||
Common Stocks | $ | 11,131,851 | $ | — | $ | — | $ | 11,131,851 | ||||||||
Preferred Stocks | 1,314,646 | — | — | 1,314,646 | ||||||||||||
Closed-End Fund | 155,320 | — | — | 155,320 | ||||||||||||
Exchange-Traded Funds | 1,028,186 | — | — | 1,028,186 | ||||||||||||
|
| |||||||||||||||
Total Equity | 13,630,003 | — | — | 13,630,003 | ||||||||||||
|
| |||||||||||||||
Fixed Income | ||||||||||||||||
Asset-Backed Securities | — | 21,390,316 | — | 21,390,316 | ||||||||||||
Bank Loans | — | 12,788,796 | — | 12,788,796 | ||||||||||||
Corporate Bonds | — | 12,067,243 | 206,510 | ** | 12,273,753 | |||||||||||
Government Securities & Agency Issue | — | 21,138,160 | — | 21,138,160 | ||||||||||||
Mortgage-Backed Securities | — | 7,105,277 | — | 7,105,277 | ||||||||||||
Municipal Bond | — | 5,100 | — | 5,100 | ||||||||||||
|
| |||||||||||||||
Total Fixed Income | — | 74,494,892 | 206,510 | ** | 74,701,402 | |||||||||||
|
| |||||||||||||||
Short-Term Investments | ||||||||||||||||
Certificate of Deposits | — | 300,000 | — | 300,000 | ||||||||||||
Money Market Funds | 848,134 | — | — | 848,134 | ||||||||||||
Repurchase Agreements | — | 3,550,495 | — | 3,550,495 | ||||||||||||
Treasury Bills | — | 1,002,064 | — | 1,002,064 | ||||||||||||
|
| |||||||||||||||
Total Short-Term Investments | 848,134 | 4,852,559 | — | 5,700,693 | ||||||||||||
|
| |||||||||||||||
Interest Rate Swaptions | — | 39,487 | — | 39,487 | ||||||||||||
|
| |||||||||||||||
Total Investments in Securities | $ | 14,478,137 | $ | 79,386,938 | $ | 206,510 | ** | $ | 94,071,585 | |||||||
|
| |||||||||||||||
Fixed Income | ||||||||||||||||
Unfunded Loan Commitments | — | 14,425 | — | 14,425 | ||||||||||||
|
| |||||||||||||||
Total Investments in Securities in Assets | $ | 14,478,137 | $ | 79,401,363 | $ | 206,510 | ** | $ | 94,086,010 | |||||||
|
| |||||||||||||||
Other Financial Instruments* | ||||||||||||||||
Forward Foreign Currency Exchange Contracts | $ | 25,426 | $ | — | $ | — | $ | 25,426 | ||||||||
Futures | (1,890 | ) | — | — | (1,890 | ) | ||||||||||
Swaps - Interest Rate | — | (88,950 | ) | — | (88,950 | ) | ||||||||||
Swaps - Credit Default | — | (80,611 | ) | — | (80,611 | ) | ||||||||||
Swaps - Total Return | — | 513 | — | 513 | ||||||||||||
Written Options | (75,819 | ) | — | — | (75,819 | ) | ||||||||||
| (a) | See Fund’s Schedule of Investments in Securities for sector classifications. |
| * | Other financial instruments are derivative instruments, such as futures, forward foreign currency exchange, swaps contracts and written options. Futures, forward foreign currency exchange and swap contracts are valued at the unrealized appreciation (depreciation) on the instrument, while written options are valued at fair value. |
| ** | Significant unobservable inputs were used in determining the value of portfolio securities for the High Income Alternatives Fund. |
| 136 | Litman Gregory Funds Trust | |||||
Table of Contents
Litman Gregory Funds Trust
NOTES TO FINANCIAL STATEMENTS – (Continued)
Note 7 – Other Derivative Information
At December 31, 2019, the Funds are invested in derivative contracts which are reflected in the Statements of Assets and Liabilities as follows:
| International Fund | ||||||||||||||||||
Derivative Assets | Derivative Liabilities | |||||||||||||||||
| Risk | Statements of Assets and Liabilities Location | Fair Value Amount | Statements of Assets and Liabilities Location | Fair Value Amount | ||||||||||||||
Currency | Unrealized gain on forward foreign currency exchange contracts | $ | — | Unrealized loss on forward foreign currency exchange contracts | $ | (796,842 | ) | |||||||||||
|
| |||||||||||||||||
| Alternative Strategies Fund | ||||||||||||||||||||
Derivative Assets | Derivative Liabilities | |||||||||||||||||||
| Risk | Statements of Assets and Liabilities Location | Fair Value Amount | Statements of Assets and Liabilities Location | Fair Value Amount | ||||||||||||||||
Currency | Unrealized gain on forward foreign currency exchange contracts | $ | 397,435 | Unrealized loss on forward foreign currency exchange contracts | $ | (1,010,929 | ) | |||||||||||||
Interest rate | Unrealized gain on futures contracts* | 532,516 | Unrealized loss on futures contracts* | (20,212 | ) | |||||||||||||||
Credit | Unrealized gain on swap contracts** | 9,048,370 | Unrealized loss on swap contracts** | (13,361,961 | ) | |||||||||||||||
Equity | Unrealized gain on swap contracts | — | Unrealized loss on swap contracts | (982,471 | ) | |||||||||||||||
| Investments in securities(1) | 146,012 | Written options | (19,430 | ) | ||||||||||||||||
|
| |||||||||||||||||||
| Total | $ | 10,124,333 | $ | (15,395,003 | ) | |||||||||||||||
|
| |||||||||||||||||||
|
| * Includes cumulative appreciation/depreciation on futures contracts described previously. Only
** Includes cumulative appreciation/depreciation on centrally cleared swaps.
(1) The Statements of Assets and Liabilities location for “Purchased Options” is “Investments in |
| ||||||||||||||||||
| Notes to Financial Statements | 137 | |||||
Table of Contents
Litman Gregory Funds Trust
NOTES TO FINANCIAL STATEMENTS – (Continued)
| High Income Alternatives Fund | ||||||||||||||||||||
Derivative Assets | Derivative Liabilities | |||||||||||||||||||
| Risk | Statements of Assets and Liabilities Location | Fair Value Amount | Statements of Assets and Liabilities Location | Fair Value Amount | ||||||||||||||||
Currency | Unrealized gain on forward foreign currency exchange contracts | $ | 86,360 | Unrealized loss on forward foreign currency exchange contracts | $ | (60,934 | ) | |||||||||||||
Interest rate | Unrealized gain on swap contracts | — | Unrealized loss on swap contracts** | (88,950 | ) | |||||||||||||||
| Unrealized gain on futures contracts* | 3,368 | Unrealized loss on futures contracts* | (5,258 | ) | ||||||||||||||||
| Investments in securities(1) | 39,487 | Written options | — | |||||||||||||||||
Credit | Unrealized gain on swap contracts | — | Unrealized loss on swap contracts** | (80,611 | ) | |||||||||||||||
Equity | Unrealized gain on swap contracts | 846 | Unrealized loss on swap contracts | (333 | ) | |||||||||||||||
| Written options | (75,819 | ) | ||||||||||||||||||
|
| |||||||||||||||||||
| Total | $ | 130,061 | $ | (311,905 | ) | |||||||||||||||
|
| |||||||||||||||||||
|
| ** Includes cumulative appreciation/depreciation on centrally cleared swaps.
* Includes cumulative appreciation/depreciation on futures contracts described previously. Only
(1) The Statements of Assets and Liabilities location for “Interest Rate Swaptions” is “Investments |
| ||||||||||||||||||
For the year ended December 31, 2019, the effect of derivative contracts in the Funds’ Statements of Operations were as follows:
| International Fund | ||||||||||||||
| Statements of Operations | ||||||||||||||
| Risk | Derivative Type | Net Realized Gain (Loss) | Net Change in Unrealized Gain (Loss) | Average Notional Amount | ||||||||||
Currency | Forward foreign currency exchange contracts | $723,027 | $ | (885,110 | ) | 14,619,358 | (a) | |||||||
| (a) | Average notional values are based on the average of monthly end contract values for the year ended December 31, 2019. |
| Alternative Strategies Fund | ||||||||||||||||||
Statements of Operations | ||||||||||||||||||
| Risk | Derivative Type | Net Realized Gain (Loss) | Net Change in Unrealized Gain (Loss) | Average Notional Amount | ||||||||||||||
Currency | Forward foreign currency exchange contracts | $ | (104,188 | ) | $ | (507,752 | ) | 86,533,420 | (a) | |||||||||
| Purchased option contracts | (114,621 | ) | 91,657 | — | (b) | |||||||||||||
Interest rate | Swap contracts | (891,015 | ) | 634,633 | — | (b)(c) | ||||||||||||
| Future contracts | (8,342,827 | ) | 2,672,052 | 358,786,093 | (b) | |||||||||||||
Credit | Swap contracts | 8,904,352 | (16,801,692 | ) | 1,759,088,980 | (b)(c) | ||||||||||||
Equity | Swap contracts | (8,463,083 | ) | (982,471 | ) | 90,774,509 | (b)(c) | |||||||||||
| Future contracts | (2,452,560 | ) | (203,572 | ) | 10,270,988 | (b) | ||||||||||||
| Purchased option contracts | (2,744,807 | ) | (54,800 | ) | 9,145 | (d) | ||||||||||||
| Written option contracts | 194,745 | (49,755 | ) | 2,786 | (d) | |||||||||||||
|
| |||||||||||||||||
| Total | $ | (14,014,004 | ) | $ | (15,201,700 | ) | ||||||||||||
|
| |||||||||||||||||
| (a) | Average notional values are based on the average of monthly end contract values for the year ended December 31, 2019. |
| (b) | Average notional values are based on the average of monthly end notional balances for the year ended December 31, 2019. |
| 138 | Litman Gregory Funds Trust | |||||
Table of Contents
Litman Gregory Funds Trust
NOTES TO FINANCIAL STATEMENTS – (Continued)
| (c) | Notional amount is denoted in local currency. |
| (d) | Average contracts are based on the average of monthly end contracts for the year ended December 31, 2019. |
| High Income Alternatives Fund | ||||||||||||||||||
| Statements of Operations | ||||||||||||||||||
| Risk | Derivative Type | Net Realized Gain (Loss) | Net Change in Unrealized Gain (Loss) | Average Notional Amount | ||||||||||||||
Currency | Forward foreign currency exchange contracts | $ | 14,908 | $ | 34,038 | 2,619,732 | (a) | |||||||||||
Interest rate | Swap contracts | (20,093 | ) | (38,661 | ) | 2,950,000 | (b)(c) | |||||||||||
| Future contracts | 1,933 | (1,890 | ) | 705,944 | (b) | |||||||||||||
| Purchased option contracts | (18 | ) | (22,213 | ) | 19,350,000 | (b) | ||||||||||||
Credit | Swap contracts | (51,584 | ) | (102,490 | ) | 5,385,000 | (b)(c) | |||||||||||
Equity | Swap contracts | 924 | 513 | 85,725 | (b)(c) | |||||||||||||
| Purchased option contracts | (42,314 | ) | 14,036 | 1 | (d) | |||||||||||||
| Written option contracts | 1,607,543 | (101,358 | ) | 71 | (d) | |||||||||||||
|
| |||||||||||||||||
| Total | $ | 1,511,299 | $ | (218,025 | ) | |||||||||||||
|
| |||||||||||||||||
| (a) | Average notional values are based on the average of monthly end contract values for the year ended December 31, 2019. |
| (b) | Average notional values are based on the average of monthly end notional balances for the year ended December 31, 2019. |
| (c) | Notional amount is denoted in local currency. |
| (d) | Average contracts are based on the average of monthly end contracts for the year ended December 31, 2019. |
The Funds are subject to various Master Netting Arrangements, which govern the terms of certain transactions with select counterparties. The Master Netting Arrangements allow the Funds to close out and net their total exposure to a counterparty in the event of a default with respect to all the transactions governed under a single agreement with a counterparty. The Master Netting Arrangements also specify collateral posting arrangements atpre-arranged exposure levels. Under the Master Netting Arrangements, collateral is routinely transferred if the total net exposure to certain transactions (net of existing collateral already in place) governed under the relevant Master Netting Arrangement with a counterparty in a given account exceeds a specified threshold depending on the counterparty and the type of Master Netting Arrangement.
At December 31, 2019, Equity Fund, International Fund, Smaller Companies Fund, Alternative Strategies Fund, and High Income Alternatives Fund had investments in repurchase agreements with a gross value of $12,612,000, $12,670,000, $3,215,000, $170,800,000, and $3,550,495, respectively, which are reflected as repurchase agreements on the Statements of Assets and Liabilities. The value of the related collateral exceeded the value of the repurchase agreements at December 31, 2019.
The following tables represent the disclosure for derivative instruments related to offsetting assets and liabilities for each of the Funds as of December 31, 2019:
| International Fund | ||||||||||||||||||||||||||||||||||||||||||||||||||||||
| Derivative Assets | Derivative Liabilities | |||||||||||||||||||||||||||||||||||||||||||||||||||||
| Counterparty | Purchased Options | Futures | Swaps | Forward Currency Contracts | Total | Futures | Swaps | Forward Currency Contracts | Written Options | Total | Net Derivative Asset (Liabilities) | Collateral (Received) Pledged | Net Amount | |||||||||||||||||||||||||||||||||||||||||
State Street Bank and Trust Company | $ | — | $ | — | $ | — | $ | — | $ | — | $ | — | $ | — | $ | (796,842 | ) | $ | — | $ | (796,842 | ) | $ | (796,842 | ) | $ | — | $ | (796,842 | ) | ||||||||||||||||||||||||
|
| |||||||||||||||||||||||||||||||||||||||||||||||||||||
| Notes to Financial Statements | 139 | |||||
Table of Contents
Litman Gregory Funds Trust
NOTES TO FINANCIAL STATEMENTS – (Continued)
| Alternative Strategies Fund | ||||||||||||||||||||||||||||||||||||||||||||||||||||||
| Derivative Assets | Derivative Liabilities | |||||||||||||||||||||||||||||||||||||||||||||||||||||
| Counterparty | Purchased Options | Futures(1) | Swaps(2) | Forward Currency Contracts | Total | Futures(1) | Swaps(2) | Forward Currency Contracts | Written Options | Total | Net Derivative Asset (Liabilities) | Collateral (Received) Pledged | Net Amount | |||||||||||||||||||||||||||||||||||||||||
Bank of America N.A. | $ | — | $ | — | $ | — | $ | 125,590 | $125,590 | $ | — | $ | — | $ | (16,814 | ) | $ | — | $ | (16,814 | ) | $ | 108,776 | $ | — | $ | 108,776 | |||||||||||||||||||||||||||
Barclays Bank Plc | — | — | — | 55,384 | 55,384 | — | — | (2,037 | ) | — | (2,037 | ) | 53,347 | — | 53,347 | |||||||||||||||||||||||||||||||||||||||
Citibank N.A. | — | — | — | — | — | — | — | (101,397 | ) | — | (101,397 | ) | (101,397 | ) | — | (101,397 | ) | |||||||||||||||||||||||||||||||||||||
Citigroup Global Markets, Inc. | — | 532,516 | — | — | 532,516 | (19,367 | ) | — | — | — | (19,367 | ) | 513,149 | — | 513,149 | |||||||||||||||||||||||||||||||||||||||
Credit Suisse International | — | — | — | — | — | — | — | (111,268 | ) | — | (111,268 | ) | (111,268 | ) | — | (111,268 | ) | |||||||||||||||||||||||||||||||||||||
Deutsche Bank AG | — | — | — | 15,606 | 15,606 | — | — | (59,709 | ) | — | (59,709 | ) | (44,103 | ) | — | (44,103 | ) | |||||||||||||||||||||||||||||||||||||
Goldman Sachs & Co. | 74,492 | — | — | 45,452 | 119,944 | — | — | (291,198 | ) | — | (291,198 | ) | (171,254 | ) | 171,254 | — | ||||||||||||||||||||||||||||||||||||||
HSBC Holdings Plc | — | — | — | 76,278 | 76,278 | — | — | — | — | — | 76,278 | — | 76,278 | |||||||||||||||||||||||||||||||||||||||||
JPMorgan Chase Bank N.A. | — | — | 950,907 | 22,611 | 973,518 | (845 | ) | (1,017,621 | ) | (81,732 | ) | — | (1,100,198 | ) | (126,680 | ) | — | (126,680 | ) | |||||||||||||||||||||||||||||||||||
Morgan Stanley & Co. | 71,520 | — | — | 25,480 | 97,000 | — | (53,701 | ) | (303,041 | ) | (19,430 | ) | (376,172 | ) | (279,172 | ) | 279,172 | — | ||||||||||||||||||||||||||||||||||||
UBS AG | — | — | — | 31,034 | 31,034 | — | — | (43,733 | ) | — | (43,733 | ) | (12,699 | ) | — | (12,699 | ) | |||||||||||||||||||||||||||||||||||||
|
|
|
|
|
|
|
|
|
|
|
| |||||||||||||||||||||||||||||||||||||||||||
Total | $ | 146,012 | $ | 532,516 | $ | 950,907 | $ | 397,435 | $2,026,870 | $ | (20,212 | ) | $ | (1,071,322 | ) | $ | (1,010,929 | ) | $ | (19,430 | ) | $ | (2,121,893 | ) | $ | (95,023 | ) | $ | 450,426 | $ | 355,403 | |||||||||||||||||||||||
|
|
|
|
|
|
|
|
|
|
|
| |||||||||||||||||||||||||||||||||||||||||||
| (1) | Includes cumulative appreciation (depreciation) of futures contracts as reported in the Notes to Schedule of Investments. Only current day’s variation margin is reported within the Statements of Assets and Liabilities. |
| (2) | Does not include the unrealized appreciation (depreciation) of centrally cleared swaps as reported in the Notes to Schedule of Investments. Only the variation margin is reported within the Statements of Assets and Liabilities. |
| High Income Alternatives Fund | ||||||||||||||||||||||||||||||||||||||||||||||||||||||||
| Derivative Assets | Derivative Liabilities | |||||||||||||||||||||||||||||||||||||||||||||||||||||||
| Counterparty | Interest | Futures(1) | Swaps(2) | Forward Currency Contracts | Total | Futures(1) | Swaps(2) | Forward Currency Contracts | Written Options | Total | Net Derivative Asset (Liabilities) | Collateral (Received) Pledged | Net Amount | |||||||||||||||||||||||||||||||||||||||||||
Bank of America N.A. | $ | 16,850 | $ | — | $ | — | $ | 929 | $ | 17,779 | $ | — | $ | — | $ | (3,650 | ) | $ | — | $ | (3,650 | ) | $ | 14,129 | $ | — | $ | 14,129 | ||||||||||||||||||||||||||||
Barclays Bank Plc | — | — | — | — | — | — | — | (2,223 | ) | — | (2,223 | ) | (2,223 | ) | — | (2,223 | ) | |||||||||||||||||||||||||||||||||||||||
Citibank N.A. | — | — | — | 2,664 | 2,664 | — | — | (4,999 | ) | — | (4,999 | ) | (2,335 | ) | — | (2,335 | ) | |||||||||||||||||||||||||||||||||||||||
Goldman Sachs & Co. | — | 3,368 | — | — | 3,368 | (5,258 | ) | — | — | — | (5,258 | ) | (1,890 | ) | — | (1,890 | ) | |||||||||||||||||||||||||||||||||||||||
Goldman Sachs International | 8,851 | — | — | 24,772 | 33,623 | — | (12,921 | ) | (34,782 | ) | — | (47,703 | ) | (14,080 | ) | — | (14,080 | ) | ||||||||||||||||||||||||||||||||||||||
JPMorgan Chase Bank N.A. | — | — | 846 | 47,935 | 48,781 | — | (333 | ) | (2,111 | ) | — | (2,444 | ) | 46,337 | — | 46,337 | ||||||||||||||||||||||||||||||||||||||||
Morgan Stanley & Co. | 13,786 | — | — | 10,060 | 23,846 | — | (6,043 | ) | (13,169 | ) | — | (19,212 | ) | 4,634 | — | 4,634 | ||||||||||||||||||||||||||||||||||||||||
UBS Securities LLC | — | — | — | — | — | — | — | — | (75,819 | ) | (75,819 | ) | (75,819 | ) | — | (75,819 | ) | |||||||||||||||||||||||||||||||||||||||
|
|
|
|
|
|
|
|
|
|
|
| |||||||||||||||||||||||||||||||||||||||||||||
Total | $ | 39,487 | $ | 3,368 | $ | 846 | $ | 86,360 | $ | 130,061 | $ | (5,258 | ) | $ | (19,297 | ) | $ | (60,934 | ) | $ | (75,819 | ) | $ | (161,308 | ) | $ | (31,247 | ) | $ | — | $ | (31,247 | ) | |||||||||||||||||||||||
|
|
|
|
|
|
|
|
|
|
|
| |||||||||||||||||||||||||||||||||||||||||||||
| (1) | Includes cumulative appreciation (depreciation) of futures contracts as reported in the Notes to Schedule of Investments. Only current day’s variation margin is reported within the Statements of Assets and Liabilities. |
| (2) | Does not include the unrealized appreciation (depreciation) of centrally cleared swaps as reported in the Notes to Schedule of Investments. Only the variation margin is reported within the Statements of Assets and Liabilities. |
Note 8 – Commitments and Contingencies for Private Equity
The Alternative Strategies Fund’s investment portfolio invests in GACP II, LLC, a private equity fund that makes credit investments. The Fund partially funded the investment at the time of purchase the security. The Fund’s total commitment for this investment was $2,600,000. The Fund has provided funding to the total commitment over the years.
At December 31, 2019, the unfunded portion of the commitment was as follows:
| Borrower | Unfunded Commitment | |||
GACP II, LLC | $ | 256,355 | ||
| 140 | Litman Gregory Funds Trust | |||||
Table of Contents
Litman Gregory Funds Trust
NOTES TO FINANCIAL STATEMENTS – (Continued)
Note 9 – Income Taxes and Distributions to Shareholders
As of December 31, 2019 the components of accumulated earnings (losses) for income tax purposes were as follows:
| Equity Fund | International Fund | Smaller Companies Fund | Alternative Strategies Fund | High Income Alternatives Fund | ||||||||||||||||
Tax cost of investments and derivatives | $ | 190,137,872 | $ | 360,898,068 | $ | 27,375,334 | $ | 1,700,025,333 | $ | 93,122,783 | ||||||||||
Gross Tax Unrealized Appreciation | 99,557,660 | 64,085,060 | 3,400,353 | 215,318,986 | 1,715,134 | |||||||||||||||
Gross Tax Unrealized Depreciation | (3,830,040 | ) | (23,379,680 | ) | (2,063,255 | ) | (128,978,449 | ) | (854,769 | ) | ||||||||||
|
|
|
| |||||||||||||||||
Net Tax unrealized appreciation (depreciation) on investments and derivatives | 95,727,620 | 40,705,380 | 1,337,098 | 86,340,537 | 860,365 | |||||||||||||||
Net Tax unrealized appreciation (depreciation) on foreign currency | (9,927 | ) | (7,243 | ) | — | 12,768 | 343 | |||||||||||||
|
|
|
| |||||||||||||||||
Net Tax unrealized appreciation (depreciation) | 95,717,693 | 40,698,137 | 1,337,098 | 86,353,305 | 860,708 | |||||||||||||||
|
|
|
| |||||||||||||||||
Undistributed Ordinary Income | — | 5,705,081 | — | — | — | |||||||||||||||
|
|
|
| |||||||||||||||||
Undistributed Long-Term Capital Gains | 6,941,803 | — | — | — | 86,867 | |||||||||||||||
|
|
|
| |||||||||||||||||
Capital Loss Carry Forward | — | (38,306,691 | ) | (88,569 | ) | (20,608,143 | ) | — | ||||||||||||
|
|
|
| |||||||||||||||||
Current Year Ordinay Late Year Losses | — | — | — | (2,197,867 | ) | (45,315 | ) | |||||||||||||
|
|
|
| |||||||||||||||||
Straddle Loss Deferral and Reversal | — | — | — | (842,831 | ) | — | ||||||||||||||
|
|
|
| |||||||||||||||||
Other Accumulated Gains/(Losses) | — | (2 | ) | — | (14,830 | ) | 58 | |||||||||||||
|
|
|
| |||||||||||||||||
Total accumulated earnings | $ | 102,659,496 | $ | 8,096,525 | $ | 1,248,529 | $ | 62,689,634 | $ | 902,318 | ||||||||||
|
|
|
| |||||||||||||||||
The difference between book-basis andtax-basis unrealized appreciation is attributable primarily to wash sales, forward foreign currency exchange contracts, futures contracts, options contracts, swap contracts, passive foreign investment company adjustments, partnership basis adjustments, organizational expenses, and constructive sales.
For the year ended December 31, 2019, capital loss carry over used in current year was as follows:
| Fund | Capital Loss Carryover Utilized | |||
International Fund | $ | 4,721,435 | ||
Alternative Strategies Fund | 4,871,907 | |||
High Income Alternatives Fund | 1,190,910 | |||
The capital loss carry forwards for each Fund were as follows:
| Equity Fund | International Fund | Smaller Companies Fund | Alternative Strategies Fund | High Income Alternatives Fund | ||||||||||||||||
Capital Loss Carryforwards | ||||||||||||||||||||
Perpetual Short-Term | $ | — | $ | (38,306,691 | ) | $ | (88,569 | ) | $ | (16,075,806 | ) | $ | — | |||||||
Perpetual Long-Term | — | — | — | (4,532,337 | ) | — | ||||||||||||||
|
|
|
|
|
|
|
|
|
| |||||||||||
Total | $ | — | $ | (38,306,691 | ) | $ | (88,569 | ) | $ | (20,608,143 | ) | $ | — | |||||||
|
|
|
|
|
|
|
|
|
| |||||||||||
Additionally, U.S. generally accepted accounting principles require that certain components of net assets relating to permanent differences be reclassified between financial and tax reporting. These reclassifications have no effect on net assets or net asset value per share. For the year ended December 31, 2019, the following table shows the reclassifications made:
| Fund | Accumulated Distributable Earnings (Deficit) | Paid In Capital | ||||||
Equity Fund* | $ | (83,389 | ) | $ | 83,389 | |||
International Fund* | — | — | ||||||
Smaller Companies Fund* | (167,000 | ) | 167,000 | |||||
Alternative Strategies Fund* | 61 | (61 | ) | |||||
High Income Alternatives Fund* | (6,603 | ) | 6,603 | |||||
| * | The permanent differences primarily relate to net operating losses, equalization adjustments, and tax treatment of partnerships. |
| Notes to Financial Statements | 141 | |||||
Table of Contents
Litman Gregory Funds Trust
NOTES TO FINANCIAL STATEMENTS – (Continued)
The tax composition of dividends (other than return of capital dividends), for the year ended December 31, 2019 and the year or period ended December 31, 2018 were as follows:
| 2019 | 2018 | |||||||||||||||||||
| Fund | Ordinary Income | Long-Term Capital Gain | Ordinary Income | Long-Term Capital Gain | ||||||||||||||||
Equity Fund | $ | 1,231,485 | $ | 23,579,152 | $ | 1,425,865 | $ | 33,711,091 | ||||||||||||
International Fund | 11,877,156 | — | 2,833,906 | — | ||||||||||||||||
Smaller Companies Fund | 2,238,440 | 627,462 | — | — | ||||||||||||||||
Alternative Strategies Fund | 52,212,885 | — | 62,077,478 | — | ||||||||||||||||
High Income Alternatives Fund | 3,055,538 | 265,169 | 474,530 | — | ||||||||||||||||
The Funds did not have any unrecognized tax benefits at December 31, 2019, nor were there any increases or decreases in unrecognized tax benefits for the year ended December 31, 2019. The Funds are subject to examination by the U.S. federal and state tax authorities for returns filed for the prior three and four fiscal years, respectively.
Note 10 – Line of Credit
The Trust has an unsecured, uncommitted $75,000,000 line of credit with the Custodian, for the Equity Fund, International Fund, Smaller Companies Fund and High Income Alternatives Fund (the “Four Funds”) expiring on May 1, 2020. Borrowings under this agreement bear interest at the higher of the overnight federal funds rate and daily one month LIBOR plus a spread of 1.00% per annum. There is no annual commitment fee on the uncommitted line of credit. The Trust also had a secured, uncommitted $125,000,000 line of credit for the Alternative Strategies Fund with the Custodian, expiring on July 23, 2020. There is no annual commitment fee but, anon-refundableup-front fee of $50,000. The line of credit is secured by a general security interest in substantially all of the Alternative Strategies Fund’s assets. Borrowings under this agreement bear interest at the higher of the overnight federal funds rate andone-month LIBOR plus a spread of 1.25% per annum.
Amounts outstanding to the Four Funds under the Facility at no time shall exceed in the aggregate at any time the least of (a) $75,000,000; (b) 10% of the value of the total assets of each Fund less such Fund’s total liabilities not represented by senior securities less the value of any assets of the Fund pledged to, or otherwise segregated for the benefit of a party other than the Bank and in connection with a liability not reflected in the calculation of the Fund’s total liabilities. Amounts outstanding for the Alternative Strategies Fund at no time shall exceed in the aggregate at any time the lesser of the (a) Borrowing Base, (b) the Facility amount of $125,000,000 and (c) should not have an aggregate amount of outstanding senior securities representing indebtedness the least of (i) 33 1/3% of the Alternative Strategies Fund’s net assets and (ii) the maximum amount that the Fund would be permitted to incur pursuant to applicable law.
For the year ended December 31, 2019, the interest expense was $67,962 for Equity Fund, $21,344 for International Fund, and $239,182 for Alternative Strategies Fund. For the year ended December 31, 2019, there were no borrowings for the Smaller Companies Fund and High Income Alternatives Fund, and there was no balance outstanding at the end of the year. There was no balance outstanding at December 31, 2019 for the Equity Fund, International Fund, and Alternative Strategies Fund. The average borrowing for the year ended December 31, 2019 for the Equity Fund for the period the line was drawn was $14,367,347, at an average borrowing rate of 3.4485%. The average borrowing for the year ended December 31, 2019 for the International Fund for the period the line was drawn was $6,078,947, at an average borrowing rate of 3.3336%. The average borrowing for the year ended December 31, 2019 for the Alternative Strategies Fund for the period the line was drawn was $19,683,761, at an average borrowing rate of 3.7373%. During the year ended December 31, 2019, the maximum borrowing was $16,000,000, $7,000,000, and $26,000,000 for the Equity Fund, International Fund, and Alternative Strategies Fund, respectively.
Note 11 – Principal Risks
Below are summaries of the principal risks of investing in one or more of the Funds, each of which could adversely affect a Fund’s net asset value, yield and total return. Each risk listed below does not necessarily apply to each Fund, and you should read a Fund’s prospectus carefully for a description of the principal risks associated with investing in a particular Fund.
| • | Asset-Backed Securities Risk. This is the risk that the impairment of the value of the collateral underlying a security in which the High Income Alternatives Fund invests, such as thenon-payment of loans, will result in a reduction in the value of the security. The value of these securities may also fluctuate in response to the market’s perception of the value of issuers or collateral. |
| • | Below Investment-Grade Fixed Income Securities Risk. This is the risk of investing in below investment-grade fixed income securities (also known as “junk bonds”), which may be greater than that of higher rated fixed income securities. These securities are rated Ba1 through C by Moody’s Investors Service (“Moody’s”) or BB+ through D by Standard & Poor’s Rating Group (“S&P”) (or comparably rated by another nationally recognized statistical rating organization), or, if not rated by Moody’s or S&P, are |
| 142 | Litman Gregory Funds Trust | |||||
Table of Contents
Litman Gregory Funds Trust
NOTES TO FINANCIAL STATEMENTS – (Continued)
| considered by thesub-advisors to be of similar quality. These securities have greater risk of default than higher rated securities. The market value of these securities is more sensitive to corporate developments and economic conditions and can be volatile. Market conditions can diminish liquidity and make accurate valuations difficult to obtain. There is no limit to the Alternative Strategies Fund’s ability to invest in below investment-grade fixed income securities; however, under normal market conditions, it does not expect to invest more than 50% of its total assets in below investment-grade fixed income securities. |
| • | Capital Structure Arbitrage Risk. The perceived mispricing identified by thesub-advisor may not disappear or may even increase, in which case losses may be realized. |
| • | Collateral Risk. If the Alternative Strategies Fund and High Income Alternatives Fund’s financial instruments are secured by collateral, the issuer may have difficulty liquidating the collateral and/or the Fund may have difficulty enforcing its rights under the terms of the securities if an issuer defaults. Collateral may be insufficient or the Fund’s right to the collateral may be set aside by a court. Collateral will generally consist of assets that may not be readily liquidated, including for example, equipment, inventory, work in the process of manufacture, real property and payments to become due under contracts or other receivable obligations. There is no assurance that the liquidation of those assets would satisfy an issuer’s obligations under a financial instrument.Non-affiliates and affiliates of issuers of financial instruments may provide collateral in the form of secured and unsecured guarantees and/or security interests in assets that they own, which may also be insufficient to satisfy an issuer’s obligations under a financial instrument. |
| • | Collateralized Loan Obligations and Collateralized Debt Obligations Risk. Collateralized loan obligations (“CLOs”) bear many of the same risks as other forms of asset-backed securities, including interest rate risk, credit risk and default risk. As they are backed by pools of loans, CLOs also bear similar risks to investing in loans directly. CLOs issue classes or “tranches” that vary in risk and yield. CLOs may experience substantial losses attributable to loan defaults. Losses caused by defaults on underlying assets are borne first by the holders of subordinate tranches. The Alternative Strategies Fund and High Income Alternatives Fund’s investment in CLOs may decrease in market value when the CLO experiences loan defaults or credit impairment, the disappearance of a subordinate tranche, or market anticipation of defaults and investor aversion to CLO securities as a class. |
Collateralized debt obligations (“CDOs”) are structured similarly to CLOs and bear the same risks as CLOs including interest rate risk, credit risk and default risk. CDOs are subject to additional risks because they are backed by pools of assets other than loans including securities (such as other asset-backed securities), synthetic instruments or bonds and may be highly leveraged. Like CLOs, losses incurred by a CDO are borne first by holders of subordinate tranches. Accordingly, the risks of CDOs depend largely on the type of underlying collateral and the tranche of CDOs in which the Fund invests. For example, CDOs that obtain their exposure through synthetic investments entail the risks associated with derivative instruments.
| • | Convertible Arbitrage Risk. Arbitrage strategies involve engaging in transactions that attempt to exploit price differences of identical, related or similar securities on different markets or in different forms. A Fund may realize losses or reduced rate of return if underlying relationships among securities in which investment positions are taken change in an adverse manner or a transaction is unexpectedly terminated or delayed. Trading to seek short-term capital appreciation can be expected to cause the Fund’s portfolio turnover rate to be substantially higher than that of the average equity-oriented investment company, resulting in higher transaction costs and additional capital gains tax liabilities. |
| • | Convertible Securities Risk. This is the risk that the market value of convertible securities may fluctuate due to changes in, among other things, interest rates; other general economic conditions; industry fundamentals; market sentiment; the issuer’s operating results, financial statements, and credit ratings; and the market value of the underlying common or preferred stock. |
| • | Credit Risk. This is the risk that a Fund could lose money if the issuer or guarantor of a fixed income security, or the counterparty of a derivatives contract or other transaction, is unable or unwilling (or is perceived to be unable or unwilling) to make timely payment of principal and/or interest, or to otherwise honor its obligations. |
| • | Currency Risk. This is the risk that investing in foreign currencies may expose the Fund to fluctuations in currency exchange rates and that such fluctuations in the exchange rates may negatively affect an investment related to a currency or denominated in a foreign currency. The Alternative Strategies Fund may invest in foreign currencies for investment and hedging purposes. All of the Funds may invest in foreign currencies for hedging purposes. |
| • | Cybersecurity Risk. Information and technology systems relied upon by the Funds, the Advisor, thesub-advisors, the Funds’ service providers (including, but not limited to, Fund accountants, custodians, transfer agents, administrators, distributors and other financial intermediaries) and/or the issuers of securities in which a Fund invests may be vulnerable to damage or interruption from computer viruses, network failures, computer and telecommunication failures, infiltration by unauthorized persons, security breaches, usage errors, power outages and catastrophic events such as fires, tornadoes, floods, hurricanes and earthquakes. Although the Advisor has implemented measures to manage risks relating to these types of events, if these systems are compromised, become inoperable for extended periods of time or cease to function properly, significant investment may be required to fix or replace them. The failure of these systems and/or of disaster recovery plans could cause significant interruptions |
| Notes to Financial Statements | 143 | |||||
Table of Contents
Litman Gregory Funds Trust
NOTES TO FINANCIAL STATEMENTS – (Continued)
| in the operations of the Funds, the Advisor, thesub-advisors, the Funds’ service providers and/or issuers of securities in which a Fund invests and may result in a failure to maintain the security, confidentiality or privacy of sensitive data, including personal information relating to investors (and the beneficial owners of investors). Such a failure could also harm the reputation of the Funds, the Advisor, thesub-advisors, the Funds’ service providers and/or issuers of securities in which a Fund invests, subject such entities and their respective affiliates to legal claims or otherwise affect their business and financial performance. |
| • | Debt Securities Risk. This is the risk that the value and liquidity of debt securities may be reduced under certain circumstances. The value of debt securities can fluctuate in response to issuer activity and changes in general economic and credit market conditions, including changes in interest rates. In recent years, dealer capacity in the debt and fixed income markets appears to have undergone fundamental changes, including a reduction in dealer market-making capacity. These changes have the potential to decrease substantially liquidity and increase volatility in the debt and fixed income markets. |
| • | Derivatives Risk. This is the risk that an investment in derivatives may not correlate completely to the performance of the underlying securities and may be volatile and that the insolvency of the counterparty to a derivative instrument could cause the Fund to lose all or substantially all of its investment in the derivative instrument, as well as the benefits derived therefrom. |
| • | Options Risk. This is the risk that an investment in options may be subject to greater fluctuation than an investment in the underlying instruments themselves and may be subject to a complete loss of the amounts paid as premiums to purchase the options. |
| • | Futures Contracts Risk. This is the risk that an investment in futures contracts may be subject to losses that exceed the amount of the premiums paid and may subject the Fund’s net asset value to greater volatility. |
| • | P-Notes Risk. This is the risk that the performance results ofP-Notes will not replicate exactly the performance of the issuers or markets that theP-Notes seek to replicate. Investments inP-Notes involve risks normally associated with a direct investment in the underlying securities as well as additional risks, such as counterparty risk. |
| • | Swaps Risk.Risks inherent in the use of swaps include: (1) swap contracts may not be assigned without the consent of the counterparty; (2) potential default of the counterparty to the swap; (3) absence of a liquid secondary market for any particular swap at any time; and (4) possible inability of the Fund to close out the swap transaction at a time that otherwise would be favorable for it to do so. |
| • | Distressed Companies Risk. A Fund may invest a portion of its assets in securities of distressed companies. Debt obligations of distressed companies typically are unrated, lower rated, in default or close to default and may be difficult to value accurately or may become worthless. |
| • | Emerging Markets Risk. A Fund may invest a portion of its assets in emerging market countries. Emerging market countries are those with immature economic and political structures, and investing in emerging markets entails greater risk than in developed markets. Such risks could include those related to government dependence on a few industries or resources, government-imposed taxes on foreign investment or limits on the removal of capital from a country, unstable government, and volatile markets. |
| • | Equity Securities Risk. This is the risk that the value of equity securities may fluctuate, sometimes rapidly and unpredictably, due to factors affecting the general market, an entire industry or sector, or particular companies. These factors include, without limitation, adverse changes in economic conditions, the general outlook for corporate earnings, interest rates or investor sentiment; increases in production costs; and significant management decisions. This risk is greater for small- andmedium-sized companies, which tend to be more vulnerable to adverse developments than larger companies. |
| • | Event-Driven Risk. Event-driven strategies seek to profit from the market inefficiencies surrounding market events, such as mergers, acquisitions, asset sales, restructurings, refinancings, recapitalizations, reorganizations or other special situations. Event-driven investing involves attempting to predict the outcome of a particular transaction as well as the optimal time at which to commit capital to it. Event-driven opportunities involve difficult legal as well as financial analysis, as some of the principal impediments to the consummation of major corporate events are often legal or regulatory rather than economic. In addition, certain of the securities issued in the context of major corporate events include complex call, put and other features, and it is difficult to precisely evaluate the terms and embedded option characteristics of these securities. A Fund may take both long and short positions in a wide range of securities, derivatives and other instruments in implementing its event-driven strategies. |
| • | Foreign Investment and Emerging Markets Risks. This is the risk that an investment in foreign(non-U.S.) securities may cause the Funds to experience more rapid and extreme changes in value than a fund that invests exclusively in securities of U.S. companies, due to factors such as currency conversion rate fluctuations, currency blockages, political and economic instability, differences in financial reporting, accounting and auditing standards, nationalization, expropriation or confiscatory taxation, and smaller and less-strict regulation of securities markets. These risks are greater in emerging markets. There is no limit to the Alternative Strategies Fund’s ability to invest in emerging market securities; however, under normal market conditions, it does not expect to invest more than 50% of its total assets in emerging market securities; however, some Funds may invest a portion of their assets in stocks of companies based outside of the United States. |
| 144 | Litman Gregory Funds Trust | |||||
Table of Contents
Litman Gregory Funds Trust
NOTES TO FINANCIAL STATEMENTS – (Continued)
| • | Interest Rate Risk. This is the risk that debt securities will decline in value because of changes in interest rates. A Fund with a longer average portfolio duration will be more sensitive to changes in interest rates than a Fund with a shorter average portfolio duration. |
| • | Investment Companies Risk. This is the risk that investing in other investment companies, including ETFs, CEFs, BDCs, unit investment trusts andopen-end funds, subjects the Fund to those risks affecting the investment vehicle, including the possibility that the value of the underlying securities held by the investment vehicle could decrease or the portfolio becomes illiquid. Moreover, the High Income Alternatives Fund and its shareholders will incur its pro rata share of the underlying vehicles’ expenses, which will reduce the Fund’s performance. In addition, investments in an ETF are subject to, among other risks, the risk that the ETF’s shares may trade at a discount or premium relative to the net asset value of the shares and the listing exchange may halt trading of the ETF’s shares. BDCs may carry risks similar to those of a private equity or venture capital fund. BDC company securities are not redeemable at the option of the shareholder and they may trade in the market at a discount to their net asset value. BDCs usually trade at a discount to their net asset value because they invest in unlisted securities and have limited access to capital markets. Shares of CEFs also frequently trade at a discount to their net asset value for those and other reasons. |
| • | Investments in Loan Risk. Investments in loans, including loan syndicates and other direct lending opportunities, involve special types of risks, including credit risk, interest rate risk, counterparty risk and prepayment risk. Loans may offer a fixed or floating interest rate. Loans are often generally below investment grade and may be unrated. The High Income Alternatives Fund’s investments in loans can also be difficult to value accurately and may be more susceptible to liquidity risk than fixed-income instruments of similar credit quality and/or maturity. The Fund is also subject to the risk that the value of the collateral for the loan may be insufficient or unavailable to cover the borrower’s obligations should the borrower fail to make payments or become insolvent. Participations in loans may subject the Fund to the credit risk of both the borrower and the issuer of the participation and may make enforcement of loan covenants, if any, more difficult for the Fund as legal action may have to go through the issuer of the participations. Transactions in loans are often subject to long settlement periods, thus potentially limiting the ability of the Fund to invest sale proceeds in other investments and to use proceeds to meet its current redemption obligations. In addition, many banks have been weakened by the recent financial crisis, and it may be difficult for the Fund to obtain an accurate picture of a lending bank’s financial condition. |
| • | Large Shareholder Purchase and Redemption Risk. This is the risk that a Fund may experience adverse effects when certain large shareholders purchase or redeem large amounts of shares of the Fund. Such large shareholder redemptions may cause the Fund to sell its securities at times when it would not otherwise do so, which may negatively impact the Fund’s net asset value and liquidity. Similarly, large share purchases may adversely affect the Fund’s performance to the extent that the Fund is delayed in investing new cash and is required to maintain a larger cash position than it ordinarily would. In addition, a large redemption could result in the Fund’s current expenses being allocated over a smaller asset base, leading to an increase in the Fund’s expense ratio. |
| • | Leverage Risk. This is the risk that leverage may cause the effect of an increase or decrease in the value of the Alternative Strategies Fund’s portfolio securities to be magnified and the Fund to be more volatile than if leverage was not used. Leverage may result from certain transactions, including the use of derivatives and borrowing. Under normal circumstances, the Alternative Strategies Fund may borrow amounts up to one third of the value of its total assets except that it may exceed this limit to satisfy redemption requests or for other temporary purposes. |
| • | Market Risk. As with all mutual funds that invest in common stocks, the value of an individual’s investment will fluctuate daily in response to the performance of the individual stocks held in a Fund. The stock market has been subject to significant volatility recently, which has increased the risks associated with an investment in a Fund. |
| • | Merger Arbitrage Risk. This is the risk that a proposed reorganization in which the Alternative Strategies Fund invests may be renegotiated or terminated. |
| • | MLP Risk. Investing in MLP units involves some risks that differ from an investment in the equity securities of a company. Holders of MLP units have limited control and voting rights on matters affecting the partnership. Holders of units issued by a MLP are exposed to a remote possibility of liability for all of the obligations of that MLP in the event that a court determines that the rights of the holders of MLP units to vote to remove or replace the general partner of that MLP, to approve amendments to that MLP’s partnership agreement, or to take other action under the partnership agreement of that MLP would constitute “control” of the business of that MLP, or a court or governmental agency determines that the MLP is conducting business in a state without complying with the partnership statute of that state. Holders of MLP units are also exposed to the risk that they will be required to repay amounts to the MLP that are wrongfully distributed to them. |
| • | Mortgage-Backed Securities Risk. This is the risk of investing in mortgaged-backed securities, which includes interest rate risk, prepayment risk and the risk of defaults on the mortgage loans underlying these securities. |
| • | Mortgage REIT Risk. Investing in mREITs involves certain risks related to investing in real property mortgages. In addition, mREITs must satisfy highly technical and complex requirements in order to qualify for the favorable tax treatment accorded to REITs under the Internal Revenue Code of 1986 (the “Code”). No assurances can be given that a mREIT in which the High Income |
| Notes to Financial Statements | 145 | |||||
Table of Contents
Litman Gregory Funds Trust
NOTES TO FINANCIAL STATEMENTS – (Continued)
| Alternatives Fund invests will be able to continue to qualify as a REIT or that complying with the REIT requirements under the Code will not adversely affect such REIT’s ability to execute its business plan. |
| • | Multi-Style Management Risk. Because portions of a Fund’s assets are managed by different portfolio managers using different styles, the Fund could experience overlapping security transactions. Certain portfolio managers may be purchasing securities at the same time other portfolio managers may be selling those same securities, which may lead to higher transaction expenses compared to a Fund using a single investment management style. |
| • | Municipal Securities Risk. Municipal securities can be significantly affected by litigation, political or economic events, as well as uncertainties in the municipal market related to taxation, legislative changes or the rights of municipal security holders. Municipal securities backed by current or anticipated revenues from specific projects or assets can be negatively affected by the inability of the issuer to collect revenues for the projects or from the assets. |
| • | Portfolio Turnover Risk. This is the risk that a Fund may experience high portfolio turnover rates as a result of its investment strategies. High portfolio turnover rates may indicate higher transaction costs and may result in higher taxes when shares of a Fund are held in a taxable account as compared to shares in investment companies that hold investments for a longer period. High portfolio turnover involves correspondingly greater expenses to a Fund, including brokerage commissions or dealermark-ups and other transaction costs on the sale of securities and reinvestments in other securities, which may result in adverse tax consequences to a Fund’s shareholders as compared to shares in investment companies that hold investments for a longer period. |
| • | Short Sale Risk. This is the risk that the value of a security the Alternative Strategies Fund sells short does not go down as expected. The risk of loss is theoretically unlimited if the value of the security sold short continues to increase. In addition, short sales may cause the Alternative Strategies Fund to be compelled, at a time disadvantageous to it, to buy the security previously sold short, thus resulting in a loss. To meet current margin requirements, the Alternative Strategies Fund is required to deposit with the broker additional cash or securities so that the total deposit with the broker is maintained daily at 150% of the current market value of the securities sold short. |
| • | Smaller Companies Risk. A Fund may invest a portion of its assets in the securities of small- andmid-sized companies. Securities of small andmid-cap companies are generally more volatile and less liquid than the securities oflarge-cap companies. This is because smaller companies may be more reliant on a few products, services or key personnel, which can make it riskier than investing in larger companies with more diverse product lines and structured management. |
| • | Special Situations Risk. Investments in special situations (undervalued equities, merger arbitrage situations, distressed companies, etc.) may involve greater risks when compared to other investments a Fund may make due to a variety of factors. For example, mergers, acquisitions, reorganizations, liquidations or recapitalizations may fail or not be completed on the terms originally contemplated, and expected developments may not occur in a timely manner, if at all. |
| • | Technology Investment Risk. A Fund may invest a portion of its assets in the technology sector, which is a very volatile segment of the market. The nature of technology is that it is rapidly changing. Therefore, products or services that may initially look promising may subsequently fail or become obsolete. In addition, many technology companies are younger, smaller and unseasoned companies which may not have established products, an experienced management team, or earnings history. |
| • | Unfavorable Tax Treatment Risk. This is the risk that a material portion of the Alternative Strategies Fund’s return could be in the form of net investment income or short-term capital gains, some of which may be distributed to shareholders and taxed at ordinary income tax rates. Therefore, shareholders may have a greater need to pay regular taxes than compared to other investment strategies that hold investments longer. Due to this investment strategy, it may be preferable for certain shareholders to invest in the Fund throughpre-tax ortax-deferred accounts as compared to investment through currently taxable accounts. Potential shareholders are encouraged to consult their tax advisors in this regard. |
| • | Value Stock Risk. Value stocks are stocks of companies that may have experienced adverse business or industry developments or may be subject to special risks that have caused the stocks to be out of favor and, in the opinion of the manager, undervalued. The value of a security believed by a manager to be undervalued may never reach what is believed to be its full (intrinsic) value, or such security’s value may decrease. |
Note 12 – Change in Accounting Principle
Recent Accounting Standards: The Fund has adopted Financial Accounting Standards Board Accounting Standards Update 2017-08 Receivables – Nonrefundable Fees and Other Costs (Subtopic 310-20): Premium Amortization on Purchased Callable Debt Securities to amend the amortization period for certain callable debt securities purchased at a premium. Under the new standard, the Fund has changed the amortization period for the premium on certain purchased callable debt securities withnon-contingent call features to the earliest call date. In accordance with the transition provisions of the standard, the Fund applied the amendments on a modified retrospective basis beginning after the fiscal year ended December 31, 2018. This change in accounting policy has been made to comply with the newly issued accounting standard and had no impact on total accumulated earnings (deficit) or the net asset value of the Fund.
| 146 | Litman Gregory Funds Trust | |||||
Table of Contents
Litman Gregory Funds Trust
OTHER INFORMATION – (Unaudited)
Proxy Voting Policies and Procedures
Thesub-advisors of the Funds vote proxies relating to portfolio securities in accordance with procedures that have been approved by the Board of Trustees of the Funds. You may obtain a description of these procedures, without charge, by calling toll-free,1-800-960-0188. This information is also available through the Securities and Exchange Commission’s website at http://www.sec.gov.
Proxy Voting Record
Information regarding how thesub-advisors of the Funds voted proxies relating to portfolio securities during the12-month period ended June 30 is available, without charge, by calling toll-free,1-800-960-0188. This information is also available through the Securities and Exchange Commission’s website at http://www.sec.gov.
Portfolio Holdings Information
The Funds previously filed their complete schedule of portfolio holdings with the Securities and Exchange Commission for the first and third quarters of each fiscal year on FormN-Q. The Funds have ceased filing FormN-Q and have commenced filing FormN-PORT. Part F of each Fund’s FormN-PORT filings for the first and third fiscal quarters will contain the complete schedule of portfolio holdings in the same manner as previously filed on FormN-Q. You can find the filings on the Securities and Exchange Commission’s website at http://www.sec.gov. This information is also available, without charge, by calling toll-free,1-800-960-0188 or by visiting the Funds’ website at http://www.mastersfunds.com.
Householding Mailings
To reduce expenses, the Trust may mail only one copy of the Funds’ prospectus and each annual and semi-annual report to those addresses shared by two or more accounts. If you wish to receive individual copies of these documents, please call us at1-800-960-0188 (or contact your financial institution). The Trust will begin sending you individual copies thirty days after receiving your request.
| Other Information | 147 | |||||
Table of Contents
Litman Gregory Funds Trust
OTHER INFORMATION – (Unaudited) – (Continued)
Board Consideration of and Continuation and Renewal of Investment Advisory Agreements
At anin-person meeting held on December 6, 2019 (the “Meeting”), the Board of Trustees (the “Board”) of the Litman Gregory Funds Trust (the “Trust”), including the Trustees who are not “interested persons” of the Trust within the meaning of the Investment Company Act of 1940, as amended (the “1940 Act”) (the “Independent Trustees”), considered and approved for an additionalone-year term through December 31, 2020 (i) the Unified Investment Advisory Agreement (the “Investment Advisory Agreement”) between the Trust and Litman Gregory Fund Advisors, LLC (the “Advisor”) with respect to the Litman Gregory Masters Equity Fund (the “Equity Fund”), the Litman Gregory Masters International Fund (the “International Fund”), the Litman Gregory Masters Smaller Companies Fund (the “Smaller Companies Fund”); the Litman Gregory Masters Alternative Strategies Fund (the “Alternative Strategies Fund”) and the Litman Gregory Masters High Income Alternatives Fund (the “High Income Alternatives Fund”) (each of the Equity Fund, the International Fund, the Smaller Companies Fund, the Alternative Strategies Fund and the High Income Alternatives Fund, a “Fund,” and collectively, the “Funds”), and (ii) the investmentsub-advisory agreements (the “InvestmentSub-Advisory Agreements,” and collectively with the Investment Advisory Agreement, the “Advisory Agreements”) between the Advisor and (a) each of Davis Selected Advisers, L.P., Fiduciary Management, Inc., Harris Associates L.P. (“Harris”), Nuance Investments, LLC, Sands Capital Management, LLC, and Wells Capital Management Inc. (“Wells”) with respect to the Equity Fund; (b) each of Evermore Global Advisors, LLC, Harris, Lazard Asset Management LLC, Pictet Asset Management, Ltd., and Thornburg Investment Management, Inc. with respect to the International Fund; (c) each of Cove Street Capital, LLC, Segall Bryant & Hamill, LLC and Wells with respect to the Smaller Companies Fund; (d) each of DCI, LLC, DoubleLine Capital LP, First Pacific Advisors, LLC, Loomis, Sayles & Company, L.P. and Water Island Capital, LLC with respect to the Alternative Strategies Fund; and (e) each of Ares Management LLC, Brown Brothers Harriman & Co., Guggenheim Partners Investment Management, LLC and Neuberger Berman Investment Advisers LLC with respect to the High Income Alternatives Fund (each of the foregoingsub-advisors, a“Sub-Advisor,” and collectively, the“Sub-Advisors”). The Board, including the Independent Trustees, also approved the continuation for an additionalone-year term through April 30, 2021 of the Restated Contractual Advisory Fee Waiver Agreement between the Trust, on behalf of the Funds, and the Advisor (the “Fee Waiver Agreement,” and collectively with the Advisory Agreements, the “Agreements”).
Prior to the Meeting, the Independent Trustees had requested detailed information from the Advisor regarding the Funds. The materials provided by the Advisor were extensive, including advisory fee and expense comparisons, performance comparisons, Advisor profitability information, and a summary of compliance programs of theSub-Advisors. In addition, the Independent Trustees discussed the approval or renewal of the Agreements with representatives of the Advisor and were advised by independent counsel on these and other relevant matters.
The Trustees, including the Independent Trustees, also noted that they had received extensive information about, andin-person presentations from, various members of senior management at the Advisor regarding the Funds throughout the year, including, without limitation, information on and/or discussion of the Funds’ and eachSub-Advisor’s investment results; portfolio composition; portfolio trading practices; shareholder services; advisory fees and expense comparisons; the Advisor’s financial condition and profitability; compliance monitoring by the Advisor; the personnel at the Advisor and theSub-Advisors providing investment management, compliance and other services to the Funds; and the Advisor’s process for selectingSub-Advisors for the Funds as well as the Advisor’s ongoing oversight of theSub-Advisors.
The information provided to the Board at the Meeting, together with the information provided to the Board throughout the year, formed the primary (but not exclusive) basis for the Board’s determinations. The Board did not identify any single issue or particular datum point that, in isolation, would be a controlling factor in its decision to approve or renew the Agreements. Rather, the Board considered the total mix of information provided. The following summary describes the key factors considered by the Independent Trustees (as well as the Board).
1. Nature, extent and quality of services
The Independent Trustees considered the depth and quality of the Advisor’s investmentmanagement process, including its sophisticated monitoring and oversight of theSub-Advisors; the experience, capability and integrity of its senior management and other personnel; the low turnover rates of its key personnel involved in theday-to-day operations of the Funds; and the overall financial strength and stability of its organization. The Independent Trustees also considered that the Advisor provided personnel to serve as officers of the Trust, including the Trust’s CCO, and that the services of the CCO were provided at a nominal cost to the Trust. The Independent Trustees discussed the high level ofsub-advisor due diligence continually being undertaken by the Advisor. The Independent Trustees also noted the high quality of thenon-advisory management services provided by the Advisor, such as responsiveness to shareholder inquiries and requests of the Board, as well as the preparation of high quality shareholder communications and the development of targeted marketing programs for the Funds. In addition, the Independent Trustees noted that, because the Advisor is a significant shareholder in the Funds, the Advisor has an additional incentive to ensure that the Funds perform well for the shareholders. The Independent Trustees also noted that the members of senior management of the Advisor, including Mr. DeGroot, as well as the Independent Trustees themselves have made significant investments in the Funds.
| 148 | Litman Gregory Funds Trust | |||||
Table of Contents
Litman Gregory Funds Trust
OTHER INFORMATION – (Unaudited) – (Continued)
The Independent Trustees, based on guidance and information provided by the Trust’s CCO, also considered the Advisor’s policies, procedures and systems to ensure compliance with applicable laws and regulations and its adherence to and continual enhancement of those programs; its efforts to keep the Board informed; and its attention dedicated to matters that may involve potential conflicts of interest with a Fund. The Independent Trustees considered the extent and effectiveness of the Advisor’s compliance operations and the Advisor’s oversight of theSub-Advisors’ and other service providers’ compliance operations.
The Independent Trustees then reviewed various materials relating to theSub-Advisors, including copies of each InvestmentSub-Advisory Agreement; copies of the Form ADV for eachSub-Advisor; information on assets of the Funds managed and fees charged by eachSub-Advisor; a summary of the compliance programs of theSub-Advisors; and an oral report by the CCO on eachSub-Advisor’s commitment to compliance. The Independent Trustees also considered the Advisor’s lengthy and extensive due diligence process for selecting and monitoring eachSub-Advisor and the value of goodwill between the Advisor and eachSub-Advisor.
The Independent Trustees concluded that the nature, overall quality, and extent of the services provided and to be provided by the Advisor and theSub-Advisors are fully satisfactory.
2. Investment results
The Independent Trustees reviewed the short-term and long-term performance of each Fund on both an absolute basis and in comparison to peer funds and benchmark indices. They also considered information regarding the selection, and discussed the appropriateness, of such peer funds and benchmark indices. The Independent Trustees considered the overall performance of the Funds as well as the performance of eachSub-Advisor within each Fund as compared to eachSub-Advisor’s own comparable mutual fund(s) or private fund(s) (if applicable). The Independent Trustees focused on longer-term performance, which they believe is more important than short, isolated periods for purposes of evaluating each Fund’s success in meeting its investment objective.
In particular, the Independent Trustees relied upon, among other information, the KFS Report. The Independent Trustees noted that KFS, and not the Advisor, selected the peer funds used in the KFS Report and that the Advisor had supplemented the KFS Report with additional performance comparisons.
For the Equity Fund, the Independent Trustees compared its investment results for its Institutional shares to a number of benchmarks, including (1) the Russell 3000 Index (the “Equity Market Benchmark”); (2) the Morningstar Large Blend Category (the “Equity Morningstar Category”); and (3) the KFS Peer Group for the Equity Fund (together with the Equity Morningstar Category, the “Equity Fund Benchmarks”). The Independent Trustees noted that, with respect to multi-year periods, the Equity Fund underperformed the Equity Morningstar Category for theone-year, three-year, five-year,ten-year and fifteen-year periods ended September 30, 2019 and underperformed the Equity Market Benchmark by thirty-eight basis points since inception. The Independent Trustees also noted that the Equity Fund outperformed the Equity Morningstar Category for the period since inception. The Independent Trustees further noted that the Equity Fund underperformed the KFS Peer Group for all relevant time periods.
For the International Fund, the Independent Trustees compared its investment results for its Institutional shares to (1) the MSCI ACWIex-U.S. Index (the “International Market Benchmark”); (2) the Morningstar Foreign Large Blend Category (the “International Morningstar Category”); and (3) the KFS Peer Group for the International Fund (together with the International Morningstar Category, the “International Fund Benchmarks”). The Independent Trustees noted that, with respect to multi-year periods, the International Fund underperformed the International Market Benchmark for theone-year, three-year, five-year, andten-year periods ended September 30, 2019. The Independent Trustees also noted that the International Fund matched the performance of the International Market Benchmark for the fifteen-year period ended September 30, 2019 and outperformed the International Market Benchmark and the International Morningstar Category for the period since inception.
For the Smaller Companies Fund, the Independent Trustees compared its investment results for its Institutional shares to (1) the Russell 2000 Index (the “Smaller Companies Market Benchmark”); (2) the Morningstar Small Blend Category (the “Smaller Companies Morningstar Category”); and (3) the KFS Peer Group for the Smaller Companies Fund (together with the Smaller Companies Morningstar Category, the “Smaller Companies Fund Benchmarks”). The Independent Trustees noted that, with respect to multi-year periods, the Smaller Companies Fund underperformed the Smaller Companies Fund Benchmarks and the Smaller Companies Market Benchmark for the five-year,ten-year and fifteen-year periods ended September 30, 2019, and underperformed the Small Companies Morningstar Category and Smaller Companies Market Benchmark for the period since inception. The Independent Trustees further noted that the Smaller Companies Fund outperformed the Smaller Companies Market Benchmark and the Smaller Companies Fund Benchmarks for theone-year and three-year periods ended September 30, 2019.
For the Alternative Strategies Fund, the Independent Trustees compared its investment results for its Institutional shares to (1) the Barclays U.S. Aggregate Bond Index (the “Alternative Strategies Market Benchmark”); (2) the Morningstar Multi-Alternative Category (the “Alternative Strategies Morningstar Category”); and (3) the KFS Peer Group for the Alternative Strategies Fund (together with the Alternative Strategies Morningstar Category, the “Alternative Strategies Fund Benchmarks”). The Independent Trustees noted that,
| Other Information | 149 | |||||
Table of Contents
Litman Gregory Funds Trust
OTHER INFORMATION – (Unaudited) – (Continued)
with respect to multi-year periods, the Alternative Strategies Fund outperformed the Alternative Strategies Fund Benchmarks for the one-year, three-year and five-year periods ended September 30, 2019 and outperformed the Alternative Strategies Market Benchmark for the three-year and since-inception periods ended September 30, 2019. The Independent Trustees further considered that the Fund has generated an absolute return since inception of 3.76% over the3-month London Interbank Offered Rate (LIBOR), noting that the Fund seeks to achieve an annualized return of LIBOR plus a range of 4% to 8% over the long term.
For the High Income Alternatives Fund, the Independent Trustees compared its investment results for its Institutional shares to (1) the Barclays U.S. Aggregate Bond Index (the “High Income Alternatives Market Benchmark”); (2) the Morningstar U.S. Fund Allocation – 15% to 30% Equity Category (the “High Income Alternatives Morningstar Category”); and (3) the KFS Peer Group for the High Income Alternatives Fund (together with the High Income Alternatives Morningstar Category, the “High Income Alternatives Fund Benchmarks”). The Independent Trustees noted that, with respect to theone-year period ended September 30, 2019, the High Income Alternatives Fund underperformed the High Income Alternatives Market Benchmark and the High Income Alternatives Fund Benchmarks.
The Independent Trustees noted that the performance of theSub-Advisors varies over time and noted and acknowledged the Advisor’s detailed monitoring of theSub-Advisors’ investment results, and interactions withSub-Advisors, particularly thoseSub-Advisors that were experiencing periods of underperformance. The Independent Trustees noted and considered the comments by the Advisor with respect to underperformingSub-Advisors, discussions at Board meetings throughout the year regarding the potential sources of underperformance and actions taken by the Advisor in response to underperformance by certainSub-Advisors. The Independent Trustees considered the Advisor’s process for terminatingSub-Advisors and noted the Advisor’s continued willingness to terminateSub-Advisors if the Advisor determined that the termination would be in the best interest of a Fund and its shareholders. The Independent Trustees also noted and considered the Advisor’s ability to attract and retain “world-class” investment managers to serve asSub-Advisors to the Funds, as well as the Advisor’s extensive screening process before hiring aSub-Advisor.
The Trustees noted the difficulty of fairly benchmarking the Funds in terms of performance. Ultimately, the Independent Trustees concluded that they were satisfied with the Funds’ overall performance records and were satisfied with the Advisor’s explanation for the periods of underperformance. The Independent Trustees further concluded that the Advisor was applying appropriate discipline and oversight to ensure that each Fund adhered to its stated investment objective and strategies, and the performance and services of theSub-Advisors supported the decision to renew the Advisory Agreements.
3. Advisory fees and total expenses
The Independent Trustees reviewed the advisory fees and total expenses of each Fund and compared them with the advisory fees and total expenses of funds in the KFS Peer Group for each Fund. The Independent Trustees noted that the KFS Peer Group for each Fund was selected independently by KFS using a selection methodology designed to identify those funds most comparable to each Fund. The Independent Trustees further noted that in selecting the KFS Peer Group for each Fund, KFS considered various screening criteria, including, without limitation, fund type, category as determined by Morningstar, Inc., load/sales charge type, average net assets, and fund attributes. The Independent Trustees also noted that, to the extent possible without affecting KFS’ core peer fund selection methodologies, KFS had attempted to include funds that are considered by Morningstar to have amanager-of-managers structure in the KFS Peer Group for each Fund. The Independent Trustees then discussed various areas in which the Funds are different from the funds included in the KFS Peer Groups, such as distribution channels and investment strategies or approaches.
The Independent Trustees noted that according to the KFS Report, the total expenses of each Fund are higher than the average or the median of the total expenses of the funds in the KFS Peer Group for such Fund, except that the total expenses of the Alternative Strategies Fund were slightly below, and the total expenses of the High Income Alternatives Fund were in line with, the average of those Funds’ respective KFS Peer Groups. The Independent Trustees observed that the Equity Fund’s total expense ratio exceeded both the Morningstar peer group and KFS Peer Group mostly because of its higher advisory fee. The Independent Trustees noted that the International Fund has an advisory fee that is higher than the average and the median of its KFS Peer Group, while the Fund’s other operating expenses were generally in line with the average other operating expenses for the KFS Peer Group and the Morningstar peer group. The Independent Trustees also noted that the International Fund’s total expense ratio was higher than the average expense ratio for the KFS Peer Group and the Morningstar peer group. The Independent Trustees also observed that, despite a fee waiver that significantly improved the Fund’s rank in the KFS Peer Group, the Smaller Companies Fund’s total expense ratio exceeded both the Morningstar peer group and KFS Peer Group in part because of the Fund’s other expenses and smaller than average asset size. The Independent Trustees further noted that the Alternative Strategies Fund has an advisory fee that is slightly higher than the average of the KFS Peer Group and the average of the Morningstar peer group, and its other expenses are slightly higher than average compared to the Morningstar peer Group and lower than the KFS Peer group. The Independent Trustees noted that although the High Income Alternatives Fund has an advisory fee that is higher than the average and the median of the KFS Peer Group, the Fund’s total expenses were only 1 basis point higher than the KFS Peer Group average. The Independent Trustees
| 150 | Litman Gregory Funds Trust | |||||
Table of Contents
Litman Gregory Funds Trust
OTHER INFORMATION – (Unaudited) – (Continued)
agreed that the Funds’ use of themanager-of-managers structure is a primary contributor to the relatively high advisory fees, and noted that the higher advisory fees allow shareholders of the Funds to have access toSub-Advisors to which they otherwise might not have access and that the higher fees are justified by the long-term performance results of certain Funds and potential performance results for underperforming Funds.
The Independent Trustees also noted the Advisor’s continued willingness to waive fees or reimburse operating expenses to maintain a competitive fee structure for each Fund and to pass through savings from fee breakpoints in anySub-Advisor’s fee schedule to the applicable Fund’s shareholders. The Independent Trustees further took into account the Fee Waiver Agreement, as most recently amended August 28, 2018, to reduce expenses by further increasing the amount of fee waivers for certain Funds under the Fee Waiver Agreement.
The Independent Trustees noted the United States Supreme Court’s guidance inJones v. Harris Associates on the relevance of comparisons of advisory fees charged by the Advisor to other similarly managed separate accounts such as pension funds or other institutional investors. The Advisor presented to the Independent Trustees the advisory fees the Advisor and its affiliates charge their separately managed accounts and private investment funds (collectively, the “Other Accounts”). The Advisor explained, to the Independent Trustees’ satisfaction, various factors that contribute to the different fee schedules between the Funds and the Other Accounts, including the fact that the products the Advisor and its affiliates offer for the Funds (i.e., concentratedsub-portfolios managed by a selection ofSub-Advisors) and the Other Accounts are significantly different; that the services the Advisor and its affiliates provide for the Funds (i.e., the assembly and monitoring of theSub-Advisors) are not readily available on the market; that the Other Accounts have much higher minimum investment requirements as compared to those of the Funds; and that certain compliance obligations and liquidity requirements are only applicable to the Funds and not the Other Accounts.
The Independent Trustees noted that thesub-advisory fees payable to theSub-Advisors are separately negotiated with the Advisor and are paid out of the advisory fees the Advisor receives from the Funds. The Independent Trustees also noted that the fees charged by theSub-Advisors are discounted relative to the fees theSub-Advisors charge to their own funds and separately managed accounts, and that the Advisor from time to time attempts to renegotiate lower fees with theSub-Advisors. Given the existence ofarm’s-length bargaining between the Advisor and eachSub-Advisor, the Independent Trustees did not engage in an extensive discussion ofsub-advisory fees and expenses.
Based on such review, the Independent Trustees concluded that the advisory fees and the total expenses of the Funds are reasonable in relation to the services the Funds receive from the Advisor and theSub-Advisors.
4. The Advisor’s financial information
The Independent Trustees reviewed information regarding the Advisor’s costs of managing the Funds and information regarding the profitability of the Advisor. The Independent Trustees also considered the extent to which economies of scale may be realized as each Fund grows and whether advisory fee levels reflect economies of scale if the Funds grow in size. The Independent Trustees also noted that the Advisor had voluntarily forgone profits to subsidize the Funds when they were at lower asset levels.
The Advisor’s Costs and Profitability.The Independent Trustees noted that the Advisor appeared to be providing products that arecompetitively priced with other funds, especially funds with multiplesub-advisors. The Independent Trustees reviewed the total advisory fees, the amounts paid by the Advisor to the variousSub-Advisors, the general cost of the services provided by the Advisor and the Advisor’s retained portion of the total advisory fee. The Independent Trustees took note of information provided on advisory fees waived by the Advisor, noting that the Advisor had waived substantial advisory fees otherwise payable under the Investment Advisory Agreement over the most recent year, and that the Advisor follows a policy of not charging advisory fees on unallocated cash.
The Independent Trustees also noted that the Advisor to date had not sought recoupment of any advisory fees waived under the Fee Waiver Agreement. The Independent Trustees also considered the Advisor’s continued willingness to invest in staff dedicated to the Funds, including new hires when needed. The Independent Trustees received information that assured them that the Advisor was financially sound and able to honor its sponsorship commitments to the Funds and that the Advisor’s expected profits under the Advisory Agreement are in the range of reasonableness for the mutual fund management industry. The Independent Trustees did not engage in an analysis ofFund-by-Fund profitability given the integrated nature of the Advisor’s management of the Funds.
The Independent Trustees did not engage in an extended analysis ofSub-Advisor profitability given thearm’s-length nature of the bargaining between the Advisor and each Sub-Advisor and the difficulty in interpreting profitability information with respect to eachSub-Advisor due to, among others, the use of disparate accounting conventions, disparate ownership structures, and the fact that eachSub-Advisor managed only a portion of each Fund. The Independent Trustees also reviewed information regarding the structure and manner in which the Advisor’s and theSub-Advisors’ investment professionals are compensated and how the compensation structures are designed to attract and retain high caliber personnel and to promote the long-term performance of the Funds.
| Other Information | 151 | |||||
Table of Contents
Litman Gregory Funds Trust
OTHER INFORMATION – (Unaudited) – (Continued)
Economies of Scale.The Independent Trustees noted that the Advisor has continued to take steps to reduce expenses of the Funds, including agreeing to amendments to the breakpoints in its fee schedules to provide for higher fee waivers, negotiating favorable terms with service providers and providing certain support services to the Funds on a cost-only basis, which represents a sharing of economies of scale. In addition, the Independent Trustees took note of the investments in the Funds made by the Other Accounts, which help reduce costs for the Funds by increasing the asset base of the Funds. The Independent Trustees also took favorable note of the Advisor’s efforts to invest in its advisory organization to ensure strong research, analytic and marketing capabilities.
Ancillary Benefits.The Independent Trustees considered other actual and potential financial benefits to the Advisor, noting that the Advisor does not have any affiliates that materially benefit from the Advisor’s relationship to the Funds.
5. Conclusions
Based on their review, including theirnon-exclusive consideration of each of the factors referred to above, the Independent Trustees as well as the Board concluded that the Agreements are fair and reasonable to each Fund and its shareholders, that each Fund’s shareholders received or would receive reasonable value in return for the advisory fees and other amounts paid to the Advisor, and that the renewal or approval, as applicable, of the Agreements would be in the best interests of each Fund and its shareholders. Each of the factors discussed above supported such approval.
| 152 | Litman Gregory Funds Trust | |||||
Table of Contents
REPORT OF INDEPENDENT REGISTERED PUBLIC ACCOUNTING FIRM
To the Shareholders and Board of Trustees of
Litman Gregory Funds Trust
Opinion on the Financial Statements
We have audited the accompanying statements of assets and liabilities, including the schedules of investments in securities, purchased options, securities sold short, forward foreign currency exchange contracts, futures contracts, swaps and written options of Litman Gregory Funds Trust comprising Litman Gregory Masters Equity Fund, Litman Gregory Masters International Fund, Litman Gregory Masters Smaller Companies Fund, Litman Gregory Masters Alternative Strategies Fund and Litman Gregory Masters High Income Alternatives Fund (the “Funds”) as of December 31, 2019, the related statements of operations for the year then ended, the statements of changes in net assets for each of the two years in the period then ended, including the related notes, and the financial highlights for each of the five years in the period then ended for Litman Gregory Masters Equity Fund, Litman Gregory Masters International Fund, Litman Gregory Masters Smaller Companies Fund, and Litman Gregory Masters Alternative Strategies Fund, and the related statement of operations for the year then ended, and the statements of changes in net assets, including the related notes, and financial highlights for the each of the two periods in the period then ended, for Litman Gregory Masters High Income Alternatives Fund,(collectively referred to as the “financial statements”). In our opinion, the financial statements present fairly, in all material respects, the financial position of theeach of the Funds as of December 31, 2019, the results of their operations for the year then ended, and the changes in their net assets and financial highlights for the periods indicated above, in conformity with accounting principles generally accepted in the United States of America.
Basis for Opinion
These financial statements are the responsibility of the Funds’ management. Our responsibility is to express an opinion on the Funds’ financial statements based on our audits. We are a public accounting firm registered with the Public Company Accounting Oversight Board (United States) (“PCAOB”) and are required to be independent with respect to the Funds in accordance with the U.S. federal securities laws and the applicable rules and regulations of the Securities and Exchange Commission and the PCAOB.
We conducted our audits in accordance with the standards of the PCAOB. Those standards require that we plan and perform the audit to obtain reasonable assurance about whether the financial statements are free of material misstatement whether due to error or fraud.
Our audits included performing procedures to assess the risks of material misstatement of the financial statements, whether due to error or fraud, and performing procedures that respond to those risks. Such procedures included examining, on a test basis, evidence regarding the amounts and disclosures in the financial statements. Our procedures included confirmation of securities owned as of December 31, 2019, by correspondence with the custodian, transfer agent, issuer, and brokers or by other appropriate auditing procedures where replies from brokers or counterparties were not received. Our audits also included evaluating the accounting principles used and significant estimates made by management, as well as evaluating the overall presentation of the financial statements. We believe that our audits provide a reasonable basis for our opinion.
We have served as the Funds’auditor since 2012.

COHEN & COMPANY, LTD.
Cleveland, Ohio
February 28, 2020
| Report of Independent Registered Public Accounting Firm | 153 | |||||
Table of Contents
Litman Gregory Funds Trust
The ABX Indexes serve as a benchmark of the market for securities backed by home loans issued to borrowers with weak credit.The ABX2006-2 AAAis an asset-backed index that tracksAAA-rated bonds issued prior to the second half of 2006.The ABX2007-1 AAAis an asset-backed index that tracksAAA-rated bonds issued prior to the first half of 2007.
BofA Merrill Lynch U.S. High Yield Master II Indextracks the performance of below investment grade, but not in default, US dollar-denominated corporate bonds publicly issued in the US domestic market.
Bloomberg Barclays U.S. Aggregate Bond Index is a market capitalization-weighted index, meaning the securities in the index are weighted according to the market size of each bond type. Most U.S. traded investment grade bonds are represented. The index includes U.S. treasury securities (non TIPS), government agency bonds, mortgage backed bonds, corporate bonds, and a small amount of foreign bonds traded in the U.S.
TheCBOE Russell 2000 PutWrite Index(PUTR) is designed to track the performance of a hypothetical strategy that sells a monthlyat-the-money (ATM) Russell 2000 Index put option.
The CBOE Russell 2000 Volatility Index (RVX) is a key measure of market expectations of near-term volatility conveyed by Russell 2000® Index (RUT) option prices. The RVX Index measures the market’s expectation of30-day volatility implicit in the prices of near-term RUT options traded at CBOE.
The CBOE S&P 500 PutWrite Index (ticker symbol PUT) is a benchmark index that measures the performance of a hypothetical portfolio that sells S&P 500 Index (SPX) put options against collateralized cash reserves held in a money market account.
The CBOE S&P 500 2% OTM PutWrite Index (PUTYSM Index) is designed to track the performance of a hypothetical passive investment strategy that collects option premiums from writing a 2%Out-of-the Money (OTM) SPX Put option on a monthly basis and holds a rolling money market account invested inone-monthT-bills to cover the liability from the short SPX Put option position.
CDXis a series of credit default swap indexes, used to hedge credit risk or to take a position on a basket of credit entities.
The Citigroup Economic Surprise Indices are objective and quantitative measures of economic news. They are defined as weighted historical standard deviations of data surprises.
FTSE Emerging Markets Index – ETF Tracker. The Index is a market capitalization index, adjusted based on the free-float of potential index constituents, and designed to measure the performance of large-, medium- and small-capitalization companies located in emerging market countries throughout the world.
The FTSE Global All Cap ex U.S. Index is part of a range of indices designed to help U.S. investors benchmark their
international investments. The index comprises large, mid and small cap stocks globally excluding the U.S. The index is derived from the FTSE Global Equity Index Series (GEIS), which covers 98% of the world’s investable market capitalization.
The HFRI Event Driven Index: Consists of investment managers who maintain positions in companies currently or prospectively involved in corporate transactions of a wide variety including but not limited to mergers, restructurings, financial distress, tender offers, shareholder buybacks, debt exchanges, security issuance or other capital structure adjustments. Security types can range from most senior in the capital structure to most junior or subordinated, and frequently involve additional derivative securities. Event driven exposure includes a combination of sensitivities to equity markets, credit markets and idiosyncratic, company specific developments.
The HFRI Event Driven Merger Arbitrage Index: Consists of merger arbitrage strategies which employ an investment process primarily focused on opportunities in equity and equity related instruments of companies which are currently engaged in a corporate transaction. Merger arbitrage involves primarily announced transactions, typically with limited or no exposure to situations whichpre-, post-date or situations in which no formal announcement is expected to occur. Opportunities are frequently presented in cross border, collared and international transactions which incorporate multiple geographic regulatory institutions, with typically involve minimal exposure to corporate credits. Merger arbitrage strategies typically have over 75% of positions in announced transactions over a given market cycle.
The HFRX Fixed Income – Credit Index is an unmanaged index that includes strategies with exposure to credit across a broad continuum of creditsub-strategies, including Corporate, Sovereign, Distressed, Convertible, Asset Backed, Capital Structure Arbitrage, Multi-Strategy and other Relative Value and Event Drivensub-strategies.
The HFRX Global Hedge Fund Index is designed to be representative of the overall composition of the hedge fund universe. It is comprised of all eligible hedge fund strategies; including but not limited to convertible arbitrage, distressed securities, equity hedge, equity market neutral, event driven, macro, merger arbitrage, and relative value arbitrage.
ICE BofAML0-3 Year U.S. Treasury Index tracks the performance of U.S. dollar denominated sovereign debt publicly issued by the U.S. government in its domestic market with maturities less than three years.
ICE BofA Merrill Lynch1-3 US Year Treasury Index is an unmanaged index that tracks the performance of the direct sovereign debt of the U.S. Government having a maturity of at least one year and less than three years.
The ICE BofAML U.S. High Yield Cash Pay TR USD Index is an unmanaged index that measures the performance of short-term U.S. dollar denominated below investment grade corporate debt publicly issued in the U.S. domestic market.
LIBOR stands for London Interbank Offered Rate. It’s an index that is used to set the cost of various variable-rate loans.
| 154 | Litman Gregory Funds Trust | |||||
Table of Contents
Litman Gregory Funds Trust
INDEX DEFINITIONS – (Continued)
Morningstar Category Averages:Each Morningstar Category Average is representative of funds with similar investment objectives.
TheMSCI All Country World Index is a free float-adjusted market capitalization weighted index that is designed to measure the equity market performance of developed and emerging markets.
TheMSCI All Country World ex U.S. Index is a free float-adjusted market capitalization weighted index that is designed to measure the equity market performance of developed and emerging markets, excluding the United States.
TheMSCI All Country World ex U.S. Growth Index is a free float-adjusted market capitalization weighted index that is designed to measure the equity market performance of developed and emerging markets, excluding the United States. It includes companies with higherprice-to-book ratios and higher forecasted growth values.
TheMSCI All Country World ex U.S. Value Index is a free float-adjusted market capitalization weighted index that is designed to measure the equity market performance of developed and emerging markets, excluding the United States. It includes companies with lowerprice-to-book ratios and lower forecasted growth values.
The MSCI EAFE Index (Europe, Australasia, Far East) is a free float-adjusted market capitalization index that is designed to measure the equity market performance of developed markets, excluding the US & Canada. As of May 27, 2010 the MSCI EAFE Index consisted of the following 22 developed market country indices: Australia, Austria, Belgium, Denmark, Finland, France, Germany, Greece, Hong Kong, Ireland, Israel, Italy, Japan, the Netherlands, New Zealand, Norway, Portugal, Singapore, Spain, Sweden, Switzerland, and the United Kingdom.
The MSCI Emerging MarketsIndex captures large andmid-cap representation across 23 Emerging Markets (EM) countries. With 836 constituents, the index covers approximately 85% of the free float-adjusted market capitalization in each country.
TheMSCI World ex U.S. Index is a free float-adjusted market capitalization weighted index that is designed to measure the equity market performance of developed markets, excluding the United States.
The Russell 1000 Index measures the performance of thelarge-cap segment of the U.S. equity universe. It is a subset of the Russell 3000® Index and includes approximately 1000 of the largest securities based on a combination of their market cap and current index membership. The Russell 1000 represents approximately 92% of the U.S. market.
The Russell 1000 Growth Index measures the performance of thelarge-cap growth segment of the U.S. equity universe. It
includes those Russell 1000 companies with higherprice-to-book ratios and higher forecasted growth values.
The Russell 2000 Index measures the performance of the 2,000 smallest companies in the Russell 3000 Index.
The Russell 2000 Value Index measures the performance ofsmall-cap value segment of the U.S. equity universe. It includes those Russell 2000 companies with lowerprice-to-book ratios and lower forecasted growth values.
The Russell 2500 Index measures the performance of the small tomid-cap segment of the U.S. equity universe, commonly referred to as “smid” cap. The Russell 2500 Index is a subset of the Russell 3000 Index. It includes approximately 2500 of the smallest securities based on a combination of their market cap and current index membership.
The Russell 3000 Index measures the performance of the 3,000 largest U.S. companies as measured by total market capitalization, and represents about 98% of the U.S. stock market.
The Russell 3000 Value Index is a broad based index that measures the performance of those companies within the 3,000 largest U.S. companies, based on total market capitalization, that have lowerprice-to-book ratios and lower forecasted growth rates.
The S&P 500 Indexis widely regarded as the standard for measuringlarge-cap stock performance, and consists of 500 stocks that represent a sample of the leading companies in leading industries.
The SPDR S&P 500 ETFconsists of 500 of the largest U.S. companies, and it is one of the most heavily traded securities in the world. It tracks the S&P 500 Index, and fund follows a full replication strategy, holding every stock in the index.
The SPDR Financials Sector Index seeks to provide an effective representation of the financial sector of the S&P 500 Index. The Index includes companies from the following industries: diversified financial services; insurance; banks; capital markets; mortgage real estate investment trusts (“REITs”); consumer finance; and thrifts and mortgage finance.
The Vanguard 500 Index Fund invests in 500 of the largest U.S. companies, which span many different industries and account for about three-fourths of the U.S. stock market’s value. This fund tracks the S&P 500 Index as closely as possible.
VIXis a trademarked ticker symbol for theChicago Board Options Exchange Market Volatility Index, a popular measure of the implied volatility of S&P 500 index options. Often referred to as thefear index or thefear gauge, it represents one measure of the market’s expectation of stock market volatility over the next 30 day period.
| Index Definitions | 155 | |||||
Indices are unmanaged, do not incur fees, and cannot be invested in directly.
Table of Contents
Litman Gregory Funds Trust
INDUSTRY TERMS AND DEFINITIONS
| 1. | Active Share measures the degree of difference between a fund portfolio and its benchmark index. |
| 2. | Alpha is an annualized return measure of how much better or worse a fund’s performance is relative to an index of funds in the same category, after allowing for differences in risk. |
| 3. | Alt-A, or AlternativeA-paper, is a type of U.S. mortgage that, for various reasons, is considered riskier thanA-paper, or “prime”, and less risky than “subprime,” the riskiest category. |
| 4. | The Basel Accords are three sets of banking regulations (Basel I, II and III) set by the Basel Committee on Bank Supervision (BCBS), which provides recommendations on banking regulations in regards to capital risk, market risk and operational risk. |
| 5. | A basis point is a value equaling oneone-hundredth of a percent (1/100 of 1%). |
| 6. | Beta is a measure of the volatility, or systematic risk, of a security or a portfolio in comparison to the market as a whole. |
| 7. | Book value is the net asset value of a company, calculated by subtracting total liabilities and intangible assets from total assets. |
| 8. | Brexit is an abbreviation of “British exit”, which refers to the June 23, 2016 referendum by British voters to exit the European Union. |
| 9. | Business development company (BDC) is an organization that invests in and helps small- andmedium-size companies grow in the initial stages of their development. |
| 10. | Cash flow measures the cash generating capability of a company by addingnon-cash charges (e.g., depreciation) and interest expense to pretax income. |
| 11. | Cash flow yield (or free cash flow yield) is a financial solvency ratio that compares the free cash flow per share a company is expected to earn against its market value per share. The ratio is calculated by taking the free cash flow per share divided by the current share price. |
| 12. | Capex (capital expenditures) are expenditures creating future benefits. |
| 13. | Collateralized Loan Obligation (CLO) is a security backed by a pool of debt, oftenlow-rated corporate loans. Collateralized loan obligations (CLOs) are similar to collateralized mortgage obligations, except for the different type of underlying loan. |
| 14. | Combined ratio is a formula used by insurance companies to relate premium income to claims, administration and dividend expenses. It is used in the annual statement filed by an insurer with the state insurance department. It is calculated by dividing the sum of incurred losses and expenses by earned premium. |
| 15. | Compound annual growth rate (CAGR) is the rate of growth of a number, compounded over several years. |
| 16. | Conditionalpre-payment rate is a loan prepayment rate that is equal to the proportion of the principal of a pool of loans that is assumed to be paid off prematurely in each period. |
| 17. | The Consumer Price Index (CPI) is a measure that examines the weighted average of prices of a basket of consumer goods and services, such as transportation, food and medical care. Changes in the CPI are used to assess price changes associated with the cost of living; the CPI is one of the most frequently used statistics for identifying periods of inflation or deflation. |
| 18. | Correlation is a statistical measure of how two securities move in relation to each other. |
| 19. | A coupon or coupon payment is the annual interest rate paid on a bond, expressed as a percentage of the face value and paid from issue date until maturity. |
| 20. | Credit default swaps are swaps designed to transfer the credit exposure of fixed income products between parties. A credit default swap is also referred to as a credit derivative contract, where the purchaser of the swap makes payments up until the maturity date of a contract. Payments are made to the seller of the swap. In return, the seller agrees to pay off a third party debt if this party defaults on the loan. |
| 21. | Discounted cash flow is calculated by multiplying future cash flows by discount factors to obtain present values. |
| 22. | Diversification is the spreading of risk by putting assets in several categories of investments. |
| 23. | Dividend yield is the return on an investor’s capital investment that a company pays out to its shareholders in the form of dividends. It is calculated by taking the amount of dividends paid per share over the course of a year and dividing by the stock’s price. |
| 24. | Drawdown is thepeak-to-trough decline during a specific record period of an investment, fund or commodity. |
| 156 | Litman Gregory Funds Trust | |||||
Table of Contents
Litman Gregory Funds Trust
INDUSTRY TERMS AND DEFINITIONS – (Continued)
| 25. | Dry powder refers to cash reserves kept on hand to cover future obligations or purchase assets, if conditions are favorable. |
| 26. | Duration is a measure of the sensitivity of the price (the value of principal) of a fixed-income investment to a change in interest rates. Duration is expressed as a number of years. Rising interest rates mean falling bond prices, while declining interest rates mean rising bond prices. |
| 27. | Earnings per share (EPS) is calculated by taking the total earnings divided by the number of shares outstanding. |
| 28. | EBIT is a company’s earnings before interest and taxes, and measures the profit a company generates from its operations, making it synonymous with “operating profit”. |
| 29. | EBITDA is a company’s earnings before interest, taxes, depreciation, and amortization. |
| 30. | E-Mini Futures Are an electronically traded futures contract on the Chicago Mercantile Exchange that represents a portion of the normal futures contracts. |
| 31. | Enterprise value is a measure of a company’s total value, calculated by adding a corporation’s market capitalization, preferred stock, and outstanding debt together and then subtracting out the cash and cash equivalents. |
| 32. | Enterprise value/adjusted target operating profit (or Enterprise Value/adjusted target EBIT) is a financial ratio that compares the total valuation of the company with its profitability, adjusting for various special circumstances. |
| 33. | EV/EBITDA is the enterprise value of a company divided by earnings before interest, taxes, depreciation, and amortization. |
| 34. | EV/Sales is the ratio of enterprise value of a company divided by the total sales of the company for a particular period, usually one year. |
| 35. | Floating interest rate, also known as a variable or adjustable rate, refers to any type of debt instrument, such as a loan, bond, mortgage, or credit, that does not have a fixed rate of interest over the life of the instrument. |
| 36. | Forex (FX) is the market in which currencies are traded. |
| 37. | Free cash flow is the amount of cash a company has after expenses, debt service, capital expenditures, and dividends. |
| 38. | Futures are financial contracts obligating the buyer to purchase an asset (or the seller to sell an asset), such as a physical commodity or a financial instrument, at a predetermined future date and price. Futures contracts detail the quality and quantity of the underlying asset; they are standardized to facilitate trading on a futures exchange. |
| 39. | The G20 (orG-20 or Group of Twenty) is an international forum for the governments and central bank governors from 20 major economies. It was founded in 1999 with the aim of studying, reviewing, and promoting high-level discussion of policy issues pertaining to the promotion of international financial stability. |
| 40. | Gross merchandise volume or GMV is a term used in online retailing to indicate a total sales dollar value for merchandise sold through a particular marketplace over a certain time frame. |
| 41. | “Growth” stocks are generally considered to be stocks of companies with high expected earnings growth compared to “value” stocks. Because of this higher expected growth, growth stocks tend to be priced at a higher multiple of their current earnings than value stocks. However, the premium paid for growth stocks compared to value stocks can vary dramatically depending on the market environment. |
| 42. | Industry cost curve is the standard microeconomic graph that shows how much output suppliers can produce at a given cost per unit. As a strategic tool, the cost curve applies most directly to commodity or near commodity industries, in which buyers get roughly the same value from a product regardless of who produces it. |
| 43. | An interest rate future is a financial derivative (a futures contract) with an interest-bearing instrument as the underlying asset. It is a particular type of interest rate derivative. Examples include Treasury-bill futures, Treasury-bond futures and Eurodollar futures. |
| 44. | An interest rate swap is a forward contract in which one stream of future interest payments is exchanged for another based on a specified principal amount. |
| 45. | Internal Rate of Return (IRR) is the discount rate often used in capital budgeting that makes the net present value of all cash flows from a particular project equal to zero. |
| 46. | Inverse floater (or inverse floating rate note) is a bond or other type of debt whose coupon rate has an inverse relationship to a benchmark rate. |
| Industry Terms and Definitions | 157 | |||||
Table of Contents
Litman Gregory Funds Trust
INDUSTRY TERMS AND DEFINITIONS – (Continued)
| 47. | Inverse interest-only security is a security that pays a coupon inversely related to market rates (i.e., it moves in the opposite direction of interest rates), instead of paying a coupon corresponding to the interest payments homeowners (mortgagors) actually make. |
| 48. | An Investment Grade bond is a bond with a rating of AAA to BBB; a Below Investment Grade bond is a bond with a rating lower than BBB |
| 49. | A Leveraged Buyout (LBO) is the acquisition of another company using a significant amount of borrowed money to meet the cost of acquisition. |
| 50. | Loss adjusted yields are those that already reflect the impact of assumed economic losses. |
| 51. | Margin of safety is a principle of investing in which an analyst only purchases securities when the market price is below the analyst’s estimation of intrinsic value. It does not guarantee a successful investment. |
| 52. | Market capitalization (or market cap) is the total value of the issued shares of a publicly traded company; it is equal to the share price times the number of shares outstanding. MBA Refinance index is a weekly measurement put together by the Mortgage Bankers Association, a national real estate finance industry association, to predict mortgage activity and loan prepayments based on the number of mortgage refinance applications submitted. |
| 53. | The Merrill Option Volatility Expectations Index (MOVE©) reflects a market estimate of future Treasury bond yield volatility. The MOVE index is a yield curve weighted index of the normalized implied volatility on1-month Treasury options. The MOVE Index reports the average implied volatility across a wide range of outstanding options on thetwo-year, five-year,10-year, and30-year U.S. Treasury securities. |
| 54. | Net operating profit after tax (NOPAT): A company’s potential cash earnings if its capitalization were unleveraged (that is, if it had no debt). |
| 55. | Normalized earnings are earnings adjusted for cyclical ups and downs of the economy. Also, on the balance sheet, earnings adjusted to remove unusual orone-time influences. |
| 56. | Operating cash flow is calculated by summing net profit, depreciation, change in accruals, and change in accounts payable, minus change in accounts receivable, minus change in inventories. |
| 57. | Options are financial derivatives that represent a contract sold by one party (option writer) to another party (option holder). The contract offers the buyer the right, but not the obligation, to buy (call) or sell (put) a security or other financial asset at an agreed-upon price (the strike price) during a certain period of time or on a specific date (exercise date). |
| 58. | Pair-wise correlation is the average of the correlations of each managers’ performance with each of the other managers on the fund. |
| 59. | Personal consumption expenditure is the measure of actual and imputed expenditures of households, and includes data pertaining to durable andnon-durable goods and services. It is essentially a measure of goods and services targeted towards individuals and consumed by individuals. |
| 60. | Present value is the current worth of a future sum of money or stream of cash flows given a specified rate of return. |
| 61. | Price to book ratio is calculated by dividing the current market price of a stock by the book value per share. |
| 62. | Price to earnings (P/E) ratio is a common tool for comparing the prices of different common stocks and is calculated by dividing the current market price of a stock by the earnings per share. Similarly, multiples of earnings and cash flow are means of expressing a company’s stock price relative to its earnings per share or cash flow per share, and are calculated by dividing the current stock price by its earnings per share or cash per share. Forecasted earnings growth is the projected rate that a company’s earnings are estimated to grow in a future period. |
| 63. | Price to sales (P/S) ratio is a tool for calculating a stock’s valuation relative to other companies, calculated by dividing a stock’s current price by its revenue per share. |
| 64. | Price to tangible book value (PTBV) is a valuation ratio expressing the price of a security compared to its hard, or tangible, book value as reported in the company’s balance sheet. The tangible book value number is equal to the company’s total book value less the value of any intangible assets. |
| 65. | Prime is a classification of borrowers, rates, or holdings in the lending market that are considered to be of high quality. |
| 66. | Principal only securities are a type of fixed-income security where the holder is only entitled to receive regular cash flows that are derived from incoming principal repayments on an underlying loan pool. |
| 158 | Litman Gregory Funds Trust | |||||
Table of Contents
Litman Gregory Funds Trust
INDUSTRY TERMS AND DEFINITIONS – (Continued)
| 67. | Private market value is the value of a company if each of its parts were independent, publicly traded entities. |
| 68. | Prospective earnings growth ratio (PEG ratio): The projectedone-year annual growth rate, determined by taking the consensus forecast of next year’s earnings, less this year’s earnings, and dividing the result by this year’s earnings. |
| 69. | Put writing is a family of options trading strategies that involve the selling of put options to earn premiums. One can either write a covered put or a naked put. Utilizing a combination of covered puts and naked puts, one can also implement the ratio put write, which is a neutral strategy. |
| 70. | Quantitative Easing (QE) is a monetary policy in which a central bank purchases government securities or other securities from the market in order to lower interest rates and increase the money supply. |
| 71. | Return on capital (ROC) is a measure of how effectively a company uses the money (borrowed or owned) invested in its operations. It is calculated by dividing net income by invested capital. |
| 72. | Return on equity (ROE) is a measure of how well a company used reinvested earnings to generate additional earnings. Expressed as a percentage, it is calculated by dividing net worth at the beginning of the period into net income for the period after preferred stock dividends but before common stock dividends. |
| 73. | Return on investment capital (ROIC) is calculated by subtracting dividends from net income and dividing by total capital. |
| 74. | Sequential growth is a measure of a company’s short-term financial performance that compares the results achieved in a recent period to those of the period immediately preceding it. |
| 75. | Sharpe ratio is the measure of a fund’s return relative to its risk. The Sharpe ratio uses standard deviation to measure a fund’s risk-adjusted returns. The higher a fund’s Sharpe ratio, the better a fund’s returns have been relative to the risk it has taken on. Because it uses standard deviation, the Sharpe ratio can be used to compare risk-adjusted returns across all fund categories. |
| 76. | Short (or short position) is the sale of a borrowed security, commodity, or currency with the expectation that the asset will fall in value. |
| 77. | Sortino Ratio is a modification of the Sharpe ratio that differentiates harmful volatility from general volatility by taking into account the standard deviation of negative asset returns, called downside deviation. |
| 78. | A sovereign bond is a debt security issued by a national government. |
| 79. | A special situation is a particular circumstance involving a security that would compel investors to trade the security based on the special situation, rather than the underlying fundamentals of the security or some other investment rationale. Aspin-off is an example of a special situation. |
| 80. | Spot price is the current price at which a particular security can be bought or sold at a specified time and place. |
| 81. | Standard deviation is a statistical measure of the historical volatility of a mutual fund or portfolio, usually computed using 36 monthly returns. |
| 82. | Subprime refers to the credit quality of particular borrowers, who have weakened credit histories and a greater risk of loan default than prime borrowers. The market for lenders and borrowers of subprime credit includes the business of subprime mortgages, subprime auto loans and subprime credit cards, as well as various securitization products that use subprime debt as collateral. |
| 83. | Swaps, traditionally, are the exchange of one security for another to change the maturity (bonds), quality of issues (stocks or bonds), or because investment objectives have changed. Recently, swaps have grown to include currency swaps and interest rate swaps. |
| 84. | Swaption (swap option): The option to enter into an interest rate swap. In exchange for an option premium, the buyer gains the right but not the obligation to enter into a specified swap agreement with the issuer on a specified future date. |
| 85. | Tangible Book Value Per Share—TBVPS is a method of valuing a company on aper-share basis by measuring its equity after removing any intangible assets. |
| 86. | Tracking error is the monitoring the performance of a portfolio, usually to analyze the extent to which its price movements conform or deviate from those of a benchmark. |
| 87. | Upside/downside capture is a statistical measure that shows whether a given fund has outperformed—gained more or lost lessthan--a broad market benchmark during periods of market strength and weakness, and if so, by how much. |
| Industry Terms and Definitions | 159 | |||||
Table of Contents
Litman Gregory Funds Trust
INDUSTRY TERMS AND DEFINITIONS – (Continued)
| 88. | Yield Curve: A line that plots the interest rates, at a set point in time, of bonds having equal credit quality, but differing maturity dates. The most frequently reported yield curve compares the three-month,two-year, five-year and30-year U.S. Treasury debt. The curve is used to predict changes in economic output and growth. |
| 89. | Yield to Maturity is the rate of return anticipated on a bond if it is held until the maturity date. |
| 90. | Yield to Worst is the lowest potential yield that can be received on a callable bond without the issuer actually defaulting. |
| 91. | Z Bonds, or Z Tranches, are the final tranche in a series of mortgage-backed securities, that is the last one to receive payment. Used in some collateralized mortgage obligations (CMO),Z-bonds pay no coupon payments while principal is being paid on earlier bonds. |
| 160 | Litman Gregory Funds Trust | |||||
Table of Contents
Litman Gregory Funds Trust
For the fiscal year ended December 31, 2019, certain dividends paid by the Funds may be subject to a maximum tax rate of 15%, as provided for by the Jobs and Growth Tax Relief Reconciliation Act of 2003. The percentage of dividends declared from ordinary income designated as qualified dividend income was as follows:
Litman Gregory Masters Equity Fund | 100.00 | % | ||
Litman Gregory Masters International Fund | 100.00 | % | ||
Litman Gregory Masters Smaller Companies Fund | 30.91 | % | ||
Litman Gregory Masters Alternative Strategies Fund | 19.04 | % | ||
Litman Gregory Masters High Income Alternatives Fund | 1.14 | % |
For corporate shareholders, the percent of ordinary income distributions qualifying for the corporate dividends received deduction for the fiscal year ended December 31, 2019 was as follows:
Litman Gregory Masters Equity Fund | 100.00 | % | ||
Litman Gregory Masters International Fund | 0.00 | % | ||
Litman Gregory Masters Smaller Companies Fund | 18.50 | % | ||
Litman Gregory Masters Alternative Strategies Fund | 10.09 | % | ||
Litman Gregory Masters High Income Alternatives Fund | 1.91 | % |
Pursuant to Internal Revenue Section 852(b), the following Funds paid distributions, which have been designated as capital gains distributions for the fiscal year ended December 31, 2019.
Litman Gregory Masters Equity Fund | $ | 23,579,152 | ||
Litman Gregory Masters International Fund | N/A | |||
Litman Gregory Masters Smaller Companies Fund | 627,462 | |||
Litman Gregory Masters Alternative Strategies Fund | N/A | |||
Litman Gregory Masters High Income Alternatives Fund | 265,169 |
Additional Information Applicable to Foreign Shareholders Only:
The percent of ordinary dividend distributions for the year ended December 31, 2019, which are designated as interest-related dividends under Internal Revenue Code Section 871 (k)(1)(C) is as follows:
Litman Gregory Masters Equity Fund | N/A | |||
Litman Gregory Masters International Fund | N/A | |||
Litman Gregory Masters Smaller Companies Fund | N/A | |||
Litman Gregory Masters Alternative Strategies Fund | 88.76 | % | ||
Litman Gregory Masters High Income Alternatives Fund | N/A |
The percentage of taxable ordinary income distributions that are designated as short-term capital gain distributions under Internal Revenue Section 871(k)(2)(C) for each Fund were as follows (unaudited):
Litman Gregory Masters Equity Fund | 0.00 | % | ||
Litman Gregory Masters International Fund | 0.00 | % | ||
Litman Gregory Masters Smaller Companies Fund | 0.00 | % | ||
Litman Gregory Masters Alternative Strategies Fund | 0.00 | % | ||
Litman Gregory Masters High Income Alternatives Fund | 0.00 | % |
For the year ended December 31, 2019, theLitman Gregory Masters International Fundearned foreign source income and paid foreign taxes which they intend to pass through to their shareholders pursuant to Section 853 of the Internal Revenue Code as follows:
| Creditable Foreign Taxes Paid | Per Share Amount | Portion of Ordinary Income Distribution Derived from foreign Sourced Income | ||
| $925,334 | $0.0383 | 100.00% |
| Tax Information | 161 | |||||
Table of Contents
Litman Gregory Funds Trust
TRUSTEE AND OFFICER INFORMATION
Background information for the Trustees and Officers of the Trust is presented below. All Trustees oversee the Litman Gregory Masters Funds. The SAI includes additional information about the Trust’s Trustees and is available, without charge, by calling1-800-960-0188.
Independent Trustees*
| Name, Address and Year Born | Position(s) Held with the Trust | Term of Office and Length of Time Served | Principal Occupation(s) During Past Five Years | #of Portfolios in Fund Complex Overseen by Trustee | Other Directorships Held by Trustee During Past Five Years | |||||
Julie Allecta 1676 N. California Blvd., | Independent Trustee | Open-ended term; served since June 2013 | Member of Governing Council, Policy Committee Chair and Executive Committee member, Independent Directors Council (education for investment company independent directors) since 2014; Director, Northern California Society of Botanical Artists (botanical art) since 2014; and Retired Partner, Paul Hastings LLP (law firm) from 1999 to 2009. | 5 | Forward Funds (4 portfolios) Salient MS Trust (4 portfolios) Salient Midstream & MLP Fund (1 portfolio) | |||||
Frederick A. Eigenbrod, Jr., Ph.D. 1676 N. California Blvd., Suite 500, Walnut Creek, California 94596 (born 1941) | Independent Trustee | Open-ended term; served since inception | Vice President, RoutSource Consulting Services (organizational planning and development) since 2002. | 5 | None | |||||
Harold M. Shefrin, Ph.D. 1676 N. California Blvd., Suite 500, Walnut Creek, California 94596 (born 1948) | Independent Trustee | Open-ended term; served since February 2005 | Professor, Department of Finance, Santa Clara University since 1979. | 5 | SA Funds – Investment Trust (10 portfolios) |
| 162 | Litman Gregory Funds Trust | |||||
Table of Contents
Litman Gregory Funds Trust
TRUSTEE AND OFFICER INFORMATION
Interested Trustees & Officers
| Name, Address and Year Born | Position(s) Held with the Trust | Term of Office and Length of Time Served | Principal Occupation(s) During Past Five Years | #of Portfolios in Fund Complex Overseen by Trustee | Other Directorships Held by Trustee/ Officer During Past Five Years | |||||
Jeremy DeGroot** 1676 N. California Blvd., Suite 500, Walnut Creek, California 94596 (born 1963) | Chairman of the Board, Trustee and President | Open-ended term; served as Chairman since March 2017, Trustee since December 2008 and President since 2014 | Chief Investment Officer of Litman Gregory Asset Management, LLC since 2008; andCo-Chief Investment Officer of Litman Gregory Asset Management, LLC from 2003 to 2008. | 5 | None | |||||
Stephen Savage 1676 N. California Blvd., Suite 500, Walnut Creek, California 94596 (born 1961) | Secretary | Open-ended term; served since 2014 | Chief Executive Officer of the Advisor since 2015; Managing Partner of the Advisor since 2010; Partner of the Advisor since 2003. | N/A | None | |||||
John Coughlan 1676 N. California Blvd., Suite 500, Walnut Creek, California 94596 (born 1956) | Treasurer and Chief Compliance Officer | Open-ended term; served as Treasurer since inception, and as Chief Compliance Officer since September 2004 | Chief Operating Officer and Chief Compliance Officer of the Advisor since 2004. | N/A | None |
| * | Denotes Trustees who are not “interested persons” of the Trust, as such term is defined under the 1940 Act (the “Independent |
| Trustees”). |
| ** | Denotes Trustees who are “interested persons” of the Trust, as such term is defined under the 1940 Act, because of their |
| relationship | with the Advisor (the “Interested Trustees”). |
In addition, Jack Chee, Rajat Jain and Jason Steuerwalt, each a Portfolio Manager and Senior Research Analyst at the Advisor, are
each an Assistant Secretary of the Trust.
| Trustee and Officer Information | 163 | |||||
Table of Contents
The Funds may collectnon-public personal information about you from the following sources:
| • | Information we receive about you on applications or other forms; |
| • | Information you give us orally; and |
| • | Information about your transactions with us. |
We do not disclose anynon-public personal information about our shareholders or former shareholders without the shareholder’s authorization, except as required or permitted by applicable law or in response to inquiries from governmental authorities. We restrict access to your personal and account information to our employees who need to know that information to provide products and services to you and to the employees of our affiliates. We also may disclose that information tonon-affiliated third parties (such as to brokers or custodians) only as permitted or required by applicable law and only as needed for us to provide agreed services to you.
We maintain physical, electronic and procedural safeguards to guard yournon-public personal information.
If you hold shares of the Funds through a financial intermediary, such as a broker-dealer, bank, or trust company, the privacy policy of your financial intermediary would govern how yournon-public personal information would be shared withnon-affiliated third parties.
| 164 | Litman Gregory Funds Trust | |||||
Table of Contents
Advisor:
Litman Gregory Fund Advisors, LLC
1676 N. California Blvd., Suite 500
Walnut Creek, CA 94596
Distributor:
ALPS Distributors, Inc.
1290 Broadway, Suite 1100
Denver, CO 80203
Transfer Agent:
DST Asset Manager Solutions, Inc.
P.O. Box 219922
Kansas City, MO 64121-9922
1-800-960-0188
For Overnight Delivery:
Masters Funds
C/O DST Asset Manager Solutions, Inc.
330 W. 9th Street
Kansas City, MO 64105
Investment Professionals:
Registered Investment Advisors, broker/dealers, and other investment professionals may contact Fund Services at1-925-254-8999.
Prospectus:
To request a current prospectus, statement of additional information, or an IRA application, call
1-800-960-0188.
Shareholder Inquiries:
To request action on your existing account, contact the Transfer agent, DST Asset Manager Solutions, Inc., at1-800-960-0188, from 9:00 a.m. to 6:00 p.m. eastern time, Monday through Friday.
24-Hour Automated Information:
For access to automated reporting of daily prices, account balances and transaction activity, call
1-800-960-0188, 24 hours a day, seven days a week. Please have your Fund number (see below) and account number ready in order to access your account information.
Information:
Fund | Symbol | CUSIP | Fund Number | |||||||||
| Equity Fund | MSEFX | 53700T108 | 305 | |||||||||
| International Fund | MSILX | 53700T207 | 306 | |||||||||
| Smaller Companies Fund | MSSFX | 53700T306 | 308 | |||||||||
| Alternative Strategies Fund | ||||||||||||
Institutional Class | MASFX | 53700T801 | 421 | |||||||||
Investor Class | MASNX | 53700T884 | 447 | |||||||||
| High Income Alternatives Fund | ||||||||||||
Institutional Class | MAHIX | 53700T876 | 1478 | |||||||||
Investor Class | MAHNX | 53700T868 | 1479 | |||||||||
Website:
www.mastersfunds.com
Table of Contents
Item 2. Code of Ethics.
The registrant has adopted a code of ethics that applies to the registrant’s principal executive officer and principal financial officer.
The registrant has not made any amendments to its code of ethics during the period covered by this report.
The registrant has not granted any waivers from any provisions of the code of ethics during the period covered by this report.
The registrant undertakes to provide to any person without charge, upon request, a copy of its code of ethics by mail when they call the registrant at1-800-960-0188.
Item 3. Audit Committee Financial Expert.
The registrant’s board of trustees (the “board”) has determined that Harold M. Shefrin, the Chairman of the board’s audit committee, is the “audit committee financial expert” and Mr. Shefrin has been deemed to be “independent” for purposes of this Item 3.
Item 4. Principal Accountant Fees and Services.
The registrant has engaged its principal accountant to perform audit services, audit-related services, tax services and other services during the past two fiscal years. “Audit services” refer to performing an audit of the registrant’s annual financial statements or services that are normally provided by the accountant in connection with statutory and regulatory filings or engagements for those fiscal years. “Audit-related services” refer to the assurance and related services by the principal accountant that are reasonably related to the performance of the audit. “Tax services” refer to professional services rendered by the principal accountant for tax compliance, tax advice, and tax planning. The following table details the aggregate fees billed or expected to be billed for each of the last two fiscal years for audit fees, audit-related fees, tax fees and other fees by the principal accountant.
| Cohen & Company, Ltd. | Cohen & Company, Ltd. | |||||||
| FYE 12/31/2019 | FYE 12/31/2018 | |||||||
Audit Fees | $ | 166,025 | $ | 147,725 | ||||
Audit-Related Services | $ | 0 | $ | 0 | ||||
Tax Fees | $ | 25,600 | $ | 25,600 | ||||
All Other Fees | $ | 0 | $ | 0 | ||||
The audit committee has adoptedpre-approval policies and procedures that require the audit committee topre-approve all audit andnon-audit services of the registrant, including services provided to any entity affiliated with the registrant.
Table of Contents
The percentage of fees billed by the principal accountant applicable tonon-audit services pursuant to waiver ofpre-approval requirement were as follows:
| Cohen & Company, Ltd. | Cohen & Company, Ltd. | |||||||
| FYE 12/31/2019 | FYE 12/31/2018 | |||||||
Audit-Related Services | 0 | % | 0 | % | ||||
Tax Fees | 0 | % | 0 | % | ||||
All Other Fees | 0 | % | 0 | % | ||||
All of the principal accountant’s hours spent on auditing the registrant’s financial statements were attributed to work performed by full-time permanent employees of the principal accountant. The following table indicates thenon-audit fees billedor expected to be billed by the registrant’s accountant for services to the registrant and to the registrant’s investment adviser (and any other controlling entity, etc.—notsub-adviser) for the last two years. The audit committee of the board has considered whether the provision ofnon-audit services that were rendered to the registrant’s investment adviser is compatible with maintaining the principal accountant’s independence and has concluded that the provision of suchnon-audit services by the accountant has not compromised the accountant’s independence.
| Cohen & Company, Ltd. | Cohen & Company, Ltd. | |||||||
Non-Audit Related Fees | FYE 12/31/2019 | FYE 12/31/2018 | ||||||
Registrant | $ | 4,400 | $ | 3,700 | ||||
Registrant’s Investment Adviser | None | None | ||||||
Item 5. Audit Committee of Listed Registrants.
Not applicable to registrants who are not listed issuers (as defined in Rule10A-3 under the Securities Exchange Act of 1934, as amended (the “Exchange Act”)).
Item 6. Investments.
(a) The complete Schedule of Investments is included as part of the report to shareholders filed under Item 1 of thisForm N-CSR.
(b) Not applicable.
Item 7. Disclosure of Proxy Voting Policies and Procedures forClosed-End Management Investment Companies.
Not applicable toopen-end investment companies.
Item 8. Portfolio Managers ofClosed-End Management Investment Companies.
Not applicable toopen-end investment companies.
Table of Contents
Item 9. Purchases of Equity Securities byClosed-End Management Investment Company and Affiliated Purchasers.
Not applicable toopen-end investment companies.
Item 10. Submission of Matters to a Vote of Security Holders.
There have been no material changes to the procedures by which shareholders may recommend nominees to the registrant’s board since the registrant last provided disclosure in response to this Item 10.
Item 11. Controls and Procedures.
(a) The registrant’s President/Principal Executive Officer and Treasurer/Principal Financial Officer have reviewed the registrant’s disclosure controls and procedures (as defined in Rule30a-3(c) under the Act) as of a date within 90 days of the filing of this report, as required by Rule30a-3(b) under the Act and Rules13a-15(b) or15d-15(b) under the Exchange Act. Based on their review, such officers have concluded that the disclosure controls and procedures are effective in ensuring that information required to be disclosed in this report is appropriately recorded, processed, summarized and reported timely and made known to them by others within the registrant and by the registrant’s service provider.
(b) There were no changes in the registrant’s internal control over financial reporting (as defined in Rule30a-3(d) under the Act) that occurred during the period covered by this report that have materially affected, or are reasonably likely to materially affect, the registrant’s internal control over financial reporting.
Item 12. Disclosure of Securities Lending Activities forClosed-End Management Investment Companies.
Not applicable toopen-end investment companies.
Item 13. Exhibits.
(a)(1) Not applicable because the Code of Ethics is provided free of charge, upon request, as described in Item 2 of this FormN-CSR.
(a)(2) Certifications pursuant to Section 302 of the Sarbanes-Oxley Act of 2002 are attached as exhibits hereto.
(a)(3) Not applicable toopen-end investment companies.
(a)(4) Not applicable.
(b) Certifications pursuant to Section 906 of the Sarbanes-Oxley Act of 2002 are attached as exhibits hereto.
Table of Contents
SIGNATURES
Pursuant to the requirements of the Securities Exchange Act of 1934, as amended, and the Investment Company Act of 1940, as amended, the registrant has duly caused this report to be signed on its behalf by the undersigned, thereunto duly authorized.
LITMAN GREGORY FUNDS TRUST
| By: | /s/ Jeremy L. DeGroot | |
| Jeremy L. DeGroot | ||
| President and Chief Executive Officer | ||
| Date: | March 4, 2020 | |
Pursuant to the requirements of the Securities Exchange Act of 1934, as amended, and the Investment Company Act of 1940, as amended, this report has been signed below by the following persons on behalf of the registrant and in the capacities and on the dates indicated.
| By: | /s/ Jeremy L. DeGroot | |
| Jeremy L. DeGroot | ||
| President and Chief Executive Officer | ||
| Date: | March 4, 2020 | |
| By: | /s/ John M. Coughlan | |
| John M. Coughlan | ||
| Treasurer and Principal Financial Officer | ||
| Date: | March 4, 2020 | |