Table of Contents
UNITED STATES
SECURITIES AND EXCHANGE COMMISSION
Washington, D.C. 20549
FORM N-CSR
CERTIFIED SHAREHOLDER REPORT OF REGISTERED
MANAGEMENT INVESTMENT COMPANIES
Investment Company Act file number: 811-07763
LITMAN GREGORY FUNDS TRUST
(Exact name of registrant as specified in charter)
2301 Rosecrans Avenue, Suite 2150
El Segundo, California
(Address of principal executive offices)(Zip code)
(Name and Address of Agent for Service)
Jeffrey K. Seeley
2301 Rosecrans Avenue, Suite 2150
El Segundo, California
Registrant’s telephone number, including area code: (925) 254-8999
Date of fiscal year end: December 31
Date of reporting period: December 31, 2023
Table of Contents
Item 1. Report to Shareholders.
(a) The following is a copy of the report transmitted to shareholders pursuant to Rule 30e-1 under the Investment Company Act of 1940, as amended (the “Act”):
Table of Contents


Annual Report
iMGP Global Select Fund
iMGP International Fund
iMGP Oldfield International Value Fund
iMGP SBH Focused Small Value Fund
iMGP Alternative Strategies Fund
iMGP High Income Fund
iMGP Dolan McEniry Corporate Bond Fund
iMGP DBi Managed Futures Strategy ETF
iMGP DBi Hedge Strategy ETF
iMGP RBA Responsible Global Allocation ETF
iMGP Berkshire Dividend Growth ETF
December 31, 2023
Table of Contents
| ii | Litman Gregory Funds Trust | |||||
Table of Contents

| 2 | ||
iMGP Global Select Fund | ||
| 4 | ||
| 7 | ||
iMGP International Fund | ||
| 9 | ||
| 13 | ||
iMGP Oldfield International Value Fund | ||
| 14 | ||
| 18 | ||
iMGP SBH Focused Small Value Fund | ||
| 19 | ||
| 22 | ||
iMGP Alternative Strategies Fund | ||
| 23 | ||
Alternative Strategies Fund Consolidated Schedule of Investments | 32 | |
iMGP High Income Fund | ||
| 71 | ||
| 75 | ||
iMGP Dolan McEniry Corporate Bond Fund | ||
| 90 | ||
| 92 | ||
iMGP DBi Managed Futures Strategy ETF | ||
| 94 | ||
DBi Managed Futures Strategy ETF Consolidated Schedule of Investments | 96 | |
iMGP DBi Hedge Strategy ETF | ||
| 98 | ||
| 100 | ||
iMGP RBA Responsible Global Allocation ETF | ||
| 102 | ||
RBA Responsible Global Allocation ETF Schedule of Investments | 104 | |
iMGP Berkshire Dividend Growth ETF | ||
| 105 | ||
| 108 | ||
| 109 | ||
| 111 | ||
| 115 | ||
| 118 | ||
| 118 | ||
| 119 | ||
| 119 | ||
| 120 | ||
| 120 | ||
| 121 | ||
| 122 | ||
| 122 | ||
| 123 | ||
| 123 | ||
Financial Highlights | ||
| 124 | ||
| 125 | ||
| 126 | ||
| 127 | ||
| 128 | ||
| 129 | ||
| 130 | ||
| 131 | ||
| 132 | ||
| 133 | ||
| 134 | ||
| 135 | ||
| 136 | ||
| 169 | ||
| 170 | ||
| 171 | ||
| 173 | ||
| 178 | ||
| 180 | ||
| 182 |
This report is intended for shareholders of the funds and may not be used as sales literature unless preceded or accompanied by a current prospectus for the iMGP Funds. Statements and other information in this report are dated and are subject to change.
iM Global Partner Fund Management, LLC has ultimate responsibility for the funds’ performance due to its responsibility to oversee its investment managers and recommend their hiring, termination and replacement.
| Table of Contents | 1 | |||||
Table of Contents
iM Global Partner Fund Management
Commitment to Shareholders
We are deeply committed to making each iMGP Fund a highly satisfying long-term investment for shareholders. In following through on this commitment we are guided by our core values, which influence four specific areas of service:
First, we are committed to the IMGP concept.
| • | We will only hire managers who we strongly believe will deliver exceptional long-term returns relative to their benchmarks. We base this belief on extremely thorough due diligence research. This not only requires us to assess their stock-picking skills, but also to evaluate their ability to add incremental performance by investing in a concentrated portfolio of their highest conviction ideas. |
| • | We will monitor each of the managers so that we can maintain our confidence in their ability to deliver the long-term performance we expect. In addition, our monitoring will seek to assess whether they are staying true to their IMGP Funds mandate. Consistent with this mandate, we focus on long-term performance evaluation so that the IMGP managers will not be distracted by short-term performance pressure. |
Second, we will do all we can to ensure that the framework within which our stock pickers do their work further increases the odds of success.
| • | Investments from new shareholders in each fund are expected to be limited so that each fund’s asset base remains small enough to retain flexibility to add value. |
| • | The framework also includes either a single-manager or a multi-manager structure; the former allowing each fund an individual, highly disciplined investment process, and the latter making it possible for each manager to invest, when appropriate, in an opportunistic manner knowing that the potential volatility within his or her portfolio will be diluted at the fund level by the performance of the other managers. In this way, the multi-manager structure seeks to provide fund-level diversification. |
| • | We will work hard to discourage short-term speculators so that cash flows into the funds are not volatile. Lower volatility helps prevent our managers from being forced to sell stocks at inopportune times or to hold excessive cash for non-investment purposes. |
Third, is our commitment to do all we can from an operational standpoint to maximize shareholder returns.
| • | We will remain attentive to fund overhead, and whenever we achieve savings we will pass them through to shareholders. For example, we have had several manager changes that resulted in lower sub-advisory fees to our funds. In every case we have passed through the full savings to shareholders in the form of fee waivers. |
| • | We will provide investors with a low minimum, no-load, no 12b-1 Institutional share class for all iMGP Funds, and a low minimum, no-load Investor share class for the Alternative Strategies Fund. |
| • | We also will work closely with our managers to make sure they are aware of tax-loss selling opportunities (only to be taken if there are equally attractive stocks to swap into). We account for partial sales on a specific tax lot basis so that shareholders will benefit from the most favorable tax treatment. The goal is not to favor taxable shareholders over tax-exempt shareholders but to make sure that the managers are taking advantage of tax savings opportunities when doing so is not expected to reduce pre-tax returns. |
Fourth, is our commitment to communicate honestly about all relevant developments and expectations.
| • | We will continue to do this by providing thorough and educational shareholder reports. |
| • | We will continue to provide what we believe are realistic assessments of the investment environment. |
Our commitment to iMGP Funds is also evidenced by our own investment. Our retired founders and current employees have, collectively, substantial investments in the funds, as does our company retirement plan. In addition, we use the funds extensively in the client accounts of our investment advisor practice (through our affiliate Litman Gregory Wealth Management, LLC). We have no financial incentive to do so because the fees we receive from iMGP Funds held in client accounts are fully offset against the advisory fees paid by our clients. In fact, we have a disincentive to use the funds in our client accounts because each iMGP Fund is capacity constrained (they may be closed as mentioned above), and by using them in client accounts we are using up capacity for which we may not be paid. But we believe these funds offer value that we can’t get elsewhere and this is why we enthusiastically invest in them ourselves and on behalf of clients.
While we believe highly in the ability of the Funds’ sub-advisors, our commitments are not intended as guarantees of future results.
While the funds are no-load, there are management fees and operating expenses that do apply, as well as a 12b-1 fee that applies to Investor class shares. Please refer to the prospectus for further details.
Diversification does not assure a profit or protect against loss in a declining market.
Must be preceded or accompanied by a prospectus.
| 2 | Litman Gregory Funds Trust | |||||
Table of Contents
General Disclosures
Past performance does not guarantee future results. Index performance is not illustrative of fund performance. An investment cannot be made directly in an index. The investment return and principal value of an investment will fluctuate so that an investor’s shares, when redeemed, may be worth more or less than their original cost. Current performance of the fund may be lower or higher than the performance quoted. To obtain the performance of the funds as of the most recently completed calendar month, please visit www.imgpfunds.com. Investment performance reflects fee waivers in effect. In the absence of such waivers, total return would be reduced.
Diversification does not assure a profit or protect against loss in a declining market.
Must be preceded or accompanied by a prospectus
Multi-investment management styles may lead to higher transaction expenses compared to single investment management styles. Outcomes depend on the skill of the sub-advisors and advisor and the allocation of assets amongst them.
Some of the comments are based on current management expectation and are considered “forward-looking statements”. Actual future results, however, may prove to be different from our expectations. You can identify forward-looking statement by words such as “estimate”, “may”, “expect”, “should”, “could”, “believe”, “plan”, and similar terms. We cannot promise future returns and our opinions are a reflection of our best judgment at the time this report is compiled.
Opinions expressed are subject to change, are not guaranteed and should not be considered recommendations to buy or sell any security.
iM Global Partner Fund Management has ultimate responsibility for the performance of the funds due to its responsibility to oversee the sub-advisors and recommend their hiring, termination and replacement.
Each of the funds may invest in foreign securities. Investing in foreign securities exposes investors to economic, political, and market risks and fluctuations in foreign currencies. Each of the funds may invest in the securities of small companies. Small-company investing subjects investors to additional risks, including security price volatility and less liquidity than investing in larger companies. Debt obligations of distressed companies typically are unrated, lower rated, in default or close to default and may become worthless. The International Fund will invest in emerging markets. Investments in emerging market countries involve additional risks such as government dependence on a few industries or resources, government-imposed taxes on foreign investment or limits on the removal of capital from a country, unstable government, and volatile markets. Investments in debt securities typically decrease when interest rates rise. This risk is usually greater for longer-term debt securities. Investments in mortgage-backed securities include additional risks that investor should be aware of including credit risk, prepayment risk, possible illiquidity, and default, as well as increased susceptibility to adverse economic developments. Investments in lower-rated and non-rated securities present a greater risk of loss to principal and interest than higher-rated securities. The funds may invest in master limited partnership units. Investing in MLP units may expose investors to additional liability and tax risks. Derivatives may involve certain costs and risks such as liquidity, interest rate, market, credit, management, and the risk that a position could not be closed when most advantageous. Investing in derivatives could lose more than the amount invested. The funds may make short sales of securities, which involves the risk that losses may exceed the original amount invested.
A commission may apply when buying or selling an ETF.
© 2021 Morningstar, Inc. All Rights Reserved. The information contained herein: (1) is proprietary to Morningstar; (2) may not be copied or distributed; and (3) is not warranted to be accurate, complete or timely. Neither Morningstar nor its content providers are responsible for any damages or losses arising from any use of this information. Past performance is no guarantee of future results.
| Fund Summary | 3 | |||||
Table of Contents
iMGP Global Select Fund 2023 Annual Report (Unaudited)
The iMGP Global Select Fund rose 17.26% in 2023, trailing the 23.79% return for the MSCI World Index. The fund narrowly trailed the 17.77% return of the Morningstar Global Large-Stock Blend category over the trailing 12 months.
Performance as of 12/31/2023 |
| |||||||||||||||||||
One- Year | Three- Year | Five- Year | Ten- Year | Since Inception 12/31/1996 | ||||||||||||||||
iMGP Global Select Fund | 17.26% | 0.94% | 9.41% | 7.64% | 7.87% | |||||||||||||||
MSCI World NR USD | 23.79% | 7.27% | 12.80% | 8.60% | 6.99% | |||||||||||||||
MSCI ACWI NR USD | 22.20% | 5.75% | 11.72% | 7.93% | 6.82% | |||||||||||||||
Morningstar US Fund Global Large-Stock Blend | 17.77% | 4.47% | 10.19% | 6.98% | 7.40% | |||||||||||||||
| Gross Expense Ratio 1.50% Net Expense Ratio 1.01% Adjusted Expense Ratio exclusive of Interest and Dividend Expense 0.98%* |
| |||||||||||||||||||
Performance quoted represents past performance and does not guarantee future results. The investment return and principal value of an investment will fluctuate so that an investor’s shares, when redeemed, may be worth more or less than their original cost. Current performance of the funds may be lower or higher than the performance quoted. To obtain standardized performance of the funds, and performance as of the most recently completed calendar month, please visit www.imgpfunds.com. The Advisor has contractually agreed to limit the expenses of the fund through April 30, 2025. Without this limit the fund’s net expenses would be higher and the return would be lower.
* The expense ratios disclosed in the performance table are based on the most recent prospectus and may not tie to what are disclosed in the financial highlights. |
| |||||||||||||||||||
Key Performance Drivers
The fund’s performance in 2023 was hurt by security selection, particularly within the technology sector. The fund’s dedicated exposure to small and mid-cap stocks also hurt relative returns. Broadly speaking, global small and mid-cap stocks (proxied by MSCI World SMID) underperformed their larger-cap counterparts in 2023. MSCI World SMID returned 15.62% compared to 23.79% year. While most of the discussion about the “Magnificent 7’s” (Alphabet, Amazon, Apple, Meta, Microsoft, Nvidia, Tesla), impact on returns relates to the S&P 500 Index, their impact is also felt within MSCI World. The Magnificent 7 make up nearly 19% of MSCI World and the fund is underweight to this basket of stocks. The impact of this large weight can be seen in the return of the MSCI World Equal Weighted Index, which returned 16.70% in 2023 or more than seven percentage points behind the market cap weighted MSCI World Index.
The fund’s selection within the technology sector was hurt mainly by a position in Keywords Studios. The stock was eventually sold during the third quarter for risk management reasons related to the threat of Artificial Intelligence. The company is a leader in the gaming development industry and facilitates outsourcing various functions to 24 of the top 25 gaming companies in the world. Artificial Intelligence is not new to gaming, but the adoption and experimentation are accelerating. The Polen Global SMID team modeled various scenarios, and the range of outcomes is unacceptably wide.
Security selection in the health care sector was a bright spot for the fund in 2023. ICON was the main contributor thanks to a greater than 45% return during the year. ICON is one of a handful of large, globally scaled players in the Clinical Research Organization (CRO) market and provides research and testing facilities to global pharmaceutical companies of all sizes. The stock saw a robust rebound in 2023 following a period of weakness driven by disruption from COVID, softer Biotech funding, and the escalation of the war in Ukraine. Fundamentals remain solid for ICON, the integration with PRA Health (previously a competitor) is progressing well, customer retention remains high and top-line growth is in line with long-term expectations of mid- to high single-digits. ICON continues to expect to reach $10 billion in sales by 2025, up from the $8bn it achieved over the last 12 months and $2.5bn it achieved in 2020. The combined company benefits from tremendous scale advantages and continues to win new business. After its rebound Polen Large Cap team trimmed their holding back to a mid-sized position. They continue to think the company maintains a strong competitive position, offers an attractive value proposition for pharmaceutical and biotech partners, and remain confident in the company’s ability to drive solid earnings growth in the coming years.
Goosehead Insurance helped drive strong security selection within the financials sector. Goosehead Insurance, a personal line property and casualty insurance brokerage primarily focused on home and auto markets, rose roughly 120% over the year. The company delivered consecutive quarters of robust results, continuing to execute its plan to clean up the corporate organization and return the company to its pre-COVID-19 productivity metrics. In its latest quarterly results total revenue increased 23% year on year, core revenue grew 22%, and premiums, the leading indicator of future revenue growth, increased 30%. Margins also showed healthy expansion. Broker upgrades and inclusion in the S&P Small Cap Index through the year further boosted the stock.
Industrials security selection hurt relative returns in 2023. 3M Company is a diversified industrial conglomerate with leading market share positions across a variety of businesses including industrial materials and adhesives, healthcare consumables, safety equipment, and consumer products. The company has historically enjoyed stable market share positions across its portfolio and its businesses benefit from structural demand drivers including the shift from traditional fasteners to adhesives, aging populations, and rising safety standards globally. These characteristics have contributed to the company exhibiting high and stable returns on capital over time.
| 4 | Litman Gregory Funds Trust | |||||
Table of Contents
Nuance’s view of 3M’s normalized earnings power is near $10.00 per share, and believes the company is currently under-earning relative to Wall Street consensus estimates for 2024. The first source of under-earning, in Nuance’s opinion, is related to cyclical weakness in 3M’s consumer-facing businesses. Discretionary consumer spending has weakened as inflation has impacted consumer budgets and consumers have worked down pandemic-related savings. According to their research, this has led to a cyclical decline in discretionary consumer electronics purchases including smartphones, TVs, tablets, and their related semiconductor content. These are all categories that utilize MMM’s products. On top of this headwind to sales driven by the end consumer, general inventory destocking by retailers has compounded this decrease in sales, in Nuance’s opinion.
The second source of under-earning is related to cost inflation for 3M’s key inputs including resins, petrochemicals, wood pulp, labor, and transportation. Nuance’s estimate that 3M’s EBITDAR margins are currently more than 200 basis points below levels they would consider normal. They believe additional pricing actions and/or moderating input cost inflation should result in margin normalization over the next few years.
Additionally, 3M is currently facing two legal battles which Nuance believes have led to negative sentiment and helped create a compelling valuation opportunity in the stock. The Investment Team has thoroughly studied both situations, has examined past analogous corporate litigation, and has stress tested 3M’s earnings power and balance sheet for a variety of scenarios. Importantly, they do not expect these legal issues to impact the competitive position of 3M’s broad line of businesses and have incorporated their own expected litigation and settlement costs into our balance sheet and normalized earnings estimates. It is Nuance’s belief that the company’s strong balance sheet and its normalized annual free cash flow in excess of $5.5 billion should provide an ample cushion from which to service any costs related to these matters. To emphasize, these issues and their own internal estimate of their long-term impact to the company are included in Nuance’s view of normalized earnings, cash flows, and balance sheet strength. In legal matters, there is always uncertainty, but based on their study of these issues, it appears to be a situation where the uncertainty is providing a solid risk reward opportunity. Nuance added to our position throughout 2023.
Revolve Group was a cause for negative security selection with the consumer discretionary sector. Revolve Group, a next-generation online retailer, sold off after posting a set of disappointing results against tough comparisons. The company had gone through a period of strength in 2022, boosted by “reopening” demand, with 2022 sales almost double that of 2020. 2023 has seen growth slow and turn negative, with operating margins also down. The share price is trading at lower levels than pre-pandemic despite being a much stronger business, having almost doubled revenues and grown annualized earnings at approximately 20%. This reflects a stark shift in sentiment. Revolve remains a high-quality company run by one of the better management teams, in the view of the Polen Small Cap team, but given their huge opportunity set and an appreciation for the wider range of outcomes, they sold out of the position in the fourth quarter.
Akzo Nobel posted a strong 26.9% return in 2023 and contributed to solid security selection in the materials sector. The company is a global manufacturer of paints and coatings with leading market share positions for paint in Europe, Asia, and Latin America. The company is also a global leader in several functional coating categories such as industrial, coil, wood, aerospace, and marine coatings. Nuance’s research suggested that the company was currently underearning its long-term potential for two transitory reasons. First, Akzo Nobel has faced raw material cost inflation, particularly in resins (40% of raw materials costs), which had depressed margins below normal levels, in their opinion. Inflationary pressures abated over the past few quarters and as raw material prices declined further from still elevated levels, Nuance believed the company would continue to see margin improvement. Second, the company faced cyclically lower demand for its products due to rising interest rates and slower growth across its geographies. Depressed demand led to inventory destocking across the channel in Europe and slower growth in China caused overall volumes to decline mid-single digits over the past year, according to their research. Nuance believed that the company’s stable market share position and structurally stable demand for paints and coatings, would position it to benefit from a cyclical demand improvement across both these markets. In their opinion, both these factors caused Akzo Nobel to post below normal earnings per share (EPS) relative to their internal estimates of normal EPS, creating what Nuance believed was an attractive risk reward relative to other opportunities. As the stock appreciated during the year, they exited the position and moved into what they viewed were more attractive risk rewards elsewhere.
Portfolio Mix
The Global Select Fund is built stock by stock from the bottom-up and can at times look very different from its benchmark. We believe this is key to generating excess long-term returns.
Over the course of 2023 the portfolio mix changed in the following way:
| • | Exposure to the information technology sector decreased from 24.3% to 15.9%. Exposure to smaller cap names within the sector were decreased over the year. |
| • | The financial sector weighting increased with the addition of names such as Brookfield, Markel, Fiserv, Morningstar, Hartford Financial Services, and Globe Life. |
| • | The health care sector remains the fund’s largest overweight. |
| • | At the start of 2023, the fund’s largest overweight was industrial stocks. This is no longer the case as the fund now has roughly the same amount as the index. The fund added six new names within the sector. |
| Fund Summary | 5 | |||||
Table of Contents
| • | The fund has zero exposure to energy and materials stocks as of the end of 2023. |
| • | Exposure to US equities increased throughout 2023. The fund remains underweight relative to MSCI World, however, the fund’s 59.9% weight is closer to the 69.6% in the index. |
By Sector
| Fund | ||||
Finance | 18.6% | |||
Consumer Discretionary | 8.4% | |||
Information Technology | 15.9% | |||
Communication Services | 5.5% | |||
Health Care & Pharmaceuticals | 22.2% | |||
Industrials | 11.9% | |||
Consumer Staples | 8.1% | |||
Real Estate | 2.1% | |||
Utilities | 3.6% | |||
Energy | 0% | |||
Materials | 0% | |||
Cash | 3.7% | |||
|
| |||
| 100% | ||||
By Region
| Fund | ||||
Europe | 28.4% | |||
North America | 67.4% | |||
Asia ex-Japan | 2.5% | |||
Japan | 1.7% | |||
Latin America | 0.0% | |||
Africa | 0.0% | |||
Australia/New Zealand | 0.0% | |||
Middle East | 0.0% | |||
Other Countries | 0.0% | |||
|
| |||
* Cash is excluded from calculation. | 100% | |||
By Region
US Equities | 59.9% | |||
Developed International Equities | 37.6% | |||
Emerging Market Equities | 2.5% | |||
|
| |||
| 100% |
iMGP Global Select Fund Value of Hypothetical $10,000
The value of a hypothetical $10,000 investment in the iMGP Global Select Fund from December 31, 1996 to December 31, 2023 compared with the Morningstar Global Large-Stock Blend Category and MSCI World Index.
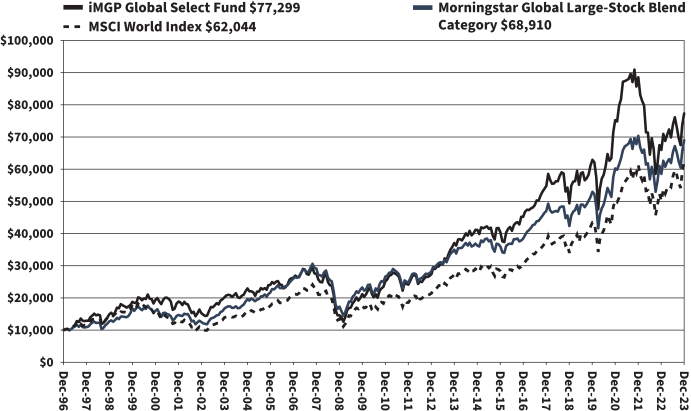
The hypothetical $10,000 investment at fund inception includes changes due to share price and reinvestment of dividends and capital gains. The chart does not imply future performance. Indexes are unmanaged, do not incur fees, expenses or taxes, and cannot be invested in directly.
Performance quoted does not include a deduction for taxes that a shareholder would pay on the redemption of fund shares.
| 6 | Litman Gregory Funds Trust | |||||
Table of Contents
iMGP Global Select Fund
SCHEDULE OF INVESTMENTS IN SECURITIES at December 31, 2023
| Shares | Value | |||||||
COMMON STOCKS: 93.9% | ||||||||
| Communication Services: 5.5% | ||||||||
| 15,889 | Alphabet, Inc. - Class A* | $ | 2,219,534 | |||||
| 58,200 | Comcast Corp. - Class A | 2,552,070 | ||||||
| 24,720 | CTS Eventim AG & Co. KGaA | 1,711,582 | ||||||
|
| |||||||
| 6,483,186 | ||||||||
|
| |||||||
| Consumer Discretionary: 8.4% | ||||||||
| 17,529 | Amazon.com, Inc.* | 2,663,356 | ||||||
| 75,300 | Compass Group PLC | 2,058,706 | ||||||
| 10,518 | Five Below, Inc.* | 2,242,017 | ||||||
| 8,625 | Floor & Decor Holdings, Inc. - Class A* | 962,205 | ||||||
| 1,155 | LVMH Moet Hennessy Louis Vuitton SE | 937,166 | ||||||
| 19,090 | YETI Holdings, Inc.* | 988,480 | ||||||
|
| |||||||
| 9,851,930 | ||||||||
|
| |||||||
| Consumer Staples: 8.1% | ||||||||
| 19,670 | Beiersdorf AG - ADR | 588,084 | ||||||
| 3,382 | Clorox Co. | 482,239 | ||||||
| 8,631 | Diageo PLC - ADR | 1,257,191 | ||||||
| 20,400 | Heineken NV | 2,040,000 | ||||||
| 116,875 | Henkel AG & Co. KGaA - ADR | 2,109,594 | ||||||
| 11,217 | Kimberly-Clark Corp. | 1,362,978 | ||||||
| 1,970 | L’Oreal SA | 981,930 | ||||||
| 11,013 | Pernod Ricard SA - ADR | 388,759 | ||||||
| 2,037 | Target Corp. | 290,109 | ||||||
|
| |||||||
| 9,500,884 | ||||||||
|
| |||||||
| Financials: 18.6% | ||||||||
| 3,982 | Aon PLC - Class A | 1,158,842 | ||||||
| 2 | Berkshire Hathaway, Inc. - Class A* | 1,085,250 | ||||||
| 3,209 | Berkshire Hathaway, Inc. - Class B* | 1,144,522 | ||||||
| 58,650 | Brookfield Corp. - Class A | 2,353,038 | ||||||
| 1,994 | Charles Schwab Corp. | 137,187 | ||||||
| 892 | Chubb Ltd. | 201,592 | ||||||
| 14,875 | Fiserv, Inc.* | 1,975,995 | ||||||
| 1,678 | Globe Life, Inc. | 204,246 | ||||||
| 15,350 | Goosehead Insurance, Inc. - Class A* | 1,163,530 | ||||||
| 2,645 | Hartford Financial Services Group, Inc. | 212,605 | ||||||
| 1,415 | Markel Group, Inc.* | 2,009,158 | ||||||
| 3,980 | Morningstar, Inc. | 1,139,235 | ||||||
| 16,171 | Northern Trust Corp. | 1,364,509 | ||||||
| 5,112 | Reinsurance Group of America, Inc. | 827,019 | ||||||
| 55,450 | TMX Group Ltd. | 1,345,884 | ||||||
| 6,624 | Travelers Cos., Inc. | 1,261,806 | ||||||
| 16,413 | Visa, Inc. - Class A | 4,273,125 | ||||||
|
| |||||||
| 21,857,543 | ||||||||
|
| |||||||
| Health Care: 22.2% | ||||||||
| 13,158 | Abbott Laboratories | 1,448,301 | ||||||
| 5,522 | Align Technology, Inc.* | 1,513,028 | ||||||
| 29,565 | Centene Corp.* | 2,194,019 | ||||||
| 26,400 | CVS Health Corp. | 2,084,544 | ||||||
| 38,394 | DENTSPLY SIRONA, Inc. | 1,366,442 | ||||||
| 25,210 | Eurofins Scientific SE | 1,644,571 | ||||||
| 10,465 | Henry Schein, Inc.* | 792,305 | ||||||
| 2,968 | Hologic, Inc.* | 212,064 | ||||||
| 4,504 | ICON PLC* | 1,274,947 | ||||||
| 4,748 | Illumina, Inc.* | 661,112 | ||||||
| 4,435 | McKesson Corp. | 2,053,316 | ||||||
| 20,235 | Novartis AG - ADR | 2,043,128 | ||||||
| Shares | Value | |||||||
| Health Care (continued) | ||||||||
| 38,030 | Progyny, Inc.* | $ | 1,413,955 | |||||
| 19,665 | Qiagen NV* | 854,051 | ||||||
| 3,631 | Quest Diagnostics, Inc. | 500,642 | ||||||
| 25,140 | Siemens Healthineers AG(a) | 1,462,601 | ||||||
| 76,168 | Smith & Nephew PLC - ADR | 2,077,863 | ||||||
| 3,070 | Tecan Group AG | 1,254,299 | ||||||
| 575 | Thermo Fisher Scientific, Inc. | 305,204 | ||||||
| 1,484 | Universal Health Services, Inc. - Class B | 226,221 | ||||||
| 2,166 | Waters Corp.* | 713,112 | ||||||
|
| |||||||
| 26,095,725 | ||||||||
|
| |||||||
| Industrials: 11.9% | ||||||||
| 19,207 | 3M Co. | 2,099,709 | ||||||
| 195,630 | Alight, Inc. - Class A* | 1,668,724 | ||||||
| 70,935 | Assa Abloy AB - Class B | 2,040,445 | ||||||
| 26,397 | Canadian Pacific Kansas City Ltd. | 2,086,947 | ||||||
| 21,794 | Core & Main, Inc. - Class A* | 880,696 | ||||||
| 13,230 | Daikin Industries Ltd. - ADR | 213,929 | ||||||
| 1,676 | Graco, Inc. | 145,410 | ||||||
| 81,363 | Knorr-Bremse AG - ADR | 1,323,125 | ||||||
| 36,272 | Legrand SA - ADR | 754,095 | ||||||
| 72,275 | MillerKnoll, Inc. | 1,928,297 | ||||||
| 3,960 | Paycom Software, Inc. | 818,611 | ||||||
|
| |||||||
| 13,959,988 | ||||||||
|
| |||||||
| Information Technology: 13.5% | ||||||||
| 2,637 | Accenture PLC - Class A | 925,350 | ||||||
| 3,888 | Adobe, Inc.* | 2,319,581 | ||||||
| 14,950 | Dynatrace, Inc.* | 817,616 | ||||||
| 13,345 | Kinaxis, Inc.* | 1,502,923 | ||||||
| 5,625 | Microsoft Corp. | 2,115,225 | ||||||
| 20,683 | Murata Manufacturing Co. Ltd. - ADR | 218,309 | ||||||
| 18,935 | Oracle Corp. | 1,996,317 | ||||||
| 11,620 | SAP SE | 1,792,639 | ||||||
| 6,100 | SHIFT, Inc.* | 1,550,704 | ||||||
| 2,600 | Tyler Technologies, Inc.* | 1,087,112 | ||||||
| 5,853 | Workday, Inc. - Class A* | 1,615,779 | ||||||
|
| |||||||
| 15,941,555 | ||||||||
|
| |||||||
| Real Estate: 2.1% | ||||||||
| 36,016 | Altus Group Ltd. | 1,149,392 | ||||||
| 56,881 | Healthcare Realty Trust, Inc. - REIT | 980,060 | ||||||
| 19,228 | Healthpeak Properties, Inc. - REIT | 380,714 | ||||||
|
| |||||||
| 2,510,166 | ||||||||
|
| |||||||
| Utilities: 3.6% | ||||||||
| 4,355 | American Water Works Co., Inc. | 574,816 | ||||||
| 7,066 | Essential Utilities, Inc. | 263,915 | ||||||
| 41,459 | Severn Trent PLC - ADR | 1,367,318 | ||||||
| 72,781 | United Utilities Group PLC - ADR | 1,997,839 | ||||||
|
| |||||||
| 4,203,888 | ||||||||
|
| |||||||
| | TOTAL COMMON STOCKS | 110,404,865 | ||||||
|
| |||||||
PREFERRED STOCK: 2.4% | ||||||||
| Information Technology: 2.4% | ||||||||
| 57,915 | Samsung Electronics Co. Ltd. -(Preference Shares) | 2,801,541 | ||||||
|
| |||||||
| | TOTAL PREFERRED STOCK | 2,801,541 | ||||||
|
| |||||||
The accompanying notes are an integral part of these financial statements.
| Schedule of Investments | 7 | |||||
Table of Contents
iMGP Global Select Fund
SCHEDULE OF INVESTMENTS IN SECURITIES at December 31, 2023 (Continued)
| Principal Amount | Value | |||||||
SHORT-TERM INVESTMENTS: 3.4% | ||||||||
REPURCHASE AGREEMENTS: 3.4% | ||||||||
| $4,034,971 | Fixed Income Clearing Corp. 1.600%, 12/29/2023, due 01/02/2024 [collateral: par value $4,484,000, U.S. Treasury Note, 0.625%, due 07/31/2026, value $4,116,243] (proceeds $4,035,688) | $ | 4,034,971 | |||||
|
| |||||||
| | TOTAL SHORT-TERM INVESTMENTS | 4,034,971 | ||||||
|
| |||||||
| | TOTAL INVESTMENTS | 117,241,377 | ||||||
|
| |||||||
| Other Assets in Excess of Liabilities: 0.3% | 361,991 | |||||||
|
| |||||||
NET ASSETS: 100.0% | $ | 117,603,368 | ||||||
|
| |||||||
Percentages are stated as a percent of net assets.
| ADR | American Depositary Receipt |
| REIT | Real Estate Investment Trust |
| * | Non-Income Producing Security. |
| (a) | Security was purchased pursuant to Rule 144A under the Securities Act of 1933 and may be sold in transactions exempt from registration only to qualified institutional buyers or in a public offering registered under Securities Act of 1933. |
The accompanying notes are an integral part of these financial statements.
| 8 | Litman Gregory Funds Trust | |||||
Table of Contents
iMGP International Fund 2023 Annual Report (Unaudited)
The iMGP International Fund rose 17.40% in 2023, trailing the 18.24% return for the MSCI EAFE Index. It outgained both the 15.62% of MSCI ACWI ex. US Index and 16.29% return of the Morningstar Foreign Large Blend category. Since the fund’s 1997 inception, the fund has an annualized return of 6.27%—comparing favorably to the 5.01% return for MSCI EAFE and 4.19% gain for the category.
Performance as of 12/31/2023 | ||||||||||||||||||||
| One- Year | Three- Year | Five- Year | Ten- Year | Since 12/1/1997 | ||||||||||||||||
iMGP International Fund | 17.40% | 0.95% | 7.11% | 1.92% | 6.27% | |||||||||||||||
MSCI ACWI ex US Index NET | 15.62% | 1.55% | 7.08% | 3.83% | 5.13% | |||||||||||||||
MSCI EAFE Index NET | 18.24% | 4.02% | 8.16% | 4.28% | 5.01% | |||||||||||||||
Morningstar Foreign Large Blend Category | 16.29% | 2.45% | 7.33% | 3.67% | 4.19% | |||||||||||||||
Gross Expense Ratio 1.47%, Net Expense Ratio 1.24%* | ||||||||||||||||||||
Performance quoted represents past performance and does not guarantee future results. The investment return and principal value of an investment will fluctuate so that an investor’s shares, when redeemed, may be worth more or less than their original cost. Current performance of the funds may be lower or higher than the performance quoted. To obtain standardized performance of the funds, and performance as of the most recently completed calendar month, please visit www.imgptfunds.com. The Advisor has contractually agreed to waive a portion of the management fee through April 30, 2025. Without this waiver the fund’s net expenses would be higher and the return would be lower.
* The expense ratios disclosed in the performance table are based on the most recent prospectus and may not tie to what are disclosed in the financial highlights.
MSCI index returns source: MSCI. Neither MSCI nor any other party involved in or related to compiling, computing, or creating the MSCI data makes any express or implied warranties or representations with respect to such data (or the results to be obtained by the use thereof), and all such parties hereby expressly disclaim all warranties of originality, accuracy, completeness, merchantability, or fitness for a particular purpose with respect to any of such data. Without limiting any of the foregoing, in no event shall MSCI, any of its affiliates, or any third party involved in or related to compiling, computing, or creating the data have any liability for any direct, indirect, special, punitive, consequential, or any other damages (including lost profits) even if notified of the possibility of such damages. No further distribution or dissemination of the MSCI data is permitted without MSCI’s express written consent. Source note: Returns prior to 1999 are the MSCI ACWI ex-US GR index. Returns from 1999 onwards are MSCI ACWI ex-US NR index. |
| |||||||||||||||||||
Key Performance Drivers
Sector allocation was a benefit to returns in 2023, while security selection detracted from relative returns. The fund’s overweight to technology and consumer discretionary stocks benefited the fund, while its underweight to consumer staples stocks also aided returns. A modest overweight to health care stocks detracted from returns, however, stock security selection within the sector more than made up for the overweight allocation. Security selection within the technology sector was the largest benefit to fund returns. While security within the financials sector was a leading detractor during the year.
The largest contributor to performance in 2023 was Ryanair. The position is held by both David Herro of Harris Associates and the team at Lazard Asset Management. Ryanair stock gained over 78% during the year. Herro says that Ryanair released strong results for the first half of fiscal-year 2024 and was accompanied by an even stronger outlook, in our view. The company’s revenue grew 30% year-over-year, and average fares increased by 24% to €58, driven by record demand and constrained capacity at European peers. Total passengers flown expanded 11% year over year to 105.4 million, and management is on track to maintain its target of 183.5 million passengers for 2024, depending on Boeing’s ability to meet its delivery commitments. Management is expecting full-year 2024 net income to be between €1.85-2.05 billion ahead of the €1.82 billion consensus estimate. The company’s strong free cash flow levels and balance sheet allowed Ryanair to reinstate a €400 million dividend (35 cents per share). The team at Harris Associates spoke with CEO Michael O’Leary about additional uses for its excess capital and were happy to hear about an incremental €1.5 billion return to shareholders starting in 2025. They continue to be optimistic about Ryanair’s future.
Mark Little and Robin Jones (Lazard Asset Management) say that Ryanair continues to enjoy a favorable cost position in the short-haul aviation market compared to its competition. This advantage has expanded during COVID as the company has been able to invest through a downturn. The financial strength of the business enables them to operate a modern and more efficient fleet, which further enhances their competitive advantage. The company reported strong results over the course of the year. Demand for air travel continues to be robust with a positive outlook for pricing. Cash flow generation has been strong which helps fund attractive cash returns to shareholders and helps to underpin an undemanding valuation.
Ryanair’s strong return within the industrials sector was offset by another industrial stock: Teleperformance. The stock, owned by the team at Polen Capital, fell meaningfully in 2023. France-based Teleperformance is the world’s leading outsourced customer services manager. Teleperformance shares suffered in 2023 as sentiment surrounding AI adoption reached a crescendo and related market narratives assumed customer experience services will be fully automated. Polen Capital believes Teleperformance’s customers, and many other businesses will continue to require effective human customer experience management. Teleperformance continues to leverage technologies, including AI, to
| Fund Summary | 9 | |||||
Table of Contents
deliver successful business outcomes to customers. Management effectively navigated the impacts of transformational technologies at times over its 40 years in business and is proactively thinking through opportunities in the present environment. Teleperformance can weather today’s weak IT services market environment and rebound to the recent years’ steady growth trajectory. The Polen team estimates low double-digit total returns ahead. At 8x 2024 earnings, shares discount a darker future than we think is in store.
Strong security selection in the information technology sector was helped by a greater than 70% return for Sage Group. The position is held by the team at Polen Capital. Sage Group, a UK-based software company, continues to demonstrate strong business momentum with organic revenue growth in the low double-digit range. Management’s thoughtful product development and sales force alignment investments in recent years transitioned Sage Group’s software to a cloud-centric model. In its most recent quarterly update, management guided for continued low double-digit revenue growth for their fiscal 2024, a function of Sage’s strong value proposition providing mission critical accounting and business management software to small and medium-sized businesses. This level of growth, coupled with steady margin expansion, should in Polen’s estimation allow Sage to grow earnings at a mid-teens annualized rate going forward. Polen believes Sage Group’s margins have significant runway to expand from here, adding a nice profit lever to the coming years’ growth algorithm. In their view, a high-20s multiple on calendar 2024 earnings is a reasonable multiple as Sage Group is well positioned for steady growth.
The financials sector was a difficult area for the fund in 2023. By the far the biggest detractor within the sector was Worldline (owned by Harris Associates). Worldline, a European merchant acquirer and payment processor, was the top detractor for the year. The company’s third-quarter earnings missed consensus and Harris’ expectations, and management cut its full-year 2023 and 2024 guidance. The implied 2024 adjusted earnings guidance is around 16% below consensus expectations. This resulted in a 60% sell-off in the stock, an amount that Harris does not think is proportional to the impact to the company’s fair value. In their view, the negative guidance revision derives from two causes. First, due to evolving regulatory requirements around cybercrime in Europe, Worldline cut ties with certain online merchants that would have required excessive investment to be fully compliant with regulatory standards. Second, Worldline highlighted weak macroeconomic trends in Germany, where it is the market leader, and these are driving spending shifts toward non-discretionary categories that produce less revenue and profit from merchants for Worldline. Collectively, Worldline’s actions impact €210 million in annualized revenue (sub-6% consolidated revenues), reset margins down by 250 basis points, and will burden near-term cash generation due to restructuring charges. The negative impact should start to ease by the second half of 2024. The team at Harris Associates has spoken to management, former Worldline employees, and payment industry competitors. In their view, Worldline’s negative share price reaction is disproportional to the likely impact on its long-term prospects. The fundamentals of the business are still intact. The European payment market is cash heavy and still largely operated by legacy banks that are ceding share to pure acquirers like Worldline. The company’s scaled pan-European footprint, capital light and cash-generative operating profile, strong medium-term growth potential, and washed-out valuation make it an attractive holding.
Harris Associates appreciates Worldline’s position as a leader in European payments, and believe it has a long growth runway ahead due to Europe’s lower cashless penetration and higher levels of bank payment in-sourcing when compared to the U.S. They believe the payments industry is structurally attractive with high recurring revenues, low customer churn and strong free cash flow generation. In their view, Worldline’s revenue acceleration, which is driven by e-commerce business, travel recovery and synergy opportunities, is underappreciated by the market.
Another financial stock that struggled in 2023 was Sampo. The company, owned by the team at Lazard Asset Management, is a high-quality P&C insurance company operating across Scandinavia. The insurance markets in Scandinavia are highly consolidated, and policies are largely sold direct, which makes it a very price-disciplined market. Sampo generates very attractive and stable combined ratios as a result. The combination of a healthy economic backdrop and disciplined pricing generates good premium growth over time. Sampo has over time made investments outside their core business; however, new management have refocused capital allocation into the core P&C franchise and undergone a process to divest non-core assets.
The strong inflationary backdrop has put upward pressure on claims inflation in Sampo’s key markets at a time when frequency has also picked post COVID. This has put some pressure on combined ratios. However, the team at Lazard is encouraged to see strong price increases come through to compensate for higher claims at a time when inflationary pressures are moderating. This is a very common cycle in P&C insurance, and they are confident Sampo will rebuild their combined ratios to historical levels as pricing comes through at a lag. In addition to these cyclical headwinds, earnings have been hit by the deconsolidation of Sampo’s life insurance business as part of the simplification of the portfolio. Life insurance is a less attractive business given the long-duration book with higher sensitivity to financial asset values.
The fund’s main position within the materials sector is Glencore (owned by Harris Associates). The stock was a detractor last year. The company is one of the world’s largest mining firms. The Harris team likes that Glencore is run by smart, hyper-competitive and value-focused managers with a focus on improving asset returns. In their estimation, Glencore differentiates itself from other miners with its trading business that provides high returns and cash flow with low cyclicality and significant barriers to entry. They appreciate the company’s leading market positions in attractive commodities and believe existing mining operations will benefit from normalized prices, higher volumes, lower costs and the move towards a low carbon economy. Harris believes Glencore is an attractive investment and trades at approximately two-thirds of their estimate of its intrinsic value.
| 10 | Litman Gregory Funds Trust | |||||
Table of Contents
Glencore was a detractor for the year. The UK-based materials company’s stock price fell in January following its release of full-year 2022 results that missed expectations. In Harris’ view, the shortfall was driven by the industrial business given a mix of production issues within coal and two copper assets and cost inflation related to labor, diesel and explosives. During the second quarter, the market reacted unfavorably towards discussions of a merger between Glencore’s agricultural trader Viterra and Bunge, one of the world’s largest crop merchants, before seeing an increase in Glencore’s stock price once the companies entered into a definitive agreement. In August, Glencore released first-half of 2023 results that missed expectations which led Harris to modestly lower their estimate of intrinsic value. They believe the miss can be attributed to three main reasons: timing, costs and first-quarter results for nickel that were loss-making. Harris Associates believes Glencore’s management team makes smart capital allocation decisions and continue to think the company remains undervalued.
A solid contributor within the consumer staples sector was Coca-Cola Europacific Partners (owned by Lazard Asset Management). The strategic shift in the Coca-Cola system to focus on value over volume has been a transformational moment for their bottling partners. A more pricing-driven topline model has produced strong operational leverage for the bottlers resulting in improving margins and returns. As a strong operator, the company has also been in a position to consolidate new territories with opportunities to improve operational efficiency in established markets (e.g., Australia) and drive category growth in less developed markets (e.g., Indonesia).
The company delivered good results over the course of the year. The management team started the year with a confident outlook for full year 2023 despite concerns of weaker backdrop for the consumer. Fast-moving consumer goods companies have generally struggled with weaker volumes after a period of strong inflationary pressures. The resilient performance at Coca-Cola Europacific Partners reflects the strong pricing power in the category and good commercial execution by the management team.
Portfolio Mix
The International Fund is built stock by stock from the bottom-up and can at times look very different from its benchmark. We believe this is key to generating excess long-term returns.
Over the last 12 months, the overall portfolio mix changed modestly.
| • | The fund’s regional allocation did not meaningfully change over the course of the year. The fund remains significantly underweight to Japan with just two holdings at year-end. |
| • | The fund’s maintains an overweight to the technology sector. At the end of 2022, the fund had 13.6% in the sector. At year-end 2023, the exposure had increased modestly to 14.7%. The technology sector within the index is 8.6%. |
| • | Exposure to health care stocks jumped the most during the year (going from 12.8% to 19.1% at the end of 2023). New positions added during the year include Novo Nordisk and Gerresheimer. |
| • | The fund’s weight to communication services stocks decreased from 8.8% to 2.9% over the year. Liquidated positions in Universal Music Group and Informa drove most of the decrease within the sector. |
| Fund Summary | 11 | |||||
Table of Contents
By Sector
| 12/31/2023 | ||||
Finance | 19.0% | |||
Consumer Discretionary | 17.4% | |||
Information Technology | 14.7% | |||
Communication Services | 2.9% | |||
Health Care & Pharmaceuticals | 19.1% | |||
Industrials | 13.0% | |||
Consumer Staples | 5.4% | |||
Real Estate | 0.0% | |||
Utilities | 0.0% | |||
Energy | 0.0% | |||
Materials | 2.2% | |||
Cash | 6.3% | |||
|
| |||
| 100.0% | ||||
|
| |||
By Region
| 12/31/2023 | ||||
US Equities | 5.5% | |||
Developed International Equities | 91.2% | |||
Emerging Market Equities | 3.3% | |||
|
| |||
| 100.0% | ||||
|
| |||
| Cash not included. | ||||
By Region
| 12/31/2023 | ||||
Europe | 77.7% | |||
North America | 8.4% | |||
Asia ex-Japan | 5.3% | |||
Japan | 3.1% | |||
Latin America | 1.6% | |||
Africa | 0.0% | |||
Australia/New Zealand | 1.3% | |||
Middle East | 2.6% | |||
Other Countries | 0.0% | |||
|
| |||
Total | 100.0% | |||
|
| |||
| Cash not included. |
| |||
By Market Cap
| 12/31/2023 | ||||
Small Cap | 1.1% | |||
Mid Cap | 12.6% | |||
Large Cap | 86.3% | |||
|
| |||
| 100.0% | ||||
|
| |||
| Cash not included. | ||||
iMGP International Fund Value of Hypothetical $10,000
The value of a hypothetical $10,000 investment in the iMGP International Fund from November 30, 1997 to December 31, 2023 compared with the MSCI EAFE Index, and Morningstar Foreign Large Blend Category.
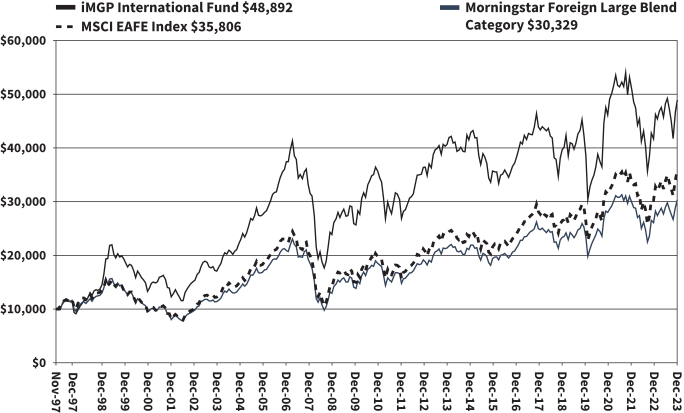
The hypothetical $10,000 investment at fund inception includes changes due to share price and reinvestment of dividends and capital gains. The chart does not imply future performance. Indexes are unmanaged, do not incur fees, expenses or taxes, and cannot be invested in directly.
Performance quoted does not include a deduction for taxes that a shareholder would pay on the redemption of fund shares.
| 12 | Litman Gregory Funds Trust | |||||
Table of Contents
iMGP International Fund
SCHEDULE OF INVESTMENTS IN SECURITIES at December 31, 2023
| Shares | Value | |||||||
COMMON STOCKS: 93.7% | ||||||||
| Argentina: 1.5% | ||||||||
| 2,143 | MercadoLibre, Inc.* | $ | 3,367,810 | |||||
|
| |||||||
| Australia: 1.2% | ||||||||
| 445,300 | Glencore PLC | 2,678,282 | ||||||
|
| |||||||
| Canada: 2.7% | ||||||||
| 39,678 | Canadian Pacific Kansas City Ltd. | 3,150,321 | ||||||
| 37,425 | Shopify, Inc. - Class A* | 2,915,408 | ||||||
|
| |||||||
| 6,065,729 | ||||||||
|
| |||||||
| China: 1.6% | ||||||||
| 117,601 | Prosus NV | 3,510,010 | ||||||
|
| |||||||
| Denmark: 3.6% | ||||||||
| 28,235 | Carlsberg AS - Class B | 3,547,652 | ||||||
| 43,876 | Novo Nordisk AS - Class B | 4,544,823 | ||||||
|
| |||||||
| 8,092,475 | ||||||||
|
| |||||||
| Finland: 2.6% | ||||||||
| 132,455 | Sampo OYJ - Class A | 5,802,940 | ||||||
|
| |||||||
| France: 8.7% | ||||||||
| 74,900 | BNP Paribas SA | 5,185,154 | ||||||
| 10,255 | Kering SA | 4,525,676 | ||||||
| 2,050 | LVMH Moet Hennessy Louis Vuitton SE | 1,663,367 | ||||||
| 21,710 | Teleperformance SE | 3,170,831 | ||||||
| 279,500 | Worldline SA*(a) | 4,844,240 | ||||||
|
| |||||||
| 19,389,268 | ||||||||
|
| |||||||
| Germany: 24.4% | ||||||||
| 13,255 | Adidas AG | 2,699,914 | ||||||
| 11,425 | Allianz SE | 3,057,432 | ||||||
| 143,900 | Bayer AG | 5,352,572 | ||||||
| 69,749 | Continental AG | 5,934,063 | ||||||
| 54,292 | CTS Eventim AG & Co. KGaA | 3,759,110 | ||||||
| 80,618 | Daimler Truck Holding AG | 3,033,481 | ||||||
| 121,665 | Fresenius SE & Co. KGaA | 3,777,313 | ||||||
| 31,527 | Gerresheimer AG | 3,290,027 | ||||||
| 132,689 | Hensoldt AG | 3,580,961 | ||||||
| 80,400 | Mercedes-Benz Group AG | 5,562,349 | ||||||
| 57,360 | SAP SE | 8,849,036 | ||||||
| 94,420 | Siemens Healthineers AG(a) | 5,493,190 | ||||||
|
| |||||||
| 54,389,448 | ||||||||
|
| |||||||
| Ireland: 10.7% | ||||||||
| 51,152 | ICON PLC - ADR* | 14,479,597 | ||||||
| 69,945 | Ryanair Holdings PLC - ADR* | 9,327,865 | ||||||
|
| |||||||
| 23,807,462 | ||||||||
|
| |||||||
| Israel: 2.4% | ||||||||
| 617,091 | Israel Discount Bank Ltd. - Class A | 3,104,580 | ||||||
| 440,085 | Tel Aviv Stock Exchange Ltd. | 2,355,960 | ||||||
|
| |||||||
| 5,460,540 | ||||||||
|
| |||||||
| Japan: 2.9% | ||||||||
| 83,600 | Nippon Sanso Holdings Corp. | 2,240,329 | ||||||
| 234,200 | Renesas Electronics Corp.* | 4,236,726 | ||||||
|
| |||||||
| 6,477,055 | ||||||||
|
| |||||||
| Netherlands: 2.4% | ||||||||
| 3,990 | ASML Holding NV | 3,008,438 | ||||||
| 23,488 | EXOR NV | 2,351,091 | ||||||
|
| |||||||
| 5,359,529 | ||||||||
|
| |||||||
| Shares | Value | |||||||
| South Korea: 1.3% | ||||||||
| 16,035 | NAVER Corp. | $ | 2,788,912 | |||||
|
| |||||||
| Spain: 2.4% | ||||||||
| 75,265 | Amadeus IT Group SA | 5,401,057 | ||||||
|
| |||||||
| Sweden: 2.7% | ||||||||
| 51,196 | Evolution AB(a) | 6,122,944 | ||||||
|
| |||||||
| Switzerland: 2.1% | ||||||||
| 82,400 | Julius Baer Group Ltd. | 4,622,439 | ||||||
|
| |||||||
| Taiwan: 2.2% | ||||||||
| 249,000 | Taiwan Semiconductor Manufacturing Co. Ltd. | 4,811,163 | ||||||
|
| |||||||
| United Kingdom: 13.1% | ||||||||
| 542,043 | CNH Industrial NV | 6,642,757 | ||||||
| 104,661 | Coca-Cola Europacific Partners PLC | 6,968,772 | ||||||
| 8,470,550 | Lloyds Banking Group PLC | 5,148,618 | ||||||
| 602,980 | Sage Group PLC | 9,007,108 | ||||||
| 31,153 | Unilever PLC | 1,508,180 | ||||||
|
| |||||||
| 29,275,435 | ||||||||
|
| |||||||
| United States: 5.2% | ||||||||
| 19,932 | Aon PLC - Class A | 5,800,611 | ||||||
| 69,219 | Medtronic PLC | 5,702,261 | ||||||
|
| |||||||
| 11,502,872 | ||||||||
|
| |||||||
| | TOTAL COMMON STOCKS | 208,925,370 | ||||||
|
| |||||||
| Principal Amount | ||||||||
SHORT-TERM INVESTMENTS: 5.9% | ||||||||
| REPURCHASE AGREEMENTS: 5.9% | ||||||||
| $13,139,674 | Fixed Income Clearing Corp. 1.600%, 12/29/2023, due 01/02/2024 [collateral: par value $14,601,200, U.S. Treasury Note, 0.625%, due 07/31/2026, value $13,403,677] (proceeds $13,142,010) | 13,139,674 | ||||||
|
| |||||||
| | TOTAL SHORT-TERM INVESTMENTS | 13,139,674 | ||||||
|
| |||||||
| | TOTAL INVESTMENTS | 222,065,044 | ||||||
|
| |||||||
| Other Assets in Excess of Liabilities: 0.4% | 843,935 | |||||||
|
| |||||||
NET ASSETS: 100.0% | $ | 222,908,979 | ||||||
|
| |||||||
Percentages are stated as a percent of net assets.
| ADR | American Depositary Receipt |
| * | Non-Income Producing Security. |
| (a) | Security was purchased pursuant to Rule 144A under the Securities Act of 1933 and may be sold in transactions exempt from registration only to qualified institutional buyers or in a public offering registered under Securities Act of 1933. |
The accompanying notes are an integral part of these financial statements.
| Schedule of Investments | 13 | |||||
Table of Contents
iMGP Oldfield International Value Fund 2023 Annual Report (Unaudited)
The iMGP Oldfield International Value Fund rose 17.74% in 2023, underperforming the 18.95% gain for the MSCI EAFE Value Index. The MSCI EAFE Index returned 18.24%. The fund outperformed the Morningstar Foreign Large Blend category’s gain of 17.48%. Since the fund’s inception, the fund’s annualized return of 6.15% trails the 8.90% return of the MSCI EAFE Value Index but is ahead of the 5.45% gain of the MSCI EAFE Index.
Performance as of 12/31/2023 | ||||||||||||
One- Year | Three- Year | Since Inception 11/30/2020 | ||||||||||
iMGP Oldfield Internatl Value Fund | 17.74% | 4.29% | 6.15% | |||||||||
MSCI EAFE Value NR USD | 18.95% | 7.59% | 8.90% | |||||||||
MSCI EAFE NR USD | 18.24% | 4.02% | 5.45% | |||||||||
Morningstar US Fund Foreign Large Value | 17.48% | 6.08% | 7.66% | |||||||||
Gross Expense Ratio:2.11% Net Expense Ratio 0.94%* | ||||||||||||
Performance quoted represents past performance and does not guarantee future results. The investment return and principal value of an investment will fluctuate so that an investor’s shares, when redeemed, may be worth more or less than their original cost. Current performance of the funds may be lower or higher than the performance quoted. Short term performance is not a good indication of the fund’s future performance and should not be the sole basis for investing in the fund. To obtain standardized performance of the funds, and performance as of the most recently completed calendar month, please visit www.imgptfunds.com. The Advisor has contractually agreed to limit the expenses of the fund through April 30, 2025. Without this limit the fund’s net expenses would be higher and the return would be lower.
* The expense ratios disclosed in the performance table are based on the most recent prospectus and may not tie to what are disclosed in the financial highlights.
MSCI index returns source: MSCI. Neither MSCI nor any other party involved in or related to compiling, computing, or creating the MSCI data makes any express or implied warranties or representations with respect to such data (or the results to be obtained by the use thereof), and all such parties hereby expressly disclaim all warranties of originality, accuracy, completeness, merchantability, or fitness for a particular purpose with respect to any of such data. Without limiting any of the foregoing, in no event shall MSCI, any of its affiliates, or any third party involved in or related to compiling, computing, or creating the data have any liability for any direct, indirect, special, punitive, consequential, or any other damages (including lost profits) even if notified of the possibility of such damages. No further distribution or dissemination of the MSCI data is permitted without MSCI’s express written consent. Source note: Returns prior to 1999 are the MSCI ACWI ex-US GR index. Returns from 1999 onwards are MSCI ACWI ex-US NR index. |
| |||||||||||
Manager Commentary
The portfolio’s performance lagged the MSCI EAFE Value benchmark slightly in 2023. The largest detractor for the year was LG H&H, the South Korean consumer goods company, which halved during (-51% total return in local currency terms). The other leading detractors for the year were, in order of their impact on the portfolio: Bayer (-28%), Alibaba (-11%), C.K. Hutchison (-5%) and Korea Tobacco & Ginseng (-4%).
In the last week of October, LG H&H reported third quarter results that fell short of the markets, and our, expectations. While they reported continued resilience of sales and profits in their Refreshment division (soft drinks) and the Home and Daily Beauty (HDB) division (combined 60% of profits for the last twelve months), their Beauty division (luxury skin care and cosmetics) reported weak sales and profit.
The Beauty division has been challenged since 2021 and is dominated by its luxury skincare range sold largely in China and Korea (to Chinese tourists). Sales to China, largely luxury skincare, fell 29% on the same period last year. Given some restructuring, rebranding expense and negative operating leverage, profit in beauty for the quarter was down almost 90%.
The problem in China is not unique to LG H&H. Other global skin care companies such as Estee Lauder and Beiersdorf have seen similar declines in their Asian travel business. In response they, like LG H&H, are working hard to return the industry to its pre-COVID structure by reducing exposure to resellers and reducing inventory in the channel—both tough decisions to take.
The results raise concerns that the problem is more than skin deep and that brand equity for these international players has been impaired, ceding market share to domestic Chinese players. The fact that global industry leaders like Estee Lauder are also suffering similar issues offers us some comfort. That said, after adjusting for the net cash on the balance sheet, the shares are now valued at 12.6x the lowered consensus expectations for profit in 2024 (earnings which are based on Beauty operating profit which is just 20% of 2021 levels).
The extreme weakness in the share price and the slow recovery in Beauty are disappointing but we think the current valuation fails to recognize Beauty’s recovery potential, the strength and stability of HDB and Refreshment (60% of operating profit) and LG H&H’s strong cash generation and net cash balance sheet.
| 14 | Litman Gregory Funds Trust | |||||
Table of Contents
The largest positive contributors to the strategy’s performance in 2023 were, in order of their impact on the strategy, Embraer (+69%), easyJet (+57%), Siemens (+35%), Exor (+33%), Samsung Electronics (+44%) and Tesco (+35%).
Embraer is an aircraft development and manufacturing firm, based in Brazil but largely selling into global markets—namely the United States. The firm had hit a severe valuation discount due to the scuppering of an expected deal with Boeing and downturn in demand due to COVID-19. In 2023, Embraer has demonstrated that these were transitionary setbacks. The valuation remains compelling, especially when compared to global peers. Beyond the core business on which our valuation is based, the firm also has a majority holding in Eve Air Mobility. EVE is a U.S.-listed entity developing electric powered aircraft for short passenger flights—the aircraft looks much like a large drone. While EVE is not profitable, and will likely not be for some time, it is a leading player in a market that is forecasted to be large in size. This is evidenced by the firm’s already substantive and growing international orderbook. As the technology and regulatory hurdles are met, the value of EVE will be added to the Embraer base valuation.
While easyJet’s shares started and finished the year strongly, the share price suffered significant turbulence during the year. In the second half of the fiscal year ending September 2023 the company flew 3% more miles than the year before the pandemic started. Strong pricing, a growing package holiday business and welcome cost control helped the company deliver record second half profits. Despite concerns about a slowing economy and pressure on consumers the company continues to expect a robust demand environment and firm pricing. The company ended the year with a net cash balance sheet and the shares valued at just 7.5x net income expected in 2024.
During the fourth quarter we bought two new holdings for the strategy—Michelin, the French automotive tire company, and Heineken Holdings, the Heineken family-controlled holding company that owns 50.4% of Heineken, the Dutch-based global brewing company. These purchases were funded from the sale of Mitsubishi Heavy Industries and a reduction in the holding of Sanofi (we later increased Sanofi after its profit warning funded by a reduction of Tesco).
Michelin is the largest global tire manufacturer. The company generates around half of its sales from the passenger car market, with the remainder split equally between trucks and specialty vehicles, including mining and aircraft tires. The low end of the tire market is commoditized, but Michelin is largely insulated as they focus on the premium end where customers care about performance and are willing to pay for it. Michelin tires have industry leading performance metrics and tend to be priced at a 10% premium. The initial purchase of a set of Michelin tires is often indirect, with customers choosing to buy a premium car which happens to come with a set of Michelin tires. When those tires are up for replacement after around four years, purchasers of premium cars tend to stick with the brand of tire the car was delivered with. The company spends a great deal of time and money to meet the strict performance requirements set by premium auto manufacturers. For this reason, the premium end of the market has significant barriers to entry.
Michelin is likely to benefit from industry tailwinds over the next few years. First, the move to electric vehicles means that tires gain in relative importance. This is because factors such as rolling resistance become more relevant. With cheap tires, an electric vehicle may not achieve the advertised energy efficiency and thus mileage. A second tailwind is more stringent regulation, including CO2 and microplastic emissions—Michelin performs well on both metrics and cheaper brands struggle to compete. These trends make it likely that Michelin can defend their market share and pricing premium.
Given its brand and pricing power, Michelin has a history of passing raw material costs on to customers, resulting in stable operating margins of 10-12% and return on invested capital of around 10%. With 75% of tire sales coming from the replacement market, this is also not a particularly cyclical business. We were able to buy Michelin at a historically high free cash flow yield of almost 10% which in our view does not reflect the quality and earnings profile of the business.
Heineken is a global beer company that was founded in 1864 by Gerard Heineken. Heineken owns 300 brands with the largest being Heineken (c.20% of volume). The Heineken brand competes with AB InBev’s Budweiser for the status of largest global brand outside of China. Other global brands the company owns include Amstel and Tiger.
Heineken owns 167 breweries with 14% share of the global beer market, second only to AB InBev (27%). A decade ago, Western Europe accounted for 44% of volumes, 50% of revenue, and 36% of profit. Following a series of acquisitions across several of the largest emerging-market countries, revenue from emerging-markets now accounts for 53% of revenue and Europe accounts for 30% of volume, 35% of revenue and 25% of profit. With the brewing costs for all beers being very similar, the key to profitability is the focus on cultivating premium branded beers. For Heineken, premium brands now account for 40% of sales. Among these is the world’s leading zero alcohol beer, Heineken 0.0%, a new growth area for the business.
The last three years have created the opportunity in Heineken today. Cost pressures and COVID-19 have seen gross margins fall from 50% to 44%. The competition has seen similar cost pressures that has meant that all operators have had to push through price increases not seen in a generation. Looking forward, we would expect pricing to hold but some of the costs to fall and this will help restore gross margins.
Today the Heineken family remains the controlling shareholders of Heineken through their 53.7% holding of Heineken Holding which in turn owns 50.4% of the main Heineken listing. Heineken Holding shares fell to a valuation of 14x price to 2024 earnings, a 17% discount to the valuation of the main listing, and we see a multiple in the high teens as fair.
| Fund Summary | 15 | |||||
Table of Contents
The strategy overall is valued at a price to expected earnings ratio of less than 10x and a price to book ratio of 1.1x. This compares with a price to expected earnings ratio of 13.2x and a price to book ratio of 1.8x for the MSCI EAFE benchmark and a price to expected earnings of 9.8x and a price to book ratio of 1.2x for the MSCI EAFE Value index. The weighted average upside for the portfolio ended the year at 54%, offering a prospective total return over the next couple of years of 60%, substantially ahead of its long-term average.
Portfolio Mix
The fund is built stock by stock from the bottom-up and can at times look very different from its benchmark. We believe this is key to generating excess long-term returns.
Over the last 12 months, the overall portfolio mix changed in the following way:
| • | The fund’s underweight to the financials sector increased as the strategy liquidated positions in Mitsubishi UFJ Financial and Nomura Holdings. Relative to its benchmark, this is now the largest sector underweight. |
| • | The fund overweight to consumer staples increased over the course of the year and it is the largest overweight in the strategy. A new position in Heineken was the main driver of this increase. |
| • | Consumer discretionary exposure increased over the year due to a new position in Michelin. |
| • | The largest change from a regional allocation standpoint is a reduction in Japanese equities. Following the sale of Mitsubishi UFJ Financial and Nomura Holdings, the fund’s sole position in the country is East Japan Railway. |
| • | As a result of the Japanese allocation decreasing, the European equity allocation increased by a similar amount. |
By Sector
Finance | 16.3% | |||
Consumer Discretionary | 8.1% | |||
Information Technology | 4.1% | |||
Communication Services | 5.1% | |||
Health Care & Pharmaceuticals | 13.6% | |||
Industrials | 22.9% | |||
Consumer Staples | 20.1% | |||
Real Estate | 0.0% | |||
Utilities | 4.9% | |||
Energy | 5.0% | |||
Materials | 0.0% | |||
Cash | -0.1% | |||
|
| |||
| 100.0% | ||||
|
|
By Region
US Equities | 0.0% | |||
Developed International Equities | 84.4% | |||
Emerging Market Equities | 15.6% | |||
|
| |||
| 100.0% | ||||
|
|
By Region
Europe | 73.4% | |||
North America | 0.0% | |||
Asia ex-Japan | 19.0% | |||
Japan | 3.0% | |||
Latin America | 4.6% | |||
Africa | 0.0% | |||
Australia/ New Zealand | 0.0% | |||
Middle East | 0.0% | |||
Other Countries | 0.0% | |||
|
| |||
| 100.0% | ||||
|
| |||
* Cash is excluded from calculation |
By Market Cap
Small Cap | 0.0% | |||
Mid Cap | 10.6% | |||
Large Cap | 89.4% | |||
|
| |||
| 100.0% | ||||
|
|
| 16 | Litman Gregory Funds Trust | |||||
Table of Contents
iMGP Oldfield International Value Fund Value of Hypothetical $10,000
The value of a hypothetical $10,000 investment in the iMGP Oldfield International Value Fund from November 30, 2020 to December 31, 2023 compared with the MSCI EAFE Value Index, and Morningstar Foreign Large Value Category.
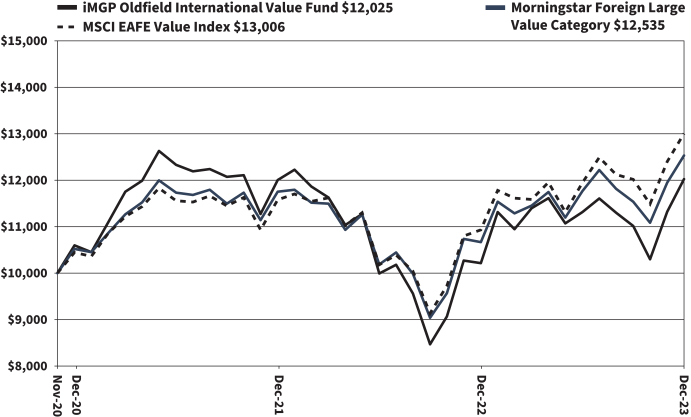
The hypothetical $10,000 investment at fund inception includes changes due to share price and reinvestment of dividends and capital gains. The chart does not imply future performance. Indexes are unmanaged, do not incur fees, expenses or taxes, and cannot be invested in directly.
Performance quoted does not include a deduction for taxes that a shareholder would pay on the redemption of fund shares.
| Fund Summary | 17 | |||||
Table of Contents
iMGP Oldfield International Value Fund
SCHEDULE OF INVESTMENTS IN SECURITIES at December 31, 2023
| Shares | Value | |||||||
COMMON STOCKS: 95.3% | ||||||||
| Brazil: 4.7% | ||||||||
| 89,000 | Embraer SA - ADR* | $ | 1,642,050 | |||||
|
| |||||||
| China: 8.0% | ||||||||
| 140,200 | Alibaba Group Holding Ltd. | 1,356,913 | ||||||
| 274,500 | CK Hutchison Holdings Ltd. | 1,470,687 | ||||||
|
| |||||||
| 2,827,600 | ||||||||
|
| |||||||
| France: 9.1% | ||||||||
| 41,541 | Cie Generale des Etablissements Michelin SCA | 1,491,421 | ||||||
| 17,263 | Sanofi SA | 1,713,855 | ||||||
|
| |||||||
| 3,205,276 | ||||||||
|
| |||||||
| Germany: 18.7% | ||||||||
| 36,642 | Bayer AG | 1,362,953 | ||||||
| 128,080 | E.ON SE | 1,721,205 | ||||||
| 55,726 | Fresenius SE & Co. KGaA | 1,730,116 | ||||||
| 9,371 | Siemens AG | 1,761,186 | ||||||
|
| |||||||
| 6,575,460 | ||||||||
|
| |||||||
| Italy: 5.0% | ||||||||
| 104,386 | Eni SpA | 1,772,021 | ||||||
|
| |||||||
| Japan: 3.0% | ||||||||
| 18,500 | East Japan Railway Co. | 1,067,290 | ||||||
|
| |||||||
| Netherlands: 9.8% | ||||||||
| 17,197 | EXOR NV | 1,721,378 | ||||||
| 20,301 | Heineken Holding NV | 1,719,971 | ||||||
|
| |||||||
| 3,441,349 | ||||||||
|
| |||||||
| South Korea: 11.0% | ||||||||
| 23,147 | KT&G Corp. | 1,561,825 | ||||||
| 3,091 | LG H&H Co. Ltd. | 852,011 | ||||||
| 23,860 | Samsung Electronics Co. Ltd. | 1,454,313 | ||||||
|
| |||||||
| 3,868,149 | ||||||||
|
| |||||||
| Sweden: 6.5% | ||||||||
| 210,464 | Svenska Handelsbanken AB - Class A | 2,291,612 | ||||||
|
| |||||||
| United Kingdom: 19.5% | ||||||||
| 1,139,106 | BT Group PLC | 1,793,710 | ||||||
| 326,056 | easyJet PLC* | 2,118,517 | ||||||
| 2,883,396 | Lloyds Banking Group PLC | 1,752,602 | ||||||
| 324,706 | Tesco PLC | 1,201,728 | ||||||
|
| |||||||
| 6,866,557 | ||||||||
|
| |||||||
| | TOTAL COMMON STOCKS | 33,557,364 | ||||||
|
| |||||||
PREFERRED STOCK: 5.0% | ||||||||
| Germany: 5.0% | ||||||||
| 21,867 | Henkel AG & Co. KGaA - (Preference Shares) | 1,762,192 | ||||||
|
| |||||||
| | TOTAL PREFERRED STOCK | 1,762,192 | ||||||
|
| |||||||
| | TOTAL INVESTMENTS | 35,319,556 | ||||||
|
| |||||||
| Liabilities in Excess of Other Assets: (0.3)% | (96,742 | ) | ||||||
|
| |||||||
NET ASSETS: 100.0% | $ | 35,222,814 | ||||||
|
| |||||||
Percentages are stated as a percent of net assets.
| ADR | American Depositary Receipt |
| * | Non-Income Producing Security. |
The accompanying notes are an integral part of these financial statements.
| 18 | Litman Gregory Funds Trust | |||||
Table of Contents
iMGP SBH Focused Small Value Fund 2023 Annual Report (Unaudited)
The iMGP SBH Focused Small Value Fund gained 24.74% in 2023, strongly outperforming the 14.65% gain for the Russell 2000 Value benchmark and the 16.61% return for the Morningstar Small Value category. Since the fund’s July 2020 inception, the fund has an annualized return of 15.62%. Despite the attractive absolute gain, the fund is slightly lagging the 16.50% return for the Russell 2000 Value benchmark and 18.92% for the peer category.
Performance as of 12/31/2023 | ||||||||||||
One- Year | Three- Year | Since Inception 7/31/20 | ||||||||||
iMGP SBH Focused Small Value fund | 24.74% | 8.94% | 15.62% | |||||||||
Russell 2000 Value | 14.65% | 7.94% | 16.50% | |||||||||
MSCI USA Small Value Index | 13.34% | 8.84% | 17.01% | |||||||||
Russell 2000 Index | 16.93% | 2.22% | 11.10% | |||||||||
Morningstar Small Value Category | 16.61% | 11.22% | 18.92% | |||||||||
Gross Expenses : 1.68%, Net Expenses: 1.15%* | ||||||||||||
Performance quoted represents past performance and does not guarantee future results. The investment return and principal value of an investment will fluctuate so that an investor’s shares, when redeemed, may be worth more or less than their original cost. Current performance of the funds may be lower or higher than the performance quoted. Short term performance is not a good indication of the fund’s future performance and should not be the sole basis for investing in the fund. To obtain standardized performance of the funds, and performance as of the most recently completed calendar month, please visit www.imgpfunds.com. Returns less than one year are not annualized. The Advisor has contractually agreed to limit the expenses of the fund through April 30, 2025. Without this limit the fund’s net expenses would be higher and the return would be lower.
* The expense ratios disclosed in the performance table are based on the most recent prospectus and may not tie to what are disclosed in the financial highlights. |
| |||||||||||
Key Performance Drivers
Investing has never been easy but investing in today’s speculative, risk-loving fervor is a challenge for those of us that still look at the markets with risk in mind. We are pleased to say, however, that even after a more challenging relative fourth quarter, when we did not keep pace in an indiscriminately strong market, 2023 performance was strong both in absolute and relative terms. Regardless of the market’s periodic desire to chase high short-interest, unprofitable, and in many cases high-beta stocks, we will continue to assess reward and risk, and populate the portfolio with companies that we determine can meaningfully improve their returns via internal, management-driven controls, not via predicting macroeconomic events. To that end, we were pleased to finally see some acquisition activity within the portfolio where it was made abundantly clear the public markets were significantly undervaluing these businesses. Predicting an acquisition is impossible but we feel we are quite good at identifying unrecognized or underappreciated inflection points in a company’s return on invested capital (ROIC).
Looking at the small-cap universe, it’s our view that our Russell 2000 Value benchmark has gotten riskier in the last few years as the percentage of unprofitable companies has increased, making the index materially more speculative. Over the years, an increasing number of investors are opting for passive vehicles as the way to gain exposure to small-cap stocks. This approach does require one to look at the investments through a risk-adjusted lens or understand whether they are being appropriately compensated for the increasing risk that we feel is being taken. Post-COVID, we have seen a different type of market, one where we don’t always believe stocks reflect risks such as pricing in recession risk. While this environment has created less opportunity versus past cycles, we have been, and continue to work hard to uncover change agents in new management, culture shifts, and aligned incentives that can lead to improving returns on invested capital.
Looking at attribution for 2023, it is important to remember that this is a relatively concentrated portfolio that is built stock by stock and that sector weightings are driven by bottom-up fundamental stock-picking process. That said, we think it’s helpful to report on the shorter-term relative performance of both sector weights and stock selection to help shareholders understand the drivers of recent performance. It is also important to remember that the performance of a stock over a relatively short period tells us nothing about whether it will be a successful position; that is only known at the point when the stock is sold.
At the sector level, industrials made the largest performance contribution relative to the benchmark due to a mix of allocation and stock selection. Within the sector, Circor International was the largest contributor. The company undertook a profit-improvement plan focused on margins by driving value and pricing, which allowed for higher earnings. During the year, the company announced they were seeking strategic alternatives, and it was acquired by a private equity firm at a significant premium. Another recent winner in the industrials space was SP Plus. The company combines industry-leading technology and best-in-class operations to deliver mobility solutions that enable the efficient movement of people, vehicles, and personal belongings. The stock is a non-benchmark name and it gained 41.97% in the fourth quarter. Early in the quarter, SP Plus agreed to be acquired by a combination of strategic and private-equity sponsors for a sizeable 52% premium to the stock price. SP has been executing a technology innovation cycle within the parking-management space. This investment
| Fund Summary | 19 | |||||
Table of Contents
cycle allowed them to see strong growth and margin improvement over the last few years coming out of Covid pandemic. In our opinion, the market was not fully appreciating the underlying ROIC improvement from these investments, and we maintained a large position in the company and are happy to see this result.
Consumer discretionary was another sector that meaningfully contributed to relative performance in the calendar year. A top-performer in the sector was Modine Manufacturing. After a strong performance in 2022, the stock was up another 200% in 2023. The decision to own the stock was driven by the company’s new CEO rapidly turning over management across the organization as it executes upon an 80/20 simplification strategy. When this management strategy is successfully adopted by an organization, it leads to less complexity, stronger customer relationships, and a greater focus on pricing and improvements. The company has seen significant success in deploying the strategy, resulting in higher margins and higher growth rates, which we believe has significant potential in the next several years. Modine has continued to beat expectations and though valuation is more appropriate today, we continue to see upside to earnings over the next several years.
As we look to 2024, we feel that risks remain elevated. That said, forecasting a recession, market crash, or the impact of higher fiscal spending is not our expertise. The market expectations today are for the Federal Reserve to cut interest rates at least 6 times this year resulting in “soft landing.” This outcome, if it comes to fruition, would be quite rare when looking at history but would likely lead to strong returns. Over the last few years, we have convinced ourselves not to be surprised by the market. Our focus, and what we pride ourselves on, is identifying positive company-specific change agents that will improve a company’s return through governance and overall influence on its employees. The number of management-team changes continues to increase, which increases our opportunity set. We believe that through our bottom-up fundamental research, we can identify the management teams making appropriate and impactful changes, improving the returns for their business. Looking ahead, the rising benchmark risk we mentioned earlier should only help us in our endeavors over time, as we believe stock-selection will matter. Over time, our process has delivered competitive returns for our shareholders, even more so when adjusting for the risks being taken. We thank you for your interest and support.
The winner within the health care sector was Immunogen. The stock was up 41.54% in the year. The company announced positive Phase 3 results in the treatment of ovarian cancer which caused the stock to rise significantly. After this announcement, its main competitor announced poor trial results which drove up the share price of IMGN. Given the move in the stock, we did liquidate the position during the year.
In terms of detractors, the financials sector was the main drag. Glacier Bancorp was among the holdings that declined over the year. The company suffered as its net interest margin (NIM) contracted more than expected. Glacier has one of the most resilient deposit models; however, as a safety measure, it took on higher cost borrowing due to the bank failures early in 2023 and uncertainty on deposit pricing dynamics. Looking ahead, the company expects its NIM to bottom out as it pays down those higher cost borrowing and loan yields reprice at much higher levels. We remain confident in the company’s prospects.
Health care was another area of relative underperformance. ICU Medical was a detractor after the company narrowed its guidance range when it reported third quarter 2023 earnings, resulting in a negative market reaction. GLP-1 drug speculation has wrought health care with materially higher levels of uncertainty regarding the longer-term impact, even in situations such as ICU where direct exposure was much more limited. The company management team must now work through inventory destocking measures which management believes will pressure margins for a few more quarters. We feel, however, this is reflected in valuations.
Asset Allocation as of December 31, 2023
By Sector
Finance | 17.9% | |||
Consumer Discretionary | 15.4% | |||
Information Technology | 8.4% | |||
Communication Services | 0.0% | |||
Health Care & Pharmaceuticals | 1.6% | |||
Industrials | 29.5% | |||
Consumer Staples | 3.4% | |||
Real Estate | 5.2% | |||
Utilities | 0.0% | |||
Energy | 7.7% | |||
Materials | 12.2% | |||
Cash | -1.3% | |||
|
| |||
| 100.0% | ||||
|
|
By Market Cap
Small Cap | 93.9% | |||
Mid Cap | 6.1% | |||
Large Cap | 0.0% | |||
|
| |||
| 100.0% | ||||
|
|
| 20 | Litman Gregory Funds Trust | |||||
Table of Contents
iMGP SBH Focused Small Value Fund Value of Hypothetical $10,000
The value of a hypothetical $10,000 investment in the iMGP SBH Focused Small Value Fund from July 31, 2020 to December 31, 2023 compared with the Russell 2000 Value Index, and Morningstar Small Value Category.
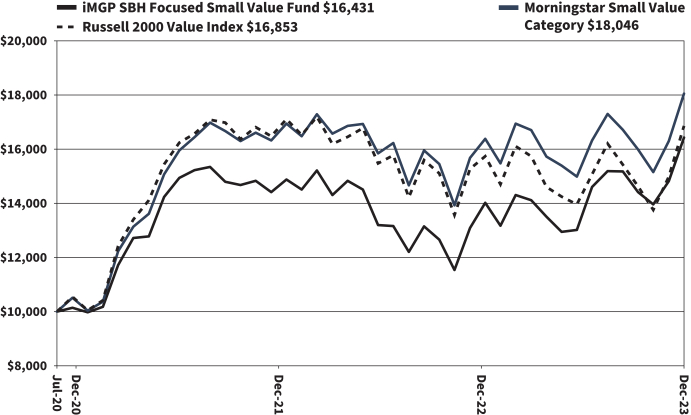
The hypothetical $10,000 investment at fund inception includes changes due to share price and reinvestment of dividends and capital gains. The chart does not imply future performance. Indexes are unmanaged, do not incur fees, expenses or taxes, and cannot be invested in directly.
Performance quoted does not include a deduction for taxes that a shareholder would pay on the redemption of fund shares.
| Fund Summary | 21 | |||||
Table of Contents
iMGP SBH Focused Small Value Fund
SCHEDULE OF INVESTMENTS IN SECURITIES at December 31, 2023
| Shares | Value | |||||||
COMMON STOCKS: 101.3% | ||||||||
| Consumer Discretionary: 15.4% | ||||||||
| 17,408 | Gentherm, Inc.* | $ | 911,483 | |||||
| 20,634 | Gildan Activewear, Inc. | 682,160 | ||||||
| 75,202 | Goodyear Tire & Rubber Co.* | 1,076,893 | ||||||
| 29,200 | Modine Manufacturing Co.* | 1,743,240 | ||||||
| 12,682 | Polaris, Inc. | 1,201,873 | ||||||
| 10,738 | PVH Corp. | 1,311,324 | ||||||
| 55,972 | VF Corp. | 1,052,274 | ||||||
|
| |||||||
| 7,979,247 | ||||||||
|
| |||||||
| Consumer Staples: 3.4% | ||||||||
| 88,825 | Coty, Inc. - Class A* | 1,103,206 | ||||||
| 61,741 | Hain Celestial Group, Inc.* | 676,064 | ||||||
|
| |||||||
| 1,779,270 | ||||||||
|
| |||||||
| Energy: 7.7% | ||||||||
| 9,521 | Chord Energy Corp. | 1,582,676 | ||||||
| 18,784 | Matador Resources Co. | 1,068,058 | ||||||
| 31,794 | Murphy Oil Corp. | 1,356,332 | ||||||
|
| |||||||
| 4,007,066 | ||||||||
|
| |||||||
| Financials: 17.9% | ||||||||
| 42,617 | Cadence Bank | 1,261,037 | ||||||
| 40,530 | Columbia Banking System, Inc. | 1,081,341 | ||||||
| 31,982 | Glacier Bancorp, Inc. | 1,321,496 | ||||||
| 36,796 | National Bank Holdings Corp. - Class A | 1,368,443 | ||||||
| 51,779 | Seacoast Banking Corp. of Florida | 1,473,631 | ||||||
| 17,596 | SouthState Corp. | 1,485,982 | ||||||
| 19,764 | Texas Capital Bancshares, Inc.* | 1,277,347 | ||||||
|
| |||||||
| 9,269,277 | ||||||||
|
| |||||||
| Health Care: 1.6% | ||||||||
| 8,185 | ICU Medical, Inc.* | 816,372 | ||||||
|
| |||||||
| Industrials: 29.5%(a) | ||||||||
| 26,860 | Apogee Enterprises, Inc. | 1,434,593 | ||||||
| 10,332 | ArcBest Corp. | 1,242,010 | ||||||
| 30,475 | AZZ, Inc. | 1,770,293 | ||||||
| 11,014 | EnerSys | 1,111,973 | ||||||
| 25,296 | KBR, Inc. | 1,401,651 | ||||||
| 36,623 | Mercury Systems, Inc.* | 1,339,303 | ||||||
| 35,772 | Quanex Building Products Corp. | 1,093,550 | ||||||
| 9,657 | Regal Rexnord Corp. | 1,429,429 | ||||||
| 89,958 | REV Group, Inc. | 1,634,537 | ||||||
| 23,914 | SP Plus Corp.* | 1,225,593 | ||||||
| 15,644 | SPX Technologies, Inc.* | 1,580,200 | ||||||
|
| |||||||
| 15,263,132 | ||||||||
|
| |||||||
| Information Technology: 8.4% | ||||||||
| 17,820 | Belden, Inc. | 1,376,595 | ||||||
| 20,835 | Ciena Corp.* | 937,783 | ||||||
| 21,638 | Ichor Holdings Ltd.* | 727,686 | ||||||
| 12,069 | Plexus Corp.* | 1,305,021 | ||||||
|
| |||||||
| 4,347,085 | ||||||||
|
| |||||||
| Materials: 12.2% | ||||||||
| 69,667 | Element Solutions, Inc. | 1,612,095 | ||||||
| 14,422 | Louisiana-Pacific Corp. | 1,021,510 | ||||||
| 13,948 | Sensient Technologies Corp. | 920,568 | ||||||
| 28,780 | Silgan Holdings, Inc. | 1,302,295 | ||||||
| 38,466 | Summit Materials, Inc. - Class A* | 1,479,402 | ||||||
|
| |||||||
| 6,335,870 | ||||||||
|
| |||||||
| Shares | Value | |||||||
| Real Estate: 5.2% | ||||||||
| 39,614 | STAG Industrial, Inc. - REIT | $ | 1,555,246 | |||||
| 17,964 | Terreno Realty Corp. - REIT | 1,125,804 | ||||||
|
| |||||||
| 2,681,050 | ||||||||
|
| |||||||
| | TOTAL COMMON STOCKS | 52,478,369 | ||||||
|
| |||||||
| | TOTAL INVESTMENTS | 52,478,369 | ||||||
|
| |||||||
| Liabilities in Excess of Other Assets: (1.3)% | (683,643 | ) | ||||||
|
| |||||||
NET ASSETS: 100.0% | $ | 51,794,726 | ||||||
|
| |||||||
Percentages are stated as a percent of net assets.
| REIT | Real Estate Investment Trust |
| * | Non-Income Producing Security. |
| (a) | For additional information on portfolio concentration, see Note 11. |
The accompanying notes are an integral part of these financial statements.
| 22 | Litman Gregory Funds Trust | |||||
Table of Contents
iMGP Alternative Strategies Fund 2023 Annual Report (Unaudited)
The iMGP Alternative Strategies Fund (Institutional Share Class) gained 5.91% in 2023. During the same period, the Morningstar Multistrategy Category was up 6.63%, the Bloomberg US Aggregate Bond Index (Agg) was up 5.53%, and the ICE BofA 3-Month Treasury Bill Index returned 5.01%.
Performance as of 12/31/2023 |
| |||||||||||||||||||
One- Year | Three- Year | Five- Year | Ten- Year | Since 9/30/2011 | ||||||||||||||||
iMGP Alternative Strategies Fund Instl | 5.91% | -0.16% | 2.80% | 2.58% | 3.65% | |||||||||||||||
iMGP Alternative Strategies Fund Inv | 5.61% | -0.40% | 2.55% | 2.33% | 3.41% | |||||||||||||||
ICE BofA US 3-Month Treasury Bill | 5.01% | 2.15% | 1.88% | 1.25% | 1.03% | |||||||||||||||
Bloomberg Aggregate Bond Index | 5.53% | -3.31% | 1.10% | 1.81% | 1.74% | |||||||||||||||
Morningstar Multistrategy Category | 6.63% | 3.37% | 3.79% | 2.37% | 3.02% | |||||||||||||||
Gross Expense Ratio: 1.67% Net Expense Ratio: 1.39%*
Performance quoted represents past performance and does not guarantee future results. The investment return and principal value of an investment will fluctuate so that an investor’s shares, when redeemed, may be worth more or less that their original cost. Current performance of the fund may be lower or higher than the performance quoted. Performance data current to the most recent month end may be obtained by visiting www.imgpfunds.com. The Advisor has contractually agreed to waive a portion of the management fee through April 30, 2025. Without this waiver the fund’s net expenses would be higher and the return would be lower.
* The expense ratios disclosed in the performance table are based on the most recent prospectus and may not tie to what are disclosed in the financial highlights.
Since its inception on September 30, 2011, the fund’s annualized return is 3.65% with a volatility (standard deviation) of 4.76%, and a beta to the U.S. stock market (Russell 1000 Index) of 0.27. This compares to the 3-Month Treasury Bill Index return of 1.03%, the Morningstar Multistrategy category return of 3.02% and the U.S. Aggregate Bond Index(the “Agg”) return of 1.74%.
The fund’s return—outperforming the 3-month Treasury Bill Index by about 260 basis points annualized—is below what we think is a reasonable expected-return range for the fund over the longer term, and the current measurement remains at or near what we expect will be a low point. The fund’s volatility has been toward the low end of our expected range of 4% to 8%, while its equity beta has been in line with our expectations. We expect the fund’s correlation to the Agg (currently about 0.4) will likely trend somewhat lower over time, back toward the range of zero it had showed as recently as 2021, especially with the addition of the Enhanced Trend strategy late in 2022. |
| |||||||||||||||||||
The Risk/Return Statistics table below presents some of the key performance metrics that we track for the fund.
| MASFX | Bloomberg U.S. Aggregate Bond Index | Morningstar Multistrategy Category | Russell 1000 Index | |||||||||||||
Annualized Return | 3.65 | 1.74 | 3.02 | 14.56 | ||||||||||||
Total Cumulative Return | 55.23 | 23.53 | 43.91 | 429.02 | ||||||||||||
Annualized Std. Deviation | 4.76 | 4.45 | 4.20 | 14.81 | ||||||||||||
Sharpe Ratio (Annualized) | 0.54 | 0.16 | 0.46 | 0.92 | ||||||||||||
Beta (to Russell 1000) | 0.27 | 0.10 | 0.25 | 1.00 | ||||||||||||
Correlation of MASFX to | 1.00 | 0.37 | 0.90 | 0.84 | ||||||||||||
Worst 12-Month Return | -10.04 | -15.68 | -5.71 | -19.13 | ||||||||||||
% Positive 12-Month Periods | 0.76 | 0.64 | 0.74 | 0.87 | ||||||||||||
Upside Capture (vs. Russell 1000) | 26.07 | 10.67 | 24.24 | 100.00 | ||||||||||||
Downside Capture (vs. Russell 1000) | 26.75 | 9.15 | 27.68 | 100.00 | ||||||||||||
Upside Capture (vs. AGG) | 72.65 | 100.00 | 59.42 | 226.45 | ||||||||||||
Downside Capture (vs. AGG) | 21.97 | 100.00 | 17.55 | 13.58 | ||||||||||||
Performance Review
The Fund produced a very respectable 5.9% return for the full year. It’s 3.4% return in the fourth quarter was good, but trailed traditional asset classes, which rose sharply in the “everything rally” of the last two-plus months of the year, driven by cooling inflation data and dovish Fed communications. The S&P 500 rallied almost 12% and the Agg bounced almost 7%—both quarterly figures would generally be considered good returns for a full year. Despite trailing the traditional asset benchmark performance in 2023’s final quarter, the fund participated meaningfully in the move, and still outperformed core bonds for the full year with significantly lower volatility and a maximum drawdown during the year of less than 4%, compared to the Agg’s intra-year drawdown of over 7%. (In an environment where the Agg suffered its worst losses since the early 1980s, the fund has outperformed the index by approximately 400bps cumulatively over the trailing two years and by approximately 900bps over the trailing three years.)
In our last commentary we talked about the impact on the fund of ‘higher-for-longer,’ which had become the consensus in the late summer/early fall. However, market sentiment was changing even as we were writing, and that consensus shifted quickly to the market’s anticipation of the eventual Fed pivot, fueling the huge gains in the last two months of the year, in a phenomenon we had expected at some
| Fund Summary | 23 | |||||
Table of Contents
point in 2023. It was somewhat more dramatic than we had anticipated, and unfortunately, while we were confident in the nature of the market reaction, we had little confidence in pinpointing precisely when it would happen, which precluded us from putting more chips on our expected outcome. ‘Early’ and ‘wrong’ can be nearly indistinguishable in the investment business, and having an even higher allocation to fixed income-oriented strategies during the dark days of the Higher-for-Longer era would have been very challenging.
The delay in what we firmly believed would be strong performance for DoubleLine and Loomis Sayles was obviously frustrating (to say nothing of seeing significant pullbacks during the year), but the change in narrative during the fourth quarter finally helped produce meaningful gains from those segments of the fund. The sizing of our overweight was conservative enough to allow us to confidently maintain the positioning and benefit when the rapid change occurred. And although these managers experienced significant positive performance in a relatively compressed timeframe, we think there is still plenty of potential return left to capture, as the blended yield-to-maturity (YTM) from DoubleLine and Loomis Sayles sleeves was 9.5% at year end, less than half a percentage point lower than what it was last quarter.
Someone in the investment industry said something to the effect of “Diversification means always having something to apologize for,” which is true in the short-term, as there’s generally always something that’s not “working.” The flip side of the recent rapid gains in the fund’s overweighted areas is the negative short-term performance suffered by DBi’s sleeve. This segment of the fund (which we reduced tactically to help fund the increase in DoubleLine’s allocation) had remained short bonds for the majority of the year as one of its main exposures. This positioning was very beneficial during a period of several months when several of the fund’s other subadvisors were challenged, helping the fund to tread water. But the rapid and dramatic reversals in the fourth quarter were, not surprisingly, a bad environment for DBi’s strategy. The Enhanced Trend strategy won’t always be negatively correlated with most of the rest of the fund, and in fact in a sustained rate rally, it should benefit significantly. As a reminder, while we view the strategy as an important diversifier, we expect it to produce long-term returns similar to other strategies in the fund, resulting in a better overall fund-level risk-adjusted return profile. Assuming that plays out as expected, there will be no apology necessary in the medium- to long-term.
As mentioned previously, we still expect a lot of performance from the fixed income/credit managers, hence their significant overall allocation, but there remains a diversity of investment styles and return drivers in the portfolio, which provides valuable diversification. While most strategies are modestly less attractive than they were a year ago in our upside case, our base case return expectations for the fund are very close to what they were a year ago. The fund also still has a healthy level of dry powder that should allow it to remain opportunistic and take advantage of potential volatility in various parts of financial markets. We fully recognize the highly uncertain nature of projecting returns (“It is difficult to make predictions, especially about the future,” as Niels Bohr or Yogi Berra may have said), which is one of the reasons we maintain a high bar for making tactical changes. However, it can be useful for calibrating expectations and testing assumptions across different scenarios, and we mention it to underscore what we think is still an attractive opportunity set. We are pleased to report reasonable gains in the past year to our fellow shareholders, and we believe there is still considerable runway for strong performance going forward. We wish you health, happiness, and prosperity in the new year. Thank you for your trust and confidence.
Quarterly Portfolio Commentary
Performance of Managers
For the full year, the returns by sub-advisor are as follows: FPA up 17.04%; DoubleLine up 9.24%; Blackstone Credit Systematic Group up 7.94%; Loomis Sayles up 7.72%; Water Island up 6.17%; and DBi down 4.10%. (All returns are net of sub advisory fees.)
Key performance drivers and positioning by strategy
Blackstone Credit Systematic Group (DCI):
The Blackstone Credit strategy produced solid performance for the year, boosted by a strong fourth quarter and good credit selection throughout most of the year. Alpha performance for the year was positive, led by alpha from the CDS overlay. Rates hedging was in line, even as Treasury volatility was heightened on whipsawing market expectations around the Fed, thanks to aggressive tightening and slowing inflation. Credit beta hedging cost a bit, as the market “soft-landing” rally at the end of the year drove the credit derivatives a bit more than the cash bonds. This effect should revert in Q1. Broadly, the hedging again kept the macro footprint of the portfolio well behaved.
Security selection gains were notably positive in corporate bonds led by long Consumer durables—especially housing related—REITS, technology names and energy names. Energy selection was strong, boosted by adjacencies in natural gas and mining, even as oil prices dropped notably. Consumer staples, media, transports, and utilities were negative contributors. Security selection in CDS was positive for the year. Positive performance was somewhat concentrated in consumer goods and insurance, led by long positions in durables, housing and housing related, as well as in consumer goods and in leisure (especially cruise lines). Negative performance was led by travel (especially airlines) and healthcare (especially hospitals).
Portfolio positioning continues to favor long consumer durables and experiences/leisure versus retail and consumer goods, long specialty finance/lending continues to be underweight in consumer staples and healthcare. The portfolio has moved shorter in energy on net (though still long some names in the cash bonds) and to short transportation. The portfolio is increasingly neutral in financial institutions and insurance, as well as in technology. The net of the moves is to further emphasize the credit selection in the portfolio.
| 24 | Litman Gregory Funds Trust | |||||
Table of Contents
The portfolio continues to be underweight high-default-probability names and tilted into stronger credit-quality. As the quarter saw notable credit differentiation, despite markets soaring, the environment proved to be favorable. This differentiation is an important theme, and going forward, the portfolio managers expect it to continue, and for “up in quality” to be rewarded in the market. The sorting of credit into winners and losers looks likely as the surprisingly resilient economy seems likely to cool down.
DBi:
2023 turned out to be a humbling year for macro strategists. The taper is coming a year late, the economy never hit the windshield, and Powell might actually pull off the Immaculate Landing.
And so, the big surprise is that it turned out to be a great year for investors. Powell’s sudden rhetorical pivot in early November triggered a massive melt up in risk assets. In two months, the MSCI World delivered nearly two thirds of its 23.8% calendar year return, while bonds—down over 3% through October—finished up 5.7%. The Everything Rally appears to have been driven by both the widespread conclusion that the rate hike cycle was over, but also a desperate catch up for investors underweight equities and duration. By year end, the price moves implied far more aggressive easing in 2024 than either Central Banks or economists forecast.
As discussed extensively in these letters, the market consensus is rarely accurate and frustratingly unstable. Contrarian investors who nailed 2022 were often wrong-footed in 2023; assets that soared in 2023 were climbing out of a deep drawdown hole. The lesson of the past several years is that the unexpected happens with alarming regularity, and the spectrum of outcomes is far wider than we expect. Today, as investors breathe a sigh of relief that the worst of the rate hike cycle might be behind us, they soon may have to turn their attention to a laundry list of headwinds, from worsening geopolitical chaos to deepening sociopolitical fragmentation to uncontrolled fiscal largesse to persistent ripple effects from higher rates to things not yet on our plate of worries. In such a world, we encourage diversification and liquidity to help clients weather the coming years.
The Enhanced Trend portfolio was down, up, and down again during the year, losing about 6% in the first quarter, making most of it back to pull to about break-even at mid-year, gaining further in the third quarter to climb into positive territory, and finally dropping by more than 5% in the fourth quarter to end the year down approximately 4%. The performance of the portfolio in the fourth quarter was negatively impacted by all asset classes, as the Everything Rally essentially reversed most major existing trends. The majority of losses were driven by rates, but exposure to commodities also detracted from performance, owing to the geopolitical turmoil and concerns about the oil output levels of major producers around the world. Within currencies, a major setback was the short exposure to the Japanese yen (JPY).
For the year, all asset classes except currencies detracted from performance, as the short JPY postion’s strong gains in the second quarter resulted in positive attribution for the year. The losses in short rates positions were most dramatic in the first quarter (thanks to the sudden banking crisis in March) and fourth quarter, but strong performance in the middle of the year meant that losses in rates for the year were actually less than the losses from commodities and equities. Equity positioning was whipsawed all year, while commodities detracted somewhat in the first quarter, as investors were torn between a hard or soft landing from the rate hikes, and then suffered from the aforementioned significant reversal in the trend in oil prices in the year’s final quarter.
DoubleLine:
For the year 2023, the portfolio’s 9.2% return outperformed the Agg’s 5.5% gain. This year was another rollercoaster ride for U.S. fixed income investors as the 10-year U.S. Treasury yield began the year at 3.87%, sold off to as high as 4.99% in October, and then rallied sharply to end the year almost right back where it started at 3.88%. Many investors forecasted a recession and policy rate cuts from the Federal Reserve—neither of which ever materialized. Several prominent bank failures and geopolitical conflicts were easily brushed off by the market which continued to focus on the forward path of the Federal Reserve’s policy rate.
The primary drivers of the portfolio’s relative outperformance during the year were security selection and asset allocation. In terms of security selection, the Agency MBS held in the Portfolio outperformed the Agency MBS held in the Index during what was a fairly volatile year for this asset class. As for asset allocation, several securitized credit sectors within the portfolio broadly outperformed the credit assets in the Index.
The top-performing sectors in the portfolio were CLOs and high yield corporate credit. CLOs generated large returns as they benefited from high interest income from floating rate coupons and spread compression from a generally resilient US economy. High yield corporate credit also experienced positive returns driven by spread tightening and interest income. The worst-performing sector in the portfolio was asset-backed securities (ABS). These assets underperformed due to investor caution around aviation and student debt in the first half of the year.
Fixed-income yields remain attractive across many sectors, allowing investors to create high-quality, diversified fixed-income portfolios with a yield comparable to the long-run average return of equities. On a go-forward basis, volatility in markets is likely to remain elevated as the probability of a U.S. recession remains high. Interest rates may remain range-bound in the near term as central banks navigate the balancing act between inflation and growth. We favor high quality assets in this environment and continue to utilize paydowns to systematically upgrade the quality of the portfolio’s credit holdings. We favor structured credit over corporate credit as we believe it offers more attractive spread levels while benefiting from structural protections such as credit enhancements.
| Fund Summary | 25 | |||||
Table of Contents
FPA:
Performance Overview
The portfolio gained approximately 17% for the trailing twelve months, capturing almost 78% of the MSCI ACWI’s gain in the trailing twelve months, outperforming its 70.6% average net risk exposure.1
Below you can see the Fund’s performance along with various relevant indexes.
Net Performance versus Illustrative Indices2
| Q4 2023 | Trailing 12-month | |||||||
iMGP Alternative Strategies Fund | 6.59 | % | 17.30 | % | ||||
MSCI ACWI | 11.03 | % | 22.20 | % | ||||
S&P 500 | 11.69 | % | 26.29 | % | ||||
60% MSCI ACWI / 40% Bloomberg US Agg | 9.36 | % | 15.37 | % | ||||
60% S&P 500 / 40% Bloomberg US Agg | 9.74 | % | 17.67 | % | ||||
Portfolio discussion
The Fund’s net risk exposure declined from 73.2% to 66.8% in 2023, largely due to securities having less favorable risk/reward profiles. We exited five positions in their entirety, and we added eight new positions during the 12-month period ending December 31, 2023.
The Fund’s top five performers contributed 8.16% to its return in the previous twelve months, while its bottom five detracted 1.70%.
Trailing Twelve-Month Contributors and Detractors as of December 31, 20233
| Contributors | Perf. Cont. | Avg. % of Port. | Detractors | Perf. Cont. | Avg. % of Port. | |||||||||||||||||
Meta Platforms | 2.20% | 2.1% | McDermott (multiple securities) | -1.10% | 1.8% | |||||||||||||||||
Alphabet | 2.14% | 4.3% | Int’l Flavors & Fragrances | -0.35% | 1.7% | |||||||||||||||||
Holcim | 1.45% | 2.8% | Signature Bank | -0.09% | 0.0% | |||||||||||||||||
Rush Enterprises | 1.34% | 3.0% | Nexon | -0.08% | 0.4% | |||||||||||||||||
Broadcom | 1.03% | 1.3% | FirstEnergy | -0.08% | 0.8% | |||||||||||||||||
|
|
|
|
|
|
|
| |||||||||||||||
| 8.16% | 13.5% | -1.70% | 4.7% | |||||||||||||||||||
We have not recently discussed the following investments meaningful to the Fund’s trailing twelve-month return.4
Meta saw a welcome recovery in engagement and revenue year-to-date following a tough 2022. The company has continued to offer new solutions that allow advertisers to target customers effectively and efficiently via one of the world’s leading digital platforms. Moreover, operating profits are rising due to an organization-wide focus on improving productivity and accelerating the time to market for new products. However, overall profitability continues to be weighed down by losses in the Reality Labs segment. But, there is positive optionality that Meta will emerge from the AI arms race as one of the leading players in the industry.
Alphabet continued going from strength to strength during 2023 despite concerns that competition may infringe on the company’s dominant position in Search. Thus far, Alphabet has continued to hold its own, and we look forward to seeing how the company incorporates further AI developments across the Alphabet ecosystem. Lastly, we are hopeful that the impending arrival of a new CFO will bring a renewed focus on efficiency—an area where we believe Alphabet has ample room for improvement.
FirstEnergy is an Ohio-based public utility holding company that we purchased in 2020 in the face of a bribery scandal. The company paid fines, and senior management changed as a result; since then, the company has performed well operationally, which has translated into good stock performance. While increasing interest rates in 2023 caused its stock to drop from its highs (along with the Interest Rate Caps), it continues to trade at a substantial discount to its peers and offers a 4.5% dividend yield.
| 1 | Risk assets are any assets that are not risk free and generally refers to any financial security or instrument, such as equities, commodities, high-yield bonds, and other financial products that are likely to fluctuate in price. Risk exposure refers to the Fund’s exposure to risk assets as a percent of total assets. The Fund’s net risk exposure as of December 31, 2023 was 66.8%. |
| 2 | Comparison to the indices is for illustrative purposes only. The Fund does not include outperformance of any index or benchmark in its investment objectives. An investor cannot invest directly in an index. |
| 3 | Reflects the top five contributors and detractors to the Fund’s performance based on contribution to return for the trailing twelve months (“TTM”). Contribution is presented gross of investment management fees, transactions costs, and Fund operating expenses, which if included, would reduce the returns presented. The information provided does not reflect all positions purchased, sold or recommended by the portfolio management team during the quarter. It should not be assumed that recommendations made in the future will be profitable or will equal the performance of the securities listed. |
Past performance is no guarantee, nor is it indicative, of future results. |
| 4 | The company data and statistics referenced in this section are sourced from company press releases and financial disclosures unless otherwise noted. |
| 26 | Litman Gregory Funds Trust | |||||
Table of Contents
Markets5
A small number of mega-cap companies drove stock prices last year. The “Magnificent Seven” stocks (Apple, Alphabet, Microsoft, Amazon.com, Meta Platforms, Tesla, and Nvidia) ended the year with an aggregate market cap of almost $12 trillion, more than the U.K., Canadian, and Japanese stock markets combined.6 Their 111% return in 2023 accounted for approximately 75% of the 26.3% total return in the S&P 500. The average stock delivered a much lower return, with the equal-weighted S&P 500 gaining just 10.4%.
Today’s less attractive valuations (relative to last year), particularly in the U.S., help explain the Fund’s slightly lower risk exposure. We are grateful to be able to invest broadly, as we believe other parts of the globe currently offer better value.
Global Stock Market Valuations as of December 31, 2023
Price to Earnings Ratio Trailing 12-Month | Price to Book Ratio | |
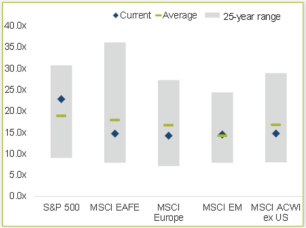 | 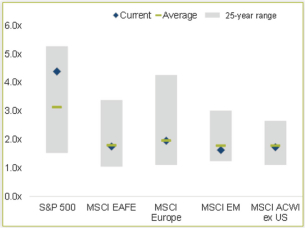 | |
While the Contrarian Value Strategy’s equity investments understandably trade more richly compared to year-end 2022, they trade at lower valuations than the Magnificent Seven, MSCI ACWI, and S&P 500, as reflected in the lower Price/Book and Price/Earnings ratios in the following table. But price without quality is like a crewless boat without an anchor, adrift without direction. Instead, we also focus on identifying quality—attractive earnings growth, solid returns on capital, and sound balance sheets—at fair prices. Through that lens, you can see that the Strategy’s equities appear, on average, more attractive.
Contrarian Value Strategy Equity Characteristics vs MSCI ACWI, S&P 500, and Magnificent Seven7
| As of 31 December 2023 | Price/Earnings 1-Year Forward | Price/Book | 3-Year Trailing EPS Growth | 3-Year Forward Estimated EPS Growth | Return on Equity | Net Debt/Total Capital | ||||||||||||||||||
FPA CV Rep Account - | 14.7x | 1.9x | 39 | % | 20 | % | 25 | % | 20 | % | ||||||||||||||
Long Equity Portfolio | ||||||||||||||||||||||||
vs. MSCI ACWI | -11 | % | -33 | % | 120 | % | 71 | % | 76 | % | -33 | % | ||||||||||||
vs. S&P 500 | -25 | % | -58 | % | 115 | % | 38 | % | 34 | % | -41 | % | ||||||||||||
vs. Magnificent 7 | -54 | % | -50 | % | 7 | % | -2 | % | -47 | % | ||||||||||||||
MSCI ACWI | 16.5x | 2.8x | 18 | % | 12 | % | 14 | % | 29 | % | ||||||||||||||
S&P 500 | 19.5x | 4.4x | 18 | % | 15 | % | 19 | % | 33 | % | ||||||||||||||
Magnificent 7 | 31.8x | 3.8x | 37 | % | 21 | % | 47 | % | -17 | % | ||||||||||||||
| 5 | Market data in this section, including the charts, is as of December 31, 2023, and is sourced from Bloomberg and/or Factset unless otherwise noted. |
| 6 | What I Learned This Week. 13D Research and Strategy. January 11, 2024. |
Past performance is no guarantee, nor is it indicative, of future results. |
| 7 | 3-Year Forward Estimated EPS Growth is based on FPA calculations using consensus data from Factset and Bloomberg. Forward Price/Earnings and 3-Year Forward Estimated EPS Growth are estimates and subject to change. Comparison to the S&P 500 and MSCI ACWI Indices is being used as a representation of the “market” and is for illustrative purposes only. Long equity holdings average weight in the CV Rep Account was 63.2% and 65.5% for Q4 2023 and TTM through 12/31/2023, respectively. The long equity statistics shown herein are for illustrative purposes only and may not reflect the impact of material economic or market factors. No representation is being made that any account, product or strategy will or is likely to achieve results similar to those shown. Long equity statistics noted herein do not represent the results that the Fund or an investor can or should expect to receive. Fund shareholders can only purchase and redeem shares at net asset value. Portfolio composition will change due to ongoing management of the Fund. |
Past performance is no guarantee, nor is it indicative, of future results. |
| Fund Summary | 27 | |||||
Table of Contents
Cheaper and better should translate into good performance versus the market over time. We believe our time is best spent deliberating about whether the companies in the portfolio and those in consideration will meet our expectations over time rather than trying to ascertain what inflation or interest rates might do, who might win the next election, etc.—focusing on bottoms-up, rather than top-down analyses.
Closing
We have been around long enough not to get so excited about a good year, knowing that a bad year might be just a flip of the calendar away. After one has strung together the good, the bad, and the ugly years, we hope to have delivered good risk-adjusted returns by investing globally in various asset classes. But, as Clint Eastwood’s Blondie character from The Good, the Bad, and the Ugly aptly said, “We’re gonna have to earn it.”
Loomis Sayles:
MARKET CONDITIONS
The bond market finished 2023 with positive total returns, but the favorable end result obscures the elevated volatility that occurred along the way. For most of the year, bonds were under pressure from concerns about persistent inflation and the US Federal Reserve’s (Fed’s) continued interest rate increases. As late as October, the headline US investment-grade bond indexes were in negative territory on a year-to-date basis amid worries that the Fed would have to keep interest rates “higher for longer.”
This backdrop changed considerably in November and December, as the concerns that had weighed on the market throughout 2023 dissipated rapidly. Inflation continued to decline unabated, despite concerns from rising oil prices in the third quarter. In November, the headline Consumer Price Index came in at inflation rates not seen since early 2021. With inflation receding, the markets grew comfortable with the idea that the Fed was finished raising rates. In December, Fed Chairman Jerome Powell added to the upbeat tone with comments suggesting that rate cuts could begin as early as the first half of 2024. Bond prices took another leg higher in response, erasing all of the previous losses and helping the fixed-income market close with solid gains for the full year. Income also made a meaningful contribution to total returns thanks to the increase in yields over the past two years.
PORTFOLIO REVIEW
The portfolio’s positive performance was diversified across several sectors, with the majority generated from investment grade corporate, securitized and high yield corporate. Duration positioning, as well as exposure to bank loans also aided performance, but to a lesser extent.
Investment grade corporate exposure was the largest contributor to performance, as spreads tightened throughout the year. Risk sentiment was generally negative for the year and bond spreads widened during the period. The rally was fueled by the Federal Reserve’s rhetoric again supporting the soft-landing thesis in addition to expectations of future rate cuts, which the market took as more of a normalization of rates policy lower sooner rather than later. The allocation to banking, consumer cyclical and energy names positively impacted performance. The securitized sector was also a main contributor for the period. The ABS, CLO and non-Agency RMBS sectors were particularly additive. After rising above 8% in October, the average 30-year mortgage loan remains below 7%, as the Federal Reserve signaled it is done raising interest rates and will begin lowering them in 2024.
The allocation to high yield credit also contributed significantly to performance for the period. Select exposure to consumer cyclical and non-cyclical, as well as communications helped excess return. Spreads tightened meaningfully, finishing the year at +323, its lowest level since March 2022.
OUTLOOK
US inflation—while still above the Fed’s 2% target—continued to decline from its mid-2022 peak and provided the Fed with enough flexibility in December 2023 to signal the tightening cycle is over. Fed Chair Jerome Powell sent a clear message to investors that he did not want to restrict the economy longer than necessary and stated that interest rate cuts would occur over the next year of 2024. This fueled a bond market rally in the second half of the fourth quarter, which saw the 10-year US Treasury yield fall to 3.88% at year-end after peaking at 4.99% on October 19, 2023. Optimism for Fed cuts and the potential for a soft landing also drove a rally in risk assets. Tighter investment grade and high yield spreads, coupled with declining interest rates, helped to boost fixed income returns, which resulted in positive calendar year returns in most fixed income sectors.
In our view, the credit cycle is firmly in the ‘late cycle’ stage. Monetary policy is in restrictive territory and lending standards have tightened. Up to this point, the US labor market has been resilient and underpinned consumer spending, while corporate fundamentals have remained stable and also have been supportive of economic activity. Looking forward, we believe that economic growth is decelerating. Our base case calls for below trend US growth in 2024, however, we do not anticipate a technical recession of back-to-back quarters with negative gross domestic product (GDP). We expect European economic growth to remain stagnant while economic growth in China is showing signs of bottoming, but continues to remain sluggish. Our view is that the credit cycle is in the late stage, with the resilience of inflation moving into focus. While we may have moved past “peak inflation,” the pace with which inflation recedes from here remains a major question. The yield curve has maintained steep inversion across certain maturities for some time. Historically, this phenomenon has been thought to indicate recession. Timing of a potential downturn, however, remains highly uncertain. As such, we expect the economy to show more signs of recession as 2024 progresses.
| 28 | Litman Gregory Funds Trust | |||||
Table of Contents
Water Island:
Despite widespread market volatility and a multitude of macroeconomic and geopolitical factors conspiring to keep investor optimism at bay over much of 2023, broader markets sustained a powerful rally into year-end. The market surge began in the days following the Federal Reserve’s (Fed) meeting which took place from October 31 to November 1. Following the conclusion of the meeting, Fed Chair Jerome Powell stated in his press conference that he saw “pretty significant progress” on inflation and noted that wage inflation had “come down significantly.” Powell’s comments turbocharged market optimism, and the projected likelihood of a rate cut by mid-2024 spiked from 50% probability as of November 1 to more than 90% probability by mid-December, according to Bloomberg data.
In our event-driven universe, the primary theme of the year was antitrust review. As we have noted in prior commentary, the event-driven landscape also faced heightened volatility for much of the latter half of 2022 and first half of 2023 due to significant regulatory challenges faced by several mergers and acquisitions (M&A) transactions. Competition reviews by global regulatory agencies including the Department of Justice (DOJ) and Federal Trade Commission (FTC) in the US, the Competition and Markets Authority (CMA) in the UK, and European Commission (EC) in the EU became increasingly fraught as regulators sought to prevent numerous large-scale acquisitions and deals in high profile sectors such as technology and health care. US regulators began seeking to block deals based on legal theories that had theretofore never been used in the US or with little historical precedent—and which seemingly had no basis in current US antitrust laws. While the FTC and DOJ found some success in preventing deals with more traditional antitrust issues (such as the recent loss by JetBlue in its attempt to buy competitor Spirit Airways) and caused some companies to abandon planned tie-ups rather than put up a fight, when forced to go to court with their more novel justifications, the FTC and DOJ often failed. This all came to a head in the second half of 2023, when the FTC lost in court and exhausted all appeals in its attempt to block a high profile vertical merger—Microsoft’s acquisition of Activision—and also withdrew what was widely viewed as a weak lawsuit seeking to block a deal based on concerns about potential future competition (based on theoretical products that not only didn’t yet exist but weren’t even planned) in Amgen’s acquisition of Horizon Therapeutics. Based on our interpretation of antitrust law, we maintained conviction that these deals would get done, and their success supports an assertion that we held throughout the year: despite numerous protracted investigations from current antitrust regulators, existing case law and not politics continues to determine the outcomes of M&A. As these transactions closed and confidence amongst arbitrageurs returned, deal spreads across the merger arbitrage landscape narrowed and our portfolio experienced a strong rebound from what had been a challenging first six months of 2023.
The top performing position in our sleeve of the fund for 2023 was our merger arbitrage investment in the aforementioned acquisition of Activision by Microsoft. In January 2022, Microsoft reached an agreement to acquire Activision Blizzard, a US-based developer and publisher of video game software, for $75.1 billion in cash. The deal was met not just with objections from competitors, including Sony, but also wariness amongst antitrust regulators, which caused ongoing volatility in the deal spread. During Q1 2023, the UK CMA initially signaled a favorable assessment of certain aspects of the transaction, only to block the deal early in Q2 2023 based on concerns about competition in the nascent cloud gaming market—a decision which Microsoft appealed. Furthermore, the FTC took Microsoft to court seeking to block the acquisition in the US. However, not only did the FTC ultimately fail to persuade the judge that the deal would curtail competition, but it also saw its attempt to appeal the court’s decision denied, clearing a path toward approval in the US. With the deal already having received approval in the EU, the CMA agreed to revisit its review and reopen discussions with Microsoft about potential remedies that could satisfy its concerns. In October 2023, the CMA and Microsoft agreed to remedies which addressed the CMA’s previous concerns, included divesting Activision’s rights to cloud gaming in the UK to competitor Ubisoft for at least 15 years, and the deal subsequently closed, leading to gains for the fund. Other top contributors included semiconductor manufacturer Broadcom’s $61.4 billion cash-and-stock acquisition of VMware and the acquisition of oncology biotechnology company Seagen by Pfizer for $46 billion in cash. Both transactions successfully closed in the fourth quarter of 2023 (the Broadcom/VMware deal after a protracted regulatory review process), leading to gains for the fund.
Conversely, the largest detractor in our sleeve of the fund during the year was our position in the failed acquisition of First Horizon Corp by Toronto-Dominion Bank (TD). In February 2022, First Horizon—a regional bank based in Tennessee that operates throughout the Southeast US—agreed to be acquired by TD—a Canada-based multinational banking and financial services corporation—for $13.4 billion in cash. While First Horizon was not directly connected to Silicon Valley Bank, the company’s shares were a casualty of indiscriminate selling across the US regional banking industry following the news of Silicon Valley Bank’s failure. This, combined with an extended regulatory review in Canada as well as rumors of a potential price cut, pressured the deal’s spread. Through the volatility, we opted to maintain exposure to the transaction as mere weeks prior TD had publicly reaffirmed its commitment to the transaction—which, due to First Horizon’s relatively small size, would have been one of very few paths for TD to gain scale via acquisition—and our outlook on the deal fundamentals had not changed. As the regional banking crisis continued to unfold, leading to the additional failures of Signature Bank and First Republic, volatility in First Horizon shares escalated. Eventually, in May 2023, when no progress had been made on the antitrust review front, First Horizon and TD mutually agreed to terminate the merger due to “uncertainty” as to when the deal might gain the lagging regulatory approvals. We sought to unwind our position in an orderly fashion, and while we were able to recuperate some of the initial losses incurred in the immediate aftermath of the deal break, the position was nonetheless a detractor from returns overall. Other top detractors included two additional broken deals: investment company Standard General’s attempt to acquire Tegna, an operator of broadcast television stations, for $5.3 billion in cash and the attempted $4.0 billion all-cash merger of two electric utility companies, PNM Resources operating in New Mexico and Texas and Avangrid operating in New England and New York. Each of these deals failed to receive necessary regulatory approvals, with the US Federal Communications Commission (FCC) serving as the obstacle to the Tegna/Standard General transaction and the PNM/Avangrid deal facing objections from New Mexico’s utility regulator.
While the market for newly announced M&A activity was admittedly somewhat tepid for much of 2023, with total deal volume for the calendar year reaching its lowest level in a decade according to Bloomberg data, M&A began to show signs of a revival in the latter half of
| Fund Summary | 29 | |||||
Table of Contents
the year. Perhaps emboldened by the courtroom successes of the likes of Microsoft, Q4 bore witness to the announcement of two of the largest transactions of 2023, both in the energy sector—Exxon’s $68 billion acquisition of Pioneer Natural Resources and Chevron’s $59 billion acquisition of Hess. Furthermore, a flurry of activity in the final three months of the year resulted in a strong fourth quarter—the only quarter of 2023 to experience a year-over-year increase in M&A activity. We believe the calming of inflation and increased clarity around the future direction of interest rates, the regulatory climate, and previously cloudy economic forecasts may have initiated a return of boardroom confidence, and we expect the acceleration in consolidation activity to continue in the year ahead. There are motivated strategic acquirers with strong balance sheets waiting in the wings, looking to take advantage of dislocated target valuations. Furthermore, private equity (PE) firms remain extremely acquisitive—in 2023, the level of take-private transactions reached its highest since 2010, and PE firms are still sitting on nearly $3 trillion in dry powder, including an estimated $1 trillion earmarked for buyouts.
Looking forward, despite increasing clarity on some fronts, we anticipate geopolitics and the upcoming election year to drive several bouts of market volatility in the year ahead. With that in mind, we expect to concentrate the portfolio on hard catalyst investments, which typically benefit from more definitive timelines and outcomes. We intend to pair select credit-based event opportunities with a core focus of merger arbitrage, where deal spreads continue to be compelling, while remaining steadfast in our commitment to stringent risk management.
Strategy Allocations
The current allocations, reflecting the DoubleLine tactical overweight of 7% are 27% to DoubleLine, 17% each to DBi and Water Island, 15% to Loomis Sayles, 13% to Blackstone Credit Systematic Group, and 11% to FPA. (The fund’s strategic targets are: 20% each to DBi and DoubleLine, 18% to Water Island, 15% each to Blackstone Credit Systematic Group and Loomis Sayles, and 12% to FPA.) We use the fund’s daily cash flows to bring the manager allocations toward their targets when differences in shorter-term relative performance cause divergences.
Sub-Advisor Portfolio Composition as of December 31, 2023
Blackstone Credit Systematic Group (DCI) Long-Short Credit Strategy
Bond Portfolio Top Five Sector Exposures
Consumer Discretionary | 16.9% | |||
High Tech | 12.9% | |||
Energy | 12.0% | |||
Investment Vehicles/REITs | 7.8% | |||
General | 6.8% |
CDS Portfolio Statistics
| Long | Short | |||||||
Number of Issuers | 73 | 70 | ||||||
Average Credit Duration | 4.4 | 4.4 | ||||||
Spread | 129 bps | 120 bps | ||||||
DBi Enhanced Trend Strategy
Asset Class Exposures (Notional)
Commodities | -1.8% | |||
Currencies | -8.9% | |||
Equities | 17.2% | |||
Rates | -31.9% |
DoubleLine Opportunistic Income Strategy
Sector Exposures
Cash | -3.1 | % | ||
Government | 2.0 | % | ||
Agency IO/Inverse IO | 11.5 | % | ||
Agency CMO | 0.5 | % | ||
Agency PO | 0.5 | % | ||
Non-Agency Residential MBS | 37.2 | % | ||
Commercial MBS | 16.0 | % | ||
Collateralized Loan Obligations | 17.0 | % | ||
ABS | 5.3 | % | ||
Bank Loan | 4.1 | % | ||
Emerging Markets | 7.4 | % | ||
HY/Other | 1.6 | % | ||
|
| |||
TOTAL | 100.0 | % | ||
|
|
FPA Contrarian Opportunity Strategy
Asset Class Exposures
U.S. Stocks | 37.0 | % | ||
Foreign Stocks | 18.1 | % | ||
Bonds | 8.9 | % | ||
Limited Partnerships | 2.2 | % | ||
Other | 0.5 | % | ||
Cash | 33.3 | % | ||
|
| |||
TOTAL | 100.0 | % | ||
|
|
Loomis Sayles Absolute Return Strategy
Strategy Exposures
| Long Total | Short Total | Net Exposure | ||||||||||
Securitized | 31.6% | 0.0% | 31.6% | |||||||||
Investment-Grade Corp. | 18.1% | 0.0% | 18.1% | |||||||||
High-Yield Corporate | 22.7% | -0.3% | 22.4% | |||||||||
Convertibles | 5.5% | 0.0% | 5.5% | |||||||||
Dividend Equity | 3.9% | -0.1% | 3.8% | |||||||||
Bank Loans | 3.9% | -0.5% | 3.4% | |||||||||
Emerging Market | 3.2% | 0.0% | 3.2% | |||||||||
Global Rates | 4.0% | 0.0% | 4.0% | |||||||||
Currency | 0.0% | -1.8% | -1.8% | |||||||||
Subtotal | 92.9% | -2.7% | 90.2% | |||||||||
Cash & Equivalents | 7.2% | 0.0% | 7.2% | |||||||||
Water Island Arbitrage and Event-Driven Strategy
Sub-Strategy Exposures
| Long | Short | Net | ||||||||||
Merger Arbitrage – Equity | 85.4% | -14.9% | 70.5% | |||||||||
Merger Arbitrage – Credit | 0.0% | 0.0% | 0.0% | |||||||||
Total Merger-Related | 85.4% | -14.9% | 70.5% | |||||||||
Special Situations – Equity | 0.9% | 0.0% | 0.9% | |||||||||
Special Situations – Credit | 4.9% | 0.0% | 4.9% | |||||||||
Total Special Situations | 5.8% | 0.0% | 5.8% | |||||||||
|
|
|
|
|
| |||||||
Total | 91.2% | -14.9% | 76.3% | |||||||||
|
|
|
|
|
| |||||||
| 30 | Litman Gregory Funds Trust | |||||
Table of Contents
iMGP Alternative Strategies Fund Value of Hypothetical $100,000
The value of a hypothetical $100,000 investment in the iMGP Alternative Strategies Fund from September 30, 2011 to December 31, 2023 compared with the ICE BofA US 3-Month Treasury Bill, Morningstar Multistrategy Category and Bloomberg US Agg Bond Index.
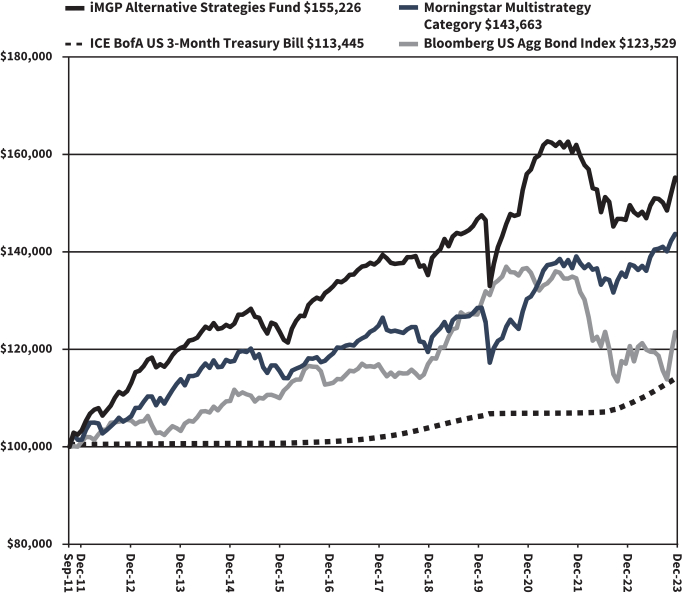
The hypothetical $100,000 investment at fund inception includes changes due to share price and reinvestment of dividends and capital gains. The chart does not imply future performance. Indexes are unmanaged, do not incur fees, expenses or taxes, and cannot be invested in directly.
Performance quoted does not include a deduction for taxes that a shareholder would pay on the redemption of fund shares.
| Fund Summary | 31 | |||||
Table of Contents
iMGP Alternative Strategies Fund
CONSOLIDATED SCHEDULE OF INVESTMENTS IN SECURITIES at December 31, 2023
| Shares | Value | |||||||
COMMON STOCKS: 20.9% | ||||||||
| Communication Services: 2.2% | ||||||||
| 303,882 | Adevinta ASA* | $ | 3,373,098 | |||||
| 15,951 | Alphabet, Inc. - Class A* | 2,228,195 | ||||||
| 10,281 | Alphabet, Inc. - Class C* | 1,448,901 | ||||||
| 114,390 | Altegrity, Inc.*(a) | 266,529 | ||||||
| 32,224 | Altice USA, Inc. - Class A* | 104,728 | ||||||
| 120,875 | Bollore SE | 756,039 | ||||||
| 2,844 | Charter Communications, Inc. - Class A* | 1,105,406 | ||||||
| 48,890 | Cineplex, Inc.* | 309,901 | ||||||
| 52,221 | Comcast Corp. - Class A | 2,289,891 | ||||||
| 17,274 | iHeartMedia, Inc. - Class A* | 46,122 | ||||||
| 7,988 | Intelsat SA* | 229,655 | ||||||
| 5,437 | Meta Platforms, Inc. - Class A* | 1,924,480 | ||||||
| 619 | Netflix, Inc.* | 301,379 | ||||||
| 17,242 | Nexon Co. Ltd. | 314,420 | ||||||
| 11,768 | Nintendo Co. Ltd. | 614,603 | ||||||
|
| |||||||
| 15,313,347 | ||||||||
|
| |||||||
| Consumer Discretionary: 1.8% | ||||||||
| 13,157 | Alibaba Group Holding Ltd. | 127,339 | ||||||
| 8,322 | Amazon.com, Inc.* | 1,264,445 | ||||||
| 17,874 | Bluegreen Vacations Holding Corp. | 1,342,695 | ||||||
| 76,520 | Capri Holdings Ltd.* | 3,844,365 | ||||||
| 11,000 | CarMax, Inc.* | 844,140 | ||||||
| 4,380 | Cie Financiere Richemont SA - Class A | 603,194 | ||||||
| 3,990 | Delivery Hero SE*(b) | 110,373 | ||||||
| 11,090 | Entain PLC | 140,467 | ||||||
| 125 | Home Depot, Inc. | 43,319 | ||||||
| 4,670 | Just Eat Takeaway.com NV*(b) | 71,187 | ||||||
| 2,909 | Marriott International, Inc. - Class A | 656,008 | ||||||
| 20,850 | Prosus NV | 622,305 | ||||||
| 252,231 | Rover Group, Inc.* | 2,744,273 | ||||||
| 463 | Starbucks Corp. | 44,453 | ||||||
|
| |||||||
| 12,458,563 | ||||||||
|
| |||||||
| Consumer Staples: 1.8% | ||||||||
| 137,378 | Albertsons Cos., Inc. - Class A | 3,159,694 | ||||||
| 1,060 | Coca-Cola Co. | 62,466 | ||||||
| 76 | Costco Wholesale Corp. | 50,166 | ||||||
| 15,184 | Heineken Holding NV | 1,286,441 | ||||||
| 5,970 | Herbalife Ltd.* | 91,102 | ||||||
| 29,230 | JDE Peet’s NV | 787,555 | ||||||
| 1,163 | Orion Corp. | 104,841 | ||||||
| 316 | Procter & Gamble Co. | 46,307 | ||||||
| 303,445 | Sovos Brands, Inc.*(c) | 6,684,893 | ||||||
| 236 | Walmart, Inc. | 37,205 | ||||||
|
| |||||||
| 12,310,670 | ||||||||
|
| |||||||
| Energy: 2.3% | ||||||||
| 17,247 | Battalion Oil Corp.* | 165,744 | ||||||
| 4,665 | Canadian Natural Resources Ltd. | 305,651 | ||||||
| 2,409 | Diamondback Energy, Inc. | 373,588 | ||||||
| 145,988 | Euronav NV | 2,567,929 | ||||||
| 1,750 | Gulfport Energy Corp.* | 233,100 | ||||||
| 35,285 | Hess Corp.(c) | 5,086,685 | ||||||
| 38,060 | Kinder Morgan, Inc. | 671,378 | ||||||
| 27,878 | Pioneer Natural Resources Co.(c) | 6,269,205 | ||||||
| 899 | Williams Cos., Inc. | 31,312 | ||||||
|
| |||||||
| 15,704,592 | ||||||||
|
| |||||||
| Shares | Value | |||||||
| Financials: 1.1% | ||||||||
| 4,358 | American International Group, Inc. | $ | 295,254 | |||||
| 3,905 | Aon PLC - Class A | 1,136,433 | ||||||
| 22 | BlackRock, Inc. | 17,860 | ||||||
| 32,190 | Citigroup, Inc. | 1,655,854 | ||||||
| 60,800 | Fast Sponsor Capital*(a) | 60,800 | ||||||
| 4,990 | Groupe Bruxelles Lambert NV | 393,077 | ||||||
| 17,220 | Jefferies Financial Group, Inc. | 695,860 | ||||||
| 233 | JPMorgan Chase & Co. | 39,633 | ||||||
| 1,498 | LPL Financial Holdings, Inc. | 340,975 | ||||||
| 57 | MasterCard, Inc. - Class A | 24,311 | ||||||
| 182 | Morgan Stanley | 16,971 | ||||||
| 5,128 | NCR Atleos Corp.* | 124,559 | ||||||
| 352,929 | Network International Holdings PLC*(b) | 1,752,665 | ||||||
| 776 | PowerUp Acquisition Corp.* | 8,850 | ||||||
| 25,290 | Wells Fargo & Co. | 1,244,774 | ||||||
|
| |||||||
| 7,807,876 | ||||||||
|
| |||||||
| Health Care: 4.4% | ||||||||
| 415 | Abbott Laboratories | 45,679 | ||||||
| 1,387 | AbbVie, Inc. | 214,943 | ||||||
| 47,716 | Albireo Pharma, Inc.* | 110,949 | ||||||
| 60,863 | Amedisys, Inc.*(c) | 5,785,637 | ||||||
| 15,111 | Bayer AG | 562,076 | ||||||
| 5 | Biote Corp. - Class A* | 25 | ||||||
| 747 | Bristol-Myers Squibb Co. | 38,329 | ||||||
| 57,645 | Cerevel Therapeutics Holdings, Inc.*(c) | 2,444,148 | ||||||
| 54,961 | CinCor Pharma, Inc.* | 182,322 | ||||||
| 213,778 | Concert Pharmaceuticals, Inc.* | 85,490 | ||||||
| 51,371 | Dechra Pharmaceuticals PLC | 2,524,933 | ||||||
| 126 | Elevance Health, Inc. | 59,417 | ||||||
| 8,428 | Envision Healthcare Corp.* | 71,638 | ||||||
| 13 | Eurofins Scientific SE | 848 | ||||||
| 1,692 | ICON PLC* | 478,954 | ||||||
| 91,174 | Icosavax, Inc.* | 1,436,902 | ||||||
| 96,679 | ImmunoGen, Inc.*(c) | 2,866,532 | ||||||
| 254 | Johnson & Johnson | 39,812 | ||||||
| 8,667 | Karuna Therapeutics, Inc.* | 2,743,192 | ||||||
| 273 | Merck & Co., Inc. | 29,762 | ||||||
| 38,636 | Mirati Therapeutics, Inc.* | 2,269,865 | ||||||
| 233,824 | Olink Holding AB - ADR* | 5,880,674 | ||||||
| 35,666 | Orchard Therapeutics PLC - ADR* | 586,706 | ||||||
| 22,388 | RayzeBio, Inc.* | 1,391,862 | ||||||
| 52 | Thermo Fisher Scientific, Inc. | 27,601 | ||||||
| 84 | UnitedHealth Group, Inc. | 44,224 | ||||||
|
| |||||||
| 29,922,520 | ||||||||
|
| |||||||
| Industrials: 2.4% | ||||||||
| 62,194 | Applus Services SA | 687,897 | ||||||
| 95 | Deere & Co. | 37,988 | ||||||
| 221 | Emerson Electric Co. | 21,510 | ||||||
| 395 | Fastenal Co. | 25,584 | ||||||
| 5,050 | Ferguson PLC | 975,004 | ||||||
| 42,800 | Hawaiian Holdings, Inc.* | 607,760 | ||||||
| 1 | Hornbeck Offshore Services, Inc.* | 50 | ||||||
| 9,620 | Howmet Aerospace, Inc. | 520,634 | ||||||
| 44,783 | Kloeckner & Co. SE | 475,510 | ||||||
| 10,350 | LG Corp. | 690,321 | ||||||
| 145 | Lockheed Martin Corp. | 65,720 | ||||||
| 538,442 | McDermott International Ltd.* | 48,460 | ||||||
| 645,855 | McDermott International, Inc.* | 58,127 | ||||||
| 35,479 | PGT Innovations, Inc.* | 1,443,995 | ||||||
| 124,401 | Resolute Forest Products, Inc.* | 191,155 | ||||||
The accompanying notes are an integral part of these financial statements.
| 32 | Litman Gregory Funds Trust | |||||
Table of Contents
iMGP Alternative Strategies Fund
CONSOLIDATED SCHEDULE OF INVESTMENTS IN SECURITIES at December 31, 2023 (Continued)
| Shares | Value | |||||||
COMMON STOCKS (CONTINUED) | ||||||||
| Industrials (continued) | ||||||||
| 43,204 | Rush Enterprises, Inc. - Class A | $ | 2,173,161 | |||||
| 5,760 | Safran SA | 1,015,896 | ||||||
| 5,030 | Samsung C&T Corp. | 505,773 | ||||||
| 73,657 | Smart Metering Systems PLC | 882,087 | ||||||
| 17,500 | Sound Holding FP*(a) | 357,822 | ||||||
| 32,810 | SP Plus Corp.*(c) | 1,681,512 | ||||||
| 62,055 | Textainer Group Holdings Ltd. | 3,053,106 | ||||||
| 7,870 | Uber Technologies, Inc.* | 484,556 | ||||||
| 150 | Union Pacific Corp. | 36,843 | ||||||
| 312 | United Parcel Service, Inc. - Class B | 49,056 | ||||||
| 4,240 | Westinghouse Air Brake Technologies Corp. | 538,056 | ||||||
|
| |||||||
| 16,627,583 | ||||||||
|
| |||||||
| Information Technology: 2.7% | ||||||||
| 26 | Accenture PLC - Class A | 9,124 | ||||||
| 59,943 | Alteryx, Inc. - Class A* | 2,826,912 | ||||||
| 10,530 | Analog Devices, Inc. | 2,090,837 | ||||||
| 777 | Apple, Inc. | 149,596 | ||||||
| 814 | Broadcom, Inc. | 908,627 | ||||||
| 303 | Cisco Systems, Inc. | 15,308 | ||||||
| 22,138 | Contra Abiomed, Inc.* | 38,741 | ||||||
| 549 | Microchip Technology, Inc. | 49,509 | ||||||
| 154 | Microsoft Corp. | 57,910 | ||||||
| 7,270 | NCR Voyix Corp.* | 122,936 | ||||||
| 3,773 | NXP Semiconductors NV | 866,583 | ||||||
| 1,167 | QUALCOMM, Inc. | 168,783 | ||||||
| 6,102 | Riverbed Technology, Inc.* | 793 | ||||||
| 32,060 | Silicon Motion Technology Corp. - ADR | 1,964,316 | ||||||
| 46,051 | Splunk, Inc.* | 7,015,870 | ||||||
| 13,530 | TE Connectivity Ltd. | 1,900,965 | ||||||
|
| |||||||
| 18,186,810 | ||||||||
|
| |||||||
| Materials: 1.1% | ||||||||
| 110,543 | Cemex SAB de CV - ADR* | 856,708 | ||||||
| 180,860 | Glencore PLC | 1,087,793 | ||||||
| 88 | Heidelberg Materials AG | 7,878 | ||||||
| 29,940 | Holcim AG | 2,351,742 | ||||||
| 18,780 | International Flavors & Fragrances, Inc. | 1,520,617 | ||||||
| 58 | Linde PLC | 23,821 | ||||||
| 878 | Newmont Corp. | 36,340 | ||||||
| 116 | Packaging Corp. of America | 18,897 | ||||||
| 28,755 | U.S. Steel Corp. | 1,398,931 | ||||||
|
| |||||||
| 7,302,727 | ||||||||
|
| |||||||
| Real Estate: 0.8% | ||||||||
| 199 | American Tower Corp. - REIT | 42,960 | ||||||
| 3,007 | Crown Castle, Inc. - REIT(c) | 346,376 | ||||||
| 15,110 | Douglas Emmett, Inc. - REIT | 219,095 | ||||||
| 94,079 | Spirit Realty Capital, Inc. - REIT | 4,110,311 | ||||||
| 28,655 | Swire Pacific Ltd. - Class A | 242,485 | ||||||
| 6,120 | Vornado Realty Trust - REIT | 172,890 | ||||||
|
| |||||||
| 5,134,117 | ||||||||
|
| |||||||
| Special Purpose Acquisition Companies: 0.0% | ||||||||
| 3,818 | Bright Bidco BV* | 2,482 | ||||||
| 6,266 | Pershing Square Tontine Holdings Ltd.* | 0 | ||||||
|
| |||||||
| 2,482 | ||||||||
|
| |||||||
| Shares | Value | |||||||
| Utilities: 0.3% | ||||||||
| 284 | Duke Energy Corp. | $ | 27,559 | |||||
| 16,210 | FirstEnergy Corp. | 594,259 | ||||||
| 5,210 | PG&E Corp. | 93,936 | ||||||
| 25,653 | PNM Resources, Inc. | 1,067,165 | ||||||
|
| |||||||
| 1,782,919 | ||||||||
|
| |||||||
| | TOTAL COMMON STOCKS | 142,554,206 | ||||||
|
| |||||||
RIGHTS/WARRANTS: 0.0% | ||||||||
| 186 | Alpha Partners Technology Merger Corp. (Expiration date 03/31/28)* | 11 | ||||||
| 243 | American Oncology Network, Inc. (Expiration date 09/20/28)* | 49 | ||||||
| 5,560 | Atlantic Coastal Acquisition Corp. (Expiration date 12/31/27)* | 145 | ||||||
| 2,542 | Atlantic Coastal Acquisition Corp. II (Expiration date 06/02/23)* | 76 | ||||||
| 3,595 | BigBear.ai Holdings, Inc. (Expiration date 12/31/28)* | 1,216 | ||||||
| 14,913 | BurTech Acquisition Corp. (Expiration date 12/18/26)* | 1,342 | ||||||
| 1,663 | Churchill Capital Corp. VII (Expiration date 02/29/28)* | 272 | ||||||
| 2,337 | DHC Acquisition Corp. (Expiration date 12/31/27)* | 41 | ||||||
| 4,634 | Disruptive Acquisition Corp. I (Expiration date 03/06/26)* | 162 | ||||||
| 2,253 | ECARX Holdings, Inc. (Expiration date 12/21/27)* | 72 | ||||||
| 5,576 | Electriq Power Holdings, Inc. (Expiration date 07/31/28)* | 6 | ||||||
| 6,951 | Flame Acquisition Corp. (Expiration date 12/31/28)* | 13,416 | ||||||
| 870 | Global Partner Acquisition Corp. II (Expiration date 12/31/27)* | 0 | ||||||
| 4,634 | Golden Arrow Merger Corp. (Expiration date 07/31/26)* | 603 | ||||||
| 1,333 | Heliogen, Inc. (Expiration date 12/30/26)* | 13 | ||||||
| 11 | Hornbeck Offshore Services, Inc. (Expiration date 04/09/30)* | 550 | ||||||
| 389 | Hornbeck Offshore Services, Inc. (Expiration date 04/09/30)* | 11,670 | ||||||
| 4,176 | Landcadia Holdings IV, Inc. (Expiration date 03/29/28)* | 219 | ||||||
| 4,247 | MariaDB PLC (Expiration date 12/16/27)* | 181 | ||||||
| 2,489 | Metals Acquisition Ltd. (Expiration date 06/16/28)* | 4,256 | ||||||
| 2,915 | NioCorp Developments Ltd. (Expiration date 03/17/28)* | 1,545 | ||||||
| 1,238 | Northern Star Investment Corp. III (Expiration date 02/25/28)* | 21 | ||||||
| 956 | Northern Star Investment Corp. IV (Expiration date 12/31/27)* | 24 | ||||||
| 1,567 | Pershing Square Holdings Ltd. (Expiration date 09/23/2033)* | 0 | ||||||
| 2,615 | Plum Acquisition Corp. I (Expiration date 12/31/28)* | 340 | ||||||
The accompanying notes are an integral part of these financial statements.
| Schedule of Investments | 33 | |||||
Table of Contents
iMGP Alternative Strategies Fund
CONSOLIDATED SCHEDULE OF INVESTMENTS IN SECURITIES at December 31, 2023 (Continued)
| Shares | Value | |||||||
RIGHTS/WARRANTS (CONTINUED) | ||||||||
| 145 | Prenetics Global Ltd. (Expiration date 05/17/27)* | $ | 1 | |||||
| 1,039 | Ross Acquisition Corp. II (Expiration date 02/12/26)* | 58 | ||||||
| 2,409 | Slam Corp. (Expiration date 12/31/27)* | 470 | ||||||
| 367 | Swvl Holdings Corp. (Expiration date 03/31/27)* | 2 | ||||||
| 4,445 | Twelve Seas Investment Co. II (Expiration date 03/02/28)* | 167 | ||||||
|
| |||||||
| | TOTAL RIGHTS/WARRANTS | 36,928 | ||||||
|
| |||||||
PREFERRED STOCKS: 0.0% | ||||||||
| Energy: 0.0% | ||||||||
| El Paso Energy Capital Trust I | ||||||||
| 528 | 4.750%, 03/31/2028 | 24,869 | ||||||
| Gulfport Energy Corp. - Cash 10.000% + PIK Rate 15.000% | ||||||||
| 18 | 10.000%, 01/29/2024*(a)(e)(f) | 14,919 | ||||||
|
| |||||||
| 39,788 | ||||||||
|
| |||||||
| Industrials: 0.0% | ||||||||
| Clarivate PLC - Series A | ||||||||
| 5,714 | 5.250%, 06/01/2024 | 218,846 | ||||||
| Element Commercial Aviation | ||||||||
| 170 | 0.000%,(a) | 0 | ||||||
| McDermott International, Inc. - (Preference Shares) | ||||||||
| 349 | 0.000%,*(a) | 39,652 | ||||||
|
| |||||||
| 258,498 | ||||||||
|
| |||||||
| | TOTAL PREFERRED STOCKS | 298,286 | ||||||
|
| |||||||
| Principal Amount^ | ||||||||
ASSET-BACKED SECURITIES: 12.8% | ||||||||
| 510 Asset-Backed Trust | ||||||||
| $237,547 | Series 2021-NPL1-A1 | 226,540 | ||||||
| Aaset Trust | ||||||||
| 301,560 | Series 2021-1A-A | 270,684 | ||||||
| Accelerated Assets LLC | ||||||||
| 72,054 | Series 2018-1-B | 70,299 | ||||||
| Affirm Asset Securitization Trust | ||||||||
| 850,000 | Series 2023-A-D | 858,169 | ||||||
| 110,000 | Series 2023-B-A | 112,010 | ||||||
| AGL CLO 3 Ltd. | ||||||||
| 470,000 | Series 2020-3A-D | 462,071 | ||||||
| Principal Amount^ | Value | |||||||
| AIM Aviation Finance Ltd. | ||||||||
| $ 637,452 | Series 2015-1A-B1 | $ | 136,150 | |||||
| AMSR Trust | ||||||||
| 1,800,000 | Series 2020-SFR5-G | 1,671,927 | ||||||
| 5,000,000 | Series 2021-SFR1-G | 4,212,196 | ||||||
| Apidos CLO XX Ltd. | ||||||||
| 265,000 | Series 2015-20A-BRR | 264,607 | ||||||
| Apidos CLO XXIV Ltd. | ||||||||
| 1,000,000 | Series 2016-24A-DR | 967,971 | ||||||
| Applebee’s Funding LLC/IHOP Funding LLC | ||||||||
| 265,000 | Series 2023-1A-A2 | 272,763 | ||||||
| Arbor Realty Commercial Real Estate Notes CLO Ltd. | ||||||||
| 1,000,000 | Series 2021-FL1-C | 980,778 | ||||||
| ARES LX CLO Ltd. | ||||||||
| 500,000 | Series 2021-60A-D | 494,882 | ||||||
| Avis Budget Rental Car Funding AESOP LLC | ||||||||
| 355,000 | Series 2020-2A-C | 337,823 | ||||||
| Bain Capital Credit CLO Ltd. | ||||||||
| 500,000 | Series 2021-2A-D | 493,141 | ||||||
| Barings CLO Ltd. | ||||||||
| 500,000 | Series 2018-4A-E | 485,246 | ||||||
| BHG Securitization Trust | ||||||||
| 545,000 | Series 2022-A-B | 504,633 | ||||||
| Blackbird Capital Aircraft Lease Securitization Ltd. | ||||||||
| 169,108 | Series 2016-1A-A | 159,559 | ||||||
| Blue Stream Issuer LLC | ||||||||
| 1,000,000 | Series 2023-1A-C | 939,781 | ||||||
| Bristol Park CLO Ltd. | ||||||||
| 260,000 | Series 2016-1A-CR | 259,865 | ||||||
| Buttermilk Park CLO Ltd. | ||||||||
| 750,000 | Series 2018-1A-E | 714,025 | ||||||
| Canyon Capital CLO Ltd. | ||||||||
| 1,000,000 | Series 2016-1A-ER | 941,568 | ||||||
The accompanying notes are an integral part of these financial statements.
| 34 | Litman Gregory Funds Trust | |||||
Table of Contents
iMGP Alternative Strategies Fund
CONSOLIDATED SCHEDULE OF INVESTMENTS IN SECURITIES at December 31, 2023 (Continued)
| Principal Amount^ | Value | |||||||
ASSET-BACKED SECURITIES (CONTINUED) | ||||||||
| Canyon Capital CLO Ltd. (Continued) | ||||||||
| $ 500,000 | Series 2018-1A-E | $ | 475,741 | |||||
| 1,000,000 | Series 2021-4A-E | 956,079 | ||||||
| Carlyle Global Market Strategies CLO Ltd. | ||||||||
| 500,000 | Series 2014-2RA-D | 466,676 | ||||||
| Carlyle U.S. CLO Ltd. | ||||||||
| 500,000 | Series 2021-1A-D | 490,041 | ||||||
| Carvana Auto Receivables Trust | ||||||||
| 3,000 | Series 2021-N1-R | 359,086 | ||||||
| 136,489 | Series 2021-N4-D | 130,985 | ||||||
| Castlelake Aircraft Securitization Trust | ||||||||
| 4,135,144 | Series 2018-1-C | 1,571,644 | ||||||
| Castlelake Aircraft Structured Trust | ||||||||
| 3,000,000 | Series 2019-1A-E | 67,500 | ||||||
| Catskill Park CLO Ltd. | ||||||||
| 1,000,000 | Series 2017-1A-D | 967,153 | ||||||
| Chenango Park CLO Ltd. | ||||||||
| 500,000 | Series 2018-1A-D | 446,732 | ||||||
| CIFC Funding CLO Ltd. | ||||||||
| 205,000 | Series 2013-2A-A3LR | 204,239 | ||||||
| 500,000 | Series 2017-4A-D | 491,368 | ||||||
| 500,000 | Series 2019-3A-DR | 504,987 | ||||||
| College Ave Student Loans LLC | ||||||||
| 89,467 | Series 2021-A-D | 82,286 | ||||||
| Cologix Data Centers U.S. Issuer LLC | ||||||||
| 1,500,000 | Series 2021-1A-C | 1,252,490 | ||||||
| Cook Park CLO Ltd. | ||||||||
| 1,000,000 | Series 2018-1A-E | 870,441 | ||||||
| CoreVest American Finance Ltd. | ||||||||
| 305,000 | Series 2020-4-C | 252,499 | ||||||
| Principal Amount^ | Value | |||||||
| CSAB Mortgage-Backed Trust | ||||||||
| $ 1,857,684 | Series 2006-2-A6B | $ | 140,727 | |||||
| Dryden 40 Senior Loan Fund CLO | ||||||||
| 1,000,000 | Series 2015-40A-ER | 879,429 | ||||||
| Dryden 45 Senior Loan Fund CLO | ||||||||
| 275,000 | Series 2016-45A-ER | 256,234 | ||||||
| Dryden 55 CLO Ltd. | ||||||||
| 500,000 | Series 2018-55A-F | 400,932 | ||||||
| Education Funding Trust | ||||||||
| 228,530 | Series 2020-A-A | 211,414 | ||||||
| Elevation CLO Ltd. | ||||||||
| 500,000 | Series 2021-14A-C | 496,267 | ||||||
| Exeter Automobile Receivables Trust | ||||||||
| 100,000 | Series 2023-2A-D | 100,954 | ||||||
| Fillmore Park CLO Ltd. | ||||||||
| 500,000 | Series 2018-1A-E | 482,369 | ||||||
| FirstKey Homes Trust | ||||||||
| 1,010,000 | Series 2020-SFR2-F1 | 939,730 | ||||||
| FMC GMSR Issuer Trust | ||||||||
| 1,900,000 | Series 2021-GT1-B | 1,536,440 | ||||||
| 2,500,000 | Series 2021-GT2-B | 2,015,910 | ||||||
| Frontier Issuer LLC | ||||||||
| 495,000 | Series 2023-1-A2 | 494,243 | ||||||
| Galaxy XIX CLO Ltd. | ||||||||
| 1,000,000 | Series 2015-19A-D1R | 966,588 | ||||||
| Gilbert Park CLO Ltd. | ||||||||
| 500,000 | Series 2017-1A-E | 483,229 | ||||||
| GITSIT Mortgage Loan Trust | ||||||||
| 88,321 | Series 2023-NPL1-A1 | 89,875 | ||||||
| GLS Auto Receivables Issuer Trust | ||||||||
| 1,000,000 | Series 2021-4A-E | 918,659 | ||||||
| 100,000 | Series 2023-2A-D | 100,946 | ||||||
| Greystone CRE Notes Ltd. | ||||||||
| 355,000 | Series 2021-HC2-A | 353,246 | ||||||
The accompanying notes are an integral part of these financial statements.
| Schedule of Investments | 35 | |||||
Table of Contents
iMGP Alternative Strategies Fund
CONSOLIDATED SCHEDULE OF INVESTMENTS IN SECURITIES at December 31, 2023 (Continued)
| Principal Amount^ | Value | |||||||
ASSET-BACKED SECURITIES (CONTINUED) | ||||||||
| GSAA Home Equity Trust | ||||||||
| $ 531,406 | Series 2006-10-AF5 | $ | 141,355 | |||||
| Hayfin U.S. XII Ltd. | ||||||||
| 300,000 | Series 2020-12A-D | 300,248 | ||||||
| Hertz Vehicle Financing III LLC | ||||||||
| 357,000 | Series 2022-1A-D | 338,608 | ||||||
| 183,000 | Series 2022-3A-D | 182,202 | ||||||
| Hertz Vehicle Financing LLC | ||||||||
| 270,000 | Series 2022-4A-D | 261,066 | ||||||
| Highbridge Loan Management CLO Ltd. | ||||||||
| 500,000 | Series 2013-2A-DR | 470,041 | ||||||
| Hilton Grand Vacations Trust | ||||||||
| 39,324 | Series 2018-AA-C | 38,099 | ||||||
| Kestrel Aircraft Funding Ltd. | ||||||||
| 329,123 | Series 2018-1A-A | 290,863 | ||||||
| LCM CLO 26 Ltd. | ||||||||
| 500,000 | Series 26A-E | 380,894 | ||||||
| LCM CLO XVII LP | ||||||||
| 1,000,000 | Series 17A-ER | 760,517 | ||||||
| LCM CLO XX LP | ||||||||
| 500,000 | Series 20A-ER | 505,000 | ||||||
| LCM Loan Income Fund I Income Note Issuer CLO Ltd. | ||||||||
| 500,000 | Series 27A-E | 411,508 | ||||||
| Lehman XS Trust | ||||||||
| 1,791,939 | Series 2005-6-3A3A | 797,178 | ||||||
| Madison Park Funding CLO XLV Ltd. | ||||||||
| 500,000 | Series 2020-45A-ER | 500,726 | ||||||
| Madison Park Funding CLO XXVI Ltd. | ||||||||
| 445,000 | Series 2017-26A-DR | 447,255 | ||||||
| Madison Park Funding CLO XXXVIII Ltd. | ||||||||
| 500,000 | Series 2021-38A-E | 495,922 | ||||||
| Principal Amount^ | Value | |||||||
| MAPS Ltd. | ||||||||
| $ 281,278 | Series 2018-1A-A | $ | 252,491 | |||||
| 107,747 | Series 2019-1A-A | 97,557 | ||||||
| Marble Point CLO XII Ltd. | ||||||||
| 500,000 | Series 2018-1A-D | 457,471 | ||||||
| Marlette Funding Trust | ||||||||
| 125,000 | Series 2023-4A-B | 128,862 | ||||||
| MetroNet Infrastructure Issuer LLC | ||||||||
| 887,000 | Series 2023-1A-B | 884,614 | ||||||
| Milos CLO Ltd. | ||||||||
| 500,000 | Series 2017-1A-ER | 486,584 | ||||||
| Mosaic Solar Loans LLC | ||||||||
| 786,714 | Series 2017-2A-B | 718,246 | ||||||
| MP CLO III Ltd. | ||||||||
| 500,000 | Series 2013-1A-CR | 498,061 | ||||||
| MVW LLC | ||||||||
| 27,291 | Series 2020-1A-C | 26,235 | ||||||
| 197,070 | Series 2021-1WA-D | 177,222 | ||||||
| MVW Owner Trust | ||||||||
| 28,222 | Series 2019-1A-C | 26,988 | ||||||
| Myers Park CLO Ltd. | ||||||||
| 1,000,000 | Series 2018-1A-E | 952,313 | ||||||
| Navient Private Education Refi Loan Trust | ||||||||
| 235,075 | Series 2018-A-B | 225,956 | ||||||
| 855,000 | Series 2019-FA-B | 713,076 | ||||||
| 180,000 | Series 2019-GA-B | 149,494 | ||||||
| 320,000 | Series 2020-FA-B | 259,420 | ||||||
| Neuberger Berman CLO XVI-S Ltd. | ||||||||
| 500,000 | Series 2017-16SA-ER | 494,561 | ||||||
| Neuberger Berman Loan Advisers CLO 24 Ltd. | ||||||||
| 1,000,000 | Series 2017-24A-E | 1,009,964 | ||||||
| Neuberger Berman Loan Advisers CLO 26 Ltd. | ||||||||
| 1,000,000 | Series 2017-26A-INC | 404,080 | ||||||
The accompanying notes are an integral part of these financial statements.
| 36 | Litman Gregory Funds Trust | |||||
Table of Contents
iMGP Alternative Strategies Fund
CONSOLIDATED SCHEDULE OF INVESTMENTS IN SECURITIES at December 31, 2023 (Continued)
| Principal Amount^ | Value | |||||||
ASSET-BACKED SECURITIES (CONTINUED) | ||||||||
| Neuberger Berman Loan Advisers CLO 37 Ltd. | ||||||||
| $ 500,000 | Series 2020-37A-ER | $ | 502,012 | |||||
| Ocean Trails CLO V | ||||||||
| 700,000 | Series 2014-5A-DRR | 645,986 | ||||||
| Octagon Investment Partners CLO 26 Ltd. | ||||||||
| 1,000,000 | Series 2016-1A-FR | 742,592 | ||||||
| Octagon Investment Partners CLO 29 Ltd. | ||||||||
| 500,000 | Series 2016-1A-DR | 482,543 | ||||||
| 1,000,000 | Series 2016-1A-ER | 960,091 | ||||||
| Octagon Investment Partners CLO 39 Ltd. | ||||||||
| 275,000 | Series 2018-3A-E | 260,781 | ||||||
| Octagon Investment Partners CLO 40 Ltd. | ||||||||
| 500,000 | Series 2019-1A-ER | 466,837 | ||||||
| Octagon Investment Partners CLO XVI Ltd. | ||||||||
| 1,000,000 | Series 2013-1A-ER | 897,973 | ||||||
| 1,500,000 | Series 2013-1A-SUB | 120,344 | ||||||
| Octagon Investment Partners CLO XXI Ltd. | ||||||||
| 500,000 | Series 2014-1A-DRR | 485,983 | ||||||
| OHA Credit Funding CLO 5 Ltd. | ||||||||
| 475,000 | Series 2020-5A-C | 473,943 | ||||||
| OneMain Financial Issuance Trust | ||||||||
| 265,000 | Series 2020-2A-C | 236,742 | ||||||
| Pagaya AI Debt Selection Trust | ||||||||
| 800,000 | Series 2021-5-CERT | 74,571 | ||||||
| Pagaya AI Debt Trust | ||||||||
| 587,213 | Series 2022-2-AB | 583,706 | ||||||
| PFP CLO Ltd. | ||||||||
| 1,000,000 | Series 2021-8-C | 956,955 | ||||||
| Planet Fitness Master Issuer LLC | ||||||||
| 748,800 | Series 2019-1A-A2 | 664,027 | ||||||
| Principal Amount^ | Value | |||||||
| Post CLO Ltd. | ||||||||
| $370,000 | Series 2023-1A-A | $ | 370,530 | |||||
| Progress Residential Trust | ||||||||
| 255,000 | Series 2020-SFR3-F | 236,883 | ||||||
| 140,000 | Series 2021-SFR1-F | 125,192 | ||||||
| 3,475,037 | Series 2021-SFR10-F | 3,024,479 | ||||||
| 2,432,000 | Series 2021-SFR2-D | 2,200,327 | ||||||
| 170,000 | Series 2021-SFR2-E2 | 152,997 | ||||||
| 7,000,000 | Series 2021-SFR2-G | 6,395,073 | ||||||
| 355,000 | Series 2021-SFR3-F | 318,646 | ||||||
| 250,000 | Series 2021-SFR5-F | 221,611 | ||||||
| 125,000 | Series 2021-SFR6-E2 | 111,220 | ||||||
| Rockford Tower CLO Ltd. | ||||||||
| 700,000 | Series 2017-2A-CR | 699,474 | ||||||
| RR 1 LLC | ||||||||
| 500,000 | Series 2017-1A-D1B | 485,072 | ||||||
| RR CLO 2 Ltd. | ||||||||
| 500,000 | Series 2017-2A-DR | 477,423 | ||||||
| RR CLO 6 Ltd. | ||||||||
| 500,000 | Series 2019-6A-DR | 471,701 | ||||||
| SCF Equipment Leasing LLC | ||||||||
| 295,000 | Series 2021-1A-E | 265,450 | ||||||
| Sierra Timeshare Receivables Funding LLC | ||||||||
| 108,534 | Series 2020-2A-C | 104,332 | ||||||
| Slam Ltd. | ||||||||
| 215,144 | Series 2021-1A-B | 181,206 | ||||||
| SLM Private Credit Student Loan Trust | ||||||||
| 102,000 | Series 2003-A-A3 | 102,245 | ||||||
| 337,000 | Series 2003-B-A3 | 336,352 | ||||||
| 50,000 | Series 2003-B-A4 | 49,904 | ||||||
| SoFi Professional Loan Program LLC | ||||||||
| 360,000 | Series 2020-A-BFX | 297,049 | ||||||
| SoFi Professional Loan Program LLC | ||||||||
| 133,000 | Series 2017-F-R1 | 1,394,278 | ||||||
The accompanying notes are an integral part of these financial statements.
| Schedule of Investments | 37 | |||||
Table of Contents
iMGP Alternative Strategies Fund
CONSOLIDATED SCHEDULE OF INVESTMENTS IN SECURITIES at December 31, 2023 (Continued)
| Principal Amount^ | Value | |||||||
ASSET-BACKED SECURITIES (CONTINUED) | ||||||||
| Sound Point CLO XXXII Ltd. | ||||||||
| $ 500,000 | Series 2021-4A-E | $ | 414,169 | |||||
| SpringCastle America Funding LLC | ||||||||
| 330,171 | Series 2020-AA-A | 304,876 | ||||||
| Stewart Park CLO Ltd. | ||||||||
| 500,000 | Series 2015-1A-ER | 442,530 | ||||||
| Sunnova Helios XI Issuer LLC | ||||||||
| 150,562 | Series 2023-A-B | 145,418 | ||||||
| Textainer Marine Containers VII Ltd. | ||||||||
| 72,257 | Series 2020-1A-A | 67,534 | ||||||
| 173,675 | Series 2021-1A-B | 151,336 | ||||||
| THL Credit Wind River CLO Ltd. | ||||||||
| 2,000,000 | Series 2014-2A-INC | 199,322 | ||||||
| 500,000 | Series 2017-3A-ER | 465,142 | ||||||
| 500,000 | Series 2018-2A-E | 463,420 | ||||||
| TICP CLO VII Ltd. | ||||||||
| 280,000 | Series 2017-7A-CR | 279,308 | ||||||
| TICP CLO XV Ltd. | ||||||||
| 250,000 | Series 2020-15A-C | 248,093 | ||||||
| Towd Point Mortgage Trust | ||||||||
| 385,000 | Series 2019-2-M1 | 326,955 | ||||||
| Trestles CLO II Ltd. | ||||||||
| 335,000 | Series 2018-2A-D | 320,271 | ||||||
| Tricon American Homes Trust | ||||||||
| 290,000 | Series 2020-SFR2-E1 | 254,234 | ||||||
| Upstart Pass-Through Trust | ||||||||
| 1,000,000 | Series 2021-ST8-CERT | 322,619 | ||||||
| 929,000 | Series 2021-ST9-CERT | 259,481 | ||||||
| Upstart Securitization Trust | ||||||||
| 1,000 | Series 2021-2-CERT | 51,179 | ||||||
| VCAT LLC | ||||||||
| 185,505 | Series 2021-NPL5-A1 | 182,496 | ||||||
| Principal Amount^ | Value | |||||||
| VOLT XCIV LLC | ||||||||
| $ 54,650 | Series 2021-NPL3-A1 | $ | 53,399 | |||||
| 675,000 | Series 2021-NPL3-A2 | 582,540 | ||||||
| Voya CLO Ltd. | ||||||||
| 500,000 | Series 2018-2A-E | 439,067 | ||||||
| 500,000 | Series 2019-1A-ER | 476,153 | ||||||
| WAVE Trust | ||||||||
| 360,515 | Series 2017-1A-A | 301,037 | ||||||
| Webster Park CLO Ltd. | ||||||||
| 1,000,000 | Series 2015-1A-DR | 937,145 | ||||||
| Wellfleet CLO Ltd. | ||||||||
| 1,000,000 | Series 2017-3A-C | 908,087 | ||||||
| Wendy’s Funding LLC | ||||||||
| 170,998 | Series 2019-1A-A2II | 160,150 | ||||||
| Willis Engine Structured Trust V | ||||||||
| 198,851 | Series 2020-A-A | 179,847 | ||||||
| Willis Engine Structured Trust VI | ||||||||
| 1,343,535 | Series 2021-A-C | 1,105,758 | ||||||
| Wind River CLO Ltd. | ||||||||
| 500,000 | Series 2021-2A-E | 440,006 | ||||||
|
| |||||||
| | TOTAL ASSET-BACKED SECURITIES | 87,636,606 | ||||||
|
| |||||||
BANK LOANS: 2.1% | ||||||||
| 1011778 BC Unlimited Liability Co. | ||||||||
| 170,000 | 7.606%, 09/20/2030(h) | 170,273 | ||||||
| Air Methods Corp. | ||||||||
| 14,404 | 0.000%, 04/22/2024(h)(l) | 14,404 | ||||||
| AmWINS Group, Inc. | ||||||||
| 44,550 | 8.220%, 02/19/2028(h) | 44,731 | ||||||
| Applied Systems, Inc. | ||||||||
| 450,000 | 12.098%, 09/17/2027(h) | 453,656 | ||||||
| Astra Acquisition Corp. | ||||||||
| 266,783 | 10.860%, 10/25/2028(h) | 173,965 | ||||||
| 1,069,743 | 14.485%, 10/25/2029(h) | 518,825 | ||||||
| Asurion LLC | ||||||||
| 160,000 | 10.720%, 01/31/2028(h) | 152,933 | ||||||
| Atlas Purchaser, Inc. | ||||||||
| 375,476 | 10.877%, 05/08/2028(h) | 224,191 | ||||||
The accompanying notes are an integral part of these financial statements.
| 38 | Litman Gregory Funds Trust | |||||
Table of Contents
iMGP Alternative Strategies Fund
CONSOLIDATED SCHEDULE OF INVESTMENTS IN SECURITIES at December 31, 2023 (Continued)
| Principal Amount^ | Value | |||||||
BANK LOANS (CONTINUED) | ||||||||
| Aveanna Healthcare LLC | ||||||||
| $ 284,530 | 12.538%, 12/10/2029(h) | $ | 211,501 | |||||
| Bausch & Lomb Corp. | ||||||||
| 460,845 | 9.356%, 09/29/2028(h) | 461,421 | ||||||
| Blackhawk Network Holdings, Inc. | ||||||||
| 125,000 | 12.462%, 06/15/2026(h) | 123,750 | ||||||
| Boxer Parent Co., Inc. | ||||||||
| 240,000 | 0.000%, 12/29/2028(k) | 242,070 | ||||||
| Bright Bidco BV | ||||||||
| 135,884 | 14.390%, 10/31/2027(f)(h) | 48,353 | ||||||
| BYJU’s Alpha, Inc. | ||||||||
| 380,875 | 15.500%, 11/24/2026(h) | 139,337 | ||||||
| Carnival Corp. | ||||||||
| 180,544 | 8.357%, 08/08/2027(h) | 181,221 | ||||||
| 514,484 | 8.720%, 10/18/2028(h) | 515,986 | ||||||
| CBI STS de LLC | ||||||||
| 105,551 | 10.406%, 12/31/2026(h) | 102,912 | ||||||
| 216,985 | 13.142%, 12/31/2026(h) | 211,561 | ||||||
| Cengage Learning, Inc. | ||||||||
| 395,888 | 10.406%, 07/14/2026(h) | 397,643 | ||||||
| Constant Contact, Inc. | ||||||||
| 875,000 | 13.413%, 02/12/2029(h) | 765,625 | ||||||
| Cornerstone OnDemand, Inc. | ||||||||
| 23,698 | 9.220%, 10/16/2028(h) | 22,988 | ||||||
| Cyxtera DC Holdings, Inc. | ||||||||
| 458,865 | 0.000%, 05/01/2024(h)(l) | 291,960 | ||||||
| DCert Buyer, Inc. | ||||||||
| 485,000 | 12.356%, 02/19/2029(h) | 443,775 | ||||||
| DG Investment Intermediate Holdings 2, Inc. | ||||||||
| 420,000 | 12.220%, 03/30/2029(h) | 380,799 | ||||||
| Farfetch U.S. Holdings, Inc. | ||||||||
| 334,156 | 11.666%, 10/20/2027(h) | 319,677 | ||||||
| GTCR W Merger Sub LLC | ||||||||
| 515,000 | 0.000%, 09/20/2030(k) | 517,897 | ||||||
| Gulf Finance LLC | ||||||||
| 284,407 | 12.631%, 08/25/2026(h) | 285,118 | ||||||
| Hub International Ltd. | ||||||||
| 95,569 | 9.610%, 06/20/2030(h) | 96,100 | ||||||
| Lealand Finance Co. B.V. | ||||||||
| 475,575 | 0.500%, 06/28/2024(h) | 475,575 | ||||||
| Principal Amount^ | Value | |||||||
| Lealand Finance Co. BV | ||||||||
| $ 51,245 | 8.470%, 06/28/2024(h) | $ | 35,615 | |||||
| 727,579 | 0.000%, 06/30/2027(k) | 458,375 | ||||||
| Lealand Finance Company B.V. | ||||||||
| 1,338,413 | 6.470%, 06/30/2025(f)(h) | 559,905 | ||||||
| 75,060 | 6.470%, 06/30/2025(h) | 31,400 | ||||||
| LifePoint Health, Inc. | ||||||||
| 300,000 | 11.168%, 11/16/2028(h) | 299,663 | ||||||
| LSF9 Atlantis Holdings LLC | ||||||||
| 226,625 | 12.598%, 03/31/2029(h) | 221,809 | ||||||
| MH Sub I LLC | ||||||||
| 274,530 | 9.606%, 05/03/2028(h) | 270,412 | ||||||
| Minotaur Acquisition, Inc. | ||||||||
| 447,152 | 10.206%, 03/27/2026(h) | 447,829 | ||||||
| Olympus Water U.S. Holding Corp. | ||||||||
| 109,725 | 10.348%, 11/09/2028(h) | 110,502 | ||||||
| Open Text Corp. | ||||||||
| 126,564 | 8.206%, 01/31/2030(h) | 127,007 | ||||||
| Playtika Holding Corp. | ||||||||
| 326,930 | 8.220%, 03/13/2028(h) | 327,186 | ||||||
| Rand Parent LLC | ||||||||
| 164,253 | 9.598%, 03/17/2030(h) | 163,945 | ||||||
| Riverbed Technology, Inc. | ||||||||
| 229,990 | 7.848%, 07/01/2028(h) | 158,693 | ||||||
| Star Parent, Inc. | ||||||||
| 277,606 | 9.348%, 09/27/2030(h) | 275,023 | ||||||
| Summit Materials LLC | ||||||||
| 220,000 | 0.000%, 11/30/2028(k) | 220,964 | ||||||
| Uber Technologies, Inc. | ||||||||
| 285,062 | 8.135%, 03/03/2030(h) | 286,221 | ||||||
| UKG, Inc. | ||||||||
| 765,000 | 10.764%, 05/03/2027(h) | 767,938 | ||||||
| Viad Corp. | ||||||||
| 304,950 | 10.470%, 07/30/2028(h) | 304,569 | ||||||
| Vision Solutions, Inc. | ||||||||
| 23,697 | 9.640%, 04/24/2028(h) | 23,555 | ||||||
| Waterbridge Midstream Operating LLC | ||||||||
| 468,887 | 11.390%, 06/22/2026(h) | 470,179 | ||||||
| Ziggo BV | ||||||||
| 490,000 (EUR) | 6.928%, 01/31/2029(h) | 529,166 | ||||||
|
| |||||||
| | TOTAL BANK LOANS | 14,078,203 | ||||||
|
| |||||||
The accompanying notes are an integral part of these financial statements.
| Schedule of Investments | 39 | |||||
Table of Contents
iMGP Alternative Strategies Fund
CONSOLIDATED SCHEDULE OF INVESTMENTS IN SECURITIES at December 31, 2023 (Continued)
| Principal Amount^ | Value | |||||||
CONVERTIBLE BONDS: 1.4% | ||||||||
| Communications: 0.7% | ||||||||
| Delivery Hero SE | ||||||||
| 1,400,000 (EUR) | 1.000%, 01/23/2027 | $ | 1,229,098 | |||||
| 100,000 (EUR) | Series A | 93,740 | ||||||
| DISH Network Corp. | ||||||||
| 305,000 | 0.000%, 12/15/2025(d) | 190,625 | ||||||
| 2,525,000 | 3.375%, 08/15/2026 | 1,350,875 | ||||||
| Etsy, Inc. | ||||||||
| 70,000 | 0.125%, 09/01/2027 | 59,892 | ||||||
| 190,000 | 0.250%, 06/15/2028 | 152,589 | ||||||
| Spotify USA, Inc. | ||||||||
| 175,000 | 0.000%, 03/15/2026(d) | 154,437 | ||||||
| Uber Technologies, Inc. | ||||||||
| 300,000 | 0.000%, 12/15/2025(d) | 306,558 | ||||||
| Wayfair, Inc. | ||||||||
| 1,362,000 | 0.625%, 10/01/2025 | 1,239,420 | ||||||
| 42,000 | 1.000%, 08/15/2026 | 36,876 | ||||||
| Zillow Group, Inc. | ||||||||
| 27,000 | 2.750%, 05/15/2025 | 29,803 | ||||||
| 269,000 | 1.375%, 09/01/2026 | 369,337 | ||||||
|
| |||||||
| 5,213,250 | ||||||||
|
| |||||||
| Consumer, Cyclical: 0.2% | ||||||||
| Cineplex, Inc. | ||||||||
| 1,041,000 (CAD) | 5.750%, 09/30/2025(b) | 778,008 | ||||||
| NCL Corp. Ltd. | ||||||||
| 190,000 | 1.125%, 02/15/2027 | 174,439 | ||||||
| Penn Entertainment, Inc. | ||||||||
| 60,000 | 2.750%, 05/15/2026 | 78,000 | ||||||
| Southwest Airlines Co. | ||||||||
| 540,000 | 1.250%, 05/01/2025 | 547,695 | ||||||
|
| |||||||
| 1,578,142 | ||||||||
|
| |||||||
| Consumer, Non-cyclical: 0.4% | ||||||||
| BioMarin Pharmaceutical, Inc. | ||||||||
| 850,000 | 1.250%, 05/15/2027 | 877,115 | ||||||
| Envista Holdings Corp. | ||||||||
| 280,000 | 1.750%, 08/15/2028(b) | 256,200 | ||||||
| Guardant Health, Inc. | ||||||||
| 95,000 | 0.000%, 11/15/2027(d) | 66,975 | ||||||
| Livongo Health, Inc. | ||||||||
| 110,000 | 0.875%, 06/01/2025 | 102,906 | ||||||
| Teladoc Health, Inc. | ||||||||
| 565,000 | 1.250%, 06/01/2027 | 467,199 | ||||||
| UpHealth, Inc. | ||||||||
| 469,000 | 14.400%, 12/15/2025(b)(h)(l) | 417,410 | ||||||
| 533,000 | 6.250%, 06/15/2026(b)(l) | 397,085 | ||||||
|
| |||||||
| 2,584,890 | ||||||||
|
| |||||||
| Financial: 0.0% | ||||||||
| Sunac China Holdings Ltd. | ||||||||
| 153,148 | 1.000%, 09/30/2032(b) | 12,252 | ||||||
|
| |||||||
| Technology: 0.1% | ||||||||
| Splunk, Inc. | ||||||||
| 105,000 | 1.125%, 06/15/2027 | 102,217 | ||||||
| Unity Software, Inc. | ||||||||
| 310,000 | 0.000%, 11/15/2026*(d) | 259,160 | ||||||
| Principal Amount^ | Value | |||||||
| Technology (continued) | ||||||||
| Wolfspeed, Inc. | ||||||||
| $60,000 | 0.250%, 02/15/2028 | $ | 40,710 | |||||
| 115,000 | 1.875%, 12/01/2029 | 78,804 | ||||||
|
| |||||||
| 480,891 | ||||||||
|
| |||||||
| | TOTAL CONVERTIBLE BONDS | 9,869,425 | ||||||
|
| |||||||
CORPORATE BONDS: 19.7% | ||||||||
| Basic Materials: 2.0% | ||||||||
| ArcelorMittal SA | ||||||||
| 330,000 | 6.800%, 11/29/2032 | 357,726 | ||||||
| Aris Mining Corp. | ||||||||
| 400,000 | 6.875%, 08/09/2026 | 347,794 | ||||||
| ASP Unifrax Holdings, Inc. | ||||||||
| 60,000 | 7.500%, 09/30/2029(b) | 30,602 | ||||||
| Braskem Idesa SAPI | ||||||||
| 450,000 | 6.990%, 02/20/2032(b) | 254,614 | ||||||
| Braskem Netherlands Finance BV | ||||||||
| 360,000 | 4.500%, 01/31/2030(b) | 279,906 | ||||||
| 400,000 | 8.500%, 01/23/2081(i) | 344,376 | ||||||
| CAP SA | ||||||||
| 300,000 | 3.900%, 04/27/2031 | 233,700 | ||||||
| Celanese U.S. Holdings LLC | ||||||||
| 445,000 | 6.700%, 11/15/2033 | 484,748 | ||||||
| Eldorado Gold Corp. | ||||||||
| 942,000 | 6.250%, 09/01/2029(b) | 890,008 | ||||||
| First Quantum Minerals Ltd. | ||||||||
| 1,235,000 | 6.875%, 03/01/2026(b) | 1,111,796 | ||||||
| FMG Resources August 2006 Pty. Ltd. | ||||||||
| 170,000 | 4.375%, 04/01/2031(b) | 155,904 | ||||||
| 660,000 | 6.125%, 04/15/2032(b) | 665,971 | ||||||
| Glencore Funding LLC | ||||||||
| 400,000 | 6.125%, 10/06/2028(b) | 419,766 | ||||||
| 385,000 | 6.375%, 10/06/2030(b) | 414,278 | ||||||
| 1,800,000 | 6.500%, 10/06/2033(b) | 1,967,813 | ||||||
| IAMGOLD Corp. | ||||||||
| 100,000 | 5.750%, 10/15/2028 | 86,129 | ||||||
| Illuminate Buyer LLC/Illuminate Holdings IV, Inc. | ||||||||
| 130,000 | 9.000%, 07/01/2028(b) | 124,462 | ||||||
| OCP SA | ||||||||
| 650,000 | 5.125%, 06/23/2051 | 495,091 | ||||||
| RPM International, Inc. | ||||||||
| 610,000 | 2.950%, 01/15/2032 | 515,835 | ||||||
| Sasol Financing USA LLC | ||||||||
| 200,000 | 5.500%, 03/18/2031 | 168,663 | ||||||
| Southern Copper Corp. | ||||||||
| 900,000 | 7.500%, 07/27/2035 | 1,046,038 | ||||||
| Unigel Luxembourg SA | ||||||||
| 450,000 | 8.750%, 10/01/2026(l) | 123,841 | ||||||
| UPL Corp. Ltd. | ||||||||
| 460,000 | 5.250%, 02/27/2025(e)(i) | 349,600 | ||||||
| Valvoline, Inc. | ||||||||
| 1,278,000 | 4.250%, 02/15/2030(b) | 1,269,404 | ||||||
| 1,080,000 | 3.625%, 06/15/2031(b) | 923,659 | ||||||
| Vedanta Resources Finance II PLC | ||||||||
| 200,000 | 9.250%, 04/23/2026 | 122,854 | ||||||
The accompanying notes are an integral part of these financial statements.
| 40 | Litman Gregory Funds Trust | |||||
Table of Contents
iMGP Alternative Strategies Fund
CONSOLIDATED SCHEDULE OF INVESTMENTS IN SECURITIES at December 31, 2023 (Continued)
| Principal Amount^ | Value | |||||||
CORPORATE BONDS (CONTINUED) | ||||||||
| Basic Materials (continued) | ||||||||
| Vedanta Resources Ltd. | ||||||||
| $450,000 | 6.125%, 08/09/2024 | $ | 299,657 | |||||
|
| |||||||
| 13,484,235 | ||||||||
|
| |||||||
| Communications: 2.3% | ||||||||
| Alibaba Group Holding Ltd. | ||||||||
| 200,000 | 3.250%, 02/09/2061 | 126,529 | ||||||
| AMC Networks, Inc. | ||||||||
| 661,000 | 4.250%, 02/15/2029 | 506,656 | ||||||
| CCO Holdings LLC/CCO Holdings Capital Corp. | ||||||||
| 1,285,000 | 5.125%, 05/01/2027(b) | 1,240,853 | ||||||
| Charter Communications Operating LLC/Charter Communications Operating Capital | ||||||||
| 145,000 | 2.800%, 04/01/2031 | 122,612 | ||||||
| 55,000 | 2.300%, 02/01/2032 | 43,881 | ||||||
| 70,000 | 4.400%, 04/01/2033 | 64,747 | ||||||
| 1,130,000 | 4.400%, 12/01/2061 | 785,430 | ||||||
| Cogent Communications Group, Inc. | ||||||||
| 50,000 | 7.000%, 06/15/2027(b) | 50,297 | ||||||
| CommScope Technologies LLC | ||||||||
| 380,000 | 5.000%, 03/15/2027(b) | 158,530 | ||||||
| CommScope, Inc. | ||||||||
| 445,000 | 4.750%, 09/01/2029(b) | 299,194 | ||||||
| CSC Holdings LLC | ||||||||
| 200,000 | 4.125%, 12/01/2030(b) | 152,384 | ||||||
| 4,975,000 | 4.625%, 12/01/2030(b) | 3,003,398 | ||||||
| 625,000 | 3.375%, 02/15/2031(b) | 456,859 | ||||||
| 400,000 | 4.500%, 11/15/2031(b) | 302,918 | ||||||
| CT Trust | ||||||||
| 200,000 | 5.125%, 02/03/2032 | 174,978 | ||||||
| DISH DBS Corp. | ||||||||
| 1,755,000 | 5.250%, 12/01/2026(b) | 1,506,887 | ||||||
| 685,000 | 5.750%, 12/01/2028(b) | 547,640 | ||||||
| 655,000 | 5.125%, 06/01/2029 | 338,258 | ||||||
| Embarq Corp. | ||||||||
| 260,000 | 7.995%, 06/01/2036 | 160,869 | ||||||
| FactSet Research Systems, Inc. | ||||||||
| 362,000 | 3.450%, 03/01/2032 | 324,962 | ||||||
| Go Daddy Operating Co. LLC/GD Finance Co., Inc. | ||||||||
| 468,000 | 3.500%, 03/01/2029(b) | 426,082 | ||||||
| iHeartCommunications, Inc. | ||||||||
| 350,000 | 5.250%, 08/15/2027(b) | 278,440 | ||||||
| 220,000 | 4.750%, 01/15/2028(b) | 169,453 | ||||||
| Koninklijke KPN NV | ||||||||
| 200,000 | 8.375%, 10/01/2030 | 236,498 | ||||||
| McGraw-Hill Education, Inc. | ||||||||
| 335,000 | 5.750%, 08/01/2028(b) | 323,365 | ||||||
| Millicom International Cellular SA | ||||||||
| 200,000 | 4.500%, 04/27/2031 | 166,348 | ||||||
| Motorola Solutions, Inc. | ||||||||
| 850,000 | 2.750%, 05/24/2031 | 728,199 | ||||||
| 617,000 | 5.600%, 06/01/2032 | 637,143 | ||||||
| Newfold Digital Holdings Group, Inc. | ||||||||
| 55,000 | 6.000%, 02/15/2029(b) | 41,609 | ||||||
| Principal Amount^ | Value | |||||||
| Communications (continued) | ||||||||
| News Corp. | ||||||||
| $ 300,000 | 3.875%, 05/15/2029(b) | $ | 276,273 | |||||
| Oi SA | ||||||||
| 36,684 | 14.000%, 09/07/2024(b)(f) | 36,684 | ||||||
| 550,000 | 10.000%, 07/27/2025(f)(i)(l) | 27,500 | ||||||
| Scripps Escrow II, Inc. | ||||||||
| 10,000 | 5.375%, 01/15/2031(b) | 7,351 | ||||||
| Telefonica Emisiones SA | ||||||||
| 300,000 | 7.045%, 06/20/2036 | 340,421 | ||||||
| Uber Technologies, Inc. | ||||||||
| 1,135,000 | 4.500%, 08/15/2029(b) | 1,084,694 | ||||||
| VeriSign, Inc. | ||||||||
| 672,000 | 2.700%, 06/15/2031 | 577,478 | ||||||
| VTR Finance NV | ||||||||
| 500,000 | 6.375%, 07/15/2028 | 130,906 | ||||||
|
| |||||||
| 15,856,326 | ||||||||
|
| |||||||
| Consumer, Cyclical: 3.4% | ||||||||
| Allison Transmission, Inc. | ||||||||
| 1,454,000 | 3.750%, 01/30/2031(b) | 1,286,409 | ||||||
| Beazer Homes USA, Inc. | ||||||||
| 900,000 | 7.250%, 10/15/2029 | 909,202 | ||||||
| Brunswick Corp. | ||||||||
| 60,000 | 4.400%, 09/15/2032 | 54,832 | ||||||
| Carnival Corp. | ||||||||
| 170,000 | 7.625%, 03/01/2026(b) | 173,186 | ||||||
| 540,000 | 5.750%, 03/01/2027(b) | 527,714 | ||||||
| 635,000 | 6.000%, 05/01/2029(b) | 611,296 | ||||||
| Carrols Restaurant Group, Inc. | ||||||||
| 330,000 | 5.875%, 07/01/2029(b) | 291,835 | ||||||
| Churchill Downs, Inc. | ||||||||
| 478,000 | 4.750%, 01/15/2028(b) | 458,652 | ||||||
| Dealer Tire LLC/DT Issuer LLC | ||||||||
| 140,000 | 8.000%, 02/01/2028(b) | 138,763 | ||||||
| FirstCash, Inc. | ||||||||
| 850,000 | 5.625%, 01/01/2030(b) | 814,971 | ||||||
| Forestar Group, Inc. | ||||||||
| 1,112,000 | 3.850%, 05/15/2026(b) | 1,058,463 | ||||||
| Gap, Inc. | ||||||||
| 550,000 | 3.875%, 10/01/2031(b) | 453,243 | ||||||
| General Motors Co. | ||||||||
| 620,000 | 5.400%, 04/01/2048 | 569,355 | ||||||
| 100,000 | 5.950%, 04/01/2049 | 98,466 | ||||||
| General Motors Financial Co., Inc. | ||||||||
| 310,000 | Series A | 275,745 | ||||||
| 255,000 | Series B | 232,996 | ||||||
| Genm Capital Labuan Ltd. | ||||||||
| 440,000 | 3.882%, 04/19/2031(b) | 376,406 | ||||||
| Hilton Domestic Operating Co., Inc. | ||||||||
| 1,913,000 | 3.625%, 02/15/2032(b) | 1,672,410 | ||||||
| Hilton Grand Vacations Borrower Escrow LLC/Hilton Grand Vacations Borrower Escrow, Inc. | ||||||||
| 160,000 | 4.875%, 07/01/2031(b) | 141,782 | ||||||
The accompanying notes are an integral part of these financial statements.
| Schedule of Investments | 41 | |||||
Table of Contents
iMGP Alternative Strategies Fund
CONSOLIDATED SCHEDULE OF INVESTMENTS IN SECURITIES at December 31, 2023 (Continued)
| Principal Amount^ | Value | |||||||
CORPORATE BONDS (CONTINUED) | ||||||||
| Consumer, Cyclical (continued) | ||||||||
| Installed Building Products, Inc. | ||||||||
| $ 410,000 | 5.750%, 02/01/2028(b) | $ | 399,961 | |||||
| LGI Homes, Inc. | ||||||||
| 161,000 | 8.750%, 12/15/2028(b) | 171,364 | ||||||
| 290,000 | 4.000%, 07/15/2029(b) | 250,467 | ||||||
| Light & Wonder International, Inc. | ||||||||
| 95,000 | 7.000%, 05/15/2028(b) | 96,043 | ||||||
| 119,000 | 7.500%, 09/01/2031(b) | 124,181 | ||||||
| Lithia Motors, Inc. | ||||||||
| 120,000 | 3.875%, 06/01/2029(b) | 108,503 | ||||||
| M/I Homes, Inc. | ||||||||
| 610,000 | 4.950%, 02/01/2028 | 587,576 | ||||||
| 710,000 | 3.950%, 02/15/2030 | 632,610 | ||||||
| Marriott Ownership Resorts, Inc. | ||||||||
| 65,000 | 4.500%, 06/15/2029(b) | 57,353 | ||||||
| MDC Holdings, Inc. | ||||||||
| 530,000 | 2.500%, 01/15/2031 | 436,404 | ||||||
| Murphy Oil USA, Inc. | ||||||||
| 600,000 | 3.750%, 02/15/2031(b) | 522,740 | ||||||
| NCL Corp. Ltd. | ||||||||
| 430,000 | 5.875%, 03/15/2026(b) | 420,100 | ||||||
| 230,000 | 8.125%, 01/15/2029(b) | 240,321 | ||||||
| NCL Finance Ltd. | ||||||||
| 115,000 | 6.125%, 03/15/2028(b) | 109,944 | ||||||
| NVR, Inc. | ||||||||
| 312,000 | 3.000%, 05/15/2030 | 278,606 | ||||||
| Patrick Industries, Inc. | ||||||||
| 750,000 | 4.750%, 05/01/2029(b) | 685,020 | ||||||
| Premier Entertainment Sub LLC/Premier Entertainment Finance Corp. | ||||||||
| 65,000 | 5.875%, 09/01/2031(b) | 50,343 | ||||||
| PulteGroup, Inc. | ||||||||
| 230,000 | 6.375%, 05/15/2033 | 252,091 | ||||||
| 455,000 | 6.000%, 02/15/2035 | 479,712 | ||||||
| Steelcase, Inc. | ||||||||
| 670,000 | 5.125%, 01/18/2029 | 636,074 | ||||||
| Suburban Propane Partners LP/Suburban Energy Finance Corp. | ||||||||
| 830,000 | 5.000%, 06/01/2031(b) | 759,939 | ||||||
| SWF Escrow Issuer Corp. | ||||||||
| 70,000 | 6.500%, 10/01/2029(b) | 50,383 | ||||||
| Taylor Morrison Communities, Inc. | ||||||||
| 500,000 | 5.125%, 08/01/2030(b) | 484,238 | ||||||
| Tempur Sealy International, Inc. | ||||||||
| 900,000 | 3.875%, 10/15/2031(b) | 762,079 | ||||||
| TKC Holdings, Inc. | ||||||||
| 50,000 | 10.500%, 05/15/2029(b) | 45,301 | ||||||
| Toll Brothers Finance Corp. | ||||||||
| 160,000 | 3.800%, 11/01/2029 | 150,220 | ||||||
| Travel & Leisure Co. | ||||||||
| 260,000 | 4.500%, 12/01/2029(b) | 233,160 | ||||||
| 110,000 | 4.625%, 03/01/2030(b) | 98,510 | ||||||
| Tri Pointe Homes, Inc. | ||||||||
| 1,200,000 | 5.700%, 06/15/2028 | 1,188,606 | ||||||
| United Airlines Pass Through Trust | ||||||||
| 594,786 | Series 2019-2-B | 540,632 | ||||||
| Principal Amount^ | Value | |||||||
| Consumer, Cyclical (continued) | ||||||||
| Viking Cruises Ltd. | ||||||||
| $ 185,000 | 9.125%, 07/15/2031(b) | $ | 197,284 | |||||
| VOC Escrow Ltd. | ||||||||
| 190,000 | 5.000%, 02/15/2028(b) | 182,368 | ||||||
| Warnermedia Holdings, Inc. | ||||||||
| 440,000 | 4.279%, 03/15/2032 | 403,365 | ||||||
| Wheel Pros, Inc. | ||||||||
| 230,000 | 6.500%, 05/15/2029(b) | 70,438 | ||||||
| Yum! Brands, Inc. | ||||||||
| 1,179,000 | 4.750%, 01/15/2030(b) | 1,144,108 | ||||||
| 402,000 | 4.625%, 01/31/2032 | 376,491 | ||||||
| ZF North America Capital, Inc. | ||||||||
| 150,000 | 7.125%, 04/14/2030(b) | 159,740 | ||||||
|
| |||||||
| 23,532,001 | ||||||||
|
| |||||||
| Consumer, Non-cyclical: 1.8% | ||||||||
| Adani International Container Terminal Pvt Ltd. | ||||||||
| 177,500 | 3.000%, 02/16/2031 | 145,703 | ||||||
| Adani Ports & Special Economic Zone Ltd. | ||||||||
| 600,000 | 5.000%, 08/02/2041 | 443,793 | ||||||
| Bausch Health Cos., Inc. | ||||||||
| 955,000 | 4.875%, 06/01/2028(b) | 576,685 | ||||||
| Block Financial LLC | ||||||||
| 300,000 | 3.875%, 08/15/2030 | 274,867 | ||||||
| BRF SA | ||||||||
| 550,000 | 5.750%, 09/21/2050 | 411,328 | ||||||
| Camposol SA | ||||||||
| 200,000 | 6.000%, 02/03/2027 | 139,072 | ||||||
| Centene Corp. | ||||||||
| 115,000 | 4.625%, 12/15/2029 | 110,405 | ||||||
| 215,000 | 3.375%, 02/15/2030 | 193,084 | ||||||
| Central Garden & Pet Co. | ||||||||
| 150,000 | 4.125%, 04/30/2031(b) | 132,746 | ||||||
| Coruripe Netherlands BV | ||||||||
| 400,000 | 10.000%, 02/10/2027 | 307,500 | ||||||
| DaVita, Inc. | ||||||||
| 410,000 | 3.750%, 02/15/2031(b) | 337,329 | ||||||
| Deluxe Corp. | ||||||||
| 515,000 | 8.000%, 06/01/2029(b) | 456,178 | ||||||
| Encompass Health Corp. | ||||||||
| 340,000 | 4.750%, 02/01/2030 | 320,765 | ||||||
| 500,000 | 4.625%, 04/01/2031 | 460,703 | ||||||
| Endo Luxembourg Finance Co. I SARL/Endo U.S., Inc. | ||||||||
| 265,000 | 6.125%, 04/01/2029(b)(l) | 169,844 | ||||||
| Frigorifico Concepcion SA | ||||||||
| 400,000 | 7.700%, 07/21/2028 | 339,010 | ||||||
| JBS USA LUX SA/JBS USA Food Co./JBS USA Finance, Inc. | ||||||||
| 100,000 | 4.375%, 02/02/2052 | 74,565 | ||||||
| Kronos Acquisition Holdings, Inc./KIK Custom Products, Inc. | ||||||||
| 135,000 | 7.000%, 12/31/2027(b) | 129,072 | ||||||
| Lamb Weston Holdings, Inc. | ||||||||
| 641,000 | 4.375%, 01/31/2032(b) | 585,723 | ||||||
| MARB BondCo PLC | ||||||||
| 200,000 | 3.950%, 01/29/2031 | 162,635 | ||||||
| Philip Morris International, Inc. | ||||||||
| 166,000 | 1.750%, 11/01/2030 | 137,143 | ||||||
| Post Holdings, Inc. | ||||||||
| 957,000 | 4.500%, 09/15/2031(b) | 859,506 | ||||||
The accompanying notes are an integral part of these financial statements.
| 42 | Litman Gregory Funds Trust | |||||
Table of Contents
iMGP Alternative Strategies Fund
CONSOLIDATED SCHEDULE OF INVESTMENTS IN SECURITIES at December 31, 2023 (Continued)
| Principal Amount^ | Value | |||||||
CORPORATE BONDS (CONTINUED) | ||||||||
| Consumer, Non-cyclical (continued) | ||||||||
| Pyxus Holdings, Inc. | ||||||||
| $ 155,100 | 8.500%, 12/31/2027(b) | $ | 99,264 | |||||
| Quanta Services, Inc. | ||||||||
| 100,000 | 2.900%, 10/01/2030 | 88,047 | ||||||
| Radiology Partners, Inc. | ||||||||
| 40,000 | 9.250%, 02/01/2028(b) | 20,558 | ||||||
| RELX Capital, Inc. | ||||||||
| 250,000 | 4.750%, 05/20/2032 | 253,186 | ||||||
| Service Corp. International | ||||||||
| 864,000 | 4.000%, 05/15/2031 | 774,619 | ||||||
| Teva Pharmaceutical Finance Netherlands II BV | ||||||||
| 215,000 (EUR) | 7.375%, 09/15/2029 | 260,865 | ||||||
| 1,700,000 (EUR) | 4.375%, 05/09/2030 | 1,770,317 | ||||||
| 181,000 (EUR) | 7.875%, 09/15/2031 | 227,446 | ||||||
| Teva Pharmaceutical Finance Netherlands III BV | ||||||||
| 590,000 | 3.150%, 10/01/2026 | 546,747 | ||||||
| 1,670,000 | 4.100%, 10/01/2046 | 1,132,789 | ||||||
| Triton Water Holdings, Inc. | ||||||||
| 130,000 | 6.250%, 04/01/2029(b) | 113,382 | ||||||
|
| |||||||
| 12,054,876 | ||||||||
|
| |||||||
| Energy: 2.5% | ||||||||
| AI Candelaria Spain SA | ||||||||
| 250,000 | 5.750%, 06/15/2033 | 194,110 | ||||||
| 250,000 | 5.750%, 06/15/2033(b) | 194,110 | ||||||
| Calumet Specialty Products Partners LP/Calumet Finance Corp. | ||||||||
| 369,000 | 9.750%, 07/15/2028(b) | 369,376 | ||||||
| Canacol Energy Ltd. | ||||||||
| 200,000 | 5.750%, 11/24/2028 | 146,047 | ||||||
| CNX Resources Corp. | ||||||||
| 190,000 | 7.375%, 01/15/2031(b) | 191,567 | ||||||
| Continental Resources, Inc. | ||||||||
| 1,190,000 | 5.750%, 01/15/2031(b) | 1,183,896 | ||||||
| 350,000 | 2.875%, 04/01/2032(b) | 284,674 | ||||||
| Delek Logistics Partners LP/Delek Logistics Finance Corp. | ||||||||
| 337,000 | 7.125%, 06/01/2028(b) | 317,811 | ||||||
| Ecopetrol SA | ||||||||
| 500,000 | 5.875%, 05/28/2045 | 395,463 | ||||||
| 250,000 | 5.875%, 11/02/2051 | 189,344 | ||||||
| Energean Israel Finance Ltd. | ||||||||
| 280,000 | 5.375%, 03/30/2028(b) | 246,762 | ||||||
| EnLink Midstream LLC | ||||||||
| 30,000 | 6.500%, 09/01/2030(b) | 30,654 | ||||||
| EnQuest PLC | ||||||||
| 560,000 | 11.625%, 11/01/2027(b) | 534,621 | ||||||
| Global Partners LP/GLP Finance Corp. | ||||||||
| 472,000 | 6.875%, 01/15/2029 | 457,605 | ||||||
| Gulfport Energy Corp. | ||||||||
| 9,976 | 8.000%, 05/17/2026 | 10,095 | ||||||
| Helix Energy Solutions Group, Inc. | ||||||||
| 202,000 | 9.750%, 03/01/2029(b) | 212,596 | ||||||
| Hess Midstream Operations LP | ||||||||
| 1,030,000 | 4.250%, 02/15/2030(b) | 948,785 | ||||||
| 700,000 | 5.500%, 10/15/2030(b) | 678,249 | ||||||
| Principal Amount^ | Value | |||||||
| Energy (continued) | ||||||||
| MC Brazil Downstream Trading SARL | ||||||||
| $ 478,976 | 7.250%, 06/30/2031 | $ | 375,967 | |||||
| MEG Energy Corp. | ||||||||
| 50,000 | 5.875%, 02/01/2029(b) | 48,638 | ||||||
| MPLX LP | ||||||||
| 350,000 | 5.000%, 03/01/2033 | 343,515 | ||||||
| NGL Energy Operating LLC/NGL Energy Finance Corp. | ||||||||
| 180,000 | 7.500%, 02/01/2026(b) | 181,950 | ||||||
| NuStar Logistics LP | ||||||||
| 650,000 | 6.375%, 10/01/2030 | 652,074 | ||||||
| Occidental Petroleum Corp. | ||||||||
| 40,000 | 8.875%, 07/15/2030 | 46,855 | ||||||
| 45,000 | 7.875%, 09/15/2031 | 51,248 | ||||||
| Ovintiv, Inc. | ||||||||
| 20,000 | 7.200%, 11/01/2031 | 21,780 | ||||||
| 15,000 | 7.375%, 11/01/2031 | 16,568 | ||||||
| 70,000 | 6.500%, 08/15/2034 | 74,286 | ||||||
| 145,000 | 6.625%, 08/15/2037 | 150,935 | ||||||
| 30,000 | 6.500%, 02/01/2038 | 31,082 | ||||||
| Parkland Corp. | ||||||||
| 1,879,000 | 4.625%, 05/01/2030(b) | 1,730,738 | ||||||
| PDC Energy, Inc. | ||||||||
| 2,558,000 | 5.750%, 05/15/2026 | 2,555,157 | ||||||
| Petroleos del Peru SA | ||||||||
| 600,000 | 5.625%, 06/19/2047 | 370,185 | ||||||
| Petroleos Mexicanos | ||||||||
| 400,000 | 6.375%, 01/23/2045 | 261,135 | ||||||
| 200,000 | 6.750%, 09/21/2047 | 131,305 | ||||||
| SierraCol Energy Andina LLC | ||||||||
| 200,000 | 6.000%, 06/15/2028(b) | 168,443 | ||||||
| 200,000 | 6.000%, 06/15/2028 | 168,443 | ||||||
| Sunoco LP/Sunoco Finance Corp. | ||||||||
| 848,000 | 4.500%, 05/15/2029 | 788,093 | ||||||
| 602,000 | 4.500%, 04/30/2030 | 558,025 | ||||||
| Targa Resources Corp. | ||||||||
| 375,000 | 6.500%, 03/30/2034 | 406,143 | ||||||
| Targa Resources Partners LP/Targa Resources Partners Finance Corp. | ||||||||
| 250,000 | 4.875%, 02/01/2031 | 242,891 | ||||||
| UEP Penonome II SA | ||||||||
| 352,170 | 6.500%, 10/01/2038(b) | 268,643 | ||||||
| Venture Global Calcasieu Pass LLC | ||||||||
| 145,000 | 4.125%, 08/15/2031(b) | 127,917 | ||||||
| 275,000 | 3.875%, 11/01/2033(b) | 233,625 | ||||||
| Venture Global LNG, Inc. | ||||||||
| 25,000 | 8.375%, 06/01/2031(b) | 25,043 | ||||||
| Viper Energy, Inc. | ||||||||
| 80,000 | 7.375%, 11/01/2031(b) | 82,890 | ||||||
| YPF SA | ||||||||
| 560,000 | 7.000%, 12/15/2047 | 423,616 | ||||||
|
| |||||||
| 17,122,955 | ||||||||
|
| |||||||
| Financial: 4.0% | ||||||||
| AerCap Ireland Capital DAC/AerCap Global Aviation Trust | ||||||||
| 215,000 | 6.150%, 09/30/2030 | 226,968 | ||||||
| 150,000 | 3.400%, 10/29/2033 | 128,894 | ||||||
| Agile Group Holdings Ltd. | ||||||||
| 200,000 | 5.500%, 04/21/2025 | 30,078 | ||||||
| 400,000 | 6.050%, 10/13/2025 | 50,000 | ||||||
The accompanying notes are an integral part of these financial statements.
| Schedule of Investments | 43 | |||||
Table of Contents
iMGP Alternative Strategies Fund
CONSOLIDATED SCHEDULE OF INVESTMENTS IN SECURITIES at December 31, 2023 (Continued)
| Principal Amount^ | Value | |||||||
CORPORATE BONDS (CONTINUED) | ||||||||
| Financial (continued) | ||||||||
| Aircastle Ltd. | ||||||||
| $ 210,000 | 6.500%, 07/18/2028(b) | $ | 214,571 | |||||
| 85,000 | Series A | 73,296 | ||||||
| Ally Financial, Inc. | ||||||||
| 725,000 | Series C | 493,819 | ||||||
| Alpha Holding SA de CV | ||||||||
| 600,000 | 9.000%, 02/10/2025 | 0 | ||||||
| 600,000 | 9.000%, 02/10/2025 | 0 | ||||||
| 565,639 | 9.000%, 02/10/2025(b)(l) | 8,485 | ||||||
| Antares Holdings LP | ||||||||
| 255,000 | 3.950%, 07/15/2026(b) | 237,449 | ||||||
| 450,000 | 2.750%, 01/15/2027(b) | 399,259 | ||||||
| 680,000 | 3.750%, 07/15/2027(b) | 613,637 | ||||||
| Ares Capital Corp. | ||||||||
| 350,000 | 7.000%, 01/15/2027 | 360,397 | ||||||
| 1,844,000 | 2.875%, 06/15/2028 | 1,637,103 | ||||||
| 660,000 | 3.200%, 11/15/2031 | 553,624 | ||||||
| Bain Capital Specialty Finance, Inc. | ||||||||
| 210,000 | 2.550%, 10/13/2026 | 189,632 | ||||||
| Banco Davivienda SA | ||||||||
| 200,000 | 6.650%, 04/22/2031(b)(e)(i) | 143,250 | ||||||
| 300,000 | 6.650%, 04/22/2031(e)(i) | 214,875 | ||||||
| Banco do Brasil SA | ||||||||
| 500,000 | 6.250%, 04/15/2024(e)(i) | 489,115 | ||||||
| Banco GNB Sudameris SA | ||||||||
| 200,000 | 7.500%, 04/16/2031(i) | 167,870 | ||||||
| 350,000 | 7.500%, 04/16/2031(b)(i) | 293,773 | ||||||
| Banco Mercantil del Norte SA | ||||||||
| 350,000 | 6.625%, 01/24/2032(b)(e)(i) | 298,200 | ||||||
| Bank of America Corp. | ||||||||
| 10,000 | 3.846%, 03/08/2037(i) | 8,802 | ||||||
| Barclays PLC | ||||||||
| 660,000 | 4.375%, 03/15/2028(e)(i) | 514,680 | ||||||
| 740,000 | 3.564%, 09/23/2035(i) | 636,051 | ||||||
| Central China Real Estate Ltd. | ||||||||
| 205,000 | 7.750%, 05/24/2024(l) | 9,973 | ||||||
| 400,000 | 7.250%, 08/13/2024(l) | 19,136 | ||||||
| 205,000 | 7.500%, 07/14/2025(l) | 9,738 | ||||||
| 230,000 | 7.650%, 08/27/2025(l) | 10,950 | ||||||
| CFLD Cayman Investment Ltd. | ||||||||
| 43,250 | 0.000%, 01/31/2031(b)(d) | 795 | ||||||
| 426,400 | 2.500%, 01/31/2031(b) | 12,579 | ||||||
| 351,200 | 2.500%, 01/31/2031(b) | 28,914 | ||||||
| Principal Amount^ | Value | |||||||
| Financial (continued) | ||||||||
| Charles Schwab Corp. | ||||||||
| $ 19,000 | Series F | $ | 16,024 | |||||
| 136,000 | Series I | 119,997 | ||||||
| China Aoyuan Group Ltd. | ||||||||
| 200,000 | 6.200%, 03/24/2026 | 4,500 | ||||||
| China Evergrande Group | ||||||||
| 200,000 | 9.500%, 04/11/2022(l) | 3,586 | ||||||
| 200,000 | 8.750%, 06/28/2025(l) | 3,000 | ||||||
| CIFI Holdings Group Co. Ltd. | ||||||||
| 200,000 | 4.450%, 08/17/2026(l) | 13,750 | ||||||
| Deutsche Bank AG | ||||||||
| 885,000 | 3.729%, 01/14/2032(i) | 744,870 | ||||||
| 200,000 | 3.742%, 01/07/2033(i) | 164,462 | ||||||
| Easy Tactic Ltd. | ||||||||
| 443,631 | 7.500%, 07/11/2027(f) | 21,773 | ||||||
| Enstar Group Ltd. | ||||||||
| 692,000 | 3.100%, 09/01/2031 | 566,091 | ||||||
| EPR Properties | ||||||||
| 770,000 | 3.600%, 11/15/2031 | 640,445 | ||||||
| Fantasia Holdings Group Co. Ltd. | ||||||||
| 200,000 | 11.875%, 06/01/2023(l) | 6,000 | ||||||
| FS KKR Capital Corp. | ||||||||
| 920,000 | 3.125%, 10/12/2028 | 803,389 | ||||||
| Global Atlantic Fin Co. | ||||||||
| 195,000 | 4.400%, 10/15/2029(b) | 179,944 | ||||||
| GLP Capital LP/GLP Financing II, Inc. | ||||||||
| 835,000 | 3.250%, 01/15/2032 | 705,798 | ||||||
| 40,000 | 6.750%, 12/01/2033 | 43,197 | ||||||
| goeasy Ltd. | ||||||||
| 130,000 | 9.250%, 12/01/2028(b) | 138,952 | ||||||
| Golub Capital BDC, Inc. | ||||||||
| 320,000 | 2.500%, 08/24/2026 | 290,334 | ||||||
| Howard Hughes Corp. | ||||||||
| 567,000 | 4.375%, 02/01/2031(b) | 492,743 | ||||||
| Icahn Enterprises LP/Icahn Enterprises Finance Corp. | ||||||||
| 220,000 | 6.375%, 12/15/2025 | 216,180 | ||||||
| 240,000 | 5.250%, 05/15/2027 | 216,215 | ||||||
| Intesa Sanpaolo SpA | ||||||||
| 200,000 | 7.200%, 11/28/2033(b) | 213,430 | ||||||
| Iron Mountain Information Management Services, Inc. | ||||||||
| 1,142,000 | 5.000%, 07/15/2032(b) | 1,046,083 | ||||||
| Iron Mountain, Inc. | ||||||||
| 738,000 | 4.500%, 02/15/2031(b) | 674,232 | ||||||
| Kaisa Group Holdings Ltd. | ||||||||
| 1,005,000 | 9.375%, 06/30/2024(l) | 36,361 | ||||||
| 200,000 | 10.500%, 01/15/2025 | 7,292 | ||||||
| 1,000,000 | 11.250%, 04/16/2025(l) | 32,500 | ||||||
| 200,000 | 9.950%, 07/23/2025(l) | 6,924 | ||||||
| 600,000 | 11.700%, 11/11/2025(l) | 21,630 | ||||||
| 400,000 | 11.650%, 06/01/2026(l) | 13,500 | ||||||
| Kawasan Industri Jababeka Tbk. PT | ||||||||
| 280,000 | 7.500%, 12/15/2027(b)(g) | 232,400 | ||||||
The accompanying notes are an integral part of these financial statements.
| 44 | Litman Gregory Funds Trust | |||||
Table of Contents
iMGP Alternative Strategies Fund
CONSOLIDATED SCHEDULE OF INVESTMENTS IN SECURITIES at December 31, 2023 (Continued)
| Principal Amount^ | Value | |||||||
CORPORATE BONDS (CONTINUED) | ||||||||
| Financial (continued) | ||||||||
| KWG Group Holdings Ltd. | ||||||||
| $ 210,000 | 6.300%, 02/13/2026(l) | $ | 13,898 | |||||
| Logan Group Co. Ltd. | ||||||||
| 200,000 | 4.250%, 07/12/2025(l) | 14,000 | ||||||
| Main Street Capital Corp. | ||||||||
| 174,000 | 3.000%, 07/14/2026 | 159,512 | ||||||
| Mexarrend SAPI de CV | ||||||||
| 300,000 | 10.250%, 07/24/2024(b) | 66,825 | ||||||
| MGIC Investment Corp. | ||||||||
| 250,000 | 5.250%, 08/15/2028 | 243,596 | ||||||
| National Health Investors, Inc. | ||||||||
| 240,000 | 3.000%, 02/01/2031 | 192,501 | ||||||
| Nationstar Mortgage Holdings, Inc. | ||||||||
| 446,000 | 5.750%, 11/15/2031(b) | 416,531 | ||||||
| Navient Corp. | ||||||||
| 350,000 | 5.500%, 03/15/2029 | 323,125 | ||||||
| 145,000 | 9.375%, 07/25/2030 | 152,060 | ||||||
| Oaktree Specialty Lending Corp. | ||||||||
| 260,000 | 7.100%, 02/15/2029 | 268,651 | ||||||
| OneMain Finance Corp. | ||||||||
| 365,000 | 3.500%, 01/15/2027 | 338,049 | ||||||
| 20,000 | 3.875%, 09/15/2028 | 17,714 | ||||||
| 85,000 | 5.375%, 11/15/2029 | 79,808 | ||||||
| 337,000 | 7.875%, 03/15/2030 | 347,238 | ||||||
| 65,000 | 4.000%, 09/15/2030 | 55,705 | ||||||
| Operadora de Servicios Mega SA de CV Sofom ER | ||||||||
| 400,000 | 8.250%, 02/11/2025(b) | 210,500 | ||||||
| Owl Rock Capital Corp. | ||||||||
| 760,000 | 2.875%, 06/11/2028 | 669,636 | ||||||
| Owl Rock Technology Finance Corp. | ||||||||
| 105,000 | 2.500%, 01/15/2027 | 91,779 | ||||||
| PennyMac Financial Services, Inc. | ||||||||
| 299,000 | 7.875%, 12/15/2029(b) | 308,249 | ||||||
| Prospect Capital Corp. | ||||||||
| 362,000 | 3.437%, 10/15/2028 | 304,891 | ||||||
| Rithm Capital Corp. | ||||||||
| 1,030,000 | 6.250%, 10/15/2025(b) | 1,015,034 | ||||||
| Rocket Mortgage LLC/Rocket Mortgage Co.-Issuer, Inc. | ||||||||
| 390,000 | 2.875%, 10/15/2026(b) | 360,105 | ||||||
| 560,000 | 3.625%, 03/01/2029(b) | 507,486 | ||||||
| 25,000 | 3.875%, 03/01/2031(b) | 22,005 | ||||||
| 545,000 | 4.000%, 10/15/2033(b) | 463,985 | ||||||
| Ronshine China Holdings Ltd. | ||||||||
| 200,000 | 7.350%, 12/15/2023(l) | 4,650 | ||||||
| 350,000 | 6.750%, 08/05/2024(l) | 8,225 | ||||||
| Sabra Health Care LP | ||||||||
| 100,000 | 3.200%, 12/01/2031 | 81,939 | ||||||
| Shimao Group Holdings Ltd. | ||||||||
| 340,000 | 4.750%, 07/03/2022(l) | 14,430 | ||||||
| Shimao Group Holdings Ltd. | ||||||||
| 200,000 | 5.200%, 01/16/2027(l) | 7,954 | ||||||
| 400,000 | 3.450%, 01/11/2031(l) | 17,000 | ||||||
| Societe Generale SA | ||||||||
| 535,000 | 3.653%, 07/08/2035(b)(i) | 451,687 | ||||||
| Principal Amount^ | Value | |||||||
| Financial (continued) | ||||||||
| Standard Chartered PLC | ||||||||
| $ 830,000 | 3.265%, 02/18/2036(b)(i) | $ | 680,798 | |||||
| Starwood Property Trust, Inc. | ||||||||
| 597,000 | 3.625%, 07/15/2026(b) | 566,052 | ||||||
| 1,190,000 | 4.375%, 01/15/2027(b) | 1,122,747 | ||||||
| Sunac China Holdings Ltd. | ||||||||
| 123,892 | 6.000%, 09/30/2026(b)(f) | 15,539 | ||||||
| 123,892 | 6.250%, 09/30/2027(b)(f) | 13,668 | ||||||
| 247,787 | 6.500%, 09/30/2027(b)(f) | 23,661 | ||||||
| 371,681 | 6.750%, 09/30/2028(b)(f) | 30,363 | ||||||
| 371,681 | 7.000%, 09/30/2029(b)(f) | 29,296 | ||||||
| 174,603 | 7.250%, 09/30/2030(b)(f) | 11,581 | ||||||
| Tanger Properties LP | ||||||||
| 391,000 | 2.750%, 09/01/2031 | 315,571 | ||||||
| Times China Holdings Ltd. | ||||||||
| 400,000 | 6.200%, 03/22/2026(l) | 11,000 | ||||||
| 200,000 | 5.750%, 01/14/2027(l) | 4,550 | ||||||
| UBS Group AG | ||||||||
| 250,000 | 9.016%, 11/15/2033(b)(i) | 308,033 | ||||||
| Unifin Financiera SAB de CV | ||||||||
| 600,000 | 8.875%, 01/29/2025(e)(l) | 3,060 | ||||||
| VICI Properties LP | ||||||||
| 416,000 | 5.125%, 05/15/2032 | 405,998 | ||||||
| Vornado Realty LP | ||||||||
| 70,000 | 3.500%, 01/15/2025 | 67,821 | ||||||
| 63,000 | 2.150%, 06/01/2026 | 56,833 | ||||||
| World Acceptance Corp. | ||||||||
| 500,000 | 7.000%, 11/01/2026(b) | 455,462 | ||||||
| Yuzhou Group Holdings Co. Ltd. | ||||||||
| 540,000 | 7.700%, 02/20/2025(l) | 35,645 | ||||||
| 200,000 | 8.300%, 05/27/2025(l) | 12,500 | ||||||
| 710,000 | 7.850%, 08/12/2026(l) | 47,123 | ||||||
| 1,940,000 | 6.350%, 01/13/2027(l) | 125,111 | ||||||
| Zhenro Properties Group Ltd. | ||||||||
| 400,000 | 6.630%, 01/07/2026(l) | 4,800 | ||||||
|
| |||||||
| 27,327,495 | ||||||||
|
| |||||||
| Industrial: 1.8% | ||||||||
| AptarGroup, Inc. | ||||||||
| 140,000 | 3.600%, 03/15/2032 | 126,403 | ||||||
| Artera Services LLC | ||||||||
| 150,000 | 9.033%, 12/04/2025(b) | 142,313 | ||||||
| BWX Technologies, Inc. | ||||||||
| 1,021,000 | 4.125%, 04/15/2029(b) | 932,770 | ||||||
| Cemex SAB de CV | ||||||||
| 355,000 | 5.125%, 06/08/2026(b)(e)(i) | 337,026 | ||||||
| 200,000 | 9.125%, 03/14/2028(b)(e)(i) | 213,208 | ||||||
| 380,000 | 5.200%, 09/17/2030(b) | 366,418 | ||||||
| 310,000 | 3.875%, 07/11/2031(b) | 277,551 | ||||||
| Danaos Corp. | ||||||||
| 490,000 | 8.500%, 03/01/2028(b) | 497,958 | ||||||
The accompanying notes are an integral part of these financial statements.
| Schedule of Investments | 45 | |||||
Table of Contents
iMGP Alternative Strategies Fund
CONSOLIDATED SCHEDULE OF INVESTMENTS IN SECURITIES at December 31, 2023 (Continued)
| Principal Amount^ | Value | |||||||
CORPORATE BONDS (CONTINUED) | ||||||||
| Industrial (continued) | ||||||||
| Embraer Netherlands Finance BV | ||||||||
| $ 260,000 | 7.000%, 07/28/2030(b) | $ | 272,976 | |||||
| Great Lakes Dredge & Dock Corp. | ||||||||
| 425,000 | 5.250%, 06/01/2029(b) | 361,777 | ||||||
| Griffon Corp. | ||||||||
| 460,000 | 5.750%, 03/01/2028 | 452,541 | ||||||
| IDEX Corp. | ||||||||
| 72,000 | 2.625%, 06/15/2031 | 61,404 | ||||||
| IHS Holding Ltd. | ||||||||
| 365,000 | 5.625%, 11/29/2026(b) | 318,640 | ||||||
| Louisiana-Pacific Corp. | ||||||||
| 670,000 | 3.625%, 03/15/2029(b) | 600,928 | ||||||
| Martin Marietta Materials, Inc. | ||||||||
| 420,000 | 2.400%, 07/15/2031 | 358,037 | ||||||
| MV24 Capital BV | ||||||||
| 322,544 | 6.748%, 06/01/2034 | 302,164 | ||||||
| nVent Finance SARL | ||||||||
| 300,000 | 5.650%, 05/15/2033 | 305,211 | ||||||
| Park-Ohio Industries, Inc. | ||||||||
| 100,000 | 6.625%, 04/15/2027 | 92,613 | ||||||
| Pentair Finance SARL | ||||||||
| 370,000 | 5.900%, 07/15/2032 | 385,331 | ||||||
| Rand Parent LLC | ||||||||
| 505,000 | 8.500%, 02/15/2030(b) | 485,593 | ||||||
| Rolls-Royce PLC | ||||||||
| 501,000 | 5.750%, 10/15/2027(b) | 502,194 | ||||||
| Simpar Europe SA | ||||||||
| 500,000 | 5.200%, 01/26/2031 | 433,663 | ||||||
| Teledyne Technologies, Inc. | ||||||||
| 400,000 | 2.750%, 04/01/2031 | 348,822 | ||||||
| TopBuild Corp. | ||||||||
| 716,000 | 4.125%, 02/15/2032(b) | 637,943 | ||||||
| TransDigm, Inc. | ||||||||
| 680,000 | 4.625%, 01/15/2029 | 638,860 | ||||||
| 1,135,000 | 4.875%, 05/01/2029 | 1,062,437 | ||||||
| Trident TPI Holdings, Inc. | ||||||||
| 25,000 | 12.750%, 12/31/2028(b) | 26,781 | ||||||
| Trimble, Inc. | ||||||||
| 350,000 | 6.100%, 03/15/2033 | 374,541 | ||||||
| Triumph Group, Inc. | ||||||||
| 55,000 | 7.750%, 08/15/2025 | 54,902 | ||||||
| Veralto Corp. | ||||||||
| 170,000 | 5.450%, 09/18/2033(b) | 176,403 | ||||||
| Vontier Corp. | ||||||||
| 570,000 | 2.950%, 04/01/2031 | 481,242 | ||||||
| Waste Connections, Inc. | ||||||||
| 725,000 | 2.200%, 01/15/2032 | 606,619 | ||||||
| XPO, Inc. | ||||||||
| 116,000 | 7.125%, 02/01/2032(b) | 119,744 | ||||||
|
| |||||||
| 12,355,013 | ||||||||
|
| |||||||
| Technology: 1.6% | ||||||||
| Amdocs Ltd. | ||||||||
| 224,000 | 2.538%, 06/15/2030 | 193,992 | ||||||
| Booz Allen Hamilton, Inc. | ||||||||
| 200,000 | 5.950%, 08/04/2033 | 211,529 | ||||||
| Broadcom, Inc. | ||||||||
| 130,000 | 2.450%, 02/15/2031(b) | 111,344 | ||||||
| Principal Amount^ | Value | |||||||
| Technology (continued) | ||||||||
| $ 105,000 | 4.150%, 04/15/2032(b) | $ | 99,289 | |||||
| 120,000 | 2.600%, 02/15/2033(b) | 99,103 | ||||||
| 210,000 | 3.419%, 04/15/2033(b) | 184,930 | ||||||
| 1,435,000 | 3.469%, 04/15/2034(b) | 1,251,292 | ||||||
| 1,405,000 | 3.137%, 11/15/2035(b) | 1,156,992 | ||||||
| Broadridge Financial Solutions, Inc. | ||||||||
| 350,000 | 2.600%, 05/01/2031 | 299,888 | ||||||
| Castle U.S. Holding Corp. | ||||||||
| 325,000 | 9.500%, 02/15/2028(b) | 169,317 | ||||||
| CDW LLC/CDW Finance Corp. | ||||||||
| 1,080,000 | 3.250%, 02/15/2029 | 988,729 | ||||||
| 600,000 | 3.569%, 12/01/2031 | 532,428 | ||||||
| CGI, Inc. | ||||||||
| 360,000 | 2.300%, 09/14/2031 | 294,965 | ||||||
| Fair Isaac Corp. | ||||||||
| 1,814,000 | 4.000%, 06/15/2028(b) | 1,716,967 | ||||||
| KBR, Inc. | ||||||||
| 465,000 | 4.750%, 09/30/2028(b) | 432,869 | ||||||
| Kyndryl Holdings, Inc. | ||||||||
| 740,000 | 3.150%, 10/15/2031 | 620,157 | ||||||
| Micron Technology, Inc. | ||||||||
| 415,000 | 6.750%, 11/01/2029 | 449,275 | ||||||
| 60,000 | 5.875%, 02/09/2033 | 62,514 | ||||||
| 290,000 | 5.875%, 09/15/2033 | 302,191 | ||||||
| Pitney Bowes, Inc. | ||||||||
| 100,000 | 6.875%, 03/15/2027(b) | 93,500 | ||||||
| 154,000 | 7.250%, 03/15/2029(b) | 132,025 | ||||||
| Roper Technologies, Inc. | ||||||||
| 600,000 | 1.750%, 02/15/2031 | 495,487 | ||||||
| Science Applications International Corp. | ||||||||
| 418,000 | 4.875%, 04/01/2028(b) | 399,809 | ||||||
| Virtusa Corp. | ||||||||
| 50,000 | 7.125%, 12/15/2028(b) | 42,956 | ||||||
| VMware LLC | ||||||||
| 35,000 | 2.200%, 08/15/2031 | 29,062 | ||||||
| Western Digital Corp. | ||||||||
| 190,000 | 2.850%, 02/01/2029 | 163,768 | ||||||
| 170,000 | 3.100%, 02/01/2032 | 135,607 | ||||||
| Xerox Holdings Corp. | ||||||||
| 406,000 | 5.500%, 08/15/2028(b) | 366,960 | ||||||
|
| |||||||
| 11,036,945 | ||||||||
|
| |||||||
| Utilities: 0.3% | ||||||||
| Adani Electricity Mumbai Ltd. | ||||||||
| 200,000 | 3.867%, 07/22/2031 | 155,552 | ||||||
| Adani Transmission Step-One Ltd. | ||||||||
| 314,000 | 4.250%, 05/21/2036 | 253,420 | ||||||
| Empresas Publicas de Medellin ESP | ||||||||
| 400,000 | 4.375%, 02/15/2031 | 327,400 | ||||||
| EnfraGen Energia Sur SA/EnfraGen Spain SA/Prime Energia SpA | ||||||||
| 400,000 | 5.375%, 12/30/2030 | 312,481 | ||||||
| Pacific Gas & Electric Co. | ||||||||
| 210,000 | 4.300%, 03/15/2045 | 165,473 | ||||||
| Vistra Operations Co. LLC | ||||||||
| 470,000 | 4.375%, 05/01/2029(b) | 439,160 | ||||||
| 385,000 | 7.750%, 10/15/2031(b) | 400,040 | ||||||
|
| |||||||
| 2,053,526 | ||||||||
|
| |||||||
| | TOTAL CORPORATE BONDS | 134,823,372 | ||||||
|
| |||||||
The accompanying notes are an integral part of these financial statements.
| 46 | Litman Gregory Funds Trust | |||||
Table of Contents
iMGP Alternative Strategies Fund
CONSOLIDATED SCHEDULE OF INVESTMENTS IN SECURITIES at December 31, 2023 (Continued)
| Principal Amount^ | Value | |||||||
GOVERNMENT SECURITIES & AGENCY ISSUE: 1.6% | ||||||||
| Brazil Notas do Tesouro Nacional | ||||||||
| 3,891,000 (BRL) | 10.000%, 01/01/2029 | $ | 799,428 | |||||
| Colombia Government International Bonds | ||||||||
| 500,000 | 5.000%, 06/15/2045 | 389,493 | ||||||
| 300,000 | 5.200%, 05/15/2049 | 235,340 | ||||||
| Indonesia Treasury Bond | ||||||||
| 3,979,000,000 (IDR) | 6.375%, 08/15/2028 | 257,972 | ||||||
| Indonesia Treasury Bonds | ||||||||
| 4,123,000,000 (IDR) | 6.875%, 04/15/2029 | 272,097 | ||||||
| Mexico Bonos | ||||||||
| 10,090,200 (MXN) | 7.500%, 05/26/2033 | 541,065 | ||||||
| Republic of South Africa Government Bond | ||||||||
| 11,940,000 (ZAR) | 8.875%, 02/28/2035 | 552,484 | ||||||
| Republic of South Africa Government International Bond | ||||||||
| 500,000 | 5.650%, 09/27/2047 | 401,225 | ||||||
| U.S. Treasury Bonds | ||||||||
| 1,400,000 | 4.750%, 11/15/2043 | 1,507,406 | ||||||
| U.S. Treasury Notes | ||||||||
| 3,625,000 | 4.500%, 11/30/2024(c) | 3,611,849 | ||||||
| 1,650,000 | 4.500%, 11/15/2033 | 1,735,981 | ||||||
| Ukraine Government International Bond | ||||||||
| 400,000 | 7.253%, 03/15/2035 | 97,268 | ||||||
| Uruguay Government International Bonds | ||||||||
| 21,060,000 (UYU) | 8.250%, 05/21/2031 | 499,919 | ||||||
|
| |||||||
| | TOTAL GOVERNMENT SECURITIES & AGENCY ISSUE | 10,901,527 | ||||||
|
| |||||||
LIMITED PARTNERSHIPS: 0.1% | ||||||||
| 35,594 | GACP II LP*(a) | 317,058 | ||||||
| 1,300,000 | U.S. Farming Realty Trust*(a) | 328,569 | ||||||
|
| |||||||
| | TOTAL LIMITED PARTNERSHIPS | 645,627 | ||||||
|
| |||||||
MORTGAGE-BACKED SECURITIES: 16.5% | ||||||||
| Adjustable Rate Mortgage Trust | ||||||||
| 230,976 | Series 2006-1-2A1 | 119,090 | ||||||
| Alternative Loan Trust | ||||||||
| 65,078 | Series 2003-22CB-1A1 | 64,402 | ||||||
| 240,008 | Series 2004-13CB-A4 | 174,241 | ||||||
| 35,246 | Series 2004-16CB-1A1 | 34,528 | ||||||
| 35,088 | Series 2004-16CB-3A1 | 34,388 | ||||||
| 55,048 | Series 2004-J10-2CB1 | 54,483 | ||||||
| 237 | Series 2005-J1-2A1 | 222 | ||||||
| 2,032,966 | Series 2006-13T1-A13 | 1,029,649 | ||||||
| Principal Amount^ | Value | |||||||
| $ 300,163 | Series 2006-31CB-A7 | $ | 177,508 | |||||
| 385,648 | Series 2006-J1-2A1 | 46,967 | ||||||
| 168,609 | Series 2007-16CB-2A1 | 60,797 | ||||||
| 48,825 | Series 2007-16CB-2A2 | 74,089 | ||||||
| 368,281 | Series 2007-16CB-4A2 | 491,779 | ||||||
| 321,559 | Series 2007-19-1A34 | 167,092 | ||||||
| 895,491 | Series 2007-20-A12 | 457,943 | ||||||
| Alternative Loan Trust Resecuritization | ||||||||
| 408,824 | Series 2008-2R-2A1 | 198,064 | ||||||
| 2,743,028 | Series 2008-2R-4A1 | 1,363,541 | ||||||
| American Home Mortgage Investment Trust | ||||||||
| 171,749 | Series 2006-1-11A1 | 125,870 | ||||||
| AREIT Trust CLO | ||||||||
| 1,000,000 | Series 2019-CRE3-D | 921,407 | ||||||
| BAMLL Commercial Mortgage Securities Trust | ||||||||
| 400,000 | Series 2018-DSNY-C | 397,736 | ||||||
| Banc of America Alternative Loan Trust | ||||||||
| 27,585 | Series 2003-8-1CB1 | 26,817 | ||||||
| Banc of America Funding Trust | ||||||||
| 20,720 | Series 2005-7-3A1 | 20,340 | ||||||
| 174,839 | Series 2006-B-7A1 | 146,468 | ||||||
| 16,271 | Series 2007-4-5A1 | 13,810 | ||||||
| Banc of America Mortgage Trust | ||||||||
| 6,414 | Series 2005-A-2A1 | 5,825 | ||||||
| BBCMS Trust | ||||||||
| 750,000 | Series 2018-CBM-E | 687,190 | ||||||
| BCAP LLC Trust | ||||||||
| 117,502 | Series 2010-RR6-6A2 | 56,049 | ||||||
| 1,729,874 | Series 2011-R11-2A4 | 1,080,476 | ||||||
The accompanying notes are an integral part of these financial statements.
| Schedule of Investments | 47 | |||||
Table of Contents
iMGP Alternative Strategies Fund
CONSOLIDATED SCHEDULE OF INVESTMENTS IN SECURITIES at December 31, 2023 (Continued)
| Principal Amount^ | Value | |||||||
MORTGAGE-BACKED SECURITIES (CONTINUED) | ||||||||
| Bear Stearns Adjustable Rate Mortgage Trust | ||||||||
| $ 1,509,276 | Series 2005-12-25A1 | $ | 1,209,517 | |||||
| Bear Stearns Asset-Backed Securities I Trust | ||||||||
| 290,855 | Series 2006-AC1-1A1 | 135,735 | ||||||
| Benchmark Mortgage Trust | ||||||||
| 540,000 | Series 2019-B9-C | 405,315 | ||||||
| 547,000 | Series 2020-B18-AGNF | 485,028 | ||||||
| 1,637,000 | Series 2021-B31-E | 592,077 | ||||||
| BF Mortgage Trust | ||||||||
| 666,000 | Series 2019-NYT-F | 340,913 | ||||||
| BINOM Securitization Trust | ||||||||
| 530,000 | Series 2022-RPL1-M1 | 404,966 | ||||||
| BPR Trust | ||||||||
| 465,000 | Series 2021-NRD-F | 419,849 | ||||||
| BX Commercial Mortgage Trust | ||||||||
| 1,274,000 | Series 2019-IMC-G | 1,248,480 | ||||||
| 277,893 | Series 2020-VKNG-A | 275,887 | ||||||
| Carbon Capital VI Commercial Mortgage Trust | ||||||||
| 343,565 | Series 2019-FL2-B | 304,857 | ||||||
| CFCRE Commercial Mortgage Trust | ||||||||
| 16,323,000 | Series 2016-C7-XE | 404,696 | ||||||
| 7,346,000 | Series 2016-C7-XF | 182,014 | ||||||
| CG-CCRE Commercial Mortgage Trust | ||||||||
| 98,780 | Series 2014-FL2-COL1 | 81,184 | ||||||
| 192,857 | Series 2014-FL2-COL2 | 143,736 | ||||||
| Chase Mortgage Finance Trust | ||||||||
| 1,262,730 | Series 2007-S3-1A15 | 577,435 | ||||||
| CIM Trust | ||||||||
| 284,252 | Series 2021-NR2-A1 | 280,423 | ||||||
| Citicorp Mortgage Securities Trust | ||||||||
| 1,551,237 | Series 2006-7-1A1 | 1,307,173 | ||||||
| Principal Amount^ | Value | |||||||
| Citigroup Commercial Mortgage Trust | ||||||||
| $ 870,000 | Series 2014-GC21-D | $ | 553,128 | |||||
| Citigroup Mortgage Loan Trust, Inc. | ||||||||
| 97,811 | Series 2005-5-2A2 | 71,696 | ||||||
| 1,665,750 | Series 2005-5-3A2A | 1,362,226 | ||||||
| 1,595,567 | Series 2011-12-1A2 | 921,183 | ||||||
| CitiMortgage Alternative Loan Trust | ||||||||
| 138,760 | Series 2006-A5-1A13 | 113,995 | ||||||
| 136,468 | Series 2006-A5-1A2 | 9,426 | ||||||
| 1,213,156 | Series 2007-A6-1A5 | 1,060,768 | ||||||
| COMM Mortgage Trust | ||||||||
| 460,000 | Series 2012-CR3-B | 362,636 | ||||||
| 40,000 | Series 2012-LC4-C | 32,109 | ||||||
| 1,868,035 | Series 2014-UBS4-F | 249,034 | ||||||
| 3,213,166 | Series 2014-UBS4-G | 215,540 | ||||||
| 7,000 | Series 2014-UBS4-V | 1 | ||||||
| 1,989,000 | Series 2018-HCLV-D | 1,331,698 | ||||||
| Countrywide Home Loan Mortgage Pass-Through Trust | ||||||||
| 3,858 | Series 2004-HYB4-2A1 | 3,350 | ||||||
| 406,321 | Series 2005-23-A1 | 227,203 | ||||||
| 1,920,304 | Series 2006-9-A1 | 879,015 | ||||||
| 115,752 | Series 2007-10-A5 | 54,725 | ||||||
| 463,244 | Series 2007-13-A5 | 236,758 | ||||||
| Credit Suisse First Boston Mortgage Securities Corp. | ||||||||
| 919,440 | Series 2005-11-7A1 | 497,413 | ||||||
| Credit Suisse First Boston Mortgage-Backed Pass-Through Certificates | ||||||||
| 28,704 | Series 2003-27-4A4 | 28,346 | ||||||
| 2,269,653 | Series 2005-10-10A3 | 611,823 | ||||||
| Credit Suisse Mortgage-Backed Trust | ||||||||
| 609,764 | Series 2006-6-1A10 | 300,785 | ||||||
| 650,041 | Series 2007-1-4A1 | 78,935 | ||||||
| 26,657 | Series 2007-2-2A5 | 20,249 | ||||||
The accompanying notes are an integral part of these financial statements.
| 48 | Litman Gregory Funds Trust | |||||
Table of Contents
iMGP Alternative Strategies Fund
CONSOLIDATED SCHEDULE OF INVESTMENTS IN SECURITIES at December 31, 2023 (Continued)
| Principal Amount^ | Value | |||||||
MORTGAGE-BACKED SECURITIES (CONTINUED) | ||||||||
| Credit Suisse Mortgage-Backed Trust (Continued) | ||||||||
| $ 635,000 | Series 2014-USA-D | $ | 371,717 | |||||
| 1,475,000 | Series 2014-USA-E | 697,567 | ||||||
| 266,364 | Series 2020-RPL3-A1 | 252,679 | ||||||
| 1,100,000 | Series 2021-NQM1-B2 | 718,202 | ||||||
| CSAIL Commercial Mortgage Trust | ||||||||
| 1,130,000 | Series 2016-C6-C | 962,460 | ||||||
| 1,400,000 | Series 2020-C19-D | 762,807 | ||||||
| DBUBS Mortgage Trust | ||||||||
| 310,000 | Series 2017-BRBK-D | 258,775 | ||||||
| Deutsche Mortgage & Asset Receiving Corp. | ||||||||
| 1,638,991 | Series 2014-RS1-1A2 | 1,304,223 | ||||||
| Deutsche Mortgage Securities, Inc. Mortgage Loan Trust | ||||||||
| 68,459 | Series 2006-PR1-3A1 | 62,575 | ||||||
| DOLP Trust | ||||||||
| 500,000 | Series 2021-NYC-F | 250,430 | ||||||
| 500,000 | Series 2021-NYC-G | 219,526 | ||||||
| DSLA Mortgage Loan Trust | ||||||||
| 88,295 | Series 2005-AR5-2A1A | 46,945 | ||||||
| Eleven Madison Trust Mortgage Trust | ||||||||
| 100,000 | Series 2015-11MD-A | 90,075 | ||||||
| Federal Home Loan Mortgage Corp. REMICS | ||||||||
| 277,501 | Series 3118-SD | 20,913 | ||||||
| 102,126 | Series 3301-MS | 8,380 | ||||||
| 133,575 | Series 3303-SE | 10,942 | ||||||
| 86,824 | Series 3303-SG | 7,580 | ||||||
| 20,313 | Series 3382-SB | 1,307 | ||||||
| 126,953 | Series 3382-SW | 10,466 | ||||||
| Principal Amount^ | Value | |||||||
| $ 29,610 | Series 3384-S | $ | 1,800 | |||||
| 82,572 | Series 3384-SG | 7,114 | ||||||
| 1,038,883 | Series 3404-SA | 94,393 | ||||||
| 14,520 | Series 3417-SX | 1,075 | ||||||
| 24,560 | Series 3423-GS | 1,447 | ||||||
| 169,683 | Series 3423-TG | 570 | ||||||
| 1,251,846 | Series 3435-S | 111,809 | ||||||
| 37,747 | Series 3445-ES | 2,144 | ||||||
| 189,471 | Series 3523-SM | 14,427 | ||||||
| 87,445 | Series 3560-KS | 4,051 | ||||||
| 40,869 | Series 3598-SA | 2,804 | ||||||
| 58,707 | Series 3641-TB | 58,148 | ||||||
| 153,067 | Series 3728-SV | 5,390 | ||||||
| 100,983 | Series 3758-S | 8,802 | ||||||
| 122,474 | Series 3770-SP | 2,411 | ||||||
| 144,736 | Series 3815-ST | 11,040 | ||||||
| 81,451 | Series 3872-SL | 6,157 | ||||||
| 67,852 | Series 3900-SB | 5,335 | ||||||
| 14,996 | Series 3946-SM | 13,079 | ||||||
| 218,839 | Series 3972-AZ | 201,005 | ||||||
| 1,154,654 | Series 3984-DS | 99,603 | ||||||
The accompanying notes are an integral part of these financial statements.
| Schedule of Investments | 49 | |||||
Table of Contents
iMGP Alternative Strategies Fund
CONSOLIDATED SCHEDULE OF INVESTMENTS IN SECURITIES at December 31, 2023 (Continued)
| Principal Amount^ | Value | |||||||
MORTGAGE-BACKED SECURITIES (CONTINUED) | ||||||||
| Federal Home Loan Mortgage Corp. REMICS (Continued) | ||||||||
| $ 2,199,698 | Series 4080-DS | $ | 125,073 | |||||
| 1,358,240 | Series 4239-OU | 844,760 | ||||||
| 1,353,612 | Series 4291-MS | 115,670 | ||||||
| 363,745 | Series 4314-MS | 10,179 | ||||||
| 6,600,505 | Series 5057-TI | 1,030,614 | ||||||
| 5,484,743 | Series 5070-MI | 816,990 | ||||||
| Federal Home Loan Mortgage Corp. Structured Agency Credit Risk Debt Notes REMIC | ||||||||
| 4,000,000 | Series 2021-DNA6-B1 | 4,071,963 | ||||||
| Federal National Mortgage Association | ||||||||
| 22,468,362 | Series 2019-M25-X | 118,566 | ||||||
| 24,229,335 | Series 2019-M5-X | 346,266 | ||||||
| 24,377,117 | Series 2021-M23-X1 | 482,567 | ||||||
| Federal National Mortgage Association Connecticut Avenue Securities | ||||||||
| 76,539 | Series 2020-R01-1M2 | 77,588 | ||||||
| 1,000,000 | Series 2022-R03-1B2 | 1,130,848 | ||||||
| Federal National Mortgage Association REMICS | ||||||||
| 125,410 | Series 2003-84-PZ | 124,534 | ||||||
| 106,258 | Series 2005-42-SA | 1,825 | ||||||
| 980,069 | Series 2006-92-LI | 100,164 | ||||||
| 280,591 | Series 2007-39-AI | 22,326 | ||||||
| 77,850 | Series 2007-57-SX | 7,421 | ||||||
| 14,701 | Series 2007-68-SA | 1,213 | ||||||
| 17,426 | Series 2008-1-CI | 1,639 | ||||||
| Principal Amount^ | Value | |||||||
| $ 765,120 | Series 2008-33-SA | $ | 67,768 | |||||
| 10,504 | Series 2008-56-SB | 444 | ||||||
| 1,422,118 | Series 2009-110-SD | 97,366 | ||||||
| 14,711 | Series 2009-111-SE | 1,555 | ||||||
| 121,417 | Series 2009-86-CI | 6,404 | ||||||
| 62,258 | Series 2009-87-SA | 6,396 | ||||||
| 25,173 | Series 2009-90-IB | 1,433 | ||||||
| 25,487 | Series 2010-11-SC | 1,262 | ||||||
| 20,269 | Series 2010-115-SD | 1,799 | ||||||
| 1,624,427 | Series 2010-123-SK | 178,660 | ||||||
| 23,784 | Series 2010-134-SE | 59 | ||||||
| 104,950 | Series 2010-15-SL | 6,149 | ||||||
| 27,950 | Series 2010-9-GS | 1,053 | ||||||
| 6,420 | Series 2011-110-LS | 5,076 | ||||||
| 60,834 | Series 2011-111-VZ | 58,173 | ||||||
| 259,351 | Series 2011-141-PZ | 248,213 | ||||||
| 1,016,295 | Series 2011-93-ES | 94,356 | ||||||
| 655,156 | Series 2012-106-SA | 63,094 | ||||||
| 1,412,077 | Series 2014-50-WS | 105,382 | ||||||
| 6,042,184 | Series 2019-31-S | 710,405 | ||||||
| 17,290,335 | Series 2019-M12-X | 280,584 | ||||||
| 7,859,125 | Series 2019-M24-2XA | 445,175 | ||||||
The accompanying notes are an integral part of these financial statements.
| 50 | Litman Gregory Funds Trust | |||||
Table of Contents
iMGP Alternative Strategies Fund
CONSOLIDATED SCHEDULE OF INVESTMENTS IN SECURITIES at December 31, 2023 (Continued)
| Principal Amount^ | Value | |||||||
MORTGAGE-BACKED SECURITIES (CONTINUED) | ||||||||
| Federal National Mortgage Association REMICS (Continued) | ||||||||
| $ 20,848,712 | Series 2019-M7-X | $ | 267,187 | |||||
| 26,921,167 | Series 2020-M10-X4 | 1,187,415 | ||||||
| 16,318,284 | Series 2020-M10-X9 | 252,625 | ||||||
| 7,000,516 | Series 2020-M13-X2 | 323,537 | ||||||
| 8,353,756 | Series 2020-M6-X | 25,427 | ||||||
| 67,855,000 | Series 2022-M4-X2 | 668,847 | ||||||
| Federal National Mortgage Association-Aces | ||||||||
| 126,631,688 | Series 2021-M17-X | 566,398 | ||||||
| First Horizon Alternative Mortgage Securities Trust | ||||||||
| 593,817 | Series 2006-FA6-1A4 | 278,780 | ||||||
| 210,107 | Series 2007-FA4-1A7 | 84,773 | ||||||
| First Horizon Mortgage Pass-Through Trust | ||||||||
| 104,335 | Series 2006-1-1A10 | 48,677 | ||||||
| Fontainebleau Miami Beach Trust | ||||||||
| 574,000 | Series 2019-FBLU-H | 540,993 | ||||||
| GCAT Trust | ||||||||
| 37,417 | Series 2019-RPL1-A1 | 35,670 | ||||||
| Government National Mortgage Association | ||||||||
| 320,327 | Series 2007-21-S | 14,207 | ||||||
| 106,853 | Series 2008-69-SB | 7,001 | ||||||
| 119,187 | Series 2009-104-SD | 11,072 | ||||||
| 11,513 | Series 2010-98-IA | 504 | ||||||
| 186,693 | Series 2011-45-GZ | 185,969 | ||||||
| 59,638 | Series 2011-69-OC | 50,558 | ||||||
| 1,210,445 | Series 2011-69-SC | 90,584 | ||||||
| 213,753 | Series 2011-89-SA | 15,943 | ||||||
| 688,853 | Series 2013-102-BS | 43,274 | ||||||
| Principal Amount^ | Value | |||||||
| $ 10,405,842 | Series 2013-155-IB | $ | 55,598 | |||||
| 1,545,147 | Series 2014-145-CS | 113,416 | ||||||
| 1,000,393 | Series 2014-156-PS | 106,350 | ||||||
| 2,429,547 | Series 2014-4-SA | 241,298 | ||||||
| 4,231,167 | Series 2014-41-SA | 454,213 | ||||||
| 1,716,536 | Series 2014-5-SA | 160,799 | ||||||
| 2,148,031 | Series 2014-58-SG | 146,243 | ||||||
| 1,706,021 | Series 2014-76-SA | 137,756 | ||||||
| 2,353,614 | Series 2014-95-CS | 193,680 | ||||||
| 5,517,360 | Series 2016-162-IO | 181,272 | ||||||
| 1,764,887 | Series 2018-105-SH | 166,861 | ||||||
| 18,168,823 | Series 2018-111-SA | 860,025 | ||||||
| 7,223,812 | Series 2018-134-CS | 673,834 | ||||||
| 5,871,601 | Series 2019-22-SA | 658,292 | ||||||
| 5,629,018 | Series 2019-H10-BI | 307,755 | ||||||
| 6,071,643 | Series 2020-112-BS | 683,102 | ||||||
| 10,332,439 | Series 2020-115-SC | 496,490 | ||||||
| 5,426,111 | Series 2020-142-SD | 712,682 | ||||||
| 6,258,323 | Series 2020-146-SH | 900,578 | ||||||
| 9,575,421 | Series 2020-168-IA | 668,160 | ||||||
| 9,831,783 | Series 2020-173-MI | 1,334,430 | ||||||
| 4,935,377 | Series 2020-188-LS | 746,376 | ||||||
The accompanying notes are an integral part of these financial statements.
| Schedule of Investments | 51 | |||||
Table of Contents
iMGP Alternative Strategies Fund
CONSOLIDATED SCHEDULE OF INVESTMENTS IN SECURITIES at December 31, 2023 (Continued)
| Principal Amount^ | Value | |||||||
MORTGAGE-BACKED SECURITIES (CONTINUED) | ||||||||
| Government National Mortgage Association (Continued) | ||||||||
| $ 4,664,194 | Series 2020-47-SL | $ | 387,790 | |||||
| 10,163,336 | Series 2020-H11-HI | 686,721 | ||||||
| 10,022,881 | Series 2020-H18-AI | 647,439 | ||||||
| 6,820,150 | Series 2020-H19-BI | 490,837 | ||||||
| 5,319,199 | Series 2021-1-QS | 750,803 | ||||||
| 7,707,826 | Series 2021-107-SA | 340,240 | ||||||
| 16,951,008 | Series 2021-213-SN | 381,496 | ||||||
| 9,285,615 | Series 2021-52-IO | 498,582 | ||||||
| 4,416,176 | Series 2021-59-S | 55,715 | ||||||
| 9,045,220 | Series 2021-77-IH | 991,360 | ||||||
| 11,167,275 | Series 2021-89-SA | 361,553 | ||||||
| 20,330,306 | Series 2021-97-SA | 283,726 | ||||||
| 7,823,521 | Series 2021-97-SB | 242,133 | ||||||
| 39,908,136 | Series 2021-H08-QI | 781,940 | ||||||
| 14,266,376 | Series 2021-H19-AI | 858,760 | ||||||
| 14,746,926 | Series 2022-48-IO | 891,036 | ||||||
| 10,144,868 | Series 2022-83-IO | 1,338,124 | ||||||
| GS Mortgage Securities Corp. Trust | ||||||||
| 130,000 | Series 2012-BWTR-A | 94,346 | ||||||
| 1,125,000 | Series 2013-PEMB-C | 741,028 | ||||||
| 1,503,000 | Series 2018-TWR-G | 110,510 | ||||||
| 600,000 | Series 2021-ARDN-H | 557,680 | ||||||
| GS Mortgage Securities Trust | ||||||||
| 130,000 | Series 2011-GC5-C | 92,908 | ||||||
| Principal Amount^ | Value | |||||||
| $ 1,010,000 | Series 2011-GC5-D | $ | 314,629 | |||||
| 100,000 | Series 2014-GC18-B | 93,594 | ||||||
| 1,344,000 | Series 2014-GC26-D | 961,830 | ||||||
| 5,673,000 | Series 2021-GSA3-XF | 448,143 | ||||||
| GSCG Trust | ||||||||
| 710,000 | Series 2019-600C-H | 7,481 | ||||||
| GSR Mortgage Loan Trust | ||||||||
| 29,786 | Series 2005-4F-6A1 | 28,166 | ||||||
| 500,611 | Series 2005-9F-2A1 | 236,881 | ||||||
| 66,261 | Series 2005-AR6-4A5 | 59,885 | ||||||
| 217,019 | Series 2006-7F-3A4 | 74,579 | ||||||
| HarborView Mortgage Loan Trust | ||||||||
| 162,362 | Series 2004-11-2A2A | 133,020 | ||||||
| Hilton USA Trust | ||||||||
| 500,000 | Series 2016-SFP-A | 401,814 | ||||||
| Imperial Fund Mortgage Trust | ||||||||
| 2,000,000 | Series 2021-NQM3-B2 | 1,349,142 | ||||||
| IndyMac INDX Mortgage Loan Trust | ||||||||
| 109,289 | Series 2004-AR7-A5 | 84,590 | ||||||
| 183,643 | Series 2005-AR11-A3 | 135,946 | ||||||
| 894,410 | Series 2007-AR5-2A1 | 700,778 | ||||||
| JP Morgan Chase Commercial Mortgage Securities Trust | ||||||||
| 1,285,000 | Series 2011-C3-E | 507,296 | ||||||
| 255,467 | Series 2012-LC9-C | 227,800 | ||||||
| 683,000 | Series 2019-MFP-G | 645,717 | ||||||
| 683,000 | Series 2019-MFP-XG | 1,864 | ||||||
| 219,000 | Series 2019-UES-C | 211,988 | ||||||
| 224,000 | Series 2019-UES-D | 215,579 | ||||||
| 261,000 | Series 2019-UES-E | 250,050 | ||||||
| 274,000 | Series 2019-UES-F | 261,341 | ||||||
| 299,000 | Series 2019-UES-G | 284,043 | ||||||
| JP Morgan Mortgage Trust | ||||||||
| 167,861 | Series 2004-S1-2A1 | 165,444 | ||||||
The accompanying notes are an integral part of these financial statements.
| 52 | Litman Gregory Funds Trust | |||||
Table of Contents
iMGP Alternative Strategies Fund
CONSOLIDATED SCHEDULE OF INVESTMENTS IN SECURITIES at December 31, 2023 (Continued)
| Principal Amount^ | Value | |||||||
MORTGAGE-BACKED SECURITIES (CONTINUED) | ||||||||
| JP Morgan Mortgage Trust (Continued) | ||||||||
| $ 1,276,296 | Series 2005-ALT1-3A1 | $ | 986,336 | |||||
| 5,633 | Series 2007-A1-4A2 | 5,292 | ||||||
| 539,484 | Series 2007-S3-1A97 | 264,180 | ||||||
| JPMBB Commercial Mortgage Securities Trust | ||||||||
| 78,000 | Series 2015-C27-D | 48,210 | ||||||
| 4,749,500 | Series 2015-C27-XFG | 54,980 | ||||||
| Legacy Mortgage Asset Trust | ||||||||
| 668,492 | Series 2020-GS1-A1 | 668,448 | ||||||
| 3,457,849 | Series 2020-GS3-A2 | 3,026,724 | ||||||
| Lehman Mortgage Trust | ||||||||
| 543,507 | Series 2006-2-2A3 | 531,150 | ||||||
| 781,717 | Series 2007-1-1A2 | 762,210 | ||||||
| Lehman XS Trust | ||||||||
| 72,863 | Series 2006-2N-1A1 | 56,741 | ||||||
| LHOME Mortgage Trust | ||||||||
| 3,700,000 | Series 2021-RTL1-M | 3,418,887 | ||||||
| Master Alternative Loan Trust | ||||||||
| 15,144 | Series 2003-9-4A1 | 14,714 | ||||||
| 11,663 | Series 2004-5-1A1 | 11,398 | ||||||
| 14,051 | Series 2004-5-2A1 | 13,965 | ||||||
| 61,572 | Series 2004-8-2A1 | 59,911 | ||||||
| Merrill Lynch Mortgage Investors Trust | ||||||||
| 2,534 | Series 2006-2-2A | 2,342 | ||||||
| Mill City Mortgage Loan Trust | ||||||||
| 305,000 | Series 2021-NMR1-M3 | 241,340 | ||||||
| Morgan Stanley Bank of America Merrill Lynch Trust | ||||||||
| 858,000 | Series 2015-C21-C | 660,874 | ||||||
| Morgan Stanley Bank of America Merrill Lynch Trust | ||||||||
| 560,000 | Series 2013-C11-B | 350,111 | ||||||
| 1,155,000 | Series 2016-C31-D | 711,310 | ||||||
| Morgan Stanley Capital I Trust | ||||||||
| 151,008 | Series 2011-C2-D | 136,805 | ||||||
| Principal Amount^ | Value | |||||||
| $ 540,000 | Series 2011-C2-E | $ | 390,374 | |||||
| 613,000 | Series 2018-H4-D | 406,854 | ||||||
| 1,508,000 | Series 2019-PLND-F | 733,715 | ||||||
| Morgan Stanley Mortgage Loan Trust | ||||||||
| 1,095,442 | Series 2005-9AR-2A | 1,003,636 | ||||||
| 2,196,158 | Series 2006-11-2A2 | 956,409 | ||||||
| 254,878 | Series 2006-7-3A | 142,466 | ||||||
| 223,113 | Series 2007-13-6A1 | 122,097 | ||||||
| New Residential Mortgage Loan Trust | ||||||||
| 2,250,000 | Series 2021-NQ1R-M1 | 1,733,620 | ||||||
| NewRez Warehouse Securitization Trust | ||||||||
| 1,906,667 | Series 2021-1-F | 1,910,495 | ||||||
| Preston Ridge Partners Mortgage LLC | ||||||||
| 3,574,648 | Series 2021-2-A1 | 3,540,060 | ||||||
| 400,000 | Series 2021-2-A2 | 394,313 | ||||||
| 286,780 | Series 2021-9-A1 | 278,837 | ||||||
| Prime Mortgage Trust | ||||||||
| 713,968 | Series 2006-DR1-2A1 | 616,994 | ||||||
| Residential Accredit Loans, Inc. | ||||||||
| 229,624 | Series 2006-QS17-A5 | 187,477 | ||||||
| Residential Accredit Loans, Inc. Trust | ||||||||
| 267,993 | Series 2006-QS7-A3 | 206,996 | ||||||
| 319,130 | Series 2007-QS1-2A10 | 243,691 | ||||||
| 281,642 | Series 2007-QS8-A8 | 212,433 | ||||||
| Residential Asset Securitization Trust | ||||||||
| 194,506 | Series 2006-A8-1A1 | 109,119 | ||||||
| 226,811 | Series 2007-A1-A8 | 75,664 | ||||||
| Residential Funding Mtg Sec I Trust | ||||||||
| 276,233 | Series 2006-S4-A5 | 218,523 | ||||||
| SMR Mortgage Trust | ||||||||
| 1,159,656 | Series 2022-IND-G | 866,481 | ||||||
| Starwood Retail Property Trust | ||||||||
| 235,000 | Series 2014-STAR-C | 86,081 | ||||||
| 980,000 | Series 2014-STAR-D | 222,068 | ||||||
| 950,000 | Series 2014-STAR-E | 47,500 | ||||||
The accompanying notes are an integral part of these financial statements.
| Schedule of Investments | 53 | |||||
Table of Contents
iMGP Alternative Strategies Fund
CONSOLIDATED SCHEDULE OF INVESTMENTS IN SECURITIES at December 31, 2023 (Continued)
| Principal Amount^ | Value | |||||||
MORTGAGE-BACKED SECURITIES (CONTINUED) | ||||||||
| Structured Adjustable Rate Mortgage Loan Trust | ||||||||
| $ 456,001 | Series 2005-14-A1 | $ | 276,940 | |||||
| 212,203 | Series 2005-15-1A1 | 114,493 | ||||||
| 446,005 | Series 2008-1-A2 | 348,737 | ||||||
| Structured Asset Securities Corp. | ||||||||
| 5,097,974 | Series 2007-4-1A3 | 325,536 | ||||||
| Toorak Mortgage Corp. Ltd. | ||||||||
| 347,786 | Series 2021-1-A1 | 341,289 | ||||||
| TTAN | ||||||||
| 514,784 | Series 2021-MHC-G | 494,930 | ||||||
| UBS-Barclays Commercial Mortgage Trust | ||||||||
| 1,000,000 | Series 2013-C5-C | 782,187 | ||||||
| Verus Securitization Trust | ||||||||
| 2,000,000 | Series 2021-7-B2 | 1,360,286 | ||||||
| Washington Mutual Mortgage Pass-Through Certificates Trust | ||||||||
| 347,444 | Series 2006-5-1A5 | 268,280 | ||||||
| 373,420 | Series 2006-8-A6 | 131,196 | ||||||
| Wells Fargo Alternative Loan Trust | ||||||||
| 83,723 | Series 2007-PA2-3A1 | 59,919 | ||||||
| 123,338 | Series 2007-PA2-3A2 | 8,299 | ||||||
| Wells Fargo Commercial Mortgage Trust | ||||||||
| 464,093 | Series 2013-LC12-B | 406,528 | ||||||
| 19,971,000 | Series 2015-C28-XE | 264,138 | ||||||
| 600,000 | Series 2016-C34-C | 482,743 | ||||||
| 135,000 | Series 2016-C36-B | 114,787 | ||||||
| 130,000 | Series 2016-C36-C | 93,155 | ||||||
| 6,406,000 | Series 2017-C42-XE | 260,911 | ||||||
| Wells Fargo Mortgage-Backed Securities Trust | ||||||||
| 43,122 | Series 2006-AR19-A1 | 41,781 | ||||||
| Principal Amount^ | Value | |||||||
| WFRBS Commercial Mortgage Trust | ||||||||
| $ 214,000 | Series 2011-C3-D | $ | 62,096 | |||||
| 395,000 | Series 2011-C4-E | 276,280 | ||||||
| 1,020,000 | Series 2012-C10-C | 710,098 | ||||||
| 250,000 | Series 2014-C24-B | 219,002 | ||||||
|
| |||||||
| | TOTAL MORTGAGE-BACKED SECURITIES | 112,833,703 | ||||||
|
| |||||||
SHORT-TERM INVESTMENTS: 22.1% | ||||||||
REPURCHASE AGREEMENTS: 5.1% | ||||||||
| 34,778,955 | Fixed Income Clearing Corp. 1.600%, 12/29/2023, due 01/02/2024(o) [collateral: par value $35,850,800, U.S. Treasury Note, 0.500% - 3.875%, due 01/15/2026 - 02/28/2026 value $35,489,713] (proceeds $34,785,138) | 34,778,955 | ||||||
|
| |||||||
| | TOTAL REPURCHASE AGREEMENTS | 34,778,955 | ||||||
|
| |||||||
TREASURY BILLS: 17.0% | ||||||||
| U.S. Treasury Bills | ||||||||
| 102,900,000 | 5.208%, 03/21/2024(d)(n)(o) | 101,728,789 | ||||||
| 2,780,000 | 5.274%, 03/28/2024(c)(d)(n) | 2,745,521 | ||||||
| 1,600,000 | 5.246%, 04/04/2024(c)(d)(n) | 1,584,974 | ||||||
| 3,770,000 | 5.167%, 04/18/2024(c)(d)(n) | 3,711,875 | ||||||
| 2,030,000 | 5.265%, 05/02/2024(c)(d)(n) | 1,994,846 | ||||||
| 3,200,000 | 5.195%, 09/05/2024(c)(d)(n) | 3,096,137 | ||||||
| 1,100,000 | 5.106%, 10/03/2024(c)(d)(n) | 1,060,476 | ||||||
|
| |||||||
| | TOTAL TREASURY BILLS | 115,922,618 | ||||||
|
| |||||||
| | TOTAL SHORT-TERM INVESTMENTS | 150,701,573 | ||||||
|
| |||||||
| | TOTAL PURCHASED OPTIONS | 38,433 | ||||||
|
| |||||||
| | TOTAL INVESTMENTS | 664,417,889 | ||||||
|
| |||||||
| Other Assets in Excess of Liabilities: 2.8% | 19,289,552 | |||||||
|
| |||||||
NET ASSETS: 100.0% | $ | 683,707,441 | ||||||
|
| |||||||
Percentages are stated as a percent of net assets.
| ADR | American Depositary Receipt |
| CLO | Collateralized Loan Obligation |
| CMT | Constant Maturity Treasury Index |
| EURIBOR | Euro Interbank Offered Rate |
| FEDL01 | Federal Funds Rate |
| LIBOR | London Interbank Offered Rate |
| LP | Limited Partnership |
The accompanying notes are an integral part of these financial statements.
| 54 | Litman Gregory Funds Trust | |||||
Table of Contents
iMGP Alternative Strategies Fund
CONSOLIDATED SCHEDULE OF INVESTMENTS IN SECURITIES at December 31, 2023 (Continued)
| PIK | Payment-in-kind |
| REIT | Real Estate Investment Trust |
| REMICS | Real Estate Mortgage Investment Conduit |
| SOFR | Secured Overnight Financing Rate |
| * | Non-Income Producing Security. |
| ^ | The principal amount is stated in U.S. Dollars unless otherwise indicated. |
| (a) | Security is valued using significant unobservable inputs in good faith in accordance with procedures approved by the Board of Trustees. |
| (b) | Security was purchased pursuant to Rule 144A under the Securities Act of 1933 and may be sold in transactions exempt from registration only to qualified institutional buyers or in a public offering registered under Securities Act of 1933. |
| (c) | Securities with an aggregate fair value of $34,743,151 have been pledged as collateral for options, total return swaps, credit default swaps, securities sold short and futures positions. |
| (d) | Issued with a zero coupon. Income is recognized through the accretion of discount. |
| (e) | Perpetual Call. |
| (f) | Pay-in-kind security. |
| (g) | Coupon increases periodically based upon a predetermined schedule. Stated interest rate in effect at December 31, 2023. |
| (h) | Floating Interest Rate at December 31, 2023. |
| (i) | Variable rate security. Interest rate or distribution rate disclosed is that which is in effect at December 31, 2023. |
| (j) | Interest Only security. Security with a notional or nominal principal amount. |
| (k) | This position represents an unsettled loan commitment at period end. Certain details associated with this purchase are not known prior to the settlement date, including coupon rate, which will be adjusted on settlement date. |
| (l) | Security is currently in default and/or non-income producing. |
| (m) | Principal Only security. |
| (n) | The rate shown represents yield-to-maturity. |
| (o) | All or a portion of this security is held by the iMGP Alternative Strategies Subsidiary. |
CURRENCY ABBREVIATIONS:
| BRL | Brazilian real |
| CAD | Canadian dollar |
| EUR | Euro |
| GBP | British pound |
| IDR | Indonesian rupiah |
| MXN | Mexican peso |
| NOK | Norwegian krone |
| ZAR | South African rand |
UNFUNDED LOAN COMMITMENTS—At December 31, 2023, the Fund had unfunded loan commitments which could be extended at the option of the borrowers, pursuant to the following agreements:
| Borrower | Principal Amount | Current Value | Unrealized Gain (Loss) | |||||||||
Lealand Finance Co. BV, 0.500%, 03/28/2024 | $ | 381,588 | $ | 200,334 | $ | (181,254 | ) | |||||
| CONSOLIDATED SCHEDULE OF INVESTMENTS IN PURCHASED OPTIONS at December 31, 2023 | ||||||||||||||||||||||||||||||
| Description | Counterparty | Exercise Price | Expiration Date | Number of Contracts | Notional Amount | Fair Value | Premiums Paid | Unrealized Appreciation/ (Depreciation) | ||||||||||||||||||||||
COMMON STOCKS |
| |||||||||||||||||||||||||||||
Call |
| |||||||||||||||||||||||||||||
Point Biopharma Global, Inc. | Morgan Stanley & Co. | $ | 17.50 | 1/19/2024 | 441 | $ | 551,250 | $ | 2,205 | $ | 14,471 | $ | (12,266 | ) | ||||||||||||||||
Put |
| |||||||||||||||||||||||||||||
Hawaiian Holdings, Inc. | Morgan Stanley & Co. | 11.00 | 4/19/2024 | 214 | 303,880 | 10,700 | 15,541 | (4,841 | ) | |||||||||||||||||||||
Hawaiian Holdings, Inc. | Morgan Stanley & Co. | 12.00 | 4/19/2024 | 214 | 303,880 | 12,840 | 20,477 | (7,637 | ) | |||||||||||||||||||||
EXCHANGE TRADED |
| |||||||||||||||||||||||||||||
Put |
| |||||||||||||||||||||||||||||
U.S. Treasury 5-Year Future Option | JPMorgan Chase Bank N.A. | 106.75 | 2/23/2024 | 56 | 6,091,313 | 12,688 | 16,742 | (4,054 | ) | |||||||||||||||||||||
|
| |||||||||||||||||||||||||||||
Total Purchased Options |
| $ | 38,433 | $ | 67,231 | $ | (28,798 | ) | ||||||||||||||||||||||
|
| |||||||||||||||||||||||||||||
The accompanying notes are an integral part of these financial statements.
| Schedule of Investments | 55 | |||||
Table of Contents
iMGP Alternative Strategies Fund
CONSOLIDATED SCHEDULE OF INVESTMENTS IN SECURITIES SOLD SHORT at December 31, 2023
| Shares | Value | |||||||
COMMON STOCKS: 0.6% | ||||||||
| (15,440) | Chevron Corp. | $ | (2,303,030 | )�� | ||||
| (8,572) | Cineplex, Inc.* | (54,336 | ) | |||||
| (15,313) | Exxon Mobil Corp. | (1,530,994 | ) | |||||
| (6,993) | iRobot Corp.* | (270,629 | ) | |||||
| (1,315) | Masonite International Corp.* | (111,328 | ) | |||||
|
| |||||||
| | TOTAL COMMON STOCKS | (4,270,317 | ) | |||||
|
| |||||||
| | TOTAL SECURITIES SOLD SHORT | $ | (4,270,317 | ) | ||||
|
| |||||||
The accompanying notes are an integral part of these financial statements.
| 56 | Litman Gregory Funds Trust | |||||
Table of Contents
iMGP Alternative Strategies Fund
CONSOLIDATED SCHEDULE OF INVESTMENTS IN FORWARD FOREIGN CURRENCY EXCHANGE CONTRACTS at December 31, 2023
At December 31, 2023, the Fund had the following forward foreign currency exchange contracts:
| Asset Derivatives | Liability Derivatives | |||||||||||||||||||||||
| Counterparty | Settlement Date | Fund Receiving | U.S. $ Value at December 31, 2023 | Fund Delivering | U.S. $ Value at December 31, 2023 | Unrealized Appreciation | Unrealized Depreciation | |||||||||||||||||
Bank of America N.A. | 1/31/2024 | USD | $ | 1,732,367 | EUR | $ | 1,805,948 | $ | — | $ | (73,581 | ) | ||||||||||||
| 3/5/2024 | USD | 327,963 | EUR | 332,628 | — | (4,665 | ) | |||||||||||||||||
Barclays Bank Plc | 1/31/2024 | USD | 526,047 | EUR | 548,096 | — | (22,049 | ) | ||||||||||||||||
JPMorgan Chase Bank N.A. | 1/11/2024 | EUR | 1,983,461 | USD | 1,933,467 | 49,994 | — | |||||||||||||||||
| 1/11/2024 | EUR | 1,093,004 | USD | 1,058,478 | 34,526 | — | ||||||||||||||||||
| 1/11/2024 | EUR | 846,755 | USD | 819,659 | 27,096 | — | ||||||||||||||||||
| 1/11/2024 | USD | 484,550 | EUR | 486,940 | — | (2,390 | ) | |||||||||||||||||
| 1/11/2024 | USD | 113,235 | EUR | 118,586 | — | (5,351 | ) | |||||||||||||||||
| 1/11/2024 | USD | 428,245 | EUR | 435,762 | — | (7,517 | ) | |||||||||||||||||
| 1/11/2024 | USD | 195,853 | EUR | 204,209 | — | (8,356 | ) | |||||||||||||||||
| 1/11/2024 | USD | 239,114 | EUR | 248,332 | — | (9,218 | ) | |||||||||||||||||
| 1/11/2024 | USD | 248,884 | EUR | 259,539 | — | (10,655 | ) | |||||||||||||||||
| 2/22/2024 | USD | 91,200 | EUR | 91,855 | — | (655 | ) | |||||||||||||||||
| 2/22/2024 | USD | 575,795 | EUR | 579,084 | — | (3,289 | ) | |||||||||||||||||
Morgan Stanley & Co. | 3/15/2024 | EUR | 30,725 | USD | 30,012 | 713 | — | |||||||||||||||||
| 3/15/2024 | EUR | 48,585 | USD | 47,971 | 614 | — | ||||||||||||||||||
| 3/15/2024 | USD | 10,929 | CAD | 11,068 | — | (139 | ) | |||||||||||||||||
| 3/15/2024 | USD | 990,613 | CAD | 1,020,068 | — | (29,455 | ) | |||||||||||||||||
| 3/15/2024 | USD | 28,297 | EUR | 28,174 | 123 | — | ||||||||||||||||||
| 3/15/2024 | USD | 1,741,103 | EUR | 1,784,524 | — | (43,421 | ) | |||||||||||||||||
| 3/15/2024 | USD | 614,061 | GBP | 611,615 | 2,446 | — | ||||||||||||||||||
| 3/15/2024 | USD | 103,220 | GBP | 103,869 | — | (649 | ) | |||||||||||||||||
| 3/15/2024 | USD | 5,253,568 | GBP | 5,334,777 | — | (81,209 | ) | |||||||||||||||||
| 3/15/2024 | USD | 3,188,206 | NOK | 3,456,666 | — | (268,460 | ) | |||||||||||||||||
|
|
|
|
|
|
|
|
| ||||||||||||||||
| $ | 20,895,780 | $ | 21,351,327 | $ | 115,512 | $ | (571,059 | ) | ||||||||||||||||
|
|
|
|
|
|
|
|
| ||||||||||||||||
The accompanying notes are an integral part of these financial statements.
| Schedule of Investments | 57 | |||||
Table of Contents
iMGP Alternative Strategies Fund
CONSOLIDATED SCHEDULE OF INVESTMENTS IN FUTURES CONTRACTS at December 31, 2023 (a)
| Description | Number of Contracts | Notional Amount | Notional Value | Expiration Date | Unrealized Appreciation/ (Depreciation) | |||||||||||||||
Futures Contracts – Long | ||||||||||||||||||||
3 Months SOFR Futures | 35 | $ | 8,427,414 | $ | 8,469,125 | 9/16/2025 | $ | 41,711 | ||||||||||||
30 Day Federal Funds Futures | 3 | 1,185,595 | 1,186,720 | 4/30/2024 | 1,125 | |||||||||||||||
BP FX Currency Futures | 4 | 313,294 | 318,775 | 3/18/2024 | 5,481 | |||||||||||||||
CAD FX Currency Futures | 3 | 221,276 | 226,875 | 3/19/2024 | 5,599 | |||||||||||||||
Euro FX Currency Futures | 61 | 8,386,807 | 8,444,687 | 3/18/2024 | 57,880 | |||||||||||||||
Japanese Yen Currency Futures | 4 | 349,788 | 358,800 | 3/18/2024 | 9,012 | |||||||||||||||
MSCI EAFE Index Futures | 59 | 6,518,428 | 6,644,580 | 3/15/2024 | 126,152 | |||||||||||||||
Nasdaq 100 E-mini Futures | 8 | 2,568,472 | 2,723,760 | 3/15/2024 | 155,288 | |||||||||||||||
Russell 2000 E-mini Futures | 16 | 1,509,936 | 1,638,160 | 3/15/2024 | 128,224 | |||||||||||||||
S&P 500 E-Mini Index Futures | 135 | 31,968,592 | 32,535,000 | 3/15/2024 | 566,408 | |||||||||||||||
S&P Mid Cap 400 E-mini Futures | 7 | 1,851,548 | 1,966,650 | 3/15/2024 | 115,102 | |||||||||||||||
U.S. Treasury 10-Year Note Futures | 10 | 1,096,114 | 1,128,906 | 3/19/2024 | 32,792 | |||||||||||||||
U.S. Treasury 10-Year Ultra Note Futures | 120 | 13,545,568 | 14,161,875 | 3/19/2024 | 616,307 | |||||||||||||||
U.S. Treasury 2-Year Note Futures | 601 | 122,695,052 | 123,754,351 | 3/28/2024 | 1,059,299 | |||||||||||||||
U.S. Treasury 5-Year Note Futures | 56 | 5,976,793 | 6,091,313 | 3/28/2024 | 114,520 | |||||||||||||||
U.S. Treasury Long Bond Futures | 39 | 4,807,039 | 4,872,563 | 3/19/2024 | 65,524 | |||||||||||||||
|
| |||||||||||||||||||
Total Long | $ | 3,100,424 | ||||||||||||||||||
|
| |||||||||||||||||||
Futures Contracts – Short | ||||||||||||||||||||
Japanese Yen Currency Futures | (239 | ) | $ | (21,010,191 | ) | $ | (21,438,300 | ) | 3/18/2024 | $ | (428,109 | ) | ||||||||
MSCI Emerging Market Index | (488 | ) | (24,056,990 | ) | (25,222,280 | ) | 3/15/2024 | (1,165,290 | ) | |||||||||||
U.S. Dollar Index Futures | (15 | ) | (1,551,903 | ) | (1,515,435 | ) | 3/18/2024 | 36,468 | ||||||||||||
U.S. Treasury 10-Year Note Futures | (329 | ) | (36,221,404 | ) | (37,141,016 | ) | 3/19/2024 | (919,612 | ) | |||||||||||
U.S. Treasury 10-Year Ultra Note Futures | (249 | ) | (28,274,918 | ) | (29,385,891 | ) | 3/19/2024 | (1,110,973 | ) | |||||||||||
U.S. Treasury 2-Year Note Futures | (152 | ) | (31,052,750 | ) | (31,298,937 | ) | 3/28/2024 | (246,187 | ) | |||||||||||
U.S. Treasury 5-Year Note Futures | (295 | ) | (31,532,582 | ) | (32,088,164 | ) | 3/28/2024 | (555,582 | ) | |||||||||||
U.S. Treasury Long Bond Futures | (20 | ) | (2,336,146 | ) | (2,498,750 | ) | 3/19/2024 | (162,604 | ) | |||||||||||
U.S. Treasury Ultra-Long Bond Futures | (22 | ) | (2,693,413 | ) | (2,939,062 | ) | 3/19/2024 | (245,649 | ) | |||||||||||
WTI Crude Futures (b) | (30 | ) | (2,228,630 | ) | (2,155,200 | ) | 3/20/2024 | 73,430 | ||||||||||||
|
| |||||||||||||||||||
Total Short | $ | (4,724,108 | ) | |||||||||||||||||
|
| |||||||||||||||||||
Total Futures Contracts | $ | (1,623,684 | ) | |||||||||||||||||
|
| |||||||||||||||||||
| (a) | Citigroup Global Markets, Inc., JPMorgan Chase Bank N.A., and StoneX Financial, Inc. are the counterparties for Open Futures Contracts held by the Fund and the iMGP Alternative Strategies Subsidiary at December 31, 2023. |
| (b) | Contracts held by the iMGP Alternative Strategies Subsidiary. |
The accompanying notes are an integral part of these financial statements.
| 58 | Litman Gregory Funds Trust | |||||
Table of Contents
iMGP Alternative Strategies Fund
CONSOLIDATED SCHEDULE OF INVESTMENTS IN SWAPS at December 31, 2023
| CENTRALLY CLEARED CREDIT DEFAULT SWAP CONTRACTS (1)(2)(3) | ||||||||||||||||||||||||||||||||
| Description | Maturity Date | Fixed Deal (Pay) Rate | Implied Credit Spread at December 31, 2023 | Notional Amount(4) | Periodic Payment Frequency | Fair Value | Upfront Premiums Paid / (Received) | Unrealized Appreciation / (Depreciation) | ||||||||||||||||||||||||
Buy Protection |
| |||||||||||||||||||||||||||||||
Accor S.A. | 12/20/2028 | (1.000 | %) | 0.901 | % | EUR | (800,000 | ) | Quarterly | $ | (4,004 | ) | $ | 3,963 | $ | (7,967 | ) | |||||||||||||||
ADT Security Corp. (The) | 12/20/2028 | (5.000 | %) | 1.466 | % | $ | (4,000,000 | ) | Quarterly | (610,367 | ) | (502,276 | ) | (108,091 | ) | |||||||||||||||||
AES Corp. (The) | 12/20/2028 | (5.000 | %) | 1.175 | % | (4,000,000 | ) | Quarterly | (668,407 | ) | (596,734 | ) | (71,673 | ) | ||||||||||||||||||
Airbus SE | 12/20/2028 | (1.000 | %) | 0.485 | % | EUR | (700,000 | ) | Quarterly | (18,553 | ) | (5,468 | ) | (13,085 | ) | |||||||||||||||||
Alstom S.A. | 12/20/2028 | (1.000 | %) | 1.901 | % | (4,500,000 | ) | Quarterly | 196,943 | 120,708 | 76,235 | |||||||||||||||||||||
American Express Co. | 12/20/2028 | (1.000 | %) | 0.404 | % | $ | (4,500,000 | ) | Quarterly | (120,829 | ) | (99,587 | ) | (21,242 | ) | |||||||||||||||||
American International Group, Inc. | 12/20/2028 | (1.000 | %) | 0.593 | % | (4,400,000 | ) | Quarterly | (80,008 | ) | (72,134 | ) | (7,874 | ) | ||||||||||||||||||
Amkor Technology, Inc. | 12/20/2028 | (5.000 | %) | 0.903 | % | (3,750,000 | ) | Quarterly | (678,404 | ) | (556,806 | ) | (121,598 | ) | ||||||||||||||||||
Anglo American Capital PLC | 12/20/2028 | (5.000 | %) | 1.432 | % | EUR | (3,750,000 | ) | Quarterly | (662,734 | ) | (586,869 | ) | (75,865 | ) | |||||||||||||||||
Apache Corp. | 12/20/2028 | (1.000 | %) | 1.389 | % | $ | (7,750,000 | ) | Quarterly | 130,685 | 156,504 | (25,819 | ) | |||||||||||||||||||
Arrow Electronics, Inc. | 12/20/2028 | (1.000 | %) | 0.840 | % | (3,700,000 | ) | Quarterly | (26,186 | ) | (13,116 | ) | (13,070 | ) | ||||||||||||||||||
Assicurazioni Generali SpA | 12/20/2028 | (1.000 | %) | 0.719 | % | EUR | (800,000 | ) | Quarterly | (11,477 | ) | (4,351 | ) | (7,126 | ) | |||||||||||||||||
Avis Budget Car Rental LLC / Avis Budget Finance, Inc. | 12/20/2028 | (5.000 | %) | 3.473 | % | $ | (4,250,000 | ) | Quarterly | (258,897 | ) | (156,642 | ) | (102,255 | ) | |||||||||||||||||
Bank of America Corp. | 12/20/2028 | (1.000 | %) | 0.689 | % | (3,900,000 | ) | Quarterly | (54,026 | ) | (23,278 | ) | (30,748 | ) | ||||||||||||||||||
Barclays PLC | 12/20/2028 | (1.000 | %) | 0.879 | % | EUR | (4,300,000 | ) | Quarterly | (26,293 | ) | 47,890 | (74,183 | ) | ||||||||||||||||||
Baxter International, Inc. | 12/20/2028 | (1.000 | %) | 0.719 | % | $ | (4,400,000 | ) | Quarterly | (55,071 | ) | (35,891 | ) | (19,180 | ) | |||||||||||||||||
Bayer AG | 12/20/2028 | (1.000 | %) | 1.053 | % | EUR | (3,700,000 | ) | Quarterly | 9,789 | 34,985 | (25,196 | ) | |||||||||||||||||||
Best Buy Co., Inc. | 12/20/2028 | (5.000 | %) | 0.660 | % | $ | (3,200,000 | ) | Quarterly | (619,400 | ) | (597,656 | ) | (21,744 | ) | |||||||||||||||||
Block Financial LLC | 12/20/2028 | (5.000 | %) | 0.559 | % | (600,000 | ) | Quarterly | (119,334 | ) | (116,926 | ) | (2,408 | ) | ||||||||||||||||||
BNP Paribas S.A. | 12/20/2028 | (1.000 | %) | 0.668 | % | EUR | (3,200,000 | ) | Quarterly | 1,700 | (10,939 | ) | 12,639 | |||||||||||||||||||
Bombardier, Inc. | 12/20/2028 | (5.000 | %) | 3.463 | % | $ | (4,250,000 | ) | Quarterly | (260,757 | ) | (137,307 | ) | (123,450 | ) | |||||||||||||||||
Bouygues S.A. | 12/20/2028 | (1.000 | %) | 0.333 | % | EUR | (4,200,000 | ) | Quarterly | (145,227 | ) | (102,085 | ) | (43,142 | ) | |||||||||||||||||
BP Capital Markets PLC | 12/20/2028 | (1.000 | %) | 0.626 | % | $ | (800,000 | ) | Quarterly | (15,330 | ) | (11,154 | ) | (4,176 | ) | |||||||||||||||||
British Telecommunications PLC | 12/20/2028 | (1.000 | %) | 0.754 | % | (4,300,000 | ) | Quarterly | (53,872 | ) | 9,087 | (62,959 | ) | |||||||||||||||||||
The accompanying notes are an integral part of these financial statements.
| Schedule of Investments | 59 | |||||
Table of Contents
iMGP Alternative Strategies Fund
CONSOLIDATED SCHEDULE OF INVESTMENTS IN SWAPS at December 31, 2023 (Continued)
| CENTRALLY CLEARED CREDIT DEFAULT SWAP CONTRACTS (1)(2)(3) (CONTINUED) | ||||||||||||||||||||||||||||||||
| Description | Maturity Date | Fixed Deal (Pay) Rate | Implied Credit Spread at December 31, 2023 | Notional Amount(4) | Periodic Payment Frequency | Fair Value | Upfront Premiums Paid / (Received) | Unrealized Appreciation / (Depreciation) | ||||||||||||||||||||||||
Buy Protection (Continued) |
| |||||||||||||||||||||||||||||||
Cardinal Health, Inc. | 12/20/2028 | (1.000 | %) | 0.394 | % | $ | (4,400,000 | ) | Quarterly | $ | (120,245 | ) | $ | (90,926 | ) | $ | (29,319 | ) | ||||||||||||||
Carlsberg Breweries AS | 12/20/2028 | (1.000 | %) | 0.281 | % | EUR | (4,200,000 | ) | Quarterly | (156,707 | ) | (133,242 | ) | (23,465 | ) | |||||||||||||||||
Carnival Corp. | 12/20/2028 | (1.000 | %) | 3.609 | % | $ | (2,600,000 | ) | Quarterly | 269,316 | 520,250 | (250,934 | ) | |||||||||||||||||||
CCO Holdings LLC / CCO Holdings Capital Corp. | 12/20/2028 | (5.000 | %) | 2.369 | % | (3,500,000 | ) | Quarterly | (383,634 | ) | (332,058 | ) | (51,576 | ) | ||||||||||||||||||
CDX North America High Yield Index Series 41 | 12/20/2028 | (5.000 | %) | 3.562 | % | (13,860,000 | ) | Quarterly | (808,493 | ) | (64,795 | ) | (743,698 | ) | ||||||||||||||||||
Centrica PLC | 12/20/2028 | (1.000 | %) | 0.583 | % | EUR | (800,000 | ) | Quarterly | (17,115 | ) | (10,751 | ) | (6,364 | ) | |||||||||||||||||
Citigroup, Inc. | 12/20/2028 | (1.000 | %) | 0.636 | % | $ | (4,500,000 | ) | Quarterly | (73,217 | ) | (43,408 | ) | (29,809 | ) | |||||||||||||||||
CNH Industrial N.V. | 12/20/2028 | (5.000 | %) | 1.018 | % | EUR | (3,300,000 | ) | Quarterly | (661,961 | ) | (609,442 | ) | (52,519 | ) | |||||||||||||||||
CSC Holdings LLC | 12/20/2028 | (5.000 | %) | 17.716 | % | $ | (300,000 | ) | Quarterly | 92,881 | 103,875 | (10,994 | ) | |||||||||||||||||||
CVS Health Corp. | 12/20/2028 | (1.000 | %) | 0.499 | % | (4,550,000 | ) | Quarterly | (102,265 | ) | (70,329 | ) | (31,936 | ) | ||||||||||||||||||
Deutsche Bank AG | 12/20/2028 | (1.000 | %) | 1.219 | % | EUR | (800,000 | ) | Quarterly | 42,311 | 24,916 | 17,395 | ||||||||||||||||||||
EDP Finance B.V. | 12/20/2028 | (1.000 | %) | 0.586 | % | (3,750,000 | ) | Quarterly | (79,660 | ) | (31,195 | ) | (48,465 | ) | ||||||||||||||||||
Electrolux AB | 12/20/2028 | (1.000 | %) | 1.308 | % | (4,500,000 | ) | Quarterly | 69,030 | 92,920 | (23,890 | ) | ||||||||||||||||||||
Enbridge, Inc. | 12/20/2028 | (1.000 | %) | 0.769 | % | $ | (900,000 | ) | Quarterly | (9,242 | ) | 797 | (10,039 | ) | ||||||||||||||||||
Enel SpA | 12/20/2028 | (1.000 | %) | 0.703 | % | EUR | (700,000 | ) | Quarterly | (10,609 | ) | 1,359 | (11,968 | ) | ||||||||||||||||||
Engie S.A. | 12/20/2028 | (1.000 | %) | 0.381 | % | (3,450,000 | ) | Quarterly | (110,484 | ) | (77,076 | ) | (33,408 | ) | ||||||||||||||||||
Exelon Corp. | 12/20/2028 | (1.000 | %) | 0.377 | % | $ | (4,100,000 | ) | Quarterly | (115,199 | ) | (109,692 | ) | (5,507 | ) | |||||||||||||||||
Expedia Group, Inc. | 12/20/2028 | (1.000 | %) | 0.752 | % | (4,500,000 | ) | Quarterly | (49,500 | ) | 38,567 | (88,067 | ) | |||||||||||||||||||
FirstEnergy Corp. | 12/20/2028 | (1.000 | %) | 0.622 | % | (4,500,000 | ) | Quarterly | (76,057 | ) | (39,053 | ) | (37,004 | ) | ||||||||||||||||||
Freeport-McMoRan, Inc. | 12/20/2028 | (1.000 | %) | 1.097 | % | (800,000 | ) | Quarterly | 3,404 | 20,096 | (16,692 | ) | ||||||||||||||||||||
Gap, Inc. (The) | 12/20/2028 | (1.000 | %) | 2.762 | % | (900,000 | ) | Quarterly | 65,053 | 123,750 | (58,697 | ) | ||||||||||||||||||||
General Electric Co. | 12/20/2028 | (1.000 | %) | 0.447 | % | (1,100,000 | ) | Quarterly | (27,350 | ) | (22,183 | ) | (5,167 | ) | ||||||||||||||||||
Goldman Sachs Group, Inc. (The) | 12/20/2028 | (1.000 | %) | 0.697 | % | (900,000 | ) | Quarterly | (12,155 | ) | 2,781 | (14,936 | ) | |||||||||||||||||||
The accompanying notes are an integral part of these financial statements.
| 60 | Litman Gregory Funds Trust | |||||
Table of Contents
iMGP Alternative Strategies Fund
CONSOLIDATED SCHEDULE OF INVESTMENTS IN SWAPS at December 31, 2023 (Continued)
| CENTRALLY CLEARED CREDIT DEFAULT SWAP CONTRACTS (1)(2)(3) (CONTINUED) | ||||||||||||||||||||||||||||||||
| Description | Maturity Date | Fixed Deal (Pay) Rate | Implied Credit Spread at December 31, 2023 | Notional Amount(4) | Periodic Payment Frequency | Fair Value | Upfront Premiums Paid / (Received) | Unrealized Appreciation / (Depreciation) | ||||||||||||||||||||||||
Buy Protection (Continued) |
| |||||||||||||||||||||||||||||||
Hapag-Lloyd AG | 12/20/2028 | (5.000 | %) | 2.830 | % | EUR | (1,900,000 | ) | Quarterly | $ | (193,119 | ) | $ | (226,316 | ) | $ | 33,197 | |||||||||||||||
Heidelberg Materials AG | 12/20/2028 | (5.000 | %) | 0.989 | % | (700,000 | ) | Quarterly | (141,574 | ) | (117,529 | ) | (24,045 | ) | ||||||||||||||||||
Holcim AG | 12/20/2028 | (1.000 | %) | 0.754 | % | (700,000 | ) | Quarterly | (8,787 | ) | 6,065 | (14,852 | ) | |||||||||||||||||||
Host Hotels & Resorts L.P. | 12/20/2028 | (1.000 | %) | 0.895 | % | $ | (800,000 | ) | Quarterly | (3,707 | ) | 3,863 | (7,570 | ) | ||||||||||||||||||
Howmet Aerospace, Inc. | 12/20/2028 | (1.000 | %) | 0.779 | % | (800,000 | ) | Quarterly | (7,842 | ) | (1,413 | ) | (6,429 | ) | ||||||||||||||||||
HP, Inc. | 12/20/2028 | (1.000 | %) | 0.717 | % | (3,750,000 | ) | Quarterly | (47,146 | ) | 10,133 | (57,279 | ) | |||||||||||||||||||
ING Groep N.V. | 12/20/2028 | (1.000 | %) | 0.575 | % | EUR | (4,250,000 | ) | Quarterly | (92,716 | ) | (63,448 | ) | (29,268 | ) | |||||||||||||||||
International Paper Co. | 12/20/2028 | (1.000 | %) | 0.496 | % | $ | (4,500,000 | ) | Quarterly | (101,716 | ) | (68,469 | ) | (33,247 | ) | |||||||||||||||||
ITV PLC | 12/20/2028 | (5.000 | %) | 1.057 | % | EUR | (3,650,000 | ) | Quarterly | (723,773 | ) | (619,938 | ) | (103,835 | ) | |||||||||||||||||
KB Home | 12/20/2028 | (5.000 | %) | 1.403 | % | $ | (700,000 | ) | Quarterly | (108,996 | ) | (97,492 | ) | (11,504 | ) | |||||||||||||||||
Koninklijke KPN N.V. | 12/20/2028 | (1.000 | %) | 0.440 | % | EUR | (700,000 | ) | Quarterly | (20,213 | ) | (13,457 | ) | (6,756 | ) | |||||||||||||||||
Koninklijke Philips N.V. | 12/20/2028 | (1.000 | %) | 0.587 | % | (4,200,000 | ) | Quarterly | (88,880 | ) | (79,027 | ) | (9,853 | ) | ||||||||||||||||||
Kroger Co. (The) | 12/20/2028 | (1.000 | %) | 0.533 | % | $ | (4,600,000 | ) | Quarterly | (96,248 | ) | (62,545 | ) | (33,703 | ) | |||||||||||||||||
Lennar Corp. | 12/20/2028 | (5.000 | %) | 0.770 | % | (700,000 | ) | Quarterly | (131,467 | ) | (125,999 | ) | (5,468 | ) | ||||||||||||||||||
Lincoln National Corp. | 12/20/2028 | (1.000 | %) | 1.667 | % | (900,000 | ) | Quarterly | 25,717 | 53,578 | (27,861 | ) | ||||||||||||||||||||
Marks & Spencer PLC | 12/20/2028 | (1.000 | %) | 0.977 | % | EUR | (700,000 | ) | Quarterly | (808 | ) | 19,547 | (20,355 | ) | ||||||||||||||||||
McKesson Corp. | 12/20/2028 | (1.000 | %) | 0.380 | % | $ | (4,400,000 | ) | Quarterly | (122,964 | ) | (113,253 | ) | (9,711 | ) | |||||||||||||||||
Mediobanca Banca di Credito Finanziario SpA | 12/20/2028 | (1.000 | %) | 0.749 | % | EUR | (800,000 | ) | Quarterly | 2,006 | (394 | ) | 2,400 | |||||||||||||||||||
MetLife, Inc. | 12/20/2028 | (1.000 | %) | 0.740 | % | $ | (800,000 | ) | Quarterly | (9,239 | ) | 2,476 | (11,715 | ) | ||||||||||||||||||
MGIC Investment Corp. | 12/20/2028 | (5.000 | %) | 1.242 | % | (800,000 | ) | Quarterly | (130,958 | ) | (120,435 | ) | (10,523 | ) | ||||||||||||||||||
MGM Resorts International | 12/20/2028 | (5.000 | %) | 1.936 | % | (4,150,000 | ) | Quarterly | (538,937 | ) | (424,054 | ) | (114,883 | ) | ||||||||||||||||||
Motorola Solutions, Inc. | 12/20/2028 | (1.000 | %) | 0.388 | % | (800,000 | ) | Quarterly | (22,067 | ) | (15,865 | ) | (6,202 | ) | ||||||||||||||||||
Nabors Industries, Inc. | 12/20/2028 | (1.000 | %) | 6.762 | % | (4,800,000 | ) | Quarterly | 974,954 | 1,016,125 | (41,171 | ) | ||||||||||||||||||||
NatWest Group PLC | 12/20/2028 | (1.000 | %) | 0.735 | % | EUR | (3,700,000 | ) | Quarterly | (50,049 | ) | 10,766 | (60,815 | ) | ||||||||||||||||||
The accompanying notes are an integral part of these financial statements.
| Schedule of Investments | 61 | |||||
Table of Contents
iMGP Alternative Strategies Fund
CONSOLIDATED SCHEDULE OF INVESTMENTS IN SWAPS at December 31, 2023 (Continued)
| CENTRALLY CLEARED CREDIT DEFAULT SWAP CONTRACTS (1)(2)(3) (CONTINUED) | ||||||||||||||||||||||||||||||||
| Description | Maturity Date | Fixed Deal (Pay) Rate | Implied Credit Spread at December 31, 2023 | Notional Amount(4) | Periodic Payment Frequency | Fair Value | Upfront Premiums Paid / (Received) | Unrealized Appreciation / (Depreciation) | ||||||||||||||||||||||||
Buy Protection (Continued) |
| |||||||||||||||||||||||||||||||
Navient Corp. | 12/20/2028 | (5.000 | %) | 2.828 | % | $ | (800,000 | ) | Quarterly | $ | (71,112 | ) | $ | (31,457 | ) | $ | (39,655 | ) | ||||||||||||||
Netflix, Inc. | 12/20/2028 | (5.000 | %) | 0.469 | % | (650,000 | ) | Quarterly | (132,371 | ) | (127,461 | ) | (4,910 | ) | ||||||||||||||||||
Newell Brands, Inc. | 12/20/2028 | (1.000 | %) | 3.728 | % | (5,100,000 | ) | Quarterly | 549,754 | 623,322 | (73,568 | ) | ||||||||||||||||||||
Next Group PLC | 12/20/2028 | (1.000 | %) | 0.681 | % | EUR | (700,000 | ) | Quarterly | (11,403 | ) | 2,707 | (14,110 | ) | ||||||||||||||||||
Nokia Oyj | 12/20/2028 | (5.000 | %) | 1.147 | % | (3,500,000 | ) | Quarterly | (675,792 | ) | (550,960 | ) | (124,832 | ) | ||||||||||||||||||
NRG Energy, Inc. | 12/20/2028 | (5.000 | %) | 1.820 | % | $ | (700,000 | ) | Quarterly | (94,775 | ) | (58,790 | ) | (35,985 | ) | |||||||||||||||||
Occidental Petroleum Corp. | 12/20/2028 | (1.000 | %) | 1.073 | % | (1,100,000 | ) | Quarterly | 3,503 | (47 | ) | 3,550 | ||||||||||||||||||||
Olin Corp. | 12/20/2028 | (1.000 | %) | 1.207 | % | (4,700,000 | ) | Quarterly | 42,519 | 186,027 | (143,508 | ) | ||||||||||||||||||||
Omnicom Group, Inc. / Omnicom Capital, Inc. | 12/20/2028 | (1.000 | %) | 0.394 | % | (4,500,000 | ) | Quarterly | (122,902 | ) | (101,876 | ) | (21,026 | ) | ||||||||||||||||||
PostNL N.V. | 12/20/2028 | (1.000 | %) | 1.127 | % | EUR | (4,000,000 | ) | Quarterly | 25,524 | 86,960 | (61,436 | ) | |||||||||||||||||||
Prudential Funding Asia PLC | 12/20/2028 | (1.000 | %) | 0.661 | % | (4,200,000 | ) | Quarterly | (72,705 | ) | (55,654 | ) | (17,051 | ) | ||||||||||||||||||
PulteGroup, Inc. | 12/20/2028 | (5.000 | %) | 0.776 | % | $ | (700,000 | ) | Quarterly | (131,264 | ) | (118,207 | ) | (13,057 | ) | |||||||||||||||||
Radian Group, Inc. | 12/20/2028 | (5.000 | %) | 1.242 | % | (700,000 | ) | Quarterly | (114,602 | ) | (97,513 | ) | (17,089 | ) | ||||||||||||||||||
Realogy Group LLC / Realogy Co-Issuer Corp. | 12/20/2028 | (5.000 | %) | 8.728 | % | (2,500,000 | ) | Quarterly | 305,900 | 600,000 | (294,100 | ) | ||||||||||||||||||||
Rentokil Initial PLC | 12/20/2028 | (1.000 | %) | 0.555 | % | EUR | (3,200,000 | ) | Quarterly | (73,044 | ) | (60,139 | ) | (12,905 | ) | |||||||||||||||||
Rolls-Royce PLC | 12/20/2028 | (1.000 | %) | 1.173 | % | (900,000 | ) | Quarterly | 7,792 | 40,908 | (33,116 | ) | ||||||||||||||||||||
Royal Caribbean Cruises Ltd. | 12/20/2028 | (5.000 | %) | 2.099 | % | $ | (800,000 | ) | Quarterly | (97,712 | ) | (57,389 | ) | (40,323 | ) | |||||||||||||||||
Ryder System, Inc. | 12/20/2028 | (1.000 | %) | 0.720 | % | (800,000 | ) | Quarterly | (9,981 | ) | 6,339 | (16,320 | ) | |||||||||||||||||||
Sherwin-Williams Co. (The) | 12/20/2028 | (1.000 | %) | 0.514 | % | (900,000 | ) | Quarterly | (19,630 | ) | (8,450 | ) | (11,180 | ) | ||||||||||||||||||
Sirius XM Radio, Inc. | 12/20/2028 | (5.000 | %) | 2.066 | % | (4,050,000 | ) | Quarterly | (500,899 | ) | (384,157 | ) | (116,742 | ) | ||||||||||||||||||
Southwest Airlines Co. | 12/20/2028 | (1.000 | %) | 0.925 | % | (4,500,000 | ) | Quarterly | (14,947 | ) | 24,025 | (38,972 | ) | |||||||||||||||||||
Standard Chartered PLC | 12/20/2028 | (1.000 | %) | 0.750 | % | EUR | (3,700,000 | ) | Quarterly | (47,043 | ) | (28,381 | ) | (18,662 | ) | |||||||||||||||||
Stellantis N.V. | 12/20/2028 | (5.000 | %) | 1.134 | % | (700,000 | ) | Quarterly | (135,683 | ) | (114,767 | ) | (20,916 | ) | ||||||||||||||||||
The accompanying notes are an integral part of these financial statements.
| 62 | Litman Gregory Funds Trust | |||||
Table of Contents
iMGP Alternative Strategies Fund
CONSOLIDATED SCHEDULE OF INVESTMENTS IN SWAPS at December 31, 2023 (Continued)
| CENTRALLY CLEARED CREDIT DEFAULT SWAP CONTRACTS (1)(2)(3) (CONTINUED) | ||||||||||||||||||||||||||||||||
| Description | Maturity Date | Fixed Deal (Pay) Rate | Implied Credit Spread at December 31, 2023 | Notional Amount(4) | Periodic Payment Frequency | Fair Value | Upfront Premiums Paid / (Received) | Unrealized Appreciation / (Depreciation) | ||||||||||||||||||||||||
Buy Protection (Continued) |
| |||||||||||||||||||||||||||||||
Stora Enso Oyj | 12/20/2028 | (5.000 | %) | 0.809 | % | EUR | (3,600,000 | ) | Quarterly | $ | (766,355 | ) | $ | (727,633 | ) | $ | (38,722 | ) | ||||||||||||||
Target Corp. | 12/20/2028 | (1.000 | %) | 0.384 | % | $ | (2,500,000 | ) | Quarterly | (69,478 | ) | (56,381 | ) | (13,097 | ) | |||||||||||||||||
Teck Resources Ltd. | 12/20/2028 | (5.000 | %) | 1.134 | % | (700,000 | ) | Quarterly | (118,416 | ) | (96,492 | ) | (21,924 | ) | ||||||||||||||||||
Telecom Italia SpA | 12/20/2028 | (1.000 | %) | 2.166 | % | EUR | (900,000 | ) | Quarterly | 50,433 | 71,402 | (20,969 | ) | |||||||||||||||||||
Telefonica Emisiones S.A. | 12/20/2028 | (1.000 | %) | 0.676 | % | (1,100,000 | ) | Quarterly | (18,224 | ) | (6,235 | ) | (11,989 | ) | ||||||||||||||||||
Telenor ASA | 12/20/2028 | (1.000 | %) | 0.236 | % | (3,850,000 | ) | Quarterly | (153,076 | ) | (120,299 | ) | (32,777 | ) | ||||||||||||||||||
Telia Co. AB | 12/20/2028 | (1.000 | %) | 0.297 | % | (4,250,000 | ) | Quarterly | (155,062 | ) | (106,291 | ) | (48,771 | ) | ||||||||||||||||||
Tenet Healthcare Corp. | 12/20/2028 | (5.000 | %) | 2.451 | % | $ | (4,000,000 | ) | Quarterly | (423,388 | ) | (202,482 | ) | (220,906 | ) | |||||||||||||||||
Tesla, Inc. | 12/20/2028 | (1.000 | %) | 1.115 | % | (1,150,000 | ) | Quarterly | 5,778 | 13,600 | (7,822 | ) | ||||||||||||||||||||
thyssenkrupp AG | 12/20/2028 | (1.000 | %) | 1.633 | % | EUR | (4,400,000 | ) | Quarterly | 136,875 | 214,832 | (77,957 | ) | |||||||||||||||||||
Toll Brothers Finance Corp. | 12/20/2028 | (1.000 | %) | 0.962 | % | $ | (800,000 | ) | Quarterly | (1,328 | ) | 8,779 | (10,107 | ) | ||||||||||||||||||
Transocean, Inc. | 12/20/2028 | (1.000 | %) | 4.810 | % | (1,000,000 | ) | Quarterly | 144,459 | 173,750 | (29,291 | ) | ||||||||||||||||||||
Tyson Foods, Inc. | 12/20/2028 | (1.000 | %) | 0.702 | % | (4,000,000 | ) | Quarterly | (53,067 | ) | (42,841 | ) | (10,226 | ) | ||||||||||||||||||
UniCredit SpA | 12/20/2028 | (1.000 | %) | 0.751 | % | EUR | (800,000 | ) | Quarterly | (10,151 | ) | 1,180 | (11,331 | ) | ||||||||||||||||||
United Airlines Holdings, Inc. | 12/20/2028 | (5.000 | %) | 4.775 | % | $ | (4,500,000 | ) | Quarterly | (38,437 | ) | 149,135 | (187,572 | ) | ||||||||||||||||||
United Rentals North America, Inc. | 12/20/2028 | (5.000 | %) | 1.043 | % | (3,850,000 | ) | Quarterly | (668,947 | ) | (584,800 | ) | (84,147 | ) | ||||||||||||||||||
Universal Health Services, Inc. | 12/20/2028 | (1.000 | %) | 0.848 | % | (4,650,000 | ) | Quarterly | (31,368 | ) | 49,844 | (81,212 | ) | |||||||||||||||||||
Valeo SE | 12/20/2028 | (1.000 | %) | 2.220 | % | EUR | (3,000,000 | ) | Quarterly | 175,613 | 280,012 | (104,399 | ) | |||||||||||||||||||
Valeo SE | 12/20/2028 | (1.000 | %) | 2.220 | % | (1,600,000 | ) | Quarterly | 93,661 | 126,220 | (32,559 | ) | ||||||||||||||||||||
Valero Energy Corp. | 12/20/2028 | (1.000 | %) | 0.734 | % | $ | (4,500,000 | ) | Quarterly | (53,214 | ) | (59,649 | ) | 6,435 | ||||||||||||||||||
Verizon Communications, Inc. | 12/20/2028 | (1.000 | %) | 0.738 | % | (800,000 | ) | Quarterly | (9,323 | ) | (6,759 | ) | (2,564 | ) | ||||||||||||||||||
Vodafone Group PLC | 12/20/2028 | (1.000 | %) | 0.645 | % | EUR | (4,200,000 | ) | Quarterly | (76,260 | ) | (33,137 | ) | (43,123 | ) | |||||||||||||||||
Volkswagen International Finance N.V. | 12/20/2028 | (1.000 | %) | 1.020 | % | (2,000,000 | ) | Quarterly | 1,993 | 47,699 | (45,706 | ) | ||||||||||||||||||||
Wendel SE | 12/20/2028 | (5.000 | %) | 0.863 | % | (3,500,000 | ) | Quarterly | (733,940 | ) | (666,121 | ) | (67,819 | ) | ||||||||||||||||||
The accompanying notes are an integral part of these financial statements.
| Schedule of Investments | 63 | |||||
Table of Contents
iMGP Alternative Strategies Fund
CONSOLIDATED SCHEDULE OF INVESTMENTS IN SWAPS at December 31, 2023 (Continued)
| CENTRALLY CLEARED CREDIT DEFAULT SWAP CONTRACTS (1)(2)(3) (CONTINUED) | ||||||||||||||||||||||||||||||||
| Description | Maturity Date | Fixed Deal (Pay) Rate | Implied Credit Spread at December 31, 2023 | Notional Amount(4) | Periodic Payment Frequency | Fair Value | Upfront Premiums Paid / (Received) | Unrealized Appreciation / (Depreciation) | ||||||||||||||||||||||||
Buy Protection (Continued) |
| |||||||||||||||||||||||||||||||
Whirlpool Corp. | 12/20/2028 | (1.000 | %) | 1.426 | % | $ | (4,300,000 | ) | Quarterly | $ | 79,244 | $ | 165,370 | $ | (86,126 | ) | ||||||||||||||||
WPP Finance S.A. | 12/20/2028 | (1.000 | %) | 0.726 | % | EUR | (4,250,000 | ) | Quarterly | (59,321 | ) | (17,627 | ) | (41,694 | ) | |||||||||||||||||
|
|
|
|
|
| |||||||||||||||||||||||||||
Total Buy Protection |
| $ | (12,202,658 | ) | $ | (6,637,886 | ) | $ | (5,564,772 | ) | ||||||||||||||||||||||
|
|
|
|
|
| |||||||||||||||||||||||||||
Sell Protection |
| |||||||||||||||||||||||||||||||
Accor S.A. | 12/20/2028 | 1.000 | % | 0.901 | % | EUR | 4,200,000 | Quarterly | $ | 21,019 | $ | (11,495 | ) | $ | 32,514 | |||||||||||||||||
ADT Security Corp. (The) | 12/20/2028 | 5.000 | % | 1.466 | % | $ | 800,000 | Quarterly | 122,073 | 111,799 | 10,274 | |||||||||||||||||||||
AES Corp. (The) | 12/20/2028 | 5.000 | % | 1.175 | % | 700,000 | Quarterly | 116,971 | 96,993 | 19,978 | ||||||||||||||||||||||
Airbus SE | 12/20/2028 | 1.000 | % | 0.485 | % | EUR | 4,250,000 | Quarterly | 112,644 | 62,675 | 49,969 | |||||||||||||||||||||
Ally Financial, Inc. | 12/20/2028 | 5.000 | % | 1.771 | % | $ | 1,500,000 | Quarterly | 206,593 | 178,337 | 28,256 | |||||||||||||||||||||
Alstom S.A. | 12/20/2028 | 1.000 | % | 1.901 | % | EUR | 700,000 | Quarterly | (30,635 | ) | (38,417 | ) | 7,782 | |||||||||||||||||||
American Airlines Group, Inc. | 12/20/2028 | 5.000 | % | 6.497 | % | $ | 1,800,000 | Quarterly | (95,932 | ) | (166,500 | ) | 70,568 | |||||||||||||||||||
American Express Co. | 12/20/2028 | 1.000 | % | 0.404 | % | 800,000 | Quarterly | 21,480 | 14,399 | 7,081 | ||||||||||||||||||||||
American International Group, Inc. | 12/20/2028 | 1.000 | % | 0.593 | % | 4,400,000 | Quarterly | 80,008 | 33,644 | 46,364 | ||||||||||||||||||||||
Amkor Technology, Inc. | 12/20/2028 | 5.000 | % | 0.903 | % | 700,000 | Quarterly | 126,635 | 118,311 | 8,324 | ||||||||||||||||||||||
Anglo American Capital PLC | 12/20/2028 | 5.000 | % | 1.432 | % | EUR | 700,000 | Quarterly | 123,711 | 108,461 | 15,250 | |||||||||||||||||||||
Apache Corp. | 12/20/2028 | 1.000 | % | 1.389 | % | $ | 3,750,000 | Quarterly | (63,235 | ) | (51,784 | ) | (11,451 | ) | ||||||||||||||||||
Assicurazioni Generali SpA | 12/20/2028 | 1.000 | % | 0.719 | % | EUR | 4,250,000 | Quarterly | 60,972 | 32,338 | 28,634 | |||||||||||||||||||||
Avis Budget Car Rental LLC / Avis Budget Finance, Inc. | 12/20/2028 | 5.000 | % | 3.473 | % | $ | 800,000 | Quarterly | 48,733 | 49,821 | (1,088 | ) | ||||||||||||||||||||
Banco Santander S.A. | 12/20/2028 | 1.000 | % | 0.797 | % | EUR | 3,200,000 | Quarterly | 77,908 | 4,002 | 73,906 | |||||||||||||||||||||
Barclays PLC | 12/20/2028 | 1.000 | % | 0.879 | % | 800,000 | Quarterly | 4,892 | (6,258 | ) | 11,150 | |||||||||||||||||||||
Baxter International, Inc. | 12/20/2028 | 1.000 | % | 0.719 | % | $ | 700,000 | Quarterly | 8,761 | 3,411 | 5,350 | |||||||||||||||||||||
Block Financial LLC | 12/20/2028 | 5.000 | % | 0.559 | % | 3,650,000 | Quarterly | 725,951 | 696,562 | 29,389 | ||||||||||||||||||||||
Bombardier, Inc. | 12/20/2028 | 5.000 | % | 3.463 | % | 700,000 | Quarterly | 42,949 | 36,517 | 6,432 | ||||||||||||||||||||||
Bouygues S.A. | 12/20/2028 | 1.000 | % | 0.333 | % | EUR | 700,000 | Quarterly | 24,204 | 17,686 | 6,518 | |||||||||||||||||||||
The accompanying notes are an integral part of these financial statements.
| 64 | Litman Gregory Funds Trust | |||||
Table of Contents
iMGP Alternative Strategies Fund
CONSOLIDATED SCHEDULE OF INVESTMENTS IN SWAPS at December 31, 2023 (Continued)
| CENTRALLY CLEARED CREDIT DEFAULT SWAP CONTRACTS (1)(2)(3) (CONTINUED) | ||||||||||||||||||||||||||||||||
| Description | Maturity Date | Fixed Deal (Pay) Rate | Implied Credit Spread at December 31, 2023 | Notional Amount(4) | Periodic Payment Frequency | Fair Value | Upfront Premiums Paid / (Received) | Unrealized Appreciation / (Depreciation) | ||||||||||||||||||||||||
Sell Protection (Continued) |
| |||||||||||||||||||||||||||||||
BP Capital Markets PLC | 12/20/2028 | 1.000 | % | 0.626 | % | EUR | 4,200,000 | Quarterly | $ | 80,482 | $ | 53,274 | $ | 27,208 | ||||||||||||||||||
British Telecommunications PLC | 12/20/2028 | 1.000 | % | 0.754 | % | 700,000 | Quarterly | 8,770 | (678 | ) | 9,448 | |||||||||||||||||||||
Cardinal Health, Inc. | 12/20/2028 | 1.000 | % | 0.394 | % | $ | 700,000 | Quarterly | 19,130 | 15,521 | 3,609 | |||||||||||||||||||||
Carlsberg Breweries AS | 12/20/2028 | 1.000 | % | 0.281 | % | EUR | 800,000 | Quarterly | 29,849 | 25,156 | 4,693 | |||||||||||||||||||||
Carnival Corp. | 12/20/2028 | 1.000 | % | 3.609 | % | $ | 6,650,000 | Quarterly | (688,826 | ) | (1,000,281 | ) | 311,455 | |||||||||||||||||||
Centrica PLC | 12/20/2028 | 1.000 | % | 0.583 | % | EUR | 4,200,000 | Quarterly | 89,855 | 45,394 | 44,461 | |||||||||||||||||||||
Citigroup, Inc. | 12/20/2028 | 1.000 | % | 0.636 | % | $ | 600,000 | Quarterly | 9,763 | 2,404 | 7,359 | |||||||||||||||||||||
Clariant AG | 12/20/2028 | 1.000 | % | 1.094 | % | EUR | 2,250,000 | Quarterly | (10,633 | ) | (28,612 | ) | 17,979 | |||||||||||||||||||
CVS Health Corp. | 12/20/2028 | 1.000 | % | 0.499 | % | $ | 900,000 | Quarterly | 20,228 | 13,755 | 6,473 | |||||||||||||||||||||
DaVita, Inc. | 12/20/2028 | 5.000 | % | 2.057 | % | 3,200,000 | Quarterly | 397,210 | 380,131 | 17,079 | ||||||||||||||||||||||
Deutsche Bank AG | 12/20/2028 | 1.000 | % | 1.219 | % | EUR | 4,400,000 | Quarterly | (48,072 | ) | (157,701 | ) | 109,629 | |||||||||||||||||||
Deutsche Lufthansa AG | 12/20/2028 | 1.000 | % | 1.578 | % | 4,000,000 | Quarterly | (113,874 | ) | (225,771 | ) | 111,897 | ||||||||||||||||||||
DR Horton, Inc. | 12/20/2028 | 1.000 | % | 0.515 | % | $ | 1,900,000 | Quarterly | 41,321 | 27,369 | 13,952 | |||||||||||||||||||||
Electrolux AB | 12/20/2028 | 1.000 | % | 1.308 | % | EUR | 600,000 | Quarterly | (9,204 | ) | (33,235 | ) | 24,031 | |||||||||||||||||||
Elis S.A. | 12/20/2028 | 5.000 | % | 0.999 | % | 1,700,000 | Quarterly | 342,885 | 266,548 | 76,337 | ||||||||||||||||||||||
Enbridge, Inc. | 12/20/2028 | 1.000 | % | 0.769 | % | $ | 4,700,000 | Quarterly | 48,264 | 17,173 | 31,091 | |||||||||||||||||||||
Enel SpA | 12/20/2028 | 1.000 | % | 0.703 | % | EUR | 4,300,000 | Quarterly | 65,169 | 18,216 | 46,953 | |||||||||||||||||||||
Exelon Corp. | 12/20/2028 | 1.000 | % | 0.377 | % | $ | 1,100,000 | Quarterly | 30,907 | 23,364 | 7,543 | |||||||||||||||||||||
Expedia Group, Inc. | 12/20/2028 | 1.000 | % | 0.752 | % | 2,550,000 | Quarterly | 28,050 | 6,799 | 21,251 | ||||||||||||||||||||||
FirstEnergy Corp. | 12/20/2028 | 1.000 | % | 0.622 | % | 800,000 | Quarterly | 13,522 | 5,714 | 7,808 | ||||||||||||||||||||||
Freeport-McMoRan, Inc. | 12/20/2028 | 1.000 | % | 1.097 | % | 4,700,000 | Quarterly | (19,995 | ) | (97,658 | ) | 77,663 | ||||||||||||||||||||
Gap, Inc. (The) | 12/20/2028 | 1.000 | % | 2.762 | % | 5,350,000 | Quarterly | (386,702 | ) | (774,500 | ) | 387,798 | ||||||||||||||||||||
General Electric Co. | 12/20/2028 | 1.000 | % | 0.447 | % | 4,700,000 | Quarterly | 116,860 | 68,911 | 47,949 | ||||||||||||||||||||||
Glencore Finance Europe Ltd. | 12/20/2028 | 5.000 | % | 1.316 | % | EUR | 3,100,000 | Quarterly | 568,338 | 486,251 | 82,087 | |||||||||||||||||||||
The accompanying notes are an integral part of these financial statements.
| Schedule of Investments | 65 | |||||
Table of Contents
iMGP Alternative Strategies Fund
CONSOLIDATED SCHEDULE OF INVESTMENTS IN SWAPS at December 31, 2023 (Continued)
| CENTRALLY CLEARED CREDIT DEFAULT SWAP CONTRACTS (1)(2)(3) (CONTINUED) | ||||||||||||||||||||||||||||||||
| Description | Maturity Date | Fixed Deal (Pay) Rate | Implied Credit Spread at December 31, 2023 | Notional Amount(4) | Periodic Payment Frequency | Fair Value | Upfront Premiums Paid / (Received) | Unrealized Appreciation / (Depreciation) | ||||||||||||||||||||||||
Sell Protection (Continued) |
| |||||||||||||||||||||||||||||||
Goldman Sachs Group, Inc. (The) | 12/20/2028 | 1.000 | % | 0.697 | % | $ | 4,600,000 | Quarterly | $ | 62,126 | $ | 25,139 | $ | 36,987 | ||||||||||||||||||
Goodyear Tire & Rubber Co. (The) | 12/20/2028 | 5.000 | % | 2.625 | % | 2,500,000 | Quarterly | 244,878 | 103,379 | 141,499 | ||||||||||||||||||||||
Heidelberg Materials AG | 12/20/2028 | 5.000 | % | 0.989 | % | EUR | 3,700,000 | Quarterly | 748,321 | 663,559 | 84,762 | |||||||||||||||||||||
Holcim AG | 12/20/2028 | 1.000 | % | 0.754 | % | 4,300,000 | Quarterly | 53,974 | (36,152 | ) | 90,126 | |||||||||||||||||||||
Host Hotels & Resorts L.P. | 12/20/2028 | 1.000 | % | 0.895 | % | $ | 2,600,000 | Quarterly | 12,047 | (39,870 | ) | 51,917 | ||||||||||||||||||||
Host Hotels & Resorts L.P. | 12/20/2028 | 1.000 | % | 0.895 | % | 1,900,000 | Quarterly | 8,804 | (29,900 | ) | 38,704 | |||||||||||||||||||||
Howmet Aerospace, Inc. | 12/20/2028 | 1.000 | % | 0.779 | % | 4,500,000 | Quarterly | 44,112 | (5,110 | ) | 49,222 | |||||||||||||||||||||
ING Groep N.V. | 12/20/2028 | 1.000 | % | 0.575 | % | EUR | 700,000 | Quarterly | 15,270 | 7,883 | 7,387 | |||||||||||||||||||||
International Business Machines Corp. | 12/20/2028 | 1.000 | % | 0.427 | % | $ | 3,500,000 | Quarterly | 90,270 | 91,893 | (1,623 | ) | ||||||||||||||||||||
International Paper Co. | 12/20/2028 | 1.000 | % | 0.496 | % | 800,000 | Quarterly | 18,082 | 10,392 | 7,690 | ||||||||||||||||||||||
ITV PLC | 12/20/2028 | 5.000 | % | 1.057 | % | EUR | 700,000 | Quarterly | 138,806 | 121,606 | 17,200 | |||||||||||||||||||||
KB Home | 12/20/2028 | 5.000 | % | 1.403 | % | $ | 3,850,000 | Quarterly | 599,479 | 527,393 | 72,086 | |||||||||||||||||||||
Koninklijke KPN N.V. | 12/20/2028 | 1.000 | % | 0.440 | % | EUR | 4,200,000 | Quarterly | 121,275 | 77,389 | 43,886 | |||||||||||||||||||||
Koninklijke Philips N.V. | 12/20/2028 | 1.000 | % | 0.587 | % | 1,000,000 | Quarterly | 21,162 | 15,455 | 5,707 | ||||||||||||||||||||||
Kroger Co. (The) | 12/20/2028 | 1.000 | % | 0.533 | % | $ | 600,000 | Quarterly | 12,554 | 7,533 | 5,021 | |||||||||||||||||||||
Lennar Corp. | 12/20/2028 | 5.000 | % | 0.770 | % | 3,750,000 | Quarterly | 704,285 | 664,496 | 39,789 | ||||||||||||||||||||||
Lincoln National Corp. | 12/20/2028 | 1.000 | % | 1.667 | % | 4,800,000 | Quarterly | (137,155 | ) | (275,599 | ) | 138,444 | ||||||||||||||||||||
Marks & Spencer PLC | 12/20/2028 | 1.000 | % | 0.977 | % | EUR | 4,400,000 | Quarterly | 5,083 | (139,255 | ) | 144,338 | ||||||||||||||||||||
McKesson Corp. | 12/20/2028 | 1.000 | % | 0.380 | % | $ | 700,000 | Quarterly | 19,563 | 18,440 | 1,123 | |||||||||||||||||||||
MDC Holdings, Inc. | 12/20/2028 | 1.000 | % | 1.158 | % | 2,500,000 | Quarterly | (17,283 | ) | (33,901 | ) | 16,618 | ||||||||||||||||||||
Mediobanca Banca di Credito Finanziario SpA | 12/20/2028 | 1.000 | % | 0.749 | % | EUR | 4,250,000 | Quarterly | 54,237 | 4,251 | 49,986 | |||||||||||||||||||||
MetLife, Inc. | 12/20/2028 | 1.000 | % | 0.740 | % | $ | 4,600,000 | Quarterly | 53,123 | 23,537 | 29,586 | |||||||||||||||||||||
MGIC Investment Corp. | 12/20/2028 | 5.000 | % | 1.242 | % | 3,900,000 | Quarterly | 638,420 | 622,346 | 16,074 | ||||||||||||||||||||||
The accompanying notes are an integral part of these financial statements.
| 66 | Litman Gregory Funds Trust | |||||
Table of Contents
iMGP Alternative Strategies Fund
CONSOLIDATED SCHEDULE OF INVESTMENTS IN SWAPS at December 31, 2023 (Continued)
| CENTRALLY CLEARED CREDIT DEFAULT SWAP CONTRACTS (1)(2)(3) (CONTINUED) | ||||||||||||||||||||||||||||||||
| Description | Maturity Date | Fixed Deal (Pay) Rate | Implied Credit Spread at December 31, 2023 | Notional Amount(4) | Periodic Payment Frequency | Fair Value | Upfront Premiums Paid / (Received) | Unrealized Appreciation / (Depreciation) | ||||||||||||||||||||||||
Sell Protection (Continued) |
| |||||||||||||||||||||||||||||||
MGM Resorts International | 12/20/2028 | 5.000 | % | 1.936 | % | $ | 700,000 | Quarterly | $ | 90,905 | $ | 64,760 | $ | 26,145 | ||||||||||||||||||
Motorola Solutions, Inc. | 12/20/2028 | 1.000 | % | 0.388 | % | 4,500,000 | Quarterly | 124,127 | 114,149 | 9,978 | ||||||||||||||||||||||
Navient Corp. | 12/20/2028 | 5.000 | % | 2.828 | % | 4,300,000 | Quarterly | 382,226 | 210,912 | 171,314 | ||||||||||||||||||||||
Netflix, Inc. | 12/20/2028 | 5.000 | % | 0.469 | % | 3,750,000 | Quarterly | 763,679 | 716,493 | 47,186 | ||||||||||||||||||||||
Newell Brands, Inc. | 12/20/2028 | 1.000 | % | 3.728 | % | 800,000 | Quarterly | (86,236 | ) | (99,407 | ) | 13,171 | ||||||||||||||||||||
Next Group PLC | 12/20/2028 | 1.000 | % | 0.681 | % | EUR | 4,300,000 | Quarterly | 70,049 | (33,373 | ) | 103,422 | ||||||||||||||||||||
Nokia Oyj | 12/20/2028 | 5.000 | % | 1.147 | % | 600,000 | Quarterly | 115,850 | 109,082 | 6,768 | ||||||||||||||||||||||
NRG Energy, Inc. | 12/20/2028 | 5.000 | % | 1.820 | % | $ | 4,250,000 | Quarterly | 575,419 | 313,779 | 261,640 | |||||||||||||||||||||
Occidental Petroleum Corp. | 12/20/2028 | 1.000 | % | 1.073 | % | 4,750,000 | Quarterly | (15,126 | ) | 15,171 | (30,297 | ) | ||||||||||||||||||||
Olin Corp. | 12/20/2028 | 1.000 | % | 1.207 | % | 900,000 | Quarterly | (8,142 | ) | (29,775 | ) | 21,633 | ||||||||||||||||||||
Omnicom Group, Inc. / Omnicom Capital, Inc. | 12/20/2028 | 1.000 | % | 0.394 | % | 1,000,000 | Quarterly | 27,312 | 18,483 | 8,829 | ||||||||||||||||||||||
Pearson Funding PLC | 12/20/2028 | 1.000 | % | 0.557 | % | EUR | 3,000,000 | Quarterly | 68,195 | 47,657 | 20,538 | |||||||||||||||||||||
Pitney Bowes, Inc. | 12/20/2028 | 1.000 | % | 8.058 | % | $ | 3,500,000 | Quarterly | (830,513 | ) | (1,160,000 | ) | 329,487 | |||||||||||||||||||
Premier Foods Finance PLC | 12/20/2028 | 5.000 | % | 1.761 | % | EUR | 1,500,000 | Quarterly | 237,491 | 195,857 | 41,634 | |||||||||||||||||||||
Prudential Financial, Inc. | 12/20/2028 | 1.000 | % | 0.744 | % | $ | 3,700,000 | Quarterly | 42,121 | 18,176 | 23,945 | |||||||||||||||||||||
Prudential Funding Asia PLC | 12/20/2028 | 1.000 | % | 0.661 | % | EUR | 700,000 | Quarterly | 12,117 | 7,298 | 4,819 | |||||||||||||||||||||
PulteGroup, Inc. | 12/20/2028 | 5.000 | % | 0.776 | % | $ | 3,900,000 | Quarterly | 731,330 | 710,081 | 21,249 | |||||||||||||||||||||
Radian Group, Inc. | 12/20/2028 | 5.000 | % | 1.242 | % | 4,000,000 | Quarterly | 654,869 | 623,655 | 31,214 | ||||||||||||||||||||||
Realogy Group LLC / Realogy Co-Issuer Corp. | 12/20/2028 | 5.000 | % | 8.728 | % | 5,100,000 | Quarterly | (624,035 | ) | (752,250 | ) | 128,215 | ||||||||||||||||||||
Rolls-Royce PLC | 12/20/2028 | 1.000 | % | 1.173 | % | EUR | 4,400,000 | Quarterly | (38,092 | ) | (180,819 | ) | 142,727 | |||||||||||||||||||
Royal Caribbean Cruises Ltd. | 12/20/2028 | 5.000 | % | 2.099 | % | $ | 4,250,000 | Quarterly | 519,093 | 363,442 | 155,651 | |||||||||||||||||||||
Ryder System, Inc. | 12/20/2028 | 1.000 | % | 0.720 | % | 4,600,000 | Quarterly | 57,387 | (10,478 | ) | 67,865 | |||||||||||||||||||||
Sherwin-Williams Co. (The) | 12/20/2028 | 1.000 | % | 0.514 | % | 4,600,000 | Quarterly | 100,331 | 60,361 | 39,970 | ||||||||||||||||||||||
The accompanying notes are an integral part of these financial statements.
| Schedule of Investments | 67 | |||||
Table of Contents
iMGP Alternative Strategies Fund
CONSOLIDATED SCHEDULE OF INVESTMENTS IN SWAPS at December 31, 2023 (Continued)
| CENTRALLY CLEARED CREDIT DEFAULT SWAP CONTRACTS (1)(2)(3) (CONTINUED) | ||||||||||||||||||||||||||||||||
| Description | Maturity Date | Fixed Deal (Pay) Rate | Implied Credit Spread at December 31, 2023 | Notional Amount(4) | Periodic Payment Frequency | Fair Value | Upfront Premiums Paid / (Received) | Unrealized Appreciation / (Depreciation) | ||||||||||||||||||||||||
Sell Protection (Continued) |
| |||||||||||||||||||||||||||||||
Simon Property Group L.P. | 12/20/2028 | 1.000 | % | 0.721 | % | $ | 3,600,000 | Quarterly | $ | 44,695 | $ | 30,444 | $ | 14,251 | ||||||||||||||||||
Sirius XM Radio, Inc. | 12/20/2028 | 5.000 | % | 2.066 | % | 800,000 | Quarterly | 98,943 | 91,131 | 7,812 | ||||||||||||||||||||||
Societe Generale S.A. | 12/20/2028 | 1.000 | % | 0.864 | % | EUR | 3,550,000 | Quarterly | 77,853 | 11,563 | 66,290 | |||||||||||||||||||||
Southwest Airlines Co. | 12/20/2028 | 1.000 | % | 0.925 | % | $ | 700,000 | Quarterly | 2,326 | (6,427 | ) | 8,753 | ||||||||||||||||||||
Stellantis N.V. | 12/20/2028 | 5.000 | % | 1.134 | % | EUR | 3,750,000 | Quarterly | 726,874 | 618,188 | 108,686 | |||||||||||||||||||||
Stora Enso Oyj | 12/20/2028 | 5.000 | % | 0.809 | % | 600,000 | Quarterly | 127,725 | 118,778 | 8,947 | ||||||||||||||||||||||
Swiss Reinsurance Co. Ltd. | 12/20/2028 | 1.000 | % | 0.491 | % | 3,250,000 | Quarterly | 85,216 | 59,896 | 25,320 | ||||||||||||||||||||||
Teck Resources Ltd. | 12/20/2028 | 5.000 | % | 1.134 | % | $ | 4,000,000 | Quarterly | 676,668 | 609,397 | 67,271 | |||||||||||||||||||||
Telecom Italia SpA | 12/20/2028 | 1.000 | % | 2.166 | % | EUR | 4,600,000 | Quarterly | (257,766 | ) | (448,852 | ) | 191,086 | |||||||||||||||||||
Telefonica Emisiones S.A. | 12/20/2028 | 1.000 | % | 0.676 | % | 4,500,000 | Quarterly | 74,552 | 15,927 | 58,625 | ||||||||||||||||||||||
Telia Co. AB | 12/20/2028 | 1.000 | % | 0.297 | % | 800,000 | Quarterly | 29,188 | 21,481 | 7,707 | ||||||||||||||||||||||
Tenet Healthcare Corp. | 12/20/2028 | 5.000 | % | 2.451 | % | $ | 1,300,000 | Quarterly | 137,601 | 122,690 | 14,911 | |||||||||||||||||||||
Tesco PLC | 12/20/2028 | 1.000 | % | 0.600 | % | EUR | 1,800,000 | Quarterly | 36,939 | 10,615 | 26,324 | |||||||||||||||||||||
Tesla, Inc. | 12/20/2028 | 1.000 | % | 1.115 | % | $ | 4,800,000 | Quarterly | (24,118 | ) | (86,944 | ) | 62,826 | |||||||||||||||||||
thyssenkrupp AG | 12/20/2028 | 1.000 | % | 1.633 | % | EUR | 900,000 | Quarterly | (27,997 | ) | (42,973 | ) | 14,976 | |||||||||||||||||||
Toll Brothers Finance Corp. | 12/20/2028 | 1.000 | % | 0.962 | % | $ | 4,600,000 | Quarterly | 7,633 | (56,858 | ) | 64,491 | ||||||||||||||||||||
Transocean, Inc. | 12/20/2028 | 1.000 | % | 4.810 | % | 5,300,000 | Quarterly | (765,630 | ) | (765,187 | ) | (443 | ) | |||||||||||||||||||
UniCredit SpA | 12/20/2028 | 1.000 | % | 0.751 | % | EUR | 4,250,000 | Quarterly | 53,929 | (531 | ) | 54,460 | ||||||||||||||||||||
United Airlines Holdings, Inc. | 12/20/2028 | 5.000 | % | 4.775 | % | $ | 900,000 | Quarterly | 7,688 | (15,750 | ) | 23,438 | ||||||||||||||||||||
United Rentals North America, Inc. | 12/20/2028 | 5.000 | % | 1.043 | % | 800,000 | Quarterly | 139,002 | 135,701 | 3,301 | ||||||||||||||||||||||
Universal Health Services, Inc. | 12/20/2028 | 1.000 | % | 0.848 | % | 900,000 | Quarterly | 6,071 | (12,583 | ) | 18,654 | |||||||||||||||||||||
Valeo SE | 12/20/2028 | 1.000 | % | 2.220 | % | EUR | 800,000 | Quarterly | (46,830 | ) | (65,843 | ) | 19,013 | |||||||||||||||||||
Valero Energy Corp. | 12/20/2028 | 1.000 | % | 0.734 | % | $ | 800,000 | Quarterly | 9,461 | 10,049 | (588 | ) | ||||||||||||||||||||
Verizon Communications, Inc. | 12/20/2028 | 1.000 | % | 0.738 | % | 4,400,000 | Quarterly | 51,280 | (12,654 | ) | 63,934 | |||||||||||||||||||||
The accompanying notes are an integral part of these financial statements.
| 68 | Litman Gregory Funds Trust | |||||
Table of Contents
iMGP Alternative Strategies Fund
CONSOLIDATED SCHEDULE OF INVESTMENTS IN SWAPS at December 31, 2023 (Continued)
| CENTRALLY CLEARED CREDIT DEFAULT SWAP CONTRACTS (1)(2)(3) (CONTINUED) | ||||||||||||||||||||||||||||||||
| Description | Maturity Date | Fixed Deal (Pay) Rate | Implied Credit Spread at December 31, 2023 | Notional Amount(4) | Periodic Payment Frequency | Fair Value | Upfront Premiums Paid / (Received) | Unrealized Appreciation / (Depreciation) | ||||||||||||||||||||||||
Sell Protection (Continued) |
| |||||||||||||||||||||||||||||||
Vivendi SE | 12/20/2028 | 1.000 | % | 0.697 | % | EUR | 4,000,000 | Quarterly | $ | 61,968 | $ | (25,310 | ) | $ | 87,278 | |||||||||||||||||
Vodafone Group PLC | 12/20/2028 | 1.000 | % | 0.645 | % | 800,000 | Quarterly | 14,526 | 13,173 | 1,353 | ||||||||||||||||||||||
Volkswagen International Finance N.V. | 12/20/2028 | 1.000 | % | 1.020 | % | 4,300,000 | Quarterly | (4,287 | ) | (73,896 | ) | 69,609 | ||||||||||||||||||||
Wendel SE | 12/20/2028 | 5.000 | % | 0.863 | % | 700,000 | Quarterly | 146,788 | 138,483 | 8,305 | ||||||||||||||||||||||
Williams Cos, Inc. (The) | 12/20/2028 | 1.000 | % | 0.746 | % | $ | 4,000,000 | Quarterly | 45,181 | 20,714 | 24,467 | |||||||||||||||||||||
WPP Finance S.A. | 12/20/2028 | 1.000 | % | 0.726 | % | EUR | 700,000 | Quarterly | 9,771 | 4,155 | 5,616 | |||||||||||||||||||||
Xerox Corp. | 12/20/2028 | 1.000 | % | 3.176 | % | $ | 1,300,000 | Quarterly | (114,208 | ) | (164,223 | ) | 50,015 | |||||||||||||||||||
Zurich Insurance Co. Ltd. | 12/20/2028 | 1.000 | % | 0.504 | % | EUR | 3,300,000 | Quarterly | 84,158 | 60,818 | 23,340 | |||||||||||||||||||||
|
|
|
|
|
| |||||||||||||||||||||||||||
Total Sell Protection |
| $ | 10,365,989 | $ | 4,491,376 | $ | 5,874,613 | |||||||||||||||||||||||||
|
|
|
|
|
| |||||||||||||||||||||||||||
Total | $ | (1,836,669 | ) | $ | (2,146,510 | ) | $ | 309,841 | ||||||||||||||||||||||||
|
|
|
|
|
| |||||||||||||||||||||||||||
| (1) | For centrally cleared swaps, when a credit event occurs as defined under the terms of the swap contract, the Fund as a seller of credit protection will either (i) pay a net amount equal to the par value of the defaulted reference entity and deliver the reference entity or (ii) pay a net amount equal to the par value of the defaulted reference entity less its recovery value. |
| (2) | For centrally cleared swaps, implied credit spread, represented in absolute terms, utilized in determining the fair value of the credit default swap contracts as of period will serve as an indicator of the payment/ performance risk and represent the likelihood of risk of default for the credit derivative. The implied credit spread of a referenced entity reflects the cost of buying/ selling protection and may include upfront payments required to be made to enter into the contract. Generally, wider credit spreads represent a perceived deterioration of the referenced entity’s credit soundness and a greater likelihood or risk of default or other credit event occurring as defined under the terms of the swap contract. |
| (3) | For centrally cleared swaps, the notional amount represents the maximum potential the Fund may receive as a buyer of credit protection if a credit event occurs, as defined under the terms of the swap contract, for each security included in the CDX North America High Yield Index Series 41. |
| (4) | Notional amounts are denominated in currency where indicated and the lines below until currency changes. |
| OVER THE COUNTER TOTAL RETURN SWAP CONTRACTS | ||||||||||||||||||||||||||||||
| Referenced Obligation | Maturity Date | Counterparty | Fund Pays/ Receives Floating Rate | Floating Rate Index and Spread | Notional Amount | Periodic Payment Frequency | Fair Value | Upfront Premiums Paid (Received) | Unrealized Depreciation | |||||||||||||||||||||
Markit iBoxx USD Liquid High Yield Index USD | 3/20/2024 | JPMorgan Chase Bank N.A. | Receives | SOFR | $35,000,000 | Quarterly | $ | (841,155 | ) | $ | — | $ | (841,155 | ) | ||||||||||||||||
Chevron Corp. USD | 5/6/2024 | Morgan Stanley & Co. | Receives | FEDL01 - 0.400% | 3,091,639 | Monthly | — | — | — | |||||||||||||||||||||
Exxon Mobil Corp. USD | 7/25/2024 | Morgan Stanley & Co. | Receives | FEDL01 - 0.400% | 4,898,520 | Monthly | — | — | — | |||||||||||||||||||||
Realty Income Corp. USD | 10/30/2024 | Morgan Stanley & Co. | Receives | FEDL01 - 0.400% | 4,115,291 | Monthly | — | — | — | |||||||||||||||||||||
|
| |||||||||||||||||||||||||||||
Total | $ | (841,155 | ) | $ | — | $ | (841,155 | ) | ||||||||||||||||||||||
|
| |||||||||||||||||||||||||||||
The accompanying notes are an integral part of these financial statements.
| Schedule of Investments | 69 | |||||
Table of Contents
iMGP Alternative Strategies Fund
CONSOLIDATED SCHEDULE OF INVESTMENTS IN WRITTEN OPTIONS at December 31, 2023
| Description | Counterparty | Exercise Price | Expiration Date | Number of Contracts | Notional Amount | Fair Value | Premiums Received | Unrealized Appreciation/ (Depreciation) | ||||||||||||||||||||||
COMMON STOCKS |
| |||||||||||||||||||||||||||||
Call |
| |||||||||||||||||||||||||||||
Abbott Laboratories | Morgan Stanley & Co. | $ | 115.00 | 2/16/2024 | (3 | ) | $ | (33,021 | ) | $ | (372 | ) | $ | (350 | ) | $ | (22 | ) | ||||||||||||
Abbvie, Inc. | Morgan Stanley & Co. | 165.00 | 2/16/2024 | (2 | ) | (30,994 | ) | (204 | ) | (228 | ) | 24 | ||||||||||||||||||
American Tower Corp. | Morgan Stanley & Co. | 230.00 | 2/16/2024 | (1 | ) | (21,588 | ) | (260 | ) | (257 | ) | (3 | ) | |||||||||||||||||
Apple, Inc. | Morgan Stanley & Co. | 205.00 | 2/16/2024 | (2 | ) | (38,506 | ) | (332 | ) | (429 | ) | 97 | ||||||||||||||||||
Bristol-myers Squibb Co. | Morgan Stanley & Co. | 55.00 | 2/16/2024 | (4 | ) | (20,524 | ) | (236 | ) | (267 | ) | 31 | ||||||||||||||||||
Cisco Systems, Inc. | Morgan Stanley & Co. | 52.50 | 2/16/2024 | (1 | ) | (5,052 | ) | (75 | ) | (74 | ) | (1 | ) | |||||||||||||||||
Coca-cola Co/the | Morgan Stanley & Co. | 60.00 | 2/16/2024 | (5 | ) | (29,465 | ) | (475 | ) | (414 | ) | (61 | ) | |||||||||||||||||
Comcast Corp. | Morgan Stanley & Co. | 47.50 | 2/16/2024 | (7 | ) | (30,695 | ) | (280 | ) | (327 | ) | 47 | ||||||||||||||||||
Crown Castle, Inc. | Morgan Stanley & Co. | 120.00 | 1/19/2024 | (14 | ) | (161,266 | ) | (1,050 | ) | (1,726 | ) | 676 | ||||||||||||||||||
Duke Energy Corp. | Morgan Stanley & Co. | 100.00 | 2/16/2024 | (1 | ) | (9,704 | ) | (105 | ) | (105 | ) | — | ||||||||||||||||||
Emerson Electric Co. | Morgan Stanley & Co. | 100.00 | 2/16/2024 | (1 | ) | (9,733 | ) | (177 | ) | (212 | ) | 35 | ||||||||||||||||||
Johnson & Johnson | Morgan Stanley & Co. | 160.00 | 2/16/2024 | (1 | ) | (15,674 | ) | (263 | ) | (258 | ) | (5 | ) | |||||||||||||||||
Jpmorgan Chase & Co. | Morgan Stanley & Co. | 175.00 | 2/16/2024 | (1 | ) | (17,010 | ) | (248 | ) | (222 | ) | (26 | ) | |||||||||||||||||
Merck & Co., Inc. | Morgan Stanley & Co. | 110.00 | 2/16/2024 | (1 | ) | (10,902 | ) | (300 | ) | (250 | ) | (50 | ) | |||||||||||||||||
Microchip Technology, Inc. | Morgan Stanley & Co. | 97.50 | 2/16/2024 | (3 | ) | (27,054 | ) | (517 | ) | (665 | ) | 148 | ||||||||||||||||||
Microsoft Corp. | Morgan Stanley & Co. | 405.00 | 2/16/2024 | (1 | ) | (37,604 | ) | (428 | ) | (447 | ) | 19 | ||||||||||||||||||
Morgan Stanley | Morgan Stanley & Co. | 97.50 | 2/16/2024 | (1 | ) | (9,325 | ) | (153 | ) | (151 | ) | (2 | ) | |||||||||||||||||
Newmont Corp. | Morgan Stanley & Co. | 45.00 | 2/16/2024 | (7 | ) | (28,973 | ) | (525 | ) | (663 | ) | 138 | ||||||||||||||||||
Qualcomm, Inc. | Morgan Stanley & Co. | 160.00 | 2/16/2024 | (2 | ) | (28,926 | ) | (338 | ) | (403 | ) | 65 | ||||||||||||||||||
Union Pacific Corp. | Morgan Stanley & Co. | 260.00 | 2/16/2024 | (1 | ) | (24,562 | ) | (260 | ) | (287 | ) | 27 | ||||||||||||||||||
United Parcel Service, Inc. | Morgan Stanley & Co. | 170.00 | 2/16/2024 | (2 | ) | (31,446 | ) | (390 | ) | (421 | ) | 31 | ||||||||||||||||||
Williams Cos. Inc/the | Morgan Stanley & Co. | 37.00 | 2/16/2024 | (7 | ) | (24,381 | ) | (210 | ) | (306 | ) | 96 | ||||||||||||||||||
EXCHANGE TRADED |
| |||||||||||||||||||||||||||||
Call |
| |||||||||||||||||||||||||||||
U.S. Treasury 5-Year Future Option | JPMorgan Chase Bank N.A. | 110.00 | 2/23/2024 | (56 | ) | (6,091,313 | ) | (26,688 | ) | (26,133 | ) | (555 | ) | |||||||||||||||||
|
| |||||||||||||||||||||||||||||
Total Written Options | $ | (33,886 | ) | $ | (34,595 | ) | $ | 709 | ||||||||||||||||||||||
|
| |||||||||||||||||||||||||||||
The accompanying notes are an integral part of these financial statements.
| 70 | Litman Gregory Funds Trust | |||||
Table of Contents
iMGP High Income Fund 2023 Annual Report (Unaudited)
The iMGP High Income Fund rose 12.32% in calendar year 2023. During the same 12-month period, the Bloomberg US Aggregate Bond Index (Agg) gained 5.53% and high-yield bonds (ICE BofA Merrill Lynch US High Yield TR Index) increased 13.46%. The fund meaningfully outperformed its Morningstar Nontraditional Bond peer category, which gained 6.93% during the year. Since the fund’s inception (9/28/18), its annualized return is 4.10%, compared to 1.36% for the Agg and 4.01% for high-yield bonds. The fund has also outperformed its peer category’s 1.81% gain over the five-plus year timeframe.
Performance as of 12/31/2023 | ||||||||||||||||
One- Year | Three- Year | Five- Year | Since Inception 9/28/18 | |||||||||||||
iMGP High Income Fund | 12.32% | 3.64% | 4.97% | 4.10% | ||||||||||||
Bloomberg Aggregate Bond Index | 5.53% | -3.31% | 1.10% | 1.36% | ||||||||||||
ICE BofAML U.S. High Yield TR USD Index | 13.46% | 2.00% | 5.21% | 4.01% | ||||||||||||
Morningstar US Fund Nontraditional Bond | 6.93% | 0.56% | 2.25% | 1.81% | ||||||||||||
| Past performance does not guarantee future results. Index performance is not illustrative of fund performance. An investment cannot be made directly in an index. The investment return and principal value of an investment will fluctuate so that an investor’s shares, when redeemed, may be worth more or less than their original cost. Current performance of the fund may be lower or higher than the performance quoted. To obtain the performance of the funds as of the most recently completed calendar month, please visit www.imgpfunds.com. The Advisor has contractually agreed to limit the expenses of the fund through April 30, 2025. Without this limit the fund’s net expenses would be higher and the return would be lower. |
| |||||||||||||||
SEC 30-Day Yield1 as of 12/31/2023: 6.13% | ||||||||||||||||
Unsubsidized SEC 30-Day Yield2 as of 12/31/2023: 5.72 % | ||||||||||||||||
1. The 30-day SEC Yield is computed under an SEC standardized formula based on net income earned over the past 30 days. It is a “subsidized” yield, which means it includes contractual expense reimbursements, and it would be lower without those reimbursements. |
| |||||||||||||||
2. The unsubsidized 30-day SEC Yield is computed under an SEC standardized formula based on net income earned over the past 30 days. It excludes contractual expense reimbursements, resulting in a lower yield. |
| |||||||||||||||
| Trailing Twelve-Month (TTM) Income Distribution Yield as of 12/31.23: 6.28% |
| |||||||||||||||
| Trailing Twelve-Month Total Distribution Yield as of 12/31/23: 6.28% |
| |||||||||||||||
| TTM Yield is the yield an investor would have received if they had held the fund over the last 12 months assuming the most recent NAV. T. The 12-month income yield is calculated by assuming any income distributions over the past 12 months and dividing the sum by the most recent NAV. The 12-month total yield is calculated by assuming any income distributions over the past 12 months and any capital gain distributions made over the past 12 months and dividing the sum by the most recent NAV. TTM yield is not a reflection of future results. |
| |||||||||||||||
| Expense Ratios* | ||||
Gross Expense Ratio | 1.42% | |||
Net Expense Ratio | 1.00% | |||
Adjusted Expense Ratio Excluding Interest and Dividend Expense | 0.98% | |||
* The expense ratios disclosed in the performance table are based on the most recent prospectus and may not tie to what are disclosed in the financial highlights. |
| |||
Portfolio Commentary
Performance of Managers
For the calendar year, all three subadvisors had strong gains. The fund’s two flexible credit managers, Brown Brothers Harriman and Guggenheim produced returns of 13.74% and 12.44%, respectively. Neuberger Berman’s option income strategy also posted a strong 13.86% gain for the year. (These returns are net of the management fees that each sub-advisor charges the fund.)
Manager Commentaries
Brown Brothers Harriman
Fixed-income markets gained during 2023 despite interest rate and credit spread volatility. The Federal Reserve increased the target range four times during the year, each time by 0.25%, yet longer-term interest rates ended the year close to their levels at the start of the year. Those changes mask the volatility driven by credit conditions and swift changes in expectations of future Federal Reserve interest rates drove markets. The failure of Silicon Valley Bank in March spurred risk contagion among U.S. regional banks and led to central bank intervention to support other banks. Amid those conditions, credit spreads spiked, and investors predicted imminent and rapid Fed rate cuts. Those conditions stabilized and the U.S. economy showed resilience among the higher interest-rate environment, and investor expectations shifted to a belief the Fed would need to stay “higher for longer” with longer-term interest rates rising to their highest levels in
| Fund Summary | 71 | |||||
Table of Contents
fifteen years. Investor expectations changed rapidly again during the fourth quarter, and interest rates declined to reflect again the prospect of quicker and larger Fed rate cuts in 2024.
Credit market performance was strong despite concerns over the impact that higher interest rates would have on default and loss rates. Default rates rose but were in-line with long-term average default rates. Loss and delinquency rates for various loans remain low by historical standards. The prospect of near-term Fed easing may also alleviate investor concerns about near-term economic risks.
All major credit indexes had positive excess returns in 2023 as risk spreads narrowed across all sectors, qualities, and maturities. Non-agency CMBS outperformed comparable duration Treasuries slightly despite negative headlines regarding commercial real estate. Indexes of investment-grade corporate bonds, senior bank loans, high-yield corporate bonds, non-traditional ABS, and CLO debt posted strong excess returns.
The robust rally in corporate credit spreads has changed the valuation landscape. Index spreads now rival those witnessed in the fourth quarter of 2021 when we last wrote about our concerns about weak valuations. A steadfast valuation discipline coupled with our disciplined credit underwriting will be essential in 2024 as issuers rush to refinance looming maturities opportunistically in this more-advantageous yield environment.
The portfolio’s performance was driven by a combination of favorable interest rate and credit positioning and strong selection results. The portfolio’s defensive duration posture was additive to results as short-term fixed income had positive returns. The portfolio’s sector and quality exposures contributed a similar amount to results as its duration profile, as the portfolio emphasized several strong-performing segments of the credit markets, including senior bank loans, investment-grade corporate bonds, high-yield corporate bonds, and ABS.
Selection results also contributed, and the portfolio experienced balanced contributions among sectors. The largest contributors to performance included corporate bonds issued by property and casualty (P&C) and life insurers, senior bank loans to electric utilities and healthcare companies, bonds of single asset single borrower (SASB) CMBS, holdings of CLOs, and high-yield corporate bonds issued by midstream energy and technology companies. Positions in high-yield corporate bonds issued by pharmaceutical companies and senior bank loans to consumer cyclical services companies had negative selection results during the year and detracted from performance.
At the end of the year, the portfolio’s duration was 2.2 years and remained near levels consistent with long-term capital preservation. The portfolio’s weight to high-yield corporate bonds increased during the year while the portfolio’s weight to senior bank loans decreased by a similar amount. The portfolio’s allocation to high-yield and non-rated instruments decreased slightly to 44% from 48%. The portfolio’s yield to maturity was 9.2% and remained elevated versus bond market alternatives. The portfolio’s option-adjusted spread was 455 basis points; for reference, the Bloomberg U.S. Corporate Index’s option-adjusted spread was 99 basis points, and the Bloomberg U.S. Corporate High Yield Index’s option-adjusted spread was 323 basis points at quarter-end.
Several forces are being exerted on credit markets in 2024, and the effect on credit spreads and transaction volumes is uncertain. Valuations, potential defaults and recession, the prospect of Fed easing, heightened refinancing needs, and fund flows in a higher Treasury rate environment can cause the market to behave erratically in any given year, and this year promises to be no different. That is why strong valuation and credit disciplines are imperative to performing in the market.
Guggenheim
The sleeve of the portfolio generated positive performance in 2023 with a return of 12.44%. Carry, or earned income net of fees, was the largest contributor to performance, adding approximately 8.30%. Credit positioning contributed 2.50% with positive performance coming from both allocation decisions and security selection. From an allocation perspective, the portfolio’s largest allocations (high-yield corporates, ABS, and bank loans) all returned 12-15% on the year. Security selection was also a contributor with the portfolios holdings in each of the aforementioned sectors outperforming their respective indices by 2% to 4%. Lastly, duration contributed 0.45% to performance.
The U.S. economy has proved resilient so far to tight monetary policy by the Federal Reserve (Fed), helped by falling inflation boosting real incomes and consumer sentiment, a big expansion in the fiscal deficit over the past year, and a supply-side boost as labor force participation improves. These tailwinds are likely to fade going forward which will pressure growth. Consumer spending also faces headwinds from dwindling excess savings buffers. The Fed-induced easing of financial conditions, with interest rates falling and stock prices rising, takes pressure off the economy and helps bring down recession risk. While recession risk has come down, it is still materially higher than very optimistic market expectations. The 2024 election could add to volatility and uncertainty this year. We expect Treasury yields to decline more than the market currently anticipates this year, though they are unlikely to return to the lows of the last cycle. We expect default rates to stay elevated as U.S. companies cope with rising borrowing costs and limited credit availability, but the stress will become increasingly bifurcated between large and small companies. High-quality corporate debt and structured credit yields should provide an income cushion that could reduce the impact if spreads should widen from here.
Over the past several quarters the portfolio has prioritized income, diversification, and quality to take advantage of relative value opportunities, while limiting potential downside. As interest-rate volatility rose to levels not seen since the Global Financial Crisis, and the 10-year Treasury approached 5%, spreads in many high-quality assets widened to post-COVID wides, creating a significant opportunity for the portfolio in both credit and interest rate markets.
| 72 | Litman Gregory Funds Trust | |||||
Table of Contents
To that end, we have focused on opportunities in high-quality structured credit, where a significant yield advantage exists relative to both investment grade corporates and agency MBS. Specific areas of focus within the Portfolio’s second largest aggregate allocation have been whole business securitizations, non-agency RMBS, and middle market CLOs.
Spreads in each of these asset classes well exceed similar credit quality opportunities in most parts of the investment grade corporate market, creating a compelling opportunity for investors capable of underwriting these more complicated structures. Corporate credit is the largest aggregate allocation within the portfolio. While corporate credit spreads are near fair value levels, there remain many idiosyncratic opportunities for alpha generation. Primary market offerings priced at especially attractive levels as investors pulled back from lending activities this year, presenting a unique opportunity to capture new issue premiums. Given dramatic intra-quarter shifts in market pricing of the path of monetary policy, the portfolio actively adjusted duration positioning increasing duration as rates rose to multi-decade highs then subsequently reducing duration as market pricing returned to in-line with our house views. The turbulence in fixed-income markets over the past couple of years has provided a very attractive entry point for longer-term investors particularly with the Federal Reserve having now signaled a pause in its rate hike campaign. Fixed income has historically performed very well during pause phases of monetary policy and potential rate cuts would add further tailwinds.
Neuberger Berman
Despite multiple wars, Silicon Valley Bank’s collapse, rampant price inflation, immigration, political controversies, labor union strikes, and budget brinksmanship, the S&P 500 Index (“S&P 500”) closed 2023 out with an 11.7% return in the fourth quarter, which brought its annual total return to 26.3%. The ‘Magnificent Seven’ posted a staggering 76% return as the AI narrative went mainstream and investors began to price in Fed easing in 2024. Notably, three S&P 500 sectors finished the year up more than 40%: Information Technology (+56.4%), Consumer Discretionary (+54.4%), and Communication Services (+41.0%); while three interest rate sensitive sectors were down on the year: Utilities (-10.2%), Consumer Staples (-2.2%), and Energy (-4.8%). Fixed income markets fared relatively well in the fourth quarter with expectations that the Fed’s rate policy was shifting to a more dovish stance but were no match for stock market narratives. The Bloomberg US Aggregate and the ICE BofAML US High Yield Indexes were up 6.8% and 7.2% in the fourth quarter, which boosted their 2023 results to 5.5% and 13.5%, respectively.
With the positive equity market momentum and the expectation that the Fed will begin a rate cutting cycle in 2024, implied volatility levels declined into year end and put skew levels were depressed as investors leaned into call buying for upside participation versus put buying for risk mitigation. Investor FOMO was driven by the prevalence of ‘big up days’ vs. ‘big down days’. Specifically, 2023 saw seven days with S&P 500 gains greater than 1.75% versus just two days with S&P 500 losses of more than -1.75%. The Cboe S&P 500 Volatility Index (“VIX”) averaged 16.9 for the year, which is well below its 2022 average of 25.6 but only a few points off its long-term average. In 2023, S&P 500 realized volatility fell to 13.3 versus 24.6 in 2022. The S&P 500 Index option market kept its positive implied volatility premium streak going with an average premium of 3.7 in the fourth quarter resulting in a 2023 average of 4.3. Looking ahead to 2024, S&P 500 Index option markets appear to be pricing implied volatility levels slightly below longer-term levels, which we think is probably underestimating all the potential risk in the global economic and political landscape. A small-but-real chance for a US recession, Ukraine falling to Russia, Trump election mania, simmering China relations, and the ongoing war between Israel and Hamas remain risks. Even without these major risks, every year offers unexpected events—except for maybe 2017—that can result in rapid repricing of equity market risk and present opportunities for elevated premium capture.
Many alternative strategies fared well relative to their more recent pasts, which saw zero rates and volatile equity markets drain return potential. Overall, our less directional index option strategies managed to navigate the S&P 500’s performance reversal from August through December. We expect these trends to continue as US economic and political uncertainty begin to cool equity and credit market returns and market uncertainty rebounds off recent lows in the new year. In 2023, the sleeve of the portfolio managed by NBIA (the “sleeve”) returned 11.21%, besting its PutWrite Benchmark, which consists of 40% Cboe S&P 500 PutWrite Index (PUT) and 60% ICE 0-3M US Treasury Bill Index, return of 8.75% but modestly lagging the Bloomberg US Corporate High Yield Index return of 13.44%. On the year, the S&P 500 PutWrite Strategy produced returned 11.04% as the Cboe S&P 500 2% OTM PutWrite Index (PUTY) returned 12.23%. On the year, the collateral portfolio gained 4.40% versus the ICE BofA 0-3M US T-Bill Index return of 5.10%.
We don’t believe the economic recession that was so certain to occur in 2023 is any more likely to occur in the first half of 2024. Our simple hypothesis is that the higher levels of portfolio income being paid to investors in the form of interest payments will continue to be a short-term income enhancement for the large US upper-middle class. The direct economic stimulus that was being provided directly to consumers and asset owners by the Fed has now shifted to the US Treasury’s distribution of interest payments (cash flows) to debtholders, which are mostly wealthy investors and institutions. The immediate increase in income for entities that spend is not instantly offset by the increase in longer-term financing costs that investors and corporations must bear over the coming years. Hence, we do not believe the Fed has to pull the ‘handbrake’ on the economy as the ‘soft-landing’ is in progress. However, fast forward a few quarters and the outlook for equities becomes much more ambiguous. Pile on a contentious US Presidential election in November and 2024 has the makings of a relatively volatile year.
| Fund Summary | 73 | |||||
Table of Contents
Strategy Allocations
The fund’s target allocations across the three managers are as follows: 40% each to Brown Brothers Harriman and Guggenheim Investments, and 20% to Neuberger Berman. We use the fund’s daily cash flows to bring each manager’s allocation toward their targeted allocation should differences in shorter-term relative performance cause divergences. We believe the fund remains well-diversified with the ability to be opportunistic across non-traditional credit sectors, particularly within the broad mandates of the fund’s flexible credit managers, BBH and Guggenheim.
Sub-Advisor Portfolio Composition as of December 31, 2022
Brown Brothers Harriman Credit Value Strategy
ABS | 18% | |||
Bank Loans | 34% | |||
Corporate Bonds | 39% | |||
CMBS | 6% | |||
Reserves | 3% |
Guggenheim Multi-Credit Strategy
ABS | 24% | |||
Bank Loans | 18% | |||
Corporate Bonds | 36% | |||
Non-Agency RMBS | 5% | |||
Preferred Stock | 3% | |||
CMBS | 2% | |||
Other | 6% | |||
Cash | 6% |
Neuberger Berman Option Income Strategy
Equity Index Put Writing | 100% |
iMGP High Income Fund Value of Hypothetical $10,000
The value of a hypothetical $10,000 investment in the iMGP High Income Fund from September 28, 2018 to December 31, 2023 compared with the ICE BofA US High Yield Index, Morningstar Nontraditional Bond Category and Bloomberg US Agg Bond Index.
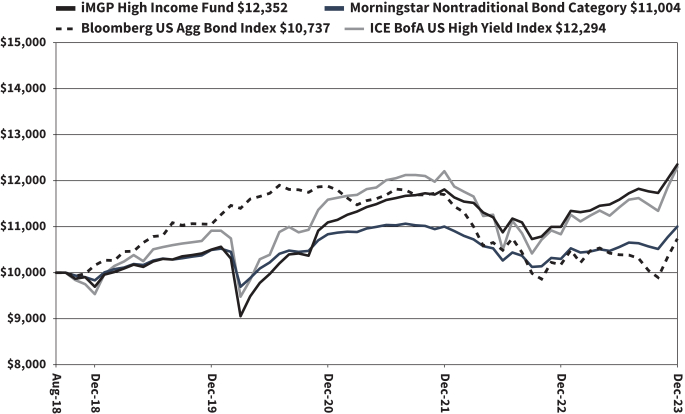
The hypothetical $10,000 investment at fund inception includes changes due to share price and reinvestment of dividends and capital gains. The chart does not imply future performance. Indexes are unmanaged, do not incur fees, expenses or taxes, and cannot be invested in directly.
Performance quoted does not include a deduction for taxes that a shareholder would pay on the redemption of fund shares.
| 74 | Litman Gregory Funds Trust | |||||
Table of Contents
iMGP High Income Fund
SCHEDULE OF INVESTMENTS IN SECURITIES at December 31, 2023
| Shares | Value | |||||||
COMMON STOCKS: 0.0% | ||||||||
| Consumer Staples: 0.0% | ||||||||
| 648 | Moran Foods LLC* | $ | 219 | |||||
|
| |||||||
| Materials: 0.0% | ||||||||
| 563 | Yak Blocker 2 LLC*(i) | 6 | ||||||
| 609 | Yak Blocker 2 LLC*(i) | 6 | ||||||
| 2,411 | Yak Blocker 2 LLC*(i) | 457 | ||||||
| 22,605 | Yak Blocker 2 LLC*(i) | 4,287 | ||||||
| 8,444 | Yak Blocker 2 LLC*(i) | 4,964 | ||||||
|
| |||||||
| 9,720 | ||||||||
|
| |||||||
| | TOTAL COMMON STOCKS | 9,939 | ||||||
|
| |||||||
PREFERRED STOCKS: 1.7% | ||||||||
| Financials: 1.7% | ||||||||
| CNO Financial Group, Inc. |
| |||||||
| 2,000 | 5.125%, 11/25/2060 | 34,840 | ||||||
| Crescent Capital BDC, Inc. |
| |||||||
| 8,900 | 5.000%, 05/25/2026 | 208,260 | ||||||
| Eagle Point Credit Co., Inc. |
| |||||||
| 32,000 | 5.375%, 01/31/2029 | 715,597 | ||||||
| Oxford Lane Capital Corp. |
| |||||||
| 23,400 | 5.000%, 01/31/2027 | 533,052 | ||||||
| Selective Insurance Group, Inc. - Series B |
| |||||||
| 2,000 | 4.600%, 12/15/2025(a) | 34,380 | ||||||
|
| |||||||
| | TOTAL PREFERRED STOCKS | 1,526,129 | ||||||
|
| |||||||
| Principal Amount^ | ||||||||
ASSET-BACKED SECURITIES: 20.5% | ||||||||
AASET Trust | ||||||||
| $220,258 | Series 2019-2-B | 103,799 | ||||||
| 138,939 | Series 2020-1A-B | 78,157 | ||||||
| AASET U.S. Ltd. | ||||||||
| 88,753 | Series 2018-2A-A | 79,601 | ||||||
| ABPCI Direct Lending Fund ABS I Ltd. | ||||||||
| 108,734 | Series 2020-1A-B | 102,384 | ||||||
| ABPCI Direct Lending Fund CLO I LLC | ||||||||
| 250,000 | Series 2017-1A-DR | 240,284 | ||||||
| ABPCI Direct Lending Fund CLO XV Ltd. | ||||||||
| 250,000 | Series 2023-15A-C | 250,731 | ||||||
| ABPCI Direct Lending Fund IX LLC | ||||||||
| 500,000 | Series 2020-9A-BR | 482,512 | ||||||
| Principal Amount^ | Value | |||||||
| ACRES Commercial Realty Ltd. | ||||||||
| $250,000 | Series 2021-FL1-AS | $ | 244,776 | |||||
| Adams Outdoor Advertising LP | ||||||||
| 280,000 | Series 2023-1-A2 | 284,503 | ||||||
| Anchorage Credit Funding 4 Ltd. | ||||||||
| 250,000 | Series 2016-4A-CR | 215,840 | ||||||
| Applebee’s Funding LLC/IHOP Funding LLC | ||||||||
| 297,000 | Series 2019-1A-A2II | 285,654 | ||||||
| Ares Finance Co. LLC | ||||||||
| 500,000 | 0.000%, 10/15/2036(d) | 505,000 | ||||||
| Atlas Senior Loan Fund IX Ltd. | ||||||||
| 350,000 | Series 2018-9A-C | 349,246 | ||||||
| Blue Stream Issuer LLC | ||||||||
| 100,000 | Series 2023-1A-B | 95,521 | ||||||
| Business Jet Securities LLC | ||||||||
| 41,912 | Series 2020-1A-B | 39,965 | ||||||
| 282,053 | Series 2022-1A-B | 259,132 | ||||||
| CARS-DB4 LP | ||||||||
| 220,000 | Series 2020-1A-B1 | 210,509 | ||||||
| 200,000 | Series 2020-1A-B3 | 168,223 | ||||||
| CARS-DB7 LP | ||||||||
| 99,688 | Series 2023-1A-A2 | 100,273 | ||||||
| 320,000 | Series 2023-1A-B | 320,847 | ||||||
| Castlelake Aircraft Securitization Trust | ||||||||
| 73,101 | Series 2018-1-A | 66,715 | ||||||
| Castlelake Aircraft Structured Trust | ||||||||
| 181,323 | Series 2021-1A-B | 150,611 | ||||||
| Cerberus Loan Funding XLII LLC | ||||||||
| 250,000 | Series 2023-3A-C | 249,971 | ||||||
| Cerberus Loan Funding XLIV LLC | ||||||||
| 250,000 | Series 2023-5A-C | 250,000 | ||||||
| CHCP Ltd. | ||||||||
| 100,000 | Series 2021-FL1-D | 96,318 | ||||||
| CIFC Funding II Ltd. | ||||||||
| 250,000 | Series 2017-2A-DR | 247,532 | ||||||
| DigitalBridge Issuer LLC | ||||||||
| 350,000 | Series 2021-1A-A2 | 329,676 | ||||||
The accompanying notes are an integral part of these financial statements.
| Schedule of Investments | 75 | |||||
Table of Contents
iMGP High Income Fund
SCHEDULE OF INVESTMENTS IN SECURITIES at December 31, 2023 (Continued)
| Principal Amount^ | Value | |||||||
ASSET-BACKED SECURITIES (CONTINUED) | ||||||||
| Dryden 87 CLO Ltd. | ||||||||
| $ 300,000 | Series 2021-87A-SUB | $ | 202,282 | |||||
| Elm Trust | ||||||||
| 85,948 | Series 2020-4A-B | 78,949 | ||||||
| Falcon Aerospace Ltd. | ||||||||
| 168,490 | Series 2017-1-B | 148,354 | ||||||
| First Franklin Mortgage Loan Trust | ||||||||
| 426,821 | Series 2006-FF16-2A4 | 175,806 | ||||||
| FirstKey Homes Trust | ||||||||
| 150,000 | Series 2020-SFR2-G1 | 140,282 | ||||||
| 100,000 | Series 2020-SFR2-G2 | 93,814 | ||||||
| Fortress Credit Opportunities IX CLO Ltd. | ||||||||
| 250,000 | Series 2017-9A-A2TR | 241,395 | ||||||
| FS Rialto Issuer LLC | ||||||||
| 100,000 | Series 2022-FL5-C | 99,210 | ||||||
| 100,000 | Series 2022-FL6-C | 100,378 | ||||||
| GAIA Aviation Ltd. | ||||||||
| 184,389 | Series 2019-1-A | 167,733 | ||||||
| 144,422 | Series 2019-1-B | 121,238 | ||||||
| GoldenTree Loan Management U.S. CLO 1 Ltd. | ||||||||
| 250,000 | Series 2021-9A-D | 251,235 | ||||||
| Golub Capital Partners ABS Funding Ltd. | ||||||||
| 96,664 | Series 2020-1A-B | 90,080 | ||||||
| Hotwire Funding LLC | ||||||||
| 750,000 | Series 2021-1-C | 637,217 | ||||||
| IP Lending X Ltd. | ||||||||
| 220,000 | Series 2023-10A-SNR | 223,947 | ||||||
| Jersey Mike’s Funding | ||||||||
| 99,500 | Series 2021-1A-A2I | 90,212 | ||||||
| JOL Air Ltd. | ||||||||
| 164,368 | Series 2019-1-A | 149,760 | ||||||
| KDAC Aviation Finance Ltd. | ||||||||
| 145,591 | Series 2017-1A-A | 122,677 | ||||||
| Principal Amount^ | Value | |||||||
| KREF Ltd. | ||||||||
| $ 100,000 | Series 2021-FL2-AS | $ | 96,505 | |||||
| LCCM Trust | ||||||||
| 150,000 | Series 2021-FL3-C | 143,264 | ||||||
| LCM 35 Ltd. | ||||||||
| 520,000 | Series 35A-SUB | 350,411 | ||||||
| LCM 37 Ltd. | ||||||||
| 300,000 | Series 37A-SUB | 195,000 | ||||||
| LCM 39 Ltd. | ||||||||
| 250,000 | Series 39A-E | 250,852 | ||||||
| LoanCore Issuer Ltd. | ||||||||
| 200,000 | Series 2022-CRE7-D | 191,508 | ||||||
| LoanCore Issuer Ltd. | ||||||||
| 100,000 | Series 2021-CRE5-D | 93,379 | ||||||
| 100,000 | Series 2021-CRE6-D | 86,895 | ||||||
| Madison Park Funding XLVIII Ltd. | ||||||||
| 250,000 | Series 2021-48A-D | 251,204 | ||||||
| MAPS Trust | ||||||||
| 113,606 | Series 2021-1A-A | 100,674 | ||||||
| Marathon CLO V Ltd. | ||||||||
| 19,783 | Series 2013-5A-BR | 19,825 | ||||||
| MCA Fund Holding LLC | ||||||||
| 138,335 | Series 2020-1-B | 132,984 | ||||||
| MidOcean Credit CLO VII | ||||||||
| 500,000 | Series 2017-7A-CR | 501,882 | ||||||
| Monroe Capital ABS Funding Ltd. | ||||||||
| 172,277 | Series 2021-1A-A2 | 167,492 | ||||||
| Monroe Capital Income Plus ABS Funding LLC | ||||||||
| 140,000 | Series 2022-1A-B | 124,301 | ||||||
| Morgan Stanley ABS Capital I, Inc. Trust | ||||||||
| 262,096 | Series 2006-HE8-A2D | 113,261 | ||||||
| 344,624 | Series 2007-HE4-A2C | 111,907 | ||||||
The accompanying notes are an integral part of these financial statements.
| 76 | Litman Gregory Funds Trust | |||||
Table of Contents
iMGP High Income Fund
SCHEDULE OF INVESTMENTS IN SECURITIES at December 31, 2023 (Continued)
| Principal Amount^ | Value | |||||||
ASSET-BACKED SECURITIES (CONTINUED) | ||||||||
| Morgan Stanley IXIS Real Estate Capital Trust | ||||||||
| $ 533,649 | Series 2006-2-A3 | $ | 179,130 | |||||
| 346,872 | Series 2006-2-A4 | 116,463 | ||||||
| Nassau CFO LLC | ||||||||
| 126,687 | Series 2019-1-A | 122,007 | ||||||
| Neuberger Berman Loan Advisers CLO 44 Ltd. | ||||||||
| 250,000 | Series 2021-44A-SUB | 199,388 | ||||||
| Newtek Small Business Loan Trust | ||||||||
| 51,023 | Series 2018-1-A | 50,606 | ||||||
| 23,192 | Series 2018-1-B | 23,055 | ||||||
| Northwoods Capital 20 Ltd. | ||||||||
| 250,000 | Series 2019-20A-DR | 250,127 | ||||||
| Northwoods Capital 22 Ltd. | ||||||||
| 250,000 | Series 2020-22A-ER | 243,428 | ||||||
| OnDeck Asset Securitization Trust IV LLC | ||||||||
| 340,000 | Series 2023-1A-B | 343,353 | ||||||
| Oportun Issuance Trust | ||||||||
| 350,000 | Series 2022-A-B | 333,415 | ||||||
| Owl Rock CLO I LLC | ||||||||
| 250,000 | Series 2019-1A-C | 251,785 | ||||||
| Owl Rock CLO XIII LLC | ||||||||
| 250,000 | Series 2023-A-B | 250,526 | ||||||
| Oxford Finance Funding LLC | ||||||||
| 89,929 | Series 2020-1A-B | 86,151 | ||||||
| Oxford Finance Funding Trust | ||||||||
| 200,000 | Series 2023-1A-B | 198,213 | ||||||
| Palmer Square Loan Funding Ltd. | ||||||||
| 200,000 | Series 2021-2A-SUB | 117,881 | ||||||
| 250,000 | Series 2021-3A-C | 248,254 | ||||||
| 200,000 | Series 2021-3A-SUB | 128,883 | ||||||
| 250,000 | Series 2023-2A-B | 250,852 | ||||||
| Principal Amount^ | Value | |||||||
| PennantPark CLO II Ltd. | ||||||||
| $ 250,000 | Series 2020-2A-D | $ | 250,749 | |||||
| ReadyCap Lending Small Business Loan Trust | ||||||||
| 54,022 | Series 2019-2-A | 53,267 | ||||||
| Republic Finance Issuance Trust | ||||||||
| 240,000 | Series 2020-A-B | 230,632 | ||||||
| Saluda Grade Alternative Mortgage Trust | ||||||||
| 100,000 | Series 2023-FIG4-B | 101,610 | ||||||
| Sapphire Aviation Finance I Ltd. | ||||||||
| 61,732 | Series 2018-1A-A | 55,037 | ||||||
| Sapphire Aviation Finance II Ltd. | ||||||||
| 209,567 | Series 2020-1A-B | 156,263 | ||||||
| SERVPRO Master Issuer LLC | ||||||||
| 96,000 | Series 2019-1A-A2 | 90,583 | ||||||
| Sonic Capital LLC | ||||||||
| 193,333 | Series 2020-1A-A2I | 183,001 | ||||||
| 48,333 | Series 2020-1A-A2II | 44,685 | ||||||
| Sprite Ltd. | ||||||||
| 189,051 | Series 2021-1-A | 173,535 | ||||||
| Stack Infrastructure Issuer LLC | ||||||||
| 250,000 | Series 2020-1A-A2 | 231,669 | ||||||
| Start Ltd. | ||||||||
| 114,145 | Series 2018-1-A | 102,962 | ||||||
| STWD Ltd. | ||||||||
| 100,000 | Series 2022-FL3-D | 94,892 | ||||||
| Sunbird Engine Finance LLC | ||||||||
| 165,379 | Series 2020-1A-B | 95,712 | ||||||
| Symphony CLO XXXI Ltd. | ||||||||
| 650,000 | Series 2022-31A-SUB | 467,270 | ||||||
| Taco Bell Funding LLC | ||||||||
| 187,500 | Series 2016-1A-A23 | 185,253 | ||||||
| Thrust Engine Leasing DAC | ||||||||
| 391,934 | Series 2021-1A-B | 311,247 | ||||||
| Vault DI Issuer LLC | ||||||||
| 250,000 | Series 2021-1A-A2 | 219,272 | ||||||
| VB-S1 Issuer LLC | ||||||||
| 250,000 | Series 2022-1A-F | 216,245 | ||||||
| VCP RRL ABS I Ltd. | ||||||||
| 62,709 | Series 2021-1A-C | 56,943 | ||||||
The accompanying notes are an integral part of these financial statements.
| Schedule of Investments | 77 | |||||
Table of Contents
iMGP High Income Fund
SCHEDULE OF INVESTMENTS IN SECURITIES at December 31, 2023 (Continued)
| Principal Amount^ | Value | |||||||
ASSET-BACKED SECURITIES (CONTINUED) | ||||||||
| Venture XIII CLO Ltd. | ||||||||
| $ 250,000 | Series 2013-13A-SUB | $ | 5,400 | |||||
| Willis Engine Structured Trust VII | ||||||||
| 248,106 | Series 2023-A-A | 247,444 | ||||||
|
| |||||||
| | TOTAL ASSET-BACKED SECURITIES | 18,840,881 | ||||||
|
| |||||||
BANK LOANS: 18.1% | ||||||||
| 24-7 Intouch, Inc. | ||||||||
| 99,475 | 10.206%, 08/25/2025(c) | 97,766 | ||||||
| AccurideCorp. | ||||||||
| 37,149 | 10.606%, 05/18/2026(c) | 30,834 | ||||||
| Advisor Group, Inc. | ||||||||
| 100,000 | 9.856%, 08/17/2028(c) | 100,446 | ||||||
| AHP Health Partners, Inc. | ||||||||
| 555,200 | 8.970%, 08/24/2028(c) | 557,890 | ||||||
| Air Canada | ||||||||
| 723,975 | 9.139%, 08/11/2028(c) | 727,084 | ||||||
| AL NGPL Holdings LLC | ||||||||
| 297,790 | 8.845%-9.210%, 04/13/2028(c) | 298,350 | ||||||
| Allen Media LLC | ||||||||
| 510,041 | 10.998%, 02/10/2027(c) | 454,786 | ||||||
AllSpring Buyer LLC | ||||||||
| 153,063 | 9.375%, 11/01/2028(c) | 152,896 | ||||||
| American Airlines, Inc. | ||||||||
| 630,000 | 10.427%, 04/20/2028(c) | 648,163 | ||||||
| Anchor Packaging, Inc. | ||||||||
| 99,479 | 8.956%, 07/18/2026(c) | 99,106 | ||||||
| API Holdings III Corp. | ||||||||
| 3,583 | 6.348%, 03/25/2027(c) | 3,480 | ||||||
| API Technologies Corp. | ||||||||
| 98,025 | 12.383%, 05/09/2026(c) | 59,795 | ||||||
| Apttus Corp. | ||||||||
| 99,491 | 9.470%, 05/08/2028(c) | 99,875 | ||||||
| Aretec Group, Inc. | ||||||||
| 99,749 | 9.956%, 08/09/2030(c) | 99,817 | ||||||
| Aston FinCo Sarl | ||||||||
| 96,250 | 9.720%, 10/09/2026(c) | 81,829 | ||||||
| Asurion LLC | ||||||||
| 99,499 | 9.706%, 08/19/2028(c) | 99,286 | ||||||
| Principal Amount^ | Value | |||||||
| Athenahealth Group, Inc. | ||||||||
| $ 373,199 | 8.606%, 02/15/2029(c) | $ | 372,079 | |||||
| Atlas CC Acquisition Corp. | ||||||||
| 15,868 | 9.900%, 05/25/2028(c) | 14,820 | ||||||
| 3,228 | 9.900%, 05/25/2028(c) | 3,015 | ||||||
| Avalara, Inc. | ||||||||
| 136,364 | 12.598%, 10/19/2028(c) | 134,789 | ||||||
| BANGL LLC | ||||||||
| 99,750 | 9.895%, 02/01/2029(c) | 100,030 | ||||||
| Bausch Health Cos., Inc. | ||||||||
| 97,125 | 10.706%, 02/01/2027(c) | 79,339 | ||||||
| Bleriot U.S. Bidco, Inc. | ||||||||
| 99,500 | 9.610%, 10/31/2028(c) | 100,024 | ||||||
| Blue Ribbon LLC | ||||||||
| 225,288 | 11.631%, 05/08/2028(c) | 197,409 | ||||||
| Blue Tree Holdings, Inc. | ||||||||
| 99,489 | 8.110%, 03/04/2028(c) | 99,115 | ||||||
| Calpine Construction Finance Co. LP | ||||||||
| 99,750 | 7.606%, 07/31/2030(c) | 99,887 | ||||||
| Cardenas Markets, Inc. | ||||||||
| 99,496 | 12.198%, 08/01/2029(c) | 99,720 | ||||||
| Cengage Learning, Inc. | ||||||||
| 45,813 | 10.406%, 07/14/2026(c) | 46,016 | ||||||
| Central Parent Inc. | ||||||||
| 615,350 | 9.348%, 07/06/2029(c) | 619,547 | ||||||
| Chef’s Warehouse Leasing Co. LLC | ||||||||
| 92,083 | 10.206%, 08/23/2029(c) | 92,237 | ||||||
| Citadel Securities LP | ||||||||
| 99,506 | 7.970%, 07/29/2030(c) | 99,858 | ||||||
| Congruex Group LLC | ||||||||
| 44,872 | 11.283%, 05/03/2029(c) | 42,853 | ||||||
| Connect Finco Sarl | ||||||||
| 505,556 | 8.856%, 12/11/2026(c) | 506,364 | ||||||
| CP Atlas Buyer, Inc. | ||||||||
| 99,344 | 9.206%, 11/23/2027(c) | 97,988 | ||||||
| Denali Water Solutions | ||||||||
| 60,382 | 9.748%, 03/27/2028(c) | 56,935 | ||||||
| Dermatology Intermediate Holdings III, Inc. | ||||||||
| 83,801 | 9.633%, 03/30/2029(c) | 81,287 | ||||||
| 15,734 | 9.633%, 03/30/2029(c) | 15,262 | ||||||
The accompanying notes are an integral part of these financial statements.
| 78 | Litman Gregory Funds Trust | |||||
Table of Contents
iMGP High Income Fund
SCHEDULE OF INVESTMENTS IN SECURITIES at December 31, 2023 (Continued)
| Principal Amount^ | Value | |||||||
BANK LOANS (CONTINUED) | ||||||||
| Dhanani Group, Inc. | ||||||||
| $ 97,273 | 11.456%, 07/20/2025(c) | $ | 94,841 | |||||
| Eastern Power LLC | ||||||||
| 362,976 | 9.220%, 10/02/2025(c) | 357,786 | ||||||
| Eisner Advisory Group LLC | ||||||||
| 29,166 | 10.720%, 07/28/2028(c) | 29,263 | ||||||
| Emrld Borrower LP | ||||||||
| 83,278 | 8.356%, 05/31/2030(c) | 83,668 | ||||||
| EyeCare Partners LLC | ||||||||
| 96,410 | 9.395%, 02/18/2027(c) | 48,259 | ||||||
| Finastra USA, Inc. | ||||||||
| 2,647 | 12.610%, 09/13/2029(c) | 2,585 | ||||||
| 91,000 | 12.630%-12.713%, 09/13/2029(c) | 90,222 | ||||||
| First Brands Group LLC | ||||||||
| 144,855 | 10.881%, 03/30/2027(c) | 143,950 | ||||||
| Firstdigital Communications LLC | ||||||||
| 49,875 | 9.720%, 12/17/2026(c) | 48,466 | ||||||
| Florida Food Products LLC | ||||||||
| 67,422 | 10.470%, 10/18/2028(c) | 59,163 | ||||||
| FR Refuel LLC | ||||||||
| 88,462 | 10.220%, 11/08/2028(c) | 86,140 | ||||||
| GEON Performance Solutions LLC | ||||||||
| 351,900 | 10.360%, 08/18/2028(c) | 352,340 | ||||||
| Gibson Brands, Inc. | ||||||||
| 98,000 | 10.664%, 08/11/2028(c) | 87,873 | ||||||
| GIP II Blue Holding LP | ||||||||
| 147,412 | 9.970%, 09/29/2028(c) | 148,283 | ||||||
| Global Medical Response, Inc. | ||||||||
| 253,980 | 9.895%, 03/14/2025(c) | 200,222 | ||||||
| Help At Home, Inc. | ||||||||
| 1,360 | 10.460%, 10/29/2027(c) | 1,353 | ||||||
| 21,304 | 10.460%, 10/29/2027(c) | 21,184 | ||||||
| 147,521 | 10.460%, 10/29/2027(c) | 147,091 | ||||||
| Higginbotham Insurance Agency, Inc. | ||||||||
| 46,444 | 10.956%, 11/24/2028(c) | 46,011 | ||||||
| 97,574 | 10.956%, 11/24/2028(c) | 96,665 | ||||||
| HighTower Holdings LLC | ||||||||
| 36,798 | 9.641%, 04/21/2028(c) | 36,722 | ||||||
| Principal Amount^ | Value | |||||||
| Holding Socotec SAS | ||||||||
| $ 98,000 | 9.822%, 06/02/2028(c) | $ | 97,265 | |||||
| HV Eight LLC | ||||||||
| 459,209 (EUR) | 7.425%, 11/22/2027(c) | 508,152 | ||||||
| Ilpea Parent, Inc. | ||||||||
| 674,003 | 9.975%, 06/22/2028(c) | 663,893 | ||||||
| Imagefirst Holdings LLC | ||||||||
| 27,883 | 9.964%, 04/27/2028(c) | 27,883 | ||||||
| Jones DesLauriers Insurance Management, Inc. | ||||||||
| 100,000 | 9.625%, 03/15/2030(c) | 100,563 | ||||||
| Laseraway Intermediate Holdings II LLC | ||||||||
| 91,671 | 11.414%, 10/14/2027(c) | 90,639 | ||||||
| LendingTree, Inc. | ||||||||
| 553,000 | 9.213%, 09/15/2028(c) | 514,636 | ||||||
| MB2 Dental Solutions LLC | ||||||||
| 107,602 | 11.456%, 01/29/2027(c) | 106,459 | ||||||
| 78,506 | 11.456%, 01/29/2027(c) | 77,721 | ||||||
| Medallion Midland Acquisition LLC | ||||||||
| 355,000 | 0.000%, 10/18/2028(f) | 356,839 | ||||||
| Medline Borrower LP | ||||||||
| 402,825 | 8.470%, 10/23/2028(c) | 405,310 | ||||||
| Midwest Veterinary Partners LLC | ||||||||
| 97,762 | 9.470%, 04/27/2028(c) | 97,167 | ||||||
| Moran Foods LLC | ||||||||
| 5,688 | 12.698%, 06/30/2026(c) | 2,966 | ||||||
| 12,145 | 12.698%, 06/30/2026(c) | 10,911 | ||||||
| 10,721 | 12.698%, 06/30/2026(c) | 5,590 | ||||||
| MPH Acquisition Holdings LLC | ||||||||
| 742,900 | 9.900%, 09/01/2028(c) | 718,291 | ||||||
| NFM & J LP | ||||||||
| 49,520 | 11.219%-11.238%, 11/30/2027(c) | 48,530 | ||||||
| 48,718 | 11.233%, 11/30/2027(c) | 47,744 | ||||||
| Orion Group Holdco, LLC | ||||||||
| 3,783 | 11.636%, 03/19/2027(c) | 3,404 | ||||||
| 34,678 | 11.860%, 03/19/2027(c) | 34,059 | ||||||
| 35,217 | 11.860% - 11.889%, 03/19/2027(c) | 34,949 | ||||||
| Pacific Bells LLC | ||||||||
| 60,023 | 10.110%, 11/10/2028(c) | 59,891 | ||||||
| Park Place Technologies LLC | ||||||||
| 99,489 | 10.456%, 11/10/2027(c) | 99,275 | ||||||
The accompanying notes are an integral part of these financial statements.
| Schedule of Investments | 79 | |||||
Table of Contents
iMGP High Income Fund
SCHEDULE OF INVESTMENTS IN SECURITIES at December 31, 2023 (Continued)
| Principal Amount^ | Value | |||||||
BANK LOANS (CONTINUED) | ||||||||
| Pelican Products, Inc. | ||||||||
| $ 99,492 | 9.601%, 12/29/2028(c) | $ | 92,694 | |||||
| Playpower, Inc. | ||||||||
| 88,356 | 11.064%, 05/08/2026(c) | 79,520 | ||||||
| PMH Newco LP | ||||||||
| 291,280 | 8.498%, 10/02/2030(c) | 291,192 | ||||||
| PMH SPV - C LLC | ||||||||
| 94,207 | 8.498%, 10/02/2030(c) | 94,171 | ||||||
| Propulsion BC Newco LLC | ||||||||
| 475,200 | 9.098%, 09/14/2029(c) | 476,642 | ||||||
| Recess Holdings, Inc. | ||||||||
| 99,750 | 9.388%, 03/29/2027(c) | 100,623 | ||||||
| Resonetics LLC | ||||||||
| 20,188 | 9.650%, 04/28/2028(c) | 20,230 | ||||||
| Saphilux Sarl | ||||||||
| 100,000 | 10.144%, 07/18/2028(c) | 100,438 | ||||||
| ScribeAmerica Intermediate Holdco LLC | ||||||||
| 46,061 | 9.970%, 04/03/2025(c) | 32,617 | ||||||
| Service Logic Acquisition, Inc. | ||||||||
| 99,488 | 9.645%, 10/29/2027(c) | 99,571 | ||||||
| Sitecore Holding III AS | ||||||||
| 7,728 | 11.626%-13.381%, 03/12/2026(c) | 7,698 | ||||||
| 113,983 | 11.878%, 09/01/2028(c) | 113,538 | ||||||
| Southern Veterinary Partners LLC | ||||||||
| 70,300 | 9.470%, 10/05/2027(c) | 70,168 | ||||||
| Syndigo LLC | ||||||||
| 120,940 | 9.970%, 12/15/2027(c) | 118,597 | ||||||
| System One Holdings LLC | ||||||||
| 741,000 | 9.498%, 03/02/2028(c) | 740,074 | ||||||
| Teneo Holdings LLC | ||||||||
| 99,481 | 10.706%, 07/11/2025(c) | 99,558 | ||||||
| United Airlines, Inc. | ||||||||
| 506,990 | 9.220%, 04/21/2028(c) | 509,525 | ||||||
| Venture Global Calcasieu Pass LLC | ||||||||
| 21,438 | 7.981%, 08/19/2026(c) | 21,465 | ||||||
| Verscend Holding Corp. | ||||||||
| 191,944 | 9.470%, 08/27/2025(c) | 192,823 | ||||||
| Principal Amount^ | Value | |||||||
| Weber-Stephen Products LLC | ||||||||
| $ 98,250 | 9.706%, 10/30/2027(c) | $ | 86,460 | |||||
| WellSky | ||||||||
| 100,000 | 10.220%, 02/09/2024(c) | 100,000 | ||||||
| Women’s Care Enterprises LLC | ||||||||
| 191,837 | 10.053%, 01/15/2028(c) | 165,459 | ||||||
| World Wide Technology Holding Co. LLC | ||||||||
| 99,499 | 8.707%, 03/01/2030(c) | 99,997 | ||||||
| WW International, Inc. | ||||||||
| 9,000 | 0.000%, 04/13/2028(f) | 6,416 | ||||||
| Xplornet Communications, Inc. | ||||||||
| 59,517 | 9.610%, 10/02/2028(c) | 36,357 | ||||||
|
| |||||||
| | TOTAL BANK LOANS | 16,620,034 | ||||||
|
| |||||||
CONVERTIBLE BONDS: 0.3% | ||||||||
| Communications: 0.1% | ||||||||
| Cable One, Inc. | ||||||||
| 50,000 | 0.000%, 03/15/2026(g) | 42,675 | ||||||
|
| |||||||
| Energy: 0.2% | ||||||||
| NextEra Energy Partners LP | ||||||||
| 240,000 | 2.500%, 06/15/2026(b) | 216,240 | ||||||
|
| |||||||
| | TOTAL CONVERTIBLE BONDS | 258,915 | ||||||
|
| |||||||
CORPORATE BONDS: 35.7% | ||||||||
| Basic Materials: 0.9% | ||||||||
| Arsenal AIC Parent LLC | ||||||||
| 100,000 | 8.000%, 10/01/2030(b) | 104,461 | ||||||
| International Flavors & Fragrances, Inc. | ||||||||
| 90,000 | 1.230%, 10/01/2025(b) | 83,382 | ||||||
| Mativ Holdings, Inc. | ||||||||
| 346,000 | 6.875%, 10/01/2026(b) | 332,285 | ||||||
| Minerals Technologies, Inc. | ||||||||
| 65,000 | 5.000%, 07/01/2028(b) | 62,572 | ||||||
| SCIL IV LLC/SCIL USA Holdings LLC | ||||||||
| 100,000 (EUR) | 9.500%, 07/15/2028(b) | 118,228 | ||||||
| SK Invictus Intermediate II SARL | ||||||||
| 100,000 | 5.000%, 10/30/2029(b) | 86,860 | ||||||
| Valvoline, Inc. | ||||||||
| 66,000 | 3.625%, 06/15/2031(b) | 56,446 | ||||||
|
| |||||||
| 844,234 | ||||||||
|
| |||||||
| Communications: 2.2% | ||||||||
| Altice France SA | ||||||||
| 200,000 | 5.500%, 10/15/2029(b) | 156,994 | ||||||
| AMC Networks, Inc. | ||||||||
| 150,000 | 4.250%, 02/15/2029 | 114,975 | ||||||
| British Telecommunications PLC | ||||||||
| 200,000 | 4.875%, 11/23/2081(b)(d) | 171,806 | ||||||
| CCO Holdings LLC/CCO Holdings Capital Corp. | ||||||||
| 410,000 | 7.375%, 03/01/2031(b) | 420,794 | ||||||
The accompanying notes are an integral part of these financial statements.
| 80 | Litman Gregory Funds Trust | |||||
Table of Contents
iMGP High Income Fund
SCHEDULE OF INVESTMENTS IN SECURITIES at December 31, 2023 (Continued)
| Principal Amount^ | Value | |||||||
CORPORATE BONDS (CONTINUED) | ||||||||
| Communications (continued) | ||||||||
| Connect Finco SARL/Connect U.S. Finco LLC | ||||||||
| $330,000 | 6.750%, 10/01/2026(b) | $ | 328,358 | |||||
| LCPR Senior Secured Financing DAC | ||||||||
| 200,000 | 5.125%, 07/15/2029(b) | 174,471 | ||||||
| Level 3 Financing, Inc. | ||||||||
| 231,000 | 4.250%, 07/01/2028(b) | 114,578 | ||||||
| Match Group Holdings II LLC | ||||||||
| 50,000 | 4.625%, 06/01/2028(b) | 47,916 | ||||||
| McGraw-Hill Education, Inc. | ||||||||
| 100,000 | 5.750%, 08/01/2028(b) | 96,527 | ||||||
| 40,000 | 8.000%, 08/01/2029(b) | 37,238 | ||||||
| Paramount Global | ||||||||
| 16,000 | 5.900%, 10/15/2040 | 14,551 | ||||||
| 10,000 | 4.850%, 07/01/2042 | 8,054 | ||||||
| 8,000 | 5.250%, 04/01/2044 | 6,442 | ||||||
| 28,000 | 4.900%, 08/15/2044 | 22,144 | ||||||
| 5,000 | 4.600%, 01/15/2045 | 3,821 | ||||||
| Radiate Holdco LLC/Radiate Finance, Inc. | ||||||||
| 150,000 | 4.500%, 09/15/2026(b) | 114,501 | ||||||
Virgin Media Finance PLC | ||||||||
| 100,000 | 5.000%, 07/15/2030(b) | 88,381 | ||||||
| Vodafone Group PLC | ||||||||
| 100,000 | 5.125%, 06/04/2081(d) | 75,720 | ||||||
|
| |||||||
| 1,997,271 | ||||||||
|
| |||||||
| Consumer, Cyclical: 2.3% | ||||||||
| Air Canada | ||||||||
| 100,000 (CAD) | 4.625%, 08/15/2029(b) | 70,194 | ||||||
| Air Canada Pass Through Trust | ||||||||
| 15,572 | Series 2020-2-A | 15,294 | ||||||
| Asbury Automotive Group, Inc. | ||||||||
| 44,000 | 4.625%, 11/15/2029(b) | 40,789 | ||||||
| Beacon Roofing Supply, Inc. | ||||||||
| 100,000 | 6.500%, 08/01/2030(b) | 102,343 | ||||||
| CD&R Smokey Buyer, Inc. | ||||||||
| 100,000 | 6.750%, 07/15/2025(b) | 99,039 | ||||||
| Deuce Finco PLC | ||||||||
| 100,000 (GBP) | 5.500%, 06/15/2027(b) | 119,145 | ||||||
| Evergreen Acqco 1 LP/TVI, Inc. | ||||||||
| 90,000 | 9.750%, 04/26/2028(b) | 95,921 | ||||||
| JB Poindexter & Co., Inc. | ||||||||
| 30,000 | 8.750%, 12/15/2031(b) | 30,628 | ||||||
| Lightning eMotors, Inc. | ||||||||
| 55,248 | 7.500%, 03/01/2037 | 51,786 | ||||||
| 110,467 | Series 2022-1-A | 104,067 | ||||||
| Macy’s Retail Holdings LLC | ||||||||
| 342,000 | 5.875%, 03/15/2030(b) | 325,391 | ||||||
| Murphy Oil USA, Inc. | ||||||||
| 125,000 | 3.750%, 02/15/2031(b) | 108,904 | ||||||
| Nordstrom, Inc. | ||||||||
| 485,000 | 4.375%, 04/01/2030 | 422,525 | ||||||
| Ontario Gaming GTA LP | ||||||||
| 100,000 | 8.000%, 08/01/2030(b) | 103,197 | ||||||
| Principal Amount^ | Value | |||||||
| Consumer, Cyclical (continued) | ||||||||
| Penn Entertainment, Inc. | ||||||||
| $100,000 | 4.125%, 07/01/2029(b) | $ | 85,919 | |||||
| Scientific Games Holdings LP/Scientific Games U.S. FinCo, Inc. | ||||||||
| 100,000 | 6.625%, 03/01/2030(b) | 94,661 | ||||||
| Superior Plus LP/Superior General Partner, Inc. | ||||||||
| 100,000 | 4.500%, 03/15/2029(b) | 92,818 | ||||||
| Thunderbird Entertainment Group, Inc. | ||||||||
| 56,085 | 7.500%, 03/01/2037 | 52,570 | ||||||
| 112,170 | Series 2022-1-1A | 105,672 | ||||||
|
| |||||||
| 2,120,863 | ||||||||
|
| |||||||
| Consumer, Non-cyclical: 2.4% | ||||||||
| ADT Security Corp. | ||||||||
| 100,000 | 4.875%, 07/15/2032(b) | 92,600 | ||||||
| Altria Group, Inc. | ||||||||
| 10,000 | 4.450%, 05/06/2050 | 7,981 | ||||||
| Ashtead Capital, Inc. | ||||||||
| 420,000 | 5.500%, 08/11/2032(b) | 416,028 | ||||||
| Bausch Health Cos., Inc. | ||||||||
| 725,000 | 4.875%, 06/01/2028(b) | 437,797 | ||||||
| BCP V Modular Services Finance II PLC | ||||||||
| 100,000 (EUR) | 4.750%, 11/30/2028(b) | 103,042 | ||||||
| Carriage Services, Inc. | ||||||||
| 100,000 | 4.250%, 05/15/2029(b) | 88,929 | ||||||
| Catalent Pharma Solutions, Inc. | ||||||||
| 72,000 | 3.125%, 02/15/2029(b) | 63,090 | ||||||
| Endo Luxembourg Finance Co. I SARL/Endo U.S., Inc. | ||||||||
| 100,000 | 6.125%, 04/01/2029(b)(h) | 64,092 | ||||||
| GTCR W-2 Merger Sub LLC | ||||||||
| 200,000 | 7.500%, 01/15/2031(b) | 211,474 | ||||||
| JBS USA LUX SA/JBS USA Food Co./JBS USA Finance, Inc. | ||||||||
| 50,000 | 3.750%, 12/01/2031 | 43,178 | ||||||
| 100,000 | 4.375%, 02/02/2052 | 74,565 | ||||||
| Kronos Acquisition Holdings, Inc./KIK Custom Products, Inc. | ||||||||
| 42,000 | 7.000%, 12/31/2027(b) | 40,156 | ||||||
| Legends Hospitality Holding Co. LLC/Legends Hospitality Co.-Issuer, Inc. | ||||||||
| 200,000 | 5.000%, 02/01/2026(b) | 199,825 | ||||||
| Sotheby’s/Bidfair Holdings, Inc. | ||||||||
| 200,000 | 5.875%, 06/01/2029(b) | 174,888 | ||||||
| Spectrum Brands, Inc. | ||||||||
| 50,000 | 5.500%, 07/15/2030(b) | 48,574 | ||||||
| WW International, Inc. | ||||||||
| 91,000 | 4.500%, 04/15/2029(b) | 60,434 | ||||||
|
| |||||||
| 2,126,653 | ||||||||
|
| |||||||
| Energy: 3.2% | ||||||||
| BP Capital Markets PLC | ||||||||
| 250,000 | 4.875%, 03/22/2030(a)(d) | 238,406 | ||||||
| CVR Energy, Inc. | ||||||||
| 100,000 | 8.500%, 01/15/2029(b) | 99,837 | ||||||
| DT Midstream, Inc. | ||||||||
| 100,000 | 4.125%, 06/15/2029(b) | 92,122 | ||||||
The accompanying notes are an integral part of these financial statements.
| Schedule of Investments | 81 | |||||
Table of Contents
iMGP High Income Fund
SCHEDULE OF INVESTMENTS IN SECURITIES at December 31, 2023 (Continued)
| Principal Amount^ | Value | |||||||
CORPORATE BONDS (CONTINUED) | ||||||||
| Energy (continued) | ||||||||
| Energy Transfer LP | ||||||||
| $ 510,000 | 7.375%, 02/01/2031(b) | $ | 536,296 | |||||
| 390,000 | Series A | 375,010 | ||||||
| EnLink Midstream LLC | ||||||||
| 400,000 | 6.500%, 09/01/2030(b) | 408,719 | ||||||
| Global Partners LP/GLP Finance Corp. | ||||||||
| 100,000 | 7.000%, 08/01/2027 | 97,862 | ||||||
| 25,000 | 6.875%, 01/15/2029 | 24,238 | ||||||
| HF Sinclair Corp. | ||||||||
| 100,000 | 6.375%, 04/15/2027(b) | 100,890 | ||||||
| ITT Holdings LLC | ||||||||
| 224,000 | 6.500%, 08/01/2029(b) | 198,389 | ||||||
| Kinetik Holdings LP | ||||||||
| 100,000 | 5.875%, 06/15/2030(b) | 98,258 | ||||||
| Midwest Connector Capital Co. LLC | ||||||||
| 99,000 | 4.625%, 04/01/2029(b) | 95,508 | ||||||
| NuStar Logistics LP | ||||||||
| 100,000 | 6.375%, 10/01/2030 | 100,319 | ||||||
| Occidental Petroleum Corp. | ||||||||
| 100,000 | 7.875%, 09/15/2031 | 113,885 | ||||||
| Parkland Corp. | ||||||||
| 100,000 | 4.625%, 05/01/2030(b) | 92,110 | ||||||
| Targa Resources Partners LP/Targa Resources Partners Finance Corp. | ||||||||
| 150,000 | 5.500%, 03/01/2030 | 150,153 | ||||||
| Venture Global LNG, Inc. | ||||||||
| 50,000 | 9.500%, 02/01/2029(b) | 52,927 | ||||||
| 50,000 | 9.875%, 02/01/2032(b) | 52,119 | ||||||
|
| |||||||
| 2,927,048 | ||||||||
|
| |||||||
| Financial: 18.6% | ||||||||
| Aegon Ltd. | ||||||||
| 300,000 | 5.500%, 04/11/2048(d) | 285,601 | ||||||
| Apollo Management Holdings LP | ||||||||
| 700,000 | 4.950%, 01/14/2050(b)(d) | 662,907 | ||||||
| Arbor Realty SR, Inc. | ||||||||
| 685,000 | Series QIB | 682,159 | ||||||
| AXIS Specialty Finance LLC | ||||||||
| 400,000 | 4.900%, 01/15/2040(d) | 333,681 | ||||||
| Bank of America Corp. | ||||||||
| 785,000 | Series RR | 701,421 | ||||||
| Blackstone Mortgage Trust, Inc. | ||||||||
| 465,000 | 3.750%, 01/15/2027(b) | 414,096 | ||||||
| Brazilian Merchant Voucher Receivables Ltd. | ||||||||
| 144,257 | 4.180%, 04/07/2028(d)(i) | 137,684 | ||||||
| Bread Financial Holdings, Inc. | ||||||||
| 300,000 | 9.750%, 03/15/2029(b) | 310,064 | ||||||
| Brightsphere Investment Group, Inc. | ||||||||
| 235,000 | 4.800%, 07/27/2026 | 225,559 | ||||||
| Principal Amount^ | Value | |||||||
| Financial (continued) | ||||||||
| Ceamer Fin 2 Sr Sec Nts | ||||||||
| $ 250,000 | 6.920%, 05/15/2038 | $ | 243,695 | |||||
| Charles Schwab Corp. | ||||||||
| 100,000 | Series H | 79,096 | ||||||
| CION Investment Corp. | ||||||||
| 230,000 | 4.500%, 02/11/2026 | 218,127 | ||||||
| Citigroup, Inc. | ||||||||
| 100,000 | Series W | 92,531 | ||||||
| 150,000 | Series X | 133,146 | ||||||
| Comerica Bank | ||||||||
| 645,000 | 4.000%, 07/27/2025 | 622,156 | ||||||
| Corebridge Financial, Inc. | ||||||||
| 505,000 | 6.875%, 12/15/2052(d) | 504,357 | ||||||
| Cushman & Wakefield U.S. Borrower LLC | ||||||||
| 71,000 | 6.750%, 05/15/2028(b) | 70,717 | ||||||
| Enstar Finance LLC | ||||||||
| 200,000 | 5.750%, 09/01/2040(d) | 187,512 | ||||||
| 770,000 | 5.500%, 01/15/2042(d) | 653,618 | ||||||
| Equitable Holdings, Inc. | ||||||||
| 150,000 | Series B | 143,112 | ||||||
| F&G Annuities & Life, Inc. | ||||||||
| 400,000 | 7.400%, 01/13/2028 | 413,374 | ||||||
| Fairfax India Holdings Corp. | ||||||||
| 320,000 | 5.000%, 02/26/2028(b) | 289,600 | ||||||
| Fidelis Insurance Holdings Ltd. | ||||||||
| 630,000 | 6.625%, 04/01/2041(b)(d) | 616,912 | ||||||
| Fifth Third Bancorp | ||||||||
| 400,000 | 6.361%, 10/27/2028(d) | 415,483 | ||||||
| FS KKR Capital Corp. | ||||||||
| 100,000 | 3.250%, 07/15/2027 | 91,095 | ||||||
| Global Atlantic Fin Co. | ||||||||
| 490,000 | 7.950%, 06/15/2033(b) | 544,580 | ||||||
| 250,000 | 4.700%, 10/15/2051(b)(d) | 214,455 | ||||||
| GLP Capital LP/GLP Financing II, Inc. | ||||||||
| 50,000 | 5.300%, 01/15/2029 | 49,695 | ||||||
| 140,000 | 4.000%, 01/15/2031 | 126,241 | ||||||
| Goldman Sachs Group, Inc. | ||||||||
| 100,000 | Series U | 88,923 | ||||||
| HAT Holdings I LLC/HAT Holdings II LLC | ||||||||
| 450,000 | 3.375%, 06/15/2026(b) | 423,219 | ||||||
| Home Point Capital, Inc. | ||||||||
| 70,000 | 5.000%, 02/01/2026(b) | 68,494 | ||||||
The accompanying notes are an integral part of these financial statements.
| 82 | Litman Gregory Funds Trust | |||||
Table of Contents
iMGP High Income Fund
SCHEDULE OF INVESTMENTS IN SECURITIES at December 31, 2023 (Continued)
| Principal Amount^ | Value | |||||||
CORPORATE BONDS (CONTINUED) | ||||||||
| Financial (continued) | ||||||||
| Horace Mann Educators Corp. | ||||||||
| $100,000 | 7.250%, 09/15/2028 | $ | 106,552 | |||||
| Host Hotels & Resorts LP | ||||||||
| 150,000 | Series I | 134,075 | ||||||
| Hunt Cos., Inc. | ||||||||
| 100,000 | 5.250%, 04/15/2029(b) | 89,311 | ||||||
| Iron Mountain, Inc. | ||||||||
| 150,000 | 5.625%, 07/15/2032(b) | 142,434 | ||||||
| Jane Street Group/JSG Finance, Inc. | ||||||||
| 100,000 | 4.500%, 11/15/2029(b) | 93,363 | ||||||
| Jefferies Finance LLC/JFIN Co.-Issuer Corp. | ||||||||
| 200,000 | 5.000%, 08/15/2028(b) | 179,428 | ||||||
| Kennedy-Wilson, Inc. | ||||||||
| 100,000 | 4.750%, 03/01/2029 | 83,601 | ||||||
| 100,000 | 4.750%, 02/01/2030 | 81,182 | ||||||
| 56,000 | 5.000%, 03/01/2031 | 44,545 | ||||||
| KKR Core Holding Co. LLC | ||||||||
| 96,799 | 4.000%, 08/12/2031 | 87,033 | ||||||
| Kuvare U.S. Holdings, Inc. | ||||||||
| 100,000 | Series A | 101,250 | ||||||
| Liberty Mutual Group, Inc. | ||||||||
| 220,000 | 4.300%, 02/01/2061(b) | 144,962 | ||||||
| LPL Holdings, Inc. | ||||||||
| 150,000 | 4.000%, 03/15/2029(b) | 138,831 | ||||||
| Lvnv Funding LLC | ||||||||
| 100,000 | 7.800%, 11/05/2028 | 104,412 | ||||||
| Markel Group, Inc. | ||||||||
| 170,000 | 6.000%, 06/01/2025(a)(d) | 168,376 | ||||||
| NFP Corp. | ||||||||
| 170,000 | 6.875%, 08/15/2028(b) | 172,907 | ||||||
| OFS Capital Corp. | ||||||||
| 620,000 | 4.750%, 02/10/2026 | 562,856 | ||||||
| OneAmerica Financial Partners, Inc. | ||||||||
| 70,000 | 4.250%, 10/15/2050(b) | 50,795 | ||||||
| OneMain Finance Corp. | ||||||||
| 100,000 | 9.000%, 01/15/2029 | 105,865 | ||||||
| PartnerRe Finance B LLC | ||||||||
| 290,000 | 4.500%, 10/01/2050(d) | 247,515 | ||||||
| PennyMac Financial Services, Inc. | ||||||||
| 20,000 | 7.875%, 12/15/2029(b) | 20,619 | ||||||
| RenaissanceRe Holdings Ltd. | ||||||||
| 425,000 | 5.750%, 06/05/2033 | 429,688 | ||||||
| Rocket Mortgage LLC/Rocket Mortgage Co.-Issuer, Inc. | ||||||||
| 150,000 | 3.875%, 03/01/2031(b) | 132,030 | ||||||
| Scentre Group Trust 2 | ||||||||
| 410,000 | 5.125%, 09/24/2080(b)(d) | 366,141 | ||||||
| Sculptor Alternative Solutions LLC | ||||||||
| 500,000 | 6.000%, 05/15/2037(b) | 427,200 | ||||||
| SiriusPoint Ltd. | ||||||||
| 700,000 | 4.600%, 11/01/2026(b) | 649,775 | ||||||
| Principal Amount^ | Value | |||||||
| Financial (continued) | ||||||||
| Starwood Property Trust, Inc. | ||||||||
| $ 560,000 | 4.375%, 01/15/2027(b) | $ | 528,352 | |||||
| Strategic Credit Opportunities Partners LLC | ||||||||
| 345,000 | Series A | 323,508 | ||||||
| Toronto-Dominion Bank | ||||||||
| 50,000 | 8.125%, 10/31/2082(d) | 52,171 | ||||||
| Trinity Capital, Inc. | ||||||||
| 320,000 | 4.375%, 08/24/2026 | 289,829 | ||||||
| United Insurance Holdings Corp. | ||||||||
| 255,000 | 7.250%, 12/15/2027 | 226,950 | ||||||
| United Wholesale Mortgage LLC | ||||||||
| 100,000 | 5.500%, 04/15/2029(b) | 94,788 | ||||||
| Universal Insurance Holdings, Inc. | ||||||||
| 345,000 | 5.625%, 11/30/2026 | 312,486 | ||||||
| Wells Fargo & Co. | ||||||||
| 100,000 | 7.625%, 09/15/2028(a)(d) | 104,905 | ||||||
| 100,000 | Series BB | 92,451 | ||||||
| Wilton RE Ltd. | ||||||||
| 190,000 | 6.000%, 10/22/2030(a)(b)(d) | 168,082 | ||||||
|
| |||||||
| 17,101,578 | ||||||||
|
| |||||||
| Industrial: 2.1% | ||||||||
| Arcosa, Inc. | ||||||||
| 100,000 | 4.375%, 04/15/2029(b) | 93,245 | ||||||
| Artera Services LLC | ||||||||
| 110,000 | 9.033%, 12/04/2025(b) | 104,363 | ||||||
| Brundage-Bone Concrete Pumping Holdings, Inc. | ||||||||
| 150,000 | 6.000%, 02/01/2026(b) | 150,110 | ||||||
| Enviri Corp. | ||||||||
| 175,000 | 5.750%, 07/31/2027(b) | 163,372 | ||||||
| Flowserve Corp. | ||||||||
| 60,000 | 3.500%, 10/01/2030 | 53,312 | ||||||
| Fontainebleau Vegas | ||||||||
| 236,713 | 10.211%, 01/31/2026 | 236,713 | ||||||
| GrafTech Finance, Inc. | ||||||||
| 105,000 | 4.625%, 12/15/2028(b) | 69,735 | ||||||
| GrafTech Global Enterprises, Inc. | ||||||||
| 30,000 | 9.875%, 12/15/2028(b) | 23,175 | ||||||
| Great Lakes Dredge & Dock Corp. | ||||||||
| 200,000 | 5.250%, 06/01/2029(b) | 170,248 | ||||||
| James Hardie International Finance DAC | ||||||||
| 250,000 | 5.000%, 01/15/2028(b) | 242,127 | ||||||
| Spirit AeroSystems, Inc. | ||||||||
| 301,000 | 9.375%, 11/30/2029(b) | 329,689 | ||||||
| Summit Materials LLC/Summit Materials Finance Corp. | ||||||||
| 100,000 | 7.250%, 01/15/2031(b) | 105,299 | ||||||
| TopBuild Corp. | ||||||||
| 50,000 | 3.625%, 03/15/2029(b) | 45,359 | ||||||
| TransDigm, Inc. | ||||||||
| 100,000 | 6.875%, 12/15/2030(b) | 103,066 | ||||||
The accompanying notes are an integral part of these financial statements.
| Schedule of Investments | 83 | |||||
Table of Contents
iMGP High Income Fund
SCHEDULE OF INVESTMENTS IN SECURITIES at December 31, 2023 (Continued)
| Principal Amount^ | Value | |||||||
CORPORATE BONDS (CONTINUED) | ||||||||
| Industrial (continued) | ||||||||
| XPO, Inc. | ||||||||
| $85,000 | 6.250%, 06/01/2028(b) | $ | 86,176 | |||||
|
| |||||||
| 1,975,989 | ||||||||
|
| |||||||
| Technology: 2.4% | ||||||||
| ams-OSRAM AG | ||||||||
| 770,000 | 12.250%, 03/30/2029(b) | 857,264 | ||||||
| AthenaHealth Group, Inc. | ||||||||
| 128,000 | 6.500%, 02/15/2030(b) | 116,372 | ||||||
| CDW LLC/CDW Finance Corp. | ||||||||
| 34,000 | 3.569%, 12/01/2031 | 30,171 | ||||||
| Central Parent, Inc./CDK Global, Inc. | ||||||||
| 100,000 | 7.250%, 06/15/2029(b) | 102,268 | ||||||
| Cloud Software Group, Inc. | ||||||||
| 100,000 | 6.500%, 03/31/2029(b) | 95,365 | ||||||
| Dell International LLC/EMC Corp. | ||||||||
| 400,000 | 5.750%, 02/01/2033 | 422,032 | ||||||
| Playtika Holding Corp. | ||||||||
| 100,000 | 4.250%, 03/15/2029(b) | 87,352 | ||||||
| Twilio, Inc. | ||||||||
| 100,000 | 3.875%, 03/15/2031 | 89,266 | ||||||
| VC3, Inc. | ||||||||
| 428,374 | 3.500%, 10/15/2041 | 386,479 | ||||||
|
| |||||||
| 2,186,569 | ||||||||
|
| |||||||
| Utilities: 1.6% | ||||||||
| Alexander Funding Trust II | ||||||||
| 605,000 | 7.467%, 07/31/2028(b) | 636,539 | ||||||
| Edison International | ||||||||
| 445,000 | Series A | 421,993 | ||||||
| Vistra Operations Co. LLC | ||||||||
| 385,000 | 6.950%, 10/15/2033(b) | 405,892 | ||||||
|
| |||||||
| 1,464,424 | ||||||||
|
| |||||||
| | TOTAL CORPORATE BONDS | 32,744,629 | ||||||
|
| |||||||
| GOVERNMENT SECURITIES & AGENCY ISSUE: 5.1% | ||||||||
| U.S. Treasury Notes | ||||||||
| 2,000,000 | 0.375%, 09/15/2024(j) | 1,936,941 | ||||||
| 1,900,000 | 1.000%, 12/15/2024(j) | 1,832,323 | ||||||
| 900,000 | 1.750%, 03/15/2025(j) | 869,907 | ||||||
|
| |||||||
| | TOTAL GOVERNMENT SECURITIES & AGENCY ISSUE | 4,639,171 | ||||||
|
| |||||||
| MORTGAGE-BACKED SECURITIES: 11.1% | ||||||||
| ACRE Commercial Mortgage Ltd. | ||||||||
| 250,000 | Series 2021-FL4-D | 235,788 | ||||||
| Alternative Loan Trust | ||||||||
| 109,631 | Series 2007-OA4-A1 | 93,396 | ||||||
| Principal Amount^ | Value | |||||||
| Alternative Loan Trust (continued) | ||||||||
| $107,778 | Series 2007-OA7-A1A | $ | 91,662 | |||||
| BPR Trust | ||||||||
| 230,000 | Series 2022-OANA-C | 219,407 | ||||||
| BRAVO Residential Funding Trust | ||||||||
| 94,498 | Series 2022-R1-A | 88,774 | ||||||
| BX Commercial Mortgage Trust | ||||||||
| 212,500 | Series 2019-XL-F | 211,000 | ||||||
| 212,500 | Series 2019-XL-G | 209,425 | ||||||
| BX Trust | ||||||||
| 100,000 | Series 2023-DELC-B | 100,428 | ||||||
| BXMT Ltd. | ||||||||
| 250,000 | Series 2020-FL2-D | 204,434 | ||||||
| 100,000 | Series 2020-FL3-D | 86,199 | ||||||
| CD Mortgage Trust | ||||||||
| 805,784 | Series 2017-CD4-XA | 24,711 | ||||||
| CFMT LLC | ||||||||
| 100,000 | Series 2022-HB9 M1 | 86,493 | ||||||
| Citigroup Mortgage Loan Trust, Inc. | ||||||||
| 90,445 | Series 2022-A-A1 | 90,875 | ||||||
| Credit Suisse Mortgage-Backed Trust | ||||||||
| 570,000 | Series 2018-SITE-E | 563,129 | ||||||
| Credit Suisse Mortgage-Backed Trust | ||||||||
| 480,000 | Series 2018-SITE-C | 476,462 | ||||||
| 55,904 | Series 2020-RPL5-A1 | 56,678 | ||||||
| Federal Home Loan Mortgage Corp. | ||||||||
| 642,875 | 3.000%, 08/01/2052 | 573,727 | ||||||
| 142,203 | 5.000%, 09/01/2052 | 141,076 | ||||||
| 100,944 | 5.000%, 03/01/2053 | 100,079 | ||||||
| Federal National Mortgage Association | ||||||||
| 85,955 | 2.500%, 10/01/2051 | 73,591 | ||||||
| 97,317 | 2.000%, 03/01/2052 | 80,251 | ||||||
| 92,406 | 3.000%, 03/01/2052 | 82,102 | ||||||
| 54,201 | 5.000%, 09/01/2052 | 53,772 | ||||||
| 185,645 | 5.000%, 05/01/2053 | 184,000 | ||||||
| 2,534,803 | 5.500%, 05/01/2053 | 2,548,194 | ||||||
| 49,399 | 5.000%, 06/01/2053 | 48,955 | ||||||
| 147,662 | 5.000%, 08/01/2053 | 146,315 | ||||||
| Finance of America HECM Buyout | ||||||||
| 100,000 | Series 2022-HB2-M2 | 96,491 | ||||||
The accompanying notes are an integral part of these financial statements.
| 84 | Litman Gregory Funds Trust | |||||
Table of Contents
iMGP High Income Fund
SCHEDULE OF INVESTMENTS IN SECURITIES at December 31, 2023 (Continued)
Principal Amount^ | Value | |||||||
MORTGAGE-BACKED SECURITIES (CONTINUED) | ||||||||
| Freddie Mac Military Housing Bonds Resecuritization Trust Certificates | ||||||||
| $ 2,705,035 | Series 2015-R1-XA1 | $ | 161,965 | |||||
| 4,229,099 | Series 2015-R1-XA3 | 212,387 | ||||||
| GCAT Trust | ||||||||
| 88,936 | Series 2022-NQM5-A3 | 87,521 | ||||||
| GS Mortgage Securities Corp. Trust | ||||||||
| 250,000 | Series 2020-DUNE-E | 239,999 | ||||||
| 250,000 | Series 2020-UPTN-E | 223,873 | ||||||
| HarborView Mortgage Loan Trust | ||||||||
| 185,113 | Series 2006-12-2A2A | 162,186 | ||||||
| JP Morgan Chase Commercial Mortgage Securities Trust | ||||||||
| 1,499,319 | Series 2016-JP2-XA | 49,660 | ||||||
| JPMDB Commercial Mortgage Securities Trust | ||||||||
| 181,351 | Series 2017-C5-XA | 3,632 | ||||||
| LSTAR Securities Investment Ltd. | ||||||||
| 730,803 | Series 2021-1-A | 741,608 | ||||||
| 351,935 | Series 2023-1-A1 | 354,863 | ||||||
| NYMT Loan Trust | ||||||||
| 397,546 | Series 2022-SP1-A1 | 389,585 | ||||||
| OBX Trust | ||||||||
| 86,675 | Series 2022-NQM8-A3 | 85,673 | ||||||
| 88,330 | Series 2022-NQM9-A3 | 88,296 | ||||||
| Preston Ridge Partners Mortgage LLC | ||||||||
| 71,730 | Series 2021-5-A1 | 70,089 | ||||||
| Residential Accredit Loans, Inc. Trust | ||||||||
| 371,361 | Series 2006-QO6-A1 | 88,050 | ||||||
| Taubman Centers Commercial Mortgage Trust | ||||||||
| 230,000 | Series 2022-DPM-C | 225,878 | ||||||
| Wells Fargo Commercial Mortgage Trust | ||||||||
| 892,714 | Series 2016-BNK1-XA | 28,588 | ||||||
|
| |||||||
| | TOTAL MORTGAGE-BACKED SECURITIES | 10,181,267 | ||||||
|
| |||||||
Principal Amount^ | Value | |||||||
MUNICIPAL BONDS: 0.1% | ||||||||
| District of Columbia: 0.1% | ||||||||
| District of columbia Miscellaneous Taxes Revenue | ||||||||
| $ 100,000 | Series A | $ | 108,769 | |||||
|
| |||||||
| Indiana: 0.0% | ||||||||
| Knox County Industry Economic Development Revenue | ||||||||
| 5,000 | Series B | 4,896 | ||||||
|
| |||||||
| | TOTAL MUNICIPAL BONDS | 113,665 | ||||||
|
| |||||||
SHORT-TERM INVESTMENTS: 4.9% | ||||||||
| Shares | ||||||||
MONEY MARKET FUNDS: 2.5% | ||||||||
| 2,265,202 | State Street Institutional Treasury Money Market Fund - Premier Class,5.28%(l) | 2,265,202 | ||||||
|
| |||||||
| | TOTAL MONEY MARKET FUNDS | 2,265,202 | ||||||
|
| |||||||
Principal Amount^ | ||||||||
REPURCHASE AGREEMENTS: 2.3% | ||||||||
| $2,082,373 | Fixed Income Clearing Corp. 1.600%, 12/29/2023, due 01/02/2024 [collateral: par value $2,141,300, U.S. Treasury Note, 3.875%, due 01/15/2026, value $2,124,979] (proceeds $2,082,743) | 2,082,373 | ||||||
|
| |||||||
| | TOTAL REPURCHASE AGREEMENTS | 2,082,373 | ||||||
|
| |||||||
TREASURY BILLS: 0.1% | ||||||||
| U.S. Treasury Bills | ||||||||
| 100,000 | 5.170%, 04/18/2024(g)(j)(m) | 98,458 | ||||||
|
| |||||||
| | TOTAL TREASURY BILLS | 98,458 | ||||||
|
| |||||||
| | TOTAL SHORT-TERM INVESTMENTS | 4,446,033 | ||||||
|
| |||||||
| | TOTAL PURCHASED OPTIONS | 2,571 | ||||||
|
| |||||||
| | TOTAL INVESTMENTS | 89,383,234 | ||||||
|
| |||||||
| Other Assets in Excess of Liabilities: 2.5% | 2,315,893 | |||||||
|
| |||||||
NET ASSETS: 100.0% | $ | 91,699,127 | ||||||
|
| |||||||
The accompanying notes are an integral part of these financial statements.
| Schedule of Investments | 85 | |||||
Table of Contents
iMGP High Income Fund
SCHEDULE OF INVESTMENTS IN SECURITIES at December 31, 2023 (Continued)
Percentages are stated as a percent of net assets.
| CLO | Collateralized Loan Obligation |
| ETF | Exchange-Traded Fund |
| EURIBOR | Euro Interbank Offered Rate |
| FEDL01 | Federal Funds Rate |
| LIBOR | London Interbank Offered Rate |
| LP | Limited Partnership |
| PIK | Payment-in-kind |
| SOFR | Secured Overnight Financing Rate |
| * | Non-Income Producing Security. |
| ^ | The principal amount is stated in U.S. Dollars unless otherwise indicated. |
| (a) | Perpetual Call. |
| (b) | Security was purchased pursuant to Rule 144A under the Securities Act of 1933 and may be sold in transactions exempt from registration only to qualified institutional buyers or in a public offering registered under Securities Act of 1933. |
| (c) | Floating Interest Rate at December 31, 2023. |
| (d) | Variable rate security. Interest rate or distribution rate disclosed is that which is in effect at December 31, 2023. |
| (e) | Coupon increases periodically based upon a predetermined schedule. Stated interest rate in effect at December 31, 2023. |
| (f) | This position represents an unsettled loan commitment at period end. Certain details associated with this purchase are not known prior to the settlement date, including coupon rate, which will be adjusted on settlement date. |
| (g) | Issued with a zero coupon. Income is recognized through the accretion of discount. |
| (h) | Security is currently in default and/or non-income producing. |
| (i) | Security is valued using significant unobservable inputs in good faith in accordance with procedures approved by the Board of Trustees. |
| (j) | Securities with an aggregate fair value of $3,769,159 have been pledged as collateral for options, total return swaps, credit default swaps, and futures positions. |
| (k) | Interest Only security. Security with a notional or nominal principal amount. |
| (l) | The rate disclosed is the 7 day net yield as of December 31, 2023. |
| (m) | The rate shown represents yield-to-maturity. |
CURRENCY ABBREVIATIONS:
| CAD | Canadian dollar |
| EUR | Euro |
| GBP | British pound |
The accompanying notes are an integral part of these financial statements.
UNFUNDED LOAN COMMITMENTS — At December 31, 2023, the Fund had unfunded loan commitments which could be extended at the option of the borrowers, pursuant to the following agreements:
| Borrower | Principal Amount | Current Value | Unrealized Gain (Loss) | |||||||||
Finastra USA, Inc., 0.500%, 09/13/2029 | $ | 7,353 | $ | 7,183 | $ | (170 | ) | |||||
Orion Group Holdco, LLC, 1.000%, 03/29/2027 | 30,000 | 29,772 | (228 | ) | ||||||||
Orion Group Holdco, LLC, 0.500%, 03/29/2027 | 2,739 | 2,465 | (274 | ) | ||||||||
Avalara, Inc., 0.500%, 10/19/2028 | 13,636 | 12,048 | (1,588 | ) | ||||||||
TOTAL | $ | 51,468 | $ | (2,260 | ) | |||||||
| 86 | Litman Gregory Funds Trust | |||||
Table of Contents
iMGP High Income Fund
SCHEDULE OF INVESTMENTS IN PURCHASED OPTIONS at December 31, 2023
| Description | Counterparty | Exercise Price | Expiration Date | Number of Contracts | Notional Amount | Fair Value | Premiums Paid | Unrealized Appreciation/ (Depreciation) | ||||||||||||||||||||||
INTEREST RATE SWAPTIONS |
| |||||||||||||||||||||||||||||
Call |
| |||||||||||||||||||||||||||||
Ten Year Two Year SOFR Constant Maturity Swaption | Bank of America N.A. | $ | 0.10 | 6/20/2024 | 600,000 | $ | 600,000 | $ | 467 | $ | 2,820 | $ | (2,353 | ) | ||||||||||||||||
Ten Year Two Year SOFR Constant Maturity Swaption | Barclays Bank Plc | 0.10 | 6/20/2024 | 1,200,000 | 1,200,000 | 935 | 5,388 | (4,453 | ) | |||||||||||||||||||||
Ten Year Two Year SOFR Constant Maturity Swaption | Goldman Sachs & Co. | 0.10 | 6/20/2024 | 1,300,000 | 1,300,000 | 1,013 | 5,931 | (4,918 | ) | |||||||||||||||||||||
Ten Year Two Year SOFR Constant Maturity Swaption | Morgan Stanley & Co. | 0.10 | 6/20/2024 | 200,000 | 200,000 | 156 | 890 | (734 | ) | |||||||||||||||||||||
|
| |||||||||||||||||||||||||||||
Total Purchased Options |
| $ | 2,571 | $ | 15,029 | $ | (12,458 | ) | ||||||||||||||||||||||
|
| |||||||||||||||||||||||||||||
SCHEDULE OF INVESTMENTS IN FORWARD FOREIGN CURRENCY EXCHANGE CONTRACTS at December 31, 2023
At December 31, 2023, the Fund had the following forward foreign currency exchange contracts:
| Asset Derivatives | Liability Derivatives | |||||||||||||||||||||||||||
| Counterparty | Settlement Date | Fund Receiving | U.S. $ Value at December 31, 2023 | Fund Delivering | U.S. $ Value at December 31, 2023 | Unrealized Appreciation | Unrealized Depreciation | |||||||||||||||||||||
Bank of America N.A. | 1/17/2024 | USD | $ | 67,659 | CAD | $ | 69,689 | $ | — | $ | (2,030 | ) | ||||||||||||||||
Barclays Bank Plc | 1/17/2024 | USD | 685,390 | EUR | 701,618 | — | (16,228 | ) | ||||||||||||||||||||
| 1/17/2024 | USD | 118,115 | GBP | 119,765 | — | (1,650 | ) | |||||||||||||||||||||
|
| |||||||||||||||||||||||||||
| $ | 871,164 | $ | 891,072 | $ | — | $ | (19,908 | ) | ||||||||||||||||||||
|
| |||||||||||||||||||||||||||
| SCHEDULE OF INVESTMENTS IN FUTURES CONTRACTS at December 31, 2023 (a) | ||||||||||||||||||||
| Description | Number of Contracts | Notional Amount | Notional Value | Expiration Date | Unrealized Appreciation/ (Depreciation) | |||||||||||||||
Futures Contracts – Long |
| |||||||||||||||||||
3 Months SOFR Futures | 17 | $ | 4,073,156 | $ | 4,104,650 | 6/17/2025 | $ | 31,494 | ||||||||||||
U.S. Treasury 10-Year Note Futures | 7 | 765,315 | 790,235 | 3/19/2024 | 24,920 | |||||||||||||||
U.S. Treasury 10-Year Ultra Note Futures | 2 | 225,802 | 236,031 | 3/19/2024 | 10,229 | |||||||||||||||
U.S. Treasury 2-Year Note Futures | 5 | 1,019,738 | 1,029,570 | 3/28/2024 | 9,832 | |||||||||||||||
|
| |||||||||||||||||||
Total Long | $ | 76,475 | ||||||||||||||||||
|
| |||||||||||||||||||
Total Futures Contracts | $ | 76,475 | ||||||||||||||||||
|
| |||||||||||||||||||
| (a) | Bank of America N.A., and Goldman Sachs & Co. are the counterparties for Open Futures Contracts held by the Fund at December 31, 2023. |
The accompanying notes are an integral part of these financial statements.
| Schedule of Investments | 87 | |||||
Table of Contents
iMGP High Income Fund
SCHEDULE OF INVESTMENTS IN SWAPS at December 31, 2023
| CENTRALLY CLEARED CREDIT DEFAULT SWAP CONTRACTS (1)(2)(3) | ||||||||||||||||||||||||||||||||
| Description | Maturity Date | Fixed Deal (Pay) Rate | Implied Credit 2023 | Notional Amount(4) | Periodic Payment Frequency | Fair Value | Upfront Premiums Paid / (Received) | Unrealized Depreciation | ||||||||||||||||||||||||
Buy Protection |
| |||||||||||||||||||||||||||||||
CDX North America High Yield Index Series 41 | 12/20/2028 | (5.000 | %) | 3.574 | % | $ | (198,000 | ) | Quarterly | $ | (11,549 | ) | $ | 1,051 | $ | (12,600 | ) | |||||||||||||||
ITRAXX.EUR.38.V1 | 12/20/2027 | (1.000 | %) | 0.457 | % | EUR (1,350,000 | ) | Quarterly | (30,801 | ) | (10,181 | ) | (20,620 | ) | ||||||||||||||||||
|
|
|
|
|
| |||||||||||||||||||||||||||
Total Buy Protection |
| $ | (42,350 | ) | $ | (9,130 | ) | $ | (33,220 | ) | ||||||||||||||||||||||
|
|
|
|
|
| |||||||||||||||||||||||||||
Total | $ | (42,350 | ) | $ | (9,130 | ) | $ | (33,220 | ) | |||||||||||||||||||||||
|
|
|
|
|
| |||||||||||||||||||||||||||
| (1) | For centrally cleared swaps, when a credit event occurs as defined under the terms of the swap contract, the Fund as a seller of credit protection will either (i) pay a net amount equal to the par value of the defaulted reference entity and deliver the reference entity or (ii) pay a net amount equal to the par value of the defaulted reference entity less its recovery value. |
| (2) | For centrally cleared swaps, implied credit spread, represented in absolute terms, utilized in determining the fair value of the credit default swap contracts as of period will serve as an indicator of the payment/ performance risk and represent the likelihood of risk of default for the credit derivative. The implied credit spread of a referenced entity reflects the cost of buying/ selling protection and may include upfront payments required to be made to enter into the contract. Generally, wider credit spreads represent a perceived deterioration of the referenced entity’s credit soundness and a greater likelihood or risk of default or other credit event occurring as defined under the terms of the swap contract. |
| (3) | For centrally cleared swaps, the notional amount represents the maximum potential the Fund may receive as a buyer of credit protection if a credit event occurs, as defined under the terms of the swap contract, for each security included in the CDX North America HIgh Yield Index Series 41 and ITRAXX Series 38. |
| (4) | Notional amounts are denominated in currency where indicated and the lines below until currency changes. |
| OVER THE COUNTER TOTAL RETURN SWAP CONTRACTS | ||||||||||||||||||||||||||||||||
| Referenced Obligation | Maturity Date | Counterparty | Fund Pays/ Receives Floating Rate | Floating Rate Index and Spread | Notional Amount | Periodic Payment Frequency | Fair Value | Upfront Premiums Paid (Received) | Unrealized Appreciation / (Depreciation) | |||||||||||||||||||||||
Vanguard Short-Term Corporate Bond ETF USD | 1/6/2025 | Bank of America N.A. | | Pays | | FEDL01 + 0.450% | $ | (102,176 | ) | Annually | $ | 1,345 | $ | — | $ | 1,345 | ||||||||||||||||
iShares iBoxx $ Investment Grade Corporate Bond ETF USD | 1/6/2025 | JPMorgan Chase Bank N.A. | Receives | FEDL01 – 0.800% | 115,534 | Annually | (4,310 | ) | — | (4,310 | ) | |||||||||||||||||||||
Vanguard Intermediate-Term Corporate Bond ETF USD | 1/4/2024 | JPMorgan Chase Bank N.A. | Pays | FEDL01 – 0.150% | (105,327 | ) | Annually | 3,425 | — | 3,425 | ||||||||||||||||||||||
|
| |||||||||||||||||||||||||||||||
Total | $ | 460 | $ | — | $ | 460 | ||||||||||||||||||||||||||
|
| |||||||||||||||||||||||||||||||
The accompanying notes are an integral part of these financial statements.
| 88 | Litman Gregory Funds Trust | |||||
Table of Contents
iMGP High Income Fund
SCHEDULE OF INVESTMENTS IN WRITTEN OPTIONS AT December 31, 2023
| Description | Counterparty | Exercise Price | Expiration Date | Number of Contracts | Notional Amount | Fair Value | Premiums Received | Unrealized Appreciation/ (Depreciation) | ||||||||||||||||||||||||
INDEX OPTIONS |
| |||||||||||||||||||||||||||||||
Put | ||||||||||||||||||||||||||||||||
S&P 500 Index | UBS Securities LLC | $ | 4,625.00 | 1/5/2024 | (1 | ) | $ | (476,983 | ) | $ | (89 | ) | $ | (639 | ) | $ | 550 | |||||||||||||||
S&P 500 Index | UBS Securities LLC | 4,625.00 | 1/12/2024 | (1 | ) | (476,983 | ) | (461 | ) | (1,174 | ) | 713 | ||||||||||||||||||||
S&P 500 Index | UBS Securities LLC | 4,640.00 | 1/12/2024 | (4 | ) | (1,907,932 | ) | (2,520 | ) | (4,036 | ) | 1,516 | ||||||||||||||||||||
S&P 500 Index | UBS Securities LLC | 4,645.00 | 1/12/2024 | (1 | ) | (476,983 | ) | (645 | ) | (1,239 | ) | 594 | ||||||||||||||||||||
S&P 500 Index | UBS Securities LLC | 4,650.00 | 1/12/2024 | (2 | ) | (953,966 | ) | (1,356 | ) | (1,782 | ) | 426 | ||||||||||||||||||||
S&P 500 Index | UBS Securities LLC | 4,655.00 | 1/12/2024 | (1 | ) | (476,983 | ) | (1,000 | ) | (669 | ) | (331 | ) | |||||||||||||||||||
S&P 500 Index | UBS Securities LLC | 4,505.00 | 1/19/2024 | (1 | ) | (476,983 | ) | (350 | ) | (1,952 | ) | 1,602 | ||||||||||||||||||||
S&P 500 Index | UBS Securities LLC | 4,565.00 | 1/19/2024 | (3 | ) | (1,430,949 | ) | (1,500 | ) | (5,641 | ) | 4,141 | ||||||||||||||||||||
S&P 500 Index | UBS Securities LLC | 4,585.00 | 1/19/2024 | (1 | ) | (476,983 | ) | (680 | ) | (1,964 | ) | 1,284 | ||||||||||||||||||||
S&P 500 Index | UBS Securities LLC | 4,615.00 | 1/19/2024 | (1 | ) | (476,983 | ) | (744 | ) | (1,749 | ) | 1,005 | ||||||||||||||||||||
S&P 500 Index | UBS Securities LLC | 4,640.00 | 1/19/2024 | (1 | ) | (476,983 | ) | (920 | ) | (1,011 | ) | 91 | ||||||||||||||||||||
S&P 500 Index | UBS Securities LLC | 4,655.00 | 1/19/2024 | (2 | ) | (953,966 | ) | (2,572 | ) | (2,098 | ) | (474 | ) | |||||||||||||||||||
S&P 500 Index | UBS Securities LLC | 4,615.00 | 1/26/2024 | (3 | ) | (1,430,949 | ) | (3,900 | ) | (6,867 | ) | 2,967 | ||||||||||||||||||||
S&P 500 Index | UBS Securities LLC | 4,625.00 | 1/26/2024 | (3 | ) | (1,430,949 | ) | (3,975 | ) | (6,414 | ) | 2,439 | ||||||||||||||||||||
S&P 500 Index | UBS Securities LLC | 4,635.00 | 1/26/2024 | (2 | ) | (953,966 | ) | (3,106 | ) | (4,713 | ) | 1,607 | ||||||||||||||||||||
S&P 500 Index | UBS Securities LLC | 4,645.00 | 1/26/2024 | (1 | ) | (476,983 | ) | (1,570 | ) | (2,319 | ) | 749 | ||||||||||||||||||||
S&P 500 Index | UBS Securities LLC | 4,640.00 | 2/2/2024 | (1 | ) | (476,983 | ) | (2,305 | ) | (2,286 | ) | (19 | ) | |||||||||||||||||||
S&P 500 Index | UBS Securities LLC | 4,650.00 | 2/2/2024 | (3 | ) | (1,430,949 | ) | (7,275 | ) | (7,770 | ) | 495 | ||||||||||||||||||||
S&P 500 Index | UBS Securities LLC | 4,655.00 | 2/2/2024 | (2 | ) | (953,966 | ) | (4,760 | ) | (4,578 | ) | (182 | ) | |||||||||||||||||||
|
| |||||||||||||||||||||||||||||||
Total Written Options |
| $ | (39,728 | ) | $ | (58,901 | ) | $ | 19,173 | |||||||||||||||||||||||
|
| |||||||||||||||||||||||||||||||
The accompanying notes are an integral part of these financial statements.
| Schedule of Investments | 89 | |||||
Table of Contents
iMGP Dolan McEniry Corporate Bond Fund 2023 Annual Report (Unaudited)
During the calendar-year 2023, the iMGP Dolan McEniry Corporate Bond Fund Institutional shares posted a 7.38% versus the Bloomberg U.S. Intermediate Credit benchmark, which gained 6.94%. The Bloomberg US Aggregate Bond Index gained 5.53%. Yield curve positioning and duration had a minimal effect on relative performance versus the benchmark. Instead, the fund’s calendar-year outperformance was driven by the fund’s overexposure to and outperformance in both the corporate investment-grade and high-yield sectors. Since the fund’s inception in September 2018, the fund has generated an annualized return of 2.52%, compared to 2.47% for the Bloomberg Credit benchmark, and 1.36% for the Aggregate Index.
Performance as of 12/31/2023 | ||||||||||||||||
One- Year | Three- Year | Five- Year | Since Inception 9/28/18 | |||||||||||||
iMGP Dolan McEniry Corporate Bond Fund | 7.38% | -0.72% | 2.81% | 2.52% | ||||||||||||
Bloomberg US Interm Credit TR USD | 6.94% | -1.28% | 2.44% | 2.47% | ||||||||||||
Bloomberg US Agg Bond TR USD | 5.53% | -3.31% | 1.10% | 1.36% | ||||||||||||
Morningstar US Fund Corporate Bond | 8.31% | -3.02% | 2.41% | 2.21% | ||||||||||||
Gross Expense Ratio 1.02 %, Net Expense Ratio 0.70%* Subsidized SEC Yield: 4.77%, Unsubsidized SEC Yield: 4.74%
Performance quoted represents past performance and does not guarantee future results. The investment return and principal value of an investment will fluctuate so that an investor’s shares, when redeemed, may be worth more or less than their original cost. Current performance of the funds may be lower or higher than the performance quoted. Short term performance is not a good indication of the fund’s future performance and should not be the sole basis for investing in the fund. To obtain standardized performance of the funds, and performance as of the most recently completed calendar month, please visit www.imgpfunds.com. The Advisor has contractually agreed to limit the expenses of the fund through April 30, 2025. Without this limit the fund’s net expenses would be higher and the return would be lower.
* The expense ratios disclosed in the performance table are based on the most recent prospectus and may not tie to what are disclosed in the financial highlights. |
| |||||||||||||||
Market Review
During 2023, positive returns were seen in many fixed-income and equity indices as markets navigated falling inflation, improving supply chains, robust economic data, and heightened interest-rate volatility.
U.S. Treasuries rallied significantly, and corporate spreads tightened as the market priced in the end of the Federal Reserve’s current rate hiking cycle. The Federal Reserve continues to indicate they are prepared to keep a restrictive monetary policy until inflation is firmly under control. Overall, credit quality remains strong although there have been pockets of deterioration. Dolan McEniry will continue to monitor markets for any opportunities that may arise.
During the year, the Treasury yield curve remained inverted although the 10-year U.S. Treasury yield was unchanged at 3.88%, the 5-year yield decreased from 4.01% to 3.85% and the 2-year yield decreased from 4.43% to 4.25%.
Per Bloomberg data, spreads of corporate investment-grade bonds tightened 31 basis points during the year to an average option adjusted spread (“OAS”) of +99 basis points. The OAS of the Bloomberg Corporate High Yield Index tightened 146 basis points to +323 basis points at year end.
Outlook and Strategy
Dolan McEniry believes that client portfolios are positioned to provide reasonable absolute and relative returns going forward. Dolan McEniry’s core competence is credit analysis, and we focus on a company’s ability to generate generous amounts of free cash flow over time in relation to its indebtedness. Investment safety and risk mitigation are of primary importance as we continue to search for undervalued fixed income securities. As of December 31, the iMGP Dolan McEniry Corporate Bond Fund had a +48 basis point yield premium and similar duration versus the Bloomberg U.S Intermediate Credit. We believe these stats will allow the portfolio to perform well versus the benchmarks over time.
Portfolio Statistics as of December 31, 2023
| iMGP Dolan McEniry Corporate Bond Fund | Bloomberg Intermediate Credit | |||||||
Yield to Worst | 5.37 | % | 4.89 | % | ||||
Yield to Maturity | 5.38 | % | 4.89 | % | ||||
Effective Duration | 3.33 years | 3.94 years | ||||||
Average Coupon | 4.10 | % | 3.66 | % | ||||
| 90 | Litman Gregory Funds Trust | |||||
Table of Contents
Security Selection
Top Performers | Bottom Performers | |||
Bath & Body Works Inc. | Verisk Analytics Inc. | |||
Bloomin Brands Inc. | U.S. Treasuries | |||
DaVita Inc. | Tegna Inc. |
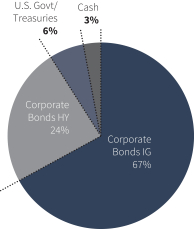
iMGP Dolan McEniry Corporate Bond Fund Value of Hypothetical $10,000
The value of a hypothetical $10,000 investment in the iMGP Dolan McEniry Corporate Bond Fund from September 28, 2018 to December 31, 2023 compared with Bloomberg US Interm Credit Index, Morningstar Corporate Bond Category and Bloomberg US Agg Bond Index.
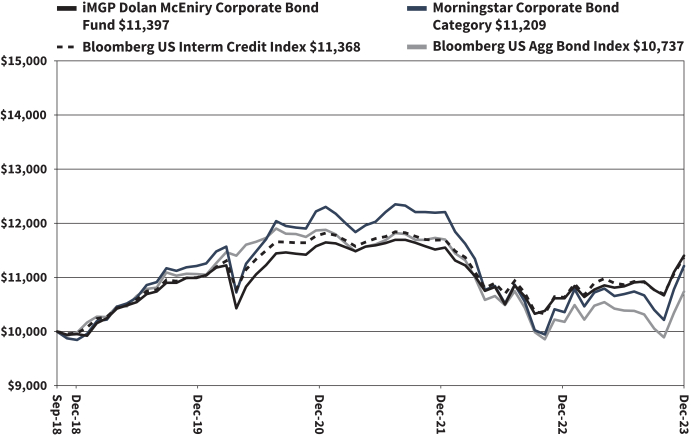
The hypothetical $10,000 investment at fund inception includes changes due to share price and reinvestment of dividends and capital gains. The chart does not imply future performance. Indexes are unmanaged, do not incur fees, expenses or taxes, and cannot be invested in directly.
Performance quoted does not include a deduction for taxes that a shareholder would pay on the redemption of fund shares.
| Fund Summary | 91 | |||||
Table of Contents
iMGP Dolan McEniry Corporate Bond Fund
SCHEDULE OF INVESTMENTS IN SECURITIES at December 31, 2023
| Principal Amount^ | Value | |||||||
CORPORATE BONDS: 91.4% | ||||||||
| Basic Materials: 3.8% | ||||||||
| Olin Corp. | ||||||||
| $3,988,000 | 5.625%, 08/01/2029 | $ | 3,928,671 | |||||
| Steel Dynamics, Inc. | ||||||||
| 918,000 | 2.400%, 06/15/2025 | 880,244 | ||||||
| 679,000 | 5.000%, 12/15/2026 | 683,359 | ||||||
| 552,000 | 1.650%, 10/15/2027 | 492,079 | ||||||
| 1,814,000 | 3.450%, 04/15/2030 | 1,672,271 | ||||||
|
| |||||||
| 7,656,624 | ||||||||
|
| |||||||
| Communications: 12.7% | ||||||||
| AT&T, Inc. | ||||||||
| 2,813,000 | 4.100%, 02/15/2028 | 2,753,216 | ||||||
| 1,008,000 | 4.350%, 03/01/2029 | 996,229 | ||||||
| 507,000 | 2.750%, 06/01/2031 | 445,426 | ||||||
| Discovery Communications LLC | ||||||||
| 3,211,000 | 3.950%, 03/20/2028 | 3,058,376 | ||||||
| 544,000 | 4.125%, 05/15/2029 | 515,883 | ||||||
| 462,000 | 3.625%, 05/15/2030 | 419,579 | ||||||
| Expedia Group, Inc. | ||||||||
| 584,000 | 5.000%, 02/15/2026 | 583,865 | ||||||
| 400,000 | 4.625%, 08/01/2027 | 398,550 | ||||||
| 2,545,000 | 3.800%, 02/15/2028 | 2,457,961 | ||||||
| 946,000 | 3.250%, 02/15/2030 | 869,046 | ||||||
| Motorola Solutions, Inc. | ||||||||
| 2,011,000 | 4.600%, 02/23/2028 | 2,003,178 | ||||||
| 1,786,000 | 4.600%, 05/23/2029 | 1,775,591 | ||||||
| Sirius XM Radio, Inc. | ||||||||
| 3,460,000 | 5.500%, 07/01/2029(a) | 3,348,986 | ||||||
| TEGNA, Inc. | ||||||||
| 2,640,000 | 4.625%, 03/15/2028 | 2,469,245 | ||||||
| Verizon Communications, Inc. | ||||||||
| 228,000 | 4.125%, 03/16/2027 | 224,908 | ||||||
| 3,648,000 | 4.329%, 09/21/2028 | 3,614,921 | ||||||
|
| |||||||
| 25,934,960 | ||||||||
|
| |||||||
| Consumer, Cyclical: 16.2% | ||||||||
| Bath & Body Works, Inc. | ||||||||
| 2,253,000 | 7.500%, 06/15/2029 | 2,349,457 | ||||||
| 1,755,000 | 6.625%, 10/01/2030(a) | 1,796,297 | ||||||
| Bloomin’ Brands, Inc./OSI Restaurant Partners LLC | ||||||||
| 2,561,000 | 5.125%, 04/15/2029(a) | 2,354,013 | ||||||
| Choice Hotels International, Inc. | ||||||||
| 3,826,000 | 3.700%, 12/01/2029 | 3,393,098 | ||||||
| Dick’s Sporting Goods, Inc. | ||||||||
| 5,223,000 | 3.150%, 01/15/2032 | 4,460,574 | ||||||
| Dollar Tree, Inc. | ||||||||
| 4,144,000 | 4.200%, 05/15/2028 | 4,061,061 | ||||||
| Genuine Parts Co. | ||||||||
| 3,808,000 | 6.500%, 11/01/2028 | 4,050,553 | ||||||
| Newell Brands, Inc. | ||||||||
| 308,000 | 6.375%, 09/15/2027 | 307,250 | ||||||
| 3,609,000 | 6.625%, 09/15/2029 | 3,601,931 | ||||||
| QVC, Inc. | ||||||||
| 2,239,000 | 4.450%, 02/15/2025 | 2,104,300 | ||||||
| 2,444,000 | 4.750%, 02/15/2027 | 1,937,233 | ||||||
| Tempur Sealy International, Inc. | ||||||||
| 3,014,000 | 4.000%, 04/15/2029(a) | 2,724,835 | ||||||
|
| |||||||
| 33,140,602 | ||||||||
|
| |||||||
| Principal Amount^ | Value | |||||||
| Consumer, Non-cyclical: 23.4% | ||||||||
| Altria Group, Inc. | ||||||||
| $1,823,000 | 4.400%, 02/14/2026 | $ | 1,807,921 | |||||
| 224,000 | 4.800%, 02/14/2029 | 223,627 | ||||||
| 2,036,000 | 3.400%, 05/06/2030 | 1,860,956 | ||||||
| BAT Capital Corp. | ||||||||
| 874,000 | 2.259%, 03/25/2028 | 783,392 | ||||||
| 1,091,000 | 4.906%, 04/02/2030 | 1,074,752 | ||||||
| Block Financial LLC | ||||||||
| 2,672,000 | 2.500%, 07/15/2028 | 2,387,445 | ||||||
| 1,817,000 | 3.875%, 08/15/2030 | 1,664,777 | ||||||
| Conagra Brands, Inc. | ||||||||
| 1,333,000 | 4.300%, 05/01/2024 | 1,326,164 | ||||||
| 654,000 | 4.600%, 11/01/2025 | 648,114 | ||||||
| 1,982,000 | 4.850%, 11/01/2028 | 1,982,696 | ||||||
| DaVita, Inc. | ||||||||
| 4,460,000 | 4.625%, 06/01/2030(a) | 3,896,566 | ||||||
| Encompass Health Corp. | ||||||||
| 2,723,000 | 4.500%, 02/01/2028 | 2,608,311 | ||||||
| 341,000 | 4.750%, 02/01/2030 | 321,709 | ||||||
| Global Payments, Inc. | ||||||||
| 970,000 | 2.650%, 02/15/2025 | 940,555 | ||||||
| 1,283,000 | 4.800%, 04/01/2026 | 1,272,886 | ||||||
| 2,038,000 | 2.900%, 05/15/2030 | 1,796,377 | ||||||
| HCA, Inc. | ||||||||
| 775,000 | 5.375%, 09/01/2026 | 779,325 | ||||||
| 2,650,000 | 5.625%, 09/01/2028 | 2,716,065 | ||||||
| 503,000 | 3.500%, 09/01/2030 | 456,528 | ||||||
| Kraft Heinz Foods Co. | ||||||||
| 939,000 | 3.000%, 06/01/2026 | 902,918 | ||||||
| Molson Coors Beverage Co. | ||||||||
| 3,836,000 | 3.000%, 07/15/2026 | 3,678,029 | ||||||
| Reynolds American, Inc. | ||||||||
| 2,042,000 | 4.450%, 06/12/2025 | 2,020,573 | ||||||
| Service Corp. International | ||||||||
| 1,499,000 | 4.625%, 12/15/2027 | 1,451,459 | ||||||
| 2,264,000 | 5.125%, 06/01/2029 | 2,224,380 | ||||||
| Tenet Healthcare Corp. | ||||||||
| 4,244,000 | 6.125%, 10/01/2028 | 4,235,724 | ||||||
| United Rentals North America, Inc. | ||||||||
| 1,242,000 | 4.875%, 01/15/2028 | 1,212,233 | ||||||
| Zimmer Biomet Holdings, Inc. | ||||||||
| 1,447,000 | 3.550%, 04/01/2025 | 1,416,974 | ||||||
| 2,073,000 | 3.050%, 01/15/2026 | 2,003,460 | ||||||
|
| |||||||
| 47,693,916 | ||||||||
|
| |||||||
| Financial: 4.9% | ||||||||
| American Tower Corp. | ||||||||
| 799,000 | 4.000%, 06/01/2025 | 785,605 | ||||||
| 1,390,000 | 3.375%, 10/15/2026 | 1,333,264 | ||||||
| 754,000 | 3.600%, 01/15/2028 | 719,677 | ||||||
| 839,000 | 5.250%, 07/15/2028 | 853,726 | ||||||
| SBA Communications Corp. | ||||||||
| 605,000 | 3.875%, 02/15/2027 | 581,576 | ||||||
| 2,233,000 | 3.125%, 02/01/2029 | 2,009,113 | ||||||
| Trinity Acquisition PLC | ||||||||
| 445,000 | 4.400%, 03/15/2026 | 439,826 | ||||||
| Willis North America, Inc. | ||||||||
| 230,000 | 3.600%, 05/15/2024 | 227,941 | ||||||
| 1,382,000 | 4.650%, 06/15/2027 | 1,369,105 | ||||||
| 1,822,000 | 4.500%, 09/15/2028 | 1,778,401 | ||||||
|
| |||||||
| 10,098,234 | ||||||||
|
| |||||||
The accompanying notes are an integral part of these financial statements.
| 92 | Litman Gregory Funds Trust | |||||
Table of Contents
iMGP Dolan McEniry Corporate Bond Fund
SCHEDULE OF INVESTMENTS IN SECURITIES at December 31, 2023 (Continued)
| Principal Amount^ | Value | |||||||
CORPORATE BONDS (CONTINUED) | ||||||||
| Industrial: 17.8% | ||||||||
| Allegion U.S. Holding Co., Inc. | ||||||||
| $ 1,398,000 | 3.200%, 10/01/2024 | $ | 1,370,431 | |||||
| 2,930,000 | 3.550%, 10/01/2027 | 2,788,474 | ||||||
| Berry Global, Inc. | ||||||||
| 2,870,000 | 4.875%, 07/15/2026(a) | 2,822,105 | ||||||
| 670,000 | 1.650%, 01/15/2027 | 604,100 | ||||||
| Carlisle Cos., Inc. | ||||||||
| 881,000 | 3.500%, 12/01/2024 | 864,607 | ||||||
| 1,839,000 | 3.750%, 12/01/2027 | 1,763,324 | ||||||
| 912,000 | 2.750%, 03/01/2030 | 809,736 | ||||||
| 753,000 | 2.200%, 03/01/2032 | 614,702 | ||||||
| Carrier Global Corp. | ||||||||
| 3,529,000 | 2.242%, 02/15/2025 | 3,422,764 | ||||||
| 517,000 | 2.493%, 02/15/2027 | 486,638 | ||||||
| Flex Ltd. | ||||||||
| 1,791,000 | 6.000%, 01/15/2028 | 1,853,178 | ||||||
| 2,142,000 | 4.875%, 05/12/2030 | 2,107,106 | ||||||
| Fortune Brands Innovations, Inc. | ||||||||
| 1,499,000 | 4.000%, 06/15/2025 | 1,474,185 | ||||||
| 844,000 | 3.250%, 09/15/2029 | 781,594 | ||||||
| Teledyne Technologies, Inc. | ||||||||
| 2,972,000 | 2.750%, 04/01/2031 | 2,591,749 | ||||||
| TransDigm, Inc. | ||||||||
| 4,163,000 | 5.500%, 11/15/2027 | 4,080,801 | ||||||
| Trimble, Inc. | ||||||||
| 3,903,000 | 4.900%, 06/15/2028 | 3,930,593 | ||||||
| Westinghouse Air Brake Technologies Corp. | ||||||||
| 974,000 | 4.150%, 03/15/2024 | 970,023 | ||||||
| 3,011,000 | 4.700%, 09/15/2028 | 2,982,292 | ||||||
|
| |||||||
| 36,318,402 | ||||||||
|
| |||||||
| Technology: 12.6% | ||||||||
| Broadcom Corp./Broadcom Cayman Finance Ltd. | ||||||||
| 1,832,000 | 3.875%, 01/15/2027 | 1,788,760 | ||||||
| Broadcom, Inc. | ||||||||
| 363,000 | 3.459%, 09/15/2026 | 351,332 | ||||||
| 837,000 | 4.110%, 09/15/2028 | 818,988 | ||||||
| 473,000 | 4.150%, 11/15/2030 | 452,709 | ||||||
| CA, Inc. | ||||||||
| 231,000 | 4.700%, 03/15/2027 | 223,703 | ||||||
| CDW LLC/CDW Finance Corp. | ||||||||
| 564,000 | 4.125%, 05/01/2025 | 552,545 | ||||||
| 3,111,000 | 4.250%, 04/01/2028 | 2,982,062 | ||||||
| 228,000 | 3.250%, 02/15/2029 | 208,732 | ||||||
| Fiserv, Inc. | ||||||||
| 3,820,000 | 5.625%, 08/21/2033 | 4,011,214 | ||||||
| HP, Inc. | ||||||||
| 1,348,000 | 3.000%, 06/17/2027 | 1,274,751 | ||||||
| 1,110,000 | 4.000%, 04/15/2029 | 1,078,857 | ||||||
| 1,634,000 | 4.200%, 04/15/2032 | 1,555,074 | ||||||
| Microchip Technology, Inc. | ||||||||
| 2,823,000 | 4.250%, 09/01/2025 | 2,782,278 | ||||||
| Oracle Corp. | ||||||||
| 2,498,000 | 2.300%, 03/25/2028 | 2,278,918 | ||||||
| 1,496,000 | 2.950%, 04/01/2030 | 1,351,941 | ||||||
| Qorvo, Inc. | ||||||||
| 4,169,000 | 4.375%, 10/15/2029 | 3,959,966 | ||||||
|
| |||||||
| 25,671,830 | ||||||||
|
| |||||||
| | TOTAL CORPORATE BONDS | 186,514,568 | ||||||
|
| |||||||
| Principal Amount^ | Value | |||||||
SHORT-TERM INVESTMENTS: 5.5% | ||||||||
| TREASURY BILLS: 5.5% | ||||||||
| U.S. Treasury Bills | ||||||||
| $11,469,000 | 5.098%, 04/09/2024(b)(c) | $ | 11,306,931 | |||||
|
| |||||||
| | TOTAL TREASURY BILLS | 11,306,931 | ||||||
|
| |||||||
| | TOTAL SHORT-TERM INVESTMENTS | 11,306,931 | ||||||
|
| |||||||
| | TOTAL INVESTMENTS | 197,821,499 | ||||||
|
| |||||||
Other Assets in Excess of Liabilities: 3.1% | 6,280,541 | |||||||
|
| |||||||
NET ASSETS: 100.0% | $ | 204,102,040 | ||||||
|
| |||||||
Percentages are stated as a percent of net assets.
| ^ | The principal amount is stated in U.S. Dollars unless otherwise indicated. |
| (a) | Security was purchased pursuant to Rule 144A under the Securities Act of 1933 and may be sold in transactions exempt from registration only to qualified institutional buyers or in a public offering registered under Securities Act of 1933. |
| (b) | Issued with a zero coupon. Income is recognized through the accretion of discount. |
| (c) | The rate shown represents yield-to-maturity. |
The accompanying notes are an integral part of these financial statements.
| Schedule of Investments | 93 | |||||
Table of Contents
iMGP DBi Managed Futures Strategy ETF 2023 Annual Report (Unaudited)
The iMGP DBi Managed Futures Strategy ETF was down 8.94% in price terms (down 8.72% in NAV) in 2023, compared to the -3.49% performance for benchmark SG CTA Index. Despite the loss this year, since the ETF’s inception in May 2019, it has gained 7.34% annualized (in price, 7.36% in NAV), outperforming the benchmark’s 5.88% gain.
Performance as of 12/31/2023 | ||||||||||||
One- Year | Three- Year | Since 5/7/2019 | ||||||||||
iMGP DBi Managed Futures Strategy ETF (NAV) | -8.72% | 7.25% | 7.36% | |||||||||
iMGP DBi Managed Futures Strategy ETF (Price) | -8.94% | 7.22% | 7.34% | |||||||||
SG CTA | -3.49% | 7.17% | 5.88% | |||||||||
Morningstar US Fund Systematic Trend | -3.86% | 4.86% | 4.02% | |||||||||
Total Expense Ratio 0.85%
Performance data quoted represents past performance. Past performance does not guarantee future results. The investment return and principal value of an investment will fluctuate so that an investor’s shares, when redeemed, may be worth more or less than their original cost. Current performance of the fund may be lower or higher than the performance quoted. Performance data current to the most recent month end may be obtained by visiting www.imgpfunds.com.
Shares of any ETF are bought and sold at market price (not NAV), may trade at a discount or premium to NAV and are not individually redeemed from the Fund. Brokerage commissions will reduce returns. |
| |||||||||||
Annual Review
2023 turned out to be a humbling year for macro strategists. The taper is coming a year late, the economy never hit the windshield, and Powell might actually pull off the Immaculate Landing.
And so, the big surprise is that it turned out to be a great year for investors. Powell’s sudden rhetorical pivot in early November triggered a massive melt up in risk assets. In two months, the MSCI World delivered nearly two thirds of its 23.8% calendar year return, while bonds—down over 3% through October—finished up 5.7%. The Everything Rally appears to have been driven by both the widespread conclusion that the rate hike cycle was over, but also a desperate catch up for investors underweight equities and duration. By year end, the price moves implied far more aggressive easing in 2024 than either Central Banks or economists forecast.
As discussed extensively in these letters, the market consensus is rarely accurate and frustratingly unstable. Contrarian investors who nailed 2022 were often wrong-footed in 2023; assets that soared in 2023 were climbing out of a deep drawdown hole. The lesson of the past several years is that the unexpected happens with alarming regularity, and the spectrum of outcomes is far wider than we expect. Today, as investors breathe a sigh of relief that the worst of the rate hike cycle might be behind us, they soon may have to turn their attention to a laundry list of headwinds, from worsening geopolitical chaos to deepening sociopolitical fragmentation to uncontrolled fiscal largesse to persistent ripple effects from higher rates to things not yet on our plate of worries. In such a world, we encourage diversification and liquidity to help clients weather the coming years.
Performance and Positioning
The fund was down 5.1% in the first half of the year and a further 4.1% in the second half of the year. These half-year returns mask significant losses in the first and last quarters of the year, which bookended strong performance in the middle two quarters. The fund’s gains in the third quarter were particularly valuable in the context of a broader portfolio as stocks and bonds both struggled significantly.
The portfolio’s performance was negatively affected by positions across all asset classes with the majority of losses driven by rates, particularly 10- and 30-year Treasuries. Exposure to commodities was also detrimental, owing to the geopolitical turmoil and concerns about the oil output levels of major producers around the world. Currencies also detracted, led by the Japanese yen, after the Bank of Japan decided to maintain negative short-term interest rates and gave no hint about near-term changes. Gains in the S&P 500 were the sole positive contributor.
For the year, all asset classes except currencies detracted from performance, as the short JPY postion’s strong gains in the second quarter resulted in positive attribution for the year. The losses in short rates positions were most dramatic in the first quarter (thanks to the sudden banking crisis in March) and fourth quarter, but strong performance in the middle of the year meant that losses in rates for the year were actually less than the losses from commodities and equities. Equity positioning was whipsawed all year, while commodities detracted somewhat in the first quarter, as investors were torn between a hard or soft landing from the rate hikes, and then suffered from the aforementioned significant reversal in the trend in oil prices in the year’s final quarter.
The fund ended the year much closer to neutral in duration, with very little commodity exposure, modestly long the dollar (long vs the JPY and short vs the EUR), long US equities and short emerging markets equities.
| 94 | Litman Gregory Funds Trust | |||||
Table of Contents
Portfolio Characteristics
Net Asset Class Exposure (%) | ||||
US Equities | 28% | |||
International Developed Equities | 3% | |||
Emerging Market Equities | -21% | |||
Currencies | -13% | |||
Commodities | -1% | |||
Fixed Income | -59% |
Top 5 Holdings |
| |||
S&P 500 | 29% | |||
JPY/USD | -22% | |||
MSCI Emerging Markets | -22% | |||
2 Yr Treasury | -21% | |||
SOFR | -21% | |||
iMGP DBi Managed Futures Strategy ETF Value of Hypothetical $10,000
The value of a hypothetical $10,000 investment in the iMGP DBi Managed Futures Strategy ETF from May 7, 2019 to December 31, 2023 compared with the SG CTA Index and Morningstar Systematic Trend Category.
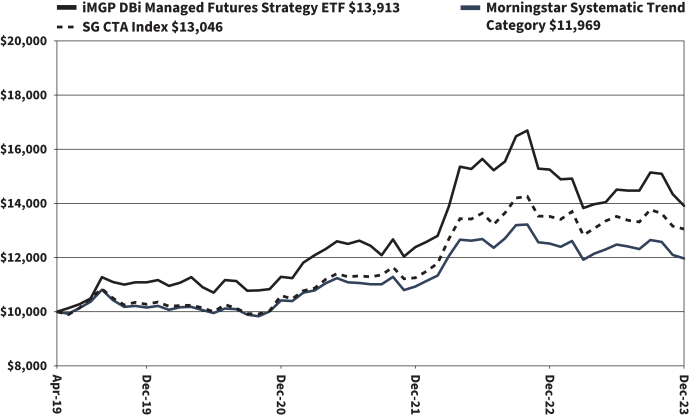
The hypothetical $10,000 investment at fund inception includes changes due to share price and reinvestment of dividends and capital gains. The chart does not imply future performance. Indexes are unmanaged, do not incur fees, expenses or taxes, and cannot be invested in directly.
Performance quoted does not include a deduction for taxes that a shareholder would pay on the redemption of fund shares.
| Fund Summary | 95 | |||||
Table of Contents
iMGP DBi Managed Futures Strategy ETF
CONSOLIDATED SCHEDULE OF INVESTMENTS IN SECURITIES at December 31, 2023
| Principal Amount^ | Value | |||||||
SHORT-TERM INVESTMENTS: 85.7% | ||||||||
| REPURCHASE AGREEMENTS: 1.7% | ||||||||
| $11,639,683 | Fixed Income Clearing Corp. 1.600%, 12/29/2023, due 01/02/2024 [collateral: par value $11,968,800, U.S. Treasury Note, 3.875%, due 01/15/2026, value $11,877,571] (proceeds $11,641,753) | $ | 11,639,683 | |||||
|
| |||||||
| | TOTAL REPURCHASE AGREEMENTS | 11,639,683 | ||||||
|
| |||||||
| TREASURY BILLS: 84.0% | ||||||||
| U.S. Treasury Bills | ||||||||
| 580,000,000 | 5.196%, 02/29/2024(a)(b)(c) | 575,085,521 | ||||||
|
| |||||||
| | TOTAL TREASURY BILLS | 575,085,521 | ||||||
|
| |||||||
| | TOTAL SHORT-TERM INVESTMENTS | 586,725,204 | ||||||
|
| |||||||
| | TOTAL INVESTMENTS | 586,725,204 | ||||||
|
| |||||||
Other Assets in Excess of Liabilities: 14.3% | 98,011,406 | |||||||
|
| |||||||
NET ASSETS: 100.0% | $ | 684,736,610 | ||||||
|
| |||||||
Percentages are stated as a percent of net assets.
| ^ | The principal amount is stated in U.S. Dollars unless otherwise indicated. |
| (a) | All or a portion of this security is held by the iMGP DBi Cayman Managed Futures Subsidiary. |
| (b) | The rate shown represents yield-to-maturity. |
| (c) | Issued with a zero coupon. Income is recognized through the accretion of discount. |
The accompanying notes are an integral part of these financial statements.
| 96 | Litman Gregory Funds Trust | |||||
Table of Contents
iMGP DBi Managed Futures Strategy ETF
CONSOLIDATED SCHEDULE OF INVESTMENTS IN FUTURES CONTRACTS AT December 31, 2023 (a)
| Description | Number of Contracts | Notional Amount | Notional Value | Expiration Date | Unrealized Appreciation/ (Depreciation) | |||||||||||||||
Futures Contracts – Long |
| |||||||||||||||||||
Euro FX Currency Futures | 436 | $ | 59,783,484 | $ | 60,358,750 | 3/18/2024 | $ | 575,266 | ||||||||||||
Gold 100 Oz Futures(b) | 44 | 9,037,779 | 9,115,920 | 2/27/2024 | 78,141 | |||||||||||||||
MSCI EAFE Index Futures | 167 | 18,748,579 | 18,807,540 | 3/15/2024 | 58,961 | |||||||||||||||
S&P 500 E-Mini Index Futures | 834 | 196,745,936 | 200,994,000 | 3/15/2024 | 4,248,064 | |||||||||||||||
U.S. Treasury Long Bond Futures | 159 | 19,653,829 | 19,865,062 | 3/19/2024 | 211,233 | |||||||||||||||
U.S. Treasury Ultra-Long Bond Futures | 138 | 18,300,592 | 18,435,938 | 3/19/2024 | 135,346 | |||||||||||||||
|
| |||||||||||||||||||
Total Long | $ | 5,307,011 | ||||||||||||||||||
|
| |||||||||||||||||||
Futures Contracts – Short |
| |||||||||||||||||||
3 Months SOFR Futures | (595 | ) | $ | (143,263,392 | ) | $ | (143,975,125 | ) | 9/16/2025 | $ | (711,733 | ) | ||||||||
Japanese Yen Currency Futures | (1,700 | ) | (149,406,515 | ) | (152,490,000 | ) | 3/18/2024 | (3,083,485 | ) | |||||||||||
MSCI Emerging Market Index | (2,887 | ) | (142,349,232 | ) | (149,214,595 | ) | 3/15/2024 | (6,865,363 | ) | |||||||||||
U.S. Treasury 10-Year Note Futures | (746 | ) | (81,938,726 | ) | (84,216,406 | ) | 3/19/2024 | (2,277,680 | ) | |||||||||||
U.S. Treasury 10-Year Ultra Note Futures | (708 | ) | (80,410,627 | ) | (83,555,062 | ) | 3/19/2024 | (3,144,435 | ) | |||||||||||
U.S. Treasury 2-Year Note Futures | (703 | ) | (143,619,165 | ) | (144,757,586 | ) | 3/28/2024 | (1,138,421 | ) | |||||||||||
WTI Crude Futures(b) | (215 | ) | (15,971,310 | ) | (15,445,600 | ) | 3/20/2024 | 525,710 | ||||||||||||
|
| |||||||||||||||||||
Total Short | $ | (16,695,407 | ) | |||||||||||||||||
|
| |||||||||||||||||||
Total Futures Contracts | $ | (11,388,396 | ) | |||||||||||||||||
|
| |||||||||||||||||||
| (a) | Societe Generale is the counterparty for all Open Futures Contracts held by the Fund and the iMGP DBi Cayman Managed Futures Subsidiary at December 31, 2023. |
| (b) | Contract held by the iMGP DBi Cayman Managed Futures Subsidiary. |
The accompanying notes are an integral part of these financial statements.
| Schedule of Investments | 97 | |||||
Table of Contents
iMGP DBi Hedge Strategy ETF 2023 Annual Report (Unaudited)
The iMGP DBi Hedge Strategy ETF gained 7.24% in price terms (7.91% in NAV) in 2023, versus the Morningstar Long-Short Equity Category benchmark’s 10.12% gain. Since inception in December 2019, the ETF has gained 6.84% annualized (in price, 6.91% in NAV), outperforming the benchmark’s 4.68% gain.
Performance as of 12/31/2023 | ||||||||||||
| One- Year | Three- Year | Since 12/17/2019 | ||||||||||
iMGP DBi Hedge Strategy ETF (NAV) | 7.91% | 1.95% | 6.91% | |||||||||
iMGP DBi Hedge Strategy ETF (Price) | 7.24% | 1.87% | 6.84% | |||||||||
Morningstar US Fund Long-Short Equity | 10.12% | 4.42% | 4.68% | |||||||||
| Total Expense Ratio 0.85% |
| |||||||||||
Performance data quoted represents past performance. Past performance does not guarantee future results. The investment return and principal value of an investment will fluctuate so that an investor’s shares, when redeemed, may be worth more or less than their original cost. Current performance of the fund may be lower or higher than the performance quoted. Performance data current to the most recent month end may be obtained by visiting www.imgpfunds.com.
Shares of any ETF are bought and sold at market price (not NAV), may trade at a discount or premium to NAV and are not individually redeemed from the Fund. Brokerage commissions will reduce returns. |
| |||||||||||
2023 Annual Review
2023 turned out to be a humbling year for macro strategists. The taper is coming a year late, the economy never hit the windshield, and Powell might actually pull off the Immaculate Landing.
And so the big surprise is that it turned out to be a great year for investors. Powell’s sudden rhetorical pivot in early November triggered a massive melt up in risk assets. In two months, the MSCI World delivered nearly two thirds of its 23.8% calendar year return, while bonds—down over 3% through October—finished up 5.7%. The Everything Rally appears to have been driven by both the widespread conclusion that the rate hike cycle was over, but also a desperate catch up for investors underweight equities and duration. By year end, the price moves implied far more aggressive easing in 2024 than either Central Banks or economists forecast.
As discussed extensively in these letters, the market consensus is rarely accurate and frustratingly unstable. Contrarian investors who nailed 2022 were often wrong-footed in 2023; assets that soared in 2023 were climbing out of a deep drawdown hole. The lesson of the past several years is that the unexpected happens with alarming regularity, and the spectrum of outcomes is far wider than we expect. Today, as investors breathe a sigh of relief that the worst of the rate hike cycle might be behind us, they soon may have to turn their attention to a laundry list of headwinds, from worsening geopolitical chaos to deepening sociopolitical fragmentation to uncontrolled fiscal largesse to persistent ripple effects from higher rates to things not yet on our plate of worries. In such a world, we encourage diversification and liquidity to help clients weather the coming years.
Performance and Positioning
Performance for the first half of the year was +4.4%, with an additional gain of approximately 2.7% in the second half. In the first quarter, a rally in equities was beneficial to performance but the pullback in March in small/mid-cap stocks due to the Silicon Valley Bank crisis partially offset gains. Short interest rate positions also somewhat detracted. A continuation of the rally in equities in the second quarter produced strong performance, particularly exposure to equities with a growth bias and non-U.S. developed market equities. Furthermore, in contrast to the first quarter, short interest rate positions in 2-year Treasury futures contributed positively to performance. The third quarter was slightly negative, as net long equity exposure globally was hurt by rising rates. More than 100% of the gain in the second half of the year (+3.9%) came during the Everything Rally in the fourth quarter. During the quarter, equities, excluding emerging markets, were accretive to performance. This was mainly led by growth biased segments, which were largely dominated by technology and AI stocks. Expectations that interest rate cuts may be on the horizon drove performance in most sectors in the year’s final quarter, as further evidenced by Fund gains in currencies and 2-year Treasuries as well.
Current positioning remains relatively conservative: underweight equities with a bias to growth and international equities, and modestly long exposure to the short end of the yield curve.
Portfolio Characteristics
Net Asset Class Exposure (%) | ||||
US Equities | 20% | |||
International Developed Equities | 9% | |||
Emerging Market Equities | -1% | |||
US Dollar | -12% | |||
Fixed Income | 50% |
Top 5 Holdings |
| |||
2 Yr Treasury | 28% | |||
SOFR | 28% | |||
EAFE | 9% | |||
Nasdaq | 8% | |||
S&P 500 | 7% | |||
| 98 | �� | Litman Gregory Funds Trust | ||||
Table of Contents
iMGP DBi Hedge Strategy ETF Value of Hypothetical $10,000
The value of a hypothetical $10,000 investment in the iMGP DBi Hedge Strategy ETF from December 17, 2019 to December 31, 2023 compared with the Morningstar Long-Short Equity Category.

The hypothetical $10,000 investment at fund inception includes changes due to share price and reinvestment of dividends and capital gains. The chart does not imply future performance. Indexes are unmanaged, do not incur fees, expenses or taxes, and cannot be invested in directly.
Performance quoted does not include a deduction for taxes that a shareholder would pay on the redemption of fund shares.
| Fund Summary | 99 | |||||
Table of Contents
iMGP DBi Hedge Strategy ETF
SCHEDULE OF INVESTMENTS IN SECURITIES at December 31, 2023
| Principal Amount^ | Value | |||||||
SHORT-TERM INVESTMENTS: 96.3% | ||||||||
| REPURCHASE AGREEMENTS: 3.6% | ||||||||
| $1,167,895 | Fixed Income Clearing Corp. 1.600%, 12/29/2023, due 01/02/2024 [collateral: par value $1,201,000, U.S. Treasury Note, 3.875%, due 01/15/2026, value $1,191,846] (proceeds $1,168,103) | $ | 1,167,895 | |||||
|
| |||||||
| | TOTAL REPURCHASE AGREEMENTS | 1,167,895 | ||||||
|
| |||||||
TREASURY BILLS: 92.7% | ||||||||
| U.S. Treasury Bills | ||||||||
| 30,500,000 | 5.197%, 02/29/2024(a)(b) | 30,241,566 | ||||||
|
| |||||||
| | TOTAL TREASURY BILLS | 30,241,566 | ||||||
|
| |||||||
| | TOTAL SHORT-TERM INVESTMENTS | 31,409,461 | ||||||
|
| |||||||
| | TOTAL INVESTMENTS | 31,409,461 | ||||||
|
| |||||||
Other Assets in Excess of Liabilities: 3.7% | 1,206,114 | |||||||
|
| |||||||
NET ASSETS: 100.0% | $ | 32,615,575 | ||||||
|
| |||||||
Percentages are stated as a percent of net assets.
| ^ | The principal amount is stated in U.S. Dollars unless otherwise indicated. |
| (a) | The rate shown represents yield-to-maturity. |
| (b) | Issued with a zero coupon. Income is recognized through the accretion of discount. |
The accompanying notes are an integral part of these financial statements.
| 100 | Litman Gregory Funds Trust | |||||
Table of Contents
iMGP DBi Hedge Strategy ETF
SCHEDULE OF INVESTMENTS IN FUTURES CONTRACTS AT December 31, 2023 (a)
| Description | Number of Contracts | Notional Amount | Notional Value | Expiration Date | Unrealized Appreciation/ (Depreciation) | |||||||||||||||
Futures Contracts – Long |
| |||||||||||||||||||
3 Months SOFR Futures | 38 | $ | 9,149,764 | $ | 9,195,050 | 9/16/2025 | $ | 45,286 | ||||||||||||
BP FX Currency Futures | 4 | 313,305 | 318,775 | 3/18/2024 | 5,470 | |||||||||||||||
CAD FX Currency Futures | 3 | 221,285 | 226,875 | 3/19/2024 | 5,590 | |||||||||||||||
Euro FX Currency Futures | 12 | 1,625,200 | 1,661,250 | 3/18/2024 | 36,050 | |||||||||||||||
30 Day Federal Funds Futures | 3 | 1,185,595 | 1,186,720 | 4/30/2024 | 1,125 | |||||||||||||||
Japanese Yen Currency Futures | 4 | 349,799 | 358,800 | 3/18/2024 | 9,001 | |||||||||||||||
MSCI EAFE Index Futures | 26 | 2,801,345 | 2,928,120 | 3/15/2024 | 126,775 | |||||||||||||||
Nasdaq 100 E-mini Futures | 8 | 2,568,494 | 2,723,760 | 3/15/2024 | 155,266 | |||||||||||||||
Russell 2000 E-mini Futures | 17 | 1,605,075 | 1,740,545 | 3/15/2024 | 135,470 | |||||||||||||||
S&P Mid Cap 400 E-mini Futures | 8 | 2,117,627 | 2,247,600 | 3/15/2024 | 129,973 | |||||||||||||||
U.S. Treasury 2-Year Note Futures | 45 | 9,193,875 | 9,266,133 | 3/28/2024 | 72,258 | |||||||||||||||
|
| |||||||||||||||||||
Total Long | $ | 722,264 | ||||||||||||||||||
|
| |||||||||||||||||||
Futures Contracts – Short |
| |||||||||||||||||||
U.S. Dollar Index Futures | (16 | ) | $ | (1,655,320 | ) | $ | (1,616,464 | ) | 3/18/2024 | $ | 38,856 | |||||||||
MSCI Emerging Market Index | (3 | ) | (147,499 | ) | (155,055 | ) | 3/15/2024 | (7,556 | ) | |||||||||||
U.S. Treasury Long Bond Futures | (11 | ) | (1,278,817 | ) | (1,374,313 | ) | 3/19/2024 | (95,496 | ) | |||||||||||
U.S. Treasury Ultra-Long Bond Futures | (10 | ) | (1,224,815 | ) | (1,335,937 | ) | 3/19/2024 | (111,122 | ) | |||||||||||
|
| |||||||||||||||||||
Total Short | $ | (175,318 | ) | |||||||||||||||||
|
| |||||||||||||||||||
Total Futures Contracts | $ | 546,946 | ||||||||||||||||||
|
| |||||||||||||||||||
| (a) | Mizuho Securities USA LLC is the counterparty for all Open Futures Contracts held by the Fund at December 31, 2023. |
The accompanying notes are an integral part of these financial statements.
| Schedule of Investments | 101 | |||||
Table of Contents
iMGP RBA Responsible Global Allocation ETF 2023 Annual Report (Unaudited)
The iMGP RBA Responsible Global Allocation ETF underperformed its benchmark in 2023, posting a return of 8.62% (NAV return) compared to a 16.21% return for its style index (65% MSCI ACWI, 35% Bloomberg US Aggregate Bond).
Performance as of 12/31/2023 |
| |||||||
| One- Year | Since 2/1/2022 | |||||||
iMGP RBA Responsible Global Allocation ETF (NAV) | 8.62% | -1.68% | ||||||
iMGP RBA Responsible Global Allocation ETF (Price) | 8.37% | -1.94% | ||||||
65/35 Blend of MSCI ACWI & Barclays Agg Bond Index | 16.21% | 0.66% | ||||||
65/35 Blend of MSCI ACWI ESG Leaders & Bloomberg MSCI US Aggregate ESG Focus Index | 16.75% | 0.39% | ||||||
Morningstar US Fund World Allocation | 10.53% | -0.53% | ||||||
Expense Ratio 0.55% Performance data quoted represents past performance. Past performance does not guarantee future results. The investment return and principal value of an investment will fluctuate so that an investor’s shares, when redeemed, may be worth more or less than their original cost. Current performance of the fund may be lower or higher than the performance quoted. Short term performance is not a good indication of the fund’s future performance and should not be the sole basis for investing in the fund. The Advisor has contractually agreed to limit the expenses of the fund including acquired fund fees and expense until April 30, 2025. Without this limitation expenses would be higher and returns would be lower. Performance data current to the most recent month end may be obtained by visiting www.imgpfunds.com.
Shares of any ETF are bought and sold at market price (not NAV), may trade at a discount or premium to NAV and are not individually redeemed from the Fund. Brokerage commissions will reduce returns. |
| |||||||
Equity Positioning
The Strategy was underweight equity over the period, holding an average weight of 61.2% (3.8 percentage point underweight) in 2023. The equity sleeve underperformed the MSCI ACWI Index by a large margin. This underperformance was largely driven by decisions made within the U.S. allocation. An underweight allocation to information technology, communication services, and consumer discretionary, specifically the mega cap “Magnificent 7” companies hurt performance the most.
An overweight allocation to defensive sectors, namely consumer staples and health care, also detracted from benchmark relative performance. An underweight allocation to U.S. energy stocks was accretive to performance as was an overweight allocation to Japan. Lastly, overweight allocations to China and Hong Kong detracted from performance.
Fixed Income Positioning
The Strategy was overweight fixed income throughout the period, holding an average weight of 37.6% (2.6 percentage point overweight) in 2023. The fixed income sleeve’s impact on benchmark relative performance was relatively muted compared to the equity sleeve’s impact. The decision with the largest impact was selection within the securitized/mortgage sector. Treasuries, the largest allocation within the fixed income sleeve, did not have a meaningful impact on performance. A slight cash exposure of less than 1% dragged on performance as markets performed well both domestically and internationally.
Outlook and Positioning
Our “4 for ‘24” theme is largely based on a potential replay of the 2000’s Lost Decade. We envision an extended period during which the Magnificent 7 significantly underperform, but other sectors, industries, countries, and investment themes that are currently being ignored could present excellent opportunities.
With this backdrop, our portfolios enter 2024 with four embedded themes: (1) U.S. Small Caps, (2) U.S. Cyclicals, (3) Non-U.S. and emerging markets, (4) Industrials as a play on deglobalization.
The profits cycle has begun to recover and seems poised to accelerate until at least mid-2024. If profits are accelerating or decelerating, it is typically attributable to cyclical companies’ earnings because stable companies’ earnings are simply too stable to cause a cycle.
Smaller capitalization stocks are more cyclical than are larger capitalization stocks and tend to outperform when profits accelerate. More important, the range of small cap outperformance is skewed positively when profits accelerate.
We are also overweight traditional cyclical sectors such as energy, materials, and industrials. In contrast, according to the latest Bank of America Global Fund Manager Survey, fund managers are underweight these sectors relative to their “normal” portfolio weights.
When the U.S. bull market began in 2009, investors were enamored with non-U.S., particularly emerging market, stocks. Fourteen years later, the opposite is true and investors strongly favor U.S. stocks. Fundamentals and sentiment though increasingly favor non-U.S. stocks, and we have roughly our lowest U.S. equity allocation in the history of our firm.
| 102 | Litman Gregory Funds Trust | |||||
Table of Contents
Lastly, it may be critical for the U.S. economy to rebuild its productive infrastructure as globalization continues to contract. Energy infrastructure, utility infrastructure, private sector manufacturing infrastructure, and related real estate, ports, roadways, and rail are as important to the future of the U.S. economy as artificial intelligence (AI) might be. However, when compared to AI, few investors are paying as much attention to this theme, which suggests greater opportunity.
RBA’s portfolios have typically been diversifiers within an overall portfolio. That role today seems a very good one to play. The speculative rally in the equity markets in 2023 is giving rise to what we think will be a once-in-a-generation investment opportunity in 2024. Like the opportunities after the Technology Bubble, there seem to be plenty of attractive investments. They just aren’t in the seven stocks that are investors’ favorites.
iMGP RBA Responsible Global Allocation ETF Value of Hypothetical $10,000
The value of a hypothetical $10,000 investment in the iMGP RBA Responsible Global Allocation ETF from February 1, 2022 to December 31, 2023 compared with the 65/35 Blend of MSCI ACWI & Bloomberg US Aggregate Bond Index, Morningstar World Allocation Category and 65/35 Blend of MSCI ACWI ESG Leaders & Bloomberg MSCI US Aggregate ESG Focus Index.
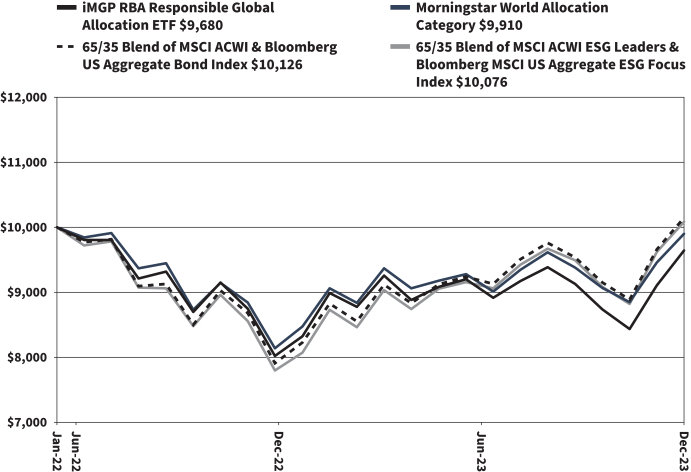
The hypothetical $10,000 investment at fund inception includes changes due to share price and reinvestment of dividends and capital gains. The chart does not imply future performance. Indexes are unmanaged, do not incur fees, expenses or taxes, and cannot be invested in directly.
Performance quoted does not include a deduction for taxes that a shareholder would pay on the redemption of fund shares.
| Fund Summary | 103 | |||||
Table of Contents
iMGP RBA Responsible Global Allocation ETF
SCHEDULE OF INVESTMENTS IN SECURITIES at December 31, 2023
| Shares | Value | |||||||
EXCHANGE-TRADED FUNDS: 100.8% | ||||||||
| 5,597 | iShares ESG Advanced MSCI EAFE ETF | $ | 357,536 | |||||
| 8,240 | iShares ESG Aware MSCI EAFE ETF | 622,450 | ||||||
| 22,407 | iShares ESG Aware MSCI USA Small-Cap ETF | 851,690 | ||||||
| 40,655 | iShares ESG Aware U.S. Aggregate Bond ETF(a) | 1,940,870 | ||||||
| 6,643 | iShares MSCI Global Sustainable Development Goals ETF | 538,415 | ||||||
| 5,535 | Janus Henderson Mortgage-Backed Securities ETF | 254,278 | ||||||
| 16,029 | Nuveen ESG Emerging Markets Equity ETF | 431,981 | ||||||
| 45,575 | Nuveen ESG Large-Cap Value ETF | 1,636,598 | ||||||
| 4,777 | Vanguard ESG International Stock ETF | 264,073 | ||||||
|
| |||||||
| | TOTAL EXCHANGE-TRADED FUNDS | 6,897,891 | ||||||
|
| |||||||
| | TOTAL INVESTMENTS | 6,897,891 | ||||||
|
| |||||||
| Liabilities in Excess of Other Assets: (0.8)% | (55,573 | ) | ||||||
|
| |||||||
NET ASSETS: 100.0% | $ | 6,842,318 | ||||||
|
| |||||||
Percentages are stated as a percent of net assets.
| ETF | Exchange-Traded Fund |
| (a) | For additional information on portfolio concentration, see Note 11. |
The accompanying notes are an integral part of these financial statements.
| 104 | Litman Gregory Funds Trust | |||||
Table of Contents
iMGP Berkshire Dividend Growth ETF 2023 Annual Report (Unaudited)
The iMGP Berkshire Dividend Growth ETF launched June 29, 2023. Over its first six months of existence, it returned 4.56% (NAV return) compared to 6.95% for the Russell 1000 Value Index. The Morningstar US Large Value category had a return of 7.80% over the same period.
Performance as of 12/31/2023 | ||||
Since 6/29/2023 | ||||
iMGP Berkshire Dividend Growth ETF (NAV) | 4.56% | |||
iMGP Berkshire Dividend Growth ETF (Price) | 4.54% | |||
Russell 1000 Value TR USD | 6.95% | |||
US Fund Large Value | 7.80% | |||
| Expense Ratio: 0.55% | ||||
Performance quoted represents past performance and does not guarantee future results. The investment return and principal value of an investment will fluctuate so that an investor’s shares, when redeemed, may be worth more or less than their original cost. Current performance of the funds may be lower or higher than the performance quoted. Short term performance is not a good indication of the fund’s future performance and should not be the sole basis for investing in the fund. To obtain standardized performance of the funds, and performance as of the most recently completed calendar month, please visit www.imgptfunds.com. Shares of any ETF are bought and sold at market price (not NAV), may trade at a discount or premium to NAV and are not individually redeemed from the Fund. Brokerage commissions will reduce returns. |
| |||
Quarterly Portfolio Manager Commentary
The New “Ab-normal”?
Reflecting on 2023, what a year…again! Massive bank failures, wild moves in interest rates, AI mania, concentrated indices, unprecedented shifts between investment styles, and global unrest.
Every year it seems there is something that makes you say “Wow. What a year!” Perhaps “ab-normal” is the new normal?
Investment-wise, 2023 will be remembered as a relatively challenging year for strategies that lean towards a “value-oriented” style.
While chaos, speculation, and “new investment abnormalities” personified 2023, Berkshire shall remain steadfast to the pillars of its investment strategy. Quality… reliable cash flow and dividends…reasonable prices that may provide upside AND a reasonable margin of safety.
As we enter the new year, it is customary to review our approach to buying businesses for your portfolio. Below, please read the step-by-step methodology by which we evaluate companies.
Dividend Strategy Process Review
The Berkshire Dividend Growth Strategy’s primary objective is intended to generate a growing stream of equity income through investments in a diversified portfolio of stocks generally with a high, “safe” and growing dividend. If we can achieve this primary goal by purchasing vibrant growing companies with fine economic prospects, capital appreciation can follow. A risk profile below that of the average stock in the S&P 500 is also viewed as desirable. Because of its dividend growth orientation, the portfolio also seeks to perform better than non-dividend paying stocks or bonds in a rising interest rate environment.
Equity Selection Process
Importantly, we believe intelligent dividend investing is not just composed of shopping for the company with the highest yield. Our process spans across three dimensions: current level of dividend, “safety” of the dividend, and notably, the growth of dividend.
Current Dividend
First, we identify companies that have a dividend yield at least that of the S&P 500, preferably higher. Companies that fit these criteria may perform better in a slow growth economy and could provide a cash buffer through equity market volatility. In certain instances, the portfolio may purchase securities with nominal or below-average dividends, but only if there is a clear and relatively certain path to normal cash payouts. Philosophically, however, we don’t believe in paying a high price for a future promise.
Stability of Dividend
A dividend springs from excess profits after a business pays off all other providers of capital. Since the shareholder is the last in line to get paid, as analysts we wish to see how substantial the claims of individuals in a senior capital position are to us. This is why companies with
| Fund Summary | 105 | |||||
Table of Contents
high levels of debt and/or volatile businesses can be undesirable investments. A profitable business that has too much debt can find the company may have little left over to pay shareholder dividends. So, we spend considerable time evaluating the company balance sheet:
| • | Debt to Equity Ratio: How much of the total capital is funded by debt vs. equity? |
| • | Times Interest Earned: How often do operating profits cover the interest expense? |
| • | Credit rating and liquidity of underlying debt, if applicable: Bond market spreads and credit ratings provide another view into the company’s ability to fund itself. |
Growth of Dividend
If our portfolio is going to provide an effective hedge against inflation and provide appropriate cash flow, it is critical that the company under evaluation demonstrate the prospects for future dividend growth. This is one of the most important parts of our screening process and what we believe makes our strategy unique relative to other dividend strategies. First, we seek a company that has a history of raising the dividend. This gives us good insight into management’s view of the dividend, how they allocate shareholder capital, and prospects for growth opportunities within the business itself. A key metric we use to quantify growth prospects is return on shareholder equity or ROE. In our opinion, return on equity (ROE) is the best financial yardstick to identify, evaluate and compare the desirability of investments. ROE is the rate of growth a company can maintain in its earnings and dividends, without needing to raise capital. By decomposing ROE into its component parts, we understand the 4 key dynamics that drive company profitability, namely:
| • | Operating Margins: Operating Profit/Sales “How profitable are core operations?” |
| • | Asset Turnover: Sales/Assets “How capital intensive is the business?” |
| • | Leverage: Assets/Equity “How much does the company’s use of debt affect returns?” |
| • | Tax Retention: Pretax Income/Net Income “How well does the company manage its tax obligations?” |
Keep in mind there is no “right” number for ROE or any one of the individual components. Some companies have high but volatile ROE’s and some companies have lower but highly stable ROE’s. Both can be equally desirable. A company that has very stable operating margins and consistent sales growth allows for management to utilize (think drugs or consumer staples) versus a company that is more cyclical (think semiconductors or energy companies). In the end, the evaluation of ROE can be a highly reliable metric. Other subjective factors that may play into our process include competitive positioning in the company’s end markets, intangibles such as brands and patents, past acquisition strategies of management, and volatility of earnings, just to name a few.
Summary of Process
While there are many factors, some quantitative and some qualitative, the goal is to buy companies with an attractive, “safe” and growing dividend so that the risk adjusted total return profile is superior.
Sell Discipline
A company is typically sold when it reaches a price beyond our estimate of intrinsic value, ROE falls below acceptable levels, loses its superior competitive position in the marketplace, abandons sound dividend policy, increases debt to uncomfortable levels or does a misplaced acquisition.
Portfolio Construction
As long as there are attractive candidates, the portfolio will attempt to be broadly diversified across a wide range of economic sectors. While the portfolio will be largely “bottom up” some consideration to macro factors may play a minor role. At any one given time certain portfolios, in aggregate, may appear more attractive than another (fundamental or valuation wise). However large or extreme sector concentrations relative to the benchmark in general should not occur. In aggregate, we seek a final portfolio: reduced systematic risk, above-average quality, and lower volatility. From a cash flow perspective, we believe a typical Berkshire holding can deliver cash flow growth of at least 7.5% per year, and the yield on the portfolio should exceed the S&P 500. If our companies can deliver earnings and dividend wise, attractive appreciation should follow and thus providing strong total return characteristics.
Risk and Performance Characteristics
We owe our investors a frank discussion of potential risks associated with our strategy and baseline expectations of our performance in various market conditions.
Dividends arise from the profits of a business after all other legal obligations to other providers of capital have been satisfied. These include trade creditors, bank loans, senior bond holders, subordinated bond holders, preferred shareholders and of course taxes owed to the government.
The dividend is last in line. So, while these claims are mandatory, dividends are paid at the discretion of management. Some management teams view growing the dividend as an “implicit promise”, while some managements want to remain flexible to right size the dividend if they need to adapt to their changing business and capital needs. For a very stable business with low capital needs, the former approach is appropriate. For businesses that have higher capital needs but perhaps higher growth prospects, the latter approach is appropriate. Dividend policy often sends a powerful signal about how management views its own prospects. Management needs to make tradeoffs between growing the business and maintaining the dividend. Not all decisions will be correct.
| 106 | Litman Gregory Funds Trust | |||||
Table of Contents
There are no guarantees even the best businesses remain profitable, that past growth rate of dividends will continue, or that management will remain committed to its dividend. So, there have been instances where a dividend appeared “safe” only to have management cut it at some point due to: deteriorating business conditions, or even they, at their discretion, find what they think is a better use of the money. We believe our screening and fundamental research will be effective in aggregate at selecting the managements capable of generating the type of cash flow growth our clients expect.
As for share price fluctuations, we stick to the premise that risk and return are directly related. The Berkshire Dividend Strategy seeks a risk posture that is below that of the S&P 500. So, in theory, the portfolio could perform better in a declining market, but we are realistic about its prospects in a rapidly rising market – particularly one characterized by speculation and where low-quality assets are coming back in favor. Still, in that rising market we expect a total return can potentially beat inflation and satisfy individual client objectives.
By Sector
| 12/31/2023 | ||||
Finance | 15.1% | |||
Consumer Discretionary | 7.3% | |||
Information Technology | 17.4% | |||
Communication Services | 0.0% | |||
Health Care & Pharmaceuticals | 13.7% | |||
Industrials | 16.2% | |||
Consumer Staples | 10.5% | |||
Real Estate | 1.6% | |||
Utilities | 2.7% | |||
Energy | 8.1% | |||
Materials | 5.0% | |||
Cash | 2.4% | |||
|
| |||
| 100.0% | ||||
|
| |||
By Market Cap
| 12/31/2023 | ||||
Small Cap | 1.7% | |||
Mid Cap | 14.4% | |||
Large Cap | 83.9% | |||
|
| |||
| 100.0% | ||||
|
| |||
By Region
| 12/31/2023 | ||||
US Equities | 95.6% | |||
Developed International Equities | 4.4% | |||
Emerging Market Equities | 0.0% | |||
|
| |||
| 100.0% | ||||
|
| |||
iMGP Berkshire Dividend Growth ETF Value of Hypothetical $10,000
The value of a hypothetical $10,000 investment in the iMGP Berkshire Dividend Growth ETF from June 29, 2023 to December 31, 2023 compared with the Russell 1000 Value Index and Morningstar Large Value Category.
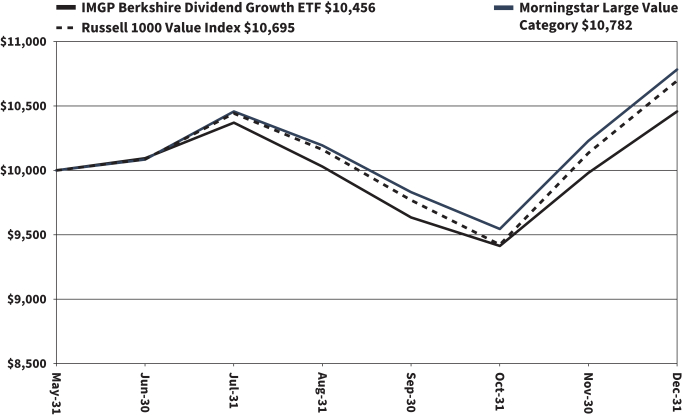
The hypothetical $10,000 investment at fund inception includes changes due to share price and reinvestment of dividends and capital gains. The chart does not imply future performance. Indexes are unmanaged, do not incur fees, expenses or taxes, and cannot be invested in directly.
Performance quoted does not include a deduction for taxes that a shareholder would pay on the redemption of fund shares.
| Fund Summary | 107 | |||||
Table of Contents
iMGP Berkshire Dividend Growth ETF
SCHEDULE OF INVESTMENTS IN SECURITIES at December 31, 2023
| Shares | Value | |||||||
COMMON STOCKS: 97.6% | ||||||||
| Consumer Discretionary: 7.3% | ||||||||
| 825 | Leggett & Platt, Inc. | $ | 21,590 | |||||
| 150 | Lowe’s Cos., Inc. | 33,383 | ||||||
| 135 | McDonald’s Corp. | 40,029 | ||||||
|
| |||||||
| 95,002 | ||||||||
|
| |||||||
| Consumer Staples: 10.5% | ||||||||
| 275 | General Mills, Inc. | 17,914 | ||||||
| 475 | Mondelez International, Inc. - Class A | 34,404 | ||||||
| 160 | PepsiCo, Inc. | 27,174 | ||||||
| 165 | Procter & Gamble Co. | 24,179 | ||||||
| 215 | Walmart, Inc. | 33,895 | ||||||
|
| |||||||
| 137,566 | ||||||||
|
| |||||||
| Energy: 8.1% | ||||||||
| 410 | Chevron Corp. | 61,156 | ||||||
| 170 | EOG Resources, Inc. | 20,561 | ||||||
| 1,360 | Kinder Morgan, Inc. | 23,990 | ||||||
|
| |||||||
| 105,707 | ||||||||
|
| |||||||
| Financials: 15.1% | ||||||||
| 1,695 | Bank of America Corp. | 57,071 | ||||||
| 125 | Chubb Ltd. | 28,250 | ||||||
| 380 | JPMorgan Chase & Co. | 64,638 | ||||||
| 140 | M&T Bank Corp. | 19,191 | ||||||
| 180 | PNC Financial Services Group, Inc. | 27,873 | ||||||
|
| |||||||
| 197,023 | ||||||||
|
| |||||||
| Health Care: 13.7% | ||||||||
| 240 | Abbott Laboratories | 26,417 | ||||||
| 310 | AbbVie, Inc. | 48,041 | ||||||
| 530 | Bristol-Myers Squibb Co. | 27,194 | ||||||
| 175 | Johnson & Johnson | 27,429 | ||||||
| 310 | Merck & Co., Inc. | 33,796 | ||||||
| 535 | Pfizer, Inc. | 15,403 | ||||||
|
| |||||||
| 178,280 | ||||||||
|
| |||||||
| Industrials: 16.2% | ||||||||
| 65 | Deere & Co. | 25,992 | ||||||
| 325 | Emerson Electric Co. | 31,632 | ||||||
| 140 | Honeywell International, Inc. | 29,359 | ||||||
| 95 | Lockheed Martin Corp. | 43,058 | ||||||
| 180 | Norfolk Southern Corp. | 42,548 | ||||||
| 215 | Waste Management, Inc. | 38,507 | ||||||
|
| |||||||
| 211,096 | ||||||||
|
| |||||||
| Information Technology: 17.4% | ||||||||
| 265 | Apple, Inc. | 51,020 | ||||||
| 760 | Cisco Systems, Inc. | 38,395 | ||||||
| 180 | Microsoft Corp. | 67,687 | ||||||
| 290 | QUALCOMM, Inc. | 41,943 | ||||||
| 195 | TE Connectivity Ltd. | 27,398 | ||||||
|
| |||||||
| 226,443 | ||||||||
|
| |||||||
| Materials: 5.0% | ||||||||
| 375 | Nucor Corp. | 65,265 | ||||||
|
| |||||||
| Real Estate: 1.6% | ||||||||
| 320 | WP Carey, Inc. - REIT | 20,739 | ||||||
|
| |||||||
| Shares | Value | |||||||
| Utilities: 2.7% | ||||||||
| 1,315 | PPL Corp. | $ | 35,637 | |||||
|
| |||||||
| | TOTAL COMMON STOCKS | 1,272,758 | ||||||
|
| |||||||
| | TOTAL INVESTMENTS | 1,272,758 | ||||||
|
| |||||||
| Other Assets in Excess of Liabilities: 2.4% | 31,937 | |||||||
|
| |||||||
NET ASSETS: 100.0% | $ | 1,304,695 | ||||||
|
| |||||||
Percentages are stated as a percent of net assets.
| REIT | Real Estate Investment Trust |
The accompanying notes are an integral part of these financial statements.
| 108 | Litman Gregory Funds Trust | |||||
Table of Contents
EXPENSE EXAMPLES – (Unaudited)
As a shareholder of the Funds, you incur two types of costs: (1) transaction costs and (2) ongoing costs, including advisory fees, and other fund expenses. The examples below are intended to help you understand your ongoing costs (in dollars) of investing in the Funds and to compare these costs with the ongoing costs of investing in other mutual funds.
The examples are based on an investment of $1,000 invested at the beginning of the period shown and held for the entire period from July 1, 2023 to December 31, 2023.
Actual Expenses
For each Fund, the first line of the table below provides information about actual account values and actual expenses. You may use the information in this line, together with the amount you invested, to estimate the expenses that you paid over the period. Simply divide your account value by $1,000 (for example, an $8,600 account value divided by $1,000 = 8.6), then multiply the result by the number in the first line under the heading entitled “Expenses Paid During Period” to estimate the expenses you paid on your account during this period.
Hypothetical Example for Comparison Purposes
For each Fund, the second line of the table below provides information about hypothetical account values and hypothetical expenses based on the Fund’s actual expense ratio and an assumed rate of return of 5% per year before expenses, which is not the Fund’s actual return. The hypothetical account values and expenses may not be used to estimate the actual ending account balance or expenses you paid for the period. You may use this information to compare the ongoing costs of investing in the Fund and other funds. To do so, compare this 5% hypothetical example with the 5% hypothetical examples that appear in the shareholder reports of the other funds.
Please note that the expenses shown in the table are meant to highlight your ongoing costs only and do not reflect any transaction costs. Therefore, the second line for each Fund of the table is useful in comparing ongoing costs only, and will not help you determine the relative total costs of owning different funds. In addition, if these transaction costs were included, your costs would have been higher.
| Beginning Account Value (7/1/23) | Ending Account Value (12/31/23) | Expenses Paid During Period* (7/1/23 to 12/31/23) | Expenses Ratio During Period* (7/1/23 to 12/31/23) | |||||||||||||
iMGP Global Select Fund – Institutional Actual | $ | 1,000.00 | $ | 1,047.20 | $ | 5.06 | 0.98% | |||||||||
iMGP Global Select Fund – Institutional Hypothetical - (5% return before expenses) | $ | 1,000.00 | $ | 1,020.26 | $ | 4.99 | 0.98% | |||||||||
iMGP International Fund – Institutional Actual | $ | 1,000.00 | $ | 1,013.50 | $ | 4.97 | 0.98% | |||||||||
iMGP International Fund – Institutional Hypothetical - (5% return before expenses) | $ | 1,000.00 | $ | 1,020.26 | $ | 4.99 | 0.98% | |||||||||
iMGP Oldfield International Value Fund – Institutional Actual | $ | 1,000.00 | $ | 1,063.10 | $ | 4.94 | 0.95% | |||||||||
iMGP Oldfield International Value Fund – Institutional Hypothetical - (5% return before expenses) | $ | 1,000.00 | $ | 1,020.41 | $ | 4.84 | 0.95% | |||||||||
iMGP SBH Focused Small Value Fund – Institutional Actual | $ | 1,000.00 | $ | 1,125.80 | $ | 6.16 | 1.15% | |||||||||
iMGP SBH Focused Small Value Fund – Institutional Hypothetical - (5% return before expenses) | $ | 1,000.00 | $ | 1,019.40 | $ | 5.85 | 1.15% | |||||||||
iMGP Alternative Strategies Fund – Institutional Actual | $ | 1,000.00 | $ | 1,038.10 | $ | 6.73 | 1.31% | |||||||||
iMGP Alternative Strategies Fund – Investor Actual | $ | 1,000.00 | $ | 1,036.60 | $ | 7.96 | 1.55% | |||||||||
iMGP Alternative Strategies Fund – Institutional Hypothetical - (5% return before expenses) | $ | 1,000.00 | $ | 1,018.60 | $ | 6.67 | 1.31% | |||||||||
iMGP Alternative Strategies Fund – Investor Hypothetical - (5% return before expenses) | $ | 1,000.00 | $ | 1,017.39 | $ | 7.88 | 1.55% | |||||||||
iMGP High Income Fund – Institutional Actual | $ | 1,000.00 | $ | 1,066.00 | $ | 5.10 | 0.98% | |||||||||
iMGP High Income Fund – Institutional Hypothetical - (5% return before expenses) | $ | 1,000.00 | $ | 1,020.26 | $ | 4.99 | 0.98% | |||||||||
iMGP Dolan McEniry Corporate Bond Fund – Institutional Actual | $ | 1,000.00 | $ | 1,052.10 | $ | 3.62 | 0.70% | |||||||||
iMGP Dolan McEniry Corporate Bond Fund – Institutional Hypothetical - (5% return before expenses) | $ | 1,000.00 | $ | 1,021.67 | $ | 3.57 | 0.70% | |||||||||
iMGP DBi Managed Futures Strategy ETF – Actual | $ | 1,000.00 | $ | 959.10 | $ | 4.20 | 0.85% | |||||||||
iMGP DBi Managed Futures Strategy ETF – Hypothetical - (5% return before expenses) | $ | 1,000.00 | $ | 1,020.92 | $ | 4.33 | 0.85% | |||||||||
iMGP DBi Hedge Strategy ETF – Actual | $ | 1,000.00 | $ | 1,028.00 | $ | 4.34 | 0.85% | |||||||||
iMGP DBi Hedge Strategy ETF – Hypothetical - (5% return before expenses) | $ | 1,000.00 | $ | 1,020.92 | $ | 4.33 | 0.85% | |||||||||
| Expense Examples | 109 | |||||
Table of Contents
| Beginning Account Value (7/1/23) | Ending Account Value (12/31/23) | Expenses Paid During Period* (7/1/23 to 12/31/23) | Expenses Ratio During Period* (7/1/23 to 12/31/23) | |||||||||||||
iMGP RBA Responsible Global Allocation ETF – Actual | $ | 1,000.00 | $ | 1,045.20 | $ | 2.84 | 0.55% | |||||||||
iMGP RBA Responsible Global Allocation ETF – Hypothetical - (5% return before expenses) | $ | 1,000.00 | $ | 1,022.43 | $ | 2.80 | 0.55% | |||||||||
iMGP Berkshire Dividend Growth ETF – Actual | $ | 1,000.00 | $ | 1,035.80 | $ | 2.82 | 0.55% | |||||||||
iMGP Berkshire Dividend Growth ETF – Hypothetical - (5% return before expenses) | $ | 1,000.00 | $ | 1,022.43 | $ | 2.80 | 0.55% | |||||||||
* Expenses are equal to the Funds’ annualized expense ratio as indicated, multiplied by the average account value over the period, multiplied by the number of days in most recent fiscal half-year period (184), then divided by the number of days in the fiscal year (365) (to reflect the one-half-year period).
| 110 | Litman Gregory Funds Trust | |||||
Table of Contents
Litman Gregory Funds Trust
STATEMENTS OF ASSETS AND LIABILITIES at December 31, 2023
| Global Select Fund | International Fund | Oldfield International Value Fund | SBH Focused Small Value Fund | |||||||||||||
ASSETS: |
| |||||||||||||||
Investments in securities at cost | $ | 95,632,086 | $ | 185,788,500 | $ | 31,494,403 | $ | 42,480,524 | ||||||||
Repurchase agreements at cost | 4,034,971 | 13,139,674 | — | — | ||||||||||||
|
|
|
|
|
|
|
| |||||||||
Total investments at cost | $ | 99,667,057 | $ | 198,928,174 | $ | 31,494,403 | $ | 42,480,524 | ||||||||
|
|
|
|
|
|
|
| |||||||||
Investments in securities at value | $ | 113,206,406 | $ | 208,925,370 | $ | 35,319,556 | $ | 52,478,369 | ||||||||
Repurchase agreements at value | 4,034,971 | 13,139,674 | — | — | ||||||||||||
|
|
|
|
|
|
|
| |||||||||
Total investments at value | $ | 117,241,377 | $ | 222,065,044 | $ | 35,319,556 | $ | 52,478,369 | ||||||||
|
|
|
|
|
|
|
| |||||||||
Cash | — | 43,810 | 678,636 | 1,344,418 | ||||||||||||
Cash, denominated in foreign currency (cost of $371,017, $108, $31,728 and $0, respectively) | 359,644 | 109 | 32,997 | — | ||||||||||||
Receivables: |
| |||||||||||||||
Securities sold | 945,471 | 134,931 | — | 385,652 | ||||||||||||
Dividends and interest | 111,931 | 386,110 | 51,048 | 35,135 | ||||||||||||
Foreign tax reclaims | 73,585 | 1,129,337 | 112,725 | — | ||||||||||||
Fund shares sold | 1,044 | 85 | 9,207 | 4,934 | ||||||||||||
Line of credit interest | — | 12,834 | — | — | ||||||||||||
Prepaid expenses | 7,719 | 5,454 | 12,504 | 8,773 | ||||||||||||
|
|
|
|
|
|
|
| |||||||||
Total Assets | 118,740,771 | 223,777,714 | 36,216,673 | 54,257,281 | ||||||||||||
|
|
|
|
|
|
|
| |||||||||
LIABILITIES: |
| |||||||||||||||
Payables: |
| |||||||||||||||
Advisory fees | 102,460 | 172,973 | 43,238 | 68,314 | ||||||||||||
Securities purchased | 5,504 | 451,098 | — | 300,022 | ||||||||||||
Fund shares redeemed | 143,322 | 5,996 | 74,900 | 20,519 | ||||||||||||
Foreign taxes withheld | 1,183 | 82,420 | — | — | ||||||||||||
Professional fees | 26,274 | 33,487 | 26,287 | 15,963 | ||||||||||||
Custodian for overdraft | 722,166 | — | — | — | ||||||||||||
Line of credit | — | — | 800,000 | 2,000,000 | ||||||||||||
Line of credit interest | 12,318 | — | 594 | — | ||||||||||||
Chief Compliance Officer fees | 13,953 | 13,953 | 13,953 | 13,953 | ||||||||||||
Accrued other expenses | 110,223 | 108,808 | 34,887 | 43,784 | ||||||||||||
|
|
|
|
|
|
|
| |||||||||
Total Liabilities | 1,137,403 | 868,735 | 993,859 | 2,462,555 | ||||||||||||
|
|
|
|
|
|
|
| |||||||||
NET ASSETS | $ | 117,603,368 | $ | 222,908,979 | $ | 35,222,814 | $ | 51,794,726 | ||||||||
|
|
|
|
|
|
|
| |||||||||
Institutional Class: |
| |||||||||||||||
Net Assets | $ | 117,603,368 | $ | 222,908,979 | $ | 35,222,814 | $ | 51,794,726 | ||||||||
Number of shares issued and outstanding (unlimited number of shares authorized, $0.01 par value) | 9,766,505 | 12,649,859 | 3,143,411 | 3,477,658 | ||||||||||||
Net asset value, offering price and redemption price per share | $ | 12.04 | $ | 17.62 | $ | 11.21 | $ | 14.89 | ||||||||
|
|
|
|
|
|
|
| |||||||||
COMPONENTS OF NET ASSETS |
| |||||||||||||||
Paid-in capital | $ | 100,985,507 | $ | 241,535,288 | $ | 31,022,023 | $ | 41,683,228 | ||||||||
Accumulated distributable earnings (deficit) | 16,617,861 | (18,626,309 | ) | 4,200,791 | 10,111,498 | |||||||||||
|
|
|
|
|
|
|
| |||||||||
Net assets | $ | 117,603,368 | $ | 222,908,979 | $ | 35,222,814 | $ | 51,794,726 | ||||||||
|
|
|
|
|
|
|
| |||||||||
The accompanying notes are an integral part of these financial statements.
| Statements of Assets and Liabilities | 111 | |||||
Table of Contents
Litman Gregory Funds Trust
STATEMENTS OF ASSETS AND LIABILITIES at December 31, 2023 – (Continued)
| Alternative Strategies Fund (Consolidated) | High Income Fund | Dolan McEniry Corporate Bond Fund | ||||||||||
ASSETS: |
| |||||||||||
Investments in securities at cost | $ | 701,127,398 | $ | 91,167,854 | $ | 198,498,040 | ||||||
Repurchase agreements at cost | 34,778,955 | 2,082,373 | — | |||||||||
|
|
|
|
|
| |||||||
Total investments at cost | $ | 735,906,353 | $ | 93,250,227 | $ | 198,498,040 | ||||||
|
|
|
|
|
| |||||||
Investments in securities at value | $ | 629,638,934 | $ | 87,300,861 | $ | 197,821,499 | ||||||
Repurchase agreements at value | 34,778,955 | 2,082,373 | — | |||||||||
|
|
|
|
|
| |||||||
Total investments at value | $ | 664,417,889 | $ | 89,383,234 | $ | 197,821,499 | ||||||
|
|
|
|
|
| |||||||
Cash | 635,106 | 827,506 | 3,279,317 | |||||||||
Cash, denominated in foreign currency (cost of $932,658, $0 and $0, respectively) | 933,456 | — | — | |||||||||
Deposits at brokers for securities sold short | 6,946,867 | — | — | |||||||||
Deposits at brokers for futures | 4,983,907 | 16,000 | — | |||||||||
Deposits at brokers for written options | 1,533,715 | — | — | |||||||||
Deposits at brokers for swaps | 8,200,010 | 26,930 | — | |||||||||
Receivables: |
| |||||||||||
Fund shares sold | 2,675,357 | 1,788,842 | 1,324,589 | |||||||||
Securities sold | 1,044,141 | 17,331 | — | |||||||||
Dividends and interest | 4,785,251 | 884,316 | 2,178,394 | |||||||||
Variation margin - Centrally Cleared Swaps | 569,108 | — | — | |||||||||
Foreign tax reclaims | 355,857 | 442 | — | |||||||||
Other Receivables | 101,174 | — | — | |||||||||
Dividend and interest for swap resets | 107,444 | 1,497 | — | |||||||||
Line of credit interest | 20,496 | — | — | |||||||||
Variation margin - Futures | 78,214 | 1,723 | — | |||||||||
Unrealized gain on forward foreign currency exchange contracts | 115,512 | — | — | |||||||||
Unrealized gain on swaps | — | 4,770 | — | |||||||||
Prepaid expenses | — | 9,927 | — | |||||||||
|
|
|
|
|
| |||||||
Total Assets | 697,503,504 | 92,962,518 | 204,603,799 | |||||||||
|
|
|
|
|
| |||||||
LIABILITIES: |
| |||||||||||
Written options (premium received, $34,595, $58,901 and $0, respectively) | 33,886 | 39,728 | — | |||||||||
Securities sold short (proceeds, $4,314,993, $0 and $0, respectively) | 4,270,317 | — | — | |||||||||
Payables: | ||||||||||||
Advisory fees | 691,192 | 41,074 | 76,697 | |||||||||
Securities purchased | 5,036,208 | 860,828 | — | |||||||||
Fund shares redeemed | 1,454,720 | 125,143 | 183,122 | |||||||||
Foreign taxes withheld | 5,006 | — | — | |||||||||
Professional fees | 148,093 | 52,081 | 22,030 | |||||||||
Distributions payable | — | — | 114,200 | |||||||||
Line of credit interest | — | 2,165 | — | |||||||||
Dividend and interest for swap resets | — | 787 | — | |||||||||
Variation margin—Centrally Cleared Swaps | — | 3,755 | — | |||||||||
Short dividend | 31,501 | — | — | |||||||||
Chief Compliance Officer fees | 13,953 | 13,953 | 13,953 | |||||||||
Unrealized loss on unfunded loan commitment | 181,254 | 2,260 | — | |||||||||
Unrealized loss on forward foreign currency exchange contracts | 571,059 | 19,908 | — | |||||||||
Unrealized loss on swaps | 841,155 | 4,310 | — | |||||||||
Distribution fees payable for investor class (see Note 4) | 5,813 | — | — | |||||||||
Accrued other expenses | 511,906 | 97,399 | 91,757 | |||||||||
|
|
|
|
|
| |||||||
Total Liabilities | 13,796,063 | 1,263,391 | 501,759 | |||||||||
|
|
|
|
|
| |||||||
Commitments and Contingencies (See Note 7) | ||||||||||||
NET ASSETS | $ | 683,707,441 | $ | 91,699,127 | $ | 204,102,040 | ||||||
|
|
|
|
|
| |||||||
The accompanying notes are an integral part of these financial statements.
| 112 | Litman Gregory Funds Trust | |||||
Table of Contents
Litman Gregory Funds Trust
STATEMENTS OF ASSETS AND LIABILITIES at December 31, 2023 – (Continued)
| Alternative Strategies Fund (Consolidated) | High Income Fund | Dolan McEniry Corporate Bond Fund | ||||||||||
Institutional Class: |
| |||||||||||
Net Assets | $ | 656,580,197 | $ | 91,699,127 | $ | 204,102,040 | ||||||
Number of shares issued and outstanding (unlimited number of shares authorized, $0.01 par value) | 62,923,968 | 9,507,031 | 20,709,935 | |||||||||
Net asset value, offering price and redemption price per share | $ | 10.43 | $ | 9.65 | $ | 9.86 | ||||||
|
|
|
|
|
| |||||||
Investor Class: |
| |||||||||||
Net Assets | $ | 27,127,244 | $ | — | $ | — | ||||||
Number of shares issued and outstanding (unlimited number of shares authorized, $0.01 par value) | 2,589,639 | — | — | |||||||||
Net asset value, offering price and redemption price per share | $ | 10.48 | $ | — | $ | — | ||||||
|
|
|
|
|
| |||||||
COMPONENTS OF NET ASSETS |
| |||||||||||
Paid-in capital | $ | 827,120,847 | $ | 98,521,606 | $ | 207,967,221 | ||||||
Accumulated distributable earnings (deficit) | (143,413,406 | ) | (6,822,479 | ) | (3,865,181 | ) | ||||||
|
|
|
|
|
| |||||||
Net assets | $ | 683,707,441 | $ | 91,699,127 | $ | 204,102,040 | ||||||
|
|
|
|
|
| |||||||
The accompanying notes are an integral part of these financial statements.
| Statements of Assets and Liabilities | 113 | |||||
Table of Contents
Litman Gregory Funds Trust
STATEMENTS OF ASSETS AND LIABILITIES at December 31, 2023 – (Continued)
| DBi Managed Futures Strategy ETF (Consolidated) | DBi Hedge Strategy ETF | RBA Responsible Global Allocation ETF | Berkshire Dividend Growth ETF | |||||||||||||
ASSETS: | ||||||||||||||||
Investments in securities at cost | $ | 574,976,888 | $ | 30,235,819 | $ | 6,820,641 | $ | 1,228,323 | ||||||||
Repurchase agreements at cost | 11,639,683 | 1,167,895 | — | — | ||||||||||||
|
|
|
|
|
|
|
| |||||||||
Total investments at cost | $ | 586,616,571 | $ | 31,403,714 | $ | 6,820,641 | $ | 1,228,323 | ||||||||
|
|
|
|
|
|
|
| |||||||||
Investments in securities at value | $ | 575,085,521 | $ | 30,241,566 | $ | 6,897,891 | $ | 1,272,758 | ||||||||
Repurchase agreements at value | 11,639,683 | 1,167,895 | — | — | ||||||||||||
|
|
|
|
|
|
|
| |||||||||
Total investments at value | $ | 586,725,204 | $ | 31,409,461 | $ | 6,897,891 | $ | 1,272,758 | ||||||||
|
|
|
|
|
|
|
| |||||||||
Cash | 22,937,466 | 6 | — | 30,478 | ||||||||||||
Deposits at brokers for futures | 82,821,444 | 1,268,082 | — | — | ||||||||||||
Receivables: | ||||||||||||||||
Advisory reimbursement | — | — | 10,996 | — | ||||||||||||
Dividends and interest | 1,553 | 156 | — | 2,013 | ||||||||||||
Variation margin - Futures | ||||||||||||||||
|
|
|
| �� |
|
|
|
| ||||||||
Total Assets | 692,485,667 | 32,677,705 | 6,908,887 | 1,305,249 | ||||||||||||
|
|
|
|
|
|
|
| |||||||||
LIABILITIES: | ||||||||||||||||
Payables: | ||||||||||||||||
Advisory fees | 516,622 | 17,616 | — | 554 | ||||||||||||
Fund shares redeemed | 5,797,125 | — | — | — | ||||||||||||
Variation margin - Futures | 1,435,310 | 44,514 | — | — | ||||||||||||
Custodian for overdraft | — | — | 66,569 | — | ||||||||||||
|
|
|
|
|
|
|
| |||||||||
Total Liabilities | 7,749,057 | 62,130 | 66,569 | 554 | ||||||||||||
|
|
|
|
|
|
|
| |||||||||
NET ASSETS | $ | 684,736,610 | $ | 32,615,575 | $ | 6,842,318 | $ | 1,304,695 | ||||||||
|
|
|
|
|
|
|
| |||||||||
Net Assets | $ | 684,736,610 | $ | 32,615,575 | $ | 6,842,318 | $ | 1,304,695 | ||||||||
Number of shares issued and outstanding (unlimited number of shares authorized, $0.01 par value) | 26,575,000 | 1,225,000 | 725,000 | 125,000 | ||||||||||||
Net asset value, offering price and redemption price per share | $ | 25.77 | $ | 26.62 | $ | 9.44 | $ | 10.44 | ||||||||
|
|
|
|
|
|
|
| |||||||||
COMPONENTS OF NET ASSETS | ||||||||||||||||
Paid-in capital | $ | 802,413,073 | $ | 32,862,051 | $ | 7,147,945 | $ | 1,260,341 | ||||||||
Accumulated distributable earnings (deficit) | (117,676,463 | ) | (246,476 | ) | (305,627 | ) | 44,354 | |||||||||
|
|
|
|
|
|
|
| |||||||||
Net assets | $ | 684,736,610 | $ | 32,615,575 | $ | 6,842,318 | $ | 1,304,695 | ||||||||
|
|
|
|
|
|
|
| |||||||||
The accompanying notes are an integral part of these financial statements.
| 114 | Litman Gregory Funds Trust | |||||
Table of Contents
Litman Gregory Funds Trust
STATEMENTS OF OPERATIONS For the Year Ended December 31, 2023
| Global Select Fund | International Fund | Oldfield International Value Fund | SBH Focused Small Value Fund | |||||||||||||
INVESTMENT INCOME: | ||||||||||||||||
Income |
| |||||||||||||||
Dividends (net of foreign taxes withheld of $94,259, $653,639, $129,420 and $3,063, respectively) | $ | 1,629,089 | $ | 4,739,049 | $ | 1,083,035 | $ | 859,444 | ||||||||
Interest | 81,005 | 170,619 | — | — | ||||||||||||
|
|
|
|
|
|
|
| |||||||||
Total income | 1,710,094 | 4,909,668 | 1,083,035 | 859,444 | ||||||||||||
|
|
|
|
|
|
|
| |||||||||
Expenses | ||||||||||||||||
Advisory fees | 1,323,239 | 2,441,577 | 248,365 | 494,986 | ||||||||||||
Transfer agent fees | 131,776 | 125,736 | 43,960 | 66,482 | ||||||||||||
Fund accounting fees | 43,140 | 46,193 | 19,723 | — | ||||||||||||
Administration fees | — | — | — | 4,902 | ||||||||||||
Professional fees | 52,546 | 79,220 | 34,792 | 27,219 | ||||||||||||
Trustee fees | 70,271 | 82,973 | 59,400 | 61,177 | ||||||||||||
Custody fees | 2,507 | 15,875 | 32,848 | 12,762 | ||||||||||||
Reports to shareholders | 44,723 | 10,476 | — | 2,994 | ||||||||||||
Registration expense | 27,141 | 30,691 | 22,383 | 23,062 | ||||||||||||
Miscellaneous | 5,259 | 9,092 | — | 1,313 | ||||||||||||
Dividend & interest expense | 46,683 | 10,372 | 2,167 | 727 | ||||||||||||
Chief Compliance Officer fees | 13,953 | 13,953 | 13,953 | 13,953 | ||||||||||||
|
|
|
|
|
|
|
| |||||||||
Total expenses | 1,761,238 | 2,866,158 | 477,591 | 709,577 | ||||||||||||
Less: fees waived (see Note 3) | (541,389 | ) | (499,400 | ) | (142,421 | ) | (140,343 | ) | ||||||||
|
|
|
|
|
|
|
| |||||||||
Net expenses | 1,219,849 | 2,366,758 | 335,170 | 569,234 | ||||||||||||
|
|
|
|
|
|
|
| |||||||||
Net investment income | 490,245 | 2,542,910 | 747,865 | 290,210 | ||||||||||||
|
|
|
|
|
|
|
| |||||||||
REALIZED AND UNREALIZED GAIN (LOSS) | ||||||||||||||||
Net realized gain (loss) on: | ||||||||||||||||
Investments | 5,309,321 | 5,888,230 | 1,943,559 | 5,774,333 | ||||||||||||
Foreign currency transactions | (8,272 | ) | (182,119 | ) | (31,732 | ) | — | |||||||||
|
|
|
|
|
|
|
| |||||||||
Net realized gain (loss) | 5,301,049 | 5,706,111 | 1,911,827 | 5,774,333 | ||||||||||||
|
|
|
|
|
|
|
| |||||||||
Net change in unrealized appreciation/depreciation on: | ||||||||||||||||
Investments | 13,316,790 | 26,498,298 | 2,940,133 | 5,191,283 | ||||||||||||
Foreign currency transactions | 13,023 | 178,090 | 3,162 | — | ||||||||||||
|
|
|
|
|
|
|
| |||||||||
Net change in unrealized appreciation/depreciation | 13,329,813 | 26,676,388 | 2,943,295 | 5,191,283 | ||||||||||||
|
|
|
|
|
|
|
| |||||||||
Net realized and unrealized gain (loss) on investments and foreign currency transactions | 18,630,862 | 32,382,499 | 4,855,122 | 10,965,616 | ||||||||||||
|
|
|
|
|
|
|
| |||||||||
Net increase in net assets resulting from operations | $ | 19,121,107 | $ | 34,925,409 | $ | 5,602,987 | $ | 11,255,826 | ||||||||
|
|
|
|
|
|
|
| |||||||||
The accompanying notes are an integral part of these financial statements.
| Statements of Operations | 115 | |||||
Table of Contents
Litman Gregory Funds Trust
STATEMENTS OF OPERATIONS For the Year Ended December 31, 2023 – (Continued)
| Alternative Strategies Fund (Consolidated) | High Income Fund | Dolan McEniry Corporate Bond Fund | ||||||||||
INVESTMENT INCOME: |
| |||||||||||
Income |
| |||||||||||
Dividends (net of foreign taxes withheld of $110,139, $0 and $0, respectively) | $ | 3,168,450 | $ | 189,549 | $ | — | ||||||
Interest (net of interest taxes withheld of $4,960, $1,769 and $0, respectively) | 43,452,492 | 5,771,611 | 6,645,354 | |||||||||
|
|
|
|
|
| |||||||
Total income | 46,620,942 | 5,961,160 | 6,645,354 | |||||||||
|
|
|
|
|
| |||||||
Expenses |
| |||||||||||
Advisory fees | 12,328,426 | 811,062 | 726,943 | |||||||||
Transfer agent fees | 708,929 | 67,239 | 194,369 | |||||||||
Fund accounting fees | 252,979 | 85,883 | 19,795 | |||||||||
Administration fees | — | — | 16,036 | |||||||||
Professional fees | 352,595 | 93,080 | 45,156 | |||||||||
Trustee fees | 170,284 | 65,904 | 72,362 | |||||||||
Custody fees | 62,136 | 81,146 | 21,527 | |||||||||
Reports to shareholders | 66,009 | 21,694 | 40,862 | |||||||||
Registration expense | 94,434 | 26,282 | 42,118 | |||||||||
Miscellaneous | 128,658 | 1,085 | 9,944 | |||||||||
Dividend & interest expense | 118,396 | 25,495 | 4,831 | |||||||||
Chief Compliance Officer fees | 13,953 | 13,953 | 13,953 | |||||||||
Distribution fees for investor class (see Note 4) | 85,040 | — | — | |||||||||
|
|
|
|
|
| |||||||
Total expenses | 14,381,839 | 1,292,823 | 1,207,896 | |||||||||
Less: fees waived (see Note 3) | (2,252,960 | ) | (434,686 | ) | (190,175 | ) | ||||||
|
|
|
|
|
| |||||||
Net expenses | 12,128,879 | 858,137 | 1,017,721 | |||||||||
|
|
|
|
|
| |||||||
Net investment income | 34,492,063 | 5,103,023 | 5,627,633 | |||||||||
|
|
|
|
|
| |||||||
REALIZED AND UNREALIZED GAIN (LOSS) | ||||||||||||
Net realized gain (loss) on: | ||||||||||||
Investments, excluding purchased options | (12,495,395 | ) | (1,910,247 | ) | (1,726,126 | ) | ||||||
Purchased options | (409,354 | ) | (39,331 | ) | — | |||||||
Short sales | (984,041 | ) | — | — | ||||||||
Written options | (152,807 | ) | 1,056,695 | — | ||||||||
Forward foreign currency exchange contracts | (133,979 | ) | 14,159 | — | ||||||||
Foreign currency transactions | (1,342 | ) | (2,341 | ) | — | |||||||
Futures | (9,506,682 | ) | (136,533 | ) | — | |||||||
Swap contracts | 1,148,626 | (284,949 | ) | — | ||||||||
|
|
|
|
|
| |||||||
Net realized (loss) | (22,534,974 | ) | (1,302,547 | ) | (1,726,126 | ) | ||||||
|
|
|
|
|
| |||||||
Net change in unrealized appreciation/depreciation on: | ||||||||||||
Investments, excluding purchased options | 41,547,910 | 6,217,252 | 7,897,632 | |||||||||
Purchased options | 17,951 | (10,244 | ) | — | ||||||||
Unfunded loan commitment | (135,374 | ) | 3,441 | — | ||||||||
Short sales | 1,609 | — | — | |||||||||
Written options | (273 | ) | (72,822 | ) | — | |||||||
Forward foreign currency exchange contracts | (247,817 | ) | (21,388 | ) | — | |||||||
Foreign currency transactions | 25,136 | 392 | — | |||||||||
Futures | (2,591,738 | ) | 127,656 | — | ||||||||
Swap contracts | (4,787,965 | ) | 171,346 | — | ||||||||
|
|
|
|
|
| |||||||
Net change in unrealized appreciation/depreciation | 33,829,439 | 6,415,633 | 7,897,632 | |||||||||
|
|
|
|
|
| |||||||
Net realized and unrealized gain (loss) on investments, purchased options, unfunded loan commitment, short sales, written options, forward foreign currency exchange contracts, foreign currency transactions, futures and swap contracts | 11,294,465 | 5,113,086 | 6,171,506 | |||||||||
|
|
|
|
|
| |||||||
Net increase in net assets resulting from operations | $ | 45,786,528 | $ | 10,216,109 | $ | 11,799,139 | ||||||
|
|
|
|
|
| |||||||
The accompanying notes are an integral part of these financial statements.
| 116 | Litman Gregory Funds Trust | |||||
Table of Contents
Litman Gregory Funds Trust
STATEMENTS OF OPERATIONS For the Year Ended December 31, 2023 – (Continued)
| DBi Managed Futures Strategy ETF (Consolidated) | DBi Hedge Strategy ETF | RBA Responsible Global Allocation ETF | Berkshire Dividend Growth ETF** | |||||||||||||
INVESTMENT INCOME: |
| |||||||||||||||
Income |
| |||||||||||||||
Dividends | $ | — | $ | — | $ | 222,842 | $ | 13,960 | ||||||||
Interest | 30,290,629 | 1,232,258 | — | — | ||||||||||||
|
|
|
|
|
|
|
| |||||||||
Total income | 30,290,629 | 1,232,258 | 222,842 | 13,960 | ||||||||||||
|
|
|
|
|
|
|
| |||||||||
Expenses | ||||||||||||||||
Advisory fees | 6,807,956 | 240,103 | 45,551 | 2,812 | ||||||||||||
|
|
|
|
|
|
|
| |||||||||
Total expenses | 6,807,956 | 240,103 | 45,551 | 2,812 | ||||||||||||
|
|
|
|
|
|
|
| |||||||||
Net expenses | 6,807,956 | 240,103 | 45,551 | 2,812 | ||||||||||||
|
|
|
|
|
|
|
| |||||||||
Net investment income | 23,482,673 | 992,155 | 177,291 | 11,148 | ||||||||||||
|
|
|
|
|
|
|
| |||||||||
REALIZED AND UNREALIZED GAIN (LOSS) | ||||||||||||||||
Net realized gain (loss) on: | ||||||||||||||||
Investments | 128,388 | (1,601 | ) | (180,228 | ) | (81 | ) | |||||||||
Futures | (96,419,946 | ) | 99,571 | — | — | |||||||||||
In-kind redemptions | — | — | 53,305 | — | ||||||||||||
|
|
|
|
|
|
|
| |||||||||
Net realized gain (loss) | (96,291,558 | ) | 97,970 | (126,923 | ) | (81 | ) | |||||||||
|
|
|
|
|
|
|
| |||||||||
Net change in unrealized appreciation/depreciation on: | ||||||||||||||||
Investments | 108,633 | 5,747 | 622,035 | 44,435 | ||||||||||||
Futures | (17,190,676 | ) | 745,332 | — | — | |||||||||||
|
|
|
|
|
|
|
| |||||||||
Net change in unrealized appreciation/depreciation | (17,082,043 | ) | 751,079 | 622,035 | 44,435 | |||||||||||
|
|
|
|
|
|
|
| |||||||||
Net realized and unrealized gain (loss) on investments and futures | (113,373,601 | ) | 849,049 | 495,112 | 44,354 | |||||||||||
|
|
|
|
|
|
|
| |||||||||
Net increase (decrease) in net assets resulting from operations | $ | (89,890,928 | ) | $ | 1,841,204 | $ | 672,403 | $ | 55,502 | |||||||
|
|
|
|
|
|
|
| |||||||||
| ** | Commenced operations on June 29, 2023. |
The accompanying notes are an integral part of these financial statements.
| Statements of Operations | 117 | |||||
Table of Contents
Litman Gregory Funds Trust
STATEMENTS OF CHANGES IN NET ASSETS
The accompanying notes are an integral part of these financial statements.
| 118 | Litman Gregory Funds Trust | |||||
Table of Contents
Litman Gregory Funds Trust
STATEMENTS OF CHANGES IN NET ASSETS – (Continued)
The accompanying notes are an integral part of these financial statements.
| Statements of Changes in Net Assets | 119 | |||||
Table of Contents
Litman Gregory Funds Trust
STATEMENTS OF CHANGES IN NET ASSETS – (Continued)
The accompanying notes are an integral part of these financial statements.
| 120 | Litman Gregory Funds Trust | |||||
Table of Contents
Litman Gregory Funds Trust
STATEMENTS OF CHANGES IN NET ASSETS – (Continued)
| 1 | Investor Class shares were converted into Institutional Class shares at the close of business on September 30, 2022. |
The accompanying notes are an integral part of these financial statements.
| Statements of Changes in Net Assets | 121 | |||||
Table of Contents
Litman Gregory Funds Trust
STATEMENTS OF CHANGES IN NET ASSETS – (Continued)
The accompanying notes are an integral part of these financial statements.
| 122 | Litman Gregory Funds Trust | |||||
Table of Contents
Litman Gregory Funds Trust
STATEMENTS OF CHANGES IN NET ASSETS – (Continued)
| * | Commenced operations on January 31, 2022. |
| ** | Commenced operations on June 29, 2023. |
The accompanying notes are an integral part of these financial statements.
| Statements of Changes in Net Assets | 123 | |||||
Table of Contents
iMGP Global Select Fund – Institutional Class
FINANCIAL HIGHLIGHTS
For a capital share outstanding throughout each year
| Year Ended December 31, | ||||||||||||||||||||
| 2023 | 2022 | 2021 | 2020 | 2019 | ||||||||||||||||
Net asset value, beginning of year | $ | 10.69 | $ | 18.80 | $ | 18.62 | $ | 17.54 | $ | 15.02 | ||||||||||
|
| |||||||||||||||||||
Income from investment operations: | ||||||||||||||||||||
Net investment income (loss)1 | 0.05 | (0.01 | ) | (0.03 | ) | (0.05 | ) | 0.08 | 2 | |||||||||||
Net realized gain (loss) and net change in unrealized | 1.79 | (4.78 | ) | 3.27 | 3.45 | 4.03 | ||||||||||||||
|
| |||||||||||||||||||
Total income (loss) from investment operations | 1.84 | (4.79 | ) | 3.24 | 3.40 | 4.11 | ||||||||||||||
|
| |||||||||||||||||||
Less distributions: | ||||||||||||||||||||
From net investment income | (0.05 | ) | — | — | — | (0.08 | ) | |||||||||||||
From net realized gains | (0.44 | ) | (3.32 | ) | (3.06 | ) | (2.32 | ) | (1.51 | ) | ||||||||||
|
| |||||||||||||||||||
Total distributions | (0.49 | ) | (3.32 | ) | (3.06 | ) | (2.32 | ) | (1.59 | ) | ||||||||||
|
| |||||||||||||||||||
Net asset value, end of year | $ | 12.04 | $ | 10.69 | $ | 18.80 | $ | 18.62 | $ | 17.54 | ||||||||||
|
| |||||||||||||||||||
Total return | 17.26 | % | (25.52 | )% | 17.75 | % | 19.52 | % | 27.55 | % | ||||||||||
|
| |||||||||||||||||||
Ratios/supplemental data: | ||||||||||||||||||||
Net assets, end of year (millions) | $ | 117.6 | $ | 119.7 | $ | 260.7 | $ | 254.9 | $ | 286.3 | ||||||||||
|
| |||||||||||||||||||
Ratios of total expenses to average net assets: | ||||||||||||||||||||
Before fees waived | 1.46 | %5 | 1.50 | %3 | 1.29 | %4 | 1.35 | %4 | 1.35 | %3 | ||||||||||
|
| |||||||||||||||||||
After fees waived | 1.01 | %5,6 | 1.18 | %3,6 | 1.16 | %4,6 | 1.23 | %4,6 | 1.24 | %3,6 | ||||||||||
|
| |||||||||||||||||||
Ratio of net investment income (loss) to average net assets | 0.41 | %5 | (0.06 | )%3 | (0.13 | )%4 | (0.29 | )%4 | 0.44 | %2,3 | ||||||||||
|
| |||||||||||||||||||
Portfolio turnover rate | 55.74 | % | 108.86 | % | 27.74 | % | 56.91 | % | 25.02 | %7 | ||||||||||
|
| |||||||||||||||||||
| 1 | Calculated based on the average shares outstanding methodology. |
| 2 | Include non-cash distributions amounting to $0.06 per share and 0.33% of average daily net assets. |
| 3 | Includes Interest & Dividend expense of 0.03% of average net assets. |
| 4 | Includes Interest & Dividend expense of 0.01% of average net assets. |
| 5 | Includes Interest & Dividend expense of 0.04% of average net assets. |
| 6 | Includes the impact of the voluntary waiver of less than 0.01% of average net assets. |
| 7 | Portfolio turnover is calculated on the basis of the Fund as a whole without distinguishing between classes of shares issued. |
The accompanying notes are an integral part of these financial statements.
| 124 | Litman Gregory Funds Trust | |||||
Table of Contents
iMGP International Fund – Institutional Class
FINANCIAL HIGHLIGHTS
For a capital share outstanding throughout each year
| Year Ended December 31, | ||||||||||||||||||||
| 2023 | 2022 | 2021 | 2020 | 2019 | ||||||||||||||||
Net asset value, beginning of year | $ | 15.16 | $ | 19.50 | $ | 18.12 | $ | 17.65 | $ | 13.94 | ||||||||||
|
| |||||||||||||||||||
Income from investment operations: | ||||||||||||||||||||
Net investment income1 | 0.19 | 0.11 | 0.71 | 3 | 0.07 | 0.27 | 2 | |||||||||||||
Net realized gain (loss) and net change in unrealized | 2.45 | (4.32 | ) | 1.39 | 0.80 | 3.97 | ||||||||||||||
|
| |||||||||||||||||||
Total income (loss) from investment operations | 2.64 | (4.21 | ) | 2.10 | 0.87 | 4.24 | ||||||||||||||
|
| |||||||||||||||||||
Less distributions: | ||||||||||||||||||||
From net investment income | (0.18 | ) | (0.13 | ) | (0.72 | ) | (0.40 | ) | (0.53 | ) | ||||||||||
From net realized gains | — | — | — | — | — | |||||||||||||||
|
| |||||||||||||||||||
Total distributions | (0.18 | ) | (0.13 | ) | (0.72 | ) | (0.40 | ) | (0.53 | ) | ||||||||||
|
| |||||||||||||||||||
Net asset value, end of year | $ | 17.62 | $ | 15.16 | $ | 19.50 | $ | 18.12 | $ | 17.65 | ||||||||||
|
| |||||||||||||||||||
Total return | 17.40 | % | (21.58 | )% | 11.75 | % | 5.02 | % | 30.45 | % | ||||||||||
|
| |||||||||||||||||||
Ratios/supplemental data: | ||||||||||||||||||||
Net assets, end of year (millions) | $ | 222.9 | $ | 205.6 | $ | 339.7 | $ | 326.7 | $ | 401.5 | ||||||||||
|
| |||||||||||||||||||
Ratios of total expenses to average net assets: | ||||||||||||||||||||
Before fees waived | 1.29 | %5 | 1.47 | %4 | 1.28 | %5 | 1.39 | %4 | 1.36 | %4 | ||||||||||
|
| |||||||||||||||||||
After fees waived | 1.07 | %5,6 | 1.24 | %4,6 | 1.05 | %5,6 | 1.15 | %4,6 | 1.12 | %4,6 | ||||||||||
|
| |||||||||||||||||||
Ratio of net investment income to average net assets | 1.15 | %5 | 0.68 | %4 | 3.63 | %3,5 | 0.49 | %4 | 1.65 | %2,4 | ||||||||||
|
| |||||||||||||||||||
Portfolio turnover rate | 40.55 | % | 42.74 | % | 99.91 | % | 59.61 | % | 45.48 | %7 | ||||||||||
|
| |||||||||||||||||||
| 1 | Calculated based on the average shares outstanding methodology. |
| 2 | Include non-cash distributions amounting to $0.10 per share and 0.60% of average daily net assets. |
| 3 | Include non-cash distributions amounting to $0.68 per share and 3.46% of average daily net assets. |
| 4 | Includes Interest & Dividend expense of 0.01% of average net assets. |
| 5 | Includes Interest & Dividend expense of 0.00% of average net assets. |
| 6 | Includes the impact of the voluntary waiver of less than 0.01% of average net assets. |
| 7 | Portfolio turnover is calculated on the basis of the Fund as a whole without distinguishing between classes of shares issued. |
The accompanying notes are an integral part of these financial statements.
| Financial Highlights | 125 | |||||
Table of Contents
iMGP Oldfield International Value Fund – Institutional Class
FINANCIAL HIGHLIGHTS
For a capital share outstanding throughout each period
| Year Ended December 31, | Period Ended December 31, 2020** | |||||||||||||||
| 2023 | 2022 | 2021 | ||||||||||||||
Net asset value, beginning of period | $ | 9.77 | $ | 11.66 | $ | 10.60 | $ | 10.00 | ||||||||
|
| |||||||||||||||
Income from investment operations: |
| |||||||||||||||
Net investment income (loss)1 | 0.23 | 0.17 | 0.26 | 2 | (0.01 | ) | ||||||||||
Net realized gain (loss) and net change in unrealized | 1.50 | (1.90 | ) | 1.13 | 0.61 | |||||||||||
|
| |||||||||||||||
Total income (loss) from investment operations | 1.73 | (1.73 | ) | 1.39 | 0.60 | |||||||||||
|
| |||||||||||||||
Less distributions: |
| |||||||||||||||
From net investment income | (0.25 | ) | (0.11 | ) | (0.22 | ) | — | |||||||||
From net realized gains | (0.04 | ) | (0.02 | ) | (0.11 | ) | — | |||||||||
Return of capital | — | (0.03 | ) | — | — | |||||||||||
|
| |||||||||||||||
Total distributions | (0.29 | ) | (0.16 | ) | (0.33 | ) | — | |||||||||
|
| |||||||||||||||
Net asset value, end of period | $ | 11.21 | $ | 9.77 | $ | 11.66 | $ | 10.60 | ||||||||
|
| |||||||||||||||
Total return | 17.74 | % | (14.89 | )% | 13.21 | % | 6.00 | %+ | ||||||||
|
| |||||||||||||||
Ratios/supplemental data: |
| |||||||||||||||
Net assets, end of year (millions) | $ | 35.2 | $ | 33.0 | $ | 25.9 | $ | 11.2 | ||||||||
|
| |||||||||||||||
Ratios of total expenses to average net assets: | ||||||||||||||||
Before fees waived | 1.35 | %4 | 2.11 | %3 | 1.52 | %3 | 5.38 | %* | ||||||||
|
| |||||||||||||||
After fees waived | 0.94 | %4 | 0.94 | %3 | 0.94 | %3,5 | 0.94 | %* | ||||||||
|
| |||||||||||||||
Ratio of net investment income (loss) to average net assets | 2.11 | %4 | 1.64 | %3 | 2.15 | %2,3 | (0.94 | )%* | ||||||||
|
| |||||||||||||||
Portfolio turnover rate | 27.70 | % | 34.50 | % | 16.31 | % | 2.51 | %+ | ||||||||
|
| |||||||||||||||
| + | Not annualized. |
| * | Annualized. |
| ** | Commenced operations on November 30, 2020. |
| 1 | Calculated based on the average shares outstanding methodology. |
| 2 | Include non-cash distributions amounting to $0.02 per share and 0.20% of average daily net assets. |
| 3 | Includes Interest & Dividend expense of 0.00% of average net assets. |
| 4 | Includes Interest & Dividend expense of 0.01% of average net assets. |
| 5 | Includes the impact of the voluntary waiver of less than 0.01% of average net assets. |
The accompanying notes are an integral part of these financial statements.
| 126 | Litman Gregory Funds Trust | |||||
Table of Contents
iMGP SBH Focused Small Value Fund – Institutional Class
FINANCIAL HIGHLIGHTS
For a capital share outstanding throughout each period
| Year Ended December 31, | Period Ended December 31, 2020** | |||||||||||||||
| 2023 | 2022 | 2021 | ||||||||||||||
Net asset value, beginning of period | $ | 12.87 | $ | 14.86 | $ | 12.71 | $ | 10.00 | ||||||||
|
| |||||||||||||||
Income from investment operations: |
| |||||||||||||||
Net investment income (loss)1 | 0.08 | 0.01 | (0.01 | ) | 0.01 | |||||||||||
Net realized gain (loss) and net change in unrealized | 3.10 | (2.00 | ) | 2.50 | 2.70 | |||||||||||
|
| |||||||||||||||
Total income (loss) from investment operations | 3.18 | (1.99 | ) | 2.49 | 2.71 | |||||||||||
|
| |||||||||||||||
Less distributions: |
| |||||||||||||||
From net investment income | (0.11 | ) | — | — | — | |||||||||||
From net realized gains | (1.05 | ) | — | (0.34 | ) | — | ||||||||||
|
| |||||||||||||||
Total distributions | (1.16 | ) | — | (0.34 | ) | — | ||||||||||
|
| |||||||||||||||
Net asset value, end of period | $ | 14.89 | $ | 12.87 | $ | 14.86 | $ | 12.71 | ||||||||
|
| |||||||||||||||
Total return | 24.74 | % | (13.39 | )% | 19.66 | % | 27.10 | %+ | ||||||||
|
| |||||||||||||||
Ratios/supplemental data: |
| |||||||||||||||
Net assets, end of year (millions) | $ | 51.8 | $ | 48.7 | $ | 65.6 | $ | 36.8 | ||||||||
|
| |||||||||||||||
Ratios of total expenses to average net assets: | ||||||||||||||||
Before fees waived | 1.43 | %2 | 1.68 | %2 | 1.48 | %2 | 2.11 | %* | ||||||||
|
| |||||||||||||||
After fees waived | 1.15 | %2 | 1.15 | %2 | 1.15 | %2,3 | 1.15 | %* | ||||||||
|
| |||||||||||||||
Ratio of net investment income (loss) to average net assets | 0.59 | %2 | 0.11 | %2 | (0.04 | )%2 | 0.23 | %* | ||||||||
|
| |||||||||||||||
Portfolio turnover rate | 56.46 | % | 35.50 | % | 45.15 | % | 27.18 | %+ | ||||||||
|
| |||||||||||||||
| + | Not annualized. |
| * | Annualized. |
| ** | Commenced operations on July 31, 2020. |
| 1 | Calculated based on the average shares outstanding methodology. |
| 2 | Includes Interest & Dividend expense of 0.00% of average net assets. |
| 3 | Includes the impact of the voluntary waiver of less than 0.01% of average net assets. |
The accompanying notes are an integral part of these financial statements.
| Financial Highlights | 127 | |||||
Table of Contents
iMGP Alternative Strategies Fund – Institutional Class
FINANCIAL HIGHLIGHTS
For a capital share outstanding throughout each year
| Year Ended December 31, | ||||||||||||||||||||
(Consolidated) 2023 | (Consolidated) 2022 | 2021 | 2020 | 2019 | ||||||||||||||||
Net asset value, beginning of year | $ | 10.25 | $ | 11.76 | $ | 12.03 | $ | 11.70 | $ | 11.08 | ||||||||||
|
| |||||||||||||||||||
Income from investment operations: | ||||||||||||||||||||
Net investment income1 | 0.40 | 0.32 | 0.29 | 3 | 0.30 | 0.31 | 2 | |||||||||||||
Net realized gain (loss) and net change in unrealized | 0.18 | (1.42 | ) | 0.16 | 0.41 | 0.64 | ||||||||||||||
|
| |||||||||||||||||||
Total income (loss) from investment operations | 0.58 | (1.10 | ) | 0.45 | 0.71 | 0.95 | ||||||||||||||
|
| |||||||||||||||||||
Less distributions: | ||||||||||||||||||||
From net investment income | (0.40 | ) | (0.41 | ) | (0.38 | ) | (0.38 | ) | (0.33 | ) | ||||||||||
From net realized gains | — | — | (0.34 | ) | — | — | ||||||||||||||
|
| |||||||||||||||||||
Total distributions | (0.40 | ) | (0.41 | ) | (0.72 | ) | (0.38 | ) | (0.33 | ) | ||||||||||
|
| |||||||||||||||||||
Net asset value, end of year | $ | 10.43 | $ | 10.25 | $ | 11.76 | $ | 12.03 | $ | 11.70 | ||||||||||
|
| |||||||||||||||||||
Total return | 5.91 | %4 | (9.49 | )%4 | 3.82 | % | 6.30 | % | 8.52 | % | ||||||||||
|
| |||||||||||||||||||
Ratios/supplemental data: | ||||||||||||||||||||
Net assets, end of year (millions) | $ | 656.6 | $ | 973.2 | $ | 1,512.5 | $ | 1,417.1 | $ | 1,724.2 | ||||||||||
|
| |||||||||||||||||||
Ratios of total expenses to average net assets: | ||||||||||||||||||||
Before fees waived | 1.62 | % 8 | 1.67 | %7 | 1.72 | %6 | 1.75 | %6 | 1.63 | %5 | ||||||||||
|
| |||||||||||||||||||
After fees waived | 1.37 | %8,9 | 1.39 | %7,9 | 1.44 | %6,9 | 1.47 | %6,9 | 1.51 | %5,9 | ||||||||||
|
| |||||||||||||||||||
Ratio of net investment income to average net assets | 3.93 | %8 | 2.89 | %7 | 2.36 | %3,6 | 2.60 | %6 | 2.70 | %2,5 | ||||||||||
|
| |||||||||||||||||||
Portfolio turnover rate10 | 100.76 | % | 89.62 | % | 137.56 | % | 193.98 | % | 190.21 | % | ||||||||||
|
| |||||||||||||||||||
| 1 | Calculated based on the average shares outstanding methodology. |
| 2 | Include non-cash distributions amounting to $0.02 per share and 0.20% of average daily net assets. |
| 3 | Include non-cash distributions amounting to $0.00 per share and 0.00% of average daily net assets. |
| 4 | The total return does not include the impact of financial statement rounding of the net asset value (NAV) per share and/or financial statement adjustments. |
| 5 | Includes Interest & Dividend expense of 0.05% of average net assets. |
| 6 | Includes Interest & Dividend expense of 0.14% of average net assets. |
| 7 | Includes Interest & Dividend expense of 0.03% of average net assets. |
| 8 | Includes Interest & Dividend expense of 0.01% of average net assets. |
| 9 | Includes the impact of the voluntary waiver of less than 0.01% of average net assets. |
| 10 | Portfolio turnover is calculated on the basis of the Fund as a whole without distinguishing between classes of shares issued. |
The accompanying notes are an integral part of these financial statements.
| 128 | Litman Gregory Funds Trust | |||||
Table of Contents
iMGP Alternative Strategies Fund – Investor Class
FINANCIAL HIGHLIGHTS
For a capital share outstanding throughout each year
| Year Ended December 31, | ||||||||||||||||||||
(Consolidated) 2023 | (Consolidated) 2022 | 2021 | 2020 | 2019 | ||||||||||||||||
Net asset value, beginning of year | $ | 10.28 | $ | 11.79 | $ | 12.06 | $ | 11.71 | $ | 11.10 | ||||||||||
|
| |||||||||||||||||||
Income from investment operations: | ||||||||||||||||||||
Net investment income1 | 0.38 | 0.29 | 0.26 | 3 | 0.27 | 0.28 | 2 | |||||||||||||
Net realized gain (loss) and net change in unrealized | 0.18 | (1.42 | ) | 0.16 | 0.42 | 0.63 | ||||||||||||||
|
| |||||||||||||||||||
Total income (loss) from investment operations | 0.56 | (1.13 | ) | 0.42 | 0.69 | 0.91 | ||||||||||||||
|
| |||||||||||||||||||
Less distributions: | ||||||||||||||||||||
From net investment income | (0.36 | ) | (0.38 | ) | (0.35 | ) | (0.34 | ) | (0.30 | ) | ||||||||||
From net realized gains | — | — | (0.34 | ) | — | — | ||||||||||||||
|
| |||||||||||||||||||
Total distributions | (0.36 | ) | (0.38 | ) | (0.69 | ) | (0.34 | ) | (0.30 | ) | ||||||||||
|
| |||||||||||||||||||
Net asset value, end of year | $ | 10.48 | $ | 10.28 | $ | 11.79 | $ | 12.06 | $ | 11.71 | ||||||||||
|
| |||||||||||||||||||
Total return | 5.61 | % | (9.65 | )% | 3.54 | % | 6.06 | % | 8.22 | % | ||||||||||
|
| |||||||||||||||||||
Ratios/supplemental data: | ||||||||||||||||||||
Net assets, end of year (millions) | $ | 27.1 | $ | 45.4 | $ | 75.6 | $ | 74.2 | $ | 144.1 | ||||||||||
|
| |||||||||||||||||||
Ratios of total expenses to average net assets: | ||||||||||||||||||||
Before fees waived | 1.87 | %7 | 1.92 | %6 | 1.97 | %5 | 1.99 | %5 | 1.88 | %4 | ||||||||||
|
| |||||||||||||||||||
After fees waived | 1.62 | %7,8 | 1.64 | %6,8 | 1.69 | %5,8 | 1.71 | %5,8 | 1.76 | %4,8 | ||||||||||
|
| |||||||||||||||||||
Ratio of net investment income to average net assets | 3.65 | %7 | 2.64 | %6 | 2.11 | %3,5 | 2.36 | %5 | 2.44 | %2,4 | ||||||||||
|
| |||||||||||||||||||
Portfolio turnover rate9 | 100.76 | % | 89.62 | % | 137.56 | % | 193.98 | % | 190.21 | % | ||||||||||
|
| |||||||||||||||||||
| 1 | Calculated based on the average shares outstanding methodology. |
| 2 | Include non-cash distributions amounting to $0.02 per share and 0.20% of average daily net assets. |
| 3 | Include non-cash distributions amounting to $0.00 per share and 0.00% of average daily net assets. |
| 4 | Includes Interest & Dividend expense of 0.05% of average net assets. |
| 5 | Includes Interest & Dividend expense of 0.14% of average net assets. |
| 6 | Includes Interest & Dividend expense of 0.03% of average net assets. |
| 7 | Includes Interest & Dividend expense of 0.01% of average net assets. |
| 8 | Includes the impact of the voluntary waiver of less than 0.01% of average net assets. |
| 9 | Portfolio turnover is calculated on the basis of the Fund as a whole without distinguishing between classes of shares issued. |
The accompanying notes are an integral part of these financial statements.
| Financial Highlights | 129 | |||||
Table of Contents
iMGP High Income Fund – Institutional Class
FINANCIAL HIGHLIGHTS
For a capital share outstanding throughout each year
| Year Ended December 31, | ||||||||||||||||||||
| 2023 | 2022 | 2021 | 2020 | 2019 | ||||||||||||||||
Net asset value, beginning of year | $ | 9.16 | $ | 10.27 | $ | 10.21 | $ | 10.06 | $ | 9.63 | ||||||||||
|
| |||||||||||||||||||
Income from investment operations: | ||||||||||||||||||||
Net investment income1 | 0.56 | 0.38 | 0.32 | 2 | 0.37 | 0.36 | ||||||||||||||
Net realized gain (loss) and net change in unrealized | 0.54 | (1.08 | ) | 0.33 | 0.16 | 0.44 | ||||||||||||||
|
| |||||||||||||||||||
Total income (loss) from investment operations | 1.10 | (0.70 | ) | 0.65 | 0.53 | 0.80 | ||||||||||||||
|
| |||||||||||||||||||
Less distributions: | ||||||||||||||||||||
From net investment income | (0.61 | ) | (0.38 | ) | (0.34 | ) | (0.37 | ) | (0.33 | ) | ||||||||||
From net realized gains | — | (0.03 | ) | (0.25 | ) | (0.01 | ) | (0.04 | ) | |||||||||||
|
| |||||||||||||||||||
Total distributions | (0.61 | ) | (0.41 | ) | (0.59 | ) | (0.38 | ) | (0.37 | ) | ||||||||||
|
| |||||||||||||||||||
Net asset value, end of year | $ | 9.65 | $ | 9.16 | $ | 10.27 | $ | 10.21 | $ | 10.06 | ||||||||||
|
| |||||||||||||||||||
Total return | 12.32 | % | (6.85 | )% | 6.42 | % | 5.62 | % | 8.37 | % | ||||||||||
|
| |||||||||||||||||||
Ratios/supplemental data: | ||||||||||||||||||||
Net assets, end of year (millions) | $ | 91.7 | $ | 99.8 | $ | 106.7 | $ | 87.9 | $ | 93.8 | ||||||||||
|
| |||||||||||||||||||
Ratios of total expenses to average net assets: | ||||||||||||||||||||
Before fees waived | 1.51 | %6 | 1.41 | %5 | 1.44 | %5 | 1.72 | %4 | 1.39 | %3 | ||||||||||
|
| |||||||||||||||||||
After fees waived | 1.01 | %6,7 | 0.99 | %5,7 | 0.98 | %5,7 | 1.00 | %4,7 | 0.98 | %3,7 | ||||||||||
|
| |||||||||||||||||||
Ratio of net investment income to average net assets | 5.98 | %6 | 3.93 | %5 | 3.11 | %2,5 | 3.83 | %4 | 3.56 | %3 | ||||||||||
|
| |||||||||||||||||||
Portfolio turnover rate | 38.78 | % | 49.41 | % | 72.02 | % | 87.63 | % | 90.51 | %8 | ||||||||||
|
| |||||||||||||||||||
| 1 | Calculated based on the average shares outstanding methodology. |
| 2 | Include non-cash distributions amounting to $0.00 per share and 0.01% of average daily net assets. |
| 3 | Includes Interest & Dividend expense of 0.00% of average net assets. |
| 4 | Includes Interest & Dividend expense of 0.02% of average net assets. |
| 5 | Includes Interest & Dividend expense of 0.01% of average net assets. |
| 6 | Includes Interest & Dividend expense of 0.03% of average net assets. |
| 7 | Includes the impact of the voluntary waiver of less than 0.01% of average net assets. |
| 8 | Portfolio turnover is calculated on the basis of the Fund as a whole without distinguishing between classes of shares issued. |
The accompanying notes are an integral part of these financial statements.
| 130 | Litman Gregory Funds Trust | |||||
Table of Contents
iMGP Dolan McEniry Corporate Bond Fund – Institutional Class
FINANCIAL HIGHLIGHTS
For a capital share outstanding throughout each year
| Year Ended December 31, | ||||||||||||||||||||
| 2023 | 2022 | 2021 | 2020 | 2019 | ||||||||||||||||
Net asset value, beginning of year | $ | 9.54 | $ | 10.62 | $ | 10.92 | $ | 10.61 | $ | 9.83 | ||||||||||
|
| |||||||||||||||||||
Income from investment operations: | ||||||||||||||||||||
Net investment income1 | 0.37 | 0.20 | 0.14 | 0.22 | 0.30 | |||||||||||||||
Net realized gain (loss) and net change in unrealized | 0.32 | (1.05 | ) | (0.23 | ) | 0.36 | 0.79 | |||||||||||||
|
| |||||||||||||||||||
Total income (loss) from investment operations | 0.69 | (0.85 | ) | (0.09 | ) | 0.58 | 1.09 | |||||||||||||
|
| |||||||||||||||||||
Less distributions: | ||||||||||||||||||||
From net investment income | (0.37 | ) | (0.22 | ) | (0.15 | ) | (0.24 | ) | (0.30 | ) | ||||||||||
From net realized gains | — | (0.01 | ) | (0.06 | ) | (0.03 | ) | (0.01 | ) | |||||||||||
|
| |||||||||||||||||||
Total distributions | (0.37 | ) | (0.23 | ) | (0.21 | ) | (0.27 | ) | (0.31 | ) | ||||||||||
|
| |||||||||||||||||||
Net asset value, end of year | $ | 9.86 | $ | 9.54 | $ | 10.62 | $ | 10.92 | $ | 10.61 | ||||||||||
|
| |||||||||||||||||||
Total return | 7.38 | % | (8.08 | )% | (0.86 | )% | 5.50 | % | 11.25 | % | ||||||||||
|
| |||||||||||||||||||
Ratios/supplemental data: | ||||||||||||||||||||
Net assets, end of year (thousands) | $ | 204,102 | $ | 95,178 | $ | 90,827 | $ | 57,666 | $ | 13,066 | ||||||||||
|
| |||||||||||||||||||
Ratios of total expenses to average net assets: | ||||||||||||||||||||
Before fees waived | 0.83 | %3 | 1.02 | % | 0.96 | %2 | 1.34 | % | 4.36 | % | ||||||||||
|
| |||||||||||||||||||
After fees waived | 0.70 | %3 | 0.70 | % | 0.70 | %2 | 0.70 | % | 0.70 | % | ||||||||||
|
| |||||||||||||||||||
Ratio of net investment income to average net assets | 3.87 | %3 | 2.01 | % | 1.28 | %2 | 2.07 | % | 2.83 | % | ||||||||||
|
| |||||||||||||||||||
Portfolio turnover rate | 21.22 | % | 26.08 | %4 | 32.65 | %4 | 40.00 | %4 | 16.00 | %4 | ||||||||||
|
| |||||||||||||||||||
| 1 | Calculated based on the average shares outstanding methodology. |
| 2 | Includes Interest & Dividend expense of 0.02% of average net assets. |
| 3 | Includes Interest & Dividend expense of 0.00% of average net assets. |
| 4 | Portfolio turnover is calculated on the basis of the Fund as a whole without distinguishing between classes of shares issued. |
The accompanying notes are an integral part of these financial statements.
| Financial Highlights | 131 | |||||
Table of Contents
iMGP DBi Managed Futures Strategy ETF
CONSOLIDATED FINANCIAL HIGHLIGHTS
For a capital share outstanding throughout each period
| Year Ended December 31, | Period Ended December 31, 2019** | |||||||||||||||||||
| 2023 | 2022 | 2021 | 2020 | |||||||||||||||||
Net asset value, beginning of period | $ | 29.05 | $ | 25.42 | $ | 25.58 | $ | 25.34 | $ | 25.00 | ||||||||||
|
| |||||||||||||||||||
Income from investment operations: |
| |||||||||||||||||||
Net investment income (loss)1 | 0.81 | (0.23 | ) | (0.26 | ) | (0.14 | ) | 0.15 | ||||||||||||
Net realized gain (loss) and net change in unrealized | (3.34 | ) | 6.11 | 2 | 2.78 | 0.60 | 2.55 | |||||||||||||
|
| |||||||||||||||||||
Total income (loss) from investment operations | (2.53 | ) | 5.88 | 2.52 | 0.46 | 2.70 | ||||||||||||||
|
| |||||||||||||||||||
Less distributions: |
| |||||||||||||||||||
From net investment income | (0.69 | ) | (1.06 | ) | (0.35 | ) | (0.02 | ) | (0.11 | ) | ||||||||||
From net realized gains | — | (1.18 | ) | (1.18 | ) | (0.20 | ) | (2.25 | ) | |||||||||||
Return of capital | (0.06 | ) | (0.01 | ) | (1.15 | ) | — | — | ||||||||||||
|
| |||||||||||||||||||
Total distributions | (0.75 | ) | (2.25 | ) | (2.68 | ) | (0.22 | ) | (2.36 | ) | ||||||||||
|
| |||||||||||||||||||
Net asset value, end of period | $ | 25.77 | $ | 29.05 | $ | 25.42 | $ | 25.58 | $ | 25.34 | ||||||||||
|
| |||||||||||||||||||
Market price, end of period | $ | 25.76 | $ | 29.11 | $ | 25.80 | $ | 25.56 | $ | 25.33 | ||||||||||
|
| |||||||||||||||||||
Net asset value total return | (8.72 | )% | 23.07 | % | 9.80 | % | 1.84 | % | 10.76 | %+ | ||||||||||
|
| |||||||||||||||||||
Market price total return | (8.94 | )% | 21.53 | % | 11.38 | % | 1.79 | % | — | % | ||||||||||
|
| |||||||||||||||||||
Ratios/supplemental data: |
| |||||||||||||||||||
Net assets, end of year (thousands) | $ | 684,737 | $ | 951,319 | $ | 60,379 | $ | 36,454 | $ | 18,369 | ||||||||||
|
| |||||||||||||||||||
Ratios of total expenses to average net assets: | ||||||||||||||||||||
Before fees waived | 0.85 | % | 0.85 | % | 0.95 | %3 | 0.85 | % | 0.85 | %* | ||||||||||
|
| |||||||||||||||||||
After fees waived | 0.85 | % | 0.85 | % | 0.95 | %3 | 0.85 | % | 0.85 | %* | ||||||||||
|
| |||||||||||||||||||
Ratio of net investment income (loss) to average net assets | 2.93 | % | (0.73 | )% | (0.93 | )%3 | (0.55 | )% | 0.84 | %* | ||||||||||
|
| |||||||||||||||||||
Portfolio turnover rate | 0.00 | % | 0.00 | % | 0.00 | % | 0.00 | % | 0.00 | %+ | ||||||||||
|
| |||||||||||||||||||
| + | Not annualized. |
| * | Annualized. |
| ** | Commencement of operations was May 7, 2019. |
| 1 | Calculated based on the average shares outstanding methodology. |
| 2 | The amount shown for a share outstanding does not correspond with the aggregate net realized and unrealized gain (loss) on investments due to the timing of purchases and redemptions of the Fund shares in relation to fluctuating market values of the investments of the Fund. |
| 3 | Includes broker interest expense of 0.10% of average net assets. |
The accompanying notes are an integral part of these financial statements.
| 132 | Litman Gregory Funds Trust | |||||
Table of Contents
FINANCIAL HIGHLIGHTS
For a capital share outstanding throughout each period
| Year Ended December 31, | Period Ended December 31, 2019** | |||||||||||||||||||
| 2023 | 2022 | 2021 | 2020 | |||||||||||||||||
Net asset value, beginning of period | $ | 25.42 | $ | 27.62 | $ | 30.87 | $ | 25.00 | $ | 25.00 | ||||||||||
|
| |||||||||||||||||||
Income from investment operations: |
| |||||||||||||||||||
Net investment income (loss)1 | 0.93 | (0.21 | ) | (0.27 | ) | (0.12 | ) | 0.00 | ^ | |||||||||||
Net realized gain (loss) and net change in unrealized | 1.08 | (1.60 | ) | 1.83 | 6.01 | 0.00 | ^ | |||||||||||||
|
| |||||||||||||||||||
Total income (loss) from investment operations | 2.01 | (1.81 | ) | 1.56 | 5.89 | 0.00 | ||||||||||||||
|
| |||||||||||||||||||
Less distributions: |
| |||||||||||||||||||
From net investment income | (0.81 | ) | (0.39 | ) | — | (0.02 | ) | (0.00 | )^ | |||||||||||
From net realized gains | — | — | (4.81 | ) | — | — | ||||||||||||||
|
| |||||||||||||||||||
Total distributions | (0.81 | ) | (0.39 | ) | (4.81 | ) | (0.02 | ) | (0.00 | ) | ||||||||||
|
| |||||||||||||||||||
Net asset value, end of period | $ | 26.62 | $ | 25.42 | $ | 27.62 | $ | 30.87 | $ | 25.00 | ||||||||||
|
| |||||||||||||||||||
Market price, end of period | $ | 26.59 | $ | 25.55 | $ | 27.61 | $ | 30.86 | $ | 25.03 | ||||||||||
|
| |||||||||||||||||||
Net asset value total return | 7.91 | % | (6.51 | )% | 5.05 | % | 23.58 | % | 0.01 | %+ | ||||||||||
|
| |||||||||||||||||||
Market price total return | 7.24 | % | (6.04 | )% | 4.92 | % | 23.42 | % | — | % | ||||||||||
|
| |||||||||||||||||||
Ratios/supplemental data: |
| |||||||||||||||||||
Net assets, end of year (thousands) | $ | 32,616 | $ | 14,618 | $ | 17,261 | $ | 18,520 | $ | 16,250 | ||||||||||
|
| |||||||||||||||||||
Ratios of total expenses to average net assets: | ||||||||||||||||||||
Before fees waived | 0.85 | % | 0.85 | % | 0.85 | % | 0.85 | % | 0.85 | %* | ||||||||||
|
| |||||||||||||||||||
After fees waived | 0.85 | % | 0.85 | % | 0.85 | % | 0.85 | % | 0.85 | %* | ||||||||||
|
| |||||||||||||||||||
Ratio of net investment income (loss) to average net assets | 3.51 | % | (0.78 | )% | (0.83 | )% | (0.47 | )% | 0.48 | %* | ||||||||||
|
| |||||||||||||||||||
Portfolio turnover rate | 0.00 | % | 0.00 | % | 0.00 | % | 0.00 | % | 0.00 | %+ | ||||||||||
|
| |||||||||||||||||||
| + | Not annualized. |
| * | Annualized. |
| ** | Commencement of operations was December 17, 2019. |
| ^ | Amount represents less than $0.01 per share. |
| 1 | Calculated based on the average shares outstanding methodology. |
The accompanying notes are an integral part of these financial statements.
| Financial Highlights | 133 | |||||
Table of Contents
iMGP RBA Responsible Global Allocation ETF
FINANCIAL HIGHLIGHTS
For a capital share outstanding throughout each period
| Year Ended December 31, 2023 | Period Ended December 31, 2022** | |||||||
Net asset value, beginning of period | $ | 8.89 | $ | 10.12 | ||||
|
| |||||||
Income from investment operations: |
| |||||||
Net investment income1 | 0.20 | 0.18 | ||||||
Net realized gain (loss) and net change in unrealized | 0.57 | (1.28 | ) | |||||
|
| |||||||
Total income (loss) from investment operations | 0.77 | (1.10 | ) | |||||
|
| |||||||
Less distributions: |
| |||||||
From net investment income | (0.22 | ) | (0.13 | ) | ||||
From net realized gains | — | — | ||||||
|
| |||||||
Total distributions | (0.22 | ) | (0.13 | ) | ||||
|
| |||||||
Net asset value, end of period | $ | 9.44 | $ | 8.89 | ||||
|
| |||||||
Market price, end of period | $ | 9.39 | $ | 8.87 | ||||
|
| |||||||
Net asset value total return | 8.62 | % | (10.88 | )%+ | ||||
|
| |||||||
Market price total return | 8.37 | % | (11.13 | )%+ | ||||
|
| |||||||
Ratios/supplemental data: |
| |||||||
Net assets, end of period (thousands) | $ | 6,842 | $ | 8,449 | ||||
|
| |||||||
Ratios of total expenses to average net assets: | ||||||||
Before fees waived2 | 0.55 | % | 0.55 | %* | ||||
|
| |||||||
After fees waived2 | 0.55 | % | 0.55 | %* | ||||
|
| |||||||
Ratio of net investment income to average net assets | 2.14 | % | 2.21 | %* | ||||
|
| |||||||
Portfolio turnover rate | 40.93 | %3 | 58.28 | %+ | ||||
|
| |||||||
| + | Not annualized. |
| * | Annualized. |
| ** | Commenced operations on January 31, 2022. |
| 1 | Calculated based on the average shares outstanding methodology. |
| 2 | The Fund invests in other funds and indirectly bears its proportionate shares of fees and expenses incurred by the underlying funds in which the Fund is invested. This ratio does not include these indirect fees and expenses. |
| 3 | Portfolio turnover rate excludes securities received or delivered in-kind. The portfolio turnover rate including securities received or delivered in-kind was 41.44% for the year ended December 31, 2023. |
The accompanying notes are an integral part of these financial statements.
| 134 | Litman Gregory Funds Trust | |||||
Table of Contents
iMGP Berkshire Dividend Growth ETF
FINANCIAL HIGHLIGHTS
For a capital share outstanding throughout the period
| Period Ended December 31, 2023** | ||||
Net asset value, beginning of period | $ | 10.08 | ||
|
| |||
Income from investment operations: |
| |||
Net investment income1 | 0.11 | |||
Net realized gain (loss) and net change in unrealized | 0.35 | |||
|
| |||
Total income from investment operations | 0.46 | |||
|
| |||
Less distributions: |
| |||
From net investment income | (0.10 | ) | ||
From net realized gains | — | |||
|
| |||
Total distributions | (0.10 | ) | ||
|
| |||
Net asset value, end of period | $ | 10.44 | ||
|
| |||
Market price, end of period | $ | 10.44 | ||
|
| |||
Net asset value total return | 4.56 | %+ | ||
|
| |||
Market price total return | 4.54 | %+ | ||
|
| |||
Ratios/supplemental data: |
| |||
Net assets, end of year (thousands) | $ | 1,305 | ||
|
| |||
Ratios of total expenses to average net assets: | ||||
Before fees waived | 0.55 | %* | ||
|
| |||
After fees waived | 0.55 | %* | ||
|
| |||
Ratio of net investment income to average net assets | 2.18 | %* | ||
|
| |||
Portfolio turnover rate | 0.02 | %+,2 | ||
|
| |||
| + | Not annualized. |
| * | Annualized. |
| ** | Commenced operations on June 29, 2023. |
| 1 | Calculated based on the average shares outstanding methodology. |
| 2 | Portfolio turnover rate excludes securities received or delivered in-kind. The portfolio turnover rate including securities received or delivered in-kind was 0.02% for the period ended December 31, 2023. |
The accompanying notes are an integral part of these financial statements.
| Financial Highlights | 135 | |||||
Table of Contents
Litman Gregory Funds Trust
Note 1 – Organization
Litman Gregory Funds Trust (the “Trust”) was organized as a Delaware business trust on August 1, 1996, and is registered under the Investment Company Act of 1940 (the “1940 Act”) as an open-end management investment company. Effective August 1, 2011, The Masters’ Select Funds Trust changed its name to the Litman Gregory Funds Trust. The Trust consists of twelve separate series. The eleven series that are included in this report are: iMGP Global Select Fund, iMGP International Fund, iMGP Oldfield International Value Fund, iMGP SBH Focused Small Value Fund, iMGP Alternative Strategies Fund, iMGP High Income Fund, iMGP Dolan McEniry Corporate Bond Fund, iMGP DBi Managed Futures Strategy ETF, iMGP DBi Hedge Strategy ETF, iMGP RBA Responsible Global Allocation ETF, and iMGP Berkshire Dividend Growth ETF (commenced operations on June 29, 2023). Each Fund, except for iMGP DBi Managed Futures Strategy ETF and iMGP DBi Hedge Strategy ETF, is diversified.
iMGP Global Select Fund (“Global Select Fund”) seeks to increase the value of an investment in the Fund over the long-term by using the combined talents and favorite stock-picking ideas of three highly regarded portfolio managers (each “Managers” or “Sub-Advisors”). The Global Select Fund offers one class of shares: Institutional Class.
iMGP International Fund (“International Fund”) seeks to increase the value of an investment in the Fund over the long-term by using the combined talents and favorite stock-picking ideas of three highly regarded international portfolio managers. The International Fund offers one class of shares: Institutional Class.
iMGP Oldfield International Value Fund (“Oldfield International Value Fund”) seeks long-term growth of capital; that is, the increase in the value of an investment in the Fund over the long-term by using the talents and favorite stock-picking ideas of an experienced, high quality portfolio manager. The Oldfield International Value Fund offers one class of shares: Institutional Class.
iMGP SBH Focused Small Value Fund (“SBH Focused Small Value Fund”) seeks long-term growth of capital; that is, the increase in the value of an investment in the Fund over the long-term by engaging an experienced, high quality portfolio manager with favorite stock-picking ideas that can deliver a portfolio that is prudently diversified in terms of stocks and industries. The SBH Focused Small Value Fund offers one class of shares: Institutional Class.
iMGP Alternative Strategies Fund (“Alternative Strategies Fund”) seeks to achieve long-term returns with lower risk and lower volatility than the stock market, and with relatively low correlation to stock and bond market indexes by using the combined talents and favorite stock and bond market indexes-picking ideas of six highly regarded portfolio managers. A portion of the Alternative Strategies Fund’s assets may be allocated in a wholly-owned subsidiary of the Alternative Strategies Fund, which is organized under the laws of the Cayman Islands, is advised by that Manager, and will comply with the Alternative Strategies Fund’s investment objective and investment policies. The Alternative Strategies Fund offers two classes of shares: Institutional Class and Investor Class shares. The Investor Class shares charge a 0.25% 12b-1 distribution fee to the shareholders of this class (see Note 4).
iMGP High Income Fund (“High Income Fund”) seeks to generate a high level of current income from diverse sources, consistent with capital preservation over time, with capital appreciation a secondary objective, by using the combined talents and favorite stock and bond market indexes-picking ideas of three highly regarded portfolio managers. The High Income Fund offers one class of shares: Institutional Class.
iMGP Dolan McEniry Corporate Bond Fund (“Dolan McEniry Corporate Bond Fund”) seeks to provide investors with total return, with a secondary investment objective of preserving capital by investing in a diversified portfolio of corporate investment grade bonds, corporate high yield bonds, and U.S. Government and Treasury securities maturing within 10 years or less. The Dolan McEniry Corporate Bond Fund offers one class of shares: Institutional Class. Investor Class shares were converted into Institutional Class shares at the close of business on September 30, 2022.
iMGP DBi Managed Futures Strategy ETF (“DBi Managed Futures Strategy ETF”) seeks long term capital appreciation. The DBi Managed Futures Strategy ETF is a non-diversified, actively-managed exchange-traded fund (“ETF”) that seeks to achieve its objective by: (i) investing its assets pursuant to a managed futures strategy; (ii) allocating up to 20% of its total assets in its wholly-owned subsidiary, which is organized under the laws of the Cayman Islands, is advised by the sub-advisor, and will comply with the DBi Managed Futures Strategy ETF’s investment objective and investment policies; and (iii) investing directly in select debt instruments for cash management and other purposes. Shares of the Fund are listed and traded on the New York Stock Exchange Arca.
iMGP DBi Hedge Strategy ETF (“DBi Hedge Strategy ETF”) seeks long-term capital appreciation. The DBi Hedge Strategy ETF is a non-diversified, actively-managed ETF that seeks to achieve its objective by: (i) investing its assets pursuant to an equity hedge strategy and (ii) allocating the remainder of its assets directly in a portfolio of investment grade debt securities to collateralize its derivatives investments, for liquidity purposes, or to enhance yield. Shares of the Fund are listed and traded on the New York Stock Exchange Arca.
iMGP RBA Responsible Global Allocation ETF (“RBA Responsible Global Allocation ETF”) seeks long-term capital appreciation. The RBA Responsible Global Allocation ETF is an active-managed ETF that seeks to achieve its objective by investing its assets in a portfolio of exchange-traded vehicles that provide exposure to asset classes in various regions, countries, and sectors around the globe. Shares of the Fund are listed and traded on the New York Stock Exchange Arca.
| 136 | Litman Gregory Funds Trust | |||||
Table of Contents
Litman Gregory Funds Trust
NOTES TO FINANCIAL STATEMENTS – (Continued)
iMGP Berkshire Dividend Growth ETF (“Berkshire Dividend Growth ETF”) seeks dividend income and long-term capital appreciation. The Berkshire Dividend Growth ETF is an actively-managed exchange-traded fund (“ETF”) that seeks to achieve its objective by investing at least 80% of its net assets, plus borrowings for investment purposes, in dividend-paying equity securities, with an emphasis on stocks that have a strong track record of paying dividends or that are expected to increase their dividends over time. Shares of the Fund are listed and traded on the New York Stock Exchange Arca.
Note 2 – Significant Accounting Policies
The following is a summary of the significant accounting policies followed by the Funds. These policies are in conformity with accounting principles generally accepted in the United States of America (“GAAP”).
| A | Accounting Estimates. The preparation of financial statements in conformity with GAAP requires management to make estimates and assumptions. These estimates and assumptions affect the reported amounts of assets and liabilities and the disclosure of contingent assets and liabilities at the date of financial statements and the reported amounts of increases and decreases in net assets from operations during the reporting period. Actual results could differ from those estimates. |
The Funds are investment companies and accordingly follow the investment company accounting and reporting guidance of the Financial Accounting Standards Board (FASB) Accounting Standards Codification Topic 946 Financial Services—Investment Companies.
| B | Security Valuation. The Funds record their investments at fair value. Fair value is defined as the price that would be received to sell an asset or paid to transfer a liability in an orderly transaction between market participants at the measurement date. The valuation techniques used to determine fair value are further described below. Investments in securities and derivatives traded on a national securities exchange are valued at the last reported sales price at the close of regular trading on each day that the exchanges are open for trading. Securities listed on the NASDAQ Global Market, the NASDAQ Global Select Market and the NASDAQ Capital Market are valued using the NASDAQ Official Closing Price. Securities traded on an exchange for which there have been no sales are valued at the mean between the closing bid and asked prices. Debt securities maturing within 60 days or less are valued at amortized cost unless the Valuation Committee determines that amortized cost does not represent fair value. Securities for which market prices are not readily available or if a security’s value has materially changed after the close of the security’s primary market but before the close of trading on the New York Stock Exchange (“NYSE”), the securities are valued at fair value as determined in good faith by the Managers that selected the security for the Funds’ portfolio and the Trust’s Valuation Committee in accordance with procedures approved by the Board of Trustees (the “Board”). In determining fair value, the Funds take into account all relevant factors and available information. Consequently, the price of the security used by a Fund to calculate its net asset value may differ from quoted or published prices for the same security. Fair value pricing involves subjective judgments and there is no single standard for determining the fair value of a security. As a result, different mutual funds could reasonably arrive at a different value for the same security. For securities that do not trade during NYSE hours, fair value determinations are based on analyses of market movements after the close of those securities’ primary markets, and include reviews of developments in foreign markets, the performance of U.S. securities markets, and the performance of instruments trading in U.S. markets that represent foreign securities and baskets of foreign securities. Pricing services are used to obtain closing market prices and to compute certain fair value adjustments utilizing computerized pricing models. It is possible that the fair value determined for a security is materially different from the value that could be realized upon the sale of that security or from the values that other mutual funds may determine. |
Investments in other funds are valued at their respective net asset values as determined by those funds in accordance with the 1940 Act.
The Funds are required to comply with U.S. Securities and Exchange Commission (“SEC”) regulations that govern valuation practices and the role of a fund’s board with respect to the fair value of the investments of a registered investment company. Rule 2a-5 under the 1940 Act, among other things, establishes an updated regulatory framework for registered investment company fair valuation practices. The Funds’ Board has designated the Advisor as each Fund’s valuation designee to perform fair value functions in accordance with valuation policies and procedures adopted by the Advisor, subject to the Board’s oversight.
Debt securities generally trade in the over-the-counter market rather than on a securities exchange. The Funds’ pricing services use multiple valuation techniques to determine fair value. In instances where sufficient market activity exists, the pricing services may utilize a market-based approach through which quotes from market makers are used to determine fair value. In instances where sufficient market activity may not exist or is limited, the pricing services also utilize proprietary valuation models which may consider market characteristics such as benchmark yield curves, option-adjusted spreads, credit spreads, estimated default rates, coupon rates, anticipated timing of principal repayments, underlying collateral, and other unique security features in order to estimate the relevant cash flows, which are then discounted to calculate the fair value. Securities denominated in a foreign currency are converted into their U.S. dollar equivalent at the foreign exchange rate in effect at the close of the NYSE on the date that the values of the foreign debt securities are determined. Repurchase agreements are valued at cost, which approximates fair value.
| Notes to Financial Statements | 137 | |||||
Table of Contents
Litman Gregory Funds Trust
NOTES TO FINANCIAL STATEMENTS – (Continued)
Certain derivatives trade in the over-the-counter market. The Funds’ pricing services use various techniques including industry standard option pricing models and proprietary discounted cash flow models to determine the fair value of those instruments. The Funds’ net benefit or obligation under the derivative contract, as measured by the fair value of the contract, is included in net assets.
The Funds have procedures to determine the fair value of securities and other financial instruments for which market prices are not readily available or which may not be reliably priced. Under these procedures, the Funds primarily employ a market-based approach which may use related or comparable assets or liabilities, recent transactions, market multiples, book values, and other relevant information for the investment to determine the fair value of the investment. The Funds may also use an income-based valuation approach in which the anticipated future cash flows of the investment are discounted to calculate fair value. Discounts may also be applied due to the nature or duration of any restrictions on the disposition of the investments. Due to the inherent uncertainty of valuations of such investments, the fair values may differ significantly from the values that would have been used had an active market existed.
| C | Consolidation of Subsidiary. The DBi Managed Futures Strategy ETF may invest up to 20% of its total assets in the iMGP DBi Cayman Managed Futures Subsidiary (the “Subsidiary”). The Subsidiary, which is organized under the laws of the Cayman Islands, is wholly- owned and controlled by the DBi Managed Futures Strategy ETF. The financial statements of the DBi Managed Futures Strategy ETF include the operations of the Subsidiary. All intercompany accounts and transactions have been eliminated in consolidation. The Subsidiary acts as an investment vehicle in order to invest in commodity-linked derivative instruments consistent with the Fund’s investment objectives and policies. The DBi Managed Futures Strategy ETF had 19.2% of its total net assets invested in the Subsidiary as of December 31, 2023. |
The Subsidiary is an exempted Cayman Islands investment company and as such is not subject to Cayman Islands taxes at the present time. For U.S. income tax purposes, the Subsidiary is a Controlled Foreign Corporation (“CFC”) not subject to U.S. income taxes. As a wholly-owned CFC, however, the Subsidiary’s net income and capital gains, if any, will be included each year in the Fund’s investment company taxable income.
Consolidation of Subsidiary. The Alternative Strategies Fund may invest a portion of its assets from the enhanced trend strategy in the Alternative Strategy Subsidiary (the “Alternative Subsidiary”), which is organized under the laws of the Cayman Islands, is wholly-owned and controlled by the Alternative Strategies Fund and is advised by the Manager that manages the enhanced trend strategy. The financial statements of the Alternative Strategies Fund include the operations of the Alternative Subsidiary. All intercompany accounts and transactions have been eliminated in consolidation. The Alternative Subsidiary acts as an investment vehicle in order to invest in commodity-linked derivative instruments consistent with the Fund’s investment objectives and policies. The Alternative Strategies Fund had 0.7% of its total net assets invested in the Alternative Subsidiary as of December 31, 2023.
The Alternative Subsidiary is an exempted Cayman Islands investment company and as such is not subject to Cayman Islands taxes at the present time. For U.S. income tax purposes, the Alternative Subsidiary is a Controlled Foreign Corporation (“CFC”) not subject to U.S. income taxes. As a wholly-owned CFC, however, the Alternative Subsidiary’s net income and capital gains, if any, will be included each year in the Fund’s investment company taxable income.
| D | Senior Term Loans. The Alternative Strategies Fund and the High Income Fund may invest in bank debt, which includes interests in loans to companies or their affiliates undertaken to finance a capital restructuring or in connection with recapitalizations, acquisitions, leveraged buyouts, refinancings or other financially leveraged transactions and may include loans which are designed to provide temporary or bridge financing to a borrower pending the sale of identified assets, the arrangement of longer-term loans or the issuance and sale of debt obligations. These loans, which may bear fixed or floating rates, have generally been arranged through private negotiations between a corporate borrower and one or more financial institutions (“Lenders”), including banks. The Alternative Strategies Fund’s and the High Income Fund’s investments may be in the form of participations in loans (“Participations”) or of assignments of all or a portion of loans from third parties (“Assignments”). |
| E | Unfunded Loan Commitments. The Alternative Strategies Fund and the High Income Fund may enter into certain credit agreements, all or a portion of which may be unfunded. The Fund is obligated to fund these commitments at the borrower’s discretion. These commitments, if any, are disclosed in the Schedules of Investments in Securities. |
| F | Short Sales. Each Fund may sell a security it does not own in anticipation of a decline in the fair value of that security. When each Fund sells a security short, it must borrow the security sold short and deliver it to the broker-dealer through which it made the short sale. In addition, cash and certain investments in securities may be used to collateralize the securities sold short. Each day the securities sold short transaction is open, the liability to replace the borrowed security is marked to market and an unrealized gain or loss is recorded. While the transaction remains open, the Fund may also incur expenses for any dividends or interest which will be paid to the lender of the securities as well as a fee to borrow the delivered security. During the term of the short sale, the value of the securities pledged as collateral on short sales is required to exceed the value of the securities sold short. A gain, limited to the price at which each Fund sold the security short, or a loss, unlimited in size, will be recognized upon the termination of a short sale. Each Fund is also subject to the risk that it may be unable to reacquire a security to terminate a short position except at a price substantially in excess of the last quoted price. |
| 138 | Litman Gregory Funds Trust | |||||
Table of Contents
Litman Gregory Funds Trust
NOTES TO FINANCIAL STATEMENTS – (Continued)
| G | Repurchase Agreements. Each Fund may enter into repurchase agreements through which the Fund acquires a security (the “underlying security”) from a seller, a well-established securities dealer or a bank that is a member of the Federal Reserve System. The bank or securities dealer agrees to repurchase the underlying security at the same price, plus a specified amount of interest, at a later date, generally for a period of less than one week. It is the Trust’s policy that its Custodian takes possession of securities as collateral under repurchase agreements and to determine on a daily basis that the value of such securities, including recorded interest, is sufficient to cover the value of the repurchase agreements. The Trust’s policy states that the value of the collateral is at least 102% of the value of the repurchase agreement. If the counterparty defaults and the value of the collateral declines or if bankruptcy proceedings are commenced with respect to the counterparty of the security, realization of the collateral by a Fund may be delayed or limited. At December 31, 2023, the Funds’ ongoing exposure to the economic return on repurchase agreements is shown on the Schedules of Investments in Securities. |
| H | Reverse repurchase agreements. The High Income Fund may enter into reverse repurchase agreements with banks and brokers to enhance return. Under a reverse repurchase agreement a Fund sells portfolio assets subject to an agreement by that Fund to repurchase the same assets at an agreed upon price and date. The Fund can use the proceeds received from entering into a reverse repurchase agreement to make additional investments, which generally causes the Fund’s portfolio to behave as if it were leveraged. If the buyer in a reverse repurchase agreement files for bankruptcy or becomes insolvent, the Fund may be unable to recover the securities it sold and as a result may realize a loss on the transaction if the securities it sold are worth more than the purchase price it originally received from the buyer. Reverse repurchase agreements outstanding at the end of the period, if any, are shown on the Schedules of Investments in Securities. Cash received in exchange for securities transferred, if any, under reverse repurchase agreements are reflected as reverse repurchase agreements on the Statements of Assets and Liabilities. |
| I | Foreign Currency Translation. The Funds’ records are maintained in U.S. dollars. The value of securities, currencies and other assets and liabilities denominated in currencies other than U.S. dollars are translated into U.S. dollars based upon foreign exchange rates prevailing at the end of the reporting period. The currencies are translated into U.S. dollars by using the exchange rates quoted at the close of the London Stock Exchange prior to when each Fund’s net asset value is next determined. Purchases and sales of investment securities, income and expenses are translated on the respective dates of such transactions. |
The Funds do not isolate that portion of their net realized and unrealized gains and losses on investments resulting from changes in foreign exchange rates from the impact arising from changes in market prices. Such fluctuations are included with net realized and unrealized gain or loss from investments.
Net realized foreign currency transaction gains and losses arise from sales of foreign currencies, currency gains or losses realized between the trade and settlement dates on securities transactions, and the differences between the amounts of dividends, interest, and foreign withholding taxes recorded on the Funds’ books and the U.S. dollar equivalent of the amounts actually received or paid. Net unrealized foreign currency transactions gains and losses arise from changes in the value of assets and liabilities, other than investments in securities, resulting from changes in the exchange rates.
| J | Forward Foreign Currency Exchange Contracts. The Funds may utilize forward foreign currency exchange contracts (“forward contracts”) under which they are obligated to exchange currencies on specified future dates at specified rates, and are subject to foreign exchange rates fluctuations. All contracts are “marked-to-market” daily and any resulting unrealized gains or losses are recorded as unrealized appreciation or depreciation on forward foreign currency exchange contracts. The Funds record realized gains or losses at the time the forward contract is settled. These gains and losses are reflected on the Statements of Operations as realized gain (loss) on forward foreign currency exchange contracts. Counterparties to these forward contracts are major U.S. financial institutions (see Note 8). |
| K | Commodity Futures Trading Commission (“CFTC”) Regulation. Because of the nature of their investments, the Alternative Strategies Fund, the DBi Managed Futures Strategy ETF and the DBi Hedge Strategy ETF are subject to regulation under the Commodities Exchange Act, as amended (the “CEA”), as a commodity pool and each of the Advisor and Sub-Adviser is subject to regulation under the CEA as a commodity pool operator (“CPO”), as those terms are defined under the CEA. The Advisor and Sub-Adviser are regulated by the CFTC, the National Futures Association and the SEC and are subject to each regulator’s disclosure requirements. The CFTC has adopted rules that are intended to harmonize certain CEA disclosure requirements with SEC disclosure requirements. |
| L | Futures Contracts. The Alternative Strategies Fund, the High Income Fund, and the DBi Hedge Strategy ETF invest in financial futures contracts primarily for the purpose of hedging their existing portfolio securities, or securities that the Funds intend to purchase, against fluctuations in fair value caused by changes in prevailing market interest rates. The futures contracts in the DBi Managed Futures Strategy ETF are not designated as hedging instruments. The DBi Managed Futures Strategy ETF employs long and short positions in derivatives, primarily futures contracts, across the broad asset classes of equities, fixed income, currencies and, through the Subsidiary, commodities. Upon entering into a financial futures contract, a Fund is required to pledge to the broker an amount of cash, U.S. government securities, or other assets, equal to a certain percentage of the contract amount (initial margin deposit). Subsequent payments, known as variation margin, are made or received by a Fund each day, depending on the daily fluctuations in the fair value of the underlying security. Each Fund recognizes a gain or loss equal to the daily variation margin. If market conditions |
| Notes to Financial Statements | 139 | |||||
Table of Contents
Litman Gregory Funds Trust
NOTES TO FINANCIAL STATEMENTS – (Continued)
| move unexpectedly, a Fund may not achieve the anticipated benefits of the financial futures contracts and may realize a loss. The use of futures transactions involves the risk of imperfect correlation in movements in the price of futures contracts, interest rates, and the underlying hedged assets (see Note 8). |
| M | Interest Rate Swaps. During the year ended December 31, 2023, the High Income Fund invested in interest rate swaps. An interest rate swap is an agreement that obligates two parties to exchange a series of cash flows at specified intervals, based upon or calculated by reference to changes in interest rates on a specified notional principal amount. The payment flows are usually netted against each other, with the difference being paid by one party to the other. Bilateral swap contracts are agreements in which a Fund and a counterparty agree to exchange periodic payments on a specified notional amount or make a net payment upon termination. Bilateral swap transactions are privately negotiated in the Over the counter (“OTC”) market and payments are settled through direct payments between a Fund and the counterparty. By contrast, certain swap transactions are subject to mandatory central clearing. These swaps are executed through a derivatives clearing member (“DCM”), acting in an agency capacity, and submitted to a central counterparty (“CCP”) (“centrally cleared swaps”), in which case all payments are settled with the CCP through the DCM. Swaps are marked-to-market daily using pricing vendor quotations, counterparty or clearinghouse prices or model prices, and the change in value, if any, is recorded as an unrealized gain or loss. Upon entering into a swap contract, a Fund is required to satisfy an initial margin requirement by delivering cash or securities to the counterparty (or in some cases, segregated in a triparty account on behalf of the counterparty), which can be adjusted by any mark-to-market gains or losses pursuant to bilateral or centrally cleared arrangements. For centrally cleared swaps the daily change in valuation, and upfront payments, if any, are recorded as a receivable or payable for variation margin on the Statements of Assets and Liabilities (see Note 8). |
| N | Credit Default Swaps. During the year ended December 31, 2023, the Alternative Strategies Fund and the High Income Fund entered into credit default swaps to manage their exposure to the market or certain sectors of the market, to reduce their risk exposure to defaults of corporate issuers or indexes or to create exposure to corporate issuers or indexes to which they are not otherwise exposed. In a credit default swap, the protection buyer makes a stream of payments based on a fixed percentage applied to the contract notional amount to the protection seller in exchange for the right to receive a specified return upon the occurrence of a defined credit event on the reference obligation which may be either a single security or a basket of securities issued by corporate or sovereign issuers. Although contract-specific, credit events are generally defined as bankruptcy, failure to pay, restructuring, obligation acceleration, obligation default, or repudiation/moratorium. Upon the occurrence of a defined credit event, the difference between the value of the reference obligation and the swap’s notional amount is recorded as realized gain (for protection written) or loss (for protection sold) in the Statements of Operations. In the case of credit default swaps where a Fund is selling protection, the notional amount approximates the maximum loss. For centrally cleared swaps the daily change in valuation, and upfront payments, if any, are recorded as a receivable or payable for variation margin on the Statements of Assets and Liabilities (see Note 8). |
| O | Total Return Swaps. During the year ended December 31, 2023, the Alternative Strategies Fund and the High Income Fund invested in total return swaps. Total return swap is the generic name for any non-traditional swap where one party agrees to pay the other the “total return” of a defined underlying asset, usually in return for receiving a stream of Secured Overnight Financing Rate (“SOFR”) and Federal Fund Rate (“FEDL01”) based cash flows. A total return swap may be applied to any underlying asset but is most commonly used with equity indices, single stocks, bonds and defined portfolios of loans and mortgages. Total return swap is a mechanism for the user to accept the economic benefits of asset ownership without utilizing the Statement of Assets and Liabilities. The other leg of the swap, usually SOFR or FEDL01, is a spread to reflect the non-Statement of Assets and Liabilities nature of the product. No notional amounts are exchanged with total return swaps. The total return receiver assumes the entire economic exposure – that is, both market and credit exposure – to the reference asset. The total return payer – often the owner of the reference obligation – gives up economic exposure to the performance of the reference asset and in return takes on counterparty credit exposure to the total return receiver in the event of a default or fall in value of the reference asset (see Note 8). |
| P | Purchasing Put and Call Options. Each Fund may purchase covered “put” and “call” options with respect to securities which are otherwise eligible for purchase by a Fund and with respect to various stock indices subject to certain restrictions. Each Fund will engage in trading of such derivative securities primarily for hedging purposes. |
If a Fund purchases a put option, a Fund acquires the right to sell the underlying security at a specified price at any time during the term of the option (for “American-style” options) or on the option expiration date (for “European-style” options). Purchasing put options may be used as a portfolio investment strategy when a portfolio manager perceives significant short-term risk but substantial long-term appreciation for the underlying security. The put option acts as an insurance policy, as it protects against significant downward price movement while it allows full participation in any upward movement. If a Fund is holding a stock which it feels has strong fundamentals, but for some reason may be weak in the near term, a Fund may purchase a put option on such security, thereby giving itself the right to sell such security at a certain strike price throughout the term of the option. Consequently, a Fund will exercise the put only if the price of such security falls below the strike price of the put. The difference between the put’s strike price and the market price of the underlying security on the date a Fund exercises the put, less transaction costs, will be the amount by which a Fund will be able to hedge against a decline in the underlying security. If during the period of the option the market price for the underlying security remains at or above the put’s strike price, the put will expire worthless, representing a loss of the price a Fund paid for the put,
| 140 | Litman Gregory Funds Trust | |||||
Table of Contents
Litman Gregory Funds Trust
NOTES TO FINANCIAL STATEMENTS – (Continued)
plus transaction costs. If the price of the underlying security increases, the profit a Fund realizes on the sale of the security will be reduced by the premium paid for the put option less any amount for which the put may be sold.
If a Fund purchases a call option, it acquires the right to purchase the underlying security at a specified price at any time during the term of the option. The purchase of a call option is a type of insurance policy to hedge against losses that could occur if a Fund has a short position in the underlying security and the security thereafter increases in price. Each Fund will exercise a call option only if the price of the underlying security is above the strike price at the time of exercise. If during the option period the market price for the underlying security remains at or below the strike price of the call option, the option will expire worthless, representing a loss of the price paid for the option, plus transaction costs. If the call option has been purchased to hedge a short position of a Fund in the underlying security and the price of the underlying security thereafter falls, the profit a Fund realizes on the cover of the short position in the security will be reduced by the premium paid for the call option less any amount for which such option may be sold.
Prior to exercise or expiration, an option may be sold when it has remaining value by a purchaser through a “closing sale transaction,” which is accomplished by selling an option of the same series as the option previously purchased. Each Fund generally will purchase only those options for which a Manager believes there is an active secondary market to facilitate closing transactions (see Note 8).
Writing Call Options. Each Fund may write covered call options. A call option is “covered” if a Fund owns the security underlying the call or has an absolute right to acquire the security without additional cash consideration (or, if additional cash consideration is required, cash or cash equivalents in such amount as are held in a segregated account by the Custodian). The writer of a call option receives a premium and gives the purchaser the right to buy the security underlying the option at the exercise price. The writer has the obligation upon exercise of the option to deliver the underlying security against payment of the exercise price during the option period. If the writer of an exchange-traded option wishes to terminate his obligation, he may effect a “closing purchase transaction.” This is accomplished by buying an option of the same series as the option previously written. A writer may not effect a closing purchase transaction after it has been notified of the exercise of an option.
Effecting a closing transaction in the case of a written call option will permit a Fund to write another call option on the underlying security with either a different exercise price, expiration date or both. Also, effecting a closing transaction will permit the cash or proceeds from the concurrent sale of any securities subject to the option to be used for other investments of a Fund. If a Fund desires to sell a particular security from its portfolio on which it has written a call option, it will effect a closing transaction prior to or concurrent with the sale of the security.
Each Fund will realize a gain from a closing transaction if the cost of the closing transaction is less than the premium received from writing the option or if the proceeds from the closing transaction are more than the premium paid to purchase the option. Each Fund will realize a loss from a closing transaction if the cost of the closing transaction is more than the premium received from writing the option or if the proceeds from the closing transaction are less than the premium paid to purchase the option. However, because increases in the market price of a call option will generally reflect increases in the market price of the underlying security, any loss to a Fund resulting from the repurchase of a call option is likely to be offset in whole or in part by appreciation of the underlying security owned by a Fund (see Note 8).
Writing Put Options. Each Fund may write put options. By writing put options, the Fund takes on the risk of declines in the value of the underlying instrument, including the possibility of a loss up to the entire strike price of each option it sells, but without the corresponding opportunity to benefit from potential increases in the value of the underlying instrument. When the Fund writes a put option, it assumes the risk that it must purchase the underlying instrument at a strike price that may be higher than the market price of the instrument. If there is a broad market decline and the Fund is able to close out its written put options, it may result in substantial losses to the Fund (see Note 8).
Risks of Investing in Options. There are several risks associated with transactions in options on securities. Options may be more volatile than the underlying instruments and, therefore, on a percentage basis, an investment in options may be subject to greater fluctuation than an investment in the underlying instruments themselves. There are also significant differences between the securities and options markets that could result in an imperfect correlation between these markets, causing a given transaction not to achieve its objective. In addition, a liquid secondary market for particular options may be absent for reasons which include the following: there may be insufficient trading interest in certain options; restrictions may be imposed by an exchange on opening transactions or closing transactions or both; trading halts, suspensions or other restrictions may be imposed with respect to particular classes or series of option of underlying securities; unusual or unforeseen circumstances may interrupt normal operations on an exchange; the facilities of an exchange or clearing corporation may not at all times be adequate to handle current trading volume; or one or more exchanges could, for economic or other reasons, decide or be compelled at some future date to discontinue the trading of options (or a particular class or series of options), in which event the secondary market on that exchange (or in that class or series of options) would cease to exist, although outstanding options that had been issued by a clearing corporation as a result of trades on that exchange would continue to be exercisable in accordance with their terms.
A decision as to whether, when and how to use options involves the exercise of skill and judgment, and even a well-conceived transaction may be unsuccessful to some degree because of market behavior or unexpected events. The extent to which a Fund may
| Notes to Financial Statements | 141 | |||||
Table of Contents
Litman Gregory Funds Trust
NOTES TO FINANCIAL STATEMENTS – (Continued)
enter into options transactions may be limited by the requirements of the Internal Revenue Code of 1986, as amended (the “Code”), with respect to qualification of a Fund as a regulated investment company.
| Q | Distributions to Shareholders. Distributions paid to shareholders are recorded on the ex-dividend date. Net realized gains from securities transactions (if any) are generally distributed annually to shareholders. The amount of dividends and distributions from net investment income and net realized capital gains is determined in accordance with federal income tax regulations, which may differ from generally accepted accounting principles. To the extent these “book/tax” differences are permanent in nature (i.e., that they result from other than timing of recognition – “temporary differences”), such amounts are reclassified within the capital accounts based on their federal tax-basis. |
| R | Income Taxes. The Funds intend to comply with the requirements of Subchapter M of the Code applicable to regulated investment companies and to distribute all of their taxable income to their shareholders. Accordingly, no provisions for federal income taxes are required. The Funds have reviewed the tax positions, taken on federal income tax returns, for each of the three open tax years (as applicable) and as of December 31, 2023, and have determined that no provision for income tax is required in the Funds’ financial statements. The Funds recognize interest and penalties, if any, related to unrecognized tax benefits as income tax expenses in the Statements of Operations. During the year ended December 31, 2023, the Funds did not incur any interest or penalties. Foreign securities held by the Funds may be subject to foreign taxation on dividend and interest income received. Foreign taxes, if any, net of any reclaims, are recorded based on the tax regulations and rates that exist in the foreign markets in which the Funds’ invest. |
Taxes on foreign interest and dividend income are generally withheld in accordance with the applicable country’s tax treaty with the United States. The foreign withholding rates applicable to a Fund’s investments in certain jurisdictions may be higher if a significant portion of the Fund is held by non-U.S. shareholders. Each Fund may be subject to taxation on realized capital gains, repatriation proceeds and other transaction-based charges imposed by certain countries in which it invests. Taxes related to capital gains realized during the year ended December 31, 2023, if any, are reflected as part of net realized gain (loss) in the Statements of Operations.
Changes in tax liabilities related to capital gain taxes on unrealized investment gains, if any, are reflected as part of change in net unrealized appreciation (depreciation) in the Statements of Operations. Transaction-based charges are generally calculated as a percentage of the transaction amount.
The Funds may have previously filed for and/or may file for additional tax refunds with respect to certain taxes withheld by certain countries. Generally, the amount of such refunds that a Fund reasonably determines are collectible and free from significant contingencies are reflected in a Fund’s net asset value and are reflected as foreign tax reclaims receivable in the Statements of Assets and Liabilities. In certain circumstances, a Fund’s receipt of such refunds may cause the Fund and/or its shareholders to be liable for U.S. federal income taxes and interest charges.
Foreign taxes paid by each Fund may be treated, to the extent permissible by the Code (and other applicable U.S. federal tax guidance) and if that Fund so elects, as if paid by U.S. shareholders of that Fund.
| S | Security Transactions, Dividend and Interest Income and Expenses. Security transactions are accounted for on the trade date. Realized gains and losses on securities transactions are reported on an identified cost basis. Dividend income and, where applicable, related foreign tax withholding expenses are recorded on the ex-dividend date. Interest income is recorded on an accrual basis. Purchase discounts and premiums on fixed-income securities are accreted and amortized to maturity using the effective interest method and reflected within interest income on the Statements of Operations. Paydown gains and losses on mortgage-related and other asset-backed securities, if any, are recorded as components of interest income in the Statements of Operations. Many expenses of the Trust can be directly attributed to a specific Fund. Each Fund is charged for expenses directly attributed to it. Expenses that cannot be directly attributed to a specific Fund are allocated among the Funds in the Trust in proportion to their respective net assets or other appropriate method. Realized and unrealized gains and losses and net investment income, not including class specific expenses, are allocated daily to each class of shares based upon the relative proportion of net assets of each class. Differences in per share distributions by class are generally due to differences in class specific expenses. Class specific expenses, such as 12b-1 expenses, are directly attributed to that specific class. |
| T | Restricted Cash. At December 31, 2023, the Alternative Strategies Fund, the High Income Fund, the DBi Managed Futures Strategy ETF, and the DBi Hedge Strategy ETF held restricted cash in connection with investments in certain derivative securities. Restricted cash is held in a segregated account with the Funds’ Custodian as well as with brokers and is reflected in the Statements of Assets and Liabilities as deposits at brokers for securities sold short, futures, options, and swaps. Restrictions may include legally restricted deposits held as compensating balances against short-term borrowing arrangements or contracts entered into with others. |
The Funds consider their investment in an Federal Deposits Insurance Corporation (“FDIC”) insured interest bearing savings account to be cash. The Funds maintain cash balances, which, at times, may exceed federally insured limits. The Funds maintain these balances with a high quality financial institution.
| U | Restricted Securities. A restricted security cannot be resold to the general public without prior registration under the Securities Act of 1933. If the security is subsequently registered and resold, the issuers would typically bear the expense of all registrations at no cost to |
| 142 | Litman Gregory Funds Trust | |||||
Table of Contents
Litman Gregory Funds Trust
NOTES TO FINANCIAL STATEMENTS – (Continued)
| the Fund. Restricted securities are valued according to the guidelines and procedures adopted by the Funds’ Board of Trustees. As of December 31, 2023, there were no restricted securities held in the Funds. |
| V | Illiquid Securities. Each Fund may not invest more than 15% of the value of its net assets in illiquid securities, including restricted securities that are not deemed to be liquid by the Sub-Advisors. The Advisor and the Sub-Advisors will monitor the amount of illiquid securities in a Fund’s portfolio, under the supervision of the Board, to ensure compliance with a Fund’s investment restrictions. In accordance with procedures approved by the Board, these securities may be valued using techniques other than market quotations, and the values established for these securities may be different than what would be produced through the use of another methodology or if they had been priced using market quotations. Illiquid securities and other portfolio securities that are valued using techniques other than market quotations, including “fair valued” securities, may be subject to greater fluctuation in their value from one day to the next than would be the case if market quotations were used. In addition, there is no assurance that a Fund could sell a portfolio security for the value established for it at any time, and it is possible that a Fund would incur a loss because a portfolio security is sold at a discount to its established value. |
| W | Indemnification Obligations. Under the Trust’s organizational documents, its current and former officers and trustees are indemnified against certain liabilities arising out of the performance of their duties to the Funds. In addition, in the normal course of business, the Funds enter into contracts that contain a variety of representations and warranties that provide general indemnifications. The Funds’ maximum exposure under these arrangements is unknown as this would involve future claims that may be made against the Funds that have not yet occurred or that would be covered by other parties. |
Note 3 – Investment Advisory and Other Agreements
The Trust, on behalf of the Funds, entered into an Investment Advisory Agreement (the “Agreement”) with Litman Gregory Fund Advisors, LLC. Effective October 1, 2021, Litman Gregory Fund Advisors, LLC has changed its name to iM Global Partner Fund Management, LLC (the “Advisor”) and also subsequently referred to as “iM Global”. Under the terms of the Agreement, each Fund pays a monthly investment advisory fee to the Advisor at the annual rate below of the respective Fund’s average daily net assets before any fee waivers:
| Contractual Management Rate | ||||||||||||||||||||||||||||||||||||||||||||
| Fund | First $450 million | Excess of $450 million | First $750 million | Excess of $750 million | First $1 billion | Excess of $1 billion | Between $1 and $2 billion | First $2 billion | Between $2 and $3 billion | Between $3 and $4 billion | Excess of $4 billion | |||||||||||||||||||||||||||||||||
Global Select | — | — | 1.10 | % | 1.00 | % | — | — | — | — | — | — | — | |||||||||||||||||||||||||||||||
International | — | — | — | — | 1.10 | % | 1.00 | % | — | — | — | — | — | |||||||||||||||||||||||||||||||
Oldfield International Value | 0.70 | % | 0.70 | % | — | — | — | — | — | — | — | — | — | |||||||||||||||||||||||||||||||
SBH Focused Small Value | 1.00 | % | 1.00 | % | — | — | — | — | — | — | — | — | — | |||||||||||||||||||||||||||||||
Alternative Strategies | — | — | — | — | — | — | — | 1.40 | % | 1.30 | % | 1.25 | % | 1.20 | % | |||||||||||||||||||||||||||||
High Income | — | — | — | — | 0.95 | % | — | 0.925 | % | — | 0.90 | % | 0.875 | % | 0.85 | % | ||||||||||||||||||||||||||||
Dolan McEniry Corporate Bond | 0.50 | % | 0.50 | % | — | — | — | — | — | — | — | — | — | |||||||||||||||||||||||||||||||
DBi Managed Futures Strategy ETF | 0.85 | % | 0.85 | % | — | — | — | — | — | — | — | — | — | |||||||||||||||||||||||||||||||
DBi Hedge Strategy ETF | 0.85 | % | 0.85 | % | ||||||||||||||||||||||||||||||||||||||||
RBA Responsible Global Allocation ETF | 0.55 | % | 0.55 | % | ||||||||||||||||||||||||||||||||||||||||
Berkshire Dividend Growth ETF | 0.55 | % | 0.55 | % | — | — | — | — | — | — | — | — | — | |||||||||||||||||||||||||||||||
The Advisor engages sub-advisors to manage the Funds and pays the sub-advisors from its advisory fees.
Through April 30, 2025, the Advisor has contractually agreed to waive a portion of its advisory fees effectively reducing total advisory fees to approximately 0.82% of the average daily net assets of the Global Select Fund, 0.88% of the average daily net assets of the International Fund, 1.14% of the average daily net assets of the Alternative Strategies Fund, and 0.80% of the average daily net assets of the High Income Fund. Additionally, the Advisor has voluntarily agreed to waive its management fee on the daily cash values of the Funds not allocated to Managers. For the year ended December 31, 2023, the amount waived, contractual and voluntary, was $335,846, $499,400, $2,252,960, and $132,382 for Global Select Fund, International Fund, Alternative Strategies Fund, and High Income Fund, respectively. The Advisor has agreed not to seek recoupment of such waived fees. Through April 30, 2025, the Advisor has contractually agreed to waive a portion of its advisory fees and/or reimburse a portion of the Global Select Fund, and the High Income Fund’s operating expenses (excluding any taxes, interest, brokerage commissions, expenses incurred in connection with any merger or reorganization, borrowing costs, (including
| Notes to Financial Statements | 143 | |||||
Table of Contents
Litman Gregory Funds Trust
NOTES TO FINANCIAL STATEMENTS – (Continued)
commitment fees), dividend expenses, acquired fund fees and expenses and extraordinary expenses such as but not limited to litigation costs) to ensure that the total annual fund operating expenses after fee waiver and/or expense reimbursement for the Institutional Class will not exceed 0.98%, and 0.98% of the average daily net assets, respectively. In addition, through April 30, 2025, the Advisor has contractually agreed to waive a portion of its advisory fees and/or reimburse a portion of the Oldfield International Value Fund, the SBH Focused Small Value Fund, and the Dolan McEniry Corporate Bond Fund’s operating expenses (excluding any taxes, interest, brokerage commissions, expenses incurred in connection with any merger or reorganization, borrowing costs, (including commitment fees), dividend expenses, acquired fund fees and expenses and extraordinary expenses such as but not limited to litigation costs) to ensure that the total annual fund operating expenses after fee waiver and/or expense reimbursement for the Institutional Class will not exceed 0.94%, 1.15%, and 0.70% of the average daily net assets, respectively. During the year ended December 31, 2023, the amount waived contractually pursuant to an Expense Limitation Agreement was $205,543, $302,304, $142,421, $140,343, and $190,175 for the Global Select Fund, High Income Fund, Oldfield International Value Fund, SBH Focused Small Value Fund, and Dolan McEniry Corporate Bond Fund, respectively. The Advisor may be reimbursed by each Fund no later than the end of the third fiscal year following the year of the waiver provided that such reimbursement does not cause each Fund’s expenses to exceed the expense limitation. The Advisor is waiving its right to recoup these fees and any fees waived in prior years.
State Street Bank and Trust Company (“State Street”) serves as the Administrator, Custodian and Fund Accountant to the Funds.
State Street also serves as the Transfer Agent for DBi Managed Futures Strategy ETF, DBi Hedge Strategy ETF, RBA Responsible Global Allocation ETF, and Berkshire Dividend Growth ETF . SS&C Global Investor & Distribution Solutions, Inc. serves as Transfer Agent for the other Funds. The Funds’ principal underwriter is ALPS Distributors, Inc.
An employee of the Advisor serves as the Funds’ Chief Compliance Officer (“CCO”). The CCO receives no compensation from the Funds for his services, however, the Funds reimbursed the Advisor $150,000 for the year ended December 31, 2023 for the services of the CCO.
Loomis Sayles & Company, L.P. used their respective affiliated entity for purchases of the Alternative Strategies Fund’s portfolio securities for the year ended December 31, 2023. There was no commissions paid for these transactions.
During the year ended December 31, 2023, each independent Trustee, within the meaning of the 1940 Act, was compensated by the Trust in the amount of $125,000. The Chairperson of the Board was compensated in the amount of $137,500.
Certain officers and Trustees of the Trust are also officers of the Advisor.
Note 4 – Distribution Plan
Certain Funds have adopted a Plan of Distribution (the “Plan”) dated February 25, 2009, as amended, pursuant to Rule 12b-1 under the 1940 Act. Under the Plan, the Investor Classes of the Alternative Strategies Fund will compensate broker dealers or qualified institutions with whom the Fund has entered into a contract to distribute Fund shares (“Dealers”). Under the Plan, the amount of such compensation paid in any one year shall not exceed 0.25% annually of the average daily net assets of the Investor Classes, which may be payable as a service fee for providing recordkeeping, subaccounting, subtransfer agency and/or shareholder liaison services. For the year ended December 31, 2023, the Alternative Strategies Fund’s Investor Class incurred $85,040 pursuant to the Plan.
The Plan will remain in effect from year to year provided such continuance is approved at least annually by a vote either of a majority of the Trustees, including a majority of the non-interested Trustees, or a majority of each Fund’s outstanding shares.
The DBi Hedge Strategy ETF, DBi Managed Futures Strategy ETF, RBA Responsible Global Allocation ETF, and Berkshire Dividend Growth ETF issue and redeem Shares at Net Asset Value (“NAV”) only in Creation Units. Only Authorized Participants (“APs”) may acquire Shares directly from the Funds, and only APs may tender their Shares for redemption directly to the Funds, at NAV. APs must be a member or participant of a clearing agency registered with the SEC and must execute a Participant Agreement that has been agreed to by the Distributor, and that has been accepted by the Transfer Agent, with respect to purchases and redemptions of Creation Units. Once created, Shares trade in the secondary market in quantities less than a Creation Unit.
Individual Shares may be purchased and sold only on a national securities exchange through brokers. Shares will be listed for trading on NYSE Arca and because the Shares will trade at market prices rather than NAV, Shares may trade at prices greater than NAV (at a premium), at NAV, or less than NAV (at a discount).
| 144 | Litman Gregory Funds Trust | |||||
Table of Contents
Litman Gregory Funds Trust
NOTES TO FINANCIAL STATEMENTS – (Continued)
Note 5 – Investment Transactions
The cost of securities purchased and the proceeds from securities sold for the year ended December 31, 2023, excluding short-term investments and in-kind transactions were as follows:
| Fund | U.S. Gov’t Securities Purchases | Other Purchases | U.S. Gov’t Securities Sales | Other Sales | ||||||||||||
Global Select Fund | $ | — | $ | 64,513,664 | $ | — | $ | 89,797,010 | ||||||||
International Fund | — | 84,538,834 | — | 97,670,496 | ||||||||||||
Oldfield International Value Fund | — | 9,515,781 | — | 10,907,987 | ||||||||||||
SBH Focused Small Value Fund | — | 27,152,365 | — | 33,245,729 | ||||||||||||
Alternative Strategies Fund | 112,598,416 | 537,381,303 | 110,137,959 | 727,902,009 | ||||||||||||
High Income Fund | 10,556,317 | 20,816,017 | 20,550,787 | 31,905,446 | ||||||||||||
Dolan McEniry Corporate Bond Fund | 7,952,936 | 111,937,323 | 7,952,478 | 21,454,478 | ||||||||||||
DBi Manage Futures Strategy ETF | — | — | — | — | ||||||||||||
DBi Hedge Strategy ETF | — | — | — | — | ||||||||||||
RBA Responsible Global Allocation ETF | — | 3,371,272 | — | 3,330,278 | ||||||||||||
Berkshire Dividend Growth ETF | — | 9,866 | — | 224 | ||||||||||||
Securities received and delivered in-kind through subscriptions and redemptions are noted in the table below:
| Fund | In-Kind Subscriptions | In-Kind Redemptions | ||||||
RBA Responsible Global Allocation ETF | $ | — | $ | 2,092,294 | ||||
Berkshire Dividend Growth ETF | 1,218,793 | — | ||||||
During the year ended December 31, 2023, there were several purchase transactions made in accordance with the established procedures pursuant to Rule 17a-7 (the exemption of certain purchase or sale transactions between an investment company and certain affiliated persons thereof), arranged by Dolan McEniry Capital Management, LLC, on behalf of the Dolan McEniry Corporate Bond Fund. The total of such purchase transactions were $2,761,704.
Note 6 – Fair Value of Financial Investments
The Funds follow a fair value hierarchy that distinguishes between market data obtained from independent sources (observable inputs) and the Funds’ own market assumptions (unobservable inputs). These inputs are used in determining the value of each Fund’s investments and are summarized in the following fair value hierarchy:
| Level 1 – | Quoted prices in active markets for identical securities. |
| Level 2 – | Other significant observable inputs (including quoted prices for similar securities, interest rates, foreign exchange rates, and fair value estimates for foreign securities indices). |
| Level 3 – | Significant unobservable inputs (including the Funds’ own assumptions in determining fair value of investments). |
Fixed income securities including corporate, convertible and municipal bonds and notes, U.S. government agencies, U.S. Treasury obligations, U.S. Treasury inflation protected securities, sovereign issues, bank loans, convertible preferred securities and non-U.S. bonds are normally valued on the basis of quotes obtained from brokers and dealers or independent pricing services or sources. Independent pricing services typically use information provided by market makers or estimates of market values obtained from yield data relating to investments or securities with similar characteristics. The service providers’ internal models use inputs that are observable such as, among other things, issuer details, interest rates, yield curves, prepayment speeds, credit risks/spreads, default rates and quoted prices for similar assets. Securities that use similar valuation techniques and inputs as described above are categorized as Level 2 of the fair value hierarchy.
Fixed income securities purchased on a delayed-delivery basis are typically marked to market daily until settlement at the forward settlement date.
Mortgage and asset-backed securities are usually issued as separate tranches, or classes, of securities within each deal. These securities are also normally valued by pricing service providers that use broker dealer quotations or valuation estimates from their internal pricing models. The pricing models for these securities usually consider tranche-level attributes, estimated cash flows and market-based yield spreads for each tranche, current market data and incorporates deal collateral performance, as available.
| Notes to Financial Statements | 145 | |||||
Table of Contents
Litman Gregory Funds Trust
NOTES TO FINANCIAL STATEMENTS – (Continued)
Stripped mortgage-backed securities are usually structured with two different classes: one that receives substantially all interest payments (interest-only, or “IO” and/or high coupon rate with relatively low principal amount, or “IOette”), and the other that receives substantially all principal payments (principal-only, or “PO”) from a pool of mortgage loans. Little to no principal will be received at the maturity of an IO; as a result, periodic adjustments are recorded to reduce the cost of the security until maturity. These adjustments are included in interest income.
Mortgage and asset-backed securities that use similar valuation techniques and inputs as described above are categorized as Level 2 of the fair value hierarchy.
Repurchase agreements and reverse repurchase agreements are short-term investments, they are fair valued approximately at their principal amounts. Repurchase agreements and reverse repurchase agreements are categorized as Level 2 of the fair value hierarchy.
Financial derivative instruments, such as forward foreign currency contracts, options contracts, futures, or swap agreements, derive their value from underlying asset prices, indices, reference rates, and other inputs or a combination of these factors. These contracts are normally valued on the basis of broker dealer quotations or pricing service providers at the settlement price determined by the relevant exchange. Depending on the product and the terms of the transaction, the value of the derivative contracts can be estimated by a pricing service provider using a series of techniques, including simulation pricing models. The pricing models use inputs that are observed from actively quoted markets such as issuer details, indices, spreads, interest rates, curves, dividends and exchange rates. Derivatives that use similar valuation techniques and inputs as described above are categorized as Level 1 or Level 2 of the fair value hierarchy.
The following tables provide the fair value measurements of applicable Fund assets and liabilities by level within the fair value hierarchy for each Fund as of December 31, 2023. These assets and liabilities are measured on a recurring basis.
Global Select Fund
| Description | Level 1 - Quoted prices in active markets for identical assets | Level 2 - Significant other observable inputs | Level 3 - Significant unobservable inputs | Total | ||||||||||||
Equity(a) | ||||||||||||||||
Common Stocks | $ | 110,404,865 | $ | — | $ | — | $ | 110,404,865 | ||||||||
Preferred Stock | 2,801,541 | — | — | 2,801,541 | ||||||||||||
|
| |||||||||||||||
Total Equity | 113,206,406 | — | — | 113,206,406 | ||||||||||||
|
| |||||||||||||||
Short-Term Investments | ||||||||||||||||
Repurchase Agreements | — | 4,034,971 | — | 4,034,971 | ||||||||||||
|
| |||||||||||||||
Total Investments in Securities | $ | 113,206,406 | $ | 4,034,971 | $ | — | $ | 117,241,377 | ||||||||
|
| |||||||||||||||
| (a) | See Fund’s Schedule of Investments in Securities for sector classifications. |
| 146 | Litman Gregory Funds Trust | |||||
Table of Contents
Litman Gregory Funds Trust
NOTES TO FINANCIAL STATEMENTS – (Continued)
International Fund
| Description | Level 1 - Quoted prices in active markets for identical assets | Level 2 - Significant other observable inputs | Level 3 - Significant unobservable inputs | Total | ||||||||||||
Equity | ||||||||||||||||
Common Stocks | ||||||||||||||||
Argentina | $ | 3,367,810 | $ | — | $ | — | $ | 3,367,810 | ||||||||
Australia | 2,678,282 | — | — | 2,678,282 | ||||||||||||
Canada | 6,065,729 | — | — | 6,065,729 | ||||||||||||
China | 3,510,010 | — | — | 3,510,010 | ||||||||||||
Denmark | 8,092,475 | — | — | 8,092,475 | ||||||||||||
Finland | 5,802,940 | — | — | 5,802,940 | ||||||||||||
France | 19,389,268 | — | — | 19,389,268 | ||||||||||||
Germany | 54,389,448 | — | — | 54,389,448 | ||||||||||||
Ireland | 23,807,462 | — | — | 23,807,462 | ||||||||||||
Israel | 5,460,540 | — | — | 5,460,540 | ||||||||||||
Japan | 6,477,055 | — | — | 6,477,055 | ||||||||||||
Netherlands | 5,359,529 | — | — | 5,359,529 | ||||||||||||
South Korea | 2,788,912 | — | — | 2,788,912 | ||||||||||||
Spain | 5,401,057 | — | — | 5,401,057 | ||||||||||||
Sweden | 6,122,944 | — | — | 6,122,944 | ||||||||||||
Switzerland | 4,622,439 | — | — | 4,622,439 | ||||||||||||
Taiwan | 4,811,163 | — | — | 4,811,163 | ||||||||||||
United Kingdom | 29,275,435 | — | — | 29,275,435 | ||||||||||||
United States | 11,502,872 | — | — | 11,502,872 | ||||||||||||
|
| |||||||||||||||
Total Equity | 208,925,370 | — | — | 208,925,370 | ||||||||||||
|
| |||||||||||||||
Short-Term Investments | ||||||||||||||||
Repurchase Agreements | — | 13,139,674 | — | 13,139,674 | ||||||||||||
|
| |||||||||||||||
Total Short-Term Investments | — | 13,139,674 | — | 13,139,674 | ||||||||||||
|
| |||||||||||||||
Total Investments in Securities | $ | 208,925,370 | $ | 13,139,674 | $ | — | $ | 222,065,044 | ||||||||
|
| |||||||||||||||
| Notes to Financial Statements | 147 | |||||
Table of Contents
Litman Gregory Funds Trust
NOTES TO FINANCIAL STATEMENTS – (Continued)
Oldfield International Value Fund
| Description | Level 1 - Quoted prices in active markets for identical assets | Level 2 - Significant other observable inputs | Level 3 - Significant unobservable inputs | Total | ||||||||||||
Equity | ||||||||||||||||
Common Stocks | ||||||||||||||||
Brazil | $ | 1,642,050 | $ | — | $ | — | $ | 1,642,050 | ||||||||
China | 2,827,600 | — | — | 2,827,600 | ||||||||||||
France | 3,205,276 | — | — | 3,205,276 | ||||||||||||
Germany | 6,575,460 | — | — | 6,575,460 | ||||||||||||
Italy | 1,772,021 | — | — | 1,772,021 | ||||||||||||
Japan | 1,067,290 | — | — | 1,067,290 | ||||||||||||
Netherlands | 3,441,349 | — | — | 3,441,349 | ||||||||||||
South Korea | 3,868,149 | — | — | 3,868,149 | ||||||||||||
Sweden | 2,291,612 | — | — | 2,291,612 | ||||||||||||
United Kingdom | 6,866,557 | — | — | 6,866,557 | ||||||||||||
Preferred Stock | ||||||||||||||||
Germany | 1,762,192 | — | — | 1,762,192 | ||||||||||||
|
|
|
|
|
|
|
| |||||||||
Total Equity | 35,319,556 | — | — | 35,319,556 | ||||||||||||
|
|
|
|
|
|
|
| |||||||||
Total Investments in Securities | $ | 35,319,556 | $ | — | $ | — | $ | 35,319,556 | ||||||||
|
| |||||||||||||||
SBH Focused Small Value Fund
| Description | Level 1 - Quoted prices in active markets for identical assets | Level 2 - Significant other observable inputs | Level 3 - Significant unobservable inputs | Total | ||||||||||||
Equity(a) | ||||||||||||||||
Common Stocks | $ | 52,478,369 | $ | — | $ | — | $ | 52,478,369 | ||||||||
|
| |||||||||||||||
Total Equity | 52,478,369 | — | — | 52,478,369 | ||||||||||||
|
| |||||||||||||||
Total Investments in Securities in Assets | $ | 52,478,369 | $ | — | $ | — | $ | 52,478,369 | ||||||||
|
| |||||||||||||||
| (a) | See Fund’s Schedule of Investments in Securities for sector classifications. |
| 148 | Litman Gregory Funds Trust | |||||
Table of Contents
Litman Gregory Funds Trust
NOTES TO FINANCIAL STATEMENTS – (Continued)
Alternative Strategies Fund (Consolidated)
| Description | Level 1 - Quoted prices in active markets for identical assets | Level 2 - Significant other observable inputs | Level 3 - Significant unobservable inputs | Total | ||||||||||||
Equity(a) | ||||||||||||||||
Common Stocks | $ | 140,955,780 | $ | 913,275 | $ | 685,151 | ** | $ | 142,554,206 | |||||||
Preferred Stocks | 243,715 | — | 54,571 | ** | 298,286 | |||||||||||
Limited Partnerships | — | — | 645,627 | ** | 645,627 | |||||||||||
|
| |||||||||||||||
Total Equity | 141,199,495 | 913,275 | 1,385,349 | ** | 143,498,119 | |||||||||||
|
| |||||||||||||||
Rights/Warrants | 24,708 | 12,220 | — | 36,928 | ||||||||||||
Fixed Income | ||||||||||||||||
Asset-Backed Securities | — | 87,636,606 | — | 87,636,606 | ||||||||||||
Bank Loans | — | 14,078,203 | — | 14,078,203 | ||||||||||||
Convertible Bonds | — | 9,869,425 | — | 9,869,425 | ||||||||||||
Corporate Bonds | — | 134,823,372 | — | 134,823,372 | ||||||||||||
Government Securities & Agency Issue | — | 10,901,527 | — | 10,901,527 | ||||||||||||
Mortgage-Backed Securities | — | 112,472,762 | 360,941 | (1) | 112,833,703 | |||||||||||
|
| |||||||||||||||
Total Fixed Income | — | 369,781,895 | 360,941 | ** | 370,142,836 | |||||||||||
|
| |||||||||||||||
Short-Term Investments | ||||||||||||||||
Repurchase Agreements | — | 34,778,955 | — | 34,778,955 | ||||||||||||
Treasury Bills | — | 115,922,618 | — | 115,922,618 | ||||||||||||
|
| |||||||||||||||
Total Short-Term Investments | — | 150,701,573 | — | 150,701,573 | ||||||||||||
|
| |||||||||||||||
Purchased Options | 38,433 | — | — | 38,433 | ||||||||||||
|
| |||||||||||||||
Total Investments in Securities in Assets | $ | 141,262,636 | $ | 521,408,963 | $ | 1,746,290 | ** | $ | 664,417,889 | |||||||
|
| |||||||||||||||
Unfunded Loan Commitments*** | — | (181,254 | ) | — | (181,254 | ) | ||||||||||
|
| |||||||||||||||
Short Sales | ||||||||||||||||
Common Stocks | (4,270,317 | ) | — | — | (4,270,317 | ) | ||||||||||
|
| |||||||||||||||
Total Short Sales | (4,270,317 | ) | — | — | (4,270,317 | ) | ||||||||||
|
| |||||||||||||||
Total Investments in Securities in Liabilities | $ | (4,270,317 | ) | $ | — | $ | — | $ | (4,270,317 | ) | ||||||
|
| |||||||||||||||
Other Financial Instruments* | ||||||||||||||||
Forward Foreign Currency Exchange Contracts | $ | — | $ | (455,547 | ) | $ | — | $ | (455,547 | ) | ||||||
Futures | (1,623,684 | ) | — | — | (1,623,684 | ) | ||||||||||
Swaps - Credit Default | — | 309,841 | — | 309,841 | ||||||||||||
Swaps - Total Return | — | (841,155 | ) | — | (841,155 | ) | ||||||||||
Written Options | (33,886 | ) | — | — | (33,886 | ) | ||||||||||
| (a) | See Fund’s Schedule of Investments in Securities for sector classifications. |
| * | Other financial instruments are derivative instruments, such as futures, forward foreign currency exchange, swaps contracts and written options. Futures, forward foreign currency exchange and swap contracts are valued at the unrealized appreciation (depreciation) on the instrument, while written options are valued at fair value. |
| ** | Significant unobservable inputs were used in determining the value of portfolio securities for the Alternative Strategies Fund . |
| *** | Unfunded Loan Commitments are shown at the unrealized appreciation (depreciation). |
| (1) | These securities were priced by a pricing service; however, the Advisor/Sub-Advisor used their fair value procedures based on other available inputs which more accurately reflected the current fair value of these securities. |
| Notes to Financial Statements | 149 | |||||
Table of Contents
Litman Gregory Funds Trust
NOTES TO FINANCIAL STATEMENTS – (Continued)
High Income Fund
| Description | Level 1 - Quoted prices in active markets for identical assets | Level 2 - Significant other observable inputs | Level 3 - Significant unobservable inputs | Total | ||||||||||||
Equity(a) | ||||||||||||||||
Common Stocks | $ | — | $ | 219 | $ | 9,720 | $ | 9,939 | ||||||||
Preferred Stocks | 1,526,129 | — | — | 1,526,129 | ||||||||||||
|
| |||||||||||||||
Total Equity | 1,526,129 | 219 | 9,720 | 1,536,068 | ||||||||||||
|
| |||||||||||||||
Fixed Income | ||||||||||||||||
Asset-Backed Securities | — | 18,840,881 | — | 18,840,881 | ||||||||||||
Bank Loans | — | 16,620,034 | — | 16,620,034 | ||||||||||||
Convertible Bonds | — | 258,915 | — | 258,915 | ||||||||||||
Corporate Bonds | — | 32,606,945 | 137,684 | ** | 32,744,629 | |||||||||||
Government Securities & Agency Issue | — | 4,639,171 | — | 4,639,171 | ||||||||||||
Mortgage-Backed Securities | — | 10,181,267 | — | 10,181,267 | ||||||||||||
Municipal Bonds | — | 113,665 | — | 113,665 | ||||||||||||
|
| |||||||||||||||
Total Fixed Income | — | 83,260,878 | 137,684 | ** | 83,398,562 | |||||||||||
|
| |||||||||||||||
Short-Term Investments | ||||||||||||||||
Money Market Funds | 2,265,202 | — | — | 2,265,202 | ||||||||||||
Repurchase Agreements | — | 2,082,373 | — | 2,082,373 | ||||||||||||
Treasury Bills | — | 98,458 | — | 98,458 | ||||||||||||
|
| |||||||||||||||
Total Short-Term Investments | 2,265,202 | 2,180,831 | — | 4,446,033 | ||||||||||||
|
| |||||||||||||||
Purchased Options | — | 2,571 | — | 2,571 | ||||||||||||
|
| |||||||||||||||
Total Investments in Securities in Assets | $ | 3,791,331 | $ | 85,444,499 | $ | 147,404 | ** | $ | 89,383,234 | |||||||
|
| |||||||||||||||
Unfunded Loan Commitments*** | — | (2,260 | ) | — | (2,260 | ) | ||||||||||
|
| |||||||||||||||
Other Financial Instruments* | ||||||||||||||||
Forward Foreign Currency Exchange Contracts | $ | — | $ | (19,908 | ) | $ | — | $ | (19,908 | ) | ||||||
Futures | 76,475 | — | — | 76,475 | ||||||||||||
Swaps - Credit Default | — | (33,220 | ) | — | (33,220 | ) | ||||||||||
Swaps - Total Return | — | 460 | — | 460 | ||||||||||||
Written Options | (39,728 | ) | — | — | (39,728 | ) | ||||||||||
| (a) | See Fund’s Schedule of Investments in Securities for sector classifications. |
| * | Other financial instruments are derivative instruments, such as futures, forward foreign currency exchange, swaps contracts and written options. Futures, forward foreign currency exchange and swap contracts are valued at the unrealized appreciation (depreciation) on the instrument, while written options are valued at fair value. |
| ** | Significant unobservable inputs were used in determining the value of portfolio securities for the High Income Fund . |
| *** | Unfunded Loan Commitments are shown at the unrealized appreciation (depreciation). |
Dolan McEniry Corporate Bond Fund
| Description | Level 1 - Quoted prices in active markets for identical assets | Level 2 - Significant other observable inputs | Level 3 - Significant unobservable inputs | Total | ||||||||||||
Fixed Income | ||||||||||||||||
Corporate Bonds | $ | — | $ | 186,514,568 | $ | — | $ | 186,514,568 | ||||||||
|
| |||||||||||||||
Total Fixed Income | — | 186,514,568 | — | 186,514,568 | ||||||||||||
|
| |||||||||||||||
Short-Term Investments | ||||||||||||||||
Treasury Bills | — | 11,306,931 | — | 11,306,931 | ||||||||||||
|
| |||||||||||||||
Total Investments in Securities in Assets | $ | — | $ | 197,821,499 | $ | — | $ | 197,821,499 | ||||||||
|
| |||||||||||||||
| 150 | Litman Gregory Funds Trust | |||||
Table of Contents
Litman Gregory Funds Trust
NOTES TO FINANCIAL STATEMENTS – (Continued)
DBi Managed Futures Strategy ETF (Consolidated)
| Description | Level 1 - Quoted prices in active markets for identical assets | Level 2 - Significant other observable inputs | Level 3 - Significant unobservable inputs | Total | ||||||||||||
Short-Term Investments | ||||||||||||||||
Repurchase Agreements | $ | — | $ | 11,639,683 | $ | — | $ | 11,639,683 | ||||||||
Treasury Bills | — | 575,085,521 | — | 575,085,521 | ||||||||||||
|
| |||||||||||||||
Total Short-Term Investments | — | 586,725,204 | — | 586,725,204 | ||||||||||||
|
| |||||||||||||||
Total Investments in Securities in Assets | $ | — | $ | 586,725,204 | $ | — | $ | 586,725,204 | ||||||||
|
| |||||||||||||||
Other Financial Instruments* | ||||||||||||||||
Futures | $ | (11,388,396 | ) | $ | — | $ | — | $ | (11,388,396 | ) | ||||||
|
| |||||||||||||||
| * | Other financial instruments are derivative instruments, such as futures, forward foreign currency exchange, swaps contracts and written options. Futures, forward foreign currency exchange and swap contracts are valued at the unrealized appreciation (depreciation) on the instrument, while written options are valued at fair value. |
DBi Hedge Strategy ETF
| Description | Level 1 - Quoted prices in active markets for identical assets | Level 2 - Significant other observable inputs | Level 3 - Significant unobservable inputs | Total | ||||||||||||
Short-Term Investments | ||||||||||||||||
Repurchase Agreements | $ | — | $ | 1,167,895 | $ | — | $ | 1,167,895 | ||||||||
Treasury Bills | — | 30,241,566 | — | 30,241,566 | ||||||||||||
|
| |||||||||||||||
Total Short-Term Investments | — | 31,409,461 | — | 31,409,461 | ||||||||||||
|
| |||||||||||||||
Total Investments in Securities | $ | — | $ | 31,409,461 | $ | — | $ | 31,409,461 | ||||||||
|
| |||||||||||||||
Other Financial Instruments* | ||||||||||||||||
Futures | $ | 546,946 | $ | — | $ | — | $ | 546,946 | ||||||||
|
| |||||||||||||||
| * | Other financial instruments are derivative instruments, such as futures, forward foreign currency exchange, swaps contracts and written options. Futures, forward foreign currency exchange and swap contracts are valued at the unrealized appreciation (depreciation) on the instrument, while written options are valued at fair value. |
RBA Responsible Global Allocation ETF
| Description | Level 1 - Quoted prices in active markets for identical assets | Level 2 - Significant other observable inputs | Level 3 - Significant unobservable inputs | Total | ||||||||||||
Equity | ||||||||||||||||
Exchange-Traded Funds | $ | 6,897,891 | $ | — | $ | — | $ | 6,897,891 | ||||||||
|
| |||||||||||||||
Total Equity | 6,897,891 | — | — | 6,897,891 | ||||||||||||
|
| |||||||||||||||
Total Investments in Securities | $ | 6,897,891 | $ | — | $ | — | $ | 6,897,891 | ||||||||
|
| |||||||||||||||
| Notes to Financial Statements | 151 | |||||
Table of Contents
Litman Gregory Funds Trust
NOTES TO FINANCIAL STATEMENTS – (Continued)
Berkshire Dividend Growth ETF
| Description | Level 1 - Quoted prices in active markets for identical assets | Level 2 - Significant other observable inputs | Level 3 - Significant unobservable inputs | Total | ||||||||||||
Equity(a) | ||||||||||||||||
Common Stocks | $ | 1,272,758 | $ | — | $ | — | $ | 1,272,758 | ||||||||
|
| |||||||||||||||
Total Equity | 1,272,758 | — | — | 1,272,758 | ||||||||||||
|
| |||||||||||||||
Total Investments in Securities | $ | 1,272,758 | $ | — | $ | — | $ | 1,272,758 | ||||||||
|
| |||||||||||||||
| (a) | See Fund’s Schedule of Investments in Securities for sector classifications. |
Note 7 – Commitments and Contingencies
The Funds may make commitments pursuant to bridge loan facilities. Such commitments typically remain off balance sheet as it is more likely than not, based on good faith judgement of the Advisor, that such bridge facilities will not ever fund. As of December 31, 2023, the High Income Fund had $266,030 outstanding bridge facility commitments.
Note 8 – Other Derivative Information
At December 31, 2023, the Funds are invested in derivative contracts which are reflected in the Statements of Assets and Liabilities as follows:
| Alternative Strategies Fund (Consolidated) | ||||||||||||||||||||
| Derivative Assets | Derivative Liabilities | |||||||||||||||||||
| Risk | Statements of Assets and Liabilities Location | Fair Value Amount | Statements of Assets and Liabilities Location | Fair Value Amount | ||||||||||||||||
Currency | Unrealized gain on forward foreign currency exchange contracts | $ | 115,512 | Unrealized loss on forward foreign currency exchange contracts | $ | (571,059 | ) | |||||||||||||
| Unrealized gain on futures contracts* | 114,440 | Unrealized loss on futures contracts* | (428,109 | ) | ||||||||||||||||
Commodity | Unrealized gain on futures contracts* | 73,430 | Unrealized loss on futures contracts* | — | ||||||||||||||||
Interest rate | Unrealized gain on futures contracts* | 1,931,278 | Unrealized loss on futures contracts* | (3,240,607 | ) | |||||||||||||||
| Investments in securities(1) | 12,688 | Written options | (26,688 | ) | ||||||||||||||||
Credit | Unrealized gain on swap contracts** | 6,071,954 | Unrealized loss on swap contracts** | (5,762,113 | ) | |||||||||||||||
Equity | Unrealized gain on swap contracts | — | Unrealized loss on swap contracts | (841,155 | ) | |||||||||||||||
| Unrealized gain on futures contracts* | 1,091,174 | Unrealized loss on futures contracts* | (1,165,290 | ) | ||||||||||||||||
| Investments in securities(1) | 25,745 | Written options | (7,198 | ) | ||||||||||||||||
|
| |||||||||||||||||||
| Total | $ | 9,436,221 | $ | (12,042,219 | ) | |||||||||||||||
|
| |||||||||||||||||||
|
* Includes cumulative appreciation/depreciation on futures contracts described previously. Only
** Includes cumulative appreciation/depreciation on centrally cleared swaps.
(1) The Consolidated Statements of Assets and Liabilities location for “Purchased Options” is |
| ||||||||||||||||||
| 152 | Litman Gregory Funds Trust | |||||
Table of Contents
Litman Gregory Funds Trust
NOTES TO FINANCIAL STATEMENTS – (Continued)
| High Income Fund | ||||||||||||||||||||
| Derivative Assets | Derivative Liabilities | |||||||||||||||||||
| Risk | Statements of Assets and Liabilities Location | Fair Value Amount | Statements of Assets and Liabilities Location | Fair Value Amount | ||||||||||||||||
Currency | Unrealized gain on forward foreign currency exchange contracts | $ | — | Unrealized loss on forward foreign currency exchange contracts | $ | (19,908 | ) | |||||||||||||
Interest rate | Unrealized gain on futures contracts* | 76,475 | Unrealized loss on futures contracts* | — | ||||||||||||||||
| Investments in securities(1) | 2,571 | Written options | — | |||||||||||||||||
Credit | Unrealized gain on swap contracts** | — | Unrealized loss on swap contracts** | (33,220 | ) | |||||||||||||||
Equity | Unrealized gain on swap contracts | 4,770 | Unrealized loss on swap contracts | (4,310 | ) | |||||||||||||||
| Investments in securities(1) | — | Written options | (39,728 | ) | ||||||||||||||||
|
| |||||||||||||||||||
| Total | $ | 83,816 | $ | (97,166 | ) | |||||||||||||||
|
| |||||||||||||||||||
|
| * Includes cumulative appreciation/depreciation on futures contracts described previously. Only
** Includes cumulative appreciation/depreciation on centrally cleared swaps.
(1) The Statements of Assets and Liabilities location for “Purchased Options” is “Investments in |
| ||||||||||||||||||
| DBi Managed Futures Strategy ETF (Consolidated) | ||||||||||||||||||||
| Derivative Assets | Derivative Liabilities | |||||||||||||||||||
| Risk | Statements of Assets and Liabilities Location | Fair Value Amount | Statements of Assets and Liabilities Location | Fair Value Amount | ||||||||||||||||
Currency | Unrealized gain on futures contracts* | $ | 575,266 | Unrealized loss on futures contracts* | $ | (3,083,485 | ) | |||||||||||||
Commodity | Unrealized gain on futures contracts* | 603,851 | Unrealized loss on futures contracts* | — | ||||||||||||||||
Interest rate | Unrealized gain on futures contracts* | 346,579 | Unrealized loss on futures contracts* | (7,272,269 | ) | |||||||||||||||
Equity | Unrealized gain on futures contracts* | 4,307,025 | Unrealized loss on futures contracts* | (6,865,363 | ) | |||||||||||||||
|
| |||||||||||||||||||
| Total | $ | 5,832,721 | $ | (17,221,117 | ) | |||||||||||||||
|
| |||||||||||||||||||
| | * Includes cumulative appreciation/depreciation on futures contracts described previously. Only | | ||||||||||||||||||
| DBi Hedge Strategy ETF | ||||||||||||||||||||
| Derivative Assets | Derivative Liabilities | |||||||||||||||||||
| Risk | Statements of Assets and Liabilities Location | Fair Value Amount | Statements of Assets and Liabilities Location | Fair Value Amount | ||||||||||||||||
Currency | Unrealized gain on futures contracts* | $ | 94,967 | Unrealized loss on futures contracts* | $ | — | ||||||||||||||
Interest rate | Unrealized gain on futures contracts* | 118,669 | Unrealized loss on futures contracts* | (206,618 | ) | |||||||||||||||
Equity | Unrealized gain on futures contracts* | 547,484 | Unrealized loss on futures contracts* | (7,556 | ) | |||||||||||||||
|
| |||||||||||||||||||
| Total | $ | 761,120 | $ | (214,174 | ) | |||||||||||||||
|
| |||||||||||||||||||
| | * Includes cumulative appreciation/depreciation on futures contracts described previously. Only | | ||||||||||||||||||
| Notes to Financial Statements | 153 | |||||
Table of Contents
Litman Gregory Funds Trust
NOTES TO FINANCIAL STATEMENTS – (Continued)
For the year ended December 31, 2023, the effect of derivative contracts in the Funds’ Statements of Operations were as follows:
| Alternative Strategies Fund (Consolidated) | ||||||||||||||||||
| Statements of Operations | ||||||||||||||||||
| Risk | Derivative Type | Net Realized Gain (Loss) | Net Change in Unrealized Gain (Loss) | Average Notional Amount | ||||||||||||||
Currency | Forward foreign currency exchange contracts | $ | (133,979 | ) | $ | (247,817 | ) | 37,622,019 | (a) | |||||||||
| Future contracts | 3,063,272 | (474,756 | ) | 55,712,948 | (b) | |||||||||||||
Commodity | Future contracts | (5,719,342 | ) | 188,545 | 15,079,831 | (b) | ||||||||||||
Interest rate | Future contracts | 626,701 | (2,769,692 | ) | 387,490,413 | (b) | ||||||||||||
| Purchased option contracts | — | (4,054 | ) | 36 | (d) | |||||||||||||
| Written option contracts | (158,372 | ) | (555 | ) | 49 | (d) | ||||||||||||
Credit | Swap contracts | 5,019,733 | (2,925,900 | ) | 825,160,417 | (b)(c) | ||||||||||||
Equity | Swap contracts | (3,871,107 | ) | (1,862,065 | ) | 51,602,583 | (b)(c) | |||||||||||
| Future contracts | (7,477,313 | ) | 464,165 | 53,280,829 | (b) | |||||||||||||
| Purchased option contracts | (409,354 | ) | 22,005 | 1,585 | (d) | |||||||||||||
| Written option contracts | 5,565 | 282 | 232 | (d) | ||||||||||||||
|
| |||||||||||||||||
| Total | $ | (9,054,196 | ) | $ | (7,609,842 | ) | ||||||||||||
|
| |||||||||||||||||
| (a) | Average notional values are based on the average of monthly end contract values for the year ended December 31, 2023. |
| (b) | Average notional values are based on the average of monthly end notional balances for the year ended December 31, 2023. |
| (c) | Notional amount is denoted in local currency. |
| (d) | Average contracts are based on the average of monthly end contracts for the year ended December 31, 2023. |
| High Income Fund | ||||||||||||||||||
| Statements of Operations | ||||||||||||||||||
| Risk | Derivative Type | Net Realized Gain (Loss) | Net Change in Unrealized Gain (Loss) | Average Notional Amount | ||||||||||||||
Currency | Forward foreign currency exchange contracts | $ | 14,159 | $ | (21,388 | ) | 609,855 | (a) | ||||||||||
Interest rate | Swap contracts | (252,262 | ) | 201,636 | 1,400,000 | (b)(c) | ||||||||||||
| Future contracts | (136,533 | ) | 127,656 | 3,761,277 | (b) | |||||||||||||
| Purchased option contracts | (16,489 | ) | (10,244 | ) | 6,658,333 | (b) | ||||||||||||
Credit | Swap contracts | (33,562 | ) | (30,750 | ) | 1,637,167 | (b)(c) | |||||||||||
| Purchased option contracts | (1,359 | ) | — | 225,000 | (d) | |||||||||||||
Equity | Swap contracts | 875 | 460 | 78,315 | (b)(c) | |||||||||||||
| Purchased option contracts | (21,483 | ) | — | 1 | (d) | |||||||||||||
| Written option contracts | 1,056,695 | (72,822 | ) | 42 | (d) | |||||||||||||
|
| |||||||||||||||||
| Total | $ | 610,041 | $ | 194,548 | ||||||||||||||
|
| |||||||||||||||||
| (a) | Average notional values are based on the average of monthly end contract values for the year ended December 31, 2023. |
| (b) | Average notional values are based on the average of monthly end notional balances for the year ended December 31, 2023. |
| (c) | Notional amount is denoted in local currency. |
| (d) | Average contracts are based on the average of monthly end contracts for the year ended December 31, 2023. |
| 154 | Litman Gregory Funds Trust | |||||
Table of Contents
Litman Gregory Funds Trust
NOTES TO FINANCIAL STATEMENTS – (Continued)
| DBi Managed Futures Strategy ETF (Consolidated) | ||||||||||||||||||
| Statements of Operations | ||||||||||||||||||
| Risk | Derivative Type | Net Realized Gain (Loss) | Net Change in Unrealized Gain (Loss) | Average Notional Amount(a) | ||||||||||||||
Currency | Future contracts | $ | 15,778,888 | $ | (3,938,175 | ) | 352,652,688 | |||||||||||
Commodity | Future contracts | (44,307,890 | ) | 2,141,627 | 128,422,376 | |||||||||||||
Interest rate | Future contracts | (15,776,568 | ) | (12,236,907 | ) | 1,102,560,440 | ||||||||||||
Equity | Future contracts | (52,114,376 | ) | (3,157,221 | ) | 265,327,629 | ||||||||||||
|
| |||||||||||||||||
| Total | $ | (96,419,946 | ) | $ | (17,190,676 | ) | ||||||||||||
|
| |||||||||||||||||
| (a) | Average notional values are based on the average of monthly end notional balances for the year ended December 31, 2023. |
| DBi Hedge Strategy ETF | ||||||||||||||||||
| Statements of Operations | ||||||||||||||||||
| Risk | Derivative Type | Net Realized Gain (Loss) | Net Change in Unrealized Gain (Loss) | Average Notional Amount(a) | ||||||||||||||
Currency | Future contracts | $ | (273,089 | ) | $ | 103,714 | 2,800,474 | |||||||||||
Interest rate | Future contracts | 73,832 | (90,405 | ) | 14,321,268 | |||||||||||||
Equity | Future contracts | 298,828 | 732,023 | 9,465,952 | ||||||||||||||
|
| |||||||||||||||||
| Total | $ | 99,571 | $ | 745,332 | ||||||||||||||
|
| |||||||||||||||||
| (a) | Average notional values are based on the average of monthly end notional balances for the year ended December 31, 2023. |
The Funds are subject to various Master Netting Arrangements, which govern the terms of certain transactions with select counterparties. The Master Netting Arrangements allow the Funds to close out and net their total exposure to a counterparty in the event of a default with respect to all the transactions governed under a single agreement with a counterparty. The Master Netting Arrangements also specify collateral posting arrangements at pre-arranged exposure levels. Under the Master Netting Arrangements, collateral is routinely transferred if the total net exposure to certain transactions (net of existing collateral already in place) governed under the relevant Master Netting Arrangement with a counterparty in a given account exceeds a specified threshold depending on the counterparty and the type of Master Netting Arrangement.
At December 31, 2023, Global Select Fund, International Fund, Alternative Strategies Fund, High Income Fund, DBi Managed Futures Strategy ETF, and DBi Hedge Strategy ETF had investments in repurchase agreements with a gross value of $4,034,971, $13,139,674, $34,778,955, $2,082,373, $11,639,683, and $1,167,895, respectively, which are reflected as repurchase agreements on the Statements of Assets and Liabilities. The value of the related collateral exceeded the value of the repurchase agreements at December 31, 2023.
| Notes to Financial Statements | 155 | |||||
Table of Contents
Litman Gregory Funds Trust
NOTES TO FINANCIAL STATEMENTS – (Continued)
The following tables represent the disclosure for derivative instruments related to offsetting assets and liabilities for each of the Funds as of December 31, 2023:
| Alternative Strategies Fund (Consolidated) | ||||||||||||||||||||||||||||||||||||||||||||||||||||||||
| Derivative Assets | Derivative Liabilities | |||||||||||||||||||||||||||||||||||||||||||||||||||||||
| Counterparty | Purchased Options | Futures(1) | Swaps(2) | Forward Currency Contracts | Total | Futures(1) | Swaps(2) | Forward Currency Contracts | Written Options | Total | Net Derivative Asset (Liabilities) | Collateral (Received) Pledged(3) | Net Amount | |||||||||||||||||||||||||||||||||||||||||||
Bank of America N.A. | $ | — | $ | — | $ | — | $ | — | $ | — | $ | — | $ | — | $ | (78,246 | ) | $ | — | $ | (78,246 | ) | $ | (78,246 | ) | $ | — | $ | (78,246 | ) | ||||||||||||||||||||||||||
Barclays Bank Plc | — | — | — | — | — | — | — | (22,049 | ) | — | (22,049 | ) | (22,049 | ) | — | (22,049 | ) | |||||||||||||||||||||||||||||||||||||||
Citigroup Global Markets, Inc. | — | 482,668 | — | — | 482,668 | (1,296,767 | ) | — | — | — | (1,296,767 | ) | (814,099 | ) | — | (814,099 | ) | |||||||||||||||||||||||||||||||||||||||
JPMorgan Chase Bank N.A. | 12,688 | 1,274,211 | — | 111,616 | 1,398,515 | (767,508 | ) | (841,155 | ) | (47,431 | ) | (26,688 | ) | (1,682,782 | ) | (284,267 | ) | 284,267 | — | |||||||||||||||||||||||||||||||||||||
Morgan Stanley & Co. | 25,745 | — | — | 3,896 | 29,641 | — | — | (423,333 | ) | (7,198 | ) | (430,531 | ) | (400,890 | ) | 400,890 | — | |||||||||||||||||||||||||||||||||||||||
StoneX Financial, Inc. | — | 1,453,443 | — | — | 1,453,443 | (2,769,731 | ) | — | — | — | (2,769,731 | ) | (1,316,288 | ) | 1,316,288 | — | ||||||||||||||||||||||||||||||||||||||||
|
|
|
|
|
|
|
|
|
|
|
| |||||||||||||||||||||||||||||||||||||||||||||
Total | $ | 38,433 | $ | 3,210,322 | $ | — | $ | 115,512 | $ | 3,364,267 | $ | (4,834,006 | ) | $ | (841,155 | ) | $ | (571,059 | ) | $ | (33,886 | ) | $ | (6,280,106 | ) | $ | (2,915,839 | ) | $ | 2,001,445 | $ | (914,394 | ) | |||||||||||||||||||||||
|
|
|
|
|
|
|
|
|
|
|
| |||||||||||||||||||||||||||||||||||||||||||||
| (1) | Includes cumulative appreciation (depreciation) of futures contracts as reported in the Consolidated Schedule of Investments in Futures. Only current day’s variation margin is reported within the Consolidated Statements of Assets and Liabilites. |
| (2) | Does not include the unrealized appreciation (depreciation) of centrally cleared swaps as reported in the Consolidated Schedule of Investments in Swaps. Only the variation margin is reported within the Consolidated Statement of Assets and Liabilities. |
| (3) | The actual collateral pledged (received) may be more than the amounts shown. |
| High Income Fund | ||||||||||||||||||||||||||||||||||||||||||||||||||||||||
| Derivative Assets | Derivative Liabilities | |||||||||||||||||||||||||||||||||||||||||||||||||||||||
| Counterparty | Purchased Options | Futures(1) | Swaps(2) | Forward Currency Contracts | Total | Futures(1) | Swaps(2) | Forward Currency Contracts | Written Options | Total | Net Derivative Asset (Liabilities) | Collateral (Received) Pledged(3) | Net Amount | |||||||||||||||||||||||||||||||||||||||||||
Bank of America N.A. | $ | 467 | $ | 31,494 | $ | 1,345 | $ | — | $ | 33,306 | $ | — | $ | — | $ | (2,030 | ) | $ | — | $ | (2,030 | ) | $ | 31,276 | $ | — | $ | 31,276 | ||||||||||||||||||||||||||||
Barclays Bank Plc | 935 | — | — | — | 935 | — | — | (17,878 | ) | — | (17,878 | ) | (16,943 | ) | — | (16,943 | ) | |||||||||||||||||||||||||||||||||||||||
Goldman Sachs & Co. | 1,013 | 44,981 | — | — | 45,994 | — | — | — | — | — | 45,994 | — | 45,994 | |||||||||||||||||||||||||||||||||||||||||||
JPMorgan Chase Bank N.A. | — | — | 3,425 | — | 3,425 | — | (4,310 | ) | — | — | (4,310 | ) | (885 | ) | — | (885 | ) | |||||||||||||||||||||||||||||||||||||||
Morgan Stanley & Co. | 156 | — | — | — | 156 | — | — | — | — | — | 156 | — | 156 | |||||||||||||||||||||||||||||||||||||||||||
UBS Securities LLC | — | — | — | — | — | — | — | — | (39,728 | ) | (39,728 | ) | (39,728 | ) | — | (39,728 | ) | |||||||||||||||||||||||||||||||||||||||
|
|
|
|
|
|
|
|
|
|
|
| |||||||||||||||||||||||||||||||||||||||||||||
Total | $ | 2,571 | $ | 76,475 | $ | 4,770 | $ | — | $ | 83,816 | $ | — | $ | (4,310 | ) | $ | (19,908 | ) | $ | (39,728 | ) | $ | (63,946 | ) | $ | 19,870 | $ | — | $ | 19,870 | ||||||||||||||||||||||||||
|
|
|
|
|
|
|
|
|
|
|
| |||||||||||||||||||||||||||||||||||||||||||||
| (1) | Includes cumulative appreciation (depreciation) of futures contracts as reported in the Schedule of Investments in Futures. Only current day’s variation margin is reported within the Statements of Assets and Liabilites. |
| (2) | Does not include the unrealized appreciation (depreciation) of centrally cleared swaps as reported in the Schedule of Investments in Swaps. Only the variation margin is reported within the Statement of Assets and Liabilities. |
| (3) | The actual collateral pledged (received) may be more than the amounts shown. |
| DBi Managed Futures Strategy ETF (Consolidated) | ||||||||||||||||||||||||||||||||||||||||||||||||||||||||
| Derivative Assets | Derivative Liabilities | |||||||||||||||||||||||||||||||||||||||||||||||||||||||
| Counterparty | Purchased Options | Futures(1) | Swaps | Forward Currency Contracts | Total | Futures(1) | Swaps | Forward Currency Contracts | Written Options | Total | Net Derivative Asset (Liabilities) | Collateral (Received) Pledged(2) | Net Amount | |||||||||||||||||||||||||||||||||||||||||||
Societe Generale | $ | — | $ | 5,832,721 | $ | — | $ | — | $ | 5,832,721 | $ | (17,221,117 | ) | $ | — | $ | — | $ | — | $ | (17,221,117 | ) | $ | (11,388,396 | ) | $ | 11,388,396 | $ | — | |||||||||||||||||||||||||||
|
|
|
|
|
|
|
|
|
|
|
| |||||||||||||||||||||||||||||||||||||||||||||
| (1) | Includes cumulative appreciation (depreciation) of futures contracts as reported in the Consolidated Schedule of Investments in Futures. Only current day’s variation margin is reported within the Consolidated Statements of Assets and Liabilites. |
| (2) | The actual collateral pledged (received) may be more than the amounts shown. |
| 156 | Litman Gregory Funds Trust | |||||
Table of Contents
Litman Gregory Funds Trust
NOTES TO FINANCIAL STATEMENTS – (Continued)
| DBi Hedge Strategy ETF | ||||||||||||||||||||||||||||||||||||||||||||||||||||||||
| Derivative Assets | Derivative Liabilities | |||||||||||||||||||||||||||||||||||||||||||||||||||||||
| Counterparty | Purchased Options | Futures(1) | Swaps | Forward Currency Contracts | Total | Futures(1) | Swaps | Forward Currency Contracts | Written Options | Total | Net Derivative Asset (Liabilities) | Collateral (Received) Pledged | Net Amount | |||||||||||||||||||||||||||||||||||||||||||
Mizuho Securities | $ | — | $ | 761,120 | $ | — | $ | — | $ | 761,120 | $ | (214,174 | ) | $ | — | $ | — | $ | — | $ | (214,174 | ) | $ | 546,946 | $ | — | $ | 546,946 | ||||||||||||||||||||||||||||
|
|
|
|
|
|
|
|
|
|
|
| |||||||||||||||||||||||||||||||||||||||||||||
| (1) | Includes cumulative appreciation (depreciation) of futures contracts as reported in the Schedule of Investments in Futures. Only current day’s variation margin is reported within the Statements of Assets and Liabilites. |
Note 9 – Income Taxes and Distributions to Shareholders
As of December 31, 2023, the components of accumulated earnings (losses) for income tax purposes were as follows:
| Global Select Fund | International Fund | Oldfield International Value Fund | SBH Focused Small Value Fund | |||||||||||||
Tax cost of Investments and derivatives | $ | 101,149,452 | $ | 206,125,706 | $ | 31,503,644 | $ | 42,964,433 | ||||||||
Gross Tax Unrealized Appreciation | 20,197,115 | 35,809,271 | 6,166,506 | 11,647,666 | ||||||||||||
Gross Tax Unrealized Depreciation | (4,105,196 | ) | (19,870,031 | ) | (2,350,594 | ) | (2,133,730 | ) | ||||||||
|
|
|
|
|
|
|
| |||||||||
Net Tax unrealized appreciation (depreciation) on investments and derivatives | 16,091,919 | 15,939,240 | 3,815,912 | 9,513,936 | ||||||||||||
Net Tax unrealized appreciation (depreciation) on foreign currency | (20,585 | ) | (11,649 | ) | (1,064 | ) | — | |||||||||
|
|
|
|
|
|
|
| |||||||||
Net Tax unrealized appreciation (depreciation) | 16,071,334 | 15,927,591 | 3,814,848 | 9,513,936 | ||||||||||||
|
|
|
|
|
|
|
| |||||||||
Undistributed Ordinary Income | 497,312 | 200,099 | 299,174 | — | ||||||||||||
|
|
|
|
|
|
|
| |||||||||
Undistributed Long-Term Capital Gains | 49,215 | — | 86,769 | 597,562 | ||||||||||||
|
|
|
|
|
|
|
| |||||||||
Capital Loss Carry Forward | — | (34,753,999 | ) | — | — | |||||||||||
|
|
|
|
|
|
|
| |||||||||
Late Year Ordinary Loss Deferral | — | — | — | — | ||||||||||||
|
|
|
|
|
|
|
| |||||||||
Other Accumulated Gains | — | — | — | — | ||||||||||||
|
|
|
|
|
|
|
| |||||||||
Total accumulated gain/(loss) | $ | 16,617,861 | $ | (18,626,309 | ) | $ | 4,200,791 | $ | 10,111,498 | |||||||
|
|
|
|
|
|
|
| |||||||||
| Alternative Strategies Fund (Consolidated) | High Income Fund | Dolan McEniry Corporate Bond Fund | ||||||||||
Tax cost of Investments and derivatives | $ | 738,484,748 | $ | 93,186,004 | $ | 198,966,672 | ||||||
Gross Tax Unrealized Appreciation | 39,488,511 | 1,205,415 | 3,148,842 | |||||||||
Gross Tax Unrealized Depreciation | (118,803,947 | ) | (5,050,484 | ) | (4,294,015 | ) | ||||||
|
|
|
|
|
| |||||||
Net Tax unrealized appreciation (depreciation) on investments and derivatives | (79,315,436 | ) | (3,845,069 | ) | (1,145,173 | ) | ||||||
Net Tax unrealized appreciation (depreciation) on foreign currency | 440 | (60,483 | ) | — | ||||||||
|
|
|
|
|
| |||||||
Net Tax unrealized appreciation (depreciation) | (79,314,996 | ) | (3,905,552 | ) | (1,145,173 | ) | ||||||
|
|
|
|
|
| |||||||
Undistributed Ordinary Income | 202,459 | — | — | |||||||||
|
|
|
|
|
| |||||||
Undistributed Long-Term Capital Gains | — | — | — | |||||||||
|
|
|
|
|
| |||||||
Capital Loss Carry Forward | (61,749,136 | ) | (2,916,927 | ) | (2,720,009 | ) | ||||||
|
|
|
|
|
| |||||||
Late Year Ordinary Loss Deferral | — | — | — | |||||||||
|
|
|
|
|
| |||||||
Straddle Loss Deferral | (2,545,803 | ) | — | — | ||||||||
|
|
|
|
|
| |||||||
Other Accumulated Losses | (5,930 | ) | — | 1 | ||||||||
|
|
|
|
|
| |||||||
Total accumulated gain/(loss) | $ | (143,413,406 | ) | $ | (6,822,479 | ) | $ | (3,865,181 | ) | |||
|
|
|
|
|
| |||||||
| Notes to Financial Statements | 157 | |||||
Table of Contents
Litman Gregory Funds Trust
NOTES TO FINANCIAL STATEMENTS – (Continued)
| DBi Managed Futures Strategy ETF (Consolidated) | DBi Hedge Strategy ETF | RBA Responsible Global Allocation ETF | Berkshire Dividend Growth ETF | |||||||||||||
Tax cost of Investments and derivatives | $ | 588,972,598 | $ | 31,403,714 | $ | 6,877,425 | $ | 1,228,323 | ||||||||
Gross Tax Unrealized Appreciation | 712,484 | 5,747 | 165,682 | 63,718 | ||||||||||||
Gross Tax Unrealized Depreciation | (2,356,027 | ) | — | (145,216 | ) | (19,283 | ) | |||||||||
|
|
|
|
|
|
|
| |||||||||
Net Tax unrealized appreciation (depreciation) on investments and derivatives | (1,643,543 | ) | 5,747 | 20,466 | 44,435 | |||||||||||
Net Tax unrealized appreciation (depreciation) on foreign currency | — | — | — | — | ||||||||||||
|
|
|
|
|
|
|
| |||||||||
Net Tax unrealized appreciation (depreciation) | (1,643,543 | ) | 5,747 | 20,466 | 44,435 | |||||||||||
|
|
|
|
|
|
|
| |||||||||
Undistributed Ordinary Income | — | 150 | — | — | ||||||||||||
|
|
|
|
|
|
|
| |||||||||
Undistributed Long-Term Capital Gains | — | — | — | — | ||||||||||||
|
|
|
|
|
|
|
| |||||||||
Capital Loss Carry Forward | (116,032,920 | ) | (252,373 | ) | (326,093 | ) | (81 | ) | ||||||||
|
|
|
|
|
|
|
| |||||||||
Late Year Ordinary Loss Deferral | — | — | — | — | ||||||||||||
|
|
|
|
|
|
|
| |||||||||
Other Accumulated Gains | — | — | — | — | ||||||||||||
|
|
|
|
|
|
|
| |||||||||
Total accumulated gain/(loss) | $ | (117,676,463 | ) | $ | (246,476 | ) | $ | (305,627 | ) | $ | 44,354 | |||||
|
|
|
|
|
|
|
| |||||||||
The difference between book-basis and tax-basis unrealized appreciation (depreciation) is attributable primarily to wash sales, premium amortization accruals, forward foreign currency exchange contracts mark to market, futures contracts mark to market, options contracts mark to market, swap contracts mark to market, passive foreign investment company adjustments, partnership basis adjustments, organizational expenses, constructive sales, 305(c) adjustment, and non REIT return of capital basis adjustments.
For the year or period ended December 31, 2023, capital loss carry over used in current year was as follows:
| Fund | Capital Loss Carryover Utilized Short-Term | Capital Loss Carryover Utilized Long-Term | ||||||
International Fund | $ | 233,484 | $ | 4,329,444 | ||||
Oldfield International Value Fund | 148,600 | 1,120,081 | ||||||
SBH Focused Small Value Fund | 147,881 | 1,293,394 | ||||||
DBi Hedge Strategy ETF | 239,230 | 354,753 | ||||||
The capital loss carry forwards for each Fund were as follows:
| International Fund | Alternative Strategies Fund (Consolidated) | High Income Fund | Dolan McEniry Corporate Bond Fund | DBi Managed Futures Strategy ETF | ||||||||||||||||
Capital Loss Carryforwards | ||||||||||||||||||||
Perpetual Short-Term | $ | (27,794,169 | ) | $ | (37,053,548 | ) | $ | (633,032 | ) | $ | (366,108 | ) | $ | (31,097,586 | ) | |||||
Perpetual Long-Term | (6,959,830 | ) | (24,695,588 | ) | (2,283,895 | ) | (2,353,901 | ) | (84,935,334 | ) | ||||||||||
|
|
|
|
|
|
|
|
|
| |||||||||||
Total | $ | (34,753,999 | ) | $ | (61,749,136 | ) | $ | (2,916,927 | ) | $ | (2,720,009 | ) | $ | (116,032,920 | ) | |||||
|
|
|
|
|
|
|
|
|
| |||||||||||
| DBi Hedge Strategy ETF | RBA Responsible Global Allocation ETF | Berkshire Dividend Growth ETF | ||||||||||
Capital Loss Carryforwards | ||||||||||||
Perpetual Short-Term | $ | (187,586 | ) | $ | (126,081 | ) | $ | (81 | ) | |||
Perpetual Long-Term | (64,787 | ) | (200,012 | ) | — | |||||||
|
|
|
|
|
| |||||||
Total | $ | (252,373 | ) | $ | (326,093 | ) | $ | (81 | ) | |||
|
|
|
|
|
| |||||||
| 158 | Litman Gregory Funds Trust | |||||
Table of Contents
Litman Gregory Funds Trust
NOTES TO FINANCIAL STATEMENTS – (Continued)
Additionally, GAAP requires that certain components of net assets relating to permanent differences be reclassified between financial and tax reporting. These reclassifications have no effect on net assets or net asset value per share. For the year ended December 31, 2023, the following table shows the reclassifications made:
Fund | Accumulated Distributable Earnings (Deficit) | Paid In Capital | ||||||
Global Select Fund* | $ | (465,386 | ) | $ | 465,386 | |||
International Fund* | — | — | ||||||
Oldfield International Value Fund* | (90,016 | ) | 90,016 | |||||
SBH Focused Small Value Fund* | (291,241 | ) | 291,241 | |||||
Alternative Strategies Fund (Consolidated)* | 1,894,140 | (1,894,140 | ) | |||||
High Income Fund* | 524,711 | (524,711 | ) | |||||
Dolan McEniry Corporate Bond Fund* | (22,356 | ) | 22,356 | |||||
DBi Managed Futures Strategy ETF (Consolidated)* | 74,498,441 | (74,498,441 | ) | |||||
DBi Hedge Strategy ETF* | 358,530 | (358,530 | ) | |||||
RBA Responsible Global Allocation ETF* | (52,967 | ) | 52,967 | |||||
Berkshire Dividend Growth ETF* | 102 | (102 | ) | |||||
| * | The permanent differences primarily relate to premium amortization, foreign currency gains/losses, paydown gains/losses, passive foreign investment company gains/losses, swaps adjustments, Subsidiary adjustments, equalization adjustments, and tax treatment of partnerships. |
The tax composition of dividends (other than return of capital dividends), for the year ended December 31, 2023 and the year ended December 31, 2022 were as follows:
| 2023 | 2022 | |||||||||||||||||||||||||||
| Fund | Ordinary Income | Long-Term Capital Gain | Return of Capital | Ordinary Income | Long-Term Gain | Return of Capital | ||||||||||||||||||||||
Global Select Fund | $ | 982,632 | $ | 3,697,048 | $ | — | $ | 240,225 | $ | 30,181,426 | $ | — | ||||||||||||||||
International Fund | 2,248,768 | — | — | 1,809,650 | — | — | ||||||||||||||||||||||
Oldfield International Value Fund | 918,384 | — | — | 430,948 | — | 83,911 | ||||||||||||||||||||||
SBH Focused Small Value Fund | 347,833 | 3,594,970 | — | — | — | — | ||||||||||||||||||||||
Alternative Strategies Fund (Consolidated) | 32,887,667 | — | — | 47,948,888 | — | — | ||||||||||||||||||||||
High Income Fund | 5,462,695 | — | — | 5,028,188 | — | — | ||||||||||||||||||||||
Dolan McEniry Corporate Bond Fund | 5,685,475 | — | — | 1,861,835 | 80,695 | — | ||||||||||||||||||||||
DBi Managed Futures Strategy ETF (Consolidated) | 18,430,660 | — | 1,658,620 | 48,855,060 | 22,694,665 | 367,075 | ||||||||||||||||||||||
DBi Hedge Strategy ETF | 992,005 | — | — | 226,550 | — | — | ||||||||||||||||||||||
RBA Responsible Global Allocation ETF | 184,305 | — | — | 119,006 | — | — | ||||||||||||||||||||||
Berkshire Dividend Growth ETF | 11,250 | — | — | — | — | — | ||||||||||||||||||||||
The Funds did not have any unrecognized tax benefits at December 31, 2023, nor were there any increases or decreases in unrecognized tax benefits for the year ended December 31, 2023. The Funds are subject to examination by the U.S. federal and state tax authorities for returns filed for the prior three and four fiscal years, respectively.
Note 10 – Line of Credit
The Trust has an unsecured, uncommitted $75,000,000 line of credit with the Custodian, for the Global Select Fund, International Fund, Oldfield International Value Fund, SBH Focused Small Value Fund, High Income Fund, and Dolan McEniry Corporate Bond Fund (the “Six Funds”) expiring on April 26, 2024. Under this agreement, borrowing interest rate is equal to the sum of applicable margin of 1.00%, and applicable rate of 0.10%, plus the higher of (i) the Federal Funds Effective Rate and (ii) Overnight Bank Funding Rate. There is no annual commitment fee on the uncommitted line of credit. There was $25,000 annual administrative fee charged at the May 1, 2023 renewal. The Trust also has a secured, uncommitted $125,000,000 line of credit for the Alternative Strategies Fund with the Custodian, expiring on July 18, 2024. There is no annual commitment fee but, a non-refundable up-front fee of $50,000 paid for each yearly amendment. The line of credit is secured by a general security interest in substantially all of the Alternative Strategies Fund’s assets. Under this agreement, the borrowing rate is the Overnight Margin (1.25%) plus the higher of (i) the Federal Funds Effective Rate and (ii) the Overnight Bank Funding Rate.
| Notes to Financial Statements | 159 | |||||
Table of Contents
Litman Gregory Funds Trust
NOTES TO FINANCIAL STATEMENTS – (Continued)
Amounts outstanding to the Six Funds under the Facility at no time shall exceed in the aggregate at any time the least of (a) $75,000,000; (b) 10% of the value of the total assets of each Fund less such Fund’s total liabilities not represented by senior securities less the value of any assets of the Fund pledged to, or otherwise segregated for the benefit of a party other than the Custodian and in connection with a liability not reflected in the calculation of the Fund’s total liabilities. Amounts outstanding for the Alternative Strategies Fund at no time shall exceed in the aggregate at any time the lesser of the (a) Borrowing Base, (b) the Facility amount of $125,000,000 and (c) should not have an aggregate amount of outstanding senior securities representing indebtedness the least of (i) 33 1/3% of the Alternative Strategies Fund’s net assets and (ii) the maximum amount that the Fund would be permitted to incur pursuant to applicable law.
For the year ended December 31, 2023, the interest expense was $39,533 for Global Select Fund, $2,771 for Oldfield International Value Fund, $4,287 for SBH Focused Small Value Fund, $169,435 for Alternative Strategies Fund, $20,926 for High Income Fund, and $3,692 for Dolan McEniry Corporate Bond Fund. For the year ended December 31, 2023, there were no borrowings for the International Fund, and there was no balance outstanding at the end of the period. There was no balance outstanding at December 31, 2023 for the Global Select Fund, Alternative Strategies Fund, High Income Fund, and Dolan McEniry Corporate Bond Fund. The outstanding balance at December 31, 2023 for the Oldfield International Value Fund and the SBH Focused Small Value Fund was $800,000 and $2,000,000, respectively. The average borrowing for the year ended December 31, 2023 for the Global Select Fund for the period the line was drawn was $6,500,000, at an average borrowing rate of 5.4738%. The average borrowing for the year ended December 31, 2023 for the Oldfield International Value Fund for the period the line was drawn was $638,462, at an average borrowing rate of 5.8915%. The average borrowing for the year ended December 31, 2023 for the SBH Focused Small Value Fund for the period the line was drawn was $2,000,000, at an average borrowing rate of 6.4300%. The average borrowing for the year ended December 31, 2023 for the Alternative Strategies Fund for the period the line was drawn was $33,107,143, at an average borrowing rate of 6.5800%. The average borrowing for the year ended December 31, 2023 for the High lncome Fund for the period the line was drawn was $3,422,500, at an average borrowing rate of 5.4738%. The average borrowing for the year ended December 31, 2023 for the Dolan McEniry Corporate Bond Fund for the period the line was drawn was $11,699,294, at an average borrowing rate of 5.6800%. During the year ended December 31, 2023, the maximum borrowing was $6,500,000, $800,000, $2,000,000, $46,000,000, $5,700,000, and $11,699,294 for the Global Select Fund, Oldfield International Value Fund, SBH Focused Small Value Fund, Alternative Strategies Fund, High Income Fund, and Dolan McEniry Corporate Bond Fund, respectively.
Note 11 – Principal Risks
Below are summaries of the principal risks of investing in one or more of the Funds, each of which could adversely affect a Fund’s net asset value, yield and total return. Each risk listed below does not necessarily apply to each Fund, and you should read a Fund’s prospectus carefully for a description of the principal risks associated with investing in a particular Fund.
| • | Asset-Backed Securities Risk. This is the risk that the impairment of the value of the collateral underlying a security in which the Alternative Strategies Fund and the High Income Fund invest, such as the non-payment of loans, will result in a reduction in the value of the security. The value of these securities may also fluctuate in response to the market’s perception of the value of issuers or collateral. |
| • | Below Investment-Grade Fixed Income Securities Risk. This is the risk of investing in below investment-grade fixed income securities (also known as “junk bonds”), which may be greater than that of higher rated fixed income securities. These securities are rated Ba1 through C by Moody’s Investors Service (“Moody’s”) or BB+ through D by Standard & Poor’s Rating Group (“S&P”) (or comparably rated by another nationally recognized statistical rating organization), or, if not rated by Moody’s or S&P, are considered by the sub-advisors to be of similar quality. These securities have greater risk of default than higher rated securities. The market value of these securities is more sensitive to corporate developments and economic conditions and can be volatile. Market conditions can diminish liquidity and make accurate valuations difficult to obtain. There is no limit to the Alternative Strategies Fund’s ability to invest in below investment-grade fixed income securities; however, under normal market conditions, it does not expect to invest more than 50% of its total assets in below investment-grade fixed income securities. |
| • | Capital Structure Arbitrage Risk. The perceived mispricing identified by the sub-advisor may not disappear or may even increase, in which case losses may be realized. |
| • | Collateral Risk. If the Alternative Strategies Fund, High Income Fund, DBi Managed Futures Strategy ETF, and DBi Hedge Strategy ETF ‘s financial instruments are secured by collateral, the issuer may have difficulty liquidating the collateral and/or the Fund may have difficulty enforcing its rights under the terms of the securities if an issuer defaults. Collateral may be insufficient or the Fund’s right to the collateral may be set aside by a court. Collateral will generally consist of assets that may not be readily liquidated, including for example, equipment, inventory, work in the process of manufacture, real property and payments to become due under contracts or other receivable obligations. There is no assurance that the liquidation of those assets would satisfy an issuer’s obligations under a financial instrument. Non-affiliates and affiliates of issuers of financial instruments may provide collateral in the form of secured and unsecured guarantees and/or security interests in assets that they own, which may also be insufficient to satisfy an issuer’s obligations under a financial instrument. |
| • | Collateralized Loan Obligations and Collateralized Debt Obligations Risk. Collateralized loan obligations (“CLOs”) bear many of the same risks as other forms of asset-backed securities, including interest rate risk, credit risk and default risk. As they are backed by pools of loans, CLOs also bear similar risks to investing in loans directly. CLOs issue classes or “tranches” that vary in risk and yield. CLOs may |
| 160 | Litman Gregory Funds Trust | |||||
Table of Contents
Litman Gregory Funds Trust
NOTES TO FINANCIAL STATEMENTS – (Continued)
| experience substantial losses attributable to loan defaults. Losses caused by defaults on underlying assets are borne first by the holders of subordinate tranches. The Alternative Strategies Fund and High Income Fund’s investment in CLOs may decrease in market value when the CLO experiences loan defaults or credit impairment, the disappearance of a subordinate tranche, or market anticipation of defaults and investor aversion to CLO securities as a class. |
Collateralized debt obligations (“CDOs”) are structured similarly to CLOs and bear the same risks as CLOs including interest rate risk, credit risk and default risk. CDOs are subject to additional risks because they are backed by pools of assets other than loans including securities (such as other asset-backed securities), synthetic instruments or bonds and may be highly leveraged. Like CLOs, losses incurred by a CDO are borne first by holders of subordinate tranches. Accordingly, the risks of CDOs depend largely on the type of underlying collateral and the tranche of CDOs in which the Fund invests. For example, CDOs that obtain their exposure through synthetic investments entail the risks associated with derivative instruments.
| • | Commodity Risk. Exposure to the commodities markets (including financial futures markets) may subject the DBi Managed Futures Strategy ETF, through its investment in a wholly-owned subsidiary (the “Subsidiary”), and the Alternative Strategies Fund, through its investment in a wholly-owned subsidiary (the “Alternative subsidiary”), which are each organized under the laws of the Cayman Islands and is advised by its respective sub-advisor, to greater volatility than investments in traditional securities. Prices of commodities and related contracts may fluctuate significantly over short periods for a variety of reasons, including changes in interest rates, supply and demand relationships and balances of payments and trade; weather and natural disasters; governmental, agricultural, trade, fiscal, monetary and exchange control programs and policies, public health crises and trade or price wars among commodity producers or buyers. The commodity markets are subject to temporary distortions and other disruptions. U.S. futures exchanges and some foreign exchanges have regulations that limit the amount of fluctuation in futures contract prices which may occur during a single business day. Limit prices have the effect of precluding trading in a particular contract or forcing the liquidation of contracts at disadvantageous times or prices. |
| • | Communications Services Sector Risk. A Fund may invest a portion of its assets in the communications services sector. Media and communications companies may be significantly affected by product and service obsolescence due to technological advancement or development, competitive pressures, substantial capital requirements, fluctuating demand and changes in regulation. |
| • | Consumer Discretionary Sector Risk. A Fund may invest a portion of its assets in the consumer discretionary sector. The success of consumer product manufacturers and retailers is tied closely to the performance of the overall domestic and international economy, interest rates, competition and consumer confidence. Success depends heavily on disposable household income and consumer spending. Changes in demographics and consumer tastes can also affect the demand for, and success of, consumer products and services in the marketplace. |
| • | Consumer Staples Sector Risk. Certain of the Funds, through the implementation of their respective investment strategies, may from time to time invest a significant portion of their assets in the consumer staples sector, which includes, for example, the food and staples retailing industry, the food, beverage and tobacco industry and the household and personal products industry. This sector can be significantly affected by, among other factors, the regulation of various product components and production methods, marketing campaigns and changes in the global economy, consumer spending and consumer demand. Tobacco companies, in particular, may be adversely affected by new laws, regulations and litigations. Companies in the consumer staples sector may also be adversely affected by changes or trends in commodity prices, which may be influenced by unpredictable factors. These companies may be subject to severe competition, which may have an adverse impact on their profitability. |
| • | Convertible Arbitrage Risk. Arbitrage strategies involve engaging in transactions that attempt to exploit price differences of identical, related or similar securities on different markets or in different forms. A Fund may realize losses or reduced rate of return if underlying relationships among securities in which investment positions are taken change in an adverse manner or a transaction is unexpectedly terminated or delayed. Trading to seek short-term capital appreciation can be expected to cause the Fund’s portfolio turnover rate to be substantially higher than that of the average equity-oriented investment company, resulting in higher transaction costs and additional capital gains tax liabilities. |
| • | Convertible Securities Risk. This is the risk that the market value of convertible securities may fluctuate due to changes in, among other things, interest rates; other general economic conditions; industry fundamentals; market sentiment; the issuer’s operating results, financial statements, and credit ratings; and the market value of the underlying common or preferred stock. |
| • | Corporate Debt Obligations Risk. Corporate debt obligations are subject to the risk of an issuer’s inability to meet principal and interest payments on the obligations. Therefore, the Alternative Strategies Fund, the High Income Fund, and the Dolan McEniry Corporate Bond Fund may be indirectly exposed to such risks associated with corporate debt obligations. |
| • | Country/Regional Risk. World events – such as political upheaval, financial troubles, or natural disasters – may adversely affect the value of securities issued by companies in foreign countries or regions. Because each of the Global Select Fund, International Fund, and Oldfield International Value Fund may invest a large portion of its assets in securities of companies located in any one country or region, |
| Notes to Financial Statements | 161 | |||||
Table of Contents
Litman Gregory Funds Trust
NOTES TO FINANCIAL STATEMENTS – (Continued)
| including emerging markets, the Fund’s performance may be hurt disproportionately by the poor performance of its investments in that area. This risk is heightened in emerging markets. |
| • | Currency Risk. This is the risk that investing in foreign currencies may expose the Fund to fluctuations in currency exchange rates and that such fluctuations in the exchange rates may negatively affect an investment related to a currency or denominated in a foreign currency. The Alternative Strategies Fund may invest in foreign currencies for investment and hedging purposes. All of the Funds may invest in foreign currencies for hedging purposes. |
| • | Cybersecurity Risk. Information and technology systems relied upon by the Funds, the Advisor, the sub-advisors, the Funds’ service providers (including, but not limited to, Fund accountants, custodians, transfer agents, administrators, distributors and other financial intermediaries) and/or the issuers of securities in which a Fund invests may be vulnerable to damage or interruption from computer viruses, network failures, computer and telecommunication failures, infiltration by unauthorized persons, security breaches, usage errors, power outages and catastrophic events such as fires, tornadoes, floods, hurricanes and earthquakes. Although the Advisor has implemented measures to manage risks relating to these types of events, if these systems are compromised, become inoperable for extended periods of time or cease to function properly, significant investment may be required to fix or replace them. The failure of these systems and/or of disaster recovery plans could cause significant interruptions in the operations of the Funds, the Advisor, the sub-advisors, the Funds’ service providers and/or issuers of securities in which a Fund invests and may result in a failure to maintain the security, confidentiality or privacy of sensitive data, including personal information relating to investors (and the beneficial owners of investors). Such a failure could also harm the reputation of the Funds, the Advisor, the sub-advisors, the Funds’ service providers and/or issuers of securities in which a Fund invests, subject such entities and their respective affiliates to legal claims or otherwise affect their business and financial performance. |
| • | Derivatives Risk. This is the risk that an investment in derivatives may not correlate completely to the performance of the underlying securities and may be volatile and that the insolvency of the counterparty to a derivative instrument could cause the Fund to lose all or substantially all of its investment in the derivative instrument, as well as the benefits derived therefrom. |
| • | Options Risk. This is the risk that an investment in options may be subject to greater fluctuation than an investment in the underlying instruments themselves and may be subject to a complete loss of the amounts paid as premiums to purchase the options. |
| • | Futures Contracts Risk. This is the risk that an investment in futures contracts may be subject to losses that exceed the amount of the premiums paid and may subject the Fund’s net asset value to greater volatility. |
| • | P-Notes Risk. This is the risk that the performance results of P-Notes will not replicate exactly the performance of the issuers or markets that the P-Notes seek to replicate. Investments in P-Notes involve risks normally associated with a direct investment in the underlying securities as well as additional risks, such as counterparty risk. |
| • | Swaps Risk. Risks inherent in the use of swaps include: (1) swap contracts may not be assigned without the consent of the counterparty; (2) potential default of the counterparty to the swap; (3) absence of a liquid secondary market for any particular swap at any time; and (4) possible inability of the Fund to close out the swap transaction at a time that otherwise would be favorable for it to do so. |
| • | Emerging Markets Risk. A Fund may invest a portion of its assets in emerging market countries. Emerging market countries are those with immature economic and political structures, and investing in emerging markets entails greater risk than in developed markets. Such risks could include those related to government dependence on a few industries or resources, government-imposed taxes on foreign investment or limits on the removal of capital from a country, unstable government, and volatile markets. |
| • | Equity Hedge Strategy Risk. The DBi Hedge Strategy ETF uses various investment strategies that seek to identify the main drivers of performance of a diversified portfolio of the largest long/short equity hedge funds. These investment strategies involve the use of complex derivatives techniques, and there is no guarantee that these strategies will succeed. The use of such strategies and techniques may subject the Fund to greater volatility and loss than investing in individual equity securities. There can be no assurance that utilizing a certain approach or model will achieve a particular level of return or reduce volatility and loss. |
| • | Equity Securities Risk. This is the risk that the value of equity securities may fluctuate, sometimes rapidly and unpredictably, due to factors affecting the general market, an entire industry or sector, or particular companies. These factors include, without limitation, adverse changes in economic conditions, the general outlook for corporate earnings, interest rates or investor sentiment; increases in production costs; and significant management decisions. This risk is greater for small- and medium-sized companies, which tend to be more vulnerable to adverse developments than larger companies. |
| • | ETF Risk. The DBi Managed Futures Strategy ETF, the DBi Hedge Strategy ETF, the RBA Responsible Global Allocation ETF, and the Berkshire Dividend Growth ETF are each an ETF, and, as a result of an ETF’s structure, each is exposed to the following risks: |
| • | Authorized Participants, Market Makers, and Liquidity Providers Limitation Risk. The Fund has a limited number of financial institutions that may act as Authorized Participants (“APs”). In addition, there may be a limited number of market makers and/or |
| 162 | Litman Gregory Funds Trust | |||||
Table of Contents
Litman Gregory Funds Trust
NOTES TO FINANCIAL STATEMENTS – (Continued)
| liquidity providers in the marketplace. To the extent either of the following events occur, shares of the Fund (“Shares”) may trade at a material discount to NAV and possibly face delisting: (i) APs exit the business or otherwise become unable to process creation and/or redemption orders and no other APs step forward to perform these services, or (ii) market makers and/or liquidity providers exit the business or significantly reduce their business activities and no other entities step forward to perform their functions. |
| • | Cash Redemption Risk. The Fund’s investment strategy may require it to redeem Shares for cash or to otherwise include cash as part of its redemption proceeds. The Fund may be required to sell or unwind portfolio investments to obtain the cash needed to distribute redemption proceeds. This may cause the Fund to recognize a capital gain that it might not have recognized if it had made a redemption in-kind. As a result, the Fund may pay out higher annual capital gain distributions than if the in-kind redemption process was used. |
| • | Costs of Buying or Selling Shares. Due to the costs of buying or selling Shares, including brokerage commissions imposed by brokers and bid/ask spreads, frequent trading of Shares may significantly reduce investment results and an investment in Shares may not be advisable for investors who anticipate regularly making small investments. |
| • | Shares May Trade at Prices Other Than NAV. As with all ETFs, Shares may be bought and sold in the secondary market at market prices. Although it is expected that the market price of Shares will approximate the Fund’s NAV, there may be times when the market price of Shares is more than the NAV intra-day (premium) or less than the NAV intra-day (discount) due to supply and demand of Shares or during periods of market volatility. This risk is heightened in times of market volatility and volatility in the Fund’s portfolio holdings, periods of steep market declines, and periods when there is limited trading activity for Shares in the secondary market, in which case such premiums or discounts may be significant. If an investor purchases Shares at a time when the market price is at a premium to the NAV of the Shares or sells at a time when the market price is at a discount to the NAV of the Shares, then the investor may sustain losses that are in addition to any losses caused by a decrease in NAV. |
| • | Trading. Although Shares are listed for trading on a national securities exchange, and may be traded on other U.S. exchanges, there can be no assurance that Shares will trade with any volume, or at all, on any stock exchange. In stressed market conditions, the liquidity of Shares may begin to mirror the liquidity of the Fund’s underlying portfolio holdings, which can be significantly less liquid than Shares. |
| • | European Investment Risk. Each of the Global Select Fund, International Fund and Oldfield International Value Fund may invest a significant portion of its assets in issuers based in Western Europe and the United Kingdom (“UK”). The economies of countries in Europe are often closely connected and interdependent, and events in one country in Europe can have an adverse impact on other European countries. Efforts by the member countries of the European Union (“EU”) to continue to unify their economic and monetary policies may increase the potential for similarities in the movements of European markets and reduce the potential investment benefits of diversification within the region. However, the substance of these policies may not address the needs of all European economies. European financial markets have in recent years experienced increased volatility due to concerns with some countries’ high levels of sovereign debt, budget deficits and unemployment. Markets have also been affected by the withdrawal of the UK from the EU (an event commonly known as “Brexit”). On January 31, 2020, the UK officially withdrew from the EU. While the long-term consequences of Brexit remain unclear, Brexit has already resulted in periods of volatility in European and global financial markets. There remains significant market uncertainty regarding Brexit’s ramifications, and the range and potential implications of possible political, regulatory, economic and market outcomes are difficult to predict. The U.K. and Europe may be less stable than they have been in recent years, and investments in the U.K. and the EU may be difficult to value, or subject to greater or more frequent volatility. In the longer term, there is likely to be a period of significant political, regulatory and commercial uncertainty as the U.K. seeks to negotiate the terms of its future trading relationships. The U.K. and European economies and the broader global economy could be significantly impacted, which could potentially have an adverse effect on the value of a Fund’s investments. Brexit may also cause additional member states to contemplate departing from the EU, which would likely perpetuate political and economic instability in the region and cause additional market disruption in global financial markets. |
| • | Event-Driven Risk. Event-driven strategies seek to profit from the market inefficiencies surrounding market events, such as mergers, acquisitions, asset sales, restructurings, refinancings, recapitalizations, reorganizations or other special situations. Event-driven investing involves attempting to predict the outcome of a particular transaction as well as the optimal time at which to commit capital to it. Event-driven opportunities involve difficult legal as well as financial analysis, as some of the principal impediments to the consummation of major corporate events are often legal or regulatory rather than economic. In addition, certain of the securities issued in the context of major corporate events include complex call, put and other features, and it is difficult to precisely evaluate the terms and embedded option characteristics of these securities. A Fund may take both long and short positions in a wide range of securities, derivatives and other instruments in implementing its event-driven strategies. |
| • | Financial Sector Risk. A Fund may invest a portion of its assets in the financial services sector and, therefore, the performance of the Fund could be negatively impacted by events affecting this sector, including changes in interest rates, government regulation, the rate of defaults on corporate, consumer and government debt and the availability and cost of capital. |
| Notes to Financial Statements | 163 | |||||
Table of Contents
Litman Gregory Funds Trust
NOTES TO FINANCIAL STATEMENTS – (Continued)
| • | Fixed Income Securities Risk. Interest rates may go up resulting in a decrease in value of the securities held by a Fund. Fixed income securities held by a Fund are also subject to interest rate risk, credit risk, call risk and liquidity risk, which are more fully described below. |
| • | Credit Risk. Credit risk is the risk that an issuer will not make timely payments of principal and interest. A credit rating assigned to a particular debt security is essentially an opinion as to the credit quality of an issuer and may prove to be inaccurate. There is also the risk that a bond issuer may “call,” or repay, its high yielding bonds before their maturity dates. |
| • | Interest Rate Risk. Interest rates may go up resulting in a decrease in the value of the securities held by a Fund. Interest rates have been historically low, so a Fund faces a heightened risk that interest rates may rise. Debt securities subject to prepayment can offer less potential for gains during a declining interest rate environment and similar or greater potential for loss in a rising interest rate environment. |
| • | Call Risk. During periods of declining interest rates, a bond issuer may “call” or repay its high yielding bonds before their maturity dates. |
| • | Liquidity Risk. Certain securities may be difficult or impossible to sell at the time and the price that a Fund would like. Trading opportunities are more limited for fixed income securities that have not received any credit ratings, have received ratings below investment grade or are not widely held. The values of these securities may fluctuate more sharply than those of other securities, and a Fund may experience some difficulty in closing out positions in these securities at prevailing market prices. |
| • | Foreign Investment and Emerging Markets Risks. This is the risk that an investment in foreign (non-U.S.) securities may cause the Funds to experience more rapid and extreme changes in value than a fund that invests exclusively in securities of U.S. companies, due to factors such as currency conversion rate fluctuations, currency blockages, political and economic instability, differences in financial reporting, accounting and auditing standards, nationalization, expropriation or confiscatory taxation, and smaller and less-strict regulation of securities markets. These risks are greater in emerging markets. There is no limit to the Alternative Strategies Fund’s ability to invest in emerging market securities; however, under normal market conditions, it does not expect to invest more than 50% of its total assets in emerging market securities; however, some Funds may invest a portion of their assets in stocks of companies based outside of the United States. |
| • | Forward Contracts Risk. Forward contracts involve an obligation to purchase or sell a specific currency at a future date, which may be any fixed number of days from the date of the contract as agreed by the parties in an amount and at a price set at the time of the contract. At the maturity of a forward contract, a fund may either accept or make delivery of the currency specified in the contract or, at or prior to maturity, enter into a closing transaction involving the purchase or sale of an offsetting contract. A Fund may invest in non-deliverable forwards, which are cash-settled, short-term forward contracts on foreign currencies that are non-convertible and that may be thinly traded or illiquid. The use of forward contracts involves various risks, including the risks associated with fluctuations in foreign currency and the risk that the counterparty will fail to fulfill its obligations. |
| • | General Market Risk; Recent Market Events. The value of a Fund’s shares will fluctuate based on the performance of the Fund’s investments and other factors affecting the securities markets generally. Certain investments selected for a Fund’s portfolio may be worth less than the price originally paid for them, or less than they were worth at an earlier time. The value of a Fund’s investments may go up or down, sometimes dramatically and unpredictably, based on current market conditions, such as real or perceived adverse political or economic conditions, inflation, changes in interest rates, lack of liquidity in the fixed income markets or adverse investor sentiment. |
| • | Healthcare Sector Risk. A Fund may invest a portion of its assets in the healthcare sector. The profitability of companies in the healthcare sector may be adversely affected by government regulations and government healthcare programs, increases or decreases in the cost of medical products and services and product liability claims, among other factors. Many healthcare companies are heavily dependent on patent protection, and the expiration of a company’s patent may adversely affect that company’s profitability. Healthcare companies are subject to competitive forces that may result in price discounting, and may be thinly capitalized and susceptible to product obsolescence. |
| • | Industrial Sector Risk. A Fund may invest a portion of its assets in the industrial sector. Companies in the industrial sector could be affected by, among other things, government regulation, world events and global economic conditions, insurance costs, and labor relations issues. |
| • | Investment in Investment Companies Risk. This is the risk that investing in other investment companies, including ETFs, CEFs, BDCs, unit investment trusts and open-end funds, subjects the Fund to those risks affecting the investment vehicle, including the possibility that the value of the underlying securities held by the investment vehicle could decrease or the portfolio becomes illiquid. Moreover, the High Income Fund and its shareholders will incur its pro rata share of the underlying vehicles’ expenses, which will reduce the Fund’s performance. In addition, investments in an ETF are subject to, among other risks, the risk that the ETF’s shares may trade at a discount or premium relative to the net asset value of the shares and the listing exchange may halt trading of the ETF’s shares. BDCs may carry risks similar to those of a private equity or venture capital fund. BDC company securities are not redeemable at the option of the |
| 164 | Litman Gregory Funds Trust | |||||
Table of Contents
Litman Gregory Funds Trust
NOTES TO FINANCIAL STATEMENTS – (Continued)
| shareholder and they may trade in the market at a discount to their net asset value. BDCs usually trade at a discount to their net asset value because they invest in unlisted securities and have limited access to capital markets. Shares of CEFs also frequently trade at a discount to their net asset value for those and other reasons. |
| • | Investment over 25% of Net assets. The RBA Responsible Global Allocation ETF invests greater than 25% of its assets in the iShares ESG Aware US Aggregate Bond ETF. The RBA Responsible Global Allocation ETF may redeem its investment at any time if the Advisor determines if it is in the best interest of the ETF and its shareholders to do so. The performance of the ETF will be directly affected by the performance of this investment. The financial statements of the investment, including the schedule of investments, can be found on the Securities and Exchange Commission’s website www.sec.gov and should be read in conjunction with the ETF’s financial statements. At December 31, 2023, the RBA Responsible Global Allocation ETF invested 28.4% of its net assets in the iShares ESG Aware US Aggregate Bond ETF. |
| • | Investment Selection Risk. The specific investments held in the Fund’s investment portfolio may underperform other funds in the same asset class or benchmarks that are representative of the general performance of the asset class because of a portfolio manager’s choice of securities. |
| • | Investments in Loan Risk. Investments in loans, including loan syndicates and other direct lending opportunities, involve special types of risks, including credit risk, interest rate risk, counterparty risk and prepayment risk. Loans may offer a fixed or floating interest rate. Loans are often generally below investment grade and may be unrated. The High Income Fund’s investments in loans can also be difficult to value accurately and may be more susceptible to liquidity risk than fixed-income instruments of similar credit quality and/or maturity. The Fund is also subject to the risk that the value of the collateral for the loan may be insufficient or unavailable to cover the borrower’s obligations should the borrower fail to make payments or become insolvent. Participations in loans may subject the Fund to the credit risk of both the borrower and the issuer of the participation and may make enforcement of loan covenants, if any, more difficult for the Fund as legal action may have to go through the issuer of the participations. Transactions in loans are often subject to long settlement periods, thus potentially limiting the ability of the Fund to invest sale proceeds in other investments and to use proceeds to meet its current redemption obligations. In addition, many banks have been weakened by the recent financial crisis, and it may be difficult for the Fund to obtain an accurate picture of a lending bank’s financial condition. |
| • | Japanese Investment Risk. Japan may be subject to political, economic, nuclear and labor risks, among others. Any of these risks, individually or in the aggregate, can impact an investment made in Japan. The growth of Japan’s economy has recently lagged that of its Asian neighbors and other major developed economies. Since 2000, Japan’s economic growth rate has generally remained low relative to other advanced economies, and it may remain low in the future. The Japanese economy faces several concerns, including a financial system with large levels of nonperforming loans, overleveraged corporate balance sheets, extensive cross-ownership by major corporations, a changing corporate governance structure, large government deficits, heavy dependence on international trade and oil and other commodity imports, an aging workforce and significant population decline, sometimes unpredictable national politics, political tensions with China, and natural disasters, such as earthquakes, volcanic eruptions, typhoons and tsunamis. Any of these concerns could negatively affect the value of Japanese investments. |
| • | Large Shareholder Purchase and Redemption Risk. This is the risk that a Fund may experience adverse effects when certain large shareholders purchase or redeem large amounts of shares of the Fund. Such large shareholder redemptions may cause the Fund to sell its securities at times when it would not otherwise do so, which may negatively impact the Fund’s net asset value and liquidity. Similarly, large share purchases may adversely affect the Fund’s performance to the extent that the Fund is delayed in investing new cash and is required to maintain a larger cash position than it ordinarily would. In addition, a large redemption could result in the Fund’s current expenses being allocated over a smaller asset base, leading to an increase in the Fund’s expense ratio. |
| • | Leverage Risk. This is the risk that leverage may cause the effect of an increase or decrease in the value of the Alternative Strategies Fund’s portfolio securities to be magnified and the Fund to be more volatile than if leverage was not used. Leverage may result from certain transactions, including the use of derivatives and borrowing. Under normal circumstances, the Alternative Strategies Fund may borrow amounts up to one third of the value of its total assets except that it may exceed this limit to satisfy redemption requests or for other temporary purposes. |
| • | LIBOR Risk. LIBOR is used extensively in the U.S. and globally as a “benchmark” or “reference rate” for various commercial and financial contracts, including corporate and municipal bonds, bank loans, asset-backed and mortgage-related securities, interest rate swaps and other derivatives. For example, debt securities in which a Fund invests may pay interest at floating rates based on LIBOR or may be subject to interest caps or floors based on LIBOR. A Fund’s derivative investments may also reference LIBOR. In addition, issuers of instruments in which a Fund invests may obtain financing at floating rates based on LIBOR, and a Fund may use leverage or borrowings based on LIBOR. In July 2017, the head of the United Kingdom Financial Conduct Authority announced the intention to phase out the use of LIBOR by the end of 2021. There is currently no definitive information regarding the future utilization of LIBOR or of any particular replacement reference rate. Abandonment of or modifications to LIBOR could have adverse impacts on newly issued financial instruments and existing financial instruments that reference LIBOR. |
| Notes to Financial Statements | 165 | |||||
Table of Contents
Litman Gregory Funds Trust
NOTES TO FINANCIAL STATEMENTS – (Continued)
| • | Liquidity and Valuation Risk. It may be difficult for the Fund to purchase and sell particular investments within a reasonable time at a fair price, or the price at which it has been valued by iM Global for purposes of the Fund’s net asset value, causing the Fund to be less liquid and unable to realize what iM Global believes should be the price of the investment. Valuation of portfolio investments may be difficult, such as during periods of market turmoil or reduced liquidity, and for investments that may, for example, trade infrequently or irregularly. In these and other circumstances, an investment may be valued using fair value methodologies, which are inherently subjective, reflect good faith judgments based on available information and may not accurately estimate the price at which the Fund could sell the investment at that time. These risks may be heightened for fixed-income instruments because of the near historically low interest rate environment as of the date of this prospectus. Based on its investment strategies, a significant portion of the Fund’s investments can be difficult to value and potentially less liquid and thus particularly prone to the foregoing risks. |
| • | Long Short Risk. The DBi Hedge Strategy ETF seeks long exposure to certain factors and short exposure to certain other factors. The Fund may or may not take long or short positions in correlated asset classes. The Fund could lose money if either or both of the Fund’s long and short positions produce negative returns. The sub-advisor’s proprietary, quantitative model, the Dynamic Beta Engine, may or may not identify long and short positions in correlated asset classes. There is no guarantee that the returns of the Fund’s long and short positions will produce positive returns. |
| • | Managed Futures Strategy Risk. In seeking to achieve its investment objective, the DBi Managed Futures Strategy ETF will utilize various investment strategies that involve the use of complex investment techniques, and there is no guarantee that these strategies will succeed. The use of such strategies and techniques may subject the Fund to greater volatility and loss. There can be no assurance that utilizing a certain approach or model will achieve a particular level of return or reduce volatility and loss. |
| • | Merger Arbitrage Risk. This is the risk that a proposed reorganization in which the Alternative Strategies Fund invests may be renegotiated or terminated. |
| • | Mid-Sized Companies Risk. Securities of companies with mid-sized market capitalizations are generally more volatile and less liquid than the securities of large-capitalization companies. Mid-sized companies may be more reliant on a few products, services or key personnel, which can make it riskier than investing in larger companies with more diverse product lines and structured management. Mid-sized companies may have relatively short operating histories or may be newer public companies. Some of these companies have more aggressive capital structures, including higher debt levels, than large-cap companies, or are involved in rapidly growing or changing industries and/or new technologies, which pose additional risks. |
| • | Models and Data Risk. The Alternative Strategies Fund uses proprietary systematic and quantitative models as part of its investment strategies. These models may fail to identify profitable opportunities at any time. Furthermore, the models may incorrectly identify opportunities and these misidentified opportunities may lead to substantial losses for the Fund. Models may be predictive in nature and such models may result in an incorrect assessment of future events. Data used in the construction of models may prove to be inaccurate or stale, which may result in losses for the Fund. |
| • | Mortgage-Backed Securities Risk. This is the risk of investing in mortgaged-backed securities, which includes interest rate risk, prepayment risk and the risk of defaults on the mortgage loans underlying these securities. |
| • | Multi-Style Management Risk. Because portions of a Fund’s assets are managed by different portfolio managers using different styles, the Fund could experience overlapping security transactions. Certain portfolio managers may be purchasing securities at the same time other portfolio managers may be selling those same securities, which may lead to higher transaction expenses compared to a Fund using a single investment management style. |
| • | Non-Diversified Fund Risk. Because each of the DBi Managed Futures Strategy ETF and the DBi Hedge Strategy ETF is “non-diversified,” each may invest a greater percentage of its assets in the securities of a single issuer. As a result, a decline in the value of an investment in a single issuer could cause a Fund’s overall value to decline to a greater degree than if the Fund held a more diversified portfolio. |
| • | Portfolio Turnover Risk. This is the risk that a Fund may experience high portfolio turnover rates as a result of its investment strategies. High portfolio turnover rates may indicate higher transaction costs and may result in higher taxes when shares of a Fund are held in a taxable account as compared to shares in investment companies that hold investments for a longer period. High portfolio turnover involves correspondingly greater expenses to a Fund, including brokerage commissions or dealer mark-ups and other transaction costs on the sale of securities and reinvestments in other securities, which may result in adverse tax consequences to a Fund’s shareholders as compared to shares in investment companies that hold investments for a longer period. |
| • | Prepayment and Extension Risk. In times of declining interest rates, a Fund’s higher yielding securities will be prepaid, and the Fund will have to replace them with securities having a lower yield. Rising interest rates could extend the life of securities with lower payment rates. This is known as extension risk and may increase a Fund’s sensitivity to rising rates and its potential for price declines. |
| • | Public Health Emergency Risk. This is the risk that pandemics and other public health emergencies, including outbreaks of infectious diseases such as the current outbreak of the novel coronavirus (“COVID-19”), can result, and in the case of COVID-19 is resulting, in |
| 166 | Litman Gregory Funds Trust | |||||
Table of Contents
Litman Gregory Funds Trust
NOTES TO FINANCIAL STATEMENTS – (Continued)
| market volatility and disruption, and materially and adversely impact economic conditions in ways that cannot be predicted, all of which could result in substantial investment losses. Containment efforts and related restrictive actions by governments and businesses have significantly diminished and disrupted global economic activity across many industries. Less developed countries and their health systems may be more vulnerable to these impacts. The ultimate impact of COVID-19 or other health emergencies on global economic conditions and businesses is impossible to predict accurately. Ongoing and potential additional material adverse economic effects of indeterminate duration and severity are possible. The resulting adverse impact on the value of an investment in a Fund could be significant and prolonged. |
| • | Sector Concentration Risk. The SBH Focused Small Value Fund concentrates its investments in a narrow segment of the total market. At December 31, 2023, the Fund has 29.5% of net assets invested in the Industrials sector of the stock market. Because of this, the Fund is subject to certain additional risks as compared to investing in a more diversified portfolio of investments. |
| • | Sector Weightings Risk. To the extent that a Fund emphasizes, from time to time, investments in a particular sector, the Fund will be subject to a greater degree to the risks particular to that sector. Market conditions, interest rates, and economic, regulatory, or financial developments could significantly affect a single sector. By focusing its investments in a particular sector, a Fund may face more risks than if it were diversified broadly over numerous sectors. |
| • | Short Position Risk. A Fund will incur a loss as a result of a short position if the price of the short position instrument increases in value between the date of the short position sale and the date on which the Fund purchases an offsetting position. Short positions may be considered speculative transactions and involve special risks, including greater reliance on the ability to accurately anticipate the future value of a security or instrument. A Fund’s losses are potentially unlimited in a short position transaction. |
| • | Short Sale Risk. This is the risk that the value of a security the Alternative Strategies Fund sells short does not go down as expected. The risk of loss is theoretically unlimited if the value of the security sold short continues to increase. In addition, short sales may cause the Alternative Strategies Fund to be compelled, at a time disadvantageous to it, to buy the security previously sold short, thus resulting in a loss. To meet current margin requirements, the Alternative Strategies Fund is required to deposit with the broker additional cash or securities so that the total deposit with the broker is maintained daily at 150% of the current market value of the securities sold short. |
| • | Smaller Companies Risk. A Fund may invest a portion of its assets in the securities of small- and mid-sized companies. Securities of small and mid-cap companies are generally more volatile and less liquid than the securities of large-cap companies. This is because smaller companies may be more reliant on a few products, services or key personnel, which can make it riskier than investing in larger companies with more diverse product lines and structured management. |
| • | Special Situations Risk. Investments in special situations (undervalued equities, merger arbitrage situations, distressed companies, etc.) may involve greater risks when compared to other investments a Fund may make due to a variety of factors. For example, mergers, acquisitions, reorganizations, liquidations or recapitalizations may fail or not be completed on the terms originally contemplated, and expected developments may not occur in a timely manner, if at all. |
| • | Subsidiary Risk. By investing in the Subsidiary and the Alternative Subsidiary, the DBi Managed Futures Strategy ETF and the Alternative Strategies Fund, respectively, is indirectly exposed to the risks associated with the Subsidiary’s and the Alternative Subsidiary’s investments. The derivatives and other investments held by the Subsidiary and the Alternative Subsidiary are generally similar to those that are permitted to be held by each Fund and are subject to the same risks that apply to similar investments if held directly by each Fund. The Subsidiary and the Alternative Subsidiary are each not registered under the 1940 Act, and, unless otherwise noted in the Prospectus, are not subject to all the investor protections of the 1940 Act. Changes in the laws of the United States and/or the Cayman Islands could result in the inability of each Fund and/or the Subsidiary or the Alternative Subsidiary to continue to operate as each does currently and could adversely affect each Fund. |
| • | Tax Risk. The federal income tax treatment of the DBi Managed Futures Strategy ETF’s and the Alternative Strategies Fund’s income from the Subsidiary and the Alternative Subsidiary, respectively, may be negatively affected by future legislation, Treasury Regulations (proposed or final), and/or other Internal Revenue Service (“IRS”) guidance or authorities that could affect the character, timing of recognition, and/or amount of each Fund’s investment company taxable income and/ or net capital gains and, therefore, the distributions it makes. If a Fund failed the source of income test for any taxable year but was eligible to and did cure the failure, it could incur potentially significant additional federal income tax expenses. If, on the other hand, a Fund failed to qualify as a RIC for any taxable year and was ineligible to or otherwise did not cure the failure, it would be subject to federal income tax at the fund-level on its taxable income at the regular corporate tax rate (without reduction for distributions to shareholders), with the consequence that its income available for distribution to shareholders would be reduced and distributions from its current or accumulated earnings and profits would generally be taxable to its shareholders as dividend income. |
Changes in the laws of the United States and/or the Cayman Islands could result in the inability of a Fund and/or the Subsidiary or the Alternative Subsidiary to operate as described in the Prospectus and the Statement of Additional Information (“SAI”) and could adversely affect each Fund. For example, the Cayman Islands does not currently impose any income, corporate or capital gains tax or withholding
| Notes to Financial Statements | 167 | |||||
Table of Contents
Litman Gregory Funds Trust
NOTES TO FINANCIAL STATEMENTS – (Continued)
tax on the Subsidiary or the Alternative Subsidiary. If Cayman Islands law changes such that the Subsidiary or the Alternative Subsidiary must pay Cayman Islands taxes, Fund shareholders would likely suffer decreased investment returns.
| • | TBAs and Dollar Rolls Risk. TBA (“to-be-announced”) and dollar roll transactions present special risks to the Alternative Strategies Fund. Although the particular TBA securities must meet industry-accepted “good delivery” standards, there can be no assurance that a security purchased on a forward commitment basis will ultimately be issued or delivered by the counterparty. During the settlement period, the Fund will still bear the risk of any decline in the value of the security to be delivered. TBAs and other forward settling securities involve leverage because they can provide investment exposure in an amount exceeding the fund’s initial investment. Leverage can magnify investment risks and cause losses to be realized more quickly. While dollar roll transactions involve the simultaneous purchase and sale of substantially similar TBA securities with different settlement dates, these transactions do not require the purchase and sale of identical securities so the characteristics of the security delivered to the Fund may be less favorable than the security delivered to the dealer. |
| • | Technology Investment Risk. A Fund may invest a portion of its assets in the technology sector, which is a very volatile segment of the market. The nature of technology is that it is rapidly changing. Therefore, products or services that may initially look promising may subsequently fail or become obsolete. In addition, many technology companies are younger, smaller and unseasoned companies which may not have established products, an experienced management team, or earnings history. |
| • | Unfavorable Tax Treatment Risk. This is the risk that a material portion of the Alternative Strategies Fund’s return could be in the form of net investment income or short-term capital gains, some of which may be distributed to shareholders and taxed at ordinary income tax rates. Therefore, shareholders may have a greater need to pay regular taxes than compared to other investment strategies that hold investments longer. Due to this investment strategy, it may be preferable for certain shareholders to invest in the Fund through pre-tax or tax-deferred accounts as compared to investment through currently taxable accounts. Potential shareholders are encouraged to consult their tax advisors in this regard. |
| • | U.S. Government and U.S. Agency Obligations Risk. Securities issued by U.S. Government agencies and instrumentalities have different levels of U.S. Government credit support. Some are backed by the full faith and credit of the U.S. Government, while others are supported by only the discretionary authority of the U.S. Government or only by the credit of the agency or instrumentality. No assurance can be given that the U.S. Government will provide financial support to U.S. Government-sponsored instrumentalities because they are not obligated to do so by law. Guarantees of timely prepayment of principal and interest do not assure that the market prices and yields of the securities are guaranteed nor do they guarantee the NAV or performance of a Fund, which will vary with changes in interest rates, the sub-advisor’s performance and other market conditions. |
| • | Value Stock Risk. Value stocks are stocks of companies that may have experienced adverse business or industry developments or may be subject to special risks that have caused the stocks to be out of favor and, in the opinion of the manager, undervalued. The value of a security believed by a manager to be undervalued may never reach what is believed to be its full (intrinsic) value, or such security’s value may decrease. |
Note 12 – Subsequent Event
On February 12, 2024, the Board of Trustees approved a plan to liquidate the iMGP RBA Responsible Global Allocation ETF. On or about April 17, 2024 (the “Liquidation Date”), iMGP RBA Responsible Global Allocation ETF will cease operations, liquidate its assets, and prepare to distribute proceeds to shareholders of record on the Liquidation Date.
| 168 | Litman Gregory Funds Trust | |||||
Table of Contents
REPORT OF INDEPENDENT REGISTERED PUBLIC ACCOUNTING FIRM
To the Shareholders and Board of Trustees of
Litman Gregory Funds Trust
Opinion on the Financial Statements
We have audited the accompanying statements of assets and liabilities, including the schedules of investments in securities, purchased options, securities sold short, forward foreign currency exchange contracts, futures contracts, swaps, and written options, of Litman Gregory Funds Trust comprising the funds listed below (the “Funds”) as of December 31, 2023, and the related statements of operations, the statements of changes in net assets, the related notes, and the financial highlights for each of the periods indicated below (collectively referred to as the “financial statements”). In our opinion, the financial statements present fairly, in all material respects, the financial position of each of the Funds as of December 31, 2023, the results of their operations, the changes in net assets, and the financial highlights for each of the periods indicated below in conformity with accounting principles generally accepted in the United States of America.
| Fund Name | Statements of Operations | Statements of Changes in Net Assets | Financial Highlights | |||
| iMGP Global Select Fund, iMGP International Fund, iMGP Alternative Strategies Fund*, and iMGP High Income Fund (formerly iMGP High Income Alternatives Fund) | For the year ended December 31, 2023 | For the years ended December 31, 2023 and 2022 | For the years ended December 31, 2023, 2022, 2021, 2020, and 2019 | |||
| iMGP Oldfield International Value Fund | For the year ended December 31, 2023 | For the years ended December 31, 2023 and 2022 | For years ended December 31, 2023, 2022, 2021 and for the period from November 30, 2020 (commencement of operations) through December 31, 2020 | |||
| iMGP SBH Focused Small Value Fund | For the year ended December 31, 2023 | For the years ended December 31, 2023 and 2022 | For the years ended December 31, 2023, 2022, 2021 and for the period from July 31, 2020 (commencement of operations) through December 31, 2020 | |||
| iMGP Dolan McEniry Corporate Bond Fund, iMGP DBi Managed Futures Strategy ETF**, and iMGP DBi Hedge Strategy ETF | For the year ended December 31, 2023 | For the years ended December 31, 2023 and 2022 | For years ended December 31, 2023, 2022 and 2021 | |||
| iMGP RBA Responsible Global Allocation ETF | For the year ended December 31, 2023 | For year ended December 31, 2023 and the period from January 31, 2022 (commencement of operations) through December 31, 2022 | For year ended December 31, 2023 and the period from January 31, 2022 (commencement of operations) through December 31, 2022 | |||
| iMGP Berkshire Dividend Growth ETF | For the period from June 29, 2023 (commencement of operations) through December 31, 2023 | |||||
| * | The financial statements and financial highlights for the years ended December 31, 2023 and December 31, 2022 are Consolidated Financial Statements |
| ** | The financial statements referred to above are Consolidated Financial Statements |
The iMGP Dolan McEniry Corporate Bond Fund, iMGP DBi Managed Futures Strategy ETF, and iMGP DBi Hedge Strategy ETF financial highlights for the periods ended December 31, 2020, and prior, were audited by other auditors whose report dated February 25, 2021, expressed an unqualified opinion on those financial statements and financial highlights.
Basis for Opinion
These financial statements are the responsibility of the Funds’ management. Our responsibility is to express an opinion on the Funds’ financial statements based on our audits. We are a public accounting firm registered with the Public Company Accounting Oversight Board (United States) (“PCAOB”) and are required to be independent with respect to the Funds in accordance with the U.S. federal securities laws and the applicable rules and regulations of the Securities and Exchange Commission and the PCAOB.
We conducted our audits in accordance with the standards of the PCAOB. Those standards require that we plan and perform the audit to obtain reasonable assurance about whether the financial statements are free of material misstatement whether due to error or fraud.
Our audits included performing procedures to assess the risks of material misstatement of the financial statements, whether due to error or fraud, and performing procedures that respond to those risks. Such procedures included examining, on a test basis, evidence regarding the amounts and disclosures in the financial statements. Our procedures included confirmation of securities owned as of December 31, 2023, by correspondence with the custodian, transfer agents, issuers, agent banks, and brokers; when replies were not received from transfer agents, agent banks, or brokers, we performed other auditing procedures. Our audits also included evaluating the accounting principles used and significant estimates made by management, as well as evaluating the overall presentation of the financial statements. We believe that our audits provide a reasonable basis for our opinion.
Emphasis of Matter
As described in Note 12 of the financial statements, on February 12, 2024, the Board of Trustees approved a plan to liquidate the iMGP RBA Responsible Global Allocation ETF. Our opinion is not modified with respect to this matter.
We have served as the auditor of one or more investment companies advised by iM Global Partner Fund Management, LLC since 2012.

COHEN & COMPANY, LTD.
Cleveland, Ohio
February 28, 2024
| Report of Independent Registered Public Accounting Firm | 169 | |||||
Table of Contents
Litman Gregory Funds Trust
OTHER INFORMATION – (Unaudited)
Proxy Voting Policies and Procedures
The sub-advisors of the Funds vote proxies relating to portfolio securities in accordance with procedures that have been approved by the Board of Trustees of the Funds. You may obtain a description of these procedures, without charge, by calling toll-free, 1-800-960-0188. This information is also available through the Securities and Exchange Commission’s website at http://www.sec.gov.
Proxy Voting Record
Information regarding how the sub-advisors of the Funds voted proxies relating to portfolio securities during the 12-month period ended June 30 is available, without charge, by calling toll-free, 1-800-960-0188. This information is also available through the Securities and Exchange Commission’s website at http://www.sec.gov.
Portfolio Holdings Information
Each Fund files a complete schedule of portfolio holdings with the Securities and Exchange Commission for the first and third quarters of each fiscal year as an exhibit to its reports on Form N-PORT. You can find the filings on the Securities and Exchange Commission’s website at http://www.sec.gov. This information is also available, without charge, by calling toll-free, 1-800-960-0188 or by visiting the Funds’ website at http://www.imgpfunds.com.
Householding Mailings
To reduce expenses, the Trust may mail only one copy of the Funds’ prospectus and each annual and semi-annual report to those addresses shared by two or more accounts. If you wish to receive individual copies of these documents, please call us at 1-800-960-0188 (or contact your financial institution). The Trust will begin sending you individual copies thirty days after receiving your request.
Review of Liquidity Risk Management Program
Pursuant to Rule 22e-4 under the 1940 Act, the Trust, on behalf of the Funds, has adopted a liquidity risk management program (the “Program”) to govern the Trust’s approach to managing liquidity risk. The Program is overseen by the Trust’s Liquidity Committee, and the Program’s principal objectives include assessing, managing and periodically reviewing each Fund’s liquidity risk, based on factors specific to the circumstances of the Fund.
At a meeting of the Board held on June 7, 2023, the Trustees received a report from the Trust’s Chief Liquidity Officer, who serves as chair of the Trust’s Liquidity Committee, addressing the operations of the Program and assessing its adequacy and effectiveness of implementation. The Liquidity Committee determined, and the Chief Liquidity Officer reported to the Board, that the Program is reasonably designed to assess and manage each Fund’s liquidity risk and has operated adequately and effectively to manage each Fund’s liquidity risk since the Program was implemented in August 2018. The Chief Liquidity Officer reported that, during the period covered by the report, there were no liquidity events that impacted the Funds or their ability to timely meet redemptions without dilution to existing shareholders. The Chief Liquidity Officer further noted that no material changes have been made to the Program since its implementation.
There can be no assurance that the Program will achieve its objectives in the future. Please refer to the Trust’s prospectuses for more information regarding a Fund’s exposure to liquidity risk and other principal risks to which an investment in the Funds may be subject.
| 170 | Litman Gregory Funds Trust | |||||
Table of Contents
INDEX DEFINITIONS – (Unaudited)
The ABX Indexes serve as a benchmark of the market for securities backed by home loans issued to borrowers with weak credit. The ABX 2006-2 AAA is an asset-backed index that tracks AAA-rated bonds issued prior to the second half of 2006. The ABX 2007-1 AAA is an asset-backed index that tracks AAA-rated bonds issued prior to the first half of 2007.
BofA Merrill Lynch U.S. High Yield Master II Index tracks the performance of below investment grade, but not in default, US dollar-denominated corporate bonds publicly issued in the US domestic market.
The BofA Merrill Lynch High Yield Cash Pay Index is an unmanaged index used as a general measure of market performance consisting of fixed-rate, coupon-bearing bonds with an outstanding par which is greater than or equal to $50 million, a maturity range greater than or equal to one year and must be less than BBB/Baa3 rated but not in default.
Bloomberg Barclays U.S. Aggregate Bond Index is a market capitalization-weighted index, meaning the securities in the index are weighted according to the market size of each bond type. Most U.S. traded investment grade bonds are represented. The index includes U.S. treasury securities (non TIPS), government agency bonds, mortgage backed bonds, corporate bonds, and a small amount of foreign bonds traded in the U.S.
Bloomberg Barclays U.S. Intermediate Credit Index: is the intermediate component of the Bloomberg Barclays U.S. Credit Index. The Bloomberg Barclays U.S. Credit Index measures the investment grade, US dollar-denominated, fixed-rate, taxable, corporate and government—related bond markets. It is composed of the US Corporate Index and a non-corporate component that includes foreign agencies, sovereigns, supranationals, and local authorities.
The CBOE Russell 2000 PutWrite Index (PUTR) is designed to track the performance of a hypothetical strategy that sells a monthly at-the-money (ATM) Russell 2000 Index put option.
The CBOE Russell 2000 Volatility Index (RVX) is a key measure of market expectations of near-term volatility conveyed by Russell 2000® Index (RUT) option prices. The RVX Index measures the market’s expectation of 30-day volatility implicit in the prices of near-term RUT options traded at CBOE.
The CBOE S&P 500 PutWrite Index (ticker symbol PUT) is a benchmark index that measures the performance of a hypothetical portfolio that sells S&P 500 Index (SPX) put options against collateralized cash reserves held in a money market account.
The CBOE S&P 500 2% OTM PutWrite Index (PUTYSM Index) is designed to track the performance of a hypothetical passive investment strategy that collects option premiums from writing a 2% Out-of-the Money (OTM) SPX Put option on a monthly basis and holds a rolling money market account invested in one-month T-bills to cover the liability from the short SPX Put option position.
CDX is a series of credit default swap indexes, used to hedge credit risk or to take a position on a basket of credit entities.
The Citigroup Economic Surprise Indices are objective and quantitative measures of economic news. They are defined as weighted historical standard deviations of data surprises.
FTSE Emerging Markets Index – ETF Tracker. The Index is a market capitalization index, adjusted based on the free-float of potential index constituents, and designed to measure the performance of large-, medium- and small-capitalization companies located in emerging market countries throughout the world.
The FTSE Global All Cap ex U.S. Index is part of a range of indices designed to help U.S. investors benchmark their international investments. The index comprises large, mid and small cap stocks globally excluding the U.S. The index is derived from the FTSE Global Equity Index Series (GEIS), which covers 98% of the world’s investable market capitalization.
hedge, equity market neutral, event driven, macro, merger arbitrage, and relative value arbitrage.
ICE BofAML 0-3 Year U.S. Treasury Index tracks the performance of U.S. dollar denominated sovereign debt publicly issued by the U.S. government in its domestic market with maturities less than three years.
ICE BofA Merrill Lynch 1-3 US Year Treasury Index is an unmanaged index that tracks the performance of the direct sovereign debt of the U.S. Government having a maturity of at least one year and less than three years.
The ICE BofAML U.S. High Yield Cash Pay TR USD Index is an unmanaged index that measures the performance of short-term U.S. dollar denominated below investment grade corporate debt publicly issued in the U.S. domestic market.
LIBOR stands for London Interbank Offered Rate. It’s an index that is used to set the cost of various variable-rate loans.
Morningstar Category Averages: Each Morningstar Category Average is representative of funds with similar investment objectives.
The MSCI All Country World Index is a free float-adjusted market capitalization weighted index that is designed to measure the equity market performance of developed and emerging markets.
The MSCI All Country World ex U.S. Index is a free float-adjusted market capitalization weighted index that is designed to measure the equity market performance of developed and emerging markets, excluding the United States.
The MSCI All Country World ex U.S. Growth Index is a free float-adjusted market capitalization weighted index that is designed to measure the equity market performance of developed and emerging markets, excluding the United States. It includes companies with higher price-to-book ratios and higher forecasted growth values.
The MSCI All Country World ex U.S. Value Index is a free float-adjusted market capitalization weighted index that is designed to
| Index Definitions | 171 | |||||
Table of Contents
Litman Gregory Funds Trust
INDEX DEFINITIONS – (Unaudited) – (Continued)
measure the equity market performance of developed and emerging markets, excluding the United States. It includes companies with lower price-to-book ratios and lower forecasted growth values.
The MSCI China Index captures large and mid cap representation across China A shares, H shares, B shares, Red chips, P chips and foreign listings (e.g. ADRs). With 739 constituents, the index covers about 85% of this China equity universe
The MSCI Emerging Markets ex China Index captures large and mid cap representation across 24 of the 25 Emerging Markets (EM) countries* excluding China. With 681 constituents, the index covers approximately 85% of the free float-adjusted market capitalization in each country.
The MSCI EAFE Index (Europe, Australasia, Far East) is a free float-adjusted market capitalization index that is designed to measure the equity market performance of developed markets, excluding the US & Canada. As of May 27, 2010 the MSCI EAFE Index consisted of the following 22 developed market country indices: Australia, Austria, Belgium, Denmark, Finland, France, Germany, Greece, Hong Kong, Ireland, Israel, Italy, Japan, the Netherlands, New Zealand, Norway, Portugal, Singapore, Spain, Sweden, Switzerland, and the United Kingdom.
The MSCI Emerging Markets Index captures large and mid-cap representation across 23 Emerging Markets (EM) countries. With 836 constituents, the index covers approximately 85% of the free float-adjusted market capitalization in each country.
The MSCI World Index is a free float-adjusted market capitalization weighted index that is designed to measure the equity market performance of developed markets, including the United States.
The Russell 1000 Index measures the performance of the large-cap segment of the U.S. equity universe. It is a subset of the Russell 3000® Index and includes approximately 1000 of the largest securities based on a combination of their market cap and current index membership. The Russell 1000 represents approximately 92% of the U.S. market.
The Russell 1000 Growth Index measures the performance of the large-cap growth segment of the U.S. equity universe. It includes those Russell 1000 companies with higher price-to-book ratios and higher forecasted growth values.
The Russell 2000 Index measures the performance of the 2,000 smallest companies in the Russell 3000 Index.
The Russell 2000 Value Index measures the performance of small-cap value segment of the U.S. equity universe. It includes those Russell 2000 companies with lower price-to-book ratios and lower forecasted growth values.
The Russell 2500 Index measures the performance of the small to mid-cap segment of the U.S. equity universe, commonly referred to as “smid” cap. The Russell 2500 Index is a subset of the Russell 3000 Index. It includes approximately 2500 of the smallest securities based on a combination of their market cap and current index membership.
The Russell 3000 Index measures the performance of the 3,000 largest U.S. companies as measured by total market capitalization, and represents about 98% of the U.S. stock market.
The Russell 3000 Value Index is a broad based index that measures the performance of those companies within the 3,000 largest U.S. companies, based on total market capitalization, that have lower price-to-book ratios and lower forecasted growth rates.
The SG CTA Index is an index published by Société Générale that is designed to reflect the performance of a pool of Commodity Trading Advisor (CTAs) selected from larger managers that employ systematic managed futures strategies. The index is reconstituted annually.
The S&P 500 Index is widely regarded as the standard for measuring large-cap stock performance, and consists of 500 stocks that represent a sample of the leading companies in leading industries.
The SPDR S&P 500 ETF consists of 500 of the largest U.S. companies, and it is one of the most heavily traded securities in the world. It tracks the S&P 500 Index, and fund follows a full replication strategy, holding every stock in the index.
The SPDR Financials Sector Index seeks to provide an effective representation of the financial sector of the S&P 500 Index. The Index includes companies from the following industries: diversified financial services; insurance; banks; capital markets; mortgage real estate investment trusts (“REITs”); consumer finance; and thrifts and mortgage finance.
The Vanguard 500 Index Fund invests in 500 of the largest U.S. companies, which span many different industries and account for about three-fourths of the U.S. stock market’s value. This fund tracks the S&P 500 Index as closely as possible.
VIX is a trademarked ticker symbol for the Chicago Board Options Exchange Market Volatility Index, a popular measure of the implied volatility of S&P 500 index options. Often referred to as the fear index or the fear gauge, it represents one measure of the market’s expectation of stock market volatility over the next 30 day period.
Indices are unmanaged, do not incur fees, and cannot be invested in directly.
| 172 | Litman Gregory Funds Trust | |||||
Table of Contents
INDUSTRY TERMS AND DEFINITIONS – (Unaudited)
| 1. | Active Share measures the degree of difference between a fund portfolio and its benchmark index. |
| 2. | Alpha is an annualized return measure of how much better or worse a fund’s performance is relative to an index of funds in the same category, after allowing for differences in risk. |
| 3. | Alt-A, or Alternative A-paper, is a type of U.S. mortgage that, for various reasons, is considered riskier than A-paper, or “prime”, and less risky than “subprime,” the riskiest category. |
| 4. | The Basel Accords are three sets of banking regulations (Basel I, II and III) set by the Basel Committee on Bank Supervision (BCBS), which provides recommendations on banking regulations in regards to capital risk, market risk and operational risk. |
| 5. | A basis point is a value equaling one one-hundredth of a percent (1/100 of 1%). |
| 6. | Beta is a measure of the volatility, or systematic risk, of a security or a portfolio in comparison to the market as a whole. |
| 7. | Book value is the net asset value of a company, calculated by subtracting total liabilities and intangible assets from total assets. |
| 8. | Brexit is an abbreviation of “British exit”, which refers to the June 23, 2016 referendum by British voters to exit the European Union. |
| 9. | Business development company (BDC) is an organization that invests in and helps small- and medium-size companies grow in the initial stages of their development. |
| 10. | Cash flow measures the cash generating capability of a company by adding non-cash charges (e.g., depreciation) and interest expense to pretax income. |
| 11. | Cash flow yield (or free cash flow yield) is a financial solvency ratio that compares the free cash flow per share a company is expected to earn against its market value per share. The ratio is calculated by taking the free cash flow per share divided by the current share price. |
| 12. | Capex (capital expenditures) are expenditures creating future benefits. |
| 13. | Collateralized Loan Obligation (CLO) is a security backed by a pool of debt, often low-rated corporate loans. Collateralized loan obligations (CLOs) are similar to collateralized mortgage obligations, except for the different type of underlying loan. |
| 14. | Combined ratio is a formula used by insurance companies to relate premium income to claims, administration and dividend expenses. It is used in the annual statement filed by an insurer with the state insurance department. It is calculated by dividing the sum of incurred losses and expenses by earned premium. |
| 15. | Compound annual growth rate (CAGR) is the rate of growth of a number, compounded over several years. |
| 16. | Conditional pre-payment rate is a loan prepayment rate that is equal to the proportion of the principal of a pool of loans that is assumed to be paid off prematurely in each period. |
| 17. | The Consumer Price Index (CPI) is a measure that examines the weighted average of prices of a basket of consumer goods and services, such as transportation, food and medical care. Changes in the CPI are used to assess price changes associated with the cost of living; the CPI is one of the most frequently used statistics for identifying periods of inflation or deflation. |
| 18. | Correlation is a statistical measure of how two securities move in relation to each other. |
| 19. | A coupon or coupon payment is the annual interest rate paid on a bond, expressed as a percentage of the face value and paid from issue date until maturity. |
| 20. | Covenants most often relate to terms in a financial contract, such as a loan document or bond issue stating the limits at which the borrower can further lend. |
| 21. | Credit default swaps are swaps designed to transfer the credit exposure of fixed income products between parties. A credit default swap is also referred to as a credit derivative contract, where the purchaser of the swap makes payments up until the maturity date of a contract. Payments are made to the seller of the swap. In return, the seller agrees to pay off a third party debt if this party defaults on the loan. |
| 22. | Discounted cash flow is calculated by multiplying future cash flows by discount factors to obtain present values. |
| 23. | Diversification is the spreading of risk by putting assets in several categories of investments. |
| 24. | Dividend yield is the return on an investor’s capital investment that a company pays out to its shareholders in the form of dividends. It is calculated by taking the amount of dividends paid per share over the course of a year and dividing by the stock’s price. |
| 25. | Drawdown is the peak-to-trough decline during a specific record period of an investment, fund or commodity. |
| Industry Terms and Definitions | 173 | |||||
Table of Contents
Litman Gregory Funds Trust
INDUSTRY TERMS AND DEFINITIONS – (Unaudited) – (Continued)
| 26. | Dry powder refers to cash reserves kept on hand to cover future obligations or purchase assets, if conditions are favorable. |
| 27. | Duration is a measure of the sensitivity of the price (the value of principal) of a fixed-income investment to a change in interest rates. Duration is expressed as a number of years. Rising interest rates mean falling bond prices, while declining interest rates mean rising bond prices. |
| 28. | Earnings per share (EPS) is calculated by taking the total earnings divided by the number of shares outstanding. |
| 29. | EBIT is a company’s earnings before interest and taxes, and measures the profit a company generates from its operations, making it synonymous with “operating profit”. |
| 30. | EBITDA is a company’s earnings before interest, taxes, depreciation, and amortization. |
| 31. | E-Mini Futures Are an electronically traded futures contract on the Chicago Mercantile Exchange that represents a portion of the normal futures contracts. |
| 32. | Enterprise value is a measure of a company’s total value, calculated by adding a corporation’s market capitalization, preferred stock, and outstanding debt together and then subtracting out the cash and cash equivalents. |
| 33. | Enterprise value/adjusted target operating profit (or Enterprise Value/adjusted target EBIT) is a financial ratio that compares the total valuation of the company with its profitability, adjusting for various special circumstances. |
| 34. | EV/EBITDA is the enterprise value of a company divided by earnings before interest, taxes, depreciation, and amortization. |
| 35. | EV/Sales is the ratio of enterprise value of a company divided by the total sales of the company for a particular period, usually one year. |
| 36. | Floating interest rate, also known as a variable or adjustable rate, refers to any type of debt instrument, such as a loan, bond, mortgage, or credit, that does not have a fixed rate of interest over the life of the instrument. |
| 37. | Forex (FX) is the market in which currencies are traded. |
| 38. | Free cash flow is the amount of cash a company has after expenses, debt service, capital expenditures, and dividends. |
| 39. | Futures are financial contracts obligating the buyer to purchase an asset (or the seller to sell an asset), such as a physical commodity or a financial instrument, at a predetermined future date and price. Futures contracts detail the quality and quantity of the underlying asset; they are standardized to facilitate trading on a futures exchange. |
| 40. | The G20 (or G-20 or Group of Twenty) is an international forum for the governments and central bank governors from 20 major economies. It was founded in 1999 with the aim of studying, reviewing, and promoting high-level discussion of policy issues pertaining to the promotion of international financial stability. |
| 41. | Gross merchandise volume or GMV is a term used in online retailing to indicate a total sales dollar value for merchandise sold through a particular marketplace over a certain time frame. |
| 42. | “Growth” stocks are generally considered to be stocks of companies with high expected earnings growth compared to “value” stocks. Because of this higher expected growth, growth stocks tend to be priced at a higher multiple of their current earnings than value stocks. However, the premium paid for growth stocks compared to value stocks can vary dramatically depending on the market environment. |
| 43. | Industry cost curve is the standard microeconomic graph that shows how much output suppliers can produce at a given cost per unit. As a strategic tool, the cost curve applies most directly to commodity or near commodity industries, in which buyers get roughly the same value from a product regardless of who produces it. |
| 44. | An interest rate future is a financial derivative (a futures contract) with an interest-bearing instrument as the underlying asset. It is a particular type of interest rate derivative. Examples include Treasury-bill futures, Treasury-bond futures and Eurodollar futures. |
| 45. | An interest rate swap is a forward contract in which one stream of future interest payments is exchanged for another based on a specified principal amount. |
| 46. | Internal Rate of Return (IRR) is the discount rate often used in capital budgeting that makes the net present value of all cash flows from a particular project equal to zero. |
| 47. | Inverse floater (or inverse floating rate note) is a bond or other type of debt whose coupon rate has an inverse relationship to a benchmark rate. |
| 174 | Litman Gregory Funds Trust | |||||
Table of Contents
Litman Gregory Funds Trust
INDUSTRY TERMS AND DEFINITIONS – (Unaudited) – (Continued)
| 48. | Inverse interest-only security is a security that pays a coupon inversely related to market rates (i.e., it moves in the opposite direction of interest rates), instead of paying a coupon corresponding to the interest payments homeowners (mortgagors) actually make. |
| 49. | An Investment Grade bond is a bond with a rating of AAA to BBB; a Below Investment Grade bond is a bond with a rating lower than BBB |
| 50. | A Leveraged Buyout (LBO) is the acquisition of another company using a significant amount of borrowed money to meet the cost of acquisition. |
| 51. | Loss adjusted yields are those that already reflect the impact of assumed economic losses. |
| 52. | Margin of safety is a principle of investing in which an analyst only purchases securities when the market price is below the analyst’s estimation of intrinsic value. It does not guarantee a successful investment. |
| 53. | Market capitalization (or market cap) is the total value of the issued shares of a publicly traded company; it is equal to the share price times the number of shares outstanding. MBA Refinance index is a weekly measurement put together by the Mortgage Bankers Association, a national real estate finance industry association, to predict mortgage activity and loan prepayments based on the number of mortgage refinance applications submitted. |
| 54. | The Merrill Option Volatility Expectations Index (MOVE©) reflects a market estimate of future Treasury bond yield volatility. The MOVE index is a yield curve weighted index of the normalized implied volatility on 1-month Treasury options. The MOVE Index reports the average implied volatility across a wide range of outstanding options on the two-year, five-year, 10-year, and 30-year U.S. Treasury securities. |
| 55. | Net operating profit after tax (NOPAT): A company’s potential cash earnings if its capitalization were unleveraged (that is, if it had no debt). |
| 56. | Normalized earnings are earnings adjusted for cyclical ups and downs of the economy. Also, on the balance sheet, earnings adjusted to remove unusual or one-time influences. |
| 57. | Operating cash flow is calculated by summing net profit, depreciation, change in accruals, and change in accounts payable, minus change in accounts receivable, minus change in inventories. |
| 58. | Options are financial derivatives that represent a contract sold by one party (option writer) to another party (option holder). The contract offers the buyer the right, but not the obligation, to buy (call) or sell (put) a security or other financial asset at an agreed-upon price (the strike price) during a certain period of time or on a specific date (exercise date). |
| 59. | An option premium is the current market price of an option contract. It is thus the income received by the seller (writer) of an option contract to another party. |
| 60. | Out of the money (OTM) is term used to describe a call option with a strike price that is higher than the market price of the underlying asset, or a put option with a strike price that is lower than the market price of the underlying asset. An out of the money option has no intrinsic value, but only possesses extrinsic or time value. |
| 61. | Pair-wise correlation is the average of the correlations of each managers’ performance with each of the other managers on the fund. |
| 62. | Personal consumption expenditure is the measure of actual and imputed expenditures of households, and includes data pertaining to durable and non-durable goods and services. It is essentially a measure of goods and services targeted towards individuals and consumed by individuals. |
| 63. | Present value is the current worth of a future sum of money or stream of cash flows given a specified rate of return. |
| 64. | Price to book ratio is calculated by dividing the current market price of a stock by the book value per share. |
| 65. | Price to earnings (P/E) ratio is a common tool for comparing the prices of different common stocks and is calculated by dividing the current market price of a stock by the earnings per share. Similarly, multiples of earnings and cash flow are means of expressing a company’s stock price relative to its earnings per share or cash flow per share, and are calculated by dividing the current stock price by its earnings per share or cash per share. Forecasted earnings growth is the projected rate that a company’s earnings are estimated to grow in a future period. |
| 66. | Price to sales (P/S) ratio is a tool for calculating a stock’s valuation relative to other companies, calculated by dividing a stock’s current price by its revenue per share. |
| 67. | Price to tangible book value (PTBV) is a valuation ratio expressing the price of a security compared to its hard, or tangible, book value as reported in the company’s balance sheet. The tangible book value number is equal to the company’s total book value less the value of any intangible assets. |
| Industry Terms and Definitions | 175 | |||||
Table of Contents
Litman Gregory Funds Trust
INDUSTRY TERMS AND DEFINITIONS – (Unaudited) – (Continued)
| 68. | Prime is a classification of borrowers, rates, or holdings in the lending market that are considered to be of high quality. |
| 69. | Principal only securities are a type of fixed-income security where the holder is only entitled to receive regular cash flows that are derived from incoming principal repayments on an underlying loan pool. |
| 70. | Private market value is the value of a company if each of its parts were independent, publicly traded entities. |
| 71. | Prospective earnings growth ratio (PEG ratio): The projected one-year annual growth rate, determined by taking the consensus forecast of next year’s earnings, less this year’s earnings, and dividing the result by this year’s earnings. |
| 72. | Put writing is a family of options trading strategies that involve the selling of put options to earn premiums. One can either write a covered put or a naked put. Utilizing a combination of covered puts and naked puts, one can also implement the ratio put write, which is a neutral strategy. |
| 73. | Quantitative Easing (QE) is a monetary policy in which a central bank purchases government securities or other securities from the market in order to lower interest rates and increase the money supply. |
| 74. | Return on capital (ROC) is a measure of how effectively a company uses the money (borrowed or owned) invested in its operations. It is calculated by dividing net income by invested capital. |
| 75. | Return on equity (ROE) is a measure of how well a company used reinvested earnings to generate additional earnings. Expressed as a percentage, it is calculated by dividing net worth at the beginning of the period into net income for the period after preferred stock dividends but before common stock dividends. |
| 76. | Return on investment capital (ROIC) is calculated by subtracting dividends from net income and dividing by total capital. |
| 77. | Sequential growth is a measure of a company’s short-term financial performance that compares the results achieved in a recent period to those of the period immediately preceding it. |
| 78. | Sharpe ratio is the measure of a fund’s return relative to its risk. The Sharpe ratio uses standard deviation to measure a fund’s risk-adjusted returns. The higher a fund’s Sharpe ratio, the better a fund’s returns have been relative to the risk it has taken on. Because it uses standard deviation, the Sharpe ratio can be used to compare risk-adjusted returns across all fund categories. |
| 79. | Short (or short position) is the sale of a borrowed security, commodity, or currency with the expectation that the asset will fall in value. |
| 80. | Sortino Ratio is a modification of the Sharpe ratio that differentiates harmful volatility from general volatility by taking into account the standard deviation of negative asset returns, called downside deviation. |
| 81. | A sovereign bond is a debt security issued by a national government. |
| 82. | A special situation is a particular circumstance involving a security that would compel investors to trade the security based on the special situation, rather than the underlying fundamentals of the security or some other investment rationale. A spin-off is an example of a special situation. |
| 83. | Spot price is the current price at which a particular security can be bought or sold at a specified time and place. |
| 84. | Standard deviation is a statistical measure of the historical volatility of a mutual fund or portfolio, usually computed using 36 monthly returns. |
| 85. | Subprime refers to the credit quality of particular borrowers, who have weakened credit histories and a greater risk of loan default than prime borrowers. The market for lenders and borrowers of subprime credit includes the business of subprime mortgages, subprime auto loans and subprime credit cards, as well as various securitization products that use subprime debt as collateral. |
| 86. | Swaps, traditionally, are the exchange of one security for another to change the maturity (bonds), quality of issues (stocks or bonds), or because investment objectives have changed. Recently, swaps have grown to include currency swaps and interest rate swaps. |
| 87. | Swaption (swap option): The option to enter into an interest rate swap. In exchange for an option premium, the buyer gains the right but not the obligation to enter into a specified swap agreement with the issuer on a specified future date. |
| 88. | Tangible Book Value Per Share—TBVPS is a method of valuing a company on a per-share basis by measuring its equity after removing any intangible assets. |
| 89. | Tracking error is the monitoring the performance of a portfolio, usually to analyze the extent to which its price movements conform or deviate from those of a benchmark. |
| 90. | Upside/downside capture is a statistical measure that shows whether a given fund has outperformed—gained more or lost less than—a broad market benchmark during periods of market strength and weakness, and if so, by how much. |
| 176 | Litman Gregory Funds Trust | |||||
Table of Contents
Litman Gregory Funds Trust
INDUSTRY TERMS AND DEFINITIONS – (Unaudited) – (Continued)
| 91. | Yield Curve: A line that plots the interest rates, at a set point in time, of bonds having equal credit quality, but differing maturity dates. The most frequently reported yield curve compares the three-month, two-year, five-year and 30-year U.S. Treasury debt. The curve is used to predict changes in economic output and growth. |
| 92. | Yield to Maturity is the rate of return anticipated on a bond if it is held until the maturity date. |
| 93. | Yield to Worst is the lowest potential yield that can be received on a callable bond without the issuer actually defaulting. |
| 94. | Z Bonds, or Z Tranches, are the final tranche in a series of mortgage-backed securities, that is the last one to receive payment. Used in some collateralized mortgage obligations (CMO), Z-bonds pay no coupon payments while principal is being paid on earlier bonds. |
| Industry Terms and Definitions | 177 | |||||
Table of Contents
Litman Gregory Funds Trust
For the fiscal year ended December 31, 2023, certain dividends paid by the Funds may be subject to a maximum tax rate of 15%, as provided for by the Jobs and Growth Tax Relief Reconciliation Act of 2003. The percentage of dividends declared from ordinary income designated as qualified dividend income was as follows:
Global Select Fund | 100.00 | % | ||
International Fund | 100.00 | % | ||
Oldfield International Value Fund | 96.76 | % | ||
SBH Focused Small Value Fund | 100.00 | % | ||
Alternative Strategies Fund (Consolidated) | 8.26 | % | ||
High Income Fund | 1.72 | % | ||
Dolan McEniry Corporate Bond Fund | 0.00 | % | ||
DBi Managed Futures Strategy ETF | 0.00 | % | ||
DBi Hedge Strategy ETF | 0.00 | % | ||
RBA Responsible Global Allocation ETF | 41.89 | % | ||
Berkshire Dividend Growth ETF | 100.00 | % |
For corporate shareholders, the percent of ordinary income distributions qualifying for the corporate dividends received deduction for the fiscal year ended December 31, 2023 was as follows:
Global Select Fund | 69.60 | % | ||
International Fund | 0.00 | % | ||
Oldfield International Value Fund | 0.00 | % | ||
SBH Focused Small Value Fund | 100.00 | % | ||
Alternative Strategies Fund (Consolidated) | 4.97 | % | ||
High Income Fund | 1.72 | % | ||
Dolan McEniry Corporate Bond Fund | 0.00 | % | ||
DBi Managed Futures Strategy ETF | 0.00 | % | ||
DBi Hedge Strategy ETF | 0.00 | % | ||
RBA Responsible Global Allocation ETF | 23.92 | % | ||
Berkshire Dividend Growth ETF | 100.00 | % |
Pursuant to Internal Revenue Section 852(b), the following Funds paid distributions, which have been designated as capital gains distributions for the fiscal year ended December 31, 2023.
Global Select Fund | $ | 3,697,048 | ||
International Fund | — | |||
Oldfield International Value Fund | — | |||
SBH Focused Small Value Fund | 3,594,970 | |||
Alternative Strategies Fund (Consolidated) | — | |||
High Income Fund | — | |||
Dolan McEniry Corporate Bond Fund | — | |||
DBi Managed Futures Strategy ETF | — | |||
DBi Hedge Strategy ETF | — | |||
RBA Responsible Global Allocation ETF | — | |||
Berkshire Dividend Growth ETF | — |
Additional Information Applicable to Foreign Shareholders Only:
The percent of ordinary dividend distributions for the year ended December 31, 2023, which are designated as interest-related dividends under Internal Revenue Code Section 871 (k)(1)(C) is as follows:
Global Select Fund | 4.05 | % | ||
International Fund | 2.73 | % | ||
Oldfield International Value Fund | N/A | |||
SBH Focused Small Value Fund | N/A | |||
Alternative Strategies Fund (Consolidated) | 69.90 | % | ||
High Income Fund | 44.35 | % | ||
Dolan McEniry Corporate Bond Fund | 97.06 | % | ||
DBi Managed Futures Strategy ETF | 88.57 | % | ||
DBi Hedge Strategy ETF | 95.41 | % | ||
RBA Responsible Global Allocation ETF | N/A | |||
Berkshire Dividend Growth ETF | N/A |
| 178 | Litman Gregory Funds Trust | |||||
Table of Contents
Litman Gregory Funds Trust
TAX INFORMATION – (Unaudited) (Continued)
The percentage of taxable ordinary income distributions that are designated as short-term capital gain distributions under Internal Revenue Section 871(k)(2)(C) for each Fund were as follows (unaudited):
Global Select Fund | 50.95 | % | ||
International Fund | 0.00 | % | ||
Oldfield International Value Fund | 22.11 | % | ||
SBH Focused Small Value Fund | 0.00 | % | ||
Alternative Strategies Fund (Consolidated) | 0.00 | % | ||
High Income Fund | 0.00 | % | ||
Dolan McEniry Corporate Bond Fund | 0.00 | % | ||
DBi Managed Futures Strategy ETF | 0.00 | % | ||
DBi Hedge Strategy ETF | 0.00 | % | ||
RBA Responsible Global Allocation ETF | 0.00 | % | ||
Berkshire Dividend Growth ETF | 0.00 | % |
For the year ended December 31, 2023, the International Fund and the Oldfield International Value Fund earned foreign source income and paid foreign taxes which they intend to pass through to their shareholders pursuant to Section 853 of the Internal Revenue Code as follows:
| Creditable Foreign Taxes Paid | Per Share Amount | Portion of Ordinary Income Distribution Derived from foreign Sourced Income | ||||
| International Fund | $653,639 | $0.0517 | 12.11% | |||
| Oldfield International Value Fund | 129,403 | 0.0412 | 10.68% | |||
| RBA Responsible Global Allocation ETF | 5,221 | 0.0072 | 10.78% |
| Tax Information | 179 | |||||
Table of Contents
Litman Gregory Funds Trust
TRUSTEE AND OFFICER INFORMATION – (Unaudited)
Independent Trustees*
| Name, Address and Year Born | Position(s) Held with the Trust | Term of Office and Length of Time Served | Principal Occupation(s) During Past Five Years | #of Portfolios in Fund Complex Overseen by Trustee | Other Directorships Held by Trustee During Past Five Years | |||||
Julie Allecta El Segundo, CA 90245 (born 1946) | Chairperson of the Board, Independent Trustee | Open-ended term; served since June 2013 | Member of Governing Council and Policy Committee, Independent Directors Council (education for investment company independent directors) 2014-2022; and Retired Partner, Paul Hastings LLP (law firm) from 1999 to 2009. | 12 | Forward Funds (mutual funds) (4 portfolios) Salient MF Trust (mutual funds) (1 portfolio) Salient Midstream & MLP Fund (closed-end fund) (1 portfolio) | |||||
Thomas W. Bird 2301 Rosecrans Avenue, Suite 2150 El Segundo, CA 90245 (born 1957) | Independent Trustee | Open-ended term; served since May 2021 | Founder, Chief Executive Officer and Director, Bird Impact LLC (impact investment vehicle) since 2016; Founder, Chairman and Chief Investment Officer, FARM Group (impact not-for-profit organization) since 1998; Board Member, Sonen Capital LLC(impact asset management firm) 2016-2020. | 12 | Sonen Capital LLC; One Summit (not-for-profit organization); Cromwell Harbor Supporting Foundation, Inc. (not-for-profit organization) | |||||
Jennifer M. Borggaard 2301 Rosecrans Avenue, El Segundo, CA 90245 (born 1969) | Independent Trustee | Open-ended term; served since May 2021 | Co-Founder and Partner, AlderBrook Advisors (management consulting) since 2019; Member, Advisory Committee, Polen Capital (investment advisor) since 2018; Senior Vice President, Affiliated Managers Group, Inc. (asset management) 2007-2017. | 12 | BroadStreet Partners Inc. (insurance); BNY Mellon Charitable Gift Fund; Anchor Capital Advisors LLC (asset management); Boston Financial Management, LLC (asset management) | |||||
Jonathan W. DePriest 2301 Rosecrans Avenue, Suite 2150 El Segundo, CA 90245 (born 1968) | Independent Trustee | Open-ended term; served since May 2021 | Consultant (financial services) since 2022; General Counsel, ApplePie Capital, Inc. (franchise financing) 2019-2021; Executive Vice President and General Counsel, Salient Partners, L.P. (asset management) 2015-2019. | 12 | None | |||||
Frederick A. Eigenbrod, El Segundo, CA 90245 (born 1941) | Independent Trustee | Open-ended term; served since inception | Vice President, RoutSource Consulting Services (organizational planning and development) since 2002. | 12 | None | |||||
Harold M. Shefrin, Ph.D. 2301 Rosecrans Avenue, Suite 2150 El Segundo, CA 90245 (born 1948) | Independent Trustee | Open-ended term; served since February 2005 | Professor, Department of Finance, Santa Clara University since 1979. | 12 | SA Funds – Investment Trust (mutual funds) (10 portfolios) |
| 180 | Litman Gregory Funds Trust | |||||
Table of Contents
Litman Gregory Funds Trust
TRUSTEE AND OFFICER INFORMATION – (Unaudited) – (Continued)
Interested Trustees & Officers
| Name, Address and Year Born | Position(s) Held with the Trust | Term of Office and Length of Time Served | Principal Occupation(s) During Past Five Years | #of Portfolios in Fund Complex Overseen by Trustee | Other Directorships Held by Trustee/ Officer During Past Five Years | |||||
Jeffrey K. Seeley** 2301 Rosecrans Avenue, Suite 2150 El Segundo, CA 90245 (born 1969) | Trustee and President | Open-ended term; Trustee since May 2021 and President since March 2023. | Deputy Chief Executive Officer, U.S. Chief Operating Officer and Head of Distribution, iM Global Partner US, LLC since 2018; Chief Compliance Officer of iM Global US Distributors, LLC since 2019; Head of Distribution Resource Securities from 2017-2018; and Head of Distribution and Sales, BP Capital Fund Advisors from 2015-2017. | 12 | None | |||||
Philippe Uzan** 2301 Rosecrans Avenue, Suite 2150, El Segundo, CA 90245 (born 1970) | Trustee | Open-ended term; served since March 2023 | Deputy Chief Executive Officer and Chief Investment Officer of iM Global Partners since February 2020; Chief Executive Officer of UP Quantamental from June 2019 to January 2020; Chief Investment Officer and Member of Executive Committee of Edmond de Rothschild Asset Management from December 2011 to March 2019. | 12 | iM Global Partner Asset Management iM GP SICAV (investment vehicle); Syz Capital (asset management) | |||||
John M. Coughlan 2301 Rosecrans Avenue, Suite 2150 El Segundo, CA 90245 (born 1956) | Treasurer | Open-ended term; served as Treasurer since inception. | Chief Operating Officer of the Advisor since 2004 and Chief Compliance Officer of the Advisor from 2004 to June 2023. | N/A | None | |||||
Joseph Kelly 2301 Rosecrans Avenue, Suite 2150 El Segundo, CA 90245 (born 1975) | Chief Compliance Officer and Secretary | Open-ended term; served as Chief Compliance Officer since June 2023 and Secretary since September 2023. | Managing Director, Chief Compliance Officer of the Advisor since June 2023. Deputy Chief Compliance Officer, The TCW Group, Inc. from January 2022 to June 2023. Senior Vice President Compliance, The TCW Group, Inc. from June 2021 to December 2021. General Counsel and Chief Compliance Officer, Dunham & Associates Investment Counsel Inc. from November 2013 to June 2021. | N/A | None |
| * | Denotes Trustees who are not “interested persons” of the Trust, as such term is defined under the 1940 Act (the “Independent Trustees”). |
| ** | Denotes Trustees who are “interested persons” of the Trust, as such term is defined under the 1940 Act, because of their relationship with the Advisor (the “Interested Trustees”). |
In addition, Jack Chee, Jason Steuerwalt and Kiko Vallarta, each a portfolio manager at the Advisor, are each an Assistant Secretary of the Trust.
| Trustee and Officer Information | 181 | |||||
Table of Contents
The Funds may collect non-public personal information about you from the following sources:
| • | Information we receive about you on applications or other forms; |
| • | Information you give us orally; and |
| • | Information about your transactions with us. |
We do not disclose any non-public personal information about our shareholders or former shareholders without the shareholder’s authorization, except as required or permitted by applicable law or in response to inquiries from governmental authorities. We restrict access to your personal and account information to our employees who need to know that information to provide products and services to you and to the employees of our affiliates. We also may disclose that information to non-affiliated third parties (such as to brokers or custodians) only as permitted or required by applicable law and only as needed for us to provide agreed services to you.
We maintain physical, electronic and procedural safeguards to guard your non-public personal information.
If you hold shares of the Funds through a financial intermediary, such as a broker-dealer, bank, or trust company, the privacy policy of your financial intermediary would govern how your non-public personal information would be shared with non-affiliated third parties.
| 182 | Litman Gregory Funds Trust | |||||
Table of Contents
Advisor:
iM Global Partner Fund Management, LLC
2301 Rosecrans Avenue, Suite 2150
El Segundo, CA 90245
Distributor:
ALPS Distributors, Inc.
1290 Broadway, Suite 1100
Denver, CO 80203
Transfer Agent:
SS&C Global Investor & Distribution Solutions, Inc.
P.O. Box 219922
Kansas City, MO 64121-9922
1-800-960-0188
For Overnight Delivery:
iMGP Funds
C/O SS&C Global Investor & Distribution Solutions, Inc.
330 W. 9th Street
Kansas City, MO 64105
Transfer Agent (for iMGP DBi Managed Futures Strategy ETF, iMGP DBi Hedge Strategy ETF, iMGP RBA Responsible Global Allocation ETF and iMGP Berkshire Dividend Growth ETF)
State Street Bank and Trust
1 Congress Building
One Congress Street, Suite 1
Boston, MA 02114-2016
1-800-960-0188
Investment Professionals:
Registered Investment Advisors, broker/dealers, and other investment professionals may contact Fund Services at 1-925-254-8999.
Prospectus:
To request a current prospectus, statement of additional information, or an IRA application, call
1-800-960-0188.
Shareholder Inquiries:
To request action on your existing account of Non-ETFs, contact the Transfer agent, SS&C Global Investor & Distribution Solutions, Inc., at 1-800-960-0188, from 9:00 a.m. to 6:00 p.m. eastern time, Monday through Friday.
24-Hour Automated Information:
For Non-ETFs: For access to automated reporting of daily prices, account balances and transaction activity, call
1-800-960-0188, 24 hours a day, seven days a week. Please have your Fund number (see below) and account number ready in order to access your account information.
Information:
Fund | Symbol | CUSIP | Fund Number | |||||||||
Global Select Fund | MSEFX | 53700T108 | 305 | |||||||||
International Fund | MSILX | 53700T207 | 306 | |||||||||
Oldfield International Value Fund | POIVX | 53700T843 | 2966 | |||||||||
SBH Focused Small Value Fund | PFSVX | 53700T850 | 2965 | |||||||||
Alternative Strategies Fund | ||||||||||||
Institutional Class | MASFX | 53700T801 | 421 | |||||||||
Investor Class | MASNX | 53700T884 | 447 | |||||||||
High Income Fund | MAHIX | 53700T876 | 1478 | |||||||||
Dolan McEniry Corporate Bond Fund | IDMIX | 53700T777 | 2967 | |||||||||
DBi Managed Futures Strategy ETF | DBMF | 53700T827 | ||||||||||
DBi Hedge Strategy ETF | DBEH | 53700T835 | ||||||||||
| IRBA | 53700T793 | |||||||||||
Berkshire Dividend Growth ETF | BDVG | 53700T751 | ||||||||||
Website:
www.imgpfunds.com
Table of Contents

Polen Capital Global Growth ETF
ANNUAL REPORT
December 31, 2023
This report is submitted for the general information of shareholders and is not authorized for distribution to prospective investors unless preceded or accompanied by a current prospectus.
Table of Contents
General Disclosures
Past performance does not guarantee future results. Index performance is not illustrative of fund performance. An investment cannot be made directly in an index. The investment return and principal value of an investment will fluctuate so that an investor’s shares, when redeemed, may be worth more or less than their original cost. Current performance of the fund may be lower or higher than the performance quoted. To obtain the performance of the funds as of the most recently completed calendar month, please visit www.imgpfunds.com.
Diversification does not assure a profit or protect against loss in a declining market.
Must be preceded or accompanied by a prospectus.
Some of the comments are based on current management expectation and are considered “forward-looking statements”. Actual future results, however, may prove to be different from our expectations. You can identify forward-looking statement by words such as “estimate”, “may”, “expect”, “should”, “could”, “believe”, “plan”, and similar terms. We cannot promise future returns and our opinions are a reflection of our best judgment at the time this report is compiled.
Opinions expressed are subject to change, are not guaranteed and should not be considered recommendations to buy or sell any security.
iM Global Partner Fund Management has ultimate responsibility for the performance of the ETF due to its responsibility to oversee the sub-advisor and recommend their hiring, termination and replacement.
The ETF may invest in foreign securities. Investing in foreign securities exposes investors to economic, political, and market risks and fluctuations in foreign currencies. The ETF may invest in emerging markets. Investments in emerging market countries involve additional risks such as government dependence on a few industries or resources, government-imposed taxes on foreign investment or limits on the removal of capital from a country, unstable government, and volatile markets
A commission may apply when buying or selling an ETF.
© 2021 Morningstar, Inc. All Rights Reserved. The information contained herein: (1) is proprietary to Morningstar; (2) may not be copied or distributed; and (3) is not warranted to be accurate, complete or timely. Neither Morningstar nor its content providers are responsible for any damages or losses arising from any use of this information. Past performance is no guarantee of future results.
| Fund Summary | 1 | |||||
Table of Contents
Polen Capital Global Growth ETF 2023 Annual Report (Unaudited)
The Polen Capital Global Growth ETF launched August 29, 2023. The ETF has gained 5.03% since inception, underperforming the MSCI ACWI Index (up 6.20%). The Morningstar Global Large Stock Growth peer group returned 6.54% over the same period.
| Performance as of 12/31/2023 | Since Inception 8/29/2023 | |||
Polen Capital Global Growth ETF (NAV) | 5.03% | |||
Polen Capital Global Growth ETF (Price) | 4.80% | |||
MSCI ACWI NR USD | 6.20% | |||
Morningstar US Fund Global Large-Stock Growth | 6.54% | |||
Expense Ratio 0.85%
Performance quoted represents past performance and does not guarantee future results. The investment return and principal value of an investment will fluctuate so that an investor’s shares, when redeemed, may be worth more or less than their original cost. Current performance of the funds may be lower or higher than the performance quoted. Short term performance is not a good indication of the fund’s future performance and should not be the sole basis for investing in the fund. To obtain standardized performance of the funds, and performance as of the most recently completed calendar month, please visit www.imgptfunds.com. Returns less than one year are not annualized.
MSCI index returns source: MSCI. Neither MSCI nor any other party involved in or related to compiling, computing, or creating the MSCI data makes any express or implied warranties or representations with respect to such data (or the results to be obtained by the use thereof), and all such parties hereby expressly disclaim all warranties of originality, accuracy, completeness, merchantability, or fitness for a particular purpose with respect to any of such data. Without limiting any of the foregoing, in no event shall MSCI, any of its affiliates, or any third party involved in or related to compiling, computing, or creating the data have any liability for any direct, indirect, special, punitive, consequential, or any other damages (including lost profits) even if notified of the possibility of such damages. No further distribution or dissemination of the MSCI data is permitted without MSCI’s express written consent.
Commentary
The market has been trying to predict the direction of monetary policy all year, and a recent cooling of inflation seems to have bolstered the case for rate cuts in 2024, sparking a strong finish for this year.
For anyone who needed a reminder of the futility of macro forecasting, 2023 provided just that.
As 2023 began, inflation was still running well above historical averages. The debate centered on whether we would have a mild or severe recession in the year’s second half. As the year progressed, the “wall of worry” only steepened from the collapse of Silicon Valley Bank Financial in March and subsequent fears about credit contagion to Chinese economic weakness and rising geopolitical tensions. All this followed on the back of 2022—a very challenging year marked by 40-year high inflation and a historically rapid tightening cycle that took rates from near zero to 4.5%.
Given this backdrop, one could have made the understandable, tactical decision to take a more conservative or “wait and see” approach in 2023. However, as we’ve seen time and again throughout history, the short term doesn’t always unfold as expected. As a measure of global equities, the MSCI ACWI Index rose nearly 23% in 2023, the sixth-best annual return since the Index incepted in 2001. Impressively, more than 14% of this return came in the year’s final two months as optimism grew around a soft-landing outcome and the potential for interest rate cuts in the first half of 2024.
None of this is to suggest that the path of the global economy or equity markets is now clear. The truth is nobody really knows how the short term will unfold. But times like this, with rapidly shifting short-term narratives, serve to reinforce the value of having a long-term mindset.
By thinking in years instead of months or quarters, the noise around macro uncertainty tends to fall away.
Our focus is—and will always be—on keeping a very high bar on quality, only owning what we believe are among the best businesses with durable competitive advantages, strong balance sheets, and secular growth tailwinds.
In remaining disciplined in our approach, we believe our businesses are as well positioned as any to deliver above-average earnings growth in good times and bad.
As we look ahead, we expect underlying earnings per share for the Portfolio to grow in the mid-teens over the next five years. If the Portfolio delivers on that, we believe returns will roughly follow as we have observed over the long term.
| 2 | Litman Gregory Funds Trust | |||||
Table of Contents
Portfolio Performance & Attribution
The largest relative contributors to the Portfolio’s performance during the fourth quarter were Workday, Amazon, and SAP. From an absolute perspective, the top contributors were Amazon, Microsoft, and Workday. The largest relative detractors to the Portfolio’s performance during the fourth quarter were Align Technology, Aon, and ADP. From an absolute perspective, the largest detractors during the quarter were Align, Aon, and Estée Lauder.
Workday’s stock price was weak coming into the quarter. At the company’s investor day in late September, management provided medium-term annual revenue guidance of 17-19%. Many investors were likely expecting annual revenue guidance of 20%+, so the 17-19% guidance may have been viewed as a tad disappointing. Following the investor day, Workday’s stock price rose significantly during Q4, buoyed by the company’s fiscal Q3 2024 earnings report, which was better than anticipated and included management raising revenue guidance for their fiscal 2024. We view the long-term guidance provided at the investor day as likely to be conservative, with ample room for Workday to continue taking share in the $100bn+ global HCM (human capital management) market. We remain confident in Workday’s ability to generate 20%+ annualized earnings growth over the next three to five years.
Amazon, which saw significant price appreciation throughout much of 2023, saw its share price increase materially in Q4 following the company’s Q3 2023 earnings report. We have yet to see the long-awaited re-acceleration in AWS (Amazon Web Services) revenue growth. However, in our estimation, the segment’s growth has likely bottomed, and we could see accelerating growth in 2024. Further, Amazon’s e-commerce business has gradually re-accelerated from 2022’s levels and, perhaps most importantly, the company’s margins and free cash flow have rebounded materially from last year. This rebound in margins and free cash flow at Amazon has been a key component of our long-term thesis for the business, and we expect the improvement in these metrics to continue into 2024 and beyond (though perhaps not linearly) as the company continues to optimize costs and capital expenditures. Our position in Amazon reflects our positive long-term expectations of the business, and it is currently our largest absolute weight in the Portfolio.
Like Workday and Amazon, SAP’s stock price rose significantly in Q4 after the company reported its Q3 2023 earnings. Importantly, SAP’s transition to the cloud (a core part of our thesis on the business) continues at pace, and the company is seeing both robust cloud revenue growth and expanding cloud gross margins. Management is guiding cloud sales growth through 2025 in the mid-20% range, which we view as reasonable and attractive.
We also view SAP as one of the more resilient software business models as it is an essential part of its customers’ day-to-day operations and cannot easily be turned off or scaled back.
Align Technology was the largest relative detractor during the past quarter, primarily because of disappointing third-quarter earnings results where the company’s revenue growth fell short of expectations despite easy comparisons from a year ago. Ultimately, we decided to exit our position in Align during the quarter, as detailed in the Portfolio Activity section.
Aon’s stock price underperformed this past quarter following the announcement of the company’s acquisition of NFP, a middle market insurance broker, for $13 billion. Though the deal complements Aon’s current business, it is expected to be dilutive to earnings in the near term, prompting a sell-off in the shares. We will continue to assess the merits of the NFP transaction, but it does not currently change our long-term view of Aon, which we view as a steady, durable, low-teens earnings compounder.
ADP modestly underperformed during the quarter. The company’s revenue and earnings growth has been in line with our expectations. Still, market participants appear to be concerned about the prospect of higher unemployment and lower interest rates in 2024, factors that could present modest headwinds to ADP’s growth. Our view of the business and its long-term growth trajectory haven’t changed, and we believe the company continues to execute at a high level.
Portfolio Activity
During the quarter, we did not initiate any new positions, though we did add to several existing positions, including Amazon, Novo Nordisk, and Abbott Laboratories. We eliminated two positions— Estée Lauder and Align Technology—and trimmed our existing position in Nestlé.
Amazon continues to showcase its place as one of the most competitively advantaged companies in the world, according to our research. Over the past few years, the company has made significant progress in managing costs and better leveraging existing capacity, driving a strong recovery in its profitability. Still, we think there’s additional room for improvement. Even after a solid run in the stock through 2023, we believe Amazon remains among one of the most attractively valued businesses in the market today. Our research shows that it is well positioned to deliver a mid-teens or higher total shareholder return for our clients over the next five-plus years without a Herculean effort from the business. It simply needs to continue executing on current businesses and growing into the capacity it built during and immediately after the pandemic.
Novo Nordisk is a newer addition to the strategy. Over the fourth quarter, we continued to build the position to an average weight. As a reminder, Novo Nordisk is a global pharmaceutical company based in Denmark and has long been the leader in developing insulin for diabetes patients. In recent years, the company’s innovation into GLP-1 drugs has been shown not only to help diabetics control blood sugar levels but also to have significant efficacy in weight loss. Obesity has become a global epidemic, creating materially negative
| Fund Summary | 3 | |||||
Table of Contents
knock-on effects for humans that range from an increase in cardiovascular events and, thus, higher mortality to a lower general quality of life. We believe that, over time, payors will recognize the value of these obesity treatments to both patients and the overall healthcare system.
Abbott Laboratories, a globally dominant healthcare business serving a broad range of end markets, was another position we added to in the period. The stock has come under pressure in recent quarters as the company has experienced a significant (and expected) decline in sales tied to pandemic-era COVID testing. However, we feel this amounts to little more than a distraction, as the core business continues to perform very well. Nothing has changed around our expectations for long-term growth, yet the stock’s valuation has compressed, making for an attractive opportunity to add to the position given the long-term durable growth profile of this business.
We exited our position in Estée Lauder, the global leader in luxury cosmetics. The company has faced a series of challenges in the past year, which have significantly impacted the company’s profitability. These range from a COVID lockdown in Shanghai, where their only Chinese distribution center was located; to travel retail partners placing large orders expecting a rebound in China that hasn’t materialized; to headwinds in North American makeup from brick-and-mortar closures; to being caught off guard by derma cosmetics, an area where L’Oréal is thriving. While some of these headwinds will abate, we do not expect a swift rebound, and the most recent earnings call illustrates that things are not turning around as we expected. We held a very small position in Estée Lauder—under 1%. Without the conviction to add after the recent decline and given little to no evidence that the company will be improving soon, we have better places to put our capital to work.
Align Technology represented another sale in the quarter. Align is the global leader in clear aligner teeth straighteners, having pioneered the category a couple of decades ago. Our decision to move on from the position is not a reflection of the quality of the business or the runway for growth ahead. Rather, given a still uncertain macro environment and the nature of their product as a big-ticket consumer discretionary purchase, we felt it more prudent to use the position as a source of funds to allocate to the aforementioned existing positions, which should prove more resilient with a narrower range of outcomes.
Finally, we trimmed our position in Nestlé. Over the past several years, we think the company has done a terrific job pruning its product portfolio of low-growth, low-margin, and capital-intensive businesses and reinvesting the proceeds in more attractive businesses to drive margin expansion.
At this point, we feel there isn’t much of an opportunity to drive further margin expansion, and the competition is significant for potential acquisition candidates that would be accretive to growth and margins. As a result, we believe that Nestlé’s ability to achieve our hurdle of low double-digit returns going forward will be more challenging, and we used the proceeds as a source of funds to add to businesses with a higher probability of delivering on our demanded returns.
Outlook
As we enter 2024, market sentiment has markedly improved, with consensus now expecting a soft landing and stabilization of the interest rate environment. Only a few months ago, consensus expectations called for rates to remain “higher for longer” and expectations for imminent recession were not uncommon. Regardless of the near-term direction of the global economy, our Portfolio companies are performing well, and we expect them to continue to perform well through the cycle. We believe the Portfolio’s valuation is currently fair for what we consider to be a collection of some of the best companies in the world. We believe these companies are well-positioned to deliver mid-teens underlying earnings per share growth, in the aggregate, for many years.
Thank you for your interest in Polen Capital and the Global Growth Portfolio. Please feel free to contact us with any questions.
Asset Allocation as of December 31, 2023
| Sector Allocation | ||||
Information Technology | 34.72 | |||
Health Care & Pharmaceuticals | 21.27 | |||
Finance | 15.22 | |||
Consumer Discretionary | 12.61 | |||
Communication Services | 7.41 | |||
Consumer Staples | 5.56 | |||
Industrials | 3.22 | |||
|
| |||
| 100.0 | ||||
|
| |||
Cash not included. | ||||
| Regional Allocation | ||||
Europe | 29.16 | |||
North America | 67.46 | |||
Asia ex-Japan | 2.16 | |||
Japan | 0 | |||
Latin America | 1.22 | |||
|
| |||
| 100.0 | ||||
|
| |||
Cash not included. | ||||
The funds’ investment objectives, risks, charges, and expenses must be considered carefully before investing. The statutory and summary prospectuses contain this and other important information about the investment company, and it may be obtained by calling 1-800-960-0188, or visiting imgpfunds.com. Read it carefully before investing.
Mutual fund investing involves risk. Principal loss is possible. Past performance does not guarantee future results.
| 4 | Litman Gregory Funds Trust | |||||
Table of Contents
The fund will invest in foreign securities. Investing in foreign securities exposes investors to economic, political and market risks and fluctuations in foreign currencies. Though not a small-cap fund, the fund may invest in the securities of small companies. Small-company investing subjects investors to additional risks, including security price volatility and less liquidity than investing in larger companies. Investments in emerging market countries involve additional risks such as government dependence on a few industries or resources, government-imposed taxes on foreign investment or limits on the removal of capital from a country, unstable government and volatile markets. A value investing style subjects the fund to the risk that the valuations never improve or that the returns on value equity securities are less than returns on other styles of investing or the overall stock market.
Each Morningstar Category Average represents a universe of Funds with similar investment objectives.
The MSCI All Country World Index is a free float-adjusted market capitalization weighted index that is designed to measure the equity market performance of developed and emerging markets.
You cannot invest directly in an index.
Fund holdings and/or sector allocations are subject to change at any time and are not recommendations to buy or sell any security.
Diversification does not assure a profit nor protect against loss in a declining market.
iM Global Partner Fund Management, LLC has ultimate responsibility for the performance of the iMGP Funds due to its responsibility to oversee the funds’ investment managers and recommend their hiring, termination, and replacement.
The iMGPFunds are distributed by ALPS Distributors, Inc.
Polen Capital Global Growth ETF Value of Hypothetical $10,000
The value of a hypothetical $10,000 investment in the Polen Capital Global Growth ETF from June 29, 2023 to December 31, 2023 compared with the MSCI ACWI Index and Morningstar Global Large-Stock Growth Category.
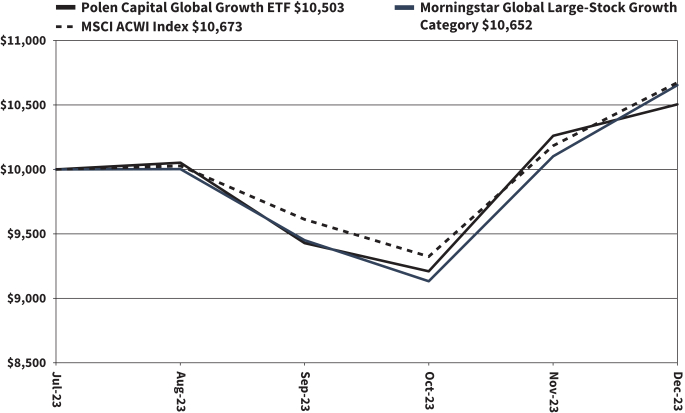
The hypothetical $10,000 investment at fund inception includes changes due to share price and reinvestment of dividends and capital gains. The chart does not imply future performance. Indexes are unmanaged, do not incur fees, expenses or taxes, and cannot be invested in directly.
Performance quoted does not include a deduction for taxes that a shareholder would pay on the redemption of fund shares.
| Fund Summary | 5 | |||||
Table of Contents
Polen Capital Global Growth ETF
SCHEDULE OF INVESTMENTS IN SECURITIES at December 31, 2023
Shares | Value | |||||||
COMMON STOCKS: 96.4% | ||||||||
| Communication Services: 7.1% | ||||||||
| 19,419 | Alphabet, Inc. - Class C* | $ | 2,736,720 | |||||
|
| |||||||
| Consumer Discretionary: 12.1% | ||||||||
| 23,648 | Amazon.com, Inc.* | 3,593,077 | ||||||
| 1,314 | LVMH Moet Hennessy Louis Vuitton SE | 1,066,178 | ||||||
|
| |||||||
| 4,659,255 | ||||||||
|
| |||||||
| Consumer Staples: 5.4% | ||||||||
| 2,627 | L’Oreal SA | 1,309,406 | ||||||
| 6,444 | Nestle SA | 747,596 | ||||||
|
| |||||||
| 2,057,002 | ||||||||
|
| |||||||
| Financials: 14.7% | ||||||||
| 4,963 | Aon PLC - Class A | 1,444,332 | ||||||
| 3,942 | MasterCard, Inc. - Class A | 1,681,303 | ||||||
| 1,459 | MSCI, Inc. | 825,283 | ||||||
| 6,424 | Visa, Inc. - Class A | 1,672,488 | ||||||
|
| |||||||
| 5,623,406 | ||||||||
|
| |||||||
| Health Care: 20.5% | ||||||||
| 16,790 | Abbott Laboratories | 1,848,075 | ||||||
| 4,088 | CSL Ltd. | 800,298 | ||||||
| 6,423 | ICON PLC* | 1,818,159 | ||||||
| 9,217 | Novo Nordisk AS - Class B | 954,728 | ||||||
| 24,675 | Siemens Healthineers AG(a) | 1,435,548 | ||||||
| 1,899 | Thermo Fisher Scientific, Inc. | 1,007,970 | ||||||
|
| |||||||
| 7,864,778 | ||||||||
|
| |||||||
| Industrials: 3.1% | ||||||||
| 5,109 | Automatic Data Processing, Inc. | 1,190,244 | ||||||
|
| |||||||
| Information Technology: 33.5%(b) | ||||||||
| 3,941 | Accenture PLC - Class A | 1,382,936 | ||||||
| 3,503 | Adobe, Inc.* | 2,089,890 | ||||||
| 3,357 | Autodesk, Inc.* | 817,362 | ||||||
| 1,897 | Globant SA* | 451,448 | ||||||
| 7,737 | Microsoft Corp. | 2,909,422 | ||||||
| 13,432 | SAP SE | 2,072,180 | ||||||
| 1,605 | ServiceNow, Inc.* | 1,133,917 | ||||||
| 7,153 | Workday, Inc. - Class A* | 1,974,657 | ||||||
|
| |||||||
| 12,831,812 | ||||||||
|
| |||||||
| | TOTAL COMMON STOCKS | 36,963,217 | ||||||
|
| |||||||
| Principal Amount | Value | |||||||
SHORT-TERM INVESTMENTS: 3.6% | ||||||||
REPURCHASE AGREEMENTS: 3.6% | ||||||||
| $1,356,896 | Fixed Income Clearing Corp. 1.600%, 12/29/2023, due 01/02/2024 [collateral: par value $1,395,300, U.S. Treasury Note, 3.875%, due 01/15/2026, value $1,384,665] (proceeds $1,357,137) | $ | 1,356,896 | |||||
|
| |||||||
| | TOTAL SHORT-TERM INVESTMENTS | 1,356,896 | ||||||
|
| |||||||
| | TOTAL INVESTMENTS | 38,320,113 | ||||||
|
| |||||||
| Other Assets in Excess of Liabilities: 0.0% | 16,129 | |||||||
|
| |||||||
NET ASSETS: 100.0% | $ | 38,336,242 | ||||||
|
| |||||||
Percentages are stated as a percent of net assets.
| * | Non-Income Producing Security. |
| (a) | Security was purchased pursuant to Rule 144A under the Securities Act of 1933 and may be sold in transactions exempt from registration only to qualified institutional buyers or in a public offering registered under Securities Act of 1933. |
| (b) | For additional information on portfolio concentration, see Note 8. |
The accompanying notes are an integral part of these financial statements.
| 6 | Litman Gregory Funds Trust | |||||
Table of Contents
Litman Gregory Funds Trust
EXPENSE EXAMPLES – (Unaudited)
As a shareholder of the Fund, you incur two types of costs: (1) transaction costs and (2) ongoing costs, including advisory fees, and other fund expenses. The examples below are intended to help you understand your ongoing costs (in dollars) of investing in the Fund and to compare these costs with the ongoing costs of investing in other mutual funds.
The actual expense example is based on an investment of $1,000 invested at the beginning of the period and held for the entire period (August 29, 2023 to December 31, 2023). The hypothetical expense example is based on an investment of $1,000 invested for the one-half year period (July 1, 2023 to December 31, 2023).
Actual Expenses
The first line of the table below provides information about actual account values and actual expenses. You may use the information in this line, together with the amount you invested, to estimate the expenses that you paid over the period. Simply divide your account value by $1,000 (for example, an $8,600 account value divided by $1,000 = 8.6), then multiply the result by the number in the first line under the heading entitled “Expenses Paid During Period” to estimate the expenses you paid on your account during this period.
Hypothetical Example for Comparison Purposes
The second line of the table below provides information about hypothetical account values and hypothetical expenses based on the Fund’s actual expense ratio and an assumed rate of return of 5% per year before expenses, which is not the Fund’s actual return. The hypothetical account values and expenses may not be used to estimate the actual ending account balance or expenses you paid for the period. You may use this information to compare the ongoing costs of investing in the Fund and other funds. To do so, compare this 5% hypothetical example with the 5% hypothetical examples that appear in the shareholder reports of the other funds.
Please note that the expenses shown in the table are meant to highlight your ongoing costs only and do not reflect any transaction costs. Therefore, the second line of the table is useful in comparing ongoing costs only, and will not help you determine the relative total costs of owning different funds. In addition, if these transaction costs were included, your costs would have been higher.
| Beginning Account Value (7/1/23) | Ending Account Value (12/31/23) | Expenses Paid During Period* (7/1/23 to 12/31/23) | Expenses Ratio During Period* (7/1/23 to 12/31/23) | |||||||||||||
Polen Capital Global Growth ETF** – Actual | $ | 1,000.00 | $ | 1,050.30 | $ | 2.96 | 0.85% | |||||||||
Polen Capital Global Growth ETF** – Hypothetical - (5% return before expenses) | $ | 1,000.00 | $ | 1,020.92 | $ | 4.33 | 0.85% | |||||||||
* Expenses are equal to the Fund’s annualized expense ratio as indicated, multiplied by the average account value over the period, multiplied by the number of days in most recent fiscal half-year period (124 for actual, 184 for hypothetical), then divided by the number of days in the fiscal year (365) (to reflect the one-half-year period).
** Commenced operations on August 29, 2023.
| Expense Examples | 7 | |||||
Table of Contents
Litman Gregory Funds Trust
STATEMENT OF ASSETS AND LIABILITIES at December 31, 2023
| Polen Capital Global Growth ETF | ||||
ASSETS: | ||||
Investments in securities at cost | $ | 34,915,221 | ||
Repurchase agreements at cost | 1,356,896 | |||
|
| |||
Total investments at cost | $ | 36,272,117 | ||
|
| |||
Investments in securities at value | $ | 36,963,217 | ||
Repurchase agreements at value | 1,356,896 | |||
|
| |||
Total investments at value | $ | 38,320,113 | ||
|
| |||
Cash | 3,921 | |||
Cash, denominated in foreign currency (cost $28) | 29 | |||
Receivables: |
| |||
Fund shares sold | 28,209 | |||
Dividends and interest | 5,505 | |||
Foreign tax reclaims | 536 | |||
|
| |||
Total Assets | 38,358,313 | |||
|
| |||
LIABILITIES: | ||||
Payables: |
| |||
Advisory fees | 22,071 | |||
|
| |||
Total Liabilities | 22,071 | |||
|
| |||
NET ASSETS | $ | 38,336,242 | ||
|
| |||
Net Assets | $ | 38,336,242 | ||
Number of shares issued and outstanding (unlimited number of shares authorized, $0.01 par value) | 3,650,000 | |||
Net asset value, offering price and redemption price per share | $ | 10.50 | ||
|
| |||
COMPONENTS OF NET ASSETS | ||||
Paid-in capital | $ | 36,305,493 | ||
Accumulated distributable earnings (deficit) | 2,030,749 | |||
|
| |||
Net assets | $ | 38,336,242 | ||
|
| |||
The accompanying notes are an integral part of these financial statements.
| 8 | Litman Gregory Funds Trust | |||||
Table of Contents
Litman Gregory Funds Trust
STATEMENT OF OPERATIONS For the Period Ended December 31, 2023
| Polen Capital Global Growth ETF* | ||||
INVESTMENT INCOME: |
| |||
Income |
| |||
Dividends (net of foreign taxes withheld of $788) | $ | 15,059 | ||
Interest | 2,553 | |||
|
| |||
Total income | 17,612 | |||
|
| |||
Expenses |
| |||
Advisory fees | 34,044 | |||
|
| |||
Total expenses | 34,044 | |||
|
| |||
Net expenses | 34,044 | |||
|
| |||
Net investment (loss) | (16,432 | ) | ||
|
| |||
REALIZED AND UNREALIZED GAIN (LOSS) |
| |||
Net realized gain (loss) on: |
| |||
Investments | (16,713 | ) | ||
Foreign currency transactions | (1,114 | ) | ||
|
| |||
Net realized (loss) | (17,827 | ) | ||
|
| |||
Net change in unrealized appreciation/depreciation on: |
| |||
Investments | 2,047,996 | |||
Foreign currency transactions | 12 | |||
|
| |||
Net change in unrealized appreciation/depreciation | 2,048,008 | |||
|
| |||
Net realized and unrealized gain (loss) on investments and foreign currency transactions | 2,030,181 | |||
|
| |||
Net increase in net assets resulting from operations | $ | 2,013,749 | ||
|
| |||
| * | Commenced operations on August 29, 2023. |
The accompanying notes are an integral part of these financial statements.
| Statement of Operations | 9 | |||||
Table of Contents
Litman Gregory Funds Trust
STATEMENT OF CHANGES IN NET ASSETS
| Polen Capital Global Growth ETF | ||||
Period Ended 2023* | ||||
INCREASE (DECREASE) IN NET ASSETS FROM: |
| |||
OPERATIONS |
| |||
Net investment loss | $ | (16,432 | ) | |
Net realized loss on investments and foreign currency transactions | (17,827 | ) | ||
Net change in unrealized appreciation/depreciation on investments and foreign currency transactions | 2,048,008 | |||
|
| |||
Net increase in net assets resulting from operations | 2,013,749 | |||
|
| |||
CAPITAL SHARE TRANSACTIONS: |
| |||
Proceeds from shares sold | 36,322,493 | |||
|
| |||
Net increase in net assets from capital share transactions | 36,322,493 | |||
|
| |||
Total increase in net assets | 38,336,242 | |||
NET ASSETS: |
| |||
Beginning of period | — | |||
|
| |||
End of period | $ | 38,336,242 | ||
|
| |||
CAPITAL TRANSACTIONS IN SHARES |
| |||
Sold | 3,650,000 | |||
Redeemed | — | |||
|
| |||
Net increase from capital share transactions | 3,650,000 | |||
|
| |||
| * | Commenced operations on August 29, 2023. |
The accompanying notes are an integral part of these financial statements.
| 10 | Litman Gregory Funds Trust | |||||
Table of Contents
Polen Capital Global Growth ETF
FINANCIAL HIGHLIGHTS
For a capital share outstanding throughout the period
| Period Ended December 31, 2023** | ||||
Net asset value, beginning of period | $ | 10.00 | ||
|
| |||
Income from investment operations: |
| |||
Net investment loss1 | (0.01 | ) | ||
Net realized gain (loss) and net change in unrealized appreciation/depreciation on investments and foreign currency | 0.51 | |||
|
| |||
Total income from investment operations | 0.50 | |||
|
| |||
Less distributions: |
| |||
From net investment income | — | |||
From net realized gains | — | |||
|
| |||
Total distributions | — | |||
|
| |||
Net asset value, end of period | $ | 10.50 | ||
|
| |||
Market price, end of period | $ | 10.48 | ||
|
| |||
Net asset value total return | 5.03 | %+ | ||
|
| |||
Market price total return | 4.80 | %+ | ||
|
| |||
Ratios/supplemental data: |
| |||
Net assets, end of year (thousands) | $ | 38,336 | ||
|
| |||
Ratios of total expenses to average net assets: | ||||
Before fees waived | 0.85 | %* | ||
|
| |||
After fees waived | 0.85 | %* | ||
|
| |||
Ratio of net investment loss to average net assets | (0.41 | )%* | ||
|
| |||
Portfolio turnover rate | 3.65 | %+,2 | ||
|
| |||
| + | Not annualized. |
| * | Annualized. |
| ** | Commenced operations on August 29, 2023. |
| 1 | Calculated based on the average shares outstanding methodology. |
| 2 | Portfolio turnover rate excludes securities received or delivered in-kind. The portfolio turnover rate including securities received or delivered in-kind was 3.65% for the period ended December 31, 2023. |
The accompanying notes are an integral part of these financial statements.
| Financial Highlights | 11 | |||||
Table of Contents
Polen Capital Global Growth ETF
NOTES TO FINANCIAL STATEMENTS
Note 1 – Organization
Litman Gregory Funds Trust (the “Trust”) was organized as a Delaware business trust on August 1, 1996, and is registered under the Investment Company Act of 1940 (the “1940 Act”) as an open-end management investment company. Effective August 1, 2011, The Masters’ Select Funds Trust changed its name to the Litman Gregory Funds Trust. The Trust consists of twelve separate series. The Polen Capital Global Growth ETF (the “Fund”) is the only series included in this report.
The Fund seeks to achieve long-term growth of capital. The Fund is a non-diversified, actively-managed ETF that seeks to achieve its objective by investing in a focused portfolio of approximately 25 to 40 common stocks of large capitalization companies (meaning companies with market capitalizations greater than $10 billion at the time of purchase) that are located anywhere in the world, including companies in both developed and emerging markets, and, in the opinion of Polen Capital Management, LLC (the “Sub-Advisor”), have a sustainable competitive advantage. In addition, the Fund may from time to time purchase common stocks, including the common stock of medium capitalization companies (meaning companies with market capitalizations greater than $2 billion but less than $10 billion at the time of purchase), if, in the Sub-Advisor’s opinion, the stock represents a particularly attractive investment opportunity. Shares of the Fund are listed and traded on the New York Stock Exchange Arca.
Note 2 – Significant Accounting Policies
The following is a summary of the significant accounting policies followed by the Fund. These policies are in conformity with accounting principles generally accepted in the United States of America (“GAAP”).
| A | Accounting Estimates. The preparation of financial statements in conformity with GAAP requires management to make estimates and assumptions. These estimates and assumptions affect the reported amounts of assets and liabilities and the disclosure of contingent assets and liabilities at the date of financial statements and the reported amounts of increases and decreases in net assets from operations during the reporting period. Actual results could differ from those estimates. |
The Fund is an investment company and accordingly follows the investment company accounting and reporting guidance of the Financial Accounting Standards Board (FASB) Accounting Standards Codification Topic 946 Financial Services – Investment Companies.
| B | Security Valuation. The Fund records its investments at fair value. Fair value is defined as the price that would be received to sell an asset or paid to transfer a liability in an orderly transaction between market participants at the measurement date. The valuation techniques used to determine fair value are further described below. Investments in securities and derivatives traded on a national securities exchange are valued at the last reported sales price at the close of regular trading on each day that the exchanges are open for trading. Securities listed on the NASDAQ Global Market, the NASDAQ Global Select Market and the NASDAQ Capital Market are valued using the NASDAQ Official Closing Price. Securities traded on an exchange for which there have been no sales are valued at the mean between the closing bid and asked prices. Debt securities maturing within 60 days or less are valued at amortized cost unless the Valuation Committee determines that amortized cost does not represent fair value. Securities for which market prices are not readily available or if a security’s value has materially changed after the close of the security’s primary market but before the close of trading on the New York Stock Exchange (“NYSE”), the securities are valued at fair value as determined in good faith by the Managers that selected the security for the Fund’s portfolio and the Trust’s Valuation Committee in accordance with procedures approved by the Board of Trustees (the “Board”). In determining fair value, the Fund takes into account all relevant factors and available information. Consequently, the price of the security used by the Fund to calculate its net asset value may differ from quoted or published prices for the same security. Fair value pricing involves subjective judgments and there is no single standard for determining the fair value of a security. As a result, different mutual funds could reasonably arrive at a different value for the same security. For securities that do not trade during NYSE hours, fair value determinations are based on analyses of market movements after the close of those securities’ primary markets, and include reviews of developments in foreign markets, the performance of U.S. securities markets, and the performance of instruments trading in U.S. markets that represent foreign securities and baskets of foreign securities. Pricing services are used to obtain closing market prices and to compute certain fair value adjustments utilizing computerized pricing models. It is possible that the fair value determined for a security is materially different from the value that could be realized upon the sale of that security or from the values that other mutual funds may determine. |
Investments in other funds are valued at their respective net asset values as determined by those funds in accordance with the 1940 Act.
The Fund is required to comply with new U.S. Securities and Exchange Commission (the “SEC”) regulations that govern valuation practices and the role of a fund’s board with respect to the fair value of the investments of a registered investment company. Rule 2a-5 under the 1940 Act, among other things, establishes an updated regulatory framework for registered investment company fair valuation practices. The Fund’s Board has designated iM Global Partner Fund Management, LLC as the Fund’s valuation designee to perform fair value functions in accordance with valuation policies and procedures adopted by iM Global Partner Fund Management, LLC, subject to the Board’s oversight.
Debt securities generally trade in the over-the-counter market rather than on a securities exchange. The Fund’s pricing services use multiple valuation techniques to determine fair value. In instances where sufficient market activity exists, the pricing services may
| 12 | Litman Gregory Funds Trust | |||||
Table of Contents
Polen Capital Global Growth ETF
NOTES TO FINANCIAL STATEMENTS – (Continued)
utilize a market-based approach through which quotes from market makers are used to determine fair value. In instances where sufficient market activity may not exist or is limited, the pricing services also utilize proprietary valuation models which may consider market characteristics such as benchmark yield curves, option-adjusted spreads, credit spreads, estimated default rates, coupon rates, anticipated timing of principal repayments, underlying collateral, and other unique security features in order to estimate the relevant cash flows, which are then discounted to calculate the fair value. Securities denominated in a foreign currency are converted into their U.S. dollar equivalent at the foreign exchange rate in effect at the close of the NYSE on the date that the values of the foreign debt securities are determined. Repurchase agreements are valued at cost, which approximates fair value.
Certain derivatives trade in the over-the-counter market. The Fund’s pricing services use various techniques including industry standard option pricing models and proprietary discounted cash flow models to determine the fair value of those instruments. The Fund’s net benefit or obligation under the derivative contract, as measured by the fair value of the contract, is included in net assets.
The Fund has procedures to determine the fair value of securities and other financial instruments for which market prices are not readily available or which may not be reliably priced. Under these procedures, the Fund primarily employs a market-based approach which may use related or comparable assets or liabilities, recent transactions, market multiples, book values, and other relevant information for the investment to determine the fair value of the investment. The Fund may also use an income-based valuation approach in which the anticipated future cash flows of the investment are discounted to calculate fair value. Discounts may also be applied due to the nature or duration of any restrictions on the disposition of the investments. Due to the inherent uncertainty of valuations of such investments, the fair values may differ significantly from the values that would have been used had an active market existed.
| C | Repurchase Agreements. The Fund may enter into repurchase agreements through which the Fund acquires a security (the “underlying security”) from a seller, a well-established securities dealer or a bank that is a member of the Federal Reserve System. The bank or securities dealer agrees to repurchase the underlying security at the same price, plus a specified amount of interest, at a later date, generally for a period of less than one week. It is the Trust’s policy that its Custodian takes possession of securities as collateral under repurchase agreements and to determine on a daily basis that the value of such securities, including recorded interest, is sufficient to cover the value of the repurchase agreements. The Trust’s policy states that the value of the collateral is at least 102% of the value of the repurchase agreement. If the counterparty defaults and the value of the collateral declines or if bankruptcy proceedings are commenced with respect to the counterparty of the security, realization of the collateral by the Fund may be delayed or limited. At December 31, 2023, the Funds’ ongoing exposure to the economic return on repurchase agreements is shown on the Schedules of Investments in Securities. |
At December 31, 2023, the Fund had investments in repurchase agreements with a gross value of $1,356,896, which is reflected as repurchase agreements on the Statement of Assets and Liabilities. The value of the related collateral exceeded the value of the repurchase agreements at December 31, 2023.
| D | Foreign Currency Translation. The Fund’s records are maintained in U.S. dollars. The value of securities, currencies and other assets and liabilities denominated in currencies other than U.S. dollars are translated into U.S. dollars based upon foreign exchange rates prevailing at the end of the reporting period. The currencies are translated into U.S. dollars by using the exchange rates quoted at the close of the London Stock Exchange prior to when the Fund’s net asset value is next determined. Purchases and sales of investment securities, income and expenses are translated on the respective dates of such transactions. |
The Fund does not isolate that portion of its net realized and unrealized gains and losses on investments resulting from changes in foreign exchange rates from the impact arising from changes in market prices. Such fluctuations are included with net realized and unrealized gain or loss from investments.
Net realized foreign currency transaction gains and losses arise from sales of foreign currencies, currency gains or losses realized between the trade and settlement dates on securities transactions, and the differences between the amounts of dividends, interest, and foreign withholding taxes recorded on the Fund’s book and the U.S. dollar equivalent of the amounts actually received or paid. Net unrealized foreign currency transactions gains and losses arise from changes in the value of assets and liabilities, other than investments in securities, resulting from changes in the exchange rates.
| E | Distributions to Shareholders. Distributions paid to shareholders are recorded on the ex-dividend date. Net realized gains from securities transactions (if any) are generally distributed annually to shareholders. The amount of dividends and distributions from net investment income and net realized capital gains is determined in accordance with federal income tax regulations, which may differ from generally accepted accounting principles. To the extent these “book/tax” differences are permanent in nature (i.e., that they result from other than timing of recognition – “temporary differences”), such amounts are reclassified within the capital accounts based on their federal tax-basis. |
| F | Income Taxes. The Fund intends to comply with the requirements of Subchapter M of the Code applicable to regulated investment companies and to distribute all of its taxable income to its shareholders. Accordingly, no provisions for federal income taxes are required. The Fund has reviewed the tax positions, taken on federal income tax returns as of December 31, 2023, and has determined |
| Notes to Financial Statements | 13 | |||||
Table of Contents
Polen Capital Global Growth ETF
NOTES TO FINANCIAL STATEMENTS – (Continued)
| that no provision for income tax is required in the Fund’s financial statements. The Fund recognizes interest and penalties, if any, related to unrecognized tax benefits as income tax expenses in the Statement of Operations. During the year ended December 31, 2023, the Fund did not incur any interest or penalties. Foreign securities held by the Fund may be subject to foreign taxation on dividend and interest income received. Foreign taxes, if any, net of any reclaims, are recorded based on the tax regulations and rates that exist in the foreign markets in which the Fund invests. |
Taxes on foreign interest and dividend income are generally withheld in accordance with the applicable country’s tax treaty with the United States. The foreign withholding rates applicable to a Fund’s investments in certain jurisdictions may be higher if a significant portion of the Fund is held by non-U.S. shareholders. The Fund may be subject to taxation on realized capital gains, repatriation proceeds and other transaction-based charges imposed by certain countries in which it invests. Taxes related to capital gains realized during the year ended December 31, 2023, if any, are reflected as part of net realized gain (loss) in the Statement of Operations.
Changes in tax liabilities related to capital gain taxes on unrealized investment gains, if any, are reflected as part of change in net unrealized appreciation (depreciation) in the Statement of Operations. Transaction-based charges are generally calculated as a percentage of the transaction amount.
The Fund may have previously filed for and/or may file for additional tax refunds with respect to certain taxes withheld by certain countries. Generally, the amount of such refunds that a Fund reasonably determines are collectible and free from significant contingencies are reflected in a Fund’s net asset value and are reflected as foreign tax reclaims receivable in the Statement of Assets and Liabilities. In certain circumstances, a Fund’s receipt of such refunds may cause the Fund and/or its shareholders to be liable for U.S. federal income taxes and interest charges.
Foreign taxes paid by the Fund may be treated, to the extent permissible by the Code (and other applicable U.S. federal tax guidance) and if that Fund so elects, as if paid by U.S. shareholders of the Fund
| G | Security Transactions, Dividend and Interest Income and Expenses. Security transactions are accounted for on the trade date. Realized gains and losses on securities transactions are reported on an identified cost basis. Dividend income and, where applicable, related foreign tax withholding expenses are recorded on the ex-dividend date. Interest income is recorded on an accrual basis. Purchase discounts and premiums on fixed-income securities are accreted and amortized to maturity using the effective interest method and reflected within interest income on the Statement of Operations. Paydown gains and losses on mortgage-related and other asset-backed securities, if any, are recorded as components of interest income in the Statement of Operations. Many expenses of the Trust can be directly attributed to a specific Fund. The Fund is charged for expenses directly attributed to it. Expenses that cannot be directly attributed to a specific Fund are allocated among the Funds in the Trust in proportion to their respective net assets or other appropriate method. |
| H | Restricted Securities. A restricted security cannot be resold to the general public without prior registration under the Securities Act of 1933. If the security is subsequently registered and resold, the issuers would typically bear the expense of all registrations at no cost to the Fund. Restricted securities are valued according to the guidelines and procedures adopted by the Fund’s Board of Trustees. As of December 31, 2023, there were no restricted securities held in the Fund. |
| I | Illiquid Securities. The Fund may not invest more than 15% of the value of its net assets in illiquid securities, including restricted securities that are not deemed to be liquid by the Sub-Advisors. The Advisor and the Sub-Advisors will monitor the amount of illiquid securities in the Fund’s portfolio, under the supervision of the Board, to ensure compliance with the Fund’s investment restrictions. In accordance with procedures approved by the Board, these securities may be valued using techniques other than market quotations, and the values established for these securities may be different than what would be produced through the use of another methodology or if they had been priced using market quotations. Illiquid securities and other portfolio securities that are valued using techniques other than market quotations, including “fair valued” securities, may be subject to greater fluctuation in their value from one day to the next than would be the case if market quotations were used. In addition, there is no assurance that the Fund could sell a portfolio security for the value established for it at any time, and it is possible that the Fund would incur a loss because a portfolio security is sold at a discount to its established value. |
| J | Indemnification Obligations. Under the Trust’s organizational documents, its current and former officers and trustees are indemnified against certain liabilities arising out of the performance of their duties to the Fund. In addition, in the normal course of business, the Fund enters into contracts that contain a variety of representations and warranties that provide general indemnifications. The Fund’s maximum exposure under these arrangements is unknown as this would involve future claims that may be made against the Fund that have not yet occurred or that would be covered by other parties. |
Note 3 – Investment Advisory and Other Agreements
The Trust, on behalf of the Fund, entered into an Investment Advisory Agreement (the “Agreement”) with Litman Gregory Fund Advisors, LLC. Effective October 1, 2021, Litman Gregory Fund Advisors, LLC has changed its name to iM Global Partner Fund Management, LLC (the “Advisor”) and also subsequently referred to as “iM Global”. Under the terms of the Agreement, the Fund pays a monthly investment advisory fee to the Advisor at the annual rate of 0.85% of the Fund’s average daily net assets.
| 14 | Litman Gregory Funds Trust | |||||
Table of Contents
Polen Capital Global Growth ETF
NOTES TO FINANCIAL STATEMENTS – (Continued)
The Advisor engages a sub-advisor to manage the Fund and pays the sub-advisor from its advisory fees.
State Street Bank and Trust Company (“State Street”) serves as the Administrator, Transfer Agent, Custodian and Fund Accountant to the Fund.
The Fund’s distributor is ALPS Distributors, Inc. (the “Distributor”).
An employee of the Advisor serves as the Funds’ Chief Compliance Officer (“CCO”). The CCO receives no compensation from the Funds for his services, however, the Funds in the Trust reimbursed the Advisor $150,000 for the year ended December 31, 2023 for the services of the CCO.
During the year ended December 31, 2023, each independent Trustee, within the meaning of the 1940 Act, was compensated by the Trust in the amount of $125,000. The Chairperson of the Board was compensated in the amount of $137,500.
Certain officers and Trustees of the Trust are also officers of the Advisor.
Note 4 – Distribution Plan
The Fund issues and redeems Shares at Net Asset Value (“NAV”) only in Creation Units. Only Authorized Participants (“APs”) may acquire Shares directly from the Fund, and only APs may tender their Shares for redemption directly to the Fund, at NAV. APs must be a member or participant of a clearing agency registered with the SEC and must execute a Participant Agreement that has been agreed to by the Distributor, and that has been accepted by the Transfer Agent, with respect to purchases and redemptions of Creation Units. Once created, Shares trade in the secondary market in quantities less than a Creation Unit.
Individual Shares may be purchased and sold only on a national securities exchange through brokers. Shares will be listed for trading on NYSE Arca and because the Shares will trade at market prices rather than NAV, Shares may trade at prices greater than NAV (at a premium), at NAV, or less than NAV (at a discount).
Note 5 – Investment Transactions
The cost of securities purchased and the proceeds from securities sold for the year ended December 31, 2023, excluding short-term investments and in-kind transactions were as follows:
| Purchases | Sales | |||||||
Polen Capital Global Growth ETF | $ | 1,303,689 | $ | 487,565 | ||||
Securities received and delivered in-kind through subscriptions and redemptions are noted in the table below:
| In-Kind Subscriptions | In-Kind Redemptions | |
$34,115,837 | $— |
Note 6 – Fair Value of Financial Investments
The Fund follows a fair value hierarchy that distinguishes between market data obtained from independent sources (observable inputs) and the Fund’s own market assumptions (unobservable inputs). These inputs are used in determining the value of the Fund’s investments and are summarized in the following fair value hierarchy:
| Level 1 – | Quoted prices in active markets for identical securities. |
| Level 2 – | Other significant observable inputs (including quoted prices for similar securities, interest rates, foreign exchange rates, and fair value estimates for foreign securities indices). |
| Level 3 – | Significant unobservable inputs (including the Fund’s own assumptions in determining fair value of investments). |
Repurchase agreements are short-term investments, they are fair valued approximately at their principal amounts. Repurchase agreements are categorized as Level 2 of the fair value hierarchy.
| Notes to Financial Statements | 15 | |||||
Table of Contents
Polen Capital Global Growth ETF
NOTES TO FINANCIAL STATEMENTS – (Continued)
The following table provides the fair value measurements of the Fund’s assets and liabilities by level within the fair value hierarchy for the Fund as of December 31, 2023. These assets and liabilities are measured on a recurring basis.
Polen Capital Global Growth ETF
| Description | Level 1 - Quoted prices in active markets for identical assets | Level 2 - Significant other observable inputs | Level 3 - Significant unobservable inputs | Total | ||||||||||||
Equity(a) | ||||||||||||||||
Common Stocks | $ | 36,963,217 | $ | — | $ | — | $ | 36,963,217 | ||||||||
|
| |||||||||||||||
Total Equity | 36,963,217 | — | — | 36,963,217 | ||||||||||||
|
| |||||||||||||||
Short-Term Investments | ||||||||||||||||
Repurchase Agreements | — | 1,356,896 | — | 1,356,896 | ||||||||||||
|
| |||||||||||||||
Total Investments in Securities in Assets | $ | 36,963,217 | $ | 1,356,896 | $ | — | $ | 38,320,113 | ||||||||
|
| |||||||||||||||
| (a) | See Fund’s Schedule of Investments in Securities for sector classifications. |
Note 7 – Income Taxes and Distributions to Shareholders
As of December 31, 2023, the components of accumulated earnings (losses) for income tax purposes were as follows:
| Polen Capital Global Growth ETF | ||||
Tax cost of Investments | $ | 36,272,204 | ||
Gross Tax Unrealized Appreciation | 2,193,002 | |||
Gross Tax Unrealized Depreciation | (145,093 | ) | ||
|
| |||
Net Tax unrealized appreciation (depreciation) on investments | 2,047,909 | |||
Net Tax unrealized appreciation (depreciation) on foreign currency | 12 | |||
|
| |||
Net Tax unrealized appreciation (depreciation) | 2,047,921 | |||
|
| |||
Undistributed Ordinary Income | — | |||
|
| |||
Undistributed Long-Term Capital Gains | — | |||
|
| |||
Capital Loss Carry Forward | (16,625 | ) | ||
|
| |||
Late Year Ordinary Loss Deferral | (547 | ) | ||
|
| |||
Other Accumulated Gains | — | |||
|
| |||
Total accumulated gain/(loss) | $ | 2,030,749 | ||
|
| |||
The difference between book-basis and tax-basis unrealized appreciation (depreciation) is attributable primarily to wash sales, and post October loss deferrals.
Capital loss carry forwards for the Fund were as follows:
Capital Loss Carryforwards | ||||
Perpetual Short-Term | $ | (16,625 | ) | |
Perpetual Long-Term | — | |||
|
| |||
Total | $ | (16,625 | ) | |
|
|
| 16 | Litman Gregory Funds Trust | |||||
Table of Contents
Polen Capital Global Growth ETF
NOTES TO FINANCIAL STATEMENTS – (Continued)
Additionally, GAAP requires that certain components of net assets relating to permanent differences be reclassified between financial and tax reporting. These reclassifications have no effect on net assets or net asset value per share. For the period ended December 31, 2023, the following table shows the reclassifications made:
| Fund | Accumulated Distributable Earnings (Deficit) | Paid In Capital | ||||||
Polen Capital Global Growth ETF* | $ | 17,000 | $ | (17,000 | ) | |||
| * | The permanent differences primarily relate to foreign currency gains/losses and net operating losses. |
The Fund did not have any unrecognized tax benefits at December 31, 2023, nor were there any increases or decreases in unrecognized tax benefits for the period ended December 31, 2023.
Note 8 – Principal Risks
Below are summaries of the principal risks of investing in the Fund, each of which could adversely affect the Fund’s net asset value, yield and total return. You should read the Fund’s prospectus carefully for a description of the principal risks associated with investing in the Fund.
| • | Country/Regional Risk. World events – such as political upheaval, financial troubles, or natural disasters – may adversely affect the value of securities issued by companies in foreign countries or regions. Because the Fund may invest a large portion of its assets in securities of companies located in any one country or region, including emerging markets, the Fund’s performance may be hurt disproportionately by the poor performance of its investments in that area. This risk is heightened in emerging markets. |
| • | Cybersecurity Risk. Information and technology systems relied upon by the Fund, the Advisor, the sub-advisors, the Fund’s service providers (including, but not limited to, Fund accountants, custodians, transfer agents, administrators, distributors and other financial intermediaries) and/or the issuers of securities in which the Fund invests may be vulnerable to damage or interruption from computer viruses, network failures, computer and telecommunication failures, infiltration by unauthorized persons, security breaches, usage errors, power outages and catastrophic events such as fires, tornadoes, floods, hurricanes and earthquakes. Although the Advisor has implemented measures to manage risks relating to these types of events, if these systems are compromised, become inoperable for extended periods of time or cease to function properly, significant investment may be required to fix or replace them. The failure of these systems and/or of disaster recovery plans could cause significant interruptions in the operations of the Fund, the Advisor, the sub-advisor, the Fund’s service providers and/or issuers of securities in which the Fund invests and may result in a failure to maintain the security, confidentiality or privacy of sensitive data, including personal information relating to investors (and the beneficial owners of investors). Such a failure could also harm the reputation of the Fund, the Advisor, the sub-advisor, the Fund’s service providers and/or issuers of securities in which the Fund invests, subject such entities and their respective affiliates to legal claims or otherwise affect their business and financial performance. |
| • | Emerging Markets Risk. The Fund may invest a portion of its assets in emerging market countries. Emerging market countries are those with immature economic and political structures, and investing in emerging markets entails greater risk than in developed markets. Such risks could include those related to government dependence on a few industries or resources, government-imposed taxes on foreign investment or limits on the removal of capital from a country, unstable government, and volatile markets. |
| • | Equity Securities Risk. This is the risk that the value of equity securities may fluctuate, sometimes rapidly and unpredictably, due to factors affecting the general market, an entire industry or sector, or particular companies. These factors include, without limitation, adverse changes in economic conditions, the general outlook for corporate earnings, interest rates or investor sentiment; increases in production costs; and significant management decisions. This risk is greater for small- and medium-sized companies, which tend to be more vulnerable to adverse developments than larger companies. |
| • | ESG Investing Risk. Because the Fund may take into consideration the environmental, social and governance characteristics of portfolio companies in which it may invest, the Fund may select or exclude securities of certain issuers for reasons other than potential performance. The Fund’s consideration of ESG characteristics in making its investment decisions may reduce or increase the Fund’s exposure to certain issuers, industries, sectors, regions or countries or cause the Fund to forego certain investment opportunities which may lower the performance of the Fund as compared to funds that do not utilize these considerations. Consideration of ESG characteristics is qualitative and subjective by nature, and there is no guarantee that the criteria used by the Sub-Advisor or any judgment exercised by the Sub-Advisor will reflect the opinions of any particular investor. Although an investment by the Fund in a company may satisfy one or more ESG and sustainability factors in the view of the portfolio managers, there is no guarantee that such company actually promotes positive environmental, social or economic developments, and that same company may also fail to satisfy other ESG factors. In addition, the Sub-Advisor may utilize third party data to evaluate ESG factors which may be incomplete or inaccurate and cause the Sub-Advisor to incorrectly assess the ESG characteristics a security or issuer. Funds with ESG investment strategies are generally suited for long-term rather than short-term investors. |
| Notes to Financial Statements | 17 | |||||
Table of Contents
Polen Capital Global Growth ETF
NOTES TO FINANCIAL STATEMENTS – (Continued)
| • | ETF Risk. As a result of the Fund’s ETF’s structure, it is exposed to the following risks: |
| • | Authorized Participants, Market Makers, and Liquidity Providers Limitation Risk. The Fund has a limited number of financial institutions that may act as Authorized Participants (“APs”). In addition, there may be a limited number of market makers and/or liquidity providers in the marketplace. To the extent either of the following events occur, shares of the Fund (“Shares”) may trade at a material discount to NAV and possibly face delisting: (i) APs exit the business or otherwise become unable to process creation and/or redemption orders and no other APs step forward to perform these services, or (ii) market makers and/or liquidity providers exit the business or significantly reduce their business activities and no other entities step forward to perform their functions. |
| • | Cash Redemption Risk. The Fund’s investment strategy may require it to redeem Shares for cash or to otherwise include cash as part of its redemption proceeds. The Fund may be required to sell or unwind portfolio investments to obtain the cash needed to distribute redemption proceeds. This may cause the Fund to recognize a capital gain that it might not have recognized if it had made a redemption in-kind. As a result, the Fund may pay out higher annual capital gain distributions than if the in-kind redemption process was used. |
| • | Costs of Buying or Selling Shares. Due to the costs of buying or selling Shares, including brokerage commissions imposed by brokers and bid/ask spreads, frequent trading of Shares may significantly reduce investment results and an investment in Shares may not be advisable for investors who anticipate regularly making small investments. |
| • | Shares May Trade at Prices Other Than NAV. As with all ETFs, Shares may be bought and sold in the secondary market at market prices. Although it is expected that the market price of Shares will approximate the Fund’s NAV, there may be times when the market price of Shares is more than the NAV intra-day (premium) or less than the NAV intra-day (discount) due to supply and demand of Shares or during periods of market volatility. This risk is heightened in times of market volatility and volatility in the Fund’s portfolio holdings, periods of steep market declines, and periods when there is limited trading activity for Shares in the secondary market, in which case such premiums or discounts may be significant. If an investor purchases Shares at a time when the market price is at a premium to the NAV of the Shares or sells at a time when the market price is at a discount to the NAV of the Shares, then the investor may sustain losses that are in addition to any losses caused by a decrease in NAV. |
| • | Trading. Although Shares are listed for trading on a national securities exchange, and may be traded on other U.S. exchanges, there can be no assurance that Shares will trade with any volume, or at all, on any stock exchange. In stressed market conditions, the liquidity of Shares may begin to mirror the liquidity of the Fund’s underlying portfolio holdings, which can be significantly less liquid than Shares. |
| • | Foreign Investment and Emerging Markets Risks. This is the risk that an investment in foreign (non-U.S.) securities may cause the Fund to experience more rapid and extreme changes in value than a fund that invests exclusively in securities of U.S. companies, due to factors such as currency conversion rate fluctuations, currency blockages, political and economic instability, differences in financial reporting, accounting and auditing standards, nationalization, expropriation or confiscatory taxation, and smaller and less-strict regulation of securities markets. These risks are greater in emerging markets. |
| • | General Market Risk; Recent Market Events. The value of the Fund’s shares will fluctuate based on the performance of the Fund’s investments and other factors affecting the securities markets generally. Certain investments selected for the Fund’s portfolio may be worth less than the price originally paid for them, or less than they were worth at an earlier time. The value of the Fund’s investments may go up or down, sometimes dramatically and unpredictably, based on current market conditions, such as real or perceived adverse political or economic conditions, inflation, changes in interest rates, lack of liquidity in certain markets or adverse investor sentiment. |
| • | Geopolitical Events Risk. The interconnectivity between global economies and financial markets increases the likelihood that events or conditions in one region or financial market may adversely impact issuers in a different country, region or financial market. Securities in the Fund’s portfolio may underperform due to inflation (or expectations for inflation), interest rates, global demand for particular products or resources, natural disasters, climate change and climate-related events, pandemics, epidemics, terrorism, international conflicts, regulatory events and governmental or quasigovernmental actions. The occurrence of global events similar to those in recent years may result in market volatility and may have long term effects on both the U.S. and global financial markets. |
| • | Growth Investing Risk. Growth stocks, as a group, may be out of favor with the market and underperform value stocks or the overall equity market. Growth stocks are generally more sensitive to market movements than other types of stocks primarily because their prices are based heavily on the future expectations of the economy and the stock’s issuing company. |
| • | Investment Selection Risk. The specific investments held in the Fund’s investment portfolio may underperform other funds in the same asset class or benchmarks that are representative of the general performance of the asset class because of a portfolio manager’s choice of securities. |
| • | Large Shareholder Purchase and Redemption Risk. This is the risk that the Fund may experience adverse effects when certain large shareholders purchase or redeem large amounts of shares of the Fund. Such large shareholder redemptions may cause the Fund to sell its securities at times when it would not otherwise do so, which may negatively impact the Fund’s net asset value and liquidity. Similarly, |
| 18 | Litman Gregory Funds Trust | |||||
Table of Contents
Polen Capital Global Growth ETF
NOTES TO FINANCIAL STATEMENTS – (Continued)
| large share purchases may adversely affect the Fund’s performance to the extent that the Fund is delayed in investing new cash and is required to maintain a larger cash position than it ordinarily would. In addition, a large redemption could result in the Fund’s current expenses being allocated over a smaller asset base, leading to an increase in the Fund’s expense ratio. |
| • | Large-Capitalization Investing Risk. The Fund may invest in the securities of large-capitalization companies. As a result, the Fund’s performance may be adversely affected if securities of these companies underperform securities of smaller capitalization companies or the market as a whole. Large-capitalization companies may adapt more slowly to new competitive challenges and be subject to slower growth during times of economic expansion. |
| • | Mid-Sized Companies Risk. Securities of companies with mid-sized market capitalizations are generally more volatile and less liquid than the securities of large-capitalization companies. Mid-sized companies may be more reliant on a few products, services or key personnel, which can make it riskier than investing in larger companies with more diverse product lines and structured management. Mid-sized companies may have relatively short operating histories or may be newer public companies. Some of these companies have more aggressive capital structures, including higher debt levels, than large-cap companies, or are involved in rapidly growing or changing industries and/or new technologies, which pose additional risks. |
| • | Non-Diversified Fund Risk. Because the Fund is “non-diversified,” it may invest a greater percentage of its assets in the securities of a single issuer. As a result, a decline in the value of an investment in a single issuer could cause the Fund’s overall value to decline to a greater degree than if the Fund held a more diversified portfolio. |
| • | Operational Risk. Operational risks include human error, changes in personnel, system changes, faults in communication, and failures in systems, technology, or processes. Various operational events or circumstances are outside the Advisor’s or The Sub-Advisor’s control, including instances at third parties. The Fund, the Advisor and the Sub-Advisor seek to reduce these operational risks through controls and procedures. However, these measures do not address every possible risk and may be inadequate to address these risks. |
| • | Public Health Emergency Risk. This is the risk that pandemics and other public health emergencies, including outbreaks of infectious diseases such as the current outbreak of the novel coronavirus (“COVID-19”), can result, and in the case of COVID-19 is resulting, in market volatility and disruption, and materially and adversely impact economic conditions in ways that cannot be predicted, all of which could result in substantial investment losses. Containment efforts and related restrictive actions by governments and businesses have significantly diminished and disrupted global economic activity across many industries. Less developed countries and their health systems may be more vulnerable to these impacts. The ultimate impact of COVID-19 or other health emergencies on global economic conditions and businesses is impossible to predict accurately. Ongoing and potential additional material adverse economic effects of indeterminate duration and severity are possible. The resulting adverse impact on the value of an investment in the Fund could be significant and prolonged. |
| • | Regulatory Risk. Governments, agencies or other regulatory bodies may adopt or change laws or regulations that could adversely affect the issuer, or market value, of an instrument held by the Fund or that could adversely impact the Fund’s performance. |
| • | Sector Concentration Risk. The Fund concentrates its investments in a narrow segment of the total market. At December 31, 2023, the Fund has 33.5% of net assets invested in the Information Technology sector of the stock market. Because of this, the Fund is subject to certain additional risks as compared to investing in a more diversified portfolio of investments. |
| • | Sector Weightings Risk. To the extent that the Fund emphasizes, from time to time, investments in a particular sector, the Fund will be subject to a greater degree to the risks particular to that sector. Market conditions, interest rates, and economic, regulatory, or financial developments could significantly affect a single sector. By focusing its investments in a particular sector, the Fund may face more risks than if it were diversified broadly over numerous sectors. |
| • | Technology Investment Risk. The Fund may invest a portion of its assets in the technology sector, which is a very volatile segment of the market. The nature of technology is that it is rapidly changing. Therefore, products or services that may initially look promising may subsequently fail or become obsolete. In addition, many technology companies are younger, smaller and unseasoned companies which may not have established products, an experienced management team, or earnings history. |
| Notes to Financial Statements | 19 | |||||
Table of Contents
REPORT OF INDEPENDENT REGISTERED PUBLIC ACCOUNTING FIRM
To the Shareholders and Board of Trustees of
Litman Gregory Funds Trust
Opinion on the Financial Statements
We have audited the accompanying statement of assets and liabilities, including the schedule of investments, of Polen Capital Global Growth ETF (the “Fund”), a series of Litman Gregory Funds Trust, as of December 31, 2023, and the related statements of operations and changes in net assets, the related notes, and the financial highlights for the period from August 29, 2023 (commencement of operations) through December 31, 2023 (collectively referred to as the “financial statements”). In our opinion, the financial statements present fairly, in all material respects, the financial position of the Fund as of December 31, 2023, the results of its operations, the changes in net assets, and the financial highlights for the period from August 29, 2023 (commencement of operations) through December 31, 2023, in conformity with accounting principles generally accepted in the United States of America.
Basis for Opinion
These financial statements are the responsibility of the Fund’s management. Our responsibility is to express an opinion on the Fund’s financial statements based on our audit. We are a public accounting firm registered with the Public Company Accounting Oversight Board (United States) (“PCAOB”) and are required to be independent with respect to the Fund in accordance with the U.S. federal securities laws and the applicable rules and regulations of the Securities and Exchange Commission and the PCAOB.
We conducted our audit in accordance with the standards of the PCAOB. Those standards require that we plan and perform the audit to obtain reasonable assurance about whether the financial statements are free of material misstatement whether due to error or fraud.
Our audit included performing procedures to assess the risks of material misstatement of the financial statements, whether due to error or fraud, and performing procedures that respond to those risks. Such procedures included examining, on a test basis, evidence regarding the amounts and disclosures in the financial statements. Our procedures included confirmation of securities owned as of December 31, 2023, by correspondence with the custodian and brokers; when replies were not received from brokers, we performed other auditing procedures. Our audit also included evaluating the accounting principles used and significant estimates made by management, as well as evaluating the overall presentation of the financial statements. We believe that our audit provides a reasonable basis for our opinion.
We have served as the auditor of one or more investment companies advised by iM Global Partner Fund Management, LLC since 2012.
COHEN & COMPANY, LTD.
Cleveland, Ohio
February 28, 2024
| 20 | Litman Gregory Funds Trust | |||||
Table of Contents
Litman Gregory Funds Trust
OTHER INFORMATION – (Unaudited)
Proxy Voting Policies and Procedures
The sub-advisors of the Fund votes proxies relating to portfolio securities in accordance with procedures that have been approved by the Board of Trustees of the Fund. You may obtain a description of these procedures, without charge, by calling toll-free, 1-800-960-0188. This information is also available through the Securities and Exchange Commission’s website at http://www.sec.gov.
Proxy Voting Record
Information regarding how the sub-advisor of the Fund voted proxies relating to portfolio securities during the 12-month period ended June 30 will be available, without charge, by calling toll-free, 1-800-960-0188. This information will also available through the Securities and Exchange Commission’s website at http://www.sec.gov.
Portfolio Holdings Information
The Fund files a complete schedule of portfolio holdings with the Securities and Exchange Commission for the first and third quarters of each fiscal year as an exhibit to its reports on Form N-PORT. You can find the filings on the Securities and Exchange Commission’s website at http://www.sec.gov. This information is also available, without charge, by calling toll-free, 1-800-960-0188 or by visiting the Funds’ website at http://www.imgpfunds.com.
Householding Mailings
To reduce expenses, the Trust may mail only one copy of the Funds’ prospectus and each annual and semi-annual report to those addresses shared by two or more accounts. If you wish to receive individual copies of these documents, please call us at 1-800-960-0188 (or contact your financial institution). The Trust will begin sending you individual copies thirty days after receiving your request.
Review of Liquidity Risk Management Program
Pursuant to Rule 22e-4 under the 1940 Act, the Trust, on behalf of the Funds in the Trust, has adopted a liquidity risk management program (the “Program”) to govern the Trust’s approach to managing liquidity risk. The Program is overseen by the Trust’s Liquidity Committee, and the Program’s principal objectives include assessing, managing and periodically reviewing each Fund’s liquidity risk, based on factors specific to the circumstances of the Fund.
At a meeting of the Board held on June 7, 2023, the Trustees received a report from the Trust’s Chief Liquidity Officer, who serves as chair of the Trust’s Liquidity Committee, addressing the operations of the Program and assessing its adequacy and effectiveness of implementation. The Liquidity Committee determined, and the Chief Liquidity Officer reported to the Board, that the Program is reasonably designed to assess and manage each Fund’s liquidity risk and has operated adequately and effectively to manage each Fund’s liquidity risk since the Program was implemented in August 2018. The Chief Liquidity Officer reported that, during the period covered by the report, there were no liquidity events that impacted the Funds or their ability to timely meet redemptions without dilution to existing shareholders. The Chief Liquidity Officer further noted that no material changes have been made to the Program since its implementation.
There can be no assurance that the Program will achieve its objectives in the future. Please refer to the Fund’s prospectus for more information regarding the Fund’s exposure to liquidity risk and other principal risks to which an investment in the Funds may be subject.
| Other Information | 21 | |||||
Table of Contents
Litman Gregory Funds Trust
OTHER INFORMATION – (Unaudited) – (Continued)
Board Consideration of Investment Sub-Advisory Agreement with Polen Capital Management, LLC
At a meeting held on June 7, 2023 (the “Meeting”), the Board of Trustees of the Trust (the “Board”), including the trustees of the Trust who are not “interested persons” of the Trust as defined in the Investment Company Act of 1940, as amended (the “1940 Act”) (the “Independent Trustees”), unanimously approved a new investment sub-advisory agreement (the “Polen Capital Sub-Advisory Agreement” by and between iM Global Partner Fund Management, LLC (the “Advisor”) and Polen Capital Management, LLC (“Polen Capital”) pursuant to which Polen Capital will serve as the sub-advisor to the Polen Capital Global Growth ETF and manage the Fund’s assets.
At the Meeting, the Board, including the Independent Trustees, unanimously approved the hiring of Polen Capital as the sub-advisor to the Fund and the Polen Capital Sub-Advisory Agreement. In determining whether to approve the Polen Capital Sub-Advisory Agreement, the Board and the Independent Trustees considered the materials prepared by the Advisor and received in advance of and at the Meeting and other information, which included, without limitation: (i) confirmation that the standard form of the sub-advisory agreement used by the Fund would be used in substantially that form for the Polen Capital Sub-Advisory Agreement; (ii) information regarding the process the Advisor undertook in recommending Polen Capital for Board approval; (iii) information regarding the nature, extent and quality of the services that Polen Capital is expected to provide to the Fund; (iv) information regarding Polen Capital’s reputation, investment management business, personnel, and operations; (v) information regarding Polen Capital’s brokerage and trading policies and practices; (vi) information regarding the level of sub-advisory fees to be charged by Polen Capital; (vii) information regarding Polen Capital’s compliance program; (viii) information regarding Polen Capital’s historical performance returns managing its various strategies, including its U.S. focus strategy, global growth strategy and international growth strategy as well as performance information of relevant indexes; and (ix) information regarding Polen Capital’s financial condition. The Board also considered the substance of its discussions with representatives of the Advisor at the Meeting. In particular, the Board and the Independent Trustees focused on the following:
1. The Nature, Extent and Quality of Services Expected to be Provided
The Board reviewed the services expected to be provided to the Fund by Polen Capital. The Board considered Polen Capital’s investment experience, philosophy and process. It was noted that Polen Capital follows a high-conviction approach to investing consistent with that of the Advisor. The Board noted that Polen Capital’s investment approach seeks to identify companies with a durable earnings profile driven by a sustainable competitive advantage, financial strength, sound Environmental, Social, and Governance (ESG) practices, proven management teams and powerful products/services. The Board further noted that Polen Capital takes a long-term investment approach and seeks to preserve capital and provide stability across market cycles. The Board also considered the extensive due diligence process undertaken by the Advisor and the Advisor’s favorable assessment of the nature and quality of the investment sub-advisory services expected to be provided to the Fund by Polen Capital. The Board further noted its familiarity with Polen Capital as a Sub-Advisor to the iMGP International Fund. The Board also noted Polen Capital’s commitment to diversity considerations.
In light of the foregoing, the Board, including the Independent Trustees, concluded that the services expected to be provided by Polen Capital would be satisfactory and would have the potential to benefit the Fund.
2. Investment Performance of Polen Capital
The Board considered Polen Capital’s performance record among its various strategies, including its U.S. focus strategy, global growth strategy and international growth strategy. The Advisor’s conviction in Polen Capital’s international strategy was noted, as well as the factors that the Advisor considered in connection with its recommendation to approve Polen Capital as the sub-advisor to the Fund.
Based on such review, the Board, including the Independent Trustees, concluded that Polen Capital’s historical performance, when viewed with other factors considered by the Board, supported a decision to approve the Sub-Advisory Agreement.
3. Cost of the Services to be Provided and Profits to be Realized from the Relationship with the Fund
The Board considered the proposed sub-advisory fee payable to Polen Capital under the Sub-Advisory Agreement, noting that such fee would be paid by the Advisor, and not the Fund, and, thus, would not impact the fees to be paid by the Fund. The Board considered that the proposed sub-advisory fee to be paid to Polen Capital by the Advisor under the Sub-Advisory Agreement had been negotiated at arm’s-length and fairly reflects the services provided by the Advisor and Polen Capital, respectively. Given the arm’s-length nature of the arrangement, the Board concluded that the proposed sub-advisory fee payable to Polen Capital by the Advisor under the Sub-Advisory Agreement is reasonable and appropriate. The Board noted that a detailed analysis of profitability in general was more appropriate in the context of the Board’s consideration of the advisory agreement with the Advisor. Accordingly, considerations of profitability with respect to approval of the Sub-Advisory Agreement were not relevant to the Board’s determination to approve Polen Capital’s Sub-Advisory Agreement.
It was noted that a Trustee has served as a member of Polen Capital’s Advisory Committee since 2018. It was also noted that, while iM Square Holding 1 LLC, an affiliate of the Advisor (“iM Square”), has a 20% ownership interest in Polen Capital, the Advisor had identified Polen Capital as a potential sub-advisor several years prior to the acquisition of Litman Gregory Wealth Management, LLC (formerly, Litman Gregory Asset Management, LLC), the parent of the Advisor, by iM Global. It was further noted that the Advisor is not technically affiliated
| 22 | Litman Gregory Funds Trust | |||||
Table of Contents
Litman Gregory Funds Trust
OTHER INFORMATION – (Unaudited) – (Continued)
with Polen Capital under the 1940 Act. The Board and Trust counsel noted the due diligence process employed by the Advisor in connection with its recommendation to hire Polen Capital as the sub-advisor to the Fund. It was noted that the Advisor engaged in a robust due diligence and selection process, consistent with the process it has historically employed in analyzing and recommending sub-advisors to the Board.
The Board reviewed the non-controlling nature and structure of iM Square’s investment in Polen Capital, and noted that iM Square’s minority interest in Polen Capital did not constitute “control” over Polen Capital. The Board discussed the strong partnerships of the Advisor’s parent company with investment advisors, in this case through iM Square’s partial ownership stake in Polen Capital, that could enable the Advisor to bring the best capabilities of iM Global’s partners to the Fund and other funds in the Trust. The Board noted that iM Global’s relationship with these partners may enable the Funds, including the Fund, to have greater insight into the partners’ compliance and business platform than is generally possible with third-party sub-advisors, aiding the ongoing monitoring of sub-advisors.
Based on such review, the Board, including the Independent Trustees, concluded that the proposed sub-advisory fee payable to Polen Capital would be reasonable in relation to the services expected to be provided to the Fund.
4. The Extent to Which Economies of Scale Would be Realized as the Fund Grows and Whether Fee Levels Would Reflect Such Economies of Scale
The Board considered the extent to which economies of scale would be realized as the Fund grows and whether fee levels reflect these economies of scale for the benefit of Fund shareholders. The Board recognized that this consideration is less relevant with respect to the proposed sub-advisory fee because the Advisor will pay Polen Capital out of its advisory fees received from the Fund and noted that the Board considered economies of scale for the Fund in connection with the approval of the Advisor’s advisory agreement with the Fund.
5. Fall-Out Benefits
The Board considered that there may be financial benefits that Polen Capital derives from its relationship with the Advisor and the Fund, including soft dollar commission benefits generated through Fund portfolio transactions. The Board did not view this consideration as having a material effect on its overall view of the reasonableness of the proposed sub-advisory fee to Polen Capital.
Conclusion
The Independent Trustees did not identify any single factor discussed previously as all-important or controlling. The Board, including a majority of Independent Trustees, concluded that the terms of the Sub-Advisory Agreement were fair and reasonable, that the fees are reasonable in light of the services expected to be provided to the Fund and that the Sub-Advisory Agreement should be approved. Based on its discussion and such other matters as were deemed relevant, the Board, including the Independent Trustees, concluded that the Sub-Advisory Agreement was in the best interest of the Fund and its shareholders and does not involve a conflict of interest from which the Advisor or a sub-advisor affiliated with the Advisor’s parent company, derives an inappropriate advantage.
| Other Information | 23 | |||||
Table of Contents
Litman Gregory Funds Trust
TRUSTEE AND OFFICER INFORMATION – (Unaudited)
Independent Trustees*
| Name, Address and Year Born | Position(s) Held with the Trust | Term of Office and Length of Time Served | Principal Occupation(s) During Past Five Years | #of Portfolios Complex Trustee | Other Directorships Held by Trustee During Past Five Years | |||||
Julie Allecta 2301 Rosecrans Avenue, Suite 2150 El Segundo, CA 90245 (born 1946) | Chairperson of the Board, Independent Trustee | Open-ended term; served since June 2013 | Member of Governing Council and Policy Committee, Independent Directors Council (education for investment company independent directors) 2014-2022; and Retired Partner, Paul Hastings LLP (law firm) from 1999 to 2009. | 12 | Forward Funds (mutual funds) (4 portfolios) Salient MF Trust (mutual funds) (1 portfolio) Salient Midstream & MLP Fund (closed-end fund) (1 portfolio) | |||||
Thomas W. Bird 2301 Rosecrans Avenue, Suite 2150 El Segundo, CA 90245 (born 1957) | Independent Trustee | Open-ended term; served since May 2021 | Founder, Chief Executive Officer and Director, Bird Impact LLC (impact investment vehicle) since 2016; Founder, Chairman and Chief Investment Officer, FARM Group (impact not-for-profit organization) since 1998; Board Member, Sonen Capital LLC(impact asset management firm) 2016-2020. | 12 | Sonen Capital LLC; One Summit (not-for-profit organization), Cromwell Harbor Supporting Foundation, Inc. (not-for-profit organization) | |||||
Jennifer M. Borggaard 2301 Rosecrans Avenue, Suite 2150 El Segundo, CA 90245 (born 1969) | Independent Trustee | Open-ended term; served since May 2021 | Co-Founder and Partner, AlderBrook Advisors (management consulting) since 2019; Member, Advisory Committee, Polen Capital (investment advisor) since 2018; Senior Vice President, Affiliated Managers Group, Inc. (asset management) 2007-2017. | 12 | BroadStreet Partners Inc. (insurance); BNY Mellon Charitable Gift Fund; Anchor Capital Advisors LLC (asset management); Boston Financial Management, LLC (asset management) | |||||
Jonathan W. DePriest 2301 Rosecrans Avenue, Suite 2150 El Segundo, CA 90245 (born 1968) | Independent Trustee | Open-ended term; served since May 2021 | Consultant (financial services) since 2022; General Counsel, ApplePie Capital, Inc. (franchise financing) 2019-2021; Executive Vice President and General Counsel, Salient Partners, L.P. (asset management) 2015-2019. | 12 | None | |||||
Frederick A. Eigenbrod, Jr., Ph.D. 2301 Rosecrans Avenue, Suite 2150 El Segundo, CA 90245 (born 1941) | Independent Trustee | Open-ended term; served since inception | Vice President, RoutSource Consulting Services (organizational planning and development) since 2002. | 12 | None | |||||
Harold M. Shefrin, Ph.D. 2301 Rosecrans Avenue, Suite 2150 El Segundo, CA 90245 (born 1948) | Independent Trustee | Open-ended term; served since February 2005 | Professor, Department of Finance, Santa Clara University since 1979. | 12 | SA Funds – Investment Trust (mutual funds) (10 portfolios) |
| 24 | Litman Gregory Funds Trust | |||||
Table of Contents
Litman Gregory Funds Trust
TRUSTEE AND OFFICER INFORMATION – (Unaudited) – (Continued)
Interested Trustees & Officers
| Name, Address and Year Born | Position(s) Held with the Trust | Term of Office and Length of Time Served | Principal Occupation(s) During Past Five Years | #of Portfolios | Other Directorships Held by Trustee/ Officer During Past Five Years | |||||
Jeffrey K. Seeley** 2301 Rosecrans Avenue, Suite 2150 El Segundo, CA 90245 (born 1969) | Trustee and President | Open-ended term; Trustee since May 2021 and President since March 2023. | Deputy Chief Executive Officer, U.S. Chief Operating Officer and Head of Distribution, iM Global Partner US, LLC since 2018; Chief Compliance Officer of iM Global US Distributors, LLC since 2019; Head of Distribution Resource Securities from 2017-2018; and Head of Distribution and Sales, BP Capital Fund Advisors from 2015-2017. | 12 | None | |||||
Philippe Uzan** 2301 Rosecrans Avenue, Suite 2150, El Segundo, CA 90245 (born 1970) | Trustee | Open-ended term; served since March 2023 | Deputy Chief Executive Officer and Chief Investment Officer of iM Global Partners since February 2020; Chief Executive Officer of UP Quantamental from June 2019 to January 2020; Chief Investment Officer and Member of Executive Committee of Edmond de Rothschild Asset Management from December 2011 to March 2019. | 12 | iM Global Partner Asset Management iM GP SICAV (investment vehicle); Syz Capital (asset management) | |||||
John M. Coughlan 2301 Rosecrans Avenue, Suite 2150 El Segundo, CA 90245 (born 1956) | Treasurer | Open-ended term; served as Treasurer since inception. | Chief Operating Officer of the Advisor since 2004 and Chief Compliance Officer of the Advisor from 2004 to June 2023. | N/A | None | |||||
Joseph Kelly 2301 Rosecrans Avenue, Suite 2150 El Segundo, CA 90245 (born 1975) | Chief Compliance Officer and Secretary | Open-ended term; served as Chief Compliance Officer since June 2023 and Secretary since September 2023. | Managing Director, Chief Compliance Officer of the Advisor since June 2023. Deputy Chief Compliance Officer, The TCW Group, Inc. from January 2022 to June 2023. Senior Vice President Compliance, The TCW Group, Inc. from June 2021 to December 2021. General Counsel and Chief Compliance Officer, Dunham & Associates Investment Counsel Inc. from November 2013 to June 2021. | N/A | None |
| * | Denotes Trustees who are not “interested persons” of the Trust, as such term is defined under the 1940 Act (the “Independent Trustees”). |
| ** | Denotes Trustees who are “interested persons” of the Trust, as such term is defined under the 1940 Act, because of their relationship with the Advisor (the “Interested Trustees”). |
In addition, Jack Chee, Jason Steuerwalt and Kiko Vallarta, each a portfolio manager at the Advisor, are each an Assistant Secretary of the Trust.
| Trustee and Officer Information | 25 | |||||
Table of Contents
Privacy Notice
The Funds may collect non-public personal information about you from the following sources:
| • | Information we receive about you on applications or other forms; |
| • | Information you give us orally; and |
| • | Information about your transactions with us. |
We do not disclose any non-public personal information about our shareholders or former shareholders without the shareholder’s authorization, except as required or permitted by applicable law or in response to inquiries from governmental authorities. We restrict access to your personal and account information to our employees who need to know that information to provide products and services to you and to the employees of our affiliates. We also may disclose that information to non-affiliated third parties (such as to brokers or custodians) only as permitted or required by applicable law and only as needed for us to provide agreed services to you.
We maintain physical, electronic and procedural safeguards to guard your non-public personal information.
If you hold shares of the Funds through a financial intermediary, such as a broker-dealer, bank, or trust company, the privacy policy of your financial intermediary would govern how your non-public personal information would be shared with non-affiliated third parties.
| 26 | Litman Gregory Funds Trust | |||||
Table of Contents
Investment Adviser
iM Global Partner Fund Management, LLC
2301 Rosecrans Avenue, Suite 2150
El Segundo, CA 90245
Investment Sub-Advisor
Polen Capital Management, LLC
1825 NW Corporate Blvd. Suite 300
Boca Raton, FL 33431
Administrator
State Street Bank and Trust
1 Congress Building
One Congress Street, Suite 1,
Boston, MA 02114-2016
Transfer Agent
State Street Bank and Trust
1 Congress Building
One Congress Street, Suite 1,
Boston, MA 02114-2016
Principal Underwriter
ALPS Distributors, Inc.,
1290 Broadway, Suite 1100,
Denver, Colorado 80203
Custodian
State Street Bank and Trust
1 Congress Building
One Congress Street, Suite 1,
Boston, MA 02114-2016
Independent Registered Public Accounting Firm
Cohen & Company, Ltd.
1350 Euclid Avenue, Suite 800,
Cleveland, Ohio 44115
Legal Counsel
Paul Hastings LLP,
101 California Street, 48th Floor,
San Francisco, California 94111
Table of Contents
(b) Not applicable.
Item 2. Code of Ethics.
(a) The registrant has adopted a code of ethics that applies to the registrant’s principal executive officer and principal financial officer.
(b) No disclosures are required by this Item 2(b).
(c) The registrant has not made any amendments to its code of ethics during the period covered by this report.
(d) The registrant has not granted any waivers from any provisions of the code of ethics during the period covered by this report.
(e) Not applicable.
(f) The registrant undertakes to provide to any person without charge, upon request, a copy of its code of ethics by mail when they call the registrant at 1-800-960-0188.
Item 3. Audit Committee Financial Expert.
(a)(1) The registrant’s board of trustees (the “board”) has determined that the registrant has a member serving on its audit committee that possesses the attributes identified in Form N-CSR to qualify as an “audit committee financial expert.”
(a)(2) Harold M. Shefrin, the Chairman of the board’s audit committee, is the “audit committee financial expert” and Mr. Shefrin has been deemed to be “independent” as that term is defined in Form N-CSR.
Item 4. Principal Accountant Fees and Services.
The firm of Cohen & Company, Ltd. (“Cohen”) serves as the independent registered public accounting firm for the registrant and has been engaged to perform audit services, audit-related services, tax services and other services to the registrant.
(a) Audit Fees
For the fiscal years ended December 31, 2023 and December 31, 2022, the aggregate fees billed for professional services rendered by Cohen for the audit of the registrant’s annual financial statements or services that are normally provided by Cohen in connection with statutory and regulatory filings or engagements were $308,500 and $279,400, respectively.
Table of Contents
(b) Audit-Related Fees
For the fiscal years ended December 31, 2023 and December 31, 2022, the aggregate fees billed for assurance and related services rendered by Cohen that are reasonably related to the performance of the audit or review of the registrant’s financial statements and that are not reported under Audit Fees above were $0 and $0, respectively.
(c) Tax Fees
For the fiscal years ended December 31, 2023 and December 31, 2022, the aggregate fees billed for tax compliance, tax advice, and tax planning services, consisting of review of federal tax forms, preparation of tax returns and review of excise dividend calculations, rendered by Cohen were $69,000 and $55,000, respectively.
(d) All Other Fees
For the fiscal years ended December 31, 2023 and December 31, 2022, the aggregate fees billed by Cohen for all services other than services reported under Audit Fees, Audit-Related Fees, and Tax Fees were $0 and $0, respectively, consisting of costs associated with the pricing of certain debt instruments and credit default swaps held by a series of the registrant.
(e)(1) The audit committee has adopted pre-approval policies and procedures that require the audit committee to pre-approve all audit and non-audit services of the registrant, including services provided to any entity affiliated with the registrant.
(e)(2) None of the services described in each of paragraphs (b) through (d) of this Item were approved by the registrant’s audit committee pursuant to paragraph (c)(7)(i)(C) of Rule 2-01 of Regulation S-X.
(f) Not applicable.
(g) For the fiscal years ended December 31, 2023 and December 31, 2022, the aggregate non-audit fees billed by Cohen for services rendered to the registrant and to the registrant’s investment adviser (and any other controlling entity, etc. — not sub-adviser) were $4,000 and $5,000 (registrant), respectively, consisting of review of the registrant’s semi-annual shareholder report.
(h) Not applicable.
(i) Not applicable.
(j) Not applicable.
Item 5. Audit Committee of Listed Registrants.
(a) The registrant is a listed issuer as defined in Rule 10A-3 under the Securities Exchange Act of 1934, as amended (the “Exchange Act”), and has a separately-designated standing audit committee established in accordance with Section 3(a)(58)(A) of the Exchange Act. The registrant’s audit committee members are Harold M. Shefrin, Ph.D., Julie Allecta and Jonathan W. DePriest.
Table of Contents
(b) Not applicable.
Item 6. Investments.
(a) The complete Schedule of Investments is included as part of the report to shareholders filed under Item 1 of this Form N-CSR.
(b) Not applicable.
Item 7. Disclosure of Proxy Voting Policies and Procedures for Closed-End Management Investment Companies.
Not applicable to open-end investment companies.
Item 8. Portfolio Managers of Closed-End Management Investment Companies.
Not applicable to open-end investment companies.
Item 9. Purchases of Equity Securities by Closed-End Management Investment Company and Affiliated Purchasers.
Not applicable to open-end investment companies.
Item 10. Submission of Matters to a Vote of Security Holders.
There have been no material changes to the procedures by which shareholders may recommend nominees to the registrant’s board of trustees since the registrant last provided disclosure in response to this Item 10.
Item 11. Controls and Procedures.
(a) The registrant’s President/Principal Executive Officer and Treasurer/Principal Financial Officer have reviewed the registrant’s disclosure controls and procedures (as defined in Rule 30a-3(c) under the Act) as of a date within 90 days of the filing of this report, as required by Rule 30a-3(b) under the Act and Rules 13a-15(b) or 15d-15(b) under the Exchange Act. Based on their review, such officers have concluded that the disclosure controls and procedures are effective in ensuring that information required to be disclosed in this report is appropriately recorded, processed, summarized and reported timely and made known to them by others within the registrant and by the registrant’s service provider.
Table of Contents
(b) There were no changes in the registrant’s internal control over financial reporting (as defined in Rule 30a-3(d) under the Act) that occurred during the period covered by this report that have materially affected, or are reasonably likely to materially affect, the registrant’s internal control over financial reporting.
Item 12. Disclosure of Securities Lending Activities for Closed-End Management Investment Companies.
Not applicable to open-end investment companies.
Item 13. Exhibits.
(a)(1) Not applicable because the Code of Ethics is provided free of charge, upon request, as described in Item 2 of this Form N-CSR.
(a)(3) Not applicable to this filing.
(a)(4) Not applicable.
Table of Contents
SIGNATURES
Pursuant to the requirements of the Securities Exchange Act of 1934, as amended, and the Investment Company Act of 1940, as amended, the registrant has duly caused this report to be signed on its behalf by the undersigned, thereunto duly authorized.
| LITMAN GREGORY FUNDS TRUST | ||
| By: | /s/ Jeffrey K. Seeley | |
| Jeffrey K. Seeley | ||
| President and Principal Executive Officer | ||
Date: March 8, 2024
Pursuant to the requirements of the Securities Exchange Act of 1934, as amended, and the Investment Company Act of 1940, as amended, this report has been signed below by the following persons on behalf of the registrant and in the capacities and on the dates indicated.
| By: | /s/ Jeffrey K. Seeley | |
| Jeffrey K. Seeley | ||
| President and Principal Executive Officer |
Date: March 8, 2024
| By: | /s/ John M. Coughlan | |
| John M. Coughlan | ||
| Treasurer and Principal Financial Officer |
Date: March 8, 2024