Q3 2017 Financial Results October 25, 2017
Safe Harbor Language and Reconciliation of Non-GAAP Measures 2 This presentation contains certain forward-looking statements within the meaning of the Private Securities Litigation Reform Act of 1995 and other securities laws and is subject to the safe- harbor created by such Act. Forward-looking statements include, but are not, limited to, our financial performance outlook and statements concerning our operations, economic performance, financial condition, goals, beliefs, future growth strategies, investment objectives, plans and current expectations, such as 2017 guidance, 2020 outlook, expected shareholder returns and cash available for distribution. These forward-looking statements are subject to various known and unknown risks, uncertainties and other factors. When Iron Mountain uses words such as "believes," "expects," "anticipates," "estimates" or similar expressions, it is making forward-looking statements. Although Iron Mountain believes that its forward-looking statements are based on reasonable assumptions, Iron Mountain’s expected results may not be achieved, and actual results may differ materially from its expectations. Iron Mountain’s expected results may not be achieved, and actual results may differ materially from its expectations. In addition, important factors that could cause actual results to differ from Iron Mountain’s expectations include, among others: (i) Iron Mountain’s ability to remain qualified for taxation as a real estate investment trust for United States federal income tax purposes; (ii) the adoption of alternative technologies and shifts by Iron Mountain’s customers to storage of data through non-paper based technologies; (iii) changes in customer preferences and demand for Iron Mountain’s storage and information management services; (iv) the cost to comply with current and future laws, regulations and customer demands relating to data security and privacy issues, as well as fire and safety standards; (v) the impact of litigation or disputes that may arise in connection with incidents in which we fail to protect Iron Mountain’s customers' information; (vi) changes in the price for Iron Mountain’s storage and information management services relative to the cost of providing such storage and information management services; (vii) changes in the political and economic environments in the countries in which Iron Mountain’s international subsidiaries operate and changes in the global political climate; (viii) Iron Mountain’s ability or inability to complete acquisitions on satisfactory terms and to close pending acquisitions and to integrate acquired companies efficiently; (ix) changes in the amount of Iron Mountain’s capital expenditures and our ability to invest in accordance with plan ; (x) changes in the cost of Iron Mountain’s debt; (xi) the impact of alternative, more attractive investments on dividends; (xii) the cost or potential liabilities associated with real estate necessary for Iron Mountain’s business; (xiii) the performance of business partners upon whom Iron Mountain depends for technical assistance or management expertise outside the United States; (xiv) other trends in competitive or economic conditions affecting Iron Mountain’s financial condition or results of operations not presently contemplated; and (xv) other risks described more fully in our filings with the Securities and Exchange Commission, including under the caption “Risk Factors” in our periodic reports or incorporated therein. In addition, the benefits of the Recall transaction, including potential cost synergies, accretion and other synergies (including tax synergies), may not be fully realized or may take longer to realize than expected. You should not rely upon forward-looking statements except as statements of Iron Mountain’s present intentions and of its present expectations, which may or may not occur. Except as required by law, Iron Mountain undertakes no obligation to release publicly the result of any revision to these forward-looking statements that may be made to reflect events or circumstances after the date hereof or to reflect the occurrence of unanticipated events. Reconciliation of Non-GAAP Measures: Throughout this presentation, Iron Mountain will discuss (1) Adjusted EBITDA, (2) Adjusted Earnings per Share (“Adjusted EPS”), (3) Funds from Operations (“FFO NAREIT”), (4) FFO (Normalized) and (5) Adjusted Funds from Operations (“AFFO”). These measures do not conform to accounting principles generally accepted in the United States (“GAAP”). These non- GAAP measures are supplemental metrics designed to enhance our disclosure and to provide additional information that we believe to be important for investors to consider in addition to, but not as a substitute for, other measures of financial performance reported in accordance with GAAP, such as operating income, income (loss) from continuing operations, net income (loss) or cash flows from operating activities from continuing operations (as determined in accordance with GAAP). The reconciliation of these measures to the appropriate GAAP measure, as required by Regulation G under the Securities Exchange Act of 1934, as amended, and the definitions are included in Supplemental Financial Information. Iron Mountain does not provide a reconciliation of non-GAAP measures that it discusses as part of its annual guidance or long term outlook because certain significant information required for such reconciliation is not available without unreasonable efforts or at all, including, most notably, the impact of exchange rates on Iron Mountain’s transactions, loss or gain related to the disposition property, plant and equipment (including of real estate) and other income or expense. Without this information, Iron Mountain does not believe that a reconciliation would be meaningful. Selected metrics definitions are available in the Appendix.
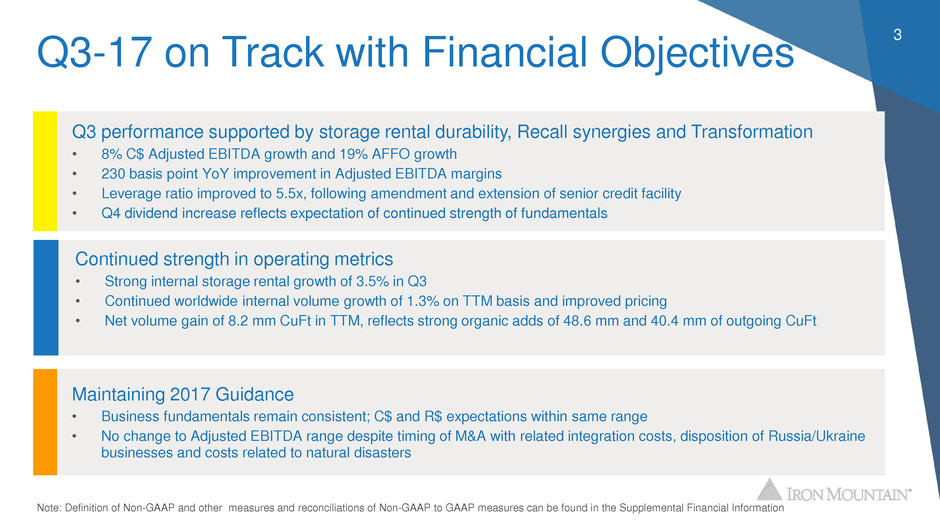
Q3-17 on Track with Financial Objectives 3 Q3 performance supported by storage rental durability, Recall synergies and Transformation • 8% C$ Adjusted EBITDA growth and 19% AFFO growth • 230 basis point YoY improvement in Adjusted EBITDA margins • Leverage ratio improved to 5.5x, following amendment and extension of senior credit facility • Q4 dividend increase reflects expectation of continued strength of fundamentals Maintaining 2017 Guidance • Business fundamentals remain consistent; C$ and R$ expectations within same range • No change to Adjusted EBITDA range despite timing of M&A with related integration costs, disposition of Russia/Ukraine businesses and costs related to natural disasters Continued strength in operating metrics • Strong internal storage rental growth of 3.5% in Q3 • Continued worldwide internal volume growth of 1.3% on TTM basis and improved pricing • Net volume gain of 8.2 mm CuFt in TTM, reflects strong organic adds of 48.6 mm and 40.4 mm of outgoing CuFt Note: Definition of Non-GAAP and other measures and reconciliations of Non-GAAP to GAAP measures can be found in the Supplemental Financial Information
4 Continued Execution of Strategic Plan Developed Markets – North America and Western Europe • Achieved 3.2% internal storage rental growth in Q3 • 1 million CuFt of net volume(1) before business acquisitions/Recall dispositions • Enhanced revenue management efforts yielding higher margin Emerging Markets(2) • Achieved 6.6% internal storage rental growth in Q3 • ~18% of total revenue(2) in Q3; expanded presence through organic growth and acquisitions • Completed deals in Cyprus and South Africa in Q3 Adjacent Businesses • Data center transactions expand existing platform • Expanding entertainment services and art storage through Bonded acquisition (1) Net volume on a trailing twelve months basis represents incoming cubic volume of 31.5mm from new and existing customers less outgoing cubic volume of 30.5mm from destructions and customer terminations (2) Emerging Markets is Other International, excluding Australia and New Zealand. Percentage of total revenue is based on 2014C$ foreign currency rates at time goal was established
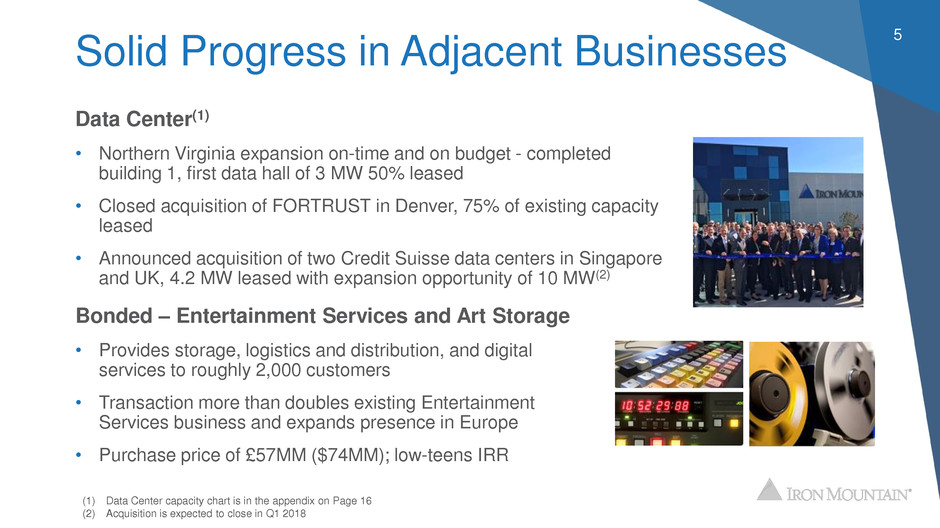
Solid Progress in Adjacent Businesses Data Center(1) • Northern Virginia expansion on-time and on budget - completed building 1, first data hall of 3 MW 50% leased • Closed acquisition of FORTRUST in Denver, 75% of existing capacity leased • Announced acquisition of two Credit Suisse data centers in Singapore and UK, 4.2 MW leased with expansion opportunity of 10 MW(2) 5 Bonded – Entertainment Services and Art Storage • Provides storage, logistics and distribution, and digital services to roughly 2,000 customers • Transaction more than doubles existing Entertainment Services business and expands presence in Europe • Purchase price of £57MM ($74MM); low-teens IRR (1) Data Center capacity chart is in the appendix on Page 16 (2) Acquisition is expected to close in Q1 2018
Recently Launched Innovations Iron Cloud • Supports hybrid data storage strategy with predictable cost, scalability and enhanced cybersecurity • Cloud Storage, Disaster Recovery and Data Archiving global market expected to grow 25% to 30%(1) Policy Center • Expands Cloud-Based Records Retention Management Platform to Mid-sized Businesses • Allows compliance with regulations, reducing cost and risk of fines • Provides up-to-date legal guidelines for electronic and physical business documents retention 6 (1) Reflects CAGR for 2016 through 2021 estimate. Source: Markets & Markets Research Report

Solid Worldwide Financial Performance 7 $ and shares in mm Q3-16 Q3-17 R$ C$ Internal Growth Revenue $943 $966 2.4% 1.4% 2.0% Storage $577 $601 4.3% 3.2% 3.5% Service $366 $365 (0.5)% (1.6)% (0.2)% Adjusted Gross Profit(1) $518 $550 6.4% Gross Profit Margin(1) 54.9% 57.0% 210 bps Income from Continuing Operations $6 $25 - Adjusted EBITDA(2) $294 $323 9.8% 8.4% Adjusted EBITDA Margin 31.2% 33.5% 230 bps Net Income $8 $24 - AFFO(2) $176 210 19.2% Dividend/Share $0.485 $0.550 13.4% Fully Diluted Shares Outstanding 265 266 0.6% (1) Reflects adjusted gross profit, excluding Recall costs; reconciliation can be found in the Supplemental Financial Information on Page 5 Reconciliation for Adjusted EBITDA and AFFO to their respective GAAP measures can be found in the Supplemental Financial Information on Pages 14 and 16, respectively Growth
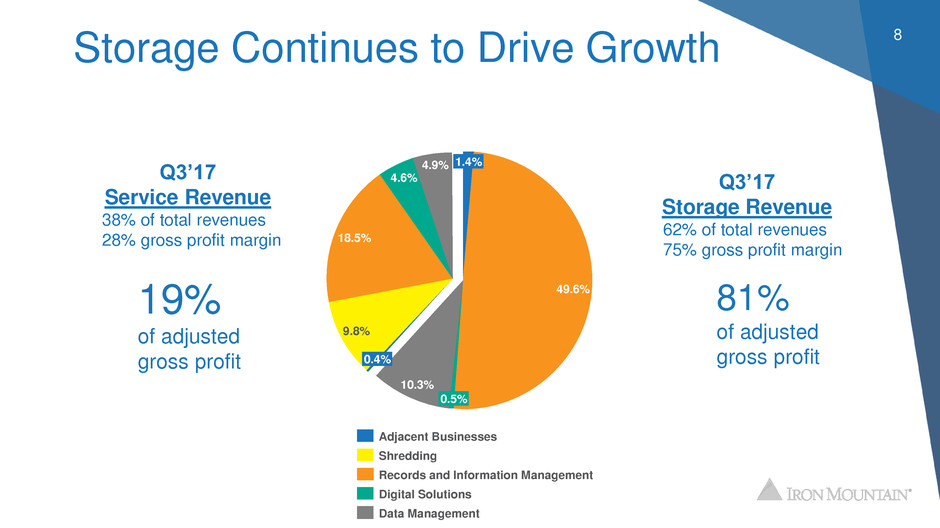
Storage Continues to Drive Growth 8 10.3% 0.5% 49.6% 1.4%4.9% 18.5% 9.8% 0.4% 4.6% Digital Solutions Records and Information Management Shredding Adjacent Businesses Data Management Q3’17 Service Revenue 38% of total revenues 28% gross profit margin Q3’17 Storage Revenue 62% of total revenues 75% gross profit margin 19% of adjusted gross profit 81% of adjusted gross profit
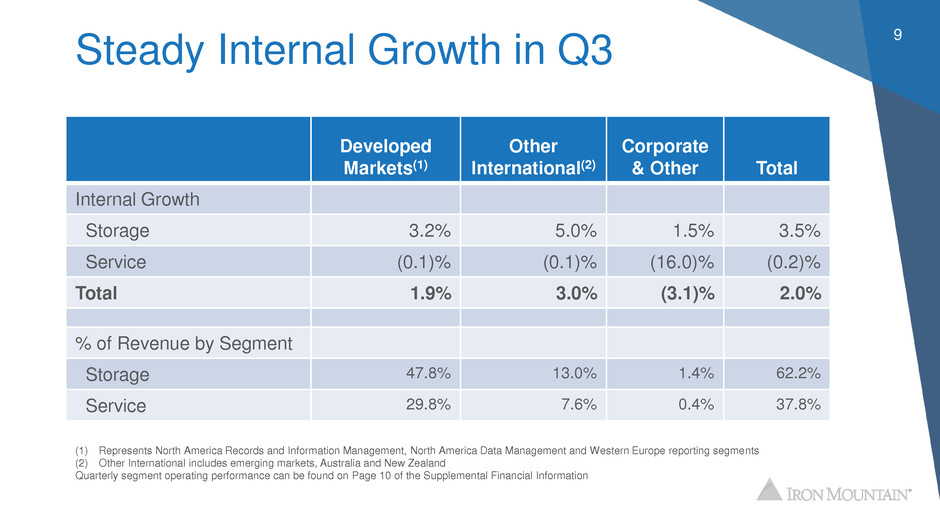
Steady Internal Growth in Q3 Developed Markets(1) Other International(2) Corporate & Other Total Internal Growth Storage 3.2% 5.0% 1.5% 3.5% Service (0.1)% (0.1)% (16.0)% (0.2)% Total 1.9% 3.0% (3.1)% 2.0% % of Revenue by Segment Storage 47.8% 13.0% 1.4% 62.2% Service 29.8% 7.6% 0.4% 37.8% 9 (1) Represents North America Records and Information Management, North America Data Management and Western Europe reporting segments (2) Other International includes emerging markets, Australia and New Zealand Quarterly segment operating performance can be found on Page 10 of the Supplemental Financial Information
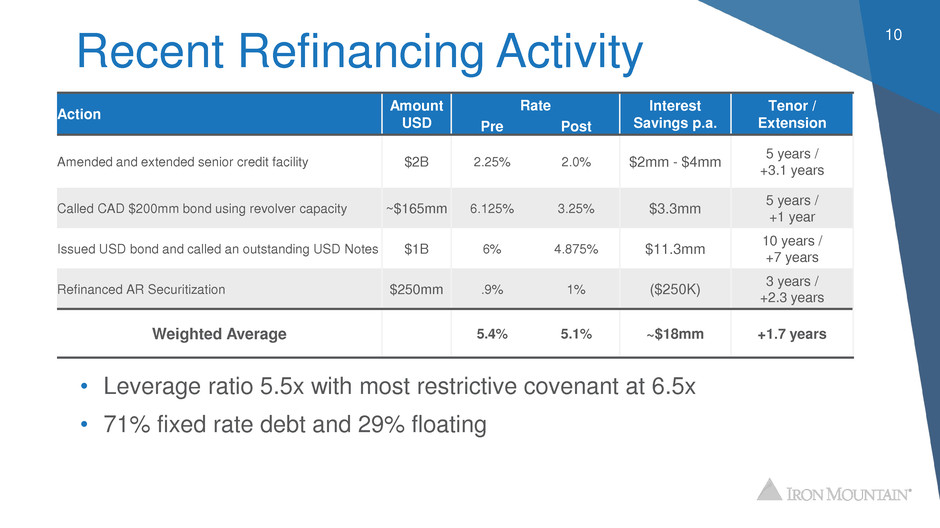
Recent Refinancing Activity • Leverage ratio 5.5x with most restrictive covenant at 6.5x • 71% fixed rate debt and 29% floating 10 Action Amount USD Rate Interest Savings p.a. Tenor / ExtensionPre Post Amended and extended senior credit facility $2B 2.25% 2.0% $2mm - $4mm 5 years / +3.1 years Called CAD $200mm bond using revolver capacity ~$165mm 6.125% 3.25% $3.3mm 5 years / +1 year Issued USD bond and called an outstanding USD Notes $1B 6% 4.875% $11.3mm 10 years / +7 years Refinanced AR Securitization $250mm .9% 1% ($250K) 3 years / +2.3 years Weighted Average 5.4% 5.1% ~$18mm +1.7 years
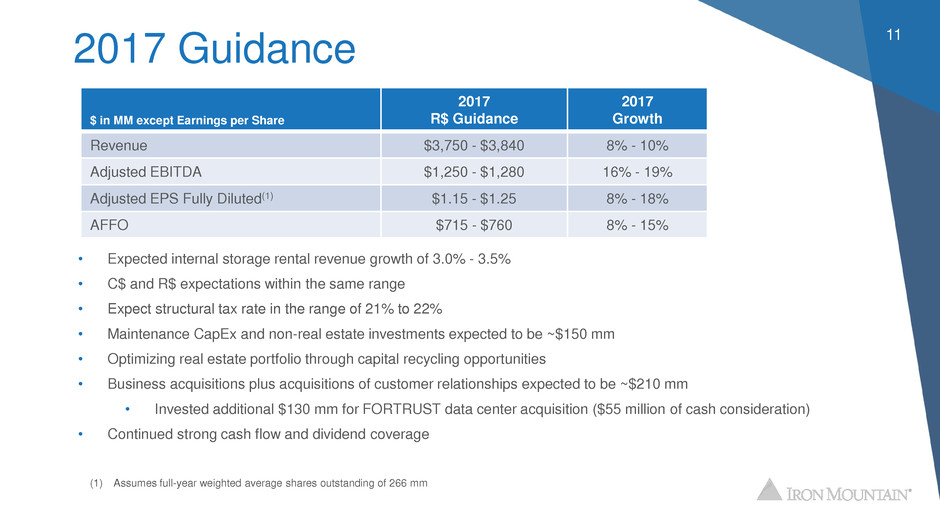
2017 Guidance 11 • Expected internal storage rental revenue growth of 3.0% - 3.5% • C$ and R$ expectations within the same range • Expect structural tax rate in the range of 21% to 22% • Maintenance CapEx and non-real estate investments expected to be ~$150 mm • Optimizing real estate portfolio through capital recycling opportunities • Business acquisitions plus acquisitions of customer relationships expected to be ~$210 mm • Invested additional $130 mm for FORTRUST data center acquisition ($55 million of cash consideration) • Continued strong cash flow and dividend coverage $ in MM except Earnings per Share 2017 R$ Guidance 2017 Growth Revenue $3,750 - $3,840 8% - 10% Adjusted EBITDA $1,250 - $1,280 16% - 19% Adjusted EPS Fully Diluted(1) $1.15 - $1.25 8% - 18% AFFO $715 - $760 8% - 15% (1) Assumes full-year weighted average shares outstanding of 266 mm
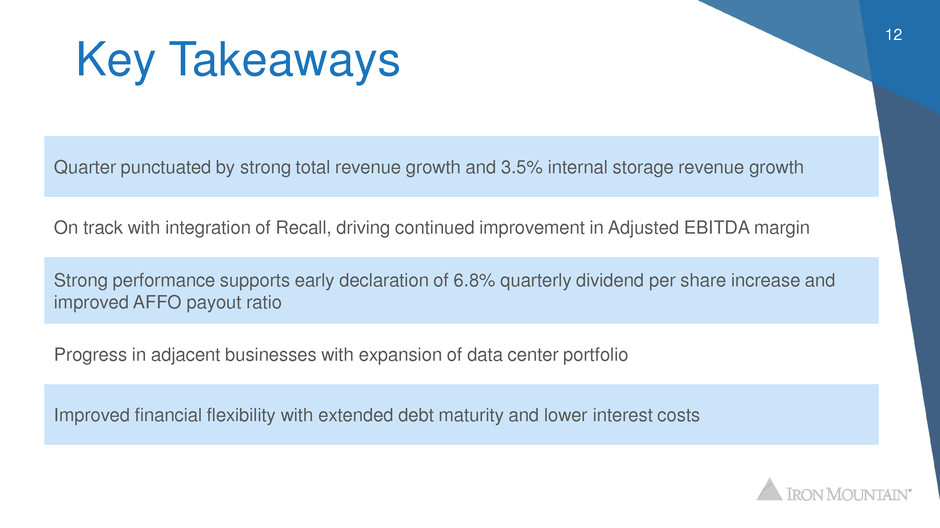
Key Takeaways 12 Quarter punctuated by strong total revenue growth and 3.5% internal storage revenue growth On track with integration of Recall, driving continued improvement in Adjusted EBITDA margin Strong performance supports early declaration of 6.8% quarterly dividend per share increase and improved AFFO payout ratio Progress in adjacent businesses with expansion of data center portfolio Improved financial flexibility with extended debt maturity and lower interest costs
Appendix

14 (34.9) (35.6) (36.3) (37.9) (39.2) (40.3) (40.7) (40.4) 43.0 43.0 45.4 47.4 48.2 50.8 49.8 48.6 Q1 ’17 9.0 10.5 Q4 ’16 9.5 Q3 ’16 Q2 ’17 9.1 Q3 ’17Q1 ’16 7.4 Q4 ’15 8.1 8.2 Q2 ’16 9.1 Worldwide Consistent Inbound/Outbound Volume CuFt in mm Net Volume before Acquisitions/Dispositions (1) (1) Net volume is defined in the appendix of the supplemental financial information on Page 42 (2) Q2-2017 cube growth has been adjusted to reflect required regulatory divestments in IRM’s legacy Australian business (2)

Developed and Other International RM Volume Developed Markets 15 Other International (1) Q2-17 cube growth has been adjusted to reflect required regulatory divestments in IRM’s legacy Australian business. (2) Represents CuFt acquired at close. CuFt activity post close flows through new sales, new volume from existing customers, destructions, outperms / terms as appropriate. Acquisitions/ dispositions reflects business acquisition volume net of dispositions required by Recall transaction and sale of Russia / Ukraine business. (3) Acquisitions of customer relationships are included in new sales as the nature of these transactions is similar to new customer wins. (1) (1) (2) (3)
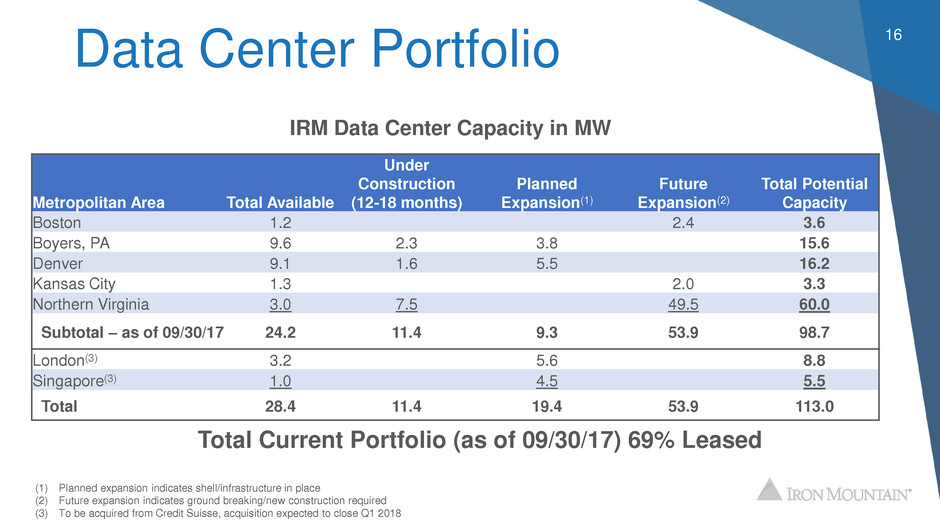
Data Center Portfolio 16 IRM Data Center Capacity in MW (1) Planned expansion indicates shell/infrastructure in place (2) Future expansion indicates ground breaking/new construction required (3) To be acquired from Credit Suisse, acquisition expected to close Q1 2018 Metropolitan Area Total Available Under Construction (12-18 months) Planned Expansion(1) Future Expansion(2) Total Potential Capacity Boston 1.2 2.4 3.6 Boyers, PA 9.6 2.3 3.8 15.6 Denver 9.1 1.6 5.5 16.2 Kansas City 1.3 2.0 3.3 Northern Virginia 3.0 7.5 49.5 60.0 Subtotal – as of 09/30/17 24.2 11.4 9.3 53.9 98.7 London(3) 3.2 5.6 8.8 Singapore(3) 1.0 4.5 5.5 Total 28.4 11.4 19.4 53.9 113.0 Total Current Portfolio (as of 09/30/17) 69% Leased
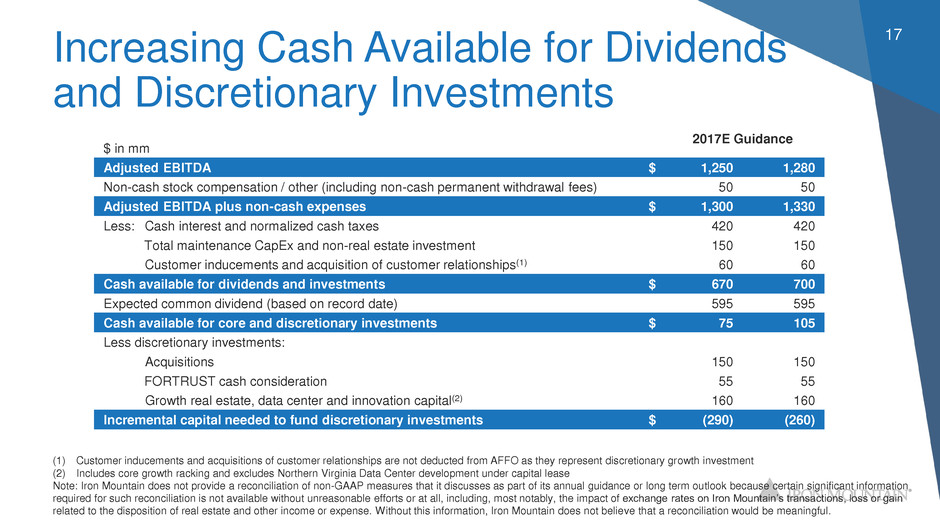
Increasing Cash Available for Dividends and Discretionary Investments 17 (1) Customer inducements and acquisitions of customer relationships are not deducted from AFFO as they represent discretionary growth investment (2) Includes core growth racking and excludes Northern Virginia Data Center development under capital lease Note: Iron Mountain does not provide a reconciliation of non-GAAP measures that it discusses as part of its annual guidance or long term outlook because certain significant information required for such reconciliation is not available without unreasonable efforts or at all, including, most notably, the impact of exchange rates on Iron Mountain’s transactions, loss or gain related to the disposition of real estate and other income or expense. Without this information, Iron Mountain does not believe that a reconciliation would be meaningful. $ in mm 2017E Guidance Adjusted EBITDA $ 1,250 1,280 Non-cash stock compensation / other (including non-cash permanent withdrawal fees) 50 50 Adjusted EBITDA plus non-cash expenses $ 1,300 1,330 Less: Cash interest and normalized cash taxes 420 420 Total maintenance CapEx and non-real estate investment 150 150 Customer inducements and acquisition of customer relationships(1) 60 60 Cash available for dividends and investments $ 670 700 Expected common dividend (based on record date) 595 595 Cash available for core and discretionary investments $ 75 105 Less discretionary investments: Acquisitions 150 150 FORTRUST cash consideration 55 55 Growth real estate, data center and innovation capital(2) 160 160 Incremental capital needed to fund discretionary investments $ (290) (260)


