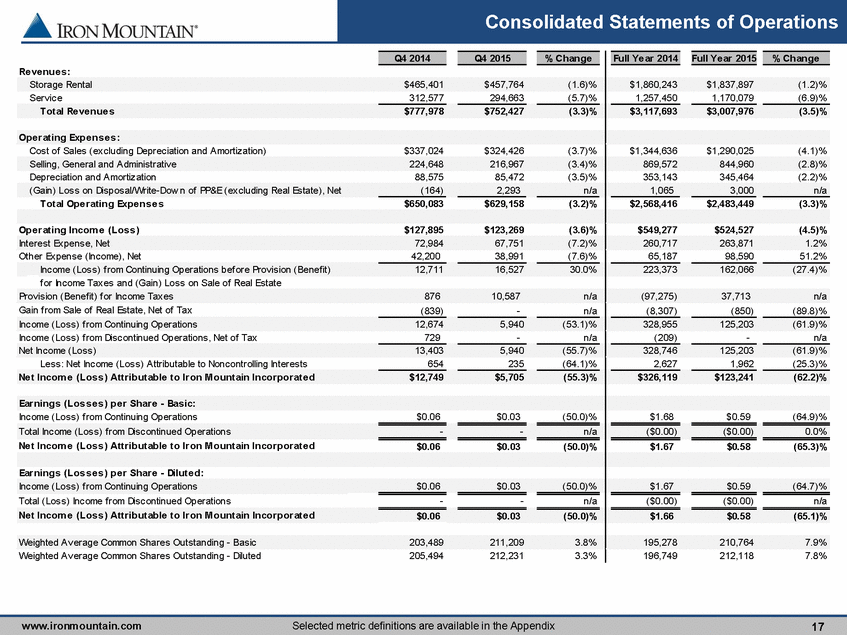
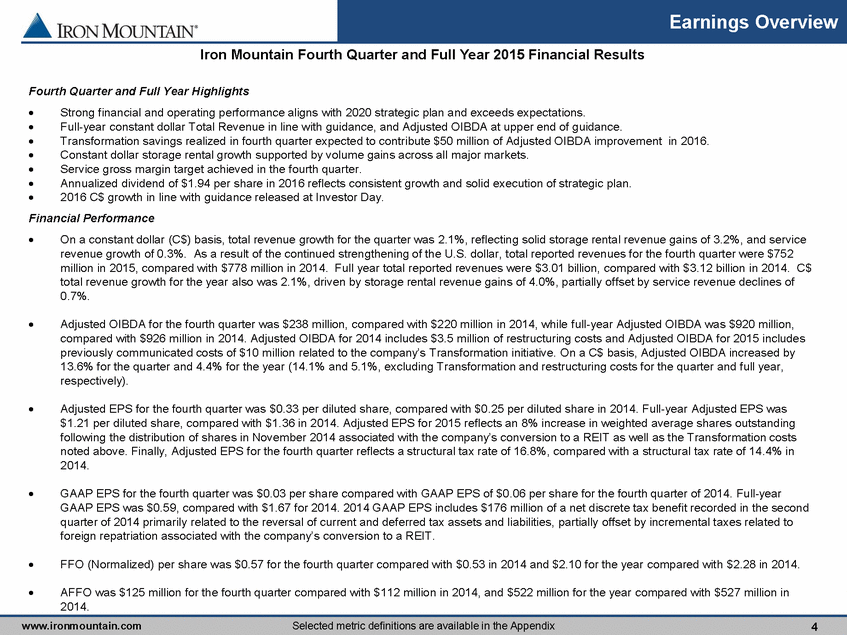
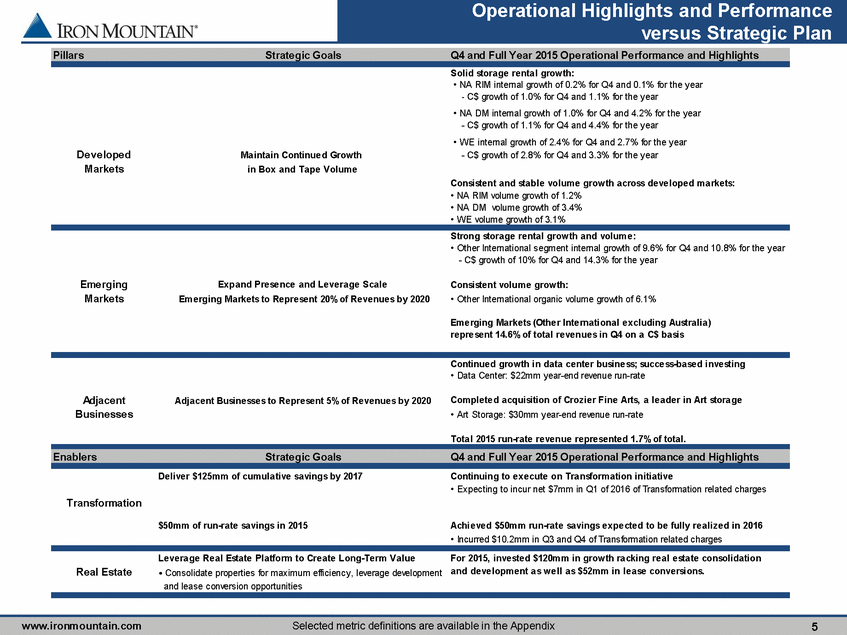
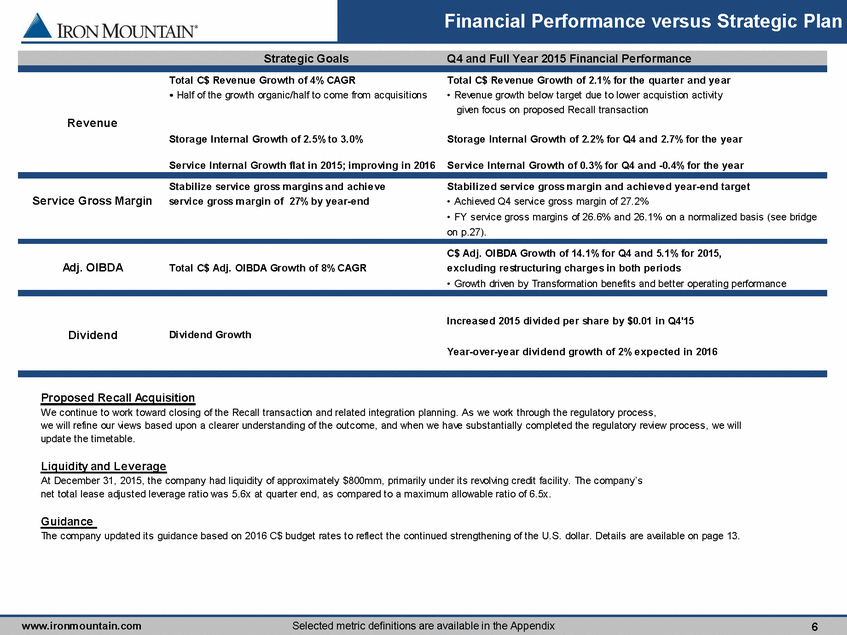
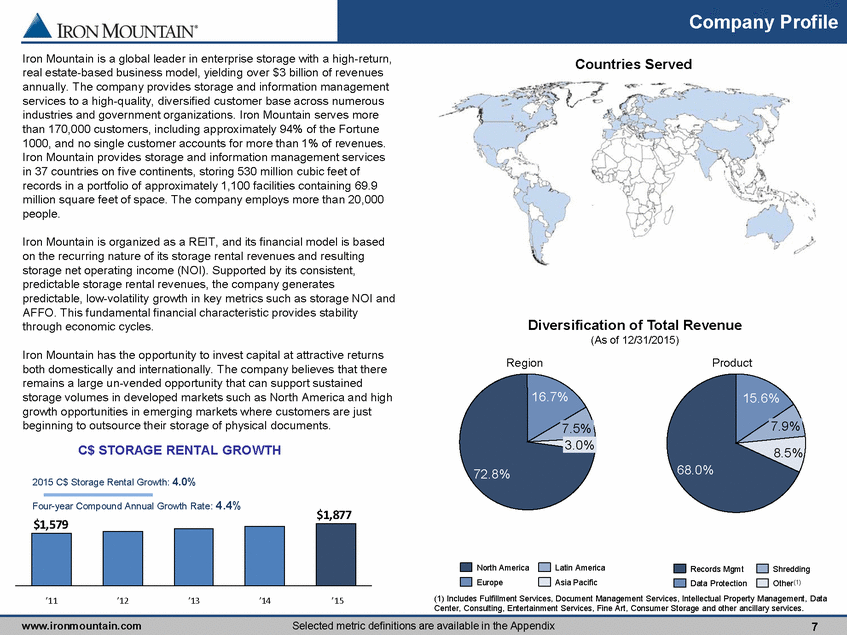
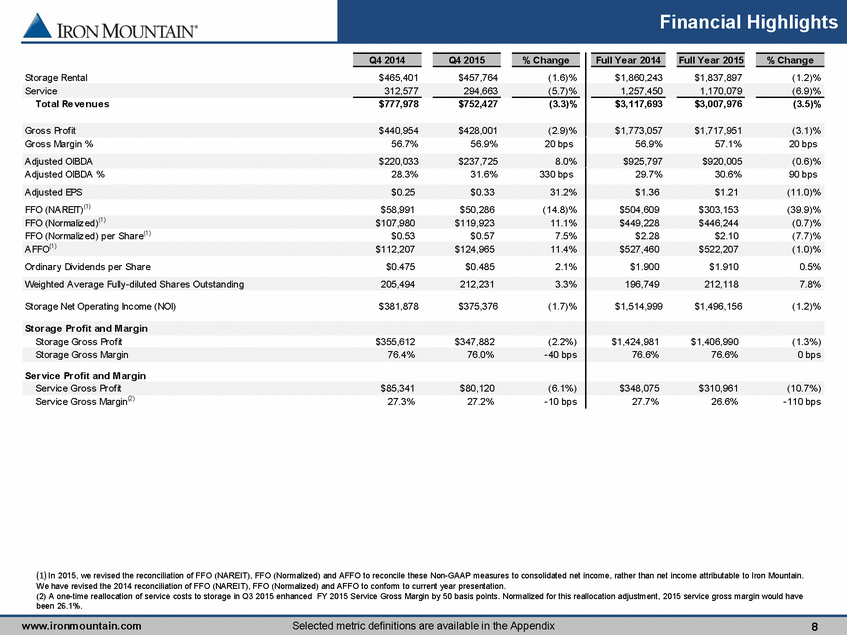
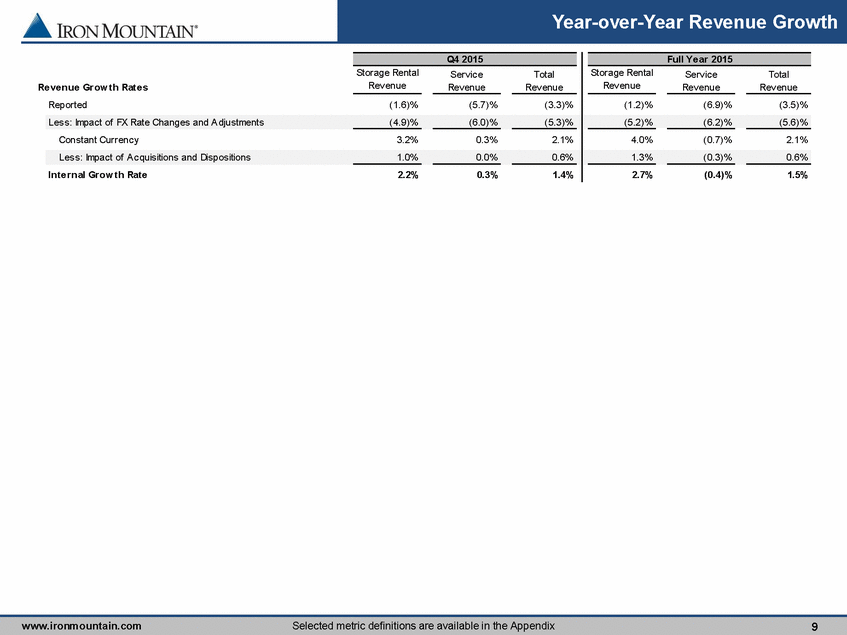
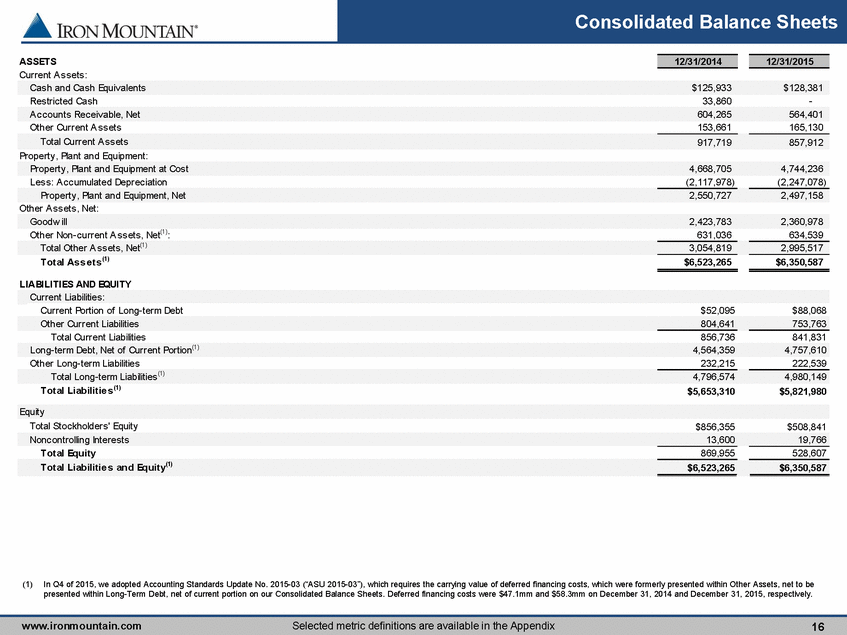
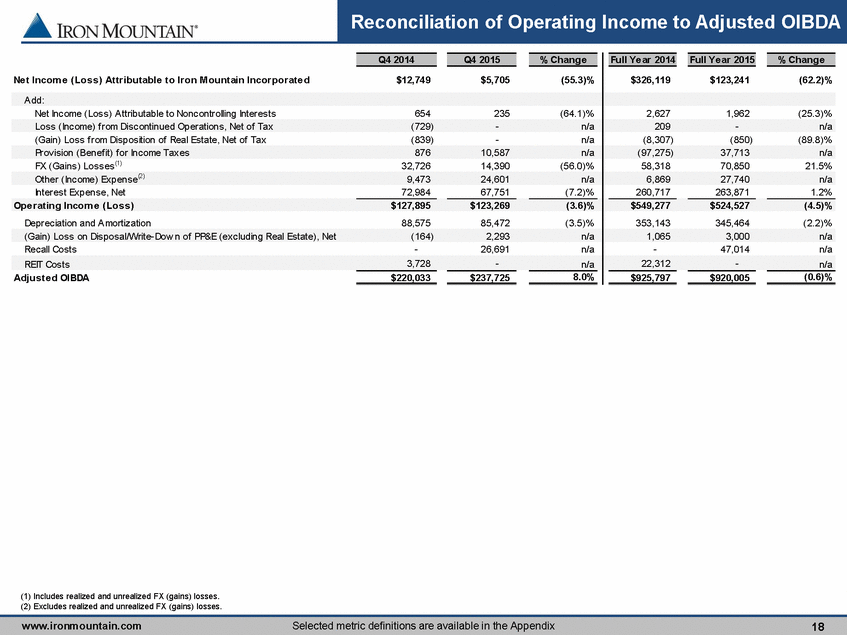
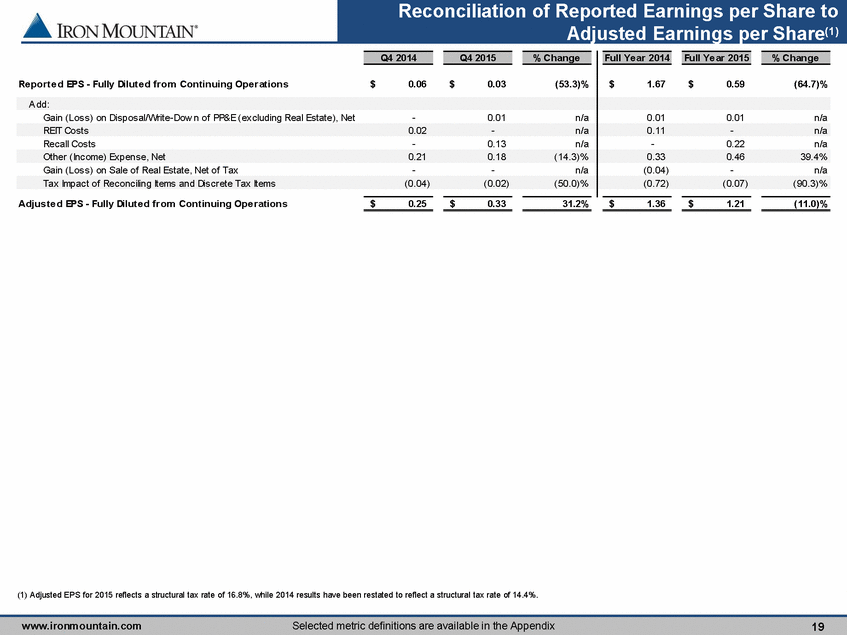
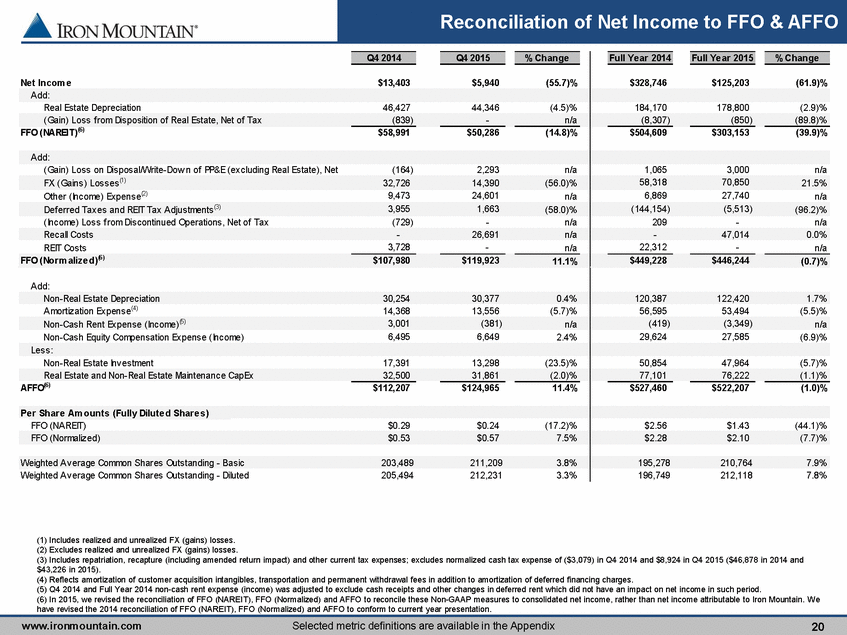
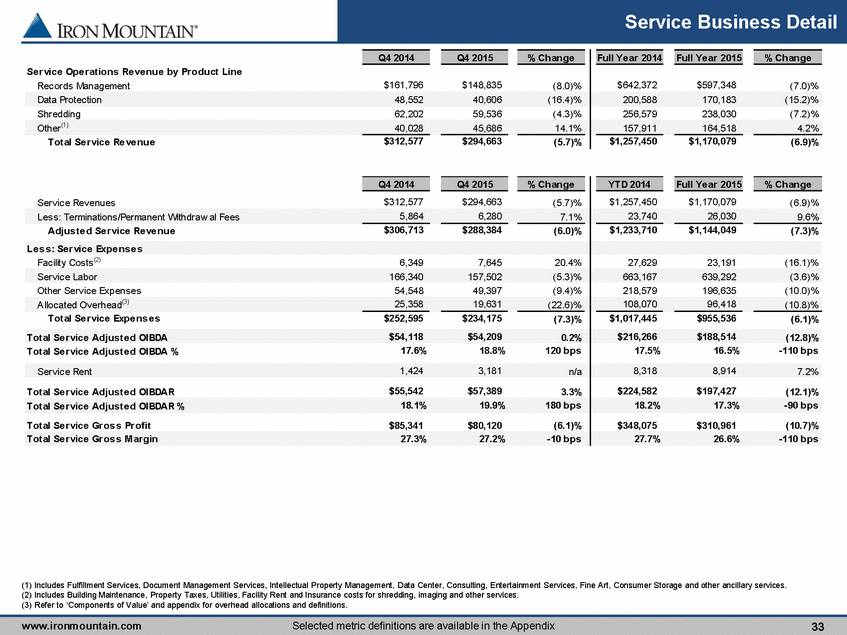
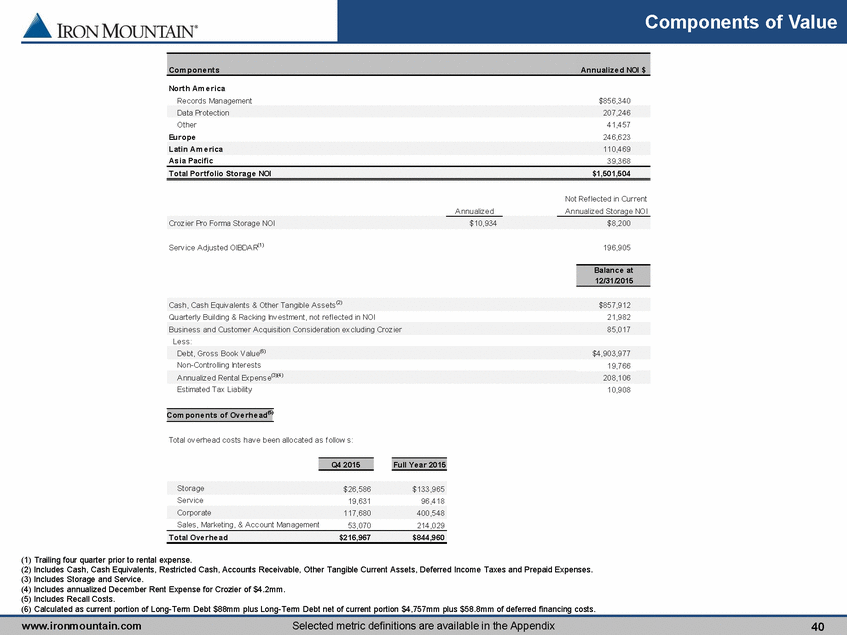
Consolidated Statements of Operations www.ironmountain.com Selected metric definitions are available in the Appendix 17 Revenues: Storage Rental $465,401 $457,764 (1.6)% $1,860,243 $1,837,897 (1.2)% Service 312,577 294,663 (5.7)% 1,257,450 1,170,079 (6.9)% Total Re ve nue s $777,978 $752,427 (3.3)% $3,117,693 $3,007,976 (3.5)% Ope rating Expe ns e s : Cost of Sales (excluding Depreciation and Amortization) $337,024 $324,426 (3.7)% $1,344,636 $1,290,025 (4.1)% Selling, General and Administrative 224,648 216,967 (3.4)% 869,572 844,960 (2.8)% Depreciation and Amortization 88,575 85,472 (3.5)% 353,143 345,464 (2.2)% (Gain) Loss on Disposal/Write-Dow n of PP&E (excluding Real Estate), Net (164) 2,293 n/a 1,065 3,000 n/a Total Ope rating Expe ns e s $650,083 $629,158 (3.2)% $2,568,416 $2,483,449 (3.3)% Ope rating Incom e (Los s ) $127,895 $123,269 (3.6)% $549,277 $524,527 (4.5)% Interest Expense, Net 72,984 67,751 (7.2)% 260,717 263,871 1.2% Other Expense (Income), Net 42,200 38,991 (7.6)% 65,187 98,590 51.2% Income (Loss) f rom Continuing Operations bef ore Provision (Benef it) 12,711 16,527 30.0% 223,373 162,066 (27.4)% f or Income Taxes and (Gain) Loss on Sale of Real Estate Provision (Benef it) f or Income Taxes 876 10,587 n/a (97,275) 37,713 n/a Gain f rom Sale of Real Estate, Net of Tax (839) - n/a (8,307) (850) (89.8)% Income (Loss) f rom Continuing Operations 12,674 5,940 (53.1)% 328,955 125,203 (61.9)% Income (Loss) f rom Discontinued Operations, Net of Tax 729 - n/a (209) - n/a Net Income (Loss) 13,403 5,940 (55.7)% 328,746 125,203 (61.9)% Less: Net Income (Loss) Attributable to Noncontrolling Interests 654 235 (64.1)% 2,627 1,962 (25.3)% Ne t Incom e (Los s ) Attributable to Iron M ountain Incorporate d $12,749 $5,705 (55.3)% $326,119 $123,241 (62.2)% Earnings (Losses) per Share - Basic: Income (Loss) f rom Continuing Operations $0.06 $0.03 (50.0)% $1.68 $0.59 (64.9)% Total Income (Loss) f rom Discontinued Operations - - n/a ($0.00) ($0.00) 0.0% Ne t Incom e (Los s ) Attributable to Iron M ountain Incorporate d $0.06 $0.03 (50.0)% $1.67 $0.58 (65.3)% Earnings (Los s e s ) pe r Share - Dilute d: Income (Loss) f rom Continuing Operations $0.06 $0.03 (50.0)% $1.67 $0.59 (64.7)% Total (Loss) Income f rom Discontinued Operations - - n/a ($0.00) ($0.00) n/a Ne t Incom e (Los s ) Attributable to Iron M ountain Incorporate d $0.06 $0.03 (50.0)% $1.66 $0.58 (65.1)% Weighted Average Common Shares Outstanding - Basic 203,489 211,209 3.8% 195,278 210,764 7.9% Weighted Average Common Shares Outstanding - Diluted 205,494 212,231 3.3% 196,749 212,118 7.8% % Change Full Ye ar 2015 Full Ye ar 2014 % Change Q4 2015 Q4 2014
