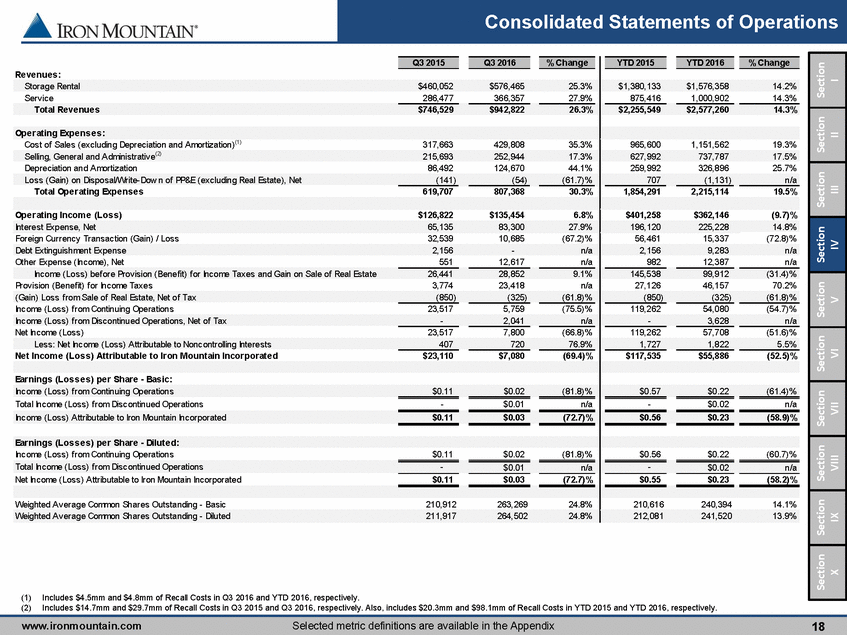
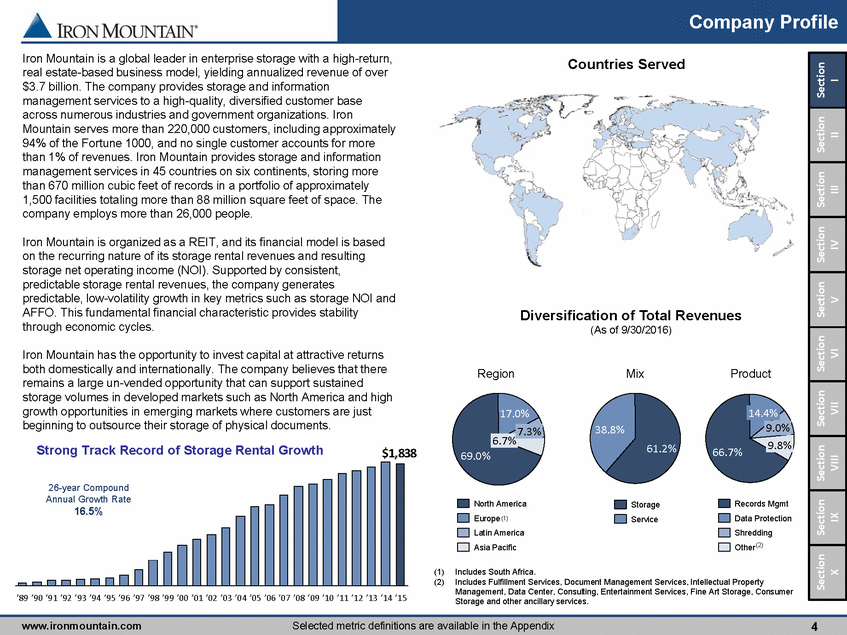
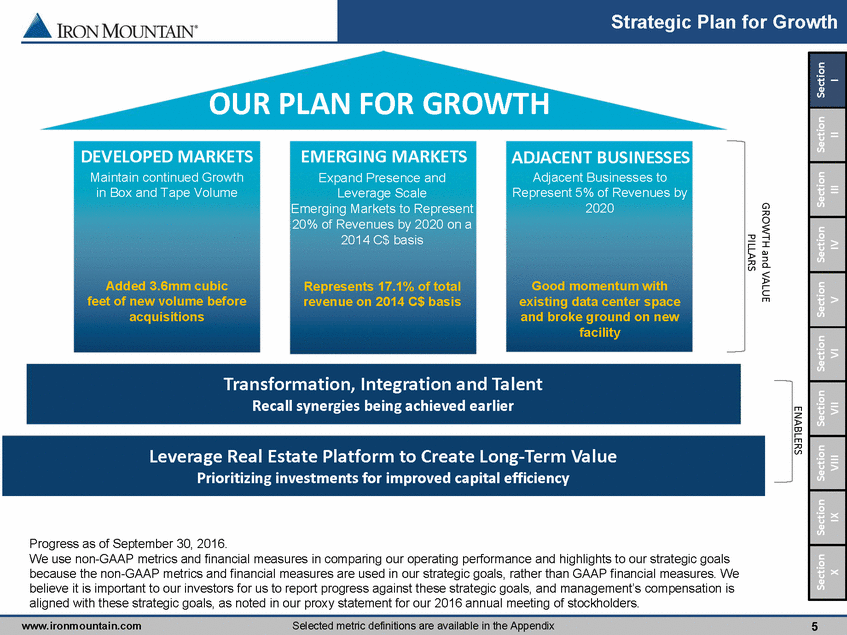
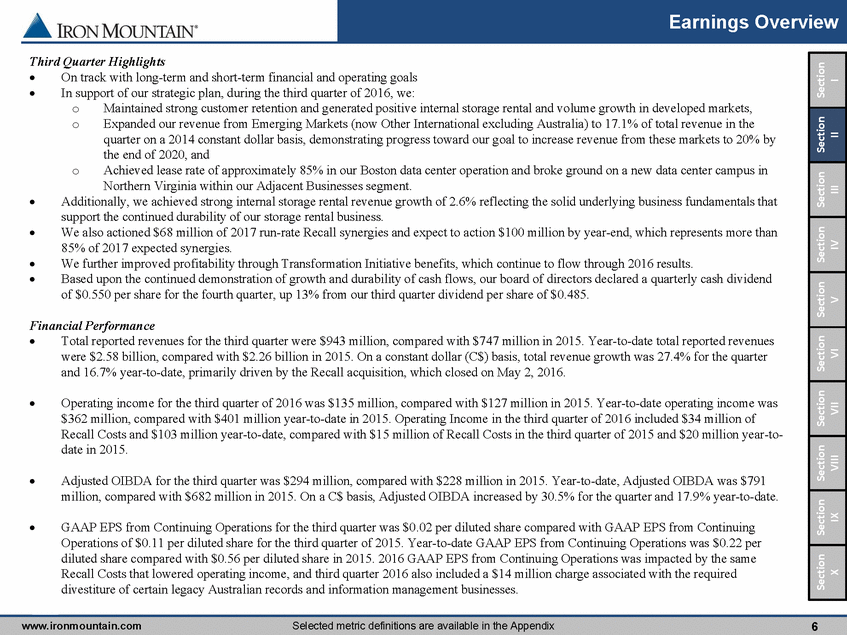
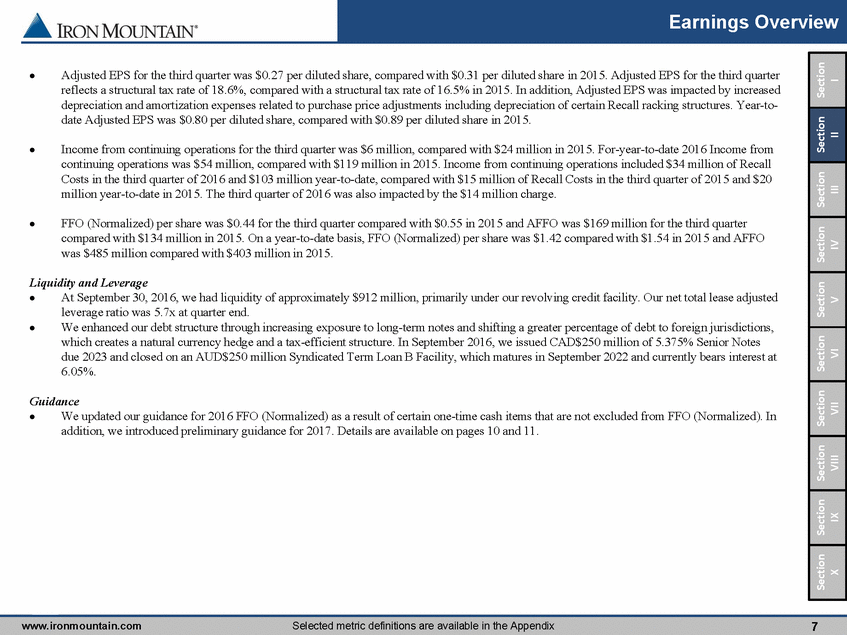
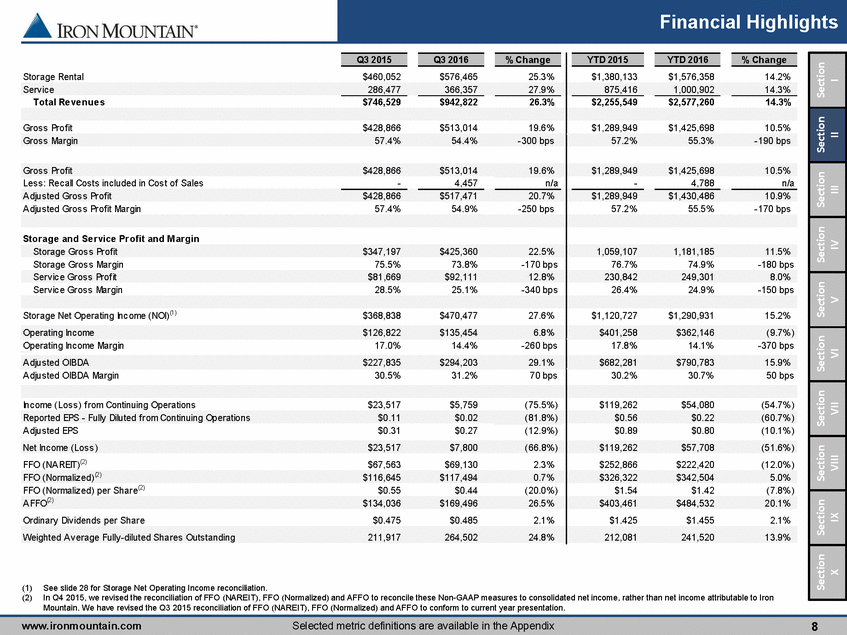
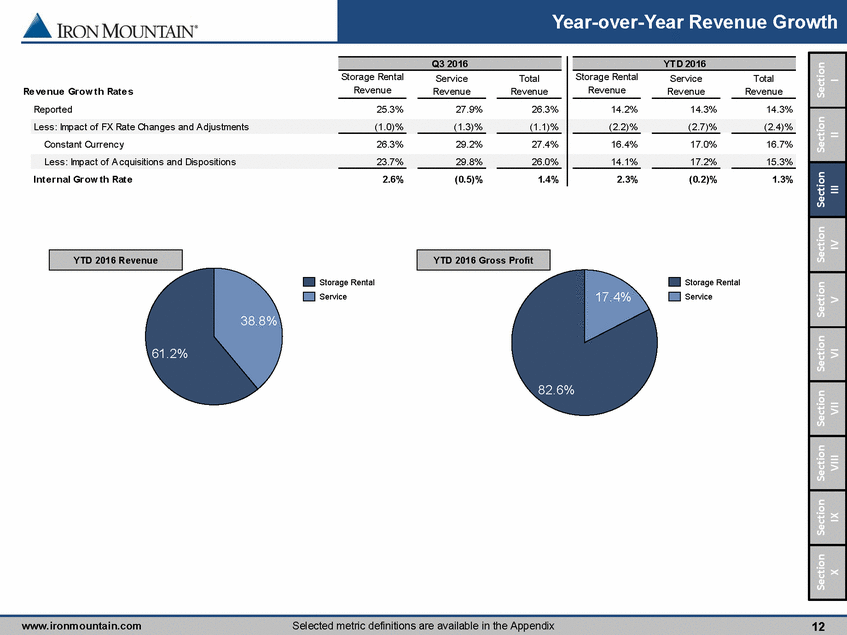
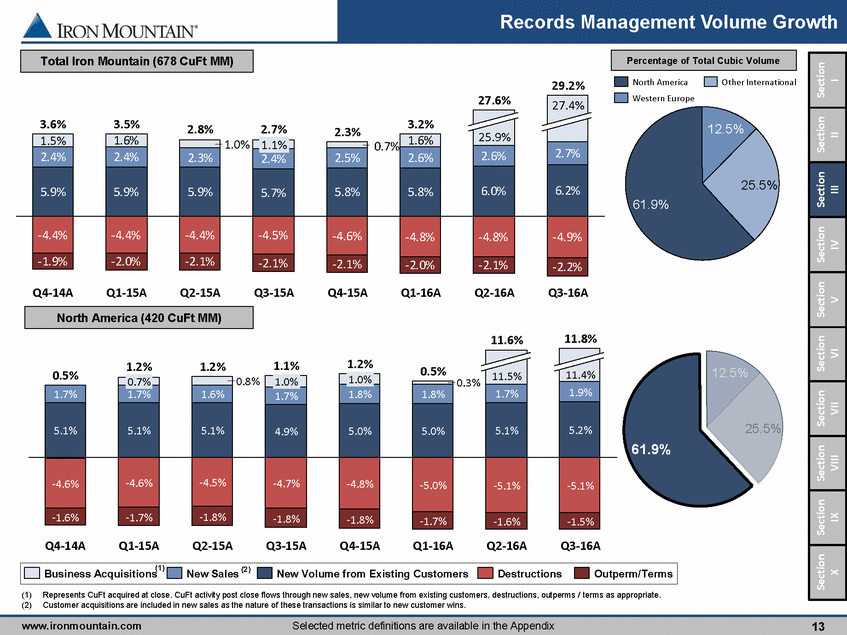
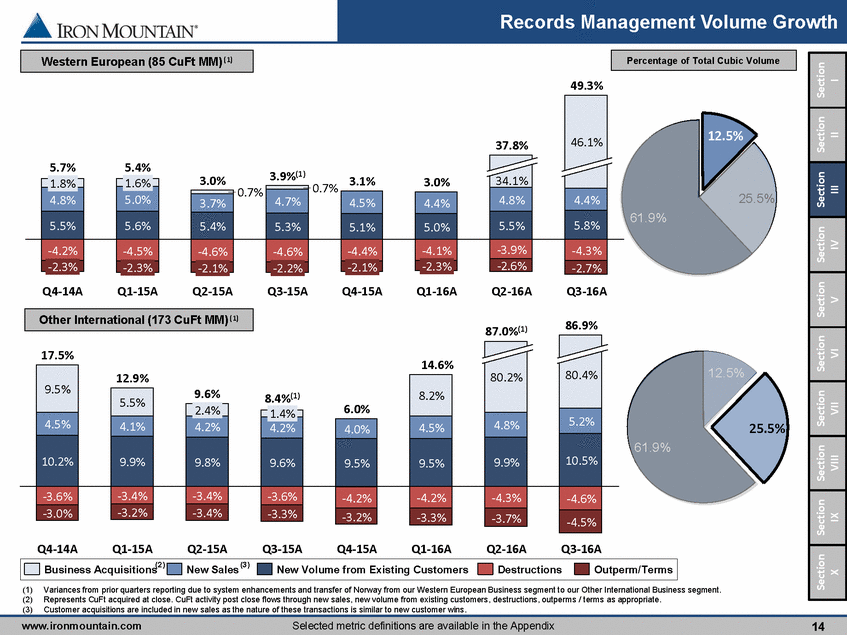
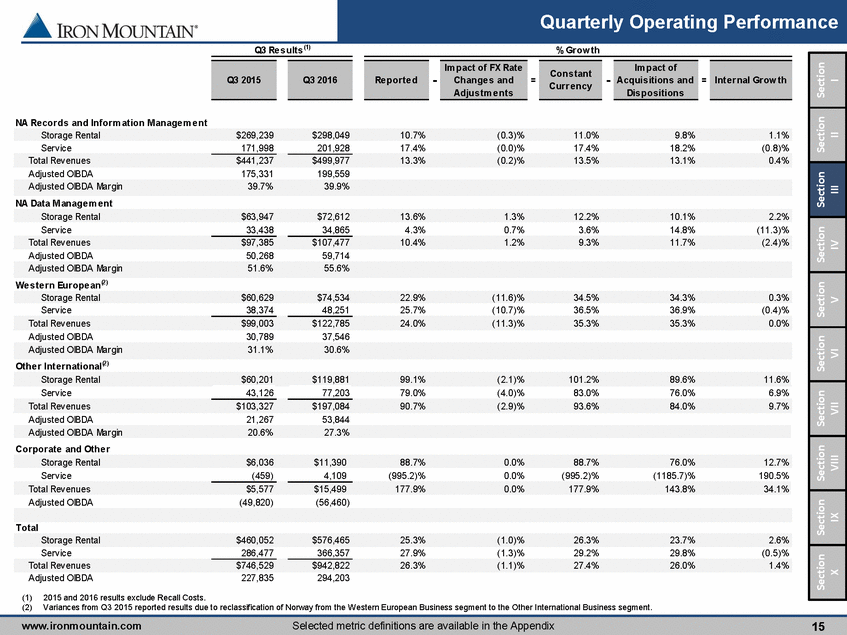
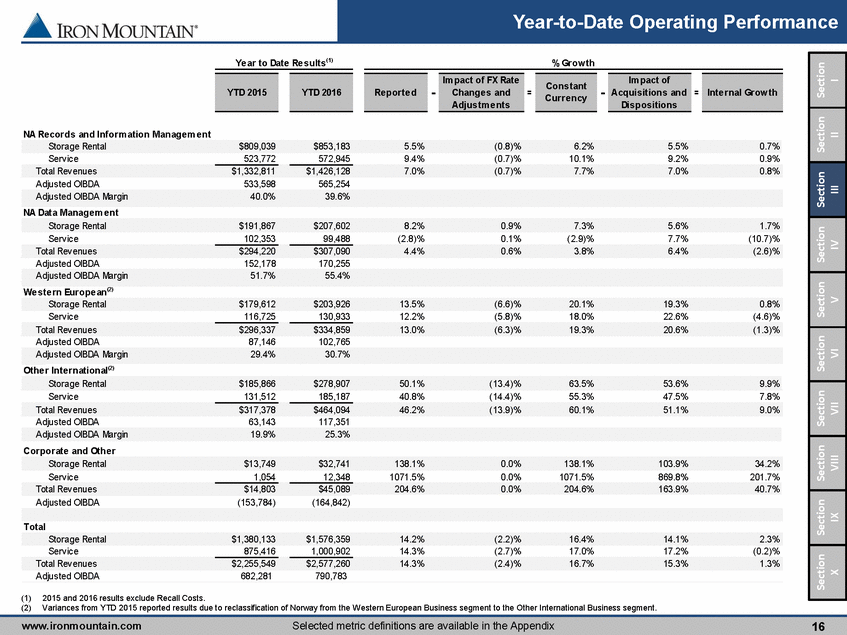
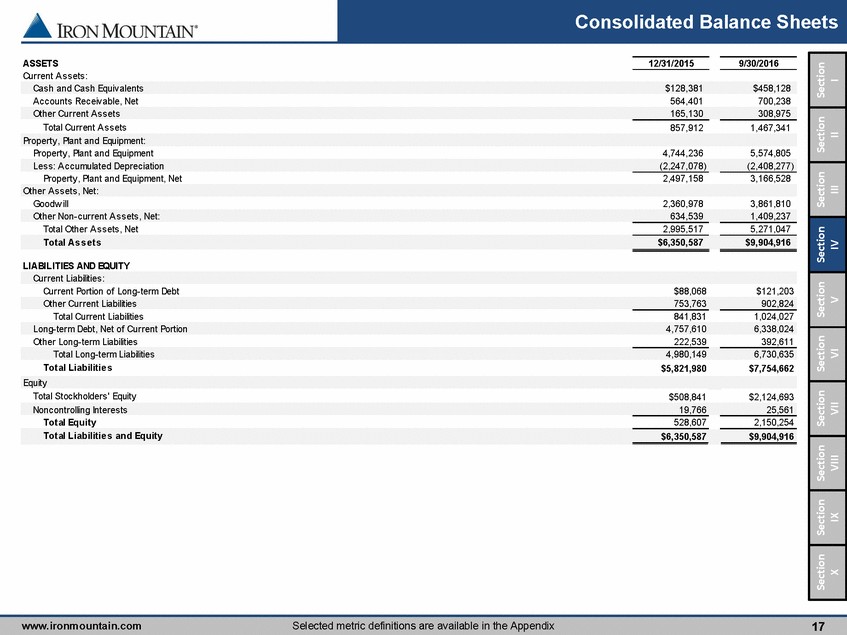
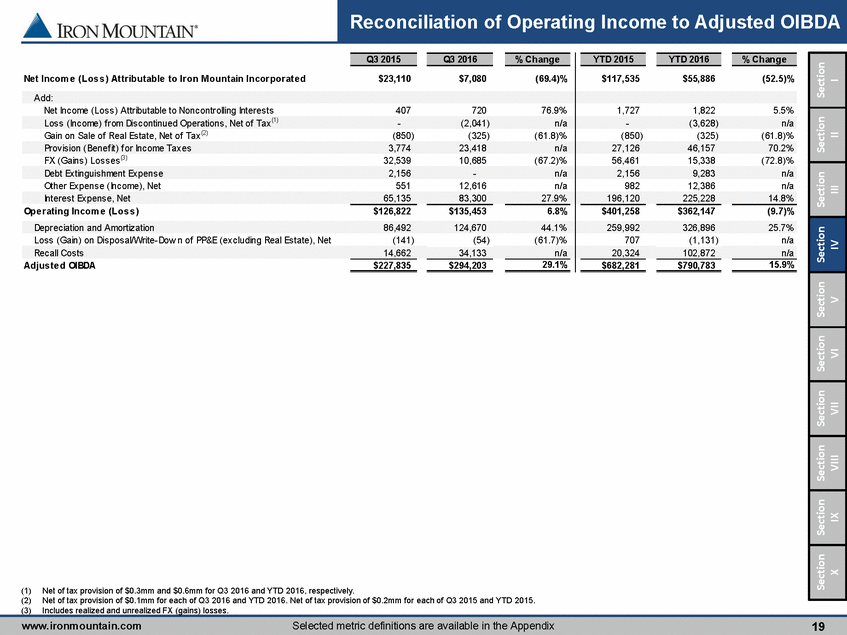
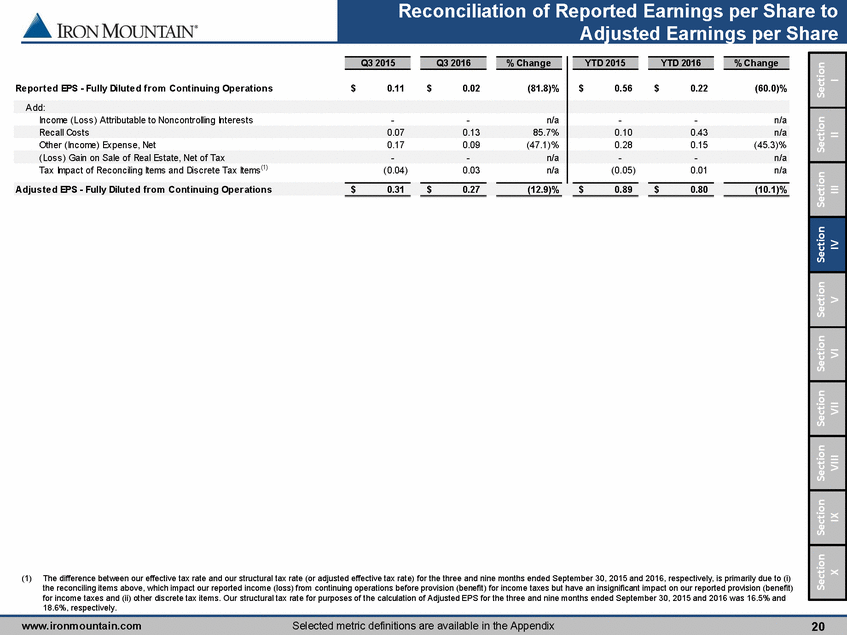
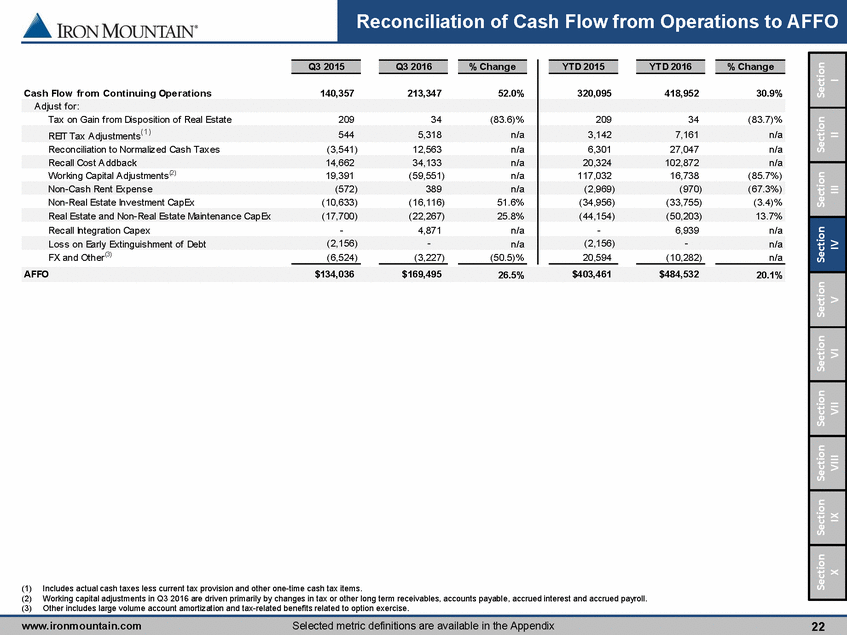
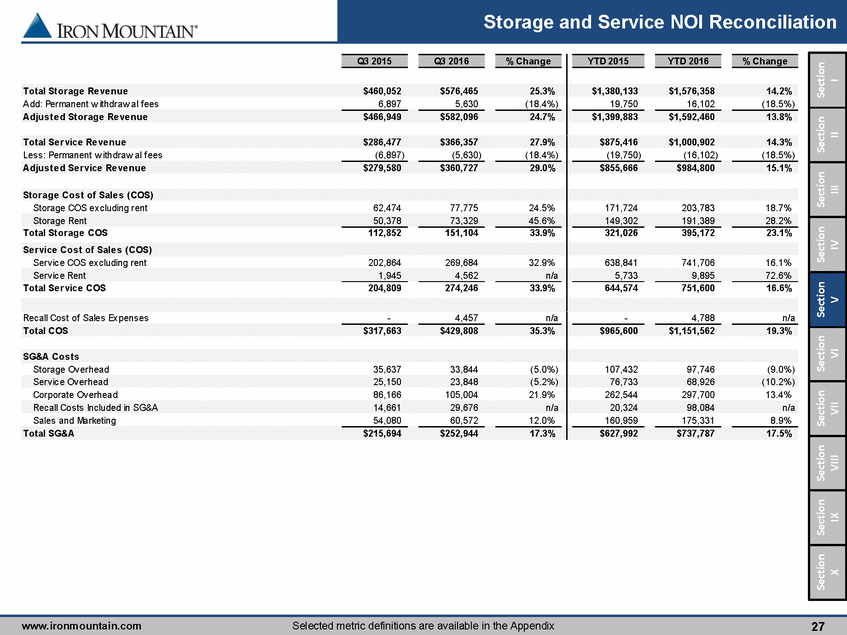
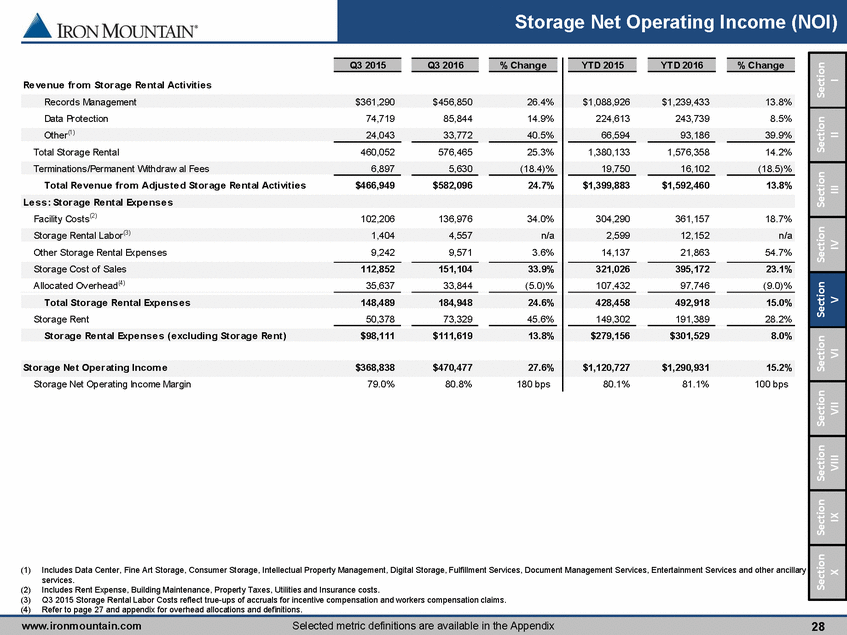
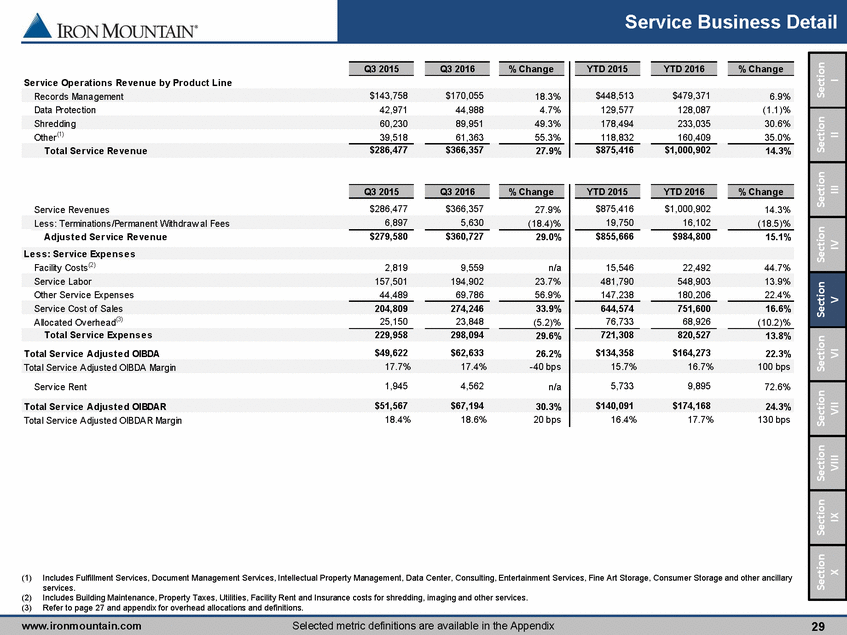
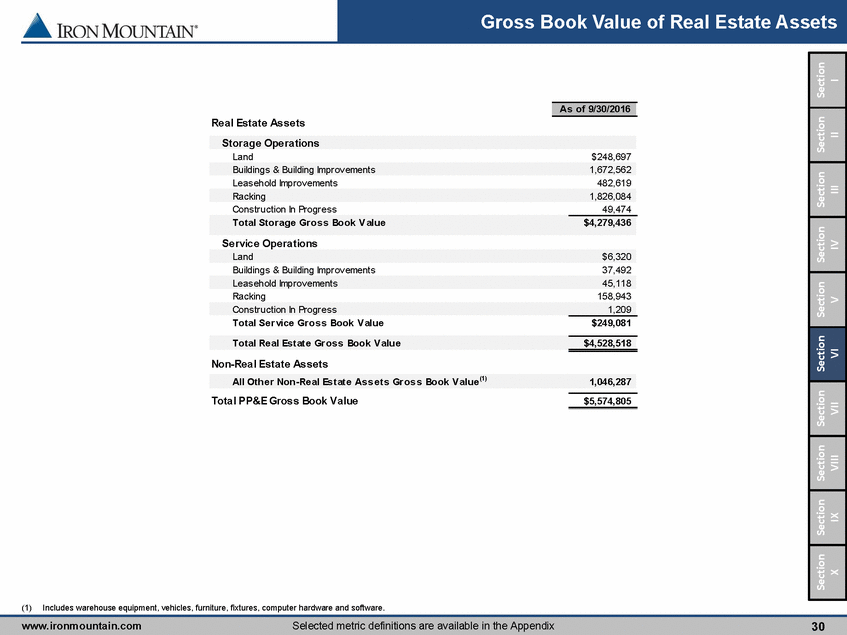
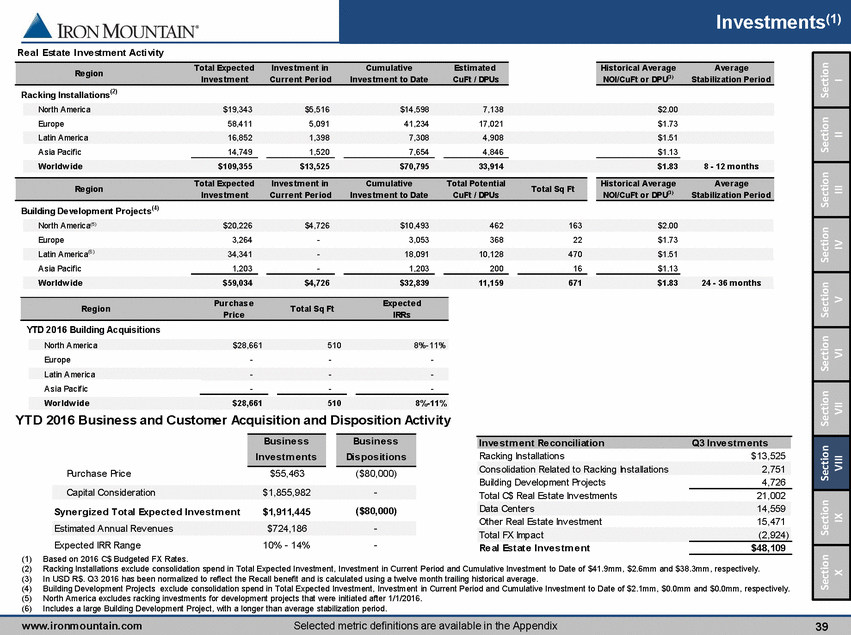
(1) Includes $4.5mm and $4.8mm of Recall Costs in Q3 2016 and YTD 2016, respectively. (2) Includes $14.7mm and $29.7mm of Recall Costs in Q3 2015 and Q3 2016, respectively. Also, includes $20.3mm and $98.1mm of Recall Costs in YTD 2015 and YTD 2016, respectively. Section X Section IX Section VIII Section VII Section VI Section V Section IV Section III Section II Section I www.ironmountain.comSelected metric definitions are available in the Appendix18 Revenues: Storage Rental $460,052 $576,465 25.3% $1,380,133 $1,576,358 14.2% Service 286,477 366,357 27.9% 875,416 1,000,902 14.3% Total Re ve nue s $746,529 $942,822 26.3% $2,255,549 $2,577,260 14.3% Ope rating Expe ns e s : Cost of Sales (excluding Depreciation and Amortization)(1) 317,663 429,808 35.3% 965,600 1,151,562 19.3% Selling, General and Administrative(2) 215,693 252,944 17.3% 627,992 737,787 17.5% Depreciation and Amortization 86,492 124,670 44.1% 259,992 326,896 25.7% Loss (Gain) on Disposal/Write-Dow n of PP&E (excluding Real Estate), Net (141) (54) (61.7)% 707 (1,131) n/a Total Ope rating Expe ns e s 619,707 807,368 30.3% 1,854,291 2,215,114 19.5% Ope rating Incom e (Los s ) $126,822 $135,454 6.8% $401,258 $362,146 (9.7)% Interest Expense, Net 65,135 83,300 27.9% 196,120 225,228 14.8% Foreign Currency Transaction (Gain) / Loss 32,539 10,685 (67.2)% 56,461 15,337 (72.8)% Debt Extinguishment Expense 2,156 - n/a 2,156 9,283 n/a Other Expense (Income), Net 551 12,617 n/a 982 12,387 n/a Income (Loss) bef ore Provision (Benef it) f or Income Taxes and Gain on Sale of Real Estate 26,441 28,852 9.1% 145,538 99,912 (31.4)% Provision (Benef it) f or Income Taxes 3,774 23,418 n/a 27,126 46,157 70.2% (Gain) Loss f rom Sale of Real Estate, Net of Tax (850) (325) (61.8)% (850) (325) (61.8)% Income (Loss) f rom Continuing Operations 23,517 5,759 (75.5)% 119,262 54,080 (54.7)% Income (Loss) f rom Discontinued Operations, Net of Tax - 2,041 n/a - 3,628 n/a Net Income (Loss) 23,517 7,800 (66.8)% 119,262 57,708 (51.6)% Less: Net Income (Loss) Attributable to Noncontrolling Interests 407 720 76.9% 1,727 1,822 5.5% Ne t Incom e (Los s ) Attributable to Iron M ountain Incorporate d $23,110 $7,080 (69.4)% $117,535 $55,886 (52.5)% Earnings (Losses) per Share - Basic: Income (Loss) f rom Continuing Operations $0.11 $0.02 (81.8)% $0.57 $0.22 (61.4)% Total Income (Loss) f rom Discontinued Operations - $0.01 n/a - $0.02 n/a Income (Loss) Attributable to Iron Mountain Incorporated $0.11 $0.03 (72.7)% $0.56 $0.23 (58.9)% Earnings (Los s e s ) pe r Share - Dilute d: Income (Loss) f rom Continuing Operations $0.11 $0.02 (81.8)% $0.56 $0.22 (60.7)% Total Income (Loss) f rom Discontinued Operations - $0.01 n/a - $0.02 n/a Net Income (Loss) Attributable to Iron Mountain Incorporated $0.11 $0.03 (72.7)% $0.55 $0.23 (58.2)% Weighted Average Common Shares Outstanding - Basic 210,912 263,269 24.8% 210,616 240,394 14.1% Weighted Average Common Shares Outstanding - Diluted 211,917 264,502 24.8% 212,081 241,520 13.9% % Change YTD 2016 YTD 2015 % Change Q3 2016 Q3 2015 Consolidated Statements of Operations
