MINCO GOLD CORPORATION
FILING STATEMENT
In Respect of the Proposed Change of
Business of Minco Gold Corporation
Neither the TSX Venture Exchange Inc. ("TSXV") nor any securities
regulatory authority has in any way passed upon the merits of the
change of business described in this filing statement.
November 11, 2016
| GLOSSARY OF TERMS | IV | |
| CURRENCY PRESENTATION | V | |
| FORWARD LOOKING INFORMATION | V | |
| SUMMARY OF FILING STATEMENT | 1 | |
| Change of Business | 1 | |
| Available Funds and Principal Purposes | 1 | |
| Stock Exchange Listings | 1 | |
| Market Price of Company's Shares | 1 | |
| Conditions to Completion of Change of Business | 1 | |
| Interests of Experts | 1 | |
| RISK FACTORS | 1 | |
| INFORMATION CONCERNING MINCO GOLD AND CHANGE OF BUSINESS | 4 | |
| Name and Incorporation | 4 | |
| Intercorporate Relationships | 5 | |
| General Development of the Business | 5 | |
| Selected Financial Information and Management's Discussion and Analysis | 5 | |
| Description of the Securities | 6 | |
| Stock Options | 6 | |
| Prior Sales | 7 | |
| Stock Exchange Price | 7 | |
| Executive Compensation | 7 | |
| Compensation Discussion and Analysis | 8 | |
| Compensation Governance | 9 | |
| Summary Compensation Table | 9 | |
| Incentive Plan Awards | 10 | |
| Termination and Change of Control Benefits | 11 | |
| Director Compensation | 12 | |
| Description of Proposed Business | 13 | |
| Conditional Listing Approval | 14 | |
| Available Funds and Principal Purposes | 15 | |
| Directors and Officers of Minco Gold | 16 | |
| Promoter Consideration | 18 | |
| Corporate Cease Trade Orders or Bankruptcies | 18 | |
| Penalties or Sanctions | 19 | |
| Personal Bankruptcies | 19 | |
| Conflicts of Interest | 19 | |
| Other Reporting Issuer Experience | 19 | |
| Proposed Executive Compensation | 20 | |
| Investor Relations Arrangements | 21 | |
| Options to Purchase Securities | 21 | |
| Escrowed Securities | 21 | |
| Legal Proceedings | 22 | |
| Auditor, Transfer Agent and Registrar | 22 | |
| Material Contracts | 22 | |
| GENERAL MATTERS | 22 | |
| Sponsor | 22 | |
| Experts | 22 | |
| Other Material Facts | 22 | |
| Approval of the Board of Directors | 22 | |
GLOSSARY OF TERMS
The following is a glossary of certain terms used in this Filing Statement; including the summary hereof. Words importing the singular, where the context requires, include the plural and vice versa and word importing any gender includes all genders.
"Affiliate" | has the meaning as defined in Appendix 1 of the TSXV "Form 3D2-Information Required in a Filing Statement for a Reverse Takeover or Change of Business", except as otherwise provided for herein; |
"Associate" | has the meaning as defined in Appendix 1 of the TSXV "Form 3D2-Information Required in a Filing Statement for a Reverse Takeover or Change of Business", except as otherwise provided for herein; |
"BCA" | means the Business Corporations Act of British Columbia, S.B.C. 2002, Chapter 57, as amended from time to time or re-enacted and the regulations thereto as from time to time amended or re-enacted; |
"Change of Business" | means the proposed change of business of the Company from that of a mineral exploration issuer to that of an investment issuer; |
"Common Shares" or "Shares" | means the common shares in the capital of the Company; |
"Company" or "Minco Gold" | means Minco Gold Corporation; |
"Minco Silver" | means Minco Silver Corporation; |
"Stock Option Plan" | means the Company's stock option plan as described under "Information Concerning Minco Gold – Stock Options"; |
"TSX" | means the Toronto Stock Exchange; and |
"TSXV" | means the TSX Venture Exchange Inc. |
CURRENCY PRESENTATION
All dollar amounts referenced herein and in the financial statements of the Company are Canadian dollars and referred to as "$" unless otherwise specified.
FORWARD LOOKING INFORMATION
This Filing Statement contains forward-looking statements and information that are based on the beliefs of management and reflect the Company's current expectations. When used in this Filing Statement, the words "estimate", "project", "belief", "anticipate", "intend", "expect", "plan", "predict", "may" or "should" and the negative of these words or such variations thereon or comparable terminology are intended to identify forward-looking statements and information. The forward-looking statements and information in this Filing Statement includes information relating to the Change of Business, the principal owner, directors and management of the Company upon completion of the Change of Business, and the implementation of Minco Gold's business plan. Such statements and information reflect the current view of the Company with respect to risks and uncertainties that may cause actual results to differ materially from those contemplated in those forward-looking statements and information.
By their nature, forward-looking statements involve known and unknown risks, uncertainties and other factors which may cause the Company's actual results, performance or achievements, or other future events, to be materially different from any future results, performance or achievements expressed or implied by such forward-looking statements. Such factors include, among others, the following risks: risks associated with the completion of the Change of Business and matters relating thereto; and risks associated with the marketing and sale of securities, the need for additional financing, reliance on key personnel, the potential for conflicts of interest among certain officers or directors with certain other projects, and the volatility of the Company's common share price and volume. Forward-looking statements are made based on management's beliefs, estimates and opinions on the date that statements are made and the Company undertakes no obligation to update forward-looking statements if these beliefs, estimates and opinions or other circumstances should change. Investors are cautioned against attributing undue certainty to forward-looking statements.
There are a number of important factors that could cause the Company's actual results to differ materially from those indicated or implied by forward-looking statements and information. Such factors include, among others, risks related to Minco Gold's proposed business such as failure of the business strategy, currency exchange rates and conflicts of interest.
The Company cautions that the foregoing list of material factors is not exhaustive. When relying on the Company's forward-looking statements and information to make decisions, investors and others should carefully consider the foregoing factors and other uncertainties and potential events. The Company has assumed a certain progression, which may not be realized. It has also assumed that the material factors referred to in the previous paragraph will not cause such forward-looking statements and information to differ materially from actual results or events. However, the list of these factors is not exhaustive and is subject to change and there can be no assurance that such assumptions will reflect the actual outcome of such items or factors. While the Company may elect to, it does not undertake to update this information at any particular time except as required in accordance with applicable laws.
THE FORWARD-LOOKING INFORMATION CONTAINED IN THIS FILING STATEMENT REPRESENTS THE EXPECTATIONS OF THE COMPANY AS OF THE DATE OF THIS FILING STATEMENT AND, ACCORDINGLY, IS SUBJECT TO CHANGE AFTER SUCH DATE. READERS SHOULD NOT PLACE UNDUE IMPORTANCE ON FORWARD-LOOKING INFORMATION AND SHOULD NOT RELY UPON THIS INFORMATION AS OF ANY OTHER DATE. WHILE THE COMPANY MAY ELECT TO, IT DOES NOT UNDERTAKE TO UPDATE THIS INFORMATION AT ANY PARTICULAR TIME EXCEPT AS REQUIRED IN ACCORDANCE WITH APPLICABLE LAWS.
SUMMARY OF FILING STATEMENT
The following is a summary of information relating Minco Gold and should be read together with the more detailed information and financial data and statements contained elsewhere in this Filing Statement. Certain capitalized words and terms used in this summary are defined in the Glossary of Terms.
Change of Business
The Company proposes to change its business from that of a mineral exploration company to that of a resources-focused investment company under the policies of the TSXV and is referred to as the "Change of Business" in this Filing Statement. See "Information Concerning Minco Gold and Change of Business".
Available Funds and Principal Purposes
Funds available to the Company upon completion of the Change of Business, including cash on hand and short-term investments that can turned into cash as needed, are estimated to be $8,500,000 which will be used to fund the estimated costs to complete the Change of Business ($100,000); to fund general and administrative expenses for the first year ($780,000); to fund investment acquisitions in the first year ($1,500,000); and for unallocated estimated general working capital ($6,120,000) (see "Information Concerning the Company – Available Funds and Principal Purposes").
Stock Exchange Listings
The Company's Shares are listed and trade on the TSX under the symbol "MMM". The Company has filed an application with the TSXV to approve the Change of Business. Upon receipt of final TSXV acceptance and completion of the Change of Business, the Company will change its name to "Minco Capital Corporation", or such other name as is acceptable to the principal shareholders of Minco Gold, the TSXV and the Registrar of Companies, and the Company will become a Tier 1 Investment Issuer on the TSXV and its new symbol will remains as "MMM" until the name change is completed at which time a new symbol may be selected.
Market Price of Company's Shares
The closing price of the Company's Common Shares on November 10, 2016, the last trading date before the date of this Filing Statement was $0.30 (see "Information Concerning Minco Gold – Stock Exchange Price").
Conditions to Completion of Change of Business
The completion of the Change of Business is subject to acceptance for filing by the TSXV. There can be no assurance that the Change of Business will be completed as proposed or at all. See "Information Concerning Minco Gold and Change of Business".
Interests of Experts
No person or company, whose profession or business gives authority to a statement made by the person or company and who is named as having prepared or certified a part of this Filing Statement or as having prepared or certified a report or valuation described or included in this Filing Statement, holds any beneficial interest, directly or indirectly, in the Company or any of its Associates or Affiliates and no such person is expected to be elected, appointed or employed as a director, senior officer or employee of the Company or of an Associate or Affiliate of the Company and no such person is a promoter of the Company or any of its Associates or Affiliates.
RISK FACTORS
The securities of the Company should be considered highly speculative due to the nature of the Issuer's proposed business and the present stage of Minco Gold's development. A prospective investor should consider carefully the risk factors set out below. In addition, prospective investors should carefully review and consider all other information contained in the Filing Statement before making an investment decision. An investment in securities of the Company should only be made by persons who can afford a significant or total loss of their investment.
- 2 -
The Company's proposed new business as an investment issuer (the "Investment Issuer") will be subject to a number of significant risk factors, and an investment in the Company will involve a high degree of risk. Investors should carefully consider each of such risks and all of the information in this Filing Statement before investing in the Company. The success of the Company will depend entirely on the expertise, ability, judgment, discretion, integrity and good faith of its management and Board of Directors. The risks consist of:
| · | The Change of Business is subject to TSXV approval – The Change of Business remains subject to the approval of the TSXV. There is no assurance that the Change of Business will receive TSXV approval or that the Change of Business will be completed. |
| · | No Operating History as an Investment Issuer – Other than its investment in Minco Silver, the Company does not have any record of operating as an Investment Issuer. As such, upon completion of the Change of Business, the Company will be subject to all of the business risks and uncertainties associated with any new business enterprise, including the risk that the Company will not achieve its financial objectives as estimated by Management. Furthermore, past successes of the Management or the Board in other ventures does not guarantee future success. |
| · | Risks of Completion – The Company will face competition from other capital providers, all of which compete with it for investment opportunities. These competitors may limit the Company's opportunities to acquire interests in investments that are attractive to the Company. The Company may be required to invest otherwise than in accordance with its investment policy and strategy in order to meet its investment objectives. If the Company is required to invest other than in accordance with its investment policy and strategy, its ability to achieve its desired rates of return on its investments may be adversely affected. |
| · | Risks of Fluctuations in the Value of the Company and the Common Shares – The net asset value of the Company and market value of the Common Shares will fluctuate with changes in the market value of the Company's investments. Such changes in value may occur as the result of various factors, including general economic and market conditions, the performance of corporations whose securities are part of the Company's investment portfolio and changes in interest rates which may affect the value of interest-bearing securities owned by the Company. There can be no assurance that Shareholders will realize any gains from their investment in the Company and may lose their entire investment. |
| · | Due Diligence – The due diligence process undertaken by the Company in connection with investments that it makes or wishes to make may not reveal all relevant facts in connection with an investment. Before making investments, the Company will conduct due diligence investigations that it deems reasonable and appropriate based on the facts and circumstances applicable to each investment. When conducting due diligence investigations, the Company may be required to evaluate important and complex business, financial, tax, accounting, environmental and legal issues. Outside consultants, legal advisors, accountants and investment banks may be involved in the due diligence process in varying degrees depending on the type of investment. Nevertheless, when conducting due diligence investigations and making an assessment regarding an investment, the Company will rely on resources available, including information provided by the target of the investment and, in some circumstances, third party investigations. The due diligence investigations that are carried out with respect to any investment opportunity may not reveal or highlight all relevant facts that may be necessary or helpful in evaluating such investment opportunity. Moreover, such investigation will not necessarily result in the investment being successful. |
- 3 -
| · | Risks of Investment in Illiquid Securities – There is a possibility that the Company will be unable to dispose of illiquid securities held in its portfolio and if the Company is unable to dispose of some or all of its investments at the appropriate time, a return on such investment may not be realized. |
| · | Loss of Investment Risk – An investment in the Company is speculative and may result in the loss of a substantial portion of an investor's investment. Only potential investors who are experienced in high risk investments and who can afford to lose a substantial portion of their investment should consider an investment in the Company. |
| · | No Guaranteed Return on Risk – There is no guarantee that an investment in the Company will earn any positive return in the short term or long term. |
| · | Dividends – To date, the Company has not paid dividends on any of its Common Shares and the Company is not required to pay any dividends on its Common Shares in the foreseeable future. Any decision to pay dividends will be made on the basis of the Company's earnings, financial requirements and other conditions. |
| · | Currency Risk – Some of the Company's assets may be invested in foreign securities. Consequently, the Canadian dollar equivalent of the Company's net denominated assets and dividends would be adversely affected by reductions in the value of the applicable foreign currencies relative to the Canadian dollar and would be positively affected by increases in the value of the applicable foreign currencies relative to the Canadian dollar. |
| · | Commodity Risk – The Company may invest in sectors that are very sensitive to the fluctuations of commodity prices. |
| · | Foreign Investment Risks – Foreign investments made by the Company in specific sectors such as natural resource, industrial or technology may be subject to political risks, risks associated with changes in foreign exchange rates, foreign exchange control risks and other similar risks. |
| · | Risk of Lack of Diversification of Investments – Investments concentrated in specific sectors such as natural resource, industrial or technology are generally more volatile than the overall market. Investing in only one specific sector of the stock market, such as the natural resource sector, entails greater risk (and greater potential reward) than investing in all sectors of the stock market. If a sector declines or falls out of favour, the share values of most or all of the corporations in that sector will generally fall faster than the market as a whole. The opposite is also true. |
| · | Natural Resource, Industrial, or Technology Sector Risks – Investing in natural resource, industrial or technology corporations can be speculative in nature and the value of the Company's investments may be subject to significant fluctuations. Such businesses entail a degree of risk, regardless of the skill and experience of the corporation's management. The assets, earnings and share values of corporations involved in the natural resource, industrial or technology corporations industries are subject to risks associated with the world prices of various natural resource, industrial, or technology sectors respectively, forces of nature, economic cycles, commodity prices, exchange rates, royalty and taxation changes and political events. Government restrictions, such as price regulations, production quotas, royalties and environmental protection, can also be factors. |
| · | Equity Market Risk – The price of the equity securities in which the Company may invest are influenced by the issuing corporation's outlook, market activity and regional, national and international economic conditions. When the economy is expanding, the outlook for many corporations is equally promising, and the value of their equity securities should rise in agreement. The opposite is also true. Typically, the greater the potential reward, the greater the potential risk. For small corporations and corporations in the emerging sectors the risk and reward ratio is usually greater. Equity-related securities, which give indirect exposure to the equity value of a corporation, such as warrants and convertible securities, can also be affected by this equity risk. |
- 4 -
| · | Private Corporation Risks – Investments in natural resource, industrial or technology private corporations cannot be resold without a prospectus, an available prospectus exemption or an appropriate ruling under relevant securities legislation. Even if they can be sold, there may not be a market for such securities. This may impair the Company's ability to react quickly to market conditions or negotiate the most favourable terms for exiting such investments. Investments in private corporations my offer relatively high potential returns, but will also be subject to a relatively high degree of risk. The process of valuing investments in natural resource, industrial or technology private corporations will inevitably be based on inherent uncertainties and the resulting values may differ from values that would have been used had a ready market existed for the investments. |
| · | Dependence Upon Key Management – The Company will depend on the business and technical expertise of its management and key personnel. There is little possibility that this dependence will increase in the near term. As the Company's operations expand, additional general management resources will be required. The Company may not be able to attract and retain additional qualified personnel and this would have a negative effect on the Company's operations. |
| · | Dilution Risk – The Company may need or desire to raise substantial additional capital in the future. If the Company raises additional funds by issuing equity or convertible debt securities, it will reduce the percentage ownership of the Company's then-existing stockholders, and the holders of those newly-issued equity or convertible debt securities may have rights, preferences, or privileges senior to those possessed by the Company's then-existing stockholders. Additionally, future sales of a substantial number of shares of the Company's common shares or other equity-related securities in the public market could depress the market price of the Company's common shares and impair the Company's ability to raise capital through the sale of additional equity or equity-linked securities. The Company cannot predict the effect that future sales of common shares or other equity-related securities would have on the market price of the Company's Shares. |
INFORMATION CONCERNING MINCO GOLD AND CHANGE OF BUSINESS
Name and Incorporation
The full name of the Company is "Minco Gold Corporation".
The head office of the Company is located at Suite 2772 – 1055 West Georgia Street, Vancouver, British Columbia V6E 3R5. The registered and records offices of the Company are located at Suite 1750, 1185 West Georgia Street, Vancouver, British Columbia V6E 4E6.
The Company was incorporated pursuant to the Business Corporations Act (British Columbia) on November 5, 1982. On May 11, 2005, the Company replaced its existing Articles with a new form of Articles.
Minco Gold was incorporated under the Business Corporations Act (British Columbia) on November 5, 1982, under the name "Caprock Energy Ltd." The Company changed its name to "Minco Gold Corporation" on January 29, 2007. As at December 31, 2015, the Company did not have subsidiaries, and had a 18.31% equity interest in Minco Silver.
- 5 -
The principal executive office and registered office of the Company is located at Suite 2772, 1055 West Georgia Street, Vancouver, British Columbia, Canada, V6E 3R5, telephone number 604-688-8002, fax number 604-688-8030 and email address info@mincomining.ca. The Company's shares trade on the TSX under the trading symbol "MMM". The Company began trading on the NYSE MKT on November 22, 2005 under the trading symbol "MMK". On February 1, 2007, the trading symbol on the NYSE MKT was changed from "MMK" to "MGH". The Company began trading on the Frankfurt Stock Exchange on May 9, 2007 under the trading symbol "MI5".
Intercorporate Relationships
The Company has no subsidiaries.
General Development of the Business
The Company's shares were listed on the TSX on December 29, 1997. Prior to July, 2015, the principal business of the Company was the exploration of natural resource properties in the Peoples Republic of China. The Company does not currently have any ongoing business operations and has no material assets other than cash and short-term investment totaling $9 million. The Company also holds a number of exploration permits and properties in China which it is in the process of disposing. The Company is considered a mineral exploration and development issuer under the policies of the TSX.
The Company proposes a change of business under the policies of the TSXV. Upon completion of the Change of Business, the Company will become a Tier 1 Investment Issuer under the policies of the TSXV.
Selected Financial Information and Management's Discussion and Analysis
Selected Financial Information
The following table sets out certain selected financial information of the Company from the Company's audited financial statements for the years ended December 31, 2015, 2014 and 2013, and the Company's unaudited interim financial statements for the six months ending June 30, 2016.
Income Statement Data | Financial Year Ended December 31, 2013 | Financial Year Ended December 31, 2014 | Financial Year Ended December 31, 2015 | Six month Period Ended June 30, 2016 |
$ | $ | $ | $ | |
Total Operating and Exploration Expenses | 3,662,049 | 3,026755 | 2,115,569 | 618,269 |
Net income (loss) | (2,943,305) | (7,497,794) | 14,320,556 | (925,726) |
Balance Sheet Data | As at December 31, 2013 | As at December 31, 2014 | As at December 31, 2015 | As at June 30, 2016 |
Cash | 1,797,809 | 2,117,038 | 5,593,669 | 4,855,342 |
Short-term investments | - | - | 4,048,341 | 3,818,341 |
Total Assets | 16,246,355 | 9,405,439 | 16,521,288 | 14,155,028 |
Total Equity | 11,941,871 | 4,903,214 | 15,954,436 | 13,762,010 |
- 6 -
Management's Discussion and Analysis
The Company's management's discussion and analyses ("MD&A") for the six month period ending June 30, 2016 and the years ending December 31, 2015, 2014 and 2013 are presented in Schedule "B" to this Filing Statement. Such MD&A, representing a discussion and analysis of financial position and results of operations of the Company should be read in conjunction with the Company's unaudited interim financial statements for the six months ended June 30, 2016 and the audited financial statements for the years ended December 31, 2015, 2014 and 2013.
Description of the Securities
The Company is authorized to issue an unlimited number of Common Shares without nominal or par value of which, as at the date of this Filing Statement, 50,733,381 are issued and outstanding as fully paid and non-assessable.
The holders of Common Shares are entitled to dividends, if, as and when declared by the board of directors, to one vote per share at meetings of the shareholders of the Company and, upon liquidation, to share equally in such assets of the Company as are distributable to the holders of Common Shares. All Common Shares to be outstanding after completion of the Change of Business will be fully paid and non-assessable and not subject to any pre-emptive rights, conversion or exchange rights, redemption, retraction, purchase for cancellation or surrender provisions, sinking or purchase fund provisions, provisions permitting or restricting the issuance of additional securities or provisions requiring a shareholder to contribute additional capital.
Stock Options
Currently, there are 4,428,334 stock options granted under the Stock Option Plan to the current directors and officers of the Company (see "Information Concerning the Company - Options to Purchase Securities"). The following table summarizes the outstanding options held by directors and officers:
Name | Number of securities underlying unexercised option (#) | Option Exercise Price ($) | Option Expiration Date |
Ken Cai | 430,000 430,000 525,000 425,000 475,000 | 0.24 0.26 0.45 0.46 0.67 | September 9, 2020 January 17, 2019 December 4, 2017 January 14, 2018 March 28, 2017 |
Robert M. Callander | 150,000 150,000 150,000 150,000 150,000 | 0.24 0.26 0.45 0.46 0.67 | September 9, 2020 January 17, 2019 December 4, 2017 January 14, 2018 March 28, 2017 |
Malcolm Clay | 125,000 95,000 125,000 125,000 125,000 | 0.24 0.26 0.45 0.46 0.67 | September 9, 2020 January 17, 2019 December 4, 2017 January 14, 2018 March 28, 2017 |
Michael Doggett | 125,000 125,000 125,000 125,000 125,000 | 0.24 0.26 0.45 0.46 0.67 | September 9, 2020 January 17, 2019 December 4, 2017 January 14, 2018 March 28, 2017 |
Jennifer Trevitt | 53,334 30,000 90,000 | 0.24 0.46 0.67 | September 9, 2020 January 14, 2018 March 28, 2017 |
- 7 -
As the Company pays each element of compensation for a different purpose it makes decisions about each component independent of the others. Notwithstanding this fact, the Compensation Committee is always cognizant of the total size of each executive officer's compensation package and works to ensure that on the whole, it is appropriate given the financial resources, size and stage of development of the Company.
In 2015, the Compensation Committee did not consider the implications or the risks associated with the Company's compensation policies and practices. The Company periodically reviews its compensation practices to ensure they do not promote excessive risk taking or are likely to have a material adverse effect on the Company. There is currently no prohibition on an executive officer or director of the Company from purchasing financial instruments to offset a decrease in market value of equity securities held directly or indirectly by that executive officer. To the Company's knowledge no executive officer or director of the Company has entered into or purchased such a financial instrument.
Compensation Governance
The Company's Compensation Committee is comprised of Robert M. Callander (Chair), Malcolm Clay and Michael Doggett, all of whom are independent directors within the meaning set out in National Instrument 52‑110 – Audit Committees ("NI 52‑110"). All three of the members of the Compensation Committee are experienced participants in the capital markets who have had experience sitting on the corporate boards in addition to that of the Company. The Compensation Committee has the responsibility of recommending stock option grants and bonus awards to the Board in addition to negotiating the NEOs' annual salaries or consulting fees.
Summary Compensation Table
The following table sets forth the total compensation paid to or earned by the Named Executive Officers for the Company's two (2) most recently completed financial years and the six month period ending June 30, 2016:
Name and Principal Position | Year or Period Ended | Salary ($) | Share-based Awards ($) | Option-based Awards(1) ($) | Non-equity Incentive Plan Compensation ($) | Pension Value ($) | All Other Compensation ($) | Total Compensation ($) | |
Annual Incentive Plans | Long-term Incentive Plans | ||||||||
Dr. Ken Cai President & Chief Executive Officer | June 30, 2016 | 42,500 | N/A | 27,777 | N/A | N/A | N/A | 5,986 | 76,263 |
2015 | 83,333 | N/A | 68,631 | 40,000 | N/A | N/A | 11,372(5) | 203,336 | |
2014 | 83,333 | N/A | 76,147 | 30,000 | N/A | N/A | 11,181 | 200,661 | |
Larry Tsang(2) Interim Chief Financial Officer | June 30, 2016 | 12,276 | N/A | N/A | N/A | N/A | N/A | N/A | 12,276 |
David Li(3) Former Chief Financial Officer | 2015 | 25,021 | N/A | 23,941 | N/A | N/A | N/A | 17,000(6) | 65,000 |
- 10 -
| Name and Principal Position | Year or Period Ended | Salary ($) | Share-based Awards ($) | Option-based Awards(1) ($) | Non-equity Incentive Plan Compensation ($) | Pension Value ($) | All Other Compensation ($) | Total Compensation ($) | |
| Annual Incentive Plans | Long-term Incentive Plans | ||||||||
Samson Siu(4) Former Interim Chief Financial Officer | 2015 | 15,600 | N/A | N/A | N/A | N/A | N/A | 14,400(6) | 30,000 |
2014 | 43,333 | N/A | 5,313 | 4,000 | N/A | N/A | Nil | 52,646 | |
| (1) | The fair value of stock options granted during the last financial year is based on the Black‑Scholes Option Pricing Model. The Company used the following assumptions in the model to determine the fair value of the awards recorded in 2015: Dividend Yield Nil; Expected Life 5 years; Volatility 85-87%; Risk Free Interest Rate 0.78-1.68%. |
| (2) | Mr. Tsang was appointed as Interim Chief Financial Officer on January 14, 2016. |
| (3) | Mr. Li was appointed as Chief Financial Officer on August 10, 2015 and ceased as Chief Financial Officer on November 30, 2015. |
| (4) | Mr. Siu ceased to act as Interim Chief Financial Officer of the Corporation on May 15, 2015. |
| (5) | Represents life insurance premiums paid during the year. |
| (6) | Amounts represent termination benefits paid. |
Incentive Plan Awards
Outstanding Share-Based Awards and Option-Based Awards
The following table sets forth the options granted to the Named Executive Officers to purchase or acquire securities of the Company outstanding at the end of the most recently completed financial year:
Name and principal position | Option-based Awards | |||
Number of securities underlying unexercised options (#)(1) | Option exercise price ($) | Option expiration date | Value of unexercised in-the-money options ($)(2) | |
Ken Z. Cai Chief Executive Officer and President | 430,000 430,000 525,000 425,000 475,000 | 0.24 0.26 0.45 0.46 0.67 | September 9, 2020 January 17, 2019 December 4, 2017 January 14, 2018 March 28, 2017 | Nil Nil Nil Nil Nil |
Larry Tsang Interim Chief Financial Officer | N/A | N/A | N/A | Nil |
David Li Former Chief Financial Officer | N/A | N/A | N/A | Nil |
Samson Siu Former Interim Chief Financial Officer | N/A | N/A | N/A | Nil |
| (1) | Represents the number of outstanding Options, both vested and unvested. All outstanding Options are vested except for 286,667 options expiring September 9, 2020 that were not vested. |
| (2) | The amount represents the aggregate dollar value that would have been realized if the Options had been exercised on December 31, 2015, based on the difference between market price of the Company's common shares and the exercise price on such date. |
Incentive Plan Awards – Value Vested or Earned During the Year
The following table sets forth the value vested or earned during the year of option-based awards, share-based awards and non-equity incentive plan compensation paid to Named Executive Officers during the most recently completed financial year:
- 11 -
Name and principal position | Option-based awards – Value vested during the year ($)(1) | Share-based awards – Value vested during the year ($) | Non-equity incentive plan compensation – Value earned during the year ($) |
Ken Z. Cai Chief Executive Officer and President | 14,300 | N/A | Nil |
Larry Tsang Interim Chief Financial Officer | N/A | N/A | N/A |
David Li Former Chief Financial Officer | N/A | N/A | Nil |
Samson Siu Former Interim Chief Financial Officer | N/A | N/A | Nil |
| (1) | The amount represents the aggregate dollar value that would have been realized if the Options had been exercised on the vesting date during the year, based on the difference between market price of the Company's common shares and the exercise price on such vesting date. |
Pension Benefits
The Company does not have a pension plan that provides for payments or benefits to the NEOs at, following, or in connection with retirement.
Termination and Change of Control Benefits
Chief Executive Officer and President
The Company's former subsidiary, Minco Resources Limited, entered into a consulting agreement dated January 1, 2014 with Sino Capital Limited, a private company controlled by Ken Z. Cai (the "Agreement"). Pursuant to the Agreement, Dr. Cai agreed to serve as the Company's President and Chief Executive Officer. The Company disposed of its interests in Minco Resources Limited in 2015 but agreed to assume certain of the obligations of Minco Resources Limited to Sino Capital Limited and Dr. Cai under the Agreement. In particular, the Company has assumed 20% of the aggregate salary that Dr. Cai receives from the Minco Group. The remaining 80% of Dr. Cai's aggregate salary is the responsibility of the other companies comprising the Minco Group.
Dr. Cai's engagement with the Company may be terminated on the occurrence of any of the following events: (i) the mutual consent in writing of both parties to terminate the services; (ii) the termination of Dr. Cai's services by the Company with cause, which shall include a material breach by Dr. Cai of one or more of the terms of Dr. Cai's employment; (iii) written notice given by one party to the other setting out a date for termination effective not less than six (6) months after the date on which the notice is deemed to be given. In the event that Dr. Cai's services are terminated with cause, no severance shall be payable by the Company. If his services are terminated without cause, Dr. Cai shall receive 24 months of compensation (based on the 20% cost allocation described above).
In the event that there is a take-over or change of control of the Company resulting in the actual or constructive termination of Dr. Cai's services, the Company shall pay compensation equal to 24 months of fees in addition to the 24 months termination described above. This severance shall be paid as a lump sum payment on the day after Dr. Cai's termination.
By way of example, if Dr. Cai's services had been terminated without cause on December 31, 2015, Dr. Cai would have received a cash payment of $160,000. Dr. Cai's vested options would be cancelled 30 days after the date of termination without cause and immediately if terminated with cause.
- 12 -
Director Compensation
Director Compensation Table
The Company's directors receive an annual retainer fee of $10,000 per year along with a fee of $500 for their attendance at each meeting. The Chairman of each of the Company's committees receives an additional fee of $1,000 per year. The Company's directors are granted Options on an annual basis as recommended by the Company's Compensation Committee.
The following table discloses the compensation of the non-management directors of the Company for the most recently completed financial year:
Name | Fees earned ($) | Share-based awards ($) | Option-based awards ($)(1) | Non-equity incentive plan compensation ($) | Pension value ($) | All other compensation ($) | Total ($) |
Robert M. Callander | 19,500 | N/A | 23,941 | Nil | N/A | Nil | 43,441 |
Malcolm Clay | 21,500 | N/A | 19,951 | Nil | N/A | Nil | 41,451 |
Michael Doggett | 18,000 | N/A | 19,951 | Nil | N/A | 15,000(2) | 52,951 |
| (1) | The Black Scholes valuation methodology was used to determine fair value on the date of grant. Accordingly, the value shown for these options are not in-the-money value at the time of grant, but the theoretical value of the options at that time based on the Black Scholes option pricing formula. Key assumptions and estimates used in the pricing model include a risk-free interest rate of 0.78 - 1.68% based on average yields of five-year Government of Canada benchmarks bonds, dividend yield 0%, volatility of 85 - 87% based on historical volatility of the stock price of the Company for the five-year period immediately preceding the grant date, and expected option life of 5 years. Please see the table under "Outstanding Share-based Awards and Option-based Awards for Directors" for the in-the-money value of these options on December 31, 2015. |
| (2) | Bonus paid to Mr. Doggett for his assistance negotiating the Company's sale of its Changkeng property in China. |
The Company's non-management directors were granted a total of 400,000 Options during the 2015 fiscal year.
Outstanding Share-Based Awards and Option-Based Awards
Currently, no directors hold any share based awards.
The table below states the name of each non-management director, the number of option based awards and the value of the awards if the directors were to have exercised their Options on December 31, 2015.
Name | Option-based Awards | |||
Number of securities underlying unexercised options (#) | Option Exercise Price ($) | Option Expiration Date | Value of unexercised in-the-money options ($)(1) | |
Robert M. Callander | 150,000 150,000 150,000 150,000 150,000 | 0.24 0.26 0.45 0.46 0.67 | September 9, 2020 January 17, 2019 December 4, 2017 January 14, 2018 March 28, 2017 | Nil Nil Nil Nil Nil |
Malcolm Clay | 125,000 125,000 125,000 125,000 125,000 | 0.24 0.26 0.45 0.46 0.67 | September 9, 2020 January 17, 2019 December 4, 2017 January 14, 2018 March 28, 2017 | Nil Nil Nil Nil Nil |
Michael Doggett | 125,000 125,000 125,000 125,000 125,000 | 0.24 0.26 0.45 0.46 0.67 | September 9, 2020 January 17, 2019 December 4, 2017 January 14, 2018 March 28, 2017 | Nil Nil Nil Nil Nil |
| (1) | The amount represents the aggregate dollar value that would have been realized if the Options had been exercised on December 31, 2015, based on the difference between market price of the Company's common shares and the exercise price on such date. |
- 13 -
Description of Proposed Business
The Company's Board of Directors has approved the Change of Business from that of a mineral exploration company to that of a resources-focused investment company. In conjunction with these plans, the Company has begun the process of divesting all remaining mineral property interests held in China. The terms of such divestitures will be announced as transactions are negotiated and concluded.
In 2015, the Company sold a 51-per-cent undivided interest in the Changkeng gold project to Minco Silver for net proceeds of approximately $10 million. Since that time, the company has been searching for suitable mineral acquisitions, joint ventures and other transactions in the mineral resource sector outside of China. Given the expertise and skill sets of the members of the Board of Directors and management, the management and Board of the Company believe that the ideal allocation of the Company's working capital would be within the framework of a resources-focused investment company. For those reasons, the Management and Board have proposed that the Company complete the Change of Business.
Investment Objectives
The investment objectives for the Company and the proposed business following the Change of Business are to seek: a high return on investment opportunities, primarily in the natural resource, industrial, or technology sectors; and to preserve capital and limit downside risk while achieving a reasonable rate of return by focusing on opportunities with attractive risk to reward profiles. The nature and timing of the Company's investments will depend, in part, on available capital at any particular time and the investment opportunities identified and available to the Company. Subject to the availability of capital, the Company intends to create a diversified portfolio of investments. The composition of its investment portfolio will vary over time depending on its assessment of a number of factors including the performance of financial markets and credit risk.
The Company holds one investment as of the date of this Filing Statement, consisting of an equity interest in Minco Silver Corporation, a Canadian public company listed on the TSX. In addition to these investments, the Company has approximately $8,500,000 in working capital (as at September 30, 2016), most of which will be allocated to new investments that are guided by the Company's investment policy. The nature and timing of the Company's investments will depend, in part, on available capital at any particular time and the investment opportunities identified and available to the Company.
Investment Strategy
In light of the numerous investment opportunities across the entire minerals sector, the Company has adopted a fairly unrestricted approach to investment targets without placing unnecessary limits on potential returns on its investment. This approach is demonstrated in the proposed investment strategy set out below.
| · | Investment Sector: Natural resource, industrial, or technology industries. |
| · | Investment Types: Equity, debt, royalties, income and commodity streams, derivatives and any other investment structures or instruments that could be acquired or created. |
| · | Jurisdictions: Preference will be given to first world countries but all countries are permissible depending on the risk assessment of the Board and Management at the time the investment is made and the risk-reward relationship associated with each investment in a particular jurisdiction. |
- 14 -
| · | Investment Size: Unlimited, which may result in the Company holding a control position in a target corporation or possibly requiring future equity or debt financings to raise money for specific investments. |
| · | Investment Timeline: Not limited. |
| · | Investment Targets: Director project investments either through direct equity in a project, or through a derivative interest such as a royalty, stream or other derivative facility. Investments in public or private corporations, partnership or other legal entities that own, or propose to own, natural resource, industrial, or technology assets or their respective derivatives. Distressed situations where a change of management or other restructuring is required to realize the value of the asset. Activist investing where shareholder value is being adversely affected by a corporation's current board and management. |
| · | Investment Review: Will seek to maintain the ability to actively review and revisit all of the investments on an ongoing basis. |
| · | Liquidity: Will evaluate the liquidity of investments and seek to realize value from same in a prudent and orderly fashion. |
The Company has adopted an investment policy to govern its investment activities. The investment policy sets out, among other things, the Company's investment objectives and strategy. A copy of the Company's investment policy is attached hereto as Schedule "C".
The Company's investment focus is primarily concentrated on the mineral resource sector with investments to be made in both privately held and publicly traded corporations and directly in resource projects.
Conditional Listing Approval
As the Company's asset base is not sufficiently large enough to qualify as an investment issuer on the TSX, the Company has applied for conditional approval to be listed on the TSXV as a Tier 1 Investment Issuer. Acceptance of the Change of Business by the TSXV will be subject to the Company fulfilling all of the requirements of the TSXV, summarized as follows (all capitalized terms used below have the meaning set forth in Exchange Policy 1.1):
| 1. | Net Tangible Assets of at least $10,000,000. |
| 2. | Disclosed investment policy. |
| 3. | Adequate Working Capital and Financial Resources to execute business plan for 18 months following listing. |
| 4. | Unallocated funds of at least $200,000. |
| 5. | Public Float of at least 1,000,000 shares. |
| 6. | At least 250 Public Shareholders each holding a Board Lot and having no Resale Restrictions on their shares. |
| 7. | At least 20% of issued and outstanding shares in the hands of Public Shareholders. |
- 15 -
Minco Silver Corporation Investment
The Company holds a significant equity investment in Minco Silver consisting of 11,000,000 common shares representing approximately 18.26% of Minco Silver's outstanding share capital. As at the close of trading on November 10, 2016, the current market value of the Minco Silver stake was approximately $12.43 million. The Company has held its investment in Minco Silver since its spin-off from the Company and listing on the TSX in 2005. Minco Silver holds a 90% interest in the Fuwan silver deposit, situated along the northeast margin of the prospective Fuwan Silver Belt in Guangdong, China and 51% interest in the Changkeng gold project, located contiguous to, and part of the same mineralized system. Further information with respect to Minco Silver may be found at Minco Silver's website, www.mincosilver.ca.
Available Funds and Principal Purposes
Funds Available
The Company has estimated working capital of $8,500,000 as of September 30, 2016 which represents the funds available to the Company upon completion of the Change of Business (the "Available Funds").
Principal Purposes
The Company intends to use the Available Funds for the following purposes:
| Purpose | Amount |
Allocation for new investments during the year following the completion of the Change of Business | $1,500,000 |
Completion of the change of business | $100,000 |
Administrative expenses for the year following the completion of the Change of Business | $780,000 (1) |
Unallocated working capital | $6,120,000 |
| Total: | $8,500,000 |
| (1) | See "Administrative Costs" below. |
The Company will spend the funds available to it on completion of the Change of Business to carry out its business plan set out in "Information Concerning Minco Gold and Change of Business – Description of Proposed Business" herein. There may be circumstances where, for sound business reasons, a re-allocation of funds may be necessary. The Company may require additional funds in order to fulfill all of the Company's expenditure requirements and to meet its objectives, in which case the Company expects to either issue additional securities or incur indebtedness. There is no assurance that additional funding required by the Resulting Issuer will be available if required.
Proceeds from the exercise of any options, warrants or other rights to purchase shares of the Company will be used for general corporate purposes.
Administrative Costs
The following table sets out the estimated aggregate monthly and annual general and administration costs that will be incurred in order for the Company to operate its business over the 12 month period following the completion of the Change of Business:
- 16 -
Item | Monthly ($) | Yearly ($) |
Office Rent and Office Expenses | 21,667 | 260,000 |
Salaries and Consulting Fees | 13,333 | 160,000 |
Audit, Accounting and Legal | 12,500 | 150,000 |
Listing and Transfer Agent Fees | 11,667 | 140,000 |
Travel and Investor Relations | 5,833 | 70,000 |
TOTAL: | 65,000 | 780,000 |
Principal Securityholders
To the knowledge of the directors and officers of the Company as at the date hereof, no shareholders of the Company are anticipated to own of record or beneficially, directly or indirectly, or exercise control or direction over more than ten percent (10%) of any class of voting securities of the Company after the completion of the Change of Business.
Directors and Officers of Minco Gold
The following table states the names of the directors and officers of the Company, the offices of the Company now held by them, their present principal occupation, the period of time for which they have been a director or officer of the Company and the securities of the Company beneficially owned by them, directly or indirectly, or over which each exercises control or direction, as at the date hereof.
Name, Province and Country of Residence | Present Principal Occupation | Current Position(s) with the Company | Director/Officer Since | Number of Securities Held |
Ken Z. Cai Beijing, China | Chief Executive Officer and President of Minco Gold Corporation, Chairman and Chief Executive Officer of Minco Silver Corporation and Minco Base Metals Corporation | Chief Executive Officer, President and Director | February 29, 1996 | Common Shares: 4,618,736(1) Options: 2,285,000 |
Robert M. Callander (2)(4)(5)(6) Ontario, Canada | Vice President of Caldwell Securities Ltd. | Director | August 23, 1996 | Common Shares: 30,277 Options: 750,000 |
Malcolm Clay (2)(3)(4)(5) British Columbia, Canada | Self-employed consultant | Director | November 16, 2007 | Common Shares: 30,000 Options: 595,000 |
Michael Doggett (2)(4)(5)(7) British Columbia, Canada | Principal Consultant at Michael Doggett & Associates | Director | July 16, 2007 | Common Shares: 12,000 Options: 625,000 |
Larry Tsang British Columbia, Canada | Interim Chief Financial Officer of Minco Gold Corporation, Minco Silver Corporation and Minco Base Metals Corporation | Interim Chief Financial Officer | January 14, 2016 | Common Shares: Nil Options: Nil |
Jennifer Trevitt British Columbia, Canada | Director of Corporate Affairs and Corporate Secretary of Minco Silver Corporation, and Minco Base Metals Corporation | Director of Corporate Affairs and Corporate Secretary | July 6, 2009 | Common Shares: Nil Options: 173,334 |
- 17 -
| (1) | Includes 3,634,052 common shares held by Pacific Canada Resources Inc., a private company over which Dr. Cai has control and direction. |
| (2) | Member of the Audit Committee. |
| (3) | Chair of the Audit Committee. |
| (4) | Member of the Compensation Committee. |
| (5) | Member of the Nominating Committee. |
| (6) | Chair of the Compensation Committee. |
| (7) | Chair of the Nominating Committee. |
The term of office of the directors expires annually at the time of the Company's annual general meeting, unless re-elected at such meeting.
The Board of Directors of the Company has three committees which will remain unchanged following completion of the Change of Business. These are the audit committee, comprised of Malcolm Clay (Chair), Michael Doggett and Robert Callander; the compensation committee, comprised of Robert Callander (Chair), Michael Doggett and Malcolm Clay; and, the nominating committee, comprised of Michael Doggett (Chair), Malcolm Clay and Robert Callander.
Management
The following is a brief description of the current members of management and directors of the Company, all of whom will retain their positions following completion of the Change of Business:
Ken Cai
President, CEO and Director (Age: 52 years)
President, CEO and Director (Age: 52 years)
Ken Cai serves as the Chairman, President and Chief Executive Officer of Minco Gold Corporation. Dr. Cai holds a Ph.D. in mineral economics from Queens University in Kingston, Ontario, Canada and has 24 years of experience in mineral exploration, project evaluation, corporate financing and company management. Dr. Cai has served as a director of several publicly-traded and private Canadian and Chinese companies. He also serves as the Chairman, President and Chief Executive Officer of Minco Silver Corporation and a Director of Minco Base Metals Corporation.
Larry Tsang
Interim CFO (Age: 58 years)
Interim CFO (Age: 58 years)
Larry Tsang, CPA, CA, was appointed the Interim Chief Financial Officer on January 14, 2016. Mr. Tsang holds a Bachelor's Degree in Technology (Accounting) from British Columbia Institute of Technology in Canada and served as a senior accountant for four years with Ernst and Young LLP, Vancouver, Canada. His experience includes more than 11 years working in auditing, accounting, taxation, and finance for both private and public companies. Mr. Tsang is currently the Interim CFO of Minco Base Metals Corporation, Minco Silver Corporation, and a director of Grand Peak Capital Corp.
Jennifer Trevitt
Corporate Secretary (Age: 43 years)
Jennifer Trevitt has been with the Company since March 2009, was appointed Corporate Secretary in July 2009 and Director of Corporate Affairs in July 2015. Ms. Trevitt also serves as Corporate Secretary for Minco Silver Corporation and Minco Base Metals Corporation. She is a Capilano University certified paralegal who has worked in the securities/corporate finance industry for over 17 years for Canadian and US public companies. She also worked as a paralegal for the Insurance Corporation of British Columbia for seven years.
Robert Callander
Director (Age: 71 years)
Director (Age: 71 years)
- 18 -
Ken Cai was formerly the Chairman, Chief Executive Officer and a Director of Pacific Link Mining Corp. (formerly Tranzcom China Security Networks Inc. ("Tranzcom")). On September 18, 2006, a cease trade order was issued against Tranzcom by the British Columbia Securities Commission. The cease trade order was issued in response to Tranzcom's failure to file its financial statements within the time periods mandated by National Instrument 51-102 – Continuous Disclosure Obligations. The cease trade order against Tranzcom was revoked on December 18, 2006.
Penalties or Sanctions
To the Company's knowledge, no proposed director, officer or promoter of the Company nor a shareholder anticipated to hold a sufficient number of securities of the Company to affect materially the control of the Company, or a personal holding company of any such person has been subject to any penalties or sanctions imposed by a court relating to securities legislation, or by any securities regulatory authority or has entered into a settlement agreement with a securities regulatory authority; or has been subject to any other penalties or sanctions imposed by a court or regulatory body or self-regulatory authority that would be likely to be considered important to a reasonable investor making an investment decision about the Minco Gold and the Change of Business.
Personal Bankruptcies
To the Company's knowledge, no proposed director, officer or promoter or a shareholder anticipated to hold a sufficient number of securities of the Company to affect materially the control of the Company, or a personal holding company of any such person has, within the ten years prior to the date of the Filing Statement, as applicable become bankrupt, made a proposal under any legislation relating to bankruptcy or insolvency or has been subject to or instituted any proceedings, arrangement, or compromise with creditors, or had a receiver, receiver manager or trustee appointed to hold their assets.
Conflicts of Interest
There are potential conflicts of interest to which the directors, officers and promoters of the Company will be subject in connection with the operations of the Company. Certain of the directors, officers and promoters may be engaged in corporations or businesses which may be in competition with the Company. Accordingly, situations may arise where a director, officer or promoter will be in direct competition with the Company. Conflicts, if any, will be subject to the procedures and remedies as provided under the BCA.
Other Reporting Issuer Experience
The following table sets out the directors, officers and promoters of the Company that are, or have been within the last five years, directors, officers or promoters of other issuers that are or were reporting issuers in any Canadian jurisdiction:
Name | Name and Jurisdiction of Reporting Issuer | Name of Trading Market | Position | From | To |
Ken Z. Cai | Minco Silver Corporation | TSX | Director and CEO | August 2004 | present |
Minco Base Metals Corporation | N/A | Director and CEO | May 2007 | present | |
Malcolm Clay | Hanwei Energy Services Corp. | TSX | Director | August 2010 | present |
GreenPower Motor Company | TSX | Director | February 2011 | present | |
Michael Doggett | Pacific Link Mining Corp. | TSX | Director | April 2007 | present |
Riverside Resources Inc. | TSX-V | Director | July 2008 | present | |
Robert Callander | N/A | ||||
Larry Tsang | Minco Silver Corporation | TSX | Interim CFO | January 2016 | present |
Minco Base Metals Corporation | N/A | Interim CFO | January 2016 | present | |
Grand Peak Capital Corp. | N/A | Director | May 2016 | present | |
Jennifer Trevitt | Pacific Link Mining Corp. | NEX | Director & Corporate Secretary | September 2014 | present |
Minco Silver Corporation | TSX | Director of Corporate Affairs & Corporate Secretary | July 2009 | present | |
Minco Base Metals Corporation | N/A | Director of Corporate Affairs & Corporate Secretary | July 2009 | present |
- 20 -
Proposed Executive Compensation
The following table sets forth the expected annual and long-term compensation for services in all capacities to the Company for the 12 months following completion of the Change of Business in respect of the Company's three most highly compensated executive officers, in addition to the proposed Chief Executive Officer.
Name and Principal Position | Salary ($) | Share- based Awards ($) | Option-based Award ($) | Non-equity Incentive Plan Compensation | Pension Value ($) | All Other Compensation ($) | Total Compensation ($) | |
Annual Incentive Plans | Long-term Incentive Plans | |||||||
Ken Cai President & Chief Executive Officer | 85,000 | N/A | 50,000 | N/A | N/A | N/A | 12,000 | 147,000 |
Larry Tsang Interim Chief Financial Officer | 25,000 | N/A | N/A | N/A | N/A | N/A | N/A | 25,000 |
110,000 | N/A | 50,000 | N/A | N/A | N/A | 12,000 | 172,000 | |
Termination and Change of Control Benefits
There will be no agreements with any directors or officers of the Company regarding arrangements for termination or change of control benefits upon completion of the Change of Business.
Compensation of Directors
Upon completion of the Change of Business, directors will not receive cash compensation but will be eligible for incentive stock options of the Company. The Company has a Stock Option Plan for the granting of incentive stock options to the officers, employees and directors. The purpose of granting such options is to assist the Company in compensating, attracting, retaining, and motivating the directors of the Company and to closely align the personal interests of such persons to that of the shareholders.
Indebtedness of Directors and Officers
None of the directors or officers of the Company, nor any individual who is proposed to be a director or officer of the Company, nor any other individual who at any time during the mostly recently completed financial year of the Company, was a director or officer of the Company, nor any Associate of such individuals, is indebted to the Company. Neither will any indebtedness of any of these Individuals or Associates to another entity be the subject of a guarantee, support guarantee, letter of credit or other similar arrangement or understanding provided by the Company.
- 21 -
Investor Relations Arrangements
The Company has not entered into any written or oral agreement or understanding with respect to any person or company to provide promotional or investment services for the Company or its securities.
Options to Purchase Securities
Stock Option Plan
The Company has previously implemented a rolling Stock Option Plan pursuant to TSX policies pursuant to which up to 15% of the issued and outstanding shares of the Company from time to time are reserved for issuance. The Stock Option Plan was approved by the Company's shareholders at an annual and special general meeting of shareholders held on June 27, 2016. As at the date of this Filing Statement, the Company had a total of 50,764,881 issued and outstanding shares. Accordingly the Stock Option Plan currently permits a total of 7,614,732 shares to be reserved for issuance, equal to 15% of the issued share capital.
TSXV policies only permit rolling stock option plans to reserve up to 10% of the issued and outstanding shares of the Company from time to time. As a result, upon acceptance of the Change of Business by the TSXV, the Stock Option Plan will be deemed to be a fixed stock option plan pursuant to which a maximum of 7,614,732 are reserved for issuance, regardless of the number of issued and outstanding shares of the Company from time to time.
The Stock Option Plan provides that the Board of Directors of the Company may from time to time, in its discretion, and in accordance with the TSX requirements, grant to directors, officers and consultants to the Company, non-transferable options to purchase Common Shares. The options are exercisable up to five (5) years from the date of grant, so long as the optionee maintains the optionee's position with the Company. The number of Common Shares reserved for issuance to any individual director or officer will not exceed 5% of the issued and outstanding Common Shares and the number of Common Shares reserved for issuance to any consultant will not exceed 2% of the issued and outstanding Common Shares.
Where an optionee's relationship with the Company terminates by reason of death, the option may be exercised within a maximum period of one year after such death, subject to the expiry date of such option. Where the relationship terminates for cause, the options are immediately cancelled. For directors, officers, employees or consultants who resign, take early retirement or whose relationship with the company is terminated other than for cause the options may be exercised within 90 days following cessation of the optionee's relationship with the Company.
As at the date of the Filing Statement, there are 5,285,334 stock options held by the Company's current directors, officers, employee and consultants having a weighted average exercise price of $0.43 per share. These options are exercisable at prices of between $0.24 and $0.67. See "Information Concerning Minco Gold and Change of Business – Stock Options".
Warrants
The Company has no share purchase warrants or other securities convertible into securities outstanding, other than the stock options described under "Options to Purchase Securities – Stock Option Plan" above.
Escrowed Securities
All of the Company's issued and outstanding shares are freely tradeable and none are subject to escrow restrictions.
- 22 -
Legal Proceedings
The Company is not currently a party to any actual or pending material legal proceedings to which it is or is likely to be a party or of which any of its assets are or are likely to be subject. Management of the Company is currently not aware of any legal proceedings contemplated against it.
Auditor, Transfer Agent and Registrar
Auditor
The Company's auditors are PricewaterhouseCoopers LLP ("PwC"), located at Suite #700 - 250 Howe Street, Vancouver, B.C., V6C 3S7. PwC has advised the Company that it is independent within the meaning of the Code of the Professional Conduct of the Chartered Professional Accounts of British Columbia.
Transfer Agent and Registrar
Computershare Investor Services Inc.
3rd Floor, 510 Burrard Street
Vancouver, B.C. V6C 3B9
3rd Floor, 510 Burrard Street
Vancouver, B.C. V6C 3B9
Material Contracts
The Company is not a party to any material contracts, excluding contracts entered into in the ordinary course of business.
Copies of these agreements will be available for inspection at the offices of the Company located at 2772 – 1055 West Georgia Street, Vancouver, British Columbia, Canada, V6E 3R5, during ordinary business hours from the date hereof until completion of the Change of Business and for a period of 30 days thereafter.
GENERAL MATTERS
Sponsor
The Company has requested a waiver of sponsorship of the Change of Business pursuant to the policies of the TSXV.
Experts
No professional person who has provided an opinion or report referenced in this Filing Statement currently holds more than 1% of Company's shares and, upon completion of the Change of Business, will not hold more than 1% of the Company's issued and outstanding shares, and no such professional person is expected to be elected, appointed or employed as a director, officer or employee of the Company or of its Associates or Affiliates.
Other Material Facts
There are no other material facts about the Company or the Change of Business that are not elsewhere disclosed elsewhere in this Filing Statement.
Approval of the Board of Directors
The contents of this Filing Statement have been approved by the Board of Directors of the Company. Where information contained in this Filing Statement rests particularly within the knowledge of a person other than the Company, the Company has relied upon information furnished by such person.
SCHEDULE A
AUDITED FINANCIAL STATEMENTS OF MINCO GOLD CORPORATION FOR THE YEAR ENDED DECEMBER 31, 2015 AND UNAUDITED FINANCIAL STATEMENTS FOR THE SIX MONTH PERIOD ENDED JUNE 30, 2016
Minco Gold Corporation
(An exploration stage enterprise)
Consolidated Financial Statements
For the years ended December 31, 2015, 2014, and 2013
(Canadian dollars)
Index
| Page | ||
| Consolidated Financial Statements | 5-9 | |
| Consolidated Statements of Financial Position | 5 | |
| Consolidated Statements of Income (Loss) | 6 | |
| Consolidated Statements of Comprehensive Income (Loss) | 7 | |
| Consolidated Statements of Changes in Equity | 8 | |
| Consolidated Statements of Cash Flow | 9 | |
| Notes to the Consolidated Financial Statements | 10 – 33 | |
| 1 | General information and significant transaction with Minco Silver | 10 |
| 2 | Basis of preparation | 11 |
| 3 | Summary of significant accounting policies | 11 |
| 4 | Critical accounting estimates and judgments | 18 |
| 5 | Cash and cash equivalents | 18 |
| 6 | Short-term investment | 18 |
| 7 | Property, plant and equipment | 19 |
| 8 | Mineral interests | 20 |
| 9 | Equity investment in Minco Silver Corporation | 22 |
| 10 | Gain on legal settlement | 24 |
| 11 | Non-controlling interest | 25 |
| 12 | Share capital | 26 |
| 13 | Income tax | 28 |
| 14 | Commitments | 29 |
| 15 | Related party transactions | 29 |
| 16 | Geographical information | 31 |
| 17 | Financial instruments and fair values | 31 |
| 18 | Capital management | 33 |
MINCO GOLD CORPORATION
(An exploration stage enterprise)
Consolidated Statements of Financial Position
(in Canadian dollars)
| December 31, | December 31, | |||||||
| 2015 | 2014 | |||||||
| Assets | $ | $ | ||||||
| Current assets | ||||||||
| Cash and cash equivalents (note 5) | 5,593,669 | 2,117,038 | ||||||
| Short-term investment (note 6) | 4,048,341 | - | ||||||
| Receivables | 11,122 | 103,174 | ||||||
| Due from related parties (note 15) | 12,387 | 47,696 | ||||||
| Prepaid expenses and deposits | 162,970 | 140,956 | ||||||
| 9,828,489 | 2,408,864 | |||||||
| Long-term deposit | 51,277 | 51,277 | ||||||
Property, plant and equipment (note 7) | 10,428 | 125,298 | ||||||
Equity investment in Minco Silver (note 9) | 6,631,094 | 6,820,000 | ||||||
| 16,521,288 | 9,405,439 | |||||||
| Liabilities | ||||||||
| Current liabilities | ||||||||
| Accounts payable and accrued liabilities | 389,522 | 444,914 | ||||||
| Advance from non-controlling interest (note 8(a)) | - | 453,463 | ||||||
| Due to related party (note 15) | 177,330 | 3,603,848 | ||||||
| 566,852 | 4,502,225 | |||||||
| Equity | ||||||||
| Equity attributable to owners of the parent | ||||||||
| Share capital (note 12(a)) | 41,911,823 | 41,882,757 | ||||||
| Contributed surplus | 9,247,685 | 9,179,213 | ||||||
| Accumulated other comprehensive income | 2,763,940 | 1,183,086 | ||||||
| Deficits | (37,969,012 | ) | (52,330,354 | ) | ||||
| 15,954,436 | (85,298 | ) | ||||||
Non-controlling interests (note 11) | - | 4,988,512 | ||||||
| Total equity | 15,954,436 | 4,903,214 | ||||||
| 16,521,288 | 9,405,439 | |||||||
Commitments (note 14) | ||||||||
| Approved by the Board of Directors | ||||||||
| (signed) Malcolm Clay Director | (signed) Robert Callander Director |
The accompanying notes are an integral part of these consolidated financial statements.
5
MINCO GOLD CORPORATION
(An exploration stage enterprise)
Consolidated Statements of Comprehensive Income (Loss)
For the years ended December 31, 2015, 2014 and 2013
(in Canadian dollars)
| 2015 | 2014 | 2013 | ||||||||||
| $ | $ | $ | ||||||||||
Exploration recovery (note 8(a)) | - | - | (622,293 | ) | ||||||||
Exploration costs (note 8) | 793,081 | 1,177,817 | 1,550,251 | |||||||||
| 793,081 | 1,177,817 | 927,958 | ||||||||||
Administrative expenses (note 15) | ||||||||||||
| Accounting and audit | 152,777 | 105,423 | 111,905 | |||||||||
| Amortization | 34,781 | 67,180 | 66,746 | |||||||||
| Consulting | 78,267 | 11,633 | 30,453 | |||||||||
| Directors' fees | 73,124 | 54,188 | 49,749 | |||||||||
| Foreign exchange loss (gain) | (209,493 | ) | 16,977 | 19,692 | ||||||||
| Investor relations | 37,051 | 24,726 | 116,814 | |||||||||
| Legal and regulatory | 144,844 | 140,727 | 132,506 | |||||||||
| Office and miscellaneous | 384,804 | 366,836 | 360,894 | |||||||||
| Property investigation | 81,407 | 74,948 | 112,863 | |||||||||
| Salaries and benefits | 388,887 | 618,926 | 655,585 | |||||||||
| Share-based compensation (note 12(b)) | 80,248 | 297,588 | 993,331 | |||||||||
| Travel and transportation | 75,791 | 69,786 | 83,553 | |||||||||
| 1,322,488 | 1,848,938 | 2,734,091 | ||||||||||
| Operating loss | (2,115,569 | ) | (3,026,755 | ) | (3,662,049 | ) | ||||||
Gain on legal settlement (note 10) | 51,745 | 148,739 | 1,343,638 | |||||||||
| Gain on sale of exploration permit (note 8(b)(c)) | - | 376,937 | - | |||||||||
| Gain on sale of Minco Resources (note 8) | 15,060,170 | - | - | |||||||||
| Loss on partial disposal of investment in Minco Silver (note 9) | - | (399,536 | ) | - | ||||||||
| Impairment of equity investment in Minco Silver (note 9) | - | (4,205,816 | ) | - | ||||||||
| Unrealized loss on marketable securities | - | - | (1,470 | ) | ||||||||
| Impairment of property, plant and equipment | - | (8,784 | ) | - | ||||||||
| Finance income | 64,819 | 17,570 | 110,122 | |||||||||
| Share of gain (loss) from equity investment in Minco Silver (note 9) 1,259,391 | (321,972 | ) | (656,132 | ) | ||||||||
| Dilution loss (note 9) | - | (78,177 | ) | (77,414 | ) | |||||||
| Net income (loss) for the year | 14,320,556 | (7,497,794 | ) | (2,943,305 | ) | |||||||
| Net income (loss) attributable to: | ||||||||||||
| Shareholders of the Company | 14,361,342 | (7,354,162 | ) | (3,144,525 | ) | |||||||
| Non-controlling interest | (40,786 | ) | (143,632 | ) | 201,220 | |||||||
| 14,320,556 | (7,497,794 | ) | (2,943,305 | ) | ||||||||
| Net Income (loss) per share: | ||||||||||||
| basic and diluted | 0.28 | (0.15 | ) | (0.06 | ) | |||||||
Weighted average number of common shares outstanding: basic and diluted | 50,566,749 | 50,488,078 | 50,348,215 | |||||||||
The accompanying notes are an integral part of these consolidated financial statements
6
Minco Gold Corporation
(An exploration stage enterprise)
Consolidated Statements of Changes in Equity
For the years ended December 31, 2013, 2012 and 2011
(in Canadian dollars)
| 2015 | 2014 | 2013 | ||||||||||
| $ | $ | $ | ||||||||||
Net income (loss) for the year | 14,320,556 | (7,497,794 | ) | (2,943,305 | ) | |||||||
Other comprehensive income (loss), net of tax | ||||||||||||
| Items that may be reclassified subsequently to profit or loss: | ||||||||||||
| Realized gain from reclassification of currency translation adjustments upon disposition of Minco Resources | (479,324 | ) | - | - | ||||||||
| Realized gain reclassified to net loss on partial disposal of equity investment in Minco Silver (note 8) | - | (158,797 | ) | - | ||||||||
| Share of other comprehensive income of Minco Silver equity accounted investment | 1,958,940 | 115,462 | 726,975 | |||||||||
Exchange differences on translation from functional to presentation currency | 101,238 | 131,551 | 126,295 | |||||||||
| Total comprehensive income (loss) for the year | 15,901,410 | (7,409,578 | ) | (2,090,035 | ) | |||||||
Comprehensive income (loss) attributable to: | ||||||||||||
| Shareholders of the Company | 15,904,973 | (7,273,894 | ) | (2,214,953 | ) | |||||||
Non-controlling interest | (3,563 | ) | (135,684 | ) | 124,918 | |||||||
| 15,901,410 | (7,409,578 | ) | (2,090,035 | ) | ||||||||
The accompanying notes are an integral part of these consolidated financial statements.
7
MINCO GOLD CORPORATION
(An exploration stage enterprise)
Consolidated Statements of Changes in Equity
For the years ended December 31, 2015, 2014 and 2013
(in Canadian dollars)
| Attributable to equity owner of the Company | ||||||||||||||||||||||||||||||||
Number of shares | Share capital | Contributed surplus | Accumulated other comprehensive income | Deficits | Subtotal | Non-controlling interest | Total equity | |||||||||||||||||||||||||
| $ | $ | $ | $ | $ | $ | $ | ||||||||||||||||||||||||||
| Balance – January 1, 2013 | 50,348,215 | 41,758,037 | 7,939,681 | 173,246 | (41,831,667 | ) | 8,039,297 | 2,425,368 | 10,464,665 | |||||||||||||||||||||||
| Net income (loss) for the year | - | - | - | - | (3,144,525 | ) | (3,144,525 | ) | 201,220 | (2,943,306 | ) | |||||||||||||||||||||
| Contribution from non-controlling interest (note 11) | - | - | - | - | - | - | 2,573,910 | 2,573,910 | ||||||||||||||||||||||||
| Other comprehensive income (loss) | - | - | - | 929,572 | - | 929,572 | (76,302 | ) | 853,270 | |||||||||||||||||||||||
| Share-based compensation | - | - | 993,331 | - | - | 993,331 | - | 993,331 | ||||||||||||||||||||||||
| Balance – December 31, 2013 | 50,348,215 | 41,758,037 | 8,933,012 | 1,102,818 | (44,976,192 | ) | 6,817,675 | 5,124,196 | 11,941,871 | |||||||||||||||||||||||
| Balance - January 1, 2014 | 50,348,215 | 41,758,037 | 8,933,012 | 1,102,818 | (44,976,192 | ) | 6,817,675 | 5,124,196 | 11,941,871 | |||||||||||||||||||||||
| Net loss for the year | - | - | - | - | (7,354,162 | ) | (7,354,162 | ) | (143,632 | ) | (7,497,794 | ) | ||||||||||||||||||||
| Other comprehensive income | - | - | - | 80,268 | - | 80,268 | 7,948 | 88,216 | ||||||||||||||||||||||||
| Proceeds on issuance of shares from exercise of options | 166,666 | 124,720 | (51,387 | ) | - | - | 73,333 | - | 73,333 | |||||||||||||||||||||||
| Share-based compensation | - | - | 297,588 | - | - | 297,588 | - | 297,588 | ||||||||||||||||||||||||
| Balance - December 31, 2014 | 50,514,881 | 41,882,757 | 9,179,213 | 1,183,086 | (52,330,354 | ) | (85,298 | ) | 4,988,512 | 4,903,214 | ||||||||||||||||||||||
| Balance - January 1, 2015 | 50,514,881 | 41,882,757 | 9,179,213 | 1,183,086 | (52,330,354 | ) | (85,298 | ) | 4,988,512 | 4,903,214 | ||||||||||||||||||||||
| Net income (loss) for the year | - | - | - | - | 14,361,342 | 14,361,342 | (40,786 | ) | 14,320,556 | |||||||||||||||||||||||
| Other comprehensive income | - | - | - | 1,580,854 | - | 1,580,854 | 37,223 | 1,618,077 | ||||||||||||||||||||||||
| Elimination of non-controlling interest related to sale of Minco Resources | - | - | - | - | - | - | (4,984,949 | ) | (4,984,949 | ) | ||||||||||||||||||||||
| Proceeds on issuance of shares from exercise of options | 66,500 | 29,066 | (11,776 | ) | - | - | 17,290 | - | 17,290 | |||||||||||||||||||||||
| Share-based compensation | - | - | 80,248 | - | - | 80,248 | - | 80,248 | ||||||||||||||||||||||||
| Balance - December 31, 2015 | 50,581,381 | 41,911,823 | 9,247,685 | 2,763,940 | (37,969,012 | ) | 15,954,436 | - | 15,954,437 | |||||||||||||||||||||||
The accompanying notes are an integral part of these consolidated financial statements.
8
| 2015 | 2014 | 2013 | ||||||||||
| Cash flow provided by (used in) | $ | $ | $ | |||||||||
Operating activities | ||||||||||||
| Net income (loss) for the year 14,320,556 | (7,497,794 | ) | (2,943,305 | ) | ||||||||
| Adjustments for: | ||||||||||||
| Amortization | 34,363 | 67,180 | 66,746 | |||||||||
| Equity loss (gain) on investment in Minco Silver | (1,259,391 | ) | 321,972 | 656,132 | ||||||||
| Dilution loss | - | 78,177 | 77,414 | |||||||||
| Loss on partial disposal of equity investment in Minco Silver | - | 399,536 | - | |||||||||
| Impairment of equity investment in Minco Silver | - | 4,205,816 | - | |||||||||
| Impairment on property, plant and equipment | - | 8,784 | - | |||||||||
| Foreign exchange loss (gain) | (227,257 | ) | 17,603 | 21,496 | ||||||||
| Gain on sale of Minco Resource | (15,111,348 | ) | - | - | ||||||||
| Gain from legal settlement (note 10) | (51,745 | ) | (148,739 | ) | (1,343,638 | ) | ||||||
| Gain on sale of exploration permits (note 8(b)) | - | (376,937 | ) | - | ||||||||
| Share-based compensation (note 12 (b)) | 80,248 | 297,588 | 993,331 | |||||||||
| Unrealized loss on marketable securities | - | - | 1,470 | |||||||||
| Changes in items of working capital: | ||||||||||||
| Receivables | 10,454 | (82,144 | ) | 65,139 | ||||||||
| Due from related parties | 501,491 | 41,368 | 1,034,808 | |||||||||
| Prepaid expenses and deposits | (140,315 | ) | (73,151 | ) | 75,151 | |||||||
| Accounts payable for Changkeng permit | - | - | (4,711,920 | ) | ||||||||
| Accounts payable and accrued liabilities | 91,603 | 19,141 | (36,317 | ) | ||||||||
| Net cash used in operating activities | (1,751,341 | ) | (2,721,600 | ) | (6,043,493 | ) | ||||||
| Investing activities | ||||||||||||
| Loan receivable | - | - | (1,641,900 | ) | ||||||||
| Net cash outflow from sale of Minco Resources and its subsidiaries | (1,354,041 | ) | - | - | ||||||||
| Proceeds from loan receivable (note 8(a)) | - | - | 1,641,900 | |||||||||
| Proceeds from legal settlement (note 10) | 94,472 | 720,095 | 801,395 | |||||||||
| Proceeds from partial disposal of investment in Minco Silver (note 9) | - | 1,500,000 | - | |||||||||
| Proceeds from sales of exploration permits (note 8(b)) | - | 376,937 | - | |||||||||
| Purchase of or proceeds from sale of property, plant and equipment | 13,693 | (13,772 | ) | (29,301 | ) | |||||||
| Redemption of short-term investments | 6,068,564 | - | 5,205,562 | |||||||||
| Net cash generated from investing activities | 4,822,688 | 2,583,260 | 5,977,656 | |||||||||
| Financing activities | ||||||||||||
| Advance from non-controlling interest shareholders | - | 258,471 | 159,417 | |||||||||
| Proceeds from stock option exercises | 17,290 | 73,333 | - | |||||||||
| Advance from Minco Silver Corporation | - | - | 1,300,000 | |||||||||
| Net cash generated from financing activities | 17,290 | 331,804 | 1,459,417 | |||||||||
| Effect of exchange rate changes on cash and cash equivalents | 387,994 | 125,765 | 141,175 | |||||||||
| Increase in cash and cash equivalents | 3,476,631 | 319,229 | 1,534,755 | |||||||||
| Cash and cash equivalents- Beginning of year | 2,117,038 | 1,797,809 | 263,054 | |||||||||
| Cash and cash equivalents - End of year | 5,593,669 | 2,117,038 | 1,797,809 | |||||||||
| Cash paid for income tax | - | - | - | |||||||||
The accompanying notes are an integral part of these consolidated financial statements.
MINCO GOLD CORPORATION
(An exploration stage enterprise)
Notes to the Consolidated Financial Statements
For the years ended December 31, 2015, 2014, and 2013
(in Canadian dollars)
| 1. | General information and significant transaction with Minco Silver |
Minco Gold Corporation ("Minco Gold" or the "Company") was incorporated in 1982 under the laws of British Columbia, Canada as Cap Rock Energy Ltd. The Company changed its name to Minco Gold in 2007. The Company is an exploration stage enterprise engaged in exploration and evaluation of gold-dominant mineral properties and projects. After the disposition of properties in China, the Company is currently review mineral properties of merit. The registered office of the Company is 2772 – 1055 West Georgia Street, British Columbia, Canada. The Company has listed its common shares on the Toronto Stock Exchange ("TSX") under the symbol "MMM", and the NYSE MKT under the symbol "MGH".
As at December 31, 2015, Minco Gold owned a 18.45% (December 31, 2014 – 18.45%) equity interest in Minco Silver Corporation ("Minco Silver"), which is accounted for as a significantly influenced investment in an associate. Minco Silver was incorporated in British Columbia, Canada and its Common Shares are listed on the Toronto Stock Exchange ("TSX") and trades under the symbol "MSV".
On May 22, 2015, the Company entered into the share purchase agreement ("SPA") with Minco Silver and Minco Silver's wholly-owned subsidiary, Minco Investment Holding HK Ltd. ("Minco Investment"). Pursuant to the SPA, the Company sold all of the issued and outstanding shares of its wholly-owned subsidiary, Minco Resources Limited ("Minco Resources"), which held interests in Minco Mining (China) Corporation ("Minco China") to Minco Investment. Minco China consolidated certain subsidiaries including Yuanling Minco Mining Ltd. ("Yuanling Minco"), Tibet Minco Mining Co. Ltd. ("Tibet Minco"), Huaihua Tiancheng Mining Ltd. ("Huanihua Tiancheng"), a legal ownership of Foshan Minco Mining Co. Ltd. ("Foshan Minco") and a 51% interest in Guangdong Mingzhong Mining Co. Ltd. ("Mingzhong"), which owned the Changkeng Gold Project. With the disposal of Minco Resources (and indirectly, the Company's ownership of Minco China), the trust agreement related to the funding of the Fuwan Project was eliminated (note 15).
The selling price was $13,716,397, net of other adjustment of $15,863. In accordance with the SPA, $3,700,000 of the sales price was applied to settle outstanding amounts due from the Company to Minco Silver. This sale transaction was completed on July 31, 2015.
The Company has calculated a gain of $18,467,407 on the sale, based on the consideration received of $13,716,397 and the negative carrying value of its investment in the net assets of Minco Resources in the amount of $4,340,686. This resulted in a total gain of $18,057,083, which was reduced by $69,000 to account for the transaction cost and further adjusted to include the reclassification of cumulative translation adjustments of $479,324 relating to the disposed of entity. The negative carrying value of the net assets sold also includes a non-controlling interest of $4,984,949, which relates to the 49% interest of Mingzhong that was not owned by the Company. Due to Minco Gold's 18.45% ownership in Minco Silver, an unrealised gain in the amount of $3,407,237 was recorded as a reduction of Minco Gold's equity investment in Minco Silver and the remaining amount resulted in a realised gain of $15,060,170 recorded in net income.
Three assets have been retained by the Company including the contingent receivable from a legal settlement with 208 Team and the Gold Bull Mountain and Longnan exploration permits.
Minco Gold has entered into a trust agreement with Minco Silver and Minco China where Minco China holds the above retained assets in trust for Minco Gold.
The majority of the consideration was received in the form of a short-term investment (note 6) and net cash out flow of $1,354,041 as result of the transaction mainly represented cash balances within the entities sold.
10
MINCO GOLD CORPORATION
(An exploration stage enterprise)
Notes to the Consolidated Financial Statements
For the years ended December 31, 2015, 2014, and 2013
(in Canadian dollars)
| 2. | Basis of preparation |
These consolidated financial statements have been prepared in compliance with International Financial Reporting Standards ("IFRS") as issued by the International Accounting Standards Board ("IASB").
These financial statements were approved by the board of directors for issue on March 31, 2016.
| 3. | Summary of significant accounting policies |
Basis of measurement
The consolidated financial statements have been prepared under the historical cost convention.
Consolidation
The consolidated financial statements include the accounts of Minco Gold, and through to July 31, 2015, as described in Note 1, its wholly-owned Chinese subsidiaries Minco Mining (China) Corporation ("Minco China"), Yuanling Minco Mining Ltd. ("Yuanling Minco"), Tibet Minco Mining Co. Ltd. ("Tibet Minco") and Huaihua Tiancheng Mining Ltd. ("Huaihua Tiancheng"); its wholly owned Hong Kong subsidiary Minco Resources Limited ("Minco Resources") and its 51% interest in Guangzhou Mingzhong Mining Co., Ltd. ("Mingzhong").
Information about the Company's holding in its former subsidiaries:
| Name | Principal activities (ownership interest) | Country of Incorporation | |||
| Minco China | Exploring and evaluating mineral properties (100%) | China | |||
| Yuanling Minco | Exploring and evaluating mineral properties (100%) | China | |||
| Tibet Minco | Exploring and evaluating mineral properties (100%) | China | |||
| Huaihua Tiancheng | Exploring and evaluating mineral properties (100%) | China | |||
| Minco Resources | Holding company (100%) | China | |||
| Mingzhong | Exploring and evaluating mineral properties (51%) | China | |||
Subsidiaries are all entities (including structured entities) over which the group has control. The group controls an entity when the group is exposed to, or has rights to, variable returns from its involvement with the entity and has the ability to affect those returns through its power over the entity. Subsidiaries are fully consolidated from the date on which control is transferred to the group. They are deconsolidated from the
date that control ceases.
date that control ceases.
11
MINCO GOLD CORPORATION
(An exploration stage enterprise)
Notes to the Consolidated Financial Statements
For the years ended December 31, 2015, 2014, and 2013
(in Canadian dollars)
| 3. | Summary of significant accounting policies (continued) |
Foreign currency translation
(i) Functional and presentation currency
The financial statements of each entity in the group are measured using the currency of the primary economic environment in which the entity operates (the "functional currency"). The consolidated financial statements are presented in Canadian dollars.
The functional currency of Minco Gold is the Canadian dollar.
The functional currency of the Company's Chinese subsidiaries, disposed of in the year, was Renminbi ("RMB").
The financial statements of the Company's Chinese subsidiaries ("foreign operations"), prior to the disposal, were translated into the Canadian dollar presentation currency as follows:
| · | Assets and liabilities – at the closing rate at the date of the statement of financial position |
| · | Income and expenses – at the average rate of the period (as this is considered a reasonable approximation of actual rates) |
All resulting changes are recognized in other comprehensive income as cumulative translation adjustments. When the settlement of a monetary item receivable from or payable to a foreign operation is neither planned nor likely in the foreseeable future, foreign exchange gains and losses arising from the item are considered to form part of the net investment in a foreign operation and are recognized in other comprehensive income.
When an entity disposes of its entire interest in a foreign operation, or loses control, joint control, or significant influence over a foreign operation, the foreign currency gains or losses accumulated in other comprehensive income related to the foreign operation are recognized in profit or loss. If an entity disposes of part of an interest in a foreign operation which remains a subsidiary, a proportionate amount of foreign currency gains or losses accumulated in other comprehensive income related to the subsidiary are reallocated between controlling and non-controlling interests.
(ii) Transactions and balances
Foreign currency transactions are translated into the functional currency of an entity using the exchange rates prevailing at the dates of the transactions. Generally, foreign exchange gains and losses resulting from the settlement of foreign currency transactions and from the translation at year-end exchange rates of monetary assets and liabilities denominated in currencies other than an operation's functional currency are recognized in the statements of income (loss).
Financial instruments
Financial assets and liabilities are recognized when the Company becomes a party to the contractual provisions of the instrument. Financial assets are derecognized when the rights to receive cash flows from the assets have expired or have been transferred and the Company has transferred substantially all risks and rewards of ownership.
13
MINCO GOLD CORPORATION
(An exploration stage enterprise)
Notes to the Consolidated Financial Statements
For the years ended December 31, 2015, 2014, and 2013
(in Canadian dollars)
3. Summary of significant accounting policies (continued)
Impairment losses on financial assets carried at amortized cost and available-for-sale debt instruments are reversed in subsequent periods if the amount of the loss decreases and the decrease can be related objectively to an event occurring after the impairment was recognized.
Property, plant and equipment
Property, plant and equipment are stated at cost less accumulated depreciation and accumulated impairment losses. Cost includes expenditures that are directly attributable to the acquisition of the asset. Subsequent costs are included in the asset's carrying amount or recognized as a separate asset, as appropriate, only when it is probable that future economic benefits associated with the item will flow to the Company and the cost can be measured reliably. Repairs and maintenance costs are charged to the statement of income during the period which they are incurred.
The major categories of property, plant and equipment are depreciated on a straight-line basis as follows:
Leasehold Improvements | remaining lease term |
| Mining Equipment | 5 years |
| Motor Vehicles | 10 years |
| Office Equipment and Furniture | 5 years |
The Company allocates the amount initially recognized in respect of an item of property, plant and equipment to its significant parts and depreciates separately each such part. The carrying amount of a replaced asset is derecognized when replaced. Residual values, method of amortization and useful lives of the assets are reviewed annually and adjusted if appropriate.
Gains and losses on disposals of property, plant and equipment are determined by comparing the proceeds with the carrying amount of the asset and are included as part of other gains and losses in the statement of income.
Exploration and evaluation costs
Exploration and evaluation costs include costs to acquire exploration rights, geological studies, exploratory drilling and sampling and directly attributable administrative costs.
Exploration and evaluation costs relating to non-specific projects or properties or those incurred before the Company has obtained legal rights to explore an area are expensed in the period incurred. In addition, exploration and evaluation costs, other than direct acquisition costs, are expensed before a mineral resource is identified as having economic potential.
Exploration and evaluation costs are capitalized as mineral interests when a mineral resource is identified as having economic potential on a property. A mineral resource is considered to have economic potential when it is expected that documented resources can be legally and economically developed considering long-term metal prices. Therefore, prior to capitalizing such costs, management determines that the following conditions have been met:
i) There is a probable future benefit that will contribute to future cash inflows;
ii) The Company can obtain the benefit and control access to it; and
iii) The transaction or event giving rise to the benefit has already occurred.
15
MINCO GOLD CORPORATION
(An exploration stage enterprise)
Notes to the Consolidated Financial Statements
For the years ended December 31, 2015, 2014, and 2013
(in Canadian dollars)
| 4. | Critical accounting estimates and judgments |
The preparation of financial statements requires management to use judgment in applying its accounting policies and estimates and assumptions about the future. Estimates and other judgments are continuously evaluated and are based on management's experience and other factors, including expectations about future events that are believed to be reasonable in the circumstances. The following discusses the most significant accounting judgments and estimates that the Company has made in the preparation of the financial statements:
Significant Influence of Minco Silver
Management has assessed the level of influence that the Company has on Minco Silver and determined that it has significant influence even though its shareholding, beginning on April 22, 2014 is below 20%. This is because of the representation on Minco Silver's board, common CEO and other shared management.
Impairment
At each reporting date, management conducts a review to determine whether there is any objective evidence that the investment in associate is impaired. This determination requires significant judgment. In making this judgment, management evaluates among other factors, the movements in the trading share price of Minco Silver and other commercial activities impacting Minco Silver.
If objective evidence of impairment exists, then the Company recognizes an impairment loss in the statement of income (loss) to the extent that the estimated recoverable amount is less than the carrying value.
As at December 31, 2015, management evaluated its equity investment in Minco Silver for indications that the impairment loss that had been recognized in the first quarter of fiscal 2015 either no longer existed or had decreased. The company concluded that due to the positive developments in Minco Silver, which included the acquisition of Minco Resources and the related activities associated with the Changkeng project, accompanied by a corresponding increase in the market value of Minco Silver's share price, that there were indicators that impairment loss had reversed. As a result, management estimated the recoverable amount and reversed the previously recognized impairment.
| 5. | Cash and cash equivalents |
Cash and cash equivalents comprise cash at banks and on hand and guaranteed investment certificates with initial maturities of less than three months. As at December 31, 2015, cash and cash equivalents consisted solely of cash at banks and on hand of $5,593,669 which includes $5,557,926 (USD $4,007,446) denominated in USD (December 31, 2014 - $2,117,038 (USD $1,820,182)). The company did not hold any cash equivalents.
| 6. | Short-term investment |
On July 31, 2015, the Company received short-term investments in the amount of $10,116,905 from Minco Silver, as consideration for the sale of Minco Resources and its subsidiaries. During the year, the Company redeemed $6,068,564 of the short-term investment received. As at December 31, 2015, short-term investments consist of $4,048,341 cashable guaranteed investment certificates, with maturity of one year on December 28, 2016. The yield on this investment is 1.4%.
18
MINCO GOLD CORPORATION
(An exploration stage enterprise)
Notes to the Consolidated Financial Statements
For the years ended December 31, 2015, 2014, and 2013
(in Canadian dollars)
Leasehold improvements | Mining equipment | Motorvehicles | Office equipment and furniture | Total | |
| $ | $ | $ | $ | $ | |
Year ended December 31, 2014 | |||||
| At January 1, 2014 | 19,012 | 67,710 | 87,299 | 3,922 | 177,943 |
| Additions | - | - | - | 14,203 | 14,203 |
| Depreciation | (12,446) | (20,128) | (25,815) | (8,791) | (67,180) |
| Impairment loss | - | (8,784) | - | - | (8,784) |
| Exchange differences | - | 2,240 | 6,076 | 800 | 9,116 |
| At December 31, 2014 | 6,566 | 41,038 | 67,560 | 10,134 | 125,298 |
At December 31, 2014 | |||||
| Cost | 95,628 | 433,109 | 352,074 | 408,965 | 1,289,776 |
| Accumulated depreciation | (89,062) | (392,071) | (284,514) | (398,831) | (1,164,478) |
| Net book value | 6,566 | 41,038 | 67,560 | 10,134 | 125,298 |
Year ended December 31, 2015 | |||||
| At January 1, 2015 | 6,566 | 41,038 | 67,560 | 10,134 | 125,298 |
| Additions | - | - | - | 1,300 | 1,300 |
| Disposals | - | (34,223) | (62,631) | (17,330) | (114,184) |
| Depreciation | (6,566) | (8,839) | (12,240) | (7,136) | (34,781) |
| Exchange differences | - | 2,024 | 7,311 | 23,460 | 32,795 |
| At December 31, 2015 | - | - | - | 10,428 | 10,428 |
| Cost | 95,628 | 400,910 | 296,754 | 416,395 | 1,209,687 |
| Accumulated depreciation | (95,628) | (400,910) | (296,754) | (405,967) | (1,199,259) |
| Net book value | - | - | - | 10,428 | 10,428 |
19
MINCO GOLD CORPORATION
(An exploration stage enterprise)
Notes to the Consolidated Financial Statements
For the years ended December 31, 2015, 2014, and 2013
(in Canadian dollars)
8. Mineral interests
a) Guangdong - Changkeng
Minco China and Tibet Minco, wholly owned subsidiaries of Minco China, are the controlling shareholders in Mingzhong with a 51% interest collectively.
Mingzhong signed an exploration permit transfer agreement with No. 757 Exploration Team of Guangdong Geological Bureau ("757 Exploration Team") and on January 5, 2008 Mingzhong received the Changkeng exploration permit (the "Changkeng Exploration Permit"). This exploration permit expires September 10, 2017.
To acquire the Changkeng Exploration Permit, Mingzhong was required to pay RMB 48 million ($8.15 million). As at December 31, 2008, the first payment for the Changkeng Exploration Permit to 757 Exploration Team was made in an amount of RMB 19 million ($3.22 million). The remaining balance of RMB 29 million ($4.92 million) was settled in May 2013. According to a Supplementary Agreement signed between 757 Exploration Team and Mingzhong, 757 Exploration Team agreed to refund RMB 3.8 million ($622,293) to Mingzhong for certain exploration costs incurred during the early stages of the Changkeng project. The refunded amount was recorded as an exploration cost recovery during the year ended December 31, 2013. On July 31, 2013, Mingzhong paid RMB 1.03 million ($169,669) to 757 Exploration Team for the completed hydro-geological program on the Changkeng Gold Project.
On July 31, 2015, the Company's equity investment, Minco Silver, completed the purchase of the Company's subsidiaries that control the 51% interest of Mingzhong (note 1).
b) Gansu - Longnan
Following the transaction in the year with Minco Silver, Minco China holds nine exploration permits in trust for the Company in the Longnan region of south Gansu province in China. The Longnan region is within the southwest Qinling gold field. The Longnan region consists of three projects according to their geographic distribution, type and potential of mineralization:
| i) | Yangshan: including four exploration permits located in the northeast extension of the Yangshan gold belt and its adjacent area; |
| ii) | Yejiaba: including four exploration permits adjacent to the Guojiagou exploration permit; and |
| iii) | Xicheng East: including one exploration permit to the east extension of the Xicheng Pb-Zn mineralization belt. |
The Company has spent a cumulative total of $12.4 million on exploration costs on the Longnan project as at December 31, 2015 (December 31, 2014 - $11.7 million).
On December 13, 2013, Minco China entered into an agreement with Gansu Yuandong Investment Co., Ltd ("YDIC") in which the Company agreed to sell two exploration permits in the Xicheng East and Yejiaba area to YDIC for RMB 0.8 million ($170,973. The process of transferring the titles to the two permits to YDIC was pending approval by Gansu province and the proceeds were not received as at December 31, 2015.
20
MINCO GOLD CORPORATION
(An exploration stage enterprise)
Notes to the Consolidated Financial Statements
For the years ended December 31, 2015, 2014, and 2013
(in Canadian dollars)
8. Mineral interests (continued)
On December 26, 2014, Minco China entered into an agreement with Beijing Runlong Investment Limited Company ("Beijing Runlong") in which the Company agreed to sell four exploration permits in the Yangshan area to Beijing Runlong for total cash proceeds of RMB 3,200,000 ($604,618). The process of transferring the titles to the four permits to Beijing Runlong was pending approval by Gansu province and the proceeds were not received as at December 31, 2015. The Company did not record any receivable due to the uncertainty of collectability.
Beijing Runlong must make the following payments to Minco China:
| i) | 5% of the total cash proceeds within 20 working days from the date of signing the agreement (not received) |
| ii) | 45% of the total cash proceeds upon receiving the approval of the transfer from the Provincial land and resources administrative authority, before submitting to the Ministry of Land and Resources (not received); and |
| iii) | 50% of the total cash proceeds within 5 days upon receiving the approved exploration rights license (not received). |
c) Hunan - Gold Bull Mountain
Minco China's wholly owned subsidiary Yuanling Minco owns the Gold Bull Mountain Exploration permit. Following the transaction in the year with Minco Silver, Minco China through Yuanling Minco holds the Gold Bull Mountain exploration permit, which expires on June 28, 2017, in trust for the Company.
The following is a summary of exploration costs, net of recoveries, incurred by each project:
| Cumulative to | ||||||||||||||||
| December 31, | December 31, | December 31, | December 31, | |||||||||||||
| 2015 | 2014 | 2013 | 2015 | |||||||||||||
| $ | $ | $ | $ | |||||||||||||
| Currently active properties: | ||||||||||||||||
| Gansu | ||||||||||||||||
| - Longnan | 626,815 | 894,646 | 1,262,074 | 12,367,711 | ||||||||||||
| Guangdong | ||||||||||||||||
| - Changkeng | 122,652 | 244,784 | (361,010 | ) | 8,285,703 | |||||||||||
| Hunan | ||||||||||||||||
| - Gold Bull Mountain | 43,508 | 36,862 | 24,031 | 2,316,611 | ||||||||||||
| Guangdong | ||||||||||||||||
| - Sihui | 106 | 1,525 | 2,863 | 6,099 | ||||||||||||
| Total | 793,081 | 1,177,817 | 927,958 | 22,976,125 | ||||||||||||
21
MINCO GOLD CORPORATION
(An exploration stage enterprise)
Notes to the Consolidated Financial Statements
For the years ended December 31, 2015, 2014, and 2013
(in Canadian dollars)
MINCO GOLD CORPORATION
(An exploration stage enterprise)
Notes to the Consolidated Financial Statements
For the years ended December 31, 2015, 2014, and 2013
(in Canadian dollars)
| 9. | Equity investment in Minco Silver Corporation (continued) |
The following is a summary of Minco Silver's balance sheet and reconciliation to carrying amounts as at December 31, 2015 and 2014:
| December 31, | December 31, | |||||||
| 2015 | 2014 | |||||||
| $ | $ | |||||||
Cash and cash equivalents | 26,202,564 | 11,938,544 | ||||||
Other current assets | 33,039,404 | 48,582,255 | ||||||
| Mineral interests | 63,676,055 | 31,621,827 | ||||||
| Property, plant and equipment | 434,999 | 422,012 | ||||||
| Current liabilities | 638,549 | 419,592 | ||||||
| Shareholders' equity | 122,714,472 | 92,145,046 | ||||||
| Reconciliation to carrying amounts: | ||||||||
| Minco Gold's share in percentage | 18.45 | % | 18.45 | % | ||||
| Minco Gold's share of net assets of Minco Silver | 22,640,820 | 17,000,761 | ||||||
| Differences between Minco Gold's share and carrying value | (16,009,726 | ) | (10,180,761 | ) | ||||
| Carrying value of investment in Minco Silver | 6,631,094 | 6,820,000 | ||||||
The following is a summary of Minco Silver's income statement for the years ended December 31, 2015, 2014, and 2013:
For the year ended December 31, | For the year ended December 31, | For the year ended December 31, | ||||||||||
| 2015 | 2014 | 2013 | ||||||||||
| $ | $ | $ | ||||||||||
Administrative recovery (expenses) | 1,368,238 | (2,336,876 | ) | (3,458,998 | ) | |||||||
| Interest income | 911,213 | 980,945 | 806,038 | |||||||||
| Net income (loss) for the year | 6,680,947 | (1,665,516 | ) | (2,987,033 | ) | |||||||
| Other comprehensive income for the year | ||||||||||||
- Shareholders of the Company | 10,619,461 | 470,514 | 3,309,545 | |||||||||
- Non-controlling interest | 232,071 | - | - | |||||||||
| Comprehensive income (loss) for the year | 17,532,479 | (1,195,002 | ) | 322,512 | ||||||||
23
MINCO GOLD CORPORATION
(An exploration stage enterprise)
Notes to the Consolidated Financial Statements
For the years ended December 31, 2015, 2014, and 2013
(in Canadian dollars)
| 10. | Gain on legal settlement |
On December 16, 2010, Minco China entered into an agreement with the 208 Team, a subsidiary of China National Nuclear Corporation, to acquire a 51% equity interest in the Tugurige Gold Project located in Inner Mongolia, China (the "Agreement"). The 208 Team did not comply with certain of its obligations under the Agreement, including its obligation to set up a new entity (the "JV Co") and the transfer of its 100% interest in the Tugurige Gold Project to the JV Co. As a result, Minco China commenced legal action in China seeking compensation.
On March 25, 2013, Minco China settled its claim against the 208 Team relating to the Agreement for an amount of RMB 14 million ($2.4 million). Minco China received RMB 5 million ($801,395) during 2013 and recognized a receivable of RMB 4 million ($699,688) as at December 31, 2013. The Company received RMB 4 million ($720,095) in January 2014.
On January 4, 2015, Minco China engaged a Chinese law firm to recommence legal action against 208 Team to recover the remaining RMB 5 million ($1,014,734) unpaid balance on a contingent fee basis whereby the Company will pay the Chinese law firm 50% of the net amount recovered.
On May 6, 2015, Minco China reached an agreement to settle its claim against the 208 Team for an amount of RMB 5.5 million ($1,138,472). The payments were to be received in following manner:
On the signing date of the agreement- RMB 500,000 ($98,940) (received on May 7, 2015)
On or before June 17, 2015- RMB 2,000,000 ($405,894) (outstanding)
On or before August 7, 2015- RMB 3,000,000 ($608,840) (outstanding)
As at December 31, 2015, Minco China had received RMB 500,000 ($98,941). Minco China recognized a net gain on the legal settlement of RMB 250,000 ($51,745) which represents the net proceeds from the initial payment after remittance of 50% of the payment under the contingent fee arrangement with the Chinese law firm. The remaining RMB 5 million ($1,014,734) balance due to be paid under the legal settlement has not been settled and therefore, has not been recognized as an asset as at December 31, 2015 due to the uncertainty of collectability of amount owing under the settlement agreement. Minco China, which is no longer a wholly-owned consolidated subsidiary of Minco Gold, advises that they have recommenced legal action in China seeking compensation.
24
MINCO GOLD CORPORATION
(An exploration stage enterprise)
Notes to the Consolidated Financial Statements
For the years ended December 31, 2015, 2014, and 2013
(in Canadian dollars)
| 11. | Non-controlling interest |
Below is summarized financial information for Mingzhong, the Company's 51% formerly owned indirect subsidiary. The amounts disclosed are based on those included in the consolidated financial statement before inter-company eliminations.
Summarized statement for financial position
| December 31, | December 31, | |||||||
| 2015 | 2014 | |||||||
| $ | $ | |||||||
| NCI percentage | 49 | % | 49 | % | ||||
| Current assets | - | 1,234,149 | ||||||
| Current liabilities | - | (1,321,620 | ) | |||||
| - | (87,471 | ) | ||||||
| Non-current asset | - | 37,384 | ||||||
| Net assets | - | 50,087 | ||||||
| Accumulated non-controlling interests | - | 4,988,512 | ||||||
Summarized income statement
Period from January 1 to July 31, | For the year-ended December 31, | |||||||
| 2015 | 2014 | |||||||
| $ | $ | |||||||
| Net loss | (101,050 | ) | (290,477 | ) | ||||
| Other comprehensive income | 75,966 | 16,226 | ||||||
| Total comprehensive loss | (25,084 | ) | (274,251 | ) | ||||
| Loss allocated to NCI | (40,786 | ) | (143,632 | ) | ||||
Summarized cash flows
Period from January 1 to July 31, | For the year-ended December 31, | |||||||
| 2015 | 2014 | |||||||
| $ | $ | |||||||
| Cash flows from operating activities | (86,455 | ) | (279,873 | ) | ||||
| Cash flows from financing activities | - | 603,100 | ||||||
| Effect of exchange rate changes on cash | 37,233 | 82,790 | ||||||
25
MINCO GOLD CORPORATION
(An exploration stage enterprise)
Notes to the Consolidated Financial Statements
For the years ended December 31, 2015, 2014, and 2013
(in Canadian dollars)
| 12. | Share capital |
| a. | Common shares |
Authorized: 100,000,000 common shares without par value
| b. | Stock options |
Minco Gold may grant options to its directors, officers, employees and consultants under its stock option plan (the "Stock Option Plan"). The Company's board of directors grants such options for periods of up to five years, with vesting periods determined at its sole discretion and at prices equal to or greater than the closing market price on the day preceding the date the options are granted. These options are equity-settled.
For the year ended December 31, 2015, the Company granted stock options for 1,190,000 common shares to various employees, consultants and directors at a weighted exercise price of $0.24 per common share that vest over an 18-month period from the issuance date.
The maximum number of common shares reserved for issuance under the Stock Option Plan is 15% of the issued and outstanding common shares of the Company.
Minco Gold recorded $80,248 in share-based compensation expense for the year ended December 31, 2015 (December 31, 2014 - $297,588, December 31, 2013 - $993,331).
A summary of the options outstanding is as follows:
| Number outstanding | Weighted average exercise price | |||||||
| $ | ||||||||
| January 1, 2014 | 6,853,167 | 0.86 | ||||||
| Granted | 1,270,000 | 0.26 | ||||||
| Forfeited | (166,666 | ) | 0.44 | |||||
| Cancelled | (836,000 | ) | 0.94 | |||||
| Expired | (660,000 | ) | 0.48 | |||||
| Balance, December 31, 2014 | 6,460,501 | 0.79 | ||||||
| Granted | 1,190,000 | 0.24 | ||||||
| Exercised | (66,500 | ) | 0.26 | |||||
| Forfeited | (927,500 | ) | 0.55 | |||||
| Expired | (66,667 | ) | 0.93 | |||||
| Balance, December 31, 2015 | 6,589,834 | 0.72 | ||||||
26
MINCO GOLD CORPORATION
(An exploration stage enterprise)
Notes to the Consolidated Financial Statements
For the years ended December 31, 2015, 2014, and 2013
(in Canadian dollars)
| 12. | Share capital (continued) |
The weighted average share price on the date of exercise was $0.30 in 2015 (2014 - $0.56, 2013 - $Nil). As at December 31, 2015, there was $83,716 (2014: $24,854) of total unrecognized compensation cost relating to unvested stock options.
| Options outstanding | Options exercisable | |||||||||||
Range of exercise prices | Number outstanding | Weighted average remaining contractual life (years) | Weighted average exercise price | Number exercisable | Weighted average exercise price | |||||||
$ | $ | $ | ||||||||||
0.18 – 0.44 | 2,072,334 | 3.88 | 0.25 | 1,032,334 | 0.26 | |||||||
0.45 – 0.54 | 2,125,000 | 1.99 | 0.46 | 2,125,000 | 0.46 | |||||||
0.55 – 0.93 | 1,270,000 | 1.24 | 0.67 | 1,270,000 | 0.67 | |||||||
0.94 – 2.59 | 1,122,500 | 0.04 | 2.17 | 1,122,500 | 2.17 | |||||||
6,589,834 | 2.11 | 0.72 | 5,549,834 | 0.81 | ||||||||
The Company uses the Black-Scholes option pricing model to determine the fair value of the options with the following assumptions:
| 2015 | 2014 | 2013 | |
| Risk-free interest rate | 0.78% - 1.68% | 1.27% -1.68% | 1.40% - 1.55% |
| Dividend yield | 0% | 0% | 0% |
| Volatility | 85% - 87% | 87% - 89% | 86% - 91% |
| Forfeiture rate | 23% | 23% | 24% |
| Estimated expected lives | 5 years | 5 years | 5 years |
Option pricing models require the use of subjective estimates and assumptions including the expected stock price volatility. The stock price volatility is calculated based on the Company's historical volatility. Changes in the underlying assumptions can materially affect the fair value estimates.
27
MINCO GOLD CORPORATION
(An exploration stage enterprise)
Notes to the Consolidated Financial Statements
For the years ended December 31, 2015, 2014, and 2013
(in Canadian dollars)
| 13. | Income tax |
Income tax expense differs from the amount that would result from applying the Canadian federal and provincial income tax rates to the loss before income taxes. These differences result from the following items:
| 2015 | 2014 | 2013 | ||||||||||
| $ | $ | $ | ||||||||||
| Net income (loss) | 14,320,556 | (7,497,794 | ) | (2,943,305 | ) | |||||||
| 26 | % | 26 | % | 25.75 | % | |||||||
| Income tax recovery at statutory rates | 3,723,345 | (1,949,427 | ) | (757,901 | ) | |||||||
| Non-taxable (deductible) expenses | 19,159 | (431,590 | ) | (314,072 | ) | |||||||
| Difference in tax rates | 1,093,732 | 20,291 | (92,885 | ) | ||||||||
| Difference in gain on disposition of Minco Resources | (6,662,076 | ) | - | - | ||||||||
| Reduction of tax attributes from sale of Minco Resources | 6,668,881 | - | - | |||||||||
| Expiry of non-capital loss carry forward | 300,755 | 279,602 | 87,867 | |||||||||
| Deferred income tax asset not recognized | (5,252,629 | ) | 1,664,315 | 1,054,613 | ||||||||
| Other | 108,833 | 416,809 | 22,378 | |||||||||
| Provision for tax expenses | - | - | - | |||||||||
Deferred income taxes arise from temporary differences in the recognition of income and expenses for financial reporting and tax purposes. The significant components of unrecognized deferred income tax assets and liabilities at December 31, 2015 and 2014 are as follows:
| 2015 | 2014 | |||||||
| $ | $ | |||||||
| Deferred income tax assets (liabilities) not recognized | ||||||||
| Non-capital loss | 3,536,062 | 6,397,642 | ||||||
| Resource expenditures | 701,784 | 4,285,187 | ||||||
| Capital assets | 50,671 | 69,672 | ||||||
| Investment in Minco Silver | (375,488 | ) | (400,045 | ) | ||||
| Capital loss | 1,070,899 | 393,426 | ||||||
| 4,983,929 | 10,745,882 | |||||||
No deferred income tax asset has been recognized as realization is not considered probable due to the uncertainty of future taxable income.
28
MINCO GOLD CORPORATION
(An exploration stage enterprise)
Notes to the Consolidated Financial Statements
For the years ended December 31, 2015, 2014, and 2013
(in Canadian dollars)
13. Income tax (continued)
The Company has approximately $13,600,240 of operating losses in Canada. The expiries for Canadian non-capital loss carry forwards are as follows:
| $ | ||||
| 2026 | 1,442,234 | |||
| 2028 | 1,582,716 | |||
| 2029 | 1,270,045 | |||
| 2030 | 1,285,615 | |||
| 2031 | 1,933,078 | |||
| 2032 | 2,131,656 | |||
| 2033 | 1,535,838 | |||
| 2034 | 1,329,782 | |||
| 2035 | 1,089,276 | |||
| 13,600,240 |
14. Commitments
The Company has commitments in respect of office leases requiring minimum payments (including a share of operating costs) of $485,065 as follows:
| $ | ||||
| 2016 | 207,885 | |||
| 2017 | 207,885 | |||
| 2018 | 69,295 | |||
485,065 |
The above lease commitment is related to a Vancouver office that is shared by Minco Silver and Minco Base Metal Corporation (Note 15). The Company has a contract to recover 70% of these lease payments from Minco Silver and Minco Base Metal Corporation.
| 15. | Related party transactions |
Funding of Foshan Minco
Up to July 31, 2015, Minco Silver could not invest directly in Foshan Minco as Foshan Minco is legally owned by Minco China. All historical funding supplied by Minco Silver for exploration of the Fuwan Project must first go through Minco China via the Company and Minco Resources to comply with Chinese Law. In the normal course of business Minco Silver uses trust agreements when providing cash, denominated in US dollars, to Minco China via the Company and Minco Resources for the purpose of increasing the registered capital of Foshan Minco. Upon completion of the disposal of Minco Resources (note 1), the requirement for the trust structure was eliminated.
29
MINCO GOLD CORPORATION
(An exploration stage enterprise)
Notes to the Consolidated Financial Statements
For the years ended December 31, 2015, 2014, and 2013
(in Canadian dollars)
| 15. | Related party transactions (continued) |
Shared office expenses
| a) | Minco Silver and Minco Gold share offices and certain administrative expenses in Beijing up to July 31, 2015. Minco Silver, Minco Base Metals Corporation ("MBM"), a company with which the Company's CEO has significant influence over, and Minco Gold share offices and certain administrative expenses in Vancouver. |
At December 31, 2015, the Company had $177,330 due to Minco Silver (December 31, 2014 – $3,603,848), representing shared office expenses, and expenses in relation to the Company's remaining assets in China. In 2014, the amount due to Minco Silver consisted of $3,700,000 debt to Minco Silver and $96,152 of shared expenses due from Minco Silver. The $3,700,000 of debt was settled as part of the Company's sale of the Changkeng Gold Project (note 1).
In the year ended December 31, 2015, the Company recovered $101,701 (December 31, 2014 – $124,833, December 31, 2013 - $157,296) in respect of rent and $563,588 (December 31, 2014 – $663,667, December 31, 2013 - $617,044) in respect of shared head office expenses and administration costs from Minco Silver.
| b) | At December 31, 2015, the Company had $12,387 due from MBM (December 31, 2014 - $47,696), in relation to shared office expenses. |
The amounts due are unsecured, non-interest bearing and payable on demand.
Key management compensation
Key management includes the Company's directors and senior management. This compensation is included in exploration costs and administrative expenses.
For the years ended December 31, 2015, 2014 and 2013, the following compensation was paid to key management:
2015 | 2014 | 2013 | ||||||||||
| $ | $ | $ | ||||||||||
Cash remuneration | 333,729 | 270,693 | 341,537 | |||||||||
Share-based compensation | 67,405 | 215,202 | 736,294 | |||||||||
Total | 401,134 | 485,895 | 1,077,831 | |||||||||
The above transactions were conducted in the normal course of business.
30
MINCO GOLD CORPORATION
(An exploration stage enterprise)
Notes to the Consolidated Financial Statements
For the years ended December 31, 2015, 2014, and 2013
(in Canadian dollars)
| 16. | Geographical information |
The Company's business of exploration and development of mineral interests is considered as operating in one segment. The geographical division of the Company's non-current assets is as follows:
| Assets by geography | December 31, 2015 | |||||||||||
| Canada | China | Total | ||||||||||
| $ | $ | $ | ||||||||||
| Non-current assets | 6,692,799 | - | 6,692,799 | |||||||||
| December 31, 2014 | ||||||||||||
| Canada | China | Total | ||||||||||
| $ | $ | $ | ||||||||||
| Non-current assets | 6,888,410 | 108,165 | 6,996,575 | |||||||||
| 17. | Financial instruments and fair value |
As explained in Note 3, financial assets and liabilities have been classified into categories that determine their basis of measurement and, for items measured at fair value, whether changes in fair value are recognized in the statement of income or comprehensive income. Those categories are: loans and receivables and other financial liabilities.
The following table summarizes the carrying value of financial assets and liabilities at December 31, 2015 and 2014:
| December 31, | December 31, | |||||||
| 2015 | 2014 | |||||||
| Loans and receivables | $ | $ | ||||||
| Cash | 5,593,669 | 2,117,038 | ||||||
| Short-term investment | 4,048,341 | - | ||||||
| Receivables | 11,122 | 103,175 | ||||||
| Due from related parties | 12,387 | 47,696 | ||||||
| Other Financial Liabilities | ||||||||
| Accounts payables | 405,550 | 311,552 | ||||||
| Advance from non-controlling interest | - | 453,463 | ||||||
| Due to related party | 177,330 | 3,603,848 | ||||||
The carrying value of the Company's loans and receivables and financial liabilities approximate their fair value.
31
MINCO GOLD CORPORATION
(An exploration stage enterprise)
Notes to the Consolidated Financial Statements
For the years ended December 31, 2015, 2014, and 2013
(in Canadian dollars)
| 17. | Financial instruments and fair value (continued) |
Fair value measurement
Financial assets and liabilities that are recognized on the balance sheet at fair value can be classified in a hierarchy that is based on the significance of the inputs used in making the measurements. The levels in the hierarchy are:
Level 1 - quoted prices (unadjusted) in active markets for identical assets or liabilities;
Level 2 - inputs other than quoted prices included within level 1 that are observable for the asset or liability, either directly (that is, as prices) or indirectly (that is, derived from prices); and
Level 3 - inputs for the asset or liability that are not based on observable market data (that is, unobservable inputs).
Financial instruments that are not measured at fair value on the balance sheet are represented by cash and cash equivalents, short-term investments, receivable, due from related parties, account payable and accrued liabilities, due to related parties, and advance from non-controlling interest. The fair values of these financial instruments approximate their carrying value due to their short-term nature.
Financial risk factors
The company's activities expose it to a variety of financial risks: market risk (including price risk, currency risk and interest rate risk), credit risk and liquidity risk. Risk management activities are carried out by management, who identifies and evaluates the financial risks.
Credit risk
Counterparty credit risk is the risk that the financial benefits of contracts with a specific counterparty will be lost if the counterparty defaults on its obligations under the contract. This includes any cash amounts owed to the Company by these counterparties, less any amounts owed to the counterparty by the Company where a legal right of set-off exists and also includes the fair value contracts with individual counterparties which are recorded in the consolidated financial statements. The Company considers the following financial assets to be exposed to credit risk:
| o | Cash and cash equivalents– In order to manage credit and liquidity risk the Company places its cash with major financial institutions in two major banks in Canada (subject to deposit insurance up to $100,000). As at December 31, 2015, total cash of $5,593,669 was placed with two institutions. |
| o | Short-term investment – The Company places its short-term investment with a major financial institution in a major bank in Canada. As at December 31, 2015, total short-term investment was $4,048,341 (December 31, 2014 - $Nil). |
32
MINCO GOLD CORPORATION
(An exploration stage enterprise)
Notes to the Consolidated Financial Statements
For the years ended December 31, 2015, 2014, and 2013
(in Canadian dollars)
| 17. | Financial instruments and fair value (continued) |
Foreign exchange risk
The Company's functional currency is the Canadian dollar in Canada. The foreign currency risk is related to US dollar funds held in the entity. Therefore the Company's net earnings are impacted by fluctuations in the valuation of the US dollar in relation to the Canadian dollar.
The Company does not hedge its exposure to currency fluctuations. The Company has completed a sensitivity analysis to estimate the impact that a change in foreign exchange rates would have on the net loss of the Company, based on the Company's net US$5.6 million monetary assets as at December 31, 2015. This sensitivity analysis shows that a changed of +/- 10% in US$ foreign exchange rate would have a -/+ US$0.6 million impact on net loss.
Interest rate risk
The effective interest rate on financial liabilities (accounts payable) ranged up to 1%. The interest rate risk is the risk that the fair value of future cash flows of a financial instrument fluctuates because of changes in market interest rates. Cash entered into by the Company bear interest at a fixed rate thus exposing the Company to the risk of changes in fair value arising from interest rate fluctuations. A 1% increase in the interest rate in Canada will have a net (before tax) income effect of $96,000 (2014 - $21,000), assuming the foreign exchange rate remains constant.
| 18. | Capital management |
The Company's objectives in the managing of the liquidity and capital are to safeguard the Company's ability to continue as a going concern and provide the financial capacity to meet its strategic objectives. The capital structure of the Company consists of equity attributable to common shareholders, comprising of issued share capital, common share purchase warrants, contributed surplus, accumulated and other comprehensive income and accumulated deficit.
The Company manages the capital structure and makes adjustments to it in light of changes in economic conditions and the risk characteristics of the underlying assets. To maintain or adjust the capital structure, the Company may attempt to issue new shares, issue new debt and/or acquire or dispose of assets to facilitate the management of its capital requirements. The Company prepares annual expenditure budgets that are updated as necessary depending upon various factors, including successful capital deployment and general industry conditions. As at December 31, 2015, the Company does not have any long-term debt.
33
Minco Gold Corporation
(An exploration stage enterprise)
Condensed Consolidated Interim Financial Statements
For the three and six months ended June 30, 2016 and 2015
(Unaudited, expressed in Canadian dollars, unless otherwise stated)
Index
Page | ||
| Condensed Consolidated Interim Financial Statements | 3 - 7 | |
| Condensed Consolidated Interim Statements of Financial Position | 3 | |
| Condensed Consolidated Interim Statements of Income (Loss) | 4 | |
| Condensed Consolidated Interim Statements of Comprehensive Loss | 5 | |
| Condensed Consolidated Interim Statements of Changes in Equity | 6 | |
| Condensed Consolidated Interim Statements of Cash Flow | 7 | |
| Notes to Condensed Consolidated Interim Financial Statements | 8 - 19 | |
| 1 | General information and liquidity risk | 8 |
| 2 | Basis of preparation | 8 |
| 3 | Critical accounting estimates and judgments | 9 |
| 4 | Cash and cash equivalents | 11 |
| 5 | Short-term investment | 11 |
| 6 | Mineral interests | 11 |
| 7 | Equity investment in Minco Silver Corporation | 12 |
| 8 | Receivable from legal settlement | 15 |
| 9 | Non-controlling interest | 16 |
| 10 | Share capital | 16 |
| 11 | Related party transactions | 18 |
| 12 | Financial instruments | 19 |
Minco Gold Corporation
(An exploration stage enterprise)
Condensed Consolidated Interim Statements of Financial Position
(Unaudited, expressed in Canadian dollars, unless otherwise stated)
| June 30, | December 31, | |||||||
| 2016 | 2015 | |||||||
| Assets | $ | $ | ||||||
| Current assets | ||||||||
| Cash and cash equivalents (note 4) | 4,855,342 | 5,593,669 | ||||||
| Short-term investment (note 5) | 3,818,341 | 4,048,341 | ||||||
| Receivables | 530,017 | 11,122 | ||||||
| Due from related parties (note 11) | 10,658 | 12,387 | ||||||
| Prepaid expenses and deposits | 121,919 | 162,970 | ||||||
| 9,336,277 | 9,828,489 | |||||||
| Long-term deposit | 51,277 | 51,277 | ||||||
| Property, plant and equipment | 8,402 | 10,428 | ||||||
Equity investment in Minco Silver (note 7) | 4,759,072 | 6,631,094 | ||||||
| 14,155,028 | 16,521,288 | |||||||
| Liabilities | ||||||||
| Current liabilities | ||||||||
| Accounts payable and accrued liabilities | 122,738 | 389,522 | ||||||
| Due to related party (note 11) | 270,280 | 177,330 | ||||||
| 393,018 | 566,852 | |||||||
| Equity | ||||||||
| Equity attributable to owners of the parent | ||||||||
| Share capital (note 10(a)) | 41,971,641 | 41,911,823 | ||||||
| Contributed surplus | 9,290,388 | 9,247,685 | ||||||
| Accumulated other comprehensive income | 1,394,719 | 2,763,940 | ||||||
| Deficits | (38,894,738 | ) | (37,969,012 | ) | ||||
| 13,762,010 | 15,954,436 | |||||||
| Total equity | 14,155,028 | 16,521,288 | ||||||
| Subsequent event (note 8) | ||||||||
| Approved by the Board of Directors | ||||||||
(signed) Malcolm Clay Director | (signed) Robert Callander Director |
The accompanying notes are an integral part of these condensed consolidated interim financial statements.
3
Minco Gold Corporation
(An exploration stage enterprise)
Condensed Consolidated Interim Statements of Comprehensive Loss
For the three and six months ended June 30, 2016, and 2015
(Unaudited, expressed in Canadian dollars, unless otherwise stated)
| Three months ended | Six months ended | |||||||||||||||
| June 30, | June 30, | |||||||||||||||
| 2016 | 2015 | 2016 | 2015 | |||||||||||||
| $ | $ | $ | $ | |||||||||||||
Exploration costs (note 6) | 28,770 | 208,905 | 119,768 | 473,839 | ||||||||||||
| Administrative expenses | ||||||||||||||||
| Accounting and audit | 16,543 | 43,272 | 36,115 | 67,417 | ||||||||||||
| Amortization | 1,013 | 13,127 | 2,025 | 29,898 | ||||||||||||
| Consulting | 11,989 | 18,182 | 16,526 | 26,600 | ||||||||||||
| Directors' fees | 13,138 | 10,124 | 27,638 | 29,124 | ||||||||||||
| Investor relations | 529 | 17,699 | 10,956 | 23,482 | ||||||||||||
| Legal and regulatory | 30,595 | 88,001 | 74,011 | 129,165 | ||||||||||||
| Office and miscellaneous | 65,434 | 129,586 | 125,478 | 251,110 | ||||||||||||
| Property investigation | 35,000 | 2,821 | 66,450 | 28,486 | ||||||||||||
| Salaries and benefits | 29,106 | 142,010 | 63,418 | 268,882 | ||||||||||||
| Share-based compensation (note 10(b)) | 23,993 | 11,194 | 66,854 | 24,542 | ||||||||||||
| Travel and transportation | 5,366 | 31,897 | 9,030 | 55,180 | ||||||||||||
| 232,706 | 507,913 | 498,501 | 933,886 | |||||||||||||
| Operating loss | (261,476 | ) | (716,818 | ) | (618,269 | ) | (1,407,725 | ) | ||||||||
| Finance income | 16,060 | 10,092 | 32,622 | 18,251 | ||||||||||||
| Foreign exchange gain (loss) | 15,411 | 5,299 | (326,278 | ) | (17,144 | ) | ||||||||||
| Gain on legal settlement (note 8) | 489,000 | - | 489,000 | 51,745 | ||||||||||||
| Recovery (impairment) of equity investment in Minco Silver (note 7) | - | 295,027 | - | (3,171,647 | ) | |||||||||||
| Share of gain (loss) from equity investment in Minco Silver (note 7) | (46,060 | ) | 674,879 | (435,676 | ) | 958,578 | ||||||||||
| Dilution loss (note 7) | (57,940 | ) | - | (67,125 | ) | - | ||||||||||
| Net income (loss) for the period | 154,995 | 268,479 | (925,726 | ) | (3,567,942 | ) | ||||||||||
| Net income (loss) attributable to: | ||||||||||||||||
| Shareholders of the Company | 154,995 | 278,997 | (925,726 | ) | (3,531,727 | ) | ||||||||||
| Non-controlling interest | - | (10,518 | ) | - | (36,215 | ) | ||||||||||
| 154,995 | 268,479 | (925,726 | ) | (3,567,942 | ) | |||||||||||
| Income (loss) per share | ||||||||||||||||
| Basic and diluted | 0.00 | 0.01 | (0.02 | ) | (0.07 | ) | ||||||||||
Weighted average number of common shares outstanding Basic and diluted | 50,699,843 | 50,581,381 | 50,641,436 | 50,551,875 | ||||||||||||
The accompanying notes are an integral part of these condensed consolidated interim financial statements.
4
Minco Gold Corporation
(An exploration stage enterprise)
Consolidated Statements of Changes in Equity
For the years ended December 31, 2013, 2012 and 2011
(in Canadian dollars)
| Three months ended | Six months ended | |||||||||||||||
| June 30, | June 30, | |||||||||||||||
| 2016 | 2015 | 2016 | 2015 | |||||||||||||
| $ | $ | $ | $ | |||||||||||||
| Net income (loss) for the period | 154,995 | 268,479 | (925,726 | ) | (3,567,942 | ) | ||||||||||
| Other comprehensive income (loss) | ||||||||||||||||
| Items that may be reclassified subsequently to profit or loss: | ||||||||||||||||
| Share of other comprehensive income (loss) of investments accounted for using the equity method | - | (529,906 | ) | - | 1,223,069 | |||||||||||
| Exchange differences on translation from functional to presentation currency | (445,845 | ) | (28,063 | ) | (1,369,221 | ) | 107,935 | |||||||||
| Total comprehensive loss for the period | (290,850 | ) | (289,490 | ) | (2,294,947 | ) | (2,236,938 | ) | ||||||||
| Comprehensive loss attributable to: | ||||||||||||||||
| Shareholders of the Company | (290,850 | ) | (271,844 | ) | (2,294,947 | ) | (2,226,886 | ) | ||||||||
| Non-controlling interest | - | (17,646 | ) | - | (10,052 | ) | ||||||||||
| (290,850 | ) | (289,490 | ) | (2,294,947 | ) | (2,236,938 | ) | |||||||||
The accompanying notes are an integral part of these condensed consolidated interim financial statements.
5
Minco Gold Corporation
(An exploration stage enterprise)
Condensed Consolidated Interim Statements of Changes in Equity
For the six months ended June 30, 2016, and 2015
(Unaudited, expressed in Canadian dollars, unless otherwise stated)
| Attributable to equity owner of the Company | ||||||||
| Number of shares | Share capital | Contributed surplus | Accumulated other comprehensive income | Deficits | Subtotal | Non-controlling interest | Total equity | |
| $ | $ | $ | $ | $ | $ | $ | ||
| Balance - January 1, 2015 | 50,514,881 | 41,882,757 | 9,179,213 | 1,183,086 | (52,330,354) | (85,298) | 4,988,512 | 4,903,214 |
| Net loss for the period | - | - | - | - | (3,531,727) | (3,531,727) | (36,215) | (3,567,942) |
| Other comprehensive income | - | - | - | 1,304,841 | - | 1,304,841 | 26,163 | 1,331,004 |
| Proceeds on issuance of shares from exercise of options | 46,500 | 29,066 | (11,776) | - | - | 17,290 | - | 17,290 |
| Share-based compensation | - | - | 24,542 | - | - | 24,542 | - | 24,542 |
| Balance – June 30, 2015 | 50,561,381 | 41,911,823 | 9,191,979 | 2,487,927 | (55,862,081) | (2,270,352) | 4,978,460 | 2,708,108 |
Balance - January 1, 2016 | 50,581,381 | 41,911,823 | 9,247,685 | 2,763,940 | (37,969,012) | 15,954,436 | - | 15,954,436 |
| Net loss for the period | - | - | - | - | (925,726) | (925,726) | - | (925,726) |
| Other comprehensive loss | - | - | - | (1,369,221) | - | (1,369,221) | - | (1,369,221) |
| Proceeds on issuance of shares from exercise of options | 140,000 | 59,818 | (24,151) | - | - | 35,667 | - | 35,667 |
| Share-based compensation | - | - | 66,854 | - | - | 66,854 | - | 66,854 |
| Balance – June 30, 2016 | 50,721,381 | 41,971,641 | 9,290,388 | 1,394,719 | (38,894,738) | 13,762,010 | - | 13,762,010 |
The accompanying notes are an integral part of these condensed consolidated interim financial statements.
6
Minco Gold Corporation
(An exploration stage enterprise)
Condensed Consolidated Interim Statements of Cash Flow
For the three and six months ended June 30, 2016, and 2015
(Unaudited, expressed in Canadian dollars, unless otherwise stated)
| Six months ended June 30, | ||||||||
| 2016 | 2015 | |||||||
| Cash flow provided by (used in) | $ | $ | ||||||
| Operating activities | ||||||||
| Net loss for the period | (925,726 | ) | (3,567,942 | ) | ||||
| Adjustments for: | ||||||||
| Amortization | 2,025 | 29,898 | ||||||
| Share of loss (gain) on equity investment in Minco Silver | 435,676 | (958,578 | ) | |||||
| Impairment of equity investment in Minco Silver | - | 3,171,647 | ||||||
| Dilution loss (note 7) | 67,125 | - | ||||||
| Foreign exchange loss | 326,278 | 17,574 | ||||||
| Gain on legal settlement (note 8) | (489,000 | ) | (51,745 | ) | ||||
| Share-based compensation (note 10 (b)) | 66,854 | 24,542 | ||||||
| Changes in items of working capital: | ||||||||
| Receivables | (29,895 | ) | (1,935 | ) | ||||
| Due to/from related parties | 94,681 | 309,024 | ||||||
| Prepaid expenses and deposits | 41,051 | (89,988 | ) | |||||
| Accounts payable and accrued liabilities | (266,786 | ) | (222,349 | ) | ||||
| Net cash used in operating activities | (677,717 | ) | (1,339,852 | ) | ||||
| Investing activities | ||||||||
| Sale deposit | - | 1,600,000 | ||||||
| Proceeds from legal settlement | - | 98,941 | ||||||
| Net redemption of short-term investments | 230,000 | - | ||||||
| Net cash generated from investing activities | 230,000 | 1,698,941 | ||||||
| Financing activities | ||||||||
| Proceeds from stock option exercises | 35,667 | 17,290 | ||||||
| Net cash generated from financing activities | 35,667 | 17,290 | ||||||
| Effect of exchange rate changes on cash | (326,277 | ) | 129,256 | |||||
| (Decrease) increase in cash and cash equivalents | (738,327 | ) | 505,635 | |||||
Cash and cash equivalents- Beginning of period | 5,593,669 | 2,117,038 | ||||||
Cash and cash equivalents- End of period | 4,855,342 | 2,622,673 | ||||||
| Less: cash and cash equivalents classified as held for sale | - | (1,2886,560 | ) | |||||
Cash and cash equivalents excluding assets classified as held for sale – End of period | 4,855,542 | 1,336,113 | ||||||
| Cash paid for income tax | - | - | ||||||
The accompanying notes are an integral part of these condensed consolidated interim financial statements.
7
Minco Gold Corporation
(An exploration stage enterprise)
Notes to the Condensed Consolidated Interim Financial Statements
For the three and six months ended June 30, 2016, and 2015
(Unaudited, expressed in Canadian dollars, unless otherwise stated)
| 1. | General information and disposition of assets |
Minco Gold Corporation ("Minco Gold" or the "Company") was incorporated in 1982 under the laws of British Columbia, Canada as Cap Rock Energy Ltd. The Company changed its name to Minco Gold in 2007. The registered office of the Company is 2772 – 1055 West Georgia Street, British Columbia, Canada. The Company has listed its common shares on the Toronto Stock Exchange ("TSX") under the symbol "MMM", and the NYSE MKT under the symbol "MGH".
As at June 30, 2016, Minco Gold owned an 18.31% (December 31, 2015 – 18.45%) equity interest in Minco Silver Corporation ("Minco Silver"), a TSX listed company.
On May 22, 2015, the Company entered into the share purchase agreement ("SPA") with Minco Silver and Minco Silver's wholly-owned subsidiary, Minco Investment Holding HK Ltd. ("Minco Investment"). Pursuant to the SPA, the Company disposed most of its mineral interests through the sale of all of the issued and outstanding shares of its wholly-owned subsidiary, Minco Resources Limited ("Minco Resources"), which held interests in Minco Mining (China) Corporation ("Minco China") to Minco Investment. Minco China consolidated certain subsidiaries including Yuanling Minco Mining Ltd. ("Yuanling Minco"), Tibet Minco Mining Co. Ltd. ("Tibet Minco"), Huaihua Tiancheng Mining Ltd. ("Huanihua Tiancheng"), a legal ownership of Foshan Minco Mining Co. Ltd. ("Foshan Minco") and a 51% interest in Guangdong Mingzhong Mining Co. Ltd. ("Mingzhong"), which owned the Changkeng Gold Project.
Three assets have been retained by the Company including the contingent receivable from a legal settlement with 208 Team (Note 8) and the Gold Bull Mountain and Longnan exploration permits (Note 6).
As the Company ceased to have operating subsidiaries in China after the completion of the SPA, the Company has entered into a trust agreement with Minco Silver and Minco China where Minco China holds the above retained assets in trust for Minco Gold.
The Company is an exploration stage enterprise engaged in exploration and evaluation of gold-dominant mineral properties and projects and is currently reviewing new mineral properties of merit.
| 2. | Basis of preparation |
These condensed consolidated interim financial statements have been prepared in compliance with International Financial Reporting Standards ("IFRS") as issued by the International Accounting Standards Board ("IASB") applicable to the preparation of interim financial statements including IAS 34, Interim Financial Reporting. The condensed consolidated interim financial statements should be read in conjunction with the Company's annual financial statements for the year ended December 31, 2015, which have been prepared in accordance with IFRS as issued by the IASB.
The accounting policies applied in these condensed consolidated interim financial statements are consistent with those applied in the preparation of the consolidated annual financial statements for the year ended December 31, 2015.
These condensed consolidated interim financial statements were approved by the board of directors for issue on August 11, 2016.
8
Minco Gold Corporation
(An exploration stage enterprise)
Notes to the Condensed Consolidated Interim Financial Statements
For the three and six months ended June 30, 2016, and 2015
(Unaudited, expressed in Canadian dollars, unless otherwise stated)
| 3. | Critical accounting estimates and judgments |
Basis of measurement
These condensed consolidated interim financial statements have been prepared under the historical cost convention.
Basis of consolidation
The Company did not have subsidiaries during the three and six months ended June 30, 2016. The comparative figures presented in these condensed consolidated financial statements to account for the three and six months ended June 30, 2015 include the accounts the following former subsidiaries (Note 1):
| Name | Principal activities (ownership interest) | Country of Incorporation |
| Minco China | Exploring and evaluating mineral properties (100%) | China |
| Yuanling Minco | Exploring and evaluating mineral properties (100%) | China |
| Tibet Minco | Exploring and evaluating mineral properties (100%) | China |
| Huaihua Tiancheng | Exploring and evaluating mineral properties (100%) | China |
| Minco Resources | Holding company (100%) | Hong Kong |
| Mingzhong | Exploring and evaluating mineral properties (51%) | China |
Subsidiaries are all entities (including structured entities) over which the group has control. The group controls an entity when the group is exposed to, or has rights to, variable returns from its involvement with the entity and has the ability to affect those returns through its power over the entity. Subsidiaries are fully consolidated from the date on which control is transferred to the group. They are deconsolidated from the date that control ceases.
9
Minco Gold Corporation
(An exploration stage enterprise)
Notes to the Condensed Consolidated Interim Financial Statements
For the three and six months ended June 30, 2016, and 2015
(Unaudited, expressed in Canadian dollars, unless otherwise stated)
| 3. | Critical accounting estimates and judgments (continued) |
The preparation of financial statements requires management to use judgment in applying its accounting policies and estimates and assumptions about the future. Estimates and other judgments are continuously evaluated and are based on management's experience and other factors, including expectations about future events that are believed to be reasonable in the circumstances. The following discusses the most significant accounting judgments and estimates that the Company has made in the preparation of the financial statements:
Significant Influence of Minco Silver
Management has assessed the level of influence that the Company has on Minco Silver and determined that it has significant influence even though its shareholding has been below 20% since April 22, 2014. The Company is able to exercise significant influence on Minco Silver through its representation on Minco Silver's board, the common CEO and other shared management (Note 7).
Impairment – investment in associate
At each reporting date, management conducts a review to determine whether there is any objective evidence that the investment in Minco Silver is impaired, or whether conditions that gave rise to the previous impairment are no longer present. This determination requires significant judgment. In making this judgment, management evaluates among other factors, the movements in the trading share price of Minco Silver and other commercial activities impacting Minco Silver.
If objective evidence of impairment exists, then the Company recognizes an impairment loss in the statement of income (loss) to the extent that the estimated recoverable amount is less than the carrying value.
If objective evidence of impairment exists, then the Company recognizes an impairment loss in the statement of income (loss) to the extent that the estimated recoverable amount is less than the carrying value.
If objective evidence of reversal exists, the reversal is recognized in net income in the period the reversal occurs, and is limited by the carrying value that would have been determined, from the application of equity accounting method, had no impairment charge been recognized in prior periods.
As at June 30, 2016, the company reviewed the corporate developments of Minco Silver, including the activities post acquisition of the Changkeng project, and an increase in the market value of Minco Silver's share price since year ended December 31, 2015. Based on this review, management determined no indicators of impairment or indicators of reversal were present.
10
Minco Gold Corporation
(An exploration stage enterprise)
Notes to the Condensed Consolidated Interim Financial Statements
For the three and six months ended June 30, 2016, and 2015
(Unaudited, expressed in Canadian dollars, unless otherwise stated)
| 4. | Cash and cash equivalents |
Cash and cash equivalents comprise cash at banks and on hand and guaranteed investment certificates with initial maturities of less than three months. The company did not hold any cash equivalents as at June 30, 2016 and December 31, 2015. As at June 30, 2016, the cash balance included USD $3,693,511 ($4,785,458 equivalent) comparing to USD $4,007,446 ($5,557,926 equivalent) held on December 31, 2015.
| 5. | Short-term investment |
As at June 30, 2016, short-term investments consist of $3,818,341 (December 31, 2015 - $4,048,341) cashable guaranteed investment certificates, that earns an interest of $1.4% per annum and matures on December 28, 2016.
| 6. | Mineral interests |
As at June 30, 2016, the Company had the following mineral interests:
| a) | Gansu – Longnan Property |
After the completion of the SPA on July 31, 2015, Minco China held nine exploration permits in the trust for the Company in the Longnan region in the south of Gansu Province in China. The Longnan region is within the southwest Qinling gold field. The Longnan region consists of three projects including Yejiaba – four exploration permits; Yangshan – four exploration permits; Xicheng East – one exploration permit, according to their geographic distribution, type and potential of mineralization.
On December 13, 2013, Minco China entered into an agreement with Gansu Yuandong Investment Co., Ltd ("YDIC") in which the Company agreed to sell two exploration permits in the Xicheng East and Yejiaba area to YDIC for RMB 0.8 million ($170,973). The process of transferring the titles to the two permits to YDIC was pending approval by Gansu province and the proceeds were not received as at March 31, 2016.
On December 26, 2014, Minco China entered into an agreement with Beijing Runlong Investment Limited Company ("Beijing Runlong") in which the Company agreed to sell four exploration permits in the Yangshan area to Beijing Runlong for total cash proceeds of RMB 3,200,000 ($604,618).
As the proceeds were not received as at June 30, 2016, the Company considers Beijing Runlong is in default of the agreement. As a result, the titles of these four permits are still kept by the Company. The Company did not record any receivable due to the uncertainty of collectability.
11
Minco Gold Corporation
(An exploration stage enterprise)
Notes to the Condensed Consolidated Interim Financial Statements
For the three and six months ended June 30, 2016, and 2015
(Unaudited, expressed in Canadian dollars, unless otherwise stated)
| 6. | Mineral interests (continued) |
| c) | Hunan - Gold Bull Mountain |
Minco China through its subsidiary Yuanling Minco holds the Gold Bull Mountain exploration permit in trust for the Company. This exploration permit expires on June 28, 2017.
| d) | Exploration Costs |
The following is a summary of exploration costs, net of recoveries, broken down by project:
| Three months ended | Six months ended | Cumulative to | |||
| June 30, | June 30, | June 30, | |||
| 2016 | 2015 | 2016 | 2015 | 2016 | |
| $ | $ | $ | $ | $ | |
| Currently active properties: | |||||
| - Gansu Longnan | 24,243 | 177,656 | 108,570 | 369,727 | 12,476,281 |
| - Guangdong Changkeng | 18,292 | - | 80,939 | 8,285,703 | |
| - Hunan Gold Bull Mountain | 4,527 | 12,957 | 11,198 | 23,067 | 2,327,809 |
| - Guangdong Sihui | - | - | - | 106 | 6,099 |
| Total | 28,770 | 208,905 | 119,768 | 473,839 | 23,095,892 |
(i) Changkeng Property was sold to Minco Silver on July 31, 2015 | |||||
7. Equity investment in Minco Silver Corporation
As at June 30, 2016, the Company owned 11,000,000 common shares of Minco Silver which represented 18.31% ownership of Minco Silver (December 31, 2015 – 11,000,000 share or 18.45%).
As at June 30, 2016, management evaluated its equity investment in Minco Silver and determined no indicators of impairment or indicators of impairment reversal were present.
12
Minco Gold Corporation
(An exploration stage enterprise)
Notes to the Condensed Consolidated Interim Financial Statements
For the three and six months ended June 30, 2016, and 2015
(Unaudited, expressed in Canadian dollars, unless otherwise stated)
| 7. | Equity investment in Minco Silver Corporation (continued) |
| 2016 | 2015 | |||||||
| $ | $ | |||||||
| As at January 1, Equity investment in Minco Silver | 6,631,094 | 6,820,000 | ||||||
| Dilution loss (i) | (67,125 | ) | - | |||||
| Share of income (loss) of Minco Silver | (435,676 | ) | 1,259,391 | |||||
Share of other comprehensive income (loss) of Minco Silver (ii) | (1,369,221 | ) | 1,958,940 | |||||
| Unrealized gain on disposition of Minco Resources | - | (3,407,237 | ) | |||||
Equity investment in Minco Silver as at June 30, 2016 and December 31, 2015 | 4,759,072 | 6,631,094 | ||||||
(i) The Company's interest in Minco Silver was diluted to 18.31 % on June 30, 2016 from 18.45% on December 31, 2015, which resulted in the recognition of a dilution loss of $67,125.
(ii) Represents the exchange differences on translation from functional to presentation currency of Minco Silver's subsidiaries.
The following is a summary of Minco Silver's statements of position and reconciliation to carrying amounts as at June 30, 2016 and December 31, 2015:
| June 30, | December 31, | |||||||
| 2016 | 2015 | |||||||
| $ | $ | |||||||
Cash and cash equivalents | 16,226,625 | 26,202,564 | ||||||
| Other current assets | 36,775,563 | 33,039,404 | ||||||
| Mineral interests | 59,167,230 | 63,676,055 | ||||||
| Property, plant and equipment | 355,112 | 434,999 | ||||||
| Current liabilities | 226,141 | 638,550 | ||||||
| Total equity | 112,298,389 | 122,714,472 | ||||||
13
Minco Gold Corporation
(An exploration stage enterprise)
Notes to the Condensed Consolidated Interim Financial Statements
For the three and six months ended June 30, 2016, and 2015
(Unaudited, expressed in Canadian dollars, unless otherwise stated)
| 7. | Equity investment in Minco Silver Corporation (continued) |
Reconciliation to carrying amounts: | ||||||||
| June 30, | December 31, | |||||||
| 2016 | 2015 | |||||||
| Minco Gold's share in percentage | 18.31 | % | 18.45 | % | ||||
| Minco Gold's share of net assets of Minco Silver | $ | 20,561,835 | $ | 22,640,820 | ||||
| Differences between Minco Gold's share of net asset and carrying value of the equity investment | (15,802,763 | ) | (16,009,726 | ) | ||||
| Carrying value of investment in Minco Silver | $ | 4,759,072 | $ | 6,631,094 | ||||
| Fair market value of investment in Minco Silver | $ | 13,860,000 | $ | 4,620,000 | ||||
The following is a summary of Minco Silver's statements of comprehensive income for the three and six months ended June 30, 2016 and 2015:
| Three months ended June 30, | Six months ended June 30, | |||||||||||||||
| 2016 | 2015 | 2016 | 2015 | |||||||||||||
| $ | $ | $ | $ | |||||||||||||
Operating income (loss) | (479,386 | ) | (559,384 | ) | (2,824,172 | ) | 135,241 | |||||||||
| Net income (loss) attributed to | ||||||||||||||||
| shareholders of Minco Silver | (257,565 | ) | 3,658,536 | (2,370,467 | ) | 5,196,473 | ||||||||||
| Non-controlling interest | (26,916 | ) | - | (82,073 | ) | - | ||||||||||
| Other comprehensive income (loss) attributed to: | ||||||||||||||||
| Shareholders of Minco Silver | (2,699,842 | ) | (2,872,633 | ) | (9,820,246 | ) | 6,630,285 | |||||||||
| Non-controlling interest | (401,017 | ) | - | (1,230,869 | ) | - | ||||||||||
| Comprehensive income (loss) for the period | (3,100,859 | ) | 785,903 | (11,051,115 | ) | 11,826,758 | ||||||||||
14
Minco Gold Corporation
(An exploration stage enterprise)
Notes to the Condensed Consolidated Interim Financial Statements
For the three and six months ended June 30, 2016, and 2015
(Unaudited, expressed in Canadian dollars, unless otherwise stated)
| 8. | Receivable from a legal settlement |
On December 16, 2010, Minco China entered into an agreement with the 208 Team, a subsidiary of China National Nuclear Corporation, to acquire a 51% equity interest in the Tugurige Gold Project located in Inner Mongolia, China (the "Agreement"). The 208 Team did not comply with certain of its obligations under the Agreement, including its obligation to set up a new entity (the "JV Co") and the transfer of its 100% interest in the Tugurige Gold Project to the JV Co. As a result, Minco China commenced legal action in China seeking compensation.
On March 25, 2013, Minco China settled its claim against the 208 Team relating to the Agreement for an amount of RMB 14 million ($2.4 million). Minco China received RMB 5 million ($801,395) during 2013 and recognized a receivable of RMB 4 million ($699,688) as at December 31, 2013. The Company received RMB 4 million ($720,095) in January 2014.
On May 6, 2015, Minco China reached an agreement to settle its claim against the 208 Team for an amount of RMB 5.5 million ($1,138,472). The payments were to be received in following manner:
| i) | On the signing date of the agreement- RMB 500,000 ($98,940) (received by Minco China on May 7, 2015) |
| ii) | On or before June 17, 2015- RMB 2,000,000 ($405,894) (outstanding) |
| iii) | On or before August 7, 2015- RMB 3,000,000 ($608,840) (outstanding) |
As at December 31, 2015, the remaining RMB 5 million ($1,014,734) balance receivable under the legal settlement has not been settled and therefore, has not been recognized as an asset due to the uncertainty of collectability.
Upon the completion of the SPA, the Company continued to hold the interest of the outstanding receivable (RMB 5,000,000) through a trust agreement with Minco China.
The Company, through Minco China, engaged a Chinese law firm to recommence a lawsuit against 208 Team to recover the remaining RMB 5 million unpaid balance on a contingent fee basis whereby the Company will pay the Chinese law firm 50% of the net amount recovered. On May 27, 2016, the Company obtained a judgment from the Highest Court of the People of Republic of China to order the 208 team to repay the Company these RMB5, 000,000, which was received on July 27, 2016.
As a result, the Company recognized a gain of $489,000 for the period ended June 30, 2016, which is the gross settlement payment received net of the related legal expenditures.
Minco Gold Corporation
(An exploration stage enterprise)
Notes to the Condensed Consolidated Interim Financial Statements
For the three and six months ended June 30, 2016, and 2015
(Unaudited, expressed in Canadian dollars, unless otherwise stated)
9. Non-controlling interest
Below is summarized financial information for Mingzhong, a 51% owned subsidiary formerly owned by the Company until July 31, 2015. The amounts disclosed are based on those included in the condensed consolidated interim financial statement before inter-company eliminations.
Summarized statements of comprehensive loss
| For the period ended | June 30, | June 30, | ||||||
| 2016 | 2015 | |||||||
| $ | $ | |||||||
| Net loss | - | (73,908 | ) | |||||
| Other comprehensive income | - | 53,393 | ||||||
| Total comprehensive income (loss) | - | (20,515 | ) | |||||
| Loss allocated to NCI | - | (36,215 | ) | |||||
Summarized statements of cash flows
| For the period ended | June 30, | June 30, | ||||||
| 2016 | 2015 | |||||||
| $ | $ | |||||||
| Cash flows from operating activities | - | (167,307 | ) | |||||
| Cash flows from financing activities | - | - | ||||||
| Effect of exchange rate changes on cash | - | 89,990 | ||||||
| 10. | Share capital |
| c. | Common shares and contributed surplus |
Authorized: 100,000,000 common shares without par value
| d. | Stock options |
Minco Gold may grant options to its directors, officers, employees and consultants under its stock option plan (the "Stock Option Plan"). The Company's board of directors grants such options for periods of up to five years, with vesting periods determined at its sole discretion and at prices equal to or greater than the closing market price on the day preceding the date the options are granted. These options are equity-settled.
16
Minco Gold Corporation
(An exploration stage enterprise)
Notes to the Condensed Consolidated Interim Financial Statements
For the three and six months ended June 30, 2016, and 2015
(Unaudited, expressed in Canadian dollars, unless otherwise stated)
| 10. | Share capital (continued) |
During the six months ended June 30, 2016, the Company did not grant any stock options.
The maximum number of common shares reserved for issuance under the Stock Option Plan is 15% of the issued and outstanding common shares of the Company.
The Company uses the Black-Scholes option pricing model to determine the fair value of the options. Minco Gold recorded $23,993 and $66,854 in share-based compensation expense for the three and six months ended June 30, 2016 (June 30, 2015 - $11,194 and $24,542).
A summary of the options outstanding is as follows:
| Number outstanding | Weighted average exercise price | |||||||
| $ | ||||||||
| January 1, 2015 | 6,460,501 | 0.79 | ||||||
| Granted | 1,190,000 | 0.24 | ||||||
| Exercised | (66,500 | ) | 0.26 | |||||
| Forfeited | (927,500 | ) | 0.55 | |||||
| Expired | (66,667 | ) | 0.93 | |||||
| Balance, December 31, 2015 | 6,589,834 | 0.72 | ||||||
| Exercised | (140,000 | ) | 0.26 | |||||
| Forfeited | (30,000 | ) | 0.46 | |||||
| Expired | (1,122,500 | ) | 2.17 | |||||
| Balance, June 30, 2016 | 5,297,334 | 0.43 | ||||||
The weighted average share price on the date of exercise for options exercised during six months ended June 30, 2016 was $0.37 (2015 - $0.30). As at June 30, 2016, there was $83,716 (2015- $24,854) of total unrecognized compensation cost relating to unvested stock options.
17
| 10. | Share capital (continued) |
| Options outstanding | Options exercisable | |||||||||||||||||||||
Range of exercise prices | Number outstanding | Weighted average remaining contractual life (years) | Weighted average exercise price | Number exercisable | Weighted average exercise price | |||||||||||||||||
| $ | $ | |||||||||||||||||||||
0.18 – 0.24 | 1,003,334 | 4.21 | 0.24 | 309,998 | 0.24 | |||||||||||||||||
0.25 – 0.42 | 919,000 | 2.55 | 0.26 | 919,000 | 0.26 | |||||||||||||||||
0.43 – 0.54 | 2,115,000 | 1.49 | 0.46 | 2,115,000 | 0.46 | |||||||||||||||||
0.55 – 0.67 | 1,260,000 | 0.74 | 0.67 | 1,260,000 | 0.67 | |||||||||||||||||
5,297,334 | 2.01 | 0.43 | 4,603,998 | 0.46 | ||||||||||||||||||
11. Related party transactions
Shared office expenses
| a) | Minco Silver and Minco Gold shared offices and certain administrative expenses in Beijing up to July 31, 2015. Minco Silver, Minco Base Metals Corporation ("MBM"), and Minco Gold share offices and certain administrative expenses in Vancouver. MBM is a company over which the Company's CEO has significant influence. |
At June 30, 2016, the Company had $270,280 due to Minco Silver (December 31, 2015 – $177,330) which included the unpaid shared office expenses, and the expenditures Minco Silver had paid on behalf of the Company in connection with the Company's remaining assets in China.
| b) | At June 30, 2016, the Company had $10,658 due from MBM (December 31, 2015 - $12,387), in relation to shared office expenses. |
The amounts due are unsecured, non-interest bearing and payable on demand.
Key management compensation
Key management includes the Company's directors and senior management. This compensation is included in exploration costs and administrative expenses.
18
Minco Gold Corporation
(An exploration stage enterprise)
Notes to the Condensed Consolidated Interim Financial Statements
For the three and six months ended June 30, 2016, and 2015
(Unaudited, expressed in Canadian dollars, unless otherwise stated)
11. Related party transactions (continued)
Following is a summary of the compensation with key management:
| Three months ended June 30, | Six months ended June 30, | |||||||||||||||
| 2016 | 2015 | 2016 | 2015 | |||||||||||||
| $ | $ | $ | $ | |||||||||||||
| Cash remuneration | 67,880 | 46,600 | 137,776 | 145,000 | ||||||||||||
| Share-based compensation | 16,387 | 9,170 | 53,615 | 19,476 | ||||||||||||
| Total | 84,267 | 55,770 | 191,391 | 164,476 | ||||||||||||
The above transactions were conducted in the normal course of business.
| 12. | Financial instruments |
Financial assets and liabilities that are recognized on the balance sheet at fair value can be classified in a hierarchy that is based on the significance of the inputs used in making the measurements. The levels in the hierarchy are:
Level 1 - quoted prices (unadjusted) in active markets for identical assets or liabilities;
Level 2 - inputs other than quoted prices included within level 1 that are observable for the asset or liability, either directly (that is, as prices) or indirectly (that is, derived from prices); and
Level 3 - inputs for the asset or liability that are not based on observable market data (that is, unobservable inputs).
Financial instruments that are not measured at fair value on the balance sheet are represented by cash and cash equivalents, short-term investment, receivable, due from related parties, account payable and accrued liabilities, and due to related parties. The fair values of these financial instruments approximate their carrying value due to their short-term nature.
19
SCHEDULE B
MANAGEMENT'S DISCUSSION AND ANALYSIS OF MINCO GOLD CORPORATION FOR THE YEAR ENDED DECEMBER 31, 2015 AND FOR THE SIX MONTH PERIOD ENDED JUNE 30, 2016
As at the date of this MD&A, the Company had 50,591,381 common shares and 5,427,334 stock options outstanding, for a total of 56,018,715 common shares outstanding, on a fully diluted basis.
Table of Contents
| 1. | Highlights for the Year |
| 2. | Projects and Equity Investment in Minco Silver |
| 3. | Results of Operations |
| 4. | Summary of Quarterly Results |
| 5. | Liquidity and Capital Resource |
| 6. | Off – Balance Sheet Arrangements |
| 7. | Transactions with Related Parties |
| 8. | Critical Accounting Estimates |
| 9. | Adoption of New Accounting Standard |
| 10. | Financial Instruments |
| 11. | Risk Factors and Uncertainties |
| 12. | Disclosure Controls and Procedures and Internal Controls over Financing Reporting |
| 13. | Cautionary Statement on Forward Looking Information |
1. Highlights for the Year
Disposition of mineral interests
On May 22, 2015, the Company entered into the share purchase agreement ("SPA") with Minco Silver and Minco Investment. Pursuant to the SPA, the Company sold all of the issued and outstanding shares of Minco Resources, which holds all of the Company's interests in its five China subsidiaries, namely Minco China. Yuanling Minco, Huaihua Tiancheng, Tibet Minco, and Mingzhong (the "Transaction"). The Transaction completed on July 31, 2015.
Until the completion of the Transaction, Minco China held the Fuwan Silver in trust for Minco Silver. Upon the completion of the Transaction, Minco China has become a subsidiary of Minco Silver. Thus the trust agreement related the Fuwan Silver Project is no longer required and has been cancelled.
Upon the completion of the Transaction, three assets that were previously owned by Minco China have been retained by the Company, namely the Longnan permits, the contingent receivable from a legal settlement with 208 Team, and the Gold Bull Mountain Property (the "Retained Assets').
After the Transaction, the Company ceased to have subsidiary in China. As a result, the Company and Minco China has entered into a trust agreement to enable Minco China holding these Retained Assets in trust for the Company.
The Company has calculated a gain of $18,467,407 on the sale, based on the consideration received of $13,716,397 and the negative carrying value of its investment in the net assets of Minco Resources in the amount of $4,340,686. This resulted in a total gain of $18,057,083, which was first reduced by $69,000 to account for the transaction cost, further adjusted to include the reclassification of cumulative translation adjustments of $479,324 relating to the disposed of entity. Due to Minco Gold's 18.45% ownership in Minco Silver, an unrealized gain in the amount of $3,407,237 was recorded as a reduction of Minco Gold's equity investment in Minco Silver and the remaining amount resulted in a realized gain of $15,060,170 recorded in net income.
Listing Requirement
On August 6, 2015, the Company received a letter from the Toronto Stock Exchange (the "TSX") advising that as a result of the completion of the sale of the Company's interest in the Changkeng Property to Minco Silver, the Company is required to provide a written submission to the TSX outlining how the Company meets or plans to meet the original listing requirements in order to maintain its listing on the TSX. The Company has provided a response to the TSX accordingly. On September 30, the Company received a note from TSX that indicates the Company has met the listing requirement based on the Company's response.
On October 27, 2015, the Company received a courtesy call from NYSE to advise that the Company's stock has been trading below US$0.20 for the last 30 days with an average of US$0.18. No action was taken at this time. If the stock starts to trade below US$0.05, NYSE will initiate a delisting process. The Company's shares have not traded below US$0.05 from October 27, 2015 to the date of this report.
Outlook
After completing the Transaction, the Company the Company intends to use the proceeds from the sale of its subsidiaries to pursue strategic mineral acquisitions, joint ventures or other transactions outside of China while continuing to evaluate its current remaining Retained Assets and business activities in China.
2. Equity Investment in Minco Silver and mineral properties update
Equity Investment in Minco Silver Corporation
On April 22, 2014, the Company sold 2,000,000 common shares of Minco Silver for cash proceeds of $1,500,000 which decreased the Company's equity interest in Minco Silver from 21.81% to 18.45%. The Company determined that it continued to hold significant influence over Minco Silver despite the Company's ownership being less than 20% of the voting rights of Minco Silver. The Company continues to have the ability to influence Minco Silver through its board representation, common CEO and other key management personnel. As a result, the Company continues to account for its investment in Minco Silver with the equity method after this share sale. Upon the completion of the Transaction on July 31, 2015, the Company's ownership of Minco Silver's common shares remained unchanged at 18.45% and the Company continued to maintain significant influence on Minco Silver through its board representation and common key management team.
As at December 31, 2015, management evaluated its equity investment in Minco Silver for indications that the impairment loss that had been recognized in the first quarter of fiscal 2015 either no longer existed or had decreased. The company concluded that due to the positive developments in Minco Silver, which included the acquisition of Minco Resources and the related activities associated with the Changkeng project, accompanied by a corresponding increase in the market value of Minco Silver's share price, that there were indicators that impairment loss had reversed. As a result, management estimated the recoverable amount and reversed the previously recognized impairment.
As at December 31, 2015, the Company owned 11,000,000 common shares of Minco Silver (December 31, 2014 - 11,000,000 common shares) that were acquired in 2004 in exchange for the transfer of the Fuwan property and the silver interest in the Changkeng property. These 11,000,000 common share owned by the Company were not part of the Transaction with Minco Silver.
Equity Investment in Minco Silver
The following is a summary of Minco Silver's financial information as at and for the year ended December 31, 2015 and 2014:
December 31, 2015 | December 31, 2014 | |||||||
| $ | $ | |||||||
| Assets | 123,353,022 | 92,564,638 | ||||||
| Liabilities | 638,550 | 419,592 | ||||||
| Revenues | - | - | ||||||
| Net income (loss) | 6,680,947 | (1,665,516 | ) | |||||
As at December 31, 2015, Minco Silver Corporation had 59,631,418 common shares, 735,000 performance share units and 6,485,667 stock options for a total of 66,852,085 fully diluted common shares outstanding.
Mineral Properties Update
The following is a brief discussion of the Changkeng Gold Project, which was held by the Company before it was sold on July 31, 2015 and the properties that Minco Gold currently holds. . Information of a technical or scientific nature respecting the Company's mineral properties ("Technical Information") is primarily derived from the documents referenced herein. Technical Information which appears in this MD&A has been reviewed and approved by Thomas Wayne Spilsbury, an independent director of Minco Silver, in which the Company owned an 18.45% equity interest as at December 31, 2015 Mr. Spilsbury is a Member of the Association of Professional Engineers and Geoscientists of British Columbia (P Geo), a Member of the Australian Institute of Geoscientists and a Fellow of the Australasian Institute of Mining and Metallurgy CP (Geo) and is a "qualified person", as defined in NI 43-101. Minco Silver operates quality assurance and quality control of sampling and analytical procedures.
All sample length information that follows refers to reported sample length; the lengths reported may not necessarily represent true thickness of the mineralization.
2.1 Changkeng Gold Project
The Changkeng Gold Project was sold to Minco Silver (of which the Company holds 18.45% equity interest) as part the Transaction completed on July 31, 2015.
Technical Information respecting the Changkeng Gold Project is primarily derived from the NI 43-101 technical report entitled "Technical Report and Updated Resource Estimate on the Changkeng Gold Project Guangdong Province, China", dated effective February 21, 2009 and prepared by Tracy Armstrong, P. Geo Ontario, Eugene Puritch, P. Eng. Ontario and Antoine Yassa, P.Geo. Québec, all of P&E Mining Consultants Inc., and all qualified persons for the purposes of NI 43-101. This technical report includes relevant information regarding the data, data validation and the assumptions, parameters and methods of the mineral resource estimates on the Changkeng Gold Project.
Location
The Changkeng gold deposit is located approximately 45 km southwest of Guangzhou, the fourth largest city in China with 13 million people and the capital city of Guangdong Province. The project is adjacent to the Fuwan silver deposit and situated close to well-established water, power and transportation infrastructure.
Ownership
On July 31, the Company sold its 51% interest in Mingzhong to Minco Silver by selling the shares of Minco Resource. Mingzhong, a cooperative joint-venture established among Minco China, Guangdong Geological Bureau, Guangdong Gold Corporation, and two private Chinese companies to jointly explore and develop the Changkeng Property, signed a purchase agreement in January 2008 to buy a 100% interest in the Changkeng Exploration Permit on the Changkeng Project from 757 Exploration Team. The transfer of the Changkeng Exploration Permit from 757 Exploration Team to Mingzhong was approved by the MOLAR in 2009. The renewed Changkeng Exploration Permit for a two-year period expires on September 10, 2017.
The purchase price of the Changkeng Exploration Permit was set at RMB 48 million ($8.26 M million). As of December 31, 2008, Mingzhong paid the first payment of RMB 19 million ($3.22million) to the 757 Exploration Team for the Changkeng Exploration Permit. The remaining balance of RMB 29 million ($6.20 million) was settled in May 2013. According to the Supplementary Agreement signed between 757 Exploration Team and Mingzhong, 757 Exploration Team agreed to refund RMB 3.8 million ($0.62 million) to Mingzhong for the exploration costs incurred during the early stage of exploration of Changkeng project. The refunded amount was recorded as an exploration cost recovery during the year ended December 31, 2013. On July 31, 2013, Mingzhong paid the RMB 1.03 million ($0.17million) to 757 Exploration Team for the completed hydro-geological program on the Changkeng Gold Project. The hydro-geological program was conducted to assist the preparation of the NI 43-101 technical report entitled "Technical Report and Updated Resource Estimate on the Changkeng Gold Project Guangdong Province, China": dated effective February 21, 2009.
Geology, Drilling Program and Resources Estimate
The Company is not aware of significant changes in the geology, drilling program and resource estimate compared to those disclosed in the MD&A of Minco Gold for the year ended December 31, 2015.
A comprehensive discussion of the geology, drilling program and resource estimate are included in the Minco Silver's MD&A for the year ended December 31, 2015 available on SEDAR at www.sedar.com.
From January 1, 2015 to July 31, 2015, just before the Changkeng Property was sold, the Company did not conduct any exploration activities, except for maintaining the Changkeng exploration permit.
2.2 Longnan Projects
This is the first component of the Retained Assets maintained by the Company. Technical Information respecting the Company's Yejiaba Project appearing in this MD&A has been primarily derived from the NI 43-101 compliant technical report entitled "Independent Technical Report on the Yejiaba Gold-Polymetallic Project Gansu Province, P.R. China", dated effective April 29, 2012 and prepared by Calvin R. Herron, P. Geo Ontario, a consultant to the Company and a qualified person for NI 43-101, available on SEDAR at www.sedar.com. Readers should refer to the aforementioned technical report for more information.
Exploration Activities - Longnan Region Projects
After the completion of the Transaction, Minco China held nine exploration permits in the trust for the Company in the Longnan region in the south of Gansu Province in China. The Longnan region is within the southwest Qinling gold field. The Longnan region consists of three projects according to their geographic distribution, type and potential of mineralization.
| Yejiaba: | Includes four exploration permits along a regional structural belt parallel to the Yangshan gold belt. The potential in this area is for polymetallic mineralization (gold-silver-iron-lead-zinc). The Company completed the NI 43-101 compliant technical report (refer to above) on Yejiaba Project, which is available on SEDAR. |
| Yangshan: | Includes four remaining exploration permits located in the northeast extension of the Yangshan gold belt and its adjacent area. |
| Xicheng East: | Includes one exploration permit for the east extension of the Xicheng Pb-Zn mineralization belt. The potential in this area is for polymetallic mineralization (gold-silver-lead-zinc). |
Yejiaba Project
The Yejiaba Project is located along the collisional boundary separating the Huabei and Yangtze Precambrian cratons. This major E-W trending collision zone has localized a number of large gold and polymetallic deposits within a geologic province that is often referred to as the Qinling Orogenic Belt. Gold and polymetallic mineralization on the Company's lease package is generally hosted in Silurian-Devonian, thin-bedded limestone interbedded with phyllite. Mineralization is associated with shears and quartz veins, with higher grades typically found along sheared contacts separating massive limestone from the thin-bedded limestone and phyllite unit. Granite porphyry and quartz diorite dykes tend to be spatially associated with mineralization. Alteration accompanying mineralization consists of weak silicification and pyritization with carbonate veining and secondary carbon. Small quartz veinlets are noted in several places. Associated metals consist of silver, lead, antimony and arsenic.
Semi-regional geochemical anomalies were first delineated by the Company in 2005, extending 10 km along a hydrothermally altered zone that follows a NE trending thrust and regional unconformity.
Subsequent work between 2006 and 2012 has included traverse-line investigations, soil sampling, geologic mapping, geophysical surveys (ground magnetic and IP), trenching and drilling.
To date several targets have been identified and tested including: Shanjinba (Zone 1 and 2), Yaoshang, Fujiawan, Baimashi, Bailuyao, Baojia and Paziba.
The Company engaged an independent consultant to conduct a detailed review of the Yejiaba Project in April 2013, in particular to focus on the Baimashi North and East Targets. The sample work performed on the Yejiaba project during 2013 consisted of 912 rock chip samples, 818 soil samples, 41 stream sediment samples and 339 trench channels. The detailed results at the Baimashi North and East Targets are described below.
The Company completed a drilling program for four drilling targets on its Baimashi North Target in 2014. The detailed assay results are described below.
Sampling and assaying
The channel samples taken in the trenches are generally 10 cm wide; 5 cm deep, lengths are typically 1m but can be slightly longer or shorter to match geological boundaries. Only significant channel sample results are reported below, where composited gold grades are over 0.50 g/t. Reported composites may comprise individual samples with gold assays lower than 0.5g/t if it is deemed that the geology and mineralization is continuous over the interval. Channel sample intervals may not necessarily represent true thickness of the mineralization.
Sample preparation was performed by independent laboratory SGS-Tianjin, at their laboratory in Xian (PRC). Pulps are then analyzed at the SGS-Tianjin assay facility in Tianjin. Sample QAQC methods consisted of insertion of blank and duplicates in the field (one in twenty samples), while SGS-Tianjin inserted analytical duplicates and reference standards into the sample stream at their laboratory.
Baimashi Target
The Baimashi gold-antimony mineralization was discovered on the boundary between Weiziping-Baimashi and Shajinba-Yangjiagou permits and includes the Baimashi North Target that was identified in 2013, located approximately 1Km north of the Baimashi Target; and the Baimashi East Target.
During 2013, the samples in Table 1 were collected within the Baimashi North and East Target. Out of total samples, 118 trench, 75 soil and 37 rock samples were collected from Baimashi East, but the results of these samples demonstrated the gold values in the Baimashi East are tightly confined to narrow structure and thereby effectively diminished the target's size and significance. The Company has no further exploration planned on this target.
All of the exploration conducted during 2013 indicates the Baimashi North Target is the only target that hosts sufficient size and grade potential to produce a substantial gold deposit.
| Table 1. Summary of sample types collected within the Baimashi Targets | |||
| # of Samples | Gold Range (ppm) | Average Au (ppm) | |
Rock Chip | 912 | <0.005 – 47.115 | 0.729 |
Soil | 818 | <0.005 – 3.968 | 0.055 |
Trench Channels | 339 | <0.005 – 14.250 | 0.190 |
Stream Sediment | 41 | <0.005 – 0.226 | 0.015 |
Baimashi North Target
Gold Mineralization Observed within the Baimashi North Target
The Rock Gold Zone shown in Figure 1 represents the distribution of rock chip gold values exceeding 0.100ppm, and the zone boundaries were defined by combining the rock chip and soil sample results together with the structural data. The gold-in-soil distribution fairly represents the gold zone.
Figure1. Outline of Baimashi North Gold Mineralization Zone relative to soil samples results
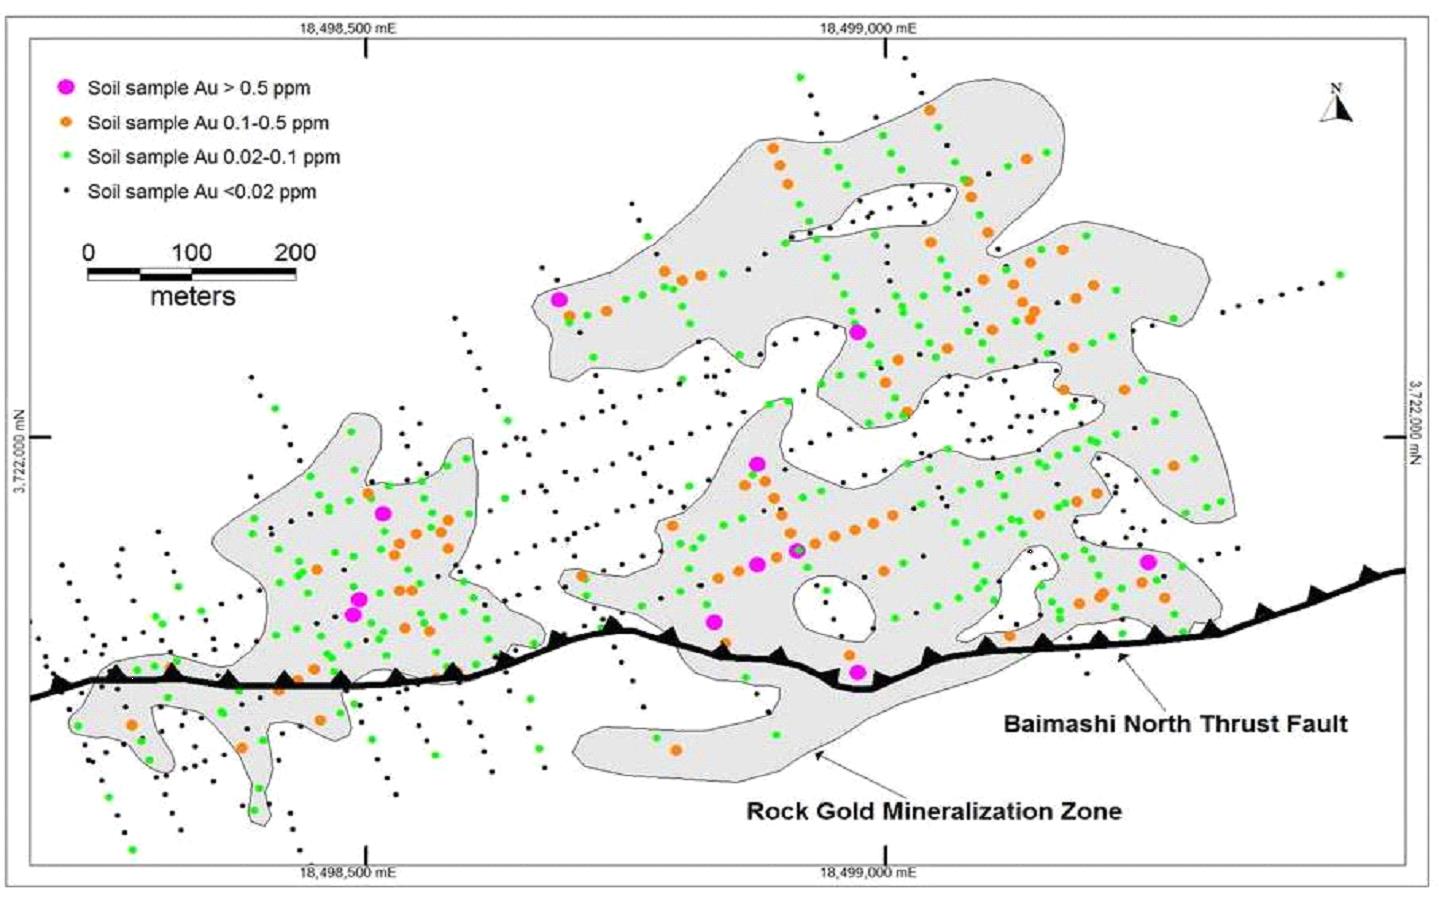
In Figure 2, the same Rock Gold Zone is shown relative to the distribution of rock chip sample results together with the mapped mineralized structures (shears, veins, dikes). Here again, the sample data fits well within the zone boundaries, which suggests that the soil sample values generally do a fair job of reflecting the rock sample data. The dominantly northeast-trending Rock Gold Mineralization Zone is approximately 1,200m long by 600m wide. It measures 317,000m2 in plain view and is open to the north. The Baimashi North Target certainly possesses sufficient size for hosting a large gold deposit but will need sufficient gold grade as well.
Figure 2. Outline of Baimashi North Gold Mineralization Zone relative to rock chip results and mineralized structures.
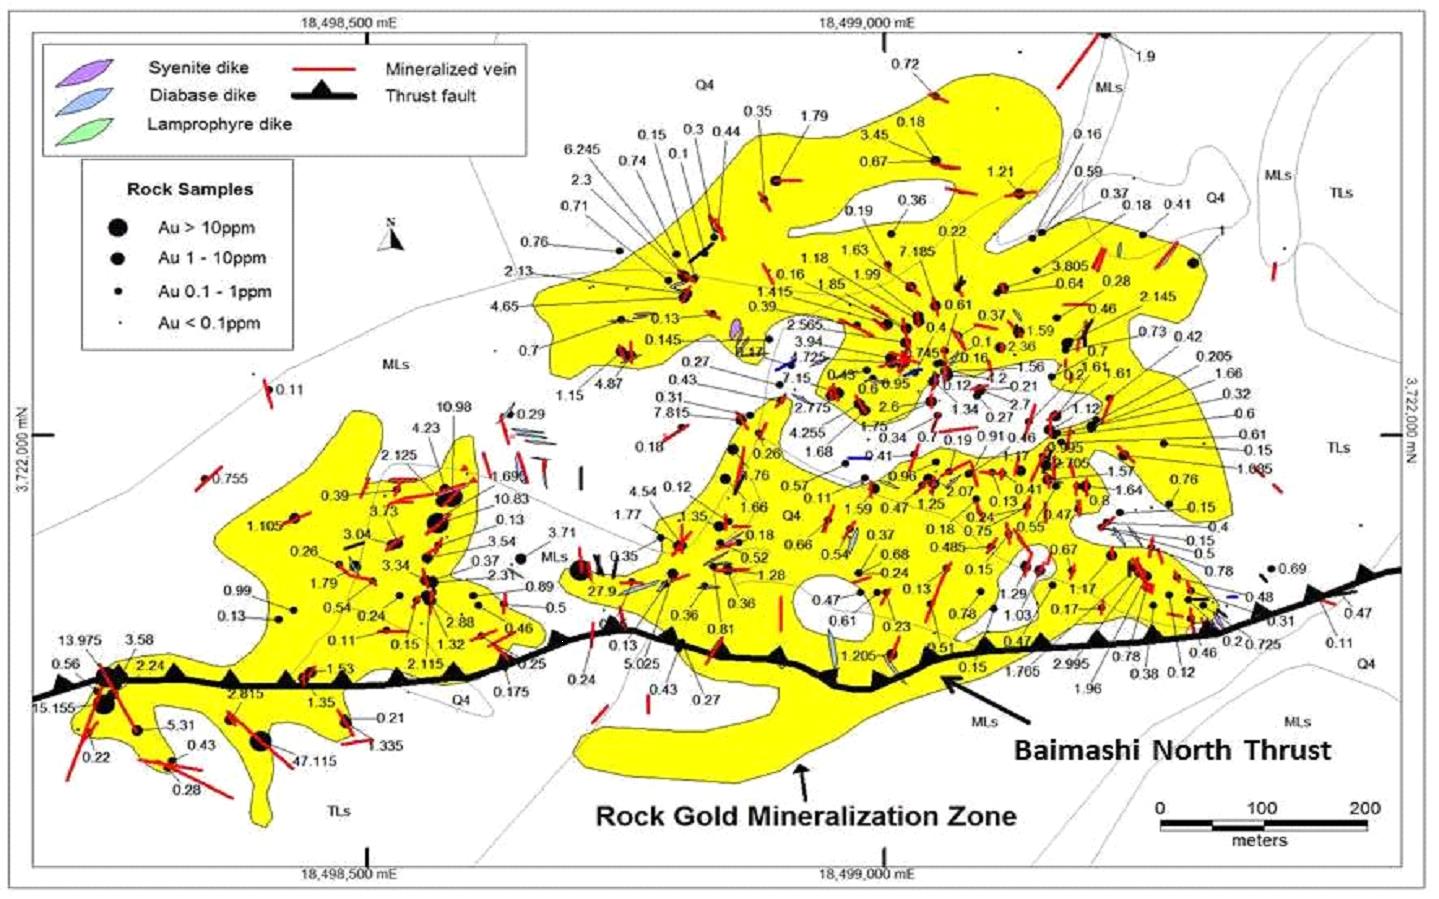
Samples collected within the Baimashi North Target
Following the encouraging results found in the third quarter of 2013 described below, a total of 589 soil samples and 39 rock samples were collected within this target during the fourth quarter of 2013. The soil sample results show a gold range from 0.005 to 3.968 ppm (refer to Table 1).
During the year ended December 31, 2013, 247 rock chip samples, 125 soil samples and 41 stream sediment samples within Baimashi North Target were collected.
The 247 rock samples collected within the Rock Gold Mineralization Zone run from 0.005 to 47.115ppm Au and average 1.49ppm, which is a potentially economic grade for an open-pit operation if this grade can be maintained. A rough analysis of the rock sample data is presented in Table 2, where we see a high percentage of samples (39%) carrying gold values exceeding 0.5 g/t, while 68% run in excess of 0.1 g/t. Six samples included in the >3.0 ppm Au category in Table 2 exceed 10ppm Au. If these six high-grade samples are taken out, the overall average grade drops to 1.00ppm, which illustrates the weight carried by high-grade numbers in this zone.
Table 2. Summary of rock chip sample results (excludes dumps). | |||||
| Sample Ranges | Number of Samples | % of Total Samples | Average Au (ppm) | Average As (ppm) | Average Sb (ppm) |
| >3.0 ppm Au | 22 | 8 | 8.391 | 4292 | 99 |
| 1.0-3.0 ppm Au | 48 | 17 | 1.764 | 2358 | 66 |
| 0.5-1.0 ppm Au | 41 | 14 | 0.691 | 1797 | 54 |
| 0.1-0.5 ppm Au | 83 | 29 | 0.276 | 1340 | 25 |
| <0.1 ppm Au | 94 | 32 | 0.027 | 241 | 8 |
The overall gold grade distribution is summarized in Table 3. This is a low grade system, and the amount of high grade found within the low-grade blanket will determine whether or not this target can be economical.
Table 3. Distribution of gold grades in 247 rock samples collected at Baimashi North Target | |||||||
Grade Range (ppm Au) | <0.1 | 0.1 -- 0.5 | 0.5 -- 2 | 2 -- 4 | 4 -- 6 | 6 -- 8 | >8 |
% of Total | 18 | 32 | 33 | 9.3 | 3.2 | 1.6 | 2.4 |
The rock samples collected within this zone tested a variety of geologic features and they can be grouped into vein/fault, dike-related, and altered rock types. The carbonate veins and altered faults usually range from 0.1m to1.0m wide, and the sampling often includes some of the surrounding low-grade wallrock. Altered dikes and dike margins were also sampled as a separate rock type, as were several zones of altered phyllitic limestone (the "altered rock type") hosting stock work-type carbonate veinlets.
Averaged Au-As sample results for these three rock groups are compared in Table 4. Based on the As: Au ratios, arsenic values look to be following the intrusive dikes and sills, which suggests a congeneric relationship between the intrusive plumbing and Au-As mineralization. In contrast, the lower As: Au ratio seen in the vein/fault type is attributed to post-intrusion mineralization in younger, more dilatant zones.
| Table 4. Comparison of Au-As mineralization in major sample types at Baimashi North Target | |||
Sample Type | Ave. Au (ppm) | Ave. As (ppm) | As/Au Ratio |
V: Vein/Fault type | 2.190 | 2185 | 997 |
D: Dike related | 0.951 | 1726 | 1815 |
R: Altered rock type | 0.958 | 1325 | 1383 |
Drilling completed in 2014
The Company's 2014 exploration program at its Yejiaba Gold Project in southern Gansu, PRC was concluded on January 1, 2015. Starting in July 2014, four diamond holes were drilled for a total of 870.35m within the Baimashi North Target, testing an area of widespread artisanal mining activity that displayed favorable potential for hosting a bulk-tonnage, low grade gold system. This scout drilling program evaluated a variety of Au-As geochemical anomalies and Au-bearing structures identified by Minco's 2013/2014 surface and underground sampling within an area measuring 1000m long by 500m wide. The Baimashi drill results received so far from SGS are tabulated in Table 5:
| Table 5. Significant gold intercepts in drill holes at the Yejiaba Project. | |||||
| Hole # | From (m) | To (m) | Interval (m) | Au (g/t) | |
| Baimashi North Target Zone | BMS-14-001 (223.57m TD) | 9.00 | 22.02 | 13.02 | 0.346 |
| 191.94 | 192.74 | 0.8 | 6.948 | ||
| 192.74 | 196.37 | 3.63 | 0.902 | ||
| 198.50 | 199.44 | 4.96 | 1.156 | ||
| BMS-14-002 (211.37m TD) | 29.47 | 31.86 | 2.39 | 0.391 | |
| BMS-14-003 (182.23m TD) | 33.80 | 36.00 | 2.20 | 0.331 | |
| 82.75 | 84.82 | 2.07 | 0.392 | ||
| BMS-14-004 (253.18m TD) | 18.20 | 20.20 | 2.00 | 0.498 | |
| 35.00 | 36.00 | 1.00 | 0.498 | ||
| 78.30 | 79.10 | 0.80 | 1.076 | ||
| 176.73 | 177.73 | 1.00 | 0.934 | ||
| 222.10 | 223.10 | 1.00 | 2.694 | ||
| 244.00 | 245.00 | 1.00 | 0.329 | ||
The first hole at BMS-14-004 hosts the best gold results, with several intervals of low-grade mineralization punctuated by a high-grade vein intercept (0.8m @ 6.948 g/t) at 192m. The gold mineralization seen in the drill holes did not have higher gold grades at depth which greatly diminished the potential for a bulk tonnage deposit within North Baimashi target. Potential exists for low-tonnage, vein-type mineralization of moderate grade (2.5g/t to 7g/t) along narrow (generally <1m thick), high-angle shears and dike contacts.
Yangshan and Xicheng East
During 2015, the Company did not conduct any exploration activities on these two projects except for maintaining the exploration permits in respect of the projects.
On December 13, 2013, Minco China entered into an agreement with Gansu Yuandong Investment Co., Ltd ("YDIC") pursuant to which the Company agreed to sell two exploration permits in the Xicheng East and Yangshan area to YDIC for RMB 0.8 million ($170,973). The process of transferring the titles of the two permits to YDIC had not been completed as at December 31, 2015 due to the pending approval by Gansu province.
On December 26, 2014, Minco China entered into an agreement with Beijing Runlong Investment Limited Company ("Beijing Runlong") in which the Company agreed to sell four exploration permits in the Yangshan area to Beijing Runlong for total cash proceeds of RMB 3,200,000 ($604,618).
Beijing Runlong must make the following payments to Minco China:
| iv) | 5% of the total cash proceeds within 20 working days from the date of signing the agreement (not received); |
| v) | 45% of the total cash proceeds upon receiving the approval of the transfer from the Provincial land and resources administrative authority, before submitting to the Ministry of Land and Resources (not received); and |
| vi) | 50% of the total cash proceeds within 5 days upon receiving the approved exploration rights license (not received). |
The process of transferring the titles to the four permits to Beijing Runlong was pending approval by Gansu province and the proceeds were not received as at December 31, 2015. The Company did not record any receivable due to the uncertainty of collectability and is actively following up with the collection of the receivable through Minco China.
2.3 Tugurige Gold project
On December 16, 2010, Minco China entered into a JV agreement with 208 Team, a subsidiary of China National Nuclear Corporation, to acquire a 51% equity interest in the Tugurige Gold Project located in Inner Mongolia, China. The 208 Team did not comply with certain of its obligations under the JV Agreement, including its obligation to set up a new entity (the "JV Co") and the transfer of its 100% interest in the Tugurige Gold Project to the JV Co. As a result, Minco China commenced legal action in China seeking compensation.
On March 25, 2013, Minco China settled its claim against the 208 Team relating to the JV Agreement for an amount of RMB 14 million ($2.4 million). The Company received RMB 5 million ($801,395) during 2013 and recognized a receivable of RMB 4 million ($699,688) (settled in 2014) as at December 31, 2013. The Company recognized a gain on the legal settlement, net of accrued legal fees of RMB 900,000 ($157,425) during the year ended December 31, 2013.
On January 4, 2015, Minco China engaged a Chinese law firm to recommence legal action against 208 Team to recover the remaining RMB 5 million ($1,014,734) unpaid balance on a contingent fee basis whereby the Company will pay the Chinese law firm 50% of the net amount recovered.
On May 6, 2015, Minco China reached an agreement to settle its claim against the 208 Team for an amount of RMB 5.5 million ($1,138,472). The payments are to be received in following manner:
| i) | On the signing date of the agreement- RMB 500,000 ($103,490) (received on May 7, 2015) |
| ii) | On or before September 17, 2015- RMB 2,000,000 ($405,894) |
| iii) | On or before August 7, 2015, RMB 3,000,000 ($608,840) |
The amount receivable of the above is the second component of the Retained Assets kept by the Company through the trust agreement with Minco China.
As at December 31, 2015, the Company had received RMB 500,000 ($103,490). The remaining RMB 5 million ($1,014,734) balances due under the legal settlement were not recognized due to the uncertainty of collectability. The Company is actively collecting the remaining balance through further legal action. The Company recognized a gain on the legal settlement of RMB 250,000 ($51,745), net of accrued legal fees during the year ended December 31, 2015.
2.4 Gold Bull Mountain Project
Yuanling Minco's wholly owned subsidiary Huaihua Tiancheng owned the Gold Bull Mountain exploration permit. The Company has renewed the exploration permit to June 28, 2017.
On June 28, 2014, Minco China, the parent company of Yuanling Minco entered into a sale agreement to dispose of its interest in Yuanling Minco for RMB 7 million ($1.2 million).
The buyer agreed to make the following payments to Minco China:
| i) | 30% of the selling price within 7 days from the date of signing this agreement (received); |
| ii) | 55% of the selling price prior to the formal transfer request being submitted to the governing authorities; and |
| iii) | 15% upon completing the transfer and obtaining all governing authorities' approval. |
As at December 31, 2014, the Company issued a notice of termination as the buyer failed to make the remaining payments within the specified period resulting in a breach in the agreement.
The Gold Bull Mountain Project is the third component of the Retained Assets and is owned by the Company through a trust arrangement with Minco China (and its subsidiary Yuanling Minco).
3. Results of Operations
3.1 Selected Annual Information
The following table summarizes selected financial information for the three most recently completed financial years:
Selected information for 2015, 2014 and 2013 is as follows:
| Year Ended December 31, | ||||||||||||
| 2015 | 2014 | 2013 | ||||||||||
| $ | $ | $ | ||||||||||
| Net income (loss) attributable to shareholders | 14,361,342 | (7,354,162 | ) | (3,144,525 | ) | |||||||
| Net income (loss) for the year | 14,320,556 | (7,497,794 | ) | (2,943,305 | ) | |||||||
| Income (loss) per share attributable to shareholders – basic and diluted | 0.28 | (0.15 | ) | (0.06 | ) | |||||||
| Income (loss) per share – basic and diluted | 0.28 | (0.15 | ) | (0.06 | ) | |||||||
| Total assets | 16,521,288 | 9,405,439 | 16,246,355 | |||||||||
| Total long-term financial liabilities | - | - | - | |||||||||
| Cash dividends declared per share for each class of share | - | - | - | |||||||||
For the year ended December 31, 2015 and 2014
Net income for the year ended December 31, 2015 was $14,320,556 (income of $0.28 per share) compared to net loss of $7,497,794 (loss of $0.15 per share) for the comparative period of 2014. The income during the year was mainly due to the gain of $15,060,170 on sale of Minco Resources, partially offset by operating expense of $1,322,488 and $793,081 exploration cost.
The Company's administrative expenses in 2015 were $1,322,488 compared to $1,848,938 in the comparative period of 2014. The decrease was mainly due to a decrease in share-based compensation of $217,340 and an increase in foreign exchange gain of $226,470.
For the year ended December 31, 2014 and 2013
Net loss for the year ended December 31, 2014 was $7,497,794 (loss of $0.15 per share) compared to net loss of $2,943,305 (loss of $0.06 per share) for the comparative period of 2013. The increase in net loss during the year was mainly due to the impairment recorded on the equity investment in Minco Silver of $4,205,816 and loss of partial disposal of investment in Minco Silver of $399,536 recorded in 2014. The net loss for the year ended December 31, 2013 included a gain of $1.34 million on a legal settlement with the 208 team and also an exploration costs recovery of $622,293 received by Mingzhong.
The Company's administrative expenses in 2014 were $1,848,938 compared to $2,734,091 in the comparative period of 2013. The decrease was mainly due to a decrease in share-based compensation.
3.2 Fourth Quarter
For the three months ended December 31, 2015 and 2014
Net income for the three months ended December 31, 2015 was $1,835,043 (income of $0.04 per share) compared to a net loss of $4,469,480 (loss of $0.09 per share) for the comparative period of 2014.
The net income of $1,835,043 is mainly comprised of incurring exploration expenses of $194,428, operating expenses of $287,296, foreign exchange gain of $179,569, and other income of $2,137,239, which is mainly related to the change of carrying value of the Company's equity investment in Minco Silver and the sales of Minco Resources and its subsidiaries.
Exploration costs for the three months ended December 31, 2015 were $194,428 compared to $322,904 incurred for the comparative period in 2014. Administrative expenses for the three months ended December 31, 2015 were $287,296, exclusive of foreign exchange gain of $179,569, compared to $417,628, exclusive of foreign exchange loss of $9,993, for the comparative period of 2014.
3.3 Exploration Costs
The following is a summary of exploration costs incurred by each project:
| Accumulative to | ||||||||||||||||
| December 31, | December 31, | December 31, | December 31, | |||||||||||||
| 2015 | 2014 | 2013 | 2015 | |||||||||||||
| $ | $ | $ | $ | |||||||||||||
| Longnan projects | 626,815 | 894,646 | 1,262,074 | 12,367,711 | ||||||||||||
| Changkeng gold project (*) | 122,652 | 244,784 | (361,010 | ) | 8,285,703 | |||||||||||
| Gold Bull Mountain | 43,508 | 36,862 | 24,031 | 2,316,611 | ||||||||||||
| Sihui | 106 | 1,525 | 2,863 | 6,099 | ||||||||||||
| 793,081 | 1,177,817 | 927,958 | 22,976,125 | |||||||||||||
During the year ended December 31, 2015 and 2014, the Company did not conduct any exploration activities on the Changkeng and Gold Bull Mountain projects, except for maintaining the exploration permits.
(*) During the year ended December 31, 2013, the Company recorded a refund from 757 Exploration Team of $622,293 for certain exploration costs incurred during the early stage of the Changkeng gold project. The refunded amount was recorded as an exploration cost recovery.
3.4 Administrative Expenses
The Company's administrative expenses include overhead associated with administering and financing of the Company's development activities.
The following table is a summary of the Company's administrative expenses for the three months and the years ended December 31, 2015, 2014 and 2013:
Three months ended December 31, | Year ended December 31, | |||||||||||||||||||||||
| Administrative expenses | 2015 | 2014 | 2013 | 2015 | 2014 | 2013 | ||||||||||||||||||
| Accounting and audit | 36,019 | 25,824 | 24,896 | 152,777 | 105,423 | 111,905 | ||||||||||||||||||
| Amortization | 1,013 | 15,826 | 16,328 | 34,781 | 67,180 | 66,746 | ||||||||||||||||||
| Consulting | 34,180 | 2,429 | 2,533 | 78,267 | 11,633 | 30,453 | ||||||||||||||||||
| Directors' fees | 26,000 | 13,000 | 11,000 | 73,124 | 54,188 | 49,749 | ||||||||||||||||||
| Foreign exchange (gain) loss | (179,569 | ) | 9,993 | 8,411 | (209,493 | ) | 16,977 | 19,692 | ||||||||||||||||
| Investor relations | 453 | 1,014 | 10,737 | 37,051 | 24,726 | 116,814 | ||||||||||||||||||
| Legal and regulatory | (13,757 | ) | 53,839 | 14,457 | 144,844 | 140,727 | 132,506 | |||||||||||||||||
| Office administration expenses | 61,874 | 78,090 | 87,057 | 384,804 | 366,836 | 360,894 | ||||||||||||||||||
| Property investigation | 30,840 | 18,112 | 18,774 | 81,407 | 74,948 | 112,863 | ||||||||||||||||||
| Salaries and benefit | 66,461 | 154,620 | 254,590 | 388,887 | 618,926 | 655,585 | ||||||||||||||||||
| Share-based compensation | 42,357 | 32,035 | 141,509 | 80,248 | 297,588 | 993,331 | ||||||||||||||||||
| Travel and transportation | 1,856 | 22,839 | 18,568 | 75,791 | 69,786 | 83,553 | ||||||||||||||||||
| 107,727 | 427,621 | 608,860 | 1,322,488 | 1,848,938 | 2,734,091 | |||||||||||||||||||
Legal, regulatory and filing expenses for the year ended December 31, 2015 were $144,844 which was consistent with $140,727 for the comparative period of 2014.
Legal, regulatory and filing expenses were $53,839 for the three months ended December 31, 2014 compared to $14,457 for the comparative period of 2013. The increase was due to the Company engaging an external legal counsel to assist with general corporate matters during the fourth quarter of 2014.
Legal, regulatory and filing expenses for the year ended December 31, 2014 were $140,727, which was consistent with $132,506 for the comparative period of 2013. The increase was due to the same reason described above.
Office administrative expenses
Office administrative expenses were $61,874 for the three months ended December 31, 2015 compared to $78,090 for the comparative period of 2014. The decrease was due to the close of the Chinese office after the Transaction.
Office administrative expenses were $384,804 for the year ended December 31, 2015, comparing to $366,836 for the comparative period of 2014. During 2015, the Company incurred more administrative expenses in connection with increased business activities which have been mostly offset by a cut down of expenses arising from the shutdown of the Chinese office after the Transaction.
Office administrative expenses were $78,090 for the three months ended December 31, 2014 which is consistent with $87,057 for the comparative period of 2013.
Office administrative expenses were $366,836 for the year ended December 31, 2014, which was in line with $360,894 for the comparative period of 2013.
Property investigation
Property investigation expenses for the three months ended December 31, 2015 were $30,840 compared to $18,112 for the comparative period of 2014. The increase was due to more work performed during three months ended December 31, 2015.
Property investigation expenses for the year ended December 31, 2015 were $81,407 which was consistent with $74,948 for the comparative period of 2014.
Property investigation expenses for the three months ended December 31, 2014 were $18,112, which was consistent with $18,774 incurred for the comparative period of 2013.
Property investigation expenses for the year ended December 31, 2014 were $74,948 compared to $112,863 for the comparative period of 2013. The decrease was due to the Company's Vice President of Business Development reducing his time spent on the Company's operations during 2014
Salaries and benefit
Salaries and benefit expense for the three months ended December 31, 2015 was $66,461 compared to $154,620 for the comparative period of 2014. The decrease was due to the close of Chinese offices in the middle of 2015.
Salaries and benefit expense for the year ended December 31, 2015 were $388,887 compared to $618,926 for the comparative period of 2014. The decrease was due to the same reason described above.
Salaries and benefit expense for the three months ended December 31, 2014 was $154,620 compared to $254,590 for the comparative period of 2013. The decrease was due to a one-time management bonus recorded in 2013 and also due to the departure of the former CFO during 2014.
Salaries and benefit expense for the year ended December 31, 2014 were $618,926 compared to $655,585 for the comparative period of 2013. The decrease was due to the same reason described above.
Share-based compensation
Share-based compensation expense for the three months ended December 31, 2015 was $42,357 compared to $32,035 for the comparative period of 2014. The increase was due to timing of options granted and vested during these two periods.
Share-based compensation expense for the year ended December 31, 2015 were $80,248 compared to $297,588 for the comparative period of 2014. The decrease was due to timing of options granted and vested during these two periods.
Share-based compensation expense for the three months ended December 31, 2014 was $32,035 compared to $141,509 for the comparative period of 2013. The decrease was due to the lower number of stock options granted and also a lower fair value of stock options granted based on the Black-Scholes option pricing model in 2014 compared to 2013.
Share-based compensation expense was $297,588 for the year ended December 31, 2014 compared to $993,331 for the comparative period of 2013. The decrease was due to the same reason described above.
3.4 Finance and other income (expense)
For the year ended December 31, 2015, the net amount of finance and other income was $15.18 million compared to the finance and other expenses of $4.07 million for the comparative period of 2014. The other gain in 2015 represents a gain from legal settlement of $51,745 (2014-$148,739), interest income of $64,819 (2014 - $17,570), a gain on sale of Minco Resources and its subsidiaries of $15.06 million (2014 - $Nil), net of a loss of $Nil (2014 - $4.21 million) from the impairment in the equity investment in Minco Silver, and a loss of partial disposition of investment in Minco Silver of $Nil (2014 – loss of $0.40 million).
For the year ended December 31, 2014, the net amount of finance and other expense was $4,070,890 compared to the finance and other income of $1,452,290 for the comparative period of 2013. The other loss in 2014 was due to the partial disposal and impairment in the equity investment in Minco Silver of $4,605,352 offset against a gain on sale of exploration permit.
4. Summary of Quarterly Results (unaudited)
| Loss per share | ||||
| Period ended | Net loss attributable to shareholders | Basic | Diluted | |
| 12-31-2015 (******) | 1,835,084 | 0.04 | (0.00) | |
| 09-30-2015(*****) | 16,057,984 | 0.32 | 0.32 | |
| 06-30-2015(****) | 278,997 | 0.01 | 0.01 | |
| 03-31-2015(***) | (3,810,723) | (0.08) | (0.08) | |
| 12-31-2014 (**) | (4,455,430) | (0.09) | (0.09) | |
| 09-30-2014 | (658,961) | (0.01) | (0.01) | |
| 06-30-2014 (*) | (1,335,106) | (0.03) | (0.03) | |
| 03-31-2014 | (904,665) | (0.02) | (0.02) | |
Variations in quarterly performance over the eight quarters can be primarily attributed to changes in dilution gains and losses and equity gains and losses resulting from the Company's investment in Minco Silver. Another contributing factor is the amount of share-based compensation recognized in each period.
(*) Net loss increased to $1.3 million for the period ended September 30, 2014 mainly due to the loss on partial disposition of investment in Minco Silver of $0.4 million.
(**) Net loss increased to $4.4 million for the period ended December 31, 2014 mainly due to the impairment recorded for the equity investment in Minco Silver of $4.2 million.
(***) Net loss increased to $3.8 million for the period ended March 31, 2015 mainly due to the impairment recorded for the equity investment in Minco Silver of $3.5 million.
(****) Net income of $0.3 million for the period ended June 30, 2015 was mainly due to share gain from equity investment in Minco Silver.
(*****) Net income of $16.0 million for the period ended September 30, 2015 was mainly due to a $15.1 million gain from sale of Minco Resources and its subsidiaries.
(******) Net income of $1.8 million for the period ended December 31, 2015 was mainly due to an increase of carrying value of the Company's equity investment in Minco Silver from September 30, 2015.
5. Liquidity and Capital Resources
5.1 Cash Flows
| Year ended December 31, | ||||||||
| 2015 | 2014 | |||||||
| $ | $ | |||||||
| Operating activities | (1,751,341 | ) | (2,721,600 | ) | ||||
| Investing activities | 4,822,688 | 2,583,260 | ||||||
| Financing activities | 17,290 | 331,804 | ||||||
Operating activities
For the year ended December 31, 2015, the Company used $970,259 less in operating activities comparing to the same period of 2014. The decrease was due to less exploration cost and administrative expenses incurred.
Investing activities
For the year ended December 31, 2015, the Company generated $4,822,688 from investing activities. During the year, the Company's cash balance was reduced by $1.35 million as subsidiaries which carried these cash balances were sold to Minco Silver. The Company received a short-term investment as consideration for the sale of the Chinese subsidiaries and redeemed $6,068,564 from these short-term investments. In addition, the Company received RMB 500,000 ($94,472) proceeds from the legal settlement with the 208 Team. In the comparative period of 2014, the Company received RMB 4 million ($720,095) proceeds from the legal settlement with the 208 Team. The Company also obtained proceeds of $1,500,000 from the disposition of some Minco Silver's shares in 2014.
Financing activities
For the year ended December 31, 2015, the Company received $17,290 cash from the exercise of stock option. In the comparative period of 2014, the Company received cash of $73,333 from the exercise of stock options and $258,471 cash advanced from minority shareholders.
5.2 Capital Resources and Liquidity Risk
As at December 31, 2015, the Company's working capital has increased to $9,261,637, compared to a working capital deficiency of $2,093,361 at the year ended 2014. The increase in working capital was primarily due to receiving proceeds from the sale of Minco Resources and its subsidiaries.
The Company does not generate revenues and relies on equity and debt financing for its working capital requirements to fund exploration, permitting and administrative activities. As at December 31, 2015, the Company believes there is sufficient working capital available to meet its current operational requirements.
The Company does not have plans to raise further capital in the next twelve months.
5.3 Contractual Obligations
The Company's contractual obligations are related to a cost sharing agreement between the Company, Minco Silver and Minco Based Metal Corp. ("MBM"), related parties domiciled in Canada, which outlines shared expenses incurred by the three companies including consulting and rental expenses.
The cost sharing agreement is renegotiated or amended by the parties as needed
| Contractual obligations | Total | Less than 1 year | 1 to 3 years | |||||||||
| $ | $ | $ | ||||||||||
| Operating leases (1) | 485,066 | 207,885 | 277,180 | |||||||||
| Other obligations (2) | 566,852 | 566,852 | - | |||||||||
| Total contractual obligations | 1,051,918 | �� | 774,737 | 277,180 | ||||||||
| (1) | Office rental payments – Canada. The Company shared an office in Canada with Minco Silver and Minco Base Metal Corporation, which are related to the Company, for office rent and operating expenses. More details about this sharing arrangement are discussed in the "Transaction with Related Parties" section. The Company has a contract to recover 70% of the operating lease from these two related parties. |
| (2) | Other obligations are comprised of payable to related parties, accounts payable and accrued liabilities that are current as at December 31, 2015. |
6. Off -Balance Sheet Arrangements
The Company does not have any off-balance sheet arrangements.
7. Transactions with Related Parties
Shared expenses
Minco Silver and Minco Gold shared offices and certain administrative expenses in China up to July 31, 2015. Minco Silver, MBM, a company with which the Company's CEO has significant influence, and Minco Gold share offices and certain administrative expenses in Vancouver.
At December 31, 2015, the Company had $177,330 due to Minco Silver (December 31, 2014 – $3,603,848) representing shared office expenses and expenses in relation to the Retained Assets. In 2014, the amount due to Minco Silver comprised $3,700,000 debt owing to Minco Silver and $96,152 of shared expenses due from Minco Silver. On July 31, 2015, this $3,700,000 debt was settled upon the completion of the Transaction with Minco Silver.
At December 31, 2015, the Company had $12,387 due from MBM (December 31, 2014 - $47,696), in relation to shared office expenses.
The amounts due are unsecured, non-interest bearing and payable on demand.
Key management compensation
Key management includes the Company's directors and senior management. This compensation is included in exploration costs and administrative expenses.
For the three months ended and years ended December 31, 2015, 2014 and 2013, the following compensation was paid to key management:
| For the three months ended December 31, | ||||||||||||
| 2015 | 2014 | 2013 | ||||||||||
| $ | $ | $ | ||||||||||
| Cash remuneration | 135,556 | 61,591 | 89,542 | |||||||||
| Share-based compensation | 36,415 | 25,611 | 97,231 | |||||||||
| Total | 171,971 | 87,202 | 186,773 | |||||||||
For the year ended December 31, | ||||||||||||
| 2015 | 2014 | 2013 | ||||||||||
| $ | $ | $ | ||||||||||
| Cash remuneration | 333,729 | 270,693 | 341,537 | |||||||||
| Share-based compensation | 67,405 | 215,202 | 736,294 | |||||||||
| Total | 401,134 | 485,895 | 1,077,831 | |||||||||
The above transactions were conducted in the normal course of business.
8. Critical Accounting Estimates
The preparation of financial statements requires management to use judgment in applying its accounting policies and estimates and assumptions about the future. Estimates and other judgments are continuously evaluated and are based on management's experience and other factors, including expectations about future events that are believed to be reasonable under the circumstances. The following discusses the most significant accounting judgments and estimates that the Company has made in the preparation of the financial statements:
Significant Influence of Minco Silver
Management has assessed the level of influence that the Company has on Minco Silver and determined that it has significant influence even though its shareholding, beginning on April 22, 2014 is below 20%. This is because of the representation on Minco Silver's board, common CEO and other shared management.
Impairment
At each reporting date, management conducts a review to determine whether there is any objective evidence that the investment in associate is impaired. This determination requires significant judgment. In making this judgment, management evaluates among other factors, the movements in the trading share price of Minco Silver and other commercial activities impacting Minco Silver. .
If a test is performed, then the Company recognizes an impairment loss in the statement of income (loss) to the extent that the estimated recoverable amount is less than the carrying value.
As at December 31, 2015, management evaluated its equity investment in Minco Silver for indications that the impairment loss that had been recognized in the first quarter of fiscal 2015 either no longer existed or had decreased. The company concluded that due to the positive developments in Minco Silver, which included the acquisition of Minco Resources and the related activities associated with the Changkeng project, accompanied by a corresponding increase in the market value of Minco Silver's share price, that there were indicators that impairment loss had reversed. As a result, management estimated the recoverable amount and reversed the previously recognized impairment.
9. Accounting Standards Issued but Not Yet Applied
IFRS 9, Financial Instruments, addresses classification and measurement of financial assets. It replaces the multiple category and measurement models in IAS 39 Financial Instruments: Recognition and Measurement for debt instruments with a new mixed measurement model having only two categories: amortized cost and fair value through profit or loss. Requirements for financial liabilities are largely carried forward from the existing requirements in IAS 39 except that fair value changes due to credit risk for liabilities designated at fair value through profit and loss are generally recorded in other comprehensive income. The effective date of this new standard will be for periods beginning on or after January 1, 2018 with early adoption permitted. The Company has not yet assessed the impact of this standard or determined whether it will adopt earlier.
IFRS 16, Leases, replaces the previous leases standard IAS 17, Leases and Related Interpretations, and sets out the principles for the recognition, measurement, presentation and disclosure of leases for both parties to a contract, i.e. the customer (lessee) and the supplier (lessor). Effective January 1, 2019, an entity can choose to apply IFRS 16, but only if it also applies IFRS 15, Revenue from Contracts with Customers. The Company will evaluate the impact of the change to the consolidated financial statements based on the characteristics of leases outstanding at the time of adoption.
10. Financial Instruments
As explained in Note 3 of the December 31, 2015 audited consolidated financial statements, financial assets and liabilities have been classified into categories that determine their basis of measurement and, for items measured at fair value, whether changes in fair value are recognized in the statement of income or comprehensive income. Those categories are: fair value through profit or loss, loans and receivables, available-for-sale and other financial liabilities.
The following table summarizes the carrying value of financial assets and liabilities as at December 31, 2015 and 2014:
| December 31, | December 31, | |||||||
| 2015 | 2014 | |||||||
| Loans and receivables | $ | $ | ||||||
| Cash | 5,593,669 | 2,117,038 | ||||||
| Short-term investment | 4,048,341 | |||||||
| Receivables | 11,122 | 103,175 | ||||||
| Due from related parties | 12,387 | 47,696 | ||||||
| Liabilities | ||||||||
| Accounts payables | 389,522 | 444,915 | ||||||
| Advance from non-controlling interest | - | 453,463 | ||||||
| Due to related party | 177,330 | 3,603,848 | ||||||
The carrying value of the Company's loans and receivables and financial liabilities approximate their fair value.
Financial risk factors
The Company's operations consist of the acquisition, exploration and development of properties in China. The Company examines the various financial risks to which it is exposed and assesses the impact and likelihood of occurrence. These risks may include credit risk, liquidity risk, currency risk and interest rate risk. Management reviews these risks on a monthly basis and when material, they are reviewed and monitored by the Board of Directors.
Credit risk
Counterparty credit risk is the risk that the financial benefits of contracts with a specific counterparty will be lost if the counterparty defaults on its obligations under the contract. This includes any cash amounts owed to the Company by these counterparties, less any amounts owed to the counterparty by the Company where a legal right of set-off exists and also includes the fair value contracts with individual counterparties which are recorded in the consolidated financial statements. The Company considers the following financial assets to be exposed to credit risk:
| · | Cash and cash equivalents– In order to manage credit and liquidity risk the Company places its cash with major financial institutions in two major banks in Canada (subject to deposit insurance up to $100,000). As at December 31, 2015, total cash of $5,593,669 was placed with two institutions. |
| · | Short-term investment – The Company places its short-term investment with a major financial institution in a major bank in Canada. As at December 31, 2015, total short-term investment was $4,048,341. |
Foreign exchange risk
The Company's functional currency is the Canadian dollar in Canada. The foreign currency risk is related to US dollar funds held in the entity. Therefore the Company's net earnings are impacted by fluctuations in the valuation of the US dollar in relation to the Canadian dollar.
The Company does not hedge its exposure to currency fluctuations. The Company has completed a sensitivity analysis to estimate the impact that a change in foreign exchange rates would have on the net loss of the Company, based on the Company's net US$5.6 million monetary assets as at December 31, 2015. This sensitivity analysis shows that a changed of +/- 10% in US$ foreign exchange rate would have a -/+ US$0.6 million impact on net loss.
Interest rate risk
The effective interest rate on financial liabilities (accounts payable) ranged up to 1%. The interest rate risk is the risk that the fair value of future cash flows of a financial instrument fluctuates because of changes in market interest rates. Cash investments held by the Company bear interest at a fixed rate thus exposing the Company to the risk of changes in fair value arising from interest rate fluctuations. A 1% increase in the interest rate in Canada will have a net (before tax) income effect of $96,000 (December 31, 2014 - $21,000), assuming the foreign exchange rate remains constant.
A comprehensive discussion of risk factors is included in the Company's annual report on Form 20-F for the year ended December 31, 2015, dated March 31, 2016, available on SEDAR at www.sedar.com.
12. Disclosure Controls and Procedures and Internal Controls over Financial Reporting
Management has established disclosure controls and procedures to ensure that information disclosed in this MD&A and the related financial statements was properly recorded, processed, summarized and reported to the Company's Board and Audit Committee.
Management has evaluated the effectiveness of the Company's disclosure controls and procedures as at December 31, 2015. As described below, a material weakness was identified in the Company's internal control over financial reporting. A material weakness is a significant deficiency, or combination of significant deficiencies, that results in more than a remote likelihood that a material misstatement of the annual or interim financial statements will not be prevented or detected. As a result of this material weakness, the Company's CEO and CFO have concluded that, as of the end of the period covered by this report, the Company's disclosure controls and procedures were not effective.
Management is also responsible for establishing and maintaining adequate internal controls over financial reporting. Any system of internal control over financial reporting, no matter how well designed, has inherent limitations. Therefore, even those systems determined to be effective can provide only reasonable assurance with respect to financial statement preparation and presentation.
Management evaluated the effectiveness of internal control over financial reporting based on the control framework established in Internal Control - Integrated Framework (2013) issued by the Committee of Sponsoring Organizations of the Treadway Commission. Based upon that assessment, management identified the material weakness described below and, as a result, management concluded that the Company's internal control over financial reporting was not effective as of December 31, 2015.
The material weakness identified by management relates to the lack of financial management oversight of accounting processes around the application of IFRS as it relates specifically to the calculation of the gain on sale of its subsidiary to an associate. This material weakness led to a material post-closing adjustment of $3.4 million which was appropriately corrected in the consolidated financial statements for the year ended December 31, 2015.
Remediation Plan
To remediate the material weakness described above, management plans to strengthen the control procedures relating to accounting for more complex transactions. The Company has recently appointed a new Chief Financial Officer who is tasked with developing and implementing more robust review and oversight processes when there are non-routine and more complex accounting issues.
Other than the material weakness described above, there were no changes in the Company's internal control over financial reporting that occurred during the year ended December 31, 2015 that have materially affected, or are reasonably likely to materially affect, the Company's internal control over financial reporting.
13. Cautionary Statement on Forward-Looking Information
Except for statements of historical fact, this MD&A contains certain "forward looking information" and "forward looking statements" within the meaning of applicable securities laws, which reflect management's current expectations regarding, among other things and without limitation, the Company's future growth, results of operations, performance and business prospects, opportunities, future price of minerals and effects thereof, the estimation of mineral reserves and resources, the timing and amount of estimated capital expenditures, the realization of mineral reserve estimates, costs and timing of proposed activities, plans and budgets for and expected results of exploration timing of proposed activities, plans and budgets for and expected results of exploration activities, exploration and permitting time-lines, requirements for additional capital, government regulation of mining operations, environmental risks, reclamation obligation and expenses, the availability of future acquisition opportunities and use of the proceeds from financing. Generally, forward looking statements and information can be identified by the use of forward looking terminology such as "plans", "expects", "is expected", "budget", "scheduled", "estimates", "forecasts", "intends", "anticipates", "believes" or variations of such words and phrases or statements that certain actions, events or results "may", "could", "would", "might" or "will be taken", "occur" or "be achieved" or the negative connotation thereof.
Forward-looking statements are included throughout this document and include, but are not limited to, statements with respect to: our plans for future exploration programs for our mineral properties; the ability to generate working capital; markets; economic conditions; performance; business prospects; results of operations; capital expenditures; and foreign exchange rates. All such forward-looking statements are based on certain assumptions and analyses made by us in light of our experience and perception of historical trends, current conditions and expected future developments, as well as other factors we believe are appropriate in the circumstances. These statements are, however, subject to known and unknown risks and uncertainties and other factors. As a result, actual results, performance or achievements could differ materially from those expressed in, or implied by, these forward-looking statements and, accordingly, no assurance can be given that any of the events anticipated by the forward-looking statements will transpire or occur, or if any of them do so, what benefits will be derived therefrom. These risks, uncertainties and other factors include, among others: the Company's ability to acquire new mineral properties for the development into a profitable operation, our interest in our mineral properties may be challenged or impugned by third parties or governmental authorities; economic, political and social changes in China; uncertainties relating to the Chinese legal system; failure or delays in obtaining necessary approvals; exploration and development is a speculative business; the Company's inability to obtain additional funding for the Company's projects on satisfactory terms, or at all; hazardous risks incidental to exploration and test mining; the Company has limited experience in placing resource properties into production; government regulation; high levels of volatility in market prices; environmental hazards; currency exchange rates; and the Company's ability to obtain mining licenses and permits in China.
MINCO GOLD CORPORATION
MANAGEMENT'S DISCUSSION AND ANALYSIS
FOR THE THREE AND SIX MONTH ENDED JUNE 30, 2016
This Management's Discussion and Analysis ("MD&A") of Minco Gold Corporation ("we", "our", "us", "Minco Gold" or the "Company") has been prepared on the basis of available information up to August 11, 2016, should be read in conjunction with the unaudited condensed consolidated interim financial statements and notes thereto prepared by management for the three and six months ended June 30, 2016 and the audited consolidated financial statements and notes thereto for the years ended December 31, 2015. The Company's condensed consolidated interim financial statements have been prepared in accordance with International Financial Reporting Standards ("IFRS") as issued by the International Accounting Standards Board ("IASB") applicable to the preparation of interim financial statements, including IAS 34, Interim Financial Reporting. Except as noted, all financial amounts are expressed in Canadian dollars. All references to "$" and "dollars" are to Canadian dollars, all references to "US$" are United States dollars and all references to "RMB" are Chinese Renminbi.
Additional information, including the audited consolidated financial statements for the year ended December 31, 2015, and the MD&A and annual report on Form 20-F for the same year, is available under the Company's profile on SEDAR at www.sedar.com. The Company's audit committee reviews the condensed consolidated interim financial statements and the MD&A, and recommends approval to the Company's board of directors.
Minco Gold (TSX: MMM/NYSE MKT: MGH/FSE: MI5) was incorporated in 1982 under the laws of British Columbia, Canada as Caprock Energy Ltd. The Company changed its name to Minco Gold Corporation in 2007. The principal business activities of the Company include the acquisition, exploration and development of gold-dominant mineral properties.
Until July 31, 2015, the Company had the following six subsidiaries:
Place of incorporation | ownership | |
Minco Resource Limited ("Minco Resources") (i) | Hong Kong | 100% |
Minco Mining (China) Co., Ltd. ("Minco China") (ii) | China | 100% |
Yuanling Minco Mining Ltd ("Yuanling Minco") | China | 100% |
Huaihua Tiancheng Mining Ltd. ("Huaihua Tiancheng) | China | 100% |
Tibet Minco Mining Co. Ltd. ("Tibet Minco") | China | 100% |
Guangzhou Mingzhong Mining Co., Ltd. ("Mingzhong") (iii) | China | 51% |
(i) The Company owned 100% of Minco Resources and Minco Resources owned 100% of Minco China
(ii)Minco China owns 100% of Yuanling Minco, 100% of Huaihua Tiancheng, 100% Tibet Minco and 51% Mingzhong directly and indirectly.
(iii) Mingzhong holds the Changkeng Gold Property and the Changkeng Exploration Permit located in Guangdong Province, China
On July 31, 2015, the Company sold all of the issued and outstanding shares of Minco Resources to Minco Investment Holding HK Ltd. ("Minco Investment"), a wholly owned subsidiary of Minco Silver Corporation ("Minco Silver"). Minco Resources held all of the Company's interests in its five China subsidiaries, namely Minco China. Yuanling Minco, Huaihua Tiancheng, Tibet Minco, and Mingzhong (the "Transaction"). The Transaction completed on July 31, 2015.
Upon the completion of the Transaction, three assets that were previously owned by Minco China have been retained by the Company, namely the Longnan permits, the contingent receivable from a legal settlement with 208 Team, and the Gold Bull Mountain Property (the "Retained Assets'). After the Transaction, the Company ceased to have subsidiary in China. As a result, the Company and Minco China has entered into a trust agreement to enable Minco China holding these Retained Assets in trust for the Company.
As at June 30, 2016, the Company had 50,721,381 common shares and 5,297,334 stock options outstanding, for a total of 56,018,715 common shares outstanding, on a fully diluted basis.
As at the date of this MD&A, the Company had 50,733,381 common shares and 5,285,334 stock options outstanding, for a total of 56,018,715 common shares outstanding, on a fully diluted basis.
Table of Contents
| 14. | Equity Investment in Minco Silver and Mineral Properties update |
| 15. | Results of Operations |
| 16. | Summary of Quarterly Results |
| 17. | Liquidity and Capital Resource |
| 18. | Off – Balance Sheet Arrangements |
| 19. | Transactions with Related Parties |
| 20. | Critical Accounting Estimates |
| 21. | Accounting Standards Issued but Not Yet Applied |
| 22. | Financial Instruments |
| 23. | Risk Factors and Uncertainties |
| 24. | Disclosure Controls and Procedures and Internal Controls over Financing Reporting |
| 25. | Cautionary Statement on Forward Looking Information |
1. Equity Investment in Minco Silver and Mineral Properties Update
Equity Investment in Minco Silver Corporation
As at June 30, 2016, the Company owned 11,000,000 common shares of Minco Silver or 18.31% ownership (December 31, 2015 - 11,000,000 common shares or 18.45 % ownership). The market value, derived from the closing price of Minco Silver's common share at the evaluation dates, of these 11,000,000 common shares of Minco Silver on June 30, 2016 and December 31, 2015 was $13,860,000 and $4,620,000 respectively.
The Company determined that it continued to hold significant influence over Minco Silver despite the Company's ownership is less than 20% of the voting rights of Minco Silver. The Company has the ability to influence Minco Silver through its board representation, common CEO and shared management positions between the Company and Minco Silver. As a result, the Company continues to account for its investment in Minco Silver with the equity method.
Mineral Properties Update
1.2 Longnan Projects
This is the first component of the Retained Assets. Technical Information respecting the Company's Yejiaba Project appearing in this MD&A has been primarily derived from the NI 43-101 compliant technical report entitled "Independent Technical Report on the Yejiaba Gold-Polymetallic Project Gansu Province, P.R. China", dated effective April 29, 2012 and prepared by Calvin R. Herron, P. Geo Ontario, a consultant to the Company and a qualified person for NI 43-101, available on SEDAR at www.sedar.com. Readers should refer to the aforementioned technical report for more information.
After the completion of the Transaction, Minco China held nine exploration permits in the trust for the Company in the Longnan region in the south of Gansu Province in China. The Longnan region is within the southwest Qinling gold field. The Longnan region consists of three projects according to their geographic distribution, type and potential of mineralization.
| Yejiaba: | Includes four exploration permits along a regional structural belt parallel to the Yangshan gold belt. The potential in this area is for polymetallic mineralization (gold-silver-iron-lead-zinc). The Company completed the NI 43-101 compliant technical report (refer to above) on Yejiaba Project, which is available on SEDAR. |
| Yangshan: | Includes four remaining exploration permits located in the northeast extension of the Yangshan gold belt and its adjacent area. |
| Xicheng East: | Includes one exploration permit for the east extension of the Xicheng Pb-Zn mineralization belt. The potential in this area is for polymetallic mineralization (gold-silver-lead-zinc). |
Yejiaba Project
The Yejiaba Project is located along the collisional boundary separating the Huabei and Yangtze Precambrian cratons. This major E-W trending collision zone has localized a number of large gold and polymetallic deposits within a geologic province that is often referred to as the Qinling Orogenic Belt. Gold and polymetallic mineralization on the Company's lease package is generally hosted in Silurian-Devonian, thin-bedded limestone interbedded with phyllite. Mineralization is associated with shears and quartz veins, with higher grades typically found along sheared contacts separating massive limestone from the thin-bedded limestone and phyllite unit. Granite porphyry and quartz diorite dykes tend to be spatially associated with mineralization. Alteration accompanying mineralization consists of weak silicification and pyritization with carbonate veining and secondary carbon. Small quartz veinlets are noted in several places. Associated metals consist of silver, lead, antimony and arsenic.
Semi-regional geochemical anomalies were first delineated by the Company in 2005, extending 10 km along a hydrothermally altered zone that follows a NE trending thrust and regional unconformity.
Subsequent work between 2006 and 2012 has included traverse-line investigations, soil sampling, geologic mapping, geophysical surveys (ground magnetic and IP), trenching and drilling.
To date several targets have been identified and tested including: Shanjinba (Zone 1 and 2), Yaoshang, Fujiawan, Baimashi, Bailuyao, Baojia and Paziba.
The Company engaged an independent consultant to conduct a detailed review of the Yejiaba Project in April 2013, in particular to focus on the Baimashi North and East Targets. The sample work performed on the Yejiaba project during 2013 consisted of 912 rock chip samples, 818 soil samples, 41 stream sediment samples and 339 trench channels. The detailed results at the Baimashi North and East Targets are described below.
The Company completed a drilling program for four drilling targets on its Baimashi North Target in 2014. The detailed assay results are described below.
Sampling and assaying
The channel samples taken in the trenches are generally 10 cm wide; 5 cm deep, lengths are typically 1m but can be slightly longer or shorter to match geological boundaries. Only significant channel sample results are reported below, where composited gold grades are over 0.50 g/t. Reported composites may comprise individual samples with gold assays lower than 0.5g/t if it is deemed that the geology and mineralization is continuous over the interval. Channel sample intervals may not necessarily represent true thickness of the mineralization.
Sample preparation was performed by independent laboratory SGS-Tianjin, at their laboratory in Xian (PRC). Pulps are then analyzed at the SGS-Tianjin assay facility in Tianjin. Sample QAQC methods consisted of insertion of blank and duplicates in the field (one in twenty samples), while SGS-Tianjin inserted analytical duplicates and reference standards into the sample stream at their laboratory.
Baimashi Target
The Baimashi gold-antimony mineralization was discovered on the boundary between Weiziping-Baimashi and Shajinba-Yangjiagou permits and includes the Baimashi North Target that was identified in 2013, located approximately 1Km north of the Baimashi Target; and the Baimashi East Target.
During 2013, the samples in Table 1 were collected within the Baimashi North and East Target. Out of total samples, 118 trench, 75 soil and 37 rock samples were collected from Baimashi East, but the results of these samples demonstrated the gold values in the Baimashi East are tightly confined to narrow structure and thereby effectively diminished the target's size and significance. The Company has no further exploration planned on this target.
All of the exploration conducted during 2013 indicates the Baimashi North Target is the only target that hosts sufficient size and grade potential to produce a substantial gold deposit.
| Table 1. Summary of sample types collected within the Baimashi Targets | |||
| # of Samples | Gold Range (ppm) | Average Au (ppm) | |
Rock Chip | 912 | <0.005 – 47.115 | 0.729 |
Soil | 818 | <0.005 – 3.968 | 0.055 |
Trench Channels | 339 | <0.005 – 14.250 | 0.190 |
Stream Sediment | 41 | <0.005 – 0.226 | 0.015 |
Baimashi North Target
Gold Mineralization Observed within the Baimashi North Target
The Rock Gold Zone shown in Figure 1 represents the distribution of rock chip gold values exceeding 0.100ppm, and the zone boundaries were defined by combining the rock chip and soil sample results together with the structural data. The gold-in-soil distribution fairly represents the gold zone.
Figure1. Outline of Baimashi North Gold Mineralization Zone relative to soil samples results
In Figure 2, the same Rock Gold Zone is shown relative to the distribution of rock chip sample results together with the mapped mineralized structures (shears, veins, dikes). Here again, the sample data fits well within the zone boundaries, which suggests that the soil sample values generally do a fair job of reflecting the rock sample data. The dominantly northeast-trending Rock Gold Mineralization Zone is approximately 1,200m long by 600m wide. It measures 317,000m2 in plain view and is open to the north. The Baimashi North Target certainly possesses sufficient size for hosting a large gold deposit but will need sufficient gold grade as well.
Figure 2. Outline of Baimashi North Gold Mineralization Zone relative to rock chip results and mineralized structures.
Samples collected within the Baimashi North Target
Following the encouraging results found in the third quarter of 2013 described below, a total of 589 soil samples and 39 rock samples were collected within this target during the fourth quarter of 2013. The soil sample results show a gold range from 0.005 to 3.968 ppm (refer to Table 1).
During the year ended December 31, 2013, 247 rock chip samples, 125 soil samples and 41 stream sediment samples within Baimashi North Target were collected.
The 247 rock samples collected within the Rock Gold Mineralization Zone run from 0.005 to 47.115ppm Au and average 1.49ppm, which is a potentially economic grade for an open-pit operation if this grade can be maintained. A rough analysis of the rock sample data is presented in Table 2, where we see a high percentage of samples (39%) carrying gold values exceeding 0.5 g/t, while 68% run in excess of 0.1 g/t. Six samples included in the >3.0 ppm Au category in Table 2 exceed 10ppm Au. If these six high-grade samples are taken out, the overall average grade drops to 1.00ppm, which illustrates the weight carried by high-grade numbers in this zone.
| Table 2. Summary of rock chip sample results (excludes dumps). | |||||
| Sample Ranges | Number of Samples | % of Total Samples | Average Au (ppm) | Average As (ppm) | Average Sb (ppm) |
| >3.0 ppm Au | 22 | 8 | 8.391 | 4292 | 99 |
| 1.0-3.0 ppm Au | 48 | 17 | 1.764 | 2358 | 66 |
| 0.5-1.0 ppm Au | 41 | 14 | 0.691 | 1797 | 54 |
| 0.1-0.5 ppm Au | 83 | 29 | 0.276 | 1340 | 25 |
| <0.1 ppm Au | 94 | 32 | 0.027 | 241 | 8 |
The overall gold grade distribution is summarized in Table 3. This is a low grade system, and the amount of high grade found within the low-grade blanket will determine whether or not this target can be economical.
| Table 3. Distribution of gold grades in 247 rock samples collected at Baimashi North Target | |||||||
Grade Range (ppm Au) | <0.1 | 0.1 -- 0.5 | 0.5 -- 2 | 2 -- 4 | 4 -- 6 | 6 -- 8 | >8 |
% of Total | 18 | 32 | 33 | 9.3 | 3.2 | 1.6 | 2.4 |
The rock samples collected within this zone tested a variety of geologic features and they can be grouped into vein/fault, dike-related, and altered rock types. The carbonate veins and altered faults usually range from 0.1m to1.0m wide, and the sampling often includes some of the surrounding low-grade wallrock. Altered dikes and dike margins were also sampled as a separate rock type, as were several zones of altered phyllitic limestone (the "altered rock type") hosting stock work-type carbonate veinlets.
Averaged Au-As sample results for these three rock groups are compared in Table 4. Based on the As: Au ratios, arsenic values look to be following the intrusive dikes and sills, which suggests a congeneric relationship between the intrusive plumbing and Au-As mineralization. In contrast, the lower As: Au ratio seen in the vein/fault type is attributed to post-intrusion mineralization in younger, more dilatant zones.
| Table 4. Comparison of Au-As mineralization in major sample types at Baimashi North Target | |||
Sample Type | Ave. Au (ppm) | Ave. As (ppm) | As/Au Ratio |
V: Vein/Fault type | 2.190 | 2185 | 997 |
D: Dike related | 0.951 | 1726 | 1815 |
R: Altered rock type | 0.958 | 1325 | 1383 |
Drilling completed in 2014
The Company's 2014 exploration program at its Yejiaba Gold Project in southern Gansu, PRC was concluded on January 1, 2015. Starting in July 2014, four diamond holes were drilled for a total of 870.35m within the Baimashi North Target, testing an area of widespread artisanal mining activity that displayed favorable potential for hosting a bulk-tonnage, low grade gold system. This scout drilling program evaluated a variety of Au-As geochemical anomalies and Au-bearing structures identified by Minco's 2013/2014 surface and underground sampling within an area measuring 1000m long by 500m wide. The Baimashi drill results received so far from SGS are tabulated in Table 5:
| Table 5. Significant gold intercepts in drill holes at the Yejiaba Project. | |||||
| Hole # | From (m) | To (m) | Interval (m) | Au (g/t) | |
| Baimashi North Target Zone | BMS-14-001 (223.57m TD) | 9.00 | 22.02 | 13.02 | 0.346 |
| 191.94 | 192.74 | 0.8 | 6.948 | ||
| 192.74 | 196.37 | 3.63 | 0.902 | ||
| 198.50 | 199.44 | 4.96 | 1.156 | ||
| BMS-14-002 (211.37m TD) | 29.47 | 31.86 | 2.39 | 0.391 | |
| BMS-14-003 (182.23m TD) | 33.80 | 36.00 | 2.20 | 0.331 | |
| 82.75 | 84.82 | 2.07 | 0.392 | ||
| BMS-14-004 (253.18m TD) | 18.20 | 20.20 | 2.00 | 0.498 | |
| 35.00 | 36.00 | 1.00 | 0.498 | ||
| 78.30 | 79.10 | 0.80 | 1.076 | ||
| 176.73 | 177.73 | 1.00 | 0.934 | ||
| 222.10 | 223.10 | 1.00 | 2.694 | ||
| 244.00 | 245.00 | 1.00 | 0.329 | ||
The first hole at BMS-14-004 hosts the best gold results, with several intervals of low-grade mineralization punctuated by a high-grade vein intercept (0.8m @ 6.948 g/t) at 192m. The gold mineralization seen in the drill holes did not have higher gold grades at depth which greatly diminished the potential for a bulk tonnage deposit within North Baimashi target. Potential exists for low-tonnage, vein-type mineralization of moderate grade (2.5g/t to 7g/t) along narrow (generally <1m thick), high-angle shears and dike contacts.
Partial Disposition
On December 13, 2013, Minco China entered into an agreement with Gansu Yuandong Investment Co., Ltd ("YDIC") pursuant to which the Company agreed to sell two exploration permits in the Xicheng East and Yejiaba area to YDIC for RMB 0.8 million ($170,973).
On December 26, 2014, Minco China entered into an agreement with Beijing Runlong Investment Limited Company ("Beijing Runlong") in which the Company agreed to sell four exploration permits in the Yangshan area to Beijing Runlong for total cash proceeds of RMB 3,200,000 ($604,618).
Beijing Runlong must make the following payments to Minco China:
| vii) | 5% of the total cash proceeds within 20 working days from the date of signing the agreement (not received); |
| viii) | 45% of the total cash proceeds upon receiving the approval of the transfer from the Provincial land and resources administrative authority, before submitting to the Ministry of Land and Resources (not received); and |
| ix) | 50% of the total cash proceeds within 5 days upon receiving the approved exploration rights license (not received). |
As the proceeds were not received as at June 30, 2016, the Company considers China Runlong is in default of the agreement. The titles of these four permits are still retained by the Company. The Company did not record any receivable due to the uncertainty of collectability and is actively following up with the collection of the receivable through Minco China.
1.2 Gold Bull Mountain Project
This is the second component of the Retained Assets. The exploration permit of this project expires on June 28, 2017.
On June 28, 2014, Minco China entered into a sale agreement to dispose of its interest in Yuanling Minco for RMB 7 million ($1.2 million).
The buyer agreed to make the following payments to Minco China:
| iv) | 30% of the selling price within 7 days from the date of signing this agreement (received); |
| v) | 55% of the selling price prior to the formal transfer request being submitted to the governing authorities; and |
| vi) | 15% upon completing the transfer and obtaining all governing authorities' approval. |
As at December 31, 2014, the Company issued a notice of termination as the buyer failed to make the remaining payments within the specified period resulting in a breach in the agreement.
1.3 Receivable from a legal settlement
On December 16, 2010, Minco China entered into a JV agreement with 208 Team, a subsidiary of China National Nuclear Corporation, to acquire a 51% equity interest in the Tugurige Gold Project located in Inner Mongolia, China. The 208 Team did not comply with certain of its obligations under the JV Agreement, including its obligation to set up a new entity (the "JV Co") and the transfer of its 100% interest in the Tugurige Gold Project to the JV Co. As a result, Minco China commenced legal action in China seeking compensation.
On March 25, 2013, Minco China settled its claim against the 208 Team relating to the JV Agreement for an amount of RMB 14 million ($2.4 million). The Company received RMB 5 million ($801,395) during 2013 and recognized a receivable of RMB 4 million ($699,688) (settled in 2014) as at December 31, 2013. The Company recognized a gain on the legal settlement, net of accrued legal fees of RMB 900,000 ($157,425) during the year ended December 31, 2013.
On May 6, 2015, Minco China reached an agreement to settle its claim against the 208 Team for an amount of RMB 5.5 million ($1,138,472). The payments are to be received in following manner:
| iv) | On the signing date of the agreement- RMB 500,000 ($103,490) (received on May 7, 2015) |
| v) | On or before September 17, 2015- RMB 2,000,000 ($405,894) |
| vi) | On or before August 7, 2015, RMB 3,000,000 ($608,840) |
The amount receivable of the above (RMB 5,000,000) is the third component of the Retained Assets kept by the Company through the trust agreement with Minco China.
The Company, through Minco China, engaged a Chinese law firm to recommence a lawsuit against 208 Team to recover the remaining RMB 5 million unpaid balance on a contingent fee basis whereby the Company will pay the Chinese law firm 50% of the net amount recovered. On May 27, 2016, the Company obtained a judgment from the Highest Court of the People of Republic of China to order the 208 team to repay the Company these RMB5,000,000, which was received on July 27, 2016.
As a result, the Company recognized a gain of $489,000 for the period ended June 30, 2016, which is the gross settlement payment received net of the related legal expenditures.
1.4 Exploration Costs
Exploration expenditures incurred by project (property) are as follows:
Six months ended June 30, | Accumulative to June 30, | |||||||||||
| 2016 | 2015 | 2016 | ||||||||||
| $ | ||||||||||||
| Longnan projects | 108,570 | 369,727 | 12,476,281 | |||||||||
| Changkeng gold project (i) | - | 80,939 | 9,396,703 | |||||||||
| Gold Bull Mountain | 11,198 | 23,067 | 2,327,809 | |||||||||
| Sihui | - | 106 | 6,099 | |||||||||
| 119,768 | 473,839 | 23,095,892 | ||||||||||
(i) Changkeng Property was sold to Minco Silver on July 31, 2015.
During the six months ended June 30, 2016, the exploration expenditures incurred for the Longnan project and the Gold Bull Mountain projects represented the maintenance fees of the exploration permits.
2. Results of Operations
2.1 Results of six months ended June 30, 2016 compared to six months ended June 30, 2015
The Company's operating results of six months ended June 30, 2016 ("2016 Six Months") compared to six months ended June 30, 2015 ("2015 Six Months") are as follows:
| Six months ended June 30, | 2016 | 2015 | 2016-2015 | |||||||||
| $ | $ | $ | ||||||||||
| Exploration costs | 119,768 | 473,839 | (354,071 | ) | ||||||||
| Administrative expenses | 498,501 | 933,886 | (435,385 | ) | ||||||||
| Operating loss | (618,269 | ) | (1,407,725 | ) | 789,456 | |||||||
| Other loss | (307,457 | ) | (2,160,217 | ) | 1,852,760 | |||||||
| Net loss | (925,726 | ) | (3,567,942 | ) | 2,642,216 | |||||||
2.1.1 Exploration Costs
Exploration expenditures incurred by project (property) are as follows:
| Six months ended June 30, | 2016 | 2015 | 2016-2015 | |||||||||
| $ | $ | $ | ||||||||||
| Longnan projects | 108,570 | 369,727 | (261,157 | ) | ||||||||
| Changkeng gold project | - | 80,939 | (80,939 | ) | ||||||||
| Gold Bull Mountain | 11,198 | 23,067 | (11,869 | ) | ||||||||
| Sihui | - | 106 | (106 | ) | ||||||||
| 119,768 | 473,839 | (354,071 | ) | |||||||||
The Company sold Changkeng gold project on July 31, 2015, thus did not have exploration costs during 2016 Six Months. Exploration costs of Longnan and Gold Bull Mountain were lower in 2016 Six Months as the Company limited its expenditures to the maintenance of these permits.
2.1.2 Administrative Expenses
The Company's administrative expenses for six months ended June 30, 2016 and 2015 are as follows:
| Six months ended June 30, | 2016 | 2015 | Note | 2016-2015 | ||||||||||||
| Administrative expenses: | $ | $ | $ | |||||||||||||
| Accounting and audit | 36,115 | 67,417 | (31,302 | ) | ||||||||||||
| Amortization | 2,025 | 29,898 | (27,873 | ) | ||||||||||||
| Consulting | 16,526 | 26,600 | (10,074 | ) | ||||||||||||
| Directors' fees | 27,638 | 29,124 | (1,486 | ) | ||||||||||||
| Investor relations | 10,956 | 23,482 | (12,526 | ) | ||||||||||||
| Legal and regulatory | 74,011 | 129,165 | 2 | (55,154 | ) | |||||||||||
| Office and miscellaneous | 125,478 | 251,110 | 2 | (125,632 | ) | |||||||||||
| Property investigation | 66,450 | 28,486 | 3 | 37,964 | ||||||||||||
| Salaries and benefits | 63,418 | 268,882 | 2 | (205,464 | ) | |||||||||||
| Share-based compensation | 66,854 | 24,542 | 4 | 42,312 | ||||||||||||
| Travel and transportation | 9,030 | 55,180 | (46,150 | ) | ||||||||||||
| 498,501 | 933,886 | 1 | (435,385 | ) | ||||||||||||
Significant changes in administrative expenses are summarized as follows:
(1) The overall administrative expenses decreased significantly during 2016 Six Months compared to the same period in 2015. The administrative expenses incurred during 2015 Six Months included the expenditures of the Company's former subsidiaries that were disposed on July 31, 2015 (see discussion about the Transaction in previous section). As a results, administrative expenses as a whole decreased.
(2) Legal and regulatory, office and miscellaneous, salaries and benefits are significant components of the Company's administrative expenses. These expenditures incurred during six months ended June 30, 2016 were all lower than those of the same period in the last year as the Company did not maintain any subsidiaries during 2016 Six Months as discussed in the above.
(3) Property investigation incurred during 2016 Six Months increased as the Company hired a new consultant in late 2015 to look for new properties and business opportunities.
(4) Share-based compensation expense incurred during 2016 Six Months was higher comparing to the same period of 2015. The increase was due to the vesting of options recently granted in the fourth quarter of 2015.
2.1.3 Finance and other income (loss)
The Company's finance and other income (expenses) for the six months ended June 30, 2016 and 2015 are as follows:
| Six months ended June 30, | 2016 | 2015 | 2016-2015 | |||||||||
| $ | $ | $ | ||||||||||
| Finance income | 32,622 | 18,251 | 14,371 | |||||||||
| Foreign exchange loss | (326,278 | ) | (17,144 | ) | (309,134 | ) | ||||||
| Gain on legal settlement | 489,000 | 51,745 | 437,255 | |||||||||
| Impairment of equity investment in Minco Silver | - | (3,171,647 | ) | 3,171,647 | ||||||||
| Share of gain (loss) from equity investment in Minco Silver | (435,676 | ) | 958,578 | (1,394,254 | ) | |||||||
| Dilution loss | (67,125 | ) | - | (67,125 | ) | |||||||
| (307,457 | ) | (2,160,217 | ) | 1,852,760 | ||||||||
Finance income increased as the Company had more cash and short term investment in 2016 Six Months compared to the same period in 2015.
The Company had a higher foreign exchange loss as the depreciation of the US dollar against the Canadian dollar was higher during 2016 Six Months.
The Company's ownership of its equity investee Minco Silver decreased to 18.31 % on June 30, 2016 from 18.45% on December 31, 2015 when Minco Silver issued shares to entities other than Minco Gold during this period. As the weighted average issuance price of these Minco Silver shares was smaller than Minco Silver's net asset per share before these share issuances, a dilution loss was recorded accordingly.
During 2015 Six Months, the Company concluded its equity investment on Minco Silver had an impairment charge of $3.17 million. There was so similar impairment assessed during 2016 Six Months.
Gain on legal settlement increased as per the discussion in the section "1.3 Receivable from a legal settlement"
2.2 Results of three months ended June 30, 2016 compared to three months ended June 30, 2015
The Company's operating results of three months ended June 30, 2016 ("2016 Q2") compared to three months ended June 30, 2015 ("2015 Q2") are as follows:
| Three months ended June 30, | 2016 | 2015 | 2016-2015 | |||||||||
| $ | $ | $ | ||||||||||
| Exploration costs | 28,770 | 208,905 | (180,135 | ) | ||||||||
| Administrative expenses | 232,706 | 507,913 | (275,207 | ) | ||||||||
| Operating loss | (261,476 | ) | (716,818 | ) | 455,342 | |||||||
| Other income | 416,471 | 985,297 | (568,826 | ) | ||||||||
| Net income | 154,995 | 268,479 | (113,484 | ) | ||||||||
2.1.1 Exploration Costs
Exploration expenditures incurred by project (property) are as follows:
| Three months ended June 30, | 2016 | 2015 | 2016-2015 | |||||||||
| $ | $ | $ | ||||||||||
| Longnan projects | 24,243 | 177,656 | (153,413 | ) | ||||||||
| Changkeng gold project | - | 18,292 | (18,292 | ) | ||||||||
| Gold Bull Mountain | 4,527 | 12,957 | (8,430 | ) | ||||||||
| 28,770 | 208,905 | (180,135 | ) | |||||||||
The Company sold Changkeng gold project on July 31, 2015, thus did not have exploration costs during 2016 Q2. Exploration costs of Longnan and Gold Bull Mountain were lower in 2016 Q2 as the Company limited its expenditures on the maintenance of these permits.
2.1.2 Administrative Expenses
The Company's administrative expenses for three months ended June 30, 2016 and 2015 are as follows:
| Three months ended June 30, | 2016 | 2015 | Note | 2016-2015 | ||||||||||||
| Administrative expenses : | $ | $ | $ | |||||||||||||
| Accounting and audit | 16,543 | 43,272 | (26,729 | ) | ||||||||||||
| Amortization | 1,013 | 13,127 | (12,114 | ) | ||||||||||||
| Consulting | 11,989 | 18,182 | (6,193 | ) | ||||||||||||
| Directors’ fees | 13,138 | 10,124 | 3,014 | |||||||||||||
| Investor relations | 529 | 17,699 | (17,170 | ) | ||||||||||||
| Legal and regulatory | 30,595 | 88,001 | 1 | (57,406 | ) | |||||||||||
| Office and miscellaneous | 65,434 | 129,586 | 1 | (64,152 | ) | |||||||||||
| Property investigation | 35,000 | 2,821 | 2 | 32,179 | ||||||||||||
| Salaries and benefits | 29,106 | 142,010 | 1 | (112,904 | ) | |||||||||||
| Share-based compensation | 23,993 | 11,194 | 3 | 12,799 | ||||||||||||
| Travel and transportation | 5,366 | 31,897 | (26,531 | ) | ||||||||||||
| 232,706 | 507,913 | 1 | (275,207 | ) | ||||||||||||
Significant changes in administrative expenses are summarized as follows:
(1) The overall administrative expenses, among legal and regulatory, office and miscellaneous, salaries and benefits were all lower than those of the same period in the last year as the Company did not maintain any subsidiaries during 2016 Q2 as discussed in the above.
(2) Property investigation incurred during 2016 Q2 increased as the Company hired a new consultant in late 2015 to look for new properties and business opportunities.
(3) Share-based compensation expense incurred during 2016 Q2 was higher comparing to the same period of 2015. The increase was due to the vesting of options recently granted in the fourth quarter of 2015.
2.2.3 Finance and other income (loss)
The Company's finance and other income (expenses) for the three months ended June 30, 2016 and 2015 are as follows:
| Three months ended June 30, | 2016 | 2015 | 2016-2015 | |||||||||
| Finance income | 16,060 | 10,092 | 5,968 | |||||||||
| Foreign exchange loss | 15,411 | 5,299 | 10,112 | |||||||||
| Gain on legal settlement | 489,000 | - | 489,000 | |||||||||
| Recovery of equity investment in Minco Silver | - | 295,027 | (295,027 | ) | ||||||||
| Share of gain (loss) from equity investment in Minco Silver | (46,060 | ) | 674,879 | (720,939 | ) | |||||||
| Dilution loss | (57,940 | ) | - | (57,940 | ) | |||||||
| 416,471 | 985,297 | (568,826 | ) | |||||||||
Finance income increased as the Company had more cash and short term investment in 2016 Q2 compared to the same period in 2015.
The Company had a dilution loss in 2016 Q2 as the Company's ownership of its equity investee Minco Silver decreased when Minco Silver issued shares to entities other than Minco Gold during this period.
3. Summary of Quarterly Results (unaudited)
| Loss per share | |||
| Period ended | Net loss attributable to shareholders | Basic | Diluted |
| 06-30-2016 | 154,995 | 0.00 | 0.00 |
| 03-31-2016 | (1,080,721) | (0.02) | (0.02) |
| 12-31-2015 (******) | 1,835,084 | 0.04 | (0.00) |
| 09-30-2015(*****) | 16,057,984 | 0.32 | 0.32 |
| 06-30-2015(****) | 278,997 | 0.01 | 0.01 |
| 03-31-2015(***) | (3,810,723) | (0.08) | (0.08) |
| 12-31-2014 (**) | (4,455,430) | (0.09) | (0.09) |
| 09-30-2014 | (658,961) | (0.01) | (0.01) |
The Company's quarterly performance is not subject to seasonality. Variations in quarterly performance over the eight quarters were primarily attributed to incidental events such as gain or loss from disposition of assets, impairment charges on the assets, foreign exchange gain and loss, and share-based compensation. The Company's past quarterly performances were also affected by the results of Minco Silver as the Company has been sharing (in a range of 18.31% – 18.45%) of the profit and loss of Minco Silver, an equity investee of the Company.
(**) Net loss increased to $4.4 million for the period ended December 31, 2014 mainly due to the impairment recorded for the equity investment in Minco Silver of $4.2 million.
(***) Net loss increased to $3.8 million for the period ended March 31, 2015 mainly due to the impairment recorded for the equity investment in Minco Silver of $3.5 million.
(****) Net income of $0.3 million for the period ended June 30, 2015 was mainly due to sharing gain from equity investment in Minco Silver.
(*****) Net income of $16.0 million for the period ended September 30, 2015 was mainly due to a $15.1 million gain from the Transaction.
(******) Net income of $1.8 million for the period ended December 31, 2015 was mainly due to an increase of carrying value of the Company's equity investment in Minco Silver from September 30, 2015.
4. Liquidity and Capital Resources
4.1 Cash Flows
| Six months ended June 30, | ||||||||
| 2016 | 2015 | |||||||
| $ | $ | |||||||
| Operating activities | (677,717 | ) | (1,339,852 | ) | ||||
| Investing activities | 230,000 | 1,698,941 | ||||||
| Financing activities | 35,667 | 17,290 | ||||||
Operating activities
For the six months ended June 30, 2016, the Company used $677,717 cash in operating activities compared to $1,339,852 cash used in the comparative period of 2015. The Company used less cash in operating activities as the Company disposed all of its subsidiaries since July 31, 2015.
Investing activities
For the six months ended June 30, 2016, the Company generated $230,000 from investing activities (redemption of short-term investment) compared to $1,703,490 cash generated for the comparative period of 2015. During six months ended June 30, 2015, the Company received $1,600,000 non-refundable deposit in connection with the Transaction with Minco Silver. There was no similar transaction in 2016 Six Months.
Financing activities
For the six months ended June 30, 2016, the Company received $35,667 cash from exercise of stock option compared to $17,290 cash received from the exercise of stock options during the same period in 2015.
4.2 Capital Resources and Liquidity Risk
As at June 30, 2016, the Company's working capital was $8,943,259, compared to $9,261,637 at the year ended 2015. Working capital decreased as the Company has used part of the funds on hand to finance its operations since December 31, 2015. Also the cash maintained in US dollars depreciated against Canadian dollar during this period.
The Company does not generate revenues and relies on equity and debt financing to fund exploration, permitting and administrative activities. As at June 30, 2016, the Company believes there is sufficient working capital available to meet its operational requirements in the next twelve months.
The Company's ability to meet its obligations and finance exploration and development activities over the long-term depends on its ability to generate cash flow through various debt or equity financing initiatives. Capital markets may not be receptive to offerings of new equity from treasury or debt, whether by way of private placements or public offerings. The Company's growth and success is dependent on external sources of financing which may not be available on acceptable terms or at all.
4.3 Contractual Obligations
The Company's contractual obligations are related to a cost sharing agreement between the Company, Minco Silver and Minco Base Metals Corporation ("MBM"), related parties domiciled in Canada, which outlines shared expenses incurred by the three companies including consulting and rental expenses.
As at June 30, 2016, the Company's contractual obligations were not materially changes compared to those at the year ended December 31, 2015. Please refer to the Company's 2015 MD&A, available on SEDAR for details.
5. Off -Balance Sheet Arrangements
The Company does not have any off-balance sheet arrangements.
6. Transactions with Related Parties
Shared office expenses
| a) | Minco Silver and Minco Gold shared offices and certain administrative expenses in Beijing up to July 31, 2015. Minco Silver, MBM, and Minco Gold share offices and certain administrative expenses in Vancouver. MBM is a company over which the Company's CEO has significant influence. |
At June 30, 2016, the Company had $270,280 due to Minco Silver (December 31, 2015 – $177,330) which included the unpaid shared office expenses, and the expenditures Minco Silver had paid on behalf of the Company in connection with the Company's remaining assets in China.
| b) | At June 30, 2016, the Company had $10,658 due from MBM (December 31, 2015 - $12,387), in relation to shared office expenses. |
The amounts due are unsecured, non-interest bearing and payable on demand.
Key management compensation
Key management includes the Company's directors and senior management. This compensation is included in exploration costs and administrative expenses.
Following is a summary of the compensation with key management:
| Three months ended June 30, | Six months ended June 30, | |||||||||||||||
| 2016 | 2015 | 2016 | 2015 | |||||||||||||
| $ | $ | $ | $ | |||||||||||||
| Cash remuneration | 67,880 | 46,600 | 137,776 | 145,000 | ||||||||||||
| Share-based compensation | 16,387 | 9,170 | 53,615 | 19,476 | ||||||||||||
| Total | 84,267 | 55,770 | 191,391 | 164,476 | ||||||||||||
The above transactions were conducted in the normal course of business.
7. Critical Accounting Estimates
The preparation of financial statements requires management to use judgment in applying its accounting policies and estimates and assumptions about the future. Estimates and other judgments are continuously evaluated and are based on management's experience and other factors, including expectations about future events that are believed to be reasonable under the circumstances. The following discusses the most significant accounting judgments and estimates that the Company has made in the preparation of the financial statements:
Significant Influence of Minco Silver
Management has assessed the level of influence that the Company has on Minco Silver and determined that it has significant influence even though its shareholding has dropped below 20% since April 22, 2014. The Company is able to impose significant influence on Minco Silver through its representation on Minco Silver's board, the common CEO and other shared management.
Impairment
At each reporting date, management conducts a review to determine whether there is any objective evidence that the investment in associate is impaired. This determination requires significant judgment. In making this judgment, management evaluates among other factors, the movements in the trading share price of Minco Silver and other commercial activities impacting Minco Silver. If objective evidence of impairment exists, then the Company recognizes an impairment loss in the statement of income (loss) to the extent that the estimated recoverable amount is less than the carrying value.
As at June 30, 2016, the company concluded that due to the positive developments in Minco Silver, which included the acquisition of Minco Resources and the related activities associated with the Changkeng project, accompanied by a corresponding increase in the market value of Minco Silver's share price since the recent year ended December 31, 2015, indication of impairment was not identified.
Impairment losses previously recorded are reversed if the conditions that gave rise to the impairment are no longer present and it has been determined that the asset is no longer impaired as a result. This reversal is recognized in net income in the period the reversal occurs, and is limited by the carrying value that would have been determined, from the application of equity accounting method, had no impairment charge been recognized in prior periods.
8. Accounting Standards Issued but Not Yet Applied
IFRS 9, Financial Instruments, addresses classification and measurement of financial assets. It replaces the multiple category and measurement models in IAS 39 Financial Instruments: Recognition and Measurement for debt instruments with a new mixed measurement model having only two categories: amortized cost and fair value through profit or loss. Requirements for financial liabilities are largely carried forward from the existing requirements in IAS 39 except that fair value changes due to credit risk for liabilities designated at fair value through profit and loss are generally recorded in other comprehensive income. The effective date of this new standard will be for periods beginning on or after January 1, 2018 with early adoption permitted. The Company has not yet assessed the impact of this standard or determined whether it will adopt earlier.
IFRS 16, Leases, replaces the previous leases standard IAS 17, Leases and Related Interpretations, and sets out the principles for the recognition, measurement, presentation and disclosure of leases for both parties to a contract, i.e. the customer (lessee) and the supplier (lessor). Effective January 1, 2019, an entity can choose to apply IFRS 16, but only if it also applies IFRS 15, Revenue from Contracts with Customers. The Company will evaluate the impact of the change to the consolidated financial statements based on the characteristics of leases outstanding at the time of adoption.
9. Financial Instruments
Financial assets and liabilities have been classified into categories that determine their basis of measurement and, for items measured at fair value, whether changes in fair value are recognized in the statement of income or comprehensive income. Those categories are: fair value through profit or loss, loans and receivables, available for sale and other financial liabilities.
The following table summarizes the carrying value of financial assets and liabilities as at June 30, 2016 and December 31, 2015.
| June 30, | December 31, | |||||||
| 2016 | 2015 | |||||||
| Loans and receivables | $ | $ | ||||||
| Cash | 4,855,342 | 5,593,669 | ||||||
| Short-term investment | 3,818,341 | 4,048,341 | ||||||
| Receivables | 530,017 | 11,122 | ||||||
| Due from related parties | 10,658 | 12,387 | ||||||
| Liabilities | ||||||||
| Accounts payables | 122,738 | 389,522 | ||||||
| Due to related party | 270,280 | 177,330 | ||||||
Financial instruments that are not measured at fair value on the balance sheet are represented by cash and cash equivalents, short-term investment, receivable, due from related parties, account payable and accrued liabilities, and due to related parties. The fair values of these financial instruments approximate their carrying value due to their short-term nature.
Financial risk factors
The Company's operations consist of the acquisition, exploration and development of properties in China. The Company examines the various financial risks to which it is exposed and assesses the impact and likelihood of occurrence. These risks may include credit risk, liquidity risk, currency risk and interest rate risk. Management reviews these risks on a monthly basis and when material, they are reviewed and monitored by the Board of Directors.
Credit risk
Counterparty credit risk is the risk that the financial benefits of contracts with a specific counterparty will be lost if the counterparty defaults on its obligations under the contract. This includes any cash amounts owed to the Company by these counterparties, less any amounts owed to the counterparty by the Company where a legal right of set-off exists and also includes the fair value contracts with individual counterparties which are recorded in the consolidated financial statements. The Company considers the following financial assets to be exposed to credit risk:
| · | Cash and cash equivalents– In order to manage credit and liquidity risk the Company places its cash with major financial institutions in two major banks in Canada (subject to deposit insurance up to $100,000). As at June 30, 2016, total cash of $4,855,342 was placed with two institutions. |
| · | Short-term investment – The Company places its short-term investment with a major financial institution in Canada. As at June 30, 2016, total short-term investment was $3,818,341. |
Foreign exchange risk
The Company's functional currency is the Canadian dollar in Canada. The foreign currency risk is related to US dollar funds held by the Company. The Company's net earnings are impacted by fluctuations in the valuation of the US dollar in relation to the Canadian dollar.
The Company does not hedge its exposure to currency fluctuations. The Company has completed a sensitivity analysis to estimate the impact that a change in foreign exchange rates would have on the net loss of the Company, based on the Company's net US$3.7 million monetary assets as at June 30, 2016. This sensitivity analysis shows that a changed of +/- 10% in US$ exchange rate against Canadian dollar would have a -/+ CAD$0.5 million impact on net loss for six months ended June 30, 2016.
Interest rate risk
The effective interest rate on financial liabilities (accounts payable) ranged up to 1%. The interest rate risk is the risk that the fair value of future cash flows of a financial instrument fluctuates because of changes in market interest rates. Cash investments held by the Company bear interest at a fixed rate thus exposing the Company to the risk of changes in fair value arising from interest rate fluctuations. A 1% increase in the interest rate in Canada will have a net (before tax) income effect of $87,000 (December 31, 2015 - $96,000), assuming the foreign exchange rate remains constant.
10. Risks Factors and Uncertainties
A comprehensive discussion of risk factors is included in the Company's annual report on Form 20-F for the year ended December 31, 2015 that is available on SEDAR at www.sedar.com.
11. Disclosure Controls and Procedures and Internal Controls over Financial Reporting
Management has established disclosure controls and procedures to ensure that information disclosed in this MD&A and the related financial statements was properly recorded, processed, summarized and reported to the Company's Board and Audit Committee. Management has evaluated the effectiveness of the Company's disclosure controls and procedures as at June 30, 2016.
As described below, a material weakness was identified in the Company's internal control over financial reporting as at December 31, 2015. A material weakness is a significant deficiency, or combination of significant deficiencies, that results in more than a remote likelihood that a material misstatement of the annual or interim financial statements will not be prevented or detected. As a result of this material weakness, the Company's CEO and CFO have concluded that, as of the end of the period covered by this report, the Company's disclosure controls and procedures were not effective. Management is also responsible for establishing and maintaining adequate internal controls over financial reporting. Any system of internal control over financial reporting, no matter how well designed, has inherent limitations. Therefore, even those systems determined to be effective can provide only reasonable assurance with respect to financial statement preparation and presentation. Management evaluated the effectiveness of internal control over financial reporting based on the control framework established in Internal Control - Integrated Framework (2013) issued by the Committee of Sponsoring Organizations of the Treadway Commission. Based upon that assessment, management identified the material weakness described below and, as a result, management concluded that the Company's internal control over financial reporting was not effective as of December 31, 2015.
The material weakness identified by management relates to the lack of financial management oversight of accounting processes around the application of IFRS as it relates specifically to the calculation of the gain on sale of its subsidiary to an associate. This material weakness led to a material post-closing adjustment of $3.4 million which was appropriately corrected in the consolidated financial statements for the year ended December 31, 2015.
Remediation Plan
To remediate the material weakness described above, management plans to strengthen the control procedures relating to accounting for more complex transactions. The Company has recently appointed a new Chief Financial Officer who is tasked with developing and implementing more robust review and oversight processes when there are non-routine and more complex accounting issues. Other than the material weakness described above, there were no changes in the Company's internal control over financial reporting that occurred during the year ended December 31, 2015 that have materially affected, or are reasonably likely to materially affect, the Company's internal control over financial reporting.
Management is still in the progress in implementing the remediation plan as discussed in the above. As a result, management is in the conclusion that the material weakness identified as at December 31, 2015 still existed as at June 30, 2016.
12. Cautionary Statement on Forward-Looking Information
Except for statements of historical fact, this MD&A contains certain "forward looking information" and "forward looking statements" within the meaning of applicable securities laws, which reflect management's current expectations regarding, among other things and without limitation, the Company's future growth, results of operations, performance and business prospects, opportunities, future price of minerals and effects thereof, the estimation of mineral reserves and resources, the timing and amount of estimated capital expenditures, the realization of mineral reserve estimates, costs and timing of proposed activities, plans and budgets for and expected results of exploration timing of proposed activities, plans and budgets for and expected results of exploration activities, exploration and permitting time-lines, requirements for additional capital, government regulation of mining operations, environmental risks, reclamation obligation and expenses, the availability of future acquisition opportunities and use of the proceeds from financing. Generally, forward looking statements and information can be identified by the use of forward looking terminology such as "plans", "expects", "is expected", "budget", "scheduled", "estimates", "forecasts", "intends", "anticipates", "believes" or variations of such words and phrases or statements that certain actions, events or results "may", "could", "would", "might" or "will be taken", "occur" or "be achieved" or the negative connotation thereof.
Forward-looking statements are included throughout this document and include, but are not limited to, statements with respect to: our plans for future exploration programs for our mineral properties; the ability to generate working capital; markets; economic conditions; performance; business prospects; results of operations; capital expenditures; and foreign exchange rates. All such forward-looking statements are based on certain assumptions and analyses made by us in light of our experience and perception of historical trends, current conditions and expected future developments, as well as other factors we believe are appropriate in the circumstances. These statements are, however, subject to known and unknown risks and uncertainties and other factors. As a result, actual results, performance or achievements could differ materially from those expressed in, or implied by, these forward-looking statements and, accordingly, no assurance can be given that any of the events anticipated by the forward-looking statements will transpire or occur, or if any of them do so, what benefits will be derived therefrom. These risks, uncertainties and other factors include, among others: our interest in our mineral properties may be challenged or impugned by third parties or governmental authorities; economic, political and social changes in China; uncertainties relating to the Chinese legal system; failure or delays in obtaining necessary approvals; exploration and development is a speculative business; the Company's inability to obtain additional funding for the Company's projects on satisfactory terms, or at all; hazardous risks incidental to exploration and test mining; the Company has limited experience in placing resource properties into production; government regulation; high levels of volatility in market prices; environmental hazards; currency exchange rates; and the Company's ability to obtain mining licenses and permits in China.
Although the Company has attempted to identify important factors that could cause actual results to differ materially, there may be other factors that cause results not to be as anticipated, estimated or intended. There can be no assurance that statements containing forward looking information will prove to be accurate as actual results and future events could differ materially from those anticipated in such statements. Accordingly, readers should not place undue reliance on statements containing forward looking information. All of the forward-looking information and statements contained in this document are expressly qualified, in their entirety, by this cautionary statement. The various risks to which we are exposed are described in additional detail under the section entitled "Item 3: Key Information – D. Risk Factors" in the Company's annual report on Form 20-F available on SEDAR at www.sedar.com. The forward-looking information and statements are made as of the date of this document, and we assume no obligation to update or revise them except as required pursuant to applicable securities laws.
SCHEDULE C
INVESTMENT POLICY OF MINCO GOLD CORPORATION
INVESTMENT POLICY
Minco Gold Corporation (the "Company") has adopted an investment policy to govern its investment activities. The investment policy sets out, among other things, the investment objectives and strategy based on the fundamental principles set out below.
Investment Objective
The investment objectives for the Company as an investment issuer are:
| 1. | To seek a high return on investment opportunities, primarily in the mining and natural resource sector; and, |
| 2. | to preserve capital and limit downside risk while achieving a reasonable rate of return by focusing on opportunities with attractive risk to reward profiles. |
Subject to the availability of capital, the Company intends to create a diversified portfolio of investments. A disciplined approach will be applied to the identification, review and assessment of primarily advanced exploration stage and pre-production projects.
The Company does not anticipate the declaration of dividends to shareholders during its initial stages and plans to reinvest the profits of its investments to further the growth and development of the Company's investment portfolio.
Investment Strategy
Investment Strategy
In light of the numerous investment opportunities across the entire natural resources sector, the Company aims to adopt a flexible approach to investment targets without placing unnecessary limits on potential returns on its investment. This approach is demonstrated in the Company's proposed investment strategy set out below.
| Investment Sector: | Natural resources industry, primarily mining but all businesses classified as natural resources may be considered for investment purposes. |
| Investment Types: | Equity, debt, royalties, income and commodity streams, derivatives and any other investment structures or instruments that could be acquired or created. |
| Commodities: | All commodities that comprise natural resources. Such commodities may include, but are not limited to, precious metals, base metals, ferrous metals, non-ferrous metals, industrial metals, non-industrial metals, agricultural minerals, industrial minerals, other minerals, oil, gas, water and forestry products. |
| Jurisdictions: | All countries are permissible depending on the risk assessment of the Board and Management at the time the investment is made and the risk-reward relationship associated with each investment in a particular jurisdiction. |
| Investment Size: | Unlimited, which may result in the Company holding a control position in a target corporation or possibly requiring future equity or debt financings to raise money for specific investments. |
| Investment Timeline: | Not limited. |
| Investment Targets: | Direct project investments either through direct equity in a project, or through a derivative interest such as a royalty, stream or other derivative facility. Investments in public or private corporations, partnership or other legal entities which own, or propose to own, natural resource assets or derivatives of natural resource assets. Distressed situations where a change of management or other restructuring is required to realize the value of the asset. |
| Investment Review: | Will seek to maintain the ability to actively review and revisit all of investments on an ongoing basis. |
| Liquidity: | Will evaluate the liquidity of investments and seek to realize value from same in a prudent and orderly fashion. |
Composition of Investment Portfolio
The nature and timing of the Company's investments will depend, in part, on available capital at any particular time and the investment opportunities identified and available to the Company.
The composition of its investment portfolio will vary over time depending on its assessment of a number of factors including the performance of financial markets and credit risk.
The Company's investments are listed in Schedule "A" attached hereto. The list of investments will be updated from time to time and appended to this investment policy from time to time to reflect changes in the Company's investment portfolio.
Future investments by the Company will not be subject to TSX Venture Exchange approval unless they consist of non-arm's length transaction, involve the issuance of securities by the Company, or involve more than 50% of the Company's working capital or management time.
EXHIBIT "A"
(Minco Gold Corporation - Investment Policy)
As at November 11, 2016, the Company's investments consist:
11,000,000 common shares of Minco Silver Corporation, a public mining company listed on the TSX under the trading symbol MSV. The Company's stake in Minco Silver represents approximately 18.26% of Minco Silver's outstanding share capital (as at November 10, 2016). As at the close of trading on November 10, 2016, the market value of the Minco Silver stake was approximately $12.43 million. The Company has held its investment in Minco Silver since its spin-off from the Company and listing on the Toronto Stock Exchange in 2005. Minco Silver holds a 90% interest in the Fuwan silver deposit, situated along the northeast margin of the prospective Fuwan Silver Belt in Guangdong, China and 51% interest in the Changkeng gold project, located contiguous to, and part of the same mineralized system. Further information with respect to Minco Silver may be found at Minco Silver's website, www.mincosilver.ca
CERTIFICATE OF MINCO GOLD CORPORATION
The foregoing document constitutes full, true and plain disclosure of all material facts relating to the securities of Minco Gold Corporation, assuming the completion of the Change of Business.
DATED: November 11, 2016
| s/ 'Dr. Ken Z. Cai" | s/ "Larry Tsang" | |
DR. KEN Z. CAI President and Chief Executive Officer | LARRY TSANG Interim Chief Financial Officer |
ON BEHALF OF THE BOARD OF DIRECTORS
s/ "Robert M. Callander" | s/ "Michael Doggett" | |
ROBERT M. CALLANDER Director | MICHAEL DOGGETT Director |
ACKNOWLEDGEMENT – PERSONAL INFORMATION
| Re: | Filing Statement of Minco Gold Corporation (the "Company") dated November 11, 2016 (the "Filing Statement") |
For the purposes of this acknowledgment, "Personal Information" means any information about an identifiable individual, and includes information contained in any Items in the Filing Statement that are analogous to Items 4.2, 11, 13.1, 16, 18.2, 19.2, 24, 25, 27, 32.3, 33, 34, 35, 36, 37, 38, 39, 41 and 42 of Form 3D2 Information Required in a Filing Statement for a Reverse Takeover or Change of Business ("Form 3D2") of the TSX Venture Exchange, as applicable.
The undersigned hereby acknowledges and agrees, in his capacity as an officer of the Company and not in his personal capacity, that the Company has obtained the express written consent of each individual to:
| (a) | the disclosure of Personal Information by the Company to the TSXV (as defined in Appendix 6B Acknowledgement - Personal Information of the TSXV ("Appendix 6B")) pursuant to Form 3D2; and |
| (b) | the collection, use and disclosure of Personal Information by the TSXV for the purposes described in Appendix 6B or as otherwise identified by the TSXV, from time to time. |
DATED: November 11, 2016.
MINCO GOLD CORPORATION
Per: | s/ "Dr. Ken Z. Cai" Dr. Ken Z. Cai, President and Chief Executive Officer |