Exhibit 2.2
MINCO GOLD CORPORATION
MANAGEMENT’S DISCUSSION AND ANALYSIS
FOR THE THREE AND NINE MONTH ENDED SEPTEMBER 30, 2016
This Management’s Discussion and Analysis (“MD&A”) of Minco Gold Corporation (“we”, “our”, “us”, “Minco Gold” or the “Company”) has been prepared on the basis of available information up to November 14, 2016, should be read in conjunction with the unaudited condensed consolidated interim financial statements and notes thereto prepared by management for the three and nine months ended September 30, 2016 and the audited consolidated financial statements and notes thereto for the years ended December 31, 2015. The Company’s condensed consolidated interim financial statements have been prepared in accordance with International Financial Reporting Standards (“IFRS”) as issued by the International Accounting Standards Board (“IASB”) applicable to the preparation of interim financial statements, including IAS 34, Interim Financial Reporting. Except as noted, all financial amounts are expressed in Canadian dollars. All references to "$" and "dollars" are to Canadian dollars, all references to “US$” are United States dollars and all references to "RMB" are Chinese Renminbi.
Additional information, including the audited consolidated financial statements for the year ended December 31, 2015, and the MD&A and annual report on Form 20-F for the same year, is available under the Company's profile on SEDAR at www.sedar.com. The Company’s audit committee reviews the condensed consolidated interim financial statements and the MD&A, and recommends approval to the Company’s board of directors.
Minco Gold (TSX: MMM/NYSE MKT: MGH/FSE: MI5) was incorporated in 1982 under the laws of British Columbia, Canada as Caprock Energy Ltd. The Company changed its name to Minco Gold Corporation in 2007. The principal business activities of the Company include the acquisition, exploration and development of gold-dominant mineral properties.
Until July 31, 2015, the Company had the following six subsidiaries:
Place of incorporation | ownership | |
Minco Resource Limited (“Minco Resources”) (i) | Hong Kong | 100% |
Minco Mining (China) Co., Ltd. (“Minco China”) (ii) | China | 100% |
Yuanling Minco Mining Ltd (“Yuanling Minco”) | China | 100% |
Huaihua Tiancheng Mining Ltd. (“Huaihua Tiancheng) | China | 100% |
Tibet Minco Mining Co. Ltd. (“Tibet Minco”) | China | 100% |
Guangzhou Mingzhong Mining Co., Ltd. (“Mingzhong”) (iii) | China | 51% |
(i) The Company owned 100% of Minco Resources and Minco Resources owned 100% of Minco China
(ii)Minco China owns 100% of Yuanling Minco, 100% of Huaihua Tiancheng, 100% Tibet Minco and 51% Mingzhong directly and indirectly.
(iii) Mingzhong holds the Changkeng Gold Property and the Changkeng Exploration Permit located in Guangdong Province, China
On July 31, 2015, the Company sold all of the issued and outstanding shares of Minco Resources to Minco Investment Holding HK Ltd. (“Minco Investment”), a wholly owned subsidiary of Minco Silver Corporation (“Minco Silver”). Minco Resources held all of the Company’s interests in its five China subsidiaries, namely Minco China. Yuanling Minco, Huaihua Tiancheng, Tibet Minco, and Mingzhong (the “Transaction”). The Transaction completed on July 31, 2015.
Upon the completion of the Transaction, three assets that were previously owned by Minco China have been retained by the Company, namely the Longnan permits, the contingent receivable from a legal settlement with 208 Team, and the Gold Bull Mountain Property (the “Retained Assets’). After the Transaction, the Company ceased to have subsidiary in China. As a result, the Company and Minco China has entered into a trust agreement to enable Minco China holding these Retained Assets in trust for the Company.
(1)
As at September 30, 2016, the Company had 50,733,381common shares and 5,285,334 stock options outstanding, for a total of 56,018,715 common shares outstanding, on a fully diluted basis.
As at the date of this MD&A, the Company had 50,733,381 common shares and 5,285,334 stock options outstanding, for a total of 56,018,715 common shares outstanding, on a fully diluted basis.
Table of Contents
| 1. | Equity Investment in Minco Silver and Mineral Properties update |
| 2. | Results of Operations |
| 3. | Summary of Quarterly Results |
| 4. | Liquidity and Capital Resource |
| 5. | Off – Balance Sheet Arrangements |
| 6. | Transactions with Related Parties |
| 7. | Critical Accounting Estimates |
| 8. | Accounting Standards Issued but Not Yet Applied |
| 9. | Financial Instruments |
| 10. | Risk Factors and Uncertainties |
| 11. | Disclosure Controls and Procedures and Internal Controls over Financing Reporting |
| 12. | Cautionary Statement on Forward Looking Information |
1. Equity Investment in Minco Silver and Mineral Properties Update
1.1 Equity investment in Minco Silver Corporation
As at September 30, 2016, the Company owned 11,000,000 common shares of Minco Silver or 18.27% ownership (December 31, 2015 - 11,000,000 common shares or 18.45 % ownership). The market value, derived from the closing price of Minco Silver’s common share at the evaluation dates, of these 11,000,000 common shares of Minco Silver on September 30, 2016 and December 31, 2015 was $15,400,000 and $4,620,000 respectively.
The Company determined that it continued to hold significant influence over Minco Silver despite the Company’s ownership is less than 20% of the voting rights of Minco Silver. The Company has the ability to influence Minco Silver through its board representation, common CEO and shared management positions between the Company and Minco Silver. As a result, the Company continues to account for its investment in Minco Silver with the equity method.
1.2 Mineral properties update
The Company is currently seeking buyers for all of the mineral properties. Details of these mineral properties are as follows:
Longnan Projects
This is the first component of the Retained Assets. Technical Information respecting the Company's Yejiaba Project appearing in this MD&A has been primarily derived from the NI 43-101 compliant technical report entitled "Independent Technical Report on the Yejiaba Gold-Polymetallic Project Gansu Province, P.R. China", dated effective April 29, 2012 and prepared by Calvin R. Herron, P. Geo Ontario, a consultant to the Company and a qualified person for NI 43-101, available on SEDAR at www.sedar.com. Readers should refer to the aforementioned technical report for more information.
After the completion of the Transaction, Minco China held nine exploration permits in the trust for the Company in the Longnan region in the south of Gansu Province in China. The Longnan region is within the southwest Qinling gold field. The Longnan region consists of three projects according to their geographic distribution, type and potential of mineralization.
(2)
| Yejiaba: | Includes four exploration permits along a regional structural belt parallel to the Yangshan gold belt. The potential in this area is for polymetallic mineralization (gold-silver-iron-lead-zinc). The Company completed the NI 43-101 compliant technical report (refer to above) on Yejiaba Project, which is available on SEDAR. |
| Yangshan: | Includes four remaining exploration permits located in the northeast extension of the Yangshan gold belt and its adjacent area. |
| Xicheng East: | Includes one exploration permit for the east extension of the Xicheng Pb-Zn mineralization belt. The potential in this area is for polymetallic mineralization (gold-silver-lead-zinc). |
Yejiaba Project
The Yejiaba Project is located along the collisional boundary separating the Huabei and Yangtze Precambrian cratons. This major E-W trending collision zone has localized a number of large gold and polymetallic deposits within a geologic province that is often referred to as the Qinling Orogenic Belt. Gold and polymetallic mineralization on the Company’s lease package is generally hosted in Silurian-Devonian, thin-bedded limestone interbedded with phyllite. Mineralization is associated with shears and quartz veins, with higher grades typically found along sheared contacts separating massive limestone from the thin-bedded limestone and phyllite unit. Granite porphyry and quartz diorite dykes tend to be spatially associated with mineralization. Alteration accompanying mineralization consists of weak silicification and pyritization with carbonate veining and secondary carbon. Small quartz veinlets are noted in several places. Associated metals consist of silver, lead, antimony and arsenic.
Semi-regional geochemical anomalies were first delineated by the Company in 2005, extending 10 km along a hydrothermally altered zone that follows a NE trending thrust and regional unconformity.
Subsequent work between 2006 and 2012 has included traverse-line investigations, soil sampling, geologic mapping, geophysical surveys (ground magnetic and IP), trenching and drilling.
To date several targets have been identified and tested including: Shanjinba (Zone 1 and 2), Yaoshang, Fujiawan, Baimashi, Bailuyao, Baojia and Paziba.
The Company engaged an independent consultant to conduct a detailed review of the Yejiaba Project in April 2013, in particular to focus on the Baimashi North and East Targets. The sample work performed on the Yejiaba project during 2013 consisted of 912 rock chip samples, 818 soil samples, 41 stream sediment samples and 339 trench channels. The detailed results at the Baimashi North and East Targets are described below.
The Company completed a drilling program for four drilling targets on its Baimashi North Target in 2014. The detailed assay results are described below.
Sampling and assaying
The channel samples taken in the trenches are generally 10 cm wide; 5 cm deep, lengths are typically 1m but can be slightly longer or shorter to match geological boundaries. Only significant channel sample results are reported below, where composited gold grades are over 0.50 g/t. Reported composites may comprise individual samples with gold assays lower than 0.5g/t if it is deemed that the geology and mineralization is continuous over the interval. Channel sample intervals may not necessarily represent true thickness of the mineralization.
Sample preparation was performed by independent laboratory SGS-Tianjin, at their laboratory in Xian (PRC). Pulps are then analyzed at the SGS-Tianjin assay facility in Tianjin. Sample QAQC methods consisted of insertion of blank and duplicates in the field (one in twenty samples), while SGS-Tianjin inserted analytical duplicates and reference standards into the sample stream at their laboratory.
(3)
Baimashi Target
The Baimashi gold-antimony mineralization was discovered on the boundary between Weiziping-Baimashi and Shajinba-Yangjiagou permits and includes the Baimashi North Target that was identified in 2013, located approximately 1Km north of the Baimashi Target; and the Baimashi East Target.
During 2013, the samples in Table 1 were collected within the Baimashi North and East Target. Out of total samples, 118 trench, 75 soil and 37 rock samples were collected from Baimashi East, but the results of these samples demonstrated the gold values in the Baimashi East are tightly confined to narrow structure and thereby effectively diminished the target’s size and significance. The Company has no further exploration planned on this target.
All of the exploration conducted during 2013 indicates the Baimashi North Target is the only target that hosts sufficient size and grade potential to produce a substantial gold deposit.
| Table 1. Summary of sample types collected within the Baimashi Targets | |||
| # of Samples | Gold Range (ppm) | Average Au (ppm) | |
Rock Chip | 912 | <0.005 – 47.115 | 0.729 |
Soil | 818 | <0.005 – 3.968 | 0.055 |
Trench Channels | 339 | <0.005 – 14.250 | 0.190 |
Stream Sediment | 41 | <0.005 – 0.226 | 0.015 |
Baimashi North Target
Gold Mineralization Observed within the Baimashi North Target
The Rock Gold Zone shown in Figure 1 represents the distribution of rock chip gold values exceeding 0.100ppm, and the zone boundaries were defined by combining the rock chip and soil sample results together with the structural data. The gold-in-soil distribution fairly represents the gold zone.
Figure1. Outline of Baimashi North Gold Mineralization Zone relative to soil samples results

(4)
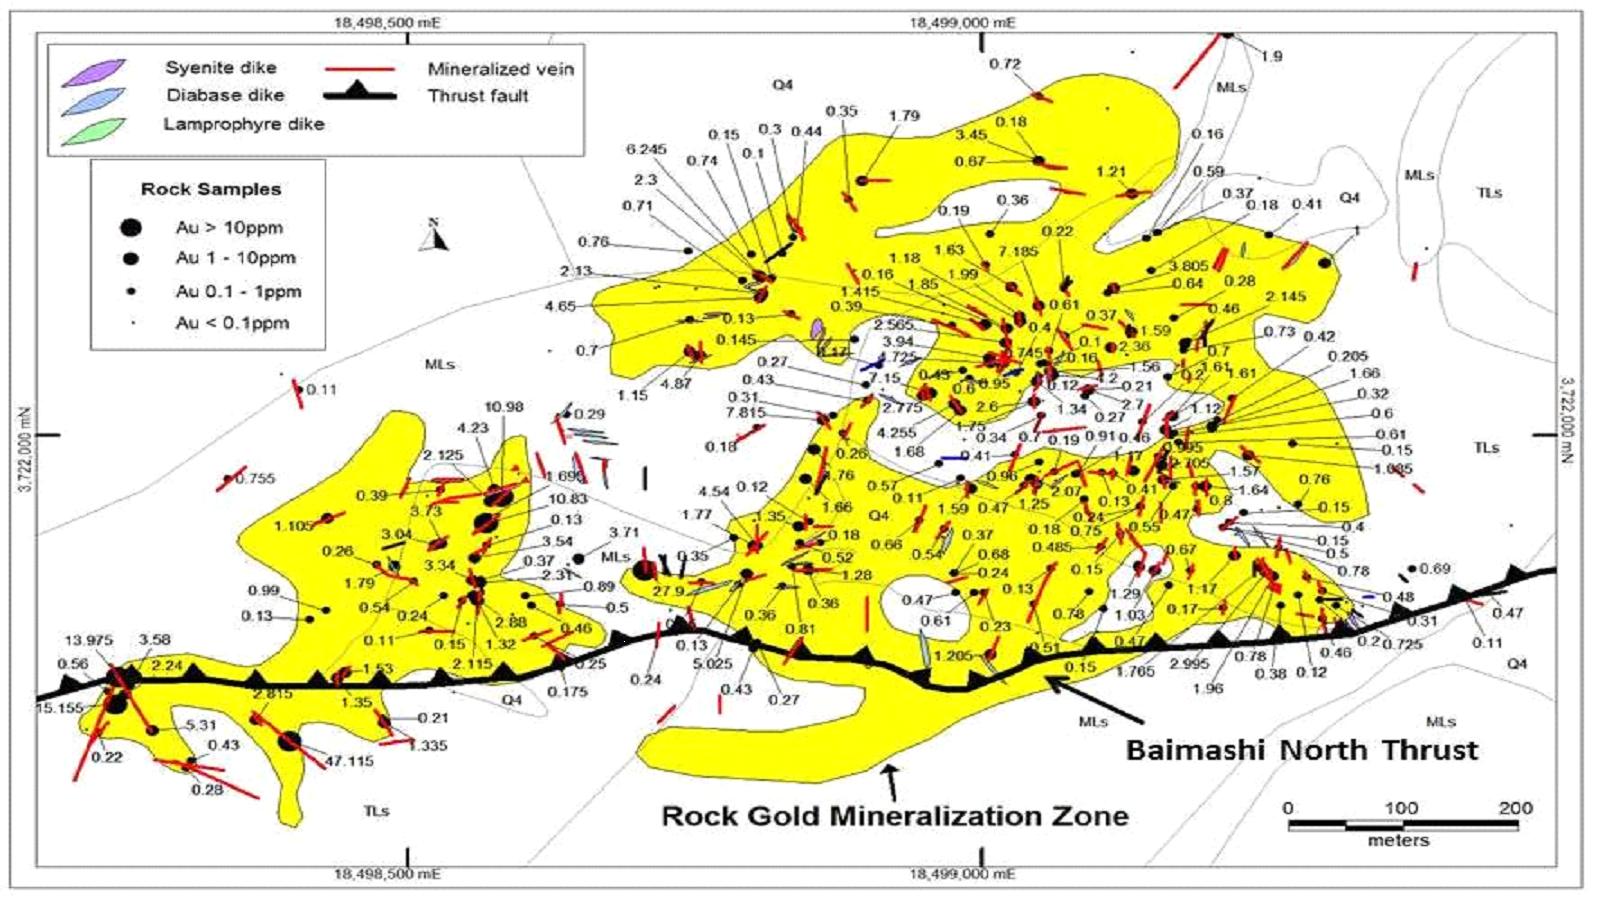
In Figure 2, the same Rock Gold Zone is shown relative to the distribution of rock chip sample results together with the mapped mineralized structures (shears, veins, dikes). Here again, the sample data fits well within the zone boundaries, which suggests that the soil sample values generally do a fair job of reflecting the rock sample data. The dominantly northeast-trending Rock Gold Mineralization Zone is approximately 1,200m long by 600m wide. It measures 317,000m2 in plain view and is open to the north. The Baimashi North Target certainly possesses sufficient size for hosting a large gold deposit but will need sufficient gold grade as well.
Figure 2. Outline of Baimashi North Gold Mineralization Zone relative to rock chip results and mineralized structures.
Samples collected within the Baimashi North Target
Following the encouraging results found in the third quarter of 2013 described below, a total of 589 soil samples and 39 rock samples were collected within this target during the fourth quarter of 2013. The soil sample results show a gold range from 0.005 to 3.968 ppm (refer to Table 1).
During the year ended December 31, 2013, 247 rock chip samples, 125 soil samples and 41 stream sediment samples within Baimashi North Target were collected.
The 247 rock samples collected within the Rock Gold Mineralization Zone run from 0.005 to 47.115ppm Au and average 1.49ppm, which is a potentially economic grade for an open-pit operation if this grade can be maintained. A rough analysis of the rock sample data is presented in Table 2, where we see a high percentage of samples (39%) carrying gold values exceeding 0.5 g/t, while 68% run in excess of 0.1 g/t. Six samples included in the >3.0 ppm Au category in Table 2 exceed 10ppm Au. If these six high-grade samples are taken out, the overall average grade drops to 1.00ppm, which illustrates the weight carried by high-grade numbers in this zone.
(5)
Table 2. Summary of rock chip sample results (excludes dumps). | |||||
| Sample Ranges | Number of Samples | % of Total Samples | Average Au (ppm) | Average As (ppm) | Average Sb (ppm) |
| >3.0 ppm Au | 22 | 8 | 8.391 | 4292 | 99 |
| 1.0-3.0 ppm Au | 48 | 17 | 1.764 | 2358 | 66 |
| 0.5-1.0 ppm Au | 41 | 14 | 0.691 | 1797 | 54 |
| 0.1-0.5 ppm Au | 83 | 29 | 0.276 | 1340 | 25 |
| <0.1 ppm Au | 94 | 32 | 0.027 | 241 | 8 |
The overall gold grade distribution is summarized in Table 3. This is a low grade system, and the amount of high grade found within the low-grade blanket will determine whether or not this target can be economical.
Table 3. Distribution of gold grades in 247 rock samples collected at Baimashi North Target | |||||||
Grade Range (ppm Au) | <0.1 | 0.1 -- 0.5 | 0.5 -- 2 | 2 -- 4 | 4 -- 6 | 6 -- 8 | >8 |
% of Total | 18 | 32 | 33 | 9.3 | 3.2 | 1.6 | 2.4 |
The rock samples collected within this zone tested a variety of geologic features and they can be grouped into vein/fault, dike-related, and altered rock types. The carbonate veins and altered faults usually range from 0.1m to1.0m wide, and the sampling often includes some of the surrounding low-grade wallrock. Altered dikes and dike margins were also sampled as a separate rock type, as were several zones of altered phyllitic limestone (the “altered rock type”) hosting stock work-type carbonate veinlets.
Averaged Au-As sample results for these three rock groups are compared in Table 4. Based on the As: Au ratios, arsenic values look to be following the intrusive dikes and sills, which suggests a congeneric relationship between the intrusive plumbing and Au-As mineralization. In contrast, the lower As: Au ratio seen in the vein/fault type is attributed to post-intrusion mineralization in younger, more dilatant zones.
| Table 4. Comparison of Au-As mineralization in major sample types at Baimashi North Target | |||
Sample Type | Ave. Au (ppm) | Ave. As (ppm) | As/Au Ratio |
V: Vein/Fault type | 2.190 | 2185 | 997 |
D: Dike related | 0.951 | 1726 | 1815 |
R: Altered rock type | 0.958 | 1325 | 1383 |
Drilling completed in 2014
The Company’s 2014 exploration program at its Yejiaba Gold Project in southern Gansu, PRC was concluded on January 1, 2015. Starting in July 2014, four diamond holes were drilled for a total of 870.35m within the Baimashi North Target, testing an area of widespread artisanal mining activity that displayed favorable potential for hosting a bulk-tonnage, low grade gold system. This scout drilling program evaluated a variety of Au-As geochemical anomalies and Au-bearing structures identified by Minco’s 2013/2014 surface and underground sampling within an area measuring 1000m long by 500m wide. The Baimashi drill results received so far from SGS are tabulated in the Table 5:
(6)
| Table 5. Significant gold intercepts in drill holes at the Yejiaba Project. | |||||
| Hole # | From (m) | To (m) | Interval (m) | Au (g/t) | |
Baimashi North Target Zone | BMS-14-001 (223.57m TD) | 9.00 | 22.02 | 13.02 | 0.346 |
| 191.94 | 192.74 | 0.8 | 6.948 | ||
| 192.74 | 196.37 | 3.63 | 0.902 | ||
| 198.50 | 199.44 | 4.96 | 1.156 | ||
| BMS-14-002 (211.37m TD) | 29.47 | 31.86 | 2.39 | 0.391 | |
| BMS-14-003 (182.23m TD) | 33.80 | 36.00 | 2.20 | 0.331 | |
| 82.75 | 84.82 | 2.07 | 0.392 | ||
| BMS-14-004 (253.18m TD) | 18.20 | 20.20 | 2.00 | 0.498 | |
| 35.00 | 36.00 | 1.00 | 0.498 | ||
| 78.30 | 79.10 | 0.80 | 1.076 | ||
| 176.73 | 177.73 | 1.00 | 0.934 | ||
| 222.10 | 223.10 | 1.00 | 2.694 | ||
| 244.00 | 245.00 | 1.00 | 0.329 | ||
The first hole at BMS-14-004 hosts the best gold results, with several intervals of low-grade mineralization punctuated by a high-grade vein intercept (0.8m @ 6.948 g/t) at 192m. The gold mineralization seen in the drill holes did not have higher gold grades at depth which greatly diminished the potential for a bulk tonnage deposit within North Baimashi target. Potential exists for low-tonnage, vein-type mineralization of moderate grade (2.5g/t to 7g/t) along narrow (generally <1m thick), high-angle shears and dike contacts.
Partial Disposition
On December 13, 2013, Minco China entered into an agreement with Gansu Yuandong Investment Co., Ltd (“YDIC”) pursuant to which the Company agreed to sell two exploration permits in the Xicheng East and Yejiaba area to YDIC for RMB 0.8 million ($170,973).
On December 26, 2014, Minco China entered into an agreement with Beijing Runlong Investment Limited Company (“Beijing Runlong”) in which the Company agreed to sell four exploration permits in the Yangshan area to Beijing Runlong for total cash proceeds of RMB 3,200,000 ($604,618).
Beijing Runlong must make the following payments to Minco China:
| i) | 5% of the total cash proceeds within 20 working days from the date of signing the agreement (not received); |
| ii) | 45% of the total cash proceeds upon receiving the approval of the transfer from the Provincial land and resources administrative authority, before submitting to the Ministry of Land and Resources (not received); and |
| iii) | 50% of the total cash proceeds within 5 days upon receiving the approved exploration rights license (not received). |
As the proceeds were not received as at September 30, 2016, the Company considers China Runlong is in default of the agreement. The titles of these four permits are still retained by the Company. The Company did not record any receivable due to the uncertainty of collectability and is actively following up with the collection of the receivable through Minco China.
1.2 Gold Bull Mountain Project
This is the second component of the Retained Assets. The exploration permit of this project expires on June 28, 2017.
On June 28, 2014, Minco China entered into a sale agreement to dispose of its interest in Yuanling Minco for RMB 7 million ($1.2 million).
(7)
The buyer agreed to make the following payments to Minco China:
| i) | 30% of the selling price within 7 days from the date of signing this agreement (received); |
| ii) | 55% of the selling price prior to the formal transfer request being submitted to the governing authorities; and |
| iii) | 15% upon completing the transfer and obtaining all governing authorities’ approval. |
As at December 31, 2014, the Company issued a notice of termination as the buyer failed to make the remaining payments within the specified period resulting in a breach in the agreement.
1.3 Receivable from a legal settlement
On December 16, 2010, Minco China entered into a JV agreement with 208 Team, a subsidiary of China National Nuclear Corporation, to acquire a 51% equity interest in the Tugurige Gold Project located in Inner Mongolia, China. The 208 Team did not comply with certain of its obligations under the JV Agreement, including its obligation to set up a new entity (the “JV Co”) and the transfer of its 100% interest in the Tugurige Gold Project to the JV Co. As a result, Minco China commenced legal action in China seeking compensation.
On March 25, 2013, Minco China settled its claim against the 208 Team relating to the JV Agreement for an amount of RMB 14 million ($2.4 million). The Company received RMB 5 million ($801,395) and RMB 4 million ($720,095) in 2013 and 2014 as part of the settlement.
On May 6, 2015, Minco China further reached an agreement to settle its claim against the 208 Team for an amount of RMB 5.5 million ($1,138,472). The payments are to be received in following manner:
| i) | On the signing date of the agreement- RMB 500,000 ($98,538) (received on May 7, 2015) |
| ii) | On or before September 17, 2015- RMB 2,000,000 ($394,151) (received in July 2016) |
| iii) | On or before August 7, 2015, RMB 3,000,000 ($591,226) (received in July 2016) |
Upon the completion of the SPA on July 31, 2015, the Company continued to hold the interest of the outstanding receivable (RMB 5,000,000) through a trust agreement with Minco China.
The Company, through Minco China, engaged a Chinese law firm to recommence a lawsuit against 208 Team to recover the remaining RMB 5 million unpaid balance on a contingent fee basis whereby the Company will pay the Chinese law firm 50% of the net amount recovered. On May 27, 2016, the Company obtained a judgment from the Highest Court of the People of Republic of China to order the 208 team to repay the Company this RMB 5,000,000, which was received, through Minco China, on July 27, 2016. As a result, the Company recognized a gain of $527,657 for the nine months ended September 30, 2016, which was the gross settlement payment received net of the related legal expenditures.
1.4 Exploration costs
Exploration expenditures incurred by project (property) are as follows:
Three months ended September 30, | Nine months ended September 30, | Accumulative to September 30, | ||||||||||||||||||||
| 2016 | 2015 | 2016 | 2015 | 2016 | ||||||||||||||||||
| $ | $ | $ | $ | $ | ||||||||||||||||||
| Longnan projects | 44,152 | 48,531 | 152,722 | 418,258 | 12,520,433 | |||||||||||||||||
| Changkeng gold project (i) | - | 7,047 | - | 87,986 | 8,285,703 | |||||||||||||||||
| Gold Bull Mountain | 5,636 | 69,236 | 16,834 | 92,303 | 2,333,445 | |||||||||||||||||
| Guangdong - Sihui | - | - | - | 106 | 6,099 | |||||||||||||||||
| 49,788 | 124,814 | 169,556 | 598,653 | 23,145,680 | ||||||||||||||||||
| (i) Changkeng property was sold to Minco Silver on July 31, 2015 | ||||||||||||||||||||||
(8)
During the nine months ended September 30, 2016, the exploration expenditures incurred for the Longnan project and the Gold Bull Mountain projects represented the maintenance fees of the exploration permits.
2. Results of Operations
2.1 Nine months ended September 30, 2016 compared to the nine months ended September 30, 2015
The Company’s operating results of the nine months ended September 30, 2016 compared to the nine months ended September 30, 2015 are as follows:
| Nine months ended September 30, | 2016 | 2015 | 2016-2015 | |||||||||
| $ | $ | $ | ||||||||||
| Exploration costs | 169,556 | 598,653 | (429,097 | ) | ||||||||
| Administrative expenses | 753,682 | 1,244,685 | (491,003 | ) | ||||||||
| Operating loss | (923,238 | ) | (1,843,338 | ) | 920,100 | |||||||
| Other income (loss) | (216,656 | ) | 14,328,810 | (14,545,466 | ) | |||||||
| Net income (loss) | (1,139,894 | ) | 12,485,472 | (13,625,366 | ) | |||||||
2.1.1 Exploration costs
Exploration expenditures incurred by project (property) are as follows:
| Nine months ended September 30, | 2016 | 2015 | 2016-2015 | |||||||||
| $ | $ | $ | ||||||||||
| Longnan projects | 152,722 | 418,258 | (265,536 | ) | ||||||||
| Changkeng gold project | - | 87,986 | (87,986 | ) | ||||||||
| Gold Bull Mountain | 16,834 | 92,303 | (75,469 | ) | ||||||||
| Sihui | - | 106 | (106 | ) | ||||||||
| Total | 169,556 | 598,653 | (429,097 | ) | ||||||||
The Company sold Changkeng gold project on July 31, 2015, thus did not have exploration costs during the nine months ended September 30, 2016. Exploration costs of Longnan and Gold Bull Mountain were lower in the nine months ended September 30, 2016 as the Company limited its expenditures to the maintenance of these permits.
(9)
2.1.2 Administrative expenses
The Company’s administrative expenses for the nine months ended September 30, 2016 and 2015 are as follows:
| Nine months ended September 30, | 2016 | 2015 | Note | 2016-2015 | ||||||||||||
| Administrative expenses: | $ | $ | $ | $ | ||||||||||||
| Accounting and audit | 67,223 | 116,758 | (49,535 | ) | ||||||||||||
| Amortization | 2,489 | 33,768 | (31,279 | ) | ||||||||||||
| Consulting | 37,629 | 44,087 | (6,458 | ) | ||||||||||||
| Directors’ fees | 38,638 | 47,124 | (8,486 | ) | ||||||||||||
| Investor relations | 11,413 | 36,598 | (25,185 | ) | ||||||||||||
| Legal and regulatory | 106,873 | 158,601 | 2 | (51,728 | ) | |||||||||||
| Office and miscellaneous | 182,688 | 322,930 | 2 | (140,242 | ) | |||||||||||
| Property investigation | 111,846 | 50,567 | 3 | 61,279 | ||||||||||||
| Salaries and benefits | 90,818 | 322,426 | 2 | (231,608 | ) | |||||||||||
| Share-based compensation | 89,325 | 37,891 | 4 | 51,434 | ||||||||||||
| Travel and transportation | 14,740 | 73,935 | (59,195 | ) | ||||||||||||
| 753,682 | 1,244,685 | 1 | (491,003 | ) | ||||||||||||
Significant changes in administrative expenses are summarized as follows:
(1) The overall administrative expenses decreased significantly during the nine months ended September 30, 2016 compared to the same period in 2015. The administrative expenses incurred during the nine months ended September 30, 2015 included the expenditures of the Company’s former subsidiaries that were disposed on July 31, 2015 (see discussion about the Transaction in the previous section). As a result, administrative expenses as a whole decreased.
(2) Legal and regulatory, office and miscellaneous, salaries and benefits are significant components of the Company’s administrative expenses. These expenditures incurred during the nine months ended September 30, 2016 were all lower than those of the same period in the last year as the Company did not maintain any subsidiaries during the nine months ended September 30, 2016 as discussed in the above.
(3) Property investigation incurred during the nine months ended September 30, 2016 increased as the Company hired a new consultant in late 2015 to look for new properties and business opportunities.
(4) Share-based compensation expense incurred during the nine months ended September 30, 2016 was higher comparing to the same period of 2015. The increase was due to the vesting of options recently granted in the fourth quarter of 2015.
2.1.3 Finance and other income (loss)
The Company’s finance and other income (expenses) for the nine months ended September 30, 2016 and 2015 are as follows:
| Nine months ended September 30, | 2016 | 2015 | 2016-2015 | |||||||||
| $ | $ | $ | ||||||||||
| Finance income | 48,087 | 38,042 | 10,045 | |||||||||
| Foreign exchange gain (loss) | (253,539 | ) | 29,924 | (283,463 | ) | |||||||
| Gain on sale of Minco Resources | - | 15,129,170 | (15,129,170 | ) | ||||||||
| Gain on legal settlement | 527,657 | 51,745 | 475,912 | |||||||||
| Impairment of equity investment in Minco Silver | - | (2,205,638 | ) | 2,205,638 | ||||||||
| Share of gain (loss) from equity investment in Minco Silver | (444,383 | ) | 1,285,567 | (1,729,950 | ) | |||||||
| Dilution loss | (94,478 | ) | - | (94,478 | ) | |||||||
| (216,656 | ) | 14,328,810 | (14,545,466 | ) | ||||||||
(10)
Finance income increased as the Company had more cash and short term investment in the nine months ended September 30, 2016 compared to the same period in 2015.
The Company had a higher foreign exchange loss as US dollar depreciated against the Canadian during the nine months ended September 30, 2016 compared to an appreciation during the same period in 2015.
During the nine months ended September 30, 2015, the Company sold all of its subsidiaries to Minco Silver with a gain of 15 million. There were no similar transactions during the nine months ended September 30, 2016.
As at September 30, 2016, the Company’s ownership of its equity investee Minco Silver decreased to 18.27 % (December 31, 2015 - 18.45%). Minco Silver issued shares to entities other than Minco Gold during this period. As the weighted average issuance price of these Minco Silver shares was lower than Minco Silver’s net asset per share before these share issuances, a dilution loss was recorded accordingly.
During the nine months ended September 30, 2015, the Company concluded its equity investment on Minco Silver had an impairment charge of $2.2 million. There was no similar impairment assessed during the nine months ended September 30, 2016.
Gain on legal settlement increased as per the discussion in the section “1.3 Receivable from a legal settlement”.
2.2 Three months ended September 30, 2016 compared to the three months ended September 30, 2015
The Company’s operating results of the three months ended September 30, 2016 compared to the same period of 2015 are as follows:
| Three months ended September 30, | 2016 | 2015 | 2016-2015 | |||||||||
| $ | $ | $ | ||||||||||
| Exploration costs | 49,788 | 124,814 | (75,026 | ) | ||||||||
| Administrative expenses | 255,181 | 310,798 | (55,617 | ) | ||||||||
| Operating loss | (304,969 | ) | (435,612 | ) | 130,643 | |||||||
| Other income | 90,801 | 16,489,026 | (16,398,225 | ) | ||||||||
| Net income | (214,168 | ) | 16,053,414 | (16,267,582 | ) | |||||||
2.2.1 Exploration costs
Exploration expenditures incurred by project (property) are as follows:
| Three months ended September 30, | 2016 | 2015 | 2016-2015 | |||||||||
| $ | $ | $ | ||||||||||
| Longnan projects | 44,152 | 48,531 | 4,379 | |||||||||
| Changkeng gold project | - | 7,047 | (7,047 | ) | ||||||||
| Gold Bull Mountain | 5,636 | 69,236 | (63,600 | ) | ||||||||
| 49,788 | 124,814 | (75,026 | ) | |||||||||
The Company sold Changkeng gold project on July 31, 2015, thus did not have exploration costs during three months ended September 30, 2016. Exploration costs of Longnan and Gold Bull Mountain were lower in the three months ended September 30, 2016 as the Company limited its expenditures on the maintenance of these permits.
(11)
2.2.2 Administrative expenses
The Company’s administrative expenses for the three months ended September 30, 2016 and 2015 are as follows:
| Three months ended September 30, | 2016 | 2015 | Note | 2016-2015 | ||||||||||||
| Administrative expenses: | $ | $ | $ | $ | ||||||||||||
| Accounting and audit | 31,108 | 49,341 | (18,233 | ) | ||||||||||||
| Amortization | 464 | 3,870 | (3,406 | ) | ||||||||||||
| Consulting | 21,103 | 17,487 | 3,616 | |||||||||||||
| Directors’ fees | 11,000 | 18,000 | (7,000 | ) | ||||||||||||
| Investor relations | 457 | 13,116 | (12,659 | ) | ||||||||||||
| Legal and regulatory | 32,862 | 29,436 | 3,426 | |||||||||||||
| Office and miscellaneous | 57,210 | 71,820 | 1 | (14,610 | ) | |||||||||||
| Property investigation | 45,396 | 22,081 | 2 | 23,315 | ||||||||||||
| Salaries and benefits | 27,400 | 53,544 | 1 | (26,144 | ) | |||||||||||
| Share-based compensation | 22,471 | 13,349 | 3 | 9,122 | ||||||||||||
| Travel and transportation | 5,710 | 18,754 | (13,044 | ) | ||||||||||||
| 255,181 | 310,798 | 1 | (55,617 | ) | ||||||||||||
Significant changes in administrative expenses are summarized as follows:
(1) The overall administrative expenses, among legal and regulatory, office and miscellaneous, salaries and benefits were all lower than those of the same period in the last year as the Company did not maintain any subsidiaries during the three months ended September 30, 2016 as discussed in the above.
(2) Property investigation incurred during the three months ended September 30, 2016 increased as the Company hired a new consultant in late 2015 to look for new properties and business opportunities.
(3) Share-based compensation expense incurred during the third quarter of 2016 was higher comparing to the same period of 2015. The increase was due to the vesting of options recently granted in the fourth quarter of 2015.
2.2.3 Finance and other income (loss)
The Company’s finance and other income (expenses) for the three months ended September 30, 2016 and 2015 are as follows:
| Three months ended September 30, | 2016 | 2015 | 2016-2015 | |||||||||
| $ | $ | $ | ||||||||||
| Finance income | 15,465 | 19,790 | (4,325 | ) | ||||||||
| Foreign exchange gain | 72,739 | 47,068 | 25,671 | |||||||||
| Gain on sale of Minco Resources | - | 15,129,170 | (15,129,170 | ) | ||||||||
| Gain on legal settlement | 38,657 | - | 38,657 | |||||||||
| Recovery of equity investment in Minco Silver | - | 966,069 | 966,069 | |||||||||
| Share of gain (loss) from equity investment in Minco Silver | (8,707 | ) | 326,989 | (356,299 | ) | |||||||
| Dilution loss | (27,353 | ) | - | (27,353 | ) | |||||||
| Total other income | 90,801 | 16,489,026 | (16,398,225 | ) | ||||||||
Finance income decreased as the interest rates offered by financial institutions for the Company’s cash and short-term investments were generally lower in the third quarter of 2016.
(12)
The Company had a dilution loss in the third quarter of 2016 as the Company’s ownership of its equity investee Minco Silver decreased when Minco Silver issued shares to entities other than Minco Gold during this period. There was no similar charge recorded in the third quarter of 2015.
3. Summary of Quarterly Results
| Loss per share | |||
| Period ended | Net loss attributable to shareholders | Basic | Diluted |
| 09-30-2016 | (214,168) | 0.00 | 0.00 |
| 06-30-2016 | 154,995 | 0.00 | 0.00 |
| 03-31-2016 | (1,080,721) | (0.02) | (0.02) |
| 12-31-2015 (******) | 1,835,084 | 0.04 | (0.00) |
| 09-30-2015(*****) | 16,057,984 | 0.32 | 0.32 |
| 06-30-2015(****) | 278,997 | 0.01 | 0.01 |
| 03-31-2015(***) | (3,810,723) | (0.08) | (0.08) |
| 12-31-2014 (**) | (4,455,430) | (0.09) | (0.09) |
The Company’s quarterly performance is not subject to seasonality. Variations in quarterly performance over the eight quarters were primarily attributed to incidental events such as gain or loss from disposition of assets, impairment charges on the assets, foreign exchange gain and loss, and share-based compensation. The Company’s past quarterly performances were also affected by the results of Minco Silver as the Company has been sharing (in a range of 18.31% – 18.45%) of the profit and loss of Minco Silver, an equity investee of the Company.
(**) Net loss increased to $4.4 million for the period ended December 31, 2014 mainly due to the impairment recorded for the equity investment in Minco Silver of $4.2 million.
(***) Net loss increased to $3.8 million for the period ended March 31, 2015 mainly due to the impairment recorded for the equity investment in Minco Silver of $3.5 million.
(****) Net income of $0.3 million for the period ended September 30, 2015 was mainly due to its share of gain from equity investment in Minco Silver.
(*****) Net income of $16.0 million for the period ended September 30, 2015 was mainly due to a $15.1 million gain from the Transaction.
(******) Net income of $1.8 million for the period ended December 31, 2015 was mainly due to an increase of carrying value of the Company’s equity investment in Minco Silver from September 30, 2015.
4. Liquidity and Capital Resources
4.1 Cash flows
| Nine months ended September 30, | ||||||||
| 2016 | 2015 | |||||||
| $ | $ | |||||||
| Operating activities | (872,450 | ) | (1,636,283 | ) | ||||
| Investing activities | 430,000 | 4,872,243 | ||||||
| Financing activities | 38,787 | 17,290 | ||||||
(13)
Operating activities
During the nine months ended September 30, 2016, the Company used $872,450 cash in operating activities. The Company used less cash as the Company had less operating loss after disposing all subsidiaries after July 31, 2015.
Investing activities
During the nine months ended September 30, 2016, the Company generated $430,000 from investing activities compared to $4,872,243 cash generated for the comparative period of 2015. The Company received redemption of $430,000 from a short-term investment during this period. During the nine months ended September 30, 2015, the Company’s $4,872,243 cash from investing activities was mainly a result of the sale of Minco Resources and its subsidiaries. There were no similar transactions in the current nine-month period.
Financing activities
During the nine months ended September 30, 2016, the Company received $38,787 cash from exercise of stock option compared to $17,290 cash received from the exercise of stock options during the nine months ended September 30, 2015.
4.2 Capital resources and liquidity risk
As at September 30, 2016, the Company’s working capital was $8,791,206 compared to $9,261,637 at the year ended 2015. Working capital decreased as the Company has used part of the funds on hand to finance its operations since December 31, 2015. Also the cash maintained in US dollars depreciated against Canadian dollar during this period.
The Company does not generate revenues and relies on equity and debt financing to fund exploration, permitting and administrative activities. As at September 30, 2016, the Company believes there is sufficient working capital available to meet its operational requirements in the next twelve months.
The Company's ability to meet its obligations and finance exploration and development activities over the long-term depends on its ability to generate cash flow through various debt or equity financing initiatives. Capital markets may not be receptive to offerings of new equity from treasury or debt, whether by way of private placements or public offerings. The Company's growth and success is dependent on external sources of financing which may not be available on acceptable terms or at all.
4.3 Contractual obligations
The Company’s contractual obligations are related to a cost sharing agreement between the Company, Minco Silver and Minco Base Metals Corporation (“MBM”), related parties domiciled in Canada, which outlines shared expenses incurred by the three companies including consulting and rental expenses.
As at September 30, 2016, the Company’s contractual obligations were not materially changed compared to those at the year ended December 31, 2015. Please refer to the Company’s 2015 MD&A, available on SEDAR for details.
5. Off -Balance Sheet Arrangements
The Company does not have any off-balance sheet arrangements.
6. Transactions with Related Parties
Shared office expenses
Minco Silver and Minco Gold shared offices and certain administrative expenses in Beijing up to July 31, 2015. Minco Silver, Minco Base Metals Corporation (“MBM”), and Minco Gold share offices and certain administrative expenses in Vancouver. MBM is a company over which the Company’s CEO has significant influence.
(14)
Due to and due from related parties
a) As at September 30, 2016, the Company had $328,453 due to Minco Silver (December 31, 2015 – $177,330) which included the unpaid shared office expenses, and the expenditures Minco Silver had paid on behalf of the Company in connection with the Company’s Retained Assets in China. The Company also had $534,081 due from Minco Silver (December 31, 2015 - $Nil), which represents the net amount Minco China received from 208 team lawsuit on behalf of the Company. As at September 30, 2016, the Company had a net receivable from Minco Silver in the amount of $205,628.
b) As at September 30, 2016, the Company had $17,199 due from MBM (December 31, 2015 $12,387), in relation to shared office expenses.
The amounts due to related parties are unsecured, non-interest bearing and payable on demand.
Key management compensation
Key management includes the Company’s directors and senior management. This compensation is included in exploration costs and administrative expenses.
Following is a summary of the compensation with key managements:
Three months ended September 30, | Nine months ended September 30, | |||||||||||||||
| 2016 | 2015 | 2016 | 2015 | |||||||||||||
| $ | $ | $ | $ | |||||||||||||
| Cash remuneration | 65,478 | 53,174 | 203,254 | 198,174 | ||||||||||||
| Share-based compensation | 25,789 | 10,812 | 79,404 | 30,990 | ||||||||||||
| Total | 91,267 | 63,985 | 282,658 | 229,164 | ||||||||||||
Transactions with related parties were conducted in the normal course of business.
7. Critical Accounting Estimates
The preparation of financial statements requires management to use judgment in applying its accounting policies and estimates and assumptions about the future. Estimates and other judgments are continuously evaluated and are based on management’s experience and other factors, including expectations about future events that are believed to be reasonable under the circumstances. The following discusses the most significant accounting judgments and estimates that the Company has made in the preparation of the financial statements:
Significant Influence of Minco Silver
Management has assessed the level of influence that the Company has on Minco Silver and determined that it has significant influence even though its shareholding has dropped below 20% since April 22, 2014. The Company is able to impose significant influence on Minco Silver through its representation on Minco Silver’s board, the common CEO and other shared management.
Impairment
At each reporting date, management conducts a review to determine whether there is any objective evidence that the investment in associate is impaired. This determination requires significant judgment. In making this judgment, management evaluates among other factors, the movements in the trading share price of Minco Silver and other commercial activities impacting Minco Silver. If objective evidence of impairment exists, then the Company recognizes an impairment loss in the statement of income (loss) to the extent that the estimated recoverable amount is less than the carrying value.
(15)
As at September 30, 2016, the company concluded that due to the positive developments in Minco Silver, which included the acquisition of Minco Resources and the related activities associated with the Changkeng project, accompanied by a corresponding increase in the market value of Minco Silver’s share price since the recent year ended December 31, 2015, indication of impairment was not identified.
Impairment losses previously recorded are reversed if the conditions that gave rise to the impairment are no longer present and it has been determined that the asset is no longer impaired as a result. This reversal is recognized in net income in the period the reversal occurs, and is limited by the carrying value that would have been determined, from the application of equity accounting method, had no impairment charge been recognized in prior periods.
8. Accounting Standards Issued but Not Yet Applied
IFRS 9, Financial Instruments, addresses classification and measurement of financial assets. It replaces the multiple category and measurement models in IAS 39 Financial Instruments: Recognition and Measurement for debt instruments with a new mixed measurement model having only two categories: amortized cost and fair value through profit or loss. Requirements for financial liabilities are largely carried forward from the existing requirements in IAS 39 except that fair value changes due to credit risk for liabilities designated at fair value through profit and loss are generally recorded in other comprehensive income. The effective date of this new standard will be for periods beginning on or after January 1, 2018 with early adoption permitted. The Company has not yet assessed the impact of this standard or determined whether it will adopt earlier.
IFRS 16, Leases, replaces the previous leases standard IAS 17, Leases and Related Interpretations, and sets out the principles for the recognition, measurement, presentation and disclosure of leases for both parties to a contract, i.e. the customer (lessee) and the supplier (lessor). Effective January 1, 2019, an entity can choose to apply IFRS 16, but only if it also applies IFRS 15, Revenue from Contracts with Customers. The Company will evaluate the impact of the change to the consolidated financial statements based on the characteristics of leases outstanding at the time of adoption.
9. Financial Instruments
Financial assets and liabilities have been classified into categories that determine their basis of measurement and, for items measured at fair value, whether changes in fair value are recognized in the statement of income or comprehensive income. Those categories are: fair value through profit or loss, loans and receivables, available for sale and other financial liabilities.
The following table summarizes the carrying value of financial assets and liabilities as at September 30, 2016 and December 31, 2015.
| September 30, | December 31, | |||||||
| 2016 | 2015 | |||||||
| Loans and receivables | $ | $ | ||||||
| Cash | 4,936,467 | 5,593,669 | ||||||
| Short-term investment | 3,618,341 | 4,048,341 | ||||||
| Receivables | 64,914 | 11,122 | ||||||
| Due from related parties | 551,280 | 12,387 | ||||||
| Liabilities | ||||||||
| Accounts payables | 124,378 | 389,522 | ||||||
| Due to related party | 328,453 | 177,330 | ||||||
Financial instruments that are not measured at fair value on the balance sheet are represented by cash and cash equivalents, short-term investment, receivable, due from related parties, account payable and accrued liabilities, and due to related parties. The fair values of these financial instruments approximate their carrying value due to their short-term nature.
(16)
Financial risk factors
The Company’s operations consist of the acquisition, exploration and development of properties in China. The Company examines the various financial risks to which it is exposed and assesses the impact and likelihood of occurrence. These risks may include credit risk, liquidity risk, currency risk and interest rate risk. Management reviews these risks on a monthly basis and when material, they are reviewed and monitored by the Board of Directors.
Credit risk
Counterparty credit risk is the risk that the financial benefits of contracts with a specific counterparty will be lost if the counterparty defaults on its obligations under the contract. This includes any cash amounts owed to the Company by these counterparties, less any amounts owed to the counterparty by the Company where a legal right of set-off exists and also includes the fair value contracts with individual counterparties which are recorded in the consolidated financial statements. The Company considers the following financial assets to be exposed to credit risk:
| · | Cash and cash equivalents– In order to manage credit and liquidity risk the Company places its cash with major financial institutions in two major banks in Canada (subject to deposit insurance up to $100,000). As at September 30, 2016, total cash of $4,936,467 was placed with two institutions. |
| · | Short-term investment – The Company places its short-term investment with a major financial institution in Canada. As at September 30, 2016, total short-term investment was $3,618,341. |
Foreign exchange risk
The Company’s functional currency is the Canadian dollar in Canada. The foreign currency risk is related to US dollar funds held by the Company. The Company’s net earnings are impacted by fluctuations in the valuation of the US dollar in relation to the Canadian dollar.
The Company does not hedge its exposure to currency fluctuations. The Company has completed a sensitivity analysis to estimate the impact that a change in foreign exchange rates would have on the net loss of the Company, based on the Company’s net US$3.7 million monetary assets as at September 30, 2016. This sensitivity analysis shows that a changed of +/- 10% in US$ exchange rate against Canadian dollar would have a -/+ CAD$0.4 million impact on net loss for nine months ended September 30, 2016.
Interest rate risk
The effective interest rate on financial liabilities (accounts payable) ranged up to 1%. The interest rate risk is the risk that the fair value of future cash flows of a financial instrument fluctuates because of changes in market interest rates. Cash investments held by the Company bear interest at a fixed rate thus exposing the Company to the risk of changes in fair value arising from interest rate fluctuations. A 1% increase in the interest rate in Canada will have a net (before tax) income effect of $87,000 (December 31, 2015 - $96,000), assuming the foreign exchange rate remains constant.
10. Risks Factors and Uncertainties
A comprehensive discussion of risk factors is included in the Company's annual report on Form 20-F for the year ended December 31, 2015 that is available on SEDAR at www.sedar.com.
11. Disclosure Controls and Procedures and Internal Controls over Financial Reporting
Management has established disclosure controls and procedures to ensure that information disclosed in this MD&A and the related financial statements was properly recorded, processed, summarized and reported to the Company’s Board and Audit Committee. Management has evaluated the effectiveness of the Company’s disclosure controls and procedures as at September 30, 2016.
(17)
As described below, a material weakness was identified in the Company’s internal control over financial reporting as at December 31, 2015. A material weakness is a significant deficiency, or combination of significant deficiencies, that results in more than a remote likelihood that a material misstatement of the annual or interim financial statements will not be prevented or detected. As a result of this material weakness, the Company’s CEO and CFO have concluded that, as of the end of the period covered by this report, the Company’s disclosure controls and procedures were not effective. Management is also responsible for establishing and maintaining adequate internal controls over financial reporting. Any system of internal control over financial reporting, no matter how well designed, has inherent limitations. Therefore, even those systems determined to be effective can provide only reasonable assurance with respect to financial statement preparation and presentation. Management evaluated the effectiveness of internal control over financial reporting based on the control framework established in Internal Control - Integrated Framework (2013) issued by the Committee of Sponsoring Organizations of the Treadway Commission. Based upon that assessment, management identified the material weakness described below and, as a result, management concluded that the Company’s internal control over financial reporting was not effective as of December 31, 2015.
The material weakness identified by management relates to the lack of financial management oversight of accounting processes around the application of IFRS as it relates specifically to the calculation of the gain on sale of its subsidiary to an associate. This material weakness led to a material post-closing adjustment of $3.4 million which was appropriately corrected in the consolidated financial statements for the year ended December 31, 2015.
Remediation Plan
To remediate the material weakness described above, management plans to strengthen the control procedures relating to accounting for more complex transactions. The Company has recently appointed a new Chief Financial Officer who is tasked with developing and implementing more robust review and oversight processes when there are non-routine and more complex accounting issues. Other than the material weakness described above, there were no changes in the Company’s internal control over financial reporting that occurred during the year ended December 31, 2015 that have materially affected, or are reasonably likely to materially affect, the Company’s internal control over financial reporting.
Management is still in the progress in implementing the remediation plan as discussed in the above. As a result, management is in the conclusion that the material weakness identified as at December 31, 2015 still existed as at September 30, 2016.
12. Cautionary Statement on Forward-Looking Information
Except for statements of historical fact, this MD&A contains certain “forward looking information” and “forward looking statements” within the meaning of applicable securities laws, which reflect management’s current expectations regarding, among other things and without limitation, the Company’s future growth, results of operations, performance and business prospects, opportunities, future price of minerals and effects thereof, the estimation of mineral reserves and resources, the timing and amount of estimated capital expenditures, the realization of mineral reserve estimates, costs and timing of proposed activities, plans and budgets for and expected results of exploration timing of proposed activities, plans and budgets for and expected results of exploration activities, exploration and permitting time-lines, requirements for additional capital, government regulation of mining operations, environmental risks, reclamation obligation and expenses, the availability of future acquisition opportunities and use of the proceeds from financing. Generally, forward looking statements and information can be identified by the use of forward looking terminology such as “plans”, “expects”, “is expected”, “budget”, “scheduled”, “estimates”, “forecasts”, “intends”, “anticipates”, “believes” or variations of such words and phrases or statements that certain actions, events or results “may”, “could”, “would”, “might” or “will be taken”, “occur” or “be achieved” or the negative connotation thereof.
(18)
Forward-looking statements are included throughout this document and include, but are not limited to, statements with respect to: our plans for future exploration programs for our mineral properties; the ability to generate working capital; markets; economic conditions; performance; business prospects; results of operations; capital expenditures; and foreign exchange rates. All such forward-looking statements are based on certain assumptions and analyses made by us in light of our experience and perception of historical trends, current conditions and expected future developments, as well as other factors we believe are appropriate in the circumstances. These statements are, however, subject to known and unknown risks and uncertainties and other factors. As a result, actual results, performance or achievements could differ materially from those expressed in, or implied by, these forward-looking statements and, accordingly, no assurance can be given that any of the events anticipated by the forward-looking statements will transpire or occur, or if any of them do so, what benefits will be derived therefrom. These risks, uncertainties and other factors include, among others: our interest in our mineral properties may be challenged or impugned by third parties or governmental authorities; economic, political and social changes in China; uncertainties relating to the Chinese legal system; failure or delays in obtaining necessary approvals; exploration and development is a speculative business; the Company's inability to obtain additional funding for the Company's projects on satisfactory terms, or at all; hazardous risks incidental to exploration and test mining; the Company has limited experience in placing resource properties into production; government regulation; high levels of volatility in market prices; environmental hazards; currency exchange rates; and the Company's ability to obtain mining licenses and permits in China.
Although the Company has attempted to identify important factors that could cause actual results to differ materially, there may be other factors that cause results not to be as anticipated, estimated or intended. There can be no assurance that statements containing forward looking information will prove to be accurate as actual results and future events could differ materially from those anticipated in such statements. Accordingly, readers should not place undue reliance on statements containing forward looking information. All of the forward-looking information and statements contained in this document are expressly qualified, in their entirety, by this cautionary statement. The various risks to which we are exposed are described in additional detail under the section entitled "Item 3: Key Information – D. Risk Factors" in the Company's annual report on Form 20-F available on SEDAR at www.sedar.com. The forward-looking information and statements are made as of the date of this document, and we assume no obligation to update or revise them except as required pursuant to applicable securities laws.
(19)