UNITED STATES
SECURITIES AND EXCHANGE COMMISSION
Washington, D.C. 20549
FORM 10-K
(Mark one)
☒ ANNUAL REPORT PURSUANT TO SECTION 13 OR 15(d) OF THE SECURITIES EXCHANGE ACT OF 1934
FOR THE YEAR ENDED DECEMBER 31, 2024
OR
☐ TRANSITION REPORT PURSUANT TO SECTION 13 OR 15(d) OF THE SECURITIES EXCHANGE ACT OF 1934
Commission file number 1-12317
NOV INC.
(Exact name of registrant as specified in its charter)
| | |
Delaware | 
| 76-0475815 |
(State or other jurisdiction of incorporation or organization) | (IRS Employer Identification No.) |
10353 Richmond Avenue
Houston, Texas 77042-4103
(Address of principal executive offices)
(346) 223-3000
(Registrant’s telephone number, including area code)
Securities registered pursuant to Section 12(b) of the Act:
| | |
Title of each class | Trading Symbol(s) | Name of each exchange on which registered |
Common Stock, par value $0.01 per share | NOV | New York Stock Exchange |
Securities registered pursuant to Section 12(g) of the Act: None
Indicate by check mark if the registrant is a well-known seasoned issuer, as defined in Rule 405 of the Securities Act. Yes☒ No☐
Indicate by check mark if the registrant is not required to file reports pursuant to Section 13 or Section 15 (d) of the Act. Yes☐ No☒
Indicate by check mark whether the registrant (1) has filed all reports required to be filed by Section 13 or 15(d) of the Securities Exchange Act of 1934 during the preceding 12 months (or for such shorter period that the registrant was required to file such reports), and (2) has been subject to such filing requirements for the past 90 days. Yes☒ No☐
Indicate by check mark whether the registrant has submitted electronically every Interactive Data File required to be submitted pursuant to Rule 405 of Regulation S-T during the preceding 12 months (or for such shorter period that the registrant was required to submit such files). Yes☒ No☐
Indicate by check mark whether the registrant is a large accelerated filer, an accelerated filer, a non-accelerated filer, a smaller reporting company, or an emerging growth company. See the definitions of “large accelerated filer,” “accelerated filer”, “smaller reporting company”, and “emerging growth company” in Rule 12b-2 of the Exchange Act.
| | | |
Large accelerated filer ☒ | Accelerated filer ☐ | Emerging growth company | ☐ |
Non-accelerated filer ☐ | Smaller Reporting Company ☐ | | |
If an emerging growth company, indicate by check mark if the registrant has elected not to use the extended transition period for complying with any new or revised financial accounting standards provided pursuant to section 13(a) of the Exchange Act. ☐
Indicate by check mark whether the registrant has filed a report on and attestation to its management’s assessment of the effectiveness of its internal control over financial reporting under Section 404(b) of the Sarbanes-Oxley Act (15 U.S.C. 7262(b)) by the registered public accounting firm that prepared or issued its audit report. ☒
If securities are registered pursuant to Section 12(b) of the Act, indicate by check mark whether the financial statements of the registrant included in the filing reflect the correction of an error to previously issued financial statements. ☐
Indicate by check mark whether any of those error corrections are restatements that required a recovery analysis of incentive-based compensation received by any of the registrant’s executive officers during the relevant recovery period pursuant to §240.10D-1(b). ☐
Indicate by check mark whether the registrant is a shell company (as defined in Rule 12b-2 of the Exchange Act). Yes☐ No☒
The aggregate market value of voting and non-voting common stock held by non-affiliates of the registrant as of June 30, 2024 was $7.4 billion. As of January 31, 2025, there were 380,819,811 shares of the Company’s common stock ($0.01 par value) outstanding.
Documents Incorporated by Reference
Portions of the Proxy Statement in connection with the 2025 Annual Meeting of Stockholders are incorporated in Part III of this report.
FORM 10-K
PART I
ITEM 1. BUSINESS
General
NOV Inc. (“NOV” or the “Company”) is a leading independent equipment and technology provider to the global energy industry. NOV and its predecessor companies have spent over 160 years helping transform oil and gas development and improving its cost-effectiveness, efficiency, safety, and environmental impact. Over the past few decades, the Company has pioneered and refined key technologies to improve the economic viability of frontier resources, including unconventional and deepwater oil and gas. More recently, by applying its deep expertise and technology, the Company has developed solutions to improve the economics of alternative energy sources.
NOV’s extensive proprietary technology portfolio supports the industry’s drilling, completion, and production needs. With unmatched cross-segment capabilities, scope, and scale, NOV continues to develop and introduce technologies that further enhance the economics and efficiencies of energy production, with a focus on digital solutions, including automation, predictive analytics, and condition-based maintenance.
NOV serves major-diversified, national, and independent service companies, contractors, and energy producers in 59 countries. NOV operates under two segments, Energy Equipment and Energy Products and Services.
Business Strategy and Competitive Strengths
NOV’s primary business objective is to generate above-average, long-term capital returns and further enhance its position as a leading independent global energy technology and equipment provider by delivering solutions that help lower the marginal cost and environmental footprint associated with energy development and production from oil, gas, and renewable sources. NOV’s strategy is to capitalize on economies of scale that arise from its position as a leading provider of equipment and technology to the global energy industry, proprietary technology it continues to develop, and core capabilities and competencies it can apply toward advancing alternative sources of energy. NOV also believes its manufacturing business model is less asset- and capital-intensive than most other participants in the energy industry.
Leverage NOV’s advantages of size, scope, scale, and market position
NOV’s position as a leading independent global energy technology and equipment provider affords several competitive advantages, including:
Economies of scale in procurement and manufacturing. NOV’s global leadership and footprint, spanning almost every major oil and gas market, provide the Company with economies of scale, enabling a unique global supply chain, which allows materials procurement from lower-cost sources. The Company’s global manufacturing footprint and diverse production flexibility also enable NOV to rapidly adapt to demand changes, efficiently leverage manufacturing capacity in high-demand areas, and manufacture goods in lower-cost jurisdictions. NOV’s geographic diversity also reduces potential revenue volatility from shifts in activity location, regional differences in energy prices, and adverse weather events.
Scope and scale for distribution and marketing. With operations in 59 countries, NOV has developed an efficient worldwide distribution network and relationships with virtually every oil and gas producer, service company, and contractor. NOV uses its customer relationships and distribution capabilities to accelerate the commercialization of new products and technologies. NOV also routinely develops technologies for the global marketplace where the Company’s infrastructure allows for quick market penetration and creation of a first-mover advantage with standardized operations around certain products.
Reputation, experience, and benefits of fleet standardization. NOV believes its reputation and experience make its products a lower-risk purchase for customers. The Company benefits from customer efforts to standardize training, maintenance, and spare parts, resulting in reduced downtime and inventory-stocking requirements, lower training costs, and better safety. Customers may prefer standardized equipment from NOV, a well-capitalized market leader with which they can enter into long-term service agreements that offer advanced analytics and condition monitoring to maximize uptime and reduce the total cost of equipment ownership.
Large installed base of equipment. As a leading original equipment manufacturer (“OEM”) for oil and gas operations, NOV believes it is well positioned to provide aftermarket support for its large base of installed equipment. Most service companies prefer, and many of their customers demand, OEM aftermarket support. Customers frequently encounter higher risk and cost when they purchase and use potentially incompatible products from different vendors, particularly where products must interact through complex interfaces, which are common sources of failures and unplanned costs. Additionally, certain past events have increased the industry’s risk profile with government regulatory bodies, which have shown a strong preference for OEM service contractor critical equipment maintenance.
Leverage NOV’s market position to accelerate the digitization of the energy industry
NOV’s experience, scale, and market position, along with its proficiencies in control systems, sensors, field instrumentation, and data acquisition makes the Company a logical choice to provide a digital platform for the energy industry that consumes all operational data, regardless of the service-provider. Additionally, NOV’s well-established, global field-service infrastructure affords the Company a distinct capability and advantage in the commercialization and support required to deploy digital solutions that must collect, aggregate, and transmit field-level data from complex machinery and equipment in harsh environments. NOV is investing considerable time and resources to develop its MaxTM platform and MaxTM edge devices, which enable large-scale collection, aggregation, and analytics of real-time equipment and process data, both at the edge and in the cloud. The Company’s Max platform and analytics services also allow users to apply artificial intelligence and machine learning to operational data, enabling better decision-making for more efficient, more productive, safer, and less carbon intensive operations.
Develop proprietary technologies and solutions that assist energy producers in reducing their marginal cost of supply
NOV strives to further develop its substantial technology portfolio and is known for developing innovative customer productivity solutions. The Company is well positioned to introduce breakthrough technologies that enhance efficiencies and address industry needs, to generate strong returns. The Company believes its cross-business-unit expertise uniquely positions NOV to pioneer proprietary technologies across its business lines. For example, NOV’s segments jointly introduced closed-loop drilling technologies, which link real-time data from the well bottom to drilling rig controls and use machine learning to drive greater efficiency. NOV works closely with customers to identify needs, and its technical experts use internal capabilities to develop value-added technologies.
Capitalize on and drive end-market fragmentation
Technology and product availability to all industry participants is a key tenet of NOV’s business model. To the extent NOV can provide equipment and technology products that are equal to or better than those developed by the major oilfield service providers, it will prevent any one organization from having a proprietary advantage and therefore drive fragmentation. This fragmentation expands NOV’s customer base and avoids customer concentration in most of its businesses. NOV has resisted the recent trend toward vertical integration, leaving the Company in an attractive and unique position as the largest global independent technology and equipment provider to the oilfield service sector. Governments in certain international markets are pursuing initiatives that drive local content and greater local employment. The Company expects that these actions will likely prompt more local startup enterprises, further expanding demand for NOV’s equipment.
Leverage core capabilities and competencies to assist customers in efforts to reduce their environmental footprint and improve the economics of alternative sources of energy
NOV’s engineering expertise, complex global supply chain management, low-cost manufacturing, and large-scale energy infrastructure development provide unique capabilities to help customers economically diversify the energy mix. The Company has pioneered numerous innovations that help reduce emissions in oilfield operations. NOV is also a leading geothermal equipment and technology provider, offering a broad array of tools and equipment specifically designed for the ultra-harsh conditions associated with geothermal development. Additionally, with expertise in offshore heavy-lift equipment and naval architectural design, the Company is the leading equipment and technology provider for purpose-built vessels used to build, install, and maintain offshore wind towers and turbines. The Company sees promise in development and commercialization of novel products and technologies to improve the efficiencies and economics of land and offshore-based wind, geothermal power generation, and carbon capture and sequestration.
Employ a capital-light business model with the ability to quickly scale operations
NOV’s manufacturing facilities require relatively low investment and maintenance expenses versus the sales they enable. NOV manufactures a diverse line of products and improves efficiency by shifting production runs to high-demand or lowest-cost facilities. The Company also benefits from a customer base requiring technically complex equipment for use in extreme environments.
NOV’s infrastructure leverages the energy industry’s cyclicality. As commodity prices rise, the industry typically enters an expansionary phase, and equipment orders increase. NOV is able to ramp up manufacturing capacity quickly to capture the up-cycle value while meeting customer demand. During down-cycles, the Company’s focus is internal efficiency and technological advancement. NOV’s continuous pursuit of cyclical technological initiatives enhances its ability to drive long-term customer and shareholder value. The Company also outsources non-critical machining operations with lower tolerance requirements during increased activity and brings the machining operations back into Company-owned facilities during down-cycles for lower cost and effective utilization.
Employ a conservative capital structure with ample liquidity to capitalize on volatility associated with the oil and gas industry
NOV maintains a conservative capital structure with an investment-grade credit rating and ample liquidity. The Company carefully manages its capital structure by continuously monitoring cash flow, capital spending, and debt capacity. Maintaining financial strength inspires confidence from customers who make large purchase commitments delivered over multi-year timeframes and who expect NOV to support their equipment with OEM aftermarket parts and services for decades to come. NOV’s strong balance sheet provides flexibility to execute its strategy, including advancing technological offerings, through industry volatility and commodity price cycles. The Company intends to maintain a conservative approach to balance sheet management to preserve operational and strategic flexibility.
Business Segment Overview
NOV operates under two reporting segments that are organized to optimize resource allocation, accelerate innovation, improve customer service, and drive stronger results. NOV executes its business strategy under the following two segments:
Energy Products and Services provides the critical tools, equipment, and services to safely maximize efficiency, reliability, and economics in the upstream oil and gas, renewables, and industrial markets. The segment’s offerings tend to be more transactional and shorter-cycle in nature. Revenues are derived from sales of consumable products, services and rentals, and sales of shorter-lived, or single-application, capital asset sales.
The segment’s offerings include:
•Drill Bits. NOV is a premier technical provider of performance-engineered drill bits and borehole enlargement products to help operators improve well construction efficiency and economics by breaking rock during rotary drilling operations. The Company designs, manufactures, sells, and rents high-quality, customized fixed cutter drill bits using industry-leading cutter technology. The portfolio also includes roller cone drill bits, borehole enlargement tools that excel in the most demanding applications, and coring tools and services.
•Downhole Tools. NOV is a leading independent drilling and intervention downhole tools equipment supplier with engineering teams, manufacturing facilities, supply hubs, and service centers situated in oil and gas activity regions. The Company’s constantly evolving product portfolio includes downhole drilling motors, agitator systems, and measurement-while-drilling, logging-while-drilling, fishing, and thru-tubing tools. NOV’s offerings enable significant efficiency increases for directional and extended lateral well drilling, workovers and intervention operations.
•Completion Tools. NOV offers a differentiated portfolio of proprietary products and solutions to support well construction and horizontal multistage completions. The company offers multistage frac technologies, including dissolvable frac plugs, frac sleeves, toe initiation burst port systems, and recyclable setting tools that enhance hydraulic fracturing efficiency. NOV also provides critical well construction components such as surface casing and liner hangers that ensure structural integrity and operational reliability.
•Artificial Lift Systems. NOV is a leading designer and manufacturer of electric submersible pumps, high viscosity pumps, and surface pumps designed to optimize productivity and reliability.
•Tubular Inspection & Coating Services. NOV is a leading provider of tubular coating and inspection services for drill-pipe and other oil country tubular goods (“OCTG”). The company has over 80 years of history offering these services and provides a fully-integrated inspection, coating, and repair process along with specialized composite sleeves and liners that protect tubulars from harsh downhole conditions, ensuring equipment durability throughout the entire well lifecycle.
•Solids Control and Waste Management Services. NOV is a leading provider of solids control and waste management equipment and services. The Company provides field services and manufactures, sells, and rents highly engineered solids control equipment that efficiently separates solid drill cuttings and reclaims drilling fluids for reuse. NOV also provides waste management (both onsite and at centralized locations), including transport and storage, and water management solutions. The Company incorporates proprietary technologies in the delivery of such solutions, including its thermal desorption systems that efficiently minimize and treat drilling waste at the source for safe on-site disposal, significantly improving the efficiency of costly activities such as barge vessel trips, crane lifts, and trucking transport while also reducing the carbon emissions from the same.
•MPD Equipment and Rentals. NOV is a leading provider of managed pressure drilling (MPD) equipment and services. The Company provides a broad spectrum of MPD solutions to help manage wellbore pressures and optimize drilling performance. Offerings include rotating control devices, managed pressure drilling manifolds, full drilling control network integration, and engineering services.
•Digital Solutions. NOV is a leading independent provider of data and digital solutions to the energy industry. Supported by a global field service infrastructure and technologically advanced equipment and sensors for harsh environments, the Company acquires, aggregates, and delivers real-time drilling, completion and production data to enable edge and cloud
analytics, which improve operational efficiencies, well productivity, and safety. Utilizing its proprietary wired drill pipe, NOV offers Downhole Broadband Solutions (DBS) to provide real-time, broadband data from the bottom-of-the-hole and along the drill string, to improve well placement, reduce well delivery times, and increase production.
•Drill Pipe. NOV is a leading provider of precision-engineered drill pipe and drill-stem equipment. The Company leverages its metallurgy expertise and premium connection technologies to offer an innovative drill pipe product portfolio for applications ranging from the simplest vertical land well to deepwater, extended-reach, high-pressure/high-temperature wells.
•Conductor Casing Connections. NOV provides proprietary connectors and integral thread solutions for oil and gas applications including conductor strings, surface casing, and liners, with diameters ranging from 16 to 72 inches. The Company’s advanced connectors are designed to withstand high fatigue loading and include connector products where threads are machined on high strength forging material then welded to pipe, and integral-threaded wedge connectors with pin and box threads that are machined directly on the ends of pipes.
•Composite Solutions. NOV is a leading provider of high-end composite pipe, tanks, and structures engineered to address complex corrosion and weight constraints across a diverse range of demanding applications, including oil and gas, chemical processing, industrial environments, wastewater management, fuel handling, marine and offshore industries, geothermal energy, and rare earth mineral extraction.
Energy Equipment designs, builds, and supports capital equipment and integrated systems used in oil and gas exploration and production, both onshore and offshore, as well as for industrial, marine, and renewable energy markets. Revenues are derived from sales of capital equipment and aftermarket spare parts, repair, and rentals, as well as comprehensive technical support, field service, and training. In addition to traditional aftermarket support, NOV offers subscription services including analytics, condition monitoring, and digital performance solutions that enhance operational efficiencies, increase up-time, and reduce the total cost of ownership of many of the Company’s products. Most of the segment’s capital equipment offerings are longer-lead-time products, requiring more than three months to manufacture and deliver, and meet the Company’s criteria to be reported as backlog when firm orders are received.
The segment’s offerings include:
•Drilling Equipment. NOV provides advanced land rigs, complete offshore drilling packages, and rig components designed to mechanize and automate complex drilling rig processes, including automation control systems and robotics solutions. The portfolio includes designs that changed the way rigs are operated, such as the TDS top drive drilling system and automated iron roughneck. Evolving with market needs, the portfolio includes solutions to reduce energy consumption and enable energy regeneration, resulting in reduced emissions profiles. Aftermarket offerings include upgrades of existing equipment and systems, spare parts, repair, and rentals, as well as comprehensive remote equipment monitoring, technical support, field service, and customer training through an extensive aftermarket facilities network strategically located in major drilling areas around the world.
•Intervention and Stimulation Equipment. NOV designs and manufactures capital equipment, related consumables, and digital products for hydraulic stimulation, coiled tubing, and wireline services. Hydraulic stimulation offerings include conventional and next-generation-technology configurations of high-pressure pumping units, along with process equipment such as hydration units, chemical additive systems, blenders, and control systems, along with consumables including centrifugal pumps, valves, seats, and flowline equipment. Coiled tubing equipment offerings include coiled tubing units, injector heads, tubing strings, pressure control and nitrogen support equipment. Wireline offerings include electric line and slickline trucks and skids, and pressure control equipment. Through NOV’s MaxTM digital platform, the Company leverages its integrated control and data acquisition systems to provide comprehensive equipment status and operational process insights, to optimize job efficiency and extend the equipment life. NOV supports all its equipment with comprehensive repair, recertification, and other services through a global aftermarket facility network.
•Marine Equipment. NOV provides heavy-lift cranes, a large range of knuckle-boom and lattice-boom cranes, with active heave capabilities, deck-handling machinery, mooring and anchoring systems, a full range of jacking systems for drilling rigs, wind turbine installation vessels, other offshore construction vessels, and specialized equipment and machinery for installing offshore wind towers, turbines, and blades, offshore pipelines and offshore power transmission cables. Additionally, NOV designs offshore jack-up and floating rigs, wind turbine and cable lay vessels, and floating offshore wind structures. NOV’s marine solutions serve the oil and gas industry as well as wind energy and other marine-based end markets.
•Process Systems. NOV provides integrated processing solutions for the separation and treatment of oil, gas, solids, seawater, and produced water production. Drawing on a deep understanding of gas and fluids behavior from more than 40 years of experience, NOV’s engineers and project managers design and build integrated systems that provide water treatment, separation, sand management, hydrate inhibition and gas processing for use both on and offshore. For deepwater
applications these systems come together to supply comprehensive solutions for floating production, storage, and offloading (“FPSO”) vessels. Leveraging processing expertise, NOV also offers carbon capture solutions, including amine-based carbon capture technologies, complementary processing systems, including CO2 dehydration, and mooring systems, to secure floating facilities used to process, condition, and inject CO2 into offshore subsurface geologic formations.
•Subsea Production Systems. NOV is a leading designer and manufacturer of flexible subsea pipe systems designed to convey hydrocarbon production from the wellhead to production facilities in demanding offshore conditions. Flexible pipes are highly engineered, complex, helically-wound structures composed of multiple unbonded steel and composite layers, allowing them to withstand the demanding pressures and tensile loads of deepwater production while remaining resistant to wave- and tidal-induced fatigue. NOV also offers an assortment of critical subsea production equipment, such as water injection and tie-in connector systems, subsea storage units, and other related products.
•Production and Midstream Equipment. NOV designs and manufactures a variety equipment used in production and midstream operations, including: reciprocating, multistage, and progressive cavity pumps, midstream products, such as closures, transfer pumps, chokes and valves; and artificial lift support systems, including production BOPs and stuffing boxes.
•Industrial Equipment. NOV provides specialized, technology-driven mixers, heat exchangers, and progressive cavity pumps to process high-viscosity liquids in a variety of end markets. Marketed under globally recognized brands known for quality and reliability and backed by more than 75 years of advanced fluid-handling experience, NOV’s industrial pumps and mixers serve a wide breadth of end markets, including biogas, food and beverage, water/wastewater, chemical, mineral processing, pulp and paper, pharmaceutical, and general industrial processes.
See Note 16 to the Consolidated Financial Statements for financial information by segment and a geographical revenue and long-lived asset breakout. We have also included a glossary of oilfield terms at the end of Item 1. “Business” of this Annual Report.
NOV Low-Carbon Solutions
As a leading independent global energy technology and equipment provider, NOV is focused on helping its customers improve efficiencies, lower costs, improve reliability, and reduce the environmental impact of producing energy. Lower-cost, cleaner sources of energy significantly contribute to raising the global standard of living by powering economic development, enabling better infrastructure, healthcare, and education, and facilitating the production of goods and services that improve quality of life. NOV leverages its core competencies to assist customers’ efforts to reduce their environmental impact and carbon emissions. While oil and gas will remain critical to many parts of the global economy, the drive to reduce emissions represents an enormous economic opportunity for organizations that can improve the economic competitiveness of renewable energy and lower-carbon solutions. NOV is working to develop proprietary solutions to improve project execution, drive higher capital returns, and lower levelized costs of energy (“LCOE,” which is a measure of the average net present cost of electricity generation over a source’s lifetime) associated with renewable energy and low-carbon solutions.
Offshore Wind
NOV is a value-added partner capable of meaningfully reducing offshore wind project execution risk. The Company has a broad and growing portfolio of relevant technology, an extensive track record of successfully managing complex marine projects, long-standing relationships with global shipyards, and a robust global supply chain accustomed to stringent quality and traceability.
Wind turbine installation vessels (WTIVs). NOV is the leading global equipment and design provider for offshore wind turbine installation vessels. NOV expects continued demand from the global offshore wind installation vessel market, driven primarily by the need for larger vessels required to support the installation of larger, higher-capacity wind turbines. The vessels required to install taller, heavier turbines are similar to those previously designed by NOV and are relatively consistent across global geographies.
Cable-lay systems for offshore wind infrastructure. NOV has leveraged its expertise in cable-lay systems to provide carousel designs for offshore interconnector and interarray cable-lay vessels that support the infrastructure buildout necessary to aggregate and transmit power from offshore wind farms to shore. The Company has received several recent orders and anticipates additional demand for cable-lay vessels, driven by international offshore renewable energy projects and electrification demand.
Floating wind. NOV believes that the nascent floating offshore wind market may present one of the great renewable resource opportunities of the next decade. NOV is actively developing new products and technologies to support this industry alongside its legacy portfolio, which includes cranes, winches, mooring systems, cable-lay systems, ballasting systems, and chain connectors and tensioners. NOV has developed a patent-pending Tri-Floater semi-submersible floating foundation that requires less steel than competing offerings. NOV is also designing several proprietary lifting and handling tools for streamlined turbine component installation. Today, the floating offshore wind market is in the pre-commercial development phase, with industry players focused on proofs of concept and mitigating execution risk.
Onshore Wind
NOV is developing technology to lower onshore wind’s LCOE by economically constructing increasingly tall wind towers. Taller wind towers improve wind farm economics by allowing larger turbines to reach stronger winds, significantly increasing energy capture, lowering energy cost, and expanding the regions where wind projects can be profitably developed.
The Company has developed a patented tapered spiral-welding process that enables automated wind tower section production. Now in the early stages of commercialization, this proprietary process could significantly decrease tower section production times and reduce costs. Additionally, in time the process could enable in-field manufacturing operations, which could reduce costs and eliminate many logistical limitations of transporting the larger-diameter sections necessary for tall tower developments.
To support taller tower wind farm construction, NOV is developing a fit-for-purpose onshore wind tower erection system, built upon the intellectual property, control systems, and experience developed through mobile desert and arctic drilling rig design. The patent-pending system creates a structurally-sound, mobile tower crane that is expected to significantly improve the safety, reliability, and efficiency of tall wind tower installation processes.
Geothermal
Today, many of NOV’s oil and gas products are used for drilling geothermal wells. NOV’s drill pipe, drill pipe coatings, liner hangers, completion tools, drill bits, and full land rig packages have been a critical part of global geothermal development. Further, with geothermal power generation’s recently renewed traction, NOV has developed new proprietary products that address many unique geothermal production challenges worldwide.
Carbon Capture and Sequestration
NOV is positioned to play a meaningful role in the growing carbon capture and sequestration industry. NOV’s gas processing technology enables CO2-from-hydrocarbon separation, dehydration, and liquification, all vital parts of the carbon capture chain. In addition, the business’s turret and mooring systems used in offshore production facilitate the development of offshore carbon re-injection sites.
Lowering the Carbon and Environmental Footprint of the Oil & Gas Industry
NOV is committed to providing products and services that economically reduce carbon intensity and deliver superior performance. The Company has pioneered numerous solutions for improving the industry’s safety and environmental footprint, including NOV’s closed-loop solids control systems, regenerative power systems, dual-containment flowline technologies, solar pumping systems, and hydrocarbon leak detection systems, among others. NOV remains committed to reducing emissions and improving industry sustainability and has recently commercialized several new offerings including:
NOV’s PowerBlade™ Kinetic Energy Recovery System is a regenerative braking technology that utilizes both flywheel energy and lithium-ion battery energy storage to significantly reduce fuel consumption and emissions associated with drilling and hoisting. The PowerBlade system captures and regenerates electrical energy that would have previously dissipated as heat when a drawworks, crane, or winch slows and stops. The PowerBlade system then returns this energy when needed.
NOV’s Maestro™ smart configurable power management system helps operators reduce fuel consumption while maintaining safe drilling operations. The Maestro system effectively calculates and determines the optimized and safe level of required power generation in real-time and optimizes power consumption on the rig to reduce emissions.
NOV’s EcoBooster™ system enables peak power shaving in hydraulic power systems and minimizes the number of active pumps needed for each operation, resulting in reduced fuel consumption and emissions savings of up to 80%. The short term power peaks are covered with flow from accumulators connected to the ringline piping by a smart valve. An added benefit of the EcoBooster™ system is improved equipment performances as the hydraulic response from accumulators is quicker than ramping up pumps.
NOV’s iNOVaTHERM™ waste management system incorporates thermal desorption technology that efficiently minimizes and treats drilling waste at the source for safe on-site disposal, significantly reducing costly carbon-emitting activities, such as barge vessel trips, crane lifts, and trucking transport. NOV’s advanced waste management systems with real-time monitoring play an integral role in reducing the risks associated with waste in transit and decreasing the industries’ overall emissions operations.
NOV’s Ideal eFrac™ pressure pumping equipment delivers advanced well stimulation technology to dramatically reduce emissions and decrease ownership cost. The patent-pending Ideal eFrac system enhances wellsite safety by reducing complexity and removing personnel from hazardous environments. In addition to lower operating emissions and greater power density, the Ideal eFrac system is less disruptive to neighboring communities because it reduces truckloads by 40 percent, enables a smaller footprint, and reduces noise.
NOV’s eDrive™ system for wireline skids and hybrid wireline trucks provides a more sustainable solution for interventions by making customers’ operations less impactful on the environment and strengthening regulatory compliance.
Markets and Competition
The Company’s customers are predominantly service companies, oil and gas companies, and shipyards. Products within Energy Products & Services are sold and rented worldwide through NOV’s sales force and through commissioned representatives. Substantially all of Energy Equipment’s capital equipment and spare parts sales, and a large portion of smaller pumps and parts sales, are made through NOV’s direct sales force and distribution service centers. Sales to foreign oil companies are often made with or through representative arrangements.
The Company’s competition consists primarily of publicly traded oilfield service and equipment companies and smaller independent equipment manufacturers in the oil and gas, industrial, and renewable energy equipment markets.
The Company’s foreign operations, which include significant operations in the Middle East, Africa, Latin America, the Far East, Canada and Europe are subject to the risks normally associated with conducting business in foreign countries, including foreign currency exchange risks and uncertain political and economic environments, which may limit or disrupt markets, restrict the movement of funds or result in the deprivation of contract rights or the taking of property without fair compensation. Government-owned oil and gas companies located in some of the countries in which the Company operates have adopted policies (or are subject to governmental policies) giving preference to the purchase of goods and services from companies that are majority-owned by local nationals. As a result of such policies, the Company relies on joint ventures, license arrangements, and other business combinations with local nationals in these countries. See Note 16 to the Consolidated Financial Statements for information regarding geographic revenue information.
Influence of Oil and Gas Activity Levels on the Company’s Business
The oil and gas industry has historically experienced significant volatility. Demand for the Company’s products and services depends primarily upon the general level of activity in the oil and gas industry worldwide. Oil and gas activity is in turn heavily influenced by, among other factors, oil and gas prices worldwide. High levels of drilling and well remediation drive demand for the Company’s products and services. Additionally, high levels of oil and gas activity increase cash flows available for oil and gas companies, drilling contractors, oilfield service companies, and manufacturers of OCTG to invest in equipment that the Company sells.
See additional discussion on the current worldwide economic environment and related oil and gas activity levels in Item 1A. “Risk Factors” and Item 7. “Management’s Discussion and Analysis of Financial Condition and Results of Operations.”
Seasonal Nature of the Company’s Business
Historically, activity levels of some of the Company’s segments have followed seasonal trends to some degree. The Company typically realizes a more pronounced level of spending during the fourth quarter, and a decline in the first quarter, in certain of its businesses, which it believes is related to annual budgetary cycles and winter weather. On average, first quarter revenues through the past five years have declined 6.9% sequentially from the fourth quarter. Extremely harsh winter weather can reduce oilfield operations in far northern or high-altitude locations, including parts of Colorado, Canada and China, and the annual thaw (or “breakup”) in Canada makes some unimproved roads inaccessible to heavy equipment during part of each second quarter. Both situations temporarily reduce demand for the Company’s products and services in the affected geographic area, although revenues generally recover once conditions improve. Fluctuations in customers’ activity levels caused by national or customary holiday seasons and annual budgetary cycles can also affect their spending levels with the Company, leading to both temporary local decreases and increases in sales. While the Company anticipates that the seasonal and other trends described above may continue, there can be no guarantee that spending by the Company’s customers will continue to follow patterns seen in the past.
Research and New Product Development and Intellectual Property
The Company believes that it has been a leader in the development of new technology and equipment to enhance the safety and productivity of drilling and well servicing processes and that its sales and earnings have been dependent, in part, upon the successful introduction of new or improved products. It also invests in new technologies related to its non-oil and gas business as well as renewable energy-related technologies. Through its internal development programs and certain acquisitions, the Company has assembled an extensive array of technologies protected by a substantial number of trademarks, for both goods and services, patents, trade secrets, and other proprietary rights.
As of December 31, 2024, the Company held a substantial number of granted patents and pending patent applications worldwide, including U.S. patents and U.S. patent applications as well as patents and patent applications in a variety of other countries. Expiration dates of such patents range from 2025 to 2044. Additionally, the Company maintains a substantial number of trademarks for both goods and services and maintains a number of trade secrets.
Although the Company believes that this intellectual property has value, competitive products with different designs have been successfully developed and marketed by others. The Company considers the quality and timely delivery of its products, the service it provides to its customers, and the technical knowledge and skills of its personnel to be as important as its intellectual property in its ability to compete. While the Company stresses the importance of its research and development programs, the technical challenges and market uncertainties associated with the development and successful introduction of new products are such that there can be no assurance that the Company will realize future revenue from new products.
Manufacturing and Service Locations
The manufacturing processes for the Company’s products generally consist of machining, welding and fabrication, heat treating, assembly of manufactured and purchased components, and testing. See properties list in Item 2 for information regarding primary facilities.
Raw Materials
The Company believes that materials and components used in its operations are generally available from multiple sources. The prices paid by the Company for its raw materials may be affected by, among other things, energy, steel, and other commodity prices; tariffs and duties on imported materials; and foreign currency exchange rates. The Company has experienced rising, declining, and stable prices for milled steel and standard grades and has generally seen stainless alloy product prices continue to rise. The Company has generally been successful in its effort to mitigate the financial impact of higher raw materials costs on its operations by applying surcharges to, and adjusting prices on, the products it sells. Higher prices and lower availability of steel and other raw materials the Company uses in its business may adversely impact future periods.
Backlog
The Company monitors its backlog of orders to guide its planning. Backlog includes orders from the Company’s Energy Equipment segment that typically require more than three months to manufacture and deliver.
Backlog measurements are based on written orders that are firm but may be defaulted upon by the customer in some instances. Most require reimbursement to the Company for costs incurred in such an event. There can be no assurance that the backlog amounts will ultimately be realized as revenue, or that the Company will earn a profit on backlog work. Backlog at December 31, 2024, 2023 and 2022 was $4.4 billion, $4.1 billion and $3.8 billion, respectively.
Human Capital
NOV’s 34,010 global, diverse employees use their skill and expertise to provide the products and services that help our customers operate safely, efficiently, sustainably, and competitively. NOV’s team designs and manufactures a broad array of equipment and technology, from some of the heaviest, largest, and most complex mobile machines on earth (on and offshore drilling rigs, wind turbine installation vessels, and FPSOs) to very small precision sensors and measuring devices.
NOV’s employee base includes:
•Inventors, designers, scientists, and engineers (including mechanical, electrical, chemical, hydraulic, materials, computer, software, data analytics, and other disciplines) who design and improve the equipment, electronics, software, services and process that bring value to NOV’s customers;
•Technical sales, marketing and training professionals who educate customers, the industry, and our own organization about NOVs’ many products, services, and unique capabilities;
•Supply chain, logistics, warehousing, and quality testing professionals who ensure our factories, workshops, repair centers and field technicians have the right materials and tools to do their jobs efficiently;
•Production and service planners and schedulers, project managers, and process design and Quality Health Safety and Environmental professionals who plan, manage, and monitor the activities of our workforce to ensure high-quality, efficient, safe, and environmentally compliant operations;
•Machinists, metal fabricators, welders, assemblers, pipe fitters, riggers, electronics technicians, system integrators, composite material fabricators, paint and industrial coatings specialists, and other skilled trade professionals who use a wide variety of industrial processes, tools, and techniques to transform raw materials and purchased components into the many products NOV sells;
•Field service engineers, mechanics, and technicians who maintain, service, repair, and upgrade NOV equipment and, in some cases, assist customers with its operation;
•Business leaders and managers who create business strategies and targets, assess goals and priorities, and allocate resources to ensure NOV’s employees have the tools they need to get the job done and further build the Company’s competitive advantages; and
•Support function professionals, including: Information Technology, Human Resources, Legal, Compliance, Clerical, and Accounting and Finance who support operations to keep the business infrastructure and administrative burdens flowing.
34% percent of NOV employees work in the United States, 20% in Europe, 14% in Latin America, 13% in the Asia Pacific region, 13% in the Middle East and Africa, 3% in Canada and 3% in China. The Company’s 551 physical locations include manufacturing plants, research facilities, machine shops, office buildings, warehouses, and distribution centers where between 20 to 1,100 people work, and repair shops, rental tool bases, sales offices and other small locations where between 5 to 200 people work. Many NOV employees travel to work at customer locations, including onshore and offshore drilling sites, shipyards, and other industrial locations where equipment needs installation, commissioning, service, or repair, or where customers need training or technical support.
NOV’s success depends on these dedicated, skilled hardworking employees. The Company strongly believes that safeguarding and supporting the health, safety, diversity, respect, skills, career satisfaction, and wellbeing of NOV’s employees are critical to the success of the business. The Company’s Human Resources and Health Safety and Environmental organizations provide policies, oversight, monitoring, resources, training, and assistance companywide that are designed to foster a culture that embraces this belief.
Safety
Protecting the health and safety of all stakeholders is a core value. NOV maintains comprehensive monitoring and tracking of reportable injuries, reviewed each quarter by our operating Segment Presidents with the CEO, CFO, and Chief HSE Officer (including significant injuries, root cause analysis, and remediation measures). Successful safety programs and campaigns are also shared across the Company’s operations, including:
•Stop Work Authority – all NOV employees have the authority, responsibility, and duty to stop an unsafe act, practice, or job;
•Life Saving Rules – standardized rules aligning NOV with industry partners to reduce the risk of serious injury or death associated with critical hazards in the workplace;
•Safety Audits – programs coordinating safety walk-throughs, observations, and improvements at NOV facilities; and
•Safety stand downs – pausing normal operations for general safety meetings or to address a specific risk.
Health and wellbeing
The Company offers locally competitive health benefits, paid holidays and time off, and retirement benefits to our employees. In the US this includes health, vision and dental insurance, life insurance, disability insurance, a 401(k)-retirement savings plan, an employee assistance program, and a wellness program.
Diversity and inclusion
NOV recognizes that diversity of thought, insight and experiences, culture, talent, and education contribute to achieving the Company’s goals. NOV is committed to maintaining a diverse workforce, fostering inclusion, and providing equal opportunities based on merit and performance, which can lead to more innovative and creative business solutions, more informed decision-making, greater employee engagement, and better retention and recruitment of top talent.
In support of this commitment, NOV has implemented training programs covering the Company’s Code of Conduct and Business Ethics and Harassment in the Workplace.
Across NOV’s global workforce, women make up 16% of all employees, 23% of salaried employees, 20% of the C-Suite and hold 27% of the Company’s Board of Directors seats.
Career satisfaction and skills
NOV tracks and monitors data on the employee experience including hiring, turnover, and promotion trends. The Company also obtains employee feedback through ‘pulse’ surveys which measure employee engagement across several areas. Human resources managers and business managers across the Company review this information to identify areas for improvement and create remediation strategies.
The Company invests in opportunities for employee education, growth, and development, providing comprehensive training opportunities in technical, managerial, and leadership skills. Some programs include Powering Excellence designed for current and potential business leaders, Supervisor Training and Resources (STAR) and Leading Self and Others designed for new managers, as well as many other courses through the Company’s dedicated Technical Training Centers based in Houston, Singapore, UAE, Norway, UK, and South America.
Available Information
The Company’s principal executive offices are located at 10353 Richmond Avenue, Houston, Texas 77042. Its telephone number is (346) 223-3000. Further information about the Company’s products and services can be found on its website at: www.nov.com. The Company’s common stock is traded on the New York Stock Exchange under the symbol “NOV”. The Company’s annual reports on Form 10-K, quarterly reports on Form 10-Q, current reports on Form 8-K, and all related amendments are available free of charge on the Investor Relations portion of the Company’s website, www.nov.com/investor, as soon as reasonably practicable after such material is electronically filed with, or furnished to, the Securities and Exchange Commission (“SEC”). The Company’s Code of Ethics is also posted on its website. The information posted on the Company’s website is not incorporated by reference into this Annual Report on Form 10-K.
ITEM 1A. RISK FACTORS
You should carefully consider the risks described below, in addition to other information contained or incorporated by reference herein. Realization of any of the following risks could have a material adverse effect on our business, financial condition, cash flows and results of operations.
Industry Environment and Operations Related
We are dependent upon the level of activity in the oil and gas industry, which is volatile and has caused, and may cause future, fluctuations in our operating results.
The oil and gas industry historically has experienced significant volatility. Demand for our products and services depends primarily upon the number of oil rigs in operation, the number of oil and gas wells being drilled, the depth and drilling conditions of these wells, the volume of production, the number of well completions, capital expenditures of other oilfield service companies and the level of workover activity. Drilling and workover activity can fluctuate significantly in a short period, particularly in the United States and Canada. The demand and pricing for our products and services will continue to be influenced by numerous factors over which we have no control, including:
•current and anticipated future prices for oil and natural gas and volatility in supply and demand and pricing for oil and natural gas;
•the impact on markets from the Organization of Petroleum Exporting Countries (“OPEC”) and other countries, such as Russia, based on voluntary production limits;
•interruptions in supply chains caused by war, geo-political conflict, trade sanctions or other restrictions placed on oil producing countries, such as Russia, Iran, and Venezuela or otherwise placed on trade and commerce;
•the level of production by non-OPEC countries including production from U.S. shale plays;
•the level of excess production capacity;
•the cost of exploring for and producing oil and gas;
•the level of drilling activity and drilling rig dayrates;
•catastrophic events, such as public health crises, e.g., the COVID-19 pandemic or other geopolitical events, such as war or terrorist activities,
•availability and access to potential hydrocarbon resources;
•governmental political requirements, regulation and energy policies;
•evolving environmental and climate change policies and regulations and fluctuations in political conditions in the United States and abroad which adversely impact exploration or development of oil or gas;
•increased capital requirements imposed upon the oil and gas industry to comply with heightened air emissions control requirements and regulations;
•currency exchange rate fluctuations and devaluations; and
•development of alternate energy sources.
Expectations for future oil and gas prices cause many shifts in the strategies and expenditure levels of oil and gas companies, drilling contractors, and other service companies, particularly with respect to decisions to purchase major capital equipment of the type we manufacture. Oil and gas prices, which are determined by the marketplace, may remain below a range that is acceptable to certain of our customers, which could continue the reduced demand for our products and have a material adverse effect on our financial condition, results of operations and cash flows.
There are risks associated with certain contracts for our equipment.
As of December 31, 2024, we had a backlog of capital equipment to be manufactured, assembled, tested and delivered by Energy Equipment in the amount of $4.43 billion. The following factors, in addition to others not listed, could reduce our margins on these contracts, adversely impact completion of these contracts, adversely affect our position in the market or subject us to contractual penalties:
•financial challenges for consumers of our capital equipment;
•credit market conditions for consumers of our capital equipment;
•our failure to adequately estimate costs for making this equipment;
•our inability to deliver equipment that meets contracted technical requirements;
•our inability to maintain our quality standards during the design and manufacturing process;
•our inability to secure parts made by third party vendors at reasonable costs and within required timeframes;
•unexpected increases in the costs of raw materials;
•our inability to manage unexpected delays due to weather, shipyard access, labor shortages, public health crises such as the COVID-19 pandemic or other factors beyond our control;
•the imposition of tariffs or duties between countries, which could materially affect our global supply chain. For example, section 232 tariffs on steel may increase our costs, reduce margins or otherwise adversely affect the Company; and
•trade or travel restrictions, including export sanctions, trade controls or other supply chain interruption, which could affect our ability to manufacture, sell, or receive payment for our equipment and/or services.
The Company’s existing contracts for rig and production equipment generally carry significant down payment and progress billing terms to facilitate the ultimate completion of these projects and the majority do not allow customers to cancel projects for convenience. However, unfavorable market conditions or financial difficulties experienced by our customers have in the past and may in the future result in cancellation of contracts or the delay or abandonment of projects. Any such developments could have a material adverse effect on our operating results and financial condition.
Competition in our industry, including the introduction of new products and technologies by our competitors, as well as the expiration of the intellectual property rights protecting our products and technologies, could ultimately lead to lower revenue and earnings.
The oilfield products and services industry is highly competitive. We compete with national, regional and foreign competitors in each of our current major product lines. Certain of these competitors may have greater financial, technical, manufacturing and marketing resources than us, and may be in a better competitive position. The following can each affect our revenue and earnings:
•improvements in the availability and delivery of products and services by our competitors;
•the introduction of new products and technologies by our competitors; and
•the expiration of intellectual property rights protecting our products and technologies.
We are a leader in the development of new technology and equipment to enhance the safety and productivity of drilling and well servicing processes. If we are unable to maintain our technology leadership position, it could adversely affect our competitive advantage for certain products and services. Our revenues and operating results have been dependent, in part, upon the successful introduction of new or improved products. Through our internal development programs and acquisitions, we have assembled an array of technologies protected by a substantial number of trade and service marks, patents, trade secrets, and other proprietary rights, which expire after a prescribed duration, some at varying times over the coming years. The expiration of these rights could have a material adverse effect on our operating results. Furthermore, while the Company stresses the importance of its research and development programs, the technical challenges and market uncertainties associated with the development and successful introduction of new products are such that there can be no assurance that the Company will realize future revenue from new products. We may also have disputes with competitors concerning our technology or payment for licenses of our technology. For example, we have on-going litigation concerning payments due under some of our technology licenses. See Note 12 to the Consolidated Financial Statements for further discussion.
The tools, techniques, methodologies, programs and components we use to provide our services may infringe upon the intellectual property rights of others. Infringement claims generally result in significant legal and other costs and may distract management from running our core business. Royalty payments under licenses from third parties, if available, could increase our costs. Additionally, developing non-infringing technologies could increase our costs. If a license were unavailable, we might be unable to continue providing a particular service or product, which could adversely affect our financial condition, results of operations and cash flows.
In addition, certain foreign jurisdictions and government-owned oil and gas companies located in some of the countries in which we operate have adopted policies or regulations which may give local nationals in these countries competitive advantages. Actions taken by our competitors and changes in local policies, preferences or regulations could impact our ability to compete in certain markets and adversely affect our financial results.
A significant portion of our revenue is derived from our non-United States operations, which exposes us to risks inherent in doing business in each of the many countries in which we operate.
Approximately 66% of our revenues in 2024 were derived from operations outside the United States (based on revenue destination). Our foreign operations include significant operations in every oil producing region in the world. Our revenues and operations are subject to the risks normally associated with conducting business in foreign countries, including:
•uncertain political, social and economic environments;
•social unrest, acts of terrorism, war and other armed conflict, such as the conflicts in Ukraine, Israel and the broader Middle East;
•public health crises and other catastrophic events, such as the COVID-19 pandemic;
•trade and economic sanctions, export controls, and other restrictions imposed by the United States, European Union or other countries;
•restrictions under the United States Foreign Corrupt Practices Act (“FCPA”) or similar legislation, as well as foreign anti-bribery and anti-corruption laws;
•confiscatory taxation, tax duties, complex and everchanging tax regimes or other adverse tax policies;
•exposure to expropriation of our assets and other actions by foreign governments;
•deprivation of contract rights;
•restrictions on the repatriation of income or capital;
•currency exchange rate fluctuations and devaluations.
Supply chain disruption and price escalation could have a material adverse effect on our business, liquidity, consolidated results of operations and consolidated financial condition.
Our business relies on a broad range of raw materials and commodities for the products we manufacture. Shortages, transportation and supply disruptions can adversely impact supply of our manufacturing raw materials, as well as delivery of finished goods and transportation of our personnel for services. To varying degrees, these problems persist and may continue to persist as a consequence of evolving geopolitical trends. Among the factors that can adversely affect our business and consolidated results of operations are the following:
•inability to access raw materials and components;
•suppliers’ allocating less of their supply to the Company than required or requested by the Company;
•higher prices for raw materials and components;
•delays and higher costs for shipping and transportation;
•labor shortages and absences;
•wage and other labor cost inflation;
•liabilities resulting from an inability to perform services due to limited manpower availability or an inability to travel to perform the services; and
•other contractual or other legal claims from our customers resulting from supply chain, transportation or other business disruption.
We sometimes provide engineered process packages and other engineered products for multi-year, fixed price contracts that may require us to assume risks associated with cost over-runs, operating cost inflation, labor availability, supplier and contractor pricing and performance, and potential claims for liquidated damages.
We sometimes provide engineered skid packages of processing equipment or complex equipment in the form of multi-year contracts, without price escalation clauses. Some of these contracts are required by our customers, including national oil companies (NOCs). These projects include acting as suppliers of skid packages or engineered products, as well as installation and commissioning services and may require us to assume additional risks associated with cost over-runs from our vendors or due to material or labor cost escalation. In addition, NOCs often possess substantial leverage in the event of dispute or disagreement regarding performance under an agreement and they often operate in countries with unsettled political conditions, war, civil unrest, or other types of community issues. These issues may also result in cost over-runs, delays, and project losses.
Providing skid packages and engineered products as well as services on an integrated basis may also require us to assume additional risks associated with operating cost inflation, labor availability and productivity, supplier pricing and performance, and potential claims for liquidated damages. We rely on third-party subcontractors, consortium partners and equipment providers to assist us with the completion of these types of contracts. To the extent that we cannot engage subcontractors or acquire equipment or materials in a timely manner and on reasonable terms, our ability to complete a project in accordance with stated deadlines or at a profit may be impaired. If the amount we are required to pay for these goods and services exceeds the amount we have estimated in bidding for fixed-price work, we could experience losses in the performance of these contracts. These delays and additional costs may be substantial, and we may be required to compensate our customers for these delays. This may reduce the profit to be realized or result in a loss on a project.
Cybersecurity risks and threats could adversely affect our business.
We rely heavily on information systems to conduct our business. Any failure, interruption, or breach in security of our information systems, or information systems owned by others that we use and rely on, could result in failures or disruptions in our customer relationship management, general ledger systems and other systems. While we have policies and procedures designed to prevent or limit the effect of the failure, interruption or security breach of our information systems, there can be no assurance that any such failures, interruptions or security breaches will not occur or, if they do occur, that any breach or interruption will be sufficiently limited. The occurrence of any failures, interruptions or security breaches of our information systems could damage our reputation, result in a loss of our intellectual property or other proprietary information, including customer data, result in a loss of customer business, subject us to additional regulatory scrutiny, or expose us to civil litigation and possible financial liability, any of which could have a material adverse effect on our financial position or results of operations.
We may suffer business disruption from direct or indirect cyber-attacks. These take many forms, including ransomware directed at us, our vendors or our customers. As with virtually all other large companies, we receive numerous phishing efforts, and other attempted cyber-attacks such as efforts to hack our systems or use distributed denial-of-service attacks. These cyber-security risks have not resulted in any material adverse interruption in our business to date but pose an ongoing threat of material interruption to our business activities.
Our ability to hire and retain qualified personnel at competitive cost could materially affect our operations and growth potential.
Many of the products we sell, and related services that we provide, are complex and technologically advanced, which enable them to perform in challenging conditions. Our ability to succeed is, in part, dependent on our success in attracting and retaining qualified personnel to provide service and to design, manufacture, use, install and commission our products. A significant increase in wages paid by competitors, both within and outside the energy industry, for such highly skilled personnel could result in insufficient availability of skilled labor or increase our labor costs, or both. If the supply of skilled labor is constrained or our costs increase, our margins could decrease, and our growth potential could be impaired.
Severe or unseasonable weather conditions may adversely affect our operations.
Our business may be materially and adversely affected by severe weather conditions in areas where we operate. Many experts believe global climate change could increase the frequency and severity of extreme weather conditions, including coastal storm surges, inland flooding from intense rainfall, hurricane-strength winds, and extreme temperature. Repercussions of severe or unseasonable weather conditions may entail the evacuation of personnel and stoppage of services, damage to our facilities and project work sites, as well as our customers’ platforms or structures and offshore drilling rigs, inability to deliver material to jobsites in accordance with contract schedules, decreases in demand for oil and natural gas during unseasonably warm winters, and loss of productivity. Additionally, severe weather events could result in a disruption or suspension of our customers’ operations, thereby reducing demand for our services. Any of these events could adversely affect our financial condition, results of operations and cash flows.
An impairment of goodwill or other indefinite lived intangible assets could reduce our earnings.
Goodwill represents the excess of acquisition price paid over the fair value of the tangible and identifiable intangible assets acquired and liabilities assumed. The Company has approximately $1.6 billion of goodwill and $0.2 billion of other intangible assets with
indefinite lives as of December 31, 2024. Generally accepted accounting principles require the Company to test goodwill and other indefinite lived intangible assets for impairment at least annually or more frequently whenever events or circumstances indicate they might be impaired. Events or circumstances which could indicate a potential impairment include (but are not limited to): a significant sustained reduction in worldwide oil and gas prices or drilling; a significant sustained reduction in profitability or cash flow of oil and gas companies or drilling contractors; a significant sustained reduction in the market capitalization of the Company; a significant sustained reduction in capital investment by drilling companies and oil and gas companies; or a significant increase in worldwide inventories of oil or gas. The timing and magnitude of any goodwill impairment charge, which could be material, would depend on the timing and severity of the event or events triggering the charge and would require a high degree of management judgment. If we were to determine that any of our remaining balance of goodwill or other indefinite lived intangible assets was impaired, we would record an immediate charge to earnings with a corresponding reduction in stockholders’ equity; resulting in a possible increase in balance sheet leverage as measured by debt to total capitalization.
See additional discussion on “Goodwill and Other Indefinite – Lived Intangible Assets” in Critical Accounting Estimates of Item 7, “Management’s Discussion and Analysis of Financial Condition and Results of Operations.”
We have expanded and grown our businesses through acquisitions and continue to pursue a growth strategy, but we cannot assure that attractive acquisitions will be available to us at reasonable prices or that such acquisitions will result in the outcomes we anticipate.
We cannot assure that acquisitions will result in the financial, operational or other benefits that we anticipate, and we cannot assure that we will successfully integrate the operations and assets of any acquired business with our own or that our management will be able to effectively manage any new lines of business. Any inability on the part of management to integrate and manage acquired businesses and their assumed liabilities could adversely affect our business and financial performance. In addition, we may need to incur substantial indebtedness to finance future acquisitions. We cannot assure that we will be able to obtain this financing on terms acceptable to us or at all. Future acquisitions may result in increased depreciation and amortization expense, increased interest expense, increased financial leverage or decreased operating income for the Company, any of which could cause our business to suffer.
Legal and Regulatory Related
The adoption of any future federal, state, or local laws or implementing regulations imposing reporting obligations on, or limiting or banning, the hydraulic fracturing process could make it more difficult to complete natural gas and oil wells and could have a material adverse effect on our business, consolidated results of operations and consolidated financial condition.
Various federal and state legislative and regulatory initiatives, as well as actions in other countries, have been or could be undertaken which could result in additional requirements or restrictions being imposed on hydraulic fracturing operations. For example, legislation and/or regulations have been adopted in many U.S. states that require additional disclosure regarding chemicals used in the hydraulic fracturing process but that generally include protections for proprietary information. Legislation, regulations and/or policies have also been adopted at the state level that impose other types of requirements on hydraulic fracturing operations (such as limits on operations in the event of certain levels of seismic activity). Additional legislation and/or regulations are being considered at the state and local level that could impose further chemical disclosure or other regulatory requirements (such as prohibitions on hydraulic fracturing operations in certain areas) that could affect our operations. Four states (New York, Maryland, Washington, and Vermont) have banned the use of high-volume hydraulic fracturing. Oregon has adopted a five-year moratorium and Colorado has enacted legislation providing local governments with regulatory authority over hydraulic fracturing operations. Local jurisdictions in some states have adopted ordinances that restrict or in certain cases prohibit the use of hydraulic fracturing, although many of these ordinances have been challenged and some have been overturned. In addition, governmental authorities in various foreign countries where we have provided or may provide hydraulic fracturing services have imposed or are considering imposing various restrictions or conditions that may affect hydraulic fracturing operations. The adoption of any future federal, state, local, or foreign laws or regulations imposing reporting obligations on, or limiting or banning, the hydraulic fracturing process could make it more difficult to complete natural gas and oil wells and could have a material adverse effect on our business, consolidated results of operations, and consolidated financial condition.
Our failure to comply with existing or future U.S. and foreign laws and regulations could have a material adverse effect on our business and our results of operations.
Our ability to comply with various complex U.S. and foreign laws and regulations, such as the FCPA, the U.K. Bribery Act and other foreign anti-bribery and anti-corruption laws, various trade control regulations, and human rights and anti-slavery legislation is dependent on the success of our ongoing compliance program, including our ability to continue to effectively supervise and train our employees to deter prohibited practices. These various laws and regulations can change frequently and significantly. We may become involved in a governmental investigation even if the Company has complied with these laws. If we fail to comply with applicable laws and regulation, we could be subject to investigations, sanctions, and civil and criminal prosecution as well as fines and penalties, which could have a material adverse effect on our reputation and our business, financial condition, results of operations and cash flows. In addition, government disruptions could negatively impact our ability to conduct our business. Supply chain restrictions such as the U.K. Modern Slavery Act and other similar legislation could also materially affect our supply chain, cost of production, and ability to manufacture our products.
We are also required to comply with various complex U.S. and foreign tax laws, regulations and treaties. These laws, regulations and treaties can change frequently and significantly, and it is reasonable to expect changes in the future. If we fail to comply with any of these tax laws, regulations or treaties, we could be subject to, among other things, civil and criminal prosecution, fines, penalties and confiscation of our assets, which could disrupt our ability to provide our products and services to our customers. Any of these events could have a material adverse effect on our business, financial condition, results of operations and cash flows.
Further, in some instances, direct or indirect consumers of our products and services, entities providing financing for purchases of our products and services or members of the supply chain for our products and services may become involved in governmental investigations, internal investigations, political or other enforcement matters. In such circumstances, such investigations may adversely impact the ability of consumers of our products, entities providing financial support to such consumers or entities in the supply chain to timely perform their business plans or to timely perform under agreements with us. The Company could also become involved in investigations of consumers of our products at significant cost to the Company.
We could be adversely affected if we fail to comply with any of the numerous international, federal, state and local laws, regulations and policies that govern environmental protection, data privacy, zoning and other matters applicable to our businesses.
Our businesses are subject to numerous international, federal, state and local laws, regulations and policies governing environmental protection, data privacy, zoning and other matters. Moreover, data privacy laws and regulations enacted in the various jurisdictions in which we operate impose a variety of obligations to protect data against misuse or disclosure. These laws and regulations have changed frequently in the past and it is reasonable to expect additional changes in the future. If existing regulatory requirements change, we may be required to make significant unanticipated capital and operating expenditures. We cannot assure you that our operations will continue to comply with future laws and regulations. Governmental authorities may seek to impose fines and penalties on us or to revoke or deny the issuance or renewal of operating permits for failure to comply with applicable laws and regulations. Under these circumstances, we might be required to reduce or cease operations or conduct site remediation or other corrective action which could adversely impact our operations and financial condition.
Our businesses expose us to potential environmental, product or personal injury liability.
Our businesses have in the past and may in the future expose us to risks from harmful substances that escape into the environment or from our product failing to perform or causing personal injury, or exposing individuals to chemicals, harmful substances, or environmental conditions, any of which could result in:
•personal injury or loss of life;
•severe damage to or destruction of property;
•environmental damage; and/or
•suspension of operations.
Our current and past activities, as well as the activities of our former divisions and subsidiaries, could result in our facing substantial environmental, regulatory, personal injury, class action, mass tort and other litigation and liabilities. These could include the costs of cleanup of contaminated sites and site closure obligations. These liabilities could also be imposed on the basis of one or more of the following theories:
•strict liability, including joint and several strict liability
•breach of contract with customers; or
•as a result of contractual agreements to indemnify our customers in the normal course of business, which is normally the case.
We may not have adequate insurance for potential environmental, product or personal injury liabilities.
While we maintain liability insurance, this insurance is subject to coverage limits. In addition, certain policies do not provide coverage for damages resulting from environmental contamination or may exclude coverage for other reasons. We face the following risks with respect to our insurance coverage:
•we may not be able to continue to obtain insurance on commercially reasonable terms;
•we may be faced with types of liabilities that will not be covered by our insurance;
•our insurance carriers may not be able to meet their obligations under the policies; or
•the dollar amount of any liabilities may exceed our policy limits.
Even a partially uninsured claim, if successful and of significant size, could have a material adverse effect on our consolidated financial statements.
Future laws, regulations, treaties, international obligations, reporting obligations related to greenhouse gases (GHG), climate change, and activism and customer positions related to environmental, social and governance (ESG) could adversely impact our business, may increase compliance obligations and could have a material adverse effect on our business, consolidated results of operations and consolidated financial condition.
Focus and attention by advocacy groups and regulatory agencies on climate change and greenhouse gas (GHG) emissions in the United States and European Union have accelerated. Investors, customers, governance pundits and government officials have increased focus on sustainability, stakeholder governance and the energy transition. As a result, there has been increased promotion of alternative energy and increased negative attitudes or perceptions of fossil fuels. New laws and regulations to reduce GHG, including the imposition of fees or taxes, could adversely impact our operations and financial condition. Oil and natural gas exploration and production may decline as a result of environmental requirements, including land use policies responsive to environmental concerns. State, national, and international governments and agencies in areas in which we conduct business continue to evaluate, and in some instances adopt, climate-related legislation and other regulatory initiatives that limit GHG emissions.
The trend of increased environmental regulation is not linear and can fluctuate depending on the administration and jurisdiction, even within the same county. For example, on January 20, 2025, President Trump issued Executive Orders seeking to rescind prior Executive Orders and agency actions enacted by the Biden Administration. These include revoking Biden-era Executive Orders withdrawing certain offshore waters within the Outer Continental Shelf available for oil and gas exploration and imposing a temporary prohibition of offshore wind leasing in the Outer Continental Shelf. We cannot foresee the potential impact and unintended consequences that future Executive Orders or the changes in enforcement of existing laws, rules, and orders may have on our business. Additionally, although the Trump Administration initially withdrew the U.S. from the Paris Agreement in November 2020, the U.S. reentered the Paris Agreement in February 2021 under the Biden Administration, but the Trump Administration again withdrew from the Paris Agreement on January 20, 2025. Though we are closely following developments in this area and changes in the regulatory landscape in the United States and other jurisdictions, we cannot predict with precision or quantify how or when challenges may arise and ultimately impact our business.
Laws and regulations in some jurisdictions, for example in the EU Corporate Sustainability Reporting Directive (“CSRD”) and the California Climate Corporate Data Accountability Act and Climate-Related Financial Risk Act, impose obligations in future years to report GHG emissions. Depending on the jurisdiction, e.g., outside of the United States, the recent Executive Orders may not change our regulatory obligations. Calculation of some GHG emissions can involve uncertainty and lack precision because of the absence of reliable inputs or methods to perform such calculations. Accordingly, the EU CSRD and California regulations and other similar regulations give rise to litigation risk concerning the required disclosures. Because our business depends on the level of activity in the oil and natural gas industry, existing or future laws, regulations, treaties, or international agreements related to GHG and climate change, including incentives to conserve energy or use alternative energy sources, may reduce demand for oil and natural gas and could have a negative impact on our business. Likewise, such restrictions may result in additional compliance obligations with respect to the release, capture, sequestration, and use of carbon dioxide. The efforts we have taken, and may undertake in the future, to respond to these evolving or new regulations and to environmental initiatives of customers, investors, and others may increase our costs. These and other environmental requirements could have a material adverse effect on our business, consolidated results of operations, and consolidated financial condition.
In addition to regulatory risks, increased advocacy related to environmental, social and governance (ESG) issues generally, and on climate change and GHG emissions in particular, may have a material adverse effect on our business, consolidated results of operations and consolidated financial condition. For example, a number of our significant customers have been sued in state and federal court in the U.S. and international courts by plaintiffs seeking to impose liability on such customers for their alleged contribution to climate change or failure to adequately warn the public of alleged risks associated with fossil fuels, and while this litigation has not generally affected companies like us within oilfield services, we cannot foreclose the possibility that this type of litigation may trend in that direction. Further, our investors, customers, and other stakeholders have increased their focus on sustainability and the energy transition. Negative perceptions of the oil and natural gas industry and promotion of alternative energy sources can negatively impact demand for our products and the price of our stock. Additionally, we may suffer reputational harm if we do not adequately identify or manage ESG-related risks or if there are negative perceptions of our response to ESG issues. We may also incur increased costs as a result of our efforts to address ESG issues important to our stakeholders, including providing expanded reporting on ESG issues, which may impact our financial condition or results of operations. Public reporting on ESG issues has been increasingly subject to scrutiny by regulators, investors and the public. Any actual or perceived “greenwashing”—defined generally as the misrepresentation or exaggeration of ESG or sustainability practices or commitments not adequately supported by measurable actions or outcomes—could result in reputational harm and legal liability, including regulatory enforcement actions, investor lawsuits and consumer claims under securities and consumer protection laws.
The combination of laws, regulations, treaties, negative reputational impact, and societal perceptions of our industry may adversely impact demand for oil and natural gas and demand for our products. Consequently, the price of our stock could be negatively impacted as we navigate the energy transition.
Local content requirements imposed in certain jurisdictions may increase the complexity of our operations and impact the demand for our services.
A growing number of nations are requiring equipment providers and contractors to meet local content requirements or other local standards. To meet many of these local content and other requirements, we are required to attract and retain qualified local personnel. If we are unable to do so because the supply of qualified local personnel is constrained for any reason, the growth and profitability of our business may be adversely affected. In addition, our ability to work in certain jurisdictions is sometimes subject to our ability to successfully negotiate and agree upon acceptable joint venture agreements. The failure to reach acceptable agreements could adversely impact the Company’s operations in certain countries. Additionally, we may share control of joint ventures with unaffiliated third parties. Differences in views, and disagreements, among joint venture parties may result in delayed decision-making and disputes on important issues. In some instances, we could suffer a material adverse effect to the results of our joint ventures and our consolidated results of operations.
The Company could be subject to changes in its tax rates, the adoption of new tax legislation, tax audits, or exposure to additional tax liabilities and to changes in tariffs that could have a material adverse effect on our business, consolidated results of operations, and consolidated financial condition.
We are subject to taxes in the U.S. and numerous jurisdictions where we operate and our subsidiaries are organized. Due to economic and political conditions, tax rates in the U.S. and other jurisdictions may be subject to significant change. An increase in tax rates, particularly in the U.S., changes in our ability to realize our deferred tax assets, or adverse outcomes resulting from examinations of our tax returns could have a material adverse effect on our business, consolidated results of operations, and consolidated financial condition. Our supply chain is integrated through numerous countries, with significant trade into and out of many jurisdictions, including the U.S., Mexico, Canada, the EU and China. As a result, changes in tariffs could have a material adverse effect on our financial results. In addition, our tax returns are subject to examination by the U.S. and other tax authorities and governmental bodies. We regularly assess the likelihood of an adverse outcome resulting from these examinations to determine the adequacy of our provision for taxes. There can be no assurance as to the outcome of the examinations. In particular, the Company received and paid a $51 million transfer pricing tax assessment in Denmark in 2022. The Company and its advisors believe the assessment is without merit. The Company is presently appealing and believes it will be reimbursed following a successful appeals process. The payment has been recorded as a long-term receivable. Additionally, the IRS has proposed an adjustment to certain restructuring steps which occurred in 2017. The Company and its advisors believe these restructuring steps were properly completed in accordance with U.S. tax laws and regulations and has appealed the proposed adjustment. However, if the Company is unsuccessful in the appeals process, the IRS proposed adjustment would be substantially offset by the utilization of foreign tax credit carryforwards which subsequently expired unused or are fully reserved by a valuation allowance and $48 million additional income tax expense would be owed. In 2024, the company received a proposed assessment of $31 million in Canada related to its 2016 – 2018 exam cycle. The company and its advisors believe its filing position is consistent with Canadian tax law and tax court cases. The company paid $16 million, is presently appealing and believes it will be reimbursed following a successful appeals or tax court process.
Our operations outside the United States require us to comply with both United States and international regulations violations of which could have a material adverse effect on our business, consolidated results of operations, and consolidated financial condition. In particular, our operations in Russia have subjected us to additional risks related to current political conflicts.
The shipment of goods, services, and technology across international borders subjects us to extensive trade laws and regulations. Our import and export activities are governed by the trade, customs, and other laws and regulations in the countries in which we operate. Moreover, many countries, including the United States, control the export, re-export, and in-country transfer of certain goods, services, and technology and impose related export recordkeeping and reporting obligations. Governments also impose economic sanctions against certain countries, persons, and entities that can restrict or prohibit transactions involving such countries, persons, and entities. This in turn can restrict, limit or prevent our conduct of business in certain jurisdictions. For our operations outside the United States, we are required to comply with applicable United States laws and other applicable international regulations. Because we have legal entities, facilities and citizens from many jurisdictions, our operations and people may be subject to laws and regulations issued by different sovereigns. Sometimes these laws conflict and impose inconsistent obligations on citizens from the different jurisdictions in which we operate giving rise to complicated compliance issues. In 2014, the United States, the European Union and other governmental bodies imposed sectoral sanctions directed at Russia’s oil and gas industry. Among other things, these sanctions restricted the provision of certain United States and European Union goods, services, and technology in support of exploration or production for deep water, Arctic offshore, or shale projects that have the potential to produce oil in Russia. At the time, these sanctions resulted in our winding down and ending work on certain projects in Russia and prevented us from pursuing certain other projects in Russia. In 2017 and 2018, the U.S. Government imposed additional sanctions against Russia, Russia’s oil and gas industry, and certain Russian companies.
Since that time, as a result of armed conflict in Ukraine, governments in the European Union, the United States, the United Kingdom, Switzerland, and other countries have enacted additional sanctions against Russia and Russian interests. Among other things, these sanctions include controls on the export, re-export, and in-country transfer in Russia of certain goods, supplies, and technologies, including some that we use in our business in Russia. They from time to time have been updated by the various governments and
also impose restrictions on doing business with certain Russian customers, certain financial institutions and certain individuals and restrict or prohibit new investments and business activities in Russia. The situation is complicated by actual and potential governmental and legal actions taken by the Russian Federation in response to the sanctions, which could expose our employees to adverse legal consequences in Russia, including potential criminal penalties. Other sanctions have been enacted related to Belarus and Belarusian interests. In response to these sanctions, we ceased new investments in Russia and have curtailed our activities in Russia. During the third quarter of 2022, we sold our business in Belarus and entered into an agreement to sell our business in Russia. The sale is subject to various government approvals in Russia and other jurisdictions. Litigation may result from the confluence of these events in Russia and Belarus and our response to the various sanctions as we work to comply with applicable laws and regulations. We also may incur severance costs as a result of conditions in Russia if we are unable to obtain government approval. As a consequence of the conflict in Ukraine and related sanctions on activities related to Russia and Belarus, we recorded impairment and other charges of $4.2 million for the year ended December 31, 2023. We did not record impairment or other charges for the year ended December 31, 2024.
In addition to customs laws, trade regulations and sanctions, our operations in countries outside the United States are subject to anti-corruption laws. For example, we comply with the United States Foreign Corrupt Practices Act (FCPA), which prohibits United States companies and their agents and employees from providing anything of value to a foreign official for the purposes of influencing any act or decision of these individuals in their official capacity to help obtain or retain business, direct business to any person or corporate entity, or obtain any unfair advantage. Our activities create the risk of unauthorized payments or offers of payments by our employees, agents, or joint venture partners that could be in violation of anti-corruption laws, even though some of these parties are not subject to our control. We have internal control policies and procedures and have implemented training and compliance programs for our employees and agents with respect to the FCPA. However, we cannot assure that our policies, procedures, and programs will always protect us from reckless or criminal acts committed by our employees or agents. We are also subject to the risks that our employees, joint venture partners, and agents outside of the United States may fail to comply with other applicable laws. Allegations of violations of applicable anti-corruption laws have resulted and may in the future result in internal, independent, or government investigations. Violations of anti-corruption laws may result in severe criminal or civil sanctions, and we may be subject to other liabilities, which could have a material adverse effect on our business, consolidated results of operations and consolidated financial condition.
GLOSSARY OF OILFIELD TERMS
| | |
|
| (Sources: Company management; “A Dictionary for the Petroleum Industry,” The University of Texas at Austin, 2001.) |
|
|
Bit |
| The cutting or boring element used in drilling oil and gas wells. The bit consists of a cutting element and a circulating element. The cutting element is steel teeth, tungsten carbide buttons, industrial diamonds, or polycrystalline diamonds (“PDCs”). These teeth, buttons, or diamonds penetrate and gouge or scrape the formation to remove it. The circulating element permits the passage of drilling fluid and utilizes the hydraulic force of the fluid stream to improve drilling rates. In rotary drilling, several drill collars are joined to the bottom end of the drill pipe column, and the bit is attached to the end of the drill collars. Drill collars provide weight on the bit to keep it in firm contact with the bottom of the hole. |
|
|
Blowout Preventer (BOP) |
| Series of valves installed at the wellhead while drilling to prevent the escape of pressurized fluids. |
|
|
Borehole Enlargement (“BHE”) | | The process of opening up or enlarging the internal diameter of the wellbore. This is typically done with under-reamers, reamers, or hole openers. |
|
|
Coiled Tubing |
| A continuous string of flexible steel tubing, often hundreds or thousands of feet long, that is wound onto a reel, often dozens of feet in diameter. The reel is an integral part of the coiled tubing unit, which consists of several devices that ensure the tubing can be safely and efficiently inserted into the well from the surface. Because tubing can be lowered into a well without having to make up joints of tubing, running coiled tubing into the well is faster and less expensive than running conventional tubing. Rapid advances in the use of coiled tubing make it a popular way in which to run tubing into and out of a well. Also called reeled tubing. |
|
|
Cuttings |
| Fragments of rock dislodged by the bit and brought to the surface in the drilling mud. Washed and dried cutting samples are analyzed by geologist to obtain information about the formations drilled. |
|
|
Directional Well |
| Well drilled in an orientation other than vertical in order to access broader portions of the formation. |
|
|
Drawworks |
| The hoisting mechanism on a drilling rig. It is essentially a large winch that spools off or takes in the drilling line and thus raises or lowers the drill stem and bit. |
| | |
Fiberglass-reinforced spoolable pipe |
| A spoolable glass fiber-reinforced epoxy composite tubular product for onshore oil and gas gathering and injection systems, with superior corrosion resistant properties and lower installed cost than steel. |
|
|
Flexible pipe |
| A dynamic riser that connects subsea production equipment to a topside facility allowing for the flow of oil, gas, and/or water. Also used on the seafloor to tie wells and subsea equipment together. |
|
|
Formation |
| A bed or deposit composed throughout of substantially the same kind of rock; often a lithologic unit. Each formation is given a name, frequently as a result of the study of the formation outcrop at the surface and sometimes based on fossils found in the formation. |
|
|
FPSO |
| A Floating Production, Storage and Offloading vessel used to receive hydrocarbons from subsea wells, and then produce and store the hydrocarbons until they can be offloaded to a tanker or pipeline. |
|
|
Hydraulic Fracturing |
| The process of creating fractures in a formation by pumping fluids, at high pressures, into the reservoir, which allows or enhances the flow of hydrocarbons. |
|
|
Jack-up rig |
| A mobile bottom-supported offshore drilling structure with columnar or open-truss legs that support the deck and hull. When positioned over the drilling site, the bottoms of the legs penetrate the seafloor. |
|
|
| | |
Joint |
| 1. In drilling, a single length (from 16 feet to 45 feet, or 5 meters to 14.5 meters, depending on its range length) of drill pipe, drill collar, casing or tubing that has threaded connections at both ends. Several joints screwed together constitute a stand of pipe. 2. In pipelining, a single length (usually 40 feet-12 meters) of pipe. 3. In sucker rod pumping, a single length of sucker rod that has threaded connections at both ends. |
| | |
Levelized Cost of Energy (“LCOE”) | | A measure of the average net present cost of electricity generation for a generating plant over its lifetime. The LCOE is calculated as the ratio between all the discounted costs over the lifetime on an electricity generating plant divided by a discounted sum of the actual energy amounts delivered. LCOE is used to compare different methods of electricity generation on a consistent basis. |
| |
Mooring system |
| The method by which a vessel or buoy is fixed to a certain position, whether permanently or temporarily. |
| | |
Oil Country Tubular Goods (OCTG) | | Metal products used in the oil and gas industry, OCTG products include drill pipe, casing, tubing, couplings, and accessories. |
|
|
Pressure control equipment |
| Equipment used in: 1. The act of preventing the entry of formation fluids into a wellbore. 2. The act of controlling high pressures encountered in a well. |
|
|
Pressure pumping |
| Pumping fluids into a well by applying pressure at the surface. |
|
|
Riser pipe |
| The pipe and special fitting used on floating offshore drilling rigs to establish a seal between the top of the wellbore, which is on the ocean floor, and the drilling equipment located above the surface of the water. A riser pipe serves as a guide for the drill stem from the drilling vessel to the wellhead and as a conductor for drilling fluid from the well to the vessel. The riser consists of several sections of pipe and includes special devices to compensate for any movement of the drilling rig caused by waves. Also called marine riser pipe, riser joint. |
| | |
Solids |
| See “Cuttings” |
|
|
String |
| The entire length of casing, tubing, sucker rods, or drill pipe run into a hole. |
|
|
Tensioner |
| A system of devices installed on a floating offshore drilling rig to maintain a constant tension on the riser pipe, despite any vertical motion made by the rig. The guidelines must also be tensioned, so a separate tensioner system is provided for them. |
|
|
Thermal desorption |
| The process of removing drilling mud from cuttings by applying heat directly to drill cuttings. |
|
|
Top drive |
| A device similar to a power swivel that is used in place of the rotary table to turn the drill stem. It also includes power tongs. Modern top drives combine the elevator, the tongs, the swivel, and the hook. Even though the rotary table assembly is not used to rotate the drill stem and bit, the top-drive system retains it to provide a place to set the slips to suspend the drill stem when drilling stops. |
| | |
Turret |
| Mechanical device that allows a floating vessel to rotate around stationary flowlines, umbilicals, and other associated risers. |
|
|
Well completion |
| 1. The activities and methods of preparing a well for the production of oil and gas or for other purposes, such as injection; the method by which one or more flow paths for hydrocarbons are established between the reservoir and the surface. 2. The system of tubulars, packers, and other tools installed beneath the wellhead in the production casing; that is, the tool assembly that provides the hydrocarbon flow path or paths. |
|
|
Wellhead |
| The termination point of a wellbore at surface level or subsea, often incorporating various valves and control instruments. |
|
|
Well stimulation |
| Any of several operations used to increase the production of a well, such as acidizing or fracturing. |
|
|
| | |
Wellbore |
| A borehole; the hole drilled by the bit. A wellbore may have casing in it or it may be open (uncased); or part of it may be cased, and part of it may be open. Also called a borehole or hole. |
|
|
Wireline |
| A slender, rodlike or threadlike piece of metal usually small in diameter, that is used for lowering special tools (such as logging sondes, perforating guns, and so forth) into the well. Also called slick line. |
None.
ITEM 1C. CYBERSECURITY
As part of the Company’s enterprise risk management, we maintain a cyber risk program with established policies and procedures to detect, prevent, mitigate, and remediate cybersecurity incidents and related risks. The program is led by our Chief Information Security Officer (“CISO”), who has 30 years of experience in information security and is a Certified Information Systems Security Professional. Our CISO reports directly to our Chief Information Officer of Corporate IT, who has over 25 years of experience in all areas of information technology. Our cybersecurity team is comprised of experienced, educated, and certified professionals with decades of experience in cybersecurity leadership roles.
Our cyber risk management program is based on recognized industry practices and standards in cybersecurity and information technology. These standards include the National Institute of Standards and Technology (“NIST”) Cybersecurity Framework (“CSF”) and the International Organization for Standardization (“ISO”) 27001. Security controls are managed using an information security management system (“ISMS”), providing a systematic approach consisting of people, processes, and technology. NOV’s ISMS aims to minimize risk and ensure business continuity by proactively limiting the impact of security incidents.
Our cybersecurity incident response plan includes an escalation process to senior management, who evaluates various factors related to the cybersecurity incident to assess the impact on the Company and any required disclosures. If a cybersecurity incident was determined to be material by senior management, our Board of Directors would be promptly notified and the incident reported based on applicable legal requirements. Our processes also address cybersecurity risks associated with third-party service providers, including those in our supply chain or who have access to our data or systems. We evaluate third-party service providers from a cybersecurity risk perspective, which may include an assessment of that service provider’s cybersecurity posture or a recommendation of specific mitigation controls. We conduct continuous vulnerability assessments and continuous penetration testing. Additionally, we undergo internal and external assessments of our processes to identify opportunities for improvement and reduce exposure to cybersecurity incidents.
The Company’s Board of Directors provides oversight of the Company’s cybersecurity program through periodic updates, typically on a quarterly basis. Additionally, on an annual basis, cybersecurity risks are discussed as part of enterprise risk management.
We have not experienced any cybersecurity incidents that have had a material adverse effect on our business, financial condition, results of operations, or cash flows. Although we have not experienced any cybersecurity incidents that are individually, or in aggregate, material, we have experienced cyberattacks in the past, which we believe have thus far been mitigated by preventative, detective, and responsive measures put in place by the Company. We recognize the potential impact of cybersecurity risks on our business strategy, results of operations, and financial condition and take proactive measures to mitigate these risks. See Item 1A. “Risk Factors.”
ITEM 2. PROPERTIES
The Company owned or leased approximately 551 facilities worldwide as of December 31, 2024, including the following principal manufacturing, service, distribution and administrative facilities:
| | | | |
| | | | |
| | | | Owned / |
Location | | Description | | Leased |
Energy Products & Services: | | |
Navasota, Texas | | Manufacturing Facility & Administrative Offices | | Owned |
Conroe, Texas | | Manufacturing Facility of Drill Bits and Downhole Tools, Administrative & Sales Offices | | Owned |
Houston, Texas | | Sheldon Road Inspection Facility | | Owned |
Veracruz, Mexico | | Manufacturing Facility of Tool Joints, Warehouse & Administrative Offices | | Owned |
Houston, Texas | | Holmes Rd Complex: Manufacturing, Warehouse, Coating Manufacturing Plant & Corporate Office | | Owned |
Cedar Park, Texas | | Instrumentation Manufacturing Facility, Administrative & Sales Offices | | Owned |
Dubai, UAE | | Manufacturing Facility of Downhole Tools, Distribution Warehouse | | Leased |
Conroe, Texas | | Solids Control Manufacturing Facility, Warehouse, Administrative & Sales Offices, and Engineering Labs | | Owned |
Houston, Texas | | Manufacturing of plastic thread products | | Owned |
Senai, Malaysia | | Manufacturing Facility of Fiber Glass Products | | Owned* |
Qingdau, Shandong, China | | Manufacturing of fiber-reinforced tubular products | | Leased |
Houston, Texas | | Manufacturing of fiber-reinforced tubular products & Administrative Offices | | Leased |
Dammam, Saudi Arabia | | Manufacturing of fiberglass products | | Leased |
Mt. Union, Pennsylvania | | Manufacturing of fiberglass products | | Owned |
Energy Equipment: | | |
Houston, Texas | | Bammel Facility, Repairs, Service, Aftermarket Parts, Administrative & Sales Offices | | Leased |
Houston, Texas | | Manufacturing Plant of Drilling Equipment | | Leased |
Houston, Texas | | West Little York Manufacturing Facility, Repairs, Service, Administrative & Sales Offices | | Owned |
New Iberia, Louisiana | | Repair, Services and Spares Facility | | Leased |
Singapore | | Manufacturing, Repairs, Service, Field Service/Training, Administrative & Sales Offices | | Leased |
Al Jubail, Saudi Arabia | | Manufacturer and Service of Drilling Rigs and Equipment | | Leased |
Tulsa, Oklahoma | | Manufacturing Facility of Pumps, Warehouse and Administrative & Sales Offices | | Owned |
Kintore, Aberdeenshire, Scotland, UK | | Manufacturing & Servicing of Elmar, ASEP and Anson Equipment | | Leased |
Kalundborg, Denmark | | Flexibles Manufacturing, Warehouse, Shop & Administrative Offices | | Owned |
Superporto du Acu, Brazil | | Flexibles Manufacturing, Warehouse, Shop & Administrative Offices | | Owned* |
Corporate: | | | | |
Houston, Texas | | Corporate and Shared Administrative Offices | | Leased |
*Building owned but land leased.
ITEM 3. LEGAL PROCEEDINGS
See Note 12 – Commitments and Contingencies (Part IV, Item 15 of this Form 10-K) for further discussion.
ITEM 4. MINE SAFETY DISCLOSURES
Information regarding mine safety and other regulatory actions at our mines is included in Exhibit 95 to this Form 10-K.
PART II
ITEM 5. MARKET FOR REGISTRANT’S COMMON EQUITY, RELATED STOCKHOLDER MATTERS AND ISSUER PURCHASES OF EQUITY SECURITIES
Market Information
Our common stock is traded on the New York Stock Exchange (NYSE) under the symbol “NOV”. As of January 31, 2025, there were 1,338 holders of record of our common stock. Many stockholders choose to own shares through brokerage accounts and other intermediaries rather than as holders of record (excluding individual participants in securities positions listing) so the actual number of stockholders is unknown but significantly higher.
Cash dividends declared was $0.05 per share in the first quarter of 2024, $0.075 per share in each of the remaining quarters of 2024 and $0.05 per share in each quarter of 2023, aggregating $108 million and $79 million for the years ended December 31, 2024 and 2023, respectively. The declaration and payment of future dividends is at the discretion of the Company’s Board of Directors and will be dependent upon the Company’s results of operations, financial condition, capital requirements, future outlook and other factors deemed relevant by the Company’s Board of Directors.
The information relating to our equity compensation plans required by Item 5. “Market for Registrant’s Common Equity, Related Stockholder Matters and Issuer Purchases of Equity Securities” is incorporated by reference to such information as set forth in Item 12. “Security Ownership of Certain Beneficial Owners and Management and Related Stockholder Matters” contained herein.
PERFORMANCE GRAPH
The graph below compares the cumulative total shareholder return on our common stock to the S&P 500 Index, the S&P Oil & Gas Equipment & Services Index, the PHLX Oil Service Index, and the S&P Oil & Gas Equipment Index. The total shareholder return assumes $100 invested on December 31, 2019 in NOV Inc., the S&P 500 Index, the S&P Oil & Gas Equipment & Services Index, the PHLX Oil Service Index, and the S&P Oil & Gas Equipment Index. It also assumes reinvestment of all dividends. The results shown in the graph below are not necessarily indicative of future performance.
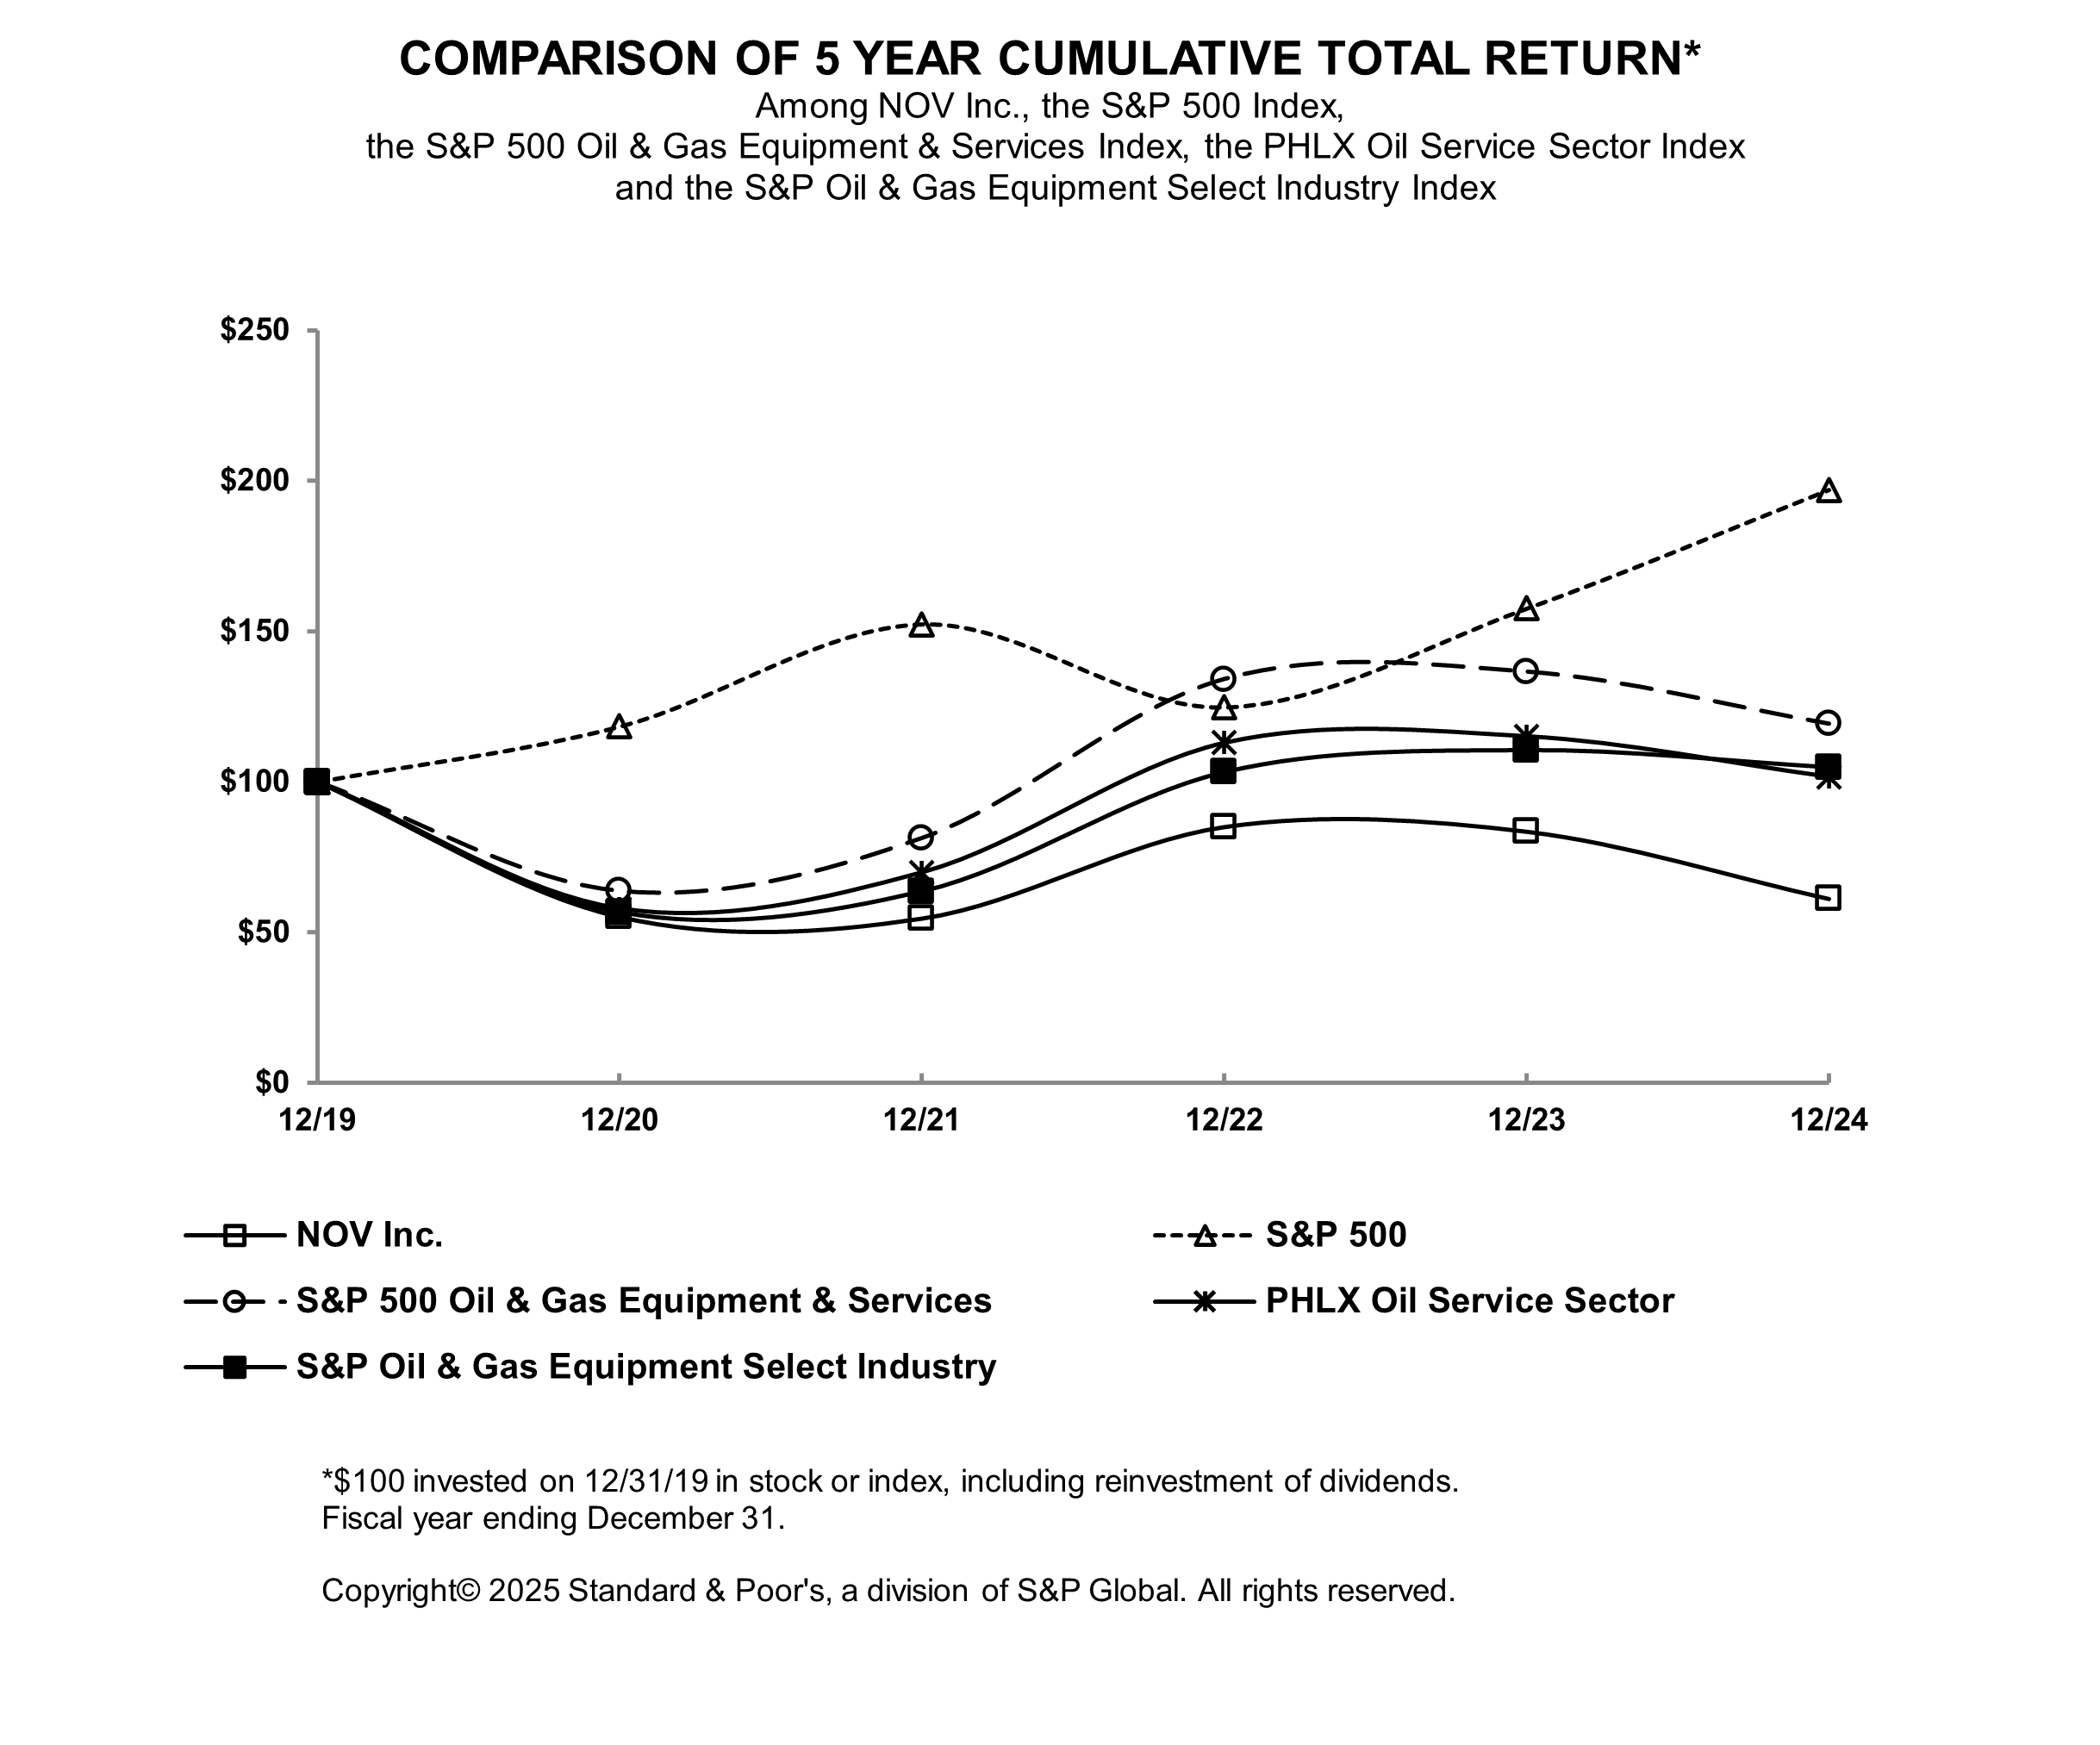
| | | | | | | | | | | | | | | | | | | | | | | | |
| | 12/19 | | | 12/20 | | | 12/21 | | | 12/22 | | | 12/23 | | | 12/24 | |
NOV Inc. | | | 100.00 | | | | 55.13 | | | | 54.63 | | | | 85.06 | | | | 83.49 | | | | 61.12 | |
S&P 500 | | | 100.00 | | | | 118.40 | | | | 152.39 | | | | 124.79 | | | | 157.59 | | | | 197.02 | |
S&P Oil & Gas Equipment & Services Index | | | 100.00 | | | | 63.78 | | | | 81.35 | | | | 134.08 | | | | 136.52 | | | | 119.25 | |
PHLX Oil Service Index | | | 100.00 | | | | 57.92 | | | | 69.94 | | | | 112.94 | | | | 115.10 | | | | 101.68 | |
S&P Oil & Gas Equipment Index | | | 100.00 | | | | 56.61 | | | | 63.54 | | | | 103.26 | | | | 110.57 | | | | 104.88 | |
This information shall not be deemed to be “soliciting material” or to be “filed” with the Commission or subject to Regulation 14A (17 CFR 240.14a-1-240.14a-104), other than as provided in Item 201(e) of Regulation S-K, or to the liabilities of section 18 of the Exchange Act (15 U.S.C. 78r).
Purchases of Equity Securities by the Issuer and Affiliated Purchasers
| | | | | | | | | | | | | | | | |
Period | | Total number
of shares
purchased | | | Average
price paid
per share | | | Total number of
shares purchased
as part of publicly
announced plans
or programs (1) | | | Approximate dollar
value of shares that
may yet be purchased
under the plans or
programs (1) | |
October 1 through October 31, 2024 | | | — | | | $ | — | | | | — | | | | 883,429,559 | |
November 1 through November 30, 2024 | | | 1,274,110 | | | | 16.09 | | | | 1,274,110 | | | | 862,932,283 | |
December 1 through December 31, 2024 | | | 6,260,509 | | | | 14.66 | | | | 6,260,509 | | | | 771,182,767 | |
Total | | | 7,534,619 | | | $ | 14.90 | | | | 7,534,619 | | | | |
(1) On April 25, 2024, the Company established a share repurchase program for up to $1 billion of the currently outstanding shares of the Company’s common stock over a period of 36 months.
ITEM 7. MANAGEMENT’S DISCUSSION AND ANALYSIS OF FINANCIAL CONDITION AND RESULTS OF OPERATIONS
General Overview
The Company is a leading independent provider of equipment and technology to the upstream oil and gas industry. With operations in approximately 551 locations across six continents, NOV designs, manufactures and services a comprehensive line of drilling, well servicing and offshore construction equipment; sells and rents drilling motors, specialized downhole tools, and rig instrumentation; performs inspection and internal coating of oilfield tubular products; provides drill cuttings separation, management and disposal systems and services; and provides expendables and spare parts used in conjunction with the Company’s large installed base of equipment. NOV also manufactures coiled tubing and high-pressure fiberglass and composite tubing and sells and rents advanced in-line inspection equipment to makers of oil country tubular goods. More recently, by applying its deep knowledge in technology, the Company has helped advance the transition toward sustainable energy. The Company has a long tradition of pioneering innovations which improve the cost-effectiveness, efficiency, safety, and environmental impact of oil and gas operations.
NOV’s revenue and operating results are principally directly related to the level of worldwide oil and gas drilling and production activities and the profitability and cash flow of oil and gas companies and drilling contractors, which in turn are affected by current and anticipated prices of oil and gas. Oil and gas prices have been and are likely to continue to be volatile. See Item 1A. “Risk Factors”.
In an effort to drive further operational and financial efficiencies, the Company consolidated NOV’s operational structure into two segments, Energy Equipment and Energy Products and Services, effective January 1, 2024. Prior to January 1, 2024, the Company conducted its operations through three business segments: Wellbore Technologies, Completion & Production Solutions, and Rig Technologies. Segment disclosures pertaining to prior periods have been restated to reflect the change in reportable segments. See Item 1. “Business”, for a discussion of each of these business segments.
Unless indicated otherwise, results of operations are presented in accordance with accounting principles generally accepted in the United States (“GAAP”). Certain reclassifications have been made to the prior year financial statements to conform with the 2024 presentation. The Company discloses Adjusted EBITDA (defined as operating profit excluding depreciation, amortization, gains and losses on sales of fixed assets and, when applicable, Other Items (as defined below under “Executive Summary”)) in its periodic earnings press releases and other public disclosures to provide investors additional information about the results of ongoing operations. See Non-GAAP Financial Measures and Reconciliations in Results of Operations for an explanation of our use of non-GAAP financial measures and reconciliations to their corresponding measures calculated in accordance with GAAP.
Operating Environment Overview
NOV’s results are dependent on, among other things, the level of worldwide oil and gas drilling, well remediation activity, the price of crude oil and natural gas, capital spending by exploration and production companies and drilling contractors, worldwide oil and gas inventory levels and, to a lesser degree, the level of investment in wind, solar and geothermal energy products. Key industry indicators for the past three years include the following:
| | | | | | | | | | | | | | | | | | | | |
| | | | | | | | | | | % increase (decrease) | |
| | | | | | | | | | | 2024 v | | | 2024 v | |
| | 2024* | | | 2023* | | | 2022* | | | 2023 | | | 2022 | |
Active Drilling Rigs: | | | | | | | | | | | | | | | |
U.S. | | | 599 | | | | 689 | | | | 721 | | | | (13.1 | %) | | | (16.9 | %) |
Canada | | 188 | | | 177 | | | 175 | | | | 6.2 | % | | | 7.4 | % |
International | | | 945 | | | | 948 | | | | 851 | | | | (0.3 | %) | | | 11.0 | % |
Worldwide | | | 1,732 | | | | 1,814 | | | | 1,747 | | | | (4.5 | %) | | | (0.9 | %) |
West Texas Intermediate Crude Prices (per
barrel) | | $ | 76.55 | | | $ | 77.64 | | | $ | 94.81 | | | | (1.4 | %) | | | (19.3 | %) |
Natural Gas Prices ($/mmbtu) | | $ | 2.19 | | | $ | 2.54 | | | $ | 6.38 | | | | (13.8 | %) | | | (65.7 | %) |
* Averages for the years indicated. See sources below.
The following table details the U.S., Canadian, and international rig activity and West Texas Intermediate Oil prices for the past nine quarters ended December 31, 2024 on a quarterly basis:
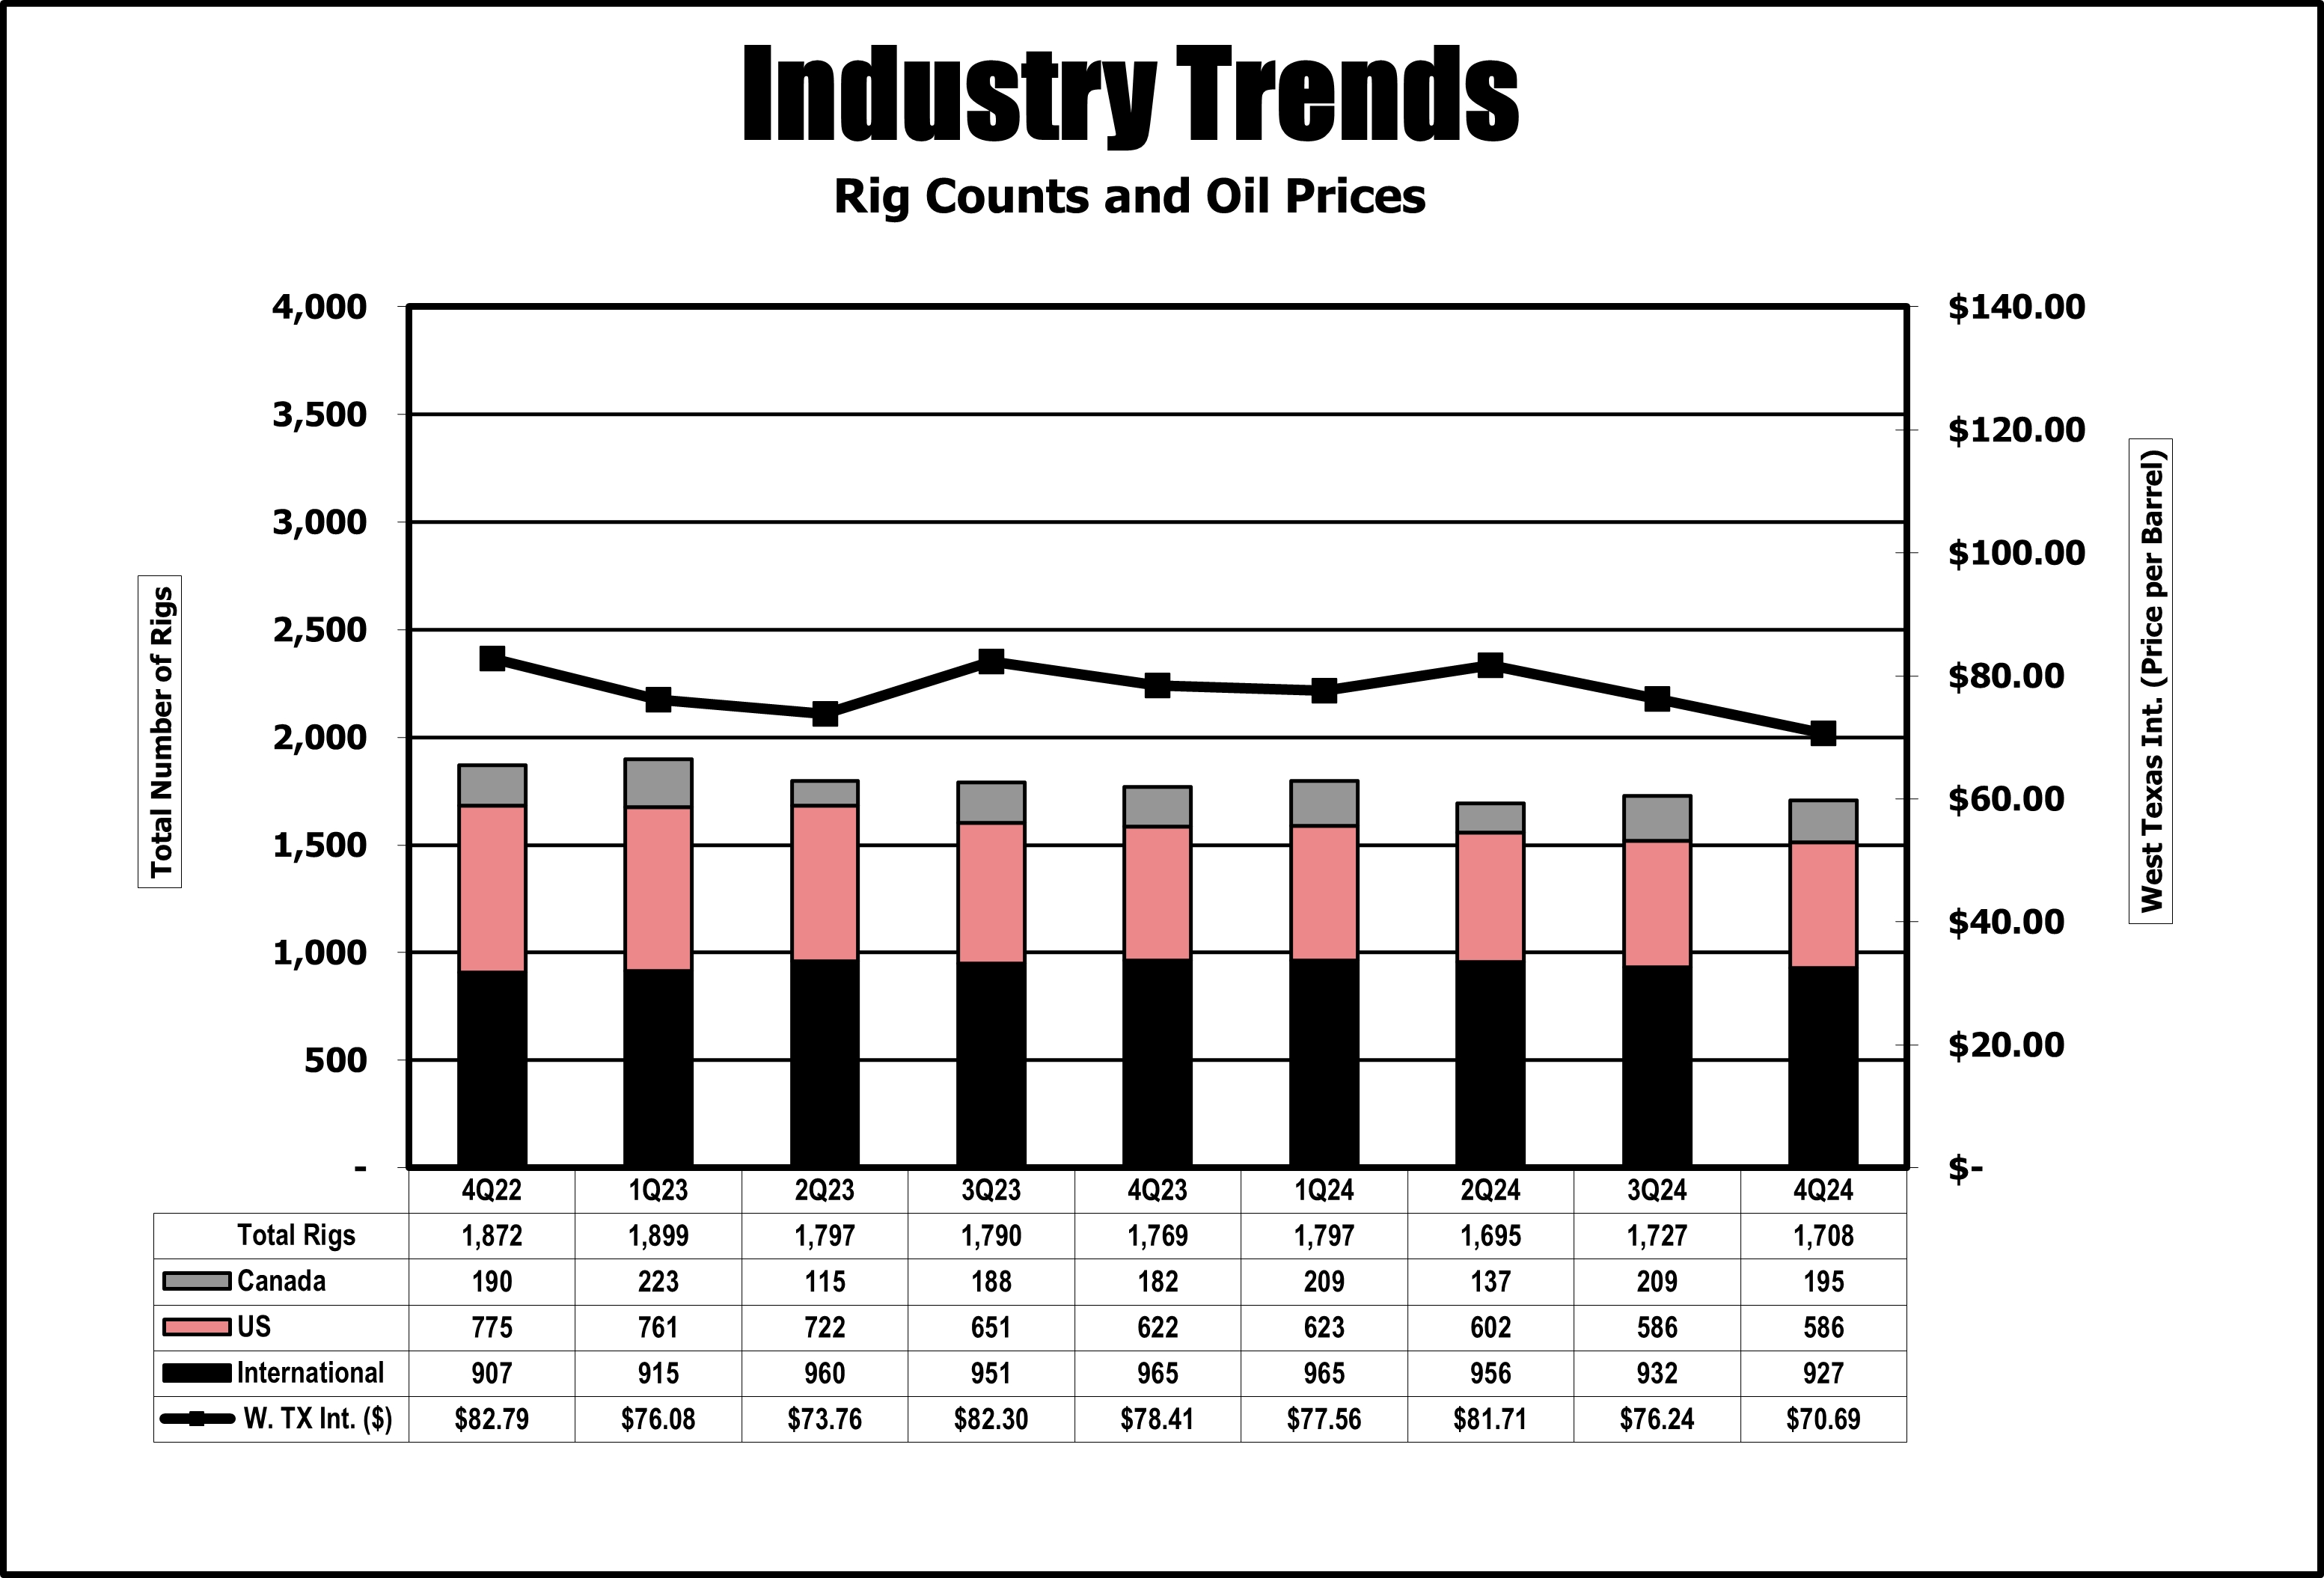
Source: Rig count: Baker Hughes, Inc. (www.bakerhughes.com); West Texas Intermediate Crude Price, Natural Gas Price: US Department of Energy, Energy Information Administration (www.eia.doe.gov).
The average price per barrel of West Texas Intermediate Crude was $76.55 in 2024, a decrease of 1% over the average price for 2023 of $77.64 per barrel. The average natural gas price in 2024 was $2.19 per mmbtu, a decrease of 14% compared to the 2023 average of $2.54 per mmbtu. Average rig activity worldwide decreased 5% for the full-year in 2024 compared to 2023. The average crude oil price for the fourth quarter of 2024 was $70.69 per barrel, and natural gas was $2.44 per mmbtu.
At January 31, 2025, there were 840 rigs actively drilling in North America, comprised of U.S. and Canada, compared to the fourth quarter average of 781 rigs, an increase of 8 percent. The price for West Texas Intermediate Crude Oil was $72.53 per barrel at January 31, 2025, an increase of 3 percent from the fourth quarter of 2024 average. The price for natural gas was $3.04 per mmbtu at January 31, 2025, an increase of 25 percent from the fourth quarter of 2024 average.
The Company is also becoming increasingly engaged with energy transition related opportunities and is currently involved in projects related to wind energy, solar, geothermal power, rare earth metal extraction, biogas production, and carbon sequestration. Additionally, the Company is investing in developing technologies and solutions that will support other energy transition related industry verticals. Management expects to see continued growth in these areas as low carbon power becomes a larger portion of the global energy supply.
EXECUTIVE SUMMARY
NOV generated revenue of $8.87 billion in 2024, due to improving quality of our capital equipment backlog, market share gains from new, higher margin technologies and services, and operational efficiencies that more than offset the effect of lower drilling activity.
For the year ended December 31, 2024, the Company reported net income attributable to the Company of $635 million, a decrease of $358 million from $993 million in 2023, which included the release of valuation allowances on deferred tax assets of $485 million. Operating profit increased 35 percent to $876 million, or 9.9 percent of sales for the full-year 2024. Adjusted EBITDA increased 11 percent to $1.11 billion or 12.5 percent of sales for 2024.
For the fourth quarter ended December 31, 2024, revenue was $2.31 billion, a decrease of 1 percent compared to the fourth quarter of 2023. Net income decreased $438 million, or $1.10 per diluted share, year-over-year from $598 million, which included the release of valuation allowances on deferred tax assets of $485 million. Operating profit increased 29 percent to $207 million, or 9.0 percent of sales. The Company recorded $7 million in pre-tax charges within Other Items, primarily related to severance and facility closure costs. Adjusted EBITDA increased 3 percent year-over-year to $302 million, or 13.1 percent of sales.
Segment Performance
Energy Products and Services
Energy Products and Services generated revenues of $1.06 billion in the fourth quarter of 2024, a decrease of 1 percent from the fourth quarter of 2023. Operating profit increased $18 million from the prior year to $112 million, or 10.6 percent of sales, and included $3 million in Other Items. Adjusted EBITDA decreased $20 million from the prior year to $173 million, or 16.3 percent of sales. The decrease in revenue and Adjusted EBITDA was primarily due to lower levels of global drilling activity, but this was partially offset by growing adoption of the Company’s new technologically advanced product offerings.
Energy Equipment
Energy Equipment generated revenues of $1.29 billion in the fourth quarter of 2024, a decrease of 1 percent from the fourth quarter of 2023. The decline in revenue was due primarily to the divestiture of the Company’s Pole Products business in early 2024 and lower revenue from aftermarket support; however, this was mostly offset by higher revenue from the segment’s growing backlog. Operating profit increased $31 million from the prior year to $152 million, or 11.8 percent of sales, and included $4 million in Other Items. Adjusted EBITDA increased $38 million from the prior year to $185 million, or 14.4 percent of sales. Profitability improved due to strong execution on higher margin projects from the segment’s backlog.
New orders booked during the quarter totaled $757 million, representing a book-to-bill of 121 percent when compared to the $628 million shipped from backlog. As of December 31, 2024, backlog for capital equipment orders for Energy Equipment was $4.43 billion, an increase of $279 million from the fourth quarter of 2023.
Oil & Gas Equipment and Services Market and Outlook
The macro environment and geopolitical uncertainties continue to drive volatility and pressure commodity prices, with oil prices reflecting growing concerns regarding diminishing demand from weakening global economies, excess OPEC capacity, and rising non-OPEC production. These concerns along with ample supplies of natural gas in North America are increasing cautiousness among oil and gas producers, resulting in lower drilling activity in the U.S. land market and are beginning to affect shorter-cycle activity in international markets.
Despite growing concerns that global oil and U.S. natural gas markets may be oversupplied in 2025, management believes commodity prices and activity levels should remain relatively rangebound, with any pullback in activity short-lived, and that the industry remains in an extended recovery due to: (1) current inventory levels in relation to OECD demand that are lower than historical averages; (2) natural oil production decline rates that average almost 15 percent; (3) anticipated increases in LNG exports from the U.S.; (4) increasing focus on energy security; and (5) capital discipline across the industry, which has diminished the global oil and gas industry’s ability to easily ramp production.
Regardless of the operating environment, NOV remains committed to improving organizational efficiencies while focusing on the development and commercialization of innovative products and services, including technologies to reduce the environmental impact of oil and gas operations, and technologies to improve the economics of alternative energy that are responsive to the longer-term needs of NOV’s customers. We believe this strategy will further advance the Company’s competitive position in all market conditions.
Results of Operations
The following table summarizes the Company’s revenue and operating profit by operating segment (in millions):
| | | | | | | | | | | | | | | | | | | | |
| | Year Ended December 31, | | | % Change | |
| | 2024 | | | 2023 | | | 2022 | | | 2024 vs. 2023 | | | 2023 vs. 2022 | |
Revenue: | | | | | | | | | | | | | | | |
Energy Products and Services | | $ | 4,130 | | | $ | 4,077 | | | $ | 3,537 | | | | 1.3 | % | | | 15.3 | % |
Energy Equipment | | | 4,888 | | | | 4,669 | | | | 3,819 | | | | 4.7 | % | | | 22.3 | % |
Eliminations | | | (148 | ) | | | (163 | ) | | | (119 | ) | | | 9.2 | % | | | (37.0 | %) |
Total revenue | | $ | 8,870 | | | $ | 8,583 | | | $ | 7,237 | | | | 3.3 | % | | | 18.6 | % |
Operating profit: | | | | | | | | | | | | | | | |
Energy Products and Services | | $ | 475 | | | $ | 507 | | | $ | 331 | | | | (6.3 | %) | | | 53.2 | % |
Energy Equipment | | | 608 | | | | 371 | | | | 137 | | | | 63.9 | % | | | 170.8 | % |
Eliminations and corporate costs | | | (207 | ) | | | (227 | ) | | | (204 | ) | | | 8.8 | % | | | (11.3 | %) |
Total operating profit | | $ | 876 | | | $ | 651 | | | $ | 264 | | | | 34.6 | % | | | 146.6 | % |
Operating profit %: | | | | | | | | | | | | | | | |
Energy Products and Services | | | 11.5 | % | | | 12.4 | % | | | 9.4 | % | | | | | | |
Energy Equipment | | | 12.4 | % | | | 7.9 | % | | | 3.6 | % | | | | | | |
Total operating profit % | | | 9.9 | % | | | 7.6 | % | | | 3.6 | % | | | | | | |
Years Ended December 31, 2024 and December 31, 2023
Energy Products and Services
Revenue from Energy Products and Services for the year ended December 31, 2024 was $4.13 billion, an increase of $53 million, or 1 percent, compared to the year ended December 31, 2023. North American revenue increased 4 percent despite the decline in drilling activity primarily due to the acquisition of our artificial lift business and market share gains, while international revenue declined 1 percent primarily due to lower sales of drill pipe and conductor pipe connections.
Operating profit from Energy Products and Services was $475 million for the year ended December 31, 2024, a decrease of $32 million compared to the year ended December 31, 2023. Operating profit percentage for 2024 was 11.5 percent compared to an operating profit percentage of 12.4 percent in 2023. The decrease in profitability was due to a less favorable sales mix and a 21 percent decline in sales of drill pipe for the year ended December 31, 2024, when compared to the prior year.
Included in operating profit are Other Items related to severance, facility closure costs, and other charges and credits. Other Items included in operating profit for Energy Products and Services were $7 million for the year ended December 31, 2024 and $53 million for the year ended December 31, 2023.
Energy Equipment
Revenue from Energy Equipment for the year ended December 31, 2024 was $4.89 billion, an increase of $219 million, or 5 percent, compared to the year ended December 31, 2023. The increase in revenue is attributable to higher sales in international offshore markets. Revenue improved from international sales by 8 percent and offshore sales increased by 10 percent for the year ended December 31, 2024, when compared to the prior year. The increase in sales to these markets is a result of strong demand for aftermarket products and services and execution on the segment’s improving capital equipment backlog. Revenues in North America declined 3 percent year-to-date when compared to the prior year, primarily due to the divestiture of the segment’s Pole Products business during the second quarter of 2024.
Operating profit from Energy Equipment was $608 million for the year ended December 31, 2024, an increase of $237 million compared to the year ended December 31, 2023. Operating profit percentage for 2024 was 12.4 percent compared to operating profit percentage of 7.9 percent in 2023. Higher profitability for the year ended December 31, 2024 was the result of higher margin sales primarily driven by improved demand for aftermarket products and services and strong execution on the segment’s improving capital equipment backlog. A $130 million gain from the divestiture of the segment’s Pole Products business in the second quarter of 2024 also contributed to the increase in profitability for the current year.
Included in operating profit are Other Items related to the gain on the divestiture of the segment’s Pole Products business, gains on sales of previously reserved inventory, severance, facility closure costs, and other charges and credits. Other items included in operating profit for Energy Equipment was a net credit of $118 million for the year ended December 31, 2024 and a net credit of $14 million for the year ended December 31, 2023.
The Energy Equipment segment monitors its capital equipment backlog to plan its business. New orders are added to backlog only when the Company receives a firm written order for major completion and production components or a contract related to a construction project. The capital equipment backlog was $4.43 billion at December 31, 2024, an increase of $279 million, or 7 percent, from backlog of $4.15 billion at December 31, 2023. Although numerous factors can affect the timing of revenue out of backlog (including, but not limited to, customer change orders and supplier accelerations or delays), the Company reasonably expects approximately 41 percent of backlog to become revenue during 2025 and the remainder thereafter. At December 31, 2024, approximately 51 percent of the capital equipment backlog was for offshore products and approximately 92 percent of the capital equipment backlog was destined for international markets.
Eliminations and corporate costs
Eliminations and corporate costs were $207 million for the year ended December 31, 2024 compared to $227 million for the year ended December 31, 2023.
Sales from one segment to another generally are priced at estimated equivalent commercial selling prices; however, segments originating an external sale are credited with the full profit to the Company. Eliminations include intercompany transactions conducted between the two reporting segments that are eliminated in consolidation. Intrasegment transactions are eliminated within each segment. Eliminations remained flat when compared to 2023, while corporate costs declined 6 percent due to our cost savings initiatives and workforce reductions taken in 2023.
Interest and financial costs and Interest Income
Interest and financial costs were $91 million for the year ended December 31, 2024 compared to $88 million for the year ended December 31, 2023. The increase in interest and financial costs were primarily due to debt borrowings on the revolving credit facility in the first quarter of 2024.
Interest income was $38 million for the year ended December 31, 2024 compared to $28 million for the year ended December 31, 2023. The increase was primarily related to interest earned on larger cash balances in the current year compared to prior year.
Equity income in unconsolidated affiliates
Equity income in unconsolidated affiliates was $36 million for the year ended December 31, 2024 compared to $119 million for the year ended December 31, 2023. A less favorable product sales mix and lower volume in sales led to lower profitability year-over-year for our largest investment in unconsolidated affiliates.
Other expense, net
Other expense, net was $28 million for the year ended December 31, 2024 compared to $98 million for the year ended December 31, 2023. The decrease in expense was primarily due to larger foreign currency fluctuations in the prior year, particularly with the currency devaluation in Argentina.
Provision for income taxes
The effective tax rate for the year ended December 31, 2024 was 23.6 percent, compared to (60.9) percent for 2023. For the year ended 2024, the effective tax rate was negatively impacted by increased withholding taxes, nondeductible expenses, and losses in certain jurisdiction with no tax benefit, partially offset by a lower rate of U.S. tax on certain earnings generated outside of the United States and the release of valuation allowances in certain jurisdictions with net operating losses as a result of improving forecasted taxable income. During 2023, the Company determined it was more likely than not that the Company would be able to realize the benefit of a substantial portion of the deferred tax assets in the United States and the majority of its other international jurisdictions and released valuation allowances on certain deferred tax assets. The effective tax rate was favorably impacted by the adjustments related to utilization of losses and tax credits for current and prior year tax returns, partially offset by current year losses in certain jurisdictions with no tax benefit.
Results of Operations in 2023 Compared to 2022
Information related to the comparison of our operating results between the years 2023 and 2022 is included in “Item 7. Management’s Discussion and Analysis of Financial Condition and Results of Operations” of our 2023 Form 10-K filed with the SEC and is incorporated by reference into this annual report on Form 10-K.
Non-GAAP Financial Measures and Reconciliations
This Form 10-K contains certain non-GAAP financial measures that management believes are useful tools for internal use and the investment community in evaluating NOV’s overall financial performance. These non-GAAP financial measures are broadly used to value and compare companies in the oilfield services and equipment industry. Not all companies define these measures in the same way. In addition, these non-GAAP financial measures are not a substitute for financial measures prepared in accordance with GAAP and should therefore be considered only as supplemental to such GAAP financial measures.
The Company defines Adjusted EBITDA as operating profit excluding depreciation, amortization, gains and losses on sales of fixed assets and, when applicable, Other Items. Adjusted EBITDA % is a ratio showing Adjusted EBITDA as a percentage of sales. Management believes this is important information to provide because it is used by management to evaluate the Company’s operational performance and trends between periods and manage the business. Management also believes this information may be useful to investors and analysts to gain a better understanding of the Company’s results of ongoing operations. Adjusted EBITDA and Adjusted EBITDA % are not intended to replace GAAP financial measures, such as Net Income and Operating Profit %.
Additionally, Excess Free Cash Flow is defined as cash flows from operations less capital expenditures and other investments, including acquisitions and divestitures. Excess Free Cash Flow does not represent the Company’s residual cash flow available for discretionary expenditures, as the calculation of these measures does not account for certain debt service requirements or other non-discretionary expenditures.
Other items consist of charges and credits related to (in millions):
| | | | | | | | | | | | | | | | | | | | |
| | Three Months Ended | | | Year Ended | |
| | December 31, | | | September 30, | | | December 31, | |
| | 2024 | | | 2023 | | | 2024 | | | 2024 | | | 2023 | |
Other items by category: | | | | | | | | | | | | | | | |
Russia impairment and other charges | | $ | — | | | $ | 1 | | | $ | 1 | | | $ | (1 | ) | | $ | 4 | |
Inventory | | | 2 | | | | (3 | ) | | | — | | | | (3 | ) | | | (20 | ) |
Voluntary early retirement program | | | — | | | | 42 | | | | — | | | | — | | | | 52 | |
Royalty discount | | | — | | | | 25 | | | | — | | | | — | | | | 25 | |
Earnout | | | — | | | | (25 | ) | | | — | | | | — | | | | (25 | ) |
Business divestiture | | | 1 | | | | — | | | | — | | | | (130 | ) | | | — | |
Severance, facility closures and other | | | 4 | | | | 15 | | | | 4 | | | | 25 | | | | 15 | |
Total other items | | $ | 7 | | | $ | 55 | | | $ | 5 | | | $ | (109 | ) | | $ | 51 | |
The following tables set forth the reconciliation of Adjusted EBITDA to its most comparable GAAP financial measures (in millions):
| | | | | | | | | | | | | | | | | | | | |
| | Three Months Ended | | | Year Ended | |
| | December 31, | | | September 30, | | | December 31, | |
| | 2024 | | | 2023 | | | 2024 | | | 2024 | | | 2023 | |
Operating profit: | | | | | | | | | | | | | | | |
Energy Products and Services | | $ | 112 | | | $ | 94 | | | $ | 114 | | | $ | 475 | | | $ | 507 | |
Energy Equipment | | | 152 | | | | 121 | | | | 129 | | | | 608 | | | | 371 | |
Eliminations and corporate costs | | | (57 | ) | | | (54 | ) | | | (49 | ) | | | (207 | ) | | | (227 | ) |
Total operating profit | | $ | 207 | | | $ | 161 | | | $ | 194 | | | $ | 876 | | | $ | 651 | |
| | | | | | | | | | | | | | | |
Operating profit %: | | | | | | | | | | | | | | | |
Energy Products and Services | | | 10.6 | % | | | 8.8 | % | | | 11.4 | % | | | 11.5 | % | | | 12.4 | % |
Energy Equipment | | | 11.8 | % | | | 9.3 | % | | | 10.6 | % | | | 12.4 | % | | | 7.9 | % |
Eliminations and corporate costs | | | — | | | | — | | | | — | | | | — | | | | — | |
Total operating profit % | | | 9.0 | % | | | 6.9 | % | | | 8.9 | % | | | 9.9 | % | | | 7.6 | % |
| | | | | | | | | | | | | | | |
Other Items, net: | | | | | | | | | | | | | | | |
Energy Products and Services | | $ | 3 | | | $ | 50 | | | $ | 3 | | | $ | 7 | | | $ | 53 | |
Energy Equipment | | | 4 | | | | (1 | ) | | | 1 | | | | (118 | ) | | | (14 | ) |
Corporate | | | — | | | | 6 | | | | 1 | | | | 2 | | | | 12 | |
Total other items | | $ | 7 | | | $ | 55 | | | $ | 5 | | | $ | (109 | ) | | $ | 51 | |
| | | | | | | | | | | | | | | |
(Gain)/loss on sales of fixed assets | | | | | | | | | | | | | | | |
Energy Products and Services | | $ | — | | | $ | 1 | | | $ | 1 | | | $ | — | | | $ | (1 | ) |
Energy Equipment | | | — | | | | (1 | ) | | | — | | | | — | | | | (4 | ) |
Corporate | | | — | | | | 1 | | | | — | | | | — | | | | 2 | |
Total (gain)/loss on sales of fixed assets | | $ | — | | | $ | 1 | | | $ | 1 | | | $ | — | | | $ | (3 | ) |
| | | | | | | | | | | | | | | |
Depreciation & amortization: | | | | | | | | | | | | | | | |
Energy Products and Services | | $ | 58 | | | $ | 48 | | | $ | 54 | | | $ | 221 | | | $ | 183 | |
Energy Equipment | | | 29 | | | | 28 | | | | 29 | | | | 115 | | | | 111 | |
Corporate | | | 1 | | | | 1 | | | | 3 | | | | 7 | | | | 8 | |
Total depreciation & amortization | | $ | 88 | | | $ | 77 | | | $ | 86 | | | $ | 343 | | | $ | 302 | |
| | | | | | | | | | | | | | | |
Adjusted EBITDA: | | | | | | | | | | | | | | | |
Energy Products and Services | | $ | 173 | | | $ | 193 | | | $ | 172 | | | $ | 703 | | | $ | 742 | |
Energy Equipment | | | 185 | | | | 147 | | | | 159 | | | | 605 | | | | 464 | |
Eliminations and corporate costs | | | (56 | ) | | | (46 | ) | | | (45 | ) | | | (198 | ) | | | (205 | ) |
Total Adjusted EBITDA | | $ | 302 | | | $ | 294 | | | $ | 286 | | | $ | 1,110 | | | $ | 1,001 | |
| | | | | | | | | | | | | | | |
Adjusted EBITDA %: | | | | | | | | | | | | | | | |
Energy Products and Services | | | 16.3 | % | | | 18.0 | % | | | 17.1 | % | | | 17.0 | % | | | 18.2 | % |
Energy Equipment | | | 14.4 | % | | | 11.3 | % | | | 13.0 | % | | | 12.4 | % | | | 9.9 | % |
Eliminations and corporate costs | | | — | | | | — | | | | — | | | | — | | | | — | |
Total Adjusted EBITDA % | | | 13.1 | % | | | 12.5 | % | | | 13.1 | % | | | 12.5 | % | | | 11.7 | % |
| | | | | | | | | | | | | | | |
Reconciliation of Adjusted EBITDA: | | | | | | | | | | | | | | | |
GAAP net income attributable to Company | | $ | 160 | | | $ | 598 | | | $ | 130 | | | $ | 635 | | | $ | 993 | |
Noncontrolling interests | | | 1 | | | | (3 | ) | | | — | | | | — | | | | (8 | ) |
Provision (benefit) for income taxes | | | 38 | | | | (460 | ) | | | 44 | | | | 196 | | | | (373 | ) |
Interest expense | | | 24 | | | | 23 | | | | 21 | | | | 91 | | | | 88 | |
Interest income | | | (11 | ) | | | (7 | ) | | | (11 | ) | | | (38 | ) | | | (28 | ) |
Equity (income) loss in unconsolidated affiliates | | | 1 | | | | (18 | ) | | | — | | | | (36 | ) | | | (119 | ) |
Other (income) expense, net | | | (6 | ) | | | 28 | | | | 10 | | | | 28 | | | | 98 | |
(Gain)/loss on sales of fixed assets | | | — | | | | 1 | | | | 1 | | | | — | | | | (3 | ) |
Depreciation and amortization | | | 88 | | | | 77 | | | | 86 | | | | 343 | | | | 302 | |
Other Items, net: | | | 7 | | | | 55 | | | | 5 | | | | (109 | ) | | | 51 | |
Total Adjusted EBITDA | | $ | 302 | | | $ | 294 | | | $ | 286 | | | $ | 1,110 | | | $ | 1,001 | |
Liquidity and Capital Resources
Overview
At December 31, 2024, the Company had cash and cash equivalents of $1,230 million, and total debt of $1,740 million. At December 31, 2023, cash and cash equivalents were $816 million and total debt was $1,725 million. As of December 31, 2024, approximately $633 million of the $1,230 million of cash and cash equivalents was held by our foreign subsidiaries and the earnings associated with this cash, if repatriated to the U.S., could be subject to foreign withholding taxes and incremental U.S. taxation. If opportunities to invest in the U.S. are greater than available cash balances that are not subject to income tax, rather than repatriating cash, the Company may choose to borrow against its revolving credit facility.
On September 12, 2024, the Company entered into a new $1.5 billion five-year unsecured revolving credit facility. This new credit facility replaced the Company’s previous $2.0 billion revolving credit facility. The Company has the right to increase the aggregate commitments under this new agreement to an aggregate amount of up to $2.5 billion upon the consent of only those lenders holding any such increase. Interest under the multicurrency facility is based upon Secured Overnight Financing Rate (SOFR), Euro Interbank Offered Rate (EURIBOR), Sterling Overnight Index Average (SONIA), Canadian Overnight Repo Rate Average (CORRA), or Norwegian Interbank Offered Rate (NIBOR), plus 1.25% subject to a ratings-based grid or the U.S. prime rate. The new credit facility contains a financial covenant establishing a maximum debt-to-capitalization ratio of 60%. As of December 31, 2024, the Company was in compliance with a debt-to-capitalization ratio of 23.8% and had no outstanding letters of credit issued under the facility, resulting in $1.5 billion of available funds.
A consolidated joint venture of the Company borrowed $120 million against a $150 million bank line of credit for the construction of a facility in Saudi Arabia. Interest under the bank line of credit is based upon SOFR plus 1.40%. The bank line of credit contains a financial covenant regarding maximum debt-to-equity ratio of 75%. As of December 31, 2024, the joint venture was in compliance. The facility construction was completed in the fourth quarter of 2022, and the joint venture will not have future borrowings on the line of credit. The line of credit repayment schedule began in December 2022 with final payment no later than June 2032. As of December 31, 2024, the Company has a carrying value of $94 million in borrowings related to this line of credit. The Company has $11 million in payments related to this line of credit due in the next twelve months.
The Company’s outstanding debt at December 31, 2024 consisted primarily of $1,091 million in 3.95% Senior Notes, $496 million in 3.60% Senior Notes, and other debt of $153 million. The Company was in compliance with all covenants at December 31, 2024. Long-term lease liabilities totaled $544 million at December 31, 2024.
The Company had $500 million of outstanding letters of credit at December 31, 2024, primarily in the U.S. and Norway, that are under various bilateral letter of credit facilities. Letters of credit are issued as bid bonds, advanced payment bonds and performance bonds.
The following table summarizes our net cash provided by (used in) continuing operating activities, continuing investing activities and continuing financing activities for the periods presented (in millions):
| | | | | | | | | | | | |
| | Year Ended December 31, | |
| | 2024 | | | 2023 | | | 2022 | |
Net cash provided by (used in) operating activities | | $ | 1,304 | | | $ | 143 | | | $ | (179 | ) |
Net cash used in investing activities | | | (471 | ) | | | (293 | ) | | | (238 | ) |
Net cash used in financing activities | | | (406 | ) | | | (103 | ) | | | (96 | ) |
Significant uses and sources of cash during 2024:
•Cash flows provided by operating activities were $1.30 billion, primarily driven by higher levels of profitability and changes in the primary components of our working capital (inventories, contract assets, receivables, and accounts payable).
•Capital expenditures were $351 million.
•Business acquisitions, net of cash acquired, were $298 million.
•Business divestitures, net of cash disposed, were $176 million.
•Payments of $108 million in dividends to our shareholders.
•Share repurchases were $229 million.
Other
The effect of the change in exchange rates on cash was a decrease of $13 million for the year ended December 31, 2024, no change for the year ended December 31, 2023, and a decrease of $9 million for the years ended December 31, 2022.
We believe that cash on hand, cash generated from operations and amounts available under our credit facilities and from other sources of debt will be sufficient to fund operations, working capital needs, capital expenditure requirements, dividends and financing obligations for the foreseeable future.
During the three months ended December 31, 2024, the Company repurchased 7.5 million shares of common stock under its share repurchase program for an aggregate amount of $112 million. During the year ended December 31, 2024, the Company repurchased 14.2 million shares of common stock under its share repurchase program for an aggregate amount of $229 million. The Company expects to return at least 50% of Excess Free Cash Flow (defined as cash flows from operations less capital expenditures and other investments, including acquisitions and divestitures), through a combination of steady, quarterly base dividends, opportunistic stock buybacks, and an annual supplemental dividend to true-up returns to shareholders on an annual basis.
We may pursue additional acquisition candidates, but the timing, size or success of any acquisition effort and the related potential capital commitments cannot be predicted. We continue to expect to fund future cash acquisitions primarily with cash flows from operations and borrowings, including the unborrowed portion of the revolving credit facility or new debt issuances, but may also issue additional equity either directly or in connection with acquisitions. There can be no assurance that additional financing for acquisitions will be available at terms acceptable to us.
As of December 31, 2024, the Company had $68 million of unrecognized tax benefits. This represents the tax benefits associated with various tax positions taken, or expected to be taken, on domestic and international tax returns that have not been recognized in our financial statements due to uncertainty regarding their resolution. Due to the uncertainty of the timing of future cash flows associated with these unrecognized tax benefits, we are unable to make reasonably reliable estimates of the period of cash settlement, if any, with the respective taxing authorities. For further information related to unrecognized tax benefits, see Note 15 to the Consolidated Financial Statements.
Critical Accounting Policies and Estimates
In preparing the financial statements, we make assumptions, estimates and judgments that affect the amounts reported. We periodically evaluate our estimates and judgments that are most critical in nature which are related to revenue recognition under long-term construction contracts and impairment of goodwill and other indefinite-lived intangible assets. Our estimates are based on historical experience and on our future expectations that we believe are reasonable. The combination of these factors forms the basis for making judgments about the carrying values of assets and liabilities that are not readily apparent from other sources. Actual results are likely to differ from our current estimates and those differences may be material.
Revenue Recognition under Long-Term Construction Contracts
Revenue is recognized over-time for certain long-term construction contracts in the Energy Equipment segment. These contracts include custom designs for customer-specific applications that are unique and require significant engineering efforts. Revenue is recognized as work progresses on each contract. Right to payment is enforceable for performance completed to date, including a reasonable profit.
We generally use the cost-to-cost (input) measure of progress for our contracts because it best depicts the transfer of assets to the customer which occurs as we incur costs. Estimating total revenue and cost at completion of long-term construction contracts is complex, subject to many variables and requires significant judgment. Under the cost-to-cost measure of progress, progress towards completion of each contract is measured based on the ratio of costs incurred to date to the total estimated costs at completion of the performance obligation. Revenues, including estimated fees or profits, are recorded proportionally as costs are incurred. These costs include labor, materials, subcontractors’ costs, and other direct costs. Any expected losses on a project are recorded in full in the period in which the loss becomes probable.
These long-term construction contracts generally include integrating a complex set of tasks and components into a single project or capability, so are accounted for as one performance obligation.
It is common for our long-term contracts to contain late delivery fees, work performance guarantees, and other provisions that can either increase or decrease the transaction price. We estimate variable consideration as the most likely amount we expect to receive. We include variable consideration in the estimated transaction price to the extent it is probable that a significant reversal of cumulative revenue recognized will not occur, or when the uncertainty associated with the variable consideration is resolved. Our estimates of variable consideration and determination of whether to include estimated amounts in the transaction price are based on an assessment of our anticipated performance and historical, current and forecasted information that is reasonably available to us. Net revenue recognized from performance obligations satisfied in previous periods was $19 million for the year ended December 31, 2024 primarily due to change orders.
Goodwill
Goodwill represents the excess of acquisition price paid over the fair value of the tangible and identifiable intangible assets acquired and liabilities assumed. The Company has approximately $1.6 billion of goodwill as of December 31, 2024. Generally accepted accounting principles require the Company to test goodwill for impairment at least annually or more frequently whenever events or circumstances indicate that goodwill might be impaired. Events or circumstances which could indicate a potential impairment include (but are not limited to): a significant sustained reduction in worldwide oil and gas prices or drilling; a significant sustained reduction in profitability or cash flow of oil and gas companies or drilling contractors; a significant sustained reduction in the market capitalization of the Company; a significant sustained reduction in capital investment by drilling companies and oil and gas companies; and a significant sustained increase in worldwide inventories of oil or gas.
The Company has the option to first perform a qualitative assessment to determine whether it is more likely than not that the fair value of a reporting unit is greater than its carrying amount. If the qualitative assessment indicates that it is more likely than not that the fair value of a reporting is greater than its carrying amount, no further testing is required. However, if the Company concludes otherwise, then it is required to perform a quantitative assessment.
If and when the Company performs a quantitative assessment, it is based on the Company’s discounted cash flow analysis. The discounted cash flow is based on management’s forecast of operating performance for each reporting unit. The two main assumptions used in measuring goodwill impairment, which bear the risk of change and could impact the Company’s goodwill impairment analysis, include the cash flows from operations from each of the Company’s individual reporting units and the weighted average cost of capital. The starting point for each of the reporting unit’s cash flows from operations is the detailed annual plan or updated forecast. Cash flows beyond the specific operating plans were estimated using a terminal value calculation, which incorporated historical and forecasted financial cyclical trends for each reporting unit and considered long-term earnings growth rates. The financial and credit market volatility directly impacts our fair value measurement through our weighted average cost of capital that we use to determine our discount rate. During times of volatility, significant judgment must be applied to determine whether credit changes are a short-term or long-term trend.
The Company elected to first perform the qualitative assessment described above for the purposes of its annual goodwill impairment test in 2024. Based on the results of the assessment, the Company concluded it was more likely than not that the fair value of each of its reporting units was greater than its carrying amount and no further testing was performed.
Inventory Reserves
Inventory is carried at the lower of cost or estimated net realizable value. The Company reviews historical usage of inventory on-hand, assumptions about future demand and market conditions, current cost and estimates about potential alternative uses, which are limited, to estimate net realizable value. The Company’s inventory consists of finished goods, spare parts, work in process, and raw materials to support ongoing manufacturing operations and the Company’s large installed base of highly specialized oilfield equipment. The Company’s estimated carrying value of inventory depends upon demand largely driven by levels of oil and gas well drilling and remediation activity, which depends in turn upon oil and gas prices, the general outlook for economic growth worldwide, available financing for the Company’s customers, political stability and governmental regulation in major oil and gas producing areas, and the potential obsolescence of various types of equipment we sell, among other factors.
During 2024, 2023, and 2022 we recorded inventory provision charges (credits) to inventory reserves of $31 million, $28 million, and $(18) million, respectively. At December 31, 2024 and 2023, inventory reserves totaled $286 and $354 million, or 12.9% and 14.1% of gross inventory, respectively.
The Company has continued to invest in developing and advancing products and technologies, contributing to the obsolescence of certain older products in a dramatically-shifted and more highly competitive recovering market, but also ensuring that the portfolio of products and services offered by the Company will meet customer needs in 2024 and beyond.
We will continue to assess our inventory levels and inventory offerings for our customers, which could require the Company to record additional allowances to reduce the value of its inventory. Such changes in our estimates or assumptions could be material under weaker market conditions or outlook.
Income Taxes
The Company is U.S. registered and is subject to income taxes in the U.S. The Company operates through various subsidiaries in a number of countries throughout the world. Income taxes have been recorded based upon the tax laws and rates of the countries in which the Company operates and income is earned.
The Company’s annual tax provision is based on taxable income, statutory rates and tax planning opportunities available in the various jurisdictions in which it operates. The determination and evaluation of the annual tax provision and tax positions involves the interpretation of the tax laws in the various jurisdictions in which the Company operates. It requires significant judgment and the use of estimates and assumptions regarding significant future events such as the amount, timing and character of income, deductions and tax credits. Changes in tax laws, regulations, treaties, foreign currency exchange restrictions or the Company’s level of operations or profitability in each jurisdiction could impact the tax liability in any given year. The Company also operates in many jurisdictions where the tax laws relating to the pricing of transactions between related parties are open to interpretation, which could potentially result in aggressive tax authorities asserting additional tax liabilities with no offsetting tax recovery in other countries. In 2022, the Company received and paid a $51 million transfer pricing tax assessment in Denmark. The Company and its advisors believe the assessment is without merit. The Company is presently appealing and believes it will be reimbursed following a successful appeals process. The payment has been recorded as a long-term receivable.
The Company maintains liabilities for estimated tax exposures in jurisdictions of operation. The annual tax provision includes the impact of income tax provisions and benefits for changes to liabilities that the Company considers appropriate, as well as related interest. Tax exposure items primarily include potential challenges to intercompany pricing and certain operating expenses that may not be deductible in foreign jurisdictions. These exposures are resolved primarily through the settlement of audits within these tax jurisdictions or by judicial means. The Company is subject to audits by federal, state and foreign jurisdictions which may result in proposed assessments. The Company believes that an appropriate liability has been established for estimated exposures under the guidance in ASC Topic 740 “Income Taxes” (“ASC Topic 740”). However, actual results may differ materially from these estimates. The Company reviews these liabilities quarterly and to the extent audits or other events result in an adjustment to the liability accrued for a prior year, the effect will be recognized in the period of the event. The IRS has proposed an adjustment to certain restructuring steps which occurred in 2017. The Company and its advisors believe these restructuring steps were properly completed in accordance with U.S. tax laws and regulations and has appealed the proposed adjustment. However, if the Company is unsuccessful in the appeals process, the IRS proposed adjustment would be substantially offset by the utilization of foreign tax credit carryforwards which subsequently expired unused or are fully reserved by a valuation allowance and $48 million additional income tax expense would be owed. The Canada Revenue Agency has proposed an adjustment for dividends received in Canada between 2016 and 2018. The Company and its advisors believe its filing position is consistent with Canadian tax law and tax court cases and has appealed the proposed adjustment. If the Company is unsuccessful in the process, $31 million additional income tax expense would be owed.
During 2023, the Company determined it was more likely than not that the Company would be able to realize the benefit of a substantial portion of the deferred tax assets in the United States and the majority of its other international jurisdictions and released valuation allowances on certain deferred tax assets. Management applied significant judgment in assessing the positive and negative evidence available in the determination of the amount of deferred tax assets that were more likely than not to be realized in the future. Although the Company considered future taxable income in its assessment, the Company concluded that, as of December 31, 2023, a valuation allowance was still required for certain United States foreign tax credit carryforwards and deferred tax assets in certain other jurisdictions.
As of December 31, 2024, the Company has recorded valuation allowances of $266 million that the Company intends to maintain until it is more likely than not the deferred tax assets will be realized. Income tax expense recorded in the future will be reduced to the extent of any additional decreases in the Company’s valuation allowances. The realization of remaining deferred tax assets is primarily dependent on future taxable income. Any reduction in future taxable income, including but not limited to any future restructuring activities, may require that the Company record an additional valuation allowance against deferred tax assets. An increase in the valuation allowance would result in additional income tax expense in such period and could have a significant impact on future earnings.
Recently Issued and Recently Adopted Accounting Standards
See Note 2 to the Consolidated Financial Statements for further discussion on recently issued and recently adopted accounting standards.
Forward–Looking Statements
The Private Securities Litigation Reform Act of 1995 provides safe harbor provisions for forward-looking information. Some of the information in this document contains, or has incorporated by reference, forward-looking statements. Statements that are not historical facts, including statements about our beliefs and expectations, are forward-looking statements. Forward-looking statements typically are identified by use of terms such as “may,” “believe,” “plan,” “will,” “expect,” “anticipate,” “estimate,” “should,” “forecast,” and similar words, although some forward-looking statements are expressed differently. We may also provide oral or written forward-looking information in other materials we release to the public. Forward-looking information involves risk and uncertainties and reflects our best judgment based on current information. You should be aware that our actual results could differ materially from results anticipated in the forward-looking statements due to a number of factors, including but not limited to changes in oil and gas prices, customer demand for our products and worldwide economic activity, including matters related to recent Russian sanctions. Given these uncertainties, current or prospective investors are cautioned not to place undue reliance on any such forward-looking statements. We undertake no obligation to update any such factors or forward-looking statements to reflect future events or developments. You should also consider carefully the statements under “Risk Factors” which address additional factors that could cause our actual results to differ from those set forth in the forward-looking statements, and additional disclosures we make in our press releases and Forms 10-Q, and 8-K. We also suggest that you listen to our quarterly earnings release conference calls with financial analysts.
ITEM 7A. QUANTITATIVE AND QUALITATIVE DISCLOSURES ABOUT MARKET RISK
We are exposed to changes in foreign currency exchange rates and interest rates. Additional information concerning each of these matters follows:
Foreign Currency Exchange Rates
We have extensive operations in foreign countries. The net assets and liabilities of these operations are exposed to changes in foreign currency exchange rates, although such fluctuations have a muted effect on net income since the functional currency for the majority of them is the local currency. These operations also have net assets and liabilities not denominated in the functional currency, which exposes us to changes in foreign currency exchange rates that impact income. During the years ended December 31, 2024, 2023 and 2022, the Company reported foreign currency losses of $19 million, $84 million and $25 million, respectively. Gains and losses are primarily due to exchange rate fluctuations related to monetary asset balances denominated in currencies other than the functional currency and adjustments to our hedged positions as a result of changes in foreign currency exchange rates. Currency exchange rate fluctuations may create losses in future periods to the extent we maintain net monetary assets and liabilities not denominated in the functional currency of the NOV operation.
Some of our revenues in foreign countries are denominated in U.S. dollars, and therefore, changes in foreign currency exchange rates impact our earnings to the extent that costs associated with those U.S. dollar revenues are denominated in the local currency. Similarly, some of our revenues are denominated in foreign currencies, but have associated U.S. dollar costs, which also give rise to foreign currency exchange rate exposure. In order to mitigate that risk, we may utilize foreign currency forward contracts to better match the currency of our revenues and associated costs. We do not use foreign currency forward contracts for trading or speculative purposes.
The Company had other financial market risk sensitive instruments (cash balances, overdraft facilities, accounts receivable and accounts payable) denominated in foreign currencies with transactional exposures totaling $594 million and translation exposures totaling $354 million as of December 31, 2024. The Company estimates that a hypothetical 10% movement of all applicable foreign currency exchange rates on the transactional exposures could affect net income by $47 million and the translational exposures could affect Other Comprehensive Income by $35 million.
The counterparties to forward contracts are major financial institutions. The credit ratings and concentration of risk of these financial institutions are monitored on a continuing basis. Because these contracts are net-settled the Company’s credit risk with the counterparties is limited to the foreign currency rate differential at the end of the contract.
Interest Rate Risk
At December 31, 2024, borrowings consisted of $1,091 million in 3.95% Senior Notes, $496 million in 3.60% Senior Notes, and other debt of $153 million. There were no outstanding letters of credit issued under the credit facility resulting in $1.5 billion of available funds. Additionally, the Company’s joint venture has outstanding borrowings of $94 million under a $150 million bank line of credit for the construction of a facility in Saudi Arabia. Interest under the bank line of credit is based upon SOFR plus 1.40%. Occasionally a portion of borrowings under our credit facility could be denominated in multiple currencies which could expose us to market risk with exchange rate movements. These instruments carry interest at a pre-agreed upon percentage point spread from either SOFR, EURIBOR, SONIA, CORRA, or NIBOR, or at the U.S. prime rate. Under our credit facility, we may, at our option, fix the interest rate for certain borrowings based on a spread over SOFR, EURIBOR, SONIA, CORRA or NIBOR for 30 days to six months. Our objective is to maintain a portion of our debt in variable rate borrowings for the flexibility obtained regarding early repayment without penalties and lower overall cost as compared with fixed-rate borrowings.
ITEM 8. FINANCIAL STATEMENTS AND SUPPLEMENTARY DATA
Attached hereto and a part of this report are financial statements and supplementary data listed in Item 15. “Exhibits and Financial Statement Schedules.”
ITEM 9. CHANGES IN AND DISAGREEMENTS WITH ACCOUNTANTS ON ACCOUNTING AND FINANCIAL DISCLOSURE.
None.
ITEM 9A. CONTROLS AND PROCEDURES
(i) Evaluation of disclosure controls and procedures
As required by SEC Rule 13a-15(b), we have evaluated, under the supervision and with the participation of our management, including our principal executive officer and principal financial officer, the effectiveness of the design and operation of our disclosure controls and procedures (as defined in Rules 13a-15(e) and 15d-15(e) under the Exchange Act) as of the end of the period covered by this report. Our disclosure controls and procedures are designed to provide reasonable assurance that the information required to be disclosed by the Company in reports that it files under the Exchange Act is accumulated and communicated to the Company’s management, including our principal executive officer and principal financial officer, as appropriate, to allow timely decisions regarding required disclosure and is recorded, processed, summarized and reported within the time periods specified in the rules and forms of the SEC. Our principal executive officer and principal financial officer have concluded that our current disclosure controls and procedures were effective as of December 31, 2024 at the reasonable assurance level.
Pursuant to section 302 of the Sarbanes-Oxley Act of 2002, our Chief Executive Officer and Chief Financial Officer have provided certain certifications to the Securities and Exchange Commission. These certifications are included herein as Exhibits 31.1 and 31.2.
(ii) Internal Control Over Financial Reporting
(a) Management’s annual report on internal control over financial reporting.
The Company’s management report on internal control over financial reporting is set forth in this annual report on Page 48 and is incorporated herein by reference.
(b) Changes in internal control
There were no changes in the Company’s internal control over financial reporting that occurred during the Company’s last fiscal quarter covered by this report that have materially affected, or are reasonably likely to materially affect, the Company’s internal control over financial reporting.
ITEM 9B. OTHER INFORMATION
None.
ITEM 9C. DISCLOSURE REGARDING FOREIGN JURISDICTIONS THAT PREVENT INSPECTIONS.
None.
PART III
ITEM 10. DIRECTORS, EXECUTIVE OFFICERS AND CORPORATE GOVERNANCE
Incorporated by reference to the definitive Proxy Statement for the 2025 Annual Meeting of Stockholders.
ITEM 11. EXECUTIVE COMPENSATION
Incorporated by reference to the definitive Proxy Statement for the 2025 Annual Meeting of Stockholders.
ITEM 12. SECURITY OWNERSHIP OF CERTAIN BENEFICIAL OWNERS AND MANAGEMENT AND RELATED STOCKHOLDER MATTERS
Incorporated by reference to the definitive Proxy Statement for the 2025 Annual Meeting of Stockholders.
Securities Authorized for Issuance Under Equity Compensation Plans.
The following table sets forth information as of our fiscal year ended December 31, 2024, with respect to compensation plans under which our common stock may be issued:
| | | | | | | | | | | | |
| | Number of securities | | | Weighted-average | | | Number of securities | |
| | to be issued upon | | | exercise price of | | | remaining available for equity | |
| | exercise of warrants | | | outstanding | | | compensation plans (excluding | |
| | and rights | | | rights | | | securities reflected in column (a)) (‘c’) | |
Plan Category | | (a) | | | (b) | | | (1) | |
Equity compensation plans approved
by security holders | | | 18,135,497 | | | $ | 34.23 | | | | 7,844,231 | |
Equity compensation plans not approved
by security holders | | | — | | | | — | | | | — | |
Total | | | 18,135,497 | | | $ | 34.23 | | | | 7,844,231 | |
(1)Shares could be issued through equity instruments other than stock options, warrants or rights.
ITEM 13. CERTAIN RELATIONSHIPS AND RELATED TRANSACTIONS, AND DIRECTOR INDEPENDENCE
Incorporated by reference to the definitive Proxy Statement for the 2025 Annual Meeting of Stockholders.
ITEM 14. PRINCIPAL ACCOUNTING FEES AND SERVICES
Incorporated by reference to the definitive Proxy Statement for the 2025 Annual Meeting of Stockholders.
PART IV
ITEM 15. EXHIBITS AND FINANCIAL STATEMENT SCHEDULES
Financial Statements and Exhibits
The following financial statements are presented in response to Part II, Item 8:
(2)Financial Statement Schedule
All schedules, other than Schedule II, are omitted because they are not applicable, not required or the information is included in the financial statements or notes thereto.
(3) Exhibits
| | |
3.1 |
| Seventh Amended and Restated Certificate of Incorporation of NOV Inc. (Exhibit 3.1) (1) |
|
| |
3.2 |
| Amended and Restated By-laws of NOV Inc. (Exhibit 3.1) (2) |
| | |
4.1 | | Description of Securities (Exhibit 4.1) (3) |
|
| |
4.2 | | Indenture, dated November 15, 2012, between National Oilwell Varco, Inc. and U.S. Bank National Association (Exhibit 4.1) (4) |
| | |
4.3 | | Third Supplemental Indenture, dated November 20, 2012, between National Oilwell Varco, Inc. and U.S. Bank National Association (Exhibit 4.6) (4) |
| | |
4.4 | | Fourth Supplemental Indenture, dated November 14, 2019, between National Oilwell Varco, Inc. and Wells Fargo Bank, National Association, as successor trustee. (Exhibit 4.2) (5) |
| | |
10.1 |
| 5-Year Credit Agreement, dated as of September 12, 2024, among NOV Inc. and the financial institutions signatory thereto, including Wells Fargo Bank, National Association, in its capacity, among others, as Administrative Agent, an Arranger and a Joint Book Runner (Exhibit 10.1) (6) |
| | |
10.2 |
| NOV Inc. Long-Term Incentive Plan, as amended and restated (7)* |
|
| |
10.3 |
| Form of Executive Employment Agreement (Exhibit 10.1) (8)* |
|
| |
10.4 |
| Form of Executive Severance Agreement (Exhibit 10.2) (9)* |
|
| |
10.5 |
| Form of Restricted Stock Unit Agreement (2022) (Exhibit 10.1) (10)* |
|
| |
10.6 | | Form of Performance Award Agreement (2022) (Exhibit 10.2) (10)* |
| | |
10.7 | | Form of Employee Nonqualified Stock Option Grant Agreement (2022) (Exhibit 10.3) (10)* |
| | |
10.8 | | Form of Non-Employee Director Restricted Stock Unit Agreement (2022) (Exhibit 10.1) (11)* |
| | |
10.9 | | Form of Performance Award Agreement (2023) (Exhibit 10.1) (12)* |
| | |
* Compensatory plan or arrangement for management or others.
(1)Filed as an Exhibit to our Current Report on Form 8-K filed on May 18, 2023.
(2)Filed as an Exhibit to our Current Report on Form 8-K filed on February 28, 2023.
(3)Filed as an Exhibit to our Annual Report on Form 10-K filed on February 12, 2021.
(4)Filed as an Exhibit to our Current Report on Form 8-K filed on November 20, 2012.
(5)Filed as an Exhibit to our Current Report on Form 8-K filed on November 14, 2019.
(6)Filed as an Exhibit to our Current Report on Form 8-K filed on September 12, 2024.
(7)Filed as Appendix I to our Proxy Statement filed on April 8, 2022.
(8)Filed as an Exhibit to our Current Report on Form 8-K filed on December 4, 2023.
(9)Filed as an Exhibit to our Current Report on Form 8-K filed on November 24, 2014.
(10)Filed as an Exhibit to our Current Report on Form 8-K filed on February 22, 2022.
(11)Filed as an Exhibit to our Quarterly Report on Form 10-Q filed on July 28, 2022.
(12)Filed as an Exhibit to our Quarterly Report on Form 10-Q filed on April 27, 2023.
(13)Filed as an Exhibit to our Quarterly Report on Form 10-Q filed on April 26, 2024.
(14)Filed as an Exhibit to our Current Report on Form 8-K filed on July 12, 2022.
(15)Filed as an Exhibit to our Current Report on Form 8-K filed on February 21, 2023.
(16)Filed with this Form 10-K.
(17)Furnished with this Form 10-K.
We hereby undertake, pursuant to Regulation S-K, Item 601(b), paragraph (4) (iii), to furnish to the U.S. Securities and Exchange Commission, upon request, all constituent instruments defining the rights of holders of our long-term debt not filed herewith.
SIGNATURES
Pursuant to the requirements of Section 13 or 15(d) of the Securities Exchange Act of 1934, the registrant has duly caused this report to be signed on its behalf by the undersigned, thereunto duly authorized.
| | | | |
| | NOV INC. |
| | | | |
Dated: February 14, 2025 | | By: | | /s/ CLAY C. WILLIAMS |
| | | | Clay C. Williams |
| | | | Chairman, President and Chief Executive Officer |
Pursuant to the requirements of the Securities Exchange Act of 1934, this report has been signed below by the following persons on behalf of the registrant and in the capacities and on the dates indicated.
Each person whose signature appears below in so signing, constitutes and appoints Clay C. Williams and Jose A. Bayardo, and each of them acting alone, his/her true and lawful attorney-in-fact and agent, with full power of substitution, for him/her and in his/her name, place and stead, in any and all capacities, to execute and cause to be filed with the Securities and Exchange Commission any and all amendments to this report, and in each case to file the same, with all exhibits thereto and other documents in connection therewith, and hereby ratifies and confirms all that said attorney-in-fact or his/her substitute or substitutes may do or cause to be done by virtue hereof.
| | | | |
Signature | | Title | | Date |
| | | | |
/s/ CLAY C. WILLIAMS Clay C. Williams | | Chairman, President and Chief Executive Officer | | February 14, 2025 |
| | | | |
/s/ JOSE A. BAYARDO Jose A. Bayardo | | Senior Vice President and Chief Financial Officer | | February 14, 2025 |
| | | | |
/s/ CHRISTY H. NOVAK Christy H. Novak | | Vice President, Corporate Controller and Chief Accounting Officer | | February 14, 2025 |
| | | | |
/s/ GREG L. ARMSTRONG | | Director | | February 14, 2025 |
Greg L. Armstrong | | | | |
| | | | |
/s/ MARCELA E. DONADIO | | Director | | February 14, 2025 |
Marcela E. Donadio | | | | |
| | | | |
/s/ BEN A. GUILL | | Director | | February 14, 2025 |
Ben A. Guill | | | | |
| | | | |
/s/ DAVID D. HARRISON | | Director | | February 14, 2025 |
David D. Harrison | | | | |
| | | | |
/s/ CHRISTIAN S. KENDALL | | Director | | February 14, 2025 |
Christian S. Kendall | | | | |
| | | | |
/s/ PATRICIA MARTINEZ | | Director | | February 14, 2025 |
Patricia Martinez | | | | |
| | | | |
/s/ ERIC L. MATTSON | | Director | | February 14, 2025 |
Eric L. Mattson | | | | |
| | | | |
/s/ PATRICIA B. MELCHER | | Director | | February 14, 2025 |
Patricia B. Melcher | | | | |
| | | | |
/s/ WILLIAM R. THOMAS | | Director | | February 14, 2025 |
William R. Thomas | | | | |
| | | | |
/s/ ROBERT S. WELBORN | | Director | | February 14, 2025 |
Robert S. Welborn | | | | |
MANAGEMENT’S REPORT ON INTERNAL CONTROL OVER FINANCIAL REPORTING
NOV Inc.’s management is responsible for establishing and maintaining adequate internal control over financial reporting. NOV Inc.’s internal control system was designed to provide reasonable assurance regarding the reliability of financial reporting and the preparation of financial statements for external purposes in accordance with generally accepted accounting principles.
Internal control over financial reporting cannot provide absolute assurance of achieving financial reporting objectives because of its inherent limitations. Internal control over financial reporting is a process that involves human diligence and compliance and is subject to lapses in judgment and breakdowns resulting from human failures. Internal control over financial reporting also can be circumvented by collusion or improper management override. Because of such limitations, there is a risk that material misstatements may not be prevented or detected on a timely basis by internal control over financial reporting. However, these inherent limitations are known features of the financial reporting process. Therefore, it is possible to design into the process safeguards to reduce, though not eliminate, this risk.
Management has used the 2013 framework set forth in the report entitled “Internal Control—Integrated Framework” published by the Committee of Sponsoring Organizations (“COSO”) of the Treadway Commission to evaluate the effectiveness of the Company’s internal control over financial reporting. Management has concluded that the Company’s internal control over financial reporting was effective as of December 31, 2024.
The effectiveness of our internal control over financial reporting as of December 31, 2024, has been audited by Ernst & Young LLP, the independent registered public accounting firm which also has audited the Company’s Consolidated Financial Statements included in this Annual Report on Form 10-K.
| |
/s/ Clay C. Williams | |
Clay C. Williams | |
Chairman, President and Chief Executive Officer | |
| |
| |
| |
/s/ Jose A. Bayardo | |
Jose A. Bayardo | |
Senior Vice President and Chief Financial Officer | |
Houston, Texas
February 14, 2025
REPORT OF INDEPENDENT REGISTERED PUBLIC ACCOUNTING FIRM
To the Shareholders and the Board of Directors of NOV Inc.
Opinion on Internal Control Over Financial Reporting
We have audited NOV Inc.’s internal control over financial reporting as of December 31, 2024, based on criteria established in Internal Control—Integrated Framework issued by the Committee of Sponsoring Organizations of the Treadway Commission (2013 framework) (the COSO criteria). In our opinion, NOV Inc. (the Company) maintained, in all material respects, effective internal control over financial reporting as of December 31, 2024, based on the COSO criteria.
We also have audited, in accordance with the standards of the Public Company Accounting Oversight Board (United States) (PCAOB), the 2024 consolidated financial statements of the Company and our report dated February 14, 2025, expressed an unqualified opinion thereon.
Basis for Opinion
The Company’s management is responsible for maintaining effective internal control over financial reporting and for its assessment of the effectiveness of internal control over financial reporting included in the accompanying Management’s Report on Internal Control Over Financial Reporting. Our responsibility is to express an opinion on the Company’s internal control over financial reporting based on our audit. We are a public accounting firm registered with the PCAOB and are required to be independent with respect to the Company in accordance with the U.S. federal securities laws and the applicable rules and regulations of the Securities and Exchange Commission and the PCAOB.
We conducted our audit in accordance with the standards of the PCAOB. Those standards require that we plan and perform the audit to obtain reasonable assurance about whether effective internal control over financial reporting was maintained in all material respects.
Our audit included obtaining an understanding of internal control over financial reporting, assessing the risk that a material weakness exists, testing and evaluating the design and operating effectiveness of internal control based on the assessed risk, and performing such other procedures as we considered necessary in the circumstances. We believe that our audit provides a reasonable basis for our opinion.
Definition and Limitations of Internal Control Over Financial Reporting
A company’s internal control over financial reporting is a process designed to provide reasonable assurance regarding the reliability of financial reporting and the preparation of financial statements for external purposes in accordance with generally accepted accounting principles. A company’s internal control over financial reporting includes those policies and procedures that (1) pertain to the maintenance of records that, in reasonable detail, accurately and fairly reflect the transactions and dispositions of the assets of the
company; (2) provide reasonable assurance that transactions are recorded as necessary to permit preparation of financial statements in accordance with generally accepted accounting principles, and that receipts and expenditures of the company are being made only in accordance with authorizations of management and directors of the company; and (3) provide reasonable assurance regarding prevention or timely detection of unauthorized acquisition, use, or disposition of the company’s assets that could have a material effect on the financial statements.
Because of its inherent limitations, internal control over financial reporting may not prevent or detect misstatements. Also, projections of any evaluation of effectiveness to future periods are subject to the risk that controls may become inadequate because of changes in conditions, or that the degree of compliance with the policies or procedures may deteriorate.
/s/ Ernst & Young LLP
Houston, Texas
February 14, 2025
REPORT OF INDEPENDENT REGISTERED PUBLIC ACCOUNTING FIRM
To the Shareholders and the Board of Directors of NOV Inc.
Opinion on the Financial Statements
We have audited the accompanying consolidated balance sheets of NOV Inc. (the Company) as of December 31, 2024 and 2023, the related consolidated statements of income, comprehensive income, cash flows, and stockholders’ equity for each of the three years in the period ended December 31, 2024, and the related notes and financial statement schedule listed in the Index at Item 15(2) (collectively referred to as the “consolidated financial statements”). In our opinion, the consolidated financial statements present fairly, in all material respects, the consolidated financial position of the Company at December 31, 2024 and 2023, and the results of its operations and its cash flows for each of the three years in the period ended December 31, 2024, in conformity with U.S. generally accepted accounting principles.
We also have audited, in accordance with the standards of the Public Company Accounting Oversight Board (United States) (PCAOB), the Company’s internal control over financial reporting as of December 31, 2024, based on criteria established in Internal Control-Integrated Framework issued by the Committee of Sponsoring Organizations of the Treadway Commission (2013 framework) and our report dated February 14, 2025, expressed an unqualified opinion thereon.
Basis for Opinion
These financial statements are the responsibility of the Company’s management. Our responsibility is to express an opinion on the Company’s financial statements based on our audits. We are a public accounting firm registered with the PCAOB and are required to be independent with respect to the Company in accordance with the U.S. federal securities laws and the applicable rules and regulations of the Securities and Exchange Commission and the PCAOB.
We conducted our audits in accordance with the standards of the PCAOB. Those standards require that we plan and perform the audit to obtain reasonable assurance about whether the financial statements are free of material misstatement, whether due to error or fraud. Our audits included performing procedures to assess the risks of material misstatement of the financial statements, whether due to error or fraud, and performing procedures that respond to those risks. Such procedures included examining, on a test basis, evidence regarding the amounts and disclosures in the financial statements. Our audits also included evaluating the accounting principles used and significant estimates made by management, as well as evaluating the overall presentation of the financial statements. We believe that our audits provide a reasonable basis for our opinion.
Critical Audit Matter
The critical audit matter communicated below is a matter arising from the current period audit of the consolidated financial statements that was communicated or required to be communicated to the audit committee and that: (1) relates to accounts or disclosures that are material to the financial statements and (2) involved our especially challenging, subjective or complex judgments. The communication of the critical audit matter does not alter in any way our opinion on the consolidated financial statements, taken as a whole, and we are not, by communicating the critical audit matter below, providing a separate opinion on the critical audit matter or on the accounts or disclosures to which it relates.
| |
| Revenue recognition under long-term construction contracts |
Description of the Matter | As discussed in Note 2 to the consolidated financial statements, the Company recognizes revenue over time for certain long-term construction contracts using an input method described as the cost-to-cost approach to determine the extent of progress towards completion of performance obligations. Under the cost-to-cost approach, the determination of the progress towards completion requires management to prepare estimates of the costs to complete, which are subject to considerable judgment and could be impacted by such items as changes to the project schedule and the cost of labor and material. Auditing management’s estimate of the progress towards completion of its projects involved subjectivity as the costs to complete forecasts are subject to considerable judgment. |
| |
How We Addressed the Matter in Our Audit | We obtained an understanding, evaluated the design and tested the operating effectiveness of controls over the Company’s estimate of the progress towards completion of its projects, including key controls related to monitoring projected project costs. To test the Company’s estimate of the progress towards completion of its projects, we performed audit procedures that included, among others, testing the significant assumptions discussed above to develop the estimated cost to |
| |
| complete and testing the completeness and accuracy of the underlying data. To assess management’s estimated costs, we performed audit procedures that included, among others, agreeing the estimates to supporting documentation; conducting interviews with project personnel; attending selected project review meetings; performing observations of select projects to observe progress; and performing lookback analyses to historical actual costs to assess management’s ability to estimate. |
/s/ Ernst & Young LLP
We have served as the Company’s auditor since at least 1995, but we are unable to determine the specific year.
Houston, Texas
February 14, 2025
NOV INC.
CONSOLIDATED BALANCE SHEETS
(In millions, except share data)
| | | | | | | | |
| | December 31, | |
| | 2024 | | | 2023 | |
ASSETS | | | | | | |
Current assets: | | | | | | |
Cash and cash equivalents | | $ | 1,230 | | | $ | 816 | |
Receivables, net | | | 1,819 | | | | 1,905 | |
Inventories, net | | | 1,932 | | | | 2,151 | |
Contract assets | | | 577 | | | | 739 | |
Prepaid and other current assets | | | 212 | | | | 229 | |
Total current assets | | | 5,770 | | | | 5,840 | |
Property, plant and equipment, net | | | 1,922 | | | | 1,865 | |
Lease right-of-use assets, operating | | | 353 | | | | 372 | |
Lease right-of-use assets, financing | | | 196 | | | | 172 | |
Deferred income taxes | | | 413 | | | | 488 | |
Goodwill | | | 1,630 | | | | 1,562 | |
Intangibles, net | | | 508 | | | | 450 | |
Investment in unconsolidated affiliates | | | 163 | | | | 211 | |
Other assets | | | 406 | | | | 334 | |
Total assets | | $ | 11,361 | | | $ | 11,294 | |
LIABILITIES AND STOCKHOLDERS’ EQUITY | | | | | | |
Current liabilities: | | | | | | |
Accounts payable | | $ | 837 | | | $ | 904 | |
Accrued liabilities | | | 861 | | | | 870 | |
Contract liabilities | | | 492 | | | | 532 | |
Current portion of lease liabilities | | | 102 | | | | 94 | |
Current portion of long-term debt | | | 37 | | | | 13 | |
Accrued income taxes | | | 18 | | | | 22 | |
Total current liabilities | | | 2,347 | | | | 2,435 | |
Long-term debt | | | 1,703 | | | | 1,712 | |
Lease liabilities | | | 544 | | | | 558 | |
Deferred income taxes | | | 56 | | | | 70 | |
Other liabilities | | | 283 | | | | 277 | |
Total liabilities | | | 4,933 | | | | 5,052 | |
Commitments and contingencies | | | | | | |
Stockholders’ equity: | | | | | | |
Common stock - par value $.01; 1 billion shares authorized; 381,549,541 and 393,945,659 shares issued and outstanding at December 31, 2024 and December 31, 2023 | | | 4 | | | | 4 | |
Additional paid-in capital | | | 8,625 | | | | 8,812 | |
Accumulated other comprehensive loss | | | (1,625 | ) | | | (1,493 | ) |
Retained deficit | | | (628 | ) | | | (1,155 | ) |
Total Company stockholders’ equity | | | 6,376 | | | | 6,168 | |
Noncontrolling interests | | | 52 | | | | 74 | |
Total stockholders’ equity | | | 6,428 | | | | 6,242 | |
Total liabilities and stockholders’ equity | | $ | 11,361 | | | $ | 11,294 | |
The accompanying notes are an integral part of these statements.
NOV INC.
CONSOLIDATED STATEMENTS OF INCOME
(In millions, except per share data)
| | | | | | | | | | | | |
| | Year Ended December 31, | |
| | 2024 | | | 2023 | | | 2022 | |
Revenue | | | | | | | | | |
Sales | | $ | 5,830 | | | $ | 5,775 | | | $ | 4,873 | |
Services | | | 1,991 | | | | 1,789 | | | | 1,482 | |
Rental | | | 1,049 | | | | 1,019 | | | | 882 | |
Total | | | 8,870 | | | | 8,583 | | | | 7,237 | |
Cost of revenue | | | | | | | | | |
Sales | | | 4,759 | | | | 4,798 | | | | 4,146 | |
Services | | | 1,543 | | | | 1,367 | | | | 1,186 | |
Rental | | | 558 | | | | 585 | | | | 571 | |
Total | | | 6,860 | | | | 6,750 | | | | 5,903 | |
Gross profit | | | 2,010 | | | | 1,833 | | | | 1,334 | |
Selling, general and administrative | | | 1,134 | | | | 1,182 | | | | 1,070 | |
Operating profit | | | 876 | | | | 651 | | | | 264 | |
Interest and financial costs | | | (91 | ) | | | (88 | ) | | | (78 | ) |
Interest income | | | 38 | | | | 28 | | | | 19 | |
Equity income in unconsolidated affiliates | | | 36 | | | | 119 | | | | 68 | |
Other expense, net | | | (28 | ) | | | (98 | ) | | | (35 | ) |
Income before income taxes | | | 831 | | | | 612 | | | | 238 | |
Provision (benefit) for income taxes | | | 196 | | | | (373 | ) | | | 83 | |
Net income | | | 635 | | | | 985 | | | | 155 | |
Net loss attributable to noncontrolling interests | | | — | | | | (8 | ) | | | — | |
Net income attributable to Company | | $ | 635 | | | $ | 993 | | | $ | 155 | |
Net income attributable to Company per share: | | | | | | | | | |
Basic | | $ | 1.62 | | | $ | 2.53 | | | $ | 0.40 | |
Diluted | | $ | 1.60 | | | $ | 2.50 | | | $ | 0.39 | |
Cash dividends per share | | $ | 0.275 | | | $ | 0.20 | | | $ | 0.20 | |
Weighted average shares outstanding: | | | | | | | | | |
Basic | | | 392 | | | | 393 | | | | 390 | |
Diluted | | | 396 | | | | 397 | | | | 394 | |
The accompanying notes are an integral part of these statements.
NOV INC.
CONSOLIDATED STATEMENTS OF COMPREHENSIVE INCOME
(In millions)
| | | | | | | | | | | | |
| | Year Ended December 31, | |
| | 2024 | | | 2023 | | | 2022 | |
Net income | | $ | 635 | | | $ | 985 | | | $ | 155 | |
Other comprehensive income: | | | | | | | | | |
Currency translation adjustments | | | (137 | ) | | | 113 | | | | (30 | ) |
Change in derivative financial instruments, net of tax | | | (5 | ) | | | (1 | ) | | | (11 | ) |
Change in defined benefit plans, net of tax | | | 10 | | | | (12 | ) | | | (6 | ) |
Comprehensive income | | | 503 | | | | 1,085 | | | | 108 | |
Net loss attributable to noncontrolling interests | | | - | | | | (8 | ) | | | - | |
Comprehensive income attributable to Company | | $ | 503 | | | $ | 1,093 | | | $ | 108 | |
The accompanying notes are an integral part of these statements.
NOV INC.
CONSOLIDATED STATEMENTS OF CASH FLOWS
(In millions)
| | | | | | | | | | | | |
| | Year Ended December 31, | |
| | 2024 | | | 2023 | | | 2022 | |
Cash flows from operating activities: | | | | | | | | | |
Net income | | $ | 635 | | | $ | 985 | | | $ | 155 | |
Adjustments to reconcile net income to net cash provided (used in) by
operating activities: | | | | | | | | | |
Depreciation and amortization | | | 343 | | | | 302 | | | | 301 | |
Russia/Belarus impairment and loss on assets held for sale | | | - | | | | 4 | | | | 127 | |
Deferred income taxes | | | 49 | | | | (489 | ) | | | (2 | ) |
Stock-based compensation | | | 70 | | | | 66 | | | | 67 | |
Equity income in unconsolidated affiliates | | | (36 | ) | | | (119 | ) | | | (68 | ) |
Dividend from unconsolidated affiliate | | | 84 | | | | — | | | | — | |
Gain on business divestiture | | | (130 | ) | | | — | | | | — | |
Provision for inventory losses | | | 31 | | | | 28 | | | | (18 | ) |
Other, net | | | 43 | | | | (50 | ) | | | 18 | |
Change in operating assets and liabilities, net of acquisitions: | | | | | | | | | |
Receivables | | | 93 | | | | (269 | ) | | | (440 | ) |
Inventories | | | 270 | | | | (361 | ) | | | (480 | ) |
Contract assets | | | 162 | | | | (55 | ) | | | (220 | ) |
Prepaid and other current assets | | | 17 | | | | (40 | ) | | | 6 | |
Accounts payable | | | (87 | ) | | | (4 | ) | | | 289 | |
Accrued liabilities | | | (51 | ) | | | (116 | ) | | | 101 | |
Contract liabilities | | | (42 | ) | | | 82 | | | | 52 | |
Income taxes payable | | | (5 | ) | | | (6 | ) | | | 5 | |
Other assets/liabilities, net | | | (142 | ) | | | 185 | | | | (72 | ) |
Net cash provided by (used in) operating activities | | | 1,304 | | | | 143 | | | | (179 | ) |
Cash flows from investing activities: | | | | | | | | | |
Purchases of property, plant and equipment | | | (351 | ) | | | (283 | ) | | | (214 | ) |
Business acquisitions, net of cash acquired | | | (298 | ) | | | (22 | ) | | | (49 | ) |
Business divestitures, net of cash disposed | | | 176 | | | | — | | | | — | |
Other, net | | | 2 | | | | 12 | | | | 25 | |
Net cash used in investing activities | | | (471 | ) | | | (293 | ) | | | (238 | ) |
Cash flows from financing activities: | | | | | | | | | |
Borrowings against lines of credit and other debt | | | 420 | | | | 184 | | | | 20 | |
Payments against lines of credit and other debt | | | (431 | ) | | | (192 | ) | | | (4 | ) |
Financing leases | | | (28 | ) | | | (23 | ) | | | (24 | ) |
Cash dividends paid | | | (108 | ) | | | (79 | ) | | | (78 | ) |
Shares repurchases | | | (229 | ) | | | — | | | | — | |
Other | | | (30 | ) | | | 7 | | | | (10 | ) |
Net cash used in financing activities | | | (406 | ) | | | (103 | ) | | | (96 | ) |
Effect of exchange rates on cash | | | (13 | ) | | | - | | | | (9 | ) |
Increase (decrease) in cash and cash equivalents | | | 414 | | | | (253 | ) | | | (522 | ) |
Cash and cash equivalents, beginning of period | | | 816 | | | | 1,069 | | | | 1,591 | |
Cash and cash equivalents, end of period | | $ | 1,230 | | | $ | 816 | | | $ | 1,069 | |
Supplemental disclosures of cash flow information: | | | | | | | | | |
Cash payments during the period for: | | | | | | | | | |
Interest | | $ | 86 | | | $ | 85 | | | $ | 75 | |
Income taxes | | $ | 161 | | | $ | 114 | | | $ | 117 | |
The accompanying notes are an integral part of these statements.
NOV INC.
CONSOLIDATED STATEMENTS OF STOCKHOLDERS’ EQUITY
(In millions)
| | | | | | | | | | | | | | | | | | | | | | | | | | | | | | | | |
| | Shares Issued
and
Outstanding | | | Common
Stock | | | Additional
Paid-in
Capital | | | Accumulated
Other
Comprehensive
Loss | | | Retained
Deficit | | | Total
Company
Stockholders’
Equity | | | Noncontrolling
Interests | | | Total
Stockholders’
Equity | |
Balance at December 31, 2021 | | | 393 | | | $ | 4 | | | $ | 8,685 | | | $ | (1,546 | ) | | $ | (2,146 | ) | | $ | 4,997 | | | $ | 67 | | | $ | 5,064 | |
Net Income | | | — | | | | — | | | | — | | | | — | | | | 155 | | | | 155 | | | | — | | | | 155 | |
Other comprehensive loss | | | — | | | | — | | | | — | | | | (47 | ) | | | — | | | | (47 | ) | | | — | | | | (47 | ) |
Cash dividends, $0.20 per common share | | | — | | | | — | | | | — | | | | — | | | | (78 | ) | | | (78 | ) | | | — | | | | (78 | ) |
Stock-based compensation | | | — | | | | — | | | | 67 | | | | — | | | | — | | | | 67 | | | | — | | | | 67 | |
Withholding taxes | | | — | | | | — | | | | (12 | ) | | | — | | | | — | | | | (12 | ) | | | — | | | | (12 | ) |
Purchase of equity in non-controlling interest | | | — | | | | — | | | | 12 | | | | — | | | | — | | | | 12 | | | | (29 | ) | | | (17 | ) |
Other | | | — | | | | — | | | | 2 | | | | — | | | | — | | | | 2 | | | | — | | | | 2 | |
Balance at December 31, 2022 | | | 393 | | | $ | 4 | | | $ | 8,754 | | | $ | (1,593 | ) | | $ | (2,069 | ) | | $ | 5,096 | | | $ | 38 | | | $ | 5,134 | |
Net Income | | | — | | | | — | | | | — | | | | — | | | | 993 | | | | 993 | | | | (8 | ) | | | 985 | |
Other comprehensive income, net | | | — | | | | — | | | | — | | | | 100 | | | | — | | | | 100 | | | | — | | | | 100 | |
Cash dividends, $0.20 per common share | | | — | | | | — | | | | — | | | | — | | | | (79 | ) | | | (79 | ) | | | — | | | | (79 | ) |
Transactions with non-controlling interests | | | — | | | | — | | | | 7 | | | | — | | | | — | | | | 7 | | | | 45 | | | | 52 | |
Stock-based compensation | | | — | | | | — | | | | 66 | | | | — | | | | — | | | | 66 | | | | — | | | | 66 | |
Common stock issued | | | 2 | | | | — | | | | — | | | | — | | | | — | | | | - | | | | — | | | | - | |
Withholding taxes | | | (1 | ) | | | — | | | | (18 | ) | | | — | | | | — | | | | (18 | ) | | | — | | | | (18 | ) |
Other | | | — | | | | — | | | | 3 | | | | — | | | | — | | | | 3 | | | | (1 | ) | | | 2 | |
Balance at December 31, 2023 | | | 394 | | | $ | 4 | | | $ | 8,812 | | | $ | (1,493 | ) | | $ | (1,155 | ) | | $ | 6,168 | | | $ | 74 | | | $ | 6,242 | |
Net Income | | | — | | | | — | | | | — | | | | — | | | | 635 | | | | 635 | | | | — | | | | 635 | |
Other comprehensive loss | | | — | | | | — | | | | — | | | | (132 | ) | | | — | | | | (132 | ) | | | — | | | | (132 | ) |
Cash dividends, $0.275 per common share | | | — | | | | — | | | | — | | | | — | | | | (108 | ) | | | (108 | ) | | | — | | | | (108 | ) |
Transactions with non-controlling interests | | | — | | | | — | | | | (16 | ) | | | — | | | | — | | | | (16 | ) | | | (21 | ) | | | (37 | ) |
Stock-based compensation | | | — | | | | — | | | | 70 | | | | — | | | | — | | | | 70 | | | | — | | | | 70 | |
Common stock issued | | | 3 | | | | — | | | | — | | | | — | | | | — | | | | — | | | | — | | | | — | |
Withholding taxes | | | (1 | ) | | | — | | | | (15 | ) | | | — | | | | — | | | | (15 | ) | | | — | | | | (15 | ) |
Share repurchases | | | (14 | ) | | | — | | | | (229 | ) | | | — | | | | — | | | | (229 | ) | | | — | | | | (229 | ) |
Other | | | — | | | | — | | | | 3 | | | | — | | | | — | | | | 3 | | | | (1 | ) | | | 2 | |
Balance at December 31, 2024 | | | 382 | | | $ | 4 | | | $ | 8,625 | | | $ | (1,625 | ) | | $ | (628 | ) | | $ | 6,376 | | | $ | 52 | | | $ | 6,428 | |
The accompanying notes are an integral part of these statements.
NOV INC.
NOTES TO CONSOLIDATED FINANCIAL STATEMENTS
1. Organization and Basis of Presentation
Nature of Business
We design, construct, manufacture and sell comprehensive systems, components, and products used in oil and gas drilling and production and certain industrial and renewable energy sectors. We also provide technology and oilfield services and supplies, distribute products and provide supply chain integration services to the upstream oil and gas industry. Our revenues and operating results are directly related to the level of worldwide oil and gas drilling and production activities and the profitability and cash flow of oil and gas companies, drilling contractors and oilfield service companies, which in turn are affected by current and anticipated prices of oil and gas. Oil and gas prices have been, and are likely to continue to be, volatile.
Basis of Consolidation
The accompanying Consolidated Financial Statements include the accounts of NOV Inc. and its consolidated subsidiaries. Certain reclassifications have been made to the prior year financial statements for them to conform with the 2024 presentation. All significant intercompany transactions and balances have been eliminated in consolidation. Investments that are not wholly owned, but where we exercise control, are fully consolidated with the equity held by minority owners and their portion of net income (loss) reflected as noncontrolling interests in the accompanying consolidated financial statements. Investments in unconsolidated affiliates, over which we exercise significant influence, but not control, are accounted for by the equity method.
2. Summary of Significant Accounting Policies
Fair Value of Financial Instruments
The carrying amounts of financial instruments including cash and cash equivalents, receivables, and payables approximated fair value because of the relatively short maturity of these instruments. Cash equivalents include only those investments having a maturity date of three months or less at the time of purchase.
Derivative Financial Instruments
The Company records all derivative financial instruments at their fair value in its Consolidated Balance Sheet. Except for certain non-designated hedges discussed in Note 3 below, all derivative financial instruments that the Company holds are designated as cash flow hedges and are highly effective in offsetting movements in the underlying risks. Such arrangements typically have terms between two and 24 months but may have longer terms depending on the underlying cash flows being hedged, typically related to the projects in our backlog.
Inventories
Inventories are stated at the lower of cost or estimated net realizable value using the first-in, first-out or average cost methods. Inventories consist of raw materials and supplies, work-in-process and finished goods and purchased products. The Company reviews historical usage of inventory on-hand, assumptions about future demand and market conditions, and estimates about potential alternative uses, which are limited, to estimate net realizable value. The Company evaluates inventory using the best information available at the time to inform our assumptions and estimates about future demand and resulting sales volumes, and records reserves as necessary.
We recorded charges (credits) to inventory reserves of $31 million, $28 million, and $(18) million for the years ended December 31, 2024, 2023, and 2022, respectively. At December 31, 2024 and 2023, inventory reserves totaled $286 million and $354 million, or 12.9% and 14.1% of gross inventory, respectively.
Property, Plant and Equipment
Property, plant and equipment are recorded at cost. Expenditures for major improvements that extend the lives of property and equipment are capitalized while minor replacements, maintenance and repairs are charged to operations as incurred. Disposals are removed at cost less accumulated depreciation with any resulting gain or loss reflected in operations. Depreciation is provided using the straight-line method over the estimated useful lives of individual items. Depreciation expense was $294 million, $260 million, and $250 million for the years ended December 31, 2024, 2023 and 2022, respectively. The estimated useful lives of the major classes of property, plant and equipment are included in Note 5 to the consolidated financial statements.
We record impairment losses on long-lived assets used in operations when events and circumstances indicate that the assets are impaired and the undiscounted cash flows estimated to be generated by those assets are less than the carrying amount of those assets. The carrying value of assets used in operations that are not recoverable is reduced to fair value if lower than carrying value. In determining the fair market value of the assets, we consider market trends and recent transactions involving sales of similar assets, or when not available, discounted cash flow analysis.
Acquisitions and Investments
Acquisitions of businesses are accounted for using the acquisition method of accounting, and the financial statements include the results of the acquired operations from the respective dates of acquisition.
The acquisition price of the acquired entities is preliminarily allocated to the net assets acquired and liabilities assumed based on the estimated fair value at the dates of acquisition, with any excess of acquisition price paid over the fair value of net assets acquired, including intangibles, recognized as goodwill. Subsequent changes to preliminary amounts are made prospectively.
The Company paid cash of $298 million, $22 million, and $49 million, net of cash acquired, for acquisitions for the years ended December 31, 2024, 2023 and 2022, respectively.
Foreign Currency
The functional currency for most of our foreign operations is the local currency. However, certain foreign operations, including our operations in Norway, use the U.S. dollar as the functional currency. The cumulative effects of translating the balance sheet accounts from the functional currency into the U.S. dollar at current exchange rates are included in accumulated other comprehensive income (loss). Revenues and expenses are translated at average exchange rates in effect during the period. Accordingly, financial statements of these foreign subsidiaries are remeasured to U.S. dollars for consolidation purposes using current rates of exchange for monetary assets and liabilities and historical rates of exchange for nonmonetary assets and related elements of expense. Revenue and expense elements are remeasured at rates that approximate the rates in effect on the transaction dates. For all operations, gains or losses from remeasuring foreign currency transactions into the functional currency are included in income. Net foreign currency transaction losses were $19 million, $84 million, and $25 million for the years ending December 31, 2024, 2023 and 2022, respectively, and are included in other expenses, net, in the accompanying consolidated statements of income.
Revenue Recognition
The majority of the Company’s revenue streams record revenue at a point in time when a performance obligation has been satisfied by transferring control of promised goods or services to a customer. Products are sold or rented and services are provided based upon a fixed or determinable price and do not generally include right of return or other significant post-delivery obligations. Revenue is recognized net of any taxes collected from customers, which are subsequently remitted to governmental authorities. Payment terms and conditions vary by contract type. We have elected to apply the practical expedient that does not require an adjustment for a financing component if, at contract inception, the period between when we transfer the promised goods or service to the customer and when the customer pays for the goods or service is one year or less. Shipping and handling costs are recognized when incurred and are treated as costs to fulfill the original performance obligation instead of as a separate performance obligation.
Revenue is generated from contracts that may include multiple performance obligations. The Company considers the degree of customization, integration and interdependency of the related products and services when assessing distinct performance obligations within one contract. Stand-alone selling price (“SSP”) for each distinct performance obligation is generally determined using the price at which the products and services would be sold separately to the customer. Discounts, when provided, are allocated based on the relative SSP of the various products and services.
For revenue that is not recognized at a point in time, the Company follows accounting guidance for revenue recognized over time, as follows:
Revenue Recognition under Long-term Construction Contracts
Revenue is recognized over-time for certain long-term construction contracts in the Energy Equipment segment. These contracts include custom designs for customer-specific applications that are unique and require significant engineering efforts. Revenue is recognized as work progresses on each contract. Right to payment is enforceable for performance completed to date, including a reasonable profit.
Because of control transferring over time, revenue is recognized based on the extent of progress towards completion of the performance obligation. We generally use the cost-to-cost (input) measure of progress for our contracts because it best depicts the transfer of assets to the customer which occurs as we incur costs. Under the cost-to-cost measure of progress, progress towards completion of each contract is measured based on the ratio of costs incurred to date to the total estimated costs at completion of the performance obligation. Revenues, including estimated fees or profits, are recorded proportionally as costs are incurred. These costs include labor, materials, subcontractors’ costs, and other direct costs. Any expected losses on a project are recorded in full in the period in which the loss becomes probable.
These long-term construction contracts generally include integrating a complex set of tasks and components into a single project or capability, so they are accounted for as one performance obligation.
Estimating total revenue and cost at completion of long-term construction contracts is complex, subject to many variables and requires significant judgment. It is common for our long-term contracts to contain late delivery fees, work performance guarantees, and other provisions that can either increase or decrease the transaction price. We estimate variable consideration as the most likely amount we expect to receive. We include variable consideration in the estimated transaction price to the extent it is probable that a significant reversal of cumulative revenue recognized will not occur, or when the uncertainty associated with the variable consideration is resolved. Our estimates of variable consideration and determination of whether to include estimated amounts in the transaction price are based on an assessment of our anticipated performance and historical, current and forecasted information that is reasonably available to us. Net revenue recognized from performance obligations satisfied in previous periods was $19 million and $39 million for the years ended December 31, 2024 and 2023, respectively, primarily due to change orders.
For service and repair contracts, revenue is recognized over time. We generally use the output method to measure progress on service contracts due to the manner in which the customer receives and derives value from the services provided. For repair contracts, we generally use the cost-to-cost measure of progress because it best depicts the transfer of assets to the customer.
Remaining Performance Obligations
Remaining performance obligations represent the transaction price of firm orders for all revenue streams for which work has not been performed on contracts with an original expected duration of one year or more. We do not disclose the remaining performance obligations of royalty contracts, service contracts for which there is a right to invoice, and short-term contracts that are expected to have a duration of one year or less.
As of December 31, 2024, the aggregate amount of the transaction price allocated to remaining performance obligations was $4,801 million. Although numerous factors can affect timing of revenue recognized on performance obligations, such as customer change orders and supplier accelerations or delays, the Company expects to recognize approximately $1,630 million in revenue for the remaining performance obligations in 2025, $1,333 million in 2026, $567 million in 2027, and $1,271 million thereafter.
Costs to Obtain and Fulfill a Contract
We recognize an asset for the incremental costs of obtaining a contract, such as sales commissions, with a customer when we expect the benefit of those costs to be longer than one year. Costs to fulfill a contract, such as set-up and mobilization costs, are also capitalized when we expect to recover those costs. These contract costs are deferred and amortized over the period of contract performance. Total capitalized costs to obtain and fulfill a contract and the related amortization were immaterial during the periods presented and are included in other current and long-term assets on our consolidated balance sheets. We apply the practical expedient to expense costs as incurred for costs to obtain a contract with a customer when the amortization period would have been one year or less.
Service and Product Warranties
The Company provides service and warranty policies on certain of its products. The Company accrues liabilities under service and warranty policies based upon specific claims and a review of historical warranty and service claim experience. Adjustments are made to accruals as claim data and historical experience change. In addition, the Company incurs discretionary costs to service its products in connection with product performance issues and accrues for them when they are encountered. The Company monitors the actual cost of performing these discretionary services and adjusts the accrual based on the most current information available.
The changes in the carrying amount of service and product warranties are as follows (in millions):
| | | | |
Balance at December 31, 2022 | | $ | 70 | |
Net provisions for warranties issued during the year | | | 16 | |
Amounts incurred | | | (16 | ) |
Currency translation adjustments and other | | | 2 | |
Balance at December 31, 2023 | | $ | 72 | |
Net provisions for warranties issued during the year | | | 22 | |
Amounts incurred | | | (27 | ) |
Currency translation adjustments and other | | | 1 | |
Balance at December 31, 2024 | | $ | 68 | |
Income Taxes
The liability method is used to account for income taxes. Deferred tax assets and liabilities are determined based on differences between the financial reporting and tax basis of assets and liabilities and are measured using the enacted tax rates that will be in effect when the differences are expected to reverse. Valuation allowances are established when necessary to reduce deferred tax assets to amounts which are more likely than not to be realized.
Concentration of Credit Risk
We grant credit to our customers, which operate primarily in the oil and gas industry. Concentrations of credit risk are limited because we have many geographically diverse customers, thus spreading trade credit risk. We control credit risk through credit evaluations, credit limits and monitoring procedures. We perform periodic credit evaluations of our customers’ financial condition and generally do not require collateral but may require letters of credit for certain international sales. Credit losses are provided for in the financial statements. Allowances for credit losses are determined based on a continuous process of assessing the Company’s portfolio on an individual customer basis considering current market conditions and trends. This process consists of a review of historical collection experience, current aging status of the customer accounts, and financial condition of the Company’s customers. Based on a review of these factors, the Company will establish or adjust allowances for specific customers. As of December 31, 2024, and December 31, 2023, the allowance for credit losses totaled $67 million and $72 million, respectively.
Stock-Based Compensation
Compensation expense for the Company’s stock-based compensation plans is measured using the fair value method. The fair value of stock option grants and restricted stock is amortized to expense using the straight-line method over the shorter of the vesting period or the remaining employee service period.
The Company provides compensation benefits to employees and non-employee directors under share-based payment arrangements, including various employee stock option plans.
Environmental Liabilities
When environmental assessments or remediations are probable and the costs can be reasonably estimated, remediation liabilities are recorded on an undiscounted basis and are adjusted as further information develops or circumstances change.
Use of Estimates
The preparation of financial statements in conformity with accounting principles generally accepted in the United States requires management to make estimates and assumptions that affect reported and contingent amounts of assets and liabilities as of the date of the financial statements and reported amounts of revenues and expenses during the reporting period. Such estimates include but are not limited to, estimated losses on accounts receivable, estimated costs and related margins of projects accounted for over time, estimated realizable value on excess and obsolete inventory, contingencies, estimated liabilities for litigation and environmental exposures and liquidated damages, estimated warranty costs, estimates related to pension accounting, estimates related to the fair value of reporting units for purposes of assessing goodwill and other indefinite-lived intangible assets for impairment and estimates related to valuation allowances on deferred tax assets. Actual results could differ from those estimates.
Contingencies
The Company accrues for costs relating to litigation claims and other contingent matters, including liquidated damage liabilities, when such liabilities become probable and reasonably estimable. In circumstances where the most likely outcome of a contingency can be reasonably estimated, we accrue a liability for that amount. Where the most likely outcome cannot be estimated, a range of potential losses is established and if no one amount in that range is more likely than others, the low end of the range is accrued. Such estimates may be based on advice from third parties or on management’s judgment, as appropriate. Revisions to contingent liabilities are reflected in income in the period in which different facts or information become known or circumstances change that affect the Company’s previous judgments with respect to the likelihood or amount of loss. Amounts paid upon the ultimate resolution of contingent liabilities may be materially different from previous estimates and could require adjustments to the estimated reserves to be recognized in the period such new information becomes known.
Net Income Attributable to Company Per Share
The following table sets forth the computation of weighted average basic and diluted shares outstanding (in millions, except per share data):
| | | | | | | | | | | | |
| | Year Ended December 31, | |
| | 2024 | | | 2023 | | | 2022 | |
Numerator: | | | | | | | | | |
Net income attributable to Company | | $ | 635 | | | $ | 993 | | | $ | 155 | |
Denominator: | | | | | | | | | |
Basic—weighted average common shares outstanding | | | 392 | | | | 393 | | | | 390 | |
Dilutive effect of employee stock options and other unvested
stock awards | | | 4 | | | | 4 | | | | 4 | |
Diluted outstanding shares | | | 396 | | | | 397 | | | | 394 | |
| | | | | | | | | |
Net income attributable to Company per share: | | | | | | | | | |
Basic | | $ | 1.62 | | | $ | 2.53 | | | $ | 0.40 | |
Diluted | | $ | 1.60 | | | $ | 2.50 | | | $ | 0.39 | |
| | | | | | | | | |
Cash dividends per share | | $ | 0.275 | | | $ | 0.20 | | | $ | 0.20 | |
Net income attributable to Company allocated to participating securities was immaterial for the years ended December 31, 2024, 2023 and 2022 and therefore not excluded from net income attributable to Company per share calculation. The Company had stock options outstanding that were anti-dilutive totaling 16 million, 18 million, and 20 million at December 31, 2024, 2023 and 2022, respectively.
Recently Issued Accounting Standards
In December 2023, the FASB issued ASU 2023-09, “Income Taxes (Topic 740): Improvements to Income Tax Disclosures” (“ASU 2023-09”), which is intended to improve the transparency and decision usefulness of income tax disclosures. The amendments in ASU 2023-09 provide for required income tax information primarily through changes to the rate reconciliation and income taxes paid information. ASU 2023-09 is effective for the Company prospectively to all annual periods beginning after December 15, 2024. The Company continues to evaluate the impact of this standard on its disclosures.
In November 2024, the FASB issued ASU 2024-03, “Income Statement—Reporting Comprehensive Income—Expense Disaggregation Disclosures” (“ASU 2024-03”), which improves the disclosures required for certain expense captions in the Company’s annual and interim consolidated financial statements. ASU 2024-03 is effective for fiscal years beginning after December 15, 2026, and for interim periods beginning after December 15, 2027. The Company is currently evaluating the impact of this standard on its disclosures.
Recently Adopted Accounting Standards
The Company has adopted ASU 2023-07, “Segment Reporting (Topic 280): Improvements to Reportable Segment Disclosures” (“ASU 2023-07”), effective retrospectively for the fiscal year ended December 31, 2024. ASU 2023-07 improves the disclosures required for operating segments in the Company’s annual and interim consolidated financial statements. As a result of this adoption, the Company’s segment disclosure now includes significant expense categories and the segment performance metric. See Note 16 to the Consolidated Financial Statements for the disclosures associated with the adoption of ASU 2023-07.
3. Derivative Financial Instruments
The Company uses derivative financial instruments to manage its foreign currency exchange rate risk. Forward currency contracts are executed to manage the foreign currency exchange rate risk on forecasted revenues and expenses denominated in currencies other than the functional currency of the operating unit (cash flow hedge). The Company also executes forward currency contracts to manage the foreign currency exchange rate risk on recognized nonfunctional currency monetary accounts (non-designated hedge).
At December 31, 2024, the Company has determined the fair value of its derivative financial instruments representing assets of $5 million and liabilities of $26 million (currency related derivatives) using level 2 inputs (inputs other than quoted prices in active markets for identical assets and liabilities that are observable either directly or indirectly for substantially the full term of the asset or liability) in the fair value hierarchy as the fair value is based on publicly available foreign exchange and interest rates at each financial reporting date. At December 31, 2024, the net fair value of the Company’s foreign currency forward contracts totaled a net liability of $21 million.
Forward currency contracts consist of (in millions):
| | | | | | | | | | | | |
| | Currency Denomination | |
Currency | | December 31, 2024 | | | December 31, 2023 | |
Colombian Peso | | COP | | | 60,970 | | | COP | | | 57,487 | |
South Korean Won | | KRW | | | 45,130 | | | KRW | | | — | |
Norwegian Krone | | NOK | | | 2,850 | | | NOK | | | 2,179 | |
Japanese Yen | | JPY | | | 1,039 | | | JPY | | | 1,118 | |
U.S. Dollar | | USD | | | 1,031 | | | USD | | | 677 | |
Mexican Peso | | MXN | | | 405 | | | MXN | | | 157 | |
Euro | | EUR | | | 95 | | | EUR | | | 102 | |
South African Rand | | ZAR | | | 25 | | | ZAR | | | 25 | |
Singapore Dollar | | SGD | | | 12 | | | SGD | | | 23 | |
Danish Krone | | DKK | | | 3 | | | DKK | | | 2 | |
Canadian Dollar | | CAD | | | 1 | | | CAD | | | 1 | |
Brazilian Real | | BRL | | | — | | | BRL | | | 291 | |
British Pound Sterling | | GBP | | | — | | | GBP | | | 5 | |
Cash Flow Hedging Strategy
To protect against the volatility of forecasted foreign currency cash flows resulting from forecasted revenues and expenses, the Company maintains a cash flow hedging program. For derivative instruments that are designated and qualify as a cash flow hedge, the gain or loss on the derivative instrument is recorded in accumulated other comprehensive loss and reclassified into earnings in the same line item associated with the forecasted transaction and in the same period or periods during which the hedged transaction affects earnings (e.g., in “revenues” when the hedged transactions are cash flows associated with forecasted revenues). The Company includes time value in hedge relationships.
The Company expects accumulated other comprehensive loss of $12 million will be reclassified into earnings within the next twelve months.
Non-designated Hedging Strategy
The Company enters into forward exchange contracts to hedge certain nonfunctional currency monetary accounts. The gain or loss on the derivative instrument is recognized in earnings in other income (expense), together with the changes in the hedged nonfunctional monetary accounts.
The amount of gain (loss) recognized in other expenses, net was $23 million, $(10) million and $(18) million for the years ended 2024, 2023 and 2022, respectively.
The Company has the following fair values of its derivative instruments and their balance sheet classifications (in millions):
| | | | | | | | | | | | | | | | | | | | |
| | Fair Values of Derivative Instruments
(In millions) | |
| | Asset Derivatives | | | Liability Derivatives | |
| | | | Fair Value | | | | | Fair Value | |
| | Balance Sheet | | December 31, | | | Balance Sheet | | December 31, | |
| | Location | | 2024 | | | 2023 | | | Location | | 2024 | | | 2023 | |
Derivatives designated as hedging
instruments under ASC Topic 815 | | | | | | | | | | | | | | | | |
Foreign exchange contracts | | Prepaid and other current assets | | $ | 1 | | | $ | 8 | | | Accrued liabilities | | $ | 13 | | | $ | 2 | |
Foreign exchange contracts | | Other assets | | | — | | | | — | | | Other liabilities | | | 1 | | | | 1 | |
Total derivatives designated as hedging
instruments under ASC Topic 815 | | | | $ | 1 | | | $ | 8 | | | | | $ | 14 | | | $ | 3 | |
Derivatives not designated as hedging
instruments under ASC Topic 815 | | | | | | | | | | | | | | | | |
Foreign exchange contracts | | Prepaid and other current assets | | $ | 4 | | | $ | 11 | | | Accrued liabilities | | $ | 11 | | | $ | 17 | |
Foreign exchange contracts | | Other assets | | | — | | | | — | | | Other liabilities | | | 1 | | | | 1 | |
Total derivatives not designated
as hedging instruments under ASC Topic 815 | | | | $ | 4 | | | $ | 11 | | | | | $ | 12 | | | $ | 18 | |
Total derivatives | | | | $ | 5 | | | $ | 19 | | | | | $ | 26 | | | $ | 21 | |
4. Inventories, net
Inventories consist of (in millions):
| | | | | | | | |
| | December 31, | |
| | 2024 | | | 2023 | |
Raw materials and supplies | | $ | 394 | | | $ | 479 | |
Work in process | | | 181 | | | | 230 | |
Finished goods and purchased products | | | 1,643 | | | | 1,796 | |
| | | 2,218 | | | | 2,505 | |
Less: Inventory reserve | | | (286 | ) | | | (354 | ) |
Total | | $ | 1,932 | | | $ | 2,151 | |
5. Property, Plant and Equipment, net
Property, plant and equipment consist of (in millions):
| | | | | | | | | | |
| | Estimated | | December 31, | |
| | Useful Lives | | 2024 | | | 2023 | |
Land | | | | $ | 165 | | | $ | 180 | |
Buildings and improvements | | 5-35 Years | | | 1,278 | | | | 1,285 | |
Operating equipment | | 2-20 Years | | | 2,813 | | | | 2,803 | |
Rental equipment | | 2-15 Years | | | 1,076 | | | | 923 | |
| | | | | 5,332 | | | | 5,191 | |
Less: Accumulated Depreciation | | | | | (3,410 | ) | | | (3,326 | ) |
| | | | $ | 1,922 | | | $ | 1,865 | |
6. Goodwill and Intangible Assets
The Company has approximately $1.6 billion of goodwill and $508 million of identified intangible assets at December 31, 2024.
Goodwill is identified by segment as follows (in millions):
| | | | | | | | | | | | |
| | Energy Products and Services | | | Energy Equipment | | | Total | |
Balance at December 31, 2022 | | $ | 729 | | | $ | 776 | | | $ | 1,505 | |
Goodwill acquired during period | | | — | | | | 40 | | | | 40 | |
Adjustment during the measurement period of assets acquired | | | 17 | | | | — | | | | 17 | |
Balance at December 31, 2023 | | $ | 746 | | | $ | 816 | | | $ | 1,562 | |
Goodwill acquired during period | | | 70 | | | | — | | | | 70 | |
Currency translation adjustments and other | | | (2 | ) | | | — | | | | (2 | ) |
Balance at December 31, 2024 (1) | | $ | 814 | | | $ | 816 | | | $ | 1,630 | |
(1)Accumulated goodwill impairment was $7,261 million as of December 31, 2024.
Identified intangible assets with determinable lives consist primarily of customer relationships, trademarks, trade names, patents, and technical drawings acquired in acquisitions, and are being amortized in a manner consistent with the underlying cash flows over the estimated useful lives of 2-40 years. Amortization expense of identified intangibles is expected to be approximately $51 million, $49 million, $45 million, $40 million, and $30 million for the next five years.
As of December 31, 2024, we provisionally recorded $102 million of amortizable intangible assets that were acquired through several strategic acquisitions made during the year. The fair value of the assets acquired are preliminary and subject to change until we finalize our accounting for these acquisitions.
The net book values of identified intangible assets are identified by segment as follows (in millions):
| | | | | | | | | | | | |
| | Energy Products and Services | | | Energy Equipment | | | Total | |
Balance at December 31, 2022 | | $ | 319 | | | $ | 171 | | | $ | 490 | |
Additions to intangible assets | | | 2 | | | | — | | | | 2 | |
Amortization | | | (22 | ) | | | (21 | ) | | | (43 | ) |
Currency translation adjustments and other | | | — | | | | 1 | | | | 1 | |
Balance at December 31, 2023 | | $ | 299 | | | $ | 151 | | | $ | 450 | |
Additions to intangible assets | | | 1 | | | | 6 | | | | 7 | |
Intangible assets acquired | | | 102 | | | | — | | | | 102 | |
Amortization | | | (28 | ) | | | (21 | ) | | | (49 | ) |
Currency translation adjustments and other | | | — | | | | (2 | ) | | | (2 | ) |
Balance at December 31, 2024 | | $ | 374 | | | $ | 134 | | | $ | 508 | |
Identified intangible assets by major classification consist of the following (in millions):
| | | | | | | | | | | | |
| | Gross | | | Accumulated
Amortization | | | Net Book Value | |
December 31, 2023: | | | | | | | | | |
Customer relationships | | $ | 494 | | | $ | (369 | ) | | $ | 125 | |
Trademarks | | | 174 | | | | (133 | ) | | | 41 | |
Patents | | | 129 | | | | (75 | ) | | | 54 | |
Indefinite-lived trade names | | | 196 | | | | — | | | | 196 | |
Other | | | 105 | | | | (71 | ) | | | 34 | |
Total identified intangibles | | $ | 1,098 | | | $ | (648 | ) | | $ | 450 | |
December 31, 2024: | | | | | | | | | |
Customer relationships | | $ | 531 | | | $ | (388 | ) | | $ | 143 | |
Trademarks | | | 194 | | | | (139 | ) | | | 55 | |
Patents | | | 153 | | | | (85 | ) | | | 68 | |
Indefinite-lived trade names | | | 196 | | | | — | | | | 196 | |
Other | | | 125 | | | | (79 | ) | | | 46 | |
Total identified intangibles | | $ | 1,199 | | | $ | (691 | ) | | $ | 508 | |
The following table presents intangible assets that were acquired during the year ended December 31, 2024 by major classification (in millions):
| | | | | | | | | | | | | | | | |
| | Gross | | | Accumulated
Amortization | | | Net Book Value | | | Weighted Average Amortization Period (in years) | |
December 31, 2024: | | | | | | | | | | | | |
Customer relationships | | $ | 39 | | | $ | (3 | ) | | $ | 36 | | | | 9.2 | |
Trademarks | | | 21 | | | | (2 | ) | | | 19 | | | | 9.6 | |
Patents | | | 27 | | | | (4 | ) | | | 23 | | | | 5.0 | |
Other | | | 15 | | | | — | | | | 15 | | | | 5.0 | |
Total identified intangibles | | $ | 102 | | | $ | (9 | ) | | $ | 92 | | | | 7.6 | |
Goodwill represents the excess of acquisition price paid over the fair value of the tangible and identifiable intangible assets acquired and liabilities assumed. Goodwill and intangibles with indefinite lives are not amortized. Goodwill is assigned to the reporting units that are expected to benefit from the synergies of a business combination. The recoverability of goodwill and indefinite-lived intangibles is assessed annually, or more frequently whenever events or circumstances indicate they might be impaired.
The Company has the option to first perform a qualitative assessment to determine whether it is more likely than not that the fair value of a reporting unit or indefinite lived intangible asset is greater than its carrying amount. If the qualitative assessment indicates that it is more likely than not that the fair value of a reporting or indefinite lived intangible asset is greater than its carrying amount, no further testing is required. However, if the Company concludes otherwise, then it is required to perform a quantitative assessment.
If and when the Company performs a quantitative assessment, it compares the reporting unit’s carrying value to the respective fair value. Fair value of the reporting unit is determined using significant unobservable inputs, or level 3 in the fair value hierarchy. These inputs are based on internal management estimates, forecasts and judgments, using discounted cash flow. The discounted cash flow is based on management’s forecast of operating performance for the reporting unit. The two main assumptions used in measuring goodwill impairment, which bear the risk of change and could impact the Company’s goodwill impairment analysis, include the cash flows from operations from each reporting unit and its weighted average cost of capital. The starting point for each of the reporting unit’s cash flows from operations is the detailed annual plan or updated forecast. Cash flows beyond the updated forecasted operating plans are estimated using a terminal value calculation, which incorporates historical and forecasted financial cyclical trends for each reporting unit and considered long-term earnings growth rates. The financial and credit market volatility directly impacts our fair value measurement through our weighted average cost of capital that we use to determine our discount rate. During times of volatility, significant judgment must be applied to determine whether credit changes are a short-term or long-term trend. The quantitative analysis for indefinite lived intangible assets is performed similarly using an income approach.
Management reviews finite-lived intangibles for indicators of impairment whenever events or changes in circumstances indicate that the carrying value may not be recoverable. Cash flows expected to be generated by the finite-lived intangibles are estimated over the intangible asset’s useful life based on updated projections on an undiscounted basis. If the evaluation indicates that the carrying value of the finite-lived intangible asset may not be recoverable, the potential impairment is measured at fair value.
During the fourth quarter of 2024, the Company performed its annual impairment test, as described in ASC Topic 350, by electing to first perform a qualitative assessment. Based on the results of the assessment, the Company concluded it was more likely than not that the fair values of each of its reporting units and indefinite lived intangible assets was greater than its carrying value and no further testing was performed.
No impairment of goodwill or indefinite-lived intangible assets was recorded in 2024 or 2023.
7. Accrued Liabilities
Accrued liabilities consist of (in millions):
| | | | | | | | |
| | December 31, | |
| | 2024 | | | 2023 | |
Compensation | | $ | 268 | | | $ | 294 | |
Vendor costs | | | 141 | | | | 133 | |
Taxes (non-income) | | | 119 | | | | 112 | |
Warranty | | | 68 | | | | 72 | |
Insurance | | | 43 | | | | 44 | |
Fair value of derivatives | | | 24 | | | | 19 | |
Commissions | | | 16 | | | | 17 | |
Interest | | | 11 | | | | 8 | |
Other | | | 171 | | | | 171 | |
Total | | $ | 861 | | | $ | 870 | |
8. Leases
The Company leases certain facilities and equipment to support its operations around the world. These leases generally require the Company to pay maintenance, insurance, taxes and other operating costs in addition to rent. Renewal options are common in longer term leases; however, it is rare that the Company intends to exercise a lease option at inception due to the cyclical nature of the Company’s business. Residual value guarantees are not typically part of the Company’s leases. Occasionally, the Company sub-leases excess facility space, generally at terms similar to the source lease. The Company reviews new agreements to determine if they include a lease and, when they do, uses its incremental borrowing rate to determine the present value of the future lease payments as most do not include implicit interest rates.
Components of leases are as follows (in millions):
| | | | | | | | |
| | December 31, | |
| | 2024 | | | 2023 | |
Current portion of lease liabilities: | | | | | | |
Operating | | $ | 72 | | | $ | 70 | |
Financing | | | 30 | | | | 24 | |
Total | | $ | 102 | | | $ | 94 | |
| | | | | | |
| | December 31, | |
| | 2024 | | | 2023 | |
Long-term portion of lease liability: | | | | | | |
Operating | | $ | 301 | | | $ | 343 | |
Financing | | | 243 | | | | 215 | |
Total | | $ | 544 | | | $ | 558 | |
Components of lease expense were as follows (in millions):
| | | | | | | | |
| | Year Ended December 31, | |
| | 2024 | | | 2023 | |
Lease cost | | | | | | |
Finance lease cost | | | | | | |
Amortization of right-of-use assets | | $ | 28 | | | $ | 23 | |
Interest on lease liabilities | | | 10 | | | | 10 | |
Operating lease cost | | | 90 | | | | 85 | |
Short-term lease cost | | | 69 | | | | 77 | |
Sub-lease income | | | (6 | ) | | | (8 | ) |
Total | | $ | 191 | | | $ | 187 | |
Supplemental information related to the Company’s leases is as follows (in millions):
| | | | | | | | |
| | Years Ended | |
| | 2024 | | | 2023 | |
Other information: | | | | | | |
Cash paid for amounts included in the measurement of lease liabilities: | | | | | | |
Operating cash flows - finance leases | | $ | 10 | | | $ | 10 | |
Operating cash flows - operating leases | | | 90 | | | | 85 | |
Financing cash flows - finance leases | | | 28 | | | | 23 | |
Right-of-use assets obtained in exchange for new: | | | | | | |
Operating lease liabilities | | $ | 65 | | | $ | 68 | |
Finance lease liabilities | | | 28 | | | | 27 | |
| | | | | | |
Weighted average remaining lease term at December 31, 2024: | | | | | | |
Operating leases | | 11 years | | | 10 years | |
Finance leases | | 16 years | | | 16 years | |
Weighted average discount rate at December 31, 2024: | | | | | | |
Operating leases | | | 5.25 | % | | | 5.17 | % |
Finance leases | | | 4.42 | % | | | 4.15 | % |
Future minimum lease commitments for leases with initial or remaining terms of one year or more at December 31, 2024, are payable as follows (in millions):
| | | | | | | | |
| | Operating | | | Finance | |
2025 | | $ | 91 | | | $ | 41 | |
2026 | | | 75 | | | | 36 | |
2027 | | | 58 | | | | 29 | |
2028 | | | 47 | | | | 23 | |
2029 | | | 36 | | | | 20 | |
Thereafter | | | 175 | | | | 190 | |
Total lease payments | | | 482 | | | | 339 | |
Less: Interest | | | (109 | ) | | | (66 | ) |
Present value of lease liabilities | | $ | 373 | | | $ | 273 | |
9. Debt
Debt consists of (in millions):
| | | | | | | | |
| | December 31, | |
| | 2024 | | | 2023 | |
$1.1 billion in Senior Notes, interest at 3.95% payable
semiannually, principal due on December 1, 2042 | | $ | 1,091 | | | $ | 1,091 | |
$0.5 billion in Senior Notes, interest at 3.60% payable
semiannually, principal due on December 1, 2029 | | | 496 | | | | 495 | |
Other debt | | | 153 | | | | 139 | |
Total debt | | | 1,740 | | | | 1,725 | |
Less current portion | | | 37 | | | | 13 | |
Long-term debt | | $ | 1,703 | | | $ | 1,712 | |
Principal payments of debt for years subsequent to 2024 are as follows (in millions):
| | | | |
2025 | | $ | 37 | |
2026 | | | 43 | |
2027 | | | 12 | |
2028 | | | 12 | |
2029 | | | 513 | |
Thereafter | | | 1,137 | |
| | $ | 1,754 | |
On September 12, 2024, the Company entered into a new $1.5 billion five-year unsecured revolving credit facility. This new credit facility replaced the Company’s previous $2.0 billion revolving credit facility. The Company has the right to increase the aggregate commitments under this new agreement to an aggregate amount of up to $2.5 billion upon the consent of only those lenders holding any such increase. Interest under the multicurrency facility is based upon Secured Overnight Financing Rate (SOFR), Euro Interbank Offered Rate (EURIBOR), Sterling Overnight Index Average (SONIA), Canadian Overnight Repo Rate Average (CORRA), or Norwegian Interbank Offered Rate (NIBOR), plus 1.25% subject to a ratings-based grid or the U.S. prime rate. The new credit facility contains a financial covenant establishing a maximum debt-to-capitalization ratio of 60%. As of December 31, 2024, the Company was in compliance with a debt-to-capitalization ratio of 23.8% and had no outstanding borrowings or letters of credit issued under the facility, resulting in $1.5 billion of available funds.
A consolidated joint venture of the Company borrowed $120 million against a $150 million bank line of credit for the construction of a facility in Saudi Arabia. Interest under the bank line of credit is based upon SOFR plus 1.40%. The bank line of credit contains a financial covenant regarding maximum debt-to-equity ratio of 75%. As of December 31, 2024, the joint venture was in compliance. The facility construction was completed in the fourth quarter of 2022, and the joint venture will not have future borrowings on the line of credit. The line of credit repayment schedule began in December 2022 with final payment no later than June 2032. As of December 31, 2024, the Company has a carrying value of $94 million in borrowings related to this line of credit. The carrying value of debt under the Company’s consolidated joint venture approximates fair value because the interest rates are variable and reflective of current market rates. The Company has $11 million in payments related to this line of credit due in the next twelve months. The Company can repay the entire outstanding facility balance without penalty at its sole discretion.
Other debt at December 31, 2024 included $58 million of amounts owed to current and former minority interest partners of NOV consolidated joint ventures, of which $27 million is due in the next twelve months.
The Company had $500 million of outstanding letters of credit at December 31, 2024, primarily in the U.S. and Norway, that are under various bilateral letter of credit facilities. Letters of credit are issued as bid bonds, advanced payment bonds and performance bonds.
At December 31, 2024 and 2023, the fair value of the Company’s unsecured Senior Notes approximated $1,285 million and $1,316 million, respectively. The fair value of the Company’s debt is estimated using Level 2 inputs in the fair value hierarchy and is based on quoted prices for those of similar instruments. At December 31, 2024 and 2023, the carrying value of the Company’s unsecured Senior Notes approximated $1,587 million and $1,586 million, respectively.
10. Employee Benefit Plans
We have benefit plans covering substantially all our employees. Defined-contribution retirement plans cover most of the U.S. and Canadian employees, and benefits are generally based on employee deferrals and matching on those employee contributions. We also have defined contribution plans in Norway and the United Kingdom. For the years ended December 31, 2024, 2023 and 2022, expenses for defined-contribution retirement plans were $85 million, $84 million, and $67 million, respectively, and all funding is current.
During the year ended December 31, 2023, the Company completed the settlement and termination of its defined benefit plan in the United States, resulting in excess plan assets being returned to the Company and an immaterial recognition of non-cash, pre-tax charges from accumulated other comprehensive loss to selling, general and administrative expenses in our consolidated statement of income.
During the year ended December 31, 2022, the Company offered a new benefit plan providing retiree medical coverage in the United States, and as of December 31, 2024, approximately 9,300 employees are eligible for this coverage. In addition, approximately 750 U.S. retirees and/or spouses participate in plans that provide post-retirement healthcare and/or life insurance benefits.
The change in benefit obligation, plan assets and the funded status of the defined benefit pension plans in the United States, United Kingdom, Norway, Germany and the Netherlands and defined postretirement plans in the United States, using a measurement date of December 31, 2024 and 2023, is as follows (in millions):
| | | | | | | | | | | | | | | | |
| | Pension benefits | | | Postretirement benefits | |
At year end | | 2024 | | | 2023 | | | 2024 | | | 2023 | |
Benefit obligation at beginning of year | | $ | 206 | | | $ | 382 | | | $ | 48 | | | $ | 50 | |
Service cost | | | — | | | | — | | | | 2 | | | | 2 | |
Interest cost | | | 8 | | | | 10 | | | | 3 | | | | 2 | |
Actuarial loss (gain) | | | (13 | ) | | | 6 | | | | (2 | ) | | | (3 | ) |
Benefits paid | | | (11 | ) | | | (16 | ) | | | (6 | ) | | | (6 | ) |
Exchange rate loss (gain) | | | (6 | ) | | | 8 | | | | — | | | | — | |
Settlements | | | — | | | | (184 | ) | | | (2 | ) | | | — | |
Special Termination Benefits | | | — | | | | — | | | | — | | | | 3 | |
Benefit obligation at end of year | | $ | 184 | | | $ | 206 | | | $ | 43 | | | $ | 48 | |
| | | | | | | | | | | | |
Fair value of plan assets at beginning of year | | $ | 180 | | | $ | 381 | | | $ | — | | | $ | — | |
Actual return | | | 6 | | | | 2 | | | | — | | | | — | |
Benefits paid | | | (11 | ) | | | (16 | ) | | | (6 | ) | | | (6 | ) |
Company contributions | | | 2 | | | | (11 | ) | | | 8 | | | | 6 | |
Exchange rate gain (loss) | | | (4 | ) | | | 8 | | | | — | | | | — | |
Settlements | | | — | | | | (184 | ) | | | (2 | ) | | | — | |
Fair value of plan assets at end of year | | $ | 173 | | | $ | 180 | | | $ | — | | | $ | — | |
Funded status | | $ | (11 | ) | | $ | (26 | ) | | $ | (43 | ) | | $ | (48 | ) |
| | | | | | | | | | | | |
Accumulated benefit obligation at end of year | | $ | 183 | | | $ | 205 | | | | | | | |
Liabilities associated with the funded status of the defined benefit pension plans are included in the balances of accrued liabilities and other liabilities in the accompanying Consolidated Balance Sheets.
Defined Benefit Pension Plans
Net periodic benefit income (cost) for our defined benefit pension plans aggregated $(3) million, $(2) million, and $1 million for the years ended December 31, 2024, 2023 and 2022, respectively.
Assumed long-term rates of return on plan assets, discount rates and rates of compensation increases vary for the different plans according to the local economic conditions. The assumption rates used for benefit obligations are as follows:
| | | | |
| | Year Ended December 31, |
| | 2024 | | 2023 |
Discount rate: | | | | |
United States plan | | 4.90% | | 5.50% - 5.60% |
International plans | | 3.40% - 5.40% | | 3.20% - 4.50% |
| | | | |
Salary increase: | | | | |
United States plan | | N/A | | N/A |
International plans | | 2.50% - 3.50% | | 2.50% - 3.75% |
The assumption rates used for net periodic benefit costs are as follows:
| | | | | | |
| | Year Ended December 31, |
| | 2024 | | 2023 | | 2022 |
Discount rate: | | | | | | |
United States plan | | 5.50% - 5.60% | | 4.74% - 5.20% | | 1.80% - 2.20% |
International plans | | 3.20% - 4.50% | | 3.30% - 4.80% | | 1.00% - 1.90% |
Salary increase: | | | | | | |
United States plan | | N/A | | N/A | | N/A |
International plans | | 2.50% - 3.75% | | 2.50% - 3.75% | | 2.50% - 3.40% |
Expected return on assets: | | | | | | |
United States plan | | N/A | | 4.74% | | 1.84% |
International plans | | 3.20% - 5.40% | | 3.20% - 4.90% | | 1.00% - 4.00% |
In determining the overall expected long-term rate of return for plan assets, the Company takes into consideration the historical experience as well as future expectations of the asset mix involved. As different investments yield different returns, each asset category is reviewed individually and then weighted for significance in relation to the total portfolio.
The majority of our plans have projected benefit obligations in excess of plan assets.
The Company expects to pay future benefit amounts on its pension plans of approximately $12 million for each of the next five years and aggregate payments of $125 million.
Plan Assets
The Company and its investment advisers collaboratively reviewed market opportunities using historic and statistical data, as well as the actuarial valuation reports for the plans, to ensure that the levels of acceptable return and risk are well-defined and monitored. Currently, the Company’s management believes that there are no significant concentrations of risk associated with plan assets. Our pension investment strategy worldwide prohibits a direct investment in our own stock.
The following table sets forth by level, within the fair value hierarchy, the plan’s assets carried at fair value (in millions):
| | | | | | | | | | | | | | | | |
| | Fair Value Measurements | |
| | Total | | | Level 1 | | | Level 2 | | | Level 3 | |
December 31, 2023: | | | | | | | | | | | | |
Equity securities | | $ | — | | | $ | — | | | $ | — | | | $ | — | |
Bonds | | | 84 | | | | — | | | | 84 | | | | — | |
Other (insurance contracts) | | | 96 | | | | — | | | | 31 | | | | 65 | |
Total Fair Value Measurements | | $ | 180 | | | $ | — | | | $ | 115 | | | $ | 65 | |
December 31, 2024: | | | | | | | | | | | | |
Equity securities | | $ | — | | | $ | — | | | $ | — | | | $ | — | |
Bonds | | | 90 | | | | — | | | | 90 | | | | — | |
Other (insurance contracts) | | | 83 | | | | — | | | | 20 | | | | 63 | |
Total Fair Value Measurements | | $ | 173 | | | $ | — | | | $ | 110 | | | $ | 63 | |
Level 3 inputs are unobservable (i.e., supported by little or no market activity). Level 3 inputs include management’s own judgment about the assumptions that market participants would use in pricing the asset or liability (including assumptions about risk). The return on assets for Level 3 plan assets are immaterial for all periods presented
11. Accumulated Other Comprehensive Loss
The components of accumulated other comprehensive loss are as follows (in millions):
| | | | | | | | | | | | | | | | |
| | | | | Derivative | | | Employee | | | | |
| | Currency | | | Financial | | | Benefit | | | | |
| | Translation | | | Instruments, | | | Plans, | | | | |
| | Adjustments | | | Net of Tax | | | Net of Tax | | | Total | |
Balance at December 31, 2021 | | $ | (1,515 | ) | | $ | 7 | | | $ | (38 | ) | | $ | (1,546 | ) |
Accumulated other comprehensive income
(loss) before reclassifications | | | (30 | ) | | | (17 | ) | | | (4 | ) | | | (51 | ) |
Amounts reclassified from accumulated other
comprehensive income (loss) | | | — | | | | 6 | | | | (2 | ) | | | 4 | |
Balance at December 31, 2022 | | $ | (1,545 | ) | | $ | (4 | ) | | $ | (44 | ) | | $ | (1,593 | ) |
Accumulated other comprehensive income
(loss) before reclassifications | | | 101 | | | | (21 | ) | | | (13 | ) | | | 67 | |
Amounts reclassified from accumulated other
comprehensive income (loss) | | | 12 | | | | 20 | | | | 1 | | | | 33 | |
Balance at December 31, 2023 | | $ | (1,432 | ) | | $ | (5 | ) | | $ | (56 | ) | | $ | (1,493 | ) |
Accumulated other comprehensive income
(loss) before reclassifications | | | (138 | ) | | | (12 | ) | | | 10 | | | | (140 | ) |
Amounts reclassified from accumulated other
comprehensive income (loss) | | | 1 | | | | 7 | | | | — | | | | 8 | |
Balance at December 31, 2024 | | $ | (1,569 | ) | | $ | (10 | ) | | $ | (46 | ) | | $ | (1,625 | ) |
The components of amounts reclassified from accumulated other comprehensive income (loss) are as follows (in millions):
| | | | | | | | | | | | | | | | | | | | | | | | | | | | | | | | | | | | | | | | | | | | | | | | |
| | Year Ended December 31, | |
| | 2024 | | | 2023 | | | 2022 | |
| | Currency | | | Derivative | | | Employee | | | | | | Currency | | | Derivative | | | Employee | | | | | | Currency | | | Derivative | | | Employee | | | | |
| | Translation | | | Financial | | | Benefit | | | | | | Translation | | | Financial | | | Benefit | | | | | | Translation | | | Financial | | | Benefit | | | | |
| | Adjustments | | | Instruments | | | Plans | | | Total | | | Adjustments | | | Instruments | | | Plans | | | Total | | | Adjustments | | | Instruments | | | Plans | | | Total | |
Revenue | | $ | — | | | $ | 5 | | | $ | — | | | $ | 5 | | | $ | — | | | $ | 11 | | | $ | — | | | $ | 11 | | | $ | — | | | $ | 3 | | | $ | — | | | $ | 3 | |
Cost of revenue | | | 1 | | | | 4 | | | | — | | | | 5 | | | | 12 | | | | 9 | | | | — | | | | 21 | | | | — | | | | 6 | | | | — | | | | 6 | |
Selling, general,
and administrative | | | — | | | | — | | | | — | | | | — | | | | — | | | | — | | | | 1 | | | | 1 | | | | — | | | | — | | | | (2 | ) | | | (2 | ) |
Tax effect | | | — | | | | (2 | ) | | | — | | | | (2 | ) | | | — | | | | — | | | | — | | | | — | | | | — | | | | (3 | ) | | | — | | | | (3 | ) |
| | $ | 1 | | | $ | 7 | | | $ | — | | | $ | 8 | | | $ | 12 | | | $ | 20 | | | $ | 1 | | | $ | 33 | | | $ | — | | | $ | 6 | | | $ | (2 | ) | | $ | 4 | |
The Company’s reporting currency is the U.S. dollar. A majority of the Company’s international entities in which there is a substantial investment have the local currency as their functional currency. As a result, currency translation adjustments resulting from the process of translating the entities’ financial statements into the reporting currency are reported in other comprehensive income or (loss). The Company recorded other comprehensive (loss) income of $(137) million, $113 million and $(30) million for the years ended December 31, 2024, 2023 and 2022, respectively.
The effect of changes in the fair values of derivatives designated as cash flow hedges are accumulated in other comprehensive income (loss), net of tax, until the underlying transactions are realized. The movement in other comprehensive income (loss) from period to period will be the result of the combination of changes in fair value of open derivatives and the outflow of other comprehensive income (loss) related to cumulative changes in the fair value of derivatives that have settled in the current period. The accumulated effect was other comprehensive income (loss) of $(5) million (net of $(2) million tax), $(1) million (net of $3 million tax), and $(11) million (net of $(3) million tax) for the years ended December 31, 2024, 2023 and 2022.
12. Commitments and Contingencies
Our business is governed by laws and regulations, including those directed to the oilfield service industry, promulgated by U.S. federal and state governments and regulatory agencies, as well as international governmental authorities in the many countries in which we conduct business. In the United States, these governmental authorities include the U.S. Department of Labor, the Occupational Safety and Health Administration, the Environmental Protection Agency, the Bureau of Land Management, the Department of Treasury, Office of Foreign Assets Control, state environmental agencies and many others. We are unaware of any material liabilities in connection with our compliance with such laws. New laws, regulations and enforcement policies may result in additional, presently unquantifiable, or unknown, costs or liabilities.
From time to time, the Company is involved in various claims, regulatory agency audits, investigations and legal actions involving a variety of matters. The Company maintains insurance that covers claims such as third-party personal injury or property damage claims arising from risks associated with the business activities of the Company, including premises liability, product liability, marine risk, property damage, and other insurable losses. The Company carries substantial insurance to cover insurable risks above a self-insured retention. The Company also from time to time may be a party to claims, threatened and actual litigation, arbitration, and internal investigations of potential regulatory and compliance matters which may arise from the Company’s business activities, some of which may not involve insured claims. The Company believes, and the Company’s experience has been, that such insurance has been sufficient to cover its material risks from operations.
The regulatory matters and disputes which the Company faces may involve private parties and/or government authorities who may assert a broad variety of potential claims against the Company, such as employment law claims, collective actions or class action claims, intellectual property claims (such as alleged patent infringement, and/or misappropriation of trade secrets by the Company), premises liability claims, environmental claims, product liability claims, warranty claims, personal injury claims arising from exposure to or use of allegedly defective products or from activities of the Company, alleged regulatory violations, alleged violations of anti-corruption and anti-bribery, trade, customs or other laws and other commercial and/or regulatory claims seeking recovery for alleged actual or exemplary damages or fines and penalties. Such claims involve various theories of liability which may include negligence, breach of contract, strict liability, product liability, and others. For some of these contingent claims and potential liabilities, the Company’s insurance coverage may not apply, or exclusions to coverage or legal impediments may apply. In such instances, settlement or other resolution of such claims, individually or collectively, could have a material financial or reputational impact on the Company. As of December 31, 2024, in the ordinary course of business, the Company recorded reserves in an amount believed to be sufficient, given the estimated range of potential outcomes, for contingent liabilities believed to be probable. These reserves include costs currently and reasonably estimated to be incurred for reclamation of a closed barite mine and product liability claims, as well as other circumstances involving material claims. The Company periodically assesses the potential for losses above the amounts accrued as well as potential losses for matters that are believed to be not probable, but which are reasonably possible. The Company sets accruals in accordance with GAAP based on its best judgment about the probable results of disputed claims, regulatory enforcement actions, tax and other governmental audits, and other contingencies.
The litigation process and the outcome of regulatory oversight is inherently uncertain, and our best judgment concerning the probable outcome of litigation or regulatory enforcement matters may prove to be incorrect. No assurance can be given as to the outcome of these matters. The total potential loss on these matters cannot be determined; however, in our opinion, any ultimate liability, to the extent not otherwise provided for, should not materially affect our financial position, cash flows or results of operations. These estimated liabilities are based on the Company’s assessment of the nature of these matters, their progress toward resolution, the advice of legal counsel and outside experts as well as management’s experience. Because of the uncertainty and risk inherent to litigation, arbitration, audits, governmental investigations, enforcement actions, and similar matters, the Company’s actual liabilities incurred may materially exceed our estimated liabilities and reserves, which could have a material financial or reputational impact on the Company.
In many instances, the Company’s products and services embody or incorporate trade secrets or patented inventions. From time to time, we are engaged in disputes concerning protection of the Company’s trade secrets and confidential information, patents, and other intellectual property rights. Such disputes frequently involve complex, factual, technical and/or legal issues which result in high costs to adjudicate our rights and for which it may be difficult to predict the ultimate outcome. At any given time, the Company may be a plaintiff or defendant in disputes involving disputed intellectual property rights.
The Company is currently pursuing litigation against several companies involving royalties due under licenses for technology related to drill bits. This technology resulted in a portfolio of patents related to leaching technology, a revolutionary technology owned by the Company that improves the performance of drill bits and other products utilizing certain synthetic diamond parts. The Company previously sued several drill bit manufacturers for patent infringement and those lawsuits were resolved by a series of licensing agreements with various drill bit manufacturers. To settle and end litigation or to avoid litigation, the licensees were provided access to the portfolio of leaching patents owned by the Company in exchange for a royalty payment, as defined in each license agreement. The companies agreed to pay the royalties for the right to use the portfolio of patents, whether they used some, all or none of the specific patented claims in any particular patent. The license agreements provide that they terminate on the date of the last to expire of the patents in the licensed portfolio. Having obtained the benefit of these licenses for more than a decade, all of the drill bit manufacturer licensees unilaterally stopped making royalty payments even though all of the patents in the portfolio have not expired. These companies have asserted, among other reasons, that they are entitled to stop making these payments because they claim to not manufacture products covered by the unexpired patents. Some of these companies stopped making payments after the expiration of what are allegedly the patents in the portfolio that they elected to use. Others paid for some period of time after that date but have since stopped making payments. The Company has sued asserting that failure to pay the royalties is a breach of the license agreements at issue. The Company is in litigation with most of the licensees seeking a judicial determination that it is entitled to be paid royalties pursuant to the terms of the licenses. The licensees have responded with a number of alleged defenses and requests for declaratory judgment all focused on avoiding the payments called for under the licenses. The parties’ legal filings to date can be found in two cases currently pending in the United States District Court for the Southern District of Texas: Grant Prideco, Inc., et al. v. Schlumberger Tech. Corp., et al., No. 4:23-cv-00730; and Halliburton Energy Serv, Inc. v. Grant Prideco, Inc., et al., No. 4:23-cv-01789. While the Company strongly believes that the royalties for which it has sued are due and owing pursuant to the terms of the licensing agreements, there is inherent risk with the related litigation and the Company makes no assurances as to the outcome of such litigation. See Note 14 to the Consolidated Financial Statements for discussion of the financial impact of royalties.
The protection of intellectual property is important to the Company’s performance, and as such, an adverse result in disputes related to our intellectual property could result in materially adverse financial consequences such as a decline in sales of products protected by patents, which could materially and adversely impact our financial performance.
From time to time purchasers of our products and services or members of our supply chain or sales chain become involved in litigation, governmental investigations, internal investigations, political or other enforcement matters, or other dispute proceedings. In such circumstances, such proceedings may adversely impact the ability of purchasers of our products, entities providing financial support to such consumers or entities in the supply chain or sales chain to timely perform their business plans or to timely perform under agreements with us. We may, from time to time, become involved in these proceedings at substantial cost to the Company.
The Company is exposed to customs and trade regulation risk, including tariffs, in the countries in which we do business and countries from which, or to which, we import or export goods. Such trade regulations can be complex and conflicting, as different countries use trade regulation to promote conflicting policy objectives. Compliance with these laws and regulations presents challenges which could result in future liabilities (for example, alleged violation of those laws or when laws conflict between countries). The Company may face increased tariffs and trade costs, loss of revenue, loss of customers, fines, penalties, increased costs, the need for renegotiation of agreements, and other business disruptions. Trade regulations, supply chain regulations, and other regulatory compliance in different jurisdictions may conflict with one another or with contractual terms with our various counterparties. In such circumstances, our compliance with U.S. laws and regulations may subject us to risk of fines, penalties, or contractual liability in other jurisdictions. Our efforts to actively manage such risks may not always be successful, and this could lead to negative impacts on revenue or earnings. In addition, trade regulations, export controls, and other laws adversely impact our ability to do business in certain countries, e.g., Iran, Syria, Russia, China and Venezuela.
In response to additional sanctions enacted by governments in the European Union, the United States, the United Kingdom, Switzerland, and other countries regarding the armed conflict in Ukraine, we ceased new investments in Russia and have curtailed our activities there. During the third quarter of 2022, we sold our business in Belarus and entered into an agreement to sell our business in Russia. The sale is subject to various government approvals in Russia, the U.S. and E.U. The Russian government continues to enact new laws impacting the exit of western companies from Russia, including some instances of expropriation of western businesses. We may incur additional costs as a result of conditions in Russia if we are unable to complete the transaction to sell our Russian business on the terms of the agreements.
Geopolitical events continue to pose supply chain and other business risks. The Company’s ability to manufacture equipment and perform services could be impaired by such disruptions and the Company could be exposed to liabilities resulting from additional interruption or delay in its ability to perform due to factors such as war, materials shortages, inflationary pressures, limited manpower or otherwise. We may face loss of workers, labor shortages, litigation, fines and/or other adverse consequences resulting from ongoing labor impacts. The combined impact of supply chain and labor market disruptions along with continuing inflationary impacts, as well as monetary and regulatory policies could have material adverse impacts on our financial results.
Disputes may arise from a variety of causes, including weather impacts, cyber, geopolitical, regulatory or other business risks, sometimes these risks may trigger application of force majeure and other contract provisions concerning allocation of responsibility among customers, the Company, and suppliers, resulting in material added cost and/or litigation. Our customers may attempt to cancel or delay projects, cancel contracts, or may invoke force majeure clauses. Our customers may also seek to delay or may default on their payments to us. As a result, the Company may be exposed to additional costs, liabilities and risks which could materially adversely impact our financial performance and results. These potential operational and service delays could result in contractual or other legal claims from our customers. At this time, it is not possible to quantify all these risks, but the combination of these factors could have a material impact on our financial results.
13. Common Stock
NOV has authorized 1 billion shares of $0.01 par value common stock. The Company also has authorized 10 million shares of $0.01 par value preferred stock, none of which is issued or outstanding.
Cash dividends aggregated $108 million and $79 million for the years ended December 31, 2024 and 2023, respectively. The declaration and payment of future dividends is at the discretion of the Company’s Board of Directors and will be dependent upon the Company’s results of operations, financial condition, capital requirements and other factors deemed relevant by the Company’s Board of Directors.
Total compensation cost that has been charged against income for all share-based compensation arrangements was $70 million, $66 million and $67 million for 2024, 2023 and 2022, respectively. The total income tax benefit recognized before consideration of valuation allowance in the consolidated statements of income for all share-based compensation arrangements was $2 million, $7 million and $3 million for 2024, 2023 and 2022, respectively.
The Company’s stock-based compensation plan, known as the NOV Inc. Long-Term Incentive Plan (the “NOV Plan”), was approved by shareholders on May 11, 2018 and amended and restated on May 24, 2022. The NOV Plan provides for the granting of stock options, restricted stock, restricted stock units, performance awards, phantom shares, stock appreciation rights, stock payments and substitute awards. The number of shares authorized under the NOV Plan is 55.7 million. The NOV Plan is also subject to a fungible ratio concept, such that the issuance of stock options and stock appreciation rights reduces the number of available shares under the NOV Plan on a 1-for-1 basis, and the issuance of other awards reduces the number of available shares under the NOV Plan on a 1.5-for-1 basis. At December 31, 2024, approximately 7.8 million shares remained available for future grants under the NOV Plan.
The Company also has outstanding awards under its other stock-based compensation plan known as the National Oilwell Varco, Inc. Long-Term Incentive Plan (the “Plan”), however the Company is no longer granting new awards under the Plan. The Plan provides for the granting of stock options, performance-based share awards, restricted stock, phantom shares, stock payments and stock appreciation rights (“SARs”). The number of shares authorized under the Plan is 69.4 million. The Plan is subject to a fungible ratio concept, such that the issuance of stock options and SARs reduces the number of available shares under the Plan on a 1-for-1 basis, and the issuance of other awards reduces the number of available shares under the Plan on a 3-for-1 basis.
Stock Options
Options granted under our stock-based compensation plans generally vest over a three-year period starting one year from the date of grant and expire ten years from the date of grant. The purchase price of options granted may not be less than the closing market price of NOV common stock on the date of grant.
Stock option information summarized below includes amounts for the NOV Plan and the Plan and stock plans of acquired companies. Options outstanding at December 31, 2024 under the stock option plans have exercise prices between $15.00 and $54.74 per share, and expire at various dates from February 26, 2025 to February 7, 2034.
The following summarizes options activity:
| | | | | | | | | | | | | | | | | | | | | | | | |
| | Year Ended December 31, | |
| | 2024 | | | 2023 | | | 2022 | |
| | Number | | | Average | | | Number | | | Average | | | Number | | | Average | |
| | of | | | Exercise | | | of | | | Exercise | | | of | | | Exercise | |
| | Shares | | | Price | | | Shares | | | Price | | | Shares | | | Price | |
Shares under option at beginning
of year | | | 19,975,103 | | | $ | 36.25 | | | | 21,080,388 | | | $ | 38.68 | | | | 21,276,961 | | | $ | 42.09 | |
Granted | | | 1,110,478 | | | | 17.52 | | | | 1,014,002 | | | | 21.76 | | | | 1,492,020 | | | | 16.73 | |
Forfeited | | | (2,743,698 | ) | | | 56.16 | | | | (1,908,768 | ) | | | 57.61 | | | | (1,574,642 | ) | | | 65.44 | |
Exercised | | | (206,386 | ) | | | 16.87 | | | | (210,519 | ) | | | 16.68 | | | | (113,951 | ) | | | 17.77 | |
Shares under option at end of year | | | 18,135,497 | | | $ | 32.31 | | | | 19,975,103 | | | $ | 36.25 | | | | 21,080,388 | | | $ | 38.68 | |
Exercisable at end of year | | | 15,911,560 | | | $ | 34.23 | | | | 17,437,459 | | | $ | 38.85 | | | | 17,988,842 | | | $ | 42.46 | |
The following summarizes information about stock options outstanding at December 31, 2024:
| | | | | | | | | | | | | | | | | | | | |
| | Weighted-Avg | | | Options Outstanding | | | Options Exercisable | |
| | Remaining | | | | | | Weighted-Avg | | | | | | Weighted-Avg | |
Range of Exercise Price | | Contractual Life | | | Shares | | | Exercise Price | | | Shares | | | Exercise Price | |
$15.00 - $30.00 | | | 5.60 | | | | 8,906,198 | | | $ | 21.24 | | | | 6,682,261 | | | $ | 22.13 | |
$30.01 - $50.00 | | | 1.97 | | | | 5,856,046 | | | | 36.22 | | | | 5,856,046 | | | | 36.22 | |
$50.01 - $54.74 | | | 0.15 | | | | 3,373,253 | | | | 54.74 | | | | 3,373,253 | | | | 54.74 | |
Total | | | 3.41 | | | | 18,135,497 | | | $ | 32.31 | | | | 15,911,560 | | | $ | 34.23 | |
The weighted-average remaining contractual term for outstanding and exercisable stock options at December 31, 2024, was 3.41 years and 2.72 years, respectively. The aggregate intrinsic value of outstanding options as of December 31, 2024, was $0.
The weighted-average fair value of options granted during 2024, 2023 and 2022, was approximately $7.90, $9.75, and $6.28 per share, respectively, as determined using the Black-Scholes option-pricing model. The total intrinsic value of options exercised was $1 million during 2024 and 2023.
The determination of fair value of share-based payment awards on the date of grant using an option-pricing model is affected by our stock price as well as assumptions regarding a number of highly complex and subjective variables. These variables include, but are not limited to, the expected stock price volatility over the term of the awards, and actual and projected employee stock option exercise activity. The use of the Black Scholes model requires the use of actual employee exercise activity data and the use of a number of complex assumptions including expected volatility, risk-free interest rate, expected dividends and expected term.
| | | | | | | | | | | | |
| | Year Ended December 31, | |
Valuation Assumptions: | | 2024 | | | 2023 | | | 2022 | |
Expected volatility | | | 46.8 | % | | | 45.7 | % | | | 43.6 | % |
Risk-free interest rate | | | 4.0 | % | | | 4.1 | % | | | 1.9 | % |
Expected dividend yield | | | 1.1 | % | | | 0.9 | % | | | 1.2 | % |
Expected term (in years) | | | 6.0 | | | | 5.8 | | | | 5.4 | |
The Company used the actual volatility for traded options for the past 10 years prior to option date as the expected volatility assumption required in the Black Scholes model.
The risk-free interest rate assumption is based upon observed interest rates appropriate for the term of our employee stock options. The dividend yield assumption is based on the history and expectation of dividend payouts. The estimated expected term is based on actual employee exercise activity for the past ten years. Forfeitures are accounted for as they occur.
At December 31, 2024, total unrecognized compensation cost related to nonvested stock options was $9 million. This cost is expected to be recognized over a weighted-average period of three years. The total fair value of stock options vested in 2024, 2023 and 2022 was approximately $9 million, $9 million and $10 million, respectively. Cash received from option exercises for 2024 was $3 million. Cash received from option exercises was $4 million and $2 million in 2023 and 2022, respectively. The actual tax benefit (expense) realized for the tax deductions from share-based compensation was zero in 2024, 2023, and 2022.
Stock Appreciation Rights
On December 20, 2017, the Company made a tender offer to exchange SARs issued to certain employees on February 24, 2016 (“2016 SARs”) for cash, amended SARs, and new stock options. The transaction was structured to provide the employees an equal long-term incentive compensation value, while alleviating volatility in the Company’s earnings caused by required mark-to-market accounting on outstanding SARS. Of the outstanding 2016 SARs, 94.75% were exchanged resulting in a total cash payment of $14 million and granting of 3,613,707 new stock options on the exchange date with an exercise price of $34.32 and a fair value of $8.47, with vesting matched to the exchanged 2016 SARs.
The following summary presents information regarding outstanding SARs:
| | | | | | | | | | | | | | | | |
| | Year Ended December 31, | |
| | 2024 | | | 2023 | |
| | Number | | | Average | | | Number | | | Average | |
| | of | | | Exercise | | | of | | | Exercise | |
| | Shares | | | Price | | | Shares | | | Price | |
Shares under SARs at beginning of year | | | 1,056,805 | | | $ | 28.37 | | | | 1,105,106 | | | $ | 28.39 | |
Granted | | | — | | | | — | | | | — | | | | — | |
Forfeited | | | (35,248 | ) | | | 28.64 | | | | (48,301 | ) | | | 28.83 | |
Exercised | | | — | | | | — | | | | — | | | | — | |
Shares under SARs at end of year | | | 1,021,557 | | | $ | 28.36 | | | | 1,056,805 | | | $ | 28.37 | |
Exercisable at end of year | | | 1,021,557 | | | $ | 28.36 | | | | 1,056,805 | | | $ | 28.37 | |
The Company recognized no expense related to SARs in 2024, 2023, or 2022. There was no liability for cash-settled SARs at December 31, 2024.
Restricted Shares
The Company issues restricted stock awards and restricted stock units to officers and key employees in addition to stock options. On February 6, 2024, under the NOV Plan, the Company granted 1,110,478 stock options with a fair value of $7.90 per option and an exercise price of $17.52 per share; 2,571,356 restricted stock units with a fair value of $17.52 per share; and performance share awards (PSAs) to senior management employees with potential payouts varying from zero to 1,061,644 shares. The stock options vest over a three-year period from the grant date. The restricted stock units vest in three equal annual installments commencing on the first anniversary of the grant date. The 2024 PSAs can be earned based on performance against two established goals over a three-year period: 85% with a TSR (total shareholder return) goal and 15% with an internal NVA (“NOV Value Added”, a return on capital metric) goal. TSR performance is determined by comparing the Company’s TSR with the TSR of the members of the Philadelphia Stock Exchange’s Oil Services Sector Index (OSX) for the three-year performance period. The TSR portion of the performance share awards is subject to a vesting cap equal to 100% of Target Level if the Company’s absolute TSR is negative, regardless of relative TSR results. Conversely, if the Company’s absolute TSR is greater than 15% annualized over the three-year performance period the payout amount shall not be less than 50% of Target Level, regardless of relative TSR results. The NVA goal is based on the Company’s improvement in NVA from the beginning of the performance period until the end of the performance period. NVA is calculated as an amount equal to the Company’s (a) gross cash earnings less (b) average gross operating assets times an amount equal to a required return on assets, with certain adjustments.
On May 15, 2024 the Company granted 85,950 restricted stock units with a fair value of $18.85 per share. The awards were granted to non-employee members of the board of directors and vest on the first anniversary of the grant date.
On May 13, 2024, the Company granted 2,667 restricted stock units with a fair value of $18.76 per share. On May 30, 2024, the Company granted 13,639 restricted stock units with a fair value of $18.33 per share. The awards were granted to employees and vest in three equal annual installments commencing on the first anniversary of grant date.
The following summary presents information regarding outstanding restricted shares:
| | | | | | | | | | | | | | | | | | | | | | | |
| Year Ended December 31, | |
| 2024 | | | 2023 | | | 2022 | |
| | | | Weighted- | | | | | | Weighted- | | | | | | Weighted- | |
| Number | | | Average | | | Number | | | Average | | | Number | | | Average | |
| of | | | Grant Date | | | of | | | Grant Date | | | of | | | Grant Date | |
| Units | | | Fair Value | | | Units | | | Fair Value | | | Units | | | Fair Value | |
Nonvested at beginning of year | | 6,615,478 | | | $ | 19.86 | | | | 7,188,183 | | | $ | 18.30 | | | | 6,936,574 | | | $ | 21.32 | |
Granted | | 3,204,434 | | | | 17.96 | | | | 2,792,465 | | | | 22.70 | | | | 3,509,425 | | | | 17.67 | |
Vested | | (3,068,811 | ) | | | 17.46 | | | | (3,045,126 | ) | | | 21.77 | | | | (2,863,385 | ) | | | 17.11 | |
Forfeited | | (312,828 | ) | | | 20.29 | | | | (320,044 | ) | | | 23.89 | | | | (394,431 | ) | | | 26.00 | |
Nonvested at end of year | | 6,438,273 | | | $ | 19.76 | | | | 6,615,478 | | | $ | 19.86 | | | | 7,188,183 | | | $ | 18.30 | |
At December 31, 2024, there was approximately $64 million of unrecognized compensation cost related to nonvested restricted stock awards and restricted stock units, which is expected to be recognized over a weighted-average period of two years.
14. Revenue
Disaggregation of Revenue
The following tables disaggregate our revenue by destinations and revenue streams, as we believe it best depicts how the nature, amount, timing and uncertainty of our revenue and cash flows are affected by economic factors (in millions).
In the tables below, North America includes only the U.S. and Canada:
| | | | | | | | | | | | | | | | |
| | Year Ended December 31, 2024 | |
| | Energy Products | | | Energy | | | | | | | |
| | and Solutions | | | Equipment | | | Eliminations | | | Total | |
North America | | $ | 2,105 | | | $ | 1,201 | | | $ | — | | | $ | 3,306 | |
International | | | 1,935 | | | | 3,629 | | | | — | | | | 5,564 | |
Intersegment revenue | | | 90 | | | | 58 | | | | (148 | ) | | | — | |
| | $ | 4,130 | | | $ | 4,888 | | | $ | (148 | ) | | $ | 8,870 | |
| | | | | | | | | | | | |
Land | | $ | 3,088 | | | $ | 1,800 | | | $ | — | | | $ | 4,888 | |
Offshore | | | 952 | | | | 3,030 | | | | — | | | | 3,982 | |
Intersegment revenue | | | 90 | | | | 58 | | | | (148 | ) | | | — | |
| | $ | 4,130 | | | $ | 4,888 | | | $ | (148 | ) | | $ | 8,870 | |
| | | | | | | | | | | | | | | | |
| | Year Ended December 31, 2023 | |
| | Energy Products | | | Energy | | | | | | | |
| | and Solutions | | | Equipment | | | Eliminations | | | Total | |
North America | | $ | 2,019 | | | $ | 1,237 | | | $ | — | | | $ | 3,256 | |
International | | | 1,954 | | | | 3,373 | | | | — | | | | 5,327 | |
Intersegment revenue | | | 104 | | | | 59 | | | | (163 | ) | | | — | |
| | $ | 4,077 | | | $ | 4,669 | | | $ | (163 | ) | | $ | 8,583 | |
| | | | | | | | | | | | |
Land | | $ | 2,921 | | | $ | 1,864 | | | $ | — | | | $ | 4,785 | |
Offshore | | | 1,052 | | | | 2,746 | | | | — | | | | 3,798 | |
Intersegment revenue | | | 104 | | | | 59 | | | | (163 | ) | | | — | |
| | $ | 4,077 | | | $ | 4,669 | | | $ | (163 | ) | | $ | 8,583 | |
| | | | | | | | | | | | | | | | |
| | Year Ended December 31, 2022 | |
| | Energy Products | | | Energy | | | | | | | |
| | and Solutions | | | Equipment | | | Eliminations | | | Total | |
North America | | $ | 1,845 | | | $ | 1,034 | | | $ | — | | | $ | 2,879 | |
International | | | 1,629 | | | | 2,729 | | | | — | | | | 4,358 | |
Eliminations | | | 63 | | | | 56 | | | | (119 | ) | | | — | |
| | $ | 3,537 | | | $ | 3,819 | | | $ | (119 | ) | | $ | 7,237 | |
| | | | | | | | | | | | |
Land | | $ | 2,620 | | | $ | 1,527 | | | $ | — | | | $ | 4,147 | |
Offshore | | | 854 | | | | 2,236 | | | | — | | | | 3,090 | |
Eliminations | | | 63 | | | | 56 | | | | (119 | ) | | | — | |
| | $ | 3,537 | | | $ | 3,819 | | | $ | (119 | ) | | $ | 7,237 | |
In the table below, the revenue streams of the Energy Products and Services segment are categorized as services and rentals, sales of shorter-lived capital equipment, and sales of consumable products. The revenue streams of Energy Equipment are categorized as long-lived capital equipment sales and aftermarket sales and services.
| | | | | | | | | | | |
| Year Ended December 31, | |
| 2024 | | | 2023 | | | 2022 | |
Energy Products and Services: | | | | | | | | |
Services & rental | $ | 1,996 | | | $ | 1,959 | | | $ | 1,740 | |
Capital equipment | | 1,238 | | | | 1,336 | | | | 1,148 | |
Product sales | | 806 | | | | 678 | | | | 586 | |
Intersegment revenue | | 90 | | | | 104 | | | | 63 | |
Total | | 4,130 | | | | 4,077 | | | | 3,537 | |
| | | | | | | | |
Energy Equipment: | | | | | | | | |
Capital equipment | | 2,625 | | | | 2,556 | | | | 2,173 | |
Aftermarket | | 2,205 | | | | 2,054 | | | | 1,590 | |
Intersegment revenue | | 58 | | | | 59 | | | | 56 | |
Total | | 4,888 | | | | 4,669 | | | | 3,819 | |
| | | | | | | | |
Eliminations | | (148 | ) | | | (163 | ) | | | (119 | ) |
| | | | | | | | |
Total consolidated | $ | 8,870 | | | $ | 8,583 | | | $ | 7,237 | |
The Company did not have any customers with revenues greater than 10% of total revenue for the years ended December 31, 2024, 2023, or 2022.
Contract Assets and Liabilities
Contract assets include unbilled amounts when revenue recognized exceeds the amount billed to the customer under contracts where revenue is recognized over-time. There were no impairment losses recorded on contract assets for the years ending December 31, 2024, 2023 and 2022.
Contract liabilities consist of advance payments, billings in excess of revenue recognized and deferred revenue.
The changes in the carrying amount of contract assets and contract liabilities are as follows (in millions):
| | | | | | | | |
| | Contract
Assets | | | Contract
Liabilities | |
Balance at December 31, 2023 | | $ | 739 | | | $ | 532 | |
Billings | | | (1,553 | ) | | | 1,261 | |
Revenue recognized | | | 1,490 | | | | (1,247 | ) |
Currency translation adjustments and other | | | (99 | ) | | | (54 | ) |
Balance at December 31, 2024 | | $ | 577 | | | $ | 492 | |
Royalty Revenue
The Company recognizes royalty revenue due under various licenses for the Company’s intellectual property, including for technology related to drill bits. The Company recognized revenue for drill bit licenses of approximately $67 million, $78 million, and $80 million for years ended December 31, 2024, 2023, and 2022, respectively. The Company is currently pursuing litigation against certain non-paying licensees, which will impact our ability to collect the receivables timely. As such, revenue and the related receivables are recorded at a discount to reflect the delayed timing of future cash collections. As of December 31, 2024, the receivables of $121 million, net of allowances of $26 million for credit losses and $14 million for the remaining timing related discount, are included in Other Assets on the Consolidated Balance Sheets. These allowances do not impact the amount the Company is entitled to recover on its claims from the licensees in litigation. While we continue to believe it is probable the Company will collect all or substantially all of the consideration to which it is entitled pursuant to the terms of the licensing agreements, the Company will also continue to evaluate the credit quality of the receivables in accordance with the policy described in Note 2. See Note 12 to the Consolidated Financial Statements for discussion of the ongoing litigation.
Allowance for Credit Losses
The Company estimates its allowance for credit losses using information about past events, current conditions and risk characteristics of each customer, and reasonable and supportable forecasts relevant to assessing risk associated with the collectability of receivables and contract assets. See Note 2 to the Consolidated Financial Statements for discussion of credit risk. As of December 31, 2024, the allowance for credit losses totaled $67 million.
The changes in the carrying amount of the allowance for credit losses are as follows (in millions):
| | | | |
Balance at December 31, 2023 | | $ | 72 | |
Provision for expected credit losses | | | 40 | |
Recoveries collected | | | (13 | ) |
Reclass for long-term receivables | | | (17 | ) |
Writeoffs | | | (13 | ) |
Other | | | (2 | ) |
Balance at December 31, 2024 | | $ | 67 | |
15. Income Taxes
The domestic and foreign components of income before income taxes were as follows (in millions):
| | | | | | | | | | | | |
| | Year Ended December 31, | |
| | 2024 | | | 2023 | | | 2022 | |
Domestic | | $ | 413 | | | $ | 249 | | | $ | 113 | |
Foreign | | | 418 | | | | 363 | | | | 125 | |
| | $ | 831 | | | $ | 612 | | | $ | 238 | |
The components of the provision (benefit) for income taxes consisted of (in millions):
| | | | | | | | | | | | |
| | Year Ended December 31, | |
| | 2024 | | | 2023 | | | 2022 | |
Current: | | | | | | | | | |
Federal | | $ | 9 | | | $ | (4 | ) | | $ | (1 | ) |
State | | | 5 | | | | 2 | | | | — | |
Foreign | | | 133 | | | | 118 | | | | 86 | |
Total current income tax provision | | | 147 | | | | 116 | | | | 85 | |
Deferred: | | | | | | | | | |
Federal | | | 41 | | | | (252 | ) | | | 3 | |
State | | | 4 | | | | (47 | ) | | | — | |
Foreign | | | 4 | | | | (190 | ) | | | (5 | ) |
Total deferred income tax provision (benefit) | | | 49 | | | | (489 | ) | | | (2 | ) |
Total income tax provision (benefit) | | $ | 196 | | | $ | (373 | ) | | $ | 83 | |
The difference between the effective tax rate reflected in the provision (benefit) for income taxes and the U.S. federal statutory rate was as follows (in millions):
| | | | | | | | | | | | |
| | Year Ended December 31, | |
| | 2024 | | | 2023 | | | 2022 | |
Federal income tax at U.S. statutory rate | | $ | 175 | | | $ | 129 | | | $ | 50 | |
Foreign income tax rate differential | | | — | | | | 3 | | | | 1 | |
Change in deferred tax valuation allowance | | | (64 | ) | | | (564 | ) | | | 24 | |
Nondeductible expenses | | | 47 | | | | 18 | | | | 18 | |
Foreign inclusions and FDII, net of foreign tax credits | | | (36 | ) | | | 5 | | | | (4 | ) |
Change in uncertain tax positions | | | 3 | | | | 12 | | | | 4 | |
Withholding taxes | | | 47 | | | | 30 | | | | 31 | |
Income tax credits | | | (6 | ) | | | (8 | ) | | | (5 | ) |
Other | | | 30 | | | | 2 | | | | (36 | ) |
Total income tax provision (benefit) | | $ | 196 | | | $ | (373 | ) | | $ | 83 | |
The effective tax rate for the year ended December 31, 2024 was 23.6%, compared to (60.9%) for 2023. For the year ended 2024, the effective tax rate was negatively impacted by increased withholding taxes, nondeductible expenses, and losses in certain jurisdiction with no tax benefit, partially offset by a lower rate of U.S. tax on global intangible low-taxed income (GILTI) and the deduction of foreign-derived intangible income (FDII) and the release of valuation allowances in certain jurisdictions as a result of improving forecasted taxable income and availability of net operating losses. During 2023, the Company determined it was more likely than not that the Company would be able to realize the benefit of a substantial portion of the deferred tax assets in the United States and the majority of its other international jurisdictions. In reaching this determination, the Company considered the growing trend of profitability over the preceding three years, particularly in the United States, as well as expectations regarding the generation of future taxable income and the sources of future taxable income. As a result of this analysis, the Company recognized a discrete tax benefit related to the release of valuation allowances of $299 million in the United States and $186 million outside the United States. The effective tax rate was also favorably impacted by adjustments related to utilization of losses and tax credits for current and prior year tax returns, partially offset by current year losses in certain jurisdictions with no tax benefit.
As of December 31, 2024, the Company continues to maintain a valuation allowance of $266 million primarily related to foreign tax credit carryforwards in the United States and deferred tax assets in certain other jurisdictions due to several factors, including specific jurisdictions in which the Company does not project to generate sufficient future taxable income to realize all or a portion of its deferred tax assets specific to that jurisdiction; the specific nature and timing of future taxable income required to realize certain tax credit carryforwards, most notably U.S. foreign tax credits; and the timing of expiration of certain tax credit carryforwards.
Significant components of our deferred tax assets and liabilities were as follows (in millions):
| | | | | | | | |
|
| December 31, | |
|
| 2024 | | | 2023 | |
Deferred tax assets: | | | | | | |
Allowances and operating liabilities | | $ | 235 | | | $ | 264 | |
Net operating loss carryforwards | | | 186 | | | | 249 | |
Stock Compensation | | | 38 | | | | 48 | |
Tax credit carryforwards | | | 257 | | | | 301 | |
Other | | | 113 | | | | 121 | |
Valuation allowance | | | (266 | ) | | | (346 | ) |
Total deferred tax assets | | | 563 | | | | 637 | |
Deferred tax liabilities: | | | | | | |
Tax over book depreciation | | | 31 | | | | 43 | |
Capital leases | | | 68 | | | | 67 | |
Intangible assets | | | 44 | | | | 39 | |
Deferred income | | | 22 | | | | 24 | |
Accrued tax on unremitted earnings | | | 41 | | | | 38 | |
Other | | | — | | | | 8 | |
Total deferred tax liabilities | | | 206 | | | | 219 | |
Net deferred tax asset | | $ | 357 | | | $ | 418 | |
The valuation allowance decreased by $80 million during 2024. This decrease is comprised of $40 million due to the Company’s evaluation of the realizability of deferred tax assets based on future projections of taxable income, $24 million related to current year utilization of deferred tax assets, $11 million related to the expiration or forfeiture of deferred tax assets, and $5 million related to foreign currency exchange rate changes.
A reconciliation of the beginning and ending amount of unrecognized tax benefits is as follows (in millions):
| | | | | | | | | | | | |
| | 2024 | | | 2023 | | | 2022 | |
Unrecognized tax benefit at beginning of year | | $ | 67 | | | $ | 62 | | | $ | 60 | |
Gross increase for tax position in current year | | | — | | | | 18 | | | | — | |
Gross increase for tax positions in prior years | | | 4 | | | | 1 | | | | 9 | |
Gross decrease for tax positions in prior years | | | — | | | | (3 | ) | | | (1 | ) |
Cash Settlements | | | — | | | | (4 | ) | | | (1 | ) |
Lapse of statute of limitations | | | (3 | ) | | | (7 | ) | | | (5 | ) |
Unrecognized tax benefit at end of year | | $ | 68 | | | $ | 67 | | | $ | 62 | |
The balance of unrecognized tax benefits at December 31, 2024, 2023 and 2022 was $68 million, $67 million and $62 million, respectively. Accruals related to prior year domestic and foreign jurisdiction issues resulted in uncertain tax position increases of $4 million in 2024.
Substantially all of the unrecognized tax benefits, if ultimately realized, would be recorded as a reduction to income tax expense in the period realized. The Company does not anticipate any material change within the next twelve months due to settlements and conclusions of tax examinations. To the extent penalties and interest would be assessed on any underpayment of income tax, such accrued amounts have been classified as a component of income tax expense in the financial statements consistent with the Company’s policy. For the years ended December 31, 2024, 2023 and 2022, we recorded income tax expense of $4 million, $5 million and $8 million, respectively, for interest and penalty related to unrecognized tax benefits. As of December 31, 2024 and 2023, the Company had accrued $24 million and $20 million, respectively, of interest and penalty relating to unrecognized tax benefits.
The Company is subject to taxation in the United States as well as various states and foreign jurisdictions. The Company has significant operations in the United States, Norway, Saudi Arabia, Brazil, China, the United Kingdom, the Netherlands, Denmark, and Mexico. Tax years that remain subject to examination by major tax jurisdictions vary by legal entity, but are generally open in the U.S. for tax years ending after 2013 and outside the U.S. for tax years ending after 2018.
Net operating loss carryforwards by jurisdiction and expiration as of December 31, 2024 were as follows (in millions):
| | | | | | | | | | | | | | | | |
| | | | | | | | | | | | |
| | Federal | | | State | | | Foreign | | | Total | |
2025 - 2029 Expiration | | $ | — | | | $ | 101 | | | $ | 44 | | | $ | 145 | |
2030 - 2040 Expiration | | | 13 | | | | 191 | | | | 92 | | | | 296 | |
Unlimited Expiration | | | 54 | | | | — | | | | 443 | | | | 497 | |
Total Net Operating Loss (NOL) | | $ | 67 | | | $ | 292 | | | $ | 579 | | | $ | 938 | |
Tax Effected NOL | | $ | 14 | | | $ | 20 | | | $ | 152 | | | $ | 186 | |
The Company has $239 million of excess foreign tax credits in the United States as of December 31, 2024, of which $116 million, $92 million, $10 million, $10 million, $8 million and $3 million will expire in 2027, 2028, 2030, 2031, 2032 and 2033 respectively.
16. Business Segments and Geographic Areas
The Company is comprised of 17 business units to provide products and services to the energy industry. Each of the business units is managed by a business unit president, recognizes revenue, incurs expenses, and has discrete financial information readily available. The business units are aggregated into our 2 reportable segments, Energy Products and Services, and Energy Equipment, based on the products and services provided, customer base, and operating environment. The reportable segments are led by Segment Presidents, who are responsible for oversight of the business units’ strategy and performance. The Segment Presidents report directly to the CEO and provide monthly operating and financial updates.
The CEO has final authority over resource allocation decisions and performance assessment for the Company. Consequently, the CEO has been identified as the CODM. The CODM regularly receives information directly from the Segment Presidents as well as the business units. However, for decision-making purposes related to the assessment of performance and allocation of resources, the CODM uses financial information at the segment level. The CODM regularly reviews Operating Profit for each segment to assess performance and for resource allocation decisions in the annual budgeting process and in the quarterly performance review processes.
Energy Products and Services
The Company’s Energy Products and Services segment primarily designs, manufactures, rents, and sells products and equipment used in drilling, intervention, completion, and production activities. Products include drill bits, downhole tools, premium drill pipe, drilling fluids, managed pressure drilling, integral and weld-on connectors for conductor strings and surface casing, completion tools, and artificial lift systems. The segment also designs, manufactures, and delivers high-end composite pipe, tanks, and structures engineered to solve both corrosion and weight challenges in a wide variety of applications, including oil and gas, chemical, industrial, wastewater, fuel handling, marine and offshore, and rare earth mineral extraction.
In addition to product and equipment sales, the segment provides services, software, and digital solutions to improve drilling and completion operational performance. Services include tubular inspection and coating, solids control, waste management, and managed pressure drilling. Software and digital solutions offered include drilling and completion optimization and remote monitoring (via downhole and surface instrumentation), wired drill pipe services, software controls and applications, and data management and analytics services at the edge and in the cloud.
Energy Products and Services serves oil and gas companies, drilling contractors, oilfield service companies, oilfield equipment rental companies and developers of geothermal energy. Demand for the segment’s products and services primarily depends on the level of oilfield drilling activity by oil and gas companies, drilling contractors, and oilfield service companies. Demand for the segment’s composite solutions serving applications outside of oil and gas are driven by industrial activity, infrastructure spend, and population growth.
Energy Equipment
The Company’s Energy Equipment segment manufactures and supports the capital equipment and integrated systems needed for oil and gas exploration and production, both onshore and offshore, as well as for other marine-based, industrial and renewable energy markets.
The segment designs, manufactures, and integrates technologies for drilling and producing oil and gas wells. This includes equipment and technologies needed for drilling, including land rigs, offshore drilling equipment packages, drilling rig components, and software control systems that mechanize and automate the drilling process and rig functionality; hydraulic fracture stimulation, including pressure pumping trucks, blenders, sanders, hydration units, injection units, flowline, and manifolds; well intervention, including coiled tubing units, coiled tubing, and wireline units and tools; cementing products for pumping, mixing, transport, and storage; onshore production, including fluid processing, and surface transfer as well as progressive cavity pumps; offshore production, including integrated production systems and subsea production technologies; and aftermarket support of these technologies, providing spare parts, service, and repair.
Energy Equipment primarily serves contract drillers, oilfield service companies, and oil and gas companies. Demand for the segment’s products primarily depends on capital spending plans by drilling contractors, service companies, and oil and gas companies, and secondarily on the overall level of oilfield drilling, completions, and workover activity which drives demand for equipment, spare parts, service, and repair for the segment’s large installed base of equipment.
The segment also serves marine and offshore markets, where it designs and builds equipment for wind turbine installation and cable lay vessels, and offers heavy lift cranes and jacking systems; industrial markets, where the segment provides pumps and mixers for a wide breadth of industrial end markets; and other energy transition markets, where it is applying its gas processing expertise to provide solutions that aid in wind power development, hydrogen production and carbon sequestration.
The following table presents financial data by business segment (in millions):
| | | | | | | | | | | | | | | | | | | | | | | | | | | | | | | | | | | | | | | | | | | | | | | | |
| | Year Ended December 31, | |
| | 2024 | | | 2023 | | | 2022 | |
| | Energy Products and Services | | | Energy Equipment | | | Eliminations and corporate costs (1) | | | Total | | | Energy Products and Services | | | Energy Equipment | | | Eliminations and corporate costs (1) | | | Total | | | Energy Products and Services | | | Energy Equipment | | | Eliminations and corporate costs (1) | | | Total | |
Revenue from external customers | | $ | 4,040 | | | $ | 4,830 | | | $ | - | | | $ | 8,870 | | | $ | 3,973 | | | $ | 4,610 | | | $ | - | | | $ | 8,583 | | | $ | 3,474 | | | $ | 3,763 | | | $ | - | | | $ | 7,237 | |
Intersegment revenue | | | 90 | | | | 58 | | | | (148 | ) | | | - | | | | 104 | | | | 59 | | | | (163 | ) | | | - | | | | 63 | | | | 56 | | | | (119 | ) | | | - | |
Total revenue | | | 4,130 | | | | 4,888 | | | | (148 | ) | | | 8,870 | | | | 4,077 | | | | 4,669 | | | | (163 | ) | | | 8,583 | | | | 3,537 | | | | 3,819 | | | | (119 | ) | | | 7,237 | |
| | | | | | | | | | | | | | | | | | | | | | | | | | | | | | | | | | | | |
Less: | | | | | | | | | | | | | | | | | | | | | | | | | | | | | | | | | | | | |
Cost of revenue (2) | | | 2,934 | | | | 3,671 | | | | (62 | ) | | | 6,543 | | | | 2,870 | | | | 3,670 | | | | (67 | ) | | | 6,473 | | | | 2,537 | | | | 3,085 | | | | (48 | ) | | | 5,574 | |
Selling, general, and administrative (2) | | | 500 | | | | 494 | | | | 114 | | | | 1,108 | | | | 518 | | | | 521 | | | | 121 | | | | 1,160 | | | | 488 | | | | 482 | | | | 128 | | | | 1,098 | |
Depreciation and amortization | | | 221 | | | | 115 | | | | 7 | | | | 343 | | | | 183 | | | | 111 | | | | 8 | | | | 302 | | | | 179 | | | | 115 | | | | 7 | | | | 301 | |
(Gain)/loss on sales of fixed assets | | | - | | | | - | | | | - | | | | - | | | | (1 | ) | | | (4 | ) | | | 2 | | | | (3 | ) | | | 2 | | | | - | | | | (2 | ) | | | - | |
Operating profit | | $ | 475 | | | $ | 608 | | | $ | (207 | ) | | $ | 876 | | | $ | 507 | | | $ | 371 | | | $ | (227 | ) | | $ | 651 | | | $ | 331 | | | $ | 137 | | | $ | (204 | ) | | $ | 264 | |
| | | | | | | | | | | | | | | | | | | | | | | | | | | | | | | | | | | | |
Reconciliation to income before income taxes: | | | | | | | | | | | | | | | | | | | | | | | | | | | | | | | | | | | | |
Interest and financial costs | | | - | | | | - | | | | (91 | ) | | | (91 | ) | | | - | | | | - | | | | (88 | ) | | | (88 | ) | | | - | | | | - | | | | (78 | ) | | | (78 | ) |
Interest income | | | - | | | | - | | | | 38 | | | | 38 | | | | - | | | | - | | | | 28 | | | | 28 | | | | - | | | | - | | | | 19 | | | | 19 | |
Equity income (loss) in unconsolidated affiliates | | | 33 | | | | 3 | | | | - | | | | 36 | | | | 111 | | | | 8 | | | | - | | | | 119 | | | | 71 | | | | (3 | ) | | | - | | | | 68 | |
Other expenses, net | | | - | | | | - | | | | (28 | ) | | | (28 | ) | | | - | | | | - | | | | (98 | ) | | | (98 | ) | | | - | | | | - | | | | (35 | ) | | | (35 | ) |
Income before income taxes | | $ | 508 | | | $ | 611 | | | $ | (288 | ) | | $ | 831 | | | $ | 618 | | | $ | 379 | | | $ | (385 | ) | | $ | 612 | | | $ | 402 | | | $ | 134 | | | $ | (298 | ) | | $ | 238 | |
| | | | | | | | | | | | | | | | | | | | | | | | | | | | | | | | | | | | |
Other segment information: | | | | | | | | | | | | | | | | | | | | | | | | | | | | | | | | | | | | |
Capital expenditures | | $ | 255 | | | $ | 86 | | | $ | 10 | | | $ | 351 | | | $ | 198 | | | $ | 68 | | | $ | 17 | | | $ | 283 | | | $ | 131 | | | $ | 71 | | | $ | 12 | | | $ | 214 | |
Investment in unconsolidated affiliates | | $ | 158 | | | $ | 5 | | | $ | - | | | $ | 163 | | | $ | 211 | | | $ | - | | | $ | - | | | $ | 211 | | | $ | 87 | | | $ | 30 | | | $ | - | | | $ | 117 | |
Total assets | | $ | 5,054 | | | $ | 4,895 | | | $ | 1,412 | | | $ | 11,361 | | | $ | 4,777 | | | $ | 5,509 | | | $ | 1,008 | | | $ | 11,294 | | | $ | 4,126 | | | $ | 4,745 | | | $ | 1,264 | | | $ | 10,135 | |
(1)Sales from one segment to another generally are priced at estimated equivalent commercial selling prices; however, segments originating an external sale are credited with the full profit to the Company. Eliminations and corporate costs include intercompany transactions conducted between the three reporting segments that are eliminated in consolidation, as well as corporate costs not allocated to the segments. Intercompany transactions within each reporting segment are eliminated within each reporting segment. Also included in the eliminations and corporate costs column are capital expenditures and total assets related to corporate. Corporate assets consist primarily of cash and fixed assets.
(2)Included in cost of revenue and selling, general, and administrative expenses are pre-tax charges (credits) within Other Items of $(109) million, $51 million, and $114 million, for the years ended December 31, 2024, 2023, and 2022, respectively. Other Items included in cost of revenue for 2024 includes a credit related to a gain on business divestiture (Energy Equipment $130 million); credits related to gains on sales of previously reserved inventory (Energy Equipment $3 million); charges related to severance and other restructuring costs (Energy Products and Services $8 million and Energy Equipment $15 million), and a credit related to Russia impairment (Energy Products and Services $1 million). Other Items included in selling, general, and administrative expenses for 2023 includes charges related to voluntary early retirement program (VERP) (Energy Products and Services $29 million and Energy Equipment $19 million); credit related to release of an earnout accrual (Energy Equipment $25 million); charges related to severance and other restructure costs (Energy Equipment $10 million). Other items included in cost of revenue for 2023 include a non-cash discount charge on royalty receivables (Energy Products and Services $25 million); credits related to gains on sales of previously reserved inventory (Energy Products and Services $1 million and Energy Equipment $19 million); charges related to severance and other restructuring costs (Energy Equipment $1 million). Other Items included in selling, general, and administrative expenses for 2022 include Russia impairment and other charges (Energy Products and Services $11 million and Energy Equipment $40 million). Other items included in cost of revenue for 2022 include Russia impairment and other charges (Energy Products and Services $60 million and Energy Equipment $12 million); charges related to severance and other restructuring costs (Energy Products and Services $2 million and Energy Equipment $6 million); and credits related to gains on sales of previously reserved inventory (Energy Products and Services $1 million and Energy Equipment $34 million).
Geographic Areas:
The following table presents consolidated revenues by country based on sales destination of the products or service (in millions):
| | | | | | | | | | | | |
| | Year Ended December 31, | |
| | 2024 | | | 2023 | | | 2022 | |
United States | | $ | 2,984 | | | $ | 2,933 | | | $ | 2,603 | |
Other Countries | | | 5,886 | | | | 5,650 | | | | 4,634 | |
Total | | $ | 8,870 | | | $ | 8,583 | | | $ | 7,237 | |
The following table presents net property, plant and equipment by country based on the location (in millions):
| | | | | | | | |
| | December 31, | |
| | 2024 | | | 2023 | |
United States | | $ | 928 | | | $ | 906 | |
Saudi Arabia | | | 303 | | | | 258 | |
Other Countries | | | 691 | | | | 701 | |
Total | | $ | 1,922 | | | $ | 1,865 | |
17. Impairment and Other Items
We recorded a net credit of $109 million in other items for the year ended December 31, 2024, of which $130 million related to a gain from the divestiture of its Pole Products business, offset by charges related to severance, facility closure and other restructuring costs of $21 million. The other items are reported in “Cost of revenue” ($(110) million for the year ended December 31, 2024) and “Selling, general and administrative” ($1 million for the year ended December 31, 2024) in our Consolidated Statements of Income.
We recorded $51 million in other items for the year ended December 31, 2023, of which $52 million related to charges related to VERP, $25 million related to a non-cash discount charge on royalty receivables, offset by credits related to the release of an earnout accrual of $25 million, and credits related to gains on sales of previously reserved inventory of $20 million. The other items are reported in “Cost of revenue” ($10 million for the year ended December 31, 2023) and “Selling, general and administrative” ($41 million for the year ended December 31, 2023) in our Consolidated Statements of Income.
We recorded $114 million in other items for the year ended December 31, 2022, of which $127 million relates to impairments for Russia and Belarus. The other items are reported in "Cost of revenue" ($63 million for the year ended December 31, 2022) and "Selling, general and administrative" ($51 million for the year ended December 31, 2022) in our Consolidated Statement of Income (Loss).
As previously disclosed, in response to sanctions against Russia and Russian interests, the Company ceased new investments and curtailed our activities in Russia. Further, during the third quarter of 2022, the Company sold its business in Belarus and committed to a plan to sell its businesses in Russia. The sale is subject to various government approvals in Russia and other jurisdictions. For the years ended December 31, 2024 and 2023, all our Russian assets and liabilities were classified as held for sale and reported in “Prepaid and other current assets” and “Accrued liabilities”, respectively, in our Consolidated Balance Sheets.
18. Acquisitions and Divestitures
For the year ended December 31, 2024, our Energy Products and Services segment made three strategic acquisitions to enhance and expand our existing portfolio for a total consideration of $291 million, net of cash acquired. One of the three acquisitions was a company owned by White Deer Energy, a middle market private equity fund focused on energy investments. As the transaction involved a related party at the time it was entered into (i.e., directors Ben A. Guill and Eric L. Mattson both had an investment interest in certain White Deer Energy funds), the acquisition was approved by the disinterested members of the Company’s Board of Directors.
As of December 31, 2024, we provisionally recorded $171 million of goodwill and amortizable intangible assets, $64 million of PP&E, including financing and operating lease right of use assets, $92 million of net working capital, $18 million of finance and operating lease liabilities, and $18 million in other liabilities. The fair values of the assets acquired and liabilities assumed are preliminary and subject to change until we finalize our accounting for these acquisitions.
On April 9, 2024, NOV completed the divestiture of its Pole Products business. Pole Products is a leading manufacturer of premium spun-cast concrete and tapered steel poles for diverse applications. We recorded a gain of $130 million, which is included as a reduction of Cost of Revenue on the Consolidated Statements of Income.
During the second quarter, the Company purchased the remaining noncontrolling interest in Keystone Tower Systems (KTS) for total consideration of $30 million.
19. Share Repurchase Program
On April 25, 2024, the Company established a share repurchase program for up to $1 billion of the currently outstanding shares of the Company’s common stock over a period of 36 months. Under the share repurchase program, the Company may repurchase shares from time to time through open market purchases, in privately negotiated transactions or by other means, including through the use of trading plans intended to qualify under Rule 10b5-1 under the Securities Exchange Act of 1934 (the “Exchange Act”), as amended, in accordance with applicable securities laws and other restrictions, including Rule 10b-18. The timing and total amount of any stock repurchases will depend upon business, economic and market conditions, corporate and regulatory requirements, prevailing stock prices and other considerations.
The Company intends to fund the repurchases using its available U.S. cash balances, which may involve the repatriation of foreign earnings not indefinitely reinvested. However, depending on U.S cash balances, the Company may choose to borrow against its revolving credit facility or issue new debt to finance the repurchases. As shares are repurchased, they are constructively retired and returned to an unissued state. During the three months ended December 31, 2024, the Company repurchased 7.5 million shares of common stock under the program for an aggregate amount of $112 million. During the year ended December, 31, 2024, the Company repurchased 14.2 million shares of common stock under the program for an aggregate amount of $229 million.
SCHEDULE II
NOV INC.
VALUATION AND QUALIFYING ACCOUNTS
Years Ended December 31, 2024, 2023 and 2022
(in millions)
| | | | | | | | | | | | | | | | |
| | Balance
beginning
of year | | | Additions
(Deductions)
charged to
costs and
expenses | | | Charge offs
and other | | | Balance
end of
year | |
Reserve for excess and obsolete inventories: | | | | | | | | | | | | |
2024 | | $ | 354 | | | $ | 31 | | | $ | (99 | ) | | $ | 286 | |
2023 | | | 378 | | | | 28 | | | | (52 | ) | | | 354 | |
2022 | | | 444 | | | | (18 | ) | | | (48 | ) | | | 378 | |
Valuation allowance for deferred tax assets: | | | | | | | | | | | | |
2024 | | $ | 346 | | | $ | (64 | ) | | $ | (16 | ) | | $ | 266 | |
2023 | | | 920 | | | | (564 | ) | | | (10 | ) | | | 346 | |
2022 | | | 1,127 | | | | 24 | | | | (231 | ) | | | 920 | |