
Investor Presentation February 8, 2022
Safe Harbor Statement Cautionary Note Regarding Forward-Looking Statements The information contained in this report may contain forward-looking statements. When used or incorporated by reference in disclosure documents, the words "believe," "anticipate," "estimate," "expect," "project," "target," "goal" and similar expressions are intended to identify forward-looking statements within the meaning of Section 27A of the Securities Act of 1933 and Section 21E of the Securities Exchange Act of 1934. These forward-looking statements may include, but are not limited to: statements of our goals, intentions and expectations; statements regarding our business plans, prospects, growth and operating strategies; statements regarding the quality of our loan and investment portfolios; and estimates of our risks and future costs and benefits. These forward-looking statements are based on current beliefs and expectations of our management and are subject to significant business, economic and competitive uncertainties and contingencies, many of which are beyond our control. In addition, these forward-looking statements are subject to assumptions with respect to future business strategies and decisions that are subject to change. Certain of these risks, uncertainties and assumptions are set forth below as well as the risk factors described in Item 1A. "Risk Factors": • Operating, legal and regulatory risk; • Economic, political and competitive events; • Legislative, regulatory and accounting changes; • Demand for our financial products and services in our market area; • Major catastrophes such as earthquakes, floods or other natural or human disasters and infectious disease outbreaks, including the current coronavirus (COVID-19) pandemic, the related disruption to local, regional and global economic activity and financial markets, and the impact that any of the foregoing may have on us and our customers and other constituencies; • Volatility in interest rates; • Fluctuations in real estate values in our market area; • The composition and credit quality of our loan and investment portfolios; • Changes in the level and direction of loan delinquencies, classified and criticized loans and charge-offs and changes in estimates of the adequacy of the allowance for credit losses; • Economic assumptions utilized to calculate the allowance for credit losses; • Our ability to access cost-effective funding; • Our ability to implement our business strategies; • Our ability to manage market risk, credit risk and operational risk; • Timing and amount of revenue and expenditures; • Adverse changes in the securities markets; • Our ability to enter new markets successfully and capitalize on growth opportunities; • Competition for loans, deposits and employees; • System failures or cyber-security breaches of our information technology infrastructure and those of our third-party service providers; • The failure to maintain current technologies and/or to successfully implement future information technology enhancements; • Our ability to retain key employees; • Other risks and uncertainties, including those occurring in the U.S. and world financial systems; and • The risk that our analysis of these risks and forces could be incorrect and/or that the strategies developed to address them could be unsuccessful. 2
Safe Harbor Statement (cont’d) Cautionary Note Regarding Forward-Looking Statements Given the ongoing and dynamic nature of the COVID-19 pandemic, it is difficult to predict the full impact of the COVID-19 pandemic on our business. The extent of such impact will depend on future developments, which are highly uncertain, including when the coronavirus can be controlled and abated. As a result of the COVID-19 pandemic and the related adverse local and national economic consequences, our forward-looking statements are also subject to the following risks, uncertainties and assumptions: • Demand for our products and services may decline; • If economic conditions worsens, loan delinquencies, problem assets, and foreclosures may increase and our allowance for credit losses may have to be increased; • Collateral for loans, especially real estate, may decline in value; • The net worth and liquidity of loan guarantors may decline, impairing their ability to honor commitments to us; • A material decrease in net income or a net loss over several quarters could result in the elimination of or a decrease in the rate of our quarterly cash dividend; • Our wealth management revenues may decline with continuing market turmoil; • Litigation, regulatory enforcement risk and reputation risk regarding our participation in the Paycheck Protection Program and the risk that the Small Business Administration may not fund some or all PPP loan guarantees; and • Our cyber security risk are increased as the result of an increase in the number of employees working remotely Should one or more of these risks or uncertainties materialize, or should underlying assumptions prove incorrect, actual results may vary materially from those anticipated, estimated, expected or projected. These forward-looking statements speak only as of the date of the report. Univest Financial Corporation (the Corporation) expressly disclaims any obligation to publicly release any updates or revisions to reflect any change in the Corporation's expectations with regard to any change in events, conditions or circumstances on which any such statement is based. 3
Non-GAAP Financial Measures This presentation contains financial information determined by methods other than in accordance with accounting principles generally accepted in the United States of America (“GAAP”). Management uses these “non-GAAP” measures in its analysis of the Corporation’s performance. Management believes these non-GAAP financial measures allow for better comparability of period to period operating performance. Additionally, the Corporation believes this information is utilized by regulators and market analysts to evaluate a company’s financial condition and therefore, such information is useful to investors. These disclosures should not be viewed as a substitute for operating results determined in accordance with GAAP, nor are they necessarily comparable to non-GAAP performance measures that may be presented by other companies. A reconciliation of the non-GAAP measures used in this presentation to the most directly comparable GAAP measures is provided in the Appendix to this presentation. 4

COMPANY OVERVIEW

Univest Company Overview • Headquartered in Souderton, Pennsylvania (Montgomery County) • Bank founded in 1876, holding company formed in 1973 • Engaged in financial services business, providing full range of banking, insurance and wealth management services ◦ Comprehensive financial solutions delivered locally • Experienced management team with proven performance track record • Physically serving twelve counties in the Southeastern and Central regions of Pennsylvania and three counties in Southern New Jersey • Customer base primarily consists of individuals, businesses, municipalities and nonprofit organizations • Operating leverage and scale with $7.1 billion of assets, $4.9 billion of assets under management and supervision and agent for $195 million of underwritten insurance premiums as of 12/31/21 6

Executive Leadership Team 7 Name Age Tenure (yrs) with Univest Title Jeffrey M. Schweitzer 48 14 President and CEO, Univest Financial Corporation Michael S. Keim 54 13 Chief Operating Officer, Univest Financial Corporation and President, Univest Bank and Trust Co. Brian J. Richardson 39 5 Senior Executive Vice President, Chief Financial Officer Megan D. Santana 46 5 Senior Executive Vice President, Chief Risk Officer and General Counsel Duane J. Brobst 69 28 Senior Executive Vice President, Chief Credit Officer Michael S. Fitzgerald 58 5 President, Commercial Banking, East Penn and NJ Division Thomas J. Jordan 54 5 President, Commercial Banking, Central PA Division Ronald R. Flaherty 54 13 President, Univest Insurance, Inc. David W. Geibel 49 8 President, Girard (Univest Wealth Management Division) William J. Clark 57 15 President, Univest Capital, Inc. Brian E. Grzebin 50 3 President, Mortgage Banking Division Dana E. Brown 54 5 President, Consumer Services Eric W. Conner 50 15 Senior Executive Vice President and Chief Information Officer M. Theresa Fosko 51 18 Executive Vice President and Director of Human Resources Annette D. Szygiel 59 18 Executive Vice President and Chief Experience Officer Briana Dona 41 21 Executive Vice President and Chief Banking Operations Officer 7

Univest Primary Physical Service Area Twelve counties in Southeastern and Central Pennsylvania and three counties in Southern New Jersey 8 8

Univest Financial Center and Regional Locations 9 9

• With BB&T Corporation’s acquisitions of Susquehanna Bancshares and National Penn Bancshares, and WSFS Financial Corporation’s acquisition of Beneficial and Bryn Mawr Bank Corporation, Univest is one of the two largest community focused financial institutions remaining headquartered in the Philadelphia market (WSFS being the other) • Univest Bank and Trust Co. operates in twelve counties in Pennsylvania including: Berks, Bucks, Chester, Cumberland, Dauphin, Delaware, Lancaster, Lehigh, Montgomery, Northampton, Philadelphia and York • Of these twelve counties, the Univest financial center network is present in seven: Bucks, Chester, Lancaster, Lehigh, Montgomery, Northampton and Philadelphia Market Opportunity Source: FDIC Market Share Data 10 Market Share (6/30/21) Market Market Rank # of Branches Deposits 6/2021 Share % 6/2020 Share % Montgomery County 5th 12 $2.9B 7.1% 7.8% Bucks County 7th 9 $1.4B 5.3% 5.0% Philadelphia County 14th 6 $482M 0.7% 0.9% Lancaster County 10th 5 $444M 2.8% 2.5%

2021 Results Earnings Loans & Deposits • Reported Earnings: $91.8 million ◦ $3.11 per share • Core PTPP-NCO(1): $87.2 million • Reported ROAA: 1.38%/Core PTPP-NCO ROAA(1)(2): 1.37% • Reported ROATE: 16.41%/Core PTPP-NCO ROATE(1)(3): 15.60% • Loan Growth excl. PPP: 9.4% • Deposit Growth: 15.5% • Average Loan to Deposit Ratio: 94.9% Key Ratios • Net Interest Margin of 3.18% (tax-equivalent excluding purchase accounting, PPP loans and excess liquidity) • Reported Efficiency Ratio of 60.9(4)%; Core Efficiency Ratio of 65.0(4)% • Non-Performing Assets to Total Assets of 0.48% • Tangible Equity(5) to Tangible Assets of 8.56% and Tangible Book Value Per Share of $20.14 at 12/31/21 1. Calculated using “Core Pre-Tax Pre-Provision Income less Net Charge-Offs” which is a Non-GAAP measure. Refer to appendix for reconciliation. 2. Calculated using “Average Assets excluding PPP" which is a Non-GAAP measure. Refer to appendix for reconciliation. 3. Calculated using “Average Tangible Common Equity" which is a Non-GAAP measure. Refer to appendix for reconciliation. 4. Includes PA capital stock tax expense - increases efficiency ratio by approx. 170 bps 5. Calculated using “Tangible Common Equity" which is a Non‑GAAP measure. Refer to appendix for reconciliation. 11
• Super-Community Bank located in attractive Southeastern Pennsylvania market • Diversified lines of business and revenue streams (i.e. Noninterest Income represents ~30% of total revenue) • Ability to scale and obtain operating leverage • Strong earnings performance: • Dividend Yield of 2.64% (4) • Attractive valuation – ◦ 12.3x Projected 2022 EPS (4)(5) ◦ 1.50x Tangible Book Value per Share (4)(6) 1. Calculated using “Core Pre‑Tax Pre‑Provision Income less Net Charge‑Offs” which is a Non‑GAAP measure. Refer to appendix for reconciliation. 2. Calculated using “Average Assets excluding PPP" which is a Non‑GAAP measure. Refer to appendix for reconciliation. 3. Calculated using “Average Tangible Common Equity" which is a Non‑GAAP measure. Refer to appendix for reconciliation. 4. Based on price of $30.25 (represents average closing price 1/31/22-2/4/22). 5. Based on analyst average consensus of $2.45 EPS for 2022 (KBW projection of $2.42, Piper Sandler projection of $2.38, Raymond James projection of $2.40 and Stephens projection of $2.61). 6. Calculated using “Tangible Common Equity" which is a Non‑GAAP measure. Refer to appendix for reconciliation. Attractive Investment Opportunity 12 2020 2021 Core PTPP-NCO ROAA (1) (2) 1.51 % 1.37 % Core PTPP-NCO ROAE (1) 12.77 % 11.88 % Core PTPP-NCO ROATE (1) (3) 17.33 % 15.60 %

2022 Strategy Continue to Expand and Optimize the Capabilities of Univest: • Further develop digital lending and deposit solutions for small businesses and consumers • Leverage technology investments and tools to deepen relationships with existing customers Execute on second year of 3-year Strategic Roadmap related to Diversity, Equity, and Inclusion Grow Top Line Revenue: • Achieve loan growth goals and continue to look for opportunities to expand the size and capabilities of our lending team(s) • Continue to identify strategies to increase the growth trajectory of non-interest lines of business • Optimize balance sheet to effectively manage excess liquidity and net interest margin Maximize Efficiency & Manage Costs: • Continue to improve long-term operating leverage by improving process flow and efficiencies driven by technology investments 13

SUMMARY FINANCIAL HIGHLIGHTS
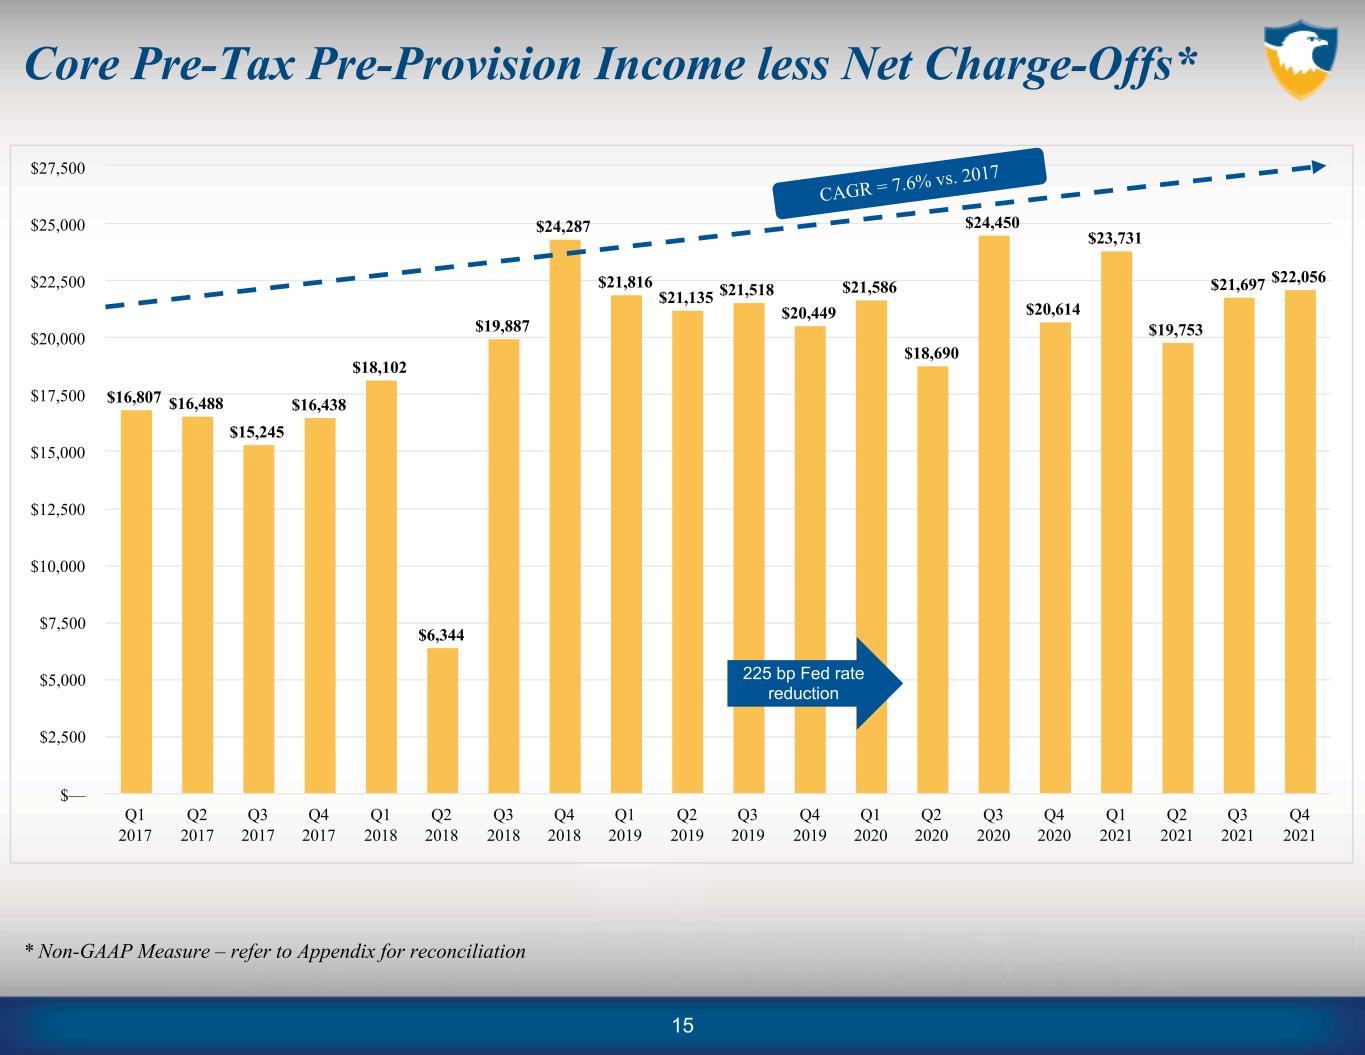
$16,807 $16,488 $15,245 $16,438 $18,102 $6,344 $19,887 $24,287 $21,816 $21,135 $21,518 $20,449 $21,586 $18,690 $24,450 $20,614 $23,731 $19,753 $21,697 $22,056 Q1 2017 Q2 2017 Q3 2017 Q4 2017 Q1 2018 Q2 2018 Q3 2018 Q4 2018 Q1 2019 Q2 2019 Q3 2019 Q4 2019 Q1 2020 Q2 2020 Q3 2020 Q4 2020 Q1 2021 Q2 2021 Q3 2021 Q4 2021 $— $2,500 $5,000 $7,500 $10,000 $12,500 $15,000 $17,500 $20,000 $22,500 $25,000 $27,500 Core Pre-Tax Pre-Provision Income less Net Charge-Offs* * Non-GAAP Measure – refer to Appendix for reconciliation 15 225 bp Fed rate reduction CAGR = 7.6% vs. 2017
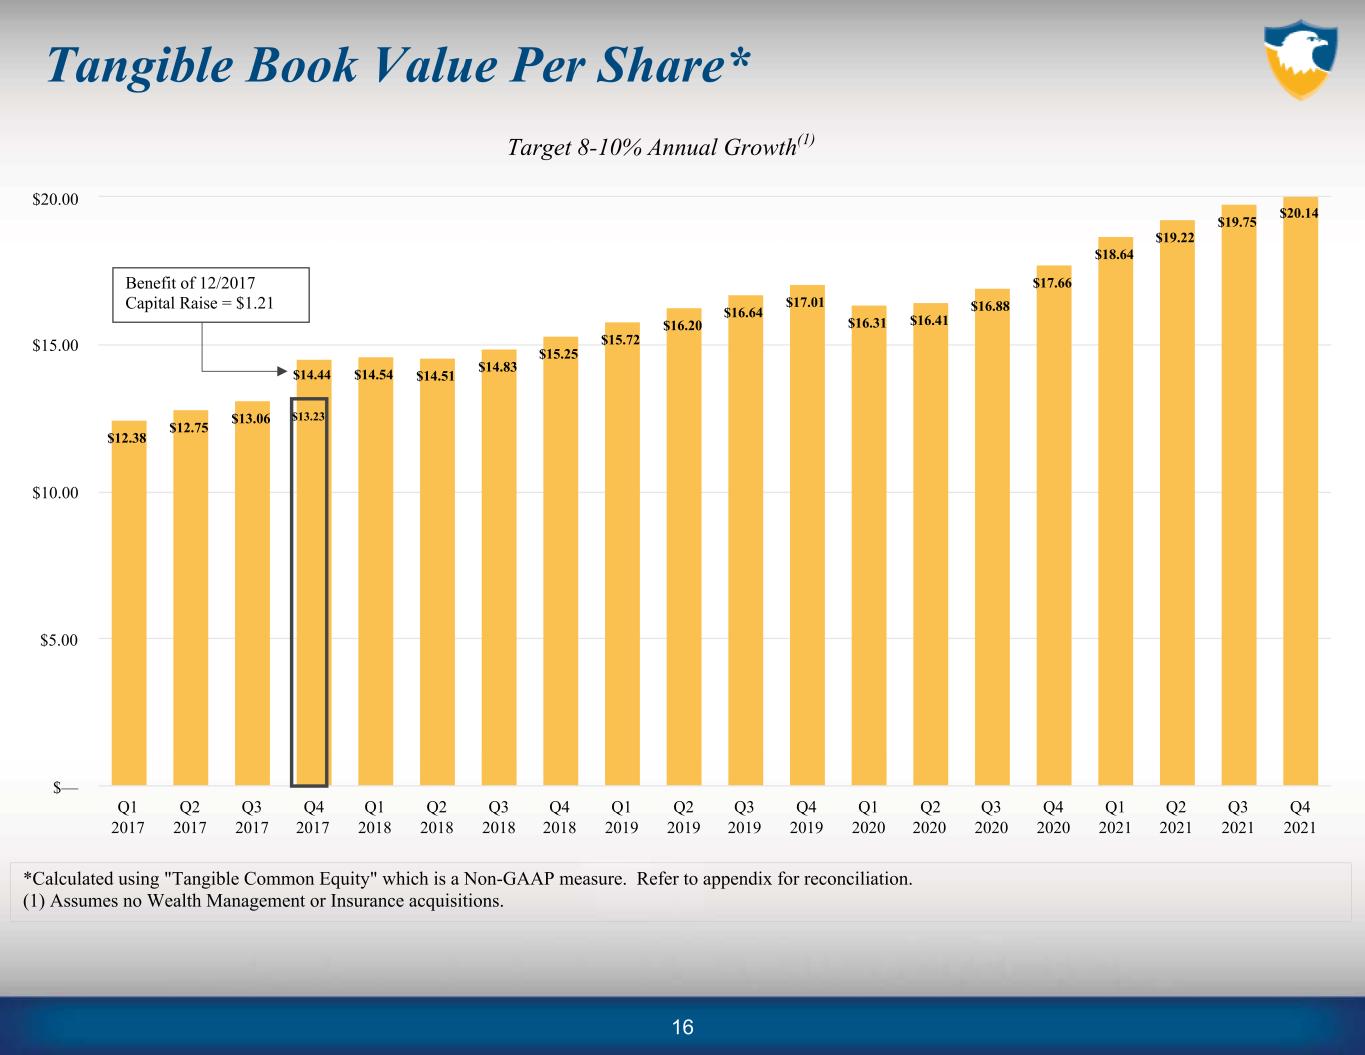
$12.38 $12.75 $13.06 $14.54 $14.51 $14.83 $15.25 $15.72 $16.20 $16.64 $17.01 $16.31 $16.41 $16.88 $17.66 $18.64 $19.22 $19.75 $20.14 Q1 2017 Q2 2017 Q3 2017 Q4 2017 Q1 2018 Q2 2018 Q3 2018 Q4 2018 Q1 2019 Q2 2019 Q3 2019 Q4 2019 Q1 2020 Q2 2020 Q3 2020 Q4 2020 Q1 2021 Q2 2021 Q3 2021 Q4 2021 $— $5.00 $10.00 $15.00 $20.00 Tangible Book Value Per Share* *Calculated using "Tangible Common Equity" which is a Non-GAAP measure. Refer to appendix for reconciliation. (1) Assumes no Wealth Management or Insurance acquisitions. Target 8-10% Annual Growth(1) 16 Benefit of 12/2017 Capital Raise = $1.21 $14.44 $13.23

Core PTPP- NCO ROAA & ROTE *Calculated using "Core Pre-Tax Pre- Provision Income less Net Charge-Offs" and “Average Assets excluding PPP” which are Non-GAAP measures. Refer to appendix for reconciliation. **Calculated using "Core Pre-Tax Pre- Provision Income less Net Charge-Offs" and "Average Tangible Common Equity" which are Non-GAAP measures. Refer to appendix for reconciliation. Core PTPP-NCO ROAA* Core PTPP-NCO ROTE** 1.61% 1.53% 1.37% 1.47% 1.61% 0.54% 1.64% 1.97% 1.77% 1.64% 1.61% 1.50% 1.60% 1.34% 1.69% 1.40% 1.64% 1.31% 1.32% 1.24% Q1 17 Q2 17 Q3 17 Q4 17 Q1 18 Q2 18 Q3 18 Q4 18 Q1 19 Q2 19 Q3 19 Q4 19 Q1 20 Q2 20 Q3 20 Q4 20 Q1 21 Q2 21 Q3 21 Q4 21 0.25% 0.50% 0.75% 1.00% 1.25% 1.50% 1.75% 2.00% 2.25% 20.86% 19.68% 17.48% 17.45% 17.22% 5.88% 18.21% 21.84% 19.49% 18.10% 17.68% 16.35% 17.45% 15.49% 19.99% 16.36% 18.34% 14.30% 15.06% 14.93% Q1 17 Q2 17 Q3 17 Q4 17 Q1 18 Q2 18 Q3 18 Q4 18 Q1 19 Q2 19 Q3 19 Q4 19 Q1 20 Q2 20 Q3 20 Q4 20 Q1 21 Q2 21 Q3 21 Q4 21 5.00% 7.50% 10.00% 12.50% 15.00% 17.50% 20.00% 22.50% 25.00% 17
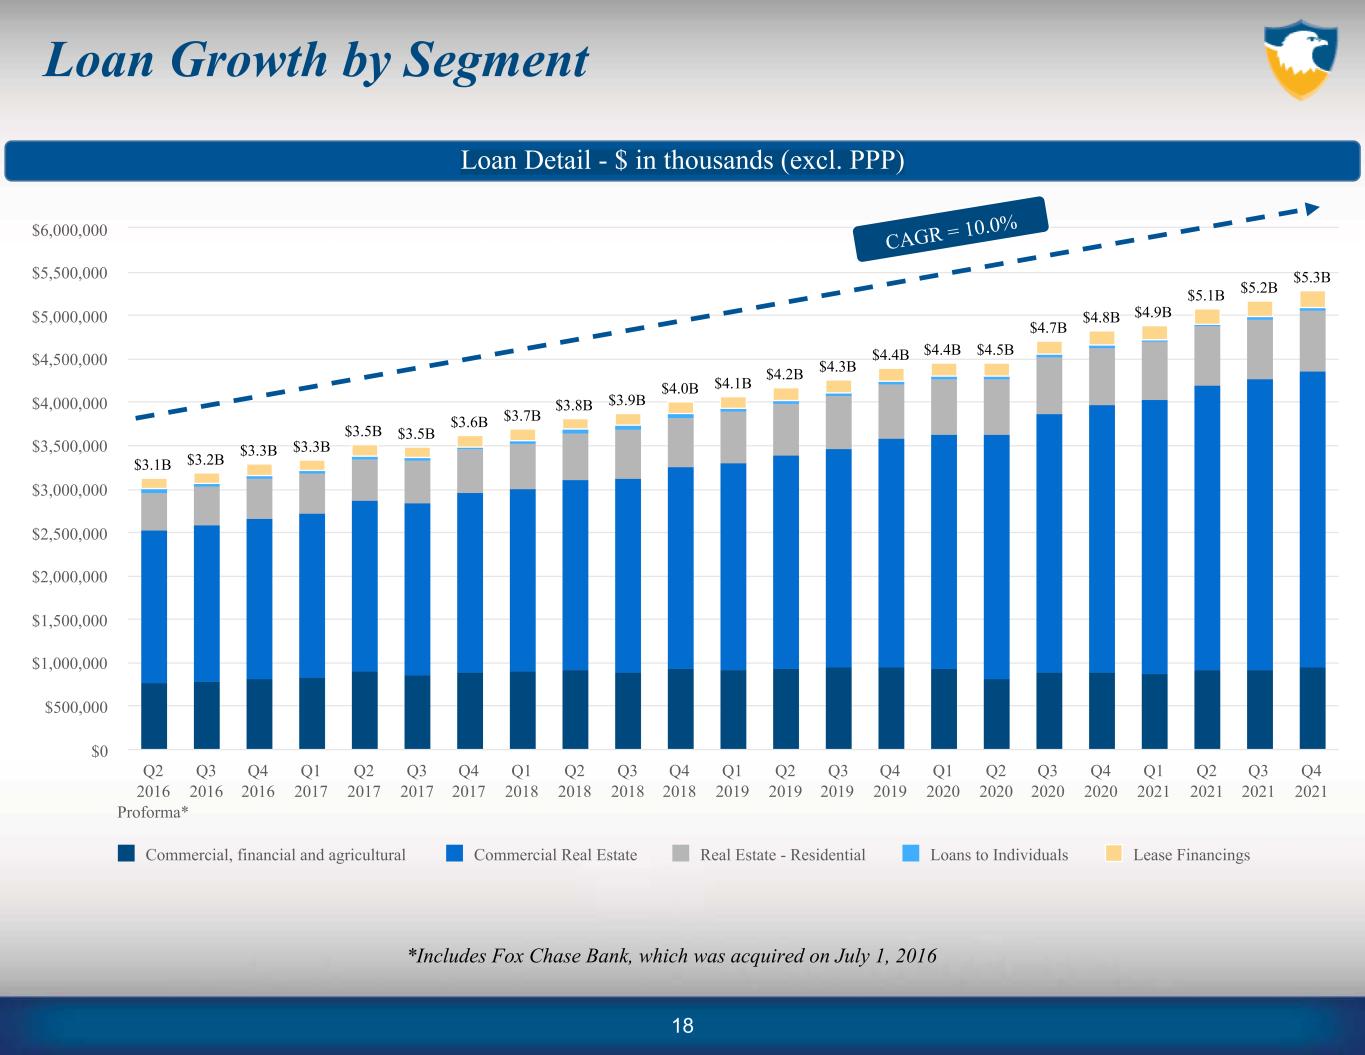
Loan Growth by Segment *Includes Fox Chase Bank, which was acquired on July 1, 2016 Loan Detail - $ in thousands (excl. PPP) $3.1B $3.2B $3.3B $3.3B $3.5B $3.5B $3.6B $3.7B $3.8B $3.9B $4.0B $4.1B $4.2B $4.3B $4.4B $4.4B $4.5B $4.7B $4.8B $4.9B $5.1B $5.2B $5.3B Commercial, financial and agricultural Commercial Real Estate Real Estate - Residential Loans to Individuals Lease Financings Q2 2016 Proforma* Q3 2016 Q4 2016 Q1 2017 Q2 2017 Q3 2017 Q4 2017 Q1 2018 Q2 2018 Q3 2018 Q4 2018 Q1 2019 Q2 2019 Q3 2019 Q4 2019 Q1 2020 Q2 2020 Q3 2020 Q4 2020 Q1 2021 Q2 2021 Q3 2021 Q4 2021 $0 $500,000 $1,000,000 $1,500,000 $2,000,000 $2,500,000 $3,000,000 $3,500,000 $4,000,000 $4,500,000 $5,000,000 $5,500,000 $6,000,000 CAGR = 10.0% 18
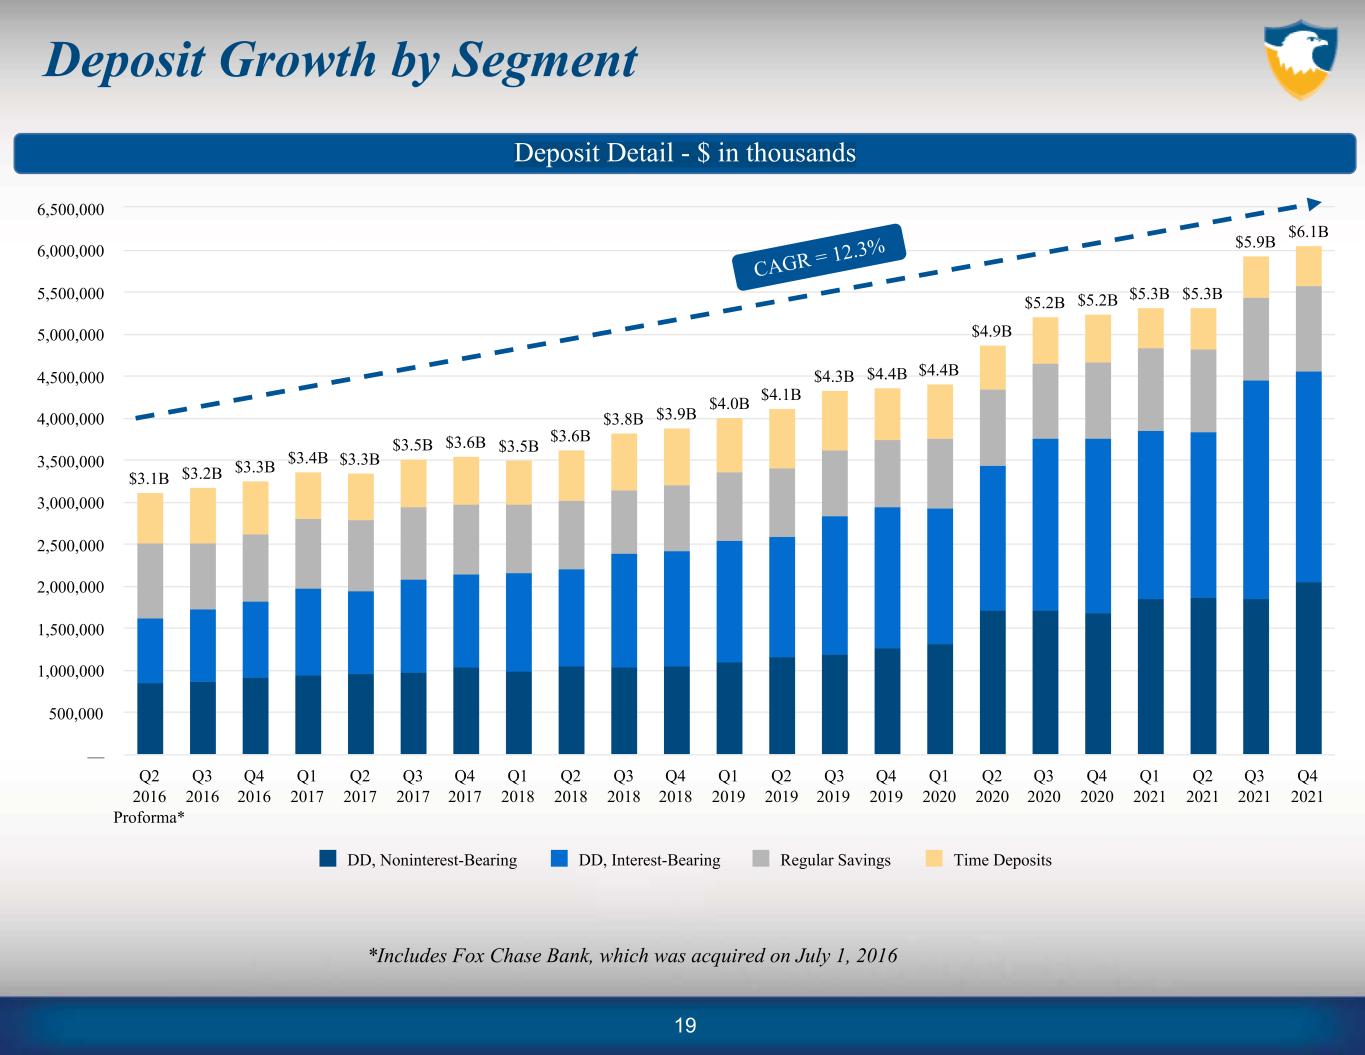
$3.1B $3.2B $3.3B $3.4B $3.3B $3.5B $3.6B $3.5B $3.6B $3.8B $3.9B $4.0B $4.1B $4.3B $4.4B $4.4B $4.9B $5.2B $5.2B $5.3B $5.3B $5.9B $6.1B DD, Noninterest-Bearing DD, Interest-Bearing Regular Savings Time Deposits Q2 2016 Proforma* Q3 2016 Q4 2016 Q1 2017 Q2 2017 Q3 2017 Q4 2017 Q1 2018 Q2 2018 Q3 2018 Q4 2018 Q1 2019 Q2 2019 Q3 2019 Q4 2019 Q1 2020 Q2 2020 Q3 2020 Q4 2020 Q1 2021 Q2 2021 Q3 2021 Q4 2021 — 500,000 1,000,000 1,500,000 2,000,000 2,500,000 3,000,000 3,500,000 4,000,000 4,500,000 5,000,000 5,500,000 6,000,000 6,500,000 Deposit Growth by Segment *Includes Fox Chase Bank, which was acquired on July 1, 2016 CAGR = 12.3% Deposit Detail - $ in thousands 19

Net Interest Income (Asset Sensitive) *Pro forma tax equivalent margin calculation excludes purchase accounting accretion and is based upon a pro forma 21% tax rate for all periods presented 1. Calculated using “Core Net Interest Income excluding PPP” which is a Non-GAAP measure. Refer to appendix for reconciliation. 2. Calculated using “Core Net Interest Income excluding PPP” and “Average Interest Earning Assets excluding Excess Liquidity and PPP Loans”, which are Non-GAAP measures. Refer to appendix for reconciliation of Non-GAAP. Core Net Interest Margin 3.64% 3.61% 3.62% 3.64% 3.70% 3.70% 3.68% 3.71% 3.74% 3.66% 3.52% 3.41% 3.48% 3.18% 3.02% 3.02% 3.11% 3.15% 3.11% 2.86% 3.71% 3.75% 3.70% 3.65% 3.53% 3.54% 3.43% 3.30% 3.22% 3.18% 3.14% 3.18% 3.21% Core Net Interest Income excluding PPP (1) Core Margin * Core Margin excl PPP Loans & Excess Liquidity (2) Q1 17 Q2 17 Q3 17 Q4 17 Q1 18 Q2 18 Q3 18 Q4 18 Q1 19 Q2 19 Q3 19 Q4 19 Q1 20 Q2 20 Q3 20 Q4 20 Q1 21 Q2 21 Q3 21 Q4 21 $0 $10,000 $20,000 $30,000 $40,000 $50,000 2.50% 2.75% 3.00% 3.25% 3.50% 3.75% 4.00% 20 CAGR = 8.2% vs. Q1 2017
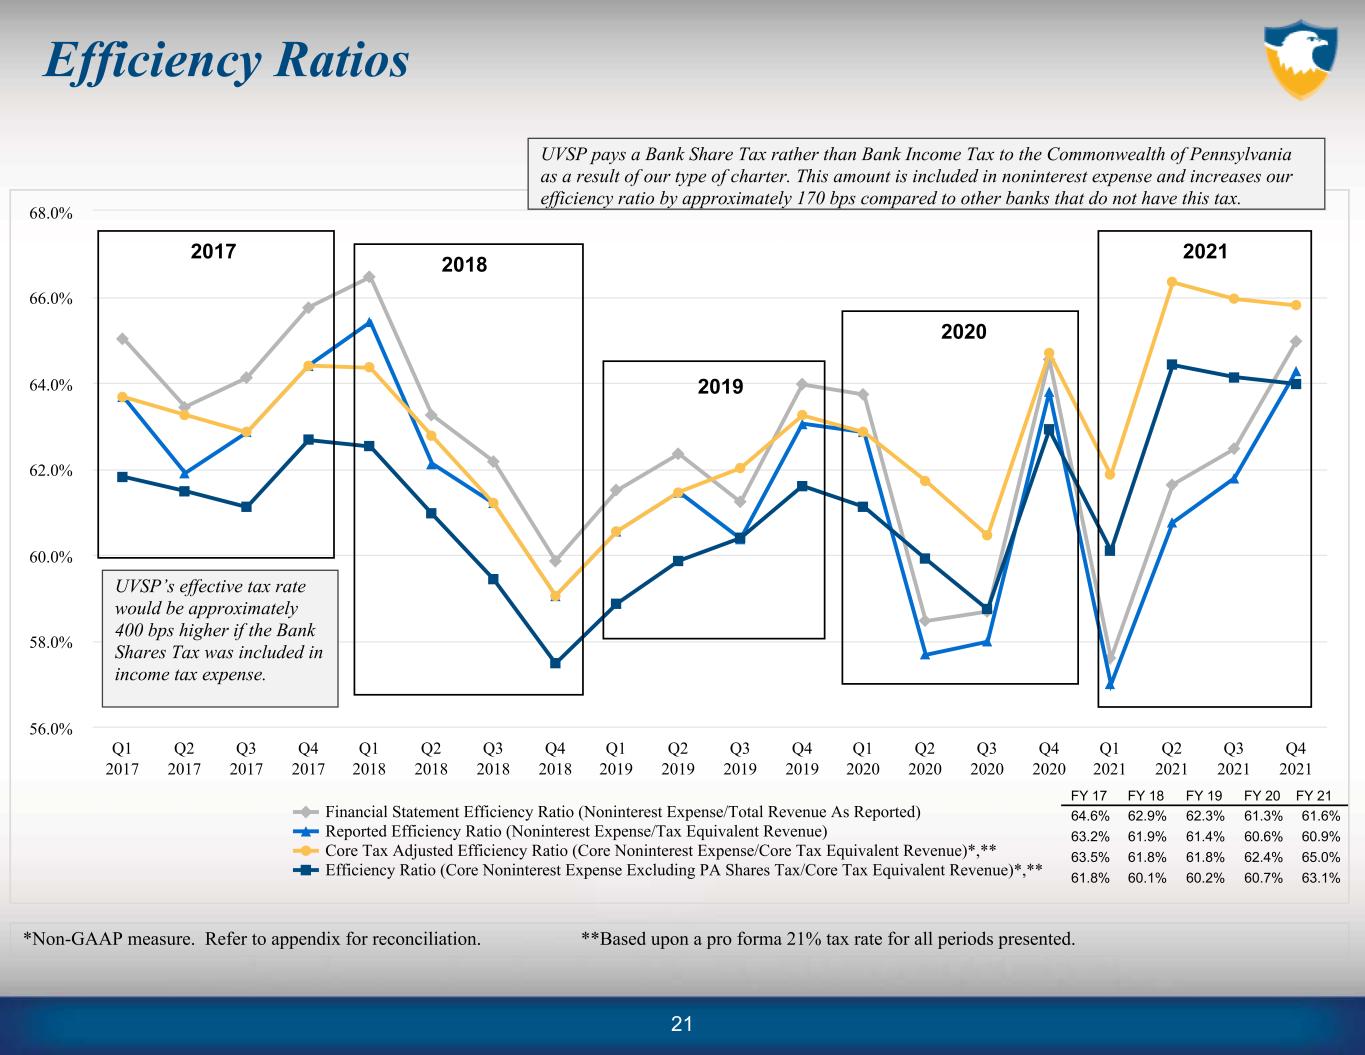
Financial Statement Efficiency Ratio (Noninterest Expense/Total Revenue As Reported) Reported Efficiency Ratio (Noninterest Expense/Tax Equivalent Revenue) Core Tax Adjusted Efficiency Ratio (Core Noninterest Expense/Core Tax Equivalent Revenue)*,** Efficiency Ratio (Core Noninterest Expense Excluding PA Shares Tax/Core Tax Equivalent Revenue)*,** Q1 2017 Q2 2017 Q3 2017 Q4 2017 Q1 2018 Q2 2018 Q3 2018 Q4 2018 Q1 2019 Q2 2019 Q3 2019 Q4 2019 Q1 2020 Q2 2020 Q3 2020 Q4 2020 Q1 2021 Q2 2021 Q3 2021 Q4 2021 56.0% 58.0% 60.0% 62.0% 64.0% 66.0% 68.0% Efficiency Ratios *Non-GAAP measure. Refer to appendix for reconciliation. **Based upon a pro forma 21% tax rate for all periods presented. 21 UVSP’s effective tax rate would be approximately 400 bps higher if the Bank Shares Tax was included in income tax expense. UVSP pays a Bank Share Tax rather than Bank Income Tax to the Commonwealth of Pennsylvania as a result of our type of charter. This amount is included in noninterest expense and increases our efficiency ratio by approximately 170 bps compared to other banks that do not have this tax. 2017 2018 2019 2020 2021 FY 17 FY 18 FY 19 FY 20 FY 21 64.6% 62.9% 62.3% 61.3% 61.6% 63.2% 61.9% 61.4% 60.6% 60.9% 63.5% 61.8% 61.8% 62.4% 65.0% 61.8% 60.1% 60.2% 60.7% 63.1%

Revenue Revenue Revenue by Business Unit (2021) (1) (1) Excludes PPP Loan impact. Revenue = Net Interest Income + Noninterest Income Bank, 70.1% Capital, 3.2% Insurance, 6.6% Wealth, 10.7% Mortgage, 9.4% $ (0 00 ) N on-Interest Incom e % of T otal R evenue Net Interest Income (excl PPP) Non-Interest Income Non-Interest Income % of Total revenue 2016 2017 2018 2019 2020 (1 ) 2021 (1 ) — 50,000 100,000 150,000 200,000 250,000 300,000 —% 10% 20% 30% 40% 50% 22
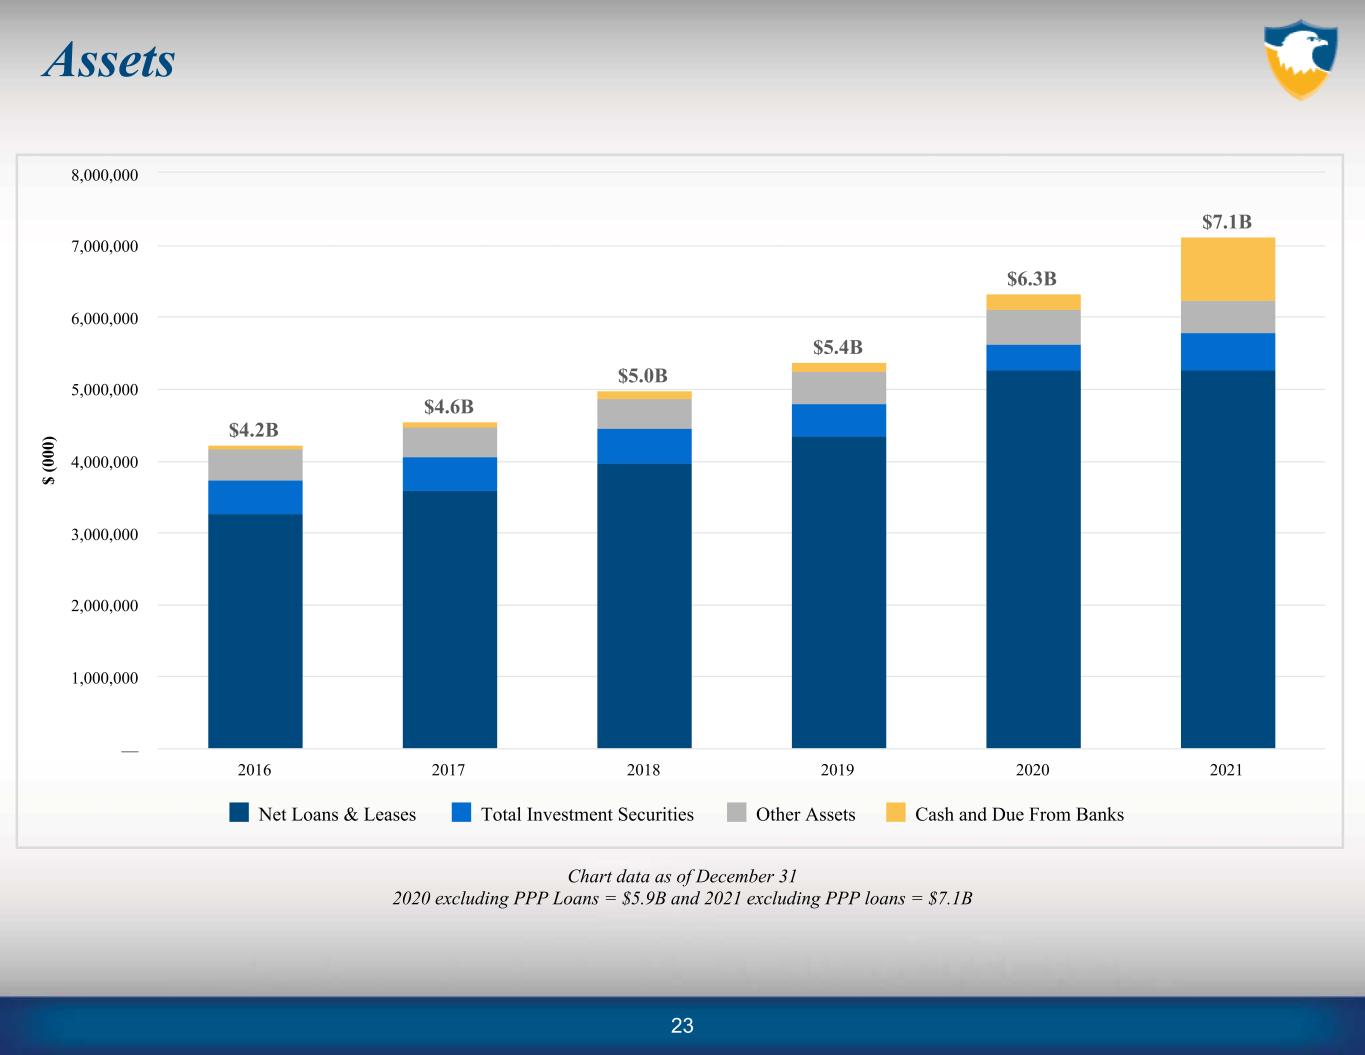
Assets Chart data as of December 31 2020 excluding PPP Loans = $5.9B and 2021 excluding PPP loans = $7.1B $ (0 00 ) $4.2B $4.6B $5.0B $5.4B $6.3B $7.1B Net Loans & Leases Total Investment Securities Other Assets Cash and Due From Banks 2016 2017 2018 2019 2020 2021 — 1,000,000 2,000,000 3,000,000 4,000,000 5,000,000 6,000,000 7,000,000 8,000,000 23
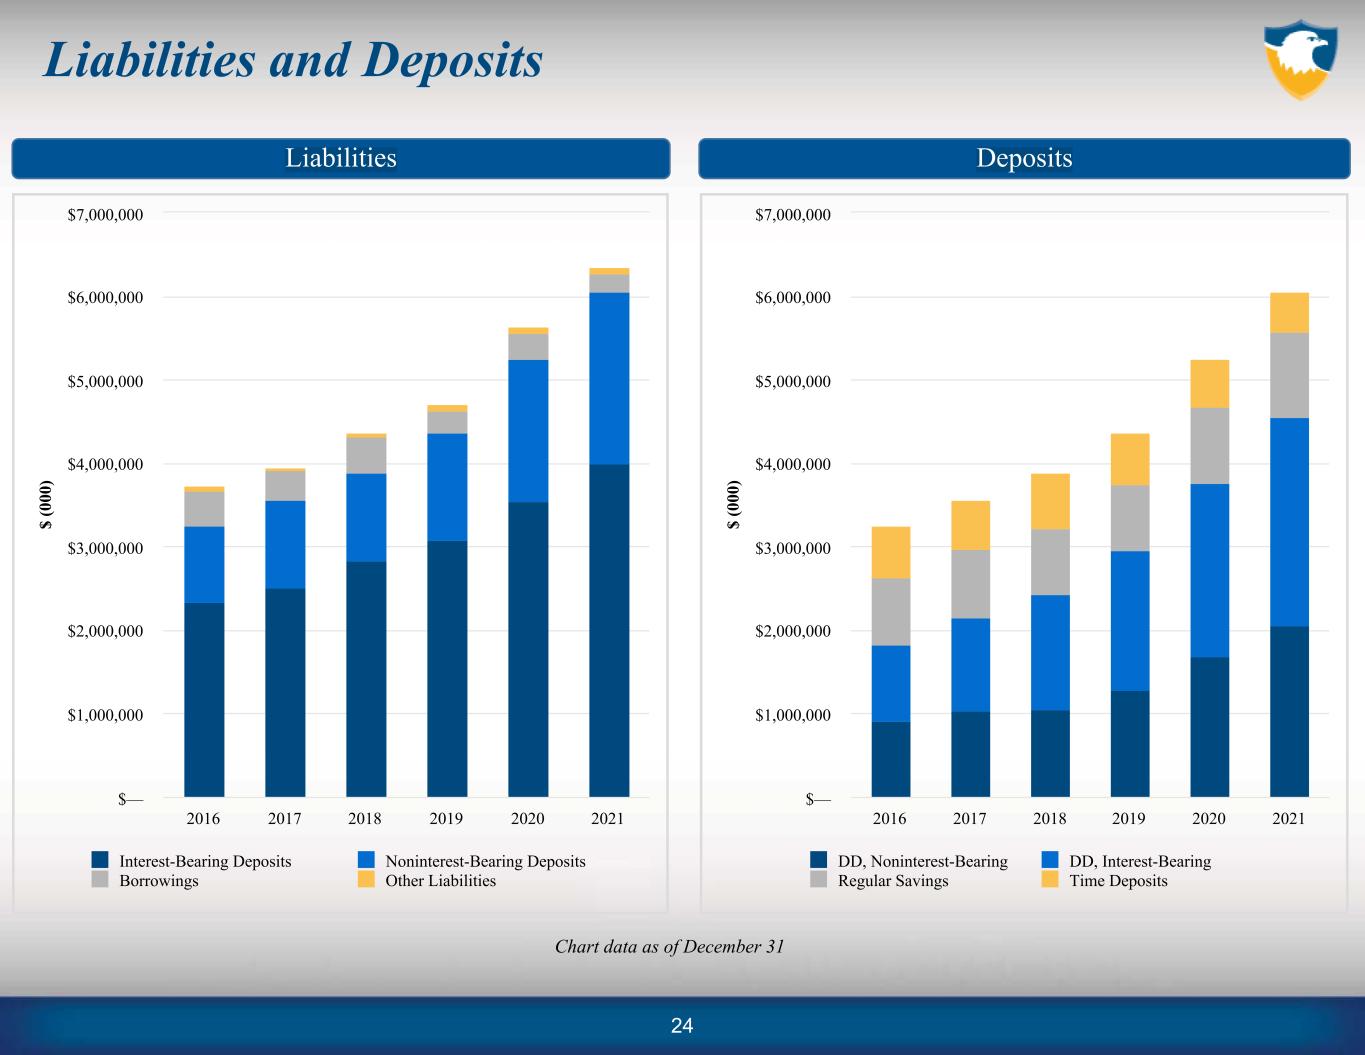
Liabilities and Deposits Chart data as of December 31 Liabilities Deposits $ (0 00 ) Interest-Bearing Deposits Noninterest-Bearing Deposits Borrowings Other Liabilities 2016 2017 2018 2019 2020 2021 $— $1,000,000 $2,000,000 $3,000,000 $4,000,000 $5,000,000 $6,000,000 $7,000,000 $ (0 00 ) DD, Noninterest-Bearing DD, Interest-Bearing Regular Savings Time Deposits 2016 2017 2018 2019 2020 2021 $— $1,000,000 $2,000,000 $3,000,000 $4,000,000 $5,000,000 $6,000,000 $7,000,000 24
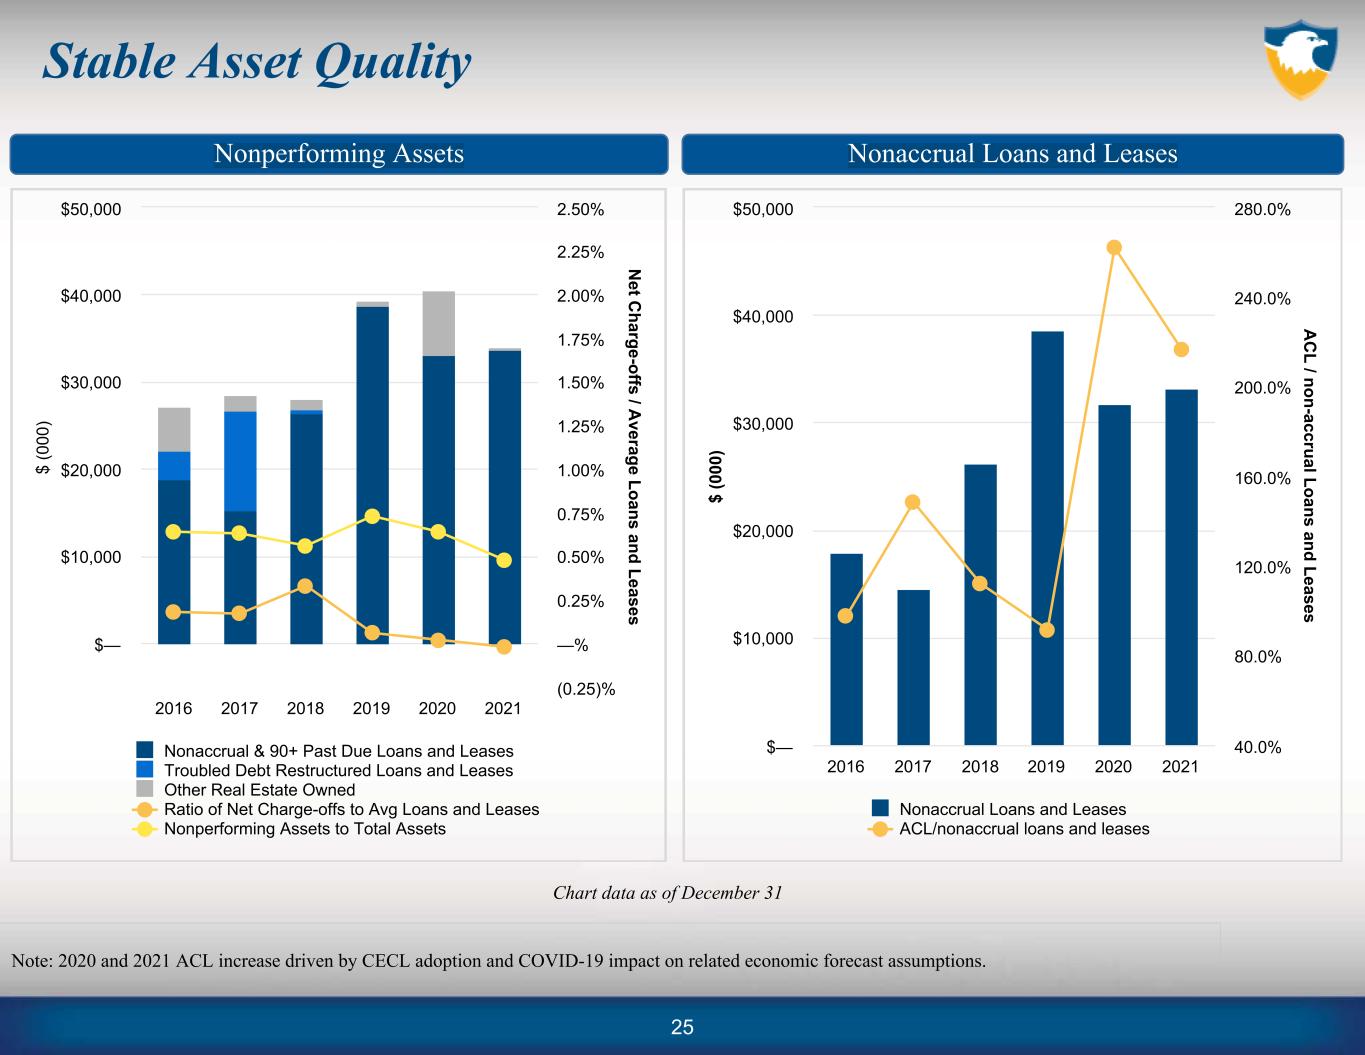
Stable Asset Quality Nonperforming Assets Nonaccrual Loans and Leases Chart data as of December 31 Note: 2020 and 2021 ACL increase driven by CECL adoption and COVID-19 impact on related economic forecast assumptions. $ (0 00 ) A C L / non-accrual Loans and Leases Nonaccrual Loans and Leases ACL/nonaccrual loans and leases 2016 2017 2018 2019 2020 2021 $— $10,000 $20,000 $30,000 $40,000 $50,000 40.0% 80.0% 120.0% 160.0% 200.0% 240.0% 280.0% $ (0 00 ) N et C harge-offs / A verage Loans and Leases Nonaccrual & 90+ Past Due Loans and Leases Troubled Debt Restructured Loans and Leases Other Real Estate Owned Ratio of Net Charge-offs to Avg Loans and Leases Nonperforming Assets to Total Assets 2016 2017 2018 2019 2020 2021 $— $10,000 $20,000 $30,000 $40,000 $50,000 (0.25)% —% 0.25% 0.50% 0.75% 1.00% 1.25% 1.50% 1.75% 2.00% 2.25% 2.50% 25
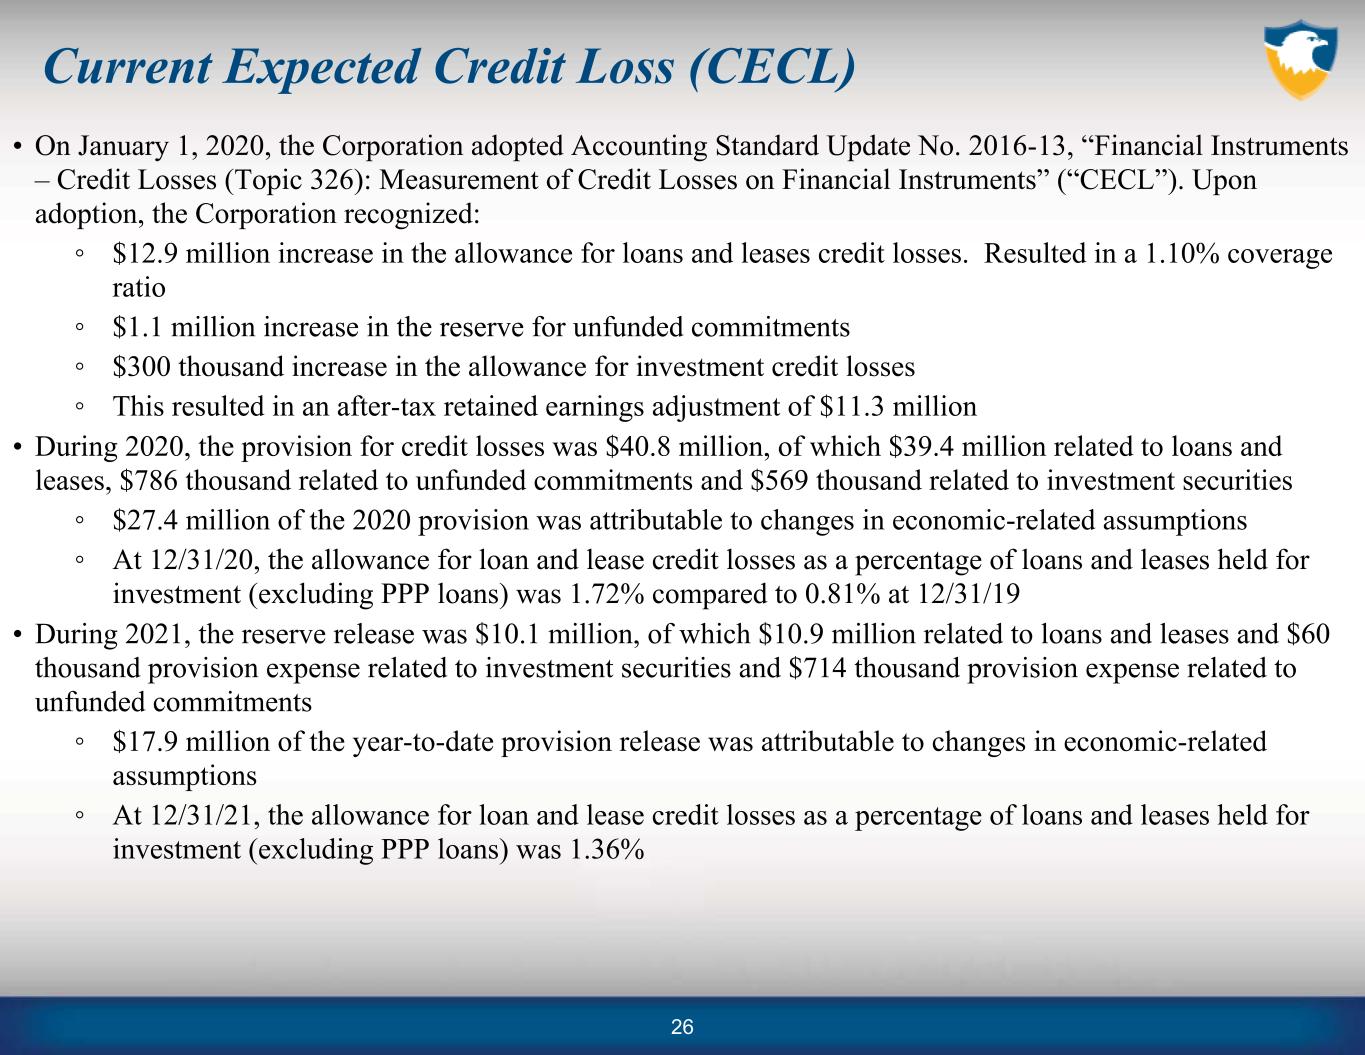
Current Expected Credit Loss (CECL) • On January 1, 2020, the Corporation adopted Accounting Standard Update No. 2016‑13, “Financial Instruments – Credit Losses (Topic 326): Measurement of Credit Losses on Financial Instruments” (“CECL”). Upon adoption, the Corporation recognized: ◦ $12.9 million increase in the allowance for loans and leases credit losses. Resulted in a 1.10% coverage ratio ◦ $1.1 million increase in the reserve for unfunded commitments ◦ $300 thousand increase in the allowance for investment credit losses ◦ This resulted in an after‑tax retained earnings adjustment of $11.3 million • During 2020, the provision for credit losses was $40.8 million, of which $39.4 million related to loans and leases, $786 thousand related to unfunded commitments and $569 thousand related to investment securities ◦ $27.4 million of the 2020 provision was attributable to changes in economic-related assumptions ◦ At 12/31/20, the allowance for loan and lease credit losses as a percentage of loans and leases held for investment (excluding PPP loans) was 1.72% compared to 0.81% at 12/31/19 • During 2021, the reserve release was $10.1 million, of which $10.9 million related to loans and leases and $60 thousand provision expense related to investment securities and $714 thousand provision expense related to unfunded commitments ◦ $17.9 million of the year-to-date provision release was attributable to changes in economic-related assumptions ◦ At 12/31/21, the allowance for loan and lease credit losses as a percentage of loans and leases held for investment (excluding PPP loans) was 1.36% 26
LIQUIDITY AND CAPITAL

Liquidity and Capital Liabilities & Shareholders’ Equity Borrowing Sources – as of 12/31/21 Wholesale Term Funding Maturities – as of 12/31/21 All data in millions, as of 12/31/21 Business Deposits, $2,576, 36.2% Consumer Deposits, $2,446, 34.3% Public Funds Deposits, $997, 14.0% Brokered Deposits, $36, 0.5% Other Borrowings, $115, 1.6% Subordinated debt, $99, 1.4% Other Liabilities, $80, 1.1% Shareholder's Equity, $774, 10.9% Balance Remaining Capacity FHLB - Pittsburgh $ 95.0 $ 1,571.3 Federal Fund Lines (10 Lenders)* — 400.0 FRB - Philadelphia — 28.8 Univest Financial Corp. LOC — 10.0 Total $ 95.0 $ 2,010.1 *Uncommitted lines ranging from $15mm to $100mm Period Amount 2022 $ — 2023 35.2 2024 60.0 Total $ 95.2 28

9.13% 11.08% 11.08% 13.77% 5.00% 7.00% 8.50% 10.50% Required Capital Ratio with full Basel III phase-in Univest Financial Corp (12/31/21) Tier 1 (Leverage) Common Equity Tier 1 Tier 1 (Common/RBC) Total ((RBC) —% 2.50% 5.00% 7.50% 10.00% 12.50% 15.00% Strong Capital Ratios Provide for Operating Flexibility Univest Financial Corporation (Parent) Univest Bank & Trust Co. (Bank) 8.77% 10.65% 10.65% 11.61% 5.00% 7.00% 8.50% 10.50% Required Capital Ratio with full Basel III phase-in Univest Bank & Trust (12/31/21) Tier 1 (Leverage) Common Equity Tier 1 Tier 1 (Common/RBC) Total ((RBC) —% 2.50% 5.00% 7.50% 10.00% 12.50% 15.00% 29 Cash Position of $99.9M at 12/31/21
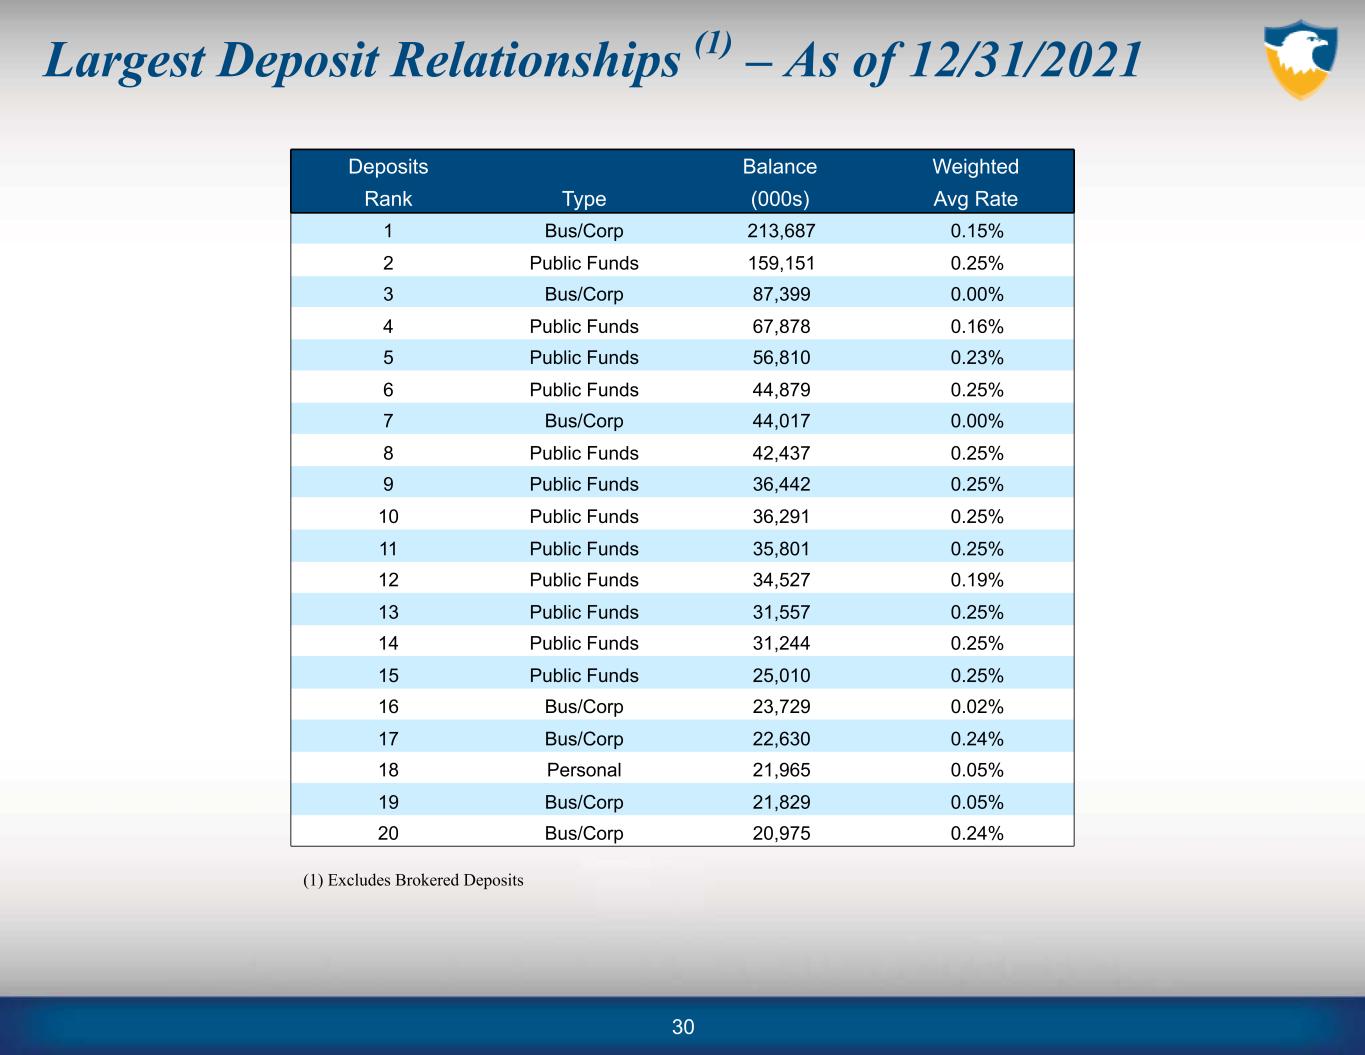
Largest Deposit Relationships (1) – As of 12/31/2021 30 Deposits Balance Weighted Rank Type (000s) Avg Rate 1 Bus/Corp 213,687 0.15% 2 Public Funds 159,151 0.25% 3 Bus/Corp 87,399 0.00% 4 Public Funds 67,878 0.16% 5 Public Funds 56,810 0.23% 6 Public Funds 44,879 0.25% 7 Bus/Corp 44,017 0.00% 8 Public Funds 42,437 0.25% 9 Public Funds 36,442 0.25% 10 Public Funds 36,291 0.25% 11 Public Funds 35,801 0.25% 12 Public Funds 34,527 0.19% 13 Public Funds 31,557 0.25% 14 Public Funds 31,244 0.25% 15 Public Funds 25,010 0.25% 16 Bus/Corp 23,729 0.02% 17 Bus/Corp 22,630 0.24% 18 Personal 21,965 0.05% 19 Bus/Corp 21,829 0.05% 20 Bus/Corp 20,975 0.24% (1) Excludes Brokered Deposits

MBS/CMO, 79.4% US Agencies, 1.4% Money Market, 0.4% Equities, 0.2% Corporate Bonds, 18.2% Municipal Bonds, 0.5% Investments ($497 Million at 12/31/21) Investment Portfolio at 12/31/2021 Investment Portfolio Details Municipal Bonds Corporate Bonds (in millions) (in millions) Moody’s Rating State Moody’s Rating Aaa 1.0 PA 1.3 Aa3 0.5 Aa3 — TN 1.0 Aa2 2.0 Aa2 — Total 2.3 Aa1 — A1 — Aaa 0.5 A2 — A3 12.9 N/A 1.3 A2 35.8 Total 2.3 A1 29.0 Baa2 0.5 S&P Rating Type Baa1 — AAA 1.0 GO 2.3 WR — AA 1.3 REV — N/A 10.0 NR — Total 2.3 Total 91.2 N/A — Total 2.3 31

LOAN PORTFOLIO DETAIL AND CREDIT OVERVIEW
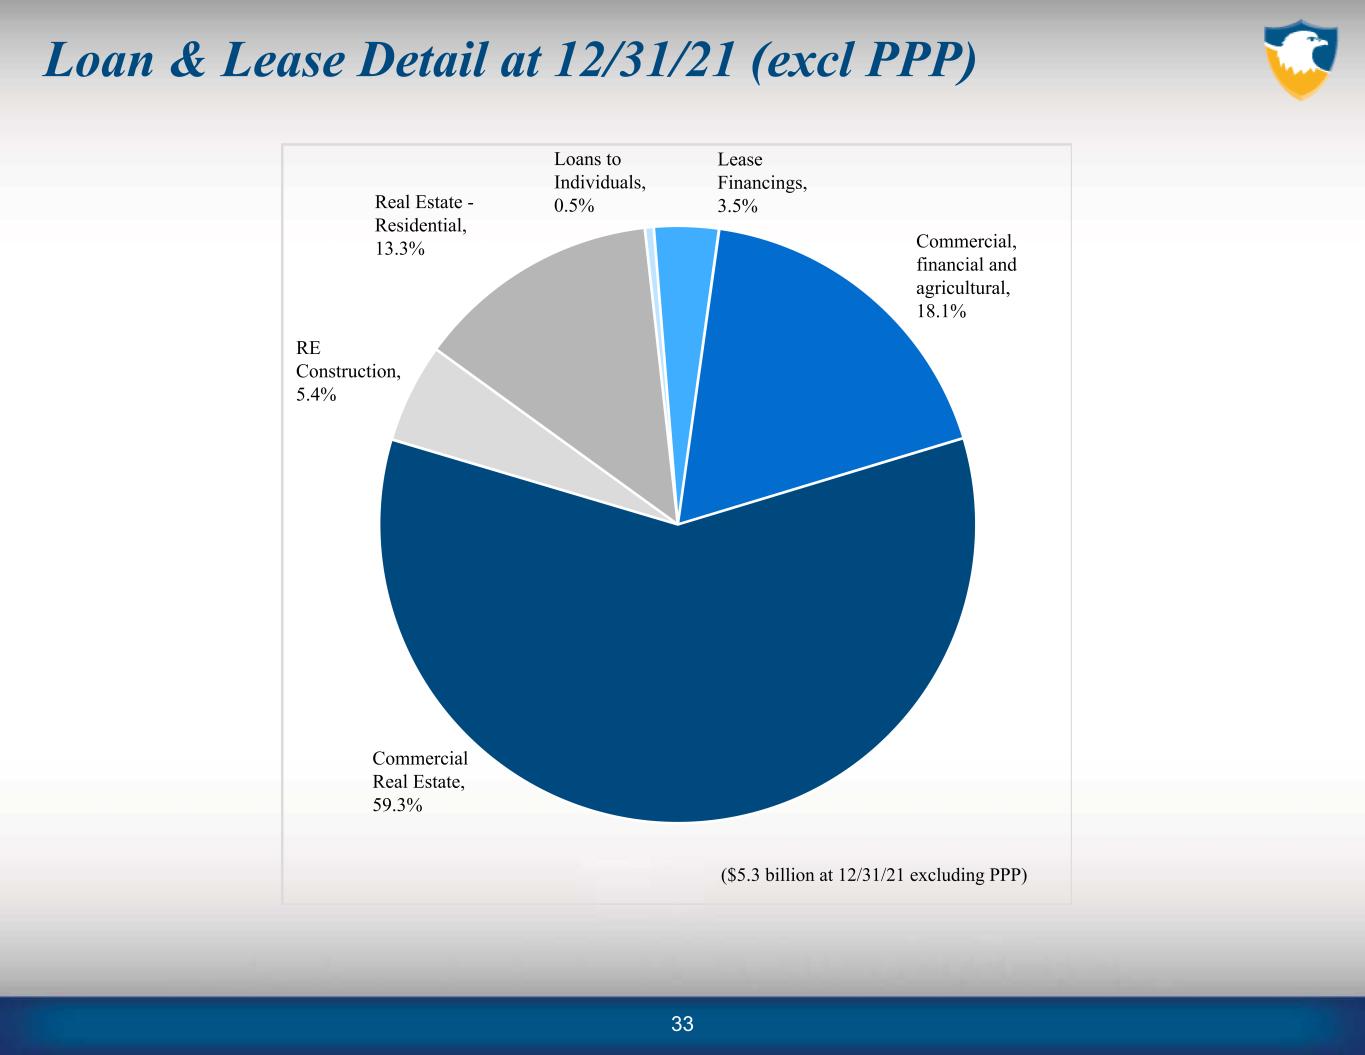
Commercial, financial and agricultural, 18.1% Commercial Real Estate, 59.3% RE Construction, 5.4% Real Estate - Residential, 13.3% Loans to Individuals, 0.5% Lease Financings, 3.5% Loan & Lease Detail at 12/31/21 (excl PPP) ($5.3 billion at 12/31/21 excluding PPP) 33
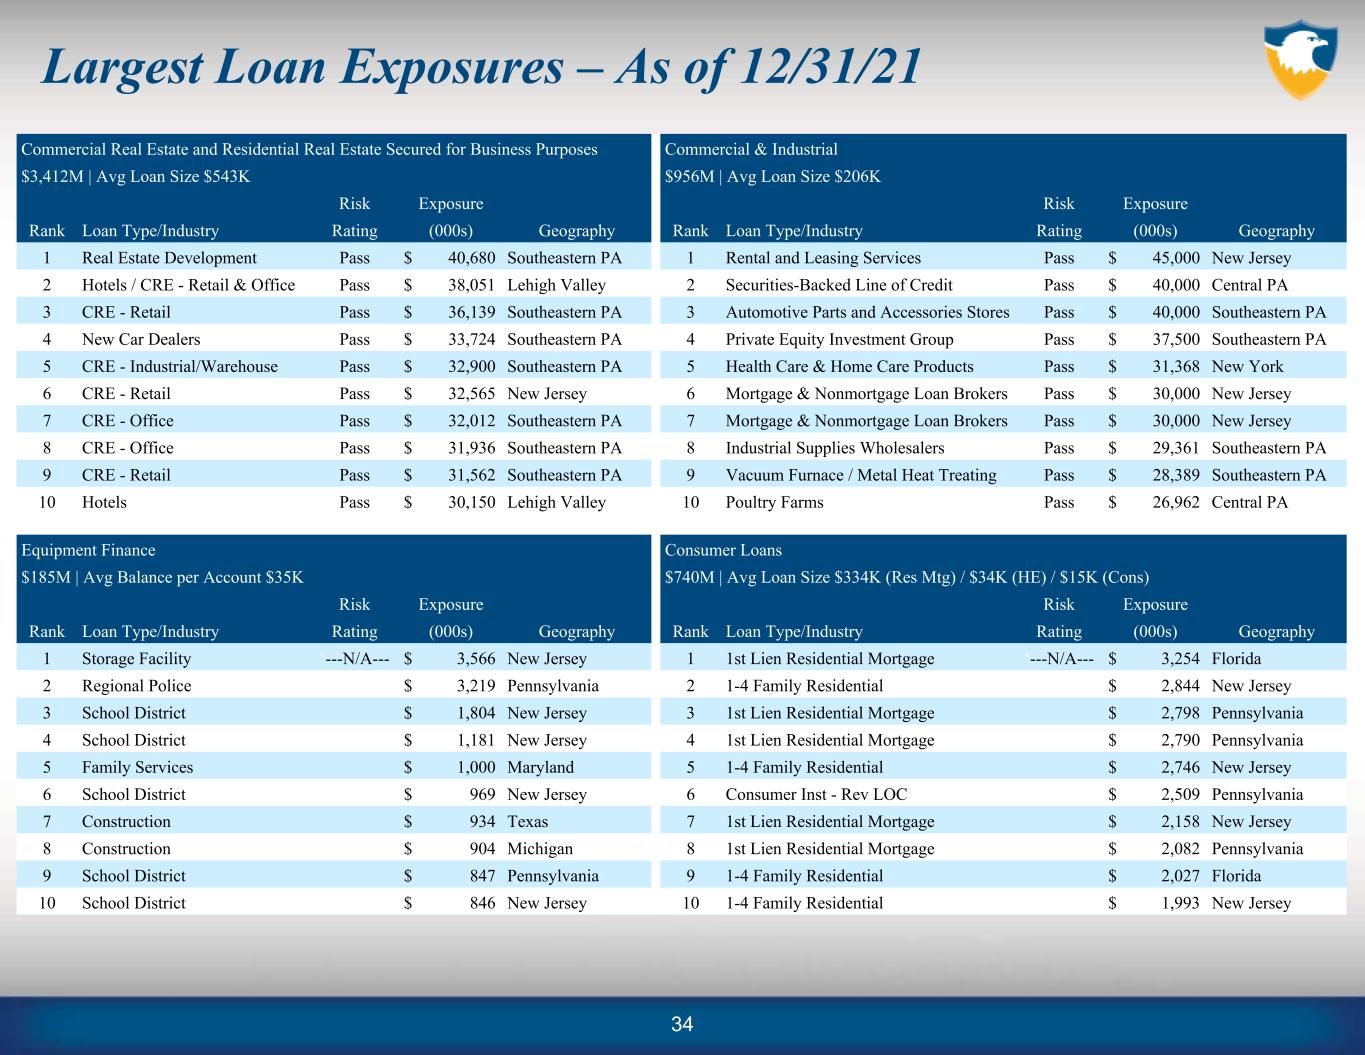
Largest Loan Exposures – As of 12/31/21 34 Commercial Real Estate and Residential Real Estate Secured for Business Purposes Commercial & Industrial $3,412M | Avg Loan Size $543K $956M | Avg Loan Size $206K Risk Exposure Risk Exposure Rank Loan Type/Industry Rating (000s) Geography Rank Loan Type/Industry Rating (000s) Geography 1 Real Estate Development Pass $ 40,680 Southeastern PA 1 Rental and Leasing Services Pass $ 45,000 New Jersey 2 Hotels / CRE - Retail & Office Pass $ 38,051 Lehigh Valley 2 Securities-Backed Line of Credit Pass $ 40,000 Central PA 3 CRE - Retail Pass $ 36,139 Southeastern PA 3 Automotive Parts and Accessories Stores Pass $ 40,000 Southeastern PA 4 New Car Dealers Pass $ 33,724 Southeastern PA 4 Private Equity Investment Group Pass $ 37,500 Southeastern PA 5 CRE - Industrial/Warehouse Pass $ 32,900 Southeastern PA 5 Health Care & Home Care Products Pass $ 31,368 New York 6 CRE - Retail Pass $ 32,565 New Jersey 6 Mortgage & Nonmortgage Loan Brokers Pass $ 30,000 New Jersey 7 CRE - Office Pass $ 32,012 Southeastern PA 7 Mortgage & Nonmortgage Loan Brokers Pass $ 30,000 New Jersey 8 CRE - Office Pass $ 31,936 Southeastern PA 8 Industrial Supplies Wholesalers Pass $ 29,361 Southeastern PA 9 CRE - Retail Pass $ 31,562 Southeastern PA 9 Vacuum Furnace / Metal Heat Treating Pass $ 28,389 Southeastern PA 10 Hotels Pass $ 30,150 Lehigh Valley 10 Poultry Farms Pass $ 26,962 Central PA Equipment Finance Consumer Loans $185M | Avg Balance per Account $35K $740M | Avg Loan Size $334K (Res Mtg) / $34K (HE) / $15K (Cons) Risk Exposure Risk Exposure Rank Loan Type/Industry Rating (000s) Geography Rank Loan Type/Industry Rating (000s) Geography 1 Storage Facility ‘---N/A--- $ 3,566 New Jersey 1 1st Lien Residential Mortgage ‘---N/A--- $ 3,254 Florida 2 Regional Police $ 3,219 Pennsylvania 2 1-4 Family Residential $ 2,844 New Jersey 3 School District $ 1,804 New Jersey 3 1st Lien Residential Mortgage $ 2,798 Pennsylvania 4 School District $ 1,181 New Jersey 4 1st Lien Residential Mortgage $ 2,790 Pennsylvania 5 Family Services $ 1,000 Maryland 5 1-4 Family Residential $ 2,746 New Jersey 6 School District $ 969 New Jersey 6 Consumer Inst - Rev LOC $ 2,509 Pennsylvania 7 Construction $ 934 Texas 7 1st Lien Residential Mortgage $ 2,158 New Jersey 8 Construction $ 904 Michigan 8 1st Lien Residential Mortgage $ 2,082 Pennsylvania 9 School District $ 847 Pennsylvania 9 1-4 Family Residential $ 2,027 Florida 10 School District $ 846 New Jersey 10 1-4 Family Residential $ 1,993 New Jersey
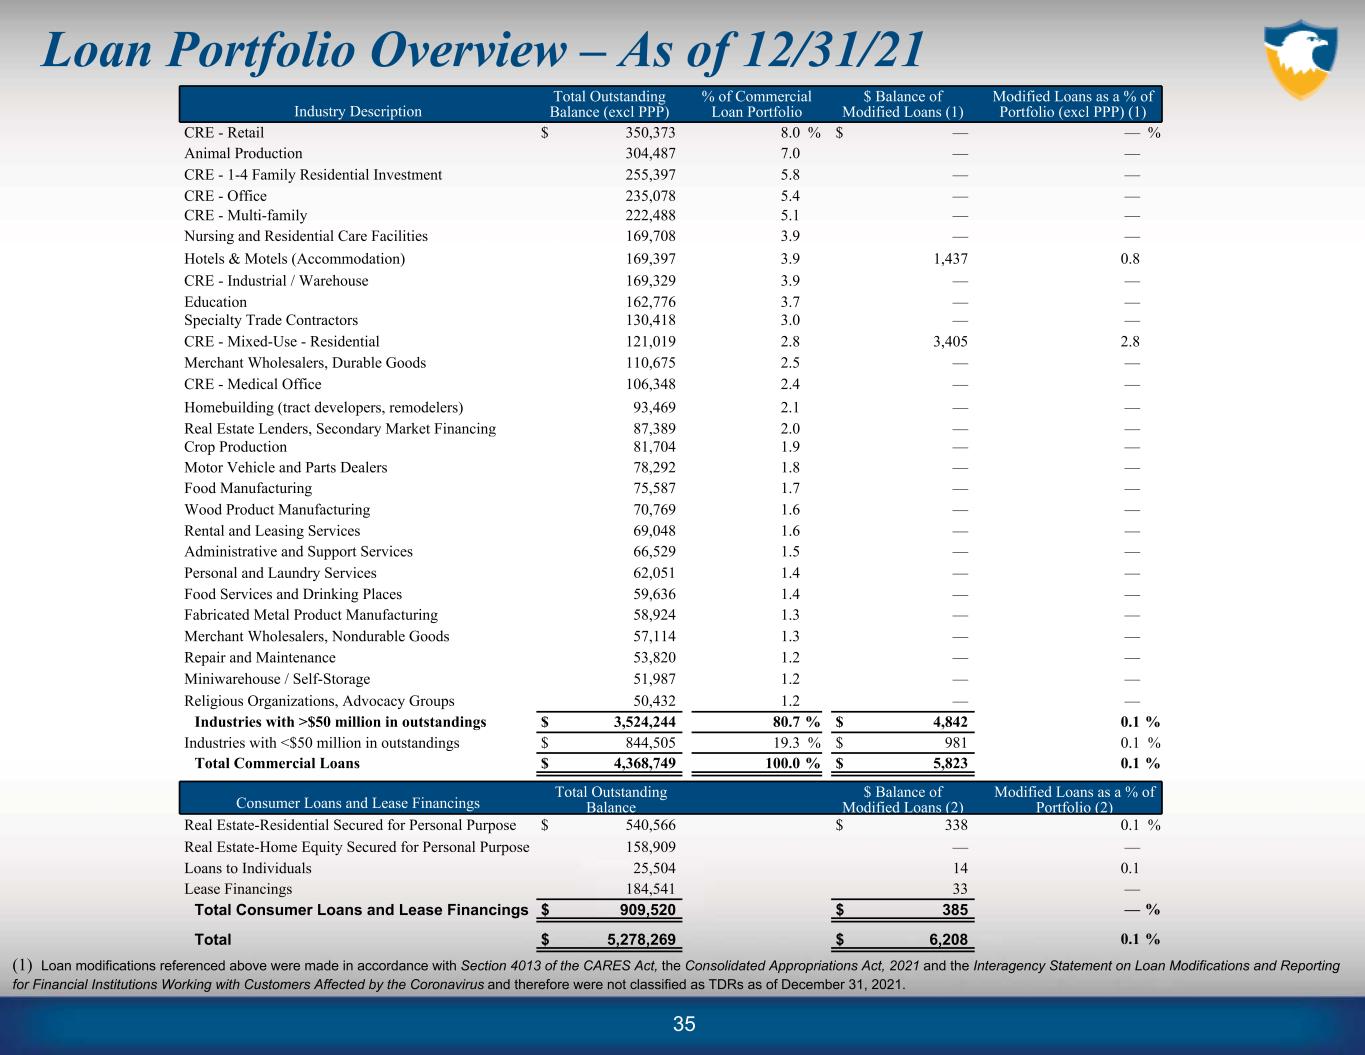
Loan Portfolio Overview – As of 12/31/21 35 Industry Description Total Outstanding Balance (excl PPP) % of Commercial Loan Portfolio $ Balance of Modified Loans (1) Modified Loans as a % of Portfolio (excl PPP) (1) CRE - Retail $ 350,373 8.0 % $ — — % Animal Production 304,487 7.0 — — CRE - 1-4 Family Residential Investment 255,397 5.8 — — CRE - Office 235,078 5.4 — — CRE - Multi-family 222,488 5.1 — — Nursing and Residential Care Facilities 169,708 3.9 — — Hotels & Motels (Accommodation) 169,397 3.9 1,437 0.8 CRE - Industrial / Warehouse 169,329 3.9 — — Education 162,776 3.7 — — Specialty Trade Contractors 130,418 3.0 — — CRE - Mixed-Use - Residential 121,019 2.8 3,405 2.8 Merchant Wholesalers, Durable Goods 110,675 2.5 — — CRE - Medical Office 106,348 2.4 — — Homebuilding (tract developers, remodelers) 93,469 2.1 — — Real Estate Lenders, Secondary Market Financing 87,389 2.0 — — Crop Production 81,704 1.9 — — Motor Vehicle and Parts Dealers 78,292 1.8 — — Food Manufacturing 75,587 1.7 — — Wood Product Manufacturing 70,769 1.6 — — Rental and Leasing Services 69,048 1.6 — — Administrative and Support Services 66,529 1.5 — — Personal and Laundry Services 62,051 1.4 — — Food Services and Drinking Places 59,636 1.4 — — Fabricated Metal Product Manufacturing 58,924 1.3 — — Merchant Wholesalers, Nondurable Goods 57,114 1.3 — — Repair and Maintenance 53,820 1.2 — — Miniwarehouse / Self-Storage 51,987 1.2 — — Religious Organizations, Advocacy Groups 50,432 1.2 — — Industries with >$50 million in outstandings $ 3,524,244 80.7 % $ 4,842 0.1 % Industries with <$50 million in outstandings $ 844,505 19.3 % $ 981 0.1 % Total Commercial Loans $ 4,368,749 100.0 % $ 5,823 0.1 % Consumer Loans and Lease Financings Total Outstanding Balance $ Balance of Modified Loans (2) Modified Loans as a % of Portfolio (2) Real Estate-Residential Secured for Personal Purpose $ 540,566 $ 338 0.1 % Real Estate-Home Equity Secured for Personal Purpose 158,909 — — Loans to Individuals 25,504 14 0.1 Lease Financings 184,541 33 — Total Consumer Loans and Lease Financings $ 909,520 $ 385 — % Total $ 5,278,269 $ 6,208 0.1 % (1) Loan modifications referenced above were made in accordance with Section 4013 of the CARES Act, the Consolidated Appropriations Act, 2021 and the Interagency Statement on Loan Modifications and Reporting for Financial Institutions Working with Customers Affected by the Coronavirus and therefore were not classified as TDRs as of December 31, 2021.

Credit Infrastructure • Experienced credit team • Conservative credit culture • Centralized credit approval process ◦ Low levels of authority in the field • Rigorous underwriting and disciplined committee approval required Approval Process Risk Management Process Owns Borrower Relationship Business/Industry Expertise or Analysis Underwriting Process Transaction Structure Negotiations Term Sheet Owns Borrower Risk Risk Assessment/Analysis Portfolio Risk Assessment Credit Risk Structure Approval Sign-off Independent Loan Review Shared Approval Process Line of Business Credit/Risk 36

• Limited single signature lending authority. Joint signature up to $5.0MM, then management level loan committee for the largest exposures. ◦ Itemized report of all approvals to weekly Officer Loan Committee. • Robust independent loan review process. Quarterly review cycle. • Credit Officer involvement in all relationships > $1.5MM, exceptions to Officer Loan Committee. • Generally, lending is in Pennsylvania, Delaware, New Jersey and Maryland. • Management of risk appetite through quarterly reporting to ERM Committee. ◦ In-House commercial concentrations levels vs. policy limits, out of market lending report, largest commercial borrowers, regulatory concentrations vs. risk based capital, CRE regulatory guidance report. • CRE portfolio trends and market analysis, with stress testing, presented annually to ERM Committee, meeting regulatory expectations for portfolio stress testing. • Independent departments for appraisal and environmental report ordering, construction loan disbursement and monitoring and loan grading risk assessments. • Chief Risk Officer (Megan Santana) reports directly to the Board of Directors. Credit Overview 37
LINE OF BUSINESS OVERVIEW
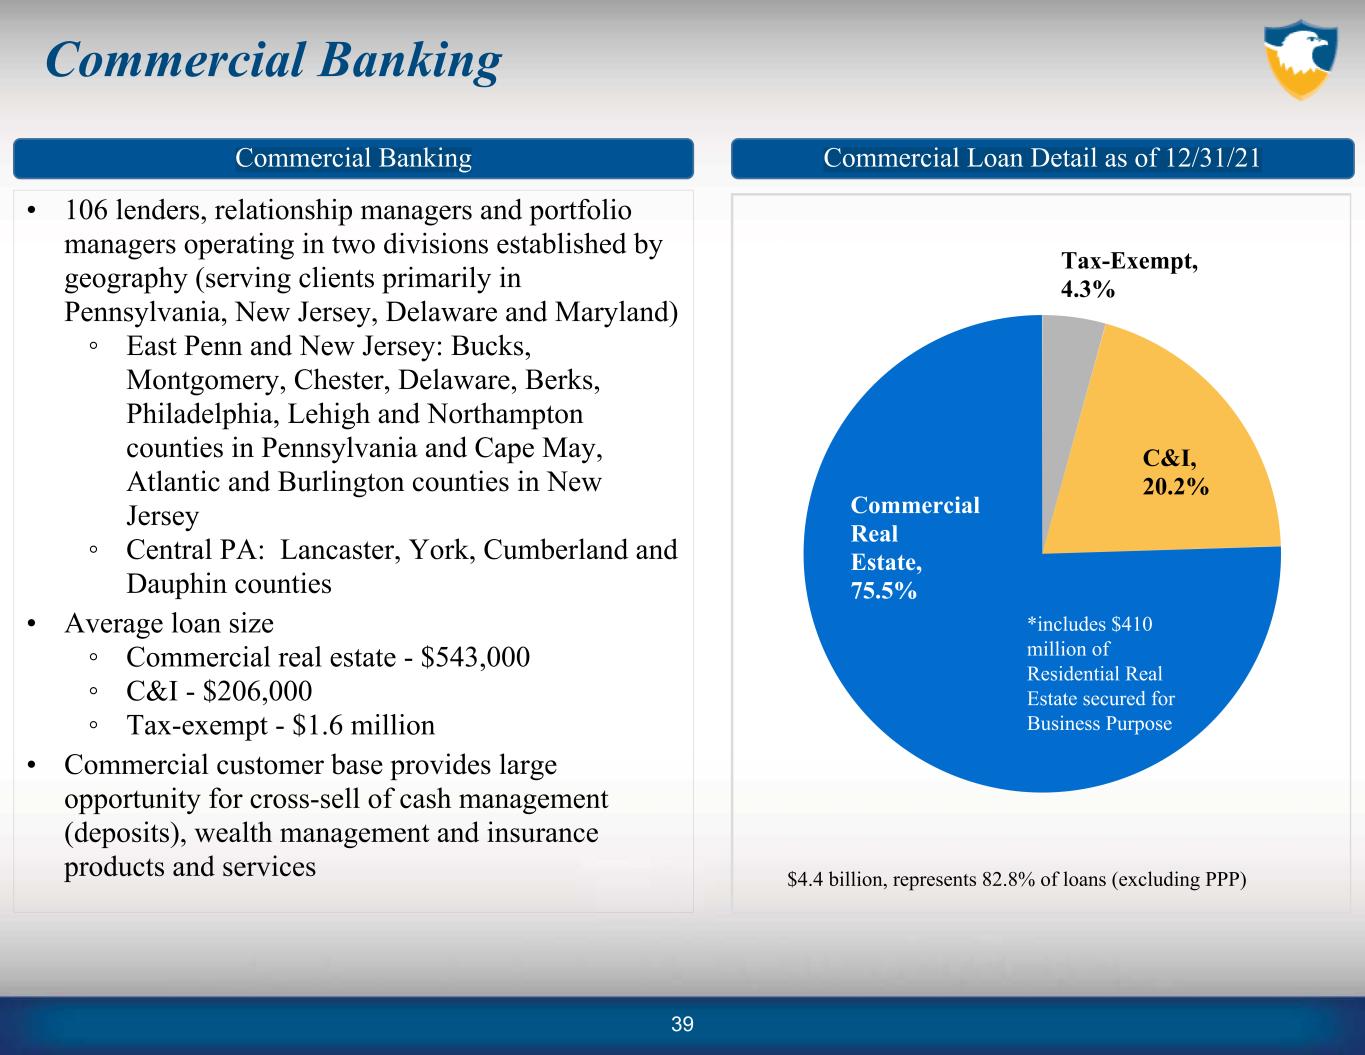
Commercial Banking • 106 lenders, relationship managers and portfolio managers operating in two divisions established by geography (serving clients primarily in Pennsylvania, New Jersey, Delaware and Maryland) ◦ East Penn and New Jersey: Bucks, Montgomery, Chester, Delaware, Berks, Philadelphia, Lehigh and Northampton counties in Pennsylvania and Cape May, Atlantic and Burlington counties in New Jersey ◦ Central PA: Lancaster, York, Cumberland and Dauphin counties • Average loan size ◦ Commercial real estate - $543,000 ◦ C&I - $206,000 ◦ Tax-exempt - $1.6 million • Commercial customer base provides large opportunity for cross-sell of cash management (deposits), wealth management and insurance products and services Commercial Loan Detail as of 12/31/21Commercial Banking Tax-Exempt, 4.3% C&I, 20.2% Commercial Real Estate, 75.5% $4.4 billion, represents 82.8% of loans (excluding PPP) *includes $410 million of Residential Real Estate secured for Business Purpose 39

Consumer Banking • 33 financial service centers located in Bucks, Chester, Lancaster, Lehigh, Montgomery, Northampton, Philadelphia, Dauphin and York counties in PA and Ocean City, NJ; also operating 14 retirement centers in Bucks and Montgomery counties and 4 regional locations (Mechanicsburg/Berks/Bucks/York) • Proactively addressed continued reduction in transactional volume by closing 21 financial centers since September 2015; Reinvesting savings in our digital solutions and expanded operating footprint ◦ Financial centers staffed by combination of personal bankers and tellers, providing both transaction and consultative services augmented by technology ◦ Focused on creating seamless customer experience between in-person and digital ◦ Growth strategy focused on obtaining consumer business from commercial customers and their employee base 40
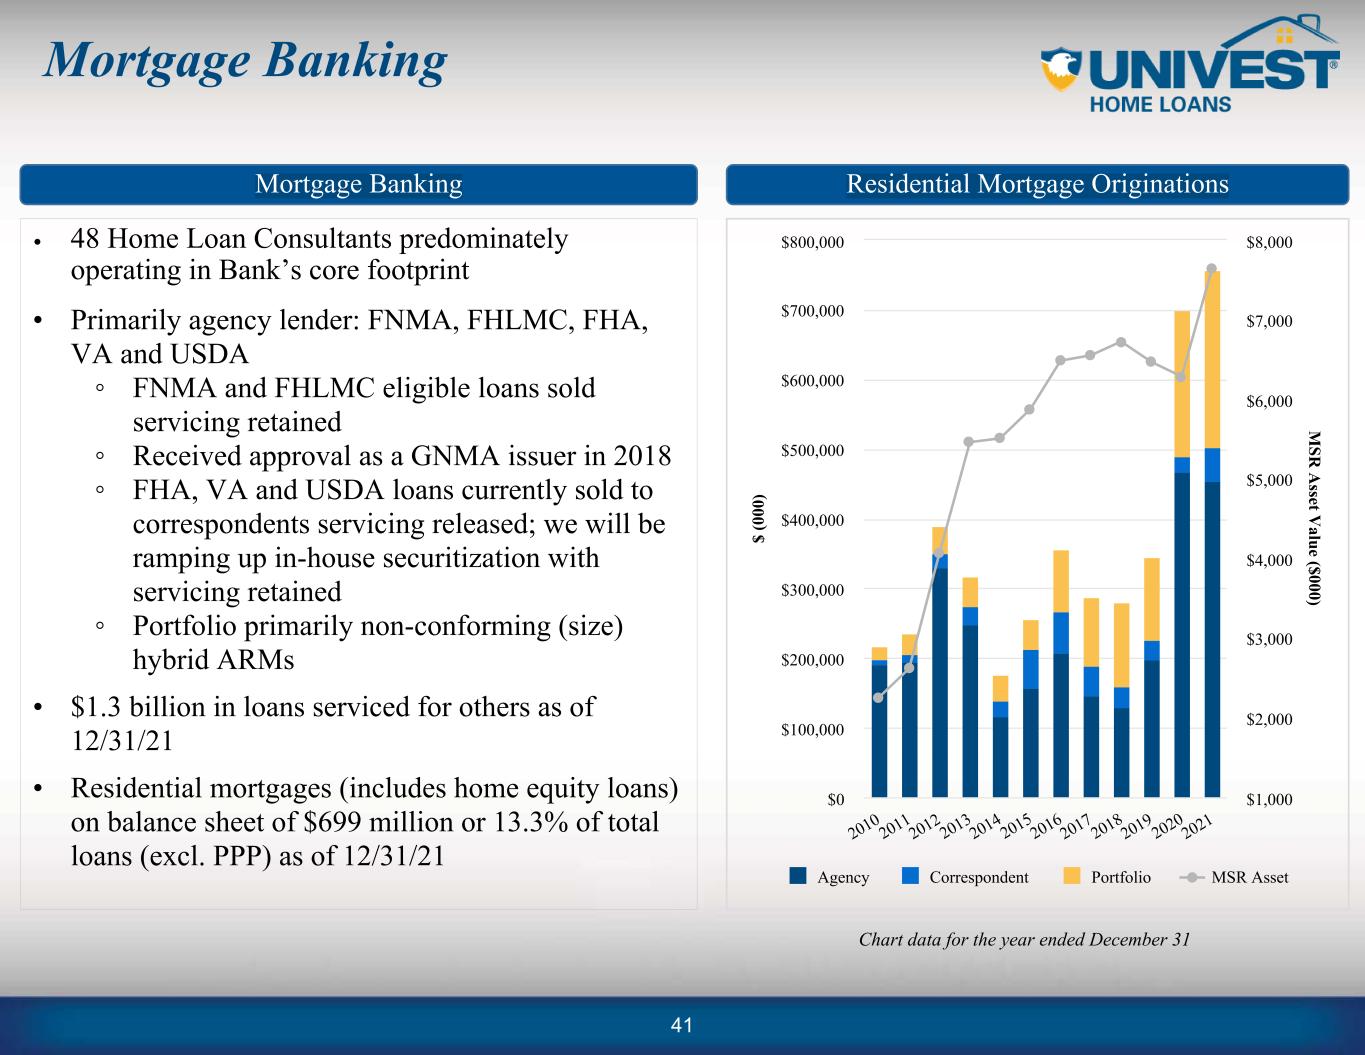
Mortgage Banking • 48 Home Loan Consultants predominately operating in Bank’s core footprint • Primarily agency lender: FNMA, FHLMC, FHA, VA and USDA ◦ FNMA and FHLMC eligible loans sold servicing retained ◦ Received approval as a GNMA issuer in 2018 ◦ FHA, VA and USDA loans currently sold to correspondents servicing released; we will be ramping up in-house securitization with servicing retained ◦ Portfolio primarily non-conforming (size) hybrid ARMs • $1.3 billion in loans serviced for others as of 12/31/21 • Residential mortgages (includes home equity loans) on balance sheet of $699 million or 13.3% of total loans (excl. PPP) as of 12/31/21 Chart data for the year ended December 31 Residential Mortgage OriginationsMortgage Banking 41 $ (0 00 ) M SR A sset V alue ($000) Agency Correspondent Portfolio MSR Asset 2010 2011 2012 2013 2014 2015 2016 2017 2018 2019 2020 2021 $0 $100,000 $200,000 $300,000 $400,000 $500,000 $600,000 $700,000 $800,000 $1,000 $2,000 $3,000 $4,000 $5,000 $6,000 $7,000 $8,000

Univest Capital, Inc. • Equipment financing business with $185 million in lease receivables as of 12/31/21 ◦ Average lease size $35,000, typically with four-year term ◦ Primary industries served: health care, education/office, automotive, golf/turf, technology and energy • Manage residual risk by primarily using $1 buyout leases and equipment finance agreements (~$1.2 million of residuals as of 12/31/21) Lease FinancingUnivest Capital Chart data as of December 31 42 $ (0 00 ) Y ield Commercial Government Yield 2010 2011 2012 2013 2014 2015 2016 2017 2018 2019 2020 2021 — 30,000 60,000 90,000 120,000 150,000 180,000 210,000 —% 2.00% 4.00% 6.00% 8.00% 10.00%
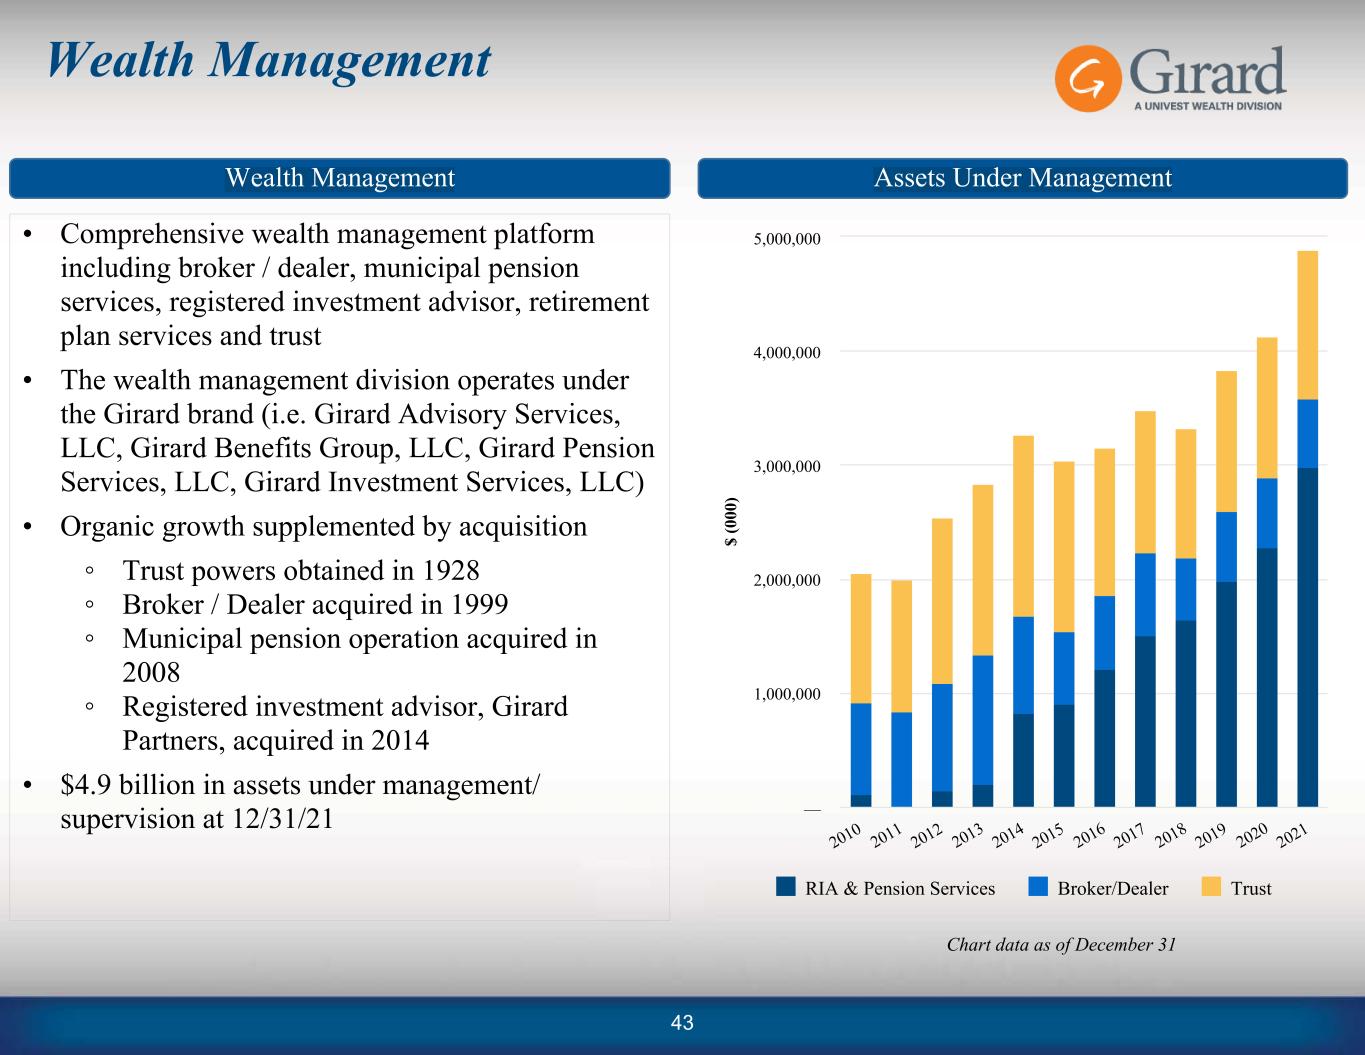
Wealth Management • Comprehensive wealth management platform including broker / dealer, municipal pension services, registered investment advisor, retirement plan services and trust • The wealth management division operates under the Girard brand (i.e. Girard Advisory Services, LLC, Girard Benefits Group, LLC, Girard Pension Services, LLC, Girard Investment Services, LLC) • Organic growth supplemented by acquisition ◦ Trust powers obtained in 1928 ◦ Broker / Dealer acquired in 1999 ◦ Municipal pension operation acquired in 2008 ◦ Registered investment advisor, Girard Partners, acquired in 2014 • $4.9 billion in assets under management/ supervision at 12/31/21 Assets Under ManagementWealth Management Chart data as of December 31 $ (0 00 ) RIA & Pension Services Broker/Dealer Trust 2010 2011 2012 2013 2014 2015 2016 2017 2018 2019 2020 2021 — 1,000,000 2,000,000 3,000,000 4,000,000 5,000,000 43

Insurance • Independent insurance agency with more than 60 carrier relationships • Full service agency providing commercial and personal lines, employee benefits and HR consulting solutions • Built via a series of eight acquisitions beginning in 2000 ◦ On December 1, 2021, Univest acquired certain assets of the Paul I. Sheaffer Insurance Agency located in Central PA. • Agent for written premiums of $195 million as of 12/31/21. This includes $15 million from the Sheaffer acquisition Agent Written PremiumsInsurance Chart data as of December 31 $ (0 00 ) Commercial Personal Employee Benefits 2010 2011 2012 2013 2014 2015 2016 2017 2018 2019 2020 2021 — 25,000 50,000 75,000 100,000 125,000 150,000 175,000 200,000 225,000 44
APPENDIX (Non-GAAP Reconciliations)

Appendix – Non-GAAP Reconciliations (1) Amount does not include mortgage servicing rights This presentation includes financial information determined by methods other than in accordance with U.S. generally accepted accounting principles (“GAAP”). The management of Univest Financial Corporation uses these non-GAAP measures in its analysis of the Corporation's performance. These measures should not be considered a substitute for GAAP basis measures nor should they be viewed as a substitute for operating results determined in accordance with GAAP. Management believes the presentation of the non-GAAP financial measures, which exclude the impact of the specified items, provides useful supplemental information that is essential to a proper understanding of the financial results of the Corporation. See below tables for additional information. $s in millions Q1 17 Q2 17 Q3 17 Q4 17 Q1 18 Q2 18 Q3 18 Q4 18 Q1 19 Q2 19 Q3 19 Q4 19 Q1 20 Q2 20 Q3 20 Q4 20 Q1 21 Q2 21 Q3 21 Q4 21 1. Tangible Common Equity Shareholders' Equity $ 511.9 $ 521.3 $ 528.8 $ 603.4 $ 606.7 $ 605.3 $ 614.2 $ 624.1 $ 637.6 $ 651.7 $ 664.3 $ 675.1 $ 651.6 $ 654.9 $ 669.1 $ 692.5 $ 722.5 $ 740.0 $ 756.0 $ 773.8 Less: Goodwill 172.6 172.6 172.6 172.6 172.6 172.6 172.6 172.6 172.6 172.6 172.6 172.6 172.6 172.6 172.6 172.6 172.6 172.6 172.6 175.5 Less: Other Intangibles(1) 9.2 8.6 8.0 7.4 6.9 6.4 5.9 5.4 4.9 4.5 4.2 3.8 3.5 3.1 2.9 2.6 2.3 2.1 1.9 4.2 Tangible Common Equity $ 330.1 $ 340.2 $ 348.3 $ 423.4 $ 427.3 $ 426.4 $ 435.8 $ 446.1 $ 460.2 $ 474.6 $ 487.6 $ 498.7 $ 475.5 $ 479.2 $ 493.7 $ 517.3 $ 547.6 $ 565.4 $ 581.5 $ 594.1 2. Average Tangible Common Equity Average Shareholders' Equity $ 509.1 $ 517.7 $ 527.0 $ 554.1 $ 606.0 $ 611.7 $ 611.8 $ 619.2 $ 631.6 $ 645.5 $ 659.5 $ 672.6 $ 673.5 $ 661.0 $ 661.9 $ 676.4 $ 699.7 $ 728.8 $ 746.2 $ 762.3 Less: Average Goodwill 172.6 172.6 172.6 172.6 172.6 172.6 172.6 172.6 172.6 172.6 172.6 172.6 172.6 172.6 172.6 172.6 172.6 172.6 172.6 173.6 Less: Average Other Intangibles(1) 9.5 8.9 8.3 7.7 7.2 6.6 6.1 5.7 5.1 4.8 4.4 4.0 3.7 3.3 3.0 2.7 2.5 2.2 2.0 2.7 Average Tangible Common Equity $ 327.0 $ 336.2 $ 346.2 $ 373.8 $ 426.3 $ 432.5 $ 433.1 $ 441.0 $ 453.9 $ 468.2 $ 482.6 $ 496.1 $ 497.2 $ 485.1 $ 486.4 $ 501.1 $ 524.7 $ 554.0 $ 571.6 $ 586.1 3. Core Net Interest Income excluding PPP Net Interest Income $ 34.3 $ 35.3 $ 36.9 $ 36.7 $ 37.3 $ 39.0 $ 40.4 $ 41.4 $ 41.5 $ 42.6 $ 42.6 $ 42.4 $ 42.5 $ 43.5 $ 43.9 $ 44.5 $ 45.4 $ 46.8 $ 48.7 $ 47.5 Tax Equivalent Interest Income 1.4 1.4 1.4 1.4 0.7 0.7 0.7 0.7 0.7 0.7 0.6 0.6 0.7 0.6 0.6 0.6 0.5 0.5 0.5 0.5 Net Interest Income Tax Equivalent $ 35.7 $ 36.7 $ 38.3 $ 38.1 $ 37.9 $ 39.7 $ 41.1 $ 42.0 $ 42.2 $ 43.3 $ 43.3 $ 43.1 $ 43.1 $ 44.2 $ 44.5 $ 45.1 $ 46.0 $ 47.3 $ 49.2 $ 48.0 Less: Purchase Accounting Net Interest Income 0.8 0.7 1.1 0.4 0.1 0.3 0.3 0.2 0.1 0.2 0.1 0.4 — — 0.1 (0.1) 0.2 — — — Less: PPP Net Interest Income — — — — — — — — — — — — — 2.0 2.7 3.1 4.5 4.8 4.2 1.6 Core Net Interest Income excluding PPP $ 33.5 $ 34.6 $ 35.8 $ 36.3 $ 37.1 $ 38.6 $ 40.1 $ 41.2 $ 41.5 $ 42.4 $ 42.6 $ 42.0 $ 42.5 $ 41.5 $ 41.1 $ 41.5 $ 40.7 $ 42.0 $ 44.6 $ 46.0 4. Core Noninterest Expense & Core Noninterest Expense, excluding PA shares tax Noninterest expense $ 32.0 $ 32.5 $ 32.7 $ 33.4 $ 35.1 $ 34.3 $ 34.4 $ 33.4 $ 35.6 $ 36.8 $ 36.3 $ 37.5 $ 38.8 $ 36.0 $ 38.5 $ 41.7 $ 39.5 $ 41.3 $ 43.2 $ 43.3 Less: Restructuring costs — — — — 0.6 — — — — — — — — — — 1.4 — — — — Plus: FDIC Small Bank Assessment Credit — — — — — — — — — — 1.0 0.1 — — — — — — — — Plus: Capitalized compensation for PPP Loans — — — — — — — — — — — — — 1.3 — — 0.6 — — — Core Noninterest Expense $ 32.0 $ 32.5 $ 32.7 $ 33.4 $ 34.6 $ 34.3 $ 34.4 $ 33.4 $ 35.6 $ 36.8 $ 37.3 $ 37.6 $ 38.8 $ 37.2 $ 38.5 $ 40.3 $ 40.1 $ 41.3 $ 43.2 $ 43.3 Less: Bank Capital Stock Tax Expense 0.9 0.9 0.9 0.9 1.0 1.0 1.0 0.9 1.0 1.0 1.0 1.0 1.1 1.1 1.1 1.1 1.1 1.2 1.2 1.2 Core Noninterest Expense, excl PA shares tax $ 31.1 $ 31.6 $ 31.8 $ 32.5 $ 33.6 $ 33.4 $ 33.4 $ 32.5 $ 34.6 $ 35.8 $ 36.3 $ 36.6 $ 37.7 $ 36.1 $ 37.4 $ 39.2 $ 39.0 $ 40.1 $ 42.1 $ 42.1 46

Appendix – Non-GAAP Reconciliations (cont.) *Based upon a pro forma 21% tax rate for all periods presented. 47 $s in millions Q1 17 Q2 17 Q3 17 Q4 17 Q1 18 Q2 18 Q3 18 Q4 18 Q1 19 Q2 19 Q3 19 Q4 19 Q1 20 Q2 20 Q3 20 Q4 20 Q1 21 Q2 21 Q3 21 Q4 21 5. Core Tax Equivalent Revenue Total Revenue $ 49.3 $ 51.3 $ 51.0 $ 50.9 $ 52.9 $ 54.3 $ 55.3 $ 55.8 $ 57.8 $ 59.0 $ 59.2 $ 58.6 $ 60.9 $ 61.5 $ 65.7 $ 64.7 $ 68.7 $ 67.0 $ 69.2 $ 66.7 Plus: Tax Equivalent Adjustment 1.1 1.3 1.0 1.1 0.8 1.0 0.9 0.8 0.9 0.9 0.8 0.8 0.8 0.8 0.8 0.8 0.7 1.0 0.8 0.7 Tax Equivalent Revenue* $ 50.3 $ 52.6 $ 52.0 $ 51.9 $ 53.7 $ 55.3 $ 56.2 $ 56.6 $ 58.7 $ 59.8 $ 60.1 $ 59.4 $ 61.7 $ 62.4 $ 66.5 $ 65.4 $ 69.4 $ 68.0 $ 70.0 $ 67.4 Less: BOLI Death Benefits (Tax Equivalent) — 1.4 — — — 0.7 — — — — — — — — — — — 1.1 0.3 — Less: PPP Net Interest Income — — — — — — — — — — — — — 2.0 2.7 3.1 4.5 4.8 4.2 1.6 Core Tax Equivalent Revenue $ 50.3 $ 51.2 $ 52.0 $ 51.9 $ 53.7 $ 54.6 $ 56.2 $ 56.6 $ 58.7 $ 59.8 $ 60.1 $ 59.4 $ 61.7 $ 60.3 $ 63.7 $ 62.3 $ 64.9 $ 62.1 $ 65.6 $ 65.9 6. Core Pre-Tax Pre-Provision Income less Net Charge-offs ("PTPP-NCO") Pre-Tax Income $ 14.8 $ 16.0 $ 15.6 $ 15.4 $ 15.7 $ 4.5 $ 18.2 $ 22.3 $ 19.6 $ 20.1 $ 21.4 $ 18.9 $ 0.2 $ 1.8 $ 23.2 $ 31.6 $ 40.4 $ 25.8 $ 26.2 $ 22.0 Plus: Provision for Credit Losses 2.4 2.8 2.7 2.0 2.1 15.4 2.7 0.1 2.7 2.1 1.5 2.2 21.8 23.7 3.9 (8.7) (11.3) (0.1) (0.2) 1.4 Less: BOLI Death Benefits — 0.9 — — — 0.4 — — — — — — — — — — — 0.9 0.2 — Plus: Restructuring Charges — — — — 0.6 — — — — — — — — — — 1.4 — — — — Less: Net Charge-offs 0.4 1.4 3.1 1.0 0.2 13.2 1.0 (1.9) 0.4 1.1 0.5 0.6 0.5 3.6 — 0.6 0.3 0.2 (0.1) (0.2) Less: FDIC Small Bank Assessment Credit — — — — — — — — — — 1.0 0.1 — — — — — — — — Less: PPP Activity — — — — — — — — — — — — — 3.3 2.7 3.1 5.1 4.8 4.2 1.6 Core PTPP-NCO $ 16.8 $ 16.5 $ 15.2 $ 16.4 $ 18.1 $ 6.3 $ 19.9 $ 24.3 $ 21.8 $ 21.1 $ 21.5 $ 20.4 $ 21.6 $ 18.7 $ 24.5 $ 20.6 $ 23.7 $ 19.8 $ 21.7 $ 22.0 7. Average Interest Earning Assets excluding Excess Liquidity and PPP Loans Average Interest Earning Assets $ 3,811.7 $ 3,917.7 $ 3,999.1 $ 4,022.6 $ 4,140.7 $ 4,263.6 $ 4,397.5 $ 4,478.9 $ 4,562.5 $ 4,729.1 $ 4,875.1 $ 4,962.7 $ 4,980.0 $ 5,591.5 $ 5,852.1 $ 5,949.3 $ 5,964.2 $ 6,016.0 $ 6,272.6 $ 6,667.6 Less: PPP Loans — — — — — — — — — — — — — 370.7 500.5 497.0 506.9 408.9 162.6 53.7 Less: Excess Liquidity — — — — — — 40.7 49.8 — 62.6 173.6 165.6 78.1 273.7 328.2 256.3 197.5 175.3 490.2 874.3 Avg Int Earning Assets excl. Excess Liq. & PPP $ 3,811.7 $ 3,917.7 $ 3,999.1 $ 4,022.6 $ 4,140.7 $ 4,263.6 $ 4,356.8 $ 4,429.2 $ 4,562.5 $ 4,666.4 $ 4,701.4 $ 4,797.1 $ 4,901.9 $ 4,947.1 $ 5,023.4 $ 5,196.0 $ 5,259.7 $ 5,431.7 $ 5,619.8 $ 5,739.5 8. Average Assets Excluding PPP Average Assets $ 4,230.4 $ 4,333.7 $ 4,416.3 $ 4,442.7 $ 4,556.0 $ 4,682.8 $ 4,817.3 $ 4,890.5 $ 5,004.3 $ 5,170.4 $ 5,317.9 $ 5,400.6 $ 5,409.6 $ 6,000.8 $ 6,265.6 $ 6,353.5 $ 6,383.5 $ 6,443.6 $ 6,698.2 $ 7,088.3 Less: Average PPP Loans — — — — — — — — — — — — — 370.7 500.5 497.0 506.9 408.9 162.6 53.7 Average Assets Excluding PPP $ 4,230.4 $ 4,333.7 $ 4,416.3 $ 4,442.7 $ 4,556.0 $ 4,682.8 $ 4,817.3 $ 4,890.5 $ 5,004.3 $ 5,170.4 $ 5,317.9 $ 5,400.6 $ 5,409.6 $ 5,630.1 $ 5,765.1 $ 5,856.5 $ 5,876.5 $ 6,034.7 $ 6,535.6 $ 7,034.5


