As filed with the Securities and Exchange Commission on August 25, 2006
Registration No. 333-
Investment Company Act File No. 811-07811
UNITED STATES SECURITIES AND EXCHANGE COMMISSION
WASHINGTON, D.C. 20549
FORM N-14
REGISTRATION STATEMENT UNDER THE SECURITIES ACT OF 1933 x
o PRE-EFFECTIVE AMENDMENT NO.
o POST-EFFECTIVE AMENDMENT NO.
JENNISON U.S. EMERGING GROWTH FUND, INC.
(Exact Name of Registrant as Specified in Charter)
Gateway Center Three, 100 Mulberry Street, Newark, New Jersey 07102-4077
(Address of Principal Executive Offices)
(973) 367-7521
(Registrant’s Telephone Number)
Deborah A. Docs, Esq.
Gateway Center Three
100 Mulberry Street
Newark, New Jersey 07102-4077
(Name and Address of Agent for Service)
with a copy to :
William G. Farrar, Esq.
Sullivan & Cromwell LLP
125 Broad Street
New York, New York 10004
(212) 558-4000
Approximate Date of Proposed Public Offering: As soon as practicable after this Registration Statement becomes effective under the Securities Act of 1933.
Title of the securities being registered: Shares of common stock, par value $0.001 per share of Jennison U.S. Emerging Growth Fund, Inc.
No filing fee is due because Registrant is relying on Section 24(f) of the Investment Company Act of 1940, as amended.
It is proposed that this filing become effective on September [6], 2006, pursuant to Rule 488(a) under the Securities Act of 1933.
No filing fee is due because the Registrant has previously registered an indefinite number of shares of common stock under the Securities Act of 1933.
STRATEGIC PARTNERS MID-CAP GROWTH FUND,
A SERIES OF STRATEGIC PARTNERS MUTUAL FUNDS, INC.
STRATEGIC PARTNERS NEW ERA GROWTH FUND,
A SERIES OF STRATEGIC PARTNERS OPPORTUNITY FUNDS
Gateway Center Three
100 Mulberry Street
Newark, New Jersey 07102
IMPORTANT PROXY MATERIALS
PLEASE VOTE NOW
September , 2006
Dear Shareholder:
I am writing to ask you to vote on one or both of the important proposals whereby the assets of each of the following funds:
• Strategic Partners Mid-Cap Growth Fund (Mid-Cap Growth Fund), a series of Strategic Partners Mutual Funds, Inc. (SP Mutual Funds); and
• Strategic Partners New Era Growth Fund (New Era Growth Fund, and together with Mid-Cap Growth Fund, the Target Funds), a series of Strategic Partners Opportunity Funds (SP Opportunity Funds)
would be acquired in separate transactions by Jennison U.S. Emerging Growth Fund, Inc. (Emerging Growth Fund, and together with the Target Funds, the Funds), and Emerging Growth Fund would acquire all of the assets and assume all of the liabilities of each of Mid-Cap Growth Fund and New Era Growth Fund (each, a Reorganization and together, the Reorganizations). Emerging Growth Fund and SP Mutual Funds are Maryland corporations. SP Opportunity Funds is a Delaware statutory trust.
Shareholder meetings (each, a Meeting) are scheduled on Thursday December 7, 2006 as follows: 5:00 p.m. Eastern time for Mid-Cap Growth Fund and 5:00 p.m. Eastern time for New Era Growth Fund. Only shareholders of Mid-Cap Growth Fund will vote on the acquisition of Mid-Cap Growth Fund's assets and the assumption of Mid-Cap Growth Fund's liabilities by Emerging Growth Fund. Only shareholders of New Era Growth Fund will vote on the acquisition of New Era Growth Fund's assets and the assumption of New Era Growth Fund's liabilities by Emerging Growth Fund. Shareholder approval of one Reorganization is not contingent upon, and will not affect, shareholder approval of the other Reorganization. In addition, completion of one Reorganization is not contingent upon, and will not affect, completion of the other Reorganization.
This package contains important information about the proposals and includes materials you will need in order to vote. The Board of Directors of SP Mutual Funds and the Board of Trustees of SP Opportunity Funds have reviewed and approved the proposals and recommended that they be presented to shareholders of the relevant Target Fund for their consideration. Although the relevant directors have determined that each proposal is in the best interests of each Fund's shareholders, the final decision is up to you.
If a Reorganization is approved, shareholders of the relevant Target Fund would have the opportunity to participate in a single mutual fund with virtually identical investment objectives and substantially similar investment policies. Combining both Mid-Cap Growth Fund and New Era Growth Fund or either Target Fund alone with Emerging Growth Fund will allow shareholders of the participating Funds to enjoy a larger asset base over which certain expenses may be spread. In addition, shareholders of each Target Fund are expected to realize a reduction in both the net and gross annual operating expenses borne by such shareholders, including a reduction in investment management fee rates, as a result of the consummation of the relevant Reorganization.
The accompanying combined joint proxy statement and prospectus includes a detailed description of the proposals. Please read the enclosed materials carefully and cast your vote.
Remember, your vote is extremely important, no matter how large or small your holdings. By voting now, you can help avoid additional costs that would be incurred with follow-up letters and calls.
To vote, you may use any of the following methods:
• By Mail. Please complete, date and sign your proxy card before mailing it in the enclosed postage paid envelope. Proxy cards must be received by 11:59 p.m. Eastern time on the day prior to the relevant Meeting to be counted.
• By Internet. Have your proxy card available. Go to the web site: www.proxyvote.com. Enter your 12-digit control number from your proxy card. Follow the simple instructions found on the web site. Votes must be entered by 11:59 p.m. Eastern time on the day prior to the Meeting to be counted.
• By Telephone. If your fund shares are held in your own name, call 1-800-690-6903 toll-free. If your fund shares are held on your behalf in a brokerage account, call 1-800-454-8683 toll-free. Enter your 12-digit control number from your proxy card. Follow the simple instructions. Votes must be entered by 11:59 p.m. Eastern time on the day prior to the relevant Meeting to be counted.
• Attend the relevant Meeting in person.
Special Note for Systematic Investment Plans (e.g., Automatic Investment Plan, Systematic Exchange, etc.). Shareholders in systematic investment plans must contact their financial adviser or call our customer service division, toll free, at 1-800-225-1852 to change their investment options. Otherwise, if a proposed transaction is approved, starting on the day following the closing of the proposed transaction (which is expected to occur after the relevant Meeting as reasonably practicable), future purchases will automatically be made in shares of Emerging Growth Fund.
If you have any questions before you vote, please call MIS, an ADP Company, at 1-888-684-2435 toll-free. They will be happy to help you understand the proposals and assist you in voting.

Judy A. Rice
President
STRATEGIC PARTNERS MID-CAP GROWTH FUND,
A SERIES OF STRATEGIC PARTNERS MUTUAL FUNDS, INC.
STRATEGIC PARTNERS NEW ERA GROWTH FUND,
A SERIES OF STRATEGIC PARTNERS OPPORTUNITY FUNDS
Gateway Center Three
100 Mulberry Street
Newark, New Jersey 07102
NOTICE OF SPECIAL MEETINGS OF SHAREHOLDERS
To Our Shareholders:
Notice is hereby given that Special Meetings of Shareholders (each, a Meeting) of each of the following funds:
• Strategic Partners Mid-Cap Growth Fund (Mid-Cap Growth Fund), a series of Strategic Partners Mutual Funds, Inc. (SP Mutual Funds), a Maryland corporation; and
• Strategic Partners New Era Growth Fund (New Era Growth Fund, and together with Mid-Cap Growth Fund, the Target Funds), a series of Strategic Partners Opportunity Funds (SP Opportunity Funds), a Delaware statutory trust
will be held at Gateway Center Three, 100 Mulberry Street, 14th Floor, Newark, New Jersey 07102, on Thursday, December 7, 2006, at 5:00 p.m. Eastern time for Mid-Cap Growth Fund and 5:00 p.m. Eastern time for New Era Growth Fund, for the following purposes, as applicable:
1. For shareholders of Mid-Cap Growth Fund to approve or disapprove a Plan of Reorganization and the reorganization it contemplates, under which Mid-Cap Growth Fund will transfer all of its assets to, and all of its liabilities will be assumed by, Jennison U.S. Emerging Growth Fund, Inc. (Emerging Growth Fund and, together with the Target Funds, the Funds). In connection with this proposed reorganization, each whole and fractional share of each class of Mid-Cap Growth Fund will be exchanged for whole and fractional shares of equal dollar value of the corresponding class of Emerging Growth Fund, outstanding shares of Mid-Cap Growth Fund will be cancelled, and Mid-Cap Growth Fund will be liquidated and terminated.
2. For shareholders of New Era Growth Fund to approve or disapprove a Plan of Reorganization and the reorganization it contemplates, under which New Era Growth Fund will transfer all of its assets to, and all of its liabilities will be assumed by, Emerging Growth Fund. In connection with this proposed reorganization, each whole and fractional share of each class of New Era Growth Fund will be exchanged for whole and fractional shares of equal dollar value of the corresponding class of Emerging Growth Fund, outstanding shares of New Era Growth Fund will be cancelled, and New Era Growth Fund will be liquidated and terminated.
3. To transact such other business as may properly come before each Meeting or any adjournments or postponements of each Meeting.
There will be one Plan of Reorganization (the Plan) that covers both reorganization transactions. The Plan provides that shareholder approval of one reorganization transaction is not contingent upon, and will not affect, shareholder approval of the other reorganization transaction. In addition, completion of one reorganization transaction is not contingent upon, and will not affect, completion of the other reorganization transaction.
The Board of Directors of SP Mutual Funds, on behalf of Mid-Cap Growth Fund, and the Board of Trustees of SP Opportunity Funds, on behalf of New Era Growth Fund, have each fixed the close of business on September 8, 2006 as the record date for the determination of the shareholders of the relevant Target Fund entitled to notice of, and to vote at, the relevant Meeting and any adjournments of the relevant Meeting.

Deborah A. Docs
Secretary
Dated: September __, 2006
A proxy card is enclosed along with this combined joint Prospectus and Proxy Statement for each proposal that is applicable to you. Please vote your shares today by signing and returning the enclosed proxy card(s) in the postage prepaid envelope provided. You may also vote by telephone or via the Internet as described in the enclosed materials. The Board of Directors of SP Mutual Funds and the Board of Trustees of SP Opportunity Funds recommend that you vote FOR the Mid-Cap Growth Fund proposal and the New Era Growth Fund proposal, respectively.
Your vote is important.
Please return your proxy card promptly
or vote by telephone or over the internet.
Shareholders are invited to attend the relevant Meeting in person. Any shareholder who does not expect to attend the relevant Meeting is urged to complete the enclosed proxy card, date and sign it, and return it in the envelope provided, which needs no postage if mailed in the United States. You may also vote by telephone or over the Internet as described in the materials provided to you. In order to avoid unnecessary expense, we ask for your cooperation in mailing your proxy card promptly, no matter how large or small your holdings may be.
INSTRUCTIONS FOR EXECUTING YOUR PROXY CARD
The following general rules for executing proxy cards may be of assistance to you and may help avoid the time and expense involved in validating your vote if you fail to execute your proxy card properly.
1. INDIVIDUAL ACCOUNTS: Your name should be signed exactly as it appears on the account registration shown on the proxy card.
2. JOINT ACCOUNTS: Both owners must sign and the signatures should conform exactly to the names shown on the account registration.
3. ALL OTHER ACCOUNTS should show the capacity of the individual signing. This can be shown either in the form of account registration or by the individual executing the proxy card. For example:
| REGISTRATION | VALID SIGNATURE | ||||||||||||||
| A. | 1. | XYZ Corporation | John Smith, President | ||||||||||||
| 2. | XYZ Corporation | John Smith, President | |||||||||||||
| c/o John Smith, President | |||||||||||||||
| B. | 1. | ABC Company Profit Sharing Plan | Jane Doe, Trustee | ||||||||||||
| 2. | Jones Family Trust | Charles Jones, Trustee | |||||||||||||
| 3. | Sarah Clark, Trustee | Sarah Clark, Trustee | |||||||||||||
| u/t/d 7/1/85 | |||||||||||||||
| C. | 1. | Thomas Wilson, Custodian | Thomas Wilson, Custodian | ||||||||||||
| f/b/o Jessica Wilson UTMA | |||||||||||||||
| New Jersey | |||||||||||||||
PROXY STATEMENT
for
STRATEGIC PARTNERS MID-CAP GROWTH FUND,
A SERIES OF STRATEGIC PARTNERS MUTUAL FUNDS, INC.
and
STRATEGIC PARTNERS NEW ERA GROWTH FUND,
A SERIES OF STRATEGIC PARTNERS OPPORTUNITY FUNDS
and
PROSPECTUS
for
JENNISON U.S. EMERGING GROWTH FUND, INC.
Gateway Center Three
100 Mulberry Street
Newark, New Jersey 07102
(973) 367-7521
Dated September , 2006
Acquisition of the Assets of Strategic Partners Mid-Cap Growth Fund
and
Acquisition of the Assets of Strategic Partners New Era Growth Fund
By and in exchange for shares of Jennison U.S. Emerging Growth Fund, Inc.
This combined joint Proxy Statement and Prospectus (Prospectus/Proxy Statement) is being furnished to the shareholders of each of the following funds:
• Strategic Partners Mid-Cap Growth Fund (Mid-Cap Growth Fund), a series of Strategic Partners Mutual Funds, Inc. (SP Mutual Funds), a Maryland corporation; and
• Strategic Partners New Era Growth Fund (New Era Growth Fund, and together with Mid-Cap Growth Fund, the Target Funds), a series of Strategic Partners Opportunity Funds (SP Opportunity Funds), a Delaware statutory trust
in connection with the solicitation of proxies by the Board of Directors of SP Mutual Funds and the Board of Trustees of SP Opportunity Funds for use at special meetings of shareholders of Mid-Cap Growth Fund and New Era Growth Fund, respectively, and at any adjournments or postponements thereof (each, a Meeting and together, the Meetings).
The Meetings will be held at Gateway Center Three, 100 Mulberry Street, 14th Floor, Newark, New Jersey 07102 on Thursday, December 7, 2006 as follows: 5:00 p.m. Eastern time for Mid-Cap Growth Fund, and 5:00 p.m. Eastern time for New Era Growth Fund. This Prospectus/Proxy Statement will first be sent to shareholders on or about September 29, 2006.
The purpose of the Meetings is for shareholders of Mid-Cap Growth Fund and New Era Growth Fund, as applicable, to vote on the Plan of Reorganization (the Plan), under which a Target Fund will transfer all of its assets to, and all of its liabilities will be assumed by, Jennison U.S. Emerging Growth Fund, Inc. (Emerging Growth Fund, and together with the Target Funds, the Funds), a Maryland corporation, solely in exchange for shares of Emerging Growth Fund, which will be distributed to shareholders of the relevant Target Fund, and the subsequent cancellation of shares of such Target Fund and its liquidation and termination (each, a Reorganization and together, the Reorganizations). If the Plan receives the required approval from the relevant Target Fund shareholders, each whole and fractional share of each class of the relevant Target Fund will be exchanged for whole and fractional shares of equal dollar value of the corresponding class of Em erging Growth Fund subsequent to the relevant Meeting or any adjournment thereof, the relevant Target Fund subsequently will be liquidated and terminated, and Emerging Growth
1
Fund will be the surviving fund. The Plan provides that shareholder approval of one Reorganization is not contingent upon, and will not affect, shareholder approval of the other Reorganization. In addition, completion of one Reorganization is not contingent upon, and will not affect, completion of the other Reorganization.
The investment objectives of the Funds are virtually identical. The investment objective of each Target Fund is to seek long-term growth of capital while the investment objective of Emerging Growth Fund is long-term capital appreciation. In short, each Fund seeks investments whose price will increase over several years. No assurance can be given that any Fund will achieve its investment objective.
The investment policies of the Funds are substantially similar. Each Fund invests primarily in the equity securities of companies with the potential for above-average growth. Each Fund has a slightly different focus with respect to market capitalization. While Emerging Growth Fund currently focuses primarily on small and medium-sized U.S. companies, Mid-Cap Growth Fund focuses primarily on medium-sized companies and New Era Growth Fund invests in companies of any size. Each Fund generally uses a "growth" investment style. Effective March 15, 2007, Emerging Growth Fund will focus primarily on the equity and equity-related securities of medium-sized companies with the potential for above-average growth and the name of the Fund will be changed to Jennison Mid-Cap Growth Fund.
This Prospectus/Proxy Statement sets forth concisely the information about the Plan and the issuance of shares of Emerging Growth Fund that you should know before voting. You should retain it for future reference. Additional information about Emerging Growth Fund has been filed with the Securities and Exchange Commission (SEC) and can be found in the following documents:
• The Prospectus for Emerging Growth Fund, dated February 27, 2006, which is enclosed and incorporated by reference into this Prospectus/Proxy Statement;
• The Statement of Additional Information (SAI) for Emerging Growth Fund, dated February 27, 2006, which is incorporated by reference into this Prospectus/Proxy Statement;
• An SAI, dated September , 2006, relating to this Prospectus/Proxy Statement, which is incorporated by reference into this Prospectus/Proxy Statement;
• An Annual Report to Shareholders of Emerging Growth Fund for the fiscal year ended October 31, 2005, which is enclosed and is incorporated by reference into this Prospectus/Proxy Statement; and
• A Semi-Annual Report to Shareholders of Emerging Growth Fund for the fiscal period ended April 30, 2006, which is enclosed and is incorporated by reference into this Prospectus/Proxy Statement.
You may request a free copy of these documents by calling 1-800-225-1852 or by writing to Emerging Growth Fund at the above address.
The SEC has not approved or disapproved these securities or passed upon the adequacy of this Prospectus/Proxy Statement. Any representation to the contrary is a criminal offense.
Mutual fund shares are not deposits or obligations of, or guaranteed or endorsed by, any bank, and are not insured by the Federal Deposit Insurance Corporation or any other U.S. government agency. Mutual fund shares involve investment risks, including the possible loss of principal.
SUMMARY
The following is a summary of certain information contained elsewhere in this Prospectus/Proxy Statement, including the Plan. You should read the more complete information in the rest of this Prospectus/Proxy Statement, including the form of Plan (attached as Exhibit A), the Prospectus for Emerging Growth Fund, dated February 27, 2006 (enclosed as Exhibit B), the Annual Report to Shareholders of Emerging Growth Fund for the fiscal year ended October 31, 2005 (enclosed as Exhibit C), and the Semi-Annual Report to Shareholders of Emerging Growth Fund for the fiscal period ended April 30, 2006 (enclosed as Exhibit D). You should also review the SAI relating to this Prospectus/Proxy Statement. This Prospectus/Proxy Statement is qualified in its entirety by reference to these documents. You should read these materials for more complete information.
2
The Proposals
Shareholders of each Target Fund are being asked to consider and approve the Plan, which will have the effect of combining their respective Target Fund and Emerging Growth Fund into a single mutual fund. Mid-Cap Growth Fund is a series of an open-end investment company that is organized as a Maryland corporation. New Era Growth Fund is a series of an open-end investment company that is organized as a Delaware statutory trust. Emerging Growth Fund is an open-end investment company that is organized as a Maryland corporation.
If the Reorganization with respect to your Target Fund receives the required shareholder approval and is completed, the assets of that Target Fund will be transferred to, and all of the liabilities of that Target Fund will be assumed by, Emerging Growth Fund in exchange for an equal value of shares of Emerging Growth Fund. Shareholders of that Target Fund will have their class of shares exchanged for the same class of shares of Emerging Growth Fund of equal dollar value based upon the value of the shares at the time that Target Fund's assets are transferred to Emerging Growth Fund. After the transfer of assets, assumption of liabilities, and exchange of shares have been completed, the Target Fund will be liquidated and terminated and you will cease to be a shareholder of that Target Fund and will become a shareholder of Emerging Growth Fund.
There will be one Plan for both Reorganizations. The Plan provides that shareholder approval of one Reorganization is not contingent upon, and will not affect, shareholder approval of the other Reorganization. In addition, completion of one Reorganization is not contingent upon, and will not affect, the completion of the other Reorganization.
For the reasons set forth below, the Boards of Directors of SP Mutual Funds and Emerging Growth Fund and the Board of Trustees of SP Opportunity Funds have determined that the proposed Reorganization of each Target Fund into Emerging Growth Fund is in the best interests of Fund shareholders and that the interests of Fund shareholders would not be subject to any dilution as a result of the consummation of the relevant Reorganization:
• The Funds have virtually identical investment objectives;
• The Funds have substantially similar investment policies and restrictions;
• Shareholders of the Target Funds are expected to realize a reduction in net and gross operating expenses as a result of the consummation of one or both of the Reorganizations;
• Shareholders of the Target Funds are expected to realize a reduction in investment management fee rates as a result of the consummation of one or both of the Reorganizations;
• Emerging Growth Fund has outperformed Mid-Cap Growth Fund and New Era Growth Fund over the past three month, 1-year, 3- year and 5-year time periods;
• Emerging Growth Fund has substantially more assets than either Target Fund; and
• Shareholders of each Fund could benefit from the long-term economies of scale that may result from consummation of one or both of the Reorganizations.
See the section entitled "Reasons for the Reorganizations" for a more detailed discussion.
The Board of Directors of SP Mutual Funds, on behalf of Mid-Cap Growth Fund, and the Board of Trustees of SP Opportunity Funds, on behalf of New Era Growth Fund, have approved the Plan and unanimously recommend that you vote to approve the Plan.
Shareholder Voting
Shareholders who own shares of a Target Fund as of the close of business on September 8, 2006 (the Record Date) will be entitled to vote at the relevant Meeting, and will be entitled to one vote for each full share and a fractional vote for each fractional share that they hold of that Target Fund. Shareholder approval of the Plan with respect to a Target Fund requires the affirmative vote of the holders of a "majority of the outstanding voting securities" of the relevant Target Fund as defined under the Investment Company Act of 1940 Act (the 1940 Act).
3
A majority of the outstanding voting securities for these purposes means the lesser of: (i) 67% or more of the voting shares of a Target Fund represented at a meeting at which more than 50% of the outstanding voting shares of the Target Fund are present in person or represented by proxy; or (ii) more than 50% of the outstanding voting shares of a Target Fund.
Please vote your shares as soon as you receive this Prospectus/Proxy Statement. You may vote by completing and signing the enclosed ballot (proxy card) or over the Internet or by phone. If you vote by any of these methods, your votes will be officially cast at the relevant Meeting by persons appointed as proxies. If you own shares in both Target Funds or in multiple accounts, you will receive multiple proxy cards. Each proxy card must be voted for all of your shares to be voted.
You can revoke or change your voting instructions at any time until the vote is taken at a Meeting. For more details about shareholder voting, see the "Voting Information" section of this Prospectus/Proxy Statement.
COMPARISON OF IMPORTANT FEATURES
Investment Objectives and Principal Investment Policies of the Funds
This section describes the investment objective and policies of the Funds and the differences between them. For a complete description of the investment policies and risks for Emerging Growth Fund, you should read the Prospectus for Emerging Growth Fund (enclosed as Exhibit B and incorporated by reference into this Prospectus/Proxy Statement) and the Statement of Additional Information for Emerging Growth Fund, dated February 27, 2006 (incorporated by reference into this Prospectus/Proxy Statement).
The investment objectives of the Funds are virtually identical. The investment objective of each Target Fund is to seek long-term growth of capital while the investment objective of Emerging Growth Fund is long-term capital appreciation. In short, each Fund seeks investments whose price will increase over several years. The investment objectives of Emerging Growth Fund and New Era Growth Fund are fundamental policies that cannot be changed by the relevant Board of Directors/Trustees without shareholder approval. The investment objective of Mid-Cap Growth Fund is a non-fundamental policy that may be changed by the Board of Directors of SP Mutual Funds without shareholder approval. No assurance can be given that any Fund will achieve its investment objective.
Each Fund invests primarily in the equity securities of companies with the potential for above-average growth. Each Fund pursues its investment objective through various investment strategies that are employed by that Fund's respective subadviser(s) as follows:
• Emerging Growth Fund normally invests at least 80% of its investable assets in equity securities of small and medium-sized U.S. companies with the potential for above-average growth. The term "investable assets" in this Prospectus/Proxy Statement refers to a Fund's net assets plus any borrowings for investment purposes. A Fund's investable assets will be less than its total assets to the extent that it has borrowed money for non-investment purposes, such as to meet anticipated redemptions. Effective March 15, 2007, Emerging Growth Fund will normally invest at least 80% of its investable assets in equity and equity-related securities of medium-sized companies with the potential for above-average growth and the name of the Fund will be changed to Jennison Mid-Cap Growth Fund. Emerging Growth Fund will provide 60 days' prior written notice to shareholders of a change in its non-fundamental policy of investing at least 80% of i ts investable assets in the type of investment suggested by its name. Emerging Growth Fund currently considers small and medium-sized companies to be those with market capitalizations (measured at the time of investment) that are generally less than the largest capitalization of the Russell Mid Cap Index. As of June 30, 2006, the largest market capitalization of a company represented in the Russell Mid Cap Index was approximately $____ billion. Effective March 15, 2007, Emerging Growth Fund will consider medium-sized companies to be those whose market capitalizations (measured at the time of investment) fall within the range of companies in the Russell Mid Cap Growth Index. The market capitalizations within the Russell Mid Cap Growth Index will vary, but as of June 30, 2006, they ranged from approximately $___ [million/billion] to $____ billion. Emerging
4
Growth Fund's subadviser, Jennison Associates LLC (Jennison), currently looks for small and medium-sized companies that have growth in sales and earnings driven by products or services. These companies usually have a unique market niche, a strong new product profile or superior management. Jennison analyzes companies using fundamental techniques. Emerging Growth Fund also may invest up to 20% of its investable assets in the equity securities of large capitalization companies. Effective March 15, 2007, Emerging Growth Fund may invest up to 35% of its investable assets in foreign securities, excluding American Depositary Receipts (ADRs) or similar receipts and shares traded in U.S. markets.
In addition to buying common stocks, Emerging Growth Fund may invest in other equity-related securities. Equity-related securities include ADRs; American Depositary Shares (ADSs); common stocks; non-convertible preferred stocks; warrants and rights that can be exercised to obtain stock; investments in various types of business ventures, including partnerships and joint ventures; securities of real estate investment trusts (REITs); and similar securities. Emerging Growth Fund also may buy convertible securities. These are securities – like bonds, corporate notes and preferred stocks – that it can convert into a company's common stock or some other equity related security. Emerging Growth Fund will only invest in investment-grade convertible securities. Emerging Growth Fund also may participate in the initial public offering (IPO) market. Generally, Emerging Growth Fund considers selling a security when, in the opinion of Jennison, t he security has experienced a fundamental disappointment in earnings; it has reached an intermediate-term price objective and its outlook no longer seems sufficiently promising; a relatively more attractive security emerges; or the security has experienced adverse price movements.
• Mid-Cap Growth Fund has a non-fundamental policy to invest, under normal circumstances, at least 80% of the value of its assets in medium capitalization companies. The 80% investment requirement applies at the time Mid-Cap Growth Fund invests its assets. Mid-Cap Growth Fund will provide 60 days' prior written notice to shareholders of a change in this non-fundamental policy. Mid-Cap Growth Fund pursues its investment objective by investing primarily in equity securities selected for their growth potential. Equity securities include common stocks, preferred stocks, warrants and securities convertible into or exchangeable for common or preferred stocks. For purposes of Mid-Cap Growth Fund, medium-sized companies are those whose market capitalizations (measured at the time of investment) fall within the range of companies in the Russell Mid Cap Growth Index. The market capitalizations within the Russell Mid Cap Growth Index wi ll vary, but as of June 30, 2006, they ranged from approximately $___ [million/billion] to $____ billion. Mid-Cap Growth Fund's subadviser, Goldman Sachs Asset Management, L.P. (GSAM), generally takes a "bottom up" approach to choosing investments for the Fund. In other words, GSAM seeks to identify individual companies with earnings growth potential that may not be recognized by the market at large.
• New Era Growth Fund's strategy is to invest in the favorite stock selection ideas of Calamos Advisors LLC (Calamos) and TCW Investment Management Company, its two subadvisers. Each subadviser builds a portfolio with stocks in which it has the highest confidence and may invest more than 5% of New Era Growth Fund's assets in any one issuer. New Era Growth Fund normally invests at least 65% of its total assets in equity-related securities of emerging U.S. companies that are believed to have strong capital appreciation potential. Emerging companies, however, may be of any size (i.e., small-, medium-, and large-capitalization companies). These companies are expected to have products, technologies, management, markets and opportunities that will help achieve an earnings growth over time that is well above the growth rate of the overall U.S. economy. The primary equity-related securities in which the Fund invests are common stocks .
In deciding which stocks to buy, each subadviser uses what is known as a growth investment style. This means that a subadviser will invest in stocks that it believes could experience superior sales or earnings growth. Calamos employs a top-down, bottom-up process focusing on stocks. The portfolio managers focus on long-term earnings sustainability and return on capital, along with a valuation overlay. The top-down view is used to set sector weights, which are influenced by macroeconomic themes such as the phase of the economic cycle, political factors, or the inflationary environment. The entire investment process is highly dependent on a number of proprietary research and pricing models. TCW Investment Management Company takes a bottom-up, fundamental research-based approach to stock selection. TCW Investment Management Company
5
is a long-term investor and believes that over the long-term, stock prices follow earnings growth. TCW Investment Management Company's strategy seeks to purchase securities of profitable, growing companies whose business prospects are believed to be improperly estimated by consensus research.
In addition to common stocks in which New Era Growth Fund primarily invests, equity-related securities include nonconvertible preferred stocks; convertible securities; ADRs; warrants and rights that can be exercised to obtain stock; investments in various types of business ventures, including partnerships and joint ventures; REITs; and similar securities. Convertible securities are securities – like bonds, corporate notes and preferred stocks – that can be converted into the company's common stock or some other equity security. REITs invest primarily in real estate or real estate mortgages and distribute almost all of their income – most of which comes from rents, mortgages and gains on sales of property – to shareholders. New Era Growth Fund may invest up to 25% of its investable assets in REITs as a secondary strategy. In addition, New Era Growth Fund also may participate in the IPO market. New Era Growth Fund intends t o be fully invested, holding less than 5% of its total assets in cash under normal market conditions.
Each of Emerging Growth Fund and Mid-Cap Growth Fund is a "diversified" investment company under the 1940 Act while New Era Growth Fund is a "non-diversified" investment company under the 1940 Act. See "Comparison of Other Policies – Diversification" and "Investment Restrictions" below.
The Funds typically distribute annually all or substantially all of their ordinary income and net realized capital gains.
After one or both Reorganizations are completed, it is expected that the combined, surviving fund will be managed according to the investment objective and policies of Emerging Growth Fund.
Comparison of Other Investment Policies
Diversification
Each of Emerging Growth Fund and Mid-Cap Growth Fund is a "diversified" investment company under the 1940 Act. As diversified investment companies, with respect to 75% of their assets, Emerging Growth Fund and Mid-Cap Growth Fund cannot invest more than 5% of their respective assets in the securities of any one issuer (except U.S. Government obligations) or cannot hold more than 10% of the outstanding voting securities of any one issuer. New Era Growth Fund is a "non-diversified" investment company under the 1940 Act, which means that the 5% and 10% limitations are computed with respect to 50% of its assets.
Foreign Securities
Each Fund may invest in securities of foreign issuers. Emerging Growth Fund and New Era Growth Fund may invest up to 20% and 35% of their respective investable assets in foreign securities, including stocks and other equity-related securities, money market instruments and other investment-grade fixed income securities of foreign issuers including securities of issuers in emerging markets. Effective March 15, 2007, Emerging Growth Fund may invest up to 35% of its investable assets in foreign securities. Neither of these Funds considers ADRs, ADSs and other similar receipts or shares traded in U.S. markets to be foreign securities. Mid-Cap Growth Fund may invest up to 25% of its net assets in foreign securities denominated in foreign currencies and not publicly traded in the United States. Mid-Cap Growth Fund may also invest in foreign companies through depository receipts or passive foreign investment companies.
Fixed-Income Obligations
Fixed-income obligations include bonds and notes. Emerging Growth Fund may invest up to 20% of its investable assets in fixed-income obligations. Emerging Growth may invest only in investment-grade corporate or government obligations. Investment-grade obligations are rated in one of the top four long-term quality ratings by a major rating service (such as Baa/BBB or better by Moody's Investors Service, Inc. or Standard & Poor's Ratings Services, respectively). Emerging Growth Fund also may invest in obligations that are not rated, but that are believed
6
to be of comparable quality. Obligations rated in the fourth category (Baa/BBB) have speculative characteristics. Although GSAM expects to invest primarily in domestic and foreign equity securities, Mid-Cap Growth Fund may also invest to a lesser degree in debt securities (i.e., up to 20% under normal circumstances). These debt securities may include bonds rated below investment-grade (sometimes referred to as junk bonds), mortgage-backed securities, asset-backed securities, and zero coupon bonds. Junk bonds are regarded as having predominantly speculative characteristics with respect to capacity to pay interest income and repay principal. New Era Growth Fund may invest up to 35% of its investable assets in securities issued or guaranteed by the U.S. government or by an agency or instrumentality of the U.S. government. Some U.S. government securities are backed by the full faith and credit of the United States, which means that payment of pr incipal and interest are guaranteed but market value is not. Some are supported only by the credit of the issuing agency and depend entirely on their own resources to repay their debt and are subject to the risk of default like private issuers.
Derivative Instruments
Each Fund may use various derivative strategies to try to improve its returns. Each Fund may also use hedging techniques to try to protect its assets. The use of derivatives – such as futures, foreign currency forward contracts, options on futures and various types of swaps – involves costs and can be volatile. With derivatives, the relevant subadviser tries to predict if the underlying investment – a security, market index, currency, interest rate, or some other benchmark, will go up or down at some future date. The relevant subadviser may use derivatives to try to reduce risk or to increase return consistent with the Fund's overall investment objectives. The relevant subadviser will consider other factors (such as cost) in deciding whether to employ any particular strategy or technique, or use any particular instrument. Any derivatives used may not match or offset a Fund's underlying positions and this could result in losses to the Fund that would not otherwise have occurred. Derivatives that involve leverage could magnify losses. When a Fund uses derivative strategies, the Fund designates certain assets as segregated or otherwise covers its exposure, as required by the rules of the SEC. Emerging Growth Fund and New Era Growth Fund usually invest less than 10% of their respective investable assets in derivatives. The Funds cannot guarantee these derivative strategies will work, that the instruments necessary to implement these strategies will be available or that the Funds will not lose money.
Short Sales
Emerging Growth Fund and New Era Growth Fund may make short sales of securites. This means that Emerging Growth Fund and New Era Growth Fund may sell a security that they do not own, which they may do, for example, when the relevant subadviser thinks the value of the security will decline. Emerging Growth Fund and New Era Growth Fund generally borrow the security to deliver to the buyer in a short sale. Emerging Growth Fund and New Era Growth Fund must then replace the borrowed security by purchasing it at the market price at the time of replacement. Short sales involve costs and risks. Mid-Cap Growth Fund has a non-fundamental policy that it will not engage in short sales.
Each Fund also may make short sales "against the box". In a short sale against the box, at the time of sale, the Fund owns or has the right to acquire the identical security at no additional cost. When selling short against the box, a Fund gives up the opportunity for capital appreciation in the security. No more than 25% of the respective net assets of Emerging Growth Fund and New Era Growth Fund, and usually no more than 10% of their respective total assets, will be subject to short sales. Short sales against the box are not subject to this limitation for Emerging Growth Fund.
Illiquid Securities
Each Fund may invest up to 15% of its net assets in illiquid securities, including securities with legal or contractual restrictions on resale, those without a readily available market, and repurchase agreements with maturities longer than seven days. Certain derivative instruments held by the Funds may also be considered illiquid.
7
Borrowing
Each Fund may borrow up to 33 1/3% of the value of its total assets calculated when the loan is made. If a Fund's asset coverage for borrowing falls below 300%, the Fund will take action to reduce its borrowings in accordance with applicable law. If the 300% asset coverage should decline, the Fund may be required to sell portfolio securities to reduce the debt and restore the 300% asset coverage, even though it may be disadvantageous from an investment standpoint to sell securities at that time. Emerging Growth Fund and New Era Growth will not purchase portfolio securities when borrowings exceed 5% of the value of their respective total assets. Mid-Cap Growth Fund does not have such a policy. Additionally, Emerging Growth Fund will take prompt action to reduce its borrowing if it holds more than 15% of its net assets in illiquid securities.
Lending of Portfolio Securities
Consistent with the applicable regulatory requirements, each Fund may lend its portfolio securities to brokers, dealers and financial institutions, if outstanding loans do not exceed 33 1/3% of the value of such Fund's assets and the loans are callable at any time by the Fund.
Temporary Defensive Investments
In response to adverse market, economic or political conditions, each Fund may take a temporary defensive position and invest up to 100% of the Fund's assets in money market instruments, including short-term obligations of, or securities guaranteed by, the U.S. Government, its agencies or instrumentalities or in high-quality obligations of banks and corporations, and may hold up to 100% of the Fund's assets in cash or cash equivalents. Investing heavily in these securities limits the Fund's ability to achieve its investment objectives, but can help to preserve the Fund's assets.
Investments in Affiliated and Non-affiliated Funds
The Funds may invest up to 25% of their respective total assets in shares of affiliated money-market funds or open-ended short-term bond funds with a portfolio maturity of three years or less. The Funds may invest up to 10% of their respective total assets in other non-affiliated investment companies, subject to additional restrictions under the 1940 Act.
Investment Restrictions
Each Fund has adopted fundamental investment restrictions, which limit its ability to: (i) issue senior securities; (ii) borrow money (except for non-leveraging, temporary, or emergency purposes); (iii) underwrite securities; (iv) purchase or sell real estate; (v) purchase or sell physical commodities; (vi) make loans (except for certain securities lending transactions); and (vi) invest more than 25% of its assets in any one industry. In addition, Emerging Growth Fund and Mid-Cap Growth Fund have adopted fundamental investment restrictions to diversify their respective investments. Accordingly, Emerging Growth Fund and Mid-Cap Growth Fund are diversified funds under the 1940 Act. This means that they may not, with respect to 75% of the value of their respective total assets, purchase a security of any issuer (other than U.S. Government securities) or securities of other investment companies) if, as a result (i) more than 5% of the value of t he Fund's total assets would be invested in the securities of such issuer, or (ii) more than 10% of the outstanding voting securities of such issuer would be held by the Fund. Under the 1940 Act, a fundamental policy may not be changed without the approval of the holders of a majority of the Fund's outstanding voting securities. For these purposes, a "majority of the outstanding voting securities" of a Fund means the lesser of: (i) 67% or more of the voting shares of a Fund represented at a meeting at which more than 50% of the outstanding voting shares of the Fund are present in person or represented by proxy; or (ii) more than 50% of the outstanding voting shares of a Fund.
Each Fund also has certain non-fundamental restrictions. These non-fundamental investment restrictions may be changed by the relevant Board without shareholder approval. Under its non-fundamental investment restrictions, Emerging Growth Fund may not: (i) purchase securities on margin (but the Fund may obtain such short-term credits as may be necessary for the clearance of transactions); provided that the deposit or payment by the Fund of initial
8
or maintenance margin in connection with futures or options is not considered the purchase of a security on margin; (ii) make short sales of securities or maintain a short position if, when added together, more than 25% of the value of the Fund's net assets would be (a) deposited as collateral for the obligation to replace securities borrowed to effect short sales and (b) allocated to segregated accounts in connection with short sales; provided, however, that short sales "against-the-box" are not subject to this limitation; (iii) make investments for the purpose of exercising control or management; (iv) invest in securities of other non-affiliated investment companies, except by purchases in the open market involving only customary brokerage commissions and as a result of which the Fund will not hold more than 3% of the outstanding voting securities of any one investment company, will not have invested more than 5% of its total assets in any one investment company and will not have invested more than 10% of its total assets (determined at the time of investment) in such securities of one or more investment companies, or except as part of a merger, consolidation or other acquisition; (v) purchase more than 10% of all outstanding voting securities of any one issuer; and (vi) change its policy of investing at least 80% of its investable assets in the type of investments suggested by the Fund's name. In addition, Emerging Growth Fund may not acquire securities of other investment companies or registered unit investment trusts in reliance on subparagraph (F) or (G) of Section 12(d)(1) of the 1940 Act so long as it is a fund in which one or more of the JennisonDryden Allocation Funds (which are series of The Prudential Investment Portfolios, Inc., Registration Nos. 33-61997, 811-7343) may invest. Under its non-fundamental investment restrictions, Mid-Cap Growth Fund may not: (i) change its policy to invest at least 80% of the value of its assets in m edium capitalization companies unless it provides 60 days prior written notice to its shareholders; (ii) sell securities short, unless it owns or has the right to obtain securities equivalent in kind and amount to the securities sold short without the payment of any additional consideration therefor, and provided that transactions in futures, options, swaps and forward contracts are not deemed to constitute selling securities short; (iii) purchase securities on margin, except that Mid-Cap Growth Fund may obtain such short-term credits as are necessary for the clearance of transactions, and provided that margin payments and other deposits in connection with transactions in futures, options, swaps and forward contracts shall not be deemed to constitute purchasing securities on margin; (iv) mortgage or pledge any securities owned or held by it in amounts that exceed, in the aggregate, 15% of its net asset value, provided that this limitation does not apply to reverse repurchase agreements, margin and other depo sits in connection with transactions in futures, options, swaps or forward contracts, or the segregation of assets in connection with such contracts; (v) purchase any security or enter into a repurchase agreement if, as a result, more than 15% of its net assets would be invested in repurchase agreements not entitling the holder to payment of principal and interest within seven days and in securities that are illiquid by virtue of legal or contractual restrictions on resale or the absence of a readily available market; and (vi) invest in companies for the purpose of exercising control of management. Under its non-fundamental investment restrictions, New Era Growth Fund may not: (i) make investments for the purpose of exercising control or management; (ii) invest in securities of other investment companies, except as permitted under the 1940 Act and the rules thereunder, as amended from time to time, or by any exemptive relief granted by the SEC, including investing up to 25% of its assets in shares of affilia ted mutual funds; and (iii) purchase portfolio securities when borrowings exceed 5% of the value of its total assets.
Risks of Investing in the Funds
As set forth below, the principal investment risks associated with an investment in both Target Funds are substantially similar to the principal investment risks associated with an investment in Emerging Growth Fund.
General. Like all investments, an investment in any of the Funds involves risk. An investment in a Fund is not a bank deposit and is not insured or guaranteed by the Federal Deposit Insurance Corporation (FDIC) or any other government agency. No assurance can be given that the Funds will meet their respective investment objectives. The Funds invest primarily in equity or equity-related securities. As with any mutual fund investing primarily in equity securities, there is the risk that the price of particular equities the Funds own could go down, or the value of the equity markets or a sector of them could go down and that such declines could be substantial. Stock markets are volatile. Generally, the stock prices of small and medium-sized companies vary more than the prices of large company stocks and may present above-average risks. This means that when stock pri ces decline overall, a Fund may decline more than the Standard & Poor's 500 Composite Stock Price Index. This is particularly true for Emerging Growth Fund and Mid-Cap Growth Fund. In addition, different parts of a market can react differently to adverse issuer,
9
market, regulatory, political and economic developments. Since each Fund's investment objective involves long-term capital appreciation/long-term capital growth, the companies that the Funds invest in generally reinvest their earnings rather than distribute them to shareholders. As a result, each Fund is not likely to receive significant dividend income on its portfolio securities.
Initial Public Offerings. Emerging Growth Fund and New Era Growth Fund may participate in the initial public offering (IPO) market. The volume of IPOs and the levels at which the newly issued stocks trade in the secondary market are affected by the performance of the stock market overall. If IPOs are bought to the market, availability may be limited and if a Fund desired to acquire shares in such an offering, it may not be able to buy any shares at the offering price, or if it is able to buy shares, it may not be able to buy as many shares at the offering price as it would like. The prices of securities involved in IPOs are often subject to greater and more unpredictable price changes than more established stocks. Such unpredictability can have a dramatic impact on a Fund's performance (higher or lower) and any assumptions by investors based on the impacted perfo rmance may be unwarranted. In addition, as a Fund's assets grow, the impact of their IPO investments on performance will decline, which could reduce total returns.
Non-Diversification. New Era Growth Fund is a non-diversified fund under the 1940 Act and, as a result, can invest more than 5% of its assets in the securities of any one issuer. Investing in a non-diversified fund involves greater risk than investing in a diversified fund because a loss resulting from the decline in volume of securities issued by one issuer may represent a greater portion of the total assets of a non-diversified fund.
Growth Investing Style Risk. Each Fund follows an investing style that favors growth investments. Historically, growth investments, have performed best during the later stages of economic expansion. Therefore, the aggressive growth investing style may over time go in and out of favor. At times when growth investing styles used are out of favor, each Fund may underperform other equity funds that use different investing styles.
Derivatives. Each Fund may use investment strategies, such as derivatives, that involve risk. The Funds use these risk management techniques to try to preserve assets or enhance return. Derivatives may not fully offset the underlying positions and this could result in losses to the Funds that would not otherwise have occurred. Derivatives can increase share price volatility and those that involve leverage could magnify losses.
Foreign Securities. Investing in foreign securities subjects the Funds to additional risks. Foreign markets, economies and political systems may not be as stable as those in the U.S. and may involve additional risk. Foreign markets tend to be more volatile than U.S. markets and generally are not subject to regulatory requirements comparable to those in the U.S. Additionally, adverse changes in the value of foreign currencies can cause losses. These securities may also be less liquid than U.S. stocks and bonds. Also, differences in foreign laws, accounting standards, public information, custody and settlement practices may result in less reliable information.
Emerging Markets. Investments in securities of emerging markets involve additional risks. The securities markets of developing countries are less liquid, are subject to greater price volatility, have smaller market capitalizations, and have less government regulation than the securities markets of more developed countries and are not subject to such extensive and frequent accounting, financial and other reporting requirements as the securities markets of more developed countries. These risks are not normally associated with investments in more developed countries.
Fixed-Income Obligations. To the extent the Funds invest in fixed-income obligations, the investments are subject to the credit risk of the issuer, market risk with respect to the value of the investment, interest rate risk, and call and redemption risk. Credit risk is the risk that the borrower will not make timely payments of principal and interest. The degree of credit risk depends on the issuer's financial condition and on the terms of the debt securities. Market risk is the risk that the debt markets will go down in value, including the possibility that such market will go down sharply and unpredictably. Interest rate risk is the risk that prices of debt securities generally increase when interest rates decline and decrease when interest rates increase. Stated otherwise, bond prices and, to the extent a Fund has invested in fixed-income obligations, the net asset value per share (NAV) for each Fund generally move in the opposite direction from interest rates. Prices of longer-term securities generally change more (i.e., decline) in response
10
to interest rate changes than prices of shorter-term securities. The Funds may lose money if short-term or long-term interest rates rise sharply or otherwise change in a manner not anticipated by the relevant subadviser. Each Fund also faces call and redemption risk. A bond's issuer may call a bond for redemption before it matures. If this happens to a bond a Fund holds, the Fund may lose income and may have to invest the proceeds in bonds with lower yields.
Illiquid Securities. Investments in illiquid securities involve additional risks. Illiquid securities may be difficult to value precisely and the Funds may have difficultly selling the securities at the time or price desired.
Short Sales. Each of Emerging Growth Fund and New Era Growth Fund may engage in short sales of securities. Short sales may magnify underlying investment losses. Share price volatility can increase losses because the underlying security must be replaced at a specific time. Investment costs may exceed potential investment gains. Short sales against the box, which all the Funds may engage in, may cause a Fund to give up the opportunity for capital appreciation in the security.
U.S. Government Securities. Not all U.S. government securities are issued or guaranteed by the U.S. government, but are only insured or guaranteed by the issuing agency, which must rely on its own resources to repay the debt and are subject to the risk of default. Investing in U.S. government securities also limits the potential for capital appreciation.
Money Market Instruments. Investing in money market instruments limits the Funds' ability to achieve their respective investment objectives of capital appreciation. Such investments also involve credit and market risk as described under Fixed Income Securities.
High Yield-High Risk Securities. Mid-Cap Growth Fund may invest in high yield securities also known as "junk bonds". High yield securities are subject to higher risk of loss, greater volatility and are considered speculative by traditional investment standards. The most significant risk associated with high yield securities is credit risk: the risk that the company issuing a high yield security may have difficulty in meeting its principal and/or interest payments on a timely basis. As a result, extensive credit research and diversification are essential factors in managing risk in the high yield arena. To a lesser extent, high yield bonds are also subject to interest rate risk: when interest rates increase, the value of fixed income securities tends to decline.
Federal Income Tax Considerations
Each Fund is treated as a separate entity for federal income tax purposes. Each Fund has qualified and elected to be treated as a "regulated investment company" under Subchapter M of the Internal Revenue Code of 1986, as amended (the Code), and intends to continue to so qualify in the future. As a regulated investment company, a Fund must, among other things, (a) derive at least 90% of its gross income from dividends, interest, payments with respect to certain loans of stock and securities, gains from the sale or other disposition of stock, securities or foreign currency and other income (including but not limited to gains from options, futures, and forward contracts) derived with respect to its business of investing in such stock, securities or foreign currency and (b) diversify its holdings so that, at the end of each quarter of its taxable year, (i) at least 50% of the value of the Fund's total assets is represented by cash, cash items, U .S. Government securities, securities of other regulated investment companies, and other securities limited, in respect of any one issuer, to an amount not greater than 5% of the Fund's total assets, and not more than 10% of the outstanding voting securities of such issuer, and (ii) not more than 25% of the value of its total assets is invested in the securities of any one issuer (other than U.S. Government securities or securities of other regulated investment companies), two or more issuers that are controlled by the Fund and are determined, pursuant to Department of Treasury regulations, to be in the same, similar or related trades or businesses. As a regulated investment company, a Fund (as opposed to its shareholders) will not be subject to federal income taxes on the net investment income and capital gain that it distributes to its shareholders, provided that at least 90% of its net investment income and realized net short-term capital gain in excess of net long-term capital loss for the taxable year i s distributed in accordance with the Code's distribution requirements.
Each Reorganization may lead to various tax consequences, which are discussed under the caption "Tax Consequences of the Reorganizations."
11
Forms of Organization
Mid-Cap Growth Fund is a series of SP Mutual Funds, which is an open-end management investment company, organized as a Maryland corporation. SP Mutual Funds is authorized to issue 5.5 billion shares of capital stock, par value $0.001 per share, 150,000,000 of which are designated as shares of Mid-Cap Growth Fund, which are further divided into Class A, Class B, Class C, Class L, Class M, Class X and New Class X shares. The rights and terms of Class X and New Class X shares are almost identical, so for ease of reference, SP Mutual Funds sometimes provides combined expenses, capitalization, financial and other information for "New Class X" and "Class X" and refers to all such shares as "Class X." The principal difference between outstanding shares of the two classes is that Class X shares issued prior to August 17, 1998 are subject to automatic conversion to Class A approximately 8 years after purchase, while New Class X shares, meaning Class X shares issued on or after August 17, 1998, are subject to automatic conversion to Class A shares approximately 10 years after purchase. You should be aware that if you hold shares referred to as "Class X," your conversion rights are determined by the date you purchased your shares.
New Era Growth Fund is a series of SP Opportunity Funds, which is an open-end management investment company, organized as a Delaware statutory trust. SP Opportunity Funds is authorized to issue an unlimited number of shares of beneficial interest, $0.001 par value per share, currently divided into four series and four classes, designated Class A, Class B, Class C and Class Z shares.
Emerging Growth Fund is an open-end management investment company, organized as a Maryland corporation. Emerging Growth Fund is authorized to issue 2 billion shares of common stock, $0.001 par value per share, divided into nine classes, designated Class A, Class B, Class C, Class L, Class M, Class X, New Class X, Class Z and Class R common stock. Of the authorized shares of common stock of Emerging Growth Fund, 800 million shares consist of Class A common stock, 400 million shares consist of Class B common stock, 300 million shares consist of Class C common stock, 100 million shares consist of Class L common stock, 100 million shares consist of Class M common stock, 50 million shares consist of Class X common stock, 50 million shares consist of New Class X common stock, 100 million shares consist of Class Z common stock and 100 million shares consist of Class R common stock. The rights and terms of Class X and New Class X shares are almost i dentical, so for ease of reference, Emerging Growth Fund sometimes provides combined expenses, capitalization, financial and other information for "New Class X" and "Class X" and refers to all such shares as "Class X." The principal difference between outstanding shares of the two classes is that Class X shares issued prior to August 17, 1998 are subject to automatic conversion to Class A approximately 8 years after purchase, while New Class X shares, meaning Class X shares issued on or after August 17, 1998, are subject to automatic conversion to Class A shares approximately 10 years after purchase. You should be aware that if you hold shares referred to as "Class X," your conversion rights are determined by the date you purchased your shares.
SP Mutual Funds and Emerging Growth Fund (together, the Companies) operate pursuant to charters, which include their Articles of Incorporation and supplements, corrections and amendments thereto, and by-laws. SP Opportunity Funds operates pursuant to an Agreement and Declaration of Trust (the Declaration) and by-laws. Each Company is governed by a Board of Directors. SP Opportunity Funds is governed by a Board of Trustees. For ease of reference and clarity of presentation, the Trustees of SP Opportunity Funds and the Directors of SP Mutual Funds and Emerging Growth Fund are referred to herein as "Directors" and the Board of Trustees of SP Opportunity Funds and the Boards of Directors of SP Mutual Funds and Emerging Growth Fund are each referred to herein as a "Board" and collectively as the "Boards."
Due to differences in Maryland law and Delaware law and the governing documents of the Companies and SP Opportunity Funds, we have summarized certain rights of shareholders of the Companies and SP Opportunity Funds below. The following is only a summary and is not a complete description of the respective governing documents or applicable state law. You should refer to the governing documents of the Companies and SP Opportunity Funds for more complete information.
12
Forms of Ownership
Ownership interests in the Companies and their series, if applicable, are represented by shares of common stock of a corporation. The par value of SP Mutual Funds' common stock is $0.001 per share. The par value of Emerging Growth Fund's common stock is $0.001 per share. Ownership interests in SP Opportunity Funds and its series are represented by shares of beneficial interest of a statutory trust. The par value of SP Opportunity Funds shares of beneficial interest is $0.001 per share. For ease of reference and clarity of presentation, shares of common stock of Mid-Cap Growth Fund and Emerging Growth Fund and shares of beneficial interest of New Era Growth Fund are referred to herein as "shares" and holders of shares are referred to herein as "shareholders."
Extraordinary Transactions
As registered open-end investment companies, the Companies are authorized under Maryland law to transfer all of their respective assets (or the assets of any class or series of their shares) without shareholder approval, but pursuant to Maryland law and their charters, most other extraordinary transactions, including mergers, consolidations, share exchanges and dissolutions, must be approved by a majority vote of the shares entitled to vote on the matter. The Declaration permits the Board of SP Opportunity Funds, without shareholder approval (unless such approval is otherwise required by the 1940 Act) to (a) cause SP Opportunity Funds to convert or merge, reorganize or consolidate with or into one or more business entities (or a series thereof to the extent permitted by law) so long as the surviving or resulting entity is an open-end management investment company (or a series thereof to the extent permitted by law) formed, organized or exist ing under the laws of a U.S. jurisdiction and that, in the case of any business entity created by the Board to accomplish such conversion, merger, reorganization or consolidation, may succeed to or assume SP Opportunity Funds' registration under the 1940 Act, (b) cause shares to be exchanged under or pursuant to any state or federal statute to the extent permitted by law, (c) cause SP Opportunity Funds to incorporate under the laws of a U.S. jurisdiction, (d) sell or convey all or substantially all of the assets of SP Opportunity Funds or any series or class thereof to another series or class thereof or to another business entity (or a series thereof to the extent permitted by law) organized under the laws of a U.S. jurisdiction so long as such business entity is an open-end management investment company and, in the case of any business entity created by the Board to accomplish such sale and conveyance, may succeed to or assume SP Opportunity Funds' registration under the 1940 Act or (e) at any time sell or convert into money all or any part of the assets of SP Opportunity Funds or any series or class thereof.
Shareholder Meetings
Place of Meeting. The Companies may hold shareholder meetings at any place set by the Board, except that in the case of SP Mutual Funds, that place is required to be within the United States. SP Opportunity Funds is required to hold shareholder meetings at the principal executive offices of SP Opportunity Funds or at such other place within the United States as the Trustees shall designate.
Shareholder Voting Rights. Each share of a Company's common stock entitles its holder to one vote and fractional shares are entitled to pro rata voting rights. In all elections for directors, each share of a Company's stock may be voted for as many individuals as there are directors to be elected and for whose election the share is entitled to be voted. SP Opportunity Funds' Board is entitled to determine, without the vote or consent of shareholders (except as required by the 1940 Act) with respect to any matter submitted for a shareholder vote whether each share shall be entitled to one vote as to any matter on which it is entitled to vote and each fractional share shall be entitled to a proportionate fractional share, or whether each dollar of net asset value shall be entitled to one vote on any matter on which such shares are entitled to vote and each fraction al dollar amount shall be entitled to a proportionate fractional vote. In addition, shareholders of SP Opportunity Funds are entitled to vote only (1) for the election or removal of Trustees and (2) with respect to such additional matters relating to SP Opportunity Funds as may be required by the 1940 Act, the Declaration, the By-Laws or any registration of SP Opportunity Funds with the SEC (or any successor agency) or any state, or as the Board may consider necessary or desirable.
Record Date. The Companies' Boards have the sole power to set a record date, which must be at or after close of business on the day the record date is fixed, and may not be more than 90 or fewer than 10 days prior to the
13
applicable meeting of shareholders. SP Opportunity Funds' Board may fix a record date falling not more than 120 days prior to the meeting.
Annual Meetings. Neither Company is required to hold annual meetings of its respective shareholders in any year in which the election of directors is not required to be acted upon under the 1940 Act. There are no requirements regarding annual shareholder meetings set forth in SP Opportunity Funds' Declaration or By-Laws.
Special Meetings. Each Company must call a special meeting of shareholders if so requested by the chairman or the president or by a majority of the Directors. In addition, SP Mutual Funds must call a special meeting, in the discretion of the Board, or on the written request of shareholders holding at least 10% of the outstanding shares of a series. In the case of Emerging Growth Fund, a special meeting will be held on the written request of shareholders representing a majority of the votes entitled to be cast at the meeting. Each Company's Board has sole power to fix the date and time of any special meeting of shareholders. SP Opportunity Funds is required to call a meeting of shareholders upon order of the Board, or, for the purpose of voting on the removal of any Trustee, upon the request of shareholders holding at least 10% of the outstanding shares entitled t o vote. If the Secretary of SP Opportunity Funds refuses or neglects to call such meeting for more than 10 days, the Board or shareholders so requesting may call the meeting themselves by giving notice thereof in the manner required by the By-Laws.
Inspector of Elections. SP Mutual Funds is required to appoint one or more inspectors of election to conduct the voting at any meeting, if so ordered by the chairman of the meeting or upon the request of shareholders entitled to cast at least 10% of the votes entitled to be cast at the meeting. Emerging Growth Fund's Board may appoint one or three inspectors before a shareholder meeting. In addition, the chairman may make such appointment and must do so upon the request of at least 10% of the shareholders. There are no requirements regarding inspectors set forth in SP Opportunity Funds' Declaration or By-Laws or the Delaware Statutory Trust Act.
Advance Notice of Shareholder Proposals. The by-laws of Emerging Growth Fund provides that in order for a shareholder to nominate a director for election or propose business to be considered at an annual meeting of shareholders, such shareholder must give notice of such nomination or proposal to Emerging Growth Fund's Secretary not less than 90 days nor more than 120 days prior to the first anniversary of the preceding year's annual meeting. However, if no annual meeting was held in the preceding year, any such shareholder must give notice to the Secretary not earlier than the 90th day prior to such meeting and not later than either the 60th day prior to such meeting or the 10th day after public announcement of such meeting is made. Although the charter of SP Mutual Funds provides that its by-laws may delineate requirements for presenting matters at annual meetin gs, its by-laws do not currently do so. This generally means that shareholders of SP Mutual Funds may submit proposals from the floor of an annual meeting. Under Maryland law, the purpose of any special meeting must be described in the notice of such meeting so only items included in the notice may be considered at special meetings of shareholders of the Companies. There are no requirements regarding advance notice for shareholder proposals set forth in SP Opportunity Funds' Declaration or By-Laws or the Delaware Statutory Trust Act. Under the by-laws of SP Opportunity Funds, only the business stated in the notice of the meeting shall be considered at such meeting.
Quorum. The presence, in person or by proxy, of shareholders entitled to cast a majority of all votes entitled to be cast on a matter with respect to one or more series or classes of SP Mutual Funds shall constitute a quorum for the transaction of business at a meeting of such shareholders. Emerging Growth Fund's charter reduces this requirement from a majority of votes entitled to be cast to one-third of votes entitled to be cast. For SP Opportunity Funds, a quorum is one-third of the shares entitled to vote, except when a larger quorum is required by federal law, including the 1940 Act, the By-Laws or the Declaration.
Adjournments. Whether or not a quorum is present, Emerging Growth Fund may adjourn a meeting of shareholders convened on the date for which it was called, by action of the chairman of the meeting, to a date not more than 120 days after the original record date. For SP Mutual Funds, a majority vote of the shareholders present is needed to achieve such an adjournment. SP Opportunity Funds can adjourn a meeting of shareholders without notice thereof if the time and date of the meeting are announced at the meeting and the adjourned meeting is held within a reasonable time after the date of the original meeting. Any meeting of shareholders of SP Opportunity Funds
14
may be adjourned one or more times to another time or place by shareholders holding a majority of the outstanding shares present and entitled to vote on a proposal to adjourn at such meeting, whether or not a quorum is present.
Shareholder Action Without a Meeting. Shareholders of the Companies are not entitled to act by written consent unless such consent is unanimous. Shareholders of SP Opportunity Funds can act by written consent if such consent is signed by the holders of outstanding shares having enough votes to authorize the action at a meeting at which all shares entitled to vote on that action were present and voted, except that in the case of shareholder proposals and any matter subject to a proxy contest or proxy solicitation or any proposal in opposition to a proposal by the Officers or Trustees of SP Opportunity Funds, shares may be voted only in person or by written proxy at a meeting.
Amendments to Charter
Amendments to each Company's charter generally require the approval of the Board and at least a majority of the votes entitled to be cast. However, the Board may amend the charter to change the name of the company, or change the designation or par value of shares, without shareholder approval. Under Maryland law, each Company's Board is also authorized to increase or decrease authorized capital stock, and classify and reclassify shares without shareholder approval. The Board of SP Opportunity Funds is entitled to amend the Declaration without shareholder approval, except that shareholders have the right to vote on (1) any amendment that is required to be approved by shareholders pursuant to the 1940 Act, and (2) any amendment submitted to the shareholders by the Board at its discretion.
Amendment of By-Laws
Each Company's by-laws can be amended by a majority vote of the shareholders, or by a majority vote, in the case of SP Mutual Funds, and by a two-thirds vote in the case of Emerging Growth Fund, of the Board. SP Opportunity Funds' By-Laws can be amended by majority vote of the shareholders or of the Board; provided, however, that no By-Law may be amended, adopted or repealed by the Board if such amendment, adoption or repeal is required by applicable law to be submitted to a vote of shareholders.
Board of Directors
Number of Members. SP Mutual Funds' Board may change the number of directors to any number from three (3) to twenty-five (25), inclusive. Emerging Growth Fund's Board may change the number of directors to any number from three (3) to twenty (20), inclusive. As for SP Opportunity Funds, the number of trustees shall be the number established under or pursuant to the prior Declaration of Trust or such number as is determined, from time to time, by the trustees but shall at all times be at least one.
Removal of Board Members. SP Mutual Funds' shareholders may remove a Board member, with or without cause, by the affirmative vote of a majority of all votes entitled to be cast generally in the election of Board members. Emerging Growth Fund's shareholders may remove a Board member, with or without cause, by the affirmative vote of two-thirds of all votes entitled to be cast generally in the election of Board members. The trustees of SP Opportunity Funds may remove any trustee with or without cause at any time by an instrument signed by at least two-thirds of the number of trustees prior to such removal, and any trustee may be removed at any meeting of shareholders by a vote of two-thirds of the outstanding shares.
Board Vacancies. A vacancy on a Company's Board may be filled by a majority of the remaining members of the Board (unless, in the case of SP Mutual Funds, the vacancy results from the removal of a director by the shareholders, in which case the shareholders may elect a successor to fill the vacancy, the vacancy results from an increase in the number of directors, in which case a majority of the entire Board may fill the vacancy, or unless otherwise required by law). A vacancy on SP Opportunity Funds' Board may be filled by a majority of the Board; provided that in the event that less than the majority of the Trustees holding office have been elected by the shareholders, to the extent required by the 1940 Act, but only to such extent, the Trustees then in office shall call a shareholders' meeting for the election of Trustees.
15
Limitation on Liability of Directors and Officers. The Companies' charters provide that, to the extent allowed by law, directors and officers will not be liable to the Companies or their shareholders for monetary damages for a breach of fiduciary duty. Maryland law permits such limitation of liability except for liability resulting from (a) actual receipt of an improper personal benefit or profit in the form of money, property or services or (b) active and deliberate dishonesty established by a final judgment as being material to the cause of action. The Declaration of SP Opportunity Funds provides that a Trustee, when acting in such capacity, shall not be personally liable to any person for any act, omission or obligation of SP Opportunity Funds, of such Trustee or any other Trustee, and shall be liable to SP Opportunity Funds and its shareholders solely for suc h Trustee's own willful malfeasance, bad faith, gross negligence or reckless disregard of the duties involved in the conduct of the office of Trustee, and shall not be liable for any neglect or wrongdoing of any officer, agent, employee, manager, adviser, sub-adviser or principal underwriter of SP Opportunity Funds. With regard to each Company and SP Opportunity Funds, the 1940 Act will not permit a limitation on liability relating to willful misfeasance, bad faith, gross negligence or reckless disregard of the duties involved in the conduct of such person's office.
Indemnification of Directors, Officers, Employees and Agents. The Companies' charter or by-laws provide for indemnification of directors and officers to the extent allowed by law. Maryland law permits a corporation to indemnify its present and former directors and officers, among others, against judgments, penalties, fines, settlements and reasonable expenses incurred by them in connection with any proceeding to which they may be made a party by reason of their service in those or other capacities unless it is established that (a) the act or omission of the director or officer was material to the matter giving rise to the proceeding and (i) was committed in bad faith or (ii) was the result of active and deliberate dishonesty, (b) the director or officer actually received an improper personal benefit in money, property or services or (c) in the case of any crimina l proceeding, the director or officer had reasonable cause to believe that the act or omission was unlawful. However, under Maryland law, a corporation may not indemnify for an adverse judgment in a suit by or in the right of the corporation or for a judgment of liability on the basis that personal benefit was improperly received, unless in either case a court orders indemnification and then only for expenses. Additionally, under the 1940 Act, such indemnification provisions may not cover willful misfeasance, bad faith, gross negligence, or reckless disregard of the duties involved in the conduct of one's office. SP Opportunity Funds' By-Laws provide that it shall indemnify Trustees, officers, employees and agents to the fullest extent permitted by law except that no indemnification shall be provided where there has been an adjudication of willful misfeasance, bad faith, gross negligence or reckless disregard of duties ("disabling conduct"), or, with respect to any proceeding disposed of without an adjudicat ion, unless there has been a determination that the indemnitee did not engage in disabling conduct by the court or other body before which the proceeding was brought, by a majority of disinterested trustees or by written legal opinion of independent legal counsel. In the case of each Company and SP Opportunity Funds, the 1940 Act prohibits indemnification in the case of willful misfeasance, bad faith, gross negligence or reckless disregard of the duties involved in the conduct of such person's office.
Liability of Shareholders
Under Maryland law, the Companies' shareholders generally have no personal liability for the debts or obligations of the Companies as a result of their status as shareholders. SP Opportunity Funds' Declaration provides that if any shareholder or former shareholder is exposed to liability relating to his or her status as a shareholder, and not because of the actions or omissions of such person or entity, such person or entity shall be entitled to be held harmless from and indemnified out of the assets of the particular series of SP Opportunity Funds of which such person or entity is or was a shareholder and in relation to which such liability arose against all loss and expense arising from such liability.
Derivative Actions
SP Opportunity Funds' Declaration imposes certain conditions on the ability of shareholders to bring a derivative action on behalf of SP Opportunity Funds, including a requirement that shareholders who collectively hold at least 10% of the outstanding shares of SP Opportunity Funds (or who collectively hold 10% of the outstanding shares of the series or class to which such action relates) join in a pre-suit demand upon the Board to bring such an
16
action unless an effort to cause the Board to bring the action is not likely to succeed. The Companies' Charters do not include similar limitations.
Termination and Dissolution
Dissolution of a Company requires the approval of the holders of a majority of the outstanding shares of all classes and series. However, under Maryland law, a Company may transfer all or any part of the assets of a series or class without shareholder approval, and can redeem outstanding shares at net asset value under certain circumstances. SP Opportunity Funds may be dissolved at any time by series, or by the Board by written notice to the shareholders, and any series or class thereof may be dissolved at any time by the Board by written notice to the shareholders of such series or class.
Management of the Funds
American Skandia Investment Services, Inc. (ASISI), One Corporate Drive, Shelton, Connecticut, and Prudential Investments LLC (PI), Gateway Center Three, 100 Mulberry Street, Newark, New Jersey, serve as co-managers of Mid-Cap Growth Fund pursuant to an investment management agreement with SP Mutual Funds, on behalf of Mid-Cap Growth Fund (the Mid-Cap Growth Management Agreement). PI serves as manager of New Era Growth Fund and Emerging Growth Fund pursuant to separate investment management agreements with (i) SP Opportunity Funds, on behalf of New Era Growth Fund (the New Era Growth Management Agreement), and (ii) Emerging Growth Fund (the Emerging Growth Management Agreement and collectively with the Mid-Cap Growth Management Agreement and the New Era Growth Management Agreement, the Management Agreements). As of June 30, 2006, PI served as the investment manager or co-manager to all of the Prudential Financial, Inc. U.S. and offshore open - -end investment companies, and as administrator to closed-end investment companies, with aggregate assets of approximately $97.6 billion. As of June 30, 2006, ASISI served as the co-manager to certain of the Prudential Financial, Inc. U.S. open-end investment companies. For ease of reference, the term "Manager" is used from time to time to refer to PI as it relates to New Era Growth Fund and Emerging Growth Fund and to PI and ASISI jointly as it relates to Mid-Cap Growth Fund.
Pursuant to the Management Agreements, the Manager administers each Fund's business affairs and supervises each Fund's investments. Subject to approval by the Board, the Manager may select and employ one or more subadvisers for each Fund, who will have primary responsibility for determining what investments the Fund will purchase, retain and sell. In evaluating a prospective subadviser, the Manager considers many factors, including the firm's experience, investment philosophy and historical performance. PI is also responsible for monitoring the performance of and supervising the Funds' subadvisers. Under the Mid-Cap Growth Management Agreement, PI (as co-manager) will provide supervision and oversight of ASISI's investment management responsibilities with respect to SP Mutual Funds, including Mid-Cap Growth Fund.
The Manager and the Funds operate under an exemptive order (the Order) from the SEC that generally permits the Manager to enter into or amend agreements with subadvisers without obtaining shareholder approval each time. This authority is subject to certain conditions, including the requirement that the Board must approve any new or amended agreements with a subadviser. Shareholders of a Fund still have the right to terminate these agreements at any time by a vote of the majority of outstanding shares of that Fund. Each Fund will notify shareholders of any new subadvisers or material amendments to subadvisory agreements pursuant to the Order.
The Manager currently engages the subadvisers listed below to manage the investments of the Funds in accordance with that Fund's investment objective, policies and limitations and any investment guidelines established by the Manager. Each subadviser is responsible, subject to the supervision and control of the Manager, for the purchase, retention and sale of securities in a Fund's investment portfolio under its management.
Jennison is the subadviser for Emerging Growth Fund. Jennison's address is 466 Lexington Avenue, New York, NY 10017. As of June 30, 2006, Jennison managed in excess of $72 billion in assets. Jennison has served as an investment adviser since 1969 and has advised investment companies since 1990. John P. Mullman, CFA, is the portfolio manager of Emerging Growth Fund and has final authority over all aspects of the Fund's investment
17
portfolio, including but not limited to, purchases and sales of individual securities, portfolio construction, risk assessment and management of cash flows. Mr. Mullman is a Managing Director of Jennison. He has been in the investment business since 1987, when he joined Prudential. Prior to joining Jennison in August 2000, Mr. Mullman managed institutional portfolios with Prudential. He earned his B.A. in Economics from the College of the Holy Cross in 1982 and his M.B.A. from Yale University in 1987. He is also a member of The New York Society of Security Analysts, Inc. He has managed Emerging Growth Fund since August 2005. The portfolio manager for Emerging Growth Fund is supported by other Jennison portfolio managers, research analysts and investment professionals. Jennison typically follows a team approach in providing such support to the portfolio manager. The teams are generally organized along product strategies (e.g., large cap growt h, large cap value) and meet regularly to review the portfolio holdings and discuss security purchase and sales activity of all accounts in the particular product strategy. Team members provide research support, make securities recommendations and support the portfolio manager in all activities. Members of the team may change from time to time.
GSAM is the subadviser for Mid-Cap Growth Fund. GSAM is located at 32 Old Slip, New York, New York 10005. GSAM registered as an investment advisor in 1990. Prior to the end of April 2003, Goldman Sachs Asset Management, a business unit of the Investment Management Division of Goldman, Sachs & Co. ("Goldman Sachs") served as subadviser for Mid-Cap Growth Fund. On or about April 26, 2003, GSAM assumed Goldman Sachs' investment advisory responsibilities for this Fund. GSAM serves as investment manager for a wide range of clients including pension funds, foundations and insurance companies and individual investors. There are 24 investment professionals on the GSAM Growth Team responsible for the day-to-day management of Mid-Cap Growth Fund since Goldman Sachs became the Fund's subadviser. The team is led by Steven M. Barry, David Shell, CFA and Gregory H. Ekizian. CFA. Mr. Barry, Mr. Shell and Mr. Ekizian are Chief Investment Officers and senior portfolio managers for the Growth Team. Mr. Shell served as a senior portfolio manager at Liberty prior to Goldman Sachs' acquisition of Liberty and had been employed by Liberty and its predecessor firm since 1987. Mr. Ekizian served as a senior portfolio manager at Liberty prior to Goldman Sachs' acquisition of Liberty and had been employed by Liberty and its predecessor firm since 1990. Prior to joining Goldman Sachs in 1999, Mr. Barry was a portfolio manager at Alliance Capital Management where he served for eleven years.
Calamos and TCW are the subadvisers for New Era Growth Fund. Calamos is a wholly-owned subsidiary of Calamos Holdings LLC. As of June 30, 2006, Calamos managed approximately $ billion in assets for institutions, individuals, investment companies and hedge funds. Calamos' address is 2020 Calamos Court, Naperville, IL 60563. TCW, a member of the TCW Group (TCW Group), is a diversified investment management company based in Los Angeles, California. Founded in 1971, TCW Group provides asset management services to a wide range of institutional and individual clients. TCW is majority owned by Societe Generale, a Paris-based bank. As of June 30, 2006, TCW Group had approximately $ billion in assets under management across equity, fixed income, balanced and international/global products. TCW's address is 865 South Figueroa Street, Suite 1800, Los Angeles, CA 90017. John P. Calamos, Sr., President, CEO and Co-Chief Investment Officer of Calamos, Nick P. Calamos, Senior Executive Vice President and Co-Chief Investment Officer of Calamos, and John P. Calamos, Jr., Executive Vice President of Calamos, are primarily responsible for the day-to-day management of New Era Growth Fund on behalf of Calamos. Each has been with Calamos since 1987. John P. Calamos, Sr. and Nick P. Calamos have managed money together at Calamos or a related entity for over 20 years. They have managed New Era Growth since Calamos became the Fund's subadviser in December 2002. R. Brendt Stallings, CFA, is the portfolio manager for the segment of New Era Growth Fund's assets advised by TCW. Mr. Stallings, Managing Director – U.S. Equities joined the TCW Equities Research Department in 1996 and has 10 years of experience. He currently serves as a Sen ior Portfolio Manager for the growth equities and mid-cap growth strategies.
Subsequent to the consummation of one or both of the Reorganizations, Jennison will continue to serve as subadviser for Emerging Growth Fund, the surviving fund, although the portfolio managers for Emerging Growth Fund could change at any time prior to and after the consummation of the Reorganizations. If the Manager determines that such portfolio manager change is not in the best interests of the Fund and its shareholders, then pursuant to the Order, the subadviser may be replaced without prior shareholder approval, subject to Board approval. If such change occurs prior to the Meetings you will be notified and you may change your vote for the proposal as described herein under "Voting Information-Revocation of Proxies."
18
Additional Information About the Portfolio Managers — Other Accounts Managed by Portfolio Managers
The table below identifies, as of July 31, 2006, for the portfolio manager referenced above, the number of accounts managed and the approximate total assets in such accounts, within each of the following categories: registered investment companies (RICs), other pooled investment vehicles and other accounts. For each category, the number of accounts and total assets in the accounts whose fees are based on performance is indicated in italics typeface.
| Portfolio Manager | RIC Accounts Managed | Assets of RIC Managed (Thousands) | Other Pooled Accounts Managed | Assets of Other Pooled Accounts Managed (Thousands) | Other Accounts Managed | Assets of Other Accounts Managed (Thousands) | |||||||||||||||||||||
| John P. Mullman | 4 | $ | 1,152,491 | 5 | $ | 568,778 | 6 | *** | $ | 873,234 | |||||||||||||||||
| (Jennison) | |||||||||||||||||||||||||||
| Steven M. Barry | |||||||||||||||||||||||||||
| (GSAM) | |||||||||||||||||||||||||||
| David Shell | |||||||||||||||||||||||||||
| (GSAM) | |||||||||||||||||||||||||||
| Gregory H. Ekizian (GSAM) | |||||||||||||||||||||||||||
| John P. Calamos, Sr. (Calamos) | |||||||||||||||||||||||||||
| Nick P. Calamos | |||||||||||||||||||||||||||
| (Calamos) | |||||||||||||||||||||||||||
| John P. Calamos, Jr. (Calamos) | |||||||||||||||||||||||||||
| R. Brendt Stallings (TCW) | |||||||||||||||||||||||||||
* "Other Pooled Investment Accounts" includes commingled insurance company separate accounts, commingled trust funds and non-U.S. mutual funds. "Other Accounts" includes single client accounts and managed accounts. Managed accounts are counted as one account per managed account platform and the asset allocation program is counted as one account.
** Certain of the accounts listed in the chart above are managed by one or more of the named portfolio managers. These accounts are included in the account and asset totals for each of the applicable portfolio managers.
*** Other Accounts excludes the assets and number of accounts in wrap fee programs that are managed using model portfolios.
Additional Information About the Portfolio Managers – Compensation and Conflicts of Interest.
Set forth below, for each portfolio manager, is an explanation of the structure of, and method(s) used to determine, portfolio manager compensation. Also set forth below, for each portfolio manager, is an explanation of any material conflicts of interest that may arise between a portfolio manager's management of a Fund's investments and investments in other accounts.
Jennison Associates LLC
Compensation. Jennison seeks to maintain a highly competitive compensation program designed to attract and retain outstanding investment professionals, which includes portfolio managers and research analysts, and to align the interests of its investment professionals with that of its clients and overall firm results. Overall firm profitability determines the total amount of incentive compensation pool that is available for investment professionals. Investment professionals are compensated with a combination of base salary and discretionary cash bonus. In general, the cash bonus comprises the majority of the compensation for investment professionals.
Investment professionals' total compensation is determined through a subjective process that evaluates numerous qualitative and quantitative factors. There is no particular weighting or formula for considering the factors.
19
Some portfolio managers may manage or contribute ideas to more than one product strategy and are evaluated accordingly.
The following factors will be reviewed for the portfolio manager:
• One and three year pre-tax investment performance of groupings of accounts (a "Composite") relative to pre-determined passive indices, such as the Russell 1000 Mid Cap Growth Index, and industry peer group data for the product strategy (e.g., large cap growth, large cap value) for which the portfolio manager is responsible;
• Historical and long-term business potential of the product strategies;
• Qualitative factors such as teamwork and responsiveness; and
• Other factors such as experience and other responsibilities such as being a team leader or supervisor may also affect the portfolio manager's total compensation.
Conflicts of Interest. In managing other portfolios (including affiliated accounts), certain potential conflicts of interest may arise. Potential conflicts include, for example, conflicts among investment strategies, conflicts in the allocation of investment opportunities, or conflicts due to different fees. As part of its compliance program, Jennison has adopted policies and procedures that seek to address and minimize the effects of these conflicts.
Jennison's portfolio managers typically manage multiple accounts. These accounts may include, among others, mutual funds, separately managed advisory accounts (assets managed on behalf of institutions such as pension funds, colleges and universities, foundations), commingled trust accounts, affiliated single client and commingled insurance separate accounts, model nondiscretionary portfolios, and model portfolios used for wrap fee programs. Portfolio managers make investment decisions for each portfolio based on the investment objectives, policies, practices and other relevant investment considerations that the managers believe are applicable to that portfolio. Consequently, portfolio managers may recommend the purchase (or sale) of certain securities for one portfolio and not another portfolio. Securities purchased in one portfolio may perform better than the securities purchased for another portfolio. Similarly, securities sold from one po rtfolio may result in better performance if the value of that security declines. Generally, however, portfolios in a particular product strategy (e.g., large cap growth equity) with similar objectives are managed similarly. Accordingly, portfolio holdings and industry and sector exposure tend to be similar across a group of accounts in a strategy that have similar objectives, which tend to minimize the potential for conflicts of interest. While these accounts have many similarities, the investment performance of each account will be different primarily due to differences in guidelines, fees, expenses and cash flows.
In addition, Jennison has adopted trade aggregation and allocation procedures that seek to treat all clients (including affiliated accounts) fairly and equitably. These policies and procedures address the allocation of limited investment opportunities, such as IPOs and the allocation of transactions across multiple accounts. Currently, while no equity accounts under Jennison's management have performance fees, some accounts have higher fees than others. These differences may give rise to a potential conflict that a portfolio manager may allocate more time to the management of one account over another. While Jennison does not monitor the specific amount of time that a portfolio manager spends on a single portfolio, senior Jennison personnel periodically review the performance of Jennison's portfolio managers as well as periodically assess whether the portfolio manager has adequate resources to effectively manage the accounts assigned to that portfolio manager. Jennison also believes that its compensation structure tends to mitigate this conflict.
Goldman Sachs Asset Management, L.P.
Compensation. GSAM and the GSAM Growth Team's (the Growth Team) compensation package for its portfolio managers is comprised of a base salary and performance bonus. The performance bonus is first and foremost tied to the Growth Team's pre-tax performance for their clients and the Growth Team's total revenues for the past year which in part is derived from advisory fees and, for certain accounts, performance based fees. The Growth Team measures their performance on a market cycle basis which is typically measured over a three to seven
20
year period, rather than being focused on short term gains in their strategies or short term contributions from a portfolio manager in any given year.
The performance bonus for portfolio managers is significantly influenced by the following criteria: (1) whether the team performed consistently with objectives and client commitments; (2) whether the team's performance exceeded performance benchmarks over a market cycle; (3) consistency of performance across accounts with similar profiles; and (4) communication with other portfolio managers within the research process. Benchmarks for measuring performance can either be broad based or narrow based indices which will vary based on client expectations. The benchmark for Mid-Cap Growth Fund is Russell Mid Cap Growth.
The Growth Team also considers each portfolio manager's individual performance, his or her contribution to the overall performance of the strategy long-term and his/her ability to work as a member of the Team.
GSAM and the Growth Team's decision may also be influenced by the following: the performance of GSAM, the profitability of Goldman, Sachs & Co. and anticipated compensation levels among competitor firms.
Other Compensation. In addition to base salary and performance bonus, GSAM has a number of additional benefits/deferred compensation programs for all portfolio managers in place including (i) a 401K program that enables employees to direct a percentage of their pretax salary and bonus income into a tax-qualified retirement plan; (ii) a profit sharing program to which Goldman Sachs & Co. makes a pretax contribution; and (iii) investment opportunity programs in which certain professionals are eligible to participate subject to certain net worth requirements. Portfolio managers may also receive grants of restricted stock units and/or stock options as part of their compensation.
Certain GSAM portfolio managers may also participate in the firm's Partner Compensation Plan, which covers many of the firm's senior executives. In general, under the Partner Compensation Plan, participants receive a base salary and a bonus (which may be paid in cash or in the form of an equity-based award) that is linked to Goldman Sachs' overall financial performance.
Conflicts of Interest. GSAM's portfolio managers are often responsible for managing one or more funds as well as other accounts, including proprietary accounts, separate accounts and other pooled investment vehicles, such as unregistered hedge funds. A portfolio manager may manage a separate account or other pooled investment vehicle that may have materially higher fee arrangements than Mid-Cap Growth Fund and may also have a performance-based fee. The side-by-side management of these funds may raise potential conflicts of interest relating to cross trading, the allocation of investment opportunities and the aggregation and allocation of trades.
GSAM has a fiduciary responsibility to manage all client accounts in a fair and equitable manner. It seeks to provide best execution of all securities transactions and aggregate and then allocate securities to client accounts in a fair and timely manner. To this end, GSAM has developed policies and procedures designed to mitigate and manage the potential conflicts of interest that may arise from side-by-side management. In addition, GSAM has adopted policies limiting the circumstances under which cross-trades may be effected between a fund and another client account. GSAM conducts periodic reviews of trades for consistency with these policies.
Due to GSAM internal policies, GSAM portfolio managers are generally prohibited from purchasing shares of subadvised funds for which they have primary responsibility.
Calamos Advisors LLC
Compensation. The amounts paid to portfolio managers and the criteria utilized to determine the amounts are benchmarked against specific data provided by third party analytical agencies. Investment performance, as measured by the performance across all Calamos strategies with unique benchmarks for each strategy, is utilized to determine part of the discretionary target bonus. Also, due to the portfolio managers' ownership and executive management positions with Calamos and its parent company, additional corporate objectives are utilized to determine the discretionary target bonus. For 2005, the additional corporate objectives were: marketing effectiveness, as measured by assets under management compared to a target, redemption rate relative to the industry and percentage growth
21
in assets under management relative to the industry; advisory fee revenues, measured by total revenues compared to a target as well as percentage growth in revenues compared to the industry; operating income, as measured by operating margin percentage relative to the industry, stock price performance as measured by the stock price at the end of 2005 compared to a target as well as the price to earnings multiple compared to the same multiple for the industry; and performance on corporate strategic initiatives.
Conflicts of Interest. Calamos does not foresee any potentially material conflicts of interest as a result of concurrent management of New Era Growth Fund.
Potential conflicts that could arise include the allocation of investment opportunities and securities purchased among these multiple accounts. Similarly, trading in securities by Calamos personnel for their own accounts potentially could conflict with the interest of clients. Calamos does not believe that any of these potential conflicts of interest are material, and Calamos has policies and procedures in place to detect, monitor and resolve these and other potential conflicts of interest that are inherent to its business as an investment advisor.
TCW Investment Management Company
Compensation. Portfolio managers of TCW Investment Management Company are compensated through a combination of base salary, profit sharing based compensation (profit sharing) and equity incentive participation in TCW Investment Management Company's immediate parent, The TCW Group, Inc and/or ultimate parent, Société Générale (equity incentives). Profit sharing and equity incentives generally represent most of the portfolio managers' compensation.
Profit sharing is linked quantitatively to a fixed percentage of income relating to accounts in the investment strategy area for which the portfolio managers are responsible and is paid quarterly. While it may be determined on a gross basis, without the deduction of expenses, in most cases, revenues are allocated to a pool and profit sharing compensation is paid out after the deduction of group expenses. The profit sharing percentage used to compensate the portfolio managers for management of the Fund is generally the same as that used to compensate them for all other client accounts they manage in the same strategy for TWC Investment Management Company and its affiliates under The TCW Group (collectively, TCW), with limited exceptions involving grandfathered accounts, firm capital of TCW or accounts sourced through a distinct distribution channel. In general, portfolio managers do not receive discretionary bonuses.
In many cases, the profit sharing percentage is subject to increase based on the relative pre-tax performance of the investment strategy composite, net of fees and expenses, to that of a benchmark. The benchmark varies from strategy to strategy but, within a given strategy, it applies to all accounts, including New Era Growth Fund. The measurement of performance can be based on single year or multiple year metrics, or a combination thereof.
Certain accounts of TCW charge a performance fee in addition to or in lieu of a flat asset-based fee. These performance fees can be (a) asset-based fees, the percentage of which is tied to the performance of the account relative to a benchmark or (b) a percentage of the net gains of the account over a threshold gain tied to a benchmark. For these accounts, the portfolio managers' profit sharing compensation will apply to such performance fees. The profit sharing percentage in the case of performance fees is generally the same as it is for the profit sharing compensation applicable to New Era Growth Fund; however, in the case of certain alternative investment products managed by a portfolio manager, the profit sharing percentage may be higher.
All portfolio managers participate in equity incentives providing benefits for performance of TCW and its affiliates, through stock ownership or participation and are in stock option or stock appreciation plans of TCW and/or Société Générale. The TCW 2001 and 2005 TCW Stock Option Plans provide eligible portfolio managers the opportunity to participate in an effective economic interest in TCW, the value of which is tied to TCW's annual financial performance as a whole. TCW portfolio managers also participate in Société Générale's Stock Option Plan which grants options on its common stock, the value of which may be realized after certain vesting requirements are met. Some portfolio managers are stockholders of TCW and/or Société Générale, as well.
22
Certain portfolio managers also participate in compensation plans that are allocated a portion of management fees, incentive fees or performance fees payable to TCW in its products, including those not managed by the portfolio managers. Portfolio managers may also participate in deferred compensation programs, the value of which is tied to their tenure at TCW and is payable upon the reaching of certain time-based milestones.
Conflicts of Interest. Actual or potential conflicts of interest may arise when a portfolio manager has management responsibilities to more than one account (including New Era Growth Fund), such as devotion of unequal time and attention to the management of the accounts, inability to allocate limited investment opportunities across a broad band of accounts and incentive to allocate opportunities to an account where the portfolio manager or TCW has a greater financial incentive, such as a performance fee account or where an account or fund managed by a portfolio manager has a higher fee sharing arrangement than the portfolio manager's fee sharing percentage with respect to New Era Growth Fund. TCW has adopted policies and procedures reasonably designed to address these types of conflicts and TCW believes its polices and procedures serve to operate in a manner that is fair and equitable among its clients, including New Era Growth Fund.
Additional Information About the Portfolio Managers – Securities Ownership. The table below identifies, for each portfolio manager, ownership of Fund securities by that portfolio manager as of July 31, 2006.
| Fund | Portfolio Manager(s) | Ownership of Securities | |||||||||
| Mid-Cap Growth Fund | Steven M. Barry David Shell Gregory H. Ekizian | ||||||||||
| New Era Growth Fund | John P. Calamos, Sr. Nick P. Calamos John P. Calamos, Jr. R. Brendt Stallings | ||||||||||
| Emerging Growth Fund | John P. Mullman | $ | 10,001-$50,000 | ||||||||
Investment Management Fees
Pursuant to the Mid-Cap Growth Management Agreement, ASISI receives a monthly investment management fee for the performance of its services for Mid-Cap Growth Fund. PI does not receive a fee for its management of Mid-Cap Growth Fund. Pursuant to the New Era Growth Management Agreement and the Emerging Growth Management Agreement, PI receives a monthly investment management fee for the performance of its services for those Funds. The investment management fee is accrued daily for the purposes of determining the sale and redemption price of each Fund's shares. ASISI, as co-manager of Mid-Cap Growth Fund, and PI, as manager of New Era Growth Fund and Emerging Growth Fund, pays the relevant subadviser a portion of its fee for the performance of the subadvisory services at no additional cost to the Funds.
| Fund | Annual Rate | ||||||
| Mid-Cap Growth Fund* | 1.00% of average daily net assets up to and including $500 million 0.90% of average daily net assets from $500 million to $1 billion 0.85% of its average daily net assets in excess of $1 billion | ||||||
| New Era Growth Fund | 0.90% of average daily net assets up to and including $1 billion 0.85% of its average daily net assets in excess of $1 billion | ||||||
| Emerging Growth Fund | 0.60% of average daily net assets up to and including $1 billion 0.55% of average daily net assets in excess of $1 billion. | ||||||
* The Manager agreed to reduce the management fee rate for Mid-Cap Growth Fund so that the management fee, as a percentage of Mid-Cap Growth Fund's average daily nets assets, is 0.90% of $500 million, 0.85% of the next $500 million, and 0.80% on $1 billion and over.
23
As a result, if the Plan is approved, Target Fund shareholders will pay investment management fees at a lower rate. During the fiscal year ended October 31, 2005 and the fiscal period ended April 30, 2006, Emerging Growth Fund paid $_________ and _______, respectively, in investment management fees to PI. During the fiscal year ended October 31, 2005 and the fiscal period ended April 30, 2006, Mid-Cap Growth Fund paid $_________ and _______, respectively, in investment management fees to ASISI. During the fiscal year ended February 28, 2006, New Era Growth Fund paid $_________ in investment management fees to PI.
The Manager pays the respective subadviser a portion of the investment management fee received from the Funds. The Manager pays such subadvisory fees without any additional expense to the respective Fund as follows:
| Fund/Subadviser | Annual Rate | ||||||
| Mid-Cap Growth Fund (GSAM) | 0.28% of average daily net assets up to and including $1 billion 0.25% of average daily net assets in excess of $1 billion* | ||||||
| New Era Growth Fund (Calamos) | 0.45% of average daily net assets up to and including $100 million 0.40% of average daily net assets in excess of $100 million | ||||||
| New Era Growth Fund (TCW) | 0.38% of average daily net assets | ||||||
| Emerging Growth Fund (Jennison) | 0.30% of average daily net assets up to and including $1 billion 0.261% of average daily net assets in excess of $1 billion | ||||||
* For purposes of calculating the subadvisory fees payable to GSAM by the Manager, the assets managed by GSAM in the Mid-Cap Growth Fund will be aggregated with the assets managed by GSAM in the Strategic Partners Goldman Sachs Concentrated Growth Fund of SP Mutual Funds, the AST Goldman Sachs Mid-Cap Growth Portfolio and the AST Goldman Sachs Concentrated Growth Portfolio of American Skandia Trust.
Distribution Plan
American Skandia Marketing, Incorporated (ASM) and Prudential Investment Management Services LLC (PIMS) jointly serve as the principal underwriter and distributor for Mid-Cap Growth Fund. PIMS also serves as the principal underwriter and distributor for New Era Growth Fund and Emerging Growth Fund. For ease of reference, the term "Distributor" is used from time to time to refer to PIMS as it relates to New Era Growth Fund and Emerging Growth Fund and to PIMS and ASISI jointly as it relates to Mid-Cap Growth Fund. Each Company and SP Opportunity Funds have adopted a Distribution and Service Plan (commonly known as a 12b-1 Plan) for each class of shares (other than Class Z shares of New Era Growth Fund and Emerging Growth Fund) to compensate the Distributor for its services and expenses in distributing shares and servicing shareholder accounts. Under the 12b-1 Plan for each share class, each Fund is authorized to pay the Distributor at the fol lowing annual rates for assets attributable to the indicated share class:
| Share Class | Rate | ||||||
| Class A (1) | 0.30% of the Fund's average daily net assets attributable to Class A shares | ||||||
| Class B | 1.00% of the Fund's average daily net assets attributable to Class B shares | ||||||
| Class C | 1.00% of the Fund's average daily net assets attributable to Class C shares | ||||||
| Class L (2) | 0.50% of the Fund's average daily net assets attributable to Class L shares | ||||||
| Class M (2) | 1.00% of the Fund's average daily net assets attributable to Class M shares | ||||||
| Class X (2) | 1.00% of the Fund's average daily net assets attributable to Class X shares | ||||||
| Class Z (3) | None | ||||||
(1) With respect to Emerging Growth Fund and Mid-Cap Growth Fund, the Distributor has contractually agreed until February 28, 2007 to reduce its distribution and service (12b-1) fees for Class A shares of those Funds to 0.25% of the average daily net assets attributable to Class A shares of those Funds. With respect to New Era Growth Fund, the Distributor has contractually agreed until June 30, 2007 to reduce its distribution and service (12b-1) fees for Class A shares of the Fund to 0.25% of the average daily net assets attributable to Class A shares of the Fund.
24
(2) Only Mid-Cap Growth Fund and Emerging Growth Fund offer Class L, Class M, Class X and New Class X shares.
(3) Only New Era Growth Fund and Emerging Growth Fund offer Class Z shares. Class Z shares are not subject to any distribution or service fees.
Because these fees are paid out of each Fund's assets on an ongoing basis, these fees may, over time, increase the cost of an investment in that Fund and may be more costly than other types of sales charges.
The Distributor may use distribution and service fees received under the 12b-1 Plan to compensate qualified brokers for services provided in connection with the sale of shares and the maintenance of shareholder accounts. In addition, distribution and service fees received under the Class X Plans by the Distributor are used for such Distributor's purchases of bonus shares, which are additional shares granted to investors in Class X shares by the Distributor.
Valuation
In connection with each Reorganization, each whole and fractional share of each class of a Target Fund will be exchanged for whole or fractional shares of equal dollar value of the corresponding class of Emerging Growth Fund. The share value of a mutual fund – known as the net asset value per share or NAV – is determined by a simple calculation: it is the total value of the Fund (assets minus liabilities) divided by the total number of shares outstanding. For example, if the value of the investments held by fund XYZ (minus its liabilities) is $1,000 and there are 100 shares of fund XYZ owned by shareholders, the price of one share of the fund – or the NAV – is $10 ($1,000 divided by 100).
Each Fund's portfolio securities are valued based upon market quotations or, if not readily available, at fair value as determined in good faith under procedures established by the relevant Board. A Fund also may use fair value pricing if it determines that the market quotation is not reliably based, among other things, on events or market conditions that occur after the quotation is derived or after the close of the primary market on which the security is traded, but before the time that the Fund's NAV is determined. This use of fair value pricing most commonly occurs with securities that are primarily traded outside the U.S. because such securities present time-zone arbitrage opportunities when events or conditions affecting the prices of specific securities or the prices of securities traded in such markets generally occur after the close of the foreign markets but prior to the time the Fund determines its NAV. A Fund may also use fair va lue pricing with respect to U.S.-traded securities if, for example, trading in a particular security is halted and does not resume before the Fund calculates its NAV or the exchange on which a security is traded closes early. In addition, fair value pricing is used for securities where the pricing agent or principal market maker does not provide a valuation or methodology or provides a valuation or methodology that, in the judgment of the Manager (or subadvisers) does not represent fair value. Different valuation methods may result in differing values for the same security. The fair value of a portfolio security that a Fund uses to determine its NAV may differ from the security's quoted or published price. If a Fund needs to implement fair value pricing after the NAV publishing deadline, but before shares of a Fund are processed, the NAV you receive or pay may differ from the published NAV price.
For purposes of computing a Fund's NAV, the Fund's futures contracts will be valued at the last sale or bid price prior to the close of trading on the New York Stock Exchange (NYSE) that day. Except when a Fund fair values securities, each foreign security held by a Fund is normally valued as of the close of the security's primary market. Fair value pricing procedures are designed to result in prices for a Fund's securities and its net asset value that are reasonable in light of the circumstances which make or have made market quotations unavailable or unreliable, and may have the effect of reducing arbitrage opportunities available to short-term traders. There is no assurance, however, that fair value pricing will more accurately reflect the market value of a security than the market price of such security on that day or that it will prevent dilution of the Fund's NAV by short-term traders.
Each Fund's NAV is determined once each business day at the close of regular trading on the NYSE, usually 4:00 p.m. New York time. The NYSE is closed on most national holidays and Good Friday. On days when the NYSE is closed but the primary markets for the Fund's foreign securities are open, the Funds will not price, and you will not be able to purchase, redeem or exchange a Fund's shares even though the value of these securities may have changed. Conversely, each Fund will ordinarily price its shares, and you may purchase, redeem or exchange shares
25
on days that the NYSE is open but foreign securities markets are closed. On days there are no orders to purchase, sell or exchange the Fund's shares, or when changes in the value of the Fund's portfolio do not materially affect its NAV, the Funds' NAVs may not be determined.
Most national newspapers report the NAVs of larger mutual funds, allowing investors to check the prices of those funds daily.
Although the legal rights of each class of shares of each Fund are substantially identical, the different expenses borne by each class will result in different NAVs and dividends. NAV is calculated separately for each class of each Fund. The NAVs of Class B, Class C, Class L, Class M, Class R and Class X, as applicable, of each Fund shares will generally be lower than the NAV of Class A shares of each Fund as a result of the larger distribution-related fee to which Class B and Class C, Class L, Class M, Class R and Class X shares, as applicable, are subject. It is expected, however, that the NAV of each Fund's share classes will tend to converge immediately after the recording of dividends, if any, that will differ by approximately the amount of the distribution and/or service fee expense accrual differential among the classes.
Portfolio Holdings
In addition to the description contained herein, a description of each Fund's policies and procedures with respect to the disclosure of that Fund's portfolio securities is also contained in that Fund's prospectus, SAI and on that Fund's website (for the Target Funds, see www.strategicpartners.com, and for Emerging Growth Fund, see www.jennisondryden.com). Each Fund will provide a full list of its portfolio holdings as of the end of the fiscal quarter on its website within approximately 30 days after the end of the month. Each Fund's portfolio holdings are made public, as required by law, in the Fund's annual and semi-annual reports and on Form N-Q. In addition, each Fund may release the Fund's top ten holdings, sector and country breakdowns, and largest industries, as applicable, on a quarterly or monthly basis with the information 15 days prior to the release. Such information will be posted to the relevant Fund's website.
When authorized by a Fund's Chief Compliance Officer (CCO) and another officer of such Fund, portfolio holdings information may be disseminated more frequently or at different periods than as described above to intermediaries that distribute such Fund's shares, third-party providers of auditing, custody, proxy voting and other services for such Fund, rating and ranking organizations, and certain affiliated persons of such Fund, as described below. The procedures utilized to determine eligibility are set forth below.
Procedures for Release of Portfolio Holdings Information:
1. A request for release of Fund holdings shall be prepared by such third parties setting forth a legitimate business purpose for such release which shall specify the Fund, the terms of such release and frequency (e.g. level of detail staleness). Such request shall address whether there are any conflicts of interest between a Fund and the investment adviser, subadviser, principal underwriter or any affiliated person thereof and how such conflicts shall be dealt with to demonstrate that the disclosure is in the best interest of the shareholders of the Fund.
2. The request shall be forwarded to PI's Product Development Group and to the CCO of the Fund, or his delegate, for review and approval.
3. A confidentiality agreement in the form approved by an officer of the Fund must be executed with the recipient of the fund holdings information.
4. An officer of the Fund shall approve the release and agreement. Copies of the release and agreement shall be sent to PI's law department.
5. Written notification of the approval shall be sent by such officer to PI's Fund Administration Department to arrange the release of fund holdings information.
26
6. PI's Fund Administration Department shall arrange for the release of fund holdings information by PFPC Trust Company (for Mid-Cap Growth Fund and SP New Era Growth Fund) and The Bank of New York (for Emerging Growth Fund) (collectively, the Custodian Banks).
As of the date of this Prospectus/Proxy Statement, each Fund will provide:
1. Traditional External Recipients/Vendors
• Full holdings on a daily basis to Investor Responsibility Research Center (IRRC), Institutional Shareholder Services (ISS) and Automatic Data Processing, Inc. (ADP) (proxy voting agents) at the end of each day;
• Full holdings on a daily basis to ISS (securities class action claims services administrator) at the end of each day;
• Full holdings on a daily basis to the relevant subadviser, Custodian Bank, sub-custodian (if any are appointed) and accounting agents (which includes the Custodian Banks and any other accounting agent that may be appointed) at the end of each day;
• Full holdings to KPMG, LLP, each Fund's independent registered public accounting firm, as soon as practicable following the Fund's fiscal year-end or on an as-needed basis; and
• Full holdings to financial printers as soon as practicable following the end of each Fund's quarterly, semi-annual and annual period-ends.
2. Analytical Service Providers
• The trades for each Fund on a quarterly basis to Abel/Noser Corp. (an agency-only broker and transaction cost analysis company) as soon as practicable following the Fund's fiscal quarter-end;
• Full holdings on a daily basis to FT Interactive Data (a fair value information service) at the end of each day;
• Full holdings on a daily basis to FactSet (an online investment research provider) at the end of each day.
In each case, the information disclosed must be for a legitimate business purpose and is subject to a confidentiality agreement intended to prohibit the recipient from trading on or further disseminating such information (except for legitimate business purposes). Such arrangements will be monitored on an ongoing basis and will be reviewed by the Fund's CCO and PI's Law Department on an annual basis.
In addition, certain authorized employees of PI receive portfolio holdings information on a quarterly, monthly or daily basis or upon request, in order to perform their business functions. All PI employees are subject to the requirements of the personal securities trading policy of Prudential Financial, Inc., which prohibits employees from trading on, or further disseminating confidential information, including portfolio holdings information.
Fund directors have approved PI's Policy for the Dissemination of Portfolio Holdings. The directors shall, on a quarterly basis, receive a report from PI detailing the recipients of the portfolio holdings information and the reason for such disclosure. The directors have delegated oversight over the Funds' disclosure of portfolio holdings to the CCO.
There can be no assurance that the Funds' policies and procedures on portfolio holdings information will protect the Funds from the misuse of such information by individuals or entities that come into possession of the information.
Frequent Purchases and Redemptions of Fund Shares
Each Fund seeks to prevent patterns of frequent purchases and redemptions of Fund shares by its shareholders. Frequent purchases and sales of shares of a Fund may adversely affect Fund performance and the interests of long-term investors. When a shareholder engages in frequent or short-term trading, a Fund may have to sell portfolio securities to have the cash necessary to redeem the shareholder's shares. This can happen when it is not advantageous to sell any securities, so a Fund's performance may be hurt. When large dollar amounts are involved, frequent trading can also make it difficult to use long-term investment strategies because a Fund cannot predict how much
27
cash it will have to invest. In addition, if a Fund is forced to liquidate investments due to short-term trading activity, it may incur increased brokerage and tax costs. Similarly, a Fund may bear increased administrative costs as a result of the asset level and investment volatility that accompanies patterns of short-term trading. Moreover, frequent or short-term trading by certain shareholders may cause dilution in the value of Fund shares held by other shareholders. Funds that invest in foreign securities may be particularly susceptible to frequent trading because time zone differences among international stock markets can allow a shareholder engaging in frequent trading to exploit Fund share prices that may be based on closing prices of foreign securities established some time before each Fund calculates its own share price. Funds that invest in certain fixed-income securities, such as high-yield bonds or certain asset-backed securities , may also constitute an effective vehicle for a shareholder's frequent trading strategy.
The Boards of the Companies and SP Opportunity Funds have adopted policies and procedures designed to discourage or prevent frequent trading activities by Fund shareholders. In an effort to prevent such practices, each Fund's transfer agent monitors trading activity on a daily basis. Each Fund has implemented a trading policy that limits the number of times a shareholder may purchase Fund shares or exchange into such Fund and then sell those shares within a specified period of time (a round-trip transaction) as established by such Fund's CCO. The CCO is authorized to set and modify the parameters at any time as required to prevent the adverse impact of frequent trading on Fund shareholders. The CCO has defined frequent trading as one or more round-trip transactions in shares of a Fund within a 30-day period. A second round-trip within 60 days will begin a warning period that will remain in effect for 90 days. If additional purchase activity is initiated during the warning period, the purchase activity will be cancelled. In addition, if two round-trips have already been completed within the past 90 days, a trading suspension will be placed on the account that remains in effect for 90 days. Exceptions to the trading policy will not normally be granted.
Each Fund reserves the right to reject or cancel, without prior notice, all additional purchases or exchanges into that Fund by a shareholder who has violated this policy. Moreover, each Fund may direct a broker-dealer or other intermediary to block a shareholder account from future trading in a Fund. The transfer agent will monitor trading activity over $25,000 per account on a daily basis for a rolling 30-day period. If a purchase into a Fund is rejected or cancelled for violations of the trading policy, the shareholder will receive a return of the purchase amount.
If a Fund is offered to qualified plans on an omnibus basis or if Fund shares may be purchased through other omnibus arrangements (Intermediaries), Intermediaries maintain the individual beneficial owner records and submit to each Fund only aggregate orders combining the transactions of many beneficial owners. Each Fund itself generally cannot monitor trading by particular beneficial owners. Each Fund communicates to Intermediaries in writing that it expects the Intermediaries to handle orders on transfers by beneficial owners consistently with each Fund's policies as set forth in each Fund's prospectus and SAI on transfers by beneficial owners. Omnibus accounts and Intermediaries are treated uniformly with respect to these policies. Intermediaries may impose different or stricter restrictions on transfers by beneficial owners. Consistent with the restrictions described above, investments in each Fund through retirement programs administered by Prudential Retirement will be similarly identified for frequent purchases and redemptions and appropriately restricted.
The transfer agent also reviews the aggregate net flows in excess of $1 million. In those cases, the trade detail is reviewed to determine if any of the activity relates to previously identified policy offenders. In cases of omnibus orders, the Intermediary may be contacted by the transfer agent to obtain additional information. The transfer agent has the authority to cancel all or a portion of the trade if the information reveals that the activity relates to previously identified policy offenders. In that case, the shareholder will receive a return of the purchase amount. Where appropriate, the transfer agent may request that the Intermediary block a financial adviser or client from accessing each Fund. If necessary, each Fund may be removed from a particular Intermediary's platform.
Shareholders seeking to engage in frequent trading activities may use a variety of strategies to avoid detection and, despite the efforts of each Fund to prevent such trading, there is no guarantee that each Fund, the transfer agent or Intermediaries will be able to identify these shareholders or curtail their trading practices. None of the Funds has any arrangements intended to permit trading of its shares in contravention of the policies described above.
28
Purchases, Redemptions, Exchanges and Distributions
The purchase policies for each Fund are identical. Emerging Growth Fund offers Class A, Class B, Class C, Class L, Class M, Class X, Class Z, and Class R shares. Mid-Cap Growth Fund offers Class A, Class B, Class C, Class L, Class M, and Class X shares. New Era Growth Fund offers Class A, Class B, Class C, and Class Z shares.
The offering price is the NAV per share plus any initial sales charge that applies. Class A shares of each Fund are sold at NAV plus an initial sales charge that varies depending on the amount of your investment. Class B shares of each Fund are sold at NAV per share without an initial sales charge. Investors who purchase $1 million or more of Class A shares and sell these shares within 12 months of purchase are not subject to an initial sales charge but are subject to a contingent deferred sales charge (CDSC) of 1% (the CDSC is waived for purchases by certain retirement or benefit plans affiliated with Prudential). In addition, if Class B shares of each Fund are redeemed within seven years of their purchase, a CDSC will be deducted from the redemption proceeds. Class C shares are sold at NAV per share without an initial sales charge. In addition, if Class C shares are redeemed within 12 calendar months of their purchase, a CDSC of 1.00% will be deducted from the redemption proceeds. Class L shares are subject to up to a 5.75% initial sales charge on purchases under $1 million. Investors who purchase $1 million or more of Class L shares, to the extent Class L is open to new purchases, and sell these shares within 12 months of purchase are not subject to an initial sales charge but are subject to a CDSC of 1% (the CDSC is waived for purchases by certain retirement or benefit plans affiliated with Prudential). Class M, Class X and New Class X shares are sold subject to a CDSC of 6.00%, decreasing annually. Class L, Class M, Class X and New Class X shares are generally no longer offered for direct purchase.
Class A shares of each Fund purchased in amounts of less than $1 million require you to pay a sales charge at the time of purchase.
This table shows how the sales charge decreases as the amount of the investment increases:
| Amount of Purchase | Front-end Sales Charge (as % of offering price) | Front-end Sales Charge (as % of amt. Invested) | |||||||||
| Less than $25,000 | 5.50 | % | 5.82 | % | |||||||
| $25,000 up to $49,999 | 5.00 | % | 5.26 | % | |||||||
| $50,000 up to $100,000 | 4.50 | % | 4.71 | % | |||||||
| $100,000 up to $250,000 | 3.75 | % | 3.90 | % | |||||||
| $250,000 up to $500,000 | 2.75 | % | 2.83 | % | |||||||
| $500,000 up to $1,000,000 | 2.00 | % | 2.04 | % | |||||||
| $1,000,000 up to $5,000,000* | None | None* | |||||||||
* If you invest $1 million or more, you can buy only class A shares, unless you qualify to buy Class Z shares. If you purchase $1 million or more of Class A shares and sell these shares within 12 months of purchase, you will be subject to a 1% CDSC, although you will not be subject to an initial sales charge. (The CDSC is waived for purchases by certain retirement or benefit plans).
Class B shares of each Fund do not require you to pay a sales charge at the time of purchase, but do require you to pay a sales charge if you sell your shares within six years.
Redemptions of Class B shares of each Fund will be subject to a CDSC declining from 5% to zero over a six-year period. The CDSC will be deducted from the redemption proceeds and reduce the amount paid to the purchaser. The CDSC will be imposed on any redemption that reduces the current value of the Class B shares of each Fund to an amount which is lower than the amount of all payments made by the investor for shares during the preceding six years. A CDSC will be applied on the lesser of the original purchase price or the current value of the shares being redeemed. Increases in the value of the investors shares or shares acquired through reinvestment of dividends or distributions are not subject to a CDSC. The amount of any CDSC will be paid to and retained by the Distributor. If an investor purchases or holds shares through a broker, third party administrator or other authorized entity that maintains subaccount recordkeeping, any applicable CDSC that the investor will pay will be calculated and reported to PMFS by such broker, administrator or other authorized entity.
29
The amount of the CDSC, if any, will vary depending on the number of years from the time of payment for the purchase of shares until the time of redemption of such shares. Solely for purposes of determining the number of years from the time of any payment for the purchase of shares, all payments during a month will be aggregated and deemed to have been made on the last day of the month. The CDSC will be calculated from the first day of the month after the initial purchase, excluding the time shares were held in a money market fund.
The following table sets forth the rates of the CDSC applicable to redemptions of Class B shares of each Fund:
| Redemption During | Class B CDSC (as % of amount subject to charge) | ||||||
| 1st year after purchase | 5.0 | % | |||||
| 2nd year after purchase | 4.0 | % | |||||
| 3rd year after purchase | 3.0 | % | |||||
| 4th year after purchase | 2.0 | % | |||||
| 5th year after purchase | 1.0 | % | |||||
| 6th year after purchase | 1.0 | % | |||||
| 7th year after purchase | None | ||||||
In determining whether a CDSC is applicable to a redemption, the calculation will be made in a manner that results in the lowest possible rate. It will be assumed that the redemption is made first of amounts representing shares acquired pursuant to the reinvestment of dividends and distributions; then of amounts representing the increase in NAV above the total amount of payments for the purchase of Class B shares of each Fund (and Class F shares of International Equity Fund after the Global Growth Fund Reorganization) made during the preceding six years; then of amounts representing the cost of shares held beyond the applicable CDSC period; and finally, of amounts representing the cost of shares held for the longest period of time within the applicable CDSC period.
Class L shares of Emerging Growth Fund and Mid-Cap Growth Fund are closed to most new purchases (with the exception of reinvested dividends and purchases by certain college savings plans). Class L shares are sold at an offering price that normally equals NAV plus an initial sales charge that varies depending on the amount of the investment. In certain instances described below, however, purchases are either not subject to an initial sales charge (and the offering price will be at NAV) or will be eligible for reduced sales charges. Emerging Growth Fund and Mid-Cap Growth Fund receive an amount equal to the NAV to invest for the account of the purchaser. A portion of the sales charge is retained by the Distributor and a portion is allocated to the purchaser's dealer. The Distributor may allocate the entire amount of the initial sales charge to dealers for all sales occurring during a particular period. The front-end sales charge rates are as f ollows:
| Amount of Purchase | Front-end Sales Charge (as % of offering price) | Front-end Sales Charge (as % of amt. Invested) | |||||||||
| Less than $50,000 | 5.75 | % | 6.10 | % | |||||||
| $ | 50,000 | up to $100,000 | 5.00 | % | 5.26 | % | |||||
| $ | 100,000 | up to $250,000 | 4.00 | % | 4.17 | % | |||||
| $ | 250,000 | up to $500,000 | 3.00 | % | 3.09 | % | |||||
| $500,000 up to $1 million | 2.25 | % | 2.30 | % | |||||||
| $ | 1,000,000 | up to $4,999,999 | None | 1.00 | %* | ||||||
| $ | 5,000,000 | up to $9,999,999 | None | 0.50 | %* | ||||||
| $10,000,000 up to $9,999,999,999 | None | 0.25 | %* | ||||||||
* For investments of $1 million to $4,999,999, the dealer reallowance is 1.00%. For investments of $5 million to $9,999,999, the dealer reallowance is 0.50%. For investments of $10 million and above, the dealer reallowance is 0.25%.
There is no initial sales charge on purchases of Class L shares of Emerging Growth Fund and Mid-Cap Growth Fund in the following cases:
• Purchases aggregating $1 million or more;
• Purchases by an employer-sponsored retirement plan under Section 403(b) of the Code that features an employer contribution or "match"; or
30
• Purchases by an employer-sponsored retirement plan under Section 401(a) of the Code (including a 401(k) plan) with at least 25 eligible employees or that uses the services of a third party administrator that has established an electronic link with the applicable Funds.
However, if such Class L shares are redeemed within 12 months of their purchase, a CDSC (Class L CDSC) will be deducted from the redemption proceeds. During the past 12 months Class L shares were not available to new investors. The Class L CDSC will not apply to redemptions of shares acquired by the reinvestment of dividends or capital gains distributions or redemptions for the purpose of making distributions or loans to Section 401(a) or 403(b)(7) plan participants, and will be waived under certain circumstances described in a Fund's SAI. The Class L CDSC will be equal to 1.0% of the shares' NAV at the time of purchase. Any increase in the share price is not subject to the Class L CDSC. The Class L CDSC is paid to the distributor with respect to expenses incurred in providing distribution-related services to the applicable Funds. To determine whether the Class L CDSC applies to a redemption, the applicable Funds will first redeem shares acq uired by reinvestment of dividends and capital gains distributions, and then will redeem shares in the order in which they were purchased (such that shares held the longest are redeemed first). For purposes of determining how long a purchaser has held shares, all purchases during the month are considered to have been made on the first business day of the month in which the purchase was actually made. The holding period for purposes of determining the applicable Class L CDSC will be calculated from the first day of the month after initial purchase, excluding any time shares were held in a money market fund.
Class M shares of Emerging Growth Fund and Mid-Cap Growth Fund are sold at NAV per share without an initial sales charge. However, if Class M shares are redeemed within 7 years of their purchase, a CDSC (Class M CDSC) will be deducted from the redemption proceeds. The Class M CDSC will not apply to redemptions of shares purchased by the reinvestment of dividends or capital gains distributions and may be waived under certain circumstances described below. The charge will be assessed on the shares' NAV at the time of purchase. Any increase in the share price is not subject to the Class M CDSC. The Class M CDSC is paid to the Distributor to reimburse expenses incurred in providing distribution-related services to Emerging Growth Fund and Mid-Cap Growth Fund in connection with the sale of its Class M shares. The Distributor has assigned its right to receive any Class M CDSC, as well as any distribution and service fees to certain unrelated parti es that provides funding for the up-front sales concession payments.
To determine whether the Class M CDSC applies to a redemption, Emerging Growth Fund and Mid-Cap Growth Fund will first redeem shares acquired by reinvestment of dividends and capital gains distributions, and then will redeem shares in the order in which they were purchased (such that shares held the longest are redeemed first). The amount of the Class M CDSC will depend on the number of years since investment and the amount being redeemed, according to the following schedule:
| Redemption During | Class M CDSC (as % of amount subject to charge) | ||||||
| 1st year after purchase | 6.00 | % | |||||
| 2nd year after purchase | 5.00 | % | |||||
| 3rd year after purchase | 4.00 | % | |||||
| 4th year after purchase | 3.00 | % | |||||
| 5th year after purchase | 2.00 | % | |||||
| 6th year after purchase | 2.00 | % | |||||
| 7th year after purchase | 1.00 | % | |||||
| 8th year after purchase | None | ||||||
For purposes of determining the Class M CDSC, all purchases during the month are considered to have been made on the first business day of the month in which the purchase was actually made. The holding period for purposes of determining the applicable CDSC will be calculated from the first day of the month after initial purchase, excluding any time shares were held in a money market fund.
31
The Class M CDSC will be waived in the following cases if shares are redeemed and the applicable Fund's transfer agent is notified: (1) redemptions under a Systematic Withdrawal Plan; (2) redemptions to pay premiums for optional insurance; (3) redemptions following death or post-purchase disability (as defined by Section 72(m)(7) of the Code); (4) the portion of a mandated minimum distribution from an IRA, SIMPLE IRA or an individual type 403(b)(7) plan equal to the percentage of your plan assets held in Class M shares of the applicable Fund (any portion greater than mandated minimum distribution would be subject to the Class M CDSC); (5) the portion of any substantially equal periodic payments (as described in Section 72(t) of the Code) equal to the percentage of your plan assets held in Class M shares of the applicable Fund; and (6) the return of excess contributions from an IRA or SIMPLE IRA.
Approximately eight years after the purchase of Class M shares of Emerging Growth Fund or Mid-Cap Growth Fund, those shares will automatically convert to Class A shares of that Fund. This conversion feature relieves Class M shareholders of the higher asset-based distribution charge that applies to Class M shares under the Class M 12b-1 Fee described above. The conversion is based on the relative NAV of the classes, and no sales charge is imposed. At the time of conversion, a portion of the Class M shares purchased through the reinvestment of dividends or capital gains (Dividend Shares) will also convert to Class A shares. The portion of Dividend Shares that will convert is determined by the ratio of converting Class M non-Dividend Shares to total Class M non-Dividend Shares.
Class X shares of Emerging Growth Fund and Mid-Cap Growth Fund are sold without an initial sales charge, however, if Class X shares are redeemed within 8 years of their purchase (7 years in the case of Class X shares purchased prior to August 19, 1998), a CDSC (Class X CDSC) will be deducted from the redemption proceeds. The Class X CDSC will not apply to redemptions of bonus shares or shares purchased by the reinvestment of dividends or capital gains distributions and may be waived under certain circumstances described below. The Class X CDSC will be assessed on the NAV of the shares at the time of purchase.
For purchases made prior to January 1, 2002, the Class X CDSC will be assessed on the lesser of (i) the original purchase price or (ii) the redemption proceeds. For purchases made after January 1, 2002, the Class X CDSC is calculated using the original purchase price. Any increase in the share price is not subject to the Class X CDSC. The Class X CDSC is paid to the Distributor to reimburse expenses incurred in providing distribution-related services to the Fund in connection with the sale of Class X shares. The Distributor has assigned its right to receive any Class X CDSC, as well as any distribution and service fees to a third party that provides funding for the up-front sales concession payments.
To determine whether the Class X CDSC applies to a redemption, the applicable Fund first redeems shares not subject to a Class X CDSC (shares acquired by reinvestment of dividends and capital gains distributions, bonus shares, and shares held for over 8 years) and then redeems other shares in the order they were purchased (such that shares held the longest are redeemed first).
The amount of the Class X CDSC will depend on the number of years since investment and the amount being redeemed, according to the following schedule:
| Redemption During | Class X CDSC (as % of amount subject to charge) | ||||||
| 1st year after purchase | 6.00 | % | |||||
| 2nd year after purchase | 5.00 | % | |||||
| 3rd year after purchase | 4.00 | % | |||||
| 4th year after purchase | 4.00 | % | |||||
| 5th year after purchase | 3.00 | % | |||||
| 6th year after purchase | 2.00 | % | |||||
| 7th year after purchase | 2.00 | % | |||||
| 8th year after purchase | 1.00 | % | |||||
| 9th or 10th year after purchase | None | ||||||
32
For purposes of determining the Class X CDSC, all purchases are considered to have been made on the first business day of the month in which the purchase was actually made. In the case of Class X shares purchased prior to August 19, 1998, the CDSC imposed will be 6% during the first year after purchase, 5% during the second year, 4% during the third year, 3% during the fourth year, 2% during the fifth and sixth years, 1% during the seventh year, and none thereafter.
The Class X CDSC will be waived in the following cases if shares are redeemed and the transfer agent is notified: (1) redemptions to pay premiums for optional insurance coverage; (2) redemptions following death or post-purchase disability (as defined by Section 72(m)(7) of the Code); (3) the portion of a mandated minimum distribution from an IRA, SIMPLE IRA or an individual type 403(b)(7) plan equal to the percentage of plan assets held in Class X shares of the applicable Fund; (4) the portion of any substantially equal periodic payments (as described in Section 72(t) of the Code) equal to the percentage of plan assets held in Class X shares of the applicable Fund; and (5) the return of excess contributions from an IRA or SIMPLE IRA.
Ten years after the purchase of Class X shares of Emerging Growth Fund or Mid-Cap Growth Fund (eight years in the case of Class X shares purchased prior to August 19, 1998), those shares will automatically convert to Class A shares of that Fund. This conversion feature relieves Class X shareholders of the higher asset-based distribution charge that applies to Class X shares under the Class X Distribution and Service Plan described above. The conversion is based on the relative NAV of the two classes, and no sales charge is imposed. At the time of conversion, a portion of the Class X shares purchased through the reinvestment of dividends or capital gains (Dividend Shares) will also convert to Class A shares. The portion of Dividend Shares that will convert is determined by the ratio of converting Class X non-Dividend Shares to total Class X non-Dividend Shares.
The redemption policies for each Fund are identical. Your shares will be sold at the next NAV per share determined after your order to sell is received and you will receive that amount less any applicable CDSC imposed and less such redemption fee or deferred sales charges as may be set by the relevant Fund's Board from time to time. Refer to each Fund's prospectus for more information regarding how to sell shares.
Shares of each Fund may be exchanged for shares of the same class of other funds in the mutual fund complex at NAV per share at the time of exchange without a sales charge. If you exchange such shares for the same class of shares of another Fund, any applicable CDSC and the date for automatic conversion of Class M, Class B and Class X shares to Class A shares will be calculated based on the date on which you acquired the original shares. After an exchange, at redemption, the CDSC will be calculated from the first day of the month after initial purchase, excluding any time shares were held in a money market fund. We may change the terms of any exchange privilege after giving you 60 days' notice. Investors will not receive bonus shares on Class X shares obtained through an exchange. Exchanges of shares involve redemption of the shares of the Fund you own and a purchase of shares of another Fund. Shares are normally redeemed and purchased in th e exchange transaction on the business day on which the transfer agent receives an exchange request that is in proper form, if the request is received by the close of the NYSE that day.
You may exchange your Fund shares for shares of any other Fund without a sales charge. If you exchange such shares for shares of another Fund or if you receive Emerging Growth Fund shares in exchange for Target Fund shares pursuant to the Plan, any applicable CDSC and the date for automatic conversion of Class M, Class B and Class X shares to Class A shares will be calculated based on the date on which you acquired the original shares. After an exchange, at redemption, the CDSC will be calculated from the first day of the month after initial purchase, excluding any time shares were held in a money market fund. We may change the terms of any exchange privilege after giving you 60 days' notice. Investors will not receive bonus shares on Class X shares obtained through an exchange.
Frequent trading of Fund shares in response to short-term fluctuations in the market – also known as "market timing" – may make it very difficult to manage a Fund's investments. When market timing occurs, the Funds may have to sell portfolio securities to have the cash necessary to redeem the market timer's shares. This can happen at a time when it is not advantageous to sell any securities, so the Fund's performance may be hurt. When large dollar amounts are involved, market timing can also make it difficult to use long-term investment strategies because we cannot predict how much cash a Fund will have to invest. When, in the opinion of the Manager, such activity would have a disruptive effect on portfolio management, the Funds reserve the right to refuse purchase orders and exchanges into the Funds by any person, group or commonly controlled account. The decision may be based on dollar amount, volume, or frequency
33
of trading. A Fund will notify a market timer of a rejection of an exchange or purchase order. No assurance can be given that a Fund's procedures will be effective in limiting the practice of market timing in all cases.
Each Fund will distribute substantially all of its income and capital gains to shareholders each year. Each Fund will declare dividends, if any, annually.
SP Mutual Funds Share Class Designations
Please note that in 2004 SP Mutual Funds renamed Class A and Class B shares, and created two new classes designated Class A and Class B. This means that if, prior to April 12, 2004, you purchased shares of any series of SP Mutual Funds designated as "Class A" or "Class B" at the time of purchase, SP Mutual Funds now refers to your shares as "Class L" and "Class M", respectively. Please be sure to consult information about the appropriate share class when reviewing these materials.
In addition, pursuant to its charter, SP Mutual Funds may issue both "Class X" shares and "New Class X" shares. The rights and terms of Class X and New Class X shares are almost identical, so for ease of reference, SP Mutual Funds sometimes provides combined expenses, capitalization, financial and other information for "New Class X" and "Class X" and refers to all such shares as "Class X." The principal difference between outstanding shares of the two classes is that Class X shares issued prior to August 17, 1998 are subject to automatic conversion to Class A shares approximately 8 years after purchase, while New Class X shares, meaning Class X shares issued on or after August 17, 1998, are subject to automatic conversion to Class A shares approximately 10 years after purchase. You should be aware that if you hold shares referred to as "Class X," your conversion rights are determined by the date you purchased your shares.
FEES AND EXPENSES
The following fee tables provide information about the fees and expenses attributable to each class of shares of each Target Fund and Emerging Growth Fund, and, assuming one or all of the Reorganization had taken place on June 30, 2006, the estimated pro forma annualized fees and expenses attributable to Emerging Growth Fund. Future fees and expenses may be greater or less than those indicated below. The holding period for shares held by investors in the Funds will be counted in computing the holding period of shares subsequently held in Emerging Growth Fund for purposes of determining any applicable CDSCs.
Shareholder Fees and Operating Expenses
Mid-Cap Growth Fund Reorganization
Class A Shares (for the twelve months ended June 30, 2006)
Shareholder Fees (fees paid directly from your investment)1
| Mid-Cap Growth Fund | Emerging Growth Fund | Pro Forma Emerging Growth Fund After Mid-Cap Growth Reorganization* | |||||||||||||
| Maximum sales charge (load) on purchases (as % of offering price) | 5.50 | % | 5.50 | % | 5.50 | % | |||||||||
| Maximum contingent deferred sales charge (load)** | 1.00%2 | 1.00%2 | 1.00%2 | ||||||||||||
| Redemption Fee | None3 | None | None | ||||||||||||
| Exchange Fee | None | None | None | ||||||||||||
| Small balance account fee | |||||||||||||||
| (beginning on or about November 17, 2006***) | $ | 15 | $ | 15 | $ | 15 | |||||||||
34
Annual Fund Operating Expenses
(expenses that are deducted from Fund assets)
| Mid-Cap Growth Fund | Emerging Growth Fund | Pro Forma Emerging Growth Fund After Mid-Cap Growth Reorganization* | |||||||||||||
| Management Fees**** | 0.90 | % | 0.60 | % | 0.60% | ||||||||||
| + Distribution (12b-1) Fees | 0.30 | %5 | 0.30 | %5 | 0.30 | %5 | |||||||||
| + Other Expenses | 0.77 | % | 0.29 | % | 0.34 | % | |||||||||
| = Total annual fund operating expenses | 1.97 | % | 1.19 | % | 1.24 | % | |||||||||
| – Fee waiver and/or expense reimbursement | –0.32 | %4,5 | –0.05 | %5 | –0.10 | %4,5 | |||||||||
| = Net annual fund operating expenses | 1.65 | %4 | 1.14 | % | 1.14 | % | |||||||||
Class B Shares (for the twelve months ended June 30, 2006)
Shareholder Fees (fees paid directly from your investment)1
| Mid-Cap Growth Fund | Emerging Growth Fund | Pro Forma Emerging Growth Fund After Mid-Cap Growth Reorganization* | |||||||||||||
| Maximum sales charge (load) on purchases (as % of offering price) | None | None | None | ||||||||||||
| Maximum contingent deferred sales charge (load)** | 5.00%6 | 5.00%6 | 5.00%6 | ||||||||||||
| Redemption Fee | None3 | None | None | ||||||||||||
| Exchange Fee | None | None | None | ||||||||||||
| Small balance account fee | |||||||||||||||
| (beginning on or about November 17, 2006***) | $ | 15 | $ | 15 | $ | 15 | |||||||||
Annual Fund Operating Expenses
(expenses that are deducted from Fund assets)
| Mid-Cap Growth Fund | Emerging Growth Fund | Pro Forma Emerging Growth Fund After Mid-Cap Growth Reorganization* | |||||||||||||
| Management Fees**** | 0.90 | % | 0.60 | % | 0.60 | % | |||||||||
| + Distribution (12b-1) Fees | 1.00 | % | 1.00 | % | 1.00 | % | |||||||||
| + Other Expenses | 0.77 | % | 0.29 | % | 0.34 | % | |||||||||
| = Total annual fund operating expenses | 2.67 | % | 1.89 | % | 1.94 | % | |||||||||
| – Fee waiver and/or expense reimbursement | –0.27 | %4 | — | % | –0.05 | %4 | |||||||||
| = Net annual fund operating expenses | 2.40 | %4 | 1.89 | % | 1.89 | % | |||||||||
35
Class C Shares (for the twelve months ended June 30, 2006)
Shareholder Fees (fees paid directly from your investment)1
| Mid-Cap Growth Fund | Emerging Growth Fund | Pro Forma Emerging Growth Fund After Mid-Cap Growth Reorganization* | |||||||||||||
| Maximum sales charge (load) on purchases (as % of offering price) | None | None | None | ||||||||||||
| Maximum contingent deferred sales charge (load)** | 1.00%6 | 1.00%6 | 1.00%6 | ||||||||||||
| Redemption Fee | None3 | None | None | ||||||||||||
| Exchange Fee | None | None | None | ||||||||||||
| Small balance account fee | |||||||||||||||
| (beginning on or about November 17, 2006***) | $ | 15 | $ | 15 | $ | 15 | |||||||||
Annual Fund Operating Expenses
(expenses that are deducted from Fund assets)
| Mid-Cap Growth Fund | Emerging Growth Fund | Pro Forma Emerging Growth Fund After Mid-Cap Growth Reorganization* | |||||||||||||
| Management Fees**** | 0.90 | % | 0.60 | % | 0.60% | ||||||||||
| + Distribution (12b-1) Fees | 1.00 | % | 1.00 | % | 1.00 | % | |||||||||
| + Other Expenses | 0.77 | % | 0.29 | % | 0.34 | % | |||||||||
| = Total annual fund operating expenses | 2.67 | % | 1.89 | % | 1.94 | % | |||||||||
| – Fee waiver and/or expense reimbursement | –0.27 | %4 | — | % | –0.05 | %4 | |||||||||
| = Net annual fund operating expenses | 2.40 | %4 | 1.89 | % | 1.89 | % | |||||||||
Class L Shares (for the twelve months ended June 30, 2006)
Shareholder Fees (fees paid directly from your investment)1
| Mid-Cap Growth Fund | Emerging Growth Fund | Pro Forma Emerging Growth Fund After Mid-Cap Growth Reorganization* | |||||||||||||
| Maximum sales charge (load) on purchases (as % of offering price) | 5.75 | % | 5.75 | % | 5.75 | % | |||||||||
| Maximum contingent deferred sales charge (load)** | 1.00%2 | 1.00%2 | 1.00%2 | ||||||||||||
| Redemption Fee | None3 | None | None | ||||||||||||
| Exchange Fee | None | None | None | ||||||||||||
| Small balance account fee | |||||||||||||||
| (beginning on or about November 17, 2006***) | $ | 15 | $ | 15 | $ | 15 | |||||||||
36
Annual Fund Operating Expenses
(expenses that are deducted from Fund assets)
| Mid-Cap Growth Fund | Emerging Growth Fund | Pro Forma Emerging Growth Fund After Mid-Cap Growth Reorganization* | |||||||||||||
| Management Fees**** | 0.90 | % | 0.60 | % | 0.60% | ||||||||||
| + Distribution (12b-1) Fees | 0.50 | % | 0.50 | % | 0.50 | % | |||||||||
| + Other Expenses | 0.77 | % | 0.29 | % | 0.34 | % | |||||||||
| = Total annual fund operating expenses | 2.17 | % | 1.39 | % | 1.44 | % | |||||||||
| – Fee waiver and/or expense reimbursement | –0.27 | %4 | — | % | –0.05 | %4 | |||||||||
| = Net annual fund operating expenses | 1.90 | %4 | 1.39 | % | 1.39 | % | |||||||||
Class M Shares (for the twelve months ended June 30, 2006)
Shareholder Fees (fees paid directly from your investment)1
| Mid-Cap Growth Fund | Emerging Growth Fund | Pro Forma Emerging Growth Fund After Mid-Cap Growth Reorganization* | |||||||||||||
| Maximum sales charge (load) on purchases (as % of offering price) | None | None | None | ||||||||||||
| Maximum contingent deferred sales charge (load)** | 6.00%6 | 6.00%6 | 6.00%6 | ||||||||||||
| Redemption Fee | None3 | None | None | ||||||||||||
| Exchange Fee | None | None | None | ||||||||||||
| Small balance account fee | |||||||||||||||
| (beginning on or about November 17, 2006***) | $ | 15 | $ | 15 | $ | 15 | |||||||||
Annual Fund Operating Expenses
(expenses that are deducted from Fund assets)
| Mid-Cap Growth Fund | Emerging Growth Fund | Pro Forma Emerging Growth Fund After Mid-Cap Growth Reorganization* | |||||||||||||
| Management Fees**** | 0.90 | % | 0.60 | % | 0.60 | % | |||||||||
| + Distribution (12b-1) Fees | 1.00 | % | 1.00 | % | 1.00 | % | |||||||||
| + Other Expenses | 0.77 | % | 0.29 | % | 0.34 | % | |||||||||
| = Total annual fund operating expenses | 2.67 | % | 1.89 | % | 1.94 | % | |||||||||
| – Fee waiver and/or expense reimbursement | –0.27 | %4 | — | % | –0.05 | %4 | |||||||||
| = Net annual fund operating expenses | 2.40 | %4 | 1.89 | % | 1.89 | % | |||||||||
37
Class R Shares (for the twelve months ended June 30, 2006)
Shareholder Fees (fees paid directly from your investment)1
| Mid-Cap Growth Fund | Emerging Growth Fund7 | Pro Forma Emerging Growth Fund After New Era Growth Reorganization* | |||||||||||||
| Maximum sales charge (load) on purchases (as % of offering price) | N/A | None | None | ||||||||||||
| Maximum contingent deferred sales charge (load)** | N/A | 1.00%2 | 1.00%2 | ||||||||||||
| Redemption Fee | N/A | None | None | ||||||||||||
| Exchange Fee | N/A | None | None | ||||||||||||
| Small balance account fee | |||||||||||||||
| (beginning on or about November 17, 2006***) | $ | 15 | $ | 15 | $ | 15 | |||||||||
Annual Fund Operating Expenses
(expenses that are deducted from Fund assets)
| Mid-Cap Growth Fund | Emerging Growth Fund | Pro Forma Emerging Growth Fund After Mid-Cap Growth Reorganization* | |||||||||||||
| Management Fees**** | N/A | 0.60 | % | 0.60 | % | ||||||||||
| + Distribution (12b-1) Fees | N/A | 0.75 | %5 | 0.75 | %5 | ||||||||||
| + Other Expenses | N/A | 0.29 | % | 0.34 | % | ||||||||||
| = Total annual fund operating expenses | N/A | 1.64 | % | 1.69 | % | ||||||||||
| – Fee waiver and/or expense reimbursement | N/A | –0.25 | %5 | –0.30 | %5 | ||||||||||
| = Net annual fund operating expenses | N/A | 1.39 | % | 1.39 | % | ||||||||||
Class X Shares (for the twelve months ended June 30, 2006)
Shareholder Fees (fees paid directly from your investment)1
| Mid-Cap Growth Fund | Emerging Growth Fund | Pro Forma Emerging Growth Fund After Mid-Cap Growth Reorganization* | |||||||||||||
| Maximum sales charge (load) on purchases (as % of offering price) | None | None | None | ||||||||||||
| Maximum contingent deferred sales charge (load)** | 6.00%6 | 6.00%6 | 6.00%6 | ||||||||||||
| Redemption Fee | None3 | None | None | ||||||||||||
| Exchange Fee | None | None | None | ||||||||||||
| Small balance account fee | |||||||||||||||
| (beginning on or about November 17, 2006***) | $ | 15 | $ | 15 | $ | 15 | |||||||||
38
Annual Fund Operating Expenses
(expenses that are deducted from Fund assets)
| Mid-Cap Growth Fund | Emerging Growth Fund | Pro Forma Emerging Growth Fund After Mid-Cap Growth Reorganization* | |||||||||||||
| Management Fees**** | 0.90 | % | 0.60 | % | 0.60 | % | |||||||||
| + Distribution (12b-1) Fees | 1.00 | % | 1.00 | % | 1.00 | % | |||||||||
| + Other Expenses | 0.77 | % | 0.29 | % | 0.34 | % | |||||||||
| = Total annual fund operating expenses | 2.67 | % | 1.89 | % | 1.94 | % | |||||||||
| – Fee waiver and/or expense reimbursement | –0.27 | %4 | — | % | –0.05 | %4 | |||||||||
| = Net annual fund operating expenses | 2.40 | %4 | 1.89 | % | 1.89 | % | |||||||||
Class Z Shares (for the twelve months ended June 30, 2006)
Shareholder Fees (fees paid directly from your investment)
| Mid-Cap Growth Fund | Emerging Growth Fund | Pro Forma Emerging Growth Fund After Mid-Cap Growth Reorganization* | |||||||||||||
| Maximum sales charge (load) on purchases (as % of offering price) | N/A | None | None | ||||||||||||
| Maximum contingent deferred sales charge (load)** | N/A | None | None | ||||||||||||
| Redemption Fee | N/A | None | None | ||||||||||||
| Exchange Fee | N/A | None | None | ||||||||||||
| Small balance account fee | |||||||||||||||
| (beginning on or about November 17, 2006***) | N/A | $ | 15 | $ | 15 | ||||||||||
Annual Fund Operating Expenses
(expenses that are deducted from Fund assets)
| Mid-Cap Growth Fund | Emerging Growth Fund | Pro Forma Emerging Growth Fund After Mid-Cap Growth Reorganization* | |||||||||||||
| Management Fees**** | N/A | 0.60 | % | 0.60 | % | ||||||||||
| + Distribution and Service (12b-1) Fees | N/A | None | None | ||||||||||||
| + Other Expenses | N/A | 0.29 | % | 0.34 | % | ||||||||||
| = Total annual fund operating expenses | N/A | 0.89 | % | 0.94 | % | ||||||||||
| – Fee waiver and/or expense reimbursement | N/A | — | % | –0.05 | %4 | ||||||||||
| = Net annual fund operating expenses | N/A | 0.89 | % | 0.89 | % | ||||||||||
39
New Era Growth Fund Reorganization
Class A Shares (for the twelve months ended June 30, 2006)
Shareholder Fees (fees paid directly from your investment)1
| New Era Growth Fund | Emerging Growth Fund | Pro Forma Emerging Growth Fund After New Era Growth Reorganization* | |||||||||||||
| Maximum sales charge (load) on purchases (as % of offering price) | 5.50 | % | 5.50 | % | 5.50 | % | |||||||||
| Maximum contingent deferred sales charge (load)** | 1.00%2 | 1.00%2 | 1.00%2 | ||||||||||||
| Redemption Fee | None | None | None | ||||||||||||
| Exchange Fee | None | None | None | ||||||||||||
| Small balance account fee | |||||||||||||||
| (beginning on or about November 17, 2006***) | $ | 15 | $ | 15 | $ | 15 | |||||||||
Annual Fund Operating Expenses
(expenses that are deducted from Fund assets)
| New Era Growth Fund | Emerging Growth Fund | Pro Forma Emerging Growth Fund After New Era Growth Reorganization* | |||||||||||||
| Management Fees**** | 0.90 | % | 0.60 | % | 0.60 | % | |||||||||
| + Distribution (12b-1) Fees | 0.30 | %5 | 0.30 | %5 | 0.30 | %5 | |||||||||
| + Other Expenses | 0.58 | % | 0.29 | % | 0.32 | % | |||||||||
| = Total annual fund operating expenses | 1.78 | % | 1.19 | % | 1.22 | % | |||||||||
| – Fee waiver and/or expense reimbursement | –0.05 | %5 | –0.05 | %5 | –0.08 | %4,5 | |||||||||
| = Net annual fund operating expenses | 1.73 | % | 1.14 | % | 1.14 | % | |||||||||
Class B Shares (for the twelve months ended June 30, 2006)
Shareholder Fees (fees paid directly from your investment)1
| New Era Growth Fund | Emerging Growth Fund | Pro Forma Emerging Growth Fund After New Era Growth Reorganization* | |||||||||||||
| Maximum sales charge (load) on purchases (as % of offering price) | None | None | None | ||||||||||||
| Maximum contingent deferred sales charge (load)** | 5.00%6 | 5.00%6 | 5.00%6 | ||||||||||||
| Redemption Fee | None | None | None | ||||||||||||
| Exchange Fee | None | None | None | ||||||||||||
| Small balance account fee | |||||||||||||||
| (beginning on or about November 17, 2006***) | $ | 15 | $ | 15 | $ | 15 | |||||||||
40
Annual Fund Operating Expenses
(expenses that are deducted from Fund assets)
| New Era Growth Fund | Emerging Growth Fund | Pro Forma Emerging Growth Fund After New Era Growth Reorganization* | |||||||||||||
| Management Fees**** | 0.90 | % | 0.60 | % | 0.60 | % | |||||||||
| + Distribution (12b-1) Fees | 1.00 | % | 1.00 | % | 1.00 | % | |||||||||
| + Other Expenses | 0.58 | % | 0.29 | % | 0.32 | % | |||||||||
| = Total annual fund operating expenses | 2.48 | % | 1.89 | % | 1.92 | % | |||||||||
| – Fee waiver and/or expense eimbursement | — | % | — | % | –0.03 | %4 | |||||||||
| = Net annual fund operating expenses | 2.48 | % | 1.89 | % | 1.89 | % | |||||||||
Class C Shares (for the twelve months ended June 30, 2006)
Shareholder Fees (fees paid directly from your investment)1
| New Era Growth Fund | Emerging Growth Fund | Pro Forma Emerging Growth Fund After New Era Growth Reorganization* | |||||||||||||
| Maximum sales charge (load) on purchases (as % of offering price) | None | None | None | ||||||||||||
| Maximum contingent deferred sales charge (load)** | 1.00%6 | 1.00%6 | 1.00%6 | ||||||||||||
| Redemption Fee | None | None | None | ||||||||||||
| Exchange Fee | None | None | None | ||||||||||||
| Small balance account fee | |||||||||||||||
| (beginning on or about November 17, 2006***) | $ | 15 | $ | 15 | $ | 15 | |||||||||
Annual Fund Operating Expenses
(expenses that are deducted from Fund assets)
| New Era Growth Fund | Emerging Growth Fund | Pro Forma Emerging Growth Fund After New Era Growth Reorganization* | |||||||||||||
| Management Fees**** | 0.90 | % | 0.60 | % | 0.60 | % | |||||||||
| + Distribution (12b-1) Fees | 1.00 | % | 1.00 | % | 1.00 | % | |||||||||
| + Other Expenses | 0.58 | % | 0.29 | % | 0.32 | % | |||||||||
| = Total annual fund operating expenses | 2.48 | % | 1.89 | % | 1.92 | % | |||||||||
| – Fee waiver and/or expense reimbursement | — | % | — | % | –0.03 | %4 | |||||||||
| = Net annual fund operating expenses | 2.48 | % | 1.89 | % | 1.89% | ||||||||||
41
Class L (for the twelve months ended June 30, 2006)
Shareholder Fees (fees paid directly from your investment)1
| New Era Growth Fund | Emerging Growth Fund | Pro Forma Emerging Growth Fund After New Era Growth Reorganization* | |||||||||||||
| Maximum sales charge (load) on purchases (as % of offering price) | N/A | 5.75 | % | 5.75 | % | ||||||||||
| Maximum contingent deferred sales charge (load)** | N/A | 1.00%2 | 1.00%2 | ||||||||||||
| Redemption Fee | N/A | None | None | ||||||||||||
| Exchange Fee | N/A | None | None | ||||||||||||
| Small balance account fee (beginning | |||||||||||||||
| on or about November 17, 2006***) | N/A | $ | 15 | $ | 15 | ||||||||||
Annual Fund Operating Expenses
(expenses that are deducted from Fund assets)
| New Era Growth Fund | Emerging Growth Fund | Pro Forma Emerging Growth Fund After New Era Growth Reorganization* | |||||||||||||
| Management Fees**** | N/A | 0.60 | % | 0.60 | % | ||||||||||
| + Distribution and Service (12b-1) Fees | N/A | 0.50 | % | 0.50 | % | ||||||||||
| + Other Expenses | N/A | 0.29 | % | 0.32 | % | ||||||||||
| = Total annual fund operating expenses | N/A | 1.39 | % | 1.42 | % | ||||||||||
| – Fee waiver and/or expense reimbursement | N/A | — | % | –0.03 | %4 | ||||||||||
| = Net annual fund operating expenses | N/A | 1.39 | % | 1.39 | % | ||||||||||
Class M (for the twelve months ended June 30, 2006)
Shareholder Fees (fees paid directly from your investment)1
| Pro Forma Emerging Growth Fund | |||||||||||||||
| New Era Growth Fund | Emerging Growth Fund | After New Era Growth Reorganization* | |||||||||||||
| Maximum sales charge (load) on purchases (as % of offering price) | N/A | None | None | ||||||||||||
| Maximum contingent deferred sales charge (load)** | N/A | 6.00%6 | 6.00%6 | ||||||||||||
| Redemption Fee | N/A | None | None | ||||||||||||
| Exchange Fee | N/A | None | None | ||||||||||||
| Small balance account fee (beginning | |||||||||||||||
| on or about November 17, 2006***) | N/A | $ | 15 | $ | 15 | ||||||||||
42
Annual Fund Operating Expenses
(expenses that are deducted from Fund assets)
| New Era Growth Fund | Emerging Growth Fund | Pro Forma Emerging Growth Fund After New Era Growth Reorganization* | |||||||||||||
| Management Fees**** | N/A | 0.60 | % | 0.60 | % | ||||||||||
| + Distribution and Service (12b-1) Fees | N/A | 1.00 | % | 1.00 | % | ||||||||||
| + Other Expenses | N/A | 0.29 | % | 0.32 | % | ||||||||||
| = Total annual fund operating expenses | N/A | 1.89 | % | 1.92 | % | ||||||||||
| – Fee waiver and/or expense reimbursement | N/A | — | % | –0.03 | %4 | ||||||||||
| = Net annual fund operating expenses | N/A | 1.89 | % | 1.89 | % | ||||||||||
Class R Shares (for the twelve months ended June 30, 2006)
Shareholder Fees (fees paid directly from your investment)1
| New Era Growth Fund | Emerging Growth Fund7 | Pro Forma Emerging Growth Fund After New Era Growth Reorganization* | |||||||||||||
| Maximum sales charge (load) on purchases (as % of offering price) | N/A | None | None | ||||||||||||
| Maximum contingent deferred sales charge (load)** | N/A | 1.00%2 | 1.00%2 | ||||||||||||
| Redemption Fee | N/A | None | None | ||||||||||||
| Exchange Fee | N/A | None | None | ||||||||||||
| Small balance account fee | |||||||||||||||
| (beginning on or about November 17, 2006***) | N/A | $ | 15 | $ | 15 | ||||||||||
Annual Fund Operating Expenses
(expenses that are deducted from Fund assets)
| New Era Growth Fund | Emerging Growth Fund | Pro Forma Emerging Growth Fund After New Era Growth Reorganization* | |||||||||||||
| Management Fees**** | N/A | 0.60 | % | 0.60 | % | ||||||||||
| + Distribution (12b-1) Fees | N/A | 0.75 | %5 | 0.75 | %5 | ||||||||||
| + Other Expenses | N/A | 0.29 | % | 0.32 | % | ||||||||||
| = Total annual fund operating expenses | N/A | 1.64 | % | 1.67 | % | ||||||||||
| – Fee waiver and/or expense reimbursement | N/A | –0.25 | %5 | –0.28 | %4,5 | ||||||||||
| = Net annual fund operating expenses | N/A | 1.39 | % | 1.39 | % | ||||||||||
43
Class X (for the twelve months ended June 30, 2006)
Shareholder Fees (fees paid directly from your investment)1
| New Era Growth Fund | Emerging Growth Fund | Pro Forma Emerging Growth Fund After New Era Growth Reorganization* | |||||||||||||
| Maximum sales charge (load) on purchases (as % of offering price) | N/A | None | None | ||||||||||||
| Maximum contingent deferred sales charge (load)** | N/A | 6.00%6 | 6.00%6 | ||||||||||||
| Redemption Fee | N/A | None | None | ||||||||||||
| Exchange Fee | N/A | None | None | ||||||||||||
| Small balance account fee (beginning | |||||||||||||||
| on or about November 17, 2006***) | N/A | $ | 15 | $ | 15 | ||||||||||
Annual Fund Operating Expenses
(expenses that are deducted from Fund assets)
| New Era Growth Fund | Emerging Growth Fund | Pro Forma Emerging Growth Fund After New Era Growth Reorganization* | |||||||||||||
| Management Fees**** | N/A | 0.60 | % | 0.60% | |||||||||||
| + Distribution and Service (12b-1) Fees | N/A | 1.00 | % | 1.00 | % | ||||||||||
| + Other Expenses | N/A | 0.29 | % | 0.32 | % | ||||||||||
| = Total annual fund operating expenses | N/A | 1.89 | % | 1.92 | % | ||||||||||
| – Fee waiver and/or expense reimbursement | N/A | — | % | –0.03 | %4 | ||||||||||
| = Net annual fund operating expenses | N/A | 1.89 | % | 1.89 | % | ||||||||||
Class Z Shares (for the twelve months ended June 30, 2006)
Shareholder Fees (fees paid directly from your investment)
| New Era Growth Fund | Emerging Growth Fund | Pro Forma Emerging Growth Fund After New Era Growth Reorganization* | |||||||||||||
| Maximum sales charge (load) on purchases (as % of offering price) | None | None | None | ||||||||||||
| Maximum contingent deferred sales charge (load)** | None | None | None | ||||||||||||
| Redemption Fee | None | None | None | ||||||||||||
| Exchange Fee | None | None | None | ||||||||||||
| Small balance account fee | |||||||||||||||
| (beginning on or about November 17, 2006***) | $ | 15 | $ | 15 | $ | 15 | |||||||||
44
Annual Fund Operating Expenses
(expenses that are deducted from Fund assets)
| New Era Growth Fund | Emerging Growth Fund | Pro Forma Emerging Growth Fund After New Era Growth Reorganization* | |||||||||||||
| Management Fees**** | 0.90 | % | 0.60 | % | 0.60 | % | |||||||||
| + Distribution and Service (12b-1) Fees | None | None | None | ||||||||||||
| + Other Expenses | 0.58 | % | 0.29 | % | 0.32 | % | |||||||||
| = Total annual fund operating expenses | 1.48 | % | 0.89 | % | 0.92 | % | |||||||||
| – Fee waiver and/or expense reimbursement | — | % | — | % | –0.03 | %4 | |||||||||
| = Net annual fund operating expenses | 1.48 | % | 0.89 | % | 0.89 | % | |||||||||
Mid-Cap Growth Fund and New Era Growth Fund Reorganizations
Class A Shares (for the twelve months ended June 30, 2006)
Shareholder Fees (fees paid directly from your investment)1
| Mid-Cap Growth Fund | New Era Growth Fund | Emerging Growth Fund | Pro Forma Emerging Growth Fund After Mid Cap Growth and New Era Growth Reorganizations* | ||||||||||||||||
| Maximum sales charge (load) on purchases (as % of offering price) | 5.50 | % | 5.50 | % | 5.50 | % | 5.50 | % | |||||||||||
| Maximum contingent deferred sales charge (load)** | 1.00%2 | 1.00%2 | 1.00%2 | 1.00%2 | |||||||||||||||
| Redemption Fee | None3 | None | None | None | |||||||||||||||
| Exchange Fee | None | None | None | None | |||||||||||||||
| Small balance account fee (beginning on or about November 17, 2006***) | $ | 15 | $ | 15 | $ | 15 | $ | 15 | |||||||||||
Annual Fund Operating Expenses
(expenses that are deducted from Fund assets)
| Mid-Cap Growth Fund | New Era Growth Fund | Emerging Growth Fund | Emerging Growth Fund After Mid Cap Growth and New Era Growth Reorganizations* | ||||||||||||||||
| Management Fees**** | 0.90 | % | 0.90 | % | 0.60 | % | 0.60 | % | |||||||||||
| + Distribution and Service (12b-1) Fees | 0.30 | %5 | 0.30 | %5 | 0.30 | %5 | 0.30 | %5 | |||||||||||
| + Other Expenses | 0.77 | % | 0.58 | % | 0.29 | % | 0.34 | % | |||||||||||
| = Total annual fund operating expenses | 1.97 | % | 1.78 | % | 1.19 | % | 1.24 | % | |||||||||||
| – Fee waiver and/or expense reimbursement | –0.32%4,5 | –0.05%5 | –0.05%5 | –0.10%4,5 | |||||||||||||||
| = Net annual fund operating expenses | 1.65 | %4 | 1.73 | % | 1.14 | % | 1.14 | % | |||||||||||
45
Class B (for the twelve months ended June 30, 2006)
Shareholder Fees (fees paid directly from your investment)1
| Mid-Cap Growth Fund | New Era Growth Fund | Emerging Growth Fund | Pro Forma Emerging Growth Fund After Mid Cap Growth and New Era Growth Reorganizations* | ||||||||||||||||
| Maximum sales charge (load) on purchases (as % of offering price) | None | None | None | None | |||||||||||||||
| Maximum contingent deferred sales charge (load)** | 5.00%6 | 5.00%6 | 5.00%6 | 5.00%6 | |||||||||||||||
| Redemption Fee | None3 | None | None | None | |||||||||||||||
| Exchange Fee | None | None | None | None | |||||||||||||||
| Small balance account fee (beginning on or about November 17, 2006***) | $ | 15 | $ | 15 | $ | 15 | $ | 15 | |||||||||||
Annual Fund Operating Expenses
(expenses that are deducted from Fund assets)
| Mid-Cap Growth Fund | New Era Growth Fund | Emerging Growth Fund | Pro Forma Emerging Growth Fund After Mid Cap Growth and New Era Growth Reorganizations* | ||||||||||||||||
| Management Fees**** | 0.90 | % | 0.90 | % | 0.60 | % | 0.60 | % | |||||||||||
| + Distribution and Service (12b-1) Fees | 1.00 | % | 1.00 | % | 1.00 | % | 1.00 | % | |||||||||||
| + Other Expenses | 0.77 | % | 0.58 | % | 0.29 | % | 0.34 | % | |||||||||||
| = Total annual fund operating expenses | 2.67 | % | 2.48 | % | 1.89 | % | 1.94 | % | |||||||||||
| – Fee waiver and/or expense reimbursement | –0.27%4 | —% | —% | –0.05%4 | |||||||||||||||
| = Net annual fund operating expenses | 2.40 | %4 | 2.48 | % | 1.89 | % | 1.89 | % | |||||||||||
Class C (for the twelve months ended June 30, 2006)
Shareholder Fees (fees paid directly from your investment)1
| Mid-Cap Growth Fund | New Era Growth Fund | Emerging Growth Fund | Pro Forma Emerging Growth Fund After Mid Cap Growth and New Era Growth Reorganizations* | ||||||||||||||||
| Maximum sales charge (load) on purchases (as % of offering price) | None | None | None | None | |||||||||||||||
| Maximum contingent deferred sales charge(load)** | 1.00%6 | 1.00%6 | 1.00%6 | 1.00%6 | |||||||||||||||
| Redemption Fee | None3 | None | None | None | |||||||||||||||
| Exchange Fee | None | None | None | None | |||||||||||||||
| Small balance account fee (beginning on or about November 17, 2006***) | $ | 15 | $ | 15 | $ | 15 | $ | 15 | |||||||||||
46
Annual Fund Operating Expenses
(expenses that are deducted from Fund assets)
| Mid-Cap Growth Fund | New Era Growth Fund | Emerging Growth Fund | Pro Forma Emerging Growth Fund After Mid Cap Growth and New Era Growth Reorganizations* | ||||||||||||||||
| Management Fees**** | 0.90 | % | 0.90 | % | 0.60 | % | 0.60 | % | |||||||||||
| + Distribution and Service (12b-1) Fees | 1.00 | % | 1.00 | % | 1.00 | % | 1.00 | % | |||||||||||
| + Other Expenses | 0.77 | % | 0.58 | % | 0.29 | % | 0.34 | % | |||||||||||
| = Total annual fund operating expenses | 2.67 | % | 2.48 | % | 1.89 | % | 1.94 | % | |||||||||||
| – Fee waiver and/or expense reimbursement | –0.27%4 | —% | —% | –0.05%4 | |||||||||||||||
| = Net annual fund operating expenses | 2.40 | %4 | 2.48 | % | 1.89 | % | 1.89 | % | |||||||||||
Class L (for the twelve months ended June 30, 2006)
Shareholder Fees (fees paid directly from your investment)1
| Mid-Cap Growth Fund | New Era Growth Fund | Emerging Growth Fund | Pro Forma Emerging Growth Fund After Mid Cap Growth and New Era Growth Reorganizations* | ||||||||||||||||
| Maximum sales charge (load) on purchases (as % of offering price) | 5.75 | % | N/A | 5.75 | % | 5.75 | % | ||||||||||||
| Maximum contingent deferred sales charge (load)** | 1.00%2 | N/A | 1.00%2 | 1.00%2 | |||||||||||||||
| Redemption Fee | None3 | N/A | None | None | |||||||||||||||
| Exchange Fee | None | N/A | None | None | |||||||||||||||
| Small balance account fee (beginning on or about November 17, 2006***) | $ | 15 | N/A | $ | 15 | $ | 15 | ||||||||||||
| Annual Fund Operating Expenses (expenses that are deducted from Fund assets) | |||||||||||||||||||
| Mid-Cap Growth Fund | New Era Growth Fund | Emerging Growth Fund | Pro Forma Emerging Growth Fund After Mid Cap Growth and New Era Reorganizations* | ||||||||||||||||
| Management Fees**** | 0.90 | % | N/A | 0.60 | % | 0.60 | % | ||||||||||||
| + Distribution and Service (12b-1) Fees | 0.50 | % | N/A | 0.50 | % | 0.50 | % | ||||||||||||
| + Other Expenses | 0.77 | % | N/A | 0.29 | % | 0.34 | % | ||||||||||||
| = Total annual fund operating expenses | 2.17 | % | N/A | 1.39 | % | 1.44 | % | ||||||||||||
| – Fee waiver and/or expense reimbursement | –0.27 | %4 | N/A | — | % | –0.05 | %4 | ||||||||||||
| = Net annual fund operating expenses | 1.90 | %4 | N/A | 1.39 | % | 1.39 | % | ||||||||||||
47
Class M (for the twelve months ended June 30, 2006)
Shareholder Fees (fees paid directly from your investment)1
| Mid-Cap Growth Fund | New Era Growth Fund | Emerging Growth Fund | Pro Forma Emerging Growth Fund After Mid Cap Growth and New Era Growth Reorganizations* | ||||||||||||||||
| Maximum sales charge (load) on purchases (as % of offering price) | None | N/A | None | None | |||||||||||||||
| Maximum contingent deferred sales charge (load)** | 6.00%6 | N/A | 6.00%6 | 6.00%6 | |||||||||||||||
| Redemption Fee | None3 | N/A | None | None | |||||||||||||||
| Exchange Fee | None | N/A | None | None | |||||||||||||||
| Small balance account fee (beginning on or about November 17, 2006***) | $ | 15 | N/A | $ | 15 | $ | 15 | ||||||||||||
Annual Fund Operating Expenses
(expenses that are deducted from Fund assets)
| Mid-Cap Growth Fund | New Era Growth Fund | Emerging Growth Fund | Pro Forma Emerging Growth Fund After Mid Cap Growth and New Era Growth Reorganizations* | ||||||||||||||||
| Management Fees**** | 0.90 | % | N/A | 0.60 | % | 0.60 | % | ||||||||||||
| + Distribution and Service (12b-1) Fees | 1.00 | % | N/A | 1.00 | % | 1.00 | % | ||||||||||||
| + Other Expenses | 0.77 | % | N/A | 0.29 | % | 0.34 | % | ||||||||||||
| = Total annual fund operating expenses | 2.67 | % | N/A | 1.89 | % | 1.94 | % | ||||||||||||
| – Fee waiver and/or expense reimbursement | –0.27 | %4 | N/A | — | % | –0.05 | %4 | ||||||||||||
| = Net annual fund operating expenses | 2.40 | %4 | N/A | 1.89 | % | 1.89 | % | ||||||||||||
Class R (for the twelve months ended June 30, 2006)
Shareholder Fees (fees paid directly from your investment)1
| Mid-Cap Growth Fund | New Era Growth Fund | Emerging Growth Fund7 | Pro Forma Emerging Growth Fund After Mid Cap Growth and New Era Growth Reorganizations* | ||||||||||||||||
| Maximum sales charge (load) on purchases (as % of offering price) | N/A | N/A | None | None | |||||||||||||||
| Maximum contingent deferred sales charge (load)** | N/A | N/A | 1.00%2 | 1.00%2 | |||||||||||||||
| Redemption Fee | N/A | N/A | None | None | |||||||||||||||
| Exchange Fee | N/A | N/A | None | None | |||||||||||||||
| Small balance account fee (beginning on or about November 17, 2006***) | N/A | N/A | $ | 15 | $ | 15 | |||||||||||||
48
Annual Fund Operating Expenses
(expenses that are deducted from Fund assets)
| Mid-Cap Growth Fund | New Era Growth Fund | Emerging Growth Fund | Pro Forma Emerging Growth Fund After Mid Cap Growth and New Era Growth Reorganizations* | ||||||||||||||||
| Management Fees**** | N/A | N/A | 0.60 | % | 0.60 | % | |||||||||||||
| + Distribution and Service (12b-1) Fees | N/A | N/A | 0.75 | % | 0.75 | % | |||||||||||||
| + Other Expenses | N/A | N/A | 0.29 | % | 0.34 | % | |||||||||||||
| = Total annual fund operating expenses | N/A | N/A | 1.64 | % | 1.69 | % | |||||||||||||
| – Fee waiver and/or expense reimbursement | N/A | N/A | –0.25 | % | –0.30 | %4 | |||||||||||||
| = Net annual fund operating expenses | N/A | N/A | 1.39 | % | 1.39 | % | |||||||||||||
Class X (for the twelve months ended June 30, 2006)
Shareholder Fees (fees paid directly from your investment)1
| Mid-Cap Growth Fund | New Era Growth Fund | Emerging Growth Fund | Pro Forma Emerging Growth Fund After Mid Cap Growth and New Era Growth Reorganizations* | ||||||||||||||||
| Maximum sales charge (load) on purchases (as % of offering price) | None | N/A | None | None | |||||||||||||||
| Maximum contingent deferred sales charge (load)** | 6.00%6 | N/A | 6.00%6 | 6.00%6 | |||||||||||||||
| Redemption Fee | None3 | N/A | None | None | |||||||||||||||
| Exchange Fee | None | N/A | None | None | |||||||||||||||
| Small balance account fee (beginning on or about November 17, 2006***) | $ | 15 | N/A | $ | 15 | $ | 15 | ||||||||||||
Annual Fund Operating Expenses
(expenses that are deducted from Fund assets)
| Mid-Cap Growth Fund | New Era Growth Fund | Emerging Growth Fund | Pro Forma Emerging Growth Fund After Mid Cap Growth and New Era Growth Reorganizations* | ||||||||||||||||
| Management Fees**** | 0.90 | % | N/A | 0.60 | % | 0.60% | |||||||||||||
| + Distribution and Service (12b-1) Fees | 1.00 | % | N/A | 1.00 | % | 1.00 | % | ||||||||||||
| + Other Expenses | 0.77 | % | N/A | 0.29 | % | 0.34 | % | ||||||||||||
| = Total annual fund operating expenses | 2.67 | % | N/A | 1.89 | % | 1.94 | % | ||||||||||||
| – Fee waiver and/or expense reimbursement | –0.27 | %4 | N/A | — | % | –0.05 | %4 | ||||||||||||
| = Net annual fund operating expenses | 2.40 | %4 | N/A | 1.89 | % | 1.89 | % | ||||||||||||
49
Class Z Shares (for the twelve months ended June 30, 2006)
Shareholder Fees (fees paid directly from your investment)
| Mid-Cap Growth Fund | New Era Growth Fund | Emerging Growth Fund | Pro Forma Emerging Growth Fund After Mid Cap Growth and New Era Growth Reorganizations* | ||||||||||||||||
| Maximum sales charge (load) on purchases (as % of offering price) | None | None | None | None | |||||||||||||||
| Maximum contingent deferred sales charge (load) | None | None | None | None | |||||||||||||||
| Redemption Fee | None | None | None | None | |||||||||||||||
| Exchange Fee | None | None | None | None | |||||||||||||||
| Small balance account fee (beginning on or about November 17, 2006***) | $ | 15 | $ | 15 | $ | 15 | $ | 15 | |||||||||||
Annual Fund Operating Expenses
(expenses that are deducted from Fund assets)
| Mid-Cap Growth Fund | New Era Growth Fund | Emerging Growth Fund | Pro Forma Emerging Growth Fund After Mid Cap Growth and New Era Growth Reorganizations* | ||||||||||||||||
| Management Fees**** | N/A | 0.90 | % | 0.60 | % | 0.60 | % | ||||||||||||
| + Distribution and Service (12b-1) Fees | N/A | None | None | None | |||||||||||||||
| + Other Expenses | N/A | 0.58 | % | 0.29 | % | 0.34 | % | ||||||||||||
| = Total annual fund operating expenses | N/A | 1.48 | % | 0.89 | % | 0.94 | % | ||||||||||||
| – Fee waiver and/or expense reimbursement | N/A | — | % | — | % | –0.05 | %4 | ||||||||||||
| = Net annual fund operating expenses | N/A | 1.48 | % | 0.89 | % | 0.89 | % | ||||||||||||
* Assuming the Mid-Cap Growth Reorganization had taken place on June 30, 2006.
** The CDSC for Class A, B, C shares of New Era Growth Fund and Emerging Growth Fund is calculated as a percentage of the lower of the original purchase price or sale proceeds. The CDSC for the Class L, M, X and New Class X shares of Emerging Growth Fund and Mid-Cap Growth Fund and the Class A, B and C shares of Mid-Cap Growth Fund is calculated as a percentage of the original purchase price.
*** Beginning on or about November 17, 2006, if the value of your account is less than $2,500, the applicable Fund will deduct a $15 annual small balance account fee from your account. Thereafter, beginning in 2007, the $15 annual small balance account fee will be assessed during the 4th calendar quarter of each year. Any applicable CDSC on the shares redeemed to pay the $15 small balance account fee will be waived. The $15 small balance account fee will not be charged on: (i) accounts during the first six months from inception of the account, (ii) omnibus accounts, (iii) institutional accounts, (iv) group retirement plans, and (v) AIP accounts or employee savings plan accounts.
**** Each Fund's management fee schedule includes fee breakpoints which reduce the Fund's effective management fee as Fund assets increase. Changes in Fund assets may result in increases or decreases in the Fund's effective management fee. Mid-Cap Growth Fund's contractual management fee is 1.00% of the average daily net assets of Mid-Cap Growth Fund up to and including $500 million, 0 .90% of the average daily net assets of Mid-Cap Growth Fund from $500 million to $1 billion, and 0 .85% of the average daily net assets of Mid-Cap Growth Fund in excess of $1 billion. The Manager, however, has agreed, effective as of August 1, 2005, to reduce the management fee rate for Mid-Cap Growth Fund so that the management fee, as a percentage of Mid-Cap Growth Fund's average daily net assets, is 0.90% to $500 million, 0.85% of the next $500 million, and 0.80% on $1 billion and over. In the event
50
the Mid-Cap Growth Fund Reorganization is consummated, the Manager could benefit from the elimination of the management fee waiver for Mid-Cap Growth Fund since the Manager is not waiving or reimbursing any of its fees for Emerging Growth Fund. New Era Growth Fund's contractual management fee is 0 .90% of the average daily net assets of New Era Growth Fund up to and including $1 billion and 0.85% of the average daily net assets of New Era Growth Fund in excess of $1 billion. Emerging Growth Fund's contractual management fee is 0.60% of the average daily net assets of Emerging Growth Fund up to and including $1 billion and 0.55% of the average daily net assets of Emerging Growth Fund in excess of $1 billion. In order to minimize the impact of any net operating expense ratio increases to Emerging Growth Fund in connection with the consummation of the Reorganization(s), the Manager has contractually agreed to waive: (i) up to .05% of its man agement fee on an annualized basis for the twelve months after the completion of the Mid-Cap Growth Fund Reorganization if Emerging Growth Fund's net operating expenses (exclusive of taxes, interest, brokerage, distribution fees and extraordinary expenses) exceed 0.89% as a result of such Reorganization; (ii) up to .03% of its management fee on an annualized basis for the twelve months after the completion of the New Era Growth Fund Reorganization if Emerging Growth Fund's net operating expenses (exclusive of taxes, interest, brokerage, distribution fees and extraordinary expenses) exceed 0.89% as a result of such Reorganization; and (iii) up to .05% of its management fee on an annualized basis for the twelve months after the completion of both Reorganizations if Emerging Growth Fund's net operating expenses (exclusive of taxes, interest, brokerage, distribution fees and extraordinary expenses) exceed 0.89% as a result of the Reorganizations.
1 Your broker may charge you a separate or additional fee for purchases and sales of shares.
2 Investors who purchase $1 million or more of Class A shares or Class L shares, to the extent Class L is open to new purchases, and sell these shares within 12 months of purchase are not subject to an initial sales charge but are subject to a CDSC of 1% (the CDSC is waived for purchases by certain retirement or benefit plans affiliated with Prudential). During the past 12 months, Class L shares were not available to new investors.
3 A $10 fee may be imposed for wire transfers of redemption proceeds.
4 The Manager has contractually agreed to reimburse and/or waive fees so that Mid-Cap Growth Fund's operating expenses, exclusive of taxes, interest, brokerage commissions, distribution fees and extraordinary expenses do not exceed 1.40% of Mid-Cap Growth Fund's average daily net asset for the twelve month period ending February 28, 2007.
5 With respect to Emerging Growth Fund and Mid-Cap Growth Fund, the Distributor has contractually agreed until February 28, 2007 to reduce its distribution and service (12b-1) fees for Class A shares of those Funds to 0.25% of the average daily net assets attributable to Class A shares of those Funds. With respect to New Era Growth Fund, the Distributor has contractually agreed until June 30, 2007 to reduce its distribution and service (12b-1) fees for Class A shares of the Fund to 0.25% of the average daily net assets attributable to Class A shares of the Fund.
6 The CDSC for Class B shares decreases by 1% annually to 1% in the fifth and sixth years and 0% in the seventh year. Class B shares automatically convert to Class A shares approximately seven years after purchase. The CDSC for Class C shares is 1% for shares redeemed within 12 months of purchase. The CDSC for Class M shares decreases by 1% annually to 2% in the fifth and sixth years after purchase, 1% in the seventh year and 0% in the eighth year after purchase. Class M shares convert to Class A shares approximately 8 years after purchase. The CDSC for Class X shares decreases by 1% annually to 2% in the fifth and sixth years after purchase, 1% in the seventh year and 0% in the eight year after purchase. The CDSC for New Class X shares decreases by 1% annually to 4% in the third and fourth years, 3% in the fifth year, 2% in the sixth and seventh years, 1% in the eighth year and 0% in the ninth year after purchase. Class X shar es and New Class X shares convert to Class A shares approximately 8 years and 10 years, respectively, after purchase. No CDSC is charged after these periods.
7 Only the Jennison Emerging Growth Fund has Class R shares. The Jennison Emerging Growth Fund distributor has contractually agreed to reduce its distribution and service (12b-1) fees for Class R shares to 0.50% of the Emerging Growth Fund's average daily net assets attributable to Class R shares for the 12-month period ending February 28, 2007. Without such contractual fee waiver the 12b-1 fees for the Jennison Emerging Growth Fund's Class R shares would be 0.75%.
Expense Examples
These examples are intended to help you compare the cost of investing in each Fund before the Reorganization with the cost of investing in Emerging Growth Fund after consummation of one or both of the Reorganizations. They assume that you invest $10,000 in a Fund for the time periods indicated, that your investment has a 5% return each year and that each Fund's operating expenses remain the same, except for any contractual and service (12b-1) fee waivers and overall expense limitations that may be in effect during the one year period. Class L, M and X shares of Emerging
51
Growth Fund were not offered during the last fiscal year. Approximately seven years after purchase, Class B shares will automatically convert to Class A shares on a quarterly basis. Approximately eight years after purchase, Class M shares will automatically convert to Class A shares on a quarterly basis. Approximately 10 years after purchase of Class X shares (and eight years of such shares issued prior to August 17, 1998) will automatically convert to Class A shares. The information in the ten years column reflects such conversions.
Full Redemption – Although your actual costs may be higher or lower, based on the above assumptions you would pay the following expenses if you redeemed your shares at the end of each period:
Class A Shares
| One Year | Three Years | Five Years | Ten Years | ||||||||||||||||
| Mid-Cap Growth Fund | $ | 709 | $ | 1,105 | $ | 1,526 | $ | 2,695 | |||||||||||
| New Era Growth Fund | 716 | 1,075 | 1,457 | 2,525 | |||||||||||||||
| Emerging Growth Fund | 660 | 902 | 1,164 | 1,910 | |||||||||||||||
| Pro Forma Emerging Growth Fund (After Mid-Cap Growth Fund Reorganization only)* | 660 | 912 | 1,184 | 1,959 | |||||||||||||||
| Pro Forma Emerging Growth Fund (After New Era Growth Fund Reorganization only)* | 660 | 908 | 1,176 | 1,939 | |||||||||||||||
| Pro Forma Emerging Growth Fund (After Mid-Cap Growth Fund and New Era Growth Fund Reorganizations)* | 660 | 912 | 1,184 | 1,959 | |||||||||||||||
* Assuming the Reorganization(s) had taken place on June 30, 2006.
Class B Shares
| One Year | Three Years | Five Years | Ten Years | ||||||||||||||||
| Mid-Cap Growth Fund | $ | 743 | $ | 1,104 | $ | 1,491 | $ | 2,734 | |||||||||||
| New Era Growth Fund | 751 | 1,073 | 1,421 | 2,563 | |||||||||||||||
| Emerging Growth Fund | 692 | 894 | 1,121 | 1,944 | |||||||||||||||
| Pro Forma Emerging Growth Fund (After Mid-Cap Growth Fund Reorganization only)* | 692 | 904 | 1,142 | 1,994 | |||||||||||||||
| Pro Forma Emerging Growth Fund (After New Era Growth Fund Reorganization only)* | 692 | 900 | 1,134 | 1,974 | |||||||||||||||
| Pro Forma Emerging Growth Fund (After Mid-Cap Growth Fund and New Era Growth Fund Reorganizations)* | 692 | 904 | 1,142 | 1,994 | |||||||||||||||
* Assuming the Reorganization(s) had taken place on June 30, 2006.
Class C Shares
| One Year | Three Years | Five Years | Ten Years | ||||||||||||||||
| Mid-Cap Growth Fund | $ | 343 | $ | 804 | $ | 1,391 | $ | 2,983 | |||||||||||
| New Era Growth Fund | 351 | 773 | 1,321 | 2,816 | |||||||||||||||
| Emerging Growth Fund | 292 | 594 | 1,021 | 2,212 | |||||||||||||||
| Pro Forma Emerging Growth Fund (After Mid-Cap Growth Fund Reorganization only)* | 292 | 604 | 1,042 | 2,260 | |||||||||||||||
| Pro Forma Emerging Growth Fund (After New Era Growth Fund Reorganization only)* | 292 | 600 | 1,034 | 2,241 | |||||||||||||||
| Pro Forma Emerging Growth Fund (After Mid-Cap Growth Fund and New Era Growth Fund Reorganizations)* | 292 | 604 | 1,042 | 2,260 | |||||||||||||||
* Assuming the Reorganization(s) had taken place on June 30, 2006.
52
Class L Shares
| One Year | Three Years | Five Years | Ten Years | ||||||||||||||||
| Mid-Cap Growth Fund | $ | 757 | $ | 1,191 | $ | 1,649 | $ | 2,914 | |||||||||||
| New Era Growth Fund | N/A | N/A | N/A | N/A | |||||||||||||||
| Emerging Growth Fund | 708 | 990 | 1,292 | 2,148 | |||||||||||||||
| Pro Forma Emerging Growth Fund (After Mid-Cap Growth Fund Reorganization only)* | 708 | 1,000 | 1,312 | 2,196 | |||||||||||||||
| Pro Forma Emerging Growth Fund (After New Era Growth Fund Reorganization only)* | 708 | 996 | 1,304 | 2,177 | |||||||||||||||
| Pro Forma Emerging Growth Fund (After Mid-Cap Growth Fund and New Era Growth Fund Reorganizations)* | 708 | 1,000 | 1,312 | 2,196 | |||||||||||||||
* Assuming the Reorganization(s) had taken place on June 30, 2006.
Class M Shares
| One Year | Three Years | Five Years | Ten Years | ||||||||||||||||
| Mid-Cap Growth Fund | $ | 843 | $ | 1,204 | $ | 1,591 | $ | 2,814 | |||||||||||
| New Era Growth Fund | N/A | N/A | N/A | N/A | |||||||||||||||
| Emerging Growth Fund | 792 | 994 | 1,221 | 2,029 | |||||||||||||||
| Pro Forma Emerging Growth Fund (After Mid-Cap Growth Fund Reorganization only)* | 792 | 1,004 | 1,242 | 2,079 | |||||||||||||||
| Pro Forma Emerging Growth Fund (After New Era Growth Fund Reorganization only)* | 792 | 1,000 | 1,234 | 2,059 | |||||||||||||||
| Pro Forma Emerging Growth Fund (After Mid-Cap Growth Fund and New Era Growth Fund Reorganizations)* | 792 | 1,004 | 1,242 | 2,079 | |||||||||||||||
* Assuming the Reorganization(s) had taken place on June 30, 2006.
Class R Shares
| One Year | Three Years | Five Years | Ten Years | ||||||||||||||||
| Mid-Cap Growth Fund | N/A | N/A | N/A | N/A | |||||||||||||||
| New Era Growth Fund | N/A | N/A | N/A | N/A | |||||||||||||||
| Emerging Growth Fund | $ | 142 | $ | 493 | $ | 868 | $ | 1,923 | |||||||||||
| Pro Forma Emerging Growth Fund (After Mid-Cap Growth Fund Reorganization only)* | 142 | 503 | 890 | 1,973 | |||||||||||||||
| Pro Forma Emerging Growth Fund (After New Era Growth Fund Reorganization only)* | 142 | 499 | 881 | 1,953 | |||||||||||||||
| Pro Forma Emerging Growth Fund (After Mid-Cap Growth Fund and New Era Growth Fund Reorganizations)* | 142 | 503 | 890 | 1,973 | |||||||||||||||
* Assuming the Reorganization(s) had taken place on June 30, 2006.
53
Class X Shares
| One Year | Three Years | Five Years | Ten Years | ||||||||||||||||
| Mid-Cap Growth Fund | $ | 843 | $ | 1,204 | $ | 1,691 | $ | 2,983 | |||||||||||
| New Era Growth Fund | N/A | N/A | N/A | N/A | |||||||||||||||
| Emerging Growth Fund | 792 | 994 | 1,321 | 2,212 | |||||||||||||||
| Pro Forma Emerging Growth Fund (After Mid-Cap Growth Fund Reorganization only)* | 792 | 1,004 | 1,342 | 2,260 | |||||||||||||||
| Pro Forma Emerging Growth Fund (After New Era Growth Fund Reorganization only)* | 792 | 1,000 | 1,334 | 2,241 | |||||||||||||||
| Pro Forma Emerging Growth Fund (After Mid-Cap Growth Fund and New Era Growth Fund Reorganizations)* | 792 | 1,004 | 1,342 | 2,260 | |||||||||||||||
* Assuming the Reorganization(s) had taken place on June 30, 2006.
Class Z Shares
| One Year | Three Years | Five Years | Ten Years | ||||||||||||||||
| Mid-Cap Growth Fund | N/A | N/A | N/A | N/A | |||||||||||||||
| New Era Growth Fund | $ | 151 | $ | 468 | $ | 808 | $ | 1,768 | |||||||||||
| Emerging Growth Fund | 91 | 284 | 493 | 1,096 | |||||||||||||||
| Pro Forma Emerging Growth Fund (After Mid-Cap Growth Fund Reorganization only)* | 91 | 295 | 515 | 1,150 | |||||||||||||||
| Pro Forma Emerging Growth Fund (After New Era Growth Fund Reorganization only)* | 91 | 290 | 506 | 1,129 | |||||||||||||||
| Pro Forma Emerging Growth Fund (After Mid-Cap Growth Fund and New Era Growth Fund Reorganizations)* | 91 | 295 | 515 | 1,150 | |||||||||||||||
* Assuming the Reorganization(s) had taken place on June 30, 2006.
No Redemption – Although your actual costs may be higher or lower, you would pay the following expenses on the same investment if you did not redeem your shares at the end of each period:
Class A Shares
| One Year | Three Years | Five Years | Ten Years | ||||||||||||||||
| Mid-Cap Growth Fund | $ | 709 | $ | 1,105 | $ | 1,526 | $ | 2,695 | |||||||||||
| New Era Growth Fund | 716 | 1,075 | 1,457 | 2,525 | |||||||||||||||
| Emerging Growth Fund | 660 | 902 | 1,164 | 1,910 | |||||||||||||||
| Pro Forma Emerging Growth Fund (After Mid-Cap Growth Fund Reorganization only)* | 660 | 912 | 1,184 | 1,959 | |||||||||||||||
| Pro Forma Emerging Growth Fund (After New Era Growth Fund Reorganization only)* | 660 | 908 | 1,176 | 1,939 | |||||||||||||||
| Pro Forma Emerging Growth Fund (After Mid-Cap Growth Fund and New Era Growth Fund Reorganizations)* | 660 | 912 | 1,184 | 1,959 | |||||||||||||||
* Assuming the Reorganization(s) had taken place on June 30, 2006.
54
Class B Shares
| One Year | Three Years | Five Years | Ten Years | ||||||||||||||||
| Mid-Cap Growth Fund | $ | 243 | $ | 804 | $ | 1,391 | $ | 2,734 | |||||||||||
| New Era Growth Fund | 251 | 773 | 1,321 | 2,563 | |||||||||||||||
| Emerging Growth Fund | 192 | 594 | 1,021 | 1,944 | |||||||||||||||
| Pro Forma Emerging Growth Fund (After Mid-Cap Growth Fund Reorganization only)* | 192 | 604 | 1,042 | 1,994 | |||||||||||||||
| Pro Forma Emerging Growth Fund (After New Era Growth Fund Reorganization only)* | 192 | 600 | 1,034 | 1,974 | |||||||||||||||
| Pro Forma Emerging Growth Fund (After Mid-Cap Growth Fund and New Era Growth Fund Reorganizations)* | 192 | 604 | 1,042 | 1,994 | |||||||||||||||
* Assuming the Reorganization(s) had taken place on June 30, 2006.
Class C Shares
| One Year | Three Years | Five Years | Ten Years | ||||||||||||||||
| Mid-Cap Growth Fund | $ | 243 | $ | 804 | $ | 1,391 | $ | 2,983 | |||||||||||
| New Era Growth Fund | 251 | 773 | 1,321 | 2,816 | |||||||||||||||
| Emerging Growth Fund | 192 | 594 | 1,021 | 2,212 | |||||||||||||||
| Pro Forma Emerging Growth Fund (After Mid-Cap Growth Fund Reorganization only)* | 192 | 604 | 1,042 | 2,260 | |||||||||||||||
| Pro Forma Emerging Growth Fund (After New Era Growth Fund Reorganization only)* | 192 | 600 | 1,034 | 2,241 | |||||||||||||||
| Pro Forma Emerging Growth Fund (After Mid-Cap Growth Fund and New Era Growth Fund Reorganizations)* | 192 | 604 | 1,042 | 2,260 | |||||||||||||||
* Assuming the Reorganization(s) had taken place on June 30, 2006.
Class L Shares
| One Year | Three Years | Five Years | Ten Years | ||||||||||||||||
| Mid-Cap Growth Fund | $ | 757 | $ | 1,191 | $ | 1,649 | $ | 2,914 | |||||||||||
| New Era Growth Fund | N/A | N/A | N/A | N/A | |||||||||||||||
| Emerging Growth Fund | 708 | 990 | 1,292 | 2,148 | |||||||||||||||
| Pro Forma Emerging Growth Fund (After Mid-Cap Growth Fund Reorganization only)* | 708 | 1,000 | 1,312 | 2,196 | |||||||||||||||
| Pro Forma Emerging Growth Fund (After New Era Growth Fund Reorganization only)* | 708 | 996 | 1,304 | 2,177 | |||||||||||||||
| Pro Forma Emerging Growth Fund (After Mid-Cap Growth Fund and New Era Growth Fund Reorganizations)* | 708 | 1,000 | 1,312 | 2,196 | |||||||||||||||
* Assuming the Reorganization(s) had taken place on June 30, 2006.
55
Class M Shares
| One Year | Three Years | Five Years | Ten Years | ||||||||||||||||
| Mid-Cap Growth Fund | $ | 243 | $ | 804 | $ | 1,391 | $ | 2,814 | |||||||||||
| New Era Growth Fund | N/A | N/A | N/A | N/A | |||||||||||||||
| Emerging Growth Fund | 192 | 594 | 1,021 | 2,029 | |||||||||||||||
| Pro Forma Emerging Growth Fund (After Mid-Cap Growth Fund Reorganization only)* | 192 | 604 | 1,042 | 2,079 | |||||||||||||||
| Pro Forma Emerging Growth Fund (After New Era Growth Fund Reorganization only)* | 192 | 600 | 1,034 | 2,059 | |||||||||||||||
| Pro Forma Emerging Growth Fund (After Mid-Cap Growth Fund and New Era Growth Fund Reorganizations)* | 192 | 604 | 1,042 | 2,079 | |||||||||||||||
* Assuming the Reorganization(s) had taken place on June 30, 2006.
Class R Shares
| One Year | Three Years | Five Years | Ten Years | ||||||||||||||||
| Mid-Cap Growth Fund | N/A | N/A | N/A | N/A | |||||||||||||||
| New Era Growth Fund | N/A | N/A | N/A | N/A | |||||||||||||||
| Emerging Growth Fund | $ | 142 | $ | 493 | $ | 868 | $ | 1,923 | |||||||||||
| Pro Forma Emerging Growth Fund (After Mid-Cap Growth Fund Reorganization only)* | 142 | 503 | 890 | 1,973 | |||||||||||||||
| Pro Forma Emerging Growth Fund (After New Era Growth Fund Reorganization only)* | 142 | 499 | 881 | 1,953 | |||||||||||||||
| Pro Forma Emerging Growth Fund (After Mid-Cap Growth Fund and New Era Growth Fund Reorganizations)* | 142 | 503 | 890 | 1,973 | |||||||||||||||
* Assuming the Reorganization(s) had taken place on June 30, 2006.
Class X Shares
| One Year | Three Years | Five Years | Ten Years | ||||||||||||||||
| Mid-Cap Growth Fund | $ | 243 | $ | 804 | $ | 1,391 | $ | 2,983 | |||||||||||
| New Era Growth Fund | N/A | N/A | N/A | N/A | |||||||||||||||
| Emerging Growth Fund | 192 | 594 | 1,021 | 2,212 | |||||||||||||||
| Pro Forma Emerging Growth Fund (After Mid-Cap Growth Fund Reorganization only)* | 192 | 604 | 1,042 | 2,260 | |||||||||||||||
| Pro Forma Emerging Growth Fund (After New Era Growth Fund Reorganization only)* | 192 | 600 | 1,034 | 2,241 | |||||||||||||||
| Pro Forma Emerging Growth Fund (After Mid-Cap Growth Fund and New Era Growth Fund Reorganizations)* | 192 | 604 | 1,042 | 2,260 | |||||||||||||||
* Assuming the Reorganization(s) had taken place on June 30, 2006.
56
Class Z Shares
| One Year | Three Years | Five Years | Ten Years | ||||||||||||||||
| Mid-Cap Growth Fund | N/A | N/A | N/A | N/A | |||||||||||||||
| New Era Growth Fund | $ | 151 | $ | 468 | $ | 808 | $ | 1,768 | |||||||||||
| Emerging Growth Fund | 91 | 284 | 493 | 1,096 | |||||||||||||||
| Pro Forma Emerging Growth Fund (After Mid-Cap Growth Fund Reorganization only)* | 91 | 295 | 515 | 1,150 | |||||||||||||||
| Pro Forma Emerging Growth Fund (After New Era Growth Fund Reorganization only)* | 91 | 290 | 506 | 1,129 | |||||||||||||||
| Pro Forma Emerging Growth Fund (After Mid-Cap Growth Fund and New Era Growth Fund Reorganizations)* | 91 | 295 | 515 | 1,150 | |||||||||||||||
* Assuming the Reorganization(s) had taken place on June 30, 2006.
These examples assume that all dividends and other distributions are reinvested and that the percentage amounts listed under "Total annual fund operating expenses" remain the same in the years shown. These examples illustrate the effect of expenses, but are not meant to suggest actual or expected expenses, which may vary. The assumed return of 5% is not a prediction of, and does not represent, actual or expected performance of any Fund.
Performance of the Funds
A number of factors – including risk – can affect how each Fund performs. The following bar charts show the performance of the Class L shares of Mid-Cap Growth Fund, the Class Z shares of New Era Growth Fund and the Class B shares of Emerging Growth Fund for each full calendar year of the respective Fund's operation. The first table below each bar chart shows each Fund's best and worst performance during the periods included in the bar chart. The second table shows the average annual total returns before taxes for each class of each Fund, as well as the average annual total returns after taxes on distributions and redemptions for respective share class of each Fund.
This information may help provide an indication of each Fund's risks by showing changes in performance from year to year and by comparing each Fund's performance with that of a broad-based securities index. The average annual figures reflect sales charges, the other figures do not, and would be lower if they did. Past performance, before and after taxes, does not mean that a fund will achieve similar results in the future.
Strategic Partners Mid-Cap Growth Fund*
Annual Total Returns % (Class L shares)1
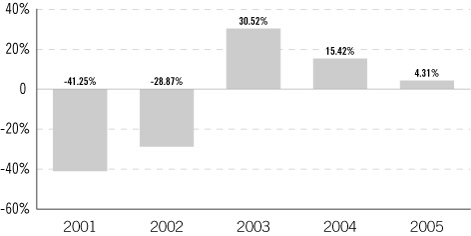
1 These annual total returns do not include deductions for sales charges. If the sales charges were included, the annual total returns would be lower than those shown.
BEST QUARTER: 18.31% (2nd quarter 2003) WORST QUARTER: –27.89% (3rd quarter 2001)
57
Average Annual Total Returns For periods ended December 31, 2005
| ONE YEAR | SINCE INCEPTION* | ||||||||||
| Class L | |||||||||||
| Return Before Taxes | (1.63 | )% | (13.72 | )% | |||||||
| Return After Taxes on Distributions | 2.74 | (13.23 | ) | ||||||||
| Return After Taxes on Distributions and | |||||||||||
| Sale of Fund Shares | (1.06 | ) | (11.02 | ) | |||||||
| Class A | |||||||||||
| Return Before Taxes | (1.42 | ) | 4.87 | ||||||||
| Class B | |||||||||||
| Return Before Taxes | (1.28 | ) | 5.35 | ||||||||
| Class M | |||||||||||
| Return Before Taxes | (2.27 | ) | (13.49 | ) | |||||||
| Class C | |||||||||||
| Return Before Taxes | 2.74 | (13.23 | ) | ||||||||
| Class X | |||||||||||
| Return Before Taxes | (2.26 | ) | (13.56 | ) | |||||||
| Index | |||||||||||
| S&P MidCap 400 Index | 12.56 | 7.11 | |||||||||
| Lipper Mid-Cap Growth Funds Avg. | 9.79 | (4.33 | ) | ||||||||
| Russell Mid-Cap Growth Index | 12.10 | (4.51 | ) | ||||||||
| Russell Mid-Cap Index | 12.65 | 6.88 | |||||||||
* Inception date: September 11, 2000
Strategic Partners New Era Growth Fund*
Annual Total Returns % (Class B shares)1

1 These annual total returns do not include deductions for sales charges. If the sales charges were included, the annual total returns would be lower than those shown.
BEST QUARTER: 20.79% (2nd quarter of 2003) WORST QUARTER: –29.60% (3rd quarter of 2001)
58
Average Annual Total Returns % (as of 12-31-05)
| ONE YEAR | FIVE YEARS | SINCE INCEPTION | |||||||||||||
| Return Before Taxes | |||||||||||||||
| Class A shares | 7.06% | (2.33)% | (2.17)% (11-22-00) | ||||||||||||
| Class C shares | 11.35% | (2.01)% | (1.83)% (11-22-00) | ||||||||||||
| Class Z shares | 13.51% | (0.99)% | (0.84)% (11-22-00) | ||||||||||||
| Class B Shares % | |||||||||||||||
| Return Before Taxes | 7.35% | (2.20)% | (2.02)% (11-22-00) | ||||||||||||
| Return After Taxes on Distributions | 7.35% | (2.20)% | (2.02)% | ||||||||||||
| Return After Taxes on Distributions | |||||||||||||||
| and Sale of Fund Shares | 4.77% | (1.86)% | (1.71)% | ||||||||||||
| Index (reflects no deduction for fees, expenses or taxes) | |||||||||||||||
| S&P 500 Index | 4.91 | % | 0.54 | % | 0.63% | ||||||||||
| Russell Midcap Growth Index | 12.10 | % | 1.38 | % | 2.38% | ||||||||||
| Lipper Average | 8.80 | % | (2.72 | )% | (2.44)% | ||||||||||
Notes to Average Annual Returns Table
• The Fund's returns are after deduction of sales charges and expenses. Without the distribution and service (12b-1) fee waiver of 0.05% for Class A shares, the returns for Class A shares would have been lower.
• After-tax returns are calculated using the highest historical individual federal marginal tax rates and do not reflect the impact of state and local taxes. Actual after-tax returns depend on an investor's tax situation and may differ from those shown. After-tax returns shown are not relevant to investors who hold their Fund shares through tax-deferred arrangements, such as 401(k) plans or individual retirement accounts. After-tax returns are shown only for Class B shares. After-tax returns for other classes will vary due to differing sales charges and expenses. Past performance, before and after taxes, does not mean that the Fund will achieve similar results in the future.
• The Russell Midcap Growth Index measures the performance of those Russell Midcap companies with high price-to-book ratios and high forecasted growth values. Source: Lipper, Inc.
• The Standard & Poor's 500 Composite Stock Price Index (S&P 500) - an unmanaged index of 500 stocks of large U.S. companies - gives a broad look at how stock prices have performed. These returns do not include the effect of any sales charges or operating expenses of a mutual fund or taxes. These returns would be lower if they included the effect of sales charges, operating expenses and taxes.
• The Lipper Average is based on the average return of all mutual funds in the Lipper Multi-Cap Growth Funds category and does not include the effect of any sales charges or taxes. Again, these returns would be lower if they included the effect of sales charges and taxes.
59
Jennison U.S. Emerging Growth Fund, Inc.
Annual Total Returns* (Class A shares)
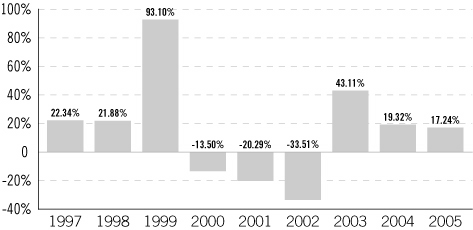
* These annual returns do not include sales charges. If the sales charges were included, the annual returns would be lower than those shown. Without a distribution and service (12b-1) fee waiver of 0.05%, the annual returns would have been lower, too.
BEST QUARTER: 55.30% (4th quarter of 1999) WORST QUARTER: –29.73% (3rd quarter of 2001)
Class L, M, X and New Class X shares are new share classes and no performance information is available for these new shares classes. The Average Annual Total Returns Table on the following page only reflects performance information for share classes that have at least one full year of operation.
Average Annual Total Returns1 (as of 12/31/05)
| ONE YEAR | FIVE YEARS | SINCE INCEPTION | |||||||||||||
| Return Before Taxes | |||||||||||||||
| Class A shares | 10.79 | % | .05 | % | 10.70% (12-31-96) | ||||||||||
| Class C shares | 15.42 | % | .44 | % | 10.55% (12-31-96) | ||||||||||
| Class Z shares | 17.51 | % | 1.44 | % | 11.66% (12-31-96) | ||||||||||
| Class R shares | N/A | N/A | N/A (6-3-05) | ||||||||||||
| Class B Shares | |||||||||||||||
| Return Before Taxes | 11.42 | % | .24 | % | 10.55% (12-31-96) | ||||||||||
| Return After Taxes on Distributions2 | 11.42 | % | .24 | % | 9.60% | ||||||||||
| Return After Taxes on Distributions and | |||||||||||||||
| Sale of Fund Shares2 | 7.42 | % | .20 | % | 8.88% | ||||||||||
| Index (reflects no deduction for fees, expenses or taxes) | |||||||||||||||
| Russell MidCap Growth Index3 | 12.10 | % | 1.38 | % | 8.39% | ||||||||||
| S&P Mid-Cap 400 Index4 | 12.56 | % | 8.60 | % | 13.83% | ||||||||||
| Russell Mid Cap Index5 | 12.65 | % | 8.45 | % | 11.79% | ||||||||||
| Lipper Midcap Growth Funds Average6 | 9.79 | % | (.48 | )% | 7.29% | ||||||||||
1 The Fund's returns are after deduction of sales charges and expenses. Without a distribution and service (12b-1) fee waiver for Class A shares of 0.05%, and a fee waiver for Class R shares of 0.25%, the returns for Class A and
60
Class R shares would have been lower. Since inception returns reflect the average annual total returns from the closest month-end date to the inception date of the Fund's Class A, B, C, Z and Class R shares.
2 After-tax returns are calculated using the historical highest individual federal marginal income tax rates and do not reflect the impact of state and local taxes. Actual after-tax returns depend on an investor's tax situation and may differ from those shown. After-tax returns shown are not relevant to investors who hold their Fund shares through tax-deferred arrangements, such as 401(k) plans or individual retirement accounts. After-tax returns are shown only for Class B shares. After-tax returns for other classes will vary due to differing sales charges and expenses. Past performance, before and after taxes, does not mean that the Fund will achieve similar results in the future.
3 The Russell MidCap Growth Index is a market value-weighted index that tracks those Russell MidCap companies with high price-to-book ratios and higher forecasted growth values. Index returns do not reflect deductions for sales charges, mutual fund operating expenses or taxes. Source: Lipper, Inc.
4 The Standard & Poor's Mid-Cap 400 Stock Index (S&P Mid-Cap 400 Index) – an unmanaged index of 400 domestic stocks chosen for market size, liquidity and industry group representation – gives a broad look at how mid-cap stock prices have performed. Index returns do not include the effect of any sales charges, mutual fund operating expenses or taxes. Effective March 1, 2006, the Fund will no longer utilize the S&P Mid-Cap 400 Index. The securities in the S&P Mid-Cap 400 Index may be very different from those in the Fund. Source: Lipper, Inc.
5 Russell Mid Cap Index – measures the performance of the 800 smallest companies in the Russell 1000 Index, which represent approximately 25% of the total market capitalization of the Russell 1000 Index. Source: Lipper Inc. Effective March 1, 2006, the Fund changed its index from the S&P Mid-Cap 400 Index to the Russell Mid Cap Index for purposes of determining the definition of small and medium sized companies.
6 The Lipper Midcap Growth Funds Average is based on the average return of all mutual funds in the Lipper Midcap Growth Funds category. It reflects deductions for mutual fund operating expenses, but does not include the effect of any sales charges or taxes. Again, these returns would be lower if they included the effects of sales charges and taxes. Source: Lipper, Inc.
REASONS FOR THE REORGANIZATIONS
The Directors of the Companies and SP Opportunity Funds, including all of the Directors who are not "interested persons" (as defined in the 1940 Act), of the Companies or SP Opportunity Funds (collectively, the "Independent Directors"), have unanimously determined that the applicable Reorganization would be in the best interests of the shareholders of each Fund, as applicable, and that the interests of the shareholders of each Fund would not be diluted as a result of the consummation of one or both of the Reorganizations.
At a meeting held on July 19, 2006, the Manager advised the Directors that, as of May 31, 2006, Mid-Cap Growth Fund and New Era Growth Fund had net assets of approximately $118 million and $80 million, respectively, while Emerging Growth Fund had net assets of approximately $648 million at that date. Accordingly, by merging the Funds, shareholders would enjoy a greater asset base over which fund expenses will be spread.
In addition, the Manager advised the Directors that, based on average annualized assets as of April 30, 2006, each Target Fund had higher gross and net expense ratios, than Emerging Growth Fund. The Directors considered the Manager's advice that if the Plan is approved with respect to each Target Fund, shareholders of each Target Fund, regardless of the class of shares they own, should realize an immediate reduction in both the net annual operating expenses and gross annual operating expenses (before and after any waivers or reimbursements) paid on their investment, although no assurance can be given that operational savings will be realized.
The Manager further advised the Directors that shareholders of each Target Fund also could benefit from the lower contractual management fee paid by shareholders of Emerging Growth Fund.
The Directors were advised that the estimated costs associated with the Reorganizations will be paid by the Target Funds and the Manager and/or an affiliate. See discussion below under "Expenses Resulting from the Reorganization."
The Manager also explained that shareholders of Emerging Growth Fund may experience a slightly higher net operating expense ratio as a result of the Reorganization(s). In order to minimize the impact of any net operating
61
expense ratio increases to Emerging Growth Fund in connection with the consummation of the Reorganization(s), the Manager has contractually agreed to waive: (i) up to .04% of its management fee on an annualized basis for the twelve months after the completion of the Mid-Cap Growth Fund Reorganization if Emerging Growth Fund's net operating expenses (exclusive of taxes, interest, brokerage, distribution fees and extraordinary expenses) exceed 0.89% as a result of such Reorganization; (ii) up to .01% of its management fee on an annualized basis for the twelve months after the completion of the New Era Growth Fund Reorganization if Emerging Growth Fund's net operating expenses (exclusive of taxes, interest, brokerage, distribution fees and extraordinary expenses) exceed 0.89% as a result of such Reorganization; and (iii) up to .05% of its management fee on an annualized basis for the twelve months after the completion of both Reorganizations if Emerging Growth Fund's net operating expenses (exclusive of taxes, interest, brokerage, distribution fees and extraordinary expenses) exceed 0.89% as a result of the Reorganizations. The Directors also noted that Emerging Growth Fund is not paying any of the costs of the Reorganization(s).
In recommending approval of the Plan to Target Fund shareholders, the Manager advised the Directors that the Funds have virtually identical investment objectives and substantially similar investment policies and investment portfolios. Moreover, the Manager reported that the Funds have similar investment styles. In recommending approval of each Reorganization, the Manager advised the Directors that the investment performance of Emerging Growth Fund was stronger than that of each Target Fund over the past three month, 1-year, 3- year, and 5-year time periods. Past investment performance does not guarantee future results.
The Manager noted that, since the shares of Emerging Growth Fund will be issued at net asset value in exchange for the net assets of each Target Fund having a value equal to the aggregate net asset value of the shares of the Target Fund when a Reorganization occurs, the net asset value per share of each Target Fund should remain virtually unchanged solely as a result of the Reorganization(s). Thus, a Reorganization should not result in dilution of the net asset value of either Target Fund or Emerging Growth Fund immediately following consummation of a Reorganization. However, as a result of a Reorganization, a shareholder of a Target Fund may hold a smaller percentage of ownership in Emerging Growth Fund than he or she did in the relevant Target Fund prior to the Reorganization. The aggregate net asset value of Emerging Growth Fund shares you receive as a result of a Reorganization will equal the aggregate net asset value of your shares of t he relevant Target Fund.
The Manager further noted that the respective assets and liabilities of each Target Fund and Emerging Growth Fund will be valued at the closing of the relevant Reorganization. The assets in each participating Fund will be valued according to the procedures set forth above under "Valuation." Purchase orders for a Target Fund's shares which have not been confirmed as of the closing of the relevant Reorganization will be treated as assets of the Emerging Growth Fund for purposes of the relevant Reorganization; redemption requests with respect to a Target Fund's shares which have not settled as of the closing of the relevant Reorganization will be treated as liabilities of the Emerging Growth Fund for purposes of the relevant Reorganization.
The Directors, including a majority of Independent Directors, after considering the matter, unanimously concluded that the interests of the shareholders of each Fund would not be diluted as a result of the consummation of one or both of the Reorganizations and that, for the following reasons, consummation of each Reorganization is in the best interests of the shareholders of each Fund, as applicable:
• The Funds have virtually identical investment objectives;
• The Funds have substantially similar investment policies and restrictions;
• Shareholders of the Target Funds are expected to realize a reduction in net and gross operating expenses as a result of the consummation of one or both of the Reorganizations;
• Shareholders of the Target Funds are expected to realize a reduction in investment management fee rates as a result of the consummation of one or both of the Reorganizations;
• The Emerging Growth Fund has outperformed each Target Fund over the past three month, 1-year, 3- year and 5-year time periods;
• Emerging Growth Fund has substantially more assets than either Target Fund; and
62
• Shareholders of each Fund could benefit from the long-term economies of scale that may result from consummation of one or both of the Reorganizations.
The Boards also considered that, in the opinion of special tax counsel to the Companies and SP Opportunity Funds, the exchange of shares pursuant to the Plan would not result in a taxable gain or loss for U.S. federal income tax purposes for shareholders of either Target Fund.
Consequently, the Boards of the SP Mutual Funds and SP Opportunity Funds approved the Plan and recommended that shareholders of Mid-Cap Growth Fund and New Era Growth Fund respectively vote to approve the Plan.
For the reasons discussed above, the Boards of SP Mutual Funds and SP Opportunity Funds unanimously recommend that you vote FOR the Plans.
If shareholders of one or both Target Funds do not approve the Plan, the Board will consider other possible courses of action for such Target Fund, including, among others, consolidation of the Target Fund with one or more affiliated or unaffiliated funds other than Emerging Growth Fund, adding one or more new subadvisers or replacing the current subadviser with one or more subadvisers. In the event that the shareholders of a Target Fund do not approve a Plan, the Manager of that Target Fund may consider recommending to the Board and shareholders the liquidation of that Target Fund in light of its past and anticipated future inability to attract sufficient assets to support long-term viability. A liquidation of a Target Fund would result in taxable gains or losses for most shareholders of that Target Fund.
INFORMATION ABOUT THE REORGANIZATIONS
This is only a summary of the Plan. You should read the form of Plan attached as Exhibit A.
Closing
If a Target Fund's shareholders approve the Plan, the relevant Reorganization will take place after various conditions are satisfied by SP Mutual Funds, on behalf of Mid-Cap Growth Fund, SP Opportunity Funds, on behalf of New Era Growth Fund, and Emerging Growth Fund, including the preparation of certain documents. Each of SP Mutual Funds, SP Opportunity Funds, and Emerging Growth Fund will determine a specific date for each Reorganization to take place. This is called the "closing date." If shareholders of a Target Fund do not approve the Plan, the Reorganization with respect to that Target Fund will not take place and the Board of Directors of SP Mutual Funds will consider alternative courses of actions, as described above. Shareholder approval of one Reorganization is not contingent upon, and will not affect, shareholder approval of the other Reorganization. In addition, completion of one Reorganization is not contingent upon, and will no t affect, completion of the other Reorganization.
If a Target Fund's shareholders approve the Plan, SP Mutual Funds and/or SP Opportunity Funds, on behalf of the relevant Target Fund, will deliver to Emerging Growth Fund all of such Target Fund's assets and Emerging Growth Fund will assume all of the liabilities of such Target Fund on the closing date. Emerging Growth Fund will issue to SP Mutual Funds and/or SP Opportunity Funds, for the benefit of the relevant Target Fund, shares of Emerging Growth Fund of a value equal to the dollar value of the net assets delivered to Emerging Growth Fund. SP Mutual Funds and/or SP Opportunity Funds will then distribute to the shareholders of record of the relevant Target Fund as of the close of business on the closing date, Emerging Growth Fund shares in equivalent value and of equivalent class as such shareholder holds in the relevant Target Fund. The relevant Target Fund will be subsequently liquidated and terminated and Emerging Growth Fund will be the surviving fund. The stock transfer books of the relevant Target Fund will be permanently closed on the closing date. Requests to transfer or redeem assets allocated to the relevant Target Fund may be submitted at any time before the close of the NYSE on the closing date and requests that are received in proper form prior to that time will be effected prior to the closing date.
To the extent permitted by law, SP Mutual Funds, SP Opportunity Funds, and Emerging Growth Fund may amend the Plan without shareholder approval. SP Mutual Funds, SP Opportunity Funds, and Emerging Growth Fund may also agree to terminate and abandon one or both of the Reorganizations at any time before or, to the extent permitted by law, after the approval by shareholders of one or both of the Target Funds.
63
Expenses Resulting from the Reorganizations
The expenses resulting from each Reorganization, including proxy solicitation costs, will be paid by the relevant Target Fund and the Manager and/or an affiliate. The portfolio securities of each Target Fund will be transferred in-kind to Emerging Growth Fund. Accordingly, consummation of the relevant Reorganization is not expected to result in material portfolio restructuring expenses. The estimated Reorganization costs associated with the Mid-Cap Growth Fund Reorganization to be borne by Mid-Cap Growth Fund are approximately $258,000, including approximately $211,000 in proxy solicitation costs. The estimated Reorganization costs associated with the New Era Growth Fund Reorganization to be borne by New Era Growth Fund are approximately $181,000, including approximately $122,000 in proxy solicitation costs. The Manager and/or an affiliate will pay any additional costs. If for any reason a Reorganization is not consummated, the relevant Targ et Fund will remain responsible for substantially all of the Reorganization-related fees and expenses.
Tax Consequences of the Reorganizations
The consummation of each Reorganization is intended to qualify for U.S. federal income tax purposes as a tax-free reorganization under the Code. It is a condition to the obligation of each Fund to complete the relevant Reorganization that such Fund will have received an opinion from Shearman & Sterling LLP, based upon representations made by the Funds participating in the relevant Reorganization, and upon certain assumptions, substantially to the effect that:
1. The acquisition by Emerging Growth Fund of the assets of the Target Fund in exchange solely for voting shares of Emerging Growth Fund and the assumption by Emerging Growth Fund of the liabilities, if any, of such Target Fund, followed by the distribution of Emerging Growth Fund shares received by such Target Fund pro rata to its shareholders, will constitute a "reorganization" within the meaning of Section 368(a) of the Code, and Emerging Growth Fund and such Target Fund each will be a "party to a reorganization" within the meaning of Section 368(b) of the Code;
2. The shareholders of such Target Fund will not recognize gain or loss upon the exchange of all of their shares of that Target Fund solely for shares of Emerging Growth Fund, as described in this Prospectus/Proxy Statement and in the Plan;
3. No gain or loss will be recognized by such Target Fund upon the transfer of its assets to Emerging Growth Fund in exchange solely for voting shares of Emerging Growth Fund and the assumption by Emerging Growth Fund of the liabilities, if any, of that Target Fund. In addition, no gain or loss will be recognized by such Target Fund on the distribution of such shares to the shareholders of that Target Fund (in liquidation of that Target Fund);
4. No gain or loss will be recognized by Emerging Growth Fund upon the acquisition of the assets of such Target Fund in exchange solely for voting shares of Emerging Growth Fund and the assumption of the liabilities, if any, of such Target Fund;
5. Emerging Growth Fund's tax basis for the assets acquired from such Target Fund will be the same as the tax basis of these assets when held by that Target Fund immediately before the transfer, and the holding period of such assets acquired by Emerging Growth Fund will include the holding period of such assets when held by that Target Fund;
6. Such Target Fund's shareholders' tax basis for the shares of Emerging Growth Fund received by them pursuant to the reorganization will be the same as their tax basis in such Target Fund shares exchanged therefor; and
7. The holding period of Emerging Growth Fund shares received by the shareholders of such Target Fund will include the holding period of their Target Fund shares exchanged therefor, provided such Target Fund shares were held as capital assets on the date of the exchange.
64
An opinion of counsel is not binding on the Internal Revenue Service (the "IRS"), or the courts. If a Reorganization were consummated but failed to qualify as a "reorganization" within the meaning of Section 368(a) of the Code, the Reorganization would be treated as a taxable sale of assets by the Target Fund to Emerging Growth Fund followed by a taxable liquidation of the Target Fund, and the shareholders of the Target Fund would recognize taxable gains or losses equal to the difference between their adjusted tax basis in the shares of the Target Fund and the fair market value of the shares of Emerging Growth Fund received in exchange therefor. Mid-Cap Growth Fund has a capital loss carryforward as of October 31, 2005 of approximately $153,730,000. New Era Growth Fund has a capital loss carryforward as of February 28, 2006 of approximately $93,526,000. Emerging Growth Fund has a capital loss carryforward as of October 31, 2005 of approximat ely $198,229,000. In a tax-free reorganization, the acquiring fund generally succeeds to capital loss carryforwards of the target fund on the transfer date pursuant to Section 381 of the Code. There are several rules that may limit the ability of the acquiring fund to utilize the capital loss carryforwards of the target fund after the transfer date. Section 381 limits the amount of gain of the acquiring fund that can be offset by the capital loss carryforwards of the target fund in the first taxable year ending after the reorganization. A second rule (pursuant to Sections 382 and 383 of the Code) limits the amount of capital gain of the acquiring fund that may be offset annually by the capital loss carryforwards of the target fund (where, as in this reorganization, the acquiring fund has greater equity value than the target fund), in general, to the value of the equity of the target fund immediately before the reorganization multiplied by the applicable long-term tax-exempt bond rate (as published by the IRS ). Additional rules may apply, further limiting the utilization of the capital loss. Target Fund shareholders should consult their tax advisers regarding the tax consequences to them of the relevant Reorganization in light of their individual circumstances. In addition, because the foregoing discussion relates only to the U.S. federal income tax consequences of the Reorganizations, shareholders also should consult their tax advisers as to state, local and foreign tax consequences to them, if any, of the relevant Reorganization.
Characteristics of Emerging Growth Fund Shares
Emerging Growth Fund was formed in Maryland on August 23, 1996. It is registered with the SEC as an open-end management investment company. Emerging Growth Fund is authorized to issue 2 billion shares of common stock, par value $0.001 per share, divided into nine classes, designated Class A, Class B, Class C, Class L, Class M, Class R, Class X, New Class X and Class Z. Class L, M, X and New Class X shares are available only for exchanges with the same class of shares in other existing funds in the mutual fund complex. These share classes will be closed to new or subsequent purchases, except for purchases through reinvestment of any dividends and distributions.
Each class of shares represents an interest in the same assets of Emerging Growth Fund and is identical in all respects except that:
• each class is subject to different sales charges and distribution or service fees (12b-1 fees) (except for Class Z shares, which are not subject to any sales charges and distribution or service fees), which may affect net asset value, dividends and liquidation rights;
• each class has exclusive voting rights on any matter submitted to shareholders that relates solely to its arrangement and has separate voting rights on any matter submitted to shareholders in which the interests of that class differ from the interests of any other class;
• each class has a different exchange privilege;
• Class Z shares are only available to a limited class of shareholders; and
• Class B, Class M, Class X and New Class X shares will have a conversion feature whereby Class B, Class M, Class X and New Class X shares will automatically convert to Class A shares as follows: at the end of seven years (Class B shares), eight years (Class M shares and Class X shares) and ten years (New Class X shares), respectively, after the original purchase of shares.
Shares of Emerging Growth Fund, when issued, are fully paid, nonassessable, fully transferable and redeemable at the option of the holder. Except for the conversion feature described above, there are no conversion, preemptive or other subscription rights. In the event of liquidation, each share of Emerging Growth Fund is entitled to its portion of all of that Fund's assets after all debt and expenses of the Fund have been paid. Since Class B, Class C,
65
Class M and Class X shares generally bear higher distribution expenses than Class A, Class L and Class R shares, the liquidation proceeds to shareholders of those classes are likely to be lower than to Class A and Class L shareholders, whose distribution expenses are lower and to Class Z shareholders, whose shares are not subject to any distribution or service fees. The voting and dividend rights, the right of redemption and the privilege of exchange are described in Emerging Growth Fund's prospectus.
Emerging Growth Fund does not intend to hold annual meetings of shareholders. There will normally be no meetings of shareholders for the purpose of electing directors unless less than a majority of the directors holding office have been elected by shareholders, and the 1940 Act requires a meeting of shareholders, at which time the directors then in office will call a shareholder meeting for the election of directors. Shareholders of record of two-thirds of the outstanding shares of Emerging Growth Fund may remove a director, with or without cause, by votes cast in person or by proxy at a meeting called for that purpose. The directors are required to call a meeting of shareholders for the purpose of voting upon the question of removal of any director, or to transact any other business, when requested in writing to do so by the shareholders of record holding at least a majority of Emerging Growth Fund's outstanding shares.
Shares of Emerging Growth Fund that will be distributed to shareholders of one or both of the Target Funds will have the same legal characteristics as the same class of shares of the Target Funds with respect to such matters as assessibility, conversion rights, and transferability.
Capitalization
The following tables set forth, as of June 30, 2006, the capitalization of each share class of: (i) Emerging Growth Fund; (ii) Mid-Cap Growth Fund; (iii) the pro forma Emerging Growth Fund as adjusted to give effect to the Mid-Cap Growth Reorganization; (iv) New Era Growth Fund; (v) the pro forma Emerging Growth Fund as adjusted to give effect to the New Era Growth Fund Reorganization; and (vi) the pro forma Emerging Growth Fund as adjusted to give effect to the Mid-Cap Growth and New Era Growth Reorganizations. The capitalization of Emerging Growth Fund is likely to be different than the pro forma indicated below when one or both of the Reorganizations are consummated.
Mid-Cap Growth Fund Reorganization
Class A
| Mid-Cap Growth Fund | Emerging Growth Fund | Adjustments* | Pro Forma Emerging Growth Fund after Mid-Cap Growth Fund Reorganization (unaudited) | ||||||||||||||||
| Net assets | $ | 12,498,158 | $ | 340,584,373 | (28,359 | ) | $ | 353,054,172 | |||||||||||
| Total shares outstanding | 2,596,986 | 16,547,095 | (1,991,148 | ) | 17,152,933 | ||||||||||||||
| Net asset value per share | $ | 4.81 | $ | 20.58 | — | $ | 20.58 | ||||||||||||
Class B
| Mid-Cap Growth Fund | Emerging Growth Fund | Adjustments* | Pro Forma Emerging Growth Fund after Mid-Cap Growth Fund Reorganization (unaudited) | ||||||||||||||||
| Net assets | $ | 2,429,473 | $ | 96,358,847 | (5,513 | ) | $ | 98,782,807 | |||||||||||
| Total shares outstanding | 520,916 | 5,074,089 | (393,274 | ) | 5,201,731 | ||||||||||||||
| Net asset value per share | $ | 4.66 | $ | 18.99 | — | $ | 18.99 | ||||||||||||
66
Class C
| Mid-Cap Growth Fund | Emerging Growth Fund | Adjustments* | Pro Forma Emerging Growth Fund after Mid-Cap Growth Fund Reorganization (unaudited) | ||||||||||||||||
| Net assets | $ | 18,239,165 | $ | 41,894,449 | (41,386 | ) | $ | 60,092,228 | |||||||||||
| Total shares outstanding | 3,931,866 | 2,205,530 | (2,973,845 | ) | 3,163,551 | ||||||||||||||
| Net asset value per share | $ | 4.64 | $ | 19.00 | — | $ | 19.00 | ||||||||||||
Class L
| Mid-Cap Growth Fund | Emerging Growth Fund | Adjustments* | Pro Forma Emerging Growth Fund after Mid-Cap Growth Fund Reorganization (unaudited) | ||||||||||||||||
| Net assets | $ | 20,079,049 | $ | 5,311,281 | (45,561 | ) | $ | 25,344,769 | |||||||||||
| Total shares outstanding | 4,208,224 | 258,046 | (3,234,907 | ) | 1,231,363 | ||||||||||||||
| Net asset value per share | $ | 4.77 | $ | 20.58 | — | $ | 20.58 | ||||||||||||
Class M
| Mid-Cap Growth Fund | Emerging Growth Fund | Adjustments* | Pro Forma Emerging Growth Fund after Mid-Cap Growth Fund Reorganization (unaudited) | ||||||||||||||||
| Net assets | $ | 50,207,037 | $ | 1,609,537 | (113,923 | ) | $ | 51,702,651 | |||||||||||
| Total shares outstanding | 10,800,442 | 84,739 | (8,163,137 | ) | 2,722,044 | ||||||||||||||
| Net asset value per share | $ | 4.65 | $ | 18.99 | — | $ | 18.99 | ||||||||||||
Class R
| Mid-Cap Growth Fund | Emerging Growth Fund** | Adjustments* | Pro Forma Emerging Growth Fund after Mid-Cap Growth Fund Reorganization (unaudited) | ||||||||||||||||
| Net assets | $ | — | $ | 3,012 | — | $ | 3,012 | ||||||||||||
| Total shares outstanding | — | 147 | — | 147 | |||||||||||||||
| Net asset value per share | $ | — | $ | 20.51 | — | $ | 20.51 | ||||||||||||
67
Class X
| Mid-Cap Growth Fund | Emerging Growth Fund | Adjustments* | Pro Forma Emerging Growth Fund after Mid-Cap Growth Fund Reorganization (unaudited) | ||||||||||||||||
| Net assets | $ | 10,250,457 | $ | 12,715,018 | (23,258 | ) | $ | 22,942,217 | |||||||||||
| Total shares outstanding | 2,210,567 | 670,088 | (1,671,588 | ) | 1,209,067 | ||||||||||||||
| Net asset value per share | $ | 4.64 | $ | 18.98 | — | $ | 18.98 | ||||||||||||
Class Z
| Mid-Cap Growth Fund | Emerging Growth Fund | Adjustments* | Pro Forma Emerging Growth Fund after Mid-Cap Growth Fund Reorganization (unaudited) | ||||||||||||||||
| Net assets | $ | — | $ | 163,133,470 | — | $ | 163,133,470 | ||||||||||||
| Total shares outstanding | — | 7,730,240 | — | 7,730,240 | |||||||||||||||
| Net asset value per share | $ | — | $ | 21.10 | — | $ | 21.10 | ||||||||||||
New Era Growth Fund Reorganization
Class A
| New Era Growth Fund | Emerging Growth Fund | Adjustments* | Pro Forma Emerging Growth Fund after New Era Growth Fund Reorganization (unaudited) | ||||||||||||||||
| Net assets | $ | 15,052,080 | $ | 340,584,373 | (34,720 | ) | $ | 355,601,733 | |||||||||||
| Total shares outstanding | 1,641,510 | 16,547,095 | (911,900 | ) | 17,276,705 | ||||||||||||||
| Net asset value per share | $ | 9.17 | $ | 20.58 | — | $ | 20.58 | ||||||||||||
Class B
| New Era Growth Fund | Emerging Growth Fund | Adjustments* | Pro Forma Emerging Growth Fund after New Era Growth Fund Reorganization (unaudited) | ||||||||||||||||
| Net assets | $ | 34,833,677 | $ | 96,358,847 | (80,350 | ) | $ | 131,112,174 | |||||||||||
| Total shares outstanding | 3,959,218 | 5,074,089 | (2,129,168 | ) | 6,904,139 | ||||||||||||||
| Net asset value per share | $ | 8.80 | $ | 18.99 | — | $ | 18.99 | ||||||||||||
68
Class C
| New Era Growth Fund | Emerging Growth Fund | Adjustments* | Pro Forma Emerging Growth Fund after New Era Growth Fund Reorganization (unaudited) | ||||||||||||||||
| Net assets | $ | 24,282,815 | $ | 41,894,449 | (56,013 | ) | $ | 66,121,251 | |||||||||||
| Total shares outstanding | 2,759,319 | 2,205,530 | (1,483,901 | ) | 3,480,948 | ||||||||||||||
| Net asset value per share | $ | 8.80 | $ | 19.00 | — | $ | 19.00 | ||||||||||||
Class L
| New Era Growth Fund | Emerging Growth Fund | Adjustments* | Pro Forma Emerging Growth Fund after New Era Growth Fund Reorganization (unaudited) | ||||||||||||||||
| Net assets | $ | — | $ | 5,311,281 | — | $ | 5,311,281 | ||||||||||||
| Total shares outstanding | — | 258,046 | — | 258,046 | |||||||||||||||
| Net asset value per share | $ | — | $ | 20.58 | — | $ | 20.58 | ||||||||||||
Class M
| New Era Growth Fund | Emerging Growth Fund | Adjustments* | Pro Forma Emerging Growth Fund after New Era Growth Fund Reorganization (unaudited) | ||||||||||||||||
| Net assets | $ | — | $ | 1,609,537 | — | $ | 1,609,537 | ||||||||||||
| Total shares outstanding | — | 84,739 | — | 84,739 | |||||||||||||||
| Net asset value per share | $ | — | $ | 18.99 | — | $ | 18.99 | ||||||||||||
Class X
| New Era Growth Fund | Emerging Growth Fund | Adjustments* | Pro Forma Emerging Growth Fund after New Era Growth Fund Reorganization (unaudited) | ||||||||||||||||
| Net assets | $ | — | $ | 12,715,018 | — | $ | 12,715,018 | ||||||||||||
| Total shares outstanding | — | 670,088 | — | 670,088 | |||||||||||||||
| Net asset value per share | $ | — | $ | 18.98 | — | $ | 18.98 | ||||||||||||
69
Class R
| New Era Growth Fund | Emerging Growth Fund** | Adjustments* | Pro Forma Emerging Growth Fund after New Era Growth Fund Reorganization (unaudited) | ||||||||||||||||
| Net assets | $ | — | $ | 3,012 | — | $ | 3,012 | ||||||||||||
| Total shares outstanding | — | 147 | — | 147 | |||||||||||||||
| Net asset value per share | $ | — | $ | 20.51 | — | $ | 20.51 | ||||||||||||
Class Z
| New Era Growth Fund | Emerging Growth Fund | Adjustments* | Pro Forma Emerging Growth Fund after New Era Growth Fund Reorganization (unaudited) | ||||||||||||||||
| Net assets | $ | 4,299,282 | $ | 163,133,470 | (9,917 | ) | $ | 167,422,835 | |||||||||||
| Total shares outstanding | 461,815 | 7,730,240 | (258,559 | ) | 7,933,496 | ||||||||||||||
| Net asset value per share | $ | 9.31 | $ | 21.10 | — | $ | 21.10 | ||||||||||||
Mid-Cap Growth Fund and New Era Growth Fund Reorganizations
Class A
| Mid-Cap Growth Fund | New Era Growth Fund | Emerging Growth Fund | Adjustments* | Pro Forma Emerging Growth Fund after Reorganizations (unaudited) | |||||||||||||||||||
| Net assets | $ | 12,498,158 | $ | 15,052,080 | $ | 340,584,373 | (63,079 | ) | $ | 368,071,532 | |||||||||||||
| Total shares outstanding | 2,596,986 | 1,641,510 | 16,547,095 | (2,903,048 | ) | 17,882,543 | |||||||||||||||||
| Net asset value per share | $ | 4.81 | $ | 9.17 | $ | 20.58 | — | $ | 20.58 | ||||||||||||||
Class B
| Mid-Cap Growth Fund | New Era Growth Fund | Emerging Growth Fund | Adjustments* | Pro Forma Emerging Growth Fund after Reorganizations (unaudited) | |||||||||||||||||||
| Net assets | $ | 2,429,473 | $ | 34,833,677 | $ | 96,358,847 | (85,863 | ) | $ | 133,536,134 | |||||||||||||
| Total shares outstanding | 520,916 | 3,959,218 | 5,074,089 | (2,522,443 | ) | 7,031,780 | |||||||||||||||||
| Net asset value per share | $ | 4.66 | $ | 8.80 | $ | 18.99 | — | $ | 18.99 | ||||||||||||||
70
Class C
| Mid-Cap Growth Fund | New Era Growth Fund | Emerging Growth Fund | Adjustments* | Pro Forma Emerging Growth Fund after Reorganizations (unaudited) | |||||||||||||||||||
| Net assets | $ | 18,239,165 | $ | 24,282,815 | $ | 41,894,449 | (97,399 | ) | $ | 84,319,030 | |||||||||||||
| Total shares outstanding | 3,931,866 | 2,759,319 | 2,205,530 | (4,457,746 | ) | 4,438,969 | |||||||||||||||||
| Net asset value per share | $ | 4.64 | $ | 8.80 | $ | 19.00 | — | $ | 19.00 | ||||||||||||||
Class L
| Mid-Cap Growth Fund | New Era Growth Fund | Emerging Growth Fund | Adjustments* | Pro Forma Emerging Growth Fund after Reorganizations (unaudited) | |||||||||||||||||||
| Net assets | $ | 20,079,049 | $ | — | $ | 5,311,281 | (45,561 | ) | $ | 25,344,769 | |||||||||||||
| Total shares outstanding | 4,208,224 | — | 258,046 | (3,234,909 | ) | 1,231,361 | |||||||||||||||||
| Net asset value per share | $ | 4.77 | $ | — | $ | 20.58 | — | $ | 20.58 | ||||||||||||||
Class M
| Mid-Cap Growth Fund | New Era Growth Fund | Emerging Growth Fund | Adjustments* | Pro Forma Emerging Growth Fund after Reorganizations (unaudited) | |||||||||||||||||||
| Net assets | $ | 50,207,037 | $ | — | $ | 1,609,537 | (113,923 | ) | $ | 51,702,651 | |||||||||||||
| Total shares outstanding | 10,800,442 | — | 84,739 | (8,163,137 | ) | 2,722,044 | |||||||||||||||||
| Net asset value per share | $ | 4.65 | $ | — | $ | 18.99 | — | $ | 18.99 | ||||||||||||||
Class R
| Mid-Cap Growth Fund | New Era Growth Fund | Emerging Growth Fund** | Adjustments* | Pro Forma Emerging Growth Fund after Reorganizations (unaudited) | |||||||||||||||||||
| Net assets | $ | — | $ | — | $ | 3,012 | — | $ | 3,012 | ||||||||||||||
| Total shares outstanding | — | — | 147 | — | 147 | ||||||||||||||||||
| Net asset value per share | $ | — | $ | — | $ | 20.51 | — | $ | 20.51 | ||||||||||||||
Class X
| Mid-Cap Growth Fund | New Era Growth Fund | Emerging Growth Fund | Adjustments* | Pro Forma Emerging Growth Fund after Reorganizations (unaudited) | |||||||||||||||||||
| Net assets | $ | 10,250,457 | $ | — | $ | 12,715,018 | (23,258 | ) | $ | 22,942,217 | |||||||||||||
| Total shares outstanding | 2,210,567 | — | 670,088 | (1,671,588 | ) | 1,209,067 | |||||||||||||||||
| Net asset value per share | $ | 4.64 | $ | — | $ | 18.98 | — | $ | 18.98 | ||||||||||||||
71
Class Z
| Mid-Cap Growth Fund | New Era Growth Fund | Emerging Growth Fund | Adjustments* | Pro Forma Emerging Growth Fund after Reorganizations (unaudited) | |||||||||||||||||||
| Net assets | $ | — | $ | 4,299,282 | $ | 163,133,470 | (9,917 | ) | $ | 422,835 | |||||||||||||
| Total shares outstanding | — | 461,815 | 7,730,240 | (258,559 | ) | 7,933,496 | |||||||||||||||||
| Net asset value per share | $ | — | $ | 9.31 | $ | 21.10 | $ | 21.10 | |||||||||||||||
* Reflects the change in shares and par value of the relevant Fund(s) upon conversion in Emerging Growth Fund.
** Class R's unrounded net assets and total shares outstanding are $3,011.58 and 146.8, respectively.
VOTING INFORMATION
Required Vote
Only shareholders of record of Mid-Cap Growth Fund and New Era Growth Fund as of the Record Date will be entitled to vote at the relevant Meeting. As of the Record Date, there were shares of Mid-Cap Growth Fund issued and outstanding and _____________ shares of New Era Growth Fund issued and outstanding.
The presence in person or by proxy of the holders of a majority of the outstanding shares of Mid-Cap Growth Fund entitled to be voted at the relevant Meeting and 40% of the outstanding shares of the New Era Growth Fund entitled to be voted at the relevant Meeting is required to constitute a quorum of such Target Fund at that Meeting. Shares beneficially held by shareholders present in person or represented by proxy at the relevant Meeting will be counted for the purpose of calculating the votes cast on the issues before the relevant Meeting. If a quorum is present with respect to that Target Fund, the affirmative vote of the holders of a majority of the total number of shares of capital stock of that Target Fund outstanding and entitled to vote thereon is necessary to approve a Plan, which, for purposes of this vote, under the 1940 Act, means that approval of the Plan requires the vote of the lesser of (i) 67% or more of the voting shares of that Target Fund represented at a relevant Meeting at which more than 50% of the outstanding voting shares of that Target Fund are present in person or represented by proxy; or (ii) more than 50% of the outstanding voting shares of that Target Fund. Each shareholder will be entitled to one vote for each full share, and a fractional vote for each fractional share of a Target Fund held at the close of business on the Record Date.
Shares held by shareholders present in person or represented by proxy at the relevant Meeting will be counted both for the purposes of determining the presence of a quorum and for calculating the votes cast on the issues before the relevant Meeting. An abstention by a shareholder, either by proxy or by vote in person at a relevant Meeting, is not a vote cast.
Under existing NYSE rules, it is not expected that brokers, banks and other nominees will be entitled to vote a Fund's shares with respect to a Plan unless the beneficial owner gives specific instructions for such vote to the broker or other nominee. When a broker executes and returns a proxy card but is unable to cast a vote on a matter without specific instructions, and no specific instructions are given, the result is referred to as a "broker non-vote." SP Mutual Funds and SP Opportunity Funds will forward proxy materials to record owners for any beneficial owners that such record owners may represent.
Abstentions and broker non-votes will count towards determining the presence of a quorum at the relevant Meeting. However, shares represented by broker non-votes and abstentions will not be voted for or against the reorganization or any adjournment. Therefore, since approval of the Plan requires the affirmative vote of the lesser of 67% of the voting shares present at the relevant Meeting or a majority of the total number of shares of a Fund outstanding at the Record Date, each broker non-vote and abstention would have the effect of a vote AGAINST the Plan or against an adjournment.
In the event that sufficient votes to obtain a quorum have not been obtained by SP Mutual Funds or SP Opportunity Funds, SP Mutual Funds or SP Opportunity Funds may request that one or more brokers submit a
72
specific number of broker non-votes in order to obtain a quorum. SP Mutual Funds or SP Opportunity Funds would only take such actions if it believed that such actions would result in a quorum and SP Mutual Funds or SP Opportunity Funds had already received or expected to receive sufficient shareholder votes to approve the proposal at the relevant Meeting. Therefore, shareholders who are against the proposal for the approval of the Plan should vote AGAINST the Plan.
Shareholders having more than one account in a Fund generally will receive a single proxy statement and a separate proxy card for each account. It is important to mark, sign, date and return all proxy cards received.
In the event that sufficient votes to approve the Plan are not received, the persons named as proxies may propose one or more adjournments of the relevant Meeting to permit further solicitation of proxies. Any such adjournment will require the affirmative vote of a majority of those shares represented at the relevant Meeting in person or by proxy. The persons named as proxies will vote in favor of such adjournment those proxies that they are entitled to vote FOR any such adjournment in their discretion. Shares represented by broker non-votes or abstentions will not be voted for or against adjournment. Because an adjournment requires an affirmative vote of a majority of the shares present at the relevant Meeting, each broker non-vote and abstention would have the effect of a vote against adjour nment.
How to Vote
You can vote your shares in any one of four ways:
• By mail, with the enclosed proxy card.
• In person at the relevant Meeting.
• By phone.
• Over the Internet.
If you simply sign and date the proxy but give no voting instructions, your shares will be voted in favor of the Plan and in accordance with the views of management upon any unexpected matters that come before the relevant Meeting or adjournment of the relevant Meeting.
Revocation of Proxies
Proxies, including votes given by telephone or over the Internet, may be revoked at any time before they are voted either (i) by a written revocation received by the Secretary of SP Mutual Funds or SP Opportunity Funds at Gateway Center Three, 100 Mulberry Street, Newark, New Jersey 07102, (ii) by properly submitting a later-dated proxy that is received by 11:59 p.m. Eastern time on the day prior to the Meeting, or (iii) by attending the relevant Meeting and voting in person. Merely attending the relevant Meeting without voting, however, will not revoke a previously submitted proxy.
Solicitation of Voting Instructions
Voting instructions will be solicited principally by mailing this Prospectus/Proxy Statement and its enclosures, but instructions also may be solicited by telephone, facsimile, through electronic means such as email, or in person by officers or representatives of the SP Mutual Funds or SP Opportunity Funds. In addition, SP Mutual Funds and SP Opportunity Funds have engaged MIS, an ADP Company, a professional proxy solicitation firm, to assist in the solicitation of proxies. As the Meeting dates approach, you may receive a phone call from a representative of MIS if SP Mutual Funds or SP Opportunity Funds have not yet received your vote. MIS may ask you for authority, by telephone, to permit MIS to execute your voting instructions on your behalf.
73
PRINCIPAL HOLDERS OF SHARES
As of the Record Date, the table below sets forth each shareholder that owns of record more than 5% of any class of each Fund.
| Fund | Beneficial Owner Name* | Address | Class | Percent Ownership | |||||||||||||||
| Mid-Cap Growth Fund: | |||||||||||||||||||
| New Era Growth Fund | |||||||||||||||||||
| Emerging Growth Fund: | |||||||||||||||||||
[To be filed by Amendment]
* As defined by the SEC, a security is beneficially owned by a person if that person has or shares voting power or investment power with respect to the security.
As of the Record Date, the officers and directors of the SP Mutual Funds, as a group, beneficially owned less than 1% of the outstanding voting shares of Mid-Cap Growth Fund.
As of the Record Date, the officers and directors of SP Opportunity Funds, as a group, beneficially owned less than 1% of the outstanding voting shares of the New Era Value Fund.
Mid-Cap Growth Fund does not offer Class R or Class Z shares. New Era Growth Fund does not offer Class L, Class M, Class X shares, or Class R shares. In the event of any meetings of shareholders, Wachovia Securities will forward, or cause the forwarding of, proxy material to the beneficial owners for which it is the record holder.
ADDITIONAL INFORMATION
Emerging Growth Fund is an open-end management investment company registered with the SEC under the 1940 Act. Detailed information about Emerging Growth Fund is contained in its prospectus, dated February 27, 2006, which is enclosed herewith and is incorporated by reference into this Prospectus/Proxy Statement. Additional information about Emerging Growth Fund is included in its Statement of Additional Information, dated February 27, 2006, which has been filed with the SEC and is incorporated by reference into this Prospectus/Proxy Statement.
A copy of the Annual Report to Shareholders of Emerging Growth Fund for the fiscal year ended October 31, 2005, and the Semi-Annual Report to Shareholders of Emerging Growth Fund for the fiscal period ended April 30, 2006 are enclosed herewith. A copy of such shareholder reports also may be obtained by calling 1-800-225-1852 or by writing to Emerging Growth Fund at Gateway Center Three, 100 Mulberry Street, Newark, New Jersey 07102.
SP Mutual Funds, on behalf of Mid-Cap Growth Fund, SP Opportunity Funds, on behalf of New Era Growth Fund, and Emerging Growth Fund file proxy materials, reports and other information with the SEC in accordance with the informational requirements of the Securities Exchange Act of 1934 and the 1940 Act. These materials can be inspected and copied at: the SEC's Public Reference Room at 100 F Street, N.E., Washington, D.C. 20549. Also, copies of such material can be obtained from the SEC's Public Branch, Office of Consumer Affairs and Information Services, Securities and Exchange Commission, Washington, D.C. 20549-6009, upon payment of prescribed fees, or from the SEC's Internet address at http://www.sec.gov.
74
MISCELLANEOUS
Legal Matters
Certain legal matters in connection with the Reorganizations will be passed upon for SP Mutual Funds and SP Opportunity Funds by Willkie Farr & Gallagher LLP, counsel to SP Mutual Funds and SP Opportunity Funds. Willkie Farr & Gallagher, LLP will rely on the opinion of DLA Piper Rudnick Gray Cary US LLP, special Maryland counsel to SP Mutual Funds, as to certain matters of Maryland law and on the opinion of Morris, Nichols, Arsht & Tunnell LLP, special Delaware counsel to SP Opportunity Funds, as to certain matters of Delaware law. Certain legal matters in connection with the Reorganizations will be passed upon for Emerging Growth Fund by Sullivan & Cromwell LLP, counsel to Emerging Growth Fund. Sullivan & Cromwell LLP will rely on the opinion of DLA Piper Rudnick Gray Cary US LLP, special Maryland counsel to Emerging Growth Fund, as to certain matters of Maryland law. Certain tax matters in connection with the Reorganiza tions will be passed upon for each Company and SP Opportunity Funds by Shearman & Sterling LLP, special tax counsel to each Company and SP Opportunity Funds.
Independent Registered Public Accounting Firm
The audited financial statements of Emerging Growth Fund, incorporated by reference into the SAI, have been audited by KPMG LLP, independent registered public accounting firm, whose report thereon is included in the Annual Report to Shareholders of Emerging Growth Fund for the fiscal year ended October 31, 2005 (File No. 811-07811). The unaudited financial statements of Emerging Growth Fund, also incorporated by reference into the SAI, are included in the Semi-Annual Report to Shareholders of Emerging Growth Fund for the six-month period ended April 30, 2006 (File No. 811-07811).
The audited financial statements of Mid-Cap Growth Fund, incorporated by reference into the SAI, have been audited by KPMG LLP, independent registered public accounting firm, whose report thereon is included in the Annual Report to Shareholders of Mid-Cap Growth Fund for the fiscal year ended October 31, 2005 (File No. 811-08085). The unaudited financial statements of Mid-Cap Fund, also incorporated by reference into the SAI, are included in the Semi-Annual Report to Shareholders of Mid-Cap Growth Fund for the six-month period ended April 30, 2006 (File No. 811-08085).
The audited financial statements of New Era Growth Fund, incorporated by reference into the SAI, have been audited by KPMG LLP, independent registered public accounting firm, whose report thereon is included in the Annual Report to Shareholders of New Era Growth Fund for the fiscal year ended February 28, 2006 (File No. 811-09805).
Notice to Banks, Broker-Dealers and Voting Trustees and Their Nominees
Please advise Mid-Cap Growth Fund and New Era Growth Fund care of Prudential Investment Management Services LLC, Gateway Center Three, 100 Mulberry Street, 14th Floor, Newark, New Jersey 07102, whether other persons are beneficial owners of shares for which proxies are being solicited and, if so, the number of copies of this Prospectus/Proxy Statement you wish to receive in order to supply copies to the beneficial owners of Target Fund shares.
SHAREHOLDER PROPOSALS
Each Company and SP Opportunity Funds are not required to hold and will not ordinarily hold annual shareholders' meetings in any year in which the election of directors is not required to be acted upon under the 1940 Act. The Boards may call special meetings of the shareholders for action by shareholder vote as required by the 1940 Act or the governing documents of the Company or SP Opportunity Funds.
Pursuant to rules adopted by the SEC, a shareholder of a Fund may submit a proposal for shareholder action for inclusion in a proxy statement relating to annual and other meetings of the shareholders of the Fund which he or she intends to introduce at such special meetings; provided, among other things, that such proposal is received
75
by the Fund at a reasonable time before a solicitation of proxies is made for such meeting. Timely submission of a proposal does not necessarily mean that the proposal will be included. Although the charter of SP Mutual Funds provides that its by-laws may delineate requirements for presenting matters at annual meetings, its by-laws do not currently do so. This generally means that shareholders of SP Mutual Funds may submit proposals from the floor of an annual meeting. However, under Maryland law, the purpose of any special meeting of shareholders must be described in the notice of such meeting so only items included in the notice for a special meeting may be considered at a special meeting of shareholders. There are no requirements regarding advance notice for shareholder proposals set forth in SP Opportunity Funds' Declaration or By-laws or the Delaware Statutory Trust Act. Under the by-laws of SP Opportunity Funds, only the business state d in the notice of the meeting shall be considered at such meeting.
The Boards of SP Mutual Funds (in the case of Mid-Cap Growth Fund) and SP Opportunity Funds (in the case of New Era Growth Fund) intends to bring before the applicable Meeting the matters set forth in the foregoing notice. The Directors do not expect any other business to be brought before the Meetings. If, however, any other matters are properly presented to the Meetings for action, it is intended that the persons named in the enclosed proxy will vote in accordance with their judgment. A shareholder executing and returning a proxy may revoke it at any time prior to its exercise by written notice of such revocation to the Secretary of the SP Mutual Funds or SP Opportunity Funds, by execution of a subsequent proxy, or by voting in person at the relevant Meeting.
76
EXHIBITS TO PROSPECTUS/PROXY STATEMENT
| Exhibits | |||||||
| A | Form of Plan of Reorganization (attached). | ||||||
| B | Prospectus for Emerging Growth Fund, dated February 27, 2006 (enclosed). | ||||||
| C | Annual Report to Shareholders of Emerging Growth Fund for the fiscal year ended October 31, 2005 (enclosed). | ||||||
| D | Semi-Annual Report to Shareholders of Emerging Growth Fund for the fiscal period ended April 30, 2006 (unaudited) (enclosed). | ||||||
77
Exhibit A
FORM OF PLAN OF REORGANIZATION
THIS PLAN OF REORGANIZATION (the "Plan") is made as of this ______ day of _____, 2007, by and among Strategic Partners Opportunity Funds ("SP Opportunity Funds"), a statutory trust organized under the laws of the State of Delaware with its principal place of business at Gateway Center Three, 100 Mulberry Street, Newark, New Jersey 07102, on behalf of Strategic Partners New Era Growth Fund ("New Era Growth Fund"), a series of SP Opportunity Funds; Strategic Partners Mutual Funds, Inc. ("SP Mutual Funds"), a corporation organized under the laws of the State of Maryland with its principal place of business at Gateway Center Three, 100 Mulberry Street, Newark, New Jersey 07102, on behalf of Strategic Partners Mid-Cap Growth Fund ("Mid-Cap Growth Fund"), a series of SP Mutual Funds; and Jennison U.S. Emerging Growth Fund, Inc. (the "Acquiring Fund"), a corporation organized under the laws of the State of Maryland with its principal place of busin ess at Gateway Center Three, 100 Mulberry Street, Newark, New Jersey 07102. SP Opportunity Funds and SP Mutual Funds are individually referred to herein as an "Acquired Company." New Era Growth Fund and Mid-Cap Growth Fund are individually referred to herein as an "Acquired Fund" and are collectively referred to herein as the "Acquired Funds." Together, the Acquiring Fund and the Acquired Funds are referred to as the "Funds."
The Plan has been structured with the intention that the transactions contemplated hereby qualify for federal income tax purposes as a tax-free reorganization under Section 368(a) of the Internal Revenue Code of 1986, as amended (the "Code").
Each reorganization (hereinafter referred to as a "Reorganization") will consist of (i) the acquisition by the Acquiring Fund, of all of the property, assets and goodwill of the Acquired Fund and the assumption by the Acquiring Fund of all of the liabilities of the Acquired Fund, if any, in exchange solely for full and fractional shares of common stock, par value $0.01 each, of the Acquiring Fund (as defined in Section 1(b) as the "Acquiring Fund Shares"); (ii) the distribution after the Closing Date (as provided in Section 3), of Acquiring Fund Shares to the shareholders of the Acquired Fund according to their respective interests in complete liquidation of the Acquired Fund; and (iii) the dissolution of the Acquired Fund as soon as practicable after the Closing (as defined in Section 3), all upon and subject to the terms and conditions of this Plan hereinafter set forth.
The Reorganization of an Acquired Fund by the Acquiring Fund is not dependent upon the consummation of the other Reorganization of an Acquired Fund by the Acquiring Fund. For convenience, the balance of this Agreement refers only to a single Reorganization, but the terms and conditions hereof shall apply separately to each Reorganization and to the Acquired Company, Acquired Fund, and the Acquiring Fund participating therein, as applicable.
In order to consummate the Plan, the following actions shall be taken by the Acquired Company, on behalf of the relevant Acquired Fund, and by the Acquiring Fund:
1. Sale and Transfer of Assets of the Acquired Fund in Exchange for Shares of the Acquiring Fund and Assumption of the Acquired Fund's Liabilities, if any, and Liquidation and Dissolution of Acquired Fund.
(a) Subject to the terms and conditions of this Plan, and on the basis of the representations, warranties and covenants contained herein, the Acquired Company, on behalf of the relevant Acquired Fund, shall sell, assign, convey, transfer and deliver to the Acquiring Fund at the Closing all of the Acquired Fund's then existing assets, and the Acquiring Fund shall assume substantially all of the Acquired Fund's liabilities. The Acquired Fund shall also retain any and all rights that it may have over and against any person that may have accrued up to and including the close of business on the Closing Date but only to the extent any liability associated with such rights was not assumed by the Acquiring Fund.
(b) Subject to the terms and conditions of this Plan, the Acquiring Fund shall at the Closing deliver to the Acquired Company, for the benefit of the relevant Acquired Fund, the number of shares of a Class of the Acquiring Fund determined by dividing the net asset value allocable to a share of such Class of the Acquired Fund by the net asset value allocable to a share of the corresponding Class of the Acquiring Fund, and multiplying the result thereof by the number of outstanding shares of the applicable Class of the Acquired Fund, as of the close of regular trading on the New York Stock Exchange (the "NYSE") on the Closing Date, all such values to be determined in the manner
A-1
and as of the time set forth in Section 2 hereof; and assume all of the Acquired Fund's liabilities, if any, as set forth in this Section 1(b). Except as otherwise provided herein, the Acquiring Fund will assume all debts, liabilities, obligations and duties of the Acquired Fund of whatever kind or nature, whether absolute, accrued, contingent or otherwise, whether or not determinable as of the Closing Date and whether or not specifically referred to in this Plan; provided, however, that the Acquired Company agrees to utilize its best efforts to cause the Acquired Fund to discharge all of the known debts, liabilities, obligations and duties of the Acquired Fund prior to the Closing Date.
(c) As soon after the Closing Date as is conveniently practicable, but in any event within 30 days of the Closing Date, the Acquired Company, on behalf of the Acquired Fund, shall distribute pro rata to Acquired Fund shareholders of record, determined as of the close of business on the Closing Date, the Acquiring Fund Shares received by the Acquired Fund pursuant to this Section with each Acquired Fund shareholder receiving shares of the same Class or Classes of the Acquiring Fund as such shareholder holds of the Acquired Fund, and then shall terminate and dissolve. Such liquidation and distribution shall be accomplished by the establishment of accounts on the share records of the Acquiring Fund and noting in such accounts the names of the former Acquired Fund Shareholders and the types and amounts of Acquiring Fund Shares that former Acquired Fund shareholders are due based on their respective holdings of the Acquired Fund as of the close of business on the Closing Date. Fractional Acquiring Fund Shares shall be carried to the second decimal place. The Acquiring Fund shall not issue certificates representing the Acquiring Fund shares in connection with such exchange. All issued and outstanding shares of the Acquired Fund will be simultaneously cancelled on the books of the Acquired Fund.
(d) Ownership of Acquiring Fund Shares will be shown on the books of Acquiring Fund's transfer agent. Acquiring Fund Shares will be issued in the manner described in Acquiring Fund's then-effective registration statement.
(e) Any transfer taxes payable upon issuance of Acquiring Fund Shares in exchange for shares of the Acquired Fund in a name other than that of the registered holder of the shares being exchanged on the books of the Acquired Fund as of that time shall be paid by the person to whom such shares are to be issued as a condition to the registration of such transfer.
2. Valuation.
(a) The value of the Acquired Fund's assets transferred to and liabilities assumed by the Acquiring Fund (such amount, the "Net Assets") hereunder shall be computed as of the close of regular trading on the NYSE on the Closing Date (such time and date being hereinafter called the "Valuation Time") using the valuation procedures set forth in the Acquired Company's [declaration of trust/articles of incorporation] and currently effective registration statement.
(b) The net asset value of a share of the Acquiring Fund shall be determined to the second decimal point as of the Valuation Time using the valuation procedures set forth in Acquiring Fund's articles of incorporation and currently effective registration statement.
(c) The net asset value of shares of the Acquired Fund shall be determined to the second decimal point as of the Valuation Time using the valuation procedures set forth in the Acquired Company's [declaration of trust/articles of incorporation] and currently effective registration statement.
3. Closing and Closing Date.
(a) The consummation of the transactions contemplated hereby shall take place at the Closing (the "Closing"). The date of the Closing (the "Closing Date") shall be March ___, 2007, or such earlier or later date as agreed to in writing by the parties hereto. The Closing shall take place at the principal office of the Acquiring Fund or at such other place as the parties may agree. The Acquired Company, on behalf of the relevant Acquired Fund, shall have provided for delivery, as of the Closing, of the Acquired Fund's Net Assets to be transferred to the account of the Acquiring Fund at the Acquiring Fund's Custodian, ______________. Also, the Acquired Company, on behalf of the relevant Acquired Fund, shall produce at the Closing (or as soon as possible thereafter) a list of names and addresses of the shareholders of record of full and fractional shares of beneficial interest of the Acquired Fund, (the "Acquired Fund Shares") and the number of full and fractional Acquired Fund Shares owned by each such
A-2
shareholder, all as of the Valuation Time, certified by its transfer agent or by its President or Vice-President to the best of its or his or her knowledge and belief. The Acquiring Fund shall issue and deliver to the Secretary of the Acquired Company at the Closing a confirmation evidencing the Acquiring Fund Shares to be credited to the Acquired Fund's account on the Closing Date, or shall provide evidence satisfactory to the Acquired Company that the Acquiring Fund Shares have been registered in all account books of the Acquiring Fund in such manner as the Acquired Company, on behalf of the relevant Acquired Fund, may request. At the Closing, each party shall deliver to the other such bills of sale, checks, assignments, share certificates, receipts and other documents as such other party or its counsel may reasonably request to effect the transactions contemplated by this Plan.
(b) In the event that immediately prior to the Valuation Time (a) the NYSE or other primary exchange is closed to trading or trading thereon is restricted or (b) trading or the reporting of trading on the NYSE or other primary exchange or elsewhere is disrupted so that accurate appraisal of the value of the Net Assets of the Acquired Fund and of the net asset value per share of the Acquiring Fund or the Acquired Fund is impracticable, the Closing Date shall be postponed until the first business day after the date when such trading shall have been fully resumed and such reporting shall have been restored.
4. Representations and Warranties to the Acquiring Fund by the Acquired Company, on behalf of the relevant Acquired Fund. The Acquired Company, on behalf of the relevant Acquired Fund, makes the following representations and warranties to the Acquiring Fund, for the benefit of the Acquiring Fund:
(a) [The Acquired Fund is a series of the Acquired Company, a statutory trust duly organized under the laws of the State of Delaware and validly existing under the laws of that jurisdiction and in good standing]. [The Acquiring Fund is a series of the Acquired Company, a corporation duly organized under the laws of the State of Maryland and validly existing under the laws of that jurisdiction and in good standing with the State Department of Assessments and Taxation of the State of Maryland (the "SDAT")]. The Acquired Company is duly registered under the Investment Company Act of 1940, as amended ("1940 Act") as an open-end, management investment company and all of the Acquired Fund Shares sold have been sold pursuant to an effective registration statement filed under the Securities Act of 1933, as amended (the "1933 Act"). The Acquired Fund has been duly established in accordance with the Acquired Company's [declaration of trust/ articles of incorporation] as a separate series of the Acquired Company.
(b) [The financial statements appearing in the Acquired Company's Annual Report to Shareholders of the Acquired Fund for the fiscal year ended February 28, 2006 (copies of which have been furnished to the Acquiring Fund) have been audited by KPMG LLP, fairly present the financial position of the Acquired Fund as of such date and the results of its operations for the year then ended in conformity with U.S. generally accepted accounting principles applied on a consistent basis]. [The financial statements appearing in the Acquired Company's Annual Report to Shareholders of the Acquired Fund for the fiscal year ended October 31, 2005 (copies of which have been furnished to the Acquiring Fund) have been audited by KPMG LLP, fairly present the financial position of the Acquired Fund as of such date and the results of its operations for the year then ended in conformity with U.S. generally accepted accounting principles applied on a cons istent basis].
(c) [If available at or prior to the Closing Date, the unaudited financial statements appearing in the Acquired Company's Semi-Annual Report to Shareholders of the Acquired Fund for the six-month period ended April 30, 2006 (copies of which will be furnished to the Acquiring Fund), and the unaudited financial statements appearing therein fairly present the financial position of the Acquired Fund and the results of operations and changes in net assets as of such date, in conformity with U.S. generally accepted accounting principles].
(d) The Acquired Company has the necessary statutory trust and authority to conduct the Acquired Fund's business as such business is now being conducted.
(e) The Acquired Company is not a party to or obligated under any provision of the Acquired Company's [declaration of trust/articles of incorporation] or by-laws or any contract or any other commitment or obligation, and is not subject to any order or decree, that would be violated by its execution of or performance under this Plan.
(f) The Acquired Fund does not have any unamortized or unpaid organizational fees or expenses.
A-3
(g) The Acquired Fund has elected to be treated as a regulated investment company (a "RIC") for federal income tax purposes under Part I of Subchapter M of the Internal Revenue Code of 1986, as amended (the "Code") and the Acquired Fund has qualified as a RIC for each taxable year since its inception, and will so qualify as of the Closing Date. The consummation of the transactions contemplated by this Plan will not cause the Acquired Fund to fail to satisfy the requirements of Subchapter M of the Code.
(h) The Acquired Fund, or its agents, (i) holds a valid Form W-8BEN, Certificate of Foreign Status of Beneficial Owner for United States Withholding (or other appropriate series of Form W-8, as the case may be), or Form W-9, Request for Taxpayer Identification Number and Certification, for each Acquired Fund shareholder of record, which Form W-8 or Form W-9 can be associated with reportable payments made by the Acquired Fund to such shareholder, and/or (ii) has otherwise timely instituted the appropriate backup withholding procedures with respect to such shareholder as provided by Section 3406 of the Code and the regulations thereunder.
(i) At the time the Registration Statement (as defined in Section 7(g)) becomes effective, at the time of the meeting of the shareholders of the Acquired Fund and on the Closing Date, the Proxy Statement of the Acquired Fund, the Prospectus of the Acquiring Fund and the Statement of Additional Information of the Acquiring Fund to be included in the Registration Statement and the Registration Statement (i) will comply in all material respects with the applicable provisions of the 1933 Act, Securities Exchange Act of 1934, as amended (the "1934 Act") and the 1940 Act and the rules and regulations promulgated thereunder, and (ii) will not contain any untrue statement of a material fact or omit to state a material fact required to be stated therein, in light of the circumstances under which they were made, or necessary to make the statements therein not misleading; provided, however, that the representations and warranties in this par agraph 4(i) shall not apply to statements in or omissions from the Proxy Statement and Registration Statement made in reliance upon and in conformity with information furnished by the Acquiring Fund for use therein.
5. Representations and Warranties to the Acquired Company, for the benefit of the relevant Acquired Fund, by the Acquiring Fund.
The Acquiring Fund makes the following representations and warranties to the Acquired Company, for the benefit of the relevant Acquired Fund:
(a) The Acquiring Fund is a corporation duly organized under the laws of the State of Maryland and validly existing under the laws of that jurisdiction and in good standing with the State Department of Assessments and Taxation of the State of Maryland (the "SDAT"). The Acquiring Fund is duly registered under the 1940 Act as an open-end, management investment company and all of the Acquiring Fund Shares sold have been sold pursuant to an effective registration statement filed under the 1933 Act.
(b) The Acquiring Fund is authorized to issue __________ shares of common stock, par value $0.01 each of Acquiring Fund Shares, each outstanding share of which is duly and validly authorized, issued and outstanding, fully paid, non-assessable, freely transferable and has voting rights.
(c) At the Closing, the Acquiring Fund Shares will be duly authorized, validly issued, fully paid and non-assessable and, under the under the Acquiring Fund's articles of incorporation and by-laws, no shareholder of the Acquiring Fund will have any pre-emptive right to subscribe therefore or purchase such shares, and such shares will be eligible for offering to the public in those states of the United States and jurisdictions in which the shares of the Acquired Fund are presently eligible for offering to the public, and there are a sufficient number of Acquiring Fund Shares registered under the 1933 Act to permit the transfers contemplated by this Plan to be consummated.
(d) The financial statements appearing in the Acquiring Fund's Annual Report to Shareholders of the Acquiring Fund for the fiscal year ended October 31, 2006 (copies of which have been furnished to the Acquired Company) have been audited by KPMG LLP and fairly present the financial position of the Acquiring Fund as of such date and the results of its operations for the year then ended in conformity with U.S. generally accepted accounting principles applied on a consistent basis.
A-4
(e) If available at or prior to the Closing Date, the unaudited financial statements appearing in the Acquiring Fund's Semi-Annual Report to Shareholders of the Acquiring Fund for the six-month period ended April 30, 2006 (copies of which will be furnished to the Acquired Company), fairly present the financial position of the Acquiring Fund and the results of operations and changes in net assets as of the respective date indicated, in conformity with U.S. generally accepted accounting principles.
(f) The Acquiring Fund has the necessary corporate power and authority to conduct the Acquiring Fund's business as such business is now being conducted.
(g) The Acquiring Fund is not a party to or obligated under any provision of the Acquiring Fund's articles of incorporation or by-laws or any contract or any other commitment or obligation, and is not subject to any order or decree, that would be violated by its execution of or performance under this Plan.
(h) The Acquiring Fund has elected to be treated as a RIC for federal income tax purposes under Subchapter M of the Code and the Acquiring Fund has qualified as a RIC for each taxable year since its inception, and will so qualify as of the Closing Date. The consummation of the transactions contemplated by this Plan will not cause the Acquiring Fund to fail to satisfy the requirements of Subchapter M of the Code.
(i) At the time the Registration Statement (as defined in Section 7(g)) becomes effective, at the time of the meeting of the shareholders of the Acquired Fund and on the Closing Date, the Proxy Statement of the Acquired Fund, the Prospectus of the Acquiring Fund and the Statement of Additional Information of the Acquiring Fund to be included in the Registration Statement and the Registration Statement (i) will comply in all material respects with the applicable provisions of the 1933 Act, the 1934 Act and the 1940 Act and the rules and regulations promulgated thereunder, and (ii) will not contain any untrue statement of a material fact or omit to state a material fact required to be stated therein, in light of the circumstances under which they were made, or necessary to make the statements therein not misleading; provided, however, that the representations and warranties in this paragraph 5(i) shall not apply to statements in or omissions from the Proxy Statement and Registration Statement made in reliance upon and in conformity with information furnished by the Acquired Company, on behalf of the relevant Acquired Fund, for use therein.
6. Representations and Warranties by the Acquired Company, on behalf of the relevant Acquired Fund, and the Acquiring Fund.
The Acquired Company, on behalf of the relevant Acquired Fund, and the Acquiring Fund make the following representations and warranties.
(a) The statement of assets and liabilities to be created by the Acquired Company as of the Valuation Time for the purpose of determining the number of Acquiring Fund Shares to be issued pursuant to Section 1 of this Plan will accurately reflect the Net Assets in the case of the Acquired Fund and the net asset value and outstanding shares of each Fund, as of such date, in conformity with generally accepted accounting principles applied on a consistent basis.
(b) At the Closing, each Fund will have good and marketable title to all of the securities and other assets shown on the statement of assets and liabilities referred to in Section 6(a) above, free and clear of all liens or encumbrances of any nature whatsoever, except for such imperfections of title or encumbrances as do not materially detract from the value or use of the assets subject thereto, or materially affect title thereto.
(c) Except as may be disclosed in the currently effective prospectuses of the Funds, there is no material suit, judicial action, or legal or administrative proceeding pending or threatened against the Funds.
(d) There are no known actual or proposed deficiency assessments with respect to any taxes payable by the Funds.
(e) The execution, delivery and performance of this Plan have been duly authorized by all necessary action of the Board of Directors/Trustees of the Acquired Company and the Board of Directors of the Acquiring Fund and this Plan constitutes a valid and binding obligation enforceable against the Acquired Company and the Acquiring Fund in accordance with its terms.
A-5
(f) The Acquired Company and the Acquiring Fund anticipate that consummation of this Plan will not cause the applicable Fund to fail to comply with the requirements of Subchapter M of the Code for Federal income taxation as a RIC at the end of the applicable fiscal year.
7. Intentions of the Acquired Company, on behalf of the relevant Acquired Fund, and the Acquiring Fund.
(a) The Acquired Company intends to operate the Acquired Fund's business as presently conducted between the date hereof and the Closing Date. The Acquiring Fund intends to operate the Acquiring Fund's business as presently conducted between the date hereof and the Closing Date.
(b) The Acquired Company intends that the Acquired Fund will not acquire any Acquiring Fund Shares for the purpose of making distributions thereof to anyone other than the Acquired Fund's shareholders.
(c) The Acquired Company, on behalf of the relevant Acquired Fund, intends, if the reorganization is consummated, to liquidate and dissolve the Acquired Fund.
(d) The Acquired Company and the Acquiring Fund intend that, by the time of Closing, each Fund's Federal and other tax returns and reports required by law to be filed on or before such date shall have been filed, and all Federal and other taxes shown as due on said returns and reports shall have been paid.
(e) At the Closing, the Acquired Company, on behalf of the relevant Acquired Fund, intends to have available a copy of the shareholder ledger accounts, certified by the Acquired Company's transfer agent or its President or a Vice-President to the best of its or his or her knowledge and belief, for all the shareholders of record of the Acquired Fund as of the Valuation Time who are to become shareholders of the Acquiring Fund as a result of the transfer of assets and the assumption of liabilities that are the subject of this Plan.
(f) The Acquired Company intends to mail to each shareholder of record of the Acquired Fund entitled to vote at the meeting of its shareholders at which action on this Plan is to be considered, in sufficient time to comply with requirements as to notice thereof, a Combined Proxy Statement and Prospectus that complies in all material respects with the applicable provisions of Section 14(a) of the 1934 Act, and Section 20(a) of the 1940 Act, and the rules and regulations, respectively, thereunder.
(g) The Acquiring Fund covenants to file with the U.S. Securities and Exchange Commission (the "SEC") a registration statement on Form N-14 under the 1933 Act relating to the Acquiring Fund Shares issuable hereunder (including any supplement or amendment thereto, the "Registration Statement"), and will use its best efforts to provide that the Registration Statement becomes effective as promptly as practicable and remains effective through the time of Closing. At the time the Registration Statement becomes effective, at the time of the meeting of the shareholders of the Acquired Fund, and on the Closing Date, the Proxy Statement of the Acquired Fund, the Prospectus of the Acquiring Fund and the Statement of Additional Information of the Acquiring Fund to be included in the Registration Statement (collectively, "Proxy Statement"), and the Registration Statement will: (i) comply in all material respects with the applicable provisions of the 1933 Act, the 1934 Act and the 1940 Act, and the rules and regulations promulgated thereunder; and (ii) not contain any untrue statement of a material fact or omit to state a material fact required to be stated therein or necessary in order to make the statements made therein in the light of the circumstances under which they were made, not misleading.
(h) The Acquired Company intends to call a meeting of the shareholders of the Acquired Fund to consider and act upon this Plan and to use all reasonable efforts to obtain approval of the transactions contemplated hereby (including the determinations of its Board of Directors/Trustees as set forth in Rule 17a-8(a) under the 1940 Act).
(i) The Acquired Company intends that it will, from time to time, as and when requested by the Acquiring Fund execute and deliver or cause to be executed and delivered, all such assignments and other instruments, and will take or cause to be taken such further action, as the Acquiring Fund may deem necessary or desirable in order to vest in and confirm to the Acquiring Fund title to and possession of all the Net Assets to be sold, assigned, transferred and delivered hereunder and otherwise to carry out the intent and purpose of this Plan.
A-6
(j) The Acquiring Fund intends to use all reasonable efforts to obtain the approvals and authorizations required by the 1933 Act, the 1940 Act (including the determinations of its Board of Directors as set forth in Rule 17a-8(a) thereunder) and such of the state Blue Sky or securities laws as it may deem appropriate in order to continue its operations after the Closing Date.
(k) The Acquiring Fund intends that it will, from time to time, as and when requested by the Acquired Company, for the benefit of the relevant Acquired Fund, execute and deliver or cause to be executed and delivered all such assignments and other instruments, and will take or cause to be taken such further action, as the Acquired Company may deem necessary or desirable in order to (i) vest in and confirm to the Acquired Fund title to and possession of all the Acquiring Fund Shares to be transferred to the shareholders of the Acquired Fund pursuant to this Plan; (ii) assume all of the liabilities of the Acquired Fund in accordance with this Plan; and (iii) otherwise to carry out the intent and purpose of this Plan.
8. Conditions Precedent to be Fulfilled by the Acquired Company, on behalf of the relevant Acquired Fund, and the Acquiring Fund.
The consummation of the Plan with respect to the Acquiring Fund and the Acquired Fund shall be subject to the following conditions:
(a) That (i) all the representations and warranties contained herein concerning the Funds shall be true and correct as of the Closing, with the same effect as though made as of and at such date; (ii) performance of all obligations required by this Plan to be performed on or on behalf of the Funds shall occur prior to the Closing; and (iii) the President or a Vice President and the Secretary or equivalent officer of each of the Acquired Company and the Acquiring Fund shall execute a certificate to the foregoing effect.
(b) That the form of this Plan shall have been adopted and approved by the appropriate action of the Board of Directors/Trustees of the Acquired Company, on behalf of the relevant Acquired Fund, and the Board of Directors of the Acquiring Fund.
(c) That the SEC shall not have issued an unfavorable management report under Section 25(b) of the 1940 Act or instituted or threatened to institute any proceeding seeking to enjoin consummation of the Plan under Section 25(c) of the 1940 Act. And, further, no other legal, administrative or other proceeding shall have been instituted or to the best of either the Acquired Company's or the Acquiring Fund's knowledge have been threatened that would materially and adversely affect the business or financial condition of the applicable Fund, would prohibit the transactions contemplated hereby or would adversely affect the ability of the applicable Fund to consummate the transactions contemplated hereby.
(d) That the Plan contemplated hereby shall have been adopted and approved by the appropriate action of the shareholders of the Acquired Fund at an annual or special meeting or any adjournment thereof.
(e) That a distribution or distributions shall have been declared for each Fund, prior to the Closing Date that, together with all previous distributions, shall have the effect of distributing to shareholders of each Fund (i) all of its ordinary income and all of its capital gain net income, if any, for the period from the close of its last fiscal year to the Valuation Time and (ii) any undistributed ordinary income and capital gain net income from any prior period. Capital gain net income has the meaning assigned to such term by Section 1222(9) of the Code.
(f) The Acquired Company, for the benefit of the relevant Acquired Fund, shall have received on the Closing Date a favorable opinion from (i) DLA Piper Rudnick Gray Cary USA, special Maryland counsel to the Acquiring Fund, with respect to items in this section that relate to matters of Maryland law, and (ii) Willkie Farr & Gallagher LLP, counsel to the Acquiring Fund, with respect to certain other items in this section, each dated as of the Closing Date, to the effect that:
(1) The Acquiring Fund is a corporation duly incorporated and validly existing under the laws of the State of Maryland and in good standing with the SDAT with requisite corporate power under its charter to own all of its properties and assets and, to the knowledge of such counsel, to carry on its business as described in its current prospectus.
A-7
(2) This Plan has been duly authorized, executed and, to the knowledge of such counsel, delivered by the Acquiring Fund and, assuming due authorization, execution and delivery of the Plan by the Acquired Company, on behalf of the relevant Acquired Fund, is a valid and legally binding obligation of the Acquiring Fund and the Acquiring Fund, enforceable against the Acquiring Fund in accordance with its terms, subject to bankruptcy, insolvency, fraudulent transfer, reorganization, moratorium and similar laws of general applicability relating to or affecting creditors' rights and to general equity principles, provided that such counsel may state that they express no opinion as to the validity or enforceability of any provision regarding choice of Maryland law to govern this Plan.
(3) When the Acquiring Fund shares to be distributed to Acquired Fund shareholders under the Plan are issued, sold and delivered, in an amount not to exceed the then authorized number of shares of common stock, par value $.01 per share, as contemplated by the Plan for the consideration stated in the Plan, which shall in each event be at least equal to the net asset value and par value per share, they will be validly issued, fully paid and non-assessable, and no shareholder of Acquiring Fund will have any pre-emptive rights under Maryland law to subscription or purchase in respect thereof.
(4) The execution and delivery of the Plan did not, and the performance of this Plan, by the Acquiring Fund of its obligations hereunder will not violate any provision of the Acquiring Fund's charter or by-laws, or result in a default or a breach of (a) the Management Agreement, (b) the Custodian Contract, (c) the Distribution Agreement, and (d) the Transfer Agency and Service Agreement, each as defined in the Acquiring Fund's currently effective registration statement, except where such violation, default or breach would not have a material adverse effect on the Acquiring Fund.
(5) To the knowledge of such counsel and without independent inquiry or investigation, no consent, approval, authorization, filing or order of any court or governmental authority is required to be obtained by the Acquiring Fund under the federal laws of the United States and the laws of the State of Maryland for the consummation by the Acquiring Fund of the transactions contemplated by the Agreement, except such as have been obtained under the 1933 Act, the 1934 Act and the 1940 Act, and such as may be required under state securities laws.
(6) The Acquiring Fund has been registered with the SEC as an investment company, and, to the knowledge of such counsel without independent inquiry or investigation, no order has been issued or proceeding instituted to suspend such registration.
(7) To the knowledge of such counsel and without independent inquiry or investigation, no litigation or government proceeding has been instituted or threatened against the Acquiring Fund or the Acquiring Fund, that would be required to be disclosed in the Acquiring Fund's registration statement on Form N-1A and is not so disclosed.
In giving the opinions set forth above, counsel may state that it is relying on certificates of the officers of the Acquiring Fund with regard to matters of fact, and certain certifications and written statements of governmental officials with respect to the good standing of the Acquiring Fund.
(g) The Acquiring Fund shall have received on the Closing Date a favorable opinion from (i) [DLA Piper Rudnick Gray Cary USA, special Maryland counsel to the Acquired Company, with respect to items in this section that relate to matters of Maryland law] [Morris, Nichols, Arsht & Tunnell LLP, special Delaware counsel to the Acquired Company, with respect to items in this section that relate to matters of Delaware law] and (ii) Willkie Farr & Gallagher, counsel to the Acquired Company, with respect to certain other items in this section, each dated as of the Closing Date, to the effect that:
(1) [The Acquired Company is a statutory trust duly formed, validly existing and in good standing with requisite statutory trust power under its declaration of trust and under the Delaware Statutory Trust Act (the "Delaware Act"), to own all of its properties and assets and, to carry on its business as described in the current prospectus of the Acquired Fund, and the Acquired Fund has been established in accordance with the terms of the Delaware Act and the Acquired Company's declaration of trust as a
A-8
separate series of the Acquired Company]. [The Acquired Company is a corporation duly incorporated and validly existing under the laws of the State of Maryland and in good standing with the SDAT with requisite corporate power under its charter to own all of its properties and assets and, to the knowledge of such counsel, to carry on its business as described in the current prospectus of the Acquired Fund, and the Acquired Fund has been duly established in accordance with the terms of Maryland law and the Acquired Company's charter as a separate series of the Acquired Company].
(2) This Plan has been duly authorized and executed by the Acquired Company, on behalf of the relevant Acquired Fund, and, assuming delivery by the Acquired Company, on behalf of the relevant Acquired Fund, and due authorization, execution and delivery of the Plan by the Acquiring Fund is a valid and legally binding obligation of the Acquired Company and the Acquired Fund enforceable against the Acquired Fund, in accordance with its terms, subject to bankruptcy, insolvency, fraudulent transfer, reorganization, moratorium and similar laws of general applicability relating to or affecting creditors' rights and to general equity principles, provided that such counsel may state that they express no opinion as to the validity or enforceability of any provision regarding choice of Maryland law to govern this Plan;
(3) All actions required to be taken by the Acquired Company on behalf of the relevant Acquired Fund under the Acquired Company's [declaration of trust/charter], by-laws and [the Delaware Act/_______] to authorize the transactions contemplated hereby have been duly authorized by all necessary [statutory trust/corporate] action on the part of the Acquired Company on behalf of the relevant Acquired Fund.
(4) The execution and delivery of the Plan did not, and the performance of this Plan, by the Acquired Company, on behalf of the relevant Acquired Fund, of its obligations hereunder will not, violate any provision of the Acquired Company's [declaration of trust/charter] or by-laws, or result in a default or breach of (a) the Management Agreement, (b) the Custodian Contract, (c) the Distribution Agreement, and (d) the Transfer Agency and Service Agreement, each as defined in the Acquired Company's currently effective registration statement, except where such violation, default or breach would not have a material adverse effect on the Acquired Fund;
(5) To the knowledge of such counsel, no consent, approval, authorization, filing or order of any court or governmental authority is required for the consummation by the Acquired Company, on behalf of the relevant Acquired Fund, of the transactions contemplated herein, except such as have been obtained under the 1933 Act, the 1934 Act and the 1940 Act and such as may be required under state Blue Sky or securities laws as to which such counsel may state that they express no opinion;
(6) Such counsel knows of no litigation or government proceeding instituted or threatened against the Acquired Company or the relevant Acquired Fund, that would be required to be disclosed in the Acquired Company's registration statement on Form N-1A and is not so disclosed;
(7) The Acquired Company has been registered with the SEC as an investment company, and, to the knowledge of such counsel, no order has been issued or proceeding instituted to suspend such registration.
In giving the opinions set forth above, counsel may state that it is relying on certificates of the officers of the Acquired Company with regard to matters of fact, and certain certifications and written statements of governmental officials with respect to the good standing of the Acquired Company.
(h) The Acquired Company and the Acquiring Fund shall have received with respect to the Acquired Fund and the Acquiring Fund, on or before the Closing Date, an opinion of Shearman & Sterling LLP, special tax counsel to the Acquired Company and the Acquiring Fund, in form and substance satisfactory to the Acquired Company and the Acquiring Fund, substantially to the effect that, for federal income tax purposes:
(1) the transfer of the assets of the Acquired Fund in exchange solely for the Acquiring Fund Shares and the assumption by Acquiring Fund of the liabilities of the Acquired Fund, if any, as provided for in the Plan, will constitute a "reorganization" within the meaning of Section 368(a) of the Code, and the Acquired Fund and the Acquiring Fund each will be deemed to be a "party to a reorganization" within the meaning of Section 368(b) of the Code;
A-9
(2) in accordance with Sections 357 and 361 of the Code, no gain or loss will be recognized by the Acquired Fund as a result of the transfer of its assets solely in exchange for Acquiring Fund Shares and the assumption by the Acquiring Fund of the liabilities of the Acquired Fund, if any, or on the distribution of the Acquiring Fund Shares to the shareholders of the Acquired Fund, as provided for in the Plan;
(3) under Section 1032 of the Code, no gain or loss will be recognized by the Acquiring Fund on the receipt of the assets of the Acquired Fund in exchange for the Acquiring Fund Shares and the assumption by the Acquiring Fund of the liabilities of the Acquired Fund, if any, as provided for in the Plan;
(4) in accordance with Section 354(a)(1) of the Code, no gain or loss will be recognized by the shareholders of the Acquired Fund on the receipt of Acquiring Fund Shares in exchange for their shares of the Acquired Fund;
(5) in accordance with Section 362(b) of the Code, the tax basis of the Acquiring Fund in the assets of the Acquired Fund will be the same as the tax basis of such assets in the hands of the Acquired Fund immediately prior to the consummation of the transactions contemplated by the Plan;
(6) in accordance with Section 358 of the Code, immediately after the consummation of the transactions contemplated by the Plan, the tax basis of the Acquiring Fund Shares received by the shareholders of the Acquired Fund will be equal, in the aggregate, to the tax basis of their shares of the Acquired Fund surrendered in exchange therefor;
(7) in accordance with Section 1223 of the Code, the holding period for the Acquiring Fund Shares received by the shareholders of the Acquired Fund will be determined by including the period for which such shareholder held their shares of the Acquired Fund exchanged therefor; provided, that the shares of the Acquired Fund Shares were held as capital assets for federal income tax purposes;
(8) in accordance with Section 1223 of the Code, the holding period of the Acquiring Fund with respect to the assets of the Acquired Fund acquired by it in accordance with the Plan will include the period for which such assets were held by the Acquired Fund; and
(9) pursuant to Section 381(a) of the Code and regulations thereunder, the Acquiring Fund will succeed to and take into account certain tax attributes of the Acquired Fund, such as earnings and profits and method of tax accounting.
In giving the opinions set forth above, counsel may state that it is relying on certificates of the officers of the Acquiring Fund and/or the Acquired Company with regard to certain matters.
(i) The Acquiring Fund Shares to be delivered hereunder shall be eligible for such sale by the Acquiring Fund with each state commission or agency with which such eligibility is required in order to permit the Acquiring Fund Shares lawfully to be delivered to each shareholder of the Acquired Fund.
9. Fees and Expenses.
(a) Each of the Acquired Company and the Acquiring Fund represents and warrants to the other that there are no broker or finders' fees payable by it in connection with the transactions provided for herein.
(b) The expenses of entering into and carrying out the provisions of this Plan shall be borne by each Fund.
10. Termination; Postponement; Waiver; Order.
(a) Anything contained in this Plan to the contrary notwithstanding, this Plan may be terminated and abandoned at any time (whether before or after approval thereof by the shareholders of the Acquired Fund) prior to the Closing or the Closing may be postponed by the Acquired Company, on behalf of an Acquired Fund, or by the Acquiring Fund by resolution of the relevant Board of Directors/Trustees, if circumstances develop that, in the opinion of either Board, make proceeding with the Plan inadvisable.
A-10
(b) In the event of termination of this Plan pursuant to the provisions hereof, the same shall become void and have no further effect with respect to the Acquiring Fund or Acquired Fund, and none of the Acquired Company, the Acquiring Fund, or the Acquired Fund, nor the directors/trustees, officers, agents or shareholders shall have any liability in respect of this Plan.
(c) At any time prior to the Closing, any of the terms or conditions of this Plan may be waived by the party who is entitled to the benefit thereof by action taken by the relevant Board of Directors/Trustees if, in the judgment of such Board of Directors/Trustees, such action or waiver will not have a material adverse effect on the benefits intended under this Plan to its shareholders, on behalf of whom such action is taken.
(d) The respective representations and warranties contained in Sections 4 and 6 hereof shall expire with and be terminated by the Plan, and none of the Acquired Company, the Acquiring Fund, any of their respective officers, directors/trustees, agents or shareholders, any of the Funds, or their respective shareholders shall have any liability with respect to such representations or warranties after the Closing. This provision shall not protect any officer, director/trustee, agent or shareholder of either the Acquired Company or the Acquiring Fund against any liability to the entity for which that officer, director/trustee, agent or shareholder so acts or to any of the Acquired Company's or the Acquiring Fund's shareholders to which that officer, director/trustee, agent or shareholder would otherwise be subject by reason of willful misfeasance, bad faith, gross negligence, or reckless disregard of the duties in the conduct of such o ffice.
(e) If any order or orders of the SEC with respect to this Plan shall be issued prior to the Closing and shall impose any terms or conditions that are determined by action of the Board of Directors/Trustees of the Acquired Company, on behalf of the relevant Acquired Fund, or the Board of Directors of the Acquiring Fund to be acceptable, such terms and conditions shall be binding as if a part of this Plan without further vote or approval of the shareholders of the Acquired Fund, unless such terms and conditions shall result in a change in the method of computing the number of Acquiring Fund Shares to be issued to the Acquired Fund in which event, unless such terms and conditions shall have been included in the proxy solicitation material furnished to the Acquired Fund shareholders prior to the meeting at which the transactions contemplated by this Plan shall have been approved, this Plan shall not be consummated and shall terminate unless the Acquired Company, on behalf of the relevant Acquired Fund, shall promptly call a special meeting of shareholders at which such conditions so imposed shall be submitted for approval.
11. Headings; Counterparts.
(a) The paragraph headings contained in this Plan are for reference purposes only and shall not affect in any way the meaning or interpretation of the Plan.
(b) This Plan may be executed in any number of counterparts, each of which will be deemed an original.
12. Agreement an Obligation Only of the Funds, and Enforceable Only Against Assets of the Funds.
The Acquired Company and the Acquiring Fund acknowledge that it must look, and agrees that it shall look, solely to the assets of the relevant Fund for the enforcement of any claims arising out of or based on the obligations of the Acquired Company or the Acquiring Fund hereunder, and in particular that none of the assets of the Acquired Company or the Acquiring Fund, other than the portfolio assets of the relevant Fund, may be resorted to for the enforcement of any claim based on the obligations of a Fund hereunder.
13. Entire Plan and Amendments; Survival of Warranties.
This Plan embodies the entire agreement of the Acquired Company, on behalf of the relevant Acquired Fund, and the Acquiring Fund and there are no agreements, understandings, restrictions, or warranties between the parties other than those set forth herein or herein provided for. This Plan may be amended only in a writing signed by the Acquired Company, on behalf of the relevant Acquired Fund, and the Acquiring Fund. This Plan shall bind and inure to the benefit of the parties and their respective successors and assigns and neither this Plan nor any interest herein may be assigned without the prior written consent of the Acquired Company, on behalf of the relevant Acquired Fund, and the Acquiring Fund. Nothing herein expressed or implied is intended or shall be construed to confer upon or give any person, firm or corporation other than the parties and their respective successors, and assigns any rights or remedies under or by any reason of th is plan. The representations, warranties and covenants contained in this Plan or in any document delivered pursuant hereto or in connection herewith shall survive the consummation of the transactions contemplated hereunder.
A-11
14. Notices.
Any notice, report, demand or other communication required or permitted by any provision of this Plan shall be in writing and shall be deemed to have been given if hand delivered or mailed, first class postage prepaid, addressed to the Acquiring Fund at Gateway Center Three, 100 Mulberry Street, Newark, New Jersey 07102, Attention: Secretary; and to the Acquired Company at Gateway Center Three, 100 Mulberry Street, Newark, New Jersey 07102, Attention: Secretary.
15. Governing Law.
This Plan shall be governed by and construed in accordance with the laws of the State of Maryland, provided that, in the case of any conflict between such laws and the federal securities laws, the latter shall govern.
IN WITNESS WHEREOF, Strategic Partners Opportunity Funds, on behalf of Strategic Partners New Era Growth Fund; Strategic Partners Mutual Funds, Inc., on behalf of Strategic Partners Mid-Cap Growth Fund, and Jennison U.S. Emerging Growth Fund, Inc., have executed this Plan by their respective duly authorized officers, all as of the date and year first-above written.
| STRATEGIC PARTNERS OPPORTUNITY FUNDS, on behalf of Strategic Partners New Era Growth Fund | |||||||
| Attest: | By: Name: Title: | ||||||
| STRATEGIC PARTNERS MUTUAL FUNDS, INC. on behalf of Strategic Partners Mid-Cap Growth Fund | |||||||
| Attest: | By: Name: Title: | ||||||
| JENNISON U.S. EMERGING GROWTH FUND, INC. | |||||||
| Attest: | By: Name: Title: | ||||||
A-12
Exhibit B
PROSPECTUS DATED FEBRUARY 27, 2006
The Prospectus for Emerging Growth Fund, dated February 27, 2006, is part of this Prospectus/Proxy Statement and will be included in the proxy solicitation mailing to shareholders.
B-1
Exhibit C
ANNUAL REPORT DATED OCTOBER 31, 2005
The Annual Report to Shareholders of Emerging Growth Fund for the fiscal year ended October 31, 2005, is incorporated by reference into this Prospectus/Proxy Statement and will be included in the proxy solicitation mailing to shareholders.
C-1
Exhibit D
SEMI-ANNUAL REPORT DATED APRIL 30, 2006
The Semi-Annual Report to Shareholders of Emerging Growth Fund for the fiscal period ended April 30, 2006, is incorporated by reference into this Prospectus/Proxy Statement and will be included in the proxy solicitation mailing to shareholders.
D-1
TABLE OF CONTENTS
| 2 | Summary | ||||||
| 3 | The Proposals | ||||||
| 3 | Shareholder Voting | ||||||
| 4 | Comparisons of Important Features | ||||||
| 4 | Investment Objectives and Principal Investment Policies of the Funds | ||||||
| 6 | Comparison of Other Investment Policies | ||||||
| 8 | Investment Restrictions | ||||||
| 9 | Risks of Investing in the Funds | ||||||
| 11 | Federal Income Tax Considerations | ||||||
| 12 | Forms of Organization | ||||||
| 13 | Shareholder Meetings | ||||||
| 15 | Amendments to Charter | ||||||
| 15 | Amendment of By-Laws | ||||||
| 15 | Board of Directors | ||||||
| 16 | Liability of Shareholders | ||||||
| 17 | Termination and Dissolution | ||||||
| 17 | Management of the Funds | ||||||
| 24 | Distribution Plan | ||||||
| 25 | Valuation | ||||||
| 26 | Portfolio Holdings | ||||||
| 27 | Frequent Purchases and Redemptions of Fund Shares | ||||||
| 29 | Purchases, Redemptions, Exchanges and Distributions | ||||||
| 34 | SP Mutual Funds Share Class Designations | ||||||
| 34 | Fees and Expenses | ||||||
| 51 | Expense Examples | ||||||
| 57 | Performance of the Funds | ||||||
| 61 | Reasons for the Reorganizations | ||||||
| 63 | Information About the Reorganizations | ||||||
| 63 | Closing | ||||||
| 64 | Expenses Resulting from the Reorganizations | ||||||
| 64 | Tax Consequences of the Reorganizations | ||||||
| 65 | Characteristics of Emerging Growth Fund Shares | ||||||
| 66 | Capitalization | ||||||
| 72 | Voting Information | ||||||
| 72 | Required Vote | ||||||
| 73 | How to Vote | ||||||
| 73 | Revocation of Proxies | ||||||
| 73 | Solicitation of Voting Instructions | ||||||
| 74 | Principal Holders of Shares | ||||||
| 74 | Additional Information | ||||||
| 75 | Miscellaneous | ||||||
| 75 | Legal Matters | ||||||
| 75 | Independent Registered Public Accounting Firm | ||||||
| 75 | Notice to Banks, Broker-Dealers and Voting Trustees and their Nominees | ||||||
| 75 | Shareholder Proposals | ||||||
| 77 | Exhibits to Prospectus/Proxy Statement | ||||||
| A-1 | Exhibit A – Form of Plan of Reorganization (attached) | ||||||
| B-1 | Exhibit B – Prospectus, dated February 27, 2006, for Emerging Growth Fund (enclosed) | ||||||
| C-1 | Exhibit C – Annual Report to Shareholders of Emerging Growth Fund for the fiscal year ended October 31, 2005 (enclosed) | ||||||
| D-1 | Exhibit D – Semi-Annual Report to Shareholders of Emerging Growth Fund for the fiscal period ended April 30, 2006 (enclosed) | ||||||
STATEMENT OF ADDITIONAL INFORMATION
FOR
JENNISON U.S. EMERGING GROWTH FUND, INC.
Dated September , 2006
Acquisition of the Net Assets of
Strategic Partners Mid-Cap Growth Fund,
a series of Strategic Partners Mutual Funds, Inc.
and
Strategic Partners New Era Growth Fund,
a series of Strategic Partners Opportunity Funds
By and in exchange for shares of
Jennison U.S. Emerging Growth Fund, Inc.
This Statement of Additional Information (SAI) relates specifically to the proposed delivery of substantially all of the assets of Strategic Partners Mid-Cap Growth Fund (SP Mid-Cap Growth Fund), a series of Strategic Partners Mutual Funds, Inc. (SP Mutual Funds), and Strategic Partners New Era Growth Fund (SP New Era Growth Fund), a series of Strategic Partners Opportunity Funds (SP Opportunity Funds), to Jennison U.S. Emerging Growth Fund, Inc. (Emerging Growth Fund), and the assumption of the liabilities of Mid-Cap Growth Fund and New Era Growth Fund by Emerging Growth Fund, solely in exchange for shares of Emerging Growth Fund (each, a Reorganization and together, the Reorganizations). This SAI contains information relating to the Reorganizations.
This SAI consists of this Cover Page, Emerging Growth Fund’s Statement of Additional Information, dated February 27, 2006, and the unaudited pro forma financial statements for SP Mid-Cap Growth Fund, SP New Era Growth Fund, Emerging Growth Fund, and the pro forma Emerging Growth Fund after giving effect to the proposed Reorganizations.
This SAI is not a Prospectus; you should read this SAI in conjunction with the Proxy Statement and Prospectus dated September [ ], 2006, relating to the Reorganizations. You can request a copy of the Proxy Statement and Prospectus by calling 1-800-225-1852 or by writing to Emerging Growth Fund at Gateway Center Three, 100 Mulberry Street, Newark, NJ 07102.
The Securities and Exchange Commission maintains a web site (http://www.sec.gov) that contains the prospectus and statement of additional information of SP Mid-Cap Growth Fund, SP New Era Growth Fund, and Emerging Growth Fund, other materials incorporated by reference herein, and other information regarding SP Mid-Cap Growth Fund, SP New Era Growth Fund, Emerging Growth Fund, SP Mutual Funds, and SP Opportunity Funds.
TABLE OF CONTENTS
| Page |
Attachment to SAI | S-2 |
Pro-Forma Financial Statements for the Reorganizations | F-1 |
Pro-Forma Portfolio of Investments for the Reorganizations (unaudited) | F-2 |
Pro-Forma Statement of Assets and Liabilities for the Reorganizations (unaudited) | F-7 |
Pro-Forma Statement of Operations for the Reorganizations (unaudited) | F-8 |
Notes to Pro-Forma Financial Statements for the Reorganizations (unaudited) | F-9 |
ATTACHMENT TO SAI
Emerging Growth Fund’s Statement of Additional Information, dated February 27, 2006, is incorporated by reference herein and is part of this SAI and will be provided to all shareholders requesting this SAI.
S-2
PRO FORMA FINANCIAL STATEMENTS FOR THE REORGANIZATIONS (UNAUDITED)
The following tables set forth, as of June 30, 2006, the unaudited pro forma Portfolio of Investments for the Reorganizations, the unaudited pro forma Statements of Assets and Liabilities for the Reorganizations, and the unaudited pro forma Statement of Operations for the Reorganizations.
F-1
PRO FORMA PORTFOLIO OF INVESTMENTS FOR THE MERGER OF SP MID CAP GROWTH FUND FUND INTO JENNISON U.S. EMERGING GROWTH FUND
AS OF JUNE 30, 2006
(Unaudited)
|
|
|
|
|
| Pro-forma |
|
|
|
|
|
|
|
|
| Pro-forma |
| |
|
|
|
|
|
| combined |
|
|
|
|
|
|
|
|
| combined |
| |
SP Mid Cap |
| Emerging |
| Pro-forma |
| Emerging |
|
|
| SP Mid Cap |
| Emerging |
| Pro-forma |
| Emerging |
| |
Growth |
| Growth |
| adjustments |
| Growth |
|
|
| Growth |
| Growth |
| adjustments |
| Growth |
| |
Shares |
| Shares |
| Shares |
| Shares |
|
|
| Value |
| Value |
| Value |
| Value |
| |
|
|
|
|
|
|
|
| LONG-TERM INVESTMENTS |
| 99.5 | % | 96.1 | % |
|
| 96.6 | % | |
|
|
|
|
|
|
|
| COMMON STOCKS |
|
|
|
|
|
|
|
|
| |
|
|
|
|
|
|
|
|
|
|
|
|
|
|
|
|
|
| |
|
|
|
|
|
|
|
| Advertising |
| 2.0 | % |
|
|
|
| 0.3 | % | |
42,450 |
|
|
|
|
| 42,450 |
| Lamar Advertising Co. |
| 2,286,357 | * (a) |
|
|
|
| $ | 2,286,357 |
|
|
|
|
|
|
|
|
|
|
|
|
|
|
|
|
|
|
| |
|
|
|
|
|
|
|
| Air Freight & Logistics |
|
|
| 0.7 | % |
|
| 0.6 | % | |
|
| 194,700 |
|
|
| 194,700 |
| UTI Worldwide, Inc. |
|
|
| 4,912,281 |
|
|
| 4,912,281 |
| |
|
|
|
|
|
|
|
|
|
|
|
|
|
|
|
|
|
| |
|
|
|
|
|
|
|
| Aerospace & Defense |
| 2.0 | % |
|
|
|
| 0.3 | % | |
28,584 |
|
|
|
|
| 28,584 |
| Alliant Techsystems, Inc. |
| 2,182,388 | * (a) |
|
|
|
| 2,182,388 |
| |
|
|
|
|
|
|
|
|
|
|
|
|
|
|
|
|
|
| |
|
|
|
|
|
|
|
| Audio Technology |
| 0.8 | % |
|
|
|
| 0.1 | % | |
38,100 |
|
|
|
|
| 38,100 |
| Dolby Laboratories, Inc. (Class A Stock) |
| 887,730 | * |
|
|
|
| 887,730 |
| |
|
|
|
|
|
|
|
|
|
|
|
|
|
|
|
|
|
| |
|
|
|
|
|
|
|
| Audio & Visual Equipment |
| 2.0 | % |
|
|
|
| 0.3 | % | |
26,900 |
|
|
|
|
| 26,900 |
| Harman International Industries, Inc. |
| 2,296,453 |
|
|
|
|
| 2,296,453 |
| |
|
|
|
|
|
|
|
|
|
|
|
|
|
|
|
|
|
| |
|
|
|
|
|
|
|
| Auto Parts & Related |
| 1.5 | % |
|
|
|
| 0.2 | % | |
123,700 |
|
|
|
|
| 123,700 |
| Gentex Corp. |
| 1,731,800 |
|
|
|
|
| 1,731,800 |
| |
|
|
|
|
|
|
|
|
|
|
|
|
|
|
|
|
|
| |
|
|
|
|
|
|
|
| Automotive Parts |
| 1.0 | % |
|
|
|
| 0.1 | % | |
35,500 |
|
|
|
|
| 35,500 |
| Advanced Auto Parts, Inc. |
| 1,025,950 | * |
|
|
|
| 1,025,950 |
| |
|
|
|
|
|
|
|
|
|
|
|
|
|
|
|
|
|
| |
|
|
|
|
|
|
|
| Banks |
| 1.4 | % |
|
|
|
| 0.2 | % | |
19,300 |
|
|
|
|
| 19,300 |
| Commerce Bancorp, Inc. |
| 688,431 |
|
|
|
|
| 688,431 |
| |
34,300 |
|
|
|
|
| 34,300 |
| TCF Financial Corp. |
| 907,235 |
|
|
|
|
| 907,235 |
| |
|
|
|
|
|
|
|
|
|
|
|
|
|
|
|
| 1,595,666 |
| |
|
|
|
|
|
|
|
|
|
|
|
|
|
|
|
|
|
| |
|
|
|
|
|
|
|
| Beverages |
| 2.3 | % |
|
|
|
| 0.3 | % | |
36,400 |
|
|
|
|
| 36,400 |
| Fortune Brands, Inc. |
| 2,584,764 |
|
|
|
|
| 2,584,764 |
| |
|
|
|
|
|
|
|
|
|
|
|
|
|
|
|
|
|
| |
|
|
|
|
|
|
|
| Biotechnology |
| 1.4 | % | 2.0 | % |
|
| 1.9 | % | |
|
| 335,200 |
|
|
| 335,200 |
| ImClone Systems, Inc. |
|
|
| 12,952,128 | * (b) |
|
| 12,952,128 |
| |
59,100 |
|
|
|
|
| 59,100 |
| MedImmune, Inc. |
| 1,601,610 | * |
|
|
|
| 1,601,610 |
| |
|
|
|
|
|
|
|
|
|
|
|
|
|
|
|
| 14,553,738 |
| |
|
|
|
|
|
|
|
|
|
|
|
|
|
|
|
|
|
| |
|
|
|
|
|
|
|
| Business Software & Services |
| 2.1 | % |
|
|
|
| 0.3 | % | |
35,100 |
|
|
|
|
| 35,100 |
| Cognizant Technology Solutions Corp. |
| 2,364,687 | * |
|
|
|
| 2,364,687 |
| |
|
|
|
|
|
|
|
|
|
|
|
|
|
|
|
|
|
| |
|
|
|
|
|
|
|
| Capital Markets |
| 0.8 | % | 6.1 | % |
|
| 5.3 | % | |
|
| 574,300 |
|
|
| 574,300 |
| Eaton Vance Corp. |
|
|
| 14,334,528 | (b) |
|
| 14,334,528 |
| |
|
| 166,500 |
|
|
| 166,500 |
| Lazard Ltd. (Class A Stock) |
|
|
| 6,726,600 | (b) |
|
| 6,726,600 |
| |
8,700 |
|
|
|
|
| 8,700 |
| Legg Mason, Inc. |
| 865,824 |
|
|
|
|
| 865,824 |
| |
|
| 189,500 |
|
|
| 189,500 |
| Nuveen Investments, Inc. (Class A Stock) |
|
|
| 8,157,975 |
|
|
| 8,157,975 |
| |
|
| 740,500 |
|
|
| 740,500 |
| TD Ameritrade Holding Corp. |
|
|
| 10,966,805 |
|
|
| 10,966,805 |
| |
|
|
|
|
|
|
|
|
|
|
|
|
|
|
|
| 41,051,732 |
| |
|
|
|
|
|
|
|
|
|
|
|
|
|
|
|
|
|
| |
|
|
|
|
|
|
|
| Chemicals |
|
|
| 3.4 | % |
|
| 2.9 | % | |
|
| 287,400 |
|
|
| 287,400 |
| Ecolab, Inc. |
|
|
| 11,662,692 | (b) |
|
| 11,662,692 |
| |
|
| 129,700 |
|
|
| 129,700 |
| Monsanto Co. |
|
|
| 10,919,443 |
|
|
| 10,919,443 |
| |
|
|
|
|
|
|
|
|
|
|
|
|
|
|
|
| 22,582,135 |
| |
|
|
|
|
|
|
|
|
|
|
|
|
|
|
|
|
|
| |
|
|
|
|
|
|
|
| Commercial Services & Supplies |
| 4.9 | % | 9.8 | % |
|
| 9.0 | % | |
43,400 |
|
|
|
|
| 43,400 |
| Alliance Data Systems Corp. |
| 2,552,788 | * (a) |
|
|
|
| 2,552,788 |
| |
|
| 731,300 |
|
|
| 731,300 |
| Allied Waste Industries, Inc. |
|
|
| 8,307,568 | * (b) |
|
| 8,307,568 |
| |
|
| 152,100 |
|
|
| 152,100 |
| ARAMARK Corp. (Class B Stock) |
|
|
| 5,036,031 |
|
|
| 5,036,031 |
| |
26,800 |
| 343,000 |
|
|
| 369,800 |
| ChoicePoint, Inc. |
| 1,119,436 | * | 14,327,110 | * |
|
| 15,446,546 |
| |
34,237 |
| 210,100 |
|
|
| 244,337 |
| Iron Mountain, Inc. |
| 1,279,779 | * | 7,853,538 | * |
|
| 9,133,317 |
| |
|
| 126,825 |
|
|
| 126,825 |
| Monster Worldwide, Inc. |
|
|
| 5,410,354 | * (b) |
|
| 5,410,354 |
| |
|
| 310,500 |
|
|
| 310,500 |
| Nalco Holdings Co. |
|
|
| 5,474,115 |
|
|
| 5,474,115 |
| |
|
| 177,515 |
|
|
| 177,515 |
| Paychex, Inc. |
|
|
| 6,919,535 |
|
|
| 6,919,535 |
| |
|
| 85,300 |
|
|
| 85,300 |
| Robert Half International, Inc. |
|
|
| 3,582,600 |
|
|
| 3,582,600 |
| |
|
| 116,900 |
|
|
| 116,900 |
| Stericycle, Inc. |
|
|
| 7,610,190 | * |
|
| 7,610,190 |
| |
21,700 |
|
|
|
|
| 21,700 |
| Suntech Power Holdings Co., ADR (China) |
| 613,025 | *(a) |
|
|
|
| 613,025 |
| |
|
|
|
|
|
|
|
|
|
|
|
|
|
|
|
| 70,086,069 |
| |
F-2
|
|
|
|
|
| Pro-forma |
|
|
|
|
|
|
|
|
| Pro-forma |
|
SP Mid Cap |
| Emerging |
| Pro-forma |
| Emerging |
|
|
| SP Mid Cap |
| Emerging |
| Pro-forma |
| Emerging |
|
Growth |
| Growth |
| adjustments |
| Growth |
|
|
| Growth |
| Growth |
| adjustments |
| Growth |
|
Shares |
| Shares |
| Shares |
| Shares |
|
|
| Value |
| Value |
| Value |
| Value |
|
|
|
|
|
|
|
|
|
|
|
|
|
|
|
|
|
|
|
|
|
|
|
|
|
|
| Communications Equipment |
|
|
| 2.9 | % |
|
| 2.5 | % |
|
| 726,000 |
|
|
| 726,000 |
| Avaya, Inc. |
|
|
| 8,290,920 | * |
|
| 8,290,920 |
|
|
| 543,570 |
|
|
| 543,570 |
| Comverse Technology, Inc. |
|
|
| 10,746,379 | * (b) |
|
| 10,746,379 |
|
|
|
|
|
|
|
|
|
|
|
|
|
|
|
|
| 19,037,299 |
|
|
|
|
|
|
|
|
|
|
|
|
|
|
|
|
|
|
|
|
|
|
|
|
|
|
| Computer Hardware |
| 0.8 | % |
|
|
|
| 0.1 | % |
26,600 |
|
|
|
|
| 26,600 |
| Zebra Technologies Corp. (Class A Stock) |
| 908,656 | * |
|
|
|
| 908,656 |
|
|
|
|
|
|
|
|
|
|
|
|
|
|
|
|
|
|
|
|
|
|
|
|
|
|
| Computers & Peripherals |
|
|
| 0.7 | % |
|
| 0.6 | % |
|
| 141,900 |
|
|
| 141,900 |
| Avid Technology, Inc. |
|
|
| 4,729,527 | * (b) |
|
| 4,729,527 |
|
|
|
|
|
|
|
|
|
|
|
|
|
|
|
|
|
|
|
|
|
|
|
|
|
|
| Computer Services |
| 3.7 | % |
|
|
|
| 0.5 | % |
90,600 |
|
|
|
|
| 90,600 |
| Ceredian Corp. |
| 2,214,264 | * |
|
|
|
| 2,214,264 |
|
59,600 |
|
|
|
|
| 59,600 |
| MoneyGram International, Inc. |
| 2,023,420 |
|
|
|
|
| 2,023,420 |
|
|
|
|
|
|
|
|
|
|
|
|
|
|
|
|
| 4,237,684 |
|
|
|
|
|
|
|
|
|
|
|
|
|
|
|
|
|
|
|
|
|
|
|
|
|
|
| Computer Software |
| 5.3 | % |
|
|
|
| 0.8 | % |
179,533 |
|
|
|
|
| 179,533 |
| Activision, Inc. |
| 2,043,086 | *(a) |
|
|
|
| 2,043,086 |
|
72,744 |
|
|
|
|
| 72,744 |
| Cogent, Inc. |
| 1,096,252 | *(a) |
|
|
|
| 1,096,252 |
|
55,200 |
|
|
|
|
| 55,200 |
| Cognos, Inc. (Canada) |
| 1,570,440 | * |
|
|
|
| 1,570,440 |
|
29,900 |
|
|
|
|
| 29,900 |
| NAVTEQ Corp. |
| 1,335,932 | * |
|
|
|
| 1,335,932 |
|
|
|
|
|
|
|
|
|
|
|
|
|
|
|
|
| 6,045,710 |
|
|
|
|
|
|
|
|
|
|
|
|
|
|
|
|
|
|
|
|
|
|
|
|
|
|
| Conglomerates |
| 0.3 | % |
|
|
|
| 0.1 | % |
7,900 |
|
|
|
|
| 7,900 |
| ITT Industries, Inc. |
| 391,050 |
|
|
|
|
| 391,050 |
|
|
|
|
|
|
|
|
|
|
|
|
|
|
|
|
|
|
|
|
|
|
|
|
|
|
| Construction |
| 0.2 | % |
|
|
|
| 0.0 | % |
10,200 |
|
|
|
|
| 10,200 |
| Chicago Bridge & Iron Co. NV (Netherlands) |
| 246,330 |
|
|
|
|
| 246,330 |
|
|
|
|
|
|
|
|
|
|
|
|
|
|
|
|
|
|
|
|
|
|
|
|
|
|
| Consumer Products & Services |
| 2.5 | % |
|
|
|
| 0.4 | % |
37,100 |
|
|
|
|
| 37,100 |
| VCA Antech, Inc. |
| 1,184,603 | * |
|
|
|
| 1,184,603 |
|
40,400 |
|
|
|
|
| 40,400 |
| Weight Watchers International, Inc. |
| 1,651,956 |
|
|
|
|
| 1,651,956 |
|
|
|
|
|
|
|
|
|
|
|
|
|
|
|
|
| 2,836,559 |
|
|
|
|
|
|
|
|
|
|
|
|
|
|
|
|
|
|
|
|
|
|
|
|
|
|
| Diversified Consumer Services |
|
|
| 0.4 | % |
|
| 0.4 | % |
|
| 276,100 |
|
|
| 276,100 |
| Servicemaster Co. (The) |
|
|
| 2,852,113 |
|
|
| 2,852,113 |
|
|
|
|
|
|
|
|
|
|
|
|
|
|
|
|
|
|
|
|
|
|
|
|
|
|
| Diversified Financial Services |
| 0.3 | % | 1.0 | % |
|
| 0.9 | % |
7,700 |
|
|
|
|
| 7,700 |
| Bankrate, Inc. |
| 290,752 | *(a) |
|
|
|
| 290,752 |
|
|
| 289,000 |
|
|
| 289,000 |
| Kkr Private Equity Investors LLP |
|
|
| 6,329,100 |
|
|
| 6,329,100 |
|
|
|
|
|
|
|
|
|
|
|
|
|
|
|
|
| 6,619,852 |
|
|
|
|
|
|
|
|
|
|
|
|
|
|
|
|
|
|
|
|
|
|
|
|
|
|
| Education |
|
|
| 0.5 | % |
|
| 0.4 | % |
|
| 62,000 |
|
|
| 62,000 |
| Apollo Group, Inc. (Class A Stock) |
|
|
| 3,203,540 | * (b) |
|
| 3,203,540 |
|
|
|
|
|
|
|
|
|
|
|
|
|
|
|
|
|
|
|
|
|
|
|
|
|
|
| Electrical Equipment |
|
|
| 5.2 | % |
|
| 4.4 | % |
|
| 216,200 |
|
|
| 216,200 |
| Ametek, Inc. |
|
|
| 10,243,556 |
|
|
| 10,243,556 |
|
|
| 187,600 |
|
|
| 187,600 |
| Amphenol Corp. (Class A Stock) |
|
|
| 10,498,096 |
|
|
| 10,498,096 |
|
|
| 327,200 |
|
|
| 327,200 |
| Insight Enterprises, Inc. |
|
|
| 6,233,160 | * |
|
| 6,233,160 |
|
|
| 255,000 |
|
|
| 255,000 |
| Tektronix, Inc. |
|
|
| 7,502,100 |
|
|
| 7,502,100 |
|
|
|
|
|
|
|
|
|
|
|
|
|
|
|
|
| 34,476,912 |
|
|
|
|
|
|
|
|
|
|
|
|
|
|
|
|
|
|
|
|
|
|
|
|
|
|
| Electronic Components & Equipment |
| 1.1 | % |
|
|
|
| 0.1 | % |
50,400 |
|
|
|
|
| 50,400 |
| Jabil Circuit, Inc. |
| 1,290,240 | * |
|
|
|
| 1,290,240 |
|
|
|
|
|
|
|
|
|
|
|
|
|
|
|
|
|
|
|
|
|
|
|
|
|
|
| Energy Equipment & Services |
| 5.6 | % | 6.4 | % |
|
| 6.3 | % |
37,900 |
| 278,900 |
|
|
| 316,800 |
| Grant Prideco, Inc. |
| 1,696,025 | * | 12,480,775 | * |
|
| 14,176,800 |
|
|
| 158,500 |
|
|
| 158,500 |
| National-Oilwell Varco, Inc. |
|
|
| 10,036,220 | * |
|
| 10,036,220 |
|
|
| 411,400 |
|
|
| 411,400 |
| Pride International, Inc. |
|
|
| 12,848,022 | * (b) |
|
| 12,848,022 |
|
57,150 |
|
|
|
|
| 57,150 |
| Smith International, Inc. |
| 2,541,461 |
|
|
|
|
| 2,541,461 |
|
43,800 |
| 136,200 |
|
|
| 180,000 |
| Weatherford International Ltd. |
| 2,173,356 |
| 6,758,244 | * (b) |
|
| 8,931,600 |
|
|
|
|
|
|
|
|
|
|
|
|
|
|
|
|
| 48,534,103 |
|
F-3
|
|
|
|
|
| Pro-forma |
|
|
|
|
|
|
|
|
| Pro-forma |
|
SP Mid Cap |
| Emerging |
| Pro-forma |
| Emerging |
|
|
| SP Mid Cap |
| Emerging |
| Pro-forma |
| Emerging |
|
Growth |
| Growth |
| adjustments |
| Growth |
|
|
| Growth |
| Growth |
| adjustments |
| Growth |
|
Shares |
| Shares |
| Shares |
| Shares |
|
|
| Value |
| Value |
| Value |
| Value |
|
|
|
|
|
|
|
|
|
|
|
|
|
|
|
|
|
|
|
|
|
|
|
|
|
|
| Exploration & Production |
| 1.2 | % |
|
|
|
| 0.2 | % |
60,200 |
|
|
|
|
| 60,200 |
| Dresser Rand Group, Inc. |
| 1,413,496 | * |
|
|
|
| 1,413,496 |
|
|
|
|
|
|
|
|
|
|
|
|
|
|
|
|
|
|
|
|
|
|
|
|
|
|
| Food |
| 1.4 | % | 1.5 | % |
|
| 1.5 | % |
|
| 445,300 |
|
|
| 445,300 |
| ConAgra Foods, Inc. |
|
|
| 9,845,583 |
|
|
| 9,845,583 |
|
29,800 |
|
|
|
|
| 29,800 |
| Hershey Foods Corp. |
| 1,641,086 | (a) |
|
|
|
| 1,641,086 |
|
|
|
|
|
|
|
|
|
|
|
|
|
|
|
|
| 11,486,669 |
|
|
|
|
|
|
|
|
|
|
|
|
|
|
|
|
|
|
|
|
|
|
|
|
|
|
| Food & Staples Retailing |
|
|
| 0.7 | % |
|
| 0.6 | % |
|
| 70,025 |
|
|
| 70,025 |
| Whole Foods Markets, Inc. |
|
|
| 4,526,416 |
|
|
| 4,526,416 |
|
|
|
|
|
|
|
|
|
|
|
|
|
|
|
|
|
|
|
|
|
|
|
|
|
|
| Health Care Equipment & Supplies |
| 6.5 | % | 4.1 | % |
|
| 4.5 | % |
33,200 |
|
|
|
|
| 33,200 |
| Bard (C.R., Inc.) |
| 2,432,232 |
|
|
|
|
| 2,432,232 |
|
49,725 |
|
|
|
|
| 49,725 |
| Charles River Laboratories International, Inc. |
| 1,829,880 | * |
|
|
|
| 1,829,880 |
|
|
| 162,345 |
|
|
| 162,345 |
| DENTSPLY International, Inc. |
|
|
| 9,838,107 |
|
|
| 9,838,107 |
|
15,676 |
|
|
|
|
| 15,676 |
| Fisher Scientific International, Inc. |
| 1,145,132 | *(a) |
|
|
|
| 1,145,132 |
|
|
| 219,200 |
|
|
| 219,200 |
| Resmed, Inc. |
|
|
| 10,291,440 | * |
|
| 10,291,440 |
|
|
| 208,900 |
|
|
| 208,900 |
| Respironics, Inc. |
|
|
| 7,148,558 | * |
|
| 7,148,558 |
|
60,800 |
|
|
|
|
| 60,800 |
| St. Jude Medical, Inc. |
| 1,971,136 | * |
|
|
|
| 1,971,136 |
|
|
|
|
|
|
|
|
|
|
|
|
|
|
|
|
| 34,656,485 |
|
|
|
|
|
|
|
|
|
|
|
|
|
|
|
|
|
|
|
|
|
|
|
|
|
|
| Health Care Providers & Services |
| 2.8 | % | 8.7 | % |
|
| 7.8 | % |
32,300 |
|
|
|
|
| 32,300 |
| Covance, Inc. |
| 1,977,406 | (a) |
|
|
|
| 1,977,406 |
|
|
| 289,100 |
|
|
| 289,100 |
| DaVita, Inc. |
|
|
| 14,368,270 | * |
|
| 14,368,270 |
|
|
| 262,200 |
|
|
| 262,200 |
| Medco Health Solutions, Inc. |
|
|
| 15,018,816 | * |
|
| 15,018,816 |
|
25,600 |
| 234,300 |
|
|
| 259,900 |
| Omnicare, Inc. |
| 1,213,952 | (a) | 11,110,506 | (b) |
|
| 12,324,458 |
|
|
| 281,900 |
|
|
| 281,900 |
| Quest Dianostics, Inc. |
|
|
| 16,891,448 | (b) |
|
| 16,891,448 |
|
|
|
|
|
|
|
|
|
|
|
|
|
|
|
|
| 60,580,398 |
|
|
|
|
|
|
|
|
|
|
|
|
|
|
|
|
|
|
|
|
|
|
|
|
|
|
| Health Care Technology |
|
|
| 0.7 | % |
|
| 0.6 | % |
|
| 131,300 |
|
|
| 131,300 |
| Cerner Corp. |
|
|
| 4,872,543 | * (b) |
|
| 4,872,543 |
|
|
|
|
|
|
|
|
|
|
|
|
|
|
|
|
|
|
|
|
|
|
|
|
|
|
| Hotels, Restaurants & Leisure |
| 2.7 | % | 2.1 | % |
|
| 2.2 | % |
32,600 |
|
|
|
|
| 32,600 |
| Chang’s China Bistro, (P.F.), Inc. |
| 1,239,452 | *(a) |
|
|
|
| 1,239,452 |
|
15,375 |
|
|
|
|
| 15,375 |
| Harrah’s Entertainment, Inc. |
| 1,094,392 |
|
|
|
|
| 1,094,392 |
|
25,200 |
| 288,300 |
|
|
| 313,500 |
| Hilton Hotels Corp. |
| 712,656 |
| 8,153,124 |
|
|
| 8,865,780 |
|
|
| 82,300 |
|
|
| 82,300 |
| Panera Bread Co. (Class A Stock) |
|
|
| 5,533,852 | * |
|
| 5,533,852 |
|
|
|
|
|
|
|
|
|
|
|
|
|
|
|
|
| 16,733,476 |
|
|
|
|
|
|
|
|
|
|
|
|
|
|
|
|
|
|
|
|
|
|
|
|
|
|
| Insurance |
| 1.3 | % | 0.7 | % |
|
| 0.8 | % |
|
| 164,600 |
|
|
| 164,600 |
| Axis Capital Holdings Ltd. |
|
|
| 4,709,206 |
|
|
| 4,709,206 |
|
47,175 |
|
|
|
|
| 47,175 |
| Willis Group Holdings Ltd. (United Kingdom) |
| 1,514,318 |
|
|
|
|
| 1,514,318 |
|
|
|
|
|
|
|
|
|
|
|
|
|
|
|
|
| 6,223,524 |
|
|
|
|
|
|
|
|
|
|
|
|
|
|
|
|
|
|
|
|
|
|
|
|
|
|
| Internet & Catalog Retail |
|
|
| 0.6 | % |
|
| 0.5 | % |
|
| 301,400 |
|
|
| 301,400 |
| GSI Commerce, Inc. |
|
|
| 4,077,942 | * (b) |
|
| 4,077,942 |
|
|
|
|
|
|
|
|
|
|
|
|
|
|
|
|
|
|
|
|
|
|
|
|
|
|
| Internet Services |
| 1.2 | % | 0.7 | % |
|
| 0.8 | % |
|
| 91,210 |
|
|
| 91,210 |
| CheckFree Corp. |
|
|
| 4,520,367 | * (b) |
|
| 4,520,367 |
|
172,400 |
|
|
|
|
| 172,400 |
| CNET Networks, Inc. |
| 1,375,752 | * |
|
|
|
| 1,375,752 |
|
|
|
|
|
|
|
|
|
|
|
|
|
|
|
|
| 5,896,119 |
|
|
|
|
|
|
|
|
|
|
|
|
|
|
|
|
|
|
|
|
|
|
|
|
|
|
| Internet Software & Services |
|
|
| 2.6 | % |
|
| 2.2 | % |
|
| 193,100 |
|
|
| 193,100 |
| Digital River, Inc. |
|
|
| 7,799,309 | * (b) |
|
| 7,799,309 |
|
|
| 174,100 |
|
|
| 174,100 |
| Equinix, Inc. |
|
|
| 9,551,126 | * (b) |
|
| 9,551,126 |
|
|
|
|
|
|
|
|
|
|
|
|
|
|
|
|
| 17,350,435 |
|
F-4
|
|
|
|
|
| Pro-forma |
|
|
|
|
|
|
|
|
| Pro-forma |
|
|
|
|
|
|
| combined |
|
|
|
|
|
|
|
|
| combined |
|
SP Mid Cap |
| Emerging |
| Pro-forma |
| Emerging |
|
|
| SP Mid Cap |
| Emerging |
| Pro-forma |
| Emerging |
|
Growth |
| Growth |
| adjustments |
| Growth |
|
|
| Growth |
| Growth |
| adjustments |
| Growth |
|
Shares |
| Shares |
| Shares |
| Shares |
|
|
| Value |
| Value |
| Value |
| Value |
|
|
|
|
|
|
|
|
|
|
|
|
|
|
|
|
|
|
|
|
|
|
|
|
|
|
| Life Sciences, Tools & Services |
|
|
| 1.5 | % |
|
| 1.3 | % |
|
| 152,700 |
|
|
| 152,700 |
| Invitrogen Corp. |
|
|
| 10,088,889 | * |
|
| 10,088,889 |
|
|
|
|
|
|
|
|
|
|
|
|
|
|
|
|
|
|
|
|
|
|
|
|
|
|
| Machinery & Equipment |
|
|
| 3.0 | % |
|
| 2.6 | % |
|
| 183,500 |
|
|
| 183,500 |
| Danaher Corp. |
|
|
| 11,802,720 |
|
|
| 11,802,720 |
|
|
| 170,700 |
|
|
| 170,700 |
| IDEX Corp. |
|
|
| 8,057,040 |
|
|
| 8,057,040 |
|
|
|
|
|
|
|
|
|
|
|
|
|
|
|
|
| 19,859,760 |
|
|
|
|
|
|
|
|
|
|
|
|
|
|
|
|
|
|
|
|
|
|
|
|
|
|
| Manufacturing |
| 5.7 | % |
|
|
|
| 0.8 | % |
49,670 |
|
|
|
|
| 49,670 |
| American Standard Cos., Inc. |
| 2,149,221 |
|
|
|
|
| 2,149,221 |
|
41,700 |
|
|
|
|
| 41,700 |
| Pentair, Inc. |
| 1,425,723 |
|
|
|
|
| 1,425,723 |
|
40,400 |
|
|
|
|
| 40,400 |
| Rockwell Automation, Inc. |
| 2,909,204 |
|
|
|
|
| 2,909,204 |
|
|
|
|
|
|
|
|
|
|
|
|
|
|
|
|
| 6,484,148 |
|
|
|
|
|
|
|
|
|
|
|
|
|
|
|
|
|
|
|
|
|
|
|
|
|
|
| Media |
| 3.1 | % | 2.6 | % |
|
| 2.7 | % |
228,825 |
|
|
|
|
| 228,825 |
| Entravision Communications Corp. (Class A Stock) |
| 1,961,030 | * |
|
|
|
| 1,961,030 |
|
|
| 165,200 |
|
|
| 165,200 |
| E.W. Scripps Co. (The (Class A Stock) |
|
|
| 7,126,728 |
|
|
| 7,126,728 |
|
|
| 494,600 |
|
|
| 494,600 |
| Regal Entertainment Group (Class A Stock) |
|
|
| 10,050,272 | (b) |
|
| 10,050,272 |
|
104,600 |
|
|
|
|
| 104,600 |
| XM Satellite Radio Holdings, Inc. (Class A Stock) |
| 1,532,390 |
|
|
|
|
| 1,532,390 |
|
|
|
|
|
|
|
|
|
|
|
|
|
|
|
|
| 20,670,420 |
|
|
|
|
|
|
|
|
|
|
|
|
|
|
|
|
|
|
|
|
|
|
|
|
|
|
| Metals & Mining |
|
|
| 3.8 | % |
|
| 3.3 | % |
|
| 147,600 |
|
|
| 147,600 |
| Arch Coal, Inc. |
|
|
| 6,253,812 |
|
|
| 6,253,812 |
|
|
| 314,600 |
|
|
| 314,600 |
| Goldcorp, Inc. |
|
|
| 9,507,212 | (b) |
|
| 9,507,212 |
|
|
| 222,600 |
|
|
| 222,600 |
| Harmony Gold Mining Co. Ltd. (ADR (South Africa) |
|
|
| 3,626,154 | * (b) |
|
| 3,626,154 |
|
|
| 163,100 |
|
|
| 163,100 |
| Massey Energy Corp. |
|
|
| 5,871,600 | (b) |
|
| 5,871,600 |
|
|
|
|
|
|
|
|
|
|
|
|
|
|
|
|
| 25,258,778 |
|
|
|
|
|
|
|
|
|
|
|
|
|
|
|
|
|
|
|
|
|
|
|
|
|
|
| Networking/Telecommunications Equipment |
| 4.8 | % |
|
|
|
| 0.7 | % |
44,000 |
|
|
|
|
| 44,000 |
| Amphenol Corp. |
| 2,462,240 |
|
|
|
|
| 2,462,240 |
|
55,046 |
|
|
|
|
| 55,046 |
| FLIR Systems, Inc. |
| 1,214,315 | *(a) |
|
|
|
| 1,214,315 |
|
26,000 |
|
|
|
|
| 26,000 |
| Research in Motion Ltd. (Canada) |
| 1,814,020 | * |
|
|
|
| 1,814,020 |
|
|
|
|
|
|
|
|
|
|
|
|
|
|
|
|
| 5,490,575 |
|
|
|
|
|
|
|
|
|
|
|
|
|
|
|
|
|
|
|
|
|
|
|
|
|
|
| Oil, Gas & Consumable Fuels |
| 5.0 | % | 2.3 | % |
|
| 2.7 | % |
52,500 |
|
|
|
|
| 52,500 |
| Cameron International Corp. |
| 2,507,925 | (a) |
|
|
|
| 2,507,925 |
|
42,600 |
|
|
|
|
| 42,600 |
| Newfield Exploration Co. |
| 2,084,844 | * |
|
|
|
| 2,084,844 |
|
|
| 129,700 |
|
|
| 129,700 |
| Noble Energy, Inc. |
|
|
| 6,077,742 |
|
|
| 6,077,742 |
|
28,400 |
|
|
|
|
| 28,400 |
| Quicksilver Resources, Inc. |
| 1,045,404 | *(a) |
|
|
|
| 1,045,404 |
|
|
| 287,800 |
|
|
| 287,800 |
| Southwestern Energy Co. |
|
|
| 8,967,848 | * |
|
| 8,967,848 |
|
|
|
|
|
|
|
|
|
|
|
|
|
|
|
|
| 20,683,763 |
|
|
|
|
|
|
|
|
|
|
|
|
|
|
|
|
|
|
|
|
|
|
|
|
|
|
| Pharmaceuticals |
| 1.3 | % | 1.4 | % |
|
| 1.4 | % |
|
| 183,800 |
|
|
| 183,800 |
| Endo Pharmaceuticals Holdings, Inc. |
|
|
| 6,061,724 | * |
|
| 6,061,724 |
|
|
| 81,400 |
|
|
| 81,400 |
| Kos Pharmaceuticals, Inc. |
|
|
| 3,062,268 | * (b) |
|
| 3,062,268 |
|
45,500 |
|
|
|
|
| 45,500 |
| OSI Pharmaceuticals, Inc. |
| 1,499,680 | *(a) |
|
|
|
| 1,499,680 |
|
|
|
|
|
|
|
|
|
|
|
|
|
|
|
|
| 10,623,672 |
|
|
|
|
|
|
|
|
|
|
|
|
|
|
|
|
|
|
|
|
|
|
|
|
|
|
| Producer Goods |
| 2.1 | % |
|
|
|
| 0.3 | % |
32,240 |
|
|
|
|
| 32,240 |
| Grainger, (W.W.), Inc. |
| 2,425,415 |
|
|
|
|
| 2,425,415 |
|
|
|
|
|
|
|
|
|
|
|
|
|
|
|
|
|
|
|
|
|
|
|
|
|
|
| Real Estate |
|
|
| 1.0 | % |
|
| 0.9 | % |
|
| 313,100 |
|
|
| 313,100 |
| Host Hotels & Resorts, Inc. |
|
|
| 6,847,497 | (b) |
|
| 6,847,497 |
|
F-5
|
|
|
|
|
| Pro-forma |
|
|
|
|
|
|
|
|
| Pro-forma |
|
|
|
|
|
|
| combined |
|
|
|
|
|
|
|
|
| combined |
|
SP Mid Cap |
| Emerging |
| Pro-forma |
| Emerging |
|
|
| SP Mid Cap |
| Emerging |
| Pro-forma |
| Emerging |
|
Growth |
| Growth |
| adjustments |
| Growth |
|
|
| Growth |
| Growth |
| adjustments |
| Growth |
|
Shares |
| Shares |
| Shares |
| Shares |
|
|
| Value |
| Value |
| Value |
| Value |
|
|
|
|
|
|
|
|
|
|
|
|
|
|
|
|
|
|
|
|
|
|
|
|
|
|
| Semiconductors & Semiconductor Equipment |
| 7.8 | % | 5.2 | % |
|
| 5.6 | % |
26,000 |
|
|
|
|
| 26,000 |
| Advanced Micro Devices, Inc. |
| 634,920 | *(a) |
|
|
|
| 634,920 |
|
|
| 202,095 |
|
|
| 202,095 |
| Broadcom Corp. (Class A Stock) |
|
|
| 6,072,955 | * |
|
| 6,072,955 |
|
39,100 |
|
|
|
|
| 39,100 |
| Formfactor, Inc. |
| 1,745,033 | * |
|
|
|
| 1,745,033 |
|
|
| 791,900 |
|
|
| 791,900 |
| Integrated Device Technology, Inc. |
|
|
| 11,229,142 | * (b) |
|
| 11,229,142 |
|
|
| 375,500 |
|
|
| 375,500 |
| Intersil Corp. (Class A Stock) |
|
|
| 8,730,375 |
|
|
| 8,730,375 |
|
77,800 |
|
|
|
|
| 77,800 |
| Linear Technology Corp. |
| 2,605,522 | (a) |
|
|
|
| 2,605,522 |
|
11,500 |
|
|
|
|
| 11,500 |
| Marvell Technology Group Ltd. (Bermuda) |
| 509,795 | * |
|
|
|
| 509,795 |
|
17,500 |
|
|
|
|
| 17,500 |
| Microchip Technology, Inc. |
| 587,125 |
|
|
|
|
| 587,125 |
|
|
| 591,400 |
|
|
| 591,400 |
| Teradyne, Inc. |
|
|
| 8,238,202 | * |
|
| 8,238,202 |
|
62,757 |
|
|
|
|
| 62,757 |
| Tessera Technologies, Inc. |
| 1,725,817 | *(a) |
|
|
|
| 1,725,817 |
|
47,800 |
|
|
|
|
| 47,800 |
| Xilinx, Inc. |
| 1,082,670 |
|
|
|
|
| 1,082,670 |
|
|
|
|
|
|
|
|
|
|
|
|
|
|
|
|
| 43,161,556 |
|
|
|
|
|
|
|
|
|
|
|
|
|
|
|
|
|
|
|
|
|
|
|
|
|
|
| Software |
|
|
| 6.3 | % |
|
| 5.4 | % |
|
| 314,176 |
|
|
| 314,176 |
| Adobe Systems, Inc. |
|
|
| 9,538,383 | * |
|
| 9,538,383 |
|
|
| 386,000 |
|
|
| 386,000 |
| Amdocs Ltd. |
|
|
| 14,127,600 | * |
|
| 14,127,600 |
|
|
| 718,615 |
|
|
| 718,615 |
| BEA Systems, Inc. |
|
|
| 9,406,670 | * (b) |
|
| 9,406,670 |
|
|
| 216,470 |
|
|
| 216,470 |
| Citrix Systems, Inc. |
|
|
| 8,689,106 | * |
|
| 8,689,106 |
|
|
|
|
|
|
|
|
|
|
|
|
|
|
|
|
| 41,761,759 |
|
|
|
|
|
|
|
|
|
|
|
|
|
|
|
|
|
|
|
|
|
|
|
|
|
|
| Specialty Retail |
| 5.3 | % | 2.2 | % |
|
| 2.7 | % |
|
| 106,900 |
|
|
| 106,900 |
| Abercrombie & Fitch Co. (Class A Stock) |
|
|
| 5,925,467 |
|
|
| 5,925,467 |
|
64,950 |
|
|
|
|
| 64,950 |
| Chico’s FAS, Inc. |
| 1,752,351 | *(a) |
|
|
|
| 1,752,351 |
|
33,000 |
|
|
|
|
| 33,000 |
| Coach, Inc. |
| 986,700 |
|
|
|
|
| 986,700 |
|
|
| 187,535 |
|
|
| 187,535 |
| Ross Stores, Inc. |
|
|
| 5,260,357 |
|
|
| 5,260,357 |
|
70,200 |
| 207,320 |
|
|
| 277,520 |
| Urban Outfitters, Inc. |
| 1,227,798 | * | 3,626,027 | * (b) |
|
| 4,853,825 |
|
59,385 |
|
|
|
|
| 59,385 |
| Williams-Sonoma, Inc. |
| 2,022,059 | * |
|
|
|
| 2,022,059 |
|
|
|
|
|
|
|
|
|
|
|
|
|
|
|
|
| 20,800,759 |
|
|
|
|
|
|
|
|
|
|
|
|
|
|
|
|
|
|
|
|
|
|
|
|
|
|
| Telecommunications |
| 4.4 | % |
|
|
|
| 0.5 | % |
40,500 |
|
|
|
|
| 40,500 |
| Cablevision Systems Corp. |
| 868,725 |
|
|
|
|
| 868,725 |
|
65,650 |
|
|
|
|
| 65,650 |
| Crown Castle International Corp. |
| 2,267,551 | *(a) |
|
|
|
| 2,267,551 |
|
54,100 |
|
|
|
|
| 54,100 |
| Neustar, Inc. (Class A Stock) |
| 1,825,875 | *(a) |
|
|
|
| 1,825,875 |
|
|
|
|
|
|
|
|
|
|
|
|
|
|
|
|
| 4,962,151 |
|
|
|
|
|
|
|
|
|
|
|
|
|
|
|
|
|
|
|
|
|
|
|
|
|
|
| Wireless Telecommunication Services |
| 0.9 | % | 5.3 | % |
|
| 4.7 | % |
34,500 |
| 433,200 |
|
|
| 467,700 |
| American Tower Corp. (Class A Stock) |
| 1,073,640 | * | 13,481,184 | * (b) |
|
| 14,554,824 |
|
|
| 384,690 |
|
|
| 384,690 |
| NII Holdings, Inc. |
|
|
| 21,688,822 | * (b) |
|
| 21,688,822 |
|
|
|
|
|
|
|
|
|
|
|
|
|
|
|
|
| 36,243,646 |
|
|
|
|
|
|
|
|
|
|
|
|
|
|
|
|
|
|
|
|
|
|
|
|
|
|
| Total Long-Term Investments |
| 113,153,962 |
| 635,577,654 |
|
|
| 748,731,616 |
|
|
|
|
|
|
|
|
| (cost $101,978,307, $556,031,962, $658,010,269) |
|
|
|
|
|
|
|
|
|
|
|
|
|
|
|
|
|
|
|
|
|
|
|
|
|
|
|
|
|
|
|
|
|
|
|
|
|
|
|
|
|
|
|
|
|
|
|
|
|
|
|
|
| SHORT-TERM INVESTMENTS |
| 26.8 | % | 25.6 | % |
|
| 25.8 | % |
|
|
|
|
|
|
|
| Affiliated Money Market Mutual Fund |
|
|
|
|
|
|
|
|
|
30,500,338 |
| 169,562,501 |
|
|
| 200,062,839 |
| Dryden Core Investment Fund-Taxable Money Market Series |
|
|
|
|
|
|
|
|
|
|
|
|
|
|
|
|
| (cost $30,500,338; includes $29,092,278 of cash collateral for securities on loan (c)(d) |
| 30,500,338 |
|
|
|
|
|
|
|
|
|
|
|
|
|
|
| (cost $169,562,501; includes $145,951,756 of cash collateral for securities on loan (c)(d) |
|
|
| 169,562,501 |
|
|
|
|
|
|
|
|
|
|
|
|
| (cost $200,062,839; includes $175,044,034 of cash collateral for securities on loan (c)(d) |
|
|
|
|
|
|
| 200,062,839 |
|
|
|
|
|
|
|
|
|
|
|
|
|
|
|
|
|
|
|
|
|
|
|
|
|
|
| Total Investments |
| 126.3 | % | 121.7 | % |
|
| 122.4 | % |
|
|
|
|
|
|
|
| (cost $132,478,645, $725,594,463, $858,073,108) |
| 143,654,300 |
| 805,140,155 |
|
|
| 948,794,455 |
|
|
|
|
|
|
|
|
|
|
|
|
|
|
|
|
|
|
|
|
|
|
|
|
|
|
| Liabilities in excess of other assets |
| (26.3 | )% | (21.7 | )% |
|
| (22.4 | )% |
|
|
|
|
|
|
|
|
|
| (29,950,961 | ) | (143,530,168 | ) | (258,000 | )(e) | (173,739,129 | ) |
|
|
|
|
|
|
|
|
|
|
|
|
|
|
|
|
|
|
|
|
|
|
|
|
|
| Net Assets |
| 113,703,339 |
| 661,609,987 |
| (258,000 | )(e) | 775,055,326 |
|
|
|
|
|
|
|
|
|
|
| 100.0 | % | 100.0 | % |
|
| 100.0 | % |
The following abbreviations are used in portfolio descriptions:
ADR - - American Depositary Receipt
* Non-income producing security.
(a) Securities, or portion thereof, on loan with an aggregate market value of $28,453,948; cash collateral of $29,092,278 (included in liabilities) was received with which the Fund purchased highly liquid short-term investments.
(b) Securities, or portion thereof, on loan with an aggregate market value of $140,789,609; cash collateral of $145,951,756 (included in liabilities) was received with which the Fund purchased highly liquid short-term investments.
(c) Represents security, or a portion thereof, purchased with cash collateral received for securities on loan.
(d) Prudential Investments LLC, the manager of the Fund also serves as manager of the Dryden Core Investment Fund-Taxable Money Market Series.
(e) Amounts reflect the adjustment to the Pro Forma Statement of Assets and Liabilities for the Reorganization relating to reorganization expenses attributable to SP Mid-Cap Growth Fund.
SP Mid-Cap Growth does not expect that any investments must be sold as a result of the reorganization.
F-6
PRO FORMA STATEMENT OF ASSETS AND LIABILITIES FOR THE REORGANIZATIONS
June 30, 2006
(Unaudited)
|
| SP Mid-Cap |
| Jennison Emerging |
| Pro-Forma |
| Pro-Forma |
| |||
|
|
|
|
|
|
|
|
|
| |||
Assets |
|
|
|
|
|
|
|
|
| |||
|
|
|
|
|
|
|
|
|
| |||
Investments at value, including securities on loan(C) |
|
|
|
|
|
|
|
|
| |||
Unaffiliated Investments(A) |
| $ | 113,153,962 |
| $ | 635,577,654 |
|
|
| $ | 748,731,616 |
|
Affiliated Investments(B) |
| 30,500,338 |
| 169,562,501 |
|
|
| 200,062,839 |
| |||
Cash |
|
|
| 24,625 |
|
|
| 24,625 |
| |||
Receivable for investments sold |
| 2,154 |
| 8,496,905 |
|
|
| 8,499,059 |
| |||
Receivable for Fund shares sold |
|
|
| 274,575 |
|
|
| 274,575 |
| |||
Dividends and interest receivable |
| 38,294 |
| 192,321 |
|
|
| 230,615 |
| |||
Prepaid expenses |
| 26,936 |
| 2,328 |
|
|
| 29,264 |
| |||
Total assets |
| 143,721,684 |
| 814,130,909 |
|
|
| 957,852,593 |
| |||
‘ |
|
|
|
|
|
|
|
|
| |||
Liabilities |
|
|
|
|
|
|
|
|
| |||
|
|
|
|
|
|
|
|
|
| |||
Payable to Broker for collateral for securities on loan |
| 29,092,278 |
| 145,951,756 |
|
|
| 175,044,034 |
| |||
Payable to Custodian |
| 119,251 |
|
|
|
|
| 119,251 |
| |||
Payable to Investment Manager |
| 120 |
|
|
|
|
| 120 |
| |||
Payable for investments purchased |
|
|
| 4,708,671 |
|
|
| 4,708,671 |
| |||
Payable for Fund shares reacquired |
| 84,948 |
| 550,679 |
|
|
| 635,627 |
| |||
Accrued expenses |
| 163,028 |
| 222,296 |
| 258,000 | (F) | 643,324 |
| |||
Management fee payable |
| 41,911 |
| 244,468 |
|
|
| 286,379 |
| |||
Distribution fee payable |
| 82,652 |
| 210,335 |
|
|
| 292,987 |
| |||
Transfer agent fee payable |
| 434,157 |
| 628,792 |
|
|
| 1,062,949 |
| |||
Deferred directors’ fees |
|
|
| 3,925 |
|
|
| 3,925 |
| |||
Total liabilities |
| 30,018,345 |
| 152,520,922 |
| 258,000 |
| 182,797,267 |
| |||
|
|
|
|
|
|
|
|
|
| |||
Net Assets |
| $ | 113,703,339 |
| $ | 661,609,987 |
| (258,000 | ) | $ | 775,055,326 |
|
|
|
|
|
|
|
|
|
|
| |||
Net assets were comprised of: |
|
|
|
|
|
|
|
|
| |||
Common stock, at par ($.001 par value; unlimited shares authorized for issuance for each fund) |
| $ | 24,269 |
| $ | 32,570 |
|
|
| $ | 56,839 |
|
Paid-in capital in excess of par |
| 248,003,933 |
| 700,229,834 |
| (258,000 | )(F) | 947,975,767 |
| |||
|
| 248,028,202 |
| 700,262,404 |
| (258,000 | ) | 948,032,606 |
| |||
Accumulated net operating loss |
| (1,486,819 | ) | (5,351,284 | ) |
|
| (6,838,103 | ) | |||
Accumulated net realized loss on investments |
| (144,013,699 | ) | (112,846,825 | ) |
|
| (256,860,524 | ) | |||
Net unrealized appreciation on investments |
| 11,175,655 |
| 79,545,692 |
|
|
| 90,721,347 |
| |||
Net assets, June 30, 2006 |
| $ | 113,703,339 |
| $ | 661,609,987 |
| (258,000 | ) | $ | 775,055,326 |
|
(A) Unaffiliated Investments at Cost |
| $ | 101,978,307 |
| $ | 556,031,962 |
|
|
| $ | 658,010,269 |
| |
(B) Affiliated Investments at Cost |
| $ | 30,500,338 |
| $ | 169,562,501 |
|
|
| $ | 200,062,839 |
| |
(C) Securities Loaned at Value |
| $ | 28,453,948 |
| $ | 140,789,609 |
|
|
| $ | 169,243,557 |
| |
|
|
|
|
|
|
|
|
|
| ||||
Class A |
|
|
|
|
|
|
|
|
| ||||
Net assets |
| $ | 12,498,158 |
| $ | 340,584,373 |
| $ | (28,359) | (F) | $ | 353,054,172 |
|
Shares of common stock issued and outstanding) |
| 2,596,986 |
| 16,547,095 |
| (1,991,148 | )(D) | 17,152,933 |
| ||||
Net asset value and redemption price per share |
| $ | 4.81 |
| $ | 20.58 |
|
|
| $ | 20.58 |
| |
Maximum sales charge (5.5% of offering price) |
| 0.28 |
| 1.20 |
|
|
| 1.20 |
| ||||
Maximum offering price to public |
| $ | 5.09 |
| $ | 21.78 |
|
|
| $ | 21.78 |
| |
Class B |
|
|
|
|
|
|
|
|
| ||||
Net assets |
| $ | 2,429,473 |
| $ | 96,358,847 |
| (5,513 | )(F) | $ | 98,782,807 |
| |
Shares of common stock issued and outstanding) |
| 520,916 |
| 5,074,089 |
| (393,274 | )(D) | 5,201,731 |
| ||||
Net asset value, offering price and redemption price per share |
| $ | 4.66 |
| $ | 18.99 |
|
|
| $ | 18.99 |
| |
Class C |
|
|
|
|
|
|
|
|
| ||||
Net assets |
| $ | 18,239,165 |
| $ | 41,894,449 |
| (41,386 | )(F) | $ | 60,092,228 |
| |
Shares of common stock issued and outstanding) |
| 3,931,866 |
| 2,205,530 |
| (2,973,845 | )(D) | 3,163,551 |
| ||||
Offering price and redemption price per share |
| $ | 4.64 |
| $ | 19.00 |
|
|
| $ | 19.00 |
| |
Class L |
|
|
|
|
|
|
|
|
| ||||
Net assets |
| $ | 20,079,049 |
| $ | 5,311,281 |
| (45,561 | )(F) | $ | 25,344,769 |
| |
Shares of common stock issued and outstanding) |
| 4,208,224 |
| 258,046 |
| (3,234,907 | )(D) | 1,231,363 |
| ||||
Net asset value, offering price and redemption price per share |
| $ | 4.77 |
| $ | 20.58 |
|
|
| $ | 20.58 |
| |
Class M |
|
|
|
|
|
|
|
|
| ||||
Net assets |
| $ | 50,207,037 |
| $ | 1,609,537 |
| (113,923 | )(F) | $ | 51,702,651 |
| |
Shares of common stock issued and outstanding) |
| 10,800,442 |
| 84,739 |
| (8,163,137 | )(D) | 2,722,044 |
| ||||
Net asset value, offering price and redemption price per share |
| $ | 4.65 |
| $ | 18.99 |
| — |
| $ | 18.99 |
| |
Class R (E) |
|
|
|
|
|
|
|
|
| ||||
Net assets |
| $ | — |
| $ | 3,012 |
| — |
| $ | 3,012 |
| |
Shares of common stock issued and outstanding) |
| — |
| 147 |
| — | (D) | 147 |
| ||||
Net asset value, offering price and redemption price per share |
| — |
| $ | 20.51 |
| — |
| $ | 20.51 |
| ||
Class X |
|
|
|
|
|
|
|
|
| ||||
Net assets |
| $ | 10,250,457 |
| $ | 12,715,018 |
| (23,258 | )(F) | $ | 22,942,217 |
| |
Shares of common stock issued and outstanding) |
| 2,210,567 |
| 670,088 |
| (1,671,588 | )(D) | 1,209,067 |
| ||||
Net asset value, offering price and redemption price per share |
| $ | 4.64 |
| $ | 18.98 |
| — |
| $ | 18.98 |
| |
Class Z |
|
|
|
|
|
|
|
|
| ||||
Net assets |
| $ | — |
| $ | 163,133,470 |
| — |
| $ | 163,133,470 |
| |
Shares of common stock issued and outstanding) |
| — |
| 7,730,240 |
| — |
| 7,730,240 |
| ||||
Net asset value, offering price and redemption price per share |
|
|
| $ | 21.10 |
| — |
| $ | 21.10 |
| ||
(D) Represents the difference between total additional shares to be issued (see note 2) and current Emerging Growth Fund shares outstanding
(E) Class R’s unrounded net assets and total shares outstanding for Emerging Growth Fund are $3,011.58 and 146.8, respectively.
(F) Reflects the estimated Reorganization expenses of $258,000 attributable to SP Mid-Cap Growth Fund.
See Notes to Pro-Forma Financial Statements
F-7
PRO FORMA STATEMENT OF OPERATIONS FOR THE REORGANIZATIONS
For the Period Ended June 30, 2006
(Unaudited)
|
| SP Mid-Cap |
| Jennison |
| Adjusting |
| Pro-Forma |
| |||
Statement of Operations |
|
|
|
|
|
|
|
|
| |||
Income: |
|
|
|
|
|
|
|
|
| |||
Interest |
| $ | 1,612 |
| 5,530 |
|
|
| $ | 7,142 |
| |
Unaffiliated Dividend Income |
| 645,874 |
| $ | 7,837,418 |
|
|
| 8,483,292 |
| ||
Affiliated Dividend Income |
| 33,626 |
| — |
|
|
| 33,626 |
| |||
Affiliated Income from Securities Loaned |
| 34,534 |
| 328,772 |
|
|
| 363,306 |
| |||
Foreign taxes Withheld |
| — |
| (10,940 | ) |
|
| (10,940 | ) | |||
Total Income |
| 715,646 |
| 8,160,780 |
|
|
| 8,876,426 |
| |||
|
|
|
|
|
|
|
|
|
| |||
Expenses: |
|
|
|
|
|
|
|
|
| |||
Management Fee |
| 1,155,345 |
| 4,149,524 |
| (385,115 | )(b) | 4,919,753 |
| |||
Distribution Fees - Class A |
| 31,605 |
| 870,205 |
|
|
| 901,811 |
| |||
Distribution Fees - Class B |
| 24,235 |
| 1,084,555 |
|
|
| 1,108,790 |
| |||
Distribution Fees - Class C |
| 209,454 |
| 450,196 |
|
|
| 659,650 |
| |||
Distribution Fees - Class L |
| 114,519 |
| 31,975 |
|
|
| 146,494 |
| |||
Distribution Fees - Class M |
| 577,685 |
| 141,652 |
|
|
| 719,337 |
| |||
Distribution Fees - Class R |
| — |
| 16 |
|
|
| 16 |
| |||
Distribution Fees - Class X |
| 116,882 |
| 27,449 |
|
|
| 144,331 |
| |||
Transfer Agent Fees(a) |
| 793,000 |
| 1,570,000 |
| (159,000 | )(b) | 2,204,000 |
| |||
Accounting & Custody ** |
| 48,000 |
| 91,000 |
| (12,000 | )(b) | 127,000 |
| |||
Legal Fees and expenses |
| 25,000 |
| 50,000 |
| (12,000 | )(b) | 63,000 |
| |||
Audit Fees |
| 17,000 |
| 33,000 |
| (10,000 | )(b) | 40,000 |
| |||
Directors Fees |
| 13,000 |
| 24,000 |
| (8,000 | )(b) | 29,000 |
| |||
Reports to Shareholders |
| 20,000 |
| 216,000 |
| (10,000 | )(b) | 226,000 |
| |||
Registration Fees |
| 55,000 |
| 98,000 |
| (30,000 | )(b) | 123,000 |
| |||
Miscellaneous Expenses |
| 12,764 |
| 15,238 |
| (11,000 | )(b) | 17,002 |
| |||
|
|
|
|
|
|
|
|
|
| |||
Total Expenses |
| 3,213,489 |
| 8,852,810 |
| (637,115 | ) | 11,429,183 |
| |||
Less: Expense Reimbursement ** |
| (346,603 | ) | — |
| (63,376 | ) | (409,979 | ) | |||
Net Expenses |
| 2,866,886 |
| 8,852,810 |
| (700,491 | ) | 11,019,204 |
| |||
|
|
|
|
|
|
|
|
|
| |||
Net Investment Income (Loss) |
| (2,151,240 | ) | (692,030 | ) | 700,491 |
| (2,142,778 | ) | |||
|
|
|
|
|
|
|
|
|
| |||
Realized and Unrealized Gain (Loss) on Investments: |
|
|
|
|
|
|
|
|
| |||
Net Realized Gain (Loss) on: |
|
|
|
|
|
|
|
|
| |||
Investments |
| (14,727,696 | ) | 109,919,762 |
| — |
| 95,192,066 |
| |||
Futures |
| — |
| — |
| — |
| — |
| |||
Options Written |
| — |
| 115,269 |
| — |
| 115,269 |
| |||
Foreign Currency |
| 0 |
| 26 |
| — |
| 26 |
| |||
|
| (14,727,696 | ) | 110,035,057 |
| — |
| 95,307,361 |
| |||
|
|
|
|
|
|
|
|
|
| |||
Net Change in Unrealized Appreciation (Depreciation) on: |
|
|
|
|
|
|
|
|
| |||
Investments |
| (7,144,254 | ) | 5,268,908 |
| — |
| (1,875,346 | ) | |||
Futures |
| — |
| — |
| — |
| — |
| |||
Options Written |
| — |
| 5,399 |
| — |
| 5,399 |
| |||
Foreign Currency |
| — |
| — |
| — |
| — |
| |||
|
| (7,144,254 | ) | 5,274,307 |
| — |
| (1,869,947 | ) | |||
|
|
|
|
|
|
|
|
|
| |||
Net Gain (Loss) on Investments |
| (21,871,950 | ) | 115,309,364 |
| — |
| 93,437,414 |
| |||
|
|
|
|
|
|
|
|
|
| |||
Net Increase (Decrease) in Net Assets Resulting From Operations |
| $ | (24,023,190 | ) | $ | 114,617,334 |
| 700,491 |
| $ | 91,294,636 |
|
(a) Affiliated Transfer Agent’s Fees and Exp |
| $ | 492,000 |
| $ | 1,242,000 |
|
|
|
|
|
(b) Assumes savings on fund fees due to consolidation. |
|
|
|
|
|
| |||||
** — Amounts have been restated to reflect current fee rates and related impact on expense ratio. |
|
|
| ||||||||
F-8
Jennison U.S. Emerging Growth Fund merger with
SP Mid-Cap Growth Fund
Notes to Pro-Forma Financial Statements
(unaudited)
1. Basis of Combination – The Pro-Forma Statement of Assets and Liabilities, including the Pro-Forma Schedule of Investments at June 30, 2006 and the related Pro-Forma Statement of Operations (“Pro-Forma Statements”) for the period ended June 30, 2006, reflect the accounts of Jennison U.S. Emerging Growth Fund (the “acquiring” fund), and SP Mid-Cap Growth Fund, (the “target” fund) each a “Fund.”
The Pro-Forma Statements give effect to the proposed transfer of all assets and liabilities of SP Mid-Cap Growth Fund in exchange for shares in Jennison U. S. Emerging Growth Fund. The Pro-Forma Statements should be read in conjunction with the historical financial statements of each Fund included in their respective Statement of Additional Information.
2. Shares of Beneficial Interest – The pro-forma net asset value per share assumes the issuance of additional Class A, B, C, L, M and X shares of Jennison U.S. Emerging Growth Fund, which would have been issued on June 30, 2006 in connection with the proposed reorganization. Shareholders of SP Mid-Cap Growth Fund would become shareholders of Jennison U.S. Emerging Growth Fund, receiving shares of Jennison U.S. Emerging Growth Fund equal to the value of their holdings in SP Mid-Cap Growth Fund. The amount of additional shares assumed to be issued has been calculated based on the June 30, 2006 net assets of SP Mid-Cap Growth Fund and Jennison U.S. Emerging Growth Fund, the net asset value per share of as follows:
Jennison U.S. Emerging |
| Net Assets of |
|
|
| Per |
| |||||
Additional Shares Issued |
| 6/30/06 |
| Adjustments* |
| 6/30/06 |
| |||||
Class A |
| 605,838 |
| $ | 12,498,158 |
| $ | (28,359 | ) | $ | 20.58 |
|
Class B |
| 127,642 |
| $ | 2,429,473 |
| $ | (5,513 | ) | $ | 18.99 |
|
Class C |
| 958,021 |
| $ | 18,239,165 |
| $ | (41,386 | ) | $ | 19.00 |
|
Class L |
| 973,317 |
| $ | 20,079,049 |
| $ | (45,561 | ) | $ | 20.58 |
|
Class M |
| 2,637,305 |
| $ | 50,207,037 |
| $ | (113,923 | ) | $ | 18.99 |
|
Class X |
| 538,979 |
| $ | 10,250,457 |
| $ | (23,258 | ) | $ | 18.98 |
|
* Reflects the estimated reorganization expenses of $258,000 attributable to SP Mid-Cap Growth Fund.
3. Pro-Forma Operations – The Pro-Forma Statement of Operations assumes similar rates of gross investment income for the investments of each Fund. Accordingly, the combined gross investment income is equal to the sum of each Fund’s gross investment income. Certain expenses have been adjusted to reflect the expected expenses of the combined entity. The pro-forma investment management fees and plan of distribution fees of the combined Fund are based on the fee schedule in effect for Jennison U.S. Emerging Growth Fund at the combined level of average net assets for the twelve months ended June 30, 2006. The Pro-Forma
F-9
Statement of Operations does not include the effect of any realized gains or losses, or transaction fees incurred in connection with the realignment of the portfolio.
4. Security Valuation – Securities listed on a securities exchange are valued at the last sale price on such exchange on the day of valuation or, if there was no sale on such day, at the mean between the last reported bid and ask price or at the last bid price on such day in the absence of an asked price. Securities traded via NASDAQ are valued at the NASDAQ official closing price (NOCP) on the day of valuation, or if there was no NOCP, at the last sale price. Securities that are actively traded in the over-the-counter market, including listed securities for which the Manager, in consultation with the subadvisor, believe the primary market to be over-the-counter are valued by an independent agent or principal market maker. Options on securities and indices traded on an exchange are valued at the mean between the most recently quoted bid and asked prices on such exchange. Futures contracts and options thereon traded on a commodities exchange of board of trade are valued at the last sale price at the closing of trading on such exchange or board of trade or, if there was no sale on the applicable commodities exchange or board of trade on such day, at the mean between the most recently quoted bid and asked prices on such exchange or board of trade or at the last bid price in the absence of an asked price. Prices may be obtained from independent pricing services which use information provided by market makers or estimates of market values obtained from yield data relating to investments or securities with similar characteristics. Securities for which reliable market quotations are not readily available, or whose values have been affected by events occurring after the close of the security’s foreign market and before the Funds’ normal pricing time, are valued at fair value in accordance with the Board of Directors’ approved fair valuation procedures. When determining the fair valuation of securities some of the factors influencing the valuation include, the nature of any restrictions on disposition of the securities; assessment of the general liquidity of the securities; the issuer’s financial condition and the markets in which it does business; the cost of the investment; the size of the holding and the capitalization of issuer; the prices of any recent transactions or bids/offers for such securities or any comparable securities; any available analysis media or other reports or information deemed reliable by the investment adviser regarding the issuer or the markets or industry in which it operates. Using fair value to price securities may result in a value that is different from a security’s most recent closing price and from the price used by other mutual funds to calculate their net asset values. Investments in mutual funds are valued at their net assets value as of the close of the New York Stock Exchange on the date of the valuation. Short-term securities that are held in the Funds, which mature in more than 60 days are valued at current market quotations, and those short-term securities, which mature in 60 days or less are valued at, amortized cost, which approximates market value.
The Funds valuation policies are substantially identical and there are no differences in terms of how each Fund values its portfolio securities.
5. Estimates – The preparation of financial statements requires management to make estimates and assumptions that affect the reported amounts and disclosures in the financial statements. Actual results could differ from those estimates.
6. Taxes - For Federal income tax purposes, the acquiring fund and each of the target funds is treated as a separate taxpaying entity. It is each Fund’s policy to continue to meet the requirements of the Internal Revenue Code applicable to regulated investment companies and to distribute all of its taxable net income and capital gains, if any, to shareholders. Therefore,
F-10
no federal income tax provision is required. SP Mid-Cap Growth Fund had a capital loss carry forward of $153,730,000 as of October 31, 2005, all of which will have an annual limitation on the amount of utilization under section 382 of the Internal Revenue Code of 1986, as amended. Jennison U.S. Emerging Growth had a capital loss carryforward of $198,229,000 as of October 31, 2005.
F-11
PRO FORMA PORTFOLIO OF INVESTMENTS FOR THE MERGER OF SP NEW ERA GROWTH FUND INTO JENNISON U.S. EMERGING GROWTH FUND
AS OF JUNE 30, 2006
(Unaudited)
|
|
|
|
|
| Pro-forma combined |
|
|
|
|
|
|
|
|
| Pro-forma combined |
|
SP New Era |
| Emerging |
| Pro-forma |
| Emerging |
|
|
| SP New Era |
| Emerging |
| Pro-forma |
| Emerging |
|
Growth |
| Growth |
| adjustments |
| Growth |
|
|
| Growth |
| Growth |
| adjustments |
| Growth |
|
Shares |
| Shares |
| Shares |
| Shares |
|
|
| Value |
| Value |
| Value |
| Value |
|
|
|
|
|
|
|
|
| LONG-TERM INVESTMENTS |
| 99.3 | % | 96.1 | % |
|
| 96.4 | % |
|
|
|
|
|
|
|
| COMMON STOCKS |
|
|
|
|
|
|
|
|
|
|
|
|
|
|
|
|
|
|
|
|
|
|
|
|
|
|
|
|
|
|
|
|
|
|
| Air Freight & Logistics |
|
|
| 0.7 | % |
|
| 0.7 | % |
|
| 194,700 |
|
|
| 194,700 |
| UTI Worldwide, Inc. |
|
|
| 4,912,281 |
|
|
| 4,912,281 |
|
|
|
|
|
|
|
|
|
|
|
|
|
|
|
|
|
|
|
|
|
|
|
|
|
|
| Banks |
| 1.0 | % |
|
|
|
| 0.1 | % |
9,500 |
|
|
|
|
| 9,500 |
| Hancock Holding Co. |
| 532,000 |
|
|
|
|
| 532,000 |
|
6,720 |
|
|
|
|
| 6,720 |
| Signature Bank |
| 217,594 | * |
|
|
|
| 217,594 |
|
|
|
|
|
|
|
|
|
|
|
|
|
|
|
|
| 749,594 |
|
|
|
|
|
|
|
|
|
|
|
|
|
|
|
|
|
|
|
|
|
|
|
|
|
|
| Biotechnology |
| 3.6 | % | 2.0 | % |
|
| 2.1 | % |
31,500 |
|
|
|
|
| 31,500 |
| Applera Corp. - Applied Biosystems Group |
| 1,019,025 |
|
|
|
|
| 1,019,025 |
|
13,800 |
|
|
|
|
| 13,800 |
| Genentech, Inc. |
| 1,128,840 | * |
|
|
|
| 1,128,840 |
|
|
| 335,200 |
|
|
| 335,200 |
| ImClone Systems, Inc. |
|
|
| 12,952,128 | * (a) |
|
| 12,952,128 |
|
11,700 |
|
|
|
|
| 11,700 |
| MedImmune, Inc. |
| 317,070 | * |
|
|
|
| 317,070 |
|
9,900 |
|
|
|
|
| 9,900 |
| Vertex Pharmaceuticals, Inc. |
| 363,429 |
|
|
|
|
| 363,429 |
|
|
|
|
|
|
|
|
|
|
|
|
|
|
|
|
| 15,780,492 |
|
|
|
|
|
|
|
|
|
|
|
|
|
|
|
|
|
|
|
|
|
|
|
|
|
|
| Building Materials & Construction |
| 1.1 | % |
|
|
|
| 0.1 | % |
4,500 |
|
|
|
|
| 4,500 |
| Martin Marietta Materials, Inc. |
| 410,175 | * |
|
|
|
| 410,175 |
|
8,700 |
|
|
|
|
| 8,700 |
| Thor Industries, Inc. |
| 421,515 |
|
|
|
|
| 421,515 |
|
|
|
|
|
|
|
|
|
|
|
|
|
|
|
|
| 831,690 |
|
|
|
|
|
|
|
|
|
|
|
|
|
|
|
|
|
|
|
|
|
|
|
|
|
|
| Business Software & Services |
| 3.0 | % |
|
|
|
| 0.3 | % |
34,600 |
|
|
|
|
| 34,600 |
| Cognizant Technology Solutions Corp. |
| 2,331,002 | * |
|
|
|
| 2,331,002 |
|
|
|
|
|
|
|
|
|
|
|
|
|
|
|
|
|
|
|
|
|
|
|
|
|
|
| Capital Markets |
| 5.0 | % | 6.1 | % |
|
| 6.0 | % |
47,200 |
|
|
|
|
| 47,200 |
| Ameritrade Holdings Corp. |
| 699,032 |
|
|
|
|
| 699,032 |
|
|
| 574,300 |
|
|
| 574,300 |
| Eaton Vance Corp. |
|
|
| 14,334,528 | (a) |
|
| 14,334,528 |
|
34,200 |
|
|
|
|
| 34,200 |
| E*Trade Financial Corp. |
| 780,444 | * |
|
|
|
| 780,444 |
|
|
| 166,500 |
|
|
| 166,500 |
| Lazard Ltd. (Class A Stock) |
|
|
| 6,726,600 | (a) |
|
| 6,726,600 |
|
22,800 |
|
|
|
|
| 22,800 |
| Nasdaq Stock Market, Inc. |
| 681,720 | * |
|
|
|
| 681,720 |
|
|
| 189,500 |
|
|
| 189,500 |
| Nuveen Investments, Inc. (Class A Stock) |
|
|
| 8,157,975 |
|
|
| 8,157,975 |
|
24,000 |
|
|
|
|
| 24,000 |
| Price, (T. Rowe) Group, Inc. |
| 907,440 |
|
|
|
|
| 907,440 |
|
18,400 |
|
|
|
|
| 18,400 |
| SEI Investments Co. |
| 899,392 |
|
|
|
|
| 899,392 |
|
|
| 740,500 |
|
|
| 740,500 |
| TD Ameritrade Holding Corp. |
|
|
| 10,966,805 |
|
|
| 10,966,805 |
|
|
|
|
|
|
|
|
|
|
|
|
|
|
|
|
| 44,153,936 |
|
|
|
|
|
|
|
|
|
|
|
|
|
|
|
|
|
|
|
|
|
|
|
|
|
|
| Chemicals |
|
|
| 3.4 | % |
|
| 3.1 | % |
|
| 287,400 |
|
|
| 287,400 |
| Ecolab, Inc. |
|
|
| 11,662,692 | (a) |
|
| 11,662,692 |
|
|
| 129,700 |
|
|
| 129,700 |
| Monsanto Co. |
|
|
| 10,919,443 |
|
|
| 10,919,443 |
|
|
|
|
|
|
|
|
|
|
|
|
|
|
|
|
| 22,582,135 |
|
|
|
|
|
|
|
|
|
|
|
|
|
|
|
|
|
|
|
|
|
|
|
|
|
|
| Commercial Services & Supplies |
| 10.4 | % | 9.8 | % |
|
| 9.8 | % |
13,200 |
|
|
|
|
| 13,200 |
| Advisory Board Co. (The) |
| 634,788 | * |
|
|
|
| 634,788 |
|
13,100 |
|
|
|
|
| 13,100 |
| Alliance Data Systems Corp. |
| 770,542 | * |
|
|
|
| 770,542 |
|
|
| 731,300 |
|
|
| 731,300 |
| Allied Waste Industries, Inc. |
|
|
| 8,307,568 | * (a) |
|
| 8,307,568 |
|
|
| 152,100 |
|
|
| 152,100 |
| ARAMARK Corp. (Class B Stock) |
|
|
| 5,036,031 |
|
|
| 5,036,031 |
|
22,300 |
|
|
|
|
| 22,300 |
| Bright Horizons Family Solutions, Inc. |
| 840,487 | * |
|
|
|
| 840,487 |
|
|
| 343,000 |
|
|
| 343,000 |
| ChoicePoint, Inc. |
|
|
| 14,327,110 | * |
|
| 14,327,110 |
|
18,400 |
|
|
|
|
| 18,400 |
| Corporate Executive Board Co. (The) |
| 1,843,680 |
|
|
|
|
| 1,843,680 |
|
3,700 |
|
|
|
|
| 3,700 |
| Equifax, Inc. |
| 127,058 |
|
|
|
|
| 127,058 |
|
|
| 210,100 |
|
|
| 210,100 |
| Iron Mountain, Inc. |
|
|
| 7,853,538 | * |
|
| 7,853,538 |
|
38,000 |
| 126,825 |
|
|
| 164,825 |
| Monster Worldwide, Inc. |
| 1,621,080 | * | 5,410,354 | * (a) |
|
| 7,031,434 |
|
|
| 310,500 |
|
|
| 310,500 |
| Nalco Holdings Co. |
|
|
| 5,474,115 |
|
|
| 5,474,115 |
|
|
| 177,515 |
|
|
| 177,515 |
| Paychex, Inc. |
|
|
| 6,919,535 |
|
|
| 6,919,535 |
|
31,900 |
|
|
|
|
| 31,900 |
| Resources Connection, Inc. |
| 798,138 | * |
|
|
|
| 798,138 |
|
27,200 |
| 85,300 |
|
|
| 112,500 |
| Robert Half International, Inc. |
| 1,142,400 |
| 3,582,600 |
|
|
| 4,725,000 |
|
|
| 116,900 |
|
|
| 116,900 |
| Stericycle, Inc. |
|
|
| 7,610,190 | * |
|
| 7,610,190 |
|
3,800 |
|
|
|
|
| 3,800 |
| Strayer Education, Inc. |
| 369,056 |
|
|
|
|
| 369,056 |
|
|
|
|
|
|
|
|
|
|
|
|
|
|
|
|
| 72,668,270 |
|
|
|
|
|
|
|
|
|
|
|
|
|
|
|
|
|
|
|
|
|
|
|
|
|
|
| Communications Equipment |
| 1.0 | % | 2.9 | % |
|
| 2.7 | % |
|
| 726,000 |
|
|
| 726,000 |
| Avaya, Inc. |
|
|
| 8,290,920 | * |
|
| 8,290,920 |
|
|
| 543,570 |
|
|
| 543,570 |
| Comverse Technology, Inc. |
|
|
| 10,746,379 | * (a) |
|
| 10,746,379 |
|
19,000 |
|
|
|
|
|
|
| Harris Corp. |
| 788,690 |
|
|
|
|
| 788,690 |
|
|
|
|
|
|
|
|
|
|
|
|
|
|
|
|
| 19,825,989 |
|
|
|
|
|
|
|
|
|
|
|
|
|
|
|
|
|
|
|
|
|
|
|
|
|
|
| Computers & Peripherals |
| 3.6 | % | 0.7 | % |
|
| 1.0 | % |
23,700 |
|
|
|
|
| 23,700 |
| Apple Computer, Inc. |
| 1,353,744 | * |
|
|
|
| 1,353,744 |
|
|
| 141,900 |
|
|
| 141,900 |
| Avid Technology, Inc. |
|
|
| 4,729,527 | * (a) |
|
| 4,729,527 |
|
F-12
|
|
|
|
|
| Pro-forma combined |
|
|
|
|
|
|
|
|
| Pro-forma combined |
|
SP New Era |
| Emerging |
| Pro-forma |
| Emerging |
|
|
| SP New Era |
| Emerging |
| Pro-forma |
| Emerging |
|
Growth |
| Growth |
| adjustments |
| Growth |
|
|
| Growth |
| Growth |
| adjustments |
| Growth |
|
Shares |
| Shares |
| Shares |
| Shares |
|
|
| Value |
| Value |
| Value |
| Value |
|
6,200 |
|
|
|
|
| 6,200 |
| Sandisk Corp. |
| 316,076 | * |
|
|
|
| 316,076 |
|
24,700 |
|
|
|
|
| 24,700 |
| Seagate Technology (Cayman Island) |
| 559,208 | * |
|
|
|
| 559,208 |
|
29,000 |
|
|
|
|
| 29,000 |
| Western Digital Corp. |
| 574,490 | * |
|
|
|
| 574,490 |
|
|
|
|
|
|
|
|
|
|
|
|
|
|
|
|
| 7,533,045 |
|
|
|
|
|
|
|
|
|
|
|
|
|
|
|
|
|
|
|
|
|
|
|
|
|
|
| Computer Services |
| 0.9 | % |
|
|
|
| 0.1 | % |
28,700 |
|
|
|
|
| 28,700 |
| Electronic Data Systems Corp. |
| 690,522 |
|
|
|
|
| 690,522 |
|
|
|
|
|
|
|
|
|
|
|
|
|
|
|
|
|
|
|
|
|
|
|
|
|
|
| Construction |
| 0.5 | % |
|
|
|
| 0.0 | % |
13,000 |
|
|
|
|
| 13,000 |
| Shaw Group, Inc. |
| 361,400 | * |
|
|
|
| 361,400 |
|
|
|
|
|
|
|
|
|
|
|
|
|
|
|
|
|
|
|
|
|
|
|
|
|
|
| Consumer Products & Services |
| 1.6 | % |
|
|
|
| 0.2 | % |
9,800 |
|
|
|
|
| 9,800 |
| GameStop Corporation (Class A Stock) |
| 411,600 |
|
|
|
|
| 411,600 |
|
9,500 |
|
|
|
|
| 9,500 |
| Scotts Co. (The) (Class A Stock) |
| 402,040 | * |
|
|
|
| 402,040 |
|
10,500 |
|
|
|
|
| 10,500 |
| Weight Watchers International, Inc. |
| 429,345 |
|
|
|
|
| 429,345 |
|
|
|
|
|
|
|
|
|
|
|
|
|
|
|
|
| 1,242,985 |
|
|
|
|
|
|
|
|
|
|
|
|
|
|
|
|
|
|
|
|
|
|
|
|
|
|
| Distribution/Wholesale |
| 0.6 | % |
|
|
|
| 0.1 | % |
7,200 |
|
|
|
|
| 7,200 |
| WESCO International, Inc. |
| 480,672 | * |
|
|
|
| 480,672 |
|
|
|
|
|
|
|
|
|
|
|
|
|
|
|
|
|
|
|
|
|
|
|
|
|
|
| Diversified Consumer Services |
|
|
| 0.4 | % |
|
| 0.4 | % |
|
| 276,100 |
|
|
| 276,100 |
| Servicemaster Co. (The) |
|
|
| 2,852,113 |
|
|
| 2,852,113 |
|
|
|
|
|
|
|
|
|
|
|
|
|
|
|
|
|
|
|
|
|
|
|
|
|
|
| Diversified Financial Services |
| 2.8 | % | 1.0 | % |
|
| 1.2 | % |
950 |
|
|
|
|
| 950 |
| Chicago Mercantile Exchange Holdings, Inc. |
| 466,592 |
|
|
|
|
| 466,592 |
|
13,900 |
|
|
|
|
| 13,900 |
| GFI Group, Inc. |
| 749,905 | * |
|
|
|
| 749,905 |
|
34,600 |
|
|
|
|
| 34,600 |
| Jefferies Group, Inc. |
| 1,025,198 |
|
|
|
|
| 1,025,198 |
|
|
| 289,000 |
|
|
| 289,000 |
| Kkr Private Equity Investors LLP |
|
|
| 6,329,100 |
|
|
| 6,329,100 |
|
|
|
|
|
|
|
|
|
|
|
|
|
|
|
|
| 8,570,795 |
|
|
|
|
|
|
|
|
|
|
|
|
|
|
|
|
|
|
|
|
|
|
|
|
|
|
| Education |
| 0.9 | % | 0.5 | % |
|
| 0.5 | % |
|
| 62,000 |
|
|
| 62,000 |
| Apollo Group, Inc. (Class A Stock) |
|
|
| 3,203,540 | * (a) |
|
| 3,203,540 |
|
16,000 |
|
|
|
|
| 16,000 |
| Laureate Education, Inc. |
| 682,080 | * |
|
|
|
| 682,080 |
|
|
|
|
|
|
|
|
|
|
|
|
|
|
|
|
| 3,885,620 |
|
|
|
|
|
|
|
|
|
|
|
|
|
|
|
|
|
|
|
|
|
|
|
|
|
|
| Electrical Equipment |
| 1.2 | % | 5.2 | % |
|
| 4.8 | % |
|
| 216,200 |
|
|
| 216,200 |
| Ametek, Inc. |
|
|
| 10,243,556 |
|
|
| 10,243,556 |
|
|
| 187,600 |
|
|
| 187,600 |
| Amphenol Corp. (Class A Stock) |
|
|
| 10,498,096 |
|
|
| 10,498,096 |
|
14,600 |
|
|
|
|
| 14,600 |
| Energy Conversion Devices, Inc. |
| 531,878 | * |
|
|
|
| 531,878 |
|
|
| 327,200 |
|
|
| 327,200 |
| Insight Enterprises, Inc. |
|
|
| 6,233,160 | * |
|
| 6,233,160 |
|
14,000 |
| 255,000 |
|
|
| 269,000 |
| Tektronix, Inc. |
| 411,880 | * | 7,502,100 |
|
|
| 7,913,980 |
|
|
|
|
|
|
|
|
|
|
|
|
|
|
|
|
| 35,420,670 |
|
|
|
|
|
|
|
|
|
|
|
|
|
|
|
|
|
|
|
|
|
|
|
|
|
|
| Electrical Equipment |
| 1.0 | % | 0.1 | % |
|
|
|
|
42,000 |
|
|
|
|
| 42,000 |
| Synopsys, Inc. |
| 788,340 | * |
|
|
|
| 788,340 |
|
|
|
|
|
|
|
|
|
|
|
|
|
|
|
|
|
|
|
|
|
|
|
|
|
|
| Energy Equipment & Services |
| 5.3 | % | 6.4 | % |
|
| 6.2 | % |
25,000 |
|
|
|
|
| 25,000 |
| BJ Services Co. |
| 931,500 |
|
|
|
|
| 931,500 |
|
|
| 278,900 |
|
|
| 278,900 |
| Grant Prideco, Inc. |
|
|
| 12,480,775 | * |
|
| 12,480,775 |
|
33,400 |
|
|
|
|
| 33,400 |
| Nabors Industries Ltd. (Barbados) |
| 1,128,586 | * |
|
|
|
| 1,128,586 |
|
8,100 |
| 158,500 |
|
|
| 166,600 |
| National-Oilwell Varco, Inc. |
| 512,892 | * | 10,036,220 | * |
|
| 10,549,112 |
|
|
| 411,400 |
|
|
| 411,400 |
| Pride International, Inc. |
|
|
| 12,848,022 | * (a) |
|
| 12,848,022 |
|
35,600 |
|
|
|
|
| 35,600 |
| Smith International, Inc. |
| 1,583,132 | * |
|
|
|
| 1,583,132 |
|
|
| 136,200 |
|
|
| 136,200 |
| Weatherford International Ltd. |
|
|
| 6,758,244 | * (a) |
|
| 6,758,244 |
|
|
|
|
|
|
|
|
|
|
|
|
|
|
|
|
| 46,279,371 |
|
|
|
|
|
|
|
|
|
|
|
|
|
|
|
|
|
|
|
|
|
|
|
|
|
|
| Engineering/Construction |
| 0.5 | % |
|
|
|
| 0.0 | % |
8,400 |
|
|
|
|
| 8,400 |
| Foster Wheeler, Ltd. |
| 362,880 | * |
|
|
|
| 362,880 |
|
|
|
|
|
|
|
|
|
|
|
|
|
|
|
|
|
|
|
|
|
|
|
|
|
|
| Food |
|
|
| 1.5 | % |
|
| 1.3 | % |
|
| 445,300 |
|
|
| 445,300 |
| ConAgra Foods, Inc. |
|
|
| 9,845,583 |
|
|
| 9,845,583 |
|
|
|
|
|
|
|
|
|
|
|
|
|
|
|
|
|
|
|
|
|
|
|
|
|
|
| Food & Staples Retailing |
| 0.5 | % | 0.7 | % |
|
| 0.7 | % |
6,000 |
| 70,025 |
|
|
| 76,025 |
| Whole Foods Markets, Inc. |
| 387,840 |
| 4,526,416 |
|
|
| 4,914,256 |
|
|
|
|
|
|
|
|
|
|
|
|
|
|
|
|
|
|
|
|
|
|
|
|
|
|
| Health Care Equipment & Supplies |
| 3.8 | % | 4.1 | % |
|
| 4.1 | % |
17,000 |
|
|
|
|
| 17,000 |
| Abaxis, Inc. |
| 380,290 |
|
|
|
|
| 380,290 |
|
|
| 162,345 |
|
|
| 162,345 |
| DENTSPLY International, Inc. |
|
|
| 9,838,107 |
|
|
| 9,838,107 |
|
7,100 |
|
|
|
|
| 7,100 |
| Foxhollow Technologies, Inc. |
| 193,972 |
|
|
|
|
| 193,972 |
|
19,400 |
|
|
|
|
| 19,400 |
| Intralase Corp. |
| 324,756 | * |
|
|
|
| 324,756 |
|
14,350 |
|
|
|
|
| 14,350 |
| Intuitive Surgical, Inc. |
| 1,692,870 | * |
|
|
|
| 1,692,870 |
|
8,100 |
|
|
|
|
| 8,100 |
| Palomar Medical Technologies, Inc. |
| 369,603 |
|
|
|
|
| 369,603 |
|
|
| 219,200 |
|
|
| 219,200 |
| Resmed, Inc. |
|
|
| 10,291,440 | * |
|
| 10,291,440 |
|
|
| 208,900 |
|
|
| 208,900 |
| Respironics, Inc. |
|
|
| 7,148,558 | * |
|
| 7,148,558 |
|
|
|
|
|
|
|
|
|
|
|
|
|
|
|
|
| 30,239,596 |
|
F-13
|
|
|
|
|
| Pro-forma combined |
|
|
|
|
|
|
|
|
| Pro-forma combined |
|
SP New Era |
| Emerging |
| Pro-forma |
| Emerging |
|
|
| SP New Era |
| Emerging |
| Pro-forma |
| Emerging |
|
Growth |
| Growth |
| adjustments |
| Growth |
|
|
| Growth |
| Growth |
| adjustments |
| Growth |
|
Shares |
| Shares |
| Shares |
| Shares |
|
|
| Value |
| Value |
| Value |
| Value |
|
|
|
|
|
|
|
|
|
|
|
|
|
|
|
|
|
|
|
|
|
|
|
|
|
|
| Health Care Providers & Services |
| 2.4 | % | 8.7 | % |
|
| 8.0 | % |
|
| 289,100 |
|
|
| 289,100 |
| DaVita, Inc. |
|
|
| 14,368,270 | * |
|
| 14,368,270 |
|
13,300 |
|
|
|
|
| 13,300 |
| Express Scripts, Inc. (Class A Stock) |
| 954,142 | * |
|
|
|
| 954,142 |
|
|
| 262,200 |
|
|
| 262,200 |
| Medco Health Solutions, Inc. |
|
|
| 15,018,816 | * |
|
| 15,018,816 |
|
|
| 234,300 |
|
|
| 234,300 |
| Omnicare, Inc. |
|
|
| 11,110,506 | (a) |
|
| 11,110,506 |
|
26,600 |
|
|
|
|
| 26,600 |
| Pharmaceutical Product Development, Inc. |
| 934,192 |
|
|
|
|
| 934,192 |
|
|
| 281,900 |
|
|
| 281,900 |
| Quest Dianostics, Inc. |
|
|
| 16,891,448 | (a) |
|
| 16,891,448 |
|
|
|
|
|
|
|
|
|
|
|
|
|
|
|
|
| 59,277,374 |
|
|
|
|
|
|
|
|
|
|
|
|
|
|
|
|
|
|
|
|
|
|
|
|
|
|
| Health Care Technology |
| 0.4 | % | 0.7 | % |
|
| 0.7 | % |
8,600 |
| 131,300 |
|
|
| 139,900 |
| Cerner Corp. |
| 319,146 | * | 4,872,543 | * (a) |
|
| 5,191,689 |
|
|
|
|
|
|
|
|
|
|
|
|
|
|
|
|
|
|
|
|
|
|
|
|
|
|
| Hotels, Restaurants & Leisure |
| 1.5 | % | 2.1 | % |
|
| 2.0 | % |
|
| 288,300 |
|
|
| 288,300 |
| Hilton Hotels Corp. |
|
|
| 8,153,124 |
|
|
| 8,153,124 |
|
11,400 |
|
|
|
|
| 11,400 |
| Marriott International, Inc. (Class A Stock) |
| 434,568 |
|
|
|
|
| 434,568 |
|
|
| 82,300 |
|
|
| 82,300 |
| Panera Bread Co. (Class A Stock) |
|
|
| 5,533,852 | * |
|
| 5,533,852 |
|
10,000 |
|
|
|
|
| 10,000 |
| Wynn Resorts Ltd. |
| 733,000 | * |
|
|
|
| 733,000 |
|
|
|
|
|
|
|
|
|
|
|
|
|
|
|
|
| 14,854,544 |
|
|
|
|
|
|
|
|
|
|
|
|
|
|
|
|
|
|
|
|
|
|
|
|
|
|
| Insurance |
| 1.7 | % | 0.7 | % |
|
| 0.8 | % |
11,500 |
|
|
|
|
| 11,500 |
| Assurant, Inc. |
| 556,600 |
|
|
|
|
| 556,600 |
|
|
| 164,600 |
|
|
| 164,600 |
| Axis Capital Holdings Ltd. |
|
|
| 4,709,206 |
|
|
| 4,709,206 |
|
28,300 |
|
|
|
|
| 28,300 |
| National Interstate Corp. |
| 767,496 |
|
|
|
|
| 767,496 |
|
|
|
|
|
|
|
|
|
|
|
|
|
|
|
|
| 6,033,302 |
|
|
|
|
|
|
|
|
|
|
|
|
|
|
|
|
|
|
|
|
|
|
|
|
|
|
| Internet & Catalog Retail |
| 1.0 | % | 0.6 | % |
|
| 0.7 | % |
28,000 |
|
|
|
|
| 28,000 |
| eBay, Inc. |
| 820,120 | * |
|
|
|
| 820,120 |
|
|
| 301,400 |
|
|
| 301,400 |
| GSI Commerce, Inc. |
|
|
| 4,077,942 | * (a) |
|
| 4,077,942 |
|
|
|
|
|
|
|
|
|
|
|
|
|
|
|
|
| 4,898,062 |
|
|
|
|
|
|
|
|
|
|
|
|
|
|
|
|
|
|
|
|
|
|
|
|
|
|
| Internet Services |
| 1.4 | % | 0.7 | % |
|
| 0.8 | % |
22,800 |
| 91,210 |
|
|
| 114,010 |
| CheckFree Corp. |
| 1,129,968 | * | 4,520,367 | * (a) |
|
| 5,650,335 |
|
|
|
|
|
|
|
|
|
|
|
|
|
|
|
|
|
|
|
|
|
|
|
|
|
|
| Internet Software & Services |
| 5.1 | % | 2.6 | % |
|
| 2.9 | % |
4,300 |
|
|
|
|
| 4,300 |
| Baidu.com, Inc., ADR |
| 354,879 |
|
|
|
|
| 354,879 |
|
12,700 |
|
|
|
|
| 12,700 |
| Ctrip.com International Ltd., ADR (China) |
| 648,335 | * |
|
|
|
| 648,335 |
|
|
| 193,100 |
|
|
| 193,100 |
| Digital River, Inc. |
|
|
| 7,799,309 | * (a) |
|
| 7,799,309 |
|
|
| 174,100 |
|
|
| 174,100 |
| Equinix, Inc. |
|
|
| 9,551,126 | * (a) |
|
| 9,551,126 |
|
18,400 |
|
|
|
|
| 18,400 |
| Netease.com, Inc., ADR (China) |
| 410,872 | * |
|
|
|
| 410,872 |
|
25,400 |
|
|
|
|
| 25,400 |
| NetFlix, Inc. |
| 691,134 | * |
|
|
|
| 691,134 |
|
69,600 |
|
|
|
|
| 69,600 |
| Opsware, Inc. |
| 573,504 |
|
|
|
|
| 573,504 |
|
7,100 |
|
|
|
|
| 7,100 |
| Sina Corp. |
| 177,358 |
|
|
|
|
| 177,358 |
|
34,000 |
|
|
|
|
| 34,000 |
| ValueClick, Inc. |
| 521,900 | * |
|
|
|
| 521,900 |
|
18,700 |
|
|
|
|
| 18,700 |
| Yahoo!, Inc. |
| 617,100 | * |
|
|
|
| 617,100 |
|
|
|
|
|
|
|
|
|
|
|
|
|
|
|
|
| 21,345,517 |
|
|
|
|
|
|
|
|
|
|
|
|
|
|
|
|
|
|
|
|
|
|
|
|
|
|
| Life Sciences, Tools & Services |
| 0.5 | % | 1.5 | % |
|
| 1.4 | % |
5,700 |
| 152,700 |
|
|
| 158,400 |
| Invitrogen Corp. |
| 376,599 | * | 10,088,889 | * |
|
| 10,465,488 |
|
|
|
|
|
|
|
|
|
|
|
|
|
|
|
|
|
|
|
|
|
|
|
|
|
|
| Machinery & Equipment |
| 1.8 | % | 3.0 | % |
|
| 2.9 | % |
|
| 183,500 |
|
|
| 183,500 |
| Danaher Corp. |
|
|
| 11,802,720 |
|
|
| 11,802,720 |
|
|
| 170,700 |
|
|
| 170,700 |
| IDEX Corp. |
|
|
| 8,057,040 |
|
|
| 8,057,040 |
|
26,600 |
|
|
|
|
| 26,600 |
| JLG Industries, Inc. |
| 598,500 |
|
|
|
|
| 598,500 |
|
16,100 |
|
|
|
|
| 16,100 |
| Joy Global, Inc. |
| 838,649 |
|
|
|
|
| 838,649 |
|
|
|
|
|
|
|
|
|
|
|
|
|
|
|
|
| 21,296,909 |
|
|
|
|
|
|
|
|
|
|
|
|
|
|
|
|
|
|
|
|
|
|
|
|
|
|
| Manufacturing |
| 2.6 | % |
|
|
|
| 0.3 | % |
8,400 |
|
|
|
|
| 8,400 |
| Harsco Corp. |
| 654,864 |
|
|
|
|
| 654,864 |
|
7,000 |
|
|
|
|
| 7,000 |
| Rockwell Automation, Inc. |
| 504,070 |
|
|
|
|
| 504,070 |
|
21,000 |
|
|
|
|
| 21,000 |
| Trinity Industries, Inc. |
| 848,400 | * |
|
|
|
| 848,400 |
|
|
|
|
|
|
|
|
|
|
|
|
|
|
|
|
| 2,007,334 |
|
|
|
|
|
|
|
|
|
|
|
|
|
|
|
|
|
|
|
|
|
|
|
|
|
|
| Media |
|
|
| 2.6 | % |
|
| 2.3 | % |
|
| 165,200 |
|
|
| 165,200 |
| E.W. Scripps Co. (The) (Class A Stock) |
|
|
| 7,126,728 |
|
|
| 7,126,728 |
|
|
| 494,600 |
|
|
| 494,600 |
| Regal Entertainment Group (Class A Stock) |
|
|
| 10,050,272 | (a) |
|
| 10,050,272 |
|
|
|
|
|
|
|
|
|
|
|
|
|
|
|
|
| 17,177,000 |
|
|
|
|
|
|
|
|
|
|
|
|
|
|
|
|
|
|
|
|
|
|
|
|
|
|
| Metals & Mining |
| 1.7 | % | 3.8 | % |
|
| 3.6 | % |
|
| 147,600 |
|
|
| 147,600 |
| Arch Coal, Inc. |
|
|
| 6,253,812 |
|
|
| 6,253,812 |
|
|
| 314,600 |
|
|
| 314,600 |
| Goldcorp, Inc. |
|
|
| 9,507,212 | (a) |
|
| 9,507,212 |
|
|
| 222,600 |
|
|
| 222,600 |
| Harmony Gold Mining Co. Ltd. (ADR) (South Africa) |
|
|
| 3,626,154 | * (a) |
|
| 3,626,154 |
|
|
| 163,100 |
|
|
| 163,100 |
| Massey Energy Corp. |
|
|
| 5,871,600 | (a) |
|
| 5,871,600 |
|
F-14
|
|
|
|
|
| Pro-forma combined |
|
|
|
|
|
|
|
|
| Pro-forma combined |
|
SP New Era |
| Emerging |
| Pro-forma |
| Emerging |
|
|
| SP New Era |
| Emerging |
| Pro-forma |
| Emerging |
|
Growth |
| Growth |
| adjustments |
| Growth |
|
|
| Growth |
| Growth |
| adjustments |
| Growth |
|
Shares |
| Shares |
| Shares |
| Shares |
|
|
| Value |
| Value |
| Value |
| Value |
|
7,300 |
|
|
|
|
| 7,300 |
| Precision Castparts Corp. |
| 436,248 |
|
|
|
|
| 436,248 |
|
11,800 |
|
|
|
|
| 11,800 |
| Titanium Metals Corp. |
| 405,684 | * |
|
|
|
| 405,684 |
|
6,600 |
|
|
|
|
| 6,600 |
| United States Steel Corp. |
| 462,792 | * |
|
|
|
| 462,792 |
|
|
|
|
|
|
|
|
|
|
|
|
|
|
|
|
| 26,563,502 |
|
|
|
|
|
|
|
|
|
|
|
|
|
|
|
|
|
|
|
|
|
|
|
|
|
|
| Networking/Telecommunications Equipment |
| 0.5 | % |
|
|
|
| 0.1 | % |
5,800 |
|
|
|
|
| 5,800 |
| Research in Motion Ltd. (Canada) |
| 404,666 |
|
|
|
|
| 404,666 |
|
|
|
|
|
|
|
|
|
|
|
|
|
|
|
|
|
|
|
|
|
|
|
|
|
|
| Oil, Gas & Consumable Fuels |
| 8.1 | % | 2.3 | % |
|
| 2.9 | % |
11,800 |
|
|
|
|
| 11,800 |
| Consol Energy, Inc. |
| 551,296 |
|
|
|
|
| 551,296 |
|
20,600 |
|
|
|
|
| 20,600 |
| FMC Technologies, Inc. |
| 1,389,676 | * |
|
|
|
| 1,389,676 |
|
13,400 |
|
|
|
|
| 13,400 |
| Frontier Oil Corp. |
| 434,160 |
|
|
|
|
| 434,160 |
|
12,700 |
|
|
|
|
| 12,700 |
| Helmerich & Payne, Inc. |
| 765,302 | * |
|
|
|
| 765,302 |
|
|
| 129,700 |
|
|
| 129,700 |
| Noble Energy, Inc. |
|
|
| 6,077,742 |
|
|
| 6,077,742 |
|
22,200 |
|
|
|
|
| 22,200 |
| Oceaneering International, Inc. |
| 1,017,870 |
|
|
|
|
| 1,017,870 |
|
17,300 |
|
|
|
|
| 17,300 |
| Range Resources Corp. |
| 470,387 | * |
|
|
|
| 470,387 |
|
|
| 287,800 |
|
|
| 287,800 |
| Southwestern Energy Co. |
|
|
| 8,967,848 | * |
|
| 8,967,848 |
|
10,500 |
|
|
|
|
| 10,500 |
| Ultra Petroleum Corp. (Canada) |
| 622,335 | * |
|
|
|
| 622,335 |
|
10,700 |
|
|
|
|
| 10,700 |
| Veritas DGC, Inc. |
| 551,906 |
|
|
|
|
| 551,906 |
|
13,900 |
|
|
|
|
| 13,900 |
| Whiting Petroleum Corp. |
| 581,993 | * |
|
|
|
| 581,993 |
|
|
|
|
|
|
|
|
|
|
|
|
|
|
|
|
| 21,430,515 |
|
|
|
|
|
|
|
|
|
|
|
|
|
|
|
|
|
|
|
|
|
|
|
|
|
|
| Pharmaceuticals |
| 2.3 | % | 1.4 | % |
|
| 1.5 | % |
8,300 |
|
|
|
|
| 8,300 |
| Alkermes, Inc. |
| 156,345 |
|
|
|
|
| 156,345 |
|
7,600 |
|
|
|
|
| 7,600 |
| Barr Pharmaceuticals, Inc. |
| 362,444 | * |
|
|
|
| 362,444 |
|
15,000 |
|
|
|
|
| 15,000 |
| Cubist Pharmaceuticals, Inc. |
| 377,700 | * |
|
|
|
| 377,700 |
|
20,200 |
|
|
|
|
| 20,200 |
| CV Therapeutics, Inc. |
| 282,194 | * |
|
|
|
| 282,194 |
|
|
| 183,800 |
|
|
| 183,800 |
| Endo Pharmaceuticals Holdings, Inc. |
|
|
| 6,061,724 | * |
|
| 6,061,724 |
|
|
| 81,400 |
|
|
| 81,400 |
| Kos Pharmaceuticals, Inc. |
|
|
| 3,062,268 | * (a) |
|
| 3,062,268 |
|
11,500 |
|
|
|
|
| 11,500 |
| Nuvelo, Inc. |
| 191,475 | * |
|
|
|
| 191,475 |
|
9,700 |
|
|
|
|
| 9,700 |
| Onyx Pharmaceuticals, Inc. |
| 163,251 | * |
|
|
|
| 163,251 |
|
23,400 |
|
|
|
|
| 23,400 |
| Salix Pharmaceuticals Ltd. |
| 287,820 | * |
|
|
|
| 287,820 |
|
|
|
|
|
|
|
|
|
|
|
|
|
|
|
|
| 10,945,221 |
|
|
|
|
|
|
|
|
|
|
|
|
|
|
|
|
|
|
|
|
|
|
|
|
|
|
| Real Estate |
|
|
| 1.0 | % |
|
| 0.9 | % |
|
| 313,100 |
|
|
| 313,100 |
| Host Hotels & Resorts, Inc. |
|
|
| 6,847,497 | (a) |
|
| 6,847,497 |
|
|
|
|
|
|
|
|
|
|
|
|
|
|
|
|
|
|
|
|
|
|
|
|
|
|
| Retail & Merchandising |
| 1.0 | % |
|
|
|
| 0.1 | % |
19,500 |
|
|
|
|
| 19,500 |
| Circuit City Stores, Inc. |
| 530,790 | * |
|
|
|
| 530,790 |
|
8,500 |
|
|
|
|
| 8,500 |
| Coldwater Creek |
| 227,460 | * |
|
|
|
| 227,460 |
|
|
|
|
|
|
|
|
|
|
|
|
|
|
|
|
| 758,250 |
|
|
|
|
|
|
|
|
|
|
|
|
|
|
|
|
|
|
|
|
|
|
|
|
|
|
| Semiconductors & Semiconductor Equipment |
| 8.0 | % | 5.2 | % |
|
| 5.5 | % |
32,300 |
|
|
|
|
| 32,300 |
| Advanced Micro Devices, Inc. |
| 788,766 | * |
|
|
|
| 788,766 |
|
100,000 |
|
|
|
|
| 100,000 |
| Atmel Corp. |
| 555,000 | * |
|
|
|
| 555,000 |
|
35,300 |
| 202,095 |
|
|
| 237,395 |
| Broadcom Corp. (Class A Stock) |
| 1,060,765 | * | 6,072,955 | * |
|
| 7,133,720 |
|
13,475 |
|
|
|
|
| 13,475 |
| Hittite Microwave Corp. |
| 487,256 | * |
|
|
|
| 487,256 |
|
|
| 791,900 |
|
|
| 791,900 |
| Integrated Device Technology, Inc. |
|
|
| 11,229,142 | * (a) |
|
| 11,229,142 |
|
|
| 375,500 |
|
|
| 375,500 |
| Intersil Corp. (Class A Stock) |
|
|
| 8,730,375 |
|
|
| 8,730,375 |
|
25,000 |
|
|
|
|
| 25,000 |
| LSI Logic Corp. |
| 223,750 | * |
|
|
|
| 223,750 |
|
12,400 |
|
|
|
|
| 12,400 |
| Marvell Technology Group Ltd. (Bermuda) |
| 549,692 | * |
|
|
|
| 549,692 |
|
27,800 |
|
|
|
|
| 27,800 |
| MEMC Electronic Materials, Inc. |
| 1,042,500 | * |
|
|
|
| 1,042,500 |
|
16,200 |
|
|
|
|
| 16,200 |
| National Semiconductor Corp. |
| 386,370 |
|
|
|
|
| 386,370 |
|
27,800 |
|
|
|
|
| 27,800 |
| Nvidia Corp. |
| 591,862 | * |
|
|
|
| 591,862 |
|
17,700 |
|
|
|
|
| 17,700 |
| Silicon Laboratories, Inc. |
| 622,155 |
|
|
|
|
| 622,155 |
|
|
| 591,400 |
|
|
| 591,400 |
| Teradyne, Inc. |
|
|
| 8,238,202 | * |
|
| 8,238,202 |
|
|
|
|
|
|
|
|
|
|
|
|
|
|
|
|
| 40,578,790 |
|
|
|
|
|
|
|
|
|
|
|
|
|
|
|
|
|
|
|
|
|
|
|
|
|
|
| Software |
| 4.3 | % | 6.3 | % |
|
| 6.1 | % |
|
| 314,176 |
|
|
| 314,176 |
| Adobe Systems, Inc. |
|
|
| 9,538,383 | * |
|
| 9,538,383 |
|
|
| 386,000 |
|
|
| 386,000 |
| Amdocs Ltd. |
|
|
| 14,127,600 | * |
|
| 14,127,600 |
|
15,000 |
|
|
|
|
| 15,000 |
| Ansys, Inc. |
| 717,300 | * |
|
|
|
| 717,300 |
|
|
| 718,615 |
|
|
| 718,615 |
| BEA Systems, Inc. |
|
|
| 9,406,670 | * (a) |
|
| 9,406,670 |
|
19,500 |
|
|
|
|
| 19,500 |
| BMC Software, Inc. |
| 466,050 | * |
|
|
|
| 466,050 |
|
12,000 |
| 216,470 |
|
|
| 228,470 |
| Citrix Systems, Inc. |
| 481,680 | * | 8,689,106 | * |
|
| 9,170,786 |
|
42,000 |
|
|
|
|
| 42,000 |
| Compuware Corp. |
| 281,400 | * |
|
|
|
| 281,400 |
|
38,000 |
|
|
|
|
| 38,000 |
| Red Hat, Inc. |
| 889,200 | * |
|
|
|
| 889,200 |
|
20,700 |
|
|
|
|
| 20,700 |
| Salesforce.com, Inc. |
| 551,862 | * |
|
|
|
| 551,862 |
|
|
|
|
|
|
|
|
|
|
|
|
|
|
|
|
| 45,149,251 |
|
|
|
|
|
|
|
|
|
|
|
|
|
|
|
|
|
|
|
|
|
|
|
|
|
|
| Specialty Retail |
| 2.8 | % | 2.2 | % |
|
| 2.3 | % |
|
| 106,900 |
|
|
| 106,900 |
| Abercrombie & Fitch Co. (Class A Stock) |
|
|
| 5,925,467 |
|
|
| 5,925,467 |
|
600 |
|
|
|
|
| 600 |
| J.Crew Group, Inc. |
| 16,470 |
|
|
|
|
| 16,470 |
|
17,100 |
|
|
|
|
| 17,100 |
| MSC Industrial Direct Co., Inc. |
| 813,447 |
|
|
|
|
| 813,447 |
|
F-15
|
|
|
|
|
| Pro-forma combined |
|
|
|
|
|
|
|
|
| Pro-forma combined |
|
SP New Era |
| Emerging |
| Pro-forma |
| Emerging |
|
|
| SP New Era |
| Emerging |
| Pro-forma |
| Emerging |
|
Growth |
| Growth |
| adjustments |
| Growth |
|
|
| Growth |
| Growth |
| adjustments |
| Growth |
|
Shares |
| Shares |
| Shares |
| Shares |
|
|
| Value |
| Value |
| Value |
| Value |
|
23,000 |
|
|
|
|
| 23,000 |
| Nordstrom, Inc. |
| 839,500 |
|
|
|
|
| 839,500 |
|
14,800 |
|
|
|
|
| 14,800 |
| Office Depot, Inc. |
| 562,400 | * |
|
|
|
| 562,400 |
|
|
| 187,535 |
|
|
| 187,535 |
| Ross Stores, Inc. |
|
|
| 5,260,357 |
|
|
| 5,260,357 |
|
|
| 207,320 |
|
|
| 207,320 |
| Urban Outfitters, Inc. |
|
|
| 3,626,027 | * (a) |
|
| 3,626,027 |
|
|
|
|
|
|
|
|
|
|
|
|
|
|
|
|
| 17,043,668 |
|
|
|
|
|
|
|
|
|
|
|
|
|
|
|
|
|
|
|
|
|
|
|
|
|
|
| Telecommunications |
| 0.8 | % |
|
|
|
| 0.0 | % |
48,300 |
|
|
|
|
| 48,300 |
| Tellabs, Inc. |
| 642,873 | * |
|
|
|
| 642,873 |
|
|
|
|
|
|
|
|
|
|
|
|
|
|
|
|
|
|
|
|
|
|
|
|
|
|
| Transportation |
| 1.3 | % |
|
|
|
| 0.1 | % |
18,200 |
|
|
|
|
| 18,200 |
| Expeditors International Washington, Inc. |
| 1,019,382 | * |
|
|
|
| 1,019,382 |
|
|
|
|
|
|
|
|
|
|
|
|
|
|
|
|
|
|
|
|
|
|
|
|
|
|
| Wireless Telecommunication Services |
| 1.8 | % | 5.3 | % |
|
| 4.9 | % |
14,000 |
| 433,200 |
|
|
| 447,200 |
| American Tower Corp. (Class A Stock) |
| 435,680 | * | 13,481,184 | * (a) |
|
| 13,916,864 |
|
17,900 |
| 384,690 |
|
|
| 402,590 |
| NII Holdings, Inc. |
| 1,009,202 | * | 21,688,822 | * (a) |
|
| 22,698,024 |
|
|
|
|
|
|
|
|
|
|
|
|
|
|
|
|
| 36,614,888 |
|
|
|
|
|
|
|
|
|
|
|
|
|
|
|
|
|
|
|
|
|
|
|
|
|
|
| Total Long-Term Investments |
| 77,921,640 |
| 635,577,654 |
|
|
| 713,499,294 |
|
|
|
|
|
|
|
|
| (cost $69,133,932, $556,031,963, $625,165,026) |
|
|
|
|
|
|
|
|
|
|
|
|
|
|
|
|
|
|
|
|
|
|
|
|
|
|
|
|
|
|
|
|
|
|
| SHORT-TERM INVESTMENTS |
| 1.1 | % | 25.6 | % |
|
| 23.0 | % |
|
|
|
|
|
|
|
| Affiliated Money Market Mutual Fund |
|
|
|
|
|
|
|
|
|
840,699 |
| 169,562,501 |
|
|
| 170,403,200 |
| Dryden Core Investment Fund-Taxable Money Market Series |
|
|
|
|
|
|
|
|
|
|
|
|
|
|
|
|
| (cost $840,699) |
| 840,699 |
|
|
|
|
|
|
|
|
|
|
|
|
|
|
| (cost $169,562,501; includes $145,951,756 of cash collateral for securities on loan) (b)(c) |
|
|
| 169,562,501 |
|
|
|
|
|
|
|
|
|
|
|
|
| (cost $170,403,200; includes $145,951,756 of cash collateral for securities on loan) (b)(c) |
|
|
|
|
|
|
| 170,403,200 |
|
|
|
|
|
|
|
|
|
|
|
|
|
|
|
|
|
|
|
|
|
|
|
|
|
|
| Total Investments |
| 100.4 | % | 121.7 | % |
|
| 119.4 | % |
|
|
|
|
|
|
|
| (cost $69,974,631, $725,594,463, $795,568,226) |
| 78,762,339 |
| 805,140,155 |
|
|
| 883,902,494 |
|
|
|
|
|
|
|
|
|
|
|
|
|
|
|
|
|
|
|
|
|
|
|
|
|
|
| Liabilities in excess of other assets -0.4%, -21.7%, -19.4% |
|
|
|
|
|
|
|
|
|
|
|
|
|
|
|
|
|
|
| (294,485 | ) | (143,530,168 | ) | (181,000 | )(d) | (144,005,653 | ) |
|
|
|
|
|
|
|
|
|
|
|
|
|
|
|
|
|
|
|
|
|
|
|
|
|
| Net Assets |
| 78,467,854 |
| 661,609,987 |
| (181,000 | )(d) | 739,896,841 |
|
|
|
|
|
|
|
|
|
|
| 100.0 | % | 100.0 | % |
|
| 100.0 | % |
The following abbreviations are used in portfolio descriptions:
ADR - American Depositary Receipt
* Non-income producing security.
(a) Securities, or portion thereof, on loan with an aggregate market value of $140,789,609; cash collateral of $145,951,756 (included in liabilities) was received with which the Fund purchased highly liquid short-term investments.
(b) Represents security, or a portion thereof, purchased with cash collateral received for securities on loan.
(c) Prudential Investments LLC, the manager of the Fund also serves as manager of the Dryden Core Investment Fund-Taxable Money Market Series.
(d) Amounts reflect the adjustment to the Pro Forma Statement of Assets and Liabilities for the Reorganization relating to reorganization expenses attributable to SP New Era Growth Fund.
SP New Era Growth Fund does not expect that any investments must be sold as a result of the Reorganization.
F-16
Pro Forma Statement of Assets and Liabilities for the Transaction
as of June 30, 2006
(Unaudited)
|
| SP New Era |
| Emerging |
| Pro-Forma |
| Pro-Forma |
| ||||
Assets |
|
|
|
|
|
|
|
|
| ||||
|
|
|
|
|
|
|
|
|
| ||||
Investments at value, including securities on loan(C) |
|
|
|
|
|
|
|
|
| ||||
Unaffiliated Investments(A) |
| $ | 77,921,640 |
| $ | 635,577,654 |
|
|
| $ | 713,499,294 |
| |
Affiliated Investments(B) |
| 840,699 |
| 169,562,501 |
|
|
| 170,403,200 |
| ||||
Cash |
| 299,016 |
| 24,625 |
|
|
| 323,641 |
| ||||
Receivable for investments sold |
| 121,617 |
| 8,496,905 |
|
|
| 8,618,522 |
| ||||
Receivable for Fund shares sold |
| 3,718 |
| 274,575 |
|
|
| 278,293 |
| ||||
Dividends and interest receivable |
| 20,032 |
| 192,321 |
|
|
| 212,353 |
| ||||
Prepaid expenses |
|
|
| 2,328 |
|
|
| 2,328 |
| ||||
Total assets |
| 79,206,722 |
| 814,130,909 |
|
|
| 893,337,631 |
| ||||
|
| ‘ |
|
|
|
|
|
|
| ||||
Liabilities |
|
|
|
|
|
|
|
|
| ||||
|
|
|
|
|
|
|
|
|
| ||||
Payable to Broker for collateral for securities on loan |
|
|
| 145,951,756 |
|
|
| 145,951,756 |
| ||||
Payable to Investment Manager |
| 1,224 |
|
|
|
|
| 1,224 |
| ||||
Payable for investments purchased |
| 65,330 |
| 4,708,671 |
|
|
| 4,774,001 |
| ||||
Payable for Fund shares reacquired |
| 223,152 |
| 550,679 |
|
|
| 773,831 |
| ||||
Accrued expenses |
| 171,382 |
| 222,296 |
| 181,000 | (F) | 466,409 |
| ||||
Management fee payable |
| 65,334 |
| 244,468 |
|
|
| 309,802 |
| ||||
Distribution fee payable |
| 185,114 |
| 210,335 |
|
|
| 395,449 |
| ||||
Transfer agent fee payable |
| 27,332 |
| 628,792 |
|
|
| 656,124 |
| ||||
Deferred directors’ fees |
|
|
| 3,925 |
|
|
| 3,925 |
| ||||
Total liabilities |
| 738,868 |
| 152,520,922 |
| 181,000 |
| 153,332,521 |
| ||||
|
|
|
|
|
|
|
|
|
| ||||
Net Assets |
| $ | 78,467,854 |
| $ | 661,609,987 |
| (181,000 | ) | $ | 739,896,841 |
| |
|
|
|
|
|
|
|
|
|
| ||||
Net assets were comprised of: |
|
|
|
|
|
|
|
|
| ||||
Common stock, at par ($.001 par value; unlimited shares authorized for issuance for each fund) |
| $ | 8,822 |
| $ | 32,570 |
|
|
| $ | 41,392 |
| |
Paid-in capital in excess of par |
| 162,038,356 |
| 700,229,834 |
| (181,000 | )(F) | 862,087,190 |
| ||||
|
| 162,047,178 |
| 700,262,404 |
| (181,000 | ) | 862,128,582 |
| ||||
Accumulated net operating loss |
| (3,960,568 | ) | (5,351,284 | ) |
|
| (9,311,852 | ) | ||||
Accumulated net realized loss on investments |
| (88,406,464 | ) | (112,846,825 | ) |
|
| (201,253,289 | ) | ||||
Net unrealized appreciation on investments |
| 8,787,708 |
| 79,545,692 |
|
|
| 88,333,400 |
| ||||
Net assets, June 30, 2006 |
| $ | 78,467,854 |
| $ | 661,609,987 |
| (181,000 | ) | $ | 739,896,841 |
| |
|
|
|
|
|
|
|
|
|
| ||||
| |||||||||||||
(A) Unaffiliated Investments at Cost |
| $ | 69,133,932 |
| $ | 556,031,962 |
|
|
| $ | 625,165,894 |
| |
(B) Affiliated Investments at Cost |
| $ | 840,699 |
| $ | 169,562,501 |
|
|
| $ | 170,403,200 |
| |
(C) Securities Loaned at Value |
| $ | — |
| $ | 140,789,609 |
|
|
| $ | 140,789,609 |
| |
|
|
|
|
|
|
|
|
|
| ||||
Class A |
|
|
|
|
|
|
|
|
| ||||
Net assets |
| $ | 15,052,080 |
| $ | 340,584,373 |
| $ | (34,720 | )(F) | $ | 355,601,733 |
|
Shares of common stock issued and outstanding) |
| 1,641,510 |
| 16,547,095 |
| (911,900 | )(D) | 17,276,705 |
| ||||
Net asset value and redemption price per share |
| $ | 9.17 |
| $ | 20.58 |
|
|
| $ | 20.58 |
| |
Maximum sales charge (5.5% of offering price) |
| 0.53 |
| 1.20 |
|
|
| 1.20 |
| ||||
Maximum offering price to public |
| $ | 9.70 |
| $ | 21.78 |
|
|
| $ | 21.78 |
| |
Class B |
|
|
|
|
|
|
|
|
| ||||
Net assets |
| $ | 34,833,677 |
| $ | 96,358,847 |
| (80,350 | )(F) | $ | 131,112,174 |
| |
Shares of common stock issued and outstanding) |
| 3,959,218 |
| 5,074,089 |
| (2,129,168 | )(D) | 6,904,139 |
| ||||
Net asset value, offering price and redemption price per share |
| $ | 8.80 |
| $ | 18.99 |
|
|
| $ | 18.99 |
| |
Class C |
|
|
|
|
|
|
|
|
| ||||
Net assets |
| $ | 24,282,815 |
| $ | 41,894,449 |
| (56,013 | )(F) | $ | 66,121,251 |
| |
Shares of common stock issued and outstanding) |
| 2,759,319 |
| 2,205,530 |
| (1,483,901 | )(D) | 3,480,948 |
| ||||
Offering price and redemption price per share |
| $ | 8.80 |
| $ | 19.00 |
|
|
| $ | 19.00 |
| |
Class L |
|
|
|
|
|
|
|
|
| ||||
Net assets |
| $ | — |
| $ | 5,311,281 |
| — |
| $ | 5,311,281 |
| |
Shares of common stock issued and outstanding) |
| — |
| 258,046 |
| — |
| 258,046 |
| ||||
Net asset value, offering price and redemption price per share |
| — |
| $ | 20.58 |
| — |
| $ | 20.58 |
| ||
Class M |
|
|
|
|
|
|
|
|
| ||||
Net assets |
| $ | — |
| $ | 1,609,537 |
| — |
| $ | 1,609,537 |
| |
Shares of common stock issued and outstanding) |
| — |
| 84,739 |
| — |
| 84,739 |
| ||||
Net asset value, offering price and redemption price per share |
| — |
| $ | 18.99 |
| — |
| $ | 18.99 |
| ||
Class R |
|
|
|
|
|
|
|
|
| ||||
Net assets |
| $ | — |
| $ | 3,012 |
| — |
| $ | 3,012 |
| |
Shares of common stock issued and outstanding) |
| — |
| 147 |
| — |
| 147 |
| ||||
Net asset value, offering price and redemption price per share |
| — |
| $ | 20.51 |
| — |
| $ | 20.51 |
| ||
Class X |
|
|
|
|
|
|
|
|
| ||||
Net assets |
| $ | — |
| $ | 12,715,018 |
| — |
| $ | 12,715,018 |
| |
Shares of common stock issued and outstanding) |
| — |
| 670,088 |
| — |
| 670,088 |
| ||||
Net asset value, offering price and redemption price per share |
| — |
| $ | 18.98 |
| — |
| $ | 18.98 |
| ||
Class Z |
|
|
|
|
|
|
|
|
| ||||
Net assets |
| $ | 4,299,282 |
| $ | 163,133,470 |
| (9,917 | )(F) | $ | 167,422,835 |
| |
Shares of common stock issued and outstanding) |
| 461,815 |
| 7,730,240 |
| (258,559 | )(D) | 7,933,496 |
| ||||
Net asset value, offering price and redemption price per share |
| $ | 9.31 |
| $ | 21.10 |
| — |
| $ | 21.10 |
| |
(D) Represents the difference between total additional shares to be issued (see note 2) and current Emerging Growth Fund shares outstanding
(E) Class R’s unrounded net assets and total shares outstanding for Emerging Growth Fund are $3,011.58 and 146.8, respectively.
(F) Reflects the estimated Reorganization expenses of $181,000 attributable to SP New Era Growth Fund.
See Notes to Pro-Forma Financial Statements
F-17
Pro-Forma Statement of Operations for the Transaction
For the Period Ended 6/30/06
(Unaudited)
|
| SP New Era |
| Jennison |
| Adjusting |
| Pro-Forma |
| ||||
Statement of Operations |
|
|
|
|
|
|
|
|
| ||||
Income: |
|
|
|
|
|
|
|
|
| ||||
Interest |
| $ | 324 |
| $ | 5,530 |
|
|
| $ | 5,854 |
| |
Unaffiliated Dividend Income |
| 738,383 |
|
| 7,837,418 |
|
|
| 8,575,801 |
| |||
Affiliated Dividend Income |
| 20,706 |
| — |
|
|
| 20,706 |
| ||||
Affiliated Income from Securities Loaned |
| 29,788 |
| 328,772 |
|
|
| 358,560 |
| ||||
Foreign taxes Withheld |
| (850 | ) | (10,940 | ) |
|
| (11,790 | ) | ||||
Total Income |
| 788,351 |
| 8,160,780 |
|
|
| 8,949,131 |
| ||||
|
|
|
|
|
|
|
|
|
| ||||
Expenses: |
|
|
|
|
|
|
|
|
| ||||
Management Fee |
| 794,902 |
| 4,149,524 |
| (264,968 | )(b) | 4,679,458 |
| ||||
Distribution Fees - Class A |
| 41,503 |
| 870,205 |
|
|
| 911,709 |
| ||||
Distribution Fees - Class B |
| 397,196 |
| 1,084,555 |
|
|
| 1,481,751 |
| ||||
Distribution Fees - Class C |
| 273,216 |
| 450,196 |
|
|
| 723,412 |
| ||||
Distribution Fees - Class L |
| — |
| 31,975 |
|
|
| 31,975 |
| ||||
Distribution Fees - Class M |
| — |
| 141,652 |
|
|
| 141,652 |
| ||||
Distribution Fees - Class R |
| — |
| 16 |
|
|
| 16 |
| ||||
Distribution Fees - Class X |
| — |
| 27,449 |
|
|
| 27,449 |
| ||||
Transfer Agent Fees(a) |
| 210,000 |
| 1,570,000 |
|
|
| 1,780,000 |
| ||||
Accounting & Custody ** |
| 129,000 |
| 91,000 |
| (20,000 | )(b) | 200,000 |
| ||||
Legal Fees and expenses |
| 24,000 |
| 50,000 |
| (11,000 | )(b) | 63,000 |
| ||||
Audit Fees |
| 17,000 |
| 33,000 |
| (10,000 | )(b) | 40,000 |
| ||||
Directors Fees |
| 16,000 |
| 24,000 |
| (8,000 | )(b) | 32,000 |
| ||||
Reports to Shareholders |
| 39,000 |
| 216,000 |
| (22,000 | )(b) | 233,000 |
| ||||
Registration Fees |
| 50,000 |
| 98,000 |
| (25,000 | )(b) | 123,000 |
| ||||
Loan Interest Expense |
| 974 |
| — |
|
|
| 974 |
| ||||
Miscellaneous Expenses |
| 18,452 |
| 15,238 |
| (5,000 | )(b) | 28,690 |
| ||||
|
|
|
|
|
|
|
|
|
| ||||
Total Expenses |
| 2,011,243 |
| 8,852,810 |
| (365,967 | ) | 10,498,086 |
| ||||
Less: Expense Reimbursement ** |
| — |
| — |
| — |
| (233,973 | ) | ||||
|
|
|
|
|
|
|
|
|
| ||||
Net Expenses |
| 2,011,243 |
| 8,852,810 |
| (365,967 | ) | 10,264,113 |
| ||||
|
|
|
|
|
|
|
|
|
| ||||
Net Investment Income (Loss) |
| (1,222,892 | ) | (692,030 | ) | 365,967 |
| (1,314,982 | ) | ||||
|
|
|
|
|
|
|
|
|
| ||||
Realized and Unrealized Gain (Loss) on Investments: |
|
|
|
|
|
|
|
|
| ||||
Net Realized Gain (Loss) on: |
|
|
|
|
|
|
|
|
| ||||
Investments |
| 58,788,786 |
| 109,919,762 |
| — |
| 168,708,548 |
| ||||
Futures |
| — |
| — |
| — |
| 0 |
| ||||
Options Written |
| 68,280 |
| 115,269 |
| — |
| 183,549 |
| ||||
Foreign Currency |
| 3,936 |
| 26 |
| — |
| 3,962 |
| ||||
|
| 58,861,002 |
| 110,035,057 |
| — |
| 168,896,059 |
| ||||
|
|
|
|
|
|
|
|
|
| ||||
Net Change in Unrealized Appreciation (Depreciation) on: |
|
|
|
|
|
|
|
|
| ||||
Investments |
| (9,708,802 | ) | 5,268,908 |
| — |
| (4,439,894 | ) | ||||
Futures |
| — |
| — |
| — |
| 0 |
| ||||
Options Written |
| — |
| 5,399 |
| — |
| 5,399 |
| ||||
Foreign Currency |
| — |
| — |
| — |
| 0 |
| ||||
|
| (9,708,802 | ) | 5,274,307 |
| — |
| (4,434,495 | ) | ||||
|
|
|
|
|
|
|
|
|
| ||||
Net Gain (Loss) on Investments |
| 49,152,200 |
| 115,309,364 |
| — |
| 164,461,564 |
| ||||
|
|
|
|
|
|
|
|
|
| ||||
Net Increase (Decrease) in Net Assets Resulting From Operations |
| $ | 47,929,308 |
| $ | 114,617,334 |
| 365,967 |
| $ | 163,146,582 |
| |
|
|
|
|
|
|
|
|
|
| ||||
| |||||||||||||
(a) Affiliated Transfer Agent’s Fees and Exp |
| $ | 164,000 |
| $ | 1,242,000 |
|
|
|
|
| ||
|
|
|
|
|
|
|
|
|
| ||||
(b) Assumes savings on fund fees due to consolidation. |
| ||||||||||||
|
|
|
|
|
|
|
|
|
| ||||
** – Amounts have been restated to reflect current fee rates and related impact on expense ratio. |
| ||||||||||||
|
|
|
|
|
|
|
|
|
| ||||
F-18
Jennison U.S. Emerging Growth Fund merger with
SP New Era Growth Fund
Notes to Pro-Forma Financial Statements
(unaudited)
1. Basis of Combination – The Pro-Forma Statement of Assets and Liabilities, including the Pro-Forma Schedule of Investments at June 30, 2006 and the related Pro-Forma Statement of Operations (“Pro-Forma Statements”) for the period ended June 30, 2006, reflect the accounts of Jennison U.S. Emerging Growth Fund (the “acquiring” fund), and SP New Era Growth Fund, (the “target” fund) each a “Fund.”
The Pro-Forma Statements give effect to the proposed transfer of all assets and liabilities of SP New Era Growth Fund in exchange for shares in Jennison U. S. Emerging Growth Fund. The Pro-Forma Statements should be read in conjunction with the historical financial statements of each Fund included in their respective Statement of Additional Information.
2. Shares of Beneficial Interest – The pro-forma net asset value per share assumes the issuance of additional Class A, B, C and Z shares of Jennison U.S. Emerging Growth Fund, which would have been issued on June 30, 2006 in connection with the proposed reorganization. Shareholders of SP New Era Growth Fund would become shareholders of Jennison U.S. Emerging Growth Fund, receiving shares of Jennison U.S. Emerging Growth Fund equal to the value of their holdings in SP New Era Growth Fund. The amount of additional shares assumed to be issued has been calculated based on the June 30, 2006 net assets of SP New Era Growth Fund and Jennison U.S. Emerging Growth Fund, the net asset value per share of as follows:
Jennison U.S. Emerging |
| Net Assets of |
|
|
| Per |
| |||||
Additional Shares Issued |
| 6/30/06 |
| Adjustments* |
| 6/30/06 |
| |||||
Class A |
| 729,610 |
| $ | 15,052,080 |
| $ | (34,720 | ) | $ | 20.58 |
|
Class B |
| 1,830,050 |
| $ | 34,833,677 |
| $ | (80,350 | ) | $ | 18.99 |
|
Class C |
| 1,275,418 |
| $ | 24,282,815 |
| $ | (56,013 | ) | $ | 19.00 |
|
Class Z |
| 203,256 |
| $ | 4,299,282 |
| $ | (9,917 | ) | $ | 21.10 |
|
* Reflects the estimated reorganization expenses of $181,000 attributable to SP New Era Growth Fund.
3. Pro-Forma Operations – The Pro-Forma Statement of Operations assumes similar rates of gross investment income for the investments of each Fund. Accordingly, the combined gross investment income is equal to the sum of each Fund’s gross investment income. Certain expenses have been adjusted to reflect the expected expenses of the combined entity. The pro-forma investment management fees and plan of distribution fees of the combined Fund are based on the fee schedule in effect for Jennison U.S. Emerging Growth Fund at the combined level of average net assets for the twelve months ended June 30, 2006. The Pro- Forma Statement of Operations does not include the effect of any realized gains or losses, or transaction fees incurred in connection with the realignment of the portfolio.
4. Security Valuation – Securities listed on a securities exchange are valued at the last sale price on such exchange on the day of valuation or, if there was no sale on such day, at the mean between the last reported bid and ask price or at the last bid price on such day in the
F-19
absence of an asked price. Securities traded via NASDAQ are valued at the NASDAQ official closing price (NOCP) on the day of valuation, or if there was no NOCP, at the last sale price. Securities that are actively traded in the over-the-counter market, including listed securities for which the Manager, in consultation with the subadvisor, believe the primary market to be over-the-counter are valued by an independent agent or principal market maker. Options on securities and indices traded on an exchange are valued at the mean between the most recently quoted bid and asked prices on such exchange. Futures contracts and options thereon traded on a commodities exchange of board of trade are valued at the last sale price at the closing of trading on such exchange or board of trade or, if there was no sale on the applicable commodities exchange or board of trade on such day, at the mean between the most recently quoted bid and asked prices on such exchange or board of trade or at the last bid price in the absence of an asked price. Prices may be obtained from independent pricing services which use information provided by market makers or estimates of market values obtained from yield data relating to investments or securities with similar characteristics. Securities for which reliable market quotations are not readily available, or whose values have been affected by events occurring after the close of the security’s foreign market and before the Funds’ normal pricing time, are valued at fair value in accordance with the Board of Directors’ approved fair valuation procedures. When determining the fair valuation of securities some of the factors influencing the valuation include, the nature of any restrictions on disposition of the securities; assessment of the general liquidity of the securities; the issuer’s financial condition and the markets in which it does business; the cost of the investment; the size of the holding and the capitalization of issuer; the prices of any recent transactions or bids/offers for such securities or any comparable securities; any available analysis media or other reports or information deemed reliable by the investment adviser regarding the issuer or the markets or industry in which it operates. Using fair value to price securities may result in a value that is different from a security’s most recent closing price and from the price used by other mutual funds to calculate their net asset values. Investments in mutual funds are valued at their net assets value as of the close of the New York Stock Exchange on the date of the valuation. Short-term securities that are held in the Funds, which mature in more than 60 days are valued at current market quotations, and those short-term securities, which mature in 60 days or less are valued at, amortized cost, which approximates market value.
5. Estimates – The preparation of financial statements requires management to make estimates and assumptions that affect the reported amounts and disclosures in the financial statements. Actual results could differ from those estimates.
6. Taxes - For Federal income tax purposes, the acquiring fund and each of the target funds is treated as a separate taxpaying entity. It is each Fund’s policy to continue to meet the requirements of the Internal Revenue Code applicable to regulated investment companies and to distribute all of its taxable net income and capital gains, if any, to shareholders. Therefore, no federal income tax provision is required. SP New Era Growth Fund had a capital loss carry forward of $93,526,000 as of February 28, 2006, all of which will have an annual limitation on the amount of utilization under section 382 of the Internal Revenue Code of 1986, as amended. Jennison U.S. Emerging Growth had a capital loss carryforward of $198,229,000 as of October 31, 2005.
F-20
PRO FORMA PORTFOLIO OF INVESTMENTS FOR THE MERGER OF SP MID CAP GROWTH FUND AND SP NEW ERA GROWTH FUND INTO JENNISON U.S. EMERGING GROWTH FUND
AS OF JUNE 30, 2006
(Unaudited)
|
|
|
|
|
|
|
| Pro-forma |
|
|
|
|
|
|
|
|
|
|
| Pro-forma |
| |
|
|
|
|
|
|
|
| combined |
|
|
|
|
|
|
|
|
|
|
| combined |
| |
SP Mid Cap |
| SP New Era |
| Emerging |
| Pro-forma |
| Emerging |
|
|
| SP Mid Cap |
| SP New Era |
| Emerging |
| Pro-forma |
| Emerging |
| |
Growth |
| Growth |
| Growth |
| adjustments |
| Growth |
|
|
| Growth |
| Growth |
| Growth |
| adjustments |
| Growth |
| |
Shares |
| Shares |
| Shares |
| Shares |
| Shares |
|
|
| Value |
| Value |
| Value |
| Value |
| Value |
| |
|
|
|
|
|
|
|
|
|
|
|
|
|
|
|
|
|
|
|
|
|
| |
|
|
|
|
|
|
|
|
|
| LONG-TERM INVESTMENTS |
| 99.5 | % | 99.3 | % | 96.1 | % |
|
| 96.8 | % | |
|
|
|
|
|
|
|
|
|
| COMMON STOCKS |
|
|
|
|
|
|
|
|
|
|
| |
|
|
|
|
|
|
|
|
|
|
|
|
|
|
|
|
|
|
|
|
|
| |
|
|
|
|
|
|
|
|
|
| Advertising |
| 2.0 | % |
|
|
|
|
|
| 0.3 | % | |
42,450 |
|
|
|
|
|
|
| 42,450 |
| Lamar Advertising Co. |
| 2,286,357 | * (a) |
|
|
|
|
|
| $ | 2,286,357 |
|
|
|
|
|
|
|
|
|
|
|
|
|
|
|
|
|
|
|
|
|
|
| |
|
|
|
|
|
|
|
|
|
| Air Freight & Logistics |
|
|
|
|
| 0.7 | % |
|
| 0.6 | % | |
|
|
|
| 194,700 |
|
|
| 194,700 |
| UTI Worldwide, Inc. |
|
|
|
|
| 4,912,281 |
|
|
| 4,912,281 |
| |
|
|
|
|
|
|
|
|
|
|
|
|
|
|
|
|
|
|
|
|
|
| |
|
|
|
|
|
|
|
|
|
| Aerospace & Defense |
| 2.0 | % |
|
|
|
|
|
| 0.3 | % | |
28,584 |
|
|
|
|
|
|
| 28,584 |
| Alliant Techsystems, Inc. |
| 2,182,388 | * (a) |
|
|
|
|
|
| 2,182,388 |
| |
|
|
|
|
|
|
|
|
|
|
|
|
|
|
|
|
|
|
|
|
|
| |
|
|
|
|
|
|
|
|
|
| Audio Technology |
| 0.8 | % |
|
|
|
|
|
| 0.1 | % | |
38,100 |
|
|
|
|
|
|
| 38,100 |
| Dolby Laboratories, Inc. (Class A Stock) |
| 887,730 | * |
|
|
|
|
|
| 887,730 |
| |
|
|
|
|
|
|
|
|
|
|
|
|
|
|
|
|
|
|
|
|
|
| |
|
|
|
|
|
|
|
|
|
| Audio & Visual Equipment |
| 2.0 | % |
|
|
|
|
|
| 0.3 | % | |
26,900 |
|
|
|
|
|
|
| 26,900 |
| Harman International Industries, Inc. |
| 2,296,453 |
|
|
|
|
|
|
| 2,296,453 |
| |
|
|
|
|
|
|
|
|
|
|
|
|
|
|
|
|
|
|
|
|
|
| |
|
|
|
|
|
|
|
|
|
| Auto Parts & Related |
| 1.5 | % |
|
|
|
|
|
| 0.2 | % | |
123,700 |
|
|
|
|
|
|
| 123,700 |
| Gentex Corp. |
| 1,731,800 |
|
|
|
|
|
|
| 1,731,800 |
| |
|
|
|
|
|
|
|
|
|
|
|
|
|
|
|
|
|
|
|
|
|
| |
|
|
|
|
|
|
|
|
|
| Automotive Parts |
| 1.0 | % |
|
|
|
|
|
| 0.1 | % | |
35,500 |
|
|
|
|
|
|
| 35,500 |
| Advanced Auto Parts, Inc. |
| 1,025,950 | * |
|
|
|
|
|
| 1,025,950 |
| |
|
|
|
|
|
|
|
|
|
|
|
|
|
|
|
|
|
|
|
|
|
| |
|
|
|
|
|
|
|
|
|
| Banks |
| 1.4 | % | 1.0 | % |
|
|
|
| 0.3 | % | |
19,300 |
|
|
|
|
|
|
| 19,300 |
| Commerce Bancorp, Inc. |
| 688,431 |
|
|
|
|
|
|
| 688,431 |
| |
|
| 9,500 |
|
|
|
|
| 9,500 |
| Hancock Holding Co. |
|
|
| 532,000 |
|
|
|
|
| 532,000 |
| |
|
| 6,720 |
|
|
|
|
| 6,720 |
| Signature Bank |
|
|
| 217,594 | * |
|
|
|
| 217,594 |
| |
34,300 |
|
|
|
|
|
|
| 34,300 |
| TCF Financial Corp. |
| 907,235 |
|
|
|
|
|
|
| 907,235 |
| |
|
|
|
|
|
|
|
|
|
|
|
|
|
|
|
|
|
|
|
| 2,345,260 |
| |
|
|
|
|
|
|
|
|
|
|
|
|
|
|
|
|
|
|
|
|
|
| |
|
|
|
|
|
|
|
|
|
| Beverages |
| 2.3 | % |
|
|
|
|
|
| 0.3 | % | |
36,400 |
|
|
|
|
|
|
| 36,400 |
| Fortune Brands, Inc. |
| 2,584,764 |
|
|
|
|
|
|
| 2,584,764 |
| |
|
|
|
|
|
|
|
|
|
|
|
|
|
|
|
|
|
|
|
|
|
| |
|
|
|
|
|
|
|
|
|
| Biotechnology |
| 1.4 | % | 3.6 | % | 2.0 | % |
|
| 2.0 | % | |
|
| 31,500 |
|
|
|
|
| 31,500 |
| Applera Corp. - Applied Biosystems Group |
|
|
| 1,019,025 |
|
|
|
|
| 1,019,025 |
| |
|
| 13,800 |
|
|
|
|
| 13,800 |
| Genentech, Inc. |
|
|
| 1,128,840 | * |
|
|
|
| 1,128,840 |
| |
|
|
|
| 335,200 |
|
|
| 335,200 |
| ImClone Systems, Inc. |
|
|
|
|
| 12,952,128 | * (b) |
|
| 12,952,128 |
| |
59,100 |
| 11,700 |
|
|
|
|
| 70,800 |
| MedImmune, Inc. |
| 1,601,610 | * | 317,070 | * |
|
|
|
| 1,918,680 |
| |
|
| 9,900 |
|
|
|
|
| 9,900 |
| Vertex Pharmaceuticals, Inc. |
|
|
| 363,429 |
|
|
|
|
| 363,429 |
| |
|
|
|
|
|
|
|
|
|
|
|
|
|
|
|
|
|
|
|
| 17,382,102 |
| |
|
|
|
|
|
|
|
|
|
|
|
|
|
|
|
|
|
|
|
|
|
| |
|
|
|
|
|
|
|
|
|
| Building Materials & Construction |
|
|
| 1.1 | % |
|
|
|
| 0.1 | % | |
|
| 4,500 |
|
|
|
|
| 4,500 |
| Martin Marietta Materials, Inc. |
|
|
| 410,175 | * |
|
|
|
| 410,175 |
| |
|
| 8,700 |
|
|
|
|
| 8,700 |
| Thor Industries, Inc. |
|
|
| 421,515 |
|
|
|
|
| 421,515 |
| |
|
|
|
|
|
|
|
|
|
|
|
|
|
|
|
|
|
|
|
| 831,690 |
| |
|
|
|
|
|
|
|
|
|
|
|
|
|
|
|
|
|
|
|
|
|
| |
|
|
|
|
|
|
|
|
|
| Business Software & Services |
| 2.1 | % | 3.0 | % |
|
|
|
| 0.5 | % | |
35,100 |
| 34,600 |
|
|
|
|
| 69,700 |
| Cognizant Technology Solutions Corp. |
| 2,364,687 | * | 2,331,002 | * |
|
|
|
| 4,695,689 |
| |
|
|
|
|
|
|
|
|
|
|
|
|
|
|
|
|
|
|
|
|
|
| |
|
|
|
|
|
|
|
|
|
| Capital Markets |
| 0.8 | % | 5.0 | % | 6.1 | % |
|
| 5.3 | % | |
|
| 47,200 |
|
|
|
|
| 47,200 |
| Ameritrade Holdings Corp. |
|
|
| 699,032 |
|
|
|
|
| 699,032 |
| |
|
|
|
| 574,300 |
|
|
| 574,300 |
| Eaton Vance Corp. |
|
|
|
|
| 14,334,528 | (b) |
|
| 14,334,528 |
| |
|
| 34,200 |
|
|
|
|
| 34,200 |
| E*Trade Financial Corp. |
|
|
| 780,444 | * |
|
|
|
| 780,444 |
| |
|
|
|
| 166,500 |
|
|
| 166,500 |
| Lazard Ltd. (Class A Stock) |
|
|
|
|
| 6,726,600 | (b) |
|
| 6,726,600 |
| |
8,700 |
|
|
|
|
|
|
| 8,700 |
| Legg Mason, Inc. |
| 865,824 |
|
|
|
|
|
|
| 865,824 |
| |
|
| 22,800 |
|
|
|
|
| 22,800 |
| Nasdaq Stock Market, Inc. |
|
|
| 681,720 | * |
|
|
|
| 681,720 |
| |
|
|
|
| 189,500 |
|
|
| 189,500 |
| Nuveen Investments, Inc. (Class A Stock) |
|
|
|
|
| 8,157,975 |
|
|
| 8,157,975 |
| |
|
| 24,000 |
|
|
|
|
| 24,000 |
| Price, (T. Rowe) Group, Inc. |
|
|
| 907,440 |
|
|
|
|
| 907,440 |
| |
|
| 18,400 |
|
|
|
|
| 18,400 |
| SEI Investments Co. |
|
|
| 899,392 |
|
|
|
|
| 899,392 |
| |
|
|
|
| 740,500 |
|
|
| 740,500 |
| TD Ameritrade Holding Corp. |
|
|
|
|
| 10,966,805 |
|
|
| 10,966,805 |
| |
|
|
|
|
|
|
|
|
|
|
|
|
|
|
|
|
|
|
|
| 45,019,760 |
| |
F-21
|
|
|
|
|
|
|
| Pro-forma |
|
|
|
|
|
|
|
|
|
|
| Pro-forma |
|
|
|
|
|
|
|
|
| combined |
|
|
|
|
|
|
|
|
|
|
| combined |
|
SP Mid Cap |
| SP New Era |
| Emerging |
| Pro-forma |
| Emerging |
|
|
| SP Mid Cap |
| SP New Era |
| Emerging |
| Pro-forma |
| Emerging |
|
Growth |
| Growth |
| Growth |
| adjustments |
| Growth |
|
|
| Growth |
| Growth |
| Growth |
| adjustments |
| Growth |
|
Shares |
| Shares |
| Shares |
| Shares |
| Shares |
|
|
| Value |
| Value |
| Value |
| Value |
| Value |
|
|
|
|
|
|
|
|
|
|
|
|
|
|
|
|
|
|
|
|
|
|
|
|
|
|
|
|
|
|
|
|
| Chemicals |
|
|
|
|
| 3.4 | % |
|
| 2.6 | % |
|
|
|
| 287,400 |
|
|
| 287,400 |
| Ecolab, Inc. |
|
|
|
|
| 11,662,692 | (b) |
|
| 11,662,692 |
|
|
|
|
| 129,700 |
|
|
| 129,700 |
| Monsanto Co. |
|
|
|
|
| 10,919,443 |
|
|
| 10,919,443 |
|
|
|
|
|
|
|
|
|
|
|
| �� |
|
|
|
|
|
|
|
| 22,582,135 |
|
|
|
|
|
|
|
|
|
|
|
|
|
|
|
|
|
|
|
|
|
|
|
|
|
|
|
|
|
|
|
|
| Commercial Services & Supplies |
| 4.9 | % | 10.4 | % | 9.8 | % |
|
| 9.2 | % |
|
| 13,200 |
|
|
|
|
| 13,200 |
| Advisory Board Co. (The) |
|
|
| 634,788 | * |
|
|
|
| 634,788 |
|
43,400 |
| 13,100 |
|
|
|
|
| 56,500 |
| Alliance Data Systems Corp. |
| 2,552,788 | * (a) | 770,542 | * |
|
|
|
| 3,323,330 |
|
|
|
|
| 731,300 |
|
|
| 731,300 |
| Allied Waste Industries, Inc. |
|
|
|
|
| 8,307,568 | * (b) |
|
| 8,307,568 |
|
|
|
|
| 152,100 |
|
|
| 152,100 |
| ARAMARK Corp. (Class B Stock) |
|
|
|
|
| 5,036,031 |
|
|
| 5,036,031 |
|
|
| 22,300 |
|
|
|
|
| 22,300 |
| Bright Horizons Family Solutions, Inc. |
|
|
| 840,487 | * |
|
|
|
| 840,487 |
|
26,800 |
|
|
| 343,000 |
|
|
| 369,800 |
| ChoicePoint, Inc. |
| 1,119,436 | * |
|
| 14,327,110 | * |
|
| 15,446,546 |
|
|
| 18,400 |
|
|
|
|
| 18,400 |
| Corporate Executive Board Co. (The) |
|
|
| 1,843,680 |
|
|
|
|
| 1,843,680 |
|
|
| 3,700 |
|
|
|
|
| 3,700 |
| Equifax, Inc. |
|
|
| 127,058 |
|
|
|
|
| 127,058 |
|
34,237 |
|
|
| 210,100 |
|
|
| 244,337 |
| Iron Mountain, Inc. |
| 1,279,779 | * |
|
| 7,853,538 | * |
|
| 9,133,317 |
|
|
| 38,000 |
| 126,825 |
|
|
| 164,825 |
| Monster Worldwide, Inc. |
|
|
| 1,621,080 | * | 5,410,354 | * (b) |
|
| 7,031,434 |
|
|
|
|
| 310,500 |
|
|
| 310,500 |
| Nalco Holdings Co. |
|
|
|
|
| 5,474,115 |
|
|
| 5,474,115 |
|
|
|
|
| 177,515 |
|
|
| 177,515 |
| Paychex, Inc. |
|
|
|
|
| 6,919,535 |
|
|
| 6,919,535 |
|
|
| 31,900 |
|
|
|
|
| 31,900 |
| Resources Connection, Inc. |
|
|
| 798,138 | * |
|
|
|
| 798,138 |
|
|
| 27,200 |
| 85,300 |
|
|
| 112,500 |
| Robert Half International, Inc. |
|
|
| 1,142,400 |
| 3,582,600 |
|
|
| 4,725,000 |
|
|
|
|
| 116,900 |
|
|
| 116,900 |
| Stericycle, Inc. |
|
|
|
|
| 7,610,190 | * |
|
| 7,610,190 |
|
|
| 3,800 |
|
|
|
|
| 3,800 |
| Strayer Education, Inc. |
|
|
| 369,056 |
|
|
|
|
| 369,056 |
|
21,700 |
|
|
|
|
|
|
| 21,700 |
| Suntech Power Holdings Co., ADR (China) |
| 613,025 | * (a) |
|
|
|
|
|
| 613,025 |
|
|
|
|
|
|
|
|
|
|
|
|
|
|
|
|
|
|
|
|
| 78,233,298 |
|
|
|
|
|
|
|
|
|
|
|
|
|
|
|
|
|
|
|
|
|
|
|
|
|
|
|
|
|
|
|
|
| Communications Equipment |
|
|
| 1.0 | % | 2.9 | % |
|
| 2.3 | % |
|
|
|
| 726,000 |
|
|
| 726,000 |
| Avaya, Inc. |
|
|
|
|
| 8,290,920 | * |
|
| 8,290,920 |
|
|
|
|
| 543,570 |
|
|
| 543,570 |
| Comverse Technology, Inc. |
|
|
|
|
| 10,746,379 | * (b) |
|
| 10,746,379 |
|
|
| 19,000 |
|
|
|
|
|
|
| Harris Corp. |
|
|
| 788,690 |
|
|
|
|
| 788,690 |
|
|
|
|
|
|
|
|
|
|
|
|
|
|
|
|
|
|
|
|
| 19,825,989 |
|
|
|
|
|
|
|
|
|
|
|
|
|
|
|
|
|
|
|
|
|
|
|
|
|
|
|
|
|
|
|
|
| Computer Hardware |
| 0.8 | % |
|
|
|
|
|
| 0.1 | % |
26,600 |
|
|
|
|
|
|
| 26,600 |
| Zebra Technologies Corp. (Class A Stock) |
| 908,656 | * |
|
|
|
|
|
| 908,656 |
|
|
|
|
|
|
|
|
|
|
|
|
|
|
|
|
|
|
|
|
|
|
|
|
|
|
|
|
|
|
|
|
| Computers & Peripherals |
|
|
| 3.6 | % | 0.7 | % |
|
| 0.9 | % |
|
| 23,700 |
|
|
|
|
| 23,700 |
| Apple Computer, Inc. |
|
|
| 1,353,744 | * |
|
|
|
| 1,353,744 |
|
|
|
|
| 141,900 |
|
|
| 141,900 |
| Avid Technology, Inc. |
|
|
|
|
| 4,729,527 | * (b) |
|
| 4,729,527 |
|
|
| 6,200 |
|
|
|
|
| 6,200 |
| Sandisk Corp. |
|
|
| 316,076 | * |
|
|
|
| 316,076 |
|
|
| 24,700 |
|
|
|
|
| 24,700 |
| Seagate Technology (Cayman Island) |
|
|
| 559,208 | * |
|
|
|
| 559,208 |
|
|
| 29,000 |
|
|
|
|
| 29,000 |
| Western Digital Corp. |
|
|
| 574,490 | * |
|
|
|
| 574,490 |
|
|
|
|
|
|
|
|
|
|
|
|
|
|
|
|
|
|
|
|
| 7,533,045 |
|
|
|
|
|
|
|
|
|
|
|
|
|
|
|
|
|
|
|
|
|
|
|
|
|
|
|
|
|
|
|
|
| Computer Services |
| 3.7 | % | 0.9 | % |
|
|
|
| 0.6 | % |
90,600 |
|
|
|
|
|
|
| 90,600 |
| Ceredian Corp. |
| 2,214,264 | * |
|
|
|
|
|
| 2,214,264 |
|
|
| 28,700 |
|
|
|
|
| 28,700 |
| Electronic Data Systems Corp. |
|
|
| 690,522 |
|
|
|
|
| 690,522 |
|
59,600 |
|
|
|
|
|
|
| 59,600 |
| MoneyGram International, Inc. |
| 2,023,420 |
|
|
|
|
|
|
| 2,023,420 |
|
|
|
|
|
|
|
|
|
|
|
|
|
|
|
|
|
|
|
|
| 4,928,206 |
|
|
|
|
|
|
|
|
|
|
|
|
|
|
|
|
|
|
|
|
|
|
|
|
|
|
|
|
|
|
|
|
| Computer Software |
| 5.3 | % |
|
|
|
|
|
| 0.7 | % |
179,533 |
|
|
|
|
|
|
| 179,533 |
| Activision, Inc. |
| 2,043,086 | * (a) |
|
|
|
|
|
| 2,043,086 |
|
72,744 |
|
|
|
|
|
|
| 72,744 |
| Cogent, Inc. |
| 1,096,252 | * (a) |
|
|
|
|
|
| 1,096,252 |
|
55,200 |
|
|
|
|
|
|
| 55,200 |
| Cognos, Inc. (Canada) |
| 1,570,440 | * |
|
|
|
|
|
| 1,570,440 |
|
29,900 |
|
|
|
|
|
|
| 29,900 |
| NAVTEQ Corp. |
| 1,335,932 | * |
|
|
|
|
|
| 1,335,932 |
|
|
|
|
|
|
|
|
|
|
|
|
|
|
|
|
|
|
|
|
| 6,045,710 |
|
|
|
|
|
|
|
|
|
|
|
|
|
|
|
|
|
|
|
|
|
|
|
|
|
|
|
|
|
|
|
|
| Conglomerates |
| 0.3 | % |
|
|
|
|
|
| 0.0 | % |
7,900 |
|
|
|
|
|
|
| 7,900 |
| ITT Industries, Inc. |
| 391,050 |
|
|
|
|
|
|
| 391,050 |
|
|
|
|
|
|
|
|
|
|
|
|
|
|
|
|
|
|
|
|
|
|
|
|
|
|
|
|
|
|
|
|
| Construction |
| 0.2 | % | 0.5 | % |
|
|
|
| 0.1 | % |
10,200 |
|
|
|
|
|
|
| 10,200 |
| Chicago Bridge & Iron Co. NV (Netherlands) |
| 246,330 |
|
|
|
|
|
|
| 246,330 |
|
|
| 13,000 |
|
|
|
|
| 13,000 |
| Shaw Group, Inc. |
|
|
| 361,400 | * |
|
|
|
| 361,400 |
|
|
|
|
|
|
|
|
|
|
|
|
|
|
|
|
|
|
|
|
| 607,730 |
|
F-22
|
|
|
|
|
|
|
| Pro-forma |
|
|
|
|
|
|
|
|
|
|
| Pro-forma |
|
|
|
|
|
|
|
|
| combined |
|
|
|
|
|
|
|
|
|
|
| combined |
|
SP Mid Cap |
| SP New Era |
| Emerging |
| Pro-forma |
| Emerging |
|
|
| SP Mid Cap |
| SP New Era |
| Emerging |
| Pro-forma |
| Emerging |
|
Growth |
| Growth |
| Growth |
| adjustments |
| Growth |
|
|
| Growth |
| Growth |
| Growth |
| adjustments |
| Growth |
|
Shares |
| Shares |
| Shares |
| Shares |
| Shares |
|
|
| Value |
| Value |
| Value |
| Value |
| Value |
|
|
|
|
|
|
|
|
|
|
|
|
|
|
|
|
|
|
|
|
|
|
|
|
|
|
|
|
|
|
|
|
| Consumer Products & Services |
| 2.5 | % | 1.6 | % |
|
|
|
| 0.5 | % |
|
| 9,800 |
|
|
|
|
| 9,800 |
| GameStop Corporation (Class A Stock) |
|
|
| 411,600 |
|
|
|
|
| 411,600 |
|
|
| 9,500 |
|
|
|
|
| 9,500 |
| Scotts Co. (The) (Class A Stock) |
|
|
| 402,040 | * |
|
|
|
| 402,040 |
|
37,100 |
|
|
|
|
|
|
| 37,100 |
| VCA Antech, Inc. |
| 1,184,603 | * |
|
|
|
|
|
| 1,184,603 |
|
40,400 |
| 10,500 |
|
|
|
|
| 50,900 |
| Weight Watchers International, Inc. |
| 1,651,956 |
| 429,345 |
|
|
|
|
| 2,081,301 |
|
|
|
|
|
|
|
|
|
|
|
|
|
|
|
|
|
|
|
|
| 4,079,544 |
|
|
|
|
|
|
|
|
|
|
|
|
|
|
|
|
|
|
|
|
|
|
|
|
|
|
|
|
|
|
|
|
| Distribution/Wholesale |
| 0.6 | % |
|
|
|
|
|
| 0.1 | % |
|
| 7,200 |
|
|
|
|
| 7,200 |
| WESCO International, Inc. |
| 480,672 | * |
|
|
|
|
|
| 480,672 |
|
|
|
|
|
|
|
|
|
|
|
|
|
|
|
|
|
|
|
|
|
|
|
|
|
|
|
|
|
|
|
|
| Diversified Consumer Services |
|
|
|
|
| 0.4 | % |
|
| 0.3 | % |
|
|
|
| 276,100 |
|
|
| 276,100 |
| Servicemaster Co. (The) |
|
|
|
|
| 2,852,113 |
|
|
| 2,852,113 |
|
|
|
|
|
|
|
|
|
|
|
|
|
|
|
|
|
|
|
|
|
|
|
|
|
|
|
|
|
|
|
|
| Diversified Financial Services |
| 0.3 | % | 2.8 | % | 1.0 | % |
|
| 1.0 | % |
7,700 |
|
|
|
|
|
|
| 7,700 |
| Bankrate, Inc. |
| 290,752 | * (a) |
|
|
|
|
|
| 290,752 |
|
|
| 950 |
|
|
|
|
| 950 |
| Chicago Mercantile Exchange Holdings, Inc. |
|
|
| 466,592 |
|
|
|
|
| 466,592 |
|
|
| 13,900 |
|
|
|
|
| 13,900 |
| GFI Group, Inc. |
|
|
| 749,905 | * |
|
|
|
| 749,905 |
|
|
| 34,600 |
|
|
|
|
| 34,600 |
| Jefferies Group, Inc. |
|
|
| 1,025,198 |
|
|
|
|
| 1,025,198 |
|
|
|
|
| 289,000 |
|
|
| 289,000 |
| Kkr Private Equity Investors LLP |
|
|
|
|
| 6,329,100 |
|
|
| 6,329,100 |
|
|
|
|
|
|
|
|
|
|
|
|
|
|
|
|
|
|
|
|
| 8,861,547 |
|
|
|
|
|
|
|
|
|
|
|
|
|
|
|
|
|
|
|
|
|
|
|
|
|
|
|
|
|
|
|
|
| Education |
|
|
| 0.9 | % | 0.5 | % |
|
| 0.5 | % |
|
|
|
| 62,000 |
|
|
| 62,000 |
| Apollo Group, Inc. (Class A Stock) |
|
|
|
|
| 3,203,540 | * (b) |
|
| 3,203,540 |
|
|
| 16,000 |
|
|
|
|
| 16,000 |
| Laureate Education, Inc. |
|
|
| 682,080 | * |
|
|
|
| 682,080 |
|
|
|
|
|
|
|
|
|
|
|
|
|
|
|
|
|
|
|
|
| 3,885,620 |
|
|
|
|
|
|
|
|
|
|
|
|
|
|
|
|
|
|
|
|
|
|
|
|
|
|
|
|
|
|
|
|
| Electrical Equipment |
| 1.2 | % | 5.2 | % |
|
|
|
| 4.1 | % |
|
|
|
| 216,200 |
|
|
| 216,200 |
| Ametek, Inc. |
|
|
|
|
| 10,243,556 |
|
|
| 10,243,556 |
|
|
|
|
| 187,600 |
|
|
| 187,600 |
| Amphenol Corp. (Class A Stock) |
|
|
|
|
| 10,498,096 |
|
|
| 10,498,096 |
|
|
| 14,600 |
|
|
|
|
| 14,600 |
| Energy Conversion Devices, Inc. |
|
|
| 531,878 | * |
|
|
|
| 531,878 |
|
|
|
|
| 327,200 |
|
|
| 327,200 |
| Insight Enterprises, Inc. |
|
|
|
|
| 6,233,160 | * |
|
| 6,233,160 |
|
|
| 14,000 |
| 255,000 |
|
|
| 269,000 |
| Tektronix, Inc. |
|
|
| 411,880 | * | 7,502,100 |
|
|
| 7,913,980 |
|
|
|
|
|
|
|
|
|
|
|
|
|
|
|
|
|
|
|
|
| 35,420,670 |
|
|
|
|
|
|
|
|
|
|
|
|
|
|
|
|
|
|
|
|
|
|
|
|
|
|
|
|
|
|
|
|
| Electronic Components & Equipment |
| 1.1 | % | 1.0 | % |
|
|
|
| 0.1 | % |
50,400 |
|
|
|
|
|
|
| 50,400 |
| Jabil Circuit, Inc. |
| 1,290,240 | * |
|
|
|
|
|
| 1,290,240 |
|
|
| 42,000 |
|
|
|
|
| 42,000 |
| Synopsys, Inc. |
|
|
| 788,340 | * |
|
|
|
| 788,340 |
|
|
|
|
|
|
|
|
|
|
|
|
|
|
|
|
|
|
|
|
| 2,078,580 |
|
|
|
|
|
|
|
|
|
|
|
|
|
|
|
|
|
|
|
|
|
|
|
|
|
|
|
|
|
|
|
|
| Energy Equipment & Services |
| 5.6 | % | 5.3 | % | 6.4 |
|
|
| 6.2 | % |
|
| 25,000 |
|
|
|
|
| 25,000 |
| BJ Services Co. |
|
|
| 931,500 |
|
|
|
|
| 931,500 |
|
37,900 |
|
|
| 278,900 |
|
|
| 316,800 |
| Grant Prideco, Inc. |
| 1,696,025 | * |
|
| 12,480,775 | * |
|
| 14,176,800 |
|
|
| 33,400 |
|
|
|
|
| 33,400 |
| Nabors Industries Ltd. (Barbados) |
|
|
| 1,128,586 | * |
|
|
|
| 1,128,586 |
|
|
| 8,100 |
| 158,500 |
|
|
| 166,600 |
| National-Oilwell Varco, Inc. |
|
|
| 512,892 | * | 10,036,220 | * |
|
| 10,549,112 |
|
|
|
|
| 411,400 |
|
|
| 411,400 |
| Pride International, Inc. |
|
|
|
|
| 12,848,022 | * (b) |
|
| 12,848,022 |
|
57,150 |
| 35,600 |
|
|
|
|
| 92,750 |
| Smith International, Inc. |
| 2,541,461 |
| 1,583,132 |
|
| * |
|
| 4,124,593 |
|
43,800 |
|
|
| 136,200 |
|
|
| 180,000 |
| Weatherford International Ltd. |
| 2,173,356 |
|
|
| 6,758,244 | * (b) |
|
| 8,931,600 |
|
|
|
|
|
|
|
|
|
|
|
|
|
|
|
|
|
|
|
|
| 52,690,213 |
|
|
|
|
|
|
|
|
|
|
|
|
|
|
|
|
|
|
|
|
|
|
|
|
|
|
|
|
|
|
|
|
| Engineering/Construction |
| 0.5 | % |
|
|
|
|
|
| 0.0 | % |
|
| 8,400 |
|
|
|
|
| 8,400 |
| Foster Wheeler, Ltd. |
|
|
| 362,880 |
|
|
|
|
| 362,880 |
|
|
|
|
|
|
|
|
|
|
|
|
|
|
|
|
|
|
|
|
|
|
|
|
|
|
|
|
|
|
|
|
| Exploration & Production |
| 1.2 | % |
|
|
|
|
|
| 0.2 | % |
60,200 |
|
|
|
|
|
|
| 60,200 |
| Dresser Rand Group, Inc. |
| 1,413,496 | * |
|
|
|
|
|
| 1,413,496 |
|
|
|
|
|
|
|
|
|
|
|
|
|
|
|
|
|
|
|
|
|
|
|
|
|
|
|
|
|
|
|
|
| Food |
| 1.4 | % |
|
| 1.5 | % |
|
| 1.3 | % |
|
|
|
| 445,300 |
|
|
| 445,300 |
| ConAgra Foods, Inc. |
|
|
|
|
| 9,845,583 |
|
|
| 9,845,583 |
|
29,800 |
|
|
|
|
|
|
| 29,800 |
| Hershey Foods Corp. |
| 1,641,086 | (a) |
|
|
|
|
|
| 1,641,086 |
|
|
|
|
|
|
|
|
|
|
|
|
|
|
|
|
|
|
|
|
| 11,486,669 |
|
F-23
|
|
|
|
|
|
|
| Pro-forma |
|
|
|
|
|
|
|
|
|
|
| Pro-forma |
|
|
|
|
|
|
|
|
| combined |
|
|
|
|
|
|
|
|
|
|
| combined |
|
SP Mid Cap |
| SP New Era |
| Emerging |
| Pro-forma |
| Emerging |
|
|
| SP Mid Cap |
| SP New Era |
| Emerging |
| Pro-forma |
| Emerging |
|
Growth |
| Growth |
| Growth |
| adjustments |
| Growth |
|
|
| Growth |
| Growth |
| Growth |
| adjustments |
| Growth |
|
Shares |
| Shares |
| Shares |
| Shares |
| Shares |
|
|
| Value |
| Value |
| Value |
| Value |
| Value |
|
|
|
|
|
|
|
|
|
|
|
|
|
|
|
|
|
|
|
|
|
|
|
|
|
|
|
|
|
|
|
|
| Food & Staples Retailing |
|
|
| 0.5 | % | 0.7 | % |
|
| 0.6 | % |
|
| 6,000 |
| 70,025 |
|
|
| 76,025 |
| Whole Foods Markets, Inc. |
|
|
| 387,840 |
| 4,526,416 |
|
|
| 4,914,256 |
|
|
|
|
|
|
|
|
|
|
|
|
|
|
|
|
|
|
|
|
|
|
|
|
|
|
|
|
|
|
|
|
| Health Care Equipment & Supplies |
| 6.5 | % | 3.8 | % | 4.1 | % |
|
| 4.4 | % |
|
| 17,000 |
|
|
|
|
| 17,000 |
| Abaxis, Inc. |
|
|
| 380,290 |
|
|
|
|
| 380,290 |
|
33,200 |
|
|
|
|
|
|
| 33,200 |
| Bard (C.R.), Inc. |
| 2,432,232 |
|
|
|
|
|
|
| 2,432,232 |
|
49,725 |
|
|
|
|
|
|
| 49,725 |
| Charles River Laboratories International, Inc. |
| 1,829,880 | * |
|
|
|
|
|
| 1,829,880 |
|
|
|
|
| 162,345 |
|
|
| 162,345 |
| DENTSPLY International, Inc. |
|
|
|
|
| 9,838,107 |
|
|
| 9,838,107 |
|
15,676 |
|
|
|
|
|
|
| 15,676 |
| Fisher Scientific International, Inc. |
| 1,145,132 | * (a) |
|
|
|
|
|
| 1,145,132 |
|
|
| 7,100 |
|
|
|
|
| 7,100 |
| Foxhollow Technologies, Inc. |
|
|
| 193,972 |
|
|
|
|
| 193,972 |
|
|
| 19,400 |
|
|
|
|
| 19,400 |
| Intralase Corp. |
|
|
| 324,756 | * |
|
|
|
| 324,756 |
|
|
| 14,350 |
|
|
|
|
| 14,350 |
| Intuitive Surgical, Inc. |
|
|
| 1,692,870 | * |
|
|
|
| 1,692,870 |
|
|
| 8,100 |
|
|
|
|
| 8,100 |
| Palomar Medical Technologies, Inc. |
|
|
| 369,603 |
|
|
|
|
| 369,603 |
|
|
|
|
| 219,200 |
|
|
| 219,200 |
| Resmed, Inc. |
|
|
|
|
| 10,291,440 | * |
|
| 10,291,440 |
|
|
|
|
| 208,900 |
|
|
| 208,900 |
| Respironics, Inc. |
|
|
|
|
| 7,148,558 | * |
|
| 7,148,558 |
|
60,800 |
|
|
|
|
|
|
| 60,800 |
| St. Jude Medical, Inc. |
| 1,971,136 | * |
|
|
|
|
|
| 1,971,136 |
|
|
|
|
|
|
|
|
|
|
|
|
|
|
|
|
|
|
|
|
| 37,617,976 |
|
|
|
|
|
|
|
|
|
|
|
|
|
|
|
|
|
|
|
|
|
|
|
|
|
|
|
|
|
|
|
|
| Health Care Providers & Services |
| 2.8 | % | 2.4 | % | 8.7 | % |
|
| 7.3 | % |
32,300 |
|
|
|
|
|
|
| 32,300 |
| Covance, Inc. |
| 1,977,406 | (a) |
|
|
|
|
|
| 1,977,406 |
|
|
|
|
| 289,100 |
|
|
| 289,100 |
| DaVita, Inc. |
|
|
|
|
| 14,368,270 | * |
|
| 14,368,270 |
|
|
| 13,300 |
|
|
|
|
| 13,300 |
| Express Scripts, Inc. (Class A Stock) |
|
|
| 954,142 | * |
|
|
|
| 954,142 |
|
|
|
|
| 262,200 |
|
|
| 262,200 |
| Medco Health Solutions, Inc. |
|
|
|
|
| 15,018,816 | * |
|
| 15,018,816 |
|
25,600 |
|
|
| 234,300 |
|
|
| 259,900 |
| Omnicare, Inc. |
| 1,213,952 | (a) |
|
| 11,110,506 | (b) |
|
| 12,324,458 |
|
|
| 26,600 |
|
|
|
|
| 26,600 |
| Pharmaceutical Product Development, Inc. |
|
|
| 934,192 |
|
|
|
|
| 934,192 |
|
|
|
|
| 281,900 |
|
|
| 281,900 |
| Quest Dianostics, Inc. |
|
|
|
|
| 16,891,448 | (b) |
|
| 16,891,448 |
|
|
|
|
|
|
|
|
|
|
|
|
|
|
|
|
|
|
|
|
| 62,468,732 |
|
|
|
|
|
|
|
|
|
|
|
|
|
|
|
|
|
|
|
|
|
|
|
|
|
|
|
|
|
|
|
|
| Health Care Technology |
|
|
| 0.4 | % | 0.7 | % |
|
| 0.6 | % |
|
| 8,600 |
| 131,300 |
|
|
| 139,900 |
| Cerner Corp. |
|
|
| 319,146 | * | 4,872,543 | * (b) |
|
| 5,191,689 |
|
|
|
|
|
|
|
|
|
|
|
|
|
|
|
|
|
|
|
|
|
|
|
|
|
|
|
|
|
|
|
|
| Hotels, Restaurants & Leisure |
| 2.7 | % | 1.5 | % | 2.1 | % |
|
| 2.1 | % |
32,600 |
|
|
|
|
|
|
| 32,600 |
| Chang’s China Bistro, (P.F.), Inc. |
| 1,239,452 | * (a) |
|
|
|
|
|
| 1,239,452 |
|
15,375 |
|
|
|
|
|
|
| 15,375 |
| Harrah’s Entertainment, Inc. |
| 1,094,392 |
|
|
|
|
|
|
| 1,094,392 |
|
25,200 |
|
|
| 288,300 |
|
|
| 313,500 |
| Hilton Hotels Corp. |
| 712,656 |
|
|
| 8,153,124 |
|
|
| 8,865,780 |
|
|
| 11,400 |
|
|
|
|
| 11,400 |
| Marriott International, Inc. (Class A Stock) |
|
|
| 434,568 |
|
|
|
|
| 434,568 |
|
|
|
|
| 82,300 |
|
|
| 82,300 |
| Panera Bread Co. (Class A Stock) |
|
|
|
|
| 5,533,852 | * |
|
| 5,533,852 |
|
|
| 10,000 |
|
|
|
|
| 10,000 |
| Wynn Resorts Ltd. |
|
|
| 733,000 | * |
|
|
|
| 733,000 |
|
|
|
|
|
|
|
|
|
|
|
|
|
|
|
|
|
|
|
|
| 17,901,044 |
|
|
|
|
|
|
|
|
|
|
|
|
|
|
|
|
|
|
|
|
|
|
|
|
|
|
|
|
|
|
|
|
| Insurance |
| 1.3 | % | 1.7 | % | 0.7 | % |
|
| 0.9 | % |
|
| 11,500 |
|
|
|
|
| 11,500 |
| Assurant, Inc. |
|
|
| 556,600 |
|
|
|
|
| 556,600 |
|
|
|
|
| 164,600 |
|
|
| 164,600 |
| Axis Capital Holdings Ltd. |
|
|
|
|
| 4,709,206 |
|
|
| 4,709,206 |
|
|
| 28,300 |
|
|
|
|
| 28,300 |
| National Interstate Corp. |
|
|
| 767,496 |
|
|
|
|
| 767,496 |
|
47,175 |
|
|
|
|
|
|
| 47,175 |
| Willis Group Holdings Ltd. (United Kingdom) |
| 1,514,318 |
|
|
|
|
|
|
| 1,514,318 |
|
|
|
|
|
|
|
|
|
|
|
|
|
|
|
|
|
|
|
|
| 7,547,620 |
|
|
|
|
|
|
|
|
|
|
|
|
|
|
|
|
|
|
|
|
|
|
|
|
|
|
|
|
|
|
|
|
| Internet & Catalog Retail |
|
|
| 1.0 | % | 0.6 | % |
|
| 0.6 | % |
|
| 28,000 |
|
|
|
|
| 28,000 |
| eBay, Inc. |
|
|
| 820,120 | * |
|
|
|
| 820,120 |
|
|
|
|
| 301,400 |
|
|
| 301,400 |
| GSI Commerce, Inc. |
|
|
|
|
| 4,077,942 | * (b) |
|
| 4,077,942 |
|
|
|
|
|
|
|
|
|
|
|
|
|
|
|
|
|
|
|
|
| 4,898,062 |
|
|
|
|
|
|
|
|
|
|
|
|
|
|
|
|
|
|
|
|
|
|
|
|
|
|
|
|
|
|
|
|
| Internet Services |
| 1.2 | % | 1.4 | % | 0.7 | % |
|
| 0.8 | % |
|
| 22,800 |
| 91,210 |
|
|
| 114,010 |
| CheckFree Corp. |
|
|
| 1,129,968 | * | 4,520,367 | * (b) |
|
| 5,650,335 |
|
172,400 |
|
|
|
|
|
|
| 172,400 |
| CNET Networks, Inc. |
| 1,375,752 | * |
|
|
|
|
|
| 1,375,752 |
|
|
|
|
|
|
|
|
|
|
|
|
|
|
|
|
|
|
|
|
| 7,026,087 |
|
F-24
|
|
|
|
|
|
|
| Pro-forma |
|
|
|
|
|
|
|
|
|
|
| Pro-forma |
|
|
|
|
|
|
|
|
| combined |
|
|
|
|
|
|
|
|
|
|
| combined |
|
SP Mid Cap |
| SP New Era |
| Emerging |
| Pro-forma |
| Emerging |
|
|
| SP Mid Cap |
| SP New Era |
| Emerging |
| Pro-forma |
| Emerging |
|
Growth |
| Growth |
| Growth |
| adjustments |
| Growth |
|
|
| Growth |
| Growth |
| Growth |
| adjustments |
| Growth |
|
Shares |
| Shares |
| Shares |
| Shares |
| Shares |
|
|
| Value |
| Value |
| Value |
| Value |
| Value |
|
|
|
|
|
|
|
|
|
|
|
|
|
|
|
|
|
|
|
|
|
|
|
|
|
|
|
|
|
|
|
|
| Internet Software & Services |
|
|
| 5.1 | % | 2.6 | % |
|
| 2.5 | % |
|
| 4,300 |
|
|
|
|
| 4,300 |
| Baidu.com, Inc., ADR |
|
|
| 354,879 |
|
|
|
|
| 354,879 |
|
|
| 12,700 |
|
|
|
|
| 12,700 |
| Ctrip.com International Ltd., ADR (China) |
|
|
| 648,335 | * |
|
|
|
| 648,335 |
|
|
|
|
| 193,100 |
|
|
| 193,100 |
| Digital River, Inc. |
|
|
|
|
| 7,799,309 | * (b) |
|
| 7,799,309 |
|
|
|
|
| 174,100 |
|
|
| 174,100 |
| Equinix, Inc. |
|
|
|
|
| 9,551,126 | * (b) |
|
| 9,551,126 |
|
|
| 18,400 |
|
|
|
|
| 18,400 |
| Netease.com, Inc., ADR (China) |
|
|
| 410,872 | * |
|
|
|
| 410,872 |
|
|
| 25,400 |
|
|
|
|
| 25,400 |
| NetFlix, Inc. |
|
|
| 691,134 | * |
|
|
|
| 691,134 |
|
|
| 69,600 |
|
|
|
|
| 69,600 |
| Opsware, Inc. |
|
|
| 573,504 |
|
|
|
|
| 573,504 |
|
|
| 7,100 |
|
|
|
|
| 7,100 | �� | Sina Corp. |
|
|
| 177,358 |
|
|
|
|
| 177,358 |
|
|
| 34,000 |
|
|
|
|
| 34,000 |
| ValueClick, Inc. |
|
|
| 521,900 | * |
|
|
|
| 521,900 |
|
|
| 18,700 |
|
|
|
|
| 18,700 |
| Yahoo!, Inc. |
|
|
| 617,100 | * |
|
|
|
| 617,100 |
|
|
|
|
|
|
|
|
|
|
|
|
|
|
|
|
|
|
|
|
| 21,345,517 |
|
|
|
|
|
|
|
|
|
|
|
|
|
|
|
|
|
|
|
|
|
|
|
|
|
|
|
|
|
|
|
|
| Life Sciences, Tools & Services |
|
|
| 0.5 | % | 1.5 | % |
|
| 1.2 | % |
|
| 5,700 |
| 152,700 |
|
|
| 158,400 |
| Invitrogen Corp. |
|
|
| 376,599 | * | 10,088,889 | * |
|
| 10,465,488 |
|
|
|
|
|
|
|
|
|
|
|
|
|
|
|
|
|
|
|
|
|
|
|
|
|
|
|
|
|
|
|
|
| Machinery & Equipment |
|
|
| 1.8 | % | 3.0 | % |
|
| 2.5 | % |
|
|
|
| 183,500 |
|
|
| 183,500 |
| Danaher Corp. |
|
|
|
|
| 11,802,720 |
|
|
| 11,802,720 |
|
|
|
|
| 170,700 |
|
|
| 170,700 |
| IDEX Corp. |
|
|
|
|
| 8,057,040 |
|
|
| 8,057,040 |
|
|
| 26,600 |
|
|
|
|
| 26,600 |
| JLG Industries, Inc. |
|
|
| 598,500 |
|
|
|
|
| 598,500 |
|
|
| 16,100 |
|
|
|
|
| 16,100 |
| Joy Global, Inc. |
|
|
| 838,649 |
|
|
|
|
| 838,649 |
|
|
|
|
|
|
|
|
|
|
|
|
|
|
|
|
|
|
|
|
| 21,296,909 |
|
|
|
|
|
|
|
|
|
|
|
|
|
|
|
|
|
|
|
|
|
|
|
|
|
|
|
|
|
|
|
|
| Manufacturing |
| 5.7 | % | 2.6 | % |
|
|
|
| 1.0 | % |
49,670 |
|
|
|
|
|
|
| 49,670 |
| American Standard Cos., Inc. |
| 2,149,221 |
|
|
|
|
|
|
| 2,149,221 |
|
|
| 8,400 |
|
|
|
|
| 8,400 |
| Harsco Corp. |
|
|
| 654,864 |
|
|
|
|
| 654,864 |
|
41,700 |
|
|
|
|
|
|
| 41,700 |
| Pentair, Inc. |
| 1,425,723 |
|
|
|
|
|
|
| 1,425,723 |
|
40,400 |
| 7,000 |
|
|
|
|
| 47,400 |
| Rockwell Automation, Inc. |
| 2,909,204 |
| 504,070 |
|
|
|
|
| 3,413,274 |
|
|
| 21,000 |
|
|
|
|
| 21,000 |
| Trinity Industries, Inc. |
|
|
| 848,400 | * |
|
|
|
| 848,400 |
|
|
|
|
|
|
|
|
|
|
|
|
|
|
|
|
|
|
|
|
| 8,491,482 |
|
|
|
|
|
|
|
|
|
|
|
|
|
|
|
|
|
|
|
|
|
|
|
|
|
|
|
|
|
|
|
|
| Media |
| 3.1 | % |
|
| 2.6 | % |
|
| 2.4 | % |
228,825 |
|
|
|
|
|
|
| 228,825 |
| Entravision Communications Corp. (Class A Stock) |
| 1,961,030 | * |
|
|
|
|
|
| 1,961,030 |
|
|
|
|
| 165,200 |
|
|
| 165,200 |
| E.W. Scripps Co. (The) (Class A Stock) |
|
|
|
|
| 7,126,728 |
|
|
| 7,126,728 |
|
|
|
|
| 494,600 |
|
|
| 494,600 |
| Regal Entertainment Group (Class A Stock) |
|
|
|
|
| 10,050,272 | (b) |
|
| 10,050,272 |
|
104,600 |
|
|
|
|
|
|
| 104,600 |
| XM Satellite Radio Holdings, Inc. (Class A Stock) |
| 1,532,390 |
|
|
|
|
|
|
| 1,532,390 |
|
|
|
|
|
|
|
|
|
|
|
|
|
|
|
|
|
|
|
|
| 20,670,420 |
|
|
|
|
|
|
|
|
|
|
|
|
|
|
|
|
|
|
|
|
|
|
|
|
|
|
|
|
|
|
|
|
| Metals & Mining |
|
|
| 1.7 | % | 3.8 | % |
|
| 3.1 | % |
|
|
|
| 147,600 |
|
|
| 147,600 |
| Arch Coal, Inc. |
|
|
|
|
| 6,253,812 |
|
|
| 6,253,812 |
|
|
|
|
| 314,600 |
|
|
| 314,600 |
| Goldcorp, Inc. |
|
|
|
|
| 9,507,212 | (b) |
|
| 9,507,212 |
|
|
|
|
| 222,600 |
|
|
| 222,600 |
| Harmony Gold Mining Co. Ltd. (ADR) (South Africa) |
|
|
|
|
| 3,626,154 | * (b) |
|
| 3,626,154 |
|
|
|
|
| 163,100 |
|
|
| 163,100 |
| Massey Energy Corp. |
|
|
|
|
| 5,871,600 | (b) |
|
| 5,871,600 |
|
|
| 7,300 |
|
|
|
|
| 7,300 |
| Precision Castparts Corp. |
|
|
| 436,248 |
|
|
|
|
| 436,248 |
|
|
| 11,800 |
|
|
|
|
| 11,800 |
| Titanium Metals Corp. |
|
|
| 405,684 | * |
|
|
|
| 405,684 |
|
|
| 6,600 |
|
|
|
|
| 6,600 |
| United States Steel Corp. |
|
|
| 462,792 | * |
|
|
|
| 462,792 |
|
|
|
|
|
|
|
|
|
|
|
|
|
|
|
|
|
|
|
|
| 26,563,502 |
|
|
|
|
|
|
|
|
|
|
|
|
|
|
|
|
|
|
|
|
|
|
|
|
|
|
|
|
|
|
|
|
| Networking/Telecommunications Equipment |
| 4.8 | % | 0.5 | % |
|
|
|
| 0.7 | % |
44,000 |
|
|
|
|
|
|
| 44,000 |
| Amphenol Corp. |
| 2,462,240 |
|
|
|
|
|
|
| 2,462,240 |
|
55,046 |
|
|
|
|
|
|
| 55,046 |
| FLIR Systems, Inc. |
| 1,214,315 | * (a) |
|
|
|
|
|
| 1,214,315 |
|
26,000 |
| 5,800 |
|
|
|
|
| 31,800 |
| Research in Motion Ltd. (Canada) |
| 1,814,020 | * | 404,666 |
|
|
|
|
| 2,218,686 |
|
|
|
|
|
|
|
|
|
|
|
|
|
|
|
|
|
|
|
|
| 5,895,241 |
|
|
|
|
|
|
|
|
|
|
|
|
|
|
|
|
|
|
|
|
|
|
|
|
|
|
|
|
|
|
|
|
| Oil, Gas & Consumable Fuels |
| 5.0 | % | 8.1 | % | 2.3 | % |
|
| 3.2 | % |
52,500 |
|
|
|
|
|
|
| 52,500 |
| Cameron International Corp. |
| 2,507,925 | (a) |
|
|
|
|
|
| 2,507,925 |
|
|
| 11,800 |
|
|
|
|
| 11,800 |
| Consol Energy, Inc. |
|
|
| 551,296 |
|
|
|
|
| 551,296 |
|
|
| 20,600 |
|
|
|
|
| 20,600 |
| FMC Technologies, Inc. |
|
|
| 1,389,676 | * |
|
|
|
| 1,389,676 |
|
|
| 13,400 |
|
|
|
|
| 13,400 |
| Frontier Oil Corp. |
|
|
| 434,160 |
|
|
|
|
| 434,160 |
|
|
| 12,700 |
|
|
|
|
| 12,700 |
| Helmerich & Payne, Inc. |
|
|
| 765,302 | * |
|
|
|
| 765,302 |
|
42,600 |
|
|
|
|
|
|
| 42,600 |
| Newfield Exploration Co. |
| 2,084,844 | * |
|
|
|
|
|
| 2,084,844 |
|
|
|
|
| 129,700 |
|
|
| 129,700 |
| Noble Energy, Inc. |
|
|
|
|
| 6,077,742 |
|
|
| 6,077,742 |
|
|
| 22,200 |
|
|
|
|
| 22,200 |
| Oceaneering International, Inc. |
|
|
| 1,017,870 |
|
|
|
|
| 1,017,870 |
|
28,400 |
|
|
|
|
|
|
| 28,400 |
| Quicksilver Resources, Inc. |
| 1,045,404 | * (a) |
|
|
|
|
|
| 1,045,404 |
|
|
| 17,300 |
|
|
|
|
| 17,300 |
| Range Resources Corp. |
|
|
| 470,387* |
|
|
|
|
| 470,387 |
|
|
|
|
| 287,800 |
|
|
| 287,800 |
| Southwestern Energy Co. |
|
|
|
|
| 8,967,848 | * |
|
| 8,967,848 |
|
|
| 10,500 |
|
|
|
|
| 10,500 |
| Ultra Petroleum Corp. (Canada) |
|
|
| 622,335 | * |
|
|
|
| 622,335 |
|
|
| 10,700 |
|
|
|
|
| 10,700 |
| Veritas DGC, Inc. |
|
|
| 551,906 |
|
|
|
|
| 551,906 |
|
|
| 13,900 |
|
|
|
|
| 13,900 |
| Whiting Petroleum Corp. |
|
|
| 581,993 | * |
|
|
|
| 581,993 |
|
|
|
|
|
|
|
|
|
|
|
|
|
|
|
|
|
|
|
|
| 27,068,688 |
|
F-25
|
|
|
|
|
|
|
| Pro-forma |
|
|
|
|
|
|
|
|
|
|
| Pro-forma |
|
|
|
|
|
|
|
|
| combined |
|
|
|
|
|
|
|
|
|
|
| combined |
|
SP Mid Cap |
| SP New Era |
| Emerging |
| Pro-forma |
| Emerging |
|
|
| SP Mid Cap |
| SP New Era |
| Emerging |
| Pro-forma |
| Emerging |
|
Growth |
| Growth |
| Growth |
| adjustments |
| Growth |
|
|
| Growth |
| Growth |
| Growth |
| adjustments |
| Growth |
|
Shares |
| Shares |
| Shares |
| Shares |
| Shares |
|
|
| Value |
| Value |
| Value |
| Value |
| Value |
|
|
|
|
|
|
|
|
|
|
|
|
|
|
|
|
|
|
|
|
|
|
|
|
|
|
|
|
|
|
|
|
| Pharmaceuticals |
| 1.3 | % | 2.3 | % | 1.4 | % |
|
| 1.5 | % |
|
| 8,300 |
|
|
|
|
| 8,300 |
| Alkermes, Inc. |
|
|
| 156,345 |
|
|
|
|
| 156,345 |
|
|
| 7,600 |
|
|
|
|
| 7,600 |
| Barr Pharmaceuticals, Inc. |
|
|
| 362,444 | * |
|
|
|
| 362,444 |
|
|
| 15,000 |
|
|
|
|
| 15,000 |
| Cubist Pharmaceuticals, Inc. |
|
|
| 377,700 | * |
|
|
|
| 377,700 |
|
|
| 20,200 |
|
|
|
|
| 20,200 |
| CV Therapeutics, Inc. |
|
|
| 282,194 | * |
|
|
|
| 282,194 |
|
|
|
|
| 183,800 |
|
|
| 183,800 |
| Endo Pharmaceuticals Holdings, Inc. |
|
|
|
|
| 6,061,724 | * |
|
| 6,061,724 |
|
|
|
|
| 81,400 |
|
|
| 81,400 |
| Kos Pharmaceuticals, Inc. |
|
|
|
|
| 3,062,268 | * (b) |
|
| 3,062,268 |
|
|
| 11,500 |
|
|
|
|
| 11,500 |
| Nuvelo, Inc. |
|
|
| 191,475 | * |
|
|
|
| 191,475 |
|
|
| 9,700 |
|
|
|
|
| 9,700 |
| Onyx Pharmaceuticals, Inc. |
|
|
| 163,251 | * |
|
|
|
| 163,251 |
|
45,500 |
|
|
|
|
|
|
| 45,500 |
| OSI Pharmaceuticals, Inc. |
| 1,499,680 | * (a) |
|
|
|
|
|
| 1,499,680 |
|
|
| 23,400 |
|
|
|
|
| 23,400 |
| Salix Pharmaceuticals Ltd. |
|
|
| 287,820 | * |
|
|
|
| 287,820 |
|
|
|
|
|
|
|
|
|
|
|
|
|
|
|
|
|
|
|
|
| 12,444,901 |
|
|
|
|
|
|
|
|
|
|
|
|
|
|
|
|
|
|
|
|
|
|
|
|
|
|
|
|
|
|
|
|
| Producer Goods |
| 2.1 | % |
|
|
|
|
|
| 0.3 | % |
32,240 |
|
|
|
|
|
|
| 32,240 |
| Grainger, (W.W.), Inc. |
| 2,425,415 |
|
|
|
|
|
|
| 2,425,415 |
|
|
|
|
|
|
|
|
|
|
|
|
|
|
|
|
|
|
|
|
|
|
|
|
|
|
|
|
|
|
|
|
| Real Estate |
| 1.0 | % |
|
|
|
|
|
| 0.8 | % |
|
|
|
| 313,100 |
|
|
| 313,100 |
| Host Hotels & Resorts, Inc. |
|
|
|
|
| 6,847,497 | (b) |
|
| 6,847,497 |
|
|
|
|
|
|
|
|
|
|
|
|
|
|
|
|
|
|
|
|
|
|
|
|
|
|
|
|
|
|
|
|
| Retail & Merchandising |
| 1.0 | % |
|
|
|
|
|
| 0.1 | % |
|
| 19,500 |
|
|
|
|
| 19,500 |
| Circuit City Stores, Inc. |
|
|
| 530,790 |
| * |
|
|
| 530,790 |
|
|
| 8,500 |
|
|
|
|
| 8,500 |
| Coldwater Creek |
|
|
| 227,460 |
| * |
|
|
| 227,460 |
|
|
|
|
|
|
|
|
|
|
|
|
|
|
|
|
|
|
|
|
| 758,250 |
|
|
|
|
|
|
|
|
|
|
|
|
|
|
|
|
|
|
|
|
|
|
|
|
|
|
|
|
|
|
|
|
| Semiconductors & Semiconductor Equipment |
| 7.8 | % | 8.0 | % | 5.2 | % |
|
| 5.8 | % |
26,000 |
| 32,300 |
|
|
|
|
| 58,300 |
| Advanced Micro Devices, Inc. |
| 634,920 | * (a) | 788,766 | * |
|
|
|
| 1,423,686 |
|
|
| 100,000 |
|
|
|
|
| 100,000 |
| Atmel Corp. |
|
|
| 555,000 | * |
|
|
|
| 555,000 |
|
|
| 35,300 |
| 202,095 |
|
|
| 237,395 |
| Broadcom Corp. (Class A Stock) |
|
| * | 1,060,765 | * | 6,072,955 | * |
|
| 7,133,720 |
|
39,100 |
|
|
|
|
|
|
| 39,100 |
| Formfactor, Inc. |
| 1,745,033 | * |
|
|
|
|
|
| 1,745,033 |
|
|
| 13,475 |
|
|
|
|
| 13,475 |
| Hittite Microwave Corp. |
|
|
| 487,256 | * |
|
|
|
| 487,256 |
|
|
|
|
| 791,900 |
|
|
| 791,900 |
| Integrated Device Technology, Inc. |
|
|
|
|
| 11,229,142 | * (b) |
|
| 11,229,142 |
|
|
|
|
| 375,500 |
|
|
| 375,500 |
| Intersil Corp. (Class A Stock) |
|
|
|
|
| 8,730,375 |
|
|
| 8,730,375 |
|
77,800 |
|
|
|
|
|
|
| 77,800 |
| Linear Technology Corp. |
| 2,605,522 |
| (a) |
|
|
|
|
| 2,605,522 |
|
|
| 25,000 |
|
|
|
|
| 25,000 |
| LSI Logic Corp. |
|
|
| 223,750 | * |
|
|
|
| 223,750 |
|
11,500 |
| 12,400 |
|
|
|
|
| 23,900 |
| Marvell Technology Group Ltd. (Bermuda) |
| 509,795 | * | 549,692 | * |
|
|
|
| 1,059,487 |
|
|
| 27,800 |
|
|
|
|
| 27,800 |
| MEMC Electronic Materials, Inc. |
|
|
| 1,042,500 | * |
|
|
|
| 1,042,500 |
|
17,500 |
|
|
|
|
|
|
| 17,500 |
| Microchip Technology, Inc. |
| 587,125 |
|
|
|
|
|
|
| 587,125 |
|
|
| 16,200 |
|
|
|
|
| 16,200 |
| National Semiconductor Corp. |
|
|
| 386,370 |
|
|
|
|
| 386,370 |
|
|
| 27,800 |
|
|
|
|
| 27,800 |
| Nvidia Corp. |
|
|
| 591,862 | * |
|
|
|
| 591,862 |
|
|
| 17,700 |
|
|
|
|
| 17,700 |
| Silicon Laboratories, Inc. |
|
|
| 622,155 |
|
|
|
|
| 622,155 |
|
|
|
|
| 591,400 |
|
|
| 591,400 |
| Teradyne, Inc. |
|
|
|
|
| 8,238,202 | * |
|
| 8,238,202 |
|
62,757 |
|
|
|
|
|
|
| 62,757 |
| Tessera Technologies, Inc. |
| 1,725,817 | * (a) |
|
|
|
|
|
| 1,725,817 |
|
47,800 |
|
|
|
|
|
|
| 47,800 |
| Xilinx, Inc. |
| 1,082,670 |
|
|
|
|
|
|
| 1,082,670 |
|
|
|
|
|
|
|
|
|
|
|
|
|
|
|
|
|
|
|
|
| 49,469,672 |
|
|
|
|
|
|
|
|
|
|
|
|
|
|
|
|
|
|
|
|
|
|
|
|
|
|
|
|
|
|
|
|
| Software |
|
|
| 4.3 | % | 6.3 | % |
|
| 5.3 | % |
|
|
|
| 314,176 |
|
|
| 314,176 |
| Adobe Systems, Inc. |
|
|
|
|
| 9,538,383 | * |
|
| 9,538,383 |
|
|
|
|
| 386,000 |
|
|
| 386,000 |
| Amdocs Ltd. |
|
|
|
|
| 14,127,600 | * |
|
| 14,127,600 |
|
|
| 15,000 |
|
|
|
|
| 15,000 |
| Ansys, Inc. |
|
|
| 717,300 | * |
|
|
|
| 717,300 |
|
|
|
|
| 718,615 |
|
|
| 718,615 |
| BEA Systems, Inc. |
|
|
|
|
| 9,406,670 | * (b) |
|
| 9,406,670 |
|
|
| 19,500 |
|
|
|
|
| 19,500 |
| BMC Software, Inc. |
|
|
| 466,050 | * |
|
|
|
| 466,050 |
|
|
| 12,000 |
| 216,470 |
|
|
| 228,470 |
| Citrix Systems, Inc. |
|
|
| 481,680 | * | 8,689,106 | * |
|
| 9,170,786 |
|
|
| 42,000 |
|
|
|
|
| 42,000 |
| Compuware Corp. |
|
|
| 281,400 | * |
|
|
|
| 281,400 |
|
|
| 38,000 |
|
|
|
|
| 38,000 |
| Red Hat, Inc. |
|
|
| 889,200 | * |
|
|
|
| 889,200 |
|
|
| 20,700 |
|
|
|
|
| 20,700 |
| Salesforce.com, Inc. |
|
|
| 551,862 | * |
|
|
|
| 551,862 |
|
|
|
|
|
|
|
|
|
|
|
|
|
|
|
|
|
|
|
|
| 45,149,251 |
|
|
|
|
|
|
|
|
|
|
|
|
|
|
|
|
|
|
|
|
|
|
|
|
|
|
|
|
|
|
|
|
| Specialty Retail |
| 5.3 | % | 2.8 | % | 2.2 | % |
|
| 2.7 | % |
|
|
|
| 106,900 |
|
|
| 106,900 |
| Abercrombie & Fitch Co. (Class A Stock) |
|
|
|
|
| 5,925,467 |
|
|
| 5,925,467 |
|
64,950 |
|
|
|
|
|
|
| 64,950 |
| Chico’s FAS, Inc. |
| 1,752,351 | * (a) |
|
|
|
|
|
| 1,752,351 |
|
33,000 |
|
|
|
|
|
|
| 33,000 |
| Coach, Inc. |
| 986,700 |
|
|
|
|
|
|
| 986,700 |
|
|
| 600 |
|
|
|
|
| 600 |
| J.Crew Group, Inc. |
|
|
| 16,470 |
|
|
|
|
| 16,470 |
|
|
| 17,100 |
|
|
|
|
| 17,100 |
| MSC Industrial Direct Co., Inc. |
|
|
| 813,447 |
|
|
|
|
| 813,447 |
|
|
| 23,000 |
|
|
|
|
| 23,000 |
| Nordstrom, Inc. |
|
|
| 839,500 |
|
|
|
|
| 839,500 |
|
|
| 14,800 |
|
|
|
|
| 14,800 |
| Office Depot, Inc. |
|
|
| 562,400 | * |
|
|
|
| 562,400 |
|
|
|
|
| 187,535 |
|
|
| 187,535 |
| Ross Stores, Inc. |
|
|
|
|
| 5,260,357 |
|
|
| 5,260,357 |
|
70,200 |
|
|
| 207,320 |
|
|
| 277,520 |
| Urban Outfitters, Inc. |
| 1,227,798 | * |
|
| 3,626,027 | * (b) |
|
| 4,853,825 |
|
59,385 |
|
|
|
|
|
|
| 59,385 |
| Williams-Sonoma, Inc. |
| 2,022,059 | * |
|
|
|
|
|
| 2,022,059 |
|
|
|
|
|
|
|
|
|
|
|
|
|
|
|
|
|
|
|
|
| 23,032,576 |
|
F-26
|
|
|
|
|
|
|
| Pro-forma |
|
|
|
|
|
|
|
|
|
|
|
|
|
|
|
|
|
|
|
|
| combined |
|
|
|
|
|
|
|
|
|
|
| Pro-forma |
|
SP Mid Cap |
| SP New Era |
| Emerging |
| Pro-forma |
| Emerging |
|
|
|
|
|
|
|
|
|
|
| combined |
|
Growth |
| Growth |
| Growth |
| adjustments |
| Growth |
|
|
| SP Mid Cap |
| SP New Era |
| Emerging |
| Pro-forma |
| Emerging |
|
Shares |
| Shares |
| Shares |
| Shares |
| Shares |
|
|
| Growth |
| Growth |
| Growth |
| adjustments |
| Growth |
|
|
|
|
|
|
|
|
|
|
|
|
|
|
|
|
|
|
|
|
|
|
|
|
|
|
|
|
|
|
|
|
| Telecommunications |
| 4.4 | % | 0.8 | % |
|
|
|
| 0.6 | % |
40,500 |
|
|
|
|
|
|
| 40,500 |
| Cablevision Systems Corp. |
| 868,725 |
|
|
|
|
|
|
| 868,725 |
|
65,650 |
|
|
|
|
|
|
| 65,650 |
| Crown Castle International Corp. |
| 2,267,551 | * (a) |
|
|
|
|
|
| 2,267,551 |
|
54,100 |
|
|
|
|
|
|
| 54,100 |
| Neustar, Inc. (Class A Stock) |
| 1,825,875 | * (a) |
|
|
|
|
|
| 1,825,875 |
|
|
| 48,300 |
|
|
|
|
| 48,300 |
| Tellabs, Inc. |
|
|
| 642,873 | * |
|
|
|
| 642,873 |
|
|
|
|
|
|
|
|
|
|
|
|
|
|
|
|
|
|
|
|
| 5,605,024 |
|
|
|
|
|
|
|
|
|
|
|
|
|
|
|
|
|
|
|
|
|
|
|
|
|
|
|
|
|
|
|
|
| Transportation |
|
|
| 1.3 | % |
|
|
|
| 0.1 | % |
|
| 18,200 |
|
|
|
|
| 18,200 |
| Expeditors International Washington, Inc. |
|
|
| 1,019,382 | * |
|
|
|
| 1,019,382 |
|
|
|
|
|
|
|
|
|
|
|
|
|
|
|
|
|
|
|
|
|
|
|
|
|
|
|
|
|
|
|
|
| Wireless Telecommunication Services |
| 0.9 | % | 1.8 | % | 5.3 | % |
|
| 4.4 | % |
34,500 |
| 14,000 |
| 433,200 |
|
|
| 481,700 |
| American Tower Corp. (Class A Stock) |
| 1,073,640 | * | 435,680 | * | 13,481,184 | * (b) |
|
| 14,990,504 |
|
|
| 17,900 |
| 384,690 |
|
|
| 402,590 |
| NII Holdings, Inc. |
|
|
| 1,009,202 | * | 21,688,822 | * (b) |
|
| 22,698,024 |
|
|
|
|
|
|
|
|
|
|
|
|
|
|
|
|
|
|
|
|
| 37,688,528 |
|
|
|
|
|
|
|
|
|
|
|
|
|
|
|
|
|
|
|
|
|
|
|
|
|
|
|
|
|
|
|
|
| Total Long-Term Investments |
| 113,153,962 |
| 77,921,640 |
| 635,577,654 |
|
|
| 826,653,256 |
|
|
|
|
|
|
|
|
|
|
| (cost $101,978,307, $69,133,932, $556,031,962, $727,143,333) |
|
|
|
|
|
|
|
|
|
|
|
|
|
|
|
|
|
|
|
|
|
|
|
|
|
|
|
|
|
|
|
|
|
|
|
|
|
|
|
|
|
|
|
|
|
|
|
|
|
|
|
|
|
|
|
|
|
|
|
|
|
|
|
|
| SHORT-TERM INVESTMENTS |
| 26.8 | % | 1.1 | % | 25.6 | % |
|
| 23.5 | % |
|
|
|
|
|
|
|
|
|
| Affiliated Money Market Mutual Fund |
|
|
|
|
|
|
|
|
|
|
|
30,500,338 |
| 840,699 |
| 169,562,501 |
|
|
| 200,903,538 |
| Dryden Core Investment Fund-Taxable Money Market Series |
|
|
|
|
|
|
|
|
|
|
|
|
|
|
|
|
|
|
|
|
| (cost $30,500,338; includes $29,092,278 of cash collateral for securities on loan) (c)(d) |
| 30,500,338 |
|
|
|
|
|
|
|
|
|
|
|
|
|
|
|
|
|
|
| (cost $840,699) |
|
|
| 840,699 |
|
|
|
|
|
|
|
|
|
|
|
|
|
|
|
|
| (cost $169,562,501; includes $145,951,756 of cash collateral for securities on loan) (c)(d) |
|
|
|
|
| 169,562,501 |
|
|
|
|
|
|
|
|
|
|
|
|
|
|
| (cost $200,903,538; includes $175,044,034 of cash collateral for securities on loan) (c)(d) |
|
|
|
|
|
|
|
|
| 200,903,538 |
|
|
|
|
|
|
|
|
|
|
|
|
|
|
|
|
|
|
|
|
|
|
|
|
|
|
|
|
|
|
|
|
| Total Investments |
| 126.3 | % | 100.4 | % | 121.7 | % |
|
| 120.4 | % |
|
|
|
|
|
|
|
|
|
| (cost $132,478,645, $69,974,631, $725,594,463, $928,046,871) |
| 143,654,300 |
| 78,762,339 |
| 805,140,155 |
|
|
| 1,027,556,794 |
|
|
|
|
|
|
|
|
|
|
|
|
|
|
|
|
|
|
|
|
|
|
|
|
|
|
|
|
|
|
|
|
| Liabilities in excess of other assets |
| -26.3 | % | -0.4 | % | -21.7 | % |
|
| -20.4 | % |
|
|
|
|
|
|
|
|
|
|
|
| (29,950,961 | ) | (294,485 | ) | (143,530,168 | ) | (439,000 | )(e) | (174,214,614 | ) |
|
|
|
|
|
|
|
|
|
|
|
|
|
|
|
|
|
|
|
|
|
|
|
|
|
|
|
|
|
|
|
| Net Assets |
| 113,703,339 |
| 78,467,854 |
| 661,609,987 |
| (439,000 | )(e) | 853,342,180 |
|
|
|
|
|
|
|
|
|
|
|
|
| 100.0 | % | 100.0 | % | 100.0 | % |
|
| 100.0 | % |
The following abbreviations are used in portfolio descriptions:
ADR - American Depositary Receipt
* Non-income producing security.
(a) Securities, or a portion thereof, on loan with an aggregate market value of $28,453,948; cash collateral of $29,092,278 (included in liabilities) was received with which the Fund purchased highly liquid short-term investments.
(b) Securities, or a portion thereof, on loan with an aggregate market value of $140,789,609; cash collateral of $145,951,756 (included in liabilities) was received with which the Fund purchased highly liquid short-term investments.
(c) Represents security, or a portion thereof, purchased with cash collateral received for securities on loan.
(d) Securities, or a portion thereof, on loan with an aggregate market value of $169,243,557; cash collateral of $175,044,034 (included in liabilities) was received with which the Fund purchased highly liquid short-term investments.
(e) Amounts reflect the adjustment to the Pro Forma Statement of Assets and Liabilities for the Reorganization relating to the reorganization expense attributable to SP Mid-Cap Growth and SP New Era Growth.
Neither SP Mid-Cap Growth or SP New Era Growth does not expect that any investments must be sold as a result of the reorganization.
F-27
Pro Forma Statement of Assets and Liabilities for the Transaction
as of June 30, 2006
(Unaudited)
|
| SP Mid-Cap |
| SP New Era |
| Jennison Emerging |
| Pro-Forma |
| Pro-Forma |
| |||||
Assets |
|
|
|
|
|
|
|
|
|
|
| |||||
Investments at value, including securities on loan(C) |
|
|
|
|
|
|
|
|
|
|
| |||||
Unaffiliated Investments(A) |
| $ | 113,153,962 |
| $ | 77,921,640 |
| $ | 635,577,654 |
|
|
| $ | 826,653,256 |
| |
Affiliated Investments(B) |
| 30,500,338 |
| 840,699 |
| 169,562,501 |
|
|
| 200,903,538 |
| |||||
Cash |
|
|
| 299,016 |
| 24,625 |
|
|
| 323,641 |
| |||||
Receivable for investments sold |
| 2,154 |
| 121,617 |
| 8,496,905 |
|
|
| 8,620,676 |
| |||||
Receivable for Fund shares sold |
|
|
| 3,718 |
| 274,575 |
|
|
| 278,293 |
| |||||
Dividends and interest receivable |
| 38,294 |
| 20,032 |
| 192,321 |
|
|
| 250,647 |
| |||||
Prepaid expenses |
| 26,936 |
|
|
| 2,328 |
|
|
| 29,264 |
| |||||
Total assets |
| 143,721,684 |
| 79,206,722 |
| 814,130,909 |
|
|
| 1,036,951,046 |
| |||||
‘ |
|
|
|
|
|
|
|
|
|
|
| |||||
Liabilities |
|
|
|
|
|
|
|
|
|
|
| |||||
|
|
|
|
|
|
|
|
|
|
|
| |||||
Payable to Broker for collateral for securities on loan |
| 29,092,278 |
|
|
| 145,951,756 |
|
|
| 175,044,034 |
| |||||
Payable to Custodian |
| 119,251 |
|
|
|
|
|
|
| 119,251 |
| |||||
Payable to Investment Manager |
| 120 |
| 1,224 |
|
|
|
|
| 1,344 |
| |||||
Payable for investments purchased |
|
|
| 65,330 |
| 4,708,671 |
|
|
| 4,774,001 |
| |||||
Payable for Fund shares reacquired |
| 84,948 |
| 223,152 |
| 550,679 |
|
|
| 858,779 |
| |||||
Accrued expenses |
| 163,028 |
| 171,382 |
| 222,296 |
| 439,000 | (E) | 995,706 |
| |||||
Management fee payable |
| 41,911 |
| 65,334 |
| 244,468 |
|
|
| 351,713 |
| |||||
Distribution fee payable |
| 82,652 |
| 185,114 |
| 210,335 |
|
|
| 478,101 |
| |||||
Transfer agent fee payable |
| 434,157 |
| 27,332 |
| 628,792 |
|
|
| 1,090,281 |
| |||||
Deferred directors’ fees |
|
|
|
|
| 3,925 |
|
|
| 3,925 |
| |||||
Total liabilities |
| 30,018,345 |
| 738,868 |
| 152,520,922 |
| 439,000 |
| 183,717,135 |
| |||||
|
|
|
|
|
|
|
|
|
|
|
| |||||
Net Assets |
| $ | 113,703,339 |
| $ | 78,467,854 |
| $ | 661,609,987 |
| (439,000 | ) | $ | 853,342,180 |
| |
|
|
|
|
|
|
|
|
|
|
|
| |||||
Net assets were comprised of: |
|
|
|
|
|
|
|
|
|
|
| |||||
Common stock, at par ($.001 par value; unlimited shares authorized for issuance for each fund) |
| $ | 24,269 |
| $ | 8,822 |
| $ | 32,570 |
|
|
| $ | 65,661 |
| |
Paid-in capital in excess of par |
| 248,003,933 |
| 162,038,356 |
| 700,229,834 |
| (439,000 | )(E) | 1,109,833,123 |
| |||||
|
| 248,028,202 |
| 162,047,178 |
| 700,262,404 |
| (439,000 | ) | 1,109,898,784 |
| |||||
Accumulated net operating loss |
| (1,486,819 | ) | (3,960,568 | ) | (5,351,284 | ) |
|
| (10,798,671 | ) | |||||
Accumulated net realized loss on investments |
| (144,013,699 | ) | (88,406,464 | ) | (112,846,825 | ) |
|
| (345,266,988 | ) | |||||
Net unrealized appreciation on investments |
| 11,175,655 |
| 8,787,708 |
| 79,545,692 |
|
|
| 99,509,055 |
| |||||
Net assets, June 30, 2006 |
| $ | 113,703,339 |
| $ | 78,467,854 |
| $ | 661,609,987 |
| (439,000 | ) | $ | 853,342,180 |
| |
|
|
|
|
|
|
|
|
|
|
|
| |||||
(A) Unaffiliated Investments at Cost |
| $ | 101,978,307 |
| $ | 69,133,932 |
| $ | 556,031,962 |
|
|
| $ | 727,036,800 |
| |
(B) Affiliated Investments at Cost |
| $ | 30,500,338 |
| $ | 840,699 |
| $ | 169,562,501 |
|
|
| $ | 200,903,538 |
| |
(C) Securities Loaned at Value |
| $ | 28,453,948 |
| $ | — |
| $ | 140,789,609 |
|
|
| $ | 169,243,557 |
| |
|
|
|
|
|
|
|
|
|
|
|
| |||||
Class A |
|
|
|
|
|
|
|
|
|
|
| |||||
Net assets |
| $ | 12,498,158 |
| $ | 15,052,080 |
| $ | 340,584,373 |
| $ | (63,079 | )(E) | $ | 368,071,532 |
|
Shares of common stock issued and outstanding) |
| 2,596,986 |
| 1,641,510 |
| 16,547,095 |
| (2,903,048 | )(D) | 17,882,543 |
| |||||
Net asset value and redemption price per share |
| $ | 4.81 |
| $ | 9.17 |
| $ | 20.58 |
|
|
| $ | 20.58 |
| |
Maximum sales charge (5.5% of offering price) |
| 0.28 |
| 0.53 |
| 1.20 |
|
|
| 1.20 |
| |||||
Maximum offering price to public |
| $ | 5.09 |
| $ | 9.70 |
| $ | 21.78 |
|
|
| $ | 21.78 |
| |
Class B |
|
|
|
|
|
|
|
|
|
|
| |||||
Net assets |
| $ | 2,429,473 |
| $ | 34,833,677 |
| $ | 96,358,847 |
| (85,863 | )(E) | $ | 133,536,134 |
| |
Shares of common stock issued and outstanding) |
| 520,916 |
| 3,959,218 |
| 5,074,089 |
| (2,522,443 | )(D) | 7,031,780 |
| |||||
Net asset value, offering price and redemption price per share |
| $ | 4.66 |
| $ | 8.80 |
| $ | 18.99 |
|
|
| $ | 18.99 |
| |
Class C |
|
|
|
|
|
|
|
|
|
|
| |||||
Net assets |
| $ | 18,239,165 |
| $ | 24,282,815 |
| $ | 41,894,449 |
| (97,399 | )(E) | $ | 84,319,030 |
| |
Shares of common stock issued and outstanding) |
| 3,931,866 |
| 2,759,319 |
| 2,205,530 |
| (4,457,746 | )(D) | 4,438,969 |
| |||||
Offering price and redemption price per share |
| $ | 4.64 |
| $ | 8.80 |
| $ | 19.00 |
|
|
| $ | 19.00 |
| |
Class L |
|
|
|
|
|
|
|
|
|
|
| |||||
Net assets |
| $ | 20,079,049 |
| $ | — |
| $ | 5,311,281 |
| (45,561 | )(E) | $ | 25,344,769 |
| |
Shares of common stock issued and outstanding) |
| 4,208,224 |
| — |
| 258,046 |
| (3,234,909 | )(D) | 1,231,361 |
| |||||
Net asset value, offering price and redemption price per share |
| $ | 4.77 |
| — |
| $ | 20.58 |
| — |
| $ | 20.58 |
| ||
Class M |
|
|
|
|
|
|
|
|
|
|
| |||||
Net assets |
| $ | 50,207,037 |
| $ | — |
| $ | 1,609,537 |
| (113,923 | )(E) | $ | 51,702,651 |
| |
Shares of common stock issued and outstanding) |
| 10,800,442 |
| — |
| 84,739 |
| (8,163,137 | )(D) | 2,722,044 |
| |||||
Net asset value, offering price and redemption price per share |
| $ | 4.65 |
| — |
| $ | 18.99 |
| — |
| $ | 18.99 |
| ||
Class R |
|
|
|
|
|
|
|
|
|
|
| |||||
Net assets |
| $ | — |
| $ | — |
| $ | 3,012 |
| — |
| $ | 3,012 |
| |
Shares of common stock issued and outstanding) |
| — |
| — |
| 147 |
| — |
| 147 |
| |||||
Net asset value, offering price and redemption price per share |
| — |
| — |
| $ | 20.51 |
| — |
| $ | 20.51 |
| |||
Class X |
|
|
|
|
|
|
|
|
|
|
| |||||
Net assets |
| $ | 10,250,457 |
| $ | — |
| $ | 12,715,018 |
| (23,258 | )(E) | $ | 22,942,217 |
| |
Shares of common stock issued and outstanding) |
| 2,210,567 |
| — |
| 670,088 |
| (1,671,588 | )(D) | 1,209,067 |
| |||||
Net asset value, offering price and redemption price per share |
| $ | 4.64 |
| — |
| $ | 18.98 |
| — |
| $ | 18.98 |
| ||
Class Z |
|
|
|
|
|
|
|
|
|
|
| |||||
Net assets |
| $ | — |
| $ | 4,299,282 |
| $ | 163,133,470 |
| (9,917 | )(E) | $ | 167,422,835 |
| |
Shares of common stock issued and outstanding) |
| — |
| 461,815 |
| 7,730,240 |
| (258,559 | )(D) | 7,933,496 |
| |||||
Net asset value, offering price and redemption price per share |
|
|
| $ | 9.31 |
| $ | 21.10 |
| — |
| $ | 21.10 |
| ||
(D) Represents the difference between total additional shares to be issued (see note 2) and current Jennison US Emerging Growth Fund shares outstanding
(E) Reflects the estimated Reorganization expenses of $439,000 consisting of $181,000 attributable to the Reorganization of SP New Era Growth and $258,000 attributable to SP Mid-Cap Growth.
See Notes to Pro-Forma Financial Statements
F-28
Pro-Forma Statement of Operations for the Transaction
For the Period Ended 6/30/06
(Unaudited)
|
| SP Mid-Cap |
| SP New Era |
| Jennison |
| Adjusting |
| Pro-Forma Combined |
| |||||
Statement of Operations |
|
|
|
|
|
|
|
|
|
|
| |||||
Income: |
|
|
|
|
|
|
|
|
|
|
| |||||
Interest |
| $ | 1,612 |
| $ | 324 |
| $ | 5,530 |
|
|
| $ | 7,466 |
| |
Unaffiliated Dividend Income |
| 645,874 |
| 738,383 |
|
| 7,837,418 |
|
|
| 9,221,675 |
| ||||
Affiliated Dividend Income |
| 33,626 |
| 20,706 |
| — |
|
|
| 54,332 |
| |||||
Affiliated Income from Securities Loaned |
| 34,534 |
| 29,788 |
| 328,772 |
|
|
| 393,094 |
| |||||
Foreign taxes Withheld |
| — |
| (850 | ) | (10,940 | ) |
|
| (11,790 | ) | |||||
Total Income |
| 715,646 |
| 788,351 |
| 8,160,780 |
|
|
| 9,664,777 |
| |||||
|
|
|
|
|
|
|
|
|
|
|
| |||||
Expenses: |
|
|
|
|
|
|
|
|
|
|
| |||||
Management Fee |
| 1,155,345 |
| 794,902 |
| 4,149,524 |
| (551,873 | )(b) | 5,547,897 |
| |||||
Distribution Fees - Class A |
| 31,605 |
| 41,503 |
| 870,205 |
|
|
| 943,313 |
| |||||
Distribution Fees - Class B |
| 24,235 |
| 397,196 |
| 1,084,555 |
|
|
| 1,505,986 |
| |||||
Distribution Fees - Class C |
| 209,454 |
| 273,216 |
| 450,196 |
|
|
| 932,866 |
| |||||
Distribution Fees - Class L |
| 114,519 |
| — |
| 31,975 |
|
|
| 146,494 |
| |||||
Distribution Fees - Class M |
| 577,685 |
| — |
| 141,652 |
|
|
| 719,337 |
| |||||
Distribution Fees - Class R |
| — |
| — |
| 16 |
|
|
| 16 |
| |||||
Distribution Fees - Class X |
| 116,882 |
| — |
| 27,449 |
|
|
| 144,331 |
| |||||
Transfer Agent Fees(a) |
| 793,000 |
| 210,000 |
| 1,570,000 |
| (159,000 | )(b) | 2,414,000 |
| |||||
Accounting & Custody ** |
| 48,000 |
| 129,000 |
| 91,000 |
| (35,000 | )(b) | 233,000 |
| |||||
Legal Fees and expenses |
| 25,000 |
| 24,000 |
| 50,000 |
| (20,000 | )(b) | 79,000 |
| |||||
Audit Fees |
| 17,000 |
| 17,000 |
| 33,000 |
| (22,000 | )(b) | 45,000 |
| |||||
Directors Fees |
| 13,000 |
| 16,000 |
| 24,000 |
| (12,000 | )(b) | 41,000 |
| |||||
Reports to Shareholders |
| 20,000 |
| 39,000 |
| 216,000 |
| (30,000 | )(b) | 245,000 |
| |||||
Registration Fees |
| 55,000 |
| 50,000 |
| 98,000 |
| (50,000 | )(b) | 153,000 |
| |||||
Loan Interest Expense |
| — |
| 974 |
| — |
|
|
| 974 |
| |||||
Miscellaneous Expenses |
| 12,764 |
| 18,452 |
| 15,238 |
| (16,000 | )(b) | 30,454 |
| |||||
|
|
|
|
|
|
|
|
|
|
|
| |||||
Total Expenses |
| 3,213,489 |
| 2,011,243 |
| 8,852,810 |
| (895,873 | ) | 13,181,669 |
| |||||
Less: Expense Reimbursement ** |
| (346,603 | ) | — |
| — |
| — |
| (462,325 | ) | |||||
Net Expenses |
| 2,866,886 |
| 2,011,243 |
| 8,852,810 |
| (1,011,594 | ) | 12,719,344 |
| |||||
|
|
|
|
|
|
|
|
|
|
|
| |||||
Net Investment Income (Loss) |
| (2,151,240 | ) | (1,222,892 | ) | (692,030 | ) | 1,011,594 |
| (3,054,567 | ) | |||||
|
|
|
|
|
|
|
|
|
|
|
| |||||
Realized and Unrealized Gain (Loss) on |
|
|
|
|
|
|
|
|
|
|
| |||||
Net Realized Gain (Loss) on: |
|
|
|
|
|
|
|
|
|
|
| |||||
Investments |
| (14,727,696 | ) | 58,788,786 |
| 109,919,762 |
| — |
| 153,980,852 |
| |||||
Futures |
| — |
| — |
| — |
| — |
| — |
| |||||
Options Written |
| — |
| 68,280 |
| 115,269 |
| — |
| 183,549 |
| |||||
Foreign Currency |
| — |
| 3,936 |
| 26 |
| — |
| 3,962 |
| |||||
|
| (14,727,696 | ) | 58,861,002 |
| 110,035,057 |
| — |
| 154,168,363 |
| |||||
|
|
|
|
|
|
|
|
|
|
|
| |||||
Net Change in Unrealized Appreciation (Depreciation) on: |
|
|
|
|
|
|
|
|
|
|
| |||||
Investments |
| (7,144,254 | ) | (9,708,802 | ) | 5,268,908 |
| — |
| (11,584,148 | ) | |||||
Futures |
| — |
| — |
| — |
| — |
| — |
| |||||
Options Written |
| — |
| — |
| 5,399 |
| — |
| 5,399 |
| |||||
Foreign Currency |
| — |
| — |
| — |
| — |
| — |
| |||||
|
| (7,144,254 | ) | (9,708,802 | ) | 5,274,307 |
| — |
| (11,578,749 | ) | |||||
|
|
|
|
|
|
|
|
|
|
|
| |||||
Net Gain (Loss) on Investments |
| (21,871,950 | ) | 49,152,200 |
| 115,309,364 |
| — |
| 142,589,614 |
| |||||
|
|
|
|
|
|
|
|
|
|
|
| |||||
Net Increase (Decrease) in Net Assets Resulting From Operations |
| $ | (24,023,190 | ) | $ | 47,929,308 |
| $ | 114,617,334 |
| $ | 1,011,594 |
| $ | 139,535,047 |
|
(a) Affiliated Transfer Agent’s Fees and Exp |
| $ | 492,000 |
| $ | 164,000 |
| $ | 1,242,000 |
|
|
|
|
|
(b) Assumes savings on fund fees due to consolidation.
** — Amounts have been restated to reflect current fee rates and related impact on expense ratio.
F-29
Jennison U.S. Emerging Growth Fund merger with SP Mid-Cap Growth
Fund and SP New Era Growth Fund
Notes to Pro-Forma Financial Statements
(unaudited)
1. Basis of Combination – The Pro-Forma Statement of Assets and Liabilities, including the Pro-Forma Schedule of Investments at June 30, 2006 and the related Pro-Forma Statement of Operations (“Pro-Forma Statements”) for the period ended June 30, 2006, reflect the accounts of Jennison U.S. Emerging Growth Fund (the “acquiring” fund), and SP Mid-Cap Growth Fund and SP New Era Growth Fund, (the “target” funds) each a “Fund.”
The Pro-Forma Statements give effect to the proposed transfer of all assets and liabilities of SP Mid-Cap Growth Fund and SP New Era Growth Fund in exchange for shares in Jennison U. S. Emerging Growth Fund. The Pro-Forma Statements should be read in conjunction with the historical financial statements of each Fund included in their respective Statement of Additional Information.
2. Shares of Beneficial Interest – The pro-forma net asset value per share assumes the issuance of additional Class A, B, C, L, M, X and Z shares of Jennison U.S. Emerging Growth Fund, which would have been issued on June 30, 2006 in connection with the proposed reorganization. Shareholders of SP Mid-Cap Growth Fund and SP New Era Growth Fund would become shareholders of Jennison U.S. Emerging Growth Fund, receiving shares of Jennison U.S. Emerging Growth Fund equal to the value of their holdings in SP Mid-Cap Growth Fund and SP New Era Growth Fund. The amount of additional shares assumed to be issued has been calculated based on the June 30, 2006 net assets of SP Mid-Cap Growth Fund, SP New Era Growth Fund and Jennison U.S. Emerging Growth Fund, the net asset value per share of as follows:
Jennison U.S. Emerging |
| Net Assets of |
|
|
| Per |
| ||||
Additional Shares Issued |
| 6/30/06 |
| Adjustments* |
| 6/30/06 |
| ||||
Class A |
| 1,335,448 |
| $ | 27,550,238 |
| (63,079 | ) | $ | 20.58 |
|
Class B |
| 1,957,691 |
| $ | 37,263,150 |
| (85,863 | ) | $ | 18.99 |
|
Class C |
| 2,233,439 |
| $ | 42,521,980 |
| (97,399 | ) | $ | 19.00 |
|
Class L |
| 973,315 |
| $ | 20,079,049 |
| (45,561 | ) | $ | 20.58 |
|
Class M |
| 2,637,305 |
| $ | 50,207,037 |
| (113,923 | ) | $ | 18.99 |
|
Class X |
| 538,979 |
| $ | 10,250,457 |
| (23,258 | ) | $ | 18.98 |
|
Class Z |
| 203,259 |
| $ | 4,299,282 |
| (9,917 | ) | $ | 21.10 |
|
* Reflects the estimated reorganization expenses of $181,000 attributable to SP New Era Growth Fund and $258,000 attributable to SP Mid-Cap Growth Fund.
3. Pro-Forma Operations – The Pro-Forma Statement of Operations assumes similar rates of gross investment income for the investments of each Fund. Accordingly, the combined gross investment income is equal to the sum of each Fund’s gross investment income. Certain expenses have been adjusted to reflect the expected expenses of the combined entity. The pro-forma investment management fees and plan of distribution fees of the combined Fund
F-30
are based on the fee schedule in effect for Jennison U.S. Emerging Growth Fund at the combined level of average net assets for the twelve months ended June 30, 2006. The Pro- Forma Statement of Operations does not include the effect of any realized gains or losses, or transaction fees incurred in connection with the realignment of the portfolio.
4. Security Valuation – Securities listed on a securities exchange are valued at the last sale price on such exchange on the day of valuation or, if there was no sale on such day, at the mean between the last reported bid and ask price or at the last bid price on such day in the absence of an asked price. Securities traded via NASDAQ are valued at the NASDAQ official closing price (NOCP) on the day of valuation, or if there was no NOCP, at the last sale price. Securities that are actively traded in the over-the-counter market, including listed securities for which the Manager, in consultation with the subadvisor, believe the primary market to be over-the-counter are valued by an independent agent or principal market maker. Options on securities and indices traded on an exchange are valued at the mean between the most recently quoted bid and asked prices on such exchange. Futures contracts and options thereon traded on a commodities exchange of board of trade are valued at the last sale price at the closing of trading on such exchange or board of trade or, if there was no sale on the applicable commodities exchange or board of trade on such day, at the mean between the most recently quoted bid and asked prices on such exchange or board of trade or at the last bid price in the absence of an asked price. Prices may be obtained from independent pricing services which use information provided by market makers or estimates of market values obtained from yield data relating to investments or securities with similar characteristics. Securities for which reliable market quotations are not readily available, or whose values have been affected by events occurring after the close of the security’s foreign market and before the Funds’ normal pricing time, are valued at fair value in accordance with the Board of Directors’ approved fair valuation procedures. When determining the fair valuation of securities some of the factors influencing the valuation include, the nature of any restrictions on disposition of the securities; assessment of the general liquidity of the securities; the issuer’s financial condition and the markets in which it does business; the cost of the investment; the size of the holding and the capitalization of issuer; the prices of any recent transactions or bids/offers for such securities or any comparable securities; any available analysis media or other reports or information deemed reliable by the investment adviser regarding the issuer or the markets or industry in which it operates. Using fair value to price securities may result in a value that is different from a security’s most recent closing price and from the price used by other mutual funds to calculate their net asset values. Investments in mutual funds are valued at their net assets value as of the close of the New York Stock Exchange on the date of the valuation. Short-term securities that are held in the Funds, which mature in more than 60 days are valued at current market quotations, and those short-term securities, which mature in 60 days or less are valued at, amortized cost, which approximates market value.
The Funds valuation policies are substantially identical and there are no differences in terms of how each Fund values its portfolio securities.
5. Estimates – The preparation of financial statements requires management to make estimates and assumptions that affect the reported amounts and disclosures in the financial statements. Actual results could differ from those estimates.
6. Taxes - For Federal income tax purposes, the acquiring fund and each of the target funds is treated as a separate taxpaying entity. It is each Fund’s policy to continue to meet the
F-31
requirements of the Internal Revenue Code applicable to regulated investment companies and to distribute all of its taxable net income and capital gains, if any, to shareholders. Therefore, no federal income tax provision is required. SP Mid-Cap Growth Fund and SP New Era Growth Fund each had a capital loss carryforward of $153,730,000 and $93,526,000 as of October 31, 2005 and February 28, 2006, respectively, all of which will have an annual limitation on the amount of utilization under section 382 of the Internal Revenue Code of 1986, as amended. Jennison U.S. Emerging Growth had a capital loss carryforward of $198,229,000 as of October 31, 2005.
F-32
PART C
OTHER INFORMATION
ITEM 15. INDEMNIFICATION
As permitted by Sections 17(h) and (i) of the Investment Company Act of 1940 (the 1940 Act) and the Maryland General Corporation Law (the MGCL), and pursuant to Article V of the Registrant’s Amended and Restated By-Laws (Exhibit (2)(c) to the Registration Statement), the Registrant shall indemnify present and former officers and directors (and persons who serve or served as the officer or director of certain other enterprises at the Registrant’s request), and, to the extent authorized by the Registrant’s Board, employees and agents, against judgments, fines, settlements and expenses, and may advance expenses to such parties, to the fullest extent authorized, and in the manner permitted, by applicable federal and state law. Section 2-418 of the MGCL permits indemnification of directors, officers, employees and agents who are made a party (or threatened to be made a party) to any proceeding by reason of their service in such capacity, unless it is established that (i) the act or omission of such person was material to the matter and (a) was committed in bad faith or (b) was the result of active and deliberate dishonesty; or (ii) such person actually received an improper personal benefit in money, property or services; or (iii) in the case of a criminal proceeding, such person had reasonable cause to believe that the act or omission was unlawful. The MGCL does not permit indemnification in respect of any proceeding by or in the right of the Registrant in which a person is found liable to the Registrant or, for proceedings brought against the Registrant, except in limited circumstances. A Maryland corporation may be required to reimburse officers and directors for reasonable expenses incurred in the successful defense of a proceeding to which such director or officer is a party by reason of his or her service in such capacity. As permitted by Section 17(i) of the 1940 Act, pursuant to Section 10 of the Distribution Agreement (Exhibits (7)(A) to this Registration Statement), the Distributor of the Registrant may be indemnified against liabilities which it may incur, except liabilities arising from bad faith, gross negligence, willful misfeasance or reckless disregard of duties.
Pursuant to Article VI of the Registrant ‘s charter, Exhibit (1)(A) to the Registration Statement, directors and officers of the Registrant shall not be liable to its shareholders for monetary damages for breach of fiduciary duty as officers or directors to the extent permitted by law (including the MGCL and the 1940 Act). Under Maryland law, such limitation on liability will not apply to liability resulting from: (a) actual receipt of an improper benefit or profit in money, property or services or (b) active and deliberate dishonesty established by a final judgment as being material to the cause of action.
Insofar as indemnification for liabilities arising under the Securities Act of 1933, as amended (Securities Act) may be permitted to directors, officers and controlling persons of the Registrant pursuant to the foregoing provisions or otherwise, the Registrant has been advised that in the opinion of the Securities and Exchange Commission such indemnification is against public policy as expressed in the 1940 Act and is, therefore, unenforceable. In the event that a claim for indemnification against such liabilities (other than the payment by the Registrant of expenses incurred or paid by a director, officer or controlling person of the Registrant in connection with the successful defense of any action, suit or proceeding) is asserted against the Registrant by such director, officer or controlling person in connection with the shares being registered, the Registrant will, unless in the opinion of its counsel the matter has been settled by controlling precedent, submit to a court of appropriate jurisdiction the question whether such indemnification by it is against public policy as expressed in the 1940 Act and will be governed by the final adjudication of such issue.
The Registrant has purchased an insurance policy insuring its officers and directors against liabilities, and certain costs of defending claims against such officers and directors, to the extent such officers and directors are not found to have committed conduct constituting willful misfeasance, bad faith, gross negligence or reckless disregard in the performance of their duties. The insurance policy also insures the Registrant against the cost of indemnification payments to officers and directors under certain circumstances.
C - 1
Section 9 of the amended Management Agreement and each other Management Agreement (Exhibits (6)(A) (i) to (6)(A)(ii) of the Registration Statement) and Section 4 of the Subadvisory Agreement (Exhibits (6)(B) to the Registration Statement) limit the liability of Prudential Investments LLC (PI), Prudential Investment Management, Inc. (PIM) and Jennison Associates LLC (Jennison), respectively, to liabilities arising from willful misfeasance, bad faith or gross negligence in the performance of their respective duties or from reckless disregard by them of their respective obligations and duties under the agreements.
The Registrant hereby undertakes that it will apply the indemnification provisions of its Amended and Restated By-Laws and each Distribution Agreement in a manner consistent with Release No. 11330 of the Securities and Exchange Commission under the 1940 Act so long as the interpretation of Sections 17(h) and 17(i) of such Act remain in effect and are consistently applied.
ITEM 16. EXHIBITS
Exhibits:
(1) (A) Articles of Incorporation.(1)
(B) Articles of Amendment.(2)
(C) Articles Supplementary.(4)
(D) Articles of Amendment.(6)
(E) Articles of Amendment dated June 30, 2003.(11)
(F) Articles Supplementary dated July 17, 2003.(11)
(G) Articles Supplementary dated February 7, 2005.(13)
(H) Articles Supplementary dated February 21, 2006.(15)
(2) (A) Amended and Restated By-Laws dated November 16, 2004.(12)
(3) Not Applicable.
(4) (A) The form of Plan of Reorganization for the reorganization of Strategic Partners Mid-Cap Growth Fund and Jennison Emerging Growth Fund is included as Exhibit A to the Joint Prospectus and Proxy Statement contained in this Registration Statement.
(B) The form of Plan of Reorganization for the reorganization of Strategic Partners New Era Growth Fund and Jennison Emerging Growth Fund is included as Exhibit A to the Joint Prospectus and Proxy Statement contained in this Registration Statement.
(5) Specimen Stock Certificate issued by the Registrant. (2)
(6) (A) (i) Management Agreement between the Registrant and Prudential Investments Fund Management LLC.(9)
(ii) New Fee Schedule as of May 25, 2004.(14)
C - 2
(B) Subadvisory Agreement with Jennison Associates LLC.(9)
(7) (A) Amended and Restated Distribution Agreement between the Registrant and Prudential Investment Management Services LLC.(15)
(B) Selected Dealer Agreement.(3)
(8) Not Applicable.
(9) Custodian Contract between the Registrant and The Bank of New York dated June 6, 2005.(14)
(10) (A) Amended and Restated Distribution and Service Plan for Class A Shares.(3)
(B) Amended and Restated Distribution and Service Plan for Class B Shares.(3)
(C) Amended and Restated Distribution and Service Plan for Class C Shares.(3)
(D) Distribution and Service Plan for Class R Shares dated November 19, 2003.(12)
(E) Distribution and Service Plan for Class L shares for the Fund with Prudential Investment Management Services LLC.(15)
(F) Distribution and Service Plan for Class M shares for the Fund with Prudential Investment Management Services LLC.(15)
(G) Distribution and Service Plan for Class X shares for the Fund with Prudential Investment Management Services LLC.(15)
(H) Distribution and Service Plan for New Class X shares for the Fund with Prudential Investment Management Services LLC.(15)
(I) Rule 12b-1 Fee Waiver for Class A and R Shares.(15)
(J) Amended and Restated Rule 18f-3 Plan.(15)
(11) Opinion and consent of DLA Piper Rudnick Gray Cary US LLP as to the legality of the securities being registered.*
(12)(A) Form of opinion and consent of counsel support tax matters and consequences to shareholders for SP Mid-Cap Growth.*
(12)(B) Form of opinion and consent of counsel supporting tax matters and consequences to shareholders for SP New Era Growth.*
(13) (A) Transfer Agency and Service Agreement between the Registrant and Prudential Mutual Fund Services, Inc.(2)
(B) Amendment to Transfer Agency Agreement.(5)
(C) Amendment to Transfer Agency Agreement dated September 4, 2002.(11)
(14) (A) Consent of KPMG LLP, independent registered public accounting firm, for the Registrant.*
(B) Consent of KPMG LLP, independent registered public accounting firm, for Strategic Partners Mutual Funds, Inc. (SPMF), on behalf of Strategic Partners Mid-Cap Growth Fund.*
(C) Consent of KPMG LLP, independent registered public accounting firm, for Strategic Partners Opportunity Funds (SP Opportunity Funds), on behalf of Strategic Partners New Era Growth Fund.*
(15) Not Applicable.
C - 3
(16) Power of attorney dated September 7, 2005.(14)
(17) (A) Form of voting instruction card for shareholders of Strategic Partners Mid-Cap Growth Fund.*
(B) Form of voting instruction card for shareholders of Strategic Partners New Era Growth Fund.*
(C) Form of proxy solicitation material being sent to shareholders of Strategic Partners Mid-Cap Growth Fund and Strategic Partners New Era Growth Fund.*
(1) Incorporated by reference to Registrant’s Registration Statement on Form N-1A filed on or about September 11, 1996 (File Nos. 333-11785 and 811-07811).
(2) Incorporated by reference to Registrant’s Pre-Effective Amendment No. 1 to its Registration Statement on Form N-1A filed on or about October 30, 1996 (File Nos. 333-11785 and 811-07811).
(3) Incorporated by reference to Registrant’s Post-Effective Amendment No. 3 to its Registration Statement on Form N-1A filed on or about October 30, 1998 (File Nos. 333-11785 and 811-07811).
(4) Incorporated by reference to Registrant’s Post-Effective Amendment No. 5 to its Registration Statement on Form N-1A filed on December 31, 1998 (File Nos. 333-11785 and 811-07811).
(5) Incorporated by reference to Registrant’s Post-Effective Amendment No. 6 to its Registration Statement on Form N-1A filed on January 20, 2000 (File Nos. 333-11785 and 811-07811).
(6) Incorporated by reference to Exhibit (p)(3) to Post-Effective Amendment No. 24 to the Registration Statement of Prudential Natural Resources Fund, Inc. filed on Form N-1A via EDGAR on July 30, 2002 (File No. 33-15166).
(7) Incorporated by reference to Post-Effective Amendment No. 23 to the Registration Statement on Form N-1A filed on July 31, 2001 of Prudential Natural Resources Fund, Inc. (File No. 33-15166).
(8) Incorporated by reference to Exhibits (p)(1) and (p)(2) to Post-Effective Amendment No. 39 to the Registration Statement on Form N-1A filed on January 29, 2003 of Jennison Sector Funds, Inc. (File No. 2-72097).
(9) Incorporated by reference to Registrant’s Post-Effective Amendment No. 10 to its Registration Statement on Form N-1A filed on December 28, 2001 (File Nos. 333-11785 and 811-07811).
(10) Incorporated by reference to Registrant’s Post-Effective Amendment No. 11 to its Registration Statement on Form N-1A filed on December 30, 2002 (File Nos. 333-11785 and 811-07811).
(11) Incorporated by reference to Registrant’s Post-Effective Amendment No. 12 to its Registration Statement on Form N-1A filed on February 2, 2004 (File Nos. 333-11785 and 811-07811).
(12) Incorporated by reference to Registrant’s Post-Effective Amendment No. 14 to its Registration Statement on Form N-1A filed on December 17, 2004 (File Nos. 333-11785 and 811-07811).
(13) Incorporated by reference to Registrant’s Post-Effective Amendment No. 16 to its Registration Statement on Form N-1A filed on February 24, 2005 (File Nos. 333-11785 and 811-07811).
(14) Incorporated by reference to Registrant’s Post-Effective Amendment No. 16 to its Registration Statement on Form N-1A filed on December 23, 2005 (File Nos. 333-11785 and 811-07811).
(15) Incorporated by reference to Registrant’s Post-Effective Amendment No. 18 to its Registration Statement on Form N-1A filed on February 27, 2006 (File Nos. 333-11785 and 811-07811).
* Filed herewith.
** To be filed at subsequent Amendment.
C - 4
ITEM 17. UNDERTAKINGS
(1) The undersigned registrant agrees that prior to any public reoffering of the securities registered through the use of a prospectus which is part of this registration statement by any person or party who is deemed to be an underwriter within the meaning of Rule 145(c) of the Securities Act, the reoffering prospectus will contain the information called for by the applicable registration form for reofferings by persons who may be deemed underwriters, in addition to the information called for by the other items of the applicable form.
(2) The undersigned registrant agrees that every prospectus that is filed under paragraph (1) above will be filed as part of an amendment to the registration statement and will not be used until the amendment is effective, and that, in determining any liability under the 1933 Act, each post-effective amendment shall be deemed to be a new registration statement for the securities offered therein, and the offering of the securities at that time shall be deemed to be the initial bona fide offering of them.
(3) The undersigned Registrant undertakes to file, by post-effective amendment, a copy of the opinion as to certain tax matters, within a reasonable time after receipt of such opinion.
C - 5
SIGNATURES
As required by the Securities Act of 1933, this registration statement has been signed on behalf of the registrant, in the City of Newark, State of New Jersey on the 25th day of August, 2006.
|
| JENNISON U.S. EMERGING GROWTH FUND, | ||
|
| By: | /s/ Deborah A. Docs |
|
|
|
| Deborah A. Docs, Secretary | |
Pursuant to the requirements of the Securities Act, this Registration Statement has been signed below by the following persons in the capacities and on the dates indicated.
Signature |
| Title |
|
|
|
* |
|
|
Linda W. Bynoe |
|
|
* |
| Director |
David E.A. Carson |
|
|
* |
| Director |
Robert G. LaBlanc |
|
|
* |
| Director |
Robert F. Gunia |
|
|
* |
| Director |
Douglas H. McCorkindale |
|
|
* |
| Director |
Richard A. Redeker |
|
|
* |
| Director |
Judy A. Rice |
|
|
* |
| Director |
Robin B. Smith |
|
|
* |
| Director |
Stephen G. Stoneburn |
|
|
* |
| Director |
Clay T. Whitehead |
|
|
* |
| Treasurer and Principal Financial and Accounting |
Grace C. Torres |
| Officer |
*By: | /s/ CLAUDIA DIGIACOMO |
| |
| Claudia DiGiacomo | August 25, 2006 | |
| Attorney-in-Fact |
| |
* Pursuant to Powers of Attorney previously filed.
C - 6
JENNISON U.S. EMERGING GROWTH FUND, INC.
REGISTRATION STATEMENT ON FORM N-14
EXHIBIT INDEX
Exhibit No. |
| Description |
(11) |
| Opinion and consent of DLA Piper Rudnick Gray Cary US LLP as to the legality of the securities being registered. |
(12)(A) |
| Form of opinion and consent of counsel supporting tax matters and consequences to shareholders for SP Mid-Cap Growth Fund. |
(12)(B) |
| Form of opinion and consent of counsel supporting tax matters and consequences to shareholders for SP New Era Growth. |
(14)(A) |
| Consent of KPMG LLP, independent registered public accounting firm, for the Registrant. |
(14)(B) |
| Consent of KPMG LLP, independent registered public accounting firm, for Strategic Partners Mutual Funds, Inc. (SPMF), on behalf of Strategic Partners Mid-Cap Growth Fund. |
(14)(C) |
| Consent of KPMG LLP, independent registered public accounting firm, for SP Opportunity Funds, on behalf of Strategic Partners New Era Growth Fund. |
(17)(A) |
| Form of voting instruction card for shareholders of Strategic Partners Mid-Cap Growth Fund. |
(17)(B) |
| Form of voting instruction card for shareholders of Strategic Partners New Era Growth Fund. |
(17)(C) |
| Form of proxy solicitation material being sent to shareholders of Strategic Partners Mid-Cap Growth Fund and Jennison New Era Growth Fund. |