UNITED STATES
SECURITIES AND EXCHANGE COMMISSION
Washington, D.C. 20549
FORM N-CSR
CERTIFIED SHAREHOLDER REPORT OF REGISTERED MANAGEMENT
INVESTMENT COMPANIES
Investment Company Act file number: | | 811-07811 |
| |
Exact name of registrant as specified in charter: | | Jennison U.S. Emerging Growth Fund, Inc. |
| |
Address of principal executive offices: | | Gateway Center 3 100 Mulberry Street Newark, New Jersey 07102 |
| |
Name and address of agent for service: | | Marguerite E. H. Morrison Gateway Center 3 100 Mulberry Street Newark, New Jersey 07102 |
| |
Registrant’s telephone number, including area code: | | 973-367-7525 |
| |
Date of fiscal year end: | | October 31, 2003 |
| |
Date of reporting period: | | October 31, 2003 |
Item 1 – Reports to Stockholders
[SHAREHOLDER REPORT TO BE INSERTED HERE IN THE EDGAR VERSION]
Jennison U.S. Emerging Growth Fund, Inc.
Formerly known as Prudential U.S. Emerging Growth Fund, Inc.
|
| OCTOBER 31, 2003 | | ANNUAL REPORT |

FUND TYPE
Small- to mid-capitalization stock
OBJECTIVE
Long-term capital appreciation
This report is not authorized for distribution to prospective investors unless preceded or accompanied by a current prospectus.
The views expressed in this report and information about the Fund’s portfolio holdings are for the period covered by this report and are subject to change thereafter.
JennisonDryden is a service mark of The Prudential Insurance Company of America.

Dear Shareholder,
December 16, 2003
As you may know, the mutual fund industry recently has been the subject of much media attention. There has been press coverage of Prudential, and recently, administrative complaints were filed against Prudential Securities* and some of its former brokers and branch managers in Massachusetts. As president of your Fund, I’d like to provide you with an update on the issues as they pertain to JennisonDryden mutual funds.
State and federal authorities have requested information regarding trading practices from many mutual fund companies across the nation. Our fund family has been cooperating with inquiries it has received, and at the same time, Prudential Financial, Inc. has been conducting its own internal review. This review encompasses the policies, systems, and procedures of our fund family, Prudential Financial’s investment units and its proprietary distribution channels, including the former Prudential Securities. The review also includes mutual fund trading activity by investment professionals who manage our funds.
Market timing
Prudential Investments LLC, the Fund’s investment manager, has actively discouraged disruptive market timing, and for years, our mutual fund prospectuses have identified and addressed this issue. Prudential Investments has established operating policies and procedures that are designed to detect and deter frequent trading activities that would be disruptive to the management of our mutual fund portfolios, and has rejected numerous orders placed by market timers in the past.
* Prudential Investments LLC, the manager of JennisonDryden mutual funds, and Prudential Investment Management Services LLC, the distributor of the funds, are part of the Investment Management segment of Prudential Financial, Inc. and are separate legal entities from the entity formerly known as Prudential Securities Incorporated, a retail brokerage firm. In February 2003, Prudential Financial and Wachovia Corporation announced they were combining their retail brokerage forces. The transaction was completed in July 2003. Wachovia Corporation has a 62% interest in the new firm, which is now known as Wachovia Securities LLC, and Prudential Financial owns the remaining 38%.
Late trading
The Securities and Exchange Commission requires that orders to purchase or redeem mutual fund shares be received either by the fund or by an intermediary (such as a broker, financial adviser, or 401(k) record keeper) before the time at which the fund calculates its net asset value (normally 4:00 p.m., Eastern time) if they are to receive that day’s price. The policies of our mutual funds do not make and have not made allowances for the practice known as “late trading”.
For more than 40 years we have offered investors quality investment products, financial guidance, and responsive customer service. Today we remain committed to this heritage and to the highest ethical principles in our investment practices.
Sincerely,

Judy A. Rice, President
Jennison U.S. Emerging Growth Fund, Inc
| Jennison U.S. Emerging Growth Fund, Inc. | | 1 |
Your Fund’s Performance
Fund Objective
The investment objective of the Jennison U.S. Emerging Growth Fund, Inc. (the Fund) is long-term capital appreciation. There can be no assurance that the Fund will achieve its investment objective.
|
| Cumulative Total Returns1 as of 10/31/03 | |
| | | One Year | | | Five Years | | | Since Inception2 | |
Class A | | 41.99 | % | | 51.83 | % | | 85.75 | % |
|
Class B | | 40.87 | | | 46.23 | | | 76.23 | |
|
Class C | | 40.87 | | | 46.23 | | | 76.23 | |
|
Class Z | | 42.42 | | | 53.76 | | | 88.88 | |
|
S&P MidCap 400 Index3 | | 30.61 | | | 73.55 | | | 132.33 | |
|
Russell Midcap Growth Index4 | | 39.30 | | | 25.35 | | | 53.69 | |
|
Lipper Mid-Cap Growth Funds Avg.5 | | 30.87 | | | 33.84 | | | 48.55 | |
|
| | | | | | | | | | |
|
| Average Annual Total Returns1 as of 9/30/03 | |
| | | One Year | | | Five Years | | | Since Inception2 | |
Class A | | 37.98 | % | | 8.04 | % | | 7.83 | % |
|
Class B | | 39.24 | | | 8.20 | | | 7.83 | |
|
Class C | | 41.81 | | | 8.13 | | | 7.66 | |
|
Class Z | | 45.59 | | | 9.44 | | | 8.92 | |
|
S&P MidCap 400 Index3 | | 26.81 | | | 11.96 | | | 12.10 | |
|
Russell Midcap Growth Index4 | | 38.89 | | | 4.49 | | | 5.36 | |
|
Lipper Mid-Cap Growth Funds Avg.5 | | 27.72 | | | 4.62 | | | 4.11 | |
|
Past performance is not indicative of future results. Principal value and investment return will fluctuate so that an investor’s shares, when redeemed, may be worth more or less than their original cost. 1Source: Prudential Investments LLC and Lipper Inc. The cumulative total returns do not take into account applicable sales charges. The average annual total returns do take into account applicable sales charges. Without the distribution and service (12b-1) fee waiver of 0.05% for Class A shares, the returns would have been lower. The Fund charges a maximum front-end sales charge of 5% for Class A shares in most circumstances, and a 12b-1 fee of up to 0.30% annually. In some circumstances, Class A shares may not be subject to a front-end sales charge, but may be subject to a 1% contingent deferred sales charge (CDSC) for the first year. Class B shares are subject to a declining CDSC of 5%, 4%, 3%, 2%, 1%, and 1% for the first six years respectively after purchase, and a 12b-1 fee of 1% annually. Approximately seven years after purchase, Class B shares will automatically convert to Class A shares on a quarterly basis. Class C shares are subject to a front-end sales charge of 1%, a CDSC of 1% for shares redeemed within 18 months of purchase, and a 12b-1 fee of 1% annually. Class Z shares are not subject to a sales charge or 12b-1 fee. The returns in the tables above do not reflect the deduction of taxes that a shareholder would pay on fund distributions or following the redemption of fund shares. 2Inception date: 12/31/96. 3The Standard & Poor’s MidCap 400 Stock Index (S&P MidCap 400 Index) is an unmanaged index of 400 domestic stocks chosen for market size, liquidity, and industry group representation. It gives a broad look at how U.S. mid-cap stock prices have performed. 4The Russell Midcap Growth Index is an unmanaged index that measures the performance of those Russell MidCap companies with higher price-to-book ratios and higher
| 2 | | Visit our website at www.jennisondryden.com |
forecasted growth values. Investors cannot invest directly in an index. 5The Lipper Mid-Cap Growth Funds Average (Lipper Average) represents returns based on an average return of all funds in the Lipper Mid-Cap Growth Funds category for the periods noted. Funds in the Lipper Average invest at least 75% of their equity assets in companies with market capitalizations (on a three-year weighted basis) less than 300% of the dollar-weighted median market capitalization of the middle 1,000 securities of the S&P SuperComposite 1500 Index. Mid-cap growth funds typically have an above-average price-to-earnings ratio, price-to-book ratio, and three-year sales-per-share growth value compared to the S&P MidCap 400 Index. The S&P MidCap 400 Index and the Russell Midcap Growth Index do not bear sales charges, operating expenses of a mutual fund, or deductions for taxes. Returns for these indexes would be lower if they were subject to these deductions. Returns for the Lipper Average reflect the deduction of mutual fund operating expenses, but not sales charges or taxes.
|
| Five Largest Holdings expressed as a percentage of net assets as of 10/31/03 | |
CheckFree Corp., Information Technology Services | | 4.0 | % |
|
E*TRADE Financial Corp., Capital Markets | | 2.8 | |
|
InterActiveCorp., Internet & Catalog Retail | | 2.8 | |
|
WebMD Corp., Healthcare Providers & Services | | 2.6 | |
|
Monster Worldwide, Inc., Commercial Services & Supplies | | 2.5 | |
|
Holdings are subject to change.
|
| Five Largest Industries expressed as a percentage of net assets as of 10/31/03 | |
Semiconductors & Semiconductor Equipment | | 13.4 | % |
|
Media | | 7.6 | |
|
Capital Markets | | 7.4 | |
|
Software | | 7.0 | |
|
Pharmaceuticals | | 6.6 | |
|
| Industry | weightings are subject to change. |
| Jennison U.S. Emerging Growth Fund, Inc. | | 3 |
Investment Adviser’s Report
Performance and market overview
The Fund produced impressive absolute and relative gains over the past 12 months, outperforming its Lipper peer group and its benchmark indexes by sizable margins. This favorable outcome was largely due to the disciplined adherence to our style despite difficult market conditions (October 2002 marked the low of the recent bear market).
Generally speaking, the Fund follows a two-pronged approach in our quest for growth: 1) companies with long-term growth patterns that are relatively immune to broader economic conditions and 2) innovative businesses with either cutting-edge products or unique business models that may be able to capitalize on important shifts in consumer behavior. This strategy yielded unimpressive results last year in a highly risk-averse market in which many investors did not differentiate among growth companies; price/earnings multiples were generally compressed across the board. This unfavorable environment showed signs of easing in the first few months of our fiscal year, but turned around dramatically with the conclusion of major combat in Iraq. As market sentiment returned to more “normal” levels, investors were once again willing to be discerning, and companies with solid growth prospects, sound balance sheets, and compelling products/services outperformed.
Innovative businesses outperformed
Among our top performers, companies with innovative business models dominated the list, with Monster Worldwide (see Comments on Largest Holdings) contributing the most gains by far. Monster’s online job search model has made recruiting cheaper and more efficient than the traditional newspaper channels, propelling Monster’s share of the total help-wanted market from 1.2% in 1999 to 6.9% in 2002. It is interesting to note that this growth was achieved during one of the worst labor market downturns in recent memory. We believe that as the economic conditions improve, Monster’s market share is likely to grow even stronger.
Electronic bill payment processor and services provider CheckFree Corporation (see Comments on Largest Holdings) also helped performance as consumers increasingly embrace bill payment online. The company has been a fairly consistent performer in terms of earnings, and recently enjoyed more good news as Bank of America (one of CheckFree’s biggest customers) announced it will be buying FleetBoston. If successful, the merger should add a considerable number of new users of CheckFree’s services.
On the other hand, some of our ideas did not pan out as expected, including our position in Circuit City. We originally purchased the stock as we sought exposure to
| 4 | | Visit our website at www.jennisondryden.com |
consumer electronics. However, competition among the retailers was keener than we had expected, which hurt Circuit City’s earnings. We have since exited from that position. Besides Circuit City, the only other holding that had a material negative impact on the Fund’s performance during the reporting period was Cerner Corporation, which declined in April after announcing results that were significantly below the company’s own guidance. We have since sold our position.
Looking ahead
The portfolio’s solid performance this year was largely the result of a rebound in price/earnings multiples from very depressed levels last year. As noted above, investors now appear more discerning and more willing to reward fundamentally sound companies with higher multiples.
After years of cost-cutting and restructuring, we believe the technology sector has considerably increased its operating leverage. We also believe that gross margins are healthy, although operating margins remain suboptimal. At this stage of the recovery, we believe the technology sector will need to see meaningful top-line growth in order to improve operating margins (and earnings) and justify further upside in stock prices. As such, while we maintain a sizable portion of the portfolio’s assets in the larger technology stocks with the inherent leverage to benefit from revenue growth, we may diversify into other areas (such as the healthcare and financial sectors) where we feel stock price performance has lagged fundamental improvements.
At the same time, in order to increase the potential for outperformance, we will seek stocks that may not be well covered, and which may be less efficiently priced as a result.
Jennison U.S. Emerging Growth Fund, Inc. Management Team
The Portfolio of Investments following this report shows the size of the Fund’s positions at period-end.
| Jennison U.S. Emerging Growth Fund, Inc. | | 5 |
Comments on Largest Holdings
Holdings expressed as a percentage of the Fund’s net assets as of 10/31/03.
| 4.0% | CheckFree Corp./InformationTechnology Services |
CheckFree Corp. provides electronic commerce services, software, and related products. CheckFree designs, develops, and markets services that enable its customers to make electronic payments and collections, automate paper-based recurring transactions, and conduct secure transactions on the Internet. CheckFree also provides investment services.
| 2.8% | E*TRADE Financial Corp./Capital Markets |
E*TRADE Financial Corporation provides financial services, including brokerage, banking, and lending for retail, corporate, and institutional customers. Securities products and services are offered by E*TRADE Securities LLC. Bank and lending products and services are offered by E*TRADE Bank, a federal savings bank, or its subsidiaries.
| 2.8% | InterActiveCorp./Internet & Catalog Retail |
InterActiveCorp. is an interactive commerce company with a multi-brand strategy. It consists of Expedia, Inc.; Hotels.com; HSN; Ticketmaster; Match.com; Entertainment Publications; Citysearch; Precision Response Corporation; Lending Tree; and Hotwire.com.
| 2.6% | WebMD Corporation/Healthcare Providers & Services |
WebMD Corporation provides connectivity and a full suite of services to the healthcare industry that improve administrative efficiencies and clinical effectiveness. WebMD’s products and services facilitate information exchange, communication, and transactions among the consumer, physician, and healthcare institutions.
| 2.5% | Monster Worldwide, Inc./Commercial Services & Supplies |
Monster Worldwide Inc., a marketing services, communications, and technology company, provides individually tailored advertising services. The company is a recruitment and yellow page advertising agency. Monster Worldwide Inc.’s services include planning and producing advertising campaigns, designing and implementing recruitment solutions, and planning on-campus recruitment programs.
Holdings are subject to change.
| 6 | | Visit our website at www.jennisondryden.com |
Financial Statements
|
| OCTOBER 31, 2003 | | ANNUAL REPORT |
Jennison U.S. Emerging Growth Fund, Inc.
Portfolio of Investments
as of October 31, 2003
| Shares | | Description | | Value (Note 1) |
| | | | | | |
LONG-TERM INVESTMENTS 97.6% | | | |
| |
COMMON STOCKS | | | |
| |
Airlines 2.2% | | | |
|
| 454,200 | | AMR Corp.(a)(b) | | $ | 6,031,776 |
| 288,500 | | Continental Airlines, Inc. (Class B)(a)(b) | | | 5,510,350 |
| | | | |
|
|
| | | | | | 11,542,126 |
| |
Biotechnology 5.9% | | | |
|
| 107,700 | | Gilead Sciences, Inc.(a) | | | 5,878,266 |
| 302,400 | | IDEC Pharmaceuticals Corp.(a)(b) | | | 10,623,312 |
| 171,800 | | IDEXX Laboratories, Inc.(a)(b) | | | 8,126,140 |
| 207,800 | | MedImmune, Inc.(a) | | | 5,539,948 |
| | | | |
|
|
| | | | | | 30,167,666 |
| |
Capital Markets 7.4% | | | |
|
| 1,390,200 | | E*TRADE Financial Corp.(a)(b) | | | 14,319,060 |
| 248,900 | | Investment Technology Group, Inc.(a)(b) | | | 4,943,154 |
| 98,400 | | Legg Mason, Inc.(b) | | | 8,191,800 |
| 93,400 | | Merrill Lynch & Co., Inc. | | | 5,529,280 |
| 117,700 | | T. Rowe Price Group, Inc.(b) | | | 4,843,355 |
| | | | |
|
|
| | | | | | 37,826,649 |
| |
Commercial Services & Supplies 5.0% | | | |
|
| 138,000 | | Apollo Group, Inc. (Class A)(a)(b) | | | 8,767,140 |
| 110,700 | | ChoicePoint, Inc.(a) | | | 3,878,928 |
| 503,300 | | Monster Worldwide, Inc.(a)(b) | | | 12,819,051 |
| | | | |
|
|
| | | | | | 25,465,119 |
| |
Communications Equipment 3.1% | | | |
|
| 829,900 | | ADC Telecommunications, Inc.(a)(b) | | | 2,116,245 |
| 97,700 | | Advanced Fibre Communications, Inc.(a) | | | 2,351,639 |
| 130,200 | | Harmonic, Inc.(a) | | | 1,010,352 |
| 371,100 | | Motorola, Inc.(b) | | | 5,020,983 |
| 716,000 | | Tellabs, Inc.(a) | | | 5,391,480 |
| | | | |
|
|
| | | | | | 15,890,699 |
| |
Computers & Peripherals 2.2% | | | |
|
| 217,100 | | Apple Computer, Inc.(a)(b) | | | 4,969,419 |
| 275,900 | | Seagate Technology | | | 6,340,182 |
| | | | |
|
|
| | | | | | 11,309,601 |
See Notes to Financial Statements.
| 8 | | Visit our website at www.jennisondryden.com |
| Shares | | Description | | Value (Note 1) |
| | | | | | |
Electronic Equipment & Instruments 6.6% | | | |
|
| 276,900 | | Agilent Technologies, Inc.(a)(b) | | $ | 6,900,348 |
| 152,500 | | Amphenol Corp. (Class A)(a)(b) | | | 8,959,375 |
| 1,097,000 | | Solectron Corp.(a) | | | 6,077,380 |
| 943,100 | | Symbol Technologies, Inc. | | | 11,779,319 |
| | | | |
|
|
| | | | | | 33,716,422 |
| |
Energy Equipment & Services 1.7% | | | |
|
| 117,700 | | BJ Services Co.(a) | | | 3,861,737 |
| 134,500 | | Smith International, Inc.(a) | | | 5,007,435 |
| | | | |
|
|
| | | | | | 8,869,172 |
| |
Health Care Equipment & Supplies 2.2% | | | |
|
| 50,500 | | Fisher Scientific International, Inc.(a) | | | 2,032,625 |
| 36,600 | | INAMED Corp.(a) | | | 3,161,142 |
| 257,900 | | VISX, Inc.(a) | | | 6,256,654 |
| | | | |
|
|
| | | | | | 11,450,421 |
| |
Health Care Providers & Services 3.6% | | | |
|
| 171,900 | | Caremark Rx, Inc.(a)(b) | | | 4,306,095 |
| 23,900 | | Select Medical Corp.(a) | | | 802,323 |
| 1,697,500 | | WebMD Corp.(a)(b) | | | 13,223,525 |
| | | | |
|
|
| | | | | | 18,331,943 |
| |
Internet & Catalog Retail 2.8% | | | |
|
| 385,248 | | InterActiveCorp(a)(b) | | | 14,142,454 |
| |
Internet Software & Services 4.0% | | | |
|
| 847,800 | | DoubleClick, Inc.(a)(b) | | | 7,062,174 |
| 804,500 | | RealNetworks, Inc.(a) | | | 5,349,925 |
| 185,400 | | Yahoo!, Inc.(a) | | | 8,101,980 |
| | | | |
|
|
| | | | | | 20,514,079 |
| |
IT Services 6.0% | | | |
|
| 489,400 | | Ceridian Corp.(a) | | | 10,277,400 |
| 746,700 | | CheckFree Corp.(a)(b) | | | 20,556,651 |
| | | | |
|
|
| | | | | | 30,834,051 |
| |
Media 7.6% | | | |
|
| 218,300 | | EchoStar Communications Corp. (Class A)(a)(b) | | | 8,365,256 |
| 121,800 | | Entercom Communications Corp.(a)(b) | | | 5,579,658 |
| 1,271,300 | | Gemstar-TV Guide International, Inc.(a) | | | 5,962,397 |
See Notes to Financial Statements.
| Jennison U.S. Emerging Growth Fund, Inc. | | 9 |
Portfolio of Investments
as of October 31, 2003 Cont’d.
| Shares | | Description | | Value (Note 1) |
| | | | | | |
| 510,600 | | General Motors Corp. (Class H)(a) | | $ | 8,389,158 |
| 216,300 | | Lin TV Corp. (Class A)(a) | | | 4,877,565 |
| 166,100 | | Univision Communications, Inc. (Class A)(a)(b) | | | 5,639,095 |
| | | | |
|
|
| | | | | | 38,813,129 |
| |
Multiline Retail 1.6% | | | |
|
| 212,300 | | Dollar Tree Stores, Inc.(a)(b) | | | 8,105,614 |
| |
Pharmaceuticals 6.6% | | | |
|
| 70,950 | | Barr Laboratories, Inc.(a)(b) | | | 5,446,831 |
| 192,600 | | Biovail Corp.(a) | | | 4,632,030 |
| 71,500 | | IVAX Corp.(a) | | | 1,377,090 |
| 113,600 | | Medicis Pharmaceutical Corp. (Class A)(b) | | | 7,196,560 |
| 222,800 | | Sepracor, Inc.(a) | | | 5,933,164 |
| 235,900 | | Watson Pharmaceuticals, Inc.(a)(b) | | | 9,263,793 |
| | | | |
|
|
| | | | | | 33,849,468 |
| |
Real Estate 1.6% | | | |
|
| 411,600 | | Friedman, Billings, Ramsey Group, Inc. (Class A) | | | 8,199,072 |
| |
Semiconductors & Semiconductor Equipment 13.4% | | | |
|
| 920,400 | | Agere Systems, Inc. (Class B)(a) | | | 3,120,156 |
| 408,400 | | Altera Corp.(a) | | | 8,261,932 |
| 86,100 | | AMIS Holdings, Inc.(a) | | | 1,734,915 |
| 594,900 | | GlobespanVirata, Inc.(a) | | | 3,664,584 |
| 162,300 | | Intel Corp. | | | 5,364,015 |
| 207,300 | | International Rectifier Corp.(a)(b) | | | 9,894,429 |
| 114,100 | | KLA-Tencor Corp.(a)(b) | | | 6,541,353 |
| 171,500 | | Lam Research Corp.(a) | | | 4,928,910 |
| 128,200 | | Linear Technology Corp.(b) | | | 5,462,602 |
| 208,800 | | Marvell Technology Group Ltd.(a)(b) | | | 9,160,056 |
| 63,600 | | Maxim Integrated Products, Inc. | | | 3,161,556 |
| 407,000 | | ON Semiconductor Corp.(a) | | | 1,750,100 |
| 247,300 | | Semtech Corp.(a)(b) | | | 5,490,060 |
| | | | |
|
|
| | | | | | 68,534,668 |
| |
Software 7.0% | | | |
|
| 94,000 | | Adobe Systems, Inc.(b) | | | 4,120,960 |
| 547,500 | | Amdocs Ltd.(a) | | | 11,749,350 |
| 170,500 | | Intuit, Inc.(a)(b) | | | 8,521,590 |
| 118,300 | | Mentor Graphics Corp.(a) | | | 1,981,525 |
| 109,900 | | Mercury Interactive Corp.(a) | | | 5,103,756 |
See Notes to Financial Statements.
| 10 | | Visit our website at www.jennisondryden.com |
| Shares | | Description | | Value (Note 1) | |
| | | | | | | |
| 148,900 | | PeopleSoft, Inc.(a) | | $ | 3,091,164 | |
| 96,600 | | Portal Software, Inc.(a) | | | 1,545,600 | |
| | | | |
|
|
|
| | | | | | 36,113,945 | |
| |
Specialty Retail 4.5% | | | | |
|
| 92,900 | | Chico’s FAS, Inc.(a)(b) | | | 3,487,466 | |
| 211,100 | | Linens ‘n Things, Inc.(a) | | | 6,231,672 | |
| 180,300 | | PETCO Animal Supplies, Inc.(a) | | | 5,982,354 | |
| 274,700 | | Staples, Inc.(a)(b) | | | 7,367,454 | |
| | | | |
|
|
|
| | | | | | 23,068,946 | |
| |
Textiles & Apparel 1.2% | | | | |
|
| 415,500 | | Tommy Hilfiger Corp.(a) | | | 6,103,695 | |
| |
Wireless Telecommunication Services 1.4% | | | | |
|
| 304,200 | | Nextel Communications, Inc. (Class A)(a)(b) | | | 7,361,640 | |
| | | | |
|
|
|
| | | Total long-term investments (cost $419,446,524) | | | 500,210,579 | |
| | | | |
|
|
|
SHORT-TERM INVESTMENTS 39.2% | | | | |
| |
Mutual Fund 39.2% | | | | |
|
| | | Dryden Core Investment Fund - Taxable Money Market Series(c) | | | | |
| 200,939,264 | | (cost $200,939,264; Note 3) | | | 200,939,264 | |
| | | | |
|
|
|
Principal
Amount (000) | | | | | |
| |
Repurchase Agreement | | | | |
|
| | | State Street Bank & Trust Co. Repurchase Agreement, dated 10/31/03, 0.05%, due 11/3/03(d)
| | | | |
| $ 73 | | (cost $73,000) | | $ | 73,000 | |
| | | | |
|
|
|
| | | Total short-term investments
(cost $201,012,264) | | | 201,012,264 | |
| | | | |
|
|
|
| | | Total Investments 136.8%
(cost $620,458,788; Note 5) | | | 701,222,843 | |
| | | Liabilities in excess of other assets (36.8%) | | | (188,580,600 | ) |
| | | | |
|
|
|
| | | Net Assets 100% | | $ | 512,642,243 | |
| | | | |
|
|
|
| (a) | Non-income producing security. |
| (b) | Security, or portion thereof, on loan, see Note 4. |
| (c) | Represents security, or a portion thereof, purchased with cash collateral received for securities on loan. |
| (d) | Repurchase price of $73,000. Collateralized by $55,000 U.S. Treasury Bond with a rate of 8.50%, maturity date of 2/15/20, and aggregate market value, including accrued interest, of $78,212. |
See Notes to Financial Statements.
| Jennison U.S. Emerging Growth Fund, Inc. | | 11 |
Statement of Assets and Liabilities
as of October 31, 2003
Assets | | | | |
|
Investments at value, including securities on loan of $178,973,766 (cost $620,458,788) | | $ | 701,222,843 | |
Cash | | | 7,034 | |
Receivable for investments sold | | | 18,456,971 | |
Receivable for Fund shares sold | | | 1,196,630 | |
Dividends and interest receivable | | | 11,120 | |
Other assets | | | 4,747 | |
| | |
|
|
|
Total assets | | | 720,899,345 | |
| | |
|
|
|
| |
Liabilities | | | | |
|
Payable to broker for collateral for securities on loan | | | 186,278,252 | |
Payable for investments purchased | | | 20,018,778 | |
Payable for Fund shares reacquired | | | 922,798 | |
Accrued expenses and other liabilities | | | 458,868 | |
Management fee payable | | | 256,420 | |
Distribution fee payable | | | 206,721 | |
Securities lending rebate payable | | | 115,265 | |
| | |
|
|
|
Total liabilities | | | 208,257,102 | |
| | |
|
|
|
| |
Net Assets | | $ | 512,642,243 | |
| | |
|
|
|
Net assets were comprised of: | | | | |
Common stock, at par | | $ | 37,064 | |
Paid-in capital in excess of par | | | 770,960,122 | |
| | |
|
|
|
| | | | 770,997,186 | |
Accumulated net realized loss on investments | | | (339,118,998 | ) |
Net unrealized appreciation on investments | | | 80,764,055 | |
| | |
|
|
|
| |
Net assets, October 31, 2003 | | $ | 512,642,243 | |
| | |
|
|
|
See Notes to Financial Statements.
| 12 | | Visit our website at www.jennisondryden.com |
Class A | | | |
|
Net asset value and redemption price per share ($204,684,934 ÷ 14,514,318 shares of common stock issued and outstanding) | | $ | 14.10 |
Maximum sales charge (5% of offering price) | | | .74 |
| | |
|
|
Maximum offering price to public | | $ | 14.84 |
| | |
|
|
| |
Class B | | | |
|
Net asset value, offering price and redemption price per share ($159,781,924 ÷ 12,036,362 shares of common stock issued and outstanding) | | $ | 13.27 |
| | |
|
|
| |
Class C | | | |
|
Net asset value and redemption price per share ($35,212,065 ÷ 2,652,510 shares of common stock issued and outstanding) | | $ | 13.27 |
Sales charge (1% of offering price) | | | .13 |
| | |
|
|
Offering price to public | | $ | 13.40 |
| | |
|
|
| |
Class Z | | | |
|
Net asset value, offering price and redemption price per share ($112,963,320 ÷ 7,861,292 shares of common stock issued and outstanding) | | $ | 14.37 |
| | |
|
|
See Notes to Financial Statements.
| Jennison U.S. Emerging Growth Fund, Inc. | | 13 |
Statement of Operations
Year Ended October 31, 2003
Net Investment Loss | | | | |
|
Income | | | | |
Dividends (net of foreign withholding taxes of $22,555) | | $ | 883,233 | |
Income from securities loaned, net | | | 179,680 | |
| | |
|
|
|
Total income | | | 1,062,913 | |
| | |
|
|
|
| |
Expenses | | | | |
Management fee | | | 2,493,885 | |
Distribution fee—Class A | | | 414,023 | |
Distribution fee—Class B | | | 1,383,270 | |
Distribution fee—Class C | | | 302,533 | |
Transfer agent’s fees and expenses | | | 1,418,000 | |
Reports to shareholders | | | 287,000 | |
Custodian’s fees and expenses | | | 135,000 | |
Registration fee | | | 68,000 | |
Legal fees and expenses | | | 42,000 | |
Audit fees | | | 28,000 | |
Directors’ fees | | | 16,000 | |
Miscellaneous | | | 11,061 | |
| | |
|
|
|
Total expenses | | | 6,598,772 | |
| | |
|
|
|
Net investment loss | | | (5,535,859 | ) |
| | |
|
|
|
| |
Realized And Unrealized Gain On Investments And Foreign Currency Transactions | | | | |
|
Net realized gain on: | | | | |
Investment transactions | | | 75,072,202 | |
Foreign currency transactions | | | 2,661 | |
Options written | | | 370,641 | |
| | |
|
|
|
| | | | 75,445,504 | |
Net change in unrealized appreciation on investments | | | 76,430,311 | |
| | |
|
|
|
Net gain on investments and foreign currencies | | | 151,875,815 | |
| | |
|
|
|
Net Increase In Net Assets Resulting From Operations | | $ | 146,339,956 | |
| | |
|
|
|
See Notes to Financial Statements.
| 14 | | Visit our website at www.jennisondryden.com |
Statement of Changes in Net Assets
| |
| | | Year Ended October 31,
| |
| | | 2003 | | | 2002 | |
Increase (Decrease) In Net Assets | | | | | | | | |
|
Operations | | | | | | | | |
Net investment loss | | $ | (5,535,859 | ) | | $ | (6,398,427 | ) |
Net realized gain (loss) on investments and foreign currency transactions | | | 75,445,504 | | | | (192,123,814 | ) |
Net change in unrealized appreciation on investments and foreign currencies | | | 76,430,311 | | | | 66,013,680 | |
| | |
|
|
| |
|
|
|
Net increase (decrease) in net assets resulting from operations | | | 146,339,956 | | | | (132,508,561 | ) |
| | |
|
|
| |
|
|
|
| | |
Fund share transactions (net of share conversion) (Note 6) | | | | | | | | |
Net proceeds from shares sold | | | 135,706,127 | | | | 200,378,149 | |
Cost of shares reacquired | | | (135,729,359 | ) | | | (219,246,525 | ) |
| | |
|
|
| |
|
|
|
Net decrease in net assets from Fund share transactions | | | (23,232 | ) | | | (18,868,376 | ) |
| | |
|
|
| |
|
|
|
Total increase (decrease) | | | 146,316,724 | | | | (151,376,937 | ) |
| | |
Net Assets | | | | | | | | |
|
Beginning of year | | | 366,325,519 | | | | 517,702,456 | |
| | |
|
|
| |
|
|
|
End of year | | $ | 512,642,243 | | | $ | 366,325,519 | |
| | |
|
|
| |
|
|
|
See Notes to Financial Statements.
| Jennison U.S. Emerging Growth Fund, Inc. | | 15 |
Notes to Financial Statements
Jennison U.S. Emerging Growth Fund, Inc. (the “Fund”), formerly known as Prudential U.S. Emerging Growth Fund, Inc., is registered under the Investment Company Act of 1940 as a diversified, open-end, management investment company. The Fund was incorporated in Maryland on August 23, 1996. The Fund issued 2,500 shares each of Class A, Class B, Class C and Class Z common stock for $100,000 on October 21, 1996 to Prudential Investments, LLC, (“PI” or “Manager”). Investment operations commenced on December 31, 1996.
The Fund’s investment objective is to achieve long-term capital appreciation. It invests primarily in equity securities of small and medium-sized U.S. companies, which will generally have a market capitalization less than the largest capitalization of the Standard & Poor’s Mid-Cap 400 Stock Index, with the potential for above-average growth.
Note 1. Accounting Policies
The following is a summary of significant accounting policies followed by the Fund in the preparation of its financial statements.
Securities Valuation: Securities listed on a securities exchange are valued at the last sale price on such exchange on the day of valuation or, if there was no sale on such day, at the mean between the last reported bid and asked prices, or at the last bid price on such day in the absence of an asked price. Securities traded via Nasdaq are valued at the official closing price provided by Nasdaq. Securities that are actively traded in the over-the-counter market, including listed securities for which the primary market is believed by PI in consultation with the subadvisor, to be over-the-counter, are valued at market value by an independent pricing agent or principal market maker. Options on securities and indicies traded on an exchange are valued at their last sale price as of the close of trading on the applicable exchange or, if there was no sale, at the mean between the most recently quoted bid and asked prices on such exchange. Futures contracts and options thereon traded on a commodities exchange or board of trade are valued at the last sale price at the close of trading on such exchange or board of trade or, if there was no sale on the applicable commodities exchange or board of trade on such day, at the mean between the most recently quoted bid and asked prices on such exchange or board of trade or at the last bid price in the absence of an asked price. Securities for which reliable market quotations are not readily available, or whose values have been affected by events occurring after the close of the security’s foreign market and before the Fund’s normal pricing time, are valued at fair value in accordance with Board of Directors’ approved fair valuation procedures.
| 16 | | Visit our website at www.jennisondryden.com |
Investments in mutual funds are valued at their net asset value as of the close of the New York Stock Exchange on the date of valuation.
Short-term securities which mature in 60 days or less are valued at amortized cost, which approximates market value. The amortized cost method involves valuing a security at its cost on the date of purchase and thereafter assuming a constant amortization to maturity of the difference between the principal amount due at maturity and cost. Short-term securities which mature in more than 60 days are valued at current market quotations.
Repurchase Agreements: In connection with transactions in repurchase agreements with United States financial institutions, it is the Fund’s policy that its custodian or designated subcustodians under triparty repurchase agreements, as the case may be, take possession of the underlying collateral securities, the value of which exceeds the principal amount of the repurchase transaction, including accrued interest. To the extent that any repurchase transaction exceeds one business day, the value of the collateral is marked to market on a daily basis to ensure the adequacy of the collateral. If the seller defaults, and the value of the collateral declines, or if bankruptcy proceedings are commenced with respect to the seller of the security, realization of the collateral by the Fund may be delayed or limited.
Foreign Currency Translation: The books and records of the Fund are maintained in U.S. dollars. Foreign currency amounts are translated into U.S. dollars on the following basis:
(i) market value of investment securities, other assets and liabilities—at the current rate of exchange.
(ii) purchases and sales of investment securities, income and expenses—at the rates of exchange prevailing on the respective dates of such transactions.
Although the net assets of the Fund are presented at the foreign exchange rates and market values at the close of the fiscal year, the Fund does not isolate that portion of the results of operations arising as a result of changes in the foreign exchange rates from the fluctuations arising from changes in the market prices of long-term securities held at the end of the fiscal year. Similarly, the Fund does not isolate the effect of changes in foreign exchange rates from the fluctuations arising from changes in the market prices of portfolio securities sold during the fiscal year. Accordingly, realized foreign currency gains or losses are included in the reported net realized gains or losses on investment transactions.
| Jennison U.S. Emerging Growth Fund, Inc. | | 17 |
Notes to Financial Statements
Cont’d
Net realized gains or losses on foreign currency transactions represent net foreign exchange gains or losses from the holding of foreign currencies, currency gains or losses realized between the trade and settlement dates on security transactions, and the difference between the amounts of dividends, interest and foreign withholding taxes recorded on the Fund’s books and the U.S. dollar equivalent amounts actually received or paid. Net unrealized currency gains or losses from valuing foreign currency denominated assets and liabilities (other than investments) at fiscal year end exchange rates are reflected as a component of net unrealized appreciation (depreciation) on foreign currencies.
Foreign security and currency transactions may involve certain considerations and risks not typically associated with those of domestic origin as a result of, among other factors, the possibility of political and economic instability or the level of governmental supervision and regulation of foreign securities markets.
Options: The Fund may either purchase or write options in order to hedge against adverse market movements or fluctuations in value caused by changes in prevailing interest rates or foreign currency exchange rates with respect to securities or currencies which the Fund currently owns or intends to purchase. The Fund’s principal reason for writing options is to realize, through receipt of premiums, greater current return than would be realized on the underlying security alone. When the Fund purchases an option, it pays a premium and an amount equal to that premium is recorded as an asset. When the Fund writes an option, it receives a premium and an amount equal to that premium is recorded as a liability. The asset or liability is adjusted daily to reflect the current market value of the options.
If an option expires unexercised, the Fund realizes a gain or loss to the extent of the premium received or paid. If an option is exercised, the premium received or paid is recorded as an adjustment to the proceeds from the sale or the cost basis of the purchase in determining whether the Fund has realized a gain or loss. The difference between the premium and the amount received or paid on effecting a closing purchase or sale transaction is also treated as a realized gain or loss. Gain or loss on purchased options is included in net realized gain or loss on investment transactions. Gain or loss on written options is presented separately as net realized gain or loss on written option transactions.
The Fund, as writer of an option, has no control over whether the underlying securities or currencies may be sold (called) or purchased (put). As a result, the Fund bears the market risk of an unfavorable change in the price of the security or currency
| 18 | | Visit our website at www.jennisondryden.com |
underlying the written option. The Fund, as purchaser of an option, bears the risk of the potential inability of the counterparties to meet the terms of their contracts.
Securities Lending: The Fund may lend its portfolio securities to broker-dealers. The loans are secured by collateral at least equal, at all times, to the market value of the securities loaned. Loans are subject to termination at the option of the borrower or the Fund. Upon termination of the loan, the borrower will return to the lender securities identified to the loaned securities. Should the borrower of the securities fail financially, the Fund has the right to repurchase the securities using the collateral in the open market. The Fund recognizes income, net of any rebate and securities lending agent fees, for lending its securities in the form of fees or interest on the investment of any cash received as collateral. The Fund also continues to receive interest and dividends or amounts equivalent thereto, on the securities loaned and recognizes any unrealized gains or loss in the market price of the securities loaned that may occur during the term of the loan.
Securities Transactions and Net Investment Income: Securities transactions are recorded on the trade date. Realized and unrealized gains and losses on sales of portfolio securities are calculated on the identified cost basis. Dividend income is recorded on the ex-dividend date and interest income, including amortization of premium and accretion of discounts on debt securities, as required, is recorded on an accrual basis. Expenses are recorded on the accrual basis which may require the use of certain estimates by management.
Net investment income or loss, (other than distribution fees which are changed directly to the respective class) and unrealized and realized gains or losses are allocated daily to each class of shares based upon the relative proportion of net assets of each class at the beginning of the day.
Dividends and Distributions: The Fund expects to pay dividends of net investment income and distributions of net realized capital and currency gains, if any, annually. Dividends and distributions to shareholders, which are determined in accordance with federal income tax regulations and which may differ from generally accepted accounting principles, are recorded on the ex-dividend date.
Taxes: It is the Fund’s policy to continue to meet the requirements of the Internal Revenue Code applicable to regulated investment companies and to distribute all of its taxable net investment income and capital gains, if any, to its shareholders. Therefore, no federal income tax provision is required.
Withholding taxes on foreign dividends are recorded, net of reclaimable amounts, at the time the related income is earned.
| Jennison U.S. Emerging Growth Fund, Inc. | | 19 |
Notes to Financial Statements
Cont’d
Note 2. Agreements
The Fund has a management agreement with PI. Pursuant to this agreement, PI has responsibility for all investment advisory services and supervises the subadvisor’s performance of such services. PI has entered into a subadvisory agreement with Jennison Associates LLC (“Jennison”). The subadvisory agreement provides that Jennison furnishes investment advisory services in connection with the management of the Fund. In connection therewith, Jennison is obligated to keep certain books and records of the Fund. PI pays for the services of Jennison, the cost of compensation of officers and employees of the Fund, occupancy and certain clerical and bookkeeping costs of the Fund. The Fund bears all other costs and expenses.
The management fee paid to PI is computed daily and payable monthly, at an annual rate of .60 of 1% of the Fund’s average daily net assets up to $1 billion and .55 of 1% of the average daily net assets in excess of $1 billion.
The Fund has a distribution agreement with Prudential Investment Management Services LLC (“PIMS”), which acts as the distributor of the Class A, Class B, Class C and Class Z shares of the Fund. The Fund compensates PIMS for distributing and servicing the Fund’s Class A, Class B and Class C shares pursuant to the plans of distribution (the “Class A, B and C Plans”), regardless of expenses actually incurred by PIMS. The distribution fees are accrued daily and payable monthly. No distribution or service fees are paid to PIMS as distributor of the Class Z shares of the Fund.
Pursuant to the Class A, B and C Plans, the Fund compensates PIMS for distribution-related activities at an annual rate of up to .30 of 1%, 1% and 1% of the average daily net assets of the Class A, B and C shares, respectively. PIMS contractually agreed to limit such fees to .25 of 1% of Class A shares.
PIMS has advised the Fund that it received approximately $136,500 and $19,100 in front-end sales charges resulting from sales of Class A shares and Class C shares, respectively, during the year ended October 31, 2003. From these fees, PIMS paid such sales charges to affiliated broker-dealers, which in turn paid commissions to salespersons and incurred other distribution costs.
PIMS has advised the Fund that for the year ended October 31, 2003, it received approximately $256,500 and $4,500 in contingent deferred sales charges imposed upon certain redemptions by Class B and Class C shareholders, respectively.
| 20 | | Visit our website at www.jennisondryden.com |
PI, PIMS and Jennison are indirect, wholly-owned subsidiaries of Prudential Financial, Inc. (“Prudential”).
The Fund, along with other affiliated registered investment companies (the “Funds”), is a party to a syndicated credit agreement (“SCA”) with a group of banks. The SCA provides for a commitment of $800 million and allows the Funds to increase the commitment to $1 billion, if necessary. Interest on any borrowings will be incurred at market rates. The Funds pay a commitment fee of .08 of 1% of the unused portion of the SCA. The commitment fee is accrued and paid quarterly and is allocated to the Funds pro rata based on net assets. The purpose of the SCA is to serve as an alternative source of funding for capital share redemptions. The expiration date of the SCA was May 2, 2003. On May 2, 2003, the SCA was renewed under the same terms and conditions (“May 2003 renewal”). The expiration date of the May 2003 renewal is April 30, 2004. The Fund did not borrow any amounts pursuant to the SCA during the year ended October 31, 2003.
Note 3. Other Transactions with Affiliates
Prudential Mutual Fund Services LLC (“PMFS”), an affiliate of PI and an indirect, wholly-owned subsidiary of Prudential, serves as the Fund’s transfer agent. During the year ended October 31, 2003, the Fund incurred fees of approximately $1,139,600 for the services of PMFS. As of October 31, 2003, approximately $93,500 of such fees were due to PMFS. Transfer agent fees and expenses in the Statement of Operations include certain out-of-pocket expenses paid to non-affiliates, where applicable.
The Fund pays networking fees to affiliated and unaffiliated broker/dealers. These networking fees are payments made to broker/dealers that clear mutual fund transactions through a national clearing system. The Fund incurred approximately $141,300 in total networking fees, of which the amount relating to the services of Wachovia Securities, LLC (“Wachovia”) and Prudential Securities, Inc. (“PSI”) affiliates of PI, was approximately $135,400 for the year ended October 31, 2003. Effective July 1, 2003, Prudential and Wachovia Corp. formed a joint venture (“Wachovia Securities LLC”) whereby Prudential and Wachovia Corp. combined their brokerage business with Prudential holding a minority interest. Prior to July 1, 2003, PSI was an indirect wholly-owned subsidiary of Prudential. As of October 31, 2003 approximately $10,500 of such fees were due to Wachovia. These amounts are included in transfer agent’s fees and expenses in the Statement of Operations.
PSI was the securities lending agent for the Fund. Effective July 1, 2003, Prudential Investment Management, Inc. (“PIM”), an indirect, wholly-owned subsidiary of
| Jennison U.S. Emerging Growth Fund, Inc. | | 21 |
Notes to Financial Statements
Cont’d
Prudential, became the Fund’s securities lending agent. For the year ended October 31, 2003, PSI and PIM have been compensated approximately $39,200 and $20,700 for these services, respectively.
The Fund invests in the Taxable Money Market Series (the “portfolio”), a portfolio of the Dryden Core Investment Fund, formerly Prudential Core Investment Fund, pursuant to an exemptive order received from the Securities and Exchange Commission. The portfolio is a money market mutual fund registered under the Investment Company Act of 1940, as amended, and managed by PI. During the year ended October 31, 2003, the Fund earned income of $141,165 and $179,680 from the portfolio by investing its excess cash and collateral received from securities lending, respectively.
Note 4. Portfolio Securities
Purchases and sales of investment securities, other than short-term investments, for the year ended October 31, 2003 were $945,415,992 and $942,017,501, respectively.
As of October 31, 2003, the Fund had securities on loan with an aggregate market value of $178,973,766. The Fund received $186,278,252 in cash as collateral for securities on loan which was used to purchase highly liquid short-term investments in accordance with the Fund’s securities lending procedures.
Transactions in options written during the year ended October 31, 2003, were as follows:
| | | Contracts
| | | Premiums
| |
Balance as of October 31, 2002 | | — | | | $ | — | |
Options written | | 6,071 | | | | 978,391 | |
Options closed | | (2,260 | ) | | | (429,200 | ) |
Options expired | | (3,811 | ) | | | (549,191 | ) |
| | |
|
| |
|
|
|
Balance as of October 31, 2003 | | — | | | $ | — | |
| | |
|
| |
|
|
|
Note 5. Distributions and Tax Information
In order to present undistributed net investment income (loss) and accumulated net realized gains (losses) on the Statement of Assets and Liabilities that more closely represent their tax character, certain adjustments have been made to paid-in-capital in excess of par, undistributed net investment income (loss) and accumulated net
| 22 | | Visit our website at www.jennisondryden.com |
realized gain (loss) on investments. For the year ended October 31, 2003, the adjustments were to decrease undistributed net investment loss by $5,535,859, increase accumulated net realized loss by $2,661 and decrease paid-in-capital in excess of par by $5,533,198 due to the reclassification of net foreign currency gains and a net operating loss. Net investment income, net realized gains and net assets were not affected by this change.
As of October 31, 2003, there were no distributable earnings on a tax basis.
As of October 31, 2003, the Fund had a capital loss carryforward for tax purposes of approximately $335,516,000 of which $132,466,000 expires in 2009 and $203,050,000 expires in 2010. Accordingly, no capital gains distributions are expected to be paid to shareholders until net gains have been realized in excess of such carryforward.
The United States federal income tax basis of the Fund’s investments and the net unrealized appreciation as of October 31, 2003 were as follows:
Tax Basis of Investments
| | Appreciation
| | Depreciation
| | Total Net Unrealized Appreciation
|
| $624,061,844 | | $84,699,994 | | $7,538,995 | | $77,160,999 |
The difference between book basis and tax basis was primarily attributable to deferred losses on wash sales.
Note 6. Capital
The Fund offers Class A, Class B, Class C and Class Z shares. Class A shares are sold with a front-end sales charge of up to 5%. Class B shares are sold with a contingent deferred sales charge which declines from 5% to zero depending on the period of time the shares are held. Class C shares are sold with a front-end sales charge of 1% and a contingent deferred sales charge of 1% during the first 18 months. Class B shares will automatically convert to Class A shares on a quarterly basis approximately seven years after purchase. A special exchange privilege is also available for shareholders who qualify to purchase Class A shares at net asset value. Class Z shares are not subject to any sales or redemption charge and are offered exclusively for sale to a limited group of investors.
There are 2 billion shares of $.001 par value common stock authorized divided into four classes, designated Class A, Class B, Class C and Class Z, which consists of 1 billion, 500 million, 300 million and 200 million authorized shares, respectively. As of October 31, 2003, Prudential owned 413,685 Class Z shares.
| Jennison U.S. Emerging Growth Fund, Inc. | | 23 |
Notes to Financial Statements
Cont’d
Transactions in shares of common stock were as follows:
Class A
| | Shares
| | | Amount
| |
Year ended October 31, 2003: | | | | | | | |
Shares sold | | 4,786,106 | | | $ | 56,401,082 | |
Shares reacquired | | (4,944,693 | ) | | | (57,050,449 | ) |
| | |
|
| |
|
|
|
Net increase (decrease) in shares outstanding before conversion | | (158,587 | ) | | | (649,367 | ) |
Shares issued upon conversion from Class B | | 437,360 | | | | 5,062,413 | |
| | |
|
| |
|
|
|
Net increase (decrease) in shares outstanding | | 278,773 | | | $ | 4,413,046 | |
| | |
|
| |
|
|
|
Year ended October 31, 2002: | | | | | | | |
Shares sold | | 7,725,347 | | | $ | 102,510,765 | |
Shares reacquired | | (7,689,019 | ) | | | (96,931,329 | ) |
| | |
|
| |
|
|
|
Net increase (decrease) in shares outstanding before conversion | | 36,328 | | | | 5,579,436 | |
Shares issued upon conversion from Class B | | 458,156 | | | | 5,838,138 | |
| | |
|
| |
|
|
|
Net increase (decrease) in shares outstanding | | 494,484 | | | $ | 11,417,574 | |
| | |
|
| |
|
|
|
Class B
| | | | | | |
Year ended October 31, 2003: | | | | | | | |
Shares sold | | 1,249,067 | | | $ | 14,106,429 | |
Shares reacquired | | (2,578,476 | ) | | | (27,139,344 | ) |
| | |
|
| |
|
|
|
Net increase (decrease) in shares outstanding before conversion | | (1,329,409 | ) | | | (13,032,915 | ) |
Shares reacquired upon conversion from Class A | | (462,862 | ) | | | (5,062,413 | ) |
| | |
|
| |
|
|
|
Net increase (decrease) in shares outstanding | | (1,792,271 | ) | | $ | (18,095,328 | ) |
| | |
|
| |
|
|
|
Year ended October 31, 2002: | | | | | | | |
Shares sold | | 1,710,399 | | | $ | 21,264,946 | |
Shares reacquired | | (4,428,260 | ) | | | (50,205,316 | ) |
| | |
|
| |
|
|
|
Net increase (decrease) in shares outstanding before conversion | | (2,717,861 | ) | | | (28,940,370 | ) |
Shares reacquired upon conversion into Class A | | (481,246 | ) | | | (5,838,138 | ) |
| | |
|
| |
|
|
|
Net increase (decrease) in shares outstanding | | (3,199,107 | ) | | $ | (34,778,508 | ) |
| | |
|
| |
|
|
|
Class C
| | | | | | |
Year ended October 31, 2003: | | | | | | | |
Shares sold | | 493,323 | | | $ | 5,615,754 | |
Shares reacquired | | (875,426 | ) | | | (9,408,250 | ) |
| | |
|
| |
|
|
|
Net increase (decrease) in shares outstanding | | (382,103 | ) | | $ | (3,792,496 | ) |
| | |
|
| |
|
|
|
Year ended October 31, 2002: | | | | | | | |
Shares sold | | 679,479 | | | $ | 7,976,449 | |
Shares reacquired | | (1,322,832 | ) | | | (14,997,207 | ) |
| | |
|
| |
|
|
|
Net increase (decrease) in shares outstanding | | (643,353 | ) | | $ | (7,020,758 | ) |
| | |
|
| |
|
|
|
| 24 | | Visit our website at www.jennisondryden.com |
Class Z
| | Shares
| | | Amount
| |
Year ended October 31, 2003: | | | | | | | |
Shares sold | | 4,837,153 | | | $ | 59,582,862 | |
Shares reacquired | | (3,534,551 | ) | | | (42,131,316 | ) |
| | |
|
| |
|
|
|
Net increase (decrease) in shares outstanding | | 1,302,602 | | | $ | 17,451,546 | |
| | |
|
| |
|
|
|
Year ended October 31, 2002: | | | | | | | |
Shares sold | | 5,311,531 | | | $ | 68,625,989 | |
Shares reacquired | | (4,493,213 | ) | | | (57,112,673 | ) |
| | |
|
| |
|
|
|
Net increase (decrease) in shares outstanding | | 818,318 | | | $ | 11,513,316 | |
| | |
|
| |
|
|
|
| Jennison U.S. Emerging Growth Fund, Inc. | | 25 |
Financial Highlights
| |
| | | Class A
| |
| | | Year Ended
October 31, 2003 | |
|
Per Share Operating Performance: | | | | |
Net Asset Value, Beginning Of Year | | $ | 9.93 | |
| | |
|
|
|
Income From Investment Operations: | | | | |
Net investment loss(a) | | | (.12 | ) |
Net realized and unrealized gain (loss) on investment transactions | | | 4.29 | |
| | |
|
|
|
Total from investment operations | | | 4.17 | |
| | |
|
|
|
Less Distributions: | | | | |
Distributions from net realized gains | | | — | |
| | |
|
|
|
Net asset value, end of year | | $ | 14.10 | |
| | |
|
|
|
Total Return(b): | | | 41.99 | % |
Ratios/Supplemental Data: | | | | |
Net assets, end of year (000) | | $ | 204,685 | |
Average net assets (000) | | $ | 165,609 | |
Ratios to average net assets: | | | | |
Expenses, including distribution and service (12b-1) fees(c) | | | 1.33 | % |
Expenses, excluding distribution and service (12b-1) fees | | | 1.08 | % |
Net investment loss | | | (1.08 | )% |
For Class A, B, C and Z shares: | | | | |
Portfolio turnover rate | | | 231 | % |
| (a) | Based on average shares outstanding during the year. |
| (b) | Total return does not consider the effects of sales loads. Total return is calculated assuming a purchase of shares on the first day and a sale on the last day of each year reported and includes reinvestment of dividends and distributions. |
| (c) | The distributor of the Fund contractually agreed to limit its distribution and service (12b-1) fees to .25 of 1% of the average net assets of Class A shares. |
See Notes to Financial Statements
| 26 | | Visit our website at www.jennisondryden.com |
| Class A | |
|
| Year Ended October 31, | |
|
| 2002 | | | 2001 | | | 2000 | | | 1999 | |
|
| | | | | | | | | | | | | | | |
| $ | 13.15 | | | $ | 25.69 | | | $ | 19.16 | | | $ | 12.01 | |
|
|
| |
|
|
| |
|
|
| |
|
|
|
| | | | | | | | | | | | | | | |
| | (.12 | ) | | | (.13 | ) | | | (.20 | ) | | | (.13 | ) |
| | (3.10 | ) | | | (9.26 | ) | | | 8.37 | | | | 7.61 | |
|
|
| |
|
|
| |
|
|
| |
|
|
|
| | (3.22 | ) | | | (9.39 | ) | | | 8.17 | | | | 7.48 | |
|
|
| |
|
|
| |
|
|
| |
|
|
|
| | | | | | | | | | | | | | | |
| | — | | | | (3.15 | ) | | | (1.64 | ) | | | (.33 | ) |
|
|
| |
|
|
| |
|
|
| |
|
|
|
| $ | 9.93 | | | $ | 13.15 | | | $ | 25.69 | | | $ | 19.16 | |
|
|
| |
|
|
| |
|
|
| |
|
|
|
| | (24.49 | )% | | | (40.13 | )% | | | 44.52 | % | | | 63.65 | % |
| | | | | | | | | | | | | | | |
| $ | 141,331 | | | $ | 180,763 | | | $ | 291,800 | | | $ | 85,595 | |
| $ | 181,454 | | | $ | 227,650 | | | $ | 217,712 | | | $ | 52,984 | |
| | | | | | | | | | | | | | | |
| | 1.31 | % | | | 1.21 | % | | | 1.06 | % | | | 1.22 | % |
| | 1.06 | % | | | .96 | % | | | .81 | % | | | .97 | % |
| | (.99 | )% | | | (.75 | )% | | | (.75 | )% | | | (.80 | )% |
| | | | | | | | | | | | | | | |
| | 337 | % | | | 305 | % | | | 347 | % | | | 153 | % |
See Notes to Financial Statements.
| Jennison U.S. Emerging Growth Fund, Inc. | | 27 |
| |
| | | Class B
| |
| | | Year Ended
October 31, 2003 | |
|
Per Share Operating Performance: | | | | |
Net Asset Value, Beginning Of Year | | $ | 9.42 | |
| | |
|
|
|
Income From Investment Operations: | | | | |
Net investment loss(a) | | | (.20 | ) |
Net realized and unrealized gain (loss) on investment transactions | | | 4.05 | |
| | |
|
|
|
Total from investment operations | | | 3.85 | |
| | |
|
|
|
Less Distributions: | | | | |
Distributions from net realized gains | | | — | |
| | |
|
|
|
Net asset value, end of year | | $ | 13.27 | |
| | |
|
|
|
Total Return(b): | | | 40.87 | % |
Ratios/Supplemental Data: | | | | |
Net assets, end of year (000) | | $ | 159,782 | |
Average net assets (000) | | $ | 138,327 | |
Ratios to average net assets: | | | | |
Expenses, including distribution and service (12b-1) fees | | | 2.08 | % |
Expenses, excluding distribution and service (12b-1) fees | | | 1.08 | % |
Net investment loss | | | (1.83 | )% |
| (a) | Based on average shares outstanding during the year. |
| (b) | Total return does not consider the effects of sales loads. Total return is calculated assuming a purchase of shares on the first day and a sale on the last day of each year reported and includes reinvestment of dividends and distributions. |
See Notes to Financial Statements.
| 28 | | Visit our website at www.jennisondryden.com |
Financial Highlights
Cont’d.
| Class B | |
|
| Year Ended October 31, | |
|
| 2002 | | | 2001 | | | 2000 | | | 1999 | |
|
| | | | | | | | | | | | | | | |
| $ | 12.57 | | | $ | 24.88 | | | $ | 18.72 | | | $ | 11.83 | |
|
|
| |
|
|
| |
|
|
| |
|
|
|
| | | | | | | | | | | | | | | |
| | (.21 | ) | | | (.24 | ) | | | (.38 | ) | | | (.24 | ) |
| | (2.94 | ) | | | (8.92 | ) | | | 8.18 | | | | 7.46 | |
|
|
| |
|
|
| |
|
|
| |
|
|
|
| | (3.15 | ) | | | (9.16 | ) | | | 7.80 | | | | 7.22 | |
|
|
| |
|
|
| |
|
|
| |
|
|
|
| | | | | | | | | | | | | | | |
| | — | | | | (3.15 | ) | | | (1.64 | ) | | | (.33 | ) |
|
|
| |
|
|
| |
|
|
| |
|
|
|
| $ | 9.42 | | | $ | 12.57 | | | $ | 24.88 | | | $ | 18.72 | |
|
|
| |
|
|
| |
|
|
| |
|
|
|
| | (25.06 | )% | | | (40.57 | )% | | | 43.52 | % | | | 62.39 | % |
| | | | | | | | | | | | | | | |
| $ | 130,225 | | | $ | 214,092 | | | $ | 424,815 | | | $ | 184,955 | |
| $ | 189,651 | | | $ | 300,962 | | | $ | 382,245 | | | $ | 127,249 | |
| | | | | | | | | | | | | | | |
| | 2.06 | % | | | 1.96 | % | | | 1.81 | % | | | 1.97 | % |
| | 1.06 | % | | | .96 | % | | | .81 | % | | | .97 | % |
| | (1.74 | )% | | | (1.49 | )% | | | (1.49 | )% | | | (1.55 | )% |
See Notes to Financial Statements.
| Jennison U.S. Emerging Growth Fund, Inc. | | 29 |
| |
| | | Class C
| |
| | | Year Ended
October 31, 2003 | |
|
Per Share Operating Performance: | | | | |
Net Asset Value, Beginning Of Year | | $ | 9.42 | |
| | |
|
|
|
Income From Investment Operations: | | | | |
Net investment loss(a) | | | (.20 | ) |
Net realized and unrealized gain (loss) on investment transactions | | | 4.05 | |
| | |
|
|
|
Total from investment operations | | | 3.85 | |
| | |
|
|
|
Less Distributions: | | | | |
Distributions from net realized gains on investment transactions | | | — | |
| | |
|
|
|
Net asset value, end of year | | $ | 13.27 | |
| | |
|
|
|
Total Return(b): | | | 40.87 | % |
Ratios/Supplemental Data: | | | | |
Net assets, end of year (000) | | $ | 35,212 | |
Average net assets (000) | | $ | 30,253 | |
Ratios to average net assets: | | | | |
Expenses, including distribution and service (12b-1) fees | | | 2.08 | % |
Expenses, excluding distribution and service (12b-1) fees | | | 1.08 | % |
Net investment loss | | | (1.83 | )% |
| (a) | Based on average shares outstanding during the year. |
| (b) | Total return does not consider the effects of sales loads. Total return is calculated assuming a purchase of shares on the first day and a sale on the last day of each year reported and includes reinvestment of dividends and distributions. |
See Notes to Financial Statements.
| 30 | | Visit our website at www.jennisondryden.com |
Financial Highlights
Cont’d.
| Class C | |
|
| Year Ended October 31, | |
|
| 2002 | | | 2001 | | | 2000 | | | 1999 | |
|
| | | | | | | | | | | | | | | |
| $ | 12.57 | | | $ | 24.88 | | | $ | 18.72 | | | $ | 11.83 | |
|
|
| |
|
|
| |
|
|
| |
|
|
|
| | | | | | | | | | | | | | | |
| | (.21 | ) | | | (.25 | ) | | | (.38 | ) | | | (.24 | ) |
| | (2.94 | ) | | | (8.91 | ) | | | 8.18 | | | | 7.46 | |
|
|
| |
|
|
| |
|
|
| |
|
|
|
| | (3.15 | ) | | | (9.16 | ) | | | 7.80 | | | | 7.22 | |
|
|
| |
|
|
| |
|
|
| |
|
|
|
| | | | | | | | | | | | | | | |
| | — | | | | (3.15 | ) | | | (1.64 | ) | | | (.33 | ) |
|
|
| |
|
|
| |
|
|
| |
|
|
|
| $ | 9.42 | | | $ | 12.57 | | | $ | 24.88 | | | $ | 18.72 | |
|
|
| |
|
|
| |
|
|
| |
|
|
|
| | (25.06 | )% | | | (40.57 | )% | | | 43.52 | % | | | 62.39 | % |
| | | | | | | | | | | | | | | |
| $ | 28,577 | | | $ | 46,243 | | | $ | 83,275 | | | $ | 23,578 | |
| $ | 41,014 | | | $ | 62,733 | | | $ | 65,566 | | | $ | 12,380 | |
| | | | | | | | | | | | | | | |
| | 2.06 | % | | | 1.96 | % | | | 1.81 | % | | | 1.97 | % |
| | 1.06 | % | | | .96 | % | | | .81 | % | | | .97 | % |
| | (1.74 | )% | | | (1.50 | )% | | | (1.50 | )% | | | (1.56 | )% |
See Notes to Financial Statements.
| Jennison U.S. Emerging Growth Fund, Inc. | | 31 |
| |
| | | Class Z
| |
| | | Year Ended
October 31, 2003 | |
|
Per Share Operating Performance: | | | | |
Net Asset Value, Beginning Of Year | | $ | 10.09 | |
| | |
|
|
|
Income From Investment Operations: | | | | |
Net investment loss(a) | | | (.10 | ) |
Net realized and unrealized gain (loss) on investment transactions | | | 4.38 | |
| | |
|
|
|
Total from investment operations | | | 4.28 | |
| | |
|
|
|
Less Distributions: | | | | |
Distributions from net realized gains on investment transactions | | | — | |
| | |
|
|
|
Net asset value, end of year | | $ | 14.37 | |
| | |
|
|
|
Total Return(b): | | | 42.42 | % |
Ratios/Supplemental Data: | | | | |
Net assets, end of year (000) | | $ | 112,963 | |
Average net assets (000) | | $ | 81,458 | |
Ratios to average net assets: | | | | |
Expenses, including distribution and service (12b-1) fees | | | 1.08 | % |
Expenses, excluding distribution and service (12b-1) fees | | | 1.08 | % |
Net investment loss | | | (.82 | )% |
| (a) | Based on average shares outstanding during the period. |
| (b) | Total return does not consider the effects of sales loads. Total return is calculated assuming a purchase of shares on the first day and a sale on the last day of each year reported and includes reinvestment of dividends and distributions. |
Financial Highlights
Cont’d.
See Notes to Financial Statements.
| 32 | | Visit our website at www.jennisondryden.com |
| Class Z | |
|
| Year Ended October 31, | |
|
| 2002 | | | 2001 | | | 2000 | | | 1999 | |
|
| | | | | | | | | | | | | | | |
| $ | 13.34 | | | $ | 25.94 | | | $ | 19.28 | | | $ | 12.06 | |
|
|
| |
|
|
| |
|
|
| |
|
|
|
| | | | | | | | | | | | | | | |
| | (.09 | ) | | | (.09 | ) | | | (.13 | ) | | | (.09 | ) |
| | (3.16 | ) | | | (9.36 | ) | | | 8.43 | | | | 7.64 | |
|
|
| |
|
|
| |
|
|
| |
|
|
|
| | (3.25 | ) | | | (9.45 | ) | | | 8.30 | | | | 7.55 | |
|
|
| |
|
|
| |
|
|
| |
|
|
|
| | | | | | | | | | | | | | | |
| | — | | | | (3.15 | ) | | | (1.64 | ) | | | (.33 | ) |
|
|
| |
|
|
| |
|
|
| |
|
|
|
| $ | 10.09 | | | $ | 13.34 | | | $ | 25.94 | | | $ | 19.28 | |
|
|
| |
|
|
| |
|
|
| |
|
|
|
| | (24.36 | )% | | | (39.95 | )% | | | 44.95 | % | | | 63.97 | % |
| | | | | | | | | | | | | | | |
| $ | 66,193 | | | $ | 76,604 | | | $ | 76,607 | | | $ | 19,029 | |
| $ | 79,868 | | | $ | 80,674 | | | $ | 52,755 | | | $ | 7,796 | |
| | | | | | | | | | | | | | | |
| | 1.06 | % | | | .96 | % | | | .81 | % | | | .97 | % |
| | 1.06 | % | | | .96 | % | | | .81 | % | | | .97 | % |
| | (.74 | )% | | | (.54 | )% | | | (.51 | )% | | | (.56 | )% |
See Notes to Financial Statements.
| Jennison U.S. Emerging Growth Fund, Inc. | | 33 |
Report of Independent Auditors
To the Board of Directors and Shareholders of
Jennison U.S. Emerging Growth Fund, Inc.
In our opinion, the accompanying statement of assets and liabilities, including the portfolio of investments, and the related statements of operations and of changes in net assets and the financial highlights present fairly, in all material respects, the financial position of Jennison U.S. Emerging Growth Fund, Inc., formerly Prudential U.S. Emerging Growth Fund, Inc. (the “Fund”) at October 31, 2003, the results of its operations for the year then ended, the changes in its net assets for each of the two years in the period then ended and the financial highlights for each of the five years in the period then ended, in conformity with accounting principles generally accepted in the United States of America. These financial statements and financial highlights (hereafter referred to as “financial statements”) are the responsibility of the Fund’s management; our responsibility is to express an opinion on these financial statements based on our audits. We conducted our audits of these financial statements in accordance with auditing standards generally accepted in the United States of America, which require that we plan and perform the audit to obtain reasonable assurance about whether the financial statements are free of material misstatement. An audit includes examining, on a test basis, evidence supporting the amounts and disclosures in the financial statements, assessing the accounting principles used and significant estimates made by management, and evaluating the overall financial statement presentation. We believe that our audits, which included confirmation of securities at October 31, 2003 by correspondence with the custodian and brokers, provide a reasonable basis for our opinion.
PricewaterhouseCoopers LLP
New York, New York
December 22, 2003
| 34 | | Visit our website at www.jennisondryden.com |
Supplemental Proxy Information
(Unaudited)
A meeting of the Fund’s shareholders was held on July 17, 2003. The meeting was held for the following purpose:
1. To approve the election of ten (10) directors to the Board of Directors, as follows:
| | • | | Douglas H. McCorkindale |
The result of the proxy solicitation on the preceding matter was:
Matter
| | Votes For
| | Votes Against
| | Votes Withheld
| | Abstentions
|
David E.A. Carson | | 26,738,665 | | — | | 216,101 | | — |
Robert E. La Blanc | | 26,742,183 | | — | | 212,583 | | — |
Robert F. Gunia | | 26,747,505 | | — | | 207,261 | | — |
Douglas H.
McCorkindale | | 26,747,489 | | — | | 207,277 | | — |
Stephen P. Munn* | | 26,748,251 | | — | | 206,515 | | — |
Richard A. Redeker | | 26,747,239 | | — | | 207,527 | | — |
Judy A. Rice | | 26,747,962 | | — | | 206,804 | | — |
Robin B. Smith | | 26,742,124 | | — | | 212,642 | | — |
Stephen Stoneburn | | 26,746,418 | | — | | 208,348 | | — |
Clay T. Whitehead | | 26,746,593 | | — | | 208,804 | | — |
| *Mr. | Munn resigned effective November 30, 2003. |
| Jennison U.S. Emerging Growth Fund, Inc. | | 35 |
Management of the Fund
(Unaudited)
Information pertaining to the Directors of the Fund is set forth below. Directors who are not deemed to be “interested persons” of the Fund, as defined in the 1940 Act are referred to as “Independent Directors.” Directors who are deemed to be “interested persons” of the Fund are referred to as “Interested Directors.” “Fund Complex”† consists of the Fund and any other investment companies managed by PI.
Independent Directors2
David E.A. Carson (69), Director since 20033 Oversees 99 portfolios in Fund complex
Principal occupations (last 5 years): Director (January 2000 to May 2000), Chairman (January 1999 to December 1999), Chairman and Chief Executive Officer (January 1998 to December 1998) and President, Chairman and Chief Executive Officer (1983-1997) of People’s Bank.
Other Directorships held:4 Director of United Illuminating and UIL Holdings (utility company), since 1993.
Robert E. La Blanc (69), Director since 20033 Oversees 119 portfolios in Fund complex
Principal occupations (last 5 years): President (since 1981) of Robert E. La Blanc Associates, Inc. (telecommunications); formerly General Partner at Salomon Brothers and Vice-Chairman of Continental Telecom; Trustee of Manhattan College.
Other Directorships held:4 Director of Storage Technology Corporation (since 1979) (technology), Chartered Semiconductor Manufacturing, Ltd. (since 1998); Titan Corporation (electronics) (since 1995), Computer Associates International, Inc. (since 2002) (software company); FiberNet Telecom Group, Inc. (since 2003) (telecom company); Director (since April 1999) of the High Yield Plus Fund, Inc.
Douglas H. McCorkindale (64), Director since 19963 Oversees 101 portfolios in Fund complex
Principal occupations (last 5 years): Chairman (since February 2001), Chief Executive Officer (since June 2000) and President (since September 1997) of Gannett Co. Inc. (publishing and media); formerly Vice Chairman (March 1984-May 2000) of Gannett Co., Inc.
Other Directorships held:4 Director of Gannett Co. Inc., Director of Continental Airlines, Inc. (since May 1993); Director of Lockheed Martin Corp. (aerospace and defense) (since May 2001); Director of The High Yield Plus Fund, Inc. (since 1996).
Richard A. Redeker (60), Director since 19963 Oversees 102 portfolios in Fund complex
Principal occupations (last 5 years): Management Consultant; formerly employee of Prudential Investments (October 1996-December 1998); Director of Invesmart, Inc. (since 2001) and Director of Penn Tank Lines, Inc. (since 1999).
Other Directorships held:4 None.
| 36 | | Visit our website at www.jennisondryden.com |
Robin B. Smith (64), Director since 19963 Oversees 109 portfolios in Fund complex
Principal occupations (last 5 years): Chairman of the Board (since January 2003) of Publishers Clearing House (direct marketing), formerly Chairman and Chief Executive Officer (August 1996-January 2003) of Publishers Clearing House.
Other Directorships held:4 Director of BellSouth Corporation (since 1992).
Stephen Stoneburn (60), Director since 20033 Oversees 107 portfolios in Fund complex
Principal occupations (last 5 years): President and Chief Executive Officer (since June 1996) of Quadrant Media Corp. (a publishing company); formerly President (June 1995-June 1996) of Argus Integrated Media, Inc.; Senior Vice President and Managing Director (January 1993-1995) of Cowles Business Media and Senior Vice President of Fairchild Publications, Inc. (1975-1989).
Other Directorships held:4 None
Clay T. Whitehead (64), Director since 19963 Oversees 106 portfolios in Fund complex
Principal occupations (last 5 years): President (since 1983) of National Exchange Inc. (new business development firm).
Other Directorships held:4 Director (since 2000) of the High Yield Plus Fund, Inc.
Interested Directors1
Judy A. Rice (55), President since 2003 and Director since 20003 Oversees 109 portfolios in Fund complex
Principal occupations (last 5 years): President, Chief Executive Officer, Chief Operating Officer and Officer-in-Charge (since 2003) of PI; Director, Officer-in-Charge, President, Chief Executive Officer and Chief Operating Officer (since May 2003) of American Skandia Advisory Services, Inc. and American Skandia Investment Services, Inc.; Director, Officer-in-Charge, President, Chief Executive Officer (since May 2003) of American Skandia Fund Services, Inc.; Vice President (since February 1999) of Prudential Investment Management Services LLC; President, Chief Executive Officer and Officer-in-Charge (since April 2003) of Prudential Mutual Fund Services LLC; formerly various positions to Senior Vice President (1992-1999) of Prudential Securities; and various positions to Managing Director (1975-1992) of Salomon Smith Barney; Member of Board of Governors of the Money Management Institute.
Other Directorships held:4 None
Robert F. Gunia (56), Vice President and Director since 19963 Oversees 189 portfolios in Fund complex
Principal occupations (last 5 years): Chief Administrative Officer (since June 1999) of PI; Executive Vice President and Treasurer (since January 1996) of PI; President (since April 1999) of Prudential Investment Management Services LLC (PIMS); Corporate Vice President (since September 1997) of The Prudential Insurance Company of America (Prudential); Director, Executive Vice President and Chief Administrative Officer (since May 2003) of American Skandia Investment Services, Inc., American Skandia Advisory Services, Inc. and American Skandia Fund Services, Inc.; President (since April 1999) of Prudential Investment Management Services LLC; Executive Vice President (since March 1999) and Treasurer (since May 2000) of Prudential Mutual Fund Services LLC; formerly Senior Vice President (March 1987-May 1999) of Prudential Securities.
Other Directorships held:4 Vice President and Director (since May 1989) and Treasurer (since 1999) of The Asia Pacific Fund, Inc.
| Jennison U.S. Emerging Growth Fund, Inc. | | 37 |
Information pertaining to the Officers of the Fund is set forth below.
Officers2
Marguerite E.H. Morrison (47), Chief Legal Officer since 2003 and Assistant Secretary since 20023
Principal occupations (last 5 years): Vice President and Chief Legal Officer—Mutual Funds and Unit Investment Trust (since August 2000) of Prudential; Senior Vice President and Secretary (since April 2003) of PI; Senior Vice President and Secretary (since May 2003) of American Skandia Investment Services, Inc., American Skandia Advisory Services, Inc. and American Skandia Fund Services, Inc.; Vice President and Assistant Secretary of PIMS (since October 2001), previously Senior Vice President and Assistant Secretary (February 2001-April 2003) of PI, Vice President and Associate General Counsel (December 1996-February 2001) of PI.
Maryanne Ryan (39), Anti-Money Laundering Compliance Officer since 20023
Principal occupations (last 5 years): Vice President, Prudential (since November 1998), First Vice President, Prudential Securities (March 1997-May 1998); Anti-Money Laundering Compliance Officer (since 2003) of American Skandia Investment Services, Inc., American Skandia Advisory Services, Inc. and American Skandia Marketing, Inc.
Grace C. Torres (44), Treasurer and Principal Financial and Accounting Officer since 19983
Principal occupations (last 5 years): Senior Vice President (since January 2000) of PI, Senior Vice President and Assistant Treasurer (since May 2003) of American Skandia Investment Services, Inc. and American Skandia Advisory Services, Inc.; formerly First Vice President (December 1996-January 2000) of PI and First Vice President (March 1993-1999) of Prudential Securities.
| 1 | “Interested” Director, as defined in the 1940 Act, by reason of employment with the Manager, (Prudential Investments LLC or PI), the Subadviser (Jennison Associates LLC or Jennison) or the Distributor (Prudential Investment Management Services LLC or PIMS). |
| 2 | Unless otherwise noted, the address of the Directors and Officers is c/o: Prudential Investments LLC, Gateway Center Three, 100 Mulberry Street, Newark, NJ 07102. |
| 3 | There is no set term of office for Directors and Officers. The Independent Directors have adopted a retirement policy, which calls for the retirement of Directors on December 31 of the year in which they reach the age of 75. The table shows the individuals length of service as Director and/or Officer. |
| 4 | This includes only directorships of companies requested to register, or file reports with the SEC under the Securities and Exchange Act of 1934 (that is, “public companies”) or other investment companies registered under the 1940 Act. |
| † | The Fund Complex consists of all investment companies managed by PI. The Funds for which PI serves as manager include JennisonDryden Mutual Funds, Strategic Partners Funds, American Skandia Advisor Funds, Inc., The Prudential Variable Contract Accounts 2, 10, 11, The Target Portfolio Trust, The Prudential Series Fund, Inc., American Skandia Trust, and Prudential’s Gibraltar Fund. |
Additional information about the Fund’s Directors is included in the Fund’s Statement of Additional Information which is available without charge, upon request, by calling (800) 521-7466 or (732) 482-7555 (Calling from outside the U.S.)
| 38 | | Visit our website at www.jennisondryden.com |
Growth of a $10,000 Investment
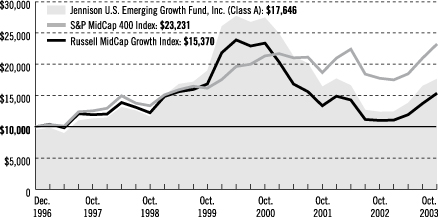
|
| Average Annual Total Returns (With Sales Charges) as of 10/31/03 | |
| | | One Year | | | Five Years | | | Since Inception | |
Class A | | 34.89 | % | | 7.60 | % | | 8.67 | % |
|
Class B | | 35.87 | | | 7.75 | | | 8.65 | |
|
Class C | | 38.47 | | | 7.68 | | | 8.49 | |
|
Class Z | | 42.42 | | | 8.99 | | | 9.75 | |
|
| | | | | | | | | | |
|
| Average Annual Total Returns (Without Sales Charges) as of 10/31/03 | |
| | | One Year | | | Five Years | | | Since Inception | |
Class A | | 41.99 | % | | 8.71 | % | | 9.48 | % |
|
Class B | | 40.87 | | | 7.90 | | | 8.65 | |
|
Class C | | 40.87 | | | 7.90 | | | 8.65 | |
|
Class Z | | 42.42 | | | 8.99 | | | 9.75 | |
|
Past performance is not indicative of future results. Principal value and investment return will fluctuate so that an investor’s shares, when redeemed, may be worth more or less than their original cost. Source: Prudential Investments LLC and Lipper Inc. Inception date: 12/31/96.
The graph compares a $10,000 investment in the Jennison U.S. Emerging Growth Fund, Inc. (Class A shares) with a similar investment in the S&P MidCap 400 Index and the Russell MidCap Growth Index by portraying the initial account values at the commencement of operations of Class A shares (December 31, 1996) and the account values at the end of the current fiscal year (October 31, 2003) as measured on a quarterly basis. For purposes of the graph, and unless otherwise indicated, it has been assumed that (a) the maximum applicable front-end sales charge was deducted from the initial $10,000 investment in Class A shares; (b) all recurring fees (including management fees) were deducted; and (c) all dividends and distributions were reinvested. The line graph provides information for Class A shares only. As indicated in the tables provided earlier, performance for Class B, C, and Z shares will vary due to the differing charges and expenses applicable to each share class
| | | Visit our website at www.jennisondryden.com |
(as indicated in the following paragraphs). Without a distribution and service (12b-1) fee waiver of 0.05% for Class A shares through October 31, 2003, the returns shown in the graph and for Class A shares in the tables would have been lower.
The S&P MidCap 400 Index is an unmanaged index of 400 domestic stocks chosen for market size, liquidity, and industry group representation. It gives a broad look at how U.S. mid-cap stock prices have performed. The Russell Midcap Growth Index is an unmanaged index that measures the performance of those Russell MidCap companies with higher price-to-book ratios and higher forecasted growth values. The Indexes’ total returns include the reinvestment of all dividends, but do not include the effects of sales charges, operating expenses of a mutual fund, or taxes. The returns for the indexes would be lower if they included the effects of sales charges, operating expenses, or taxes. The securities that comprise these indexes may differ substantially from the securities in the Fund. These are not the only indexes that may be used to characterize performance of small- to mid-capitalization stock funds. Other indexes may portray different comparative performance. Investors cannot invest directly in an index.
The Fund charges a maximum front-end sales charge of 5% for Class A shares in most circumstances, and a 12b-1 fee of up to 0.30% annually. In some circumstances, Class A shares may not be subject to a front-end sales charge, but may be subject to a 1% contingent deferred sales charge (CDSC) for the first year. Class B shares are subject to a declining CDSC of 5%, 4%, 3%, 2%, 1%, and 1% respectively for the first six years after purchase and a 12b-1 fee of 1% annually. Approximately seven years after purchase, Class B shares will automatically convert to Class A shares on a quarterly basis. Class C shares are subject to a front-end sales charge of 1%, a CDSC of 1% for shares redeemed within 18 months of purchase, and a 12b-1 fee of 1% annually. The returns in the graph and the tables do not reflect the deduction of taxes that a shareholder would pay on Fund distributions or following the redemption of Fund shares.
| Jennison U.S. Emerging Growth Fund, Inc. | | |
| | |
| n MAIL | | n TELEPHONE | | n WEBSITE |
Gateway Center Three 100 Mulberry Street Newark, NJ 07102 | | (800) 225-1852 | | www.jennisondryden.com |
| DIRECTORS |
| David E.A. Carson•Robert F. Gunia•Robert E. La Blanc•Douglas H. McCorkindale• Richard A. Redeker•Judy A. Rice•Robin B. Smith•Stephen D. Stoneburn•Clay T. Whitehead |
| |
| OFFICERS |
| Judy A. Rice, President•Robert F. Gunia, Vice President•Grace C. Torres, Treasurer and Principal Financial and Accounting Officer•Marguerite E.H. Morrison, Chief Legal Officer and Assistant Secretary•Maryanne Ryan, Anti-Money Laundering Compliance Officer |
| MANAGER | | Prudential Investments LLC | | Gateway Center Three
100 Mulberry Street
Newark, NJ 07102 |
|
| INVESTMENT ADVISER | | Jennison Associates LLC | | 466 Lexington Avenue
New York, NY 10017 |
|
| DISTRIBUTOR | | Prudential Investment
Management Services LLC | | Gateway Center Three
14th Floor
100 Mulberry Street
Newark, NJ 07102 |
|
| CUSTODIAN | | State Street Bank
and Trust Company | | One Heritage Drive
North Quincy, MA 02171 |
|
| TRANSFER AGENT | | Prudential Mutual Fund
Services LLC | | PO Box 8098
Philadelphia, PA 19101 |
|
| INDEPENDENT AUDITORS | | PricewaterhouseCoopers LLP | | 1177 Avenue of the
Americas
New York, NY 10036 |
|
| FUND COUNSEL | | Sullivan & Cromwell LLP | | 125 Broad Street
New York, NY 10004 |
| | |
| Jennison U.S. Emerging Growth Fund, Inc. | | | | |
| Share Class | | | | A | | B | | C | | Z | | |
| | | | | | |
Nasdaq | | | | PEEAX | | PEEBX | | PEGCX | | PEGZX | | |
CUSIP | | | | 476296108 | | 476296207 | | 476296306 | | 476296405 | | |
| | | | | | | | | | | | | |
Mutual Funds:
| ARE NOT INSURED BY THE FDIC OR ANY FEDERAL GOVERNMENT AGENCY | | MAY LOSE VALUE | | ARE NOT A DEPOSIT OF OR GUARANTEED BY ANY BANK OR ANY BANK AFFILIATE |
| | |
| Jennison U.S. Emerging Growth Fund, Inc. | | | | |
| | | Share Class | | A | | B | | C | | Z | | |
| | | | | | |
| | | Nasdaq | | PEEAX | | PEEBX | | PEGCX | | PEGZX | | |
| | | CUSIP | | 476296108 | | 476296207 | | 476296306 | | 476296405 | | |
| | | | | | | | | | | | | |
MF173E IFS-AO86525
Item 2 – Code of Ethics – See Exhibit (a)
As of the end of the period covered by this report, the registrant has adopted a code of ethics (the “Section 406 Standards for Investment Companies — Ethical Standards for Principal Executive and Financial Officers”) that applies to the registrant’s Principal Executive Officer and Principal Financial Officer; the registrant’s Principal Financial Officer also serves as the Principal Accounting Officer.
The registrant hereby undertakes to provide any person, without charge, upon request, a copy of the code of ethics. To request a copy of the code of ethics, contact the registrant at (973) 367-7525, and ask for a copy of the Section 406 Standards for Investment Companies – Ethical Standards for Principal Executive and Financial Officers.
Item 3 – Audit Committee Financial Expert –
Stephen Munn had been designated as the Fund’s Audit Committee Financial Expert, however, he resigned as a Director of the Fund effective November 30, 2003 and the Fund’s board is in the process of selecting a new designee.
Item 4 – Principal Accountant Fees and Services – Not required in this filing
Item 5 – Reserved
Item 6 – Reserved
Item 7 – Disclosure of Proxy Voting Policies and Procedures for Closed-End Management Investment Companies – Not required in this filing
Item 8 – Reserved
Item 9 – Controls and Procedures
(a) It is the conclusion of the registrant’s principal executive officer and principal financial officer that the effectiveness of the registrant’s current disclosure controls and procedures (such disclosure controls and procedures having been evaluated within 90 days of the date of this filing) provide reasonable assurance that the information required to be disclosed by the registrant has been recorded, processed, summarized and reported within the time period specified in the Commission’s rules and forms and that the information required to be disclosed by the registrant has been accumulated and communicated to the registrant’s principal executive officer and principal financial officer in order to allow timely decisions regarding required disclosure.
(b) There have been no significant changes in the registrant’s internal controls or in other factors that could significantly affect these controls subsequent to the date of their evaluation, including any corrective actions with regard to significant deficiencies and material weaknesses.
Item 10 – Exhibits
(a) Code of Ethics – Attached hereto
(b) Certifications pursuant to Sections 302 and 906 of the Sarbanes-Oxley Act – Attached hereto
SIGNATURES
Pursuant to the requirements of the Securities Exchange Act of 1934 and the Investment Company Act of 1940, the registrant has duly caused this report to be signed on its behalf by the undersigned, thereunto duly authorized.
(Registrant) Jennison U.S. Emerging Growth Fund, Inc. |
| |
By (Signature and Title)* | | /s/ Marguerite E. H. Morrison
|
| | | Marguerite E. H. Morrison |
| | | Assistant Secretary |
| |
Date | | December 22, 2003 |
Pursuant to the requirements of the Securities Exchange Act of 1934 and the Investment Company Act of 1940, this report has been signed below by the following persons on behalf of the registrant and in the capacities and on the dates indicated.
By (Signature and Title)* | | /s/ Judy A. Rice
|
| | | Judy A. Rice |
| | | President and Principal Executive Officer |
| |
Date | | December 22, 2003 |
| |
By (Signature and Title)* | | /s/ Grace C. Torres
|
| | | Grace C. Torres |
| | | Treasurer and Principal Financial Officer |
| |
Date | | December 22, 2003 |
| * | Print the name and title of each signing officer under his or her signature. |