UNITED STATES
SECURITIES AND EXCHANGE COMMISSION
Washington, D.C. 20549
FORM N-CSR
CERTIFIED SHAREHOLDER REPORT OF REGISTERED MANAGEMENT INVESTMENT COMPANIES
| | |
| Investment Company Act file number: | | 811-07811 |
| |
| Exact name of registrant as specified in charter: | | Prudential Jenison Mid-Cap Growth Fund, Inc. |
| |
| Address of principal executive offices: | | 655 Broad Street, 17th Floor |
| | | Newark, New Jersey 07102 |
| |
| Name and address of agent for service: | | Deborah A. Docs |
| | | 655 Broad Street, 17th Floor |
| | | Newark, New Jersey 07102 |
| |
| Registrant’s telephone number, including area code: | | 800-225-1852 |
| |
| Date of fiscal year end: | | 8/31/2018 |
| |
| Date of reporting period: | | 8/31/2018 |
Item 1 – Reports to Stockholders

PGIM JENNISON MID-CAP GROWTH FUND
(Formerly known as Prudential Jennison Mid-Cap Growth Fund, Inc.)
ANNUAL REPORT
AUGUST 31, 2018

To enroll in e-delivery, go to pgiminvestments.com/edelivery
|
| Objective: Long-term capital appreciation |
Highlights (unaudited)
| • | | The Fund’s information technology holdings, along with its healthcare and industrial holdings, posted strong absolute gains in aggregate, but fell short of the impressive returns of the Russell Midcap Growth Index (the Index). Individual holdings that posted disappointing performance numbers were spread out across multiple sectors. |
| • | | Many of the Fund’s top-performing positions were in the information technology sector, despite the sector’s disappointing relative results. |
| • | | Jennison favors long-term growth stories with attractive valuations, good balance sheets, and strong free cash flow. With the possibility of inflation rising significantly for the first time in years, Jennison is particularly focused on companies that demonstrate pricing power and the ability to hold healthy profit margins against cost pressures. |
This report is not authorized for distribution to prospective investors unless preceded or accompanied by a current prospectus.
The views expressed in this report and information about the Fund’s portfolio holdings are for the period covered by this report and are subject to change thereafter.
Mutual funds are distributed by Prudential Investment Management Services LLC, member SIPC. Jennison Associates is a registered investment adviser. Both are Prudential Financial companies. © 2018 Prudential Financial, Inc. and its related entities. Jennison Associates, Jennison, PGIM, and the PGIM logo are service marks of Prudential Financial, Inc. and its related entities, registered in many jurisdictions worldwide.
| | |
| 2 | | Visit our website at pgiminvestments.com |
PGIM FUNDS — UPDATE
The Board of Directors/Trustees for the Fund has approved the implementation of an automatic conversion feature for Class C shares, effective as of April 1, 2019. To reflect these changes, effective April 1, 2019, the section of the Fund’s Prospectus entitled “How to Buy, Sell and Exchange Fund Shares—How to Exchange Your Shares—Frequent Purchases and Redemptions of Fund Shares” is restated to read as follows:
This supplement should be read in conjunction with your Summary Prospectus, Statutory Prospectus and Statement of Additional Information, be retained for future reference and is in addition to any existing Fund supplements.
| | 1. | In each Fund’s Statutory Prospectus, the following is added at the end of the section entitled “Fund Distributions And Tax Issues—If You Sell or Exchange Your Shares”: |
Automatic Conversion of Class C Shares
The conversion of Class C shares into Class A shares—which happens automatically approximately 10 years after purchase—is not a taxable event for federal income tax purposes. For more information about the automatic conversion of Class C shares, see Class C Shares Automatically Convert to Class A Shares in How to Buy, Sell and Exchange Fund Shares.
| | 2. | In each Fund’s Statutory Prospectus, the following sentence is added at the end of the section entitled “How to Buy, Sell and Exchange Shares—Closure of Certain Share Classes to New Group Retirement Plans”: |
Shareholders owning Class C shares may continue to hold their Class C shares until the shares automatically convert to Class A shares under the conversion schedule, or until the shareholder redeems their Class C shares.
| | 3. | In each Fund’s Statutory Prospectus, the following disclosure is added immediately following the section entitled “How to Buy, Sell and Exchange Shares—How to Buy Shares—Class B Shares Automatically Convert to Class A Shares”: |
Class C Shares Automatically Convert to Class A Shares
Starting on or about April 1, 2019 (the “Effective Date”), Class C shares will be eligible for automatic conversion into Class A shares on a monthly basis approximately ten years after the original date of purchase (the “Conversion Date”). Conversion will take place based on the relative NAV of the two classes, without the imposition of any sales load, fee or other charge. All such automatic conversions of Class C shares will constitute tax-free exchanges for federal income tax purposes.
For shareholders investing in Class C shares through retirement plans or omnibus accounts, and in certain other instances, the Fund and its agents may not have transparency into how long a shareholder has held Class C shares for purposes of determining whether such Class C shares are eligible for automatic conversion into Class A
| | | | |
| PGIM Jennison Mid-Cap Growth Fund | | | 3 | |
shares, and the relevant financial intermediary may not have the ability to track purchases in order to credit individual shareholders’ holding periods. In these circumstances, the Fund will not be able to automatically convert Class C shares into Class A shares as described above. In order to determine eligibility for conversion in these circumstances, it is the responsibility of the financial intermediary to notify the Fund that the shareholder is eligible for the conversion of Class C shares to Class A shares, and the financial intermediary may be required to maintain and provide the Fund with records that substantiate the holding period of Class C shares. It is the financial intermediary’s (and not the Fund’s) responsibility to keep records of transactions made in accounts it holds and to ensure that the shareholder is credited with the proper holding period based on such records or those provided to the financial intermediary by the shareholder. Please consult with your financial intermediary for the applicability of this conversion feature to your shares.
A financial intermediary may sponsor and/or control accounts, programs or platforms that impose a different conversion schedule or different eligibility requirements for the exchange of Class C shares for Class A shares (see Appendix A: Waivers and Discounts Available From Certain Financial Intermediaries of the Prospectus). Please consult with your financial intermediary if you have any questions regarding your shares’ conversion from Class C shares to Class A shares.
| | 4. | In Part II of each Fund’s Statement of Additional Information, the following disclosure is added immediately following the section entitled “Purchase, Redemption and Pricing of Fund Shares—Share Classes—Automatic Conversion of Class B Shares”: |
AUTOMATIC CONVERSION OF CLASS C SHARES. Starting on or about April 1, 2019 (the “Effective Date”), Class C shares will be eligible for automatic conversion into Class A shares on a monthly basis approximately ten years after the original date of purchase (the “Conversion Date”). Conversion will take place based on the relative NAV of the two classes, without the imposition of any sales load, fee or other charge. Class C shares of a Fund acquired through automatic reinvestment of dividends or distributions will convert to Class A shares of the Fund on the Conversion Date pro rata with the converting Class C shares of the Fund that were not acquired through reinvestment of dividends or distributions. All such automatic conversions of Class C shares will constitute tax-free exchanges for federal income tax purposes.
For shareholders investing in Class C shares through retirement plans or omnibus accounts, and in certain other instances, the Fund and its agents may not have transparency into how long a shareholder has held Class C shares for purposes of determining whether such Class C shares are eligible for automatic conversion into Class A shares, and the relevant financial intermediary may not have the ability to track purchases in order to credit individual shareholders’ holding periods. In these circumstances, the Fund will not be able to automatically convert Class C shares into Class A shares as described above. In order to determine eligibility for conversion in these circumstances, it is the responsibility of the
| | |
| 4 | | Visit our website at pgiminvestments.com |
financial intermediary to notify the Fund that the shareholder is eligible for the conversion of Class C shares to Class A shares, and the financial intermediary may be required to maintain and provide the Fund with records that substantiate the holding period of Class C shares. It is the financial intermediary’s (and not the Fund’s) responsibility to keep records of transactions made in accounts it holds and to ensure that the shareholder is credited with the proper holding period based on such records or those provided to the financial intermediary by the shareholder. Please consult with your financial intermediary for the applicability of this conversion feature to your shares.
Class C shares were generally closed to investments by new group retirement plans effective June 1, 2018. Group retirement plans (and their successor, related and affiliated plans) that have Class C shares of the Fund available to participants on or before the Effective Date may continue to open accounts for new participants in such share class and purchase additional shares in existing participant accounts.
The Fund has no responsibility for monitoring or implementing a financial intermediary’s process for determining whether a shareholder meets the required holding period for conversion. A financial intermediary may sponsor and/or control accounts, programs or platforms that impose a different conversion schedule or different eligibility requirements for the exchange of Class C shares for Class A shares, as set forth on Appendix A: Waivers and Discounts Available From Certain Financial Intermediaries of the Prospectus. In these cases, Class C shareholders may have their shares exchanged for Class A shares under the policies of the financial intermediary. Financial intermediaries will be responsible for making such exchanges in those circumstances. Please consult with your financial intermediary if you have any questions regarding your shares’ conversion from Class C shares to Class A shares.
LR1094
- Not part of the Annual Report -
| | | | |
| PGIM Jennison Mid-Cap Growth Fund | | | 5 | |
Table of Contents
| | |
| 6 | | Visit our website at pgiminvestments.com |
Letter from the President

Dear Shareholder:
We hope you find the annual report for the PGIM Jennison Mid-Cap Growth Fund informative and useful. The report covers performance for the 12-month period that ended August 31, 2018.
We have important information to share with you. Effective June 11, 2018, Prudential Mutual Funds were renamed PGIM Funds. This renaming is part of our
ongoing effort to further build our reputation and establish our global brand, which
began when our firm adopted PGIM Investments as its name in April 2017. Please note that only the Fund’s name has changed. Your Fund’s management and operation, along with its symbols, remained the same.*
Over the reporting period, the global economy continued to grow, and central banks gradually tightened monetary policy. In the US, the economy expanded and employment increased. In June, the Federal Reserve hiked interest rates for the seventh time since 2015, based on confidence in the economy.
Equity returns were strong, due to optimistic earnings expectations and investor sentiment. Global equities, including emerging markets, generally posted positive returns. However, they trailed the performance of US equities, which rose on higher corporate profits, new regulatory policies, and tax reform benefits. Volatility spiked briefly in the middle of the period on inflation concerns, rising interest rates, and a potential global trade war, but it decreased as the period ended.
The overall bond market declined modestly during the period, as measured by the Bloomberg Barclays US Aggregate Bond Index. The best performance came from higher-yielding, economically sensitive sectors. Although they finished the period with negative returns, US investment-grade corporate bonds outperformed US government nominal bonds. A major trend during the period was the flattening of the US Treasury yield curve, which increased the yield on fixed income investments with shorter maturities and made them more attractive to investors.
Regarding your investments with PGIM, we believe it is important to maintain a diversified portfolio of funds consistent with your tolerance for risk, time horizon, and financial goals. Your financial advisor can help you create a diversified investment plan that may include funds covering all the basic asset classes and that reflects your personal investor profile and risk tolerance. However, diversification and asset allocation strategies do not assure a profit or protect against loss in declining markets.
At PGIM Investments, we consider it a great privilege and responsibility to help investors participate in opportunities across global markets while meeting their toughest investment challenges. PGIM is a top-10 global investment manager with more than $1 trillion in assets under management. This investment expertise allows us to deliver actively managed funds and strategies to meet the needs of investors around the globe.
Thank you for choosing our family of funds.
Sincerely,

Stuart S. Parker, President
PGIM Jennison Mid-Cap Growth Fund
October 15, 2018
*The Prudential Day One Funds did not change their names.
| | | | |
| PGIM Jennison Mid-Cap Growth Fund | | | 7 | |
Your Fund’s Performance (unaudited)
Performance data quoted represent past performance. Past performance does not guarantee future results. The investment return and principal value of an investment will fluctuate, so that an investor’s shares, when redeemed, may be worth more or less than their original cost. Current performance may be lower or higher than the past performance data quoted. An investor may obtain performance data as of the most recent month-end by visiting our website at www.pgiminvestments.com or by calling (800) 225-1852.
| | | | | | | | | | | | | | |
| | | Average Annual Total Returns as of 8/31/18 (with sales charges) | |
| | | One Year (%) | | Five Years (%) | | | Ten Years (%) | | | Since Inception (%) | |
| Class A | | 9.56 | | | 9.16 | | | | 9.07 | | | | — | |
| Class B | | 10.09 | | | 9.46 | | | | 8.91 | | | | — | |
| Class C | | 14.22 | | | 9.64 | | | | 8.94 | | | | — | |
| Class R | | 15.73 | | | 10.18 | | | | 9.48 | | | | — | |
| Class Z | | 16.24 | | | 10.71 | | | | 10.02 | | | | — | |
| Class R2 | | N/A | | | N/A | | | | N/A | | | | 7.96** (12/27/17) | |
| Class R4 | | N/A | | | N/A | | | | N/A | | | | 8.14** (12/27/17) | |
| Class R6* | | 16.50 | | | 10.92 | | | | N/A | | | | 11.16 (1/18/11) | |
| Russell Midcap Growth Index | |
| | 25.06 | | | 14.19 | | | | 11.64 | | | | — | |
| Russell Midcap Index | |
| | 17.89 | | | 12.80 | | | | 10.92 | | | | — | |
| Lipper Mid-Cap Growth Funds Average | |
| | | 25.94 | | | 13.38 | | | | 10.58 | | | | — | |
| | | | | | | | | | | | | | |
| | | Average Annual Total Returns as of 8/31/18 (without sales charges) | |
| | | One Year (%) | | Five Years (%) | | | Ten Years (%) | | | Since Inception (%) | |
| Class A | | 15.93 | | | 10.40 | | | | 9.69 | | | | — | |
| Class B | | 14.94 | | | 9.59 | | | | 8.91 | | | | — | |
| Class C | | 15.19 | | | 9.64 | | | | 8.94 | | | | — | |
| Class R | | 15.73 | | | 10.18 | | | | 9.48 | | | | — | |
| Class Z | | 16.24 | | | 10.71 | | | | 10.02 | | | | — | |
| Class R2 | | N/A | | | N/A | | | | N/A | | | | 7.96** (12/27/17) | |
| Class R4 | | N/A | | | N/A | | | | N/A | | | | 8.14** (12/27/17) | |
| Class R6* | | 16.50 | | | 10.92 | | | | N/A | | | | 11.16 (1/18/11) | |
| Russell Midcap Growth Index | |
| | 25.06 | | | 14.19 | | | | 11.64 | | | | — | |
| Russell Midcap Index | |
| | 17.89 | | | 12.80 | | | | 10.92 | | | | — | |
| Lipper Mid-Cap Growth Funds Average | |
| | | 25.94 | | | 13.38 | | | | 10.58 | | | | — | |
| | |
| 8 | | Visit our website at pgiminvestments.com |
Growth of a $10,000 Investment (unaudited)
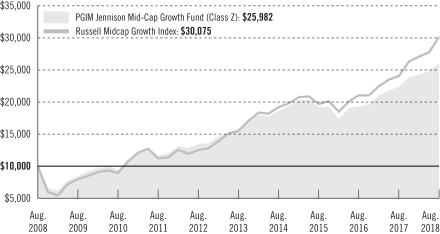
The graph compares a $10,000 investment in the Fund’s Class Z shares with a similar investment in the Russell Midcap Growth Index by portraying the initial account values at the beginning of the 10-year period (August 31, 2008) and the account values at the end of the current fiscal year (August 31, 2018) as measured on a quarterly basis. For purposes of the graph, and unless otherwise indicated, it has been assumed that (a) all recurring fees (including management fees) were deducted; and (b) all dividends and distributions were reinvested. The line graph provides information for Class Z shares only. As indicated in the tables provided earlier, performance for other share classes will vary due to the differing charges and expenses applicable to each share class (as indicated in the following paragraphs). Without waiver of fees and/or expense reimbursement, if any, the Fund’s returns would have been lower.
Past performance does not predict future performance. Total returns and the ending account values in the graphs include changes in share price and reinvestment of dividends and capital gains distributions in a hypothetical investment for the periods shown. The Fund’s total returns do not reflect the deduction of income taxes on an individual’s investment. Taxes may reduce your actual investment returns on income or gains paid by the Fund or any gains you may realize if you sell your shares.
Source: PGIM Investments LLC and Lipper Inc.
* Formerly known as Class Q shares.
** Not annualized
Since Inception returns are provided for any share class with less than 10 fiscal years of returns. Since Inception returns for the Indexes and the Lipper Average are measured from the closest month-end to the class’ inception date.
| | | | |
| PGIM Jennison Mid-Cap Growth Fund | | | 9 | |
Your Fund’s Performance (continued)
The returns in the tables do not reflect the deduction of taxes that a shareholder would pay on Fund distributions or following the redemption of Fund shares. The average annual total returns take into account applicable sales charges which are described for each share class in the table below.
| | | | | | | | | | | | | | | | |
| | | Class A | | Class B* | | Class C | | Class R | | Class Z | | Class R2 | | Class R4 | | Class R6** |
| Maximum initial sales charge | | 5.50% of the public offering price | | None | | None | | None | | None | | None | | None | | None |
| Contingent deferred sales charge (CDSC) (as a percentage of the lower of original purchase price or net asset value at redemption) | | 1.00% on sales of $1 million or more made within 12 months of purchase | | 5.00% (Yr. 1) 4.00% (Yr. 2) 3.00% (Yr. 3) 2.00% (Yr. 4) 1.00% (Yr. 5) 1.00% (Yr. 6) 0.00% (Yr. 7) | | 1.00% on sales made within 12 months of purchase | | None | | None | | None | | None | | None |
| Annual distribution and service (12b-1) fees (shown as a percentage of average daily net assets) | | 0.30% | | 1.00% | | 1.00% | | 0.75%
(0.50% currently) | | None | | 0.25% | | None | | None |
| Shareholder service fees | | None | | None | | None | | None | | None | | 0.10% | | 0.10% | | None |
*Class B shares are closed to all purchase activity and no additional Class B shares may be purchased or acquired except by exchange from Class B shares of another Fund or through dividend or capital gains reinvestment.
**Formerly known as Class Q shares.
Benchmark Definitions
Russell Midcap Growth Index—The Russell Midcap Growth Index is an unmanaged, market-value-weighted index that measures the performance of those Russell Midcap companies with higher price-to-book ratios and higher forecasted growth values. The average annual total return for the Russell Midcap Growth Index measured from the month-end closest to the inception date of the Fund’s Class R6 shares is 13.38%. The cumulative total returns for the Index measured from the month-end closest to the inception date of the Fund’s Class R2 and Class R4 shares is 13.87%.
Russell Midcap Index—The Russell Midcap Index is an unmanaged index which measures the performance of the 800 smallest companies in the Russell 1000 Index, which represent approximately 25% of the total market capitalization of the Russell 1000 Index. The average annual total return for the Russell Midcap Index
| | |
| 10 | | Visit our website at pgiminvestments.com |
measured from the month-end closest to the inception date of the Fund’s Class R6 shares is 12.57%. The cumulative total returns for the Index measured from the month-end closest to the inception date of the Fund’s Class R2 and Class R4 shares is 8.15%.
Lipper Mid-Cap Growth Funds Average—The Lipper Mid-Cap Growth Funds Average (Lipper Average) is based on the average return of all funds in the Lipper Mid-Cap Growth Funds universe for the periods noted. Funds in the Lipper Average invest at least 75% of their equity assets in companies with market capitalizations (on a three-year weighted basis) less than 300% of the dollar-weighted median market capitalization of the middle 1,000 securities of the S&P SuperComposite 1500 Index. Mid-cap growth funds typically have an above-average price-to-earnings ratio, price-to-book ratio, and three-year sales-per-share growth value compared with the S&P MidCap 400 Index. The average annual total return for the Lipper Average measured from the month-end closest to the inception date of the Fund’s Class R6 shares is 12.53%. The cumulative total returns for the Lipper Average measured from the month-end closest to the inception date of the Fund’s Class R2 and Class R4 shares is 15.73%.
Investors cannot invest directly in an index or average. The returns for the Indexes would be lower if they included the effects of sales charges, operating expenses of a mutual fund, or taxes. Returns for the Lipper Average reflect the deduction of operating expenses of a mutual fund, but not sales charges or taxes.
Presentation of Fund Holdings
| | | | |
Five Largest Holdings expressed as a
percentage of net assets as of 8/31/18 (%) | |
| ServiceNow, Inc., Software | | | 2.3 | |
| Red Hat, Inc., Software | | | 2.2 | |
| Roper Technologies, Inc., Industrial Conglomerates | | | 2.2 | |
| Centene Corp., Health Care Providers & Services | | | 2.1 | |
| Worldpay, Inc., IT Services | | | 2.1 | |
Holdings reflect only long-term investments and are subject to change.
| | | | |
Five Largest Industries expressed as a
percentage of net assets as of 8/31/18 (%) | |
| Software | | | 9.8 | |
| IT Services | | | 7.3 | |
| Semiconductors & Semiconductor Equipment | | | 6.7 | |
| Specialty Retail | | | 5.6 | |
| Capital Markets | | | 5.0 | |
Industry weightings reflect only long-term investments and are subject to change.
| | | | |
| PGIM Jennison Mid-Cap Growth Fund | | | 11 | |
Strategy and Performance Overview (unaudited)
How did the Fund perform?
The PGIM Jennison Mid-Cap Growth Fund’s Class Z shares rose 16.24% in the 12-month period that ended August 31, 2018. In the same period, the Russell Midcap Growth Index (the Index) advanced 25.06%, and the Lipper Mid-Cap Growth Funds Average climbed 25.94%.
What was the market environment?
| • | | Equity returns were strong in the reporting period. Global gross domestic product (GDP) advanced at a healthy pace, long-term interest rates remained low, and central banks (including the Federal Reserve) tightened monetary policy gradually in light of subdued inflation. |
| • | | Solid US economic fundamentals included accelerating economic expansion, robust employment, strong corporate profit growth, accumulating cash on company balance sheets, and rising business and consumer confidence. |
| • | | Reduced regulatory pressures and corporate taxation also contributed to market performance. However, trade-related tensions gathered steam as threats from Washington sparked retaliatory measures from global trade partners. |
| • | | The Index’s strong return was supported by advances in most sectors. Information technology generated the largest gains, followed by healthcare and industrials. Only the materials sector lost ground. |
What worked?
Many of the Fund’s top-performing positions were in the information technology sector, despite the whole sector’s disappointing relative results.
| • | | ServiceNow is a leader in software as a service (SaaS)-based IT service management. Shares benefited from growth in revenue, subscriptions, and billings. Jennison believes there is tremendous growth potential as the company has been successfully adding new customers, increasing sales to its existing customer base, and driving new product innovation and market penetration. |
| • | | Splunk makes software that allows businesses to mine and assess large amounts of digital data, helping them diagnose problems, detect patterns and fraud, provide alerts, and analyze customer behaviors. Revenue across all categories was strong as Splunk outpaced its competition and its products gained more importance in large IT organizations. Jennison continues to favor the company’s fundamentals and observes that its customer base is shifting from license to subscription terms, which Jennison believes should result in better margins. |
| | |
| 12 | | Visit our website at pgiminvestments.com |
| • | | Palo Alto Networks makes Internet security hardware and software. It has taken a significant share of the firewall market, and is achieving growth in its non-firewall appliance business. Profitability and free cash flow remain impressive. Many incremental growth drivers are above average for corporate profitability, which Jennison believes should lead to margin expansion. |
| • | | Red Hat is the market-leading vendor of Linux, an open-source computer operating system. The company benefitted from several secular trends, including a shift from UNIX to Linux, open-source virtualization and middleware, and cloud computing. Jennison remains bullish on Red Hat’s market position given its new products, stable core business, minimal competition, and the increasing use of hybrid infrastructure. |
The Fund owned a standout performer in the healthcare sector:
| • | | Centene is a diversified healthcare service provider to government-sponsored plans throughout the US. As more states move high-risk patients to managed care plans, Medicaid enrollment is experiencing strong growth. Supported by a robust technology platform, Centene has a solid track record of winning and retaining state contracts, including a recent Medicaid contract in Iowa. The company also has been moving into new areas of complex care, and it recently acquired New York-based Fidelis Care. |
What didn’t work?
The Fund’s information technology holdings, along with its healthcare and industrial holdings, posted strong absolute gains in aggregate, but fell short of the Index’s impressive returns. Individual holdings that posted disappointing performance numbers were spread out across multiple sectors.
| • | | Newell Brands is a leading global marketer of consumer and commercial products that includes well-known brands such as Paper Mate, Mr. Coffee, and Rubbermaid. Jennison’s investment thesis assumed that e-commerce would improve sales and generate a growing free-cash-flow yield. However, the Fund eliminated its position in Newell Brands as most segments failed to deliver operational improvements amid a tough retail environment. |
| • | | Incyte’s Jakafi is the only treatment approved in the US for patients suffering from certain types of myelofibrosis (MF). Jakafi is also approved for treatment of polycythemia vera (PV), a rare blood cancer. Based on competitive concerns and uncertainty over upcoming trial data, the Fund eliminated its position. |
| • | | Online travel company Expedia suffered disappointing earnings while focusing on business initiatives to position itself for long-term growth. While these initiatives may eventually benefit the company, the Fund eliminated its position in favor of other investment opportunities. |
| | | | |
| PGIM Jennison Mid-Cap Growth Fund | | | 13 | |
Strategy and Performance Overview (continued)
| • | | TreeHouse Foods, a food and beverage manufacturer, missed earnings expectations, and profits fell in nearly all segments. Following a management shakeup, the Fund eliminated its position due to the company’s inability to compete for new business as a result of these operational challenges and management turnover. |
| • | | Affiliated Managers Group, a global asset management company had mixed results with good earnings offset by large outflows. While Jennison was disappointed in this lack of growth, it still thinks the company can accelerate earnings given healthy markets and a return of capital to shareholders. |
The percentage points shown in the tables identify each security’s positive or negative contribution to the Fund’s return, which is the sum of all contributions by individual holdings.
| | | | | | |
| Top contributors (%) | | Top detractors (%) |
| ServiceNow Inc. | | 0.97 | | Newell Brands | | –0.61 |
| Splunk Inc. | | 0.97 | | Incyte Corp. | | –0.43 |
| Palo Alto Networks Inc. | | 0.96 | | Expedia Group | | –0.29 |
| Red Hat Inc. | | 0.84 | | TreeHouse Foods Inc. | | –0.25 |
| Centene Corp. | | 0.82 | | Affliated Managers
Group Inc. | | –0.24 |
Current outlook
| • | | Jennison continues to monitor broad economic fundamentals and the performance of its investments. Despite ongoing positive economic trends, some trends are decelerating and growth may have peaked in the second quarter of 2018. While interest rates are still low by historical standards, the Federal Reserve raised the federal funds rate three times during the reporting period (once in December 2017 and again in March and June of 2018). It likely will raise this rate again in the future to curb inflation, which is still relatively low but increasing. Meanwhile, margins for many companies are at record levels and may be peaking. |
| • | | Jennison reduced the Fund’s exposure to industrial cyclical companies based on the belief that the business cycle is in a later stage of growth. That said, Jennison maintains significant exposure to consumer cyclicals like lodging, cruise lines, and retail. |
| • | | Jennison added new franchises with large market opportunities that are in the early stages of growth. It favors companies with established positive cash flow and profitability. |
| • | | As always, Jennison favors long-term growth stories with attractive valuations, good balance sheets, and strong free cash flow. With the possibility of inflation rising significantly for the first time in years, Jennison is particularly focused on companies that demonstrate pricing power and the ability to hold healthy profit margins against cost pressures. |
| • | | 2018 was a year of above-moderate market returns. Relative to its benchmark and peers, the Fund has historically performed well during market downturns and periods of moderate and negative market returns, due mostly to its lower risk posture. |
| | |
| 14 | | Visit our website at pgiminvestments.com |
Fees and Expenses (unaudited)
As a shareholder of the Fund, you incur two types of costs: (1) transaction costs, including sales charges (loads) on purchase payments and redemptions, as applicable, and (2) ongoing costs, including management fees, distribution and/or service (12b-1) fees, and other Fund expenses, as applicable. This example is intended to help you understand your ongoing costs (in dollars) of investing in the Fund and to compare these costs with the ongoing costs of investing in other mutual funds.
The example is based on an investment of $1,000 held through the six-month period ended August 31, 2018. The example is for illustrative purposes only; you should consult the Prospectus for information on initial and subsequent minimum investment requirements.
Actual Expenses
The first line for each share class in the table on the following page provides information about actual account values and actual expenses. You may use the information on this line, together with the amount you invested, to estimate the expenses that you paid over the period. Simply divide your account value by $1,000 (for example, an $8,600 account value ÷ $1,000 = 8.6), then multiply the result by the number on the first line under the heading “Expenses Paid During the Six-Month Period” to estimate the expenses you paid on your account during this period.
Hypothetical Example for Comparison Purposes
The second line for each share class in the table on the following page provides information about hypothetical account values and hypothetical expenses based on the Fund’s actual expense ratio and an assumed rate of return of 5% per year before expenses, which is not the Fund’s actual return. The hypothetical account values and expenses may not be used to estimate the actual ending account balance or expenses you paid for the period. You may use this information to compare the ongoing costs of investing in the Fund and other funds. To do so, compare this 5% hypothetical example with the 5% hypothetical examples that appear in the shareholder reports of the other funds.
The Fund’s transfer agent may charge additional fees to holders of certain accounts that are not included in the expenses shown in the table on the following page. These fees apply to individual retirement accounts (IRAs) and Section 403(b) accounts. As of the close of the six-month period covered by the table, IRA fees included an annual maintenance fee of $15 per account (subject to a maximum annual maintenance fee of $25 for all accounts held by the same shareholder). Section 403(b) accounts are charged an annual $25 fiduciary maintenance fee. Some of the fees may vary in amount, or may be waived, based on your total account balance or the number of PGIM funds, including the Fund, that you own. You should consider the additional fees that were charged to your Fund account over the six-month period when you estimate the total ongoing expenses paid over the period and the impact of these fees on your ending account value, as these additional expenses
| | | | |
| PGIM Jennison Mid-Cap Growth Fund | | | 15 | |
Fees and Expenses (continued)
are not reflected in the information provided in the expense table. Additional fees have the effect of reducing investment returns.
Please note that the expenses shown in the table are meant to highlight your ongoing costs only and do not reflect any transactional costs such as sales charges (loads). Therefore, the second line for each share class in the table is useful in comparing ongoing costs only and will not help you determine the relative total costs of owning different funds. In addition, if these transactional costs were included, your costs would have been higher.
| | | | | | | | | | | | | | | | | | |
PGIM
Jennison Mid-Cap
Growth Fund | | Beginning Account
Value
March 1, 2018 | | | Ending Account
Value
August 31, 2018 | | | Annualized
Expense Ratio | | | Expenses Paid
During the
Six-Month Period* | |
| Class A | | Actual | | $ | 1,000.00 | | | $ | 1,072.80 | | | | 1.03 | % | | $ | 5.38 | |
| | Hypothetical | | $ | 1,000.00 | | | $ | 1,020.01 | | | | 1.03 | % | | $ | 5.24 | |
| Class B | | Actual | | $ | 1,000.00 | | | $ | 1,068.40 | | | | 1.87 | % | | $ | 9.75 | |
| | Hypothetical | | $ | 1,000.00 | | | $ | 1,015.78 | | | | 1.87 | % | | $ | 9.50 | |
| Class C | | Actual | | $ | 1,000.00 | | | $ | 1,069.30 | | | | 1.67 | % | | $ | 8.71 | |
| | Hypothetical | | $ | 1,000.00 | | | $ | 1,016.79 | | | | 1.67 | % | | $ | 8.49 | |
| Class R | | Actual | | $ | 1,000.00 | | | $ | 1,071.80 | | | | 1.23 | % | | $ | 6.42 | |
| | Hypothetical | | $ | 1,000.00 | | | $ | 1,019.00 | | | | 1.23 | % | | $ | 6.26 | |
| Class Z | | Actual | | $ | 1,000.00 | | | $ | 1,073.90 | | | | 0.80 | % | | $ | 4.18 | |
| | Hypothetical | | $ | 1,000.00 | | | $ | 1,021.17 | | | | 0.80 | % | | $ | 4.08 | |
| Class R2 | | Actual | | $ | 1,000.00 | | | $ | 1,072.60 | | | | 1.08 | % | | $ | 5.64 | |
| | Hypothetical | | $ | 1,000.00 | | | $ | 1,019.76 | | | | 1.08 | % | | $ | 5.50 | |
| Class R4 | | Actual | | $ | 1,000.00 | | | $ | 1,073.90 | | | | 0.83 | % | | $ | 4.34 | |
| | Hypothetical | | $ | 1,000.00 | | | $ | 1,021.02 | | | | 0.83 | % | | $ | 4.23 | |
| Class R6** | | Actual | | $ | 1,000.00 | | | $ | 1,075.10 | | | | 0.58 | % | | $ | 3.03 | |
| | | Hypothetical | | $ | 1,000.00 | | | $ | 1,022.28 | | | | 0.58 | % | | $ | 2.96 | |
* Fund expenses (net of fee waivers or subsidies, if any) for each share class are equal to the annualized expense ratio for each share class (provided in the table), multiplied by the average account value over the period, multiplied by the 184 days in the six-month period ended August 31, 2018, and divided by the 365 days in the Fund’s fiscal year ended August 31, 2018 (to reflect the six-month period). Expenses presented in the table include the expenses of any underlying portfolios in which the Fund may invest.
**Formerly known as Class Q shares.
| | |
| 16 | | Visit our website at pgiminvestments.com |
Schedule of Investments
as of August 31, 2018
| | | | | | | | |
| Description | | Shares | | | Value | |
LONG-TERM INVESTMENTS 99.5% | | | | | | | | |
| | |
COMMON STOCKS | | | | | | | | |
| | |
Aerospace & Defense 2.0% | | | | | | | | |
BWX Technologies, Inc. | | | 783,103 | | | $ | 48,019,876 | |
Hexcel Corp. | | | 834,475 | | | | 55,175,487 | |
| | | | | | | | |
| | | | | | | 103,195,363 | |
| | |
Air Freight & Logistics 0.9% | | | | | | | | |
XPO Logistics, Inc.*(a) | | | 418,824 | | | | 44,604,756 | |
| | |
Airlines 0.3% | | | | | | | | |
Spirit Airlines, Inc.*(a) | | | 327,667 | | | | 15,570,736 | |
| | |
Auto Components 1.3% | | | | | | | | |
Aptiv PLC | | | 789,177 | | | | 69,455,468 | |
| | |
Banks 1.3% | | | | | | | | |
Pinnacle Financial Partners, Inc. | | | 640,749 | | | | 41,360,348 | |
SVB Financial Group* | | | 83,356 | | | | 26,903,149 | |
| | | | | | | | |
| | | | | | | 68,263,497 | |
| | |
Biotechnology 2.1% | | | | | | | | |
Alexion Pharmaceuticals, Inc.* | | | 438,654 | | | | 53,621,065 | |
BioMarin Pharmaceutical, Inc.* | | | 576,722 | | | | 57,660,666 | |
| | | | | | | | |
| | | | | | | 111,281,731 | |
| | |
Capital Markets 5.0% | | | | | | | | |
Affiliated Managers Group, Inc. | | | 420,490 | | | | 61,429,384 | |
Lazard Ltd. (Class A Stock) | | | 846,279 | | | | 40,739,871 | |
Moody’s Corp. | | | 364,940 | | | | 64,966,619 | |
TD Ameritrade Holding Corp.(a) | | | 1,538,083 | | | | 90,085,521 | |
| | | | | | | | |
| | | | | | | 257,221,395 | |
| | |
Chemicals 2.8% | | | | | | | | |
Albemarle Corp.(a) | | | 488,673 | | | | 46,678,045 | |
Celanese Corp. (Class A Stock) | | | 290,609 | | | | 33,951,849 | |
FMC Corp. | | | 770,393 | | | | 65,830,082 | |
| | | | | | | | |
| | | | | | | 146,459,976 | |
See Notes to Financial Statements.
| | | | |
| PGIM Jennison Mid-Cap Growth Fund | | | 17 | |
Schedule of Investments (continued)
as of August 31, 2018
| | | | | | | | |
| Description | | Shares | | | Value | |
COMMON STOCKS (Continued) | | | | | | | | |
| | |
Commercial Services & Supplies 2.5% | | | | | | | | |
Cintas Corp. | | | 301,439 | | | $ | 64,318,039 | |
Stericycle, Inc.*(a) | | | 1,095,640 | | | | 67,590,032 | |
| | | | | | | | |
| | | | | | | 131,908,071 | |
| | |
Communications Equipment 1.8% | | | | | | | | |
Palo Alto Networks, Inc.* | | | 404,304 | | | | 93,454,870 | |
| | |
Construction & Engineering 1.0% | | | | | | | | |
Quanta Services, Inc.* | | | 1,519,638 | | | | 52,564,278 | |
| | |
Construction Materials 1.1% | | | | | | | | |
Vulcan Materials Co. | | | 519,460 | | | | 57,556,168 | |
| | |
Consumer Finance 1.6% | | | | | | | | |
SLM Corp.* | | | 7,031,125 | | | | 82,404,785 | |
| | |
Diversified Consumer Services 0.8% | | | | | | | | |
Bright Horizons Family Solutions, Inc.* | | | 334,751 | | | | 39,979,312 | |
| | |
Electrical Equipment 1.9% | | | | | | | | |
AMETEK, Inc. | | | 1,287,741 | | | | 99,104,547 | |
| | |
Electronic Equipment, Instruments & Components 3.8% | | | | | | | | |
Amphenol Corp. (Class A Stock) | | | 829,354 | | | | 78,440,301 | |
CDW Corp. | | | 852,889 | | | | 74,678,961 | |
Flex Ltd.* | | | 3,078,527 | | | | 42,452,887 | |
| | | | | | | | |
| | | | | | | 195,572,149 | |
| | |
Energy Equipment & Services 0.4% | | | | | | | | |
TechnipFMC PLC (United Kingdom) | | | 726,883 | | | | 22,264,426 | |
| | |
Equity Real Estate Investment Trusts (REITs) 3.1% | | | | | | | | |
Equinix, Inc. | | | 142,552 | | | | 62,171,204 | |
SBA Communications Corp.* | | | 637,787 | | | | 99,003,676 | |
| | | | | | | | |
| | | | | | | 161,174,880 | |
| | |
Food & Staples Retailing 0.8% | | | | | | | | |
US Foods Holding Corp.* | | | 1,216,298 | | | | 39,639,152 | |
| | |
Food Products 1.1% | | | | | | | | |
McCormick & Co., Inc.(a) | | | 440,240 | | | | 54,977,171 | |
See Notes to Financial Statements.
| | | | | | | | |
| Description | | Shares | | | Value | |
COMMON STOCKS (Continued) | | | | | | | | |
| | |
Health Care Equipment & Supplies 3.4% | | | | | | | | |
Edwards Lifesciences Corp.* | | | 535,662 | | | $ | 77,263,887 | |
Hill-Rom Holdings, Inc. | | | 591,345 | | | | 57,520,128 | |
Teleflex, Inc. | | | 173,318 | | | | 42,884,073 | |
| | | | | | | | |
| | | | | | | 177,668,088 | |
| | |
Health Care Providers & Services 3.4% | | | | | | | | |
Centene Corp.* | | | 740,859 | | | | 108,521,026 | |
Laboratory Corp. of America Holdings* | | | 386,592 | | | | 66,830,159 | |
| | | | | | | | |
| | | | | | | 175,351,185 | |
| | |
Hotels, Restaurants & Leisure 4.3% | | | | | | | | |
Aramark | | | 1,013,421 | | | | 41,631,335 | |
Hilton Worldwide Holdings, Inc. | | | 1,017,207 | | | | 78,955,607 | |
Norwegian Cruise Line Holdings Ltd.* | | | 1,133,710 | | | | 60,778,193 | |
Vail Resorts, Inc. | | | 132,103 | | | | 39,373,299 | |
| | | | | | | | |
| | | | | | | 220,738,434 | |
| | |
Household Durables 0.8% | | | | | | | | |
Mohawk Industries, Inc.* | | | 212,190 | | | | 40,653,482 | |
| | |
Household Products 1.7% | | | | | | | | |
Church & Dwight Co., Inc. | | | 942,439 | | | | 53,323,198 | |
Clorox Co. (The) | | | 252,816 | | | | 36,653,264 | |
| | | | | | | | |
| | | | | | | 89,976,462 | |
| | |
Industrial Conglomerates 2.2% | | | | | | | | |
Roper Technologies, Inc. | | | 375,443 | | | | 112,020,928 | |
| | |
Internet Software & Services 0.7% | | | | | | | | |
GrubHub, Inc.* | | | 250,357 | | | | 36,078,947 | |
| | |
IT Services 7.3% | | | | | | | | |
Fidelity National Information Services, Inc. | | | 868,562 | | | | 93,952,352 | |
FleetCor Technologies, Inc.* | | | 352,132 | | | | 75,264,694 | |
Global Payments, Inc. | | | 833,490 | | | | 103,836,184 | |
Worldpay, Inc. (Class A Stock)* | | | 1,112,198 | | | | 108,316,963 | |
| | | | | | | | |
| | | | | | | 381,370,193 | |
| | |
Life Sciences Tools & Services 2.6% | | | | | | | | |
Illumina, Inc.* | | | 160,057 | | | | 56,793,025 | |
See Notes to Financial Statements.
| | | | |
| PGIM Jennison Mid-Cap Growth Fund | | | 19 | |
Schedule of Investments (continued)
as of August 31, 2018
| | | | | | | | |
| Description | | Shares | | | Value | |
COMMON STOCKS (Continued) | | | | | | | | |
| | |
Life Sciences Tools & Services (cont’d.) | | | | | | | | |
IQVIA Holdings, Inc.* | | | 356,521 | | | $ | 45,310,254 | |
PRA Health Sciences, Inc.* | | | 329,513 | | | | 34,796,573 | |
| | | | | | | | |
| | | | | | | 136,899,852 | |
| | |
Machinery 1.8% | | | | | | | | |
Fortive Corp. | | | 707,214 | | | | 59,391,832 | |
Stanley Black & Decker, Inc. | | | 229,419 | | | | 32,240,252 | |
| | | | | | | | |
| | | | | | | 91,632,084 | |
| | |
Mortgage Real Estate Investment Trusts (REITs) 1.3% | | | | | | | | |
Starwood Property Trust, Inc. | | | 2,967,451 | | | | 65,372,946 | |
| | |
Multiline Retail 1.5% | | | | | | | | |
Dollar General Corp. | | | 487,843 | | | | 52,555,327 | |
Dollar Tree, Inc.* | | | 323,638 | | | | 26,056,095 | |
| | | | | | | | |
| | | | | | | 78,611,422 | |
| | |
Oil, Gas & Consumable Fuels 2.1% | | | | | | | | |
Noble Energy, Inc. | | | 2,226,537 | | | | 66,172,680 | |
Targa Resources Corp. | | | 797,799 | | | | 43,934,791 | |
| | | | | | | | |
| | | | | | | 110,107,471 | |
| | |
Pharmaceuticals 0.7% | | | | | | | | |
Zoetis, Inc. | | | 429,632 | | | | 38,924,659 | |
| | |
Professional Services 3.3% | | | | | | | | |
CoStar Group, Inc.* | | | 126,300 | | | | 55,844,808 | |
IHS Markit Ltd.* | | | 1,477,754 | | | | 81,276,470 | |
Verisk Analytics, Inc.* | | | 284,000 | | | | 33,821,560 | |
| | | | | | | | |
| | | | | | | 170,942,838 | |
| | |
Real Estate Management & Development 3.0% | | | | | | | | |
CBRE Group, Inc. (Class A Stock)* | | | 2,044,460 | | | | 99,790,092 | |
Howard Hughes Corp. (The)* | | | 429,170 | | | | 55,950,893 | |
| | | | | | | | |
| | | | | | | 155,740,985 | |
| | |
Road & Rail 1.1% | | | | | | | | |
J.B. Hunt Transport Services, Inc. | | | 474,501 | | | | 57,295,996 | |
See Notes to Financial Statements.
| | | | | | | | |
| Description | | Shares | | | Value | |
COMMON STOCKS (Continued) | | | | | | | | |
| | |
Semiconductors & Semiconductor Equipment 6.7% | | | | | | | | |
Analog Devices, Inc.(a) | | | 937,729 | | | $ | 92,694,512 | |
Lam Research Corp. | | | 218,208 | | | | 37,769,623 | |
Marvell Technology Group Ltd. | | | 4,587,781 | | | | 94,875,311 | |
Microchip Technology, Inc.(a) | | | 795,806 | | | | 68,463,190 | |
Universal Display Corp.(a) | | | 446,126 | | | | 54,605,822 | |
| | | | | | | | |
| | | | | | | 348,408,458 | |
| | |
Software 9.8% | | | | | | | | |
Guidewire Software, Inc.*(a) | | | 593,749 | | | | 59,713,337 | |
HubSpot, Inc.* | | | 213,052 | | | | 30,615,572 | |
Proofpoint, Inc.* | | | 345,891 | | | | 41,039,967 | |
Red Hat, Inc.* | | | 784,970 | | | | 115,963,618 | |
ServiceNow, Inc.* | | | 616,721 | | | | 121,099,336 | |
Splunk, Inc.* | | | 793,285 | | | | 101,659,473 | |
Take-Two Interactive Software, Inc.* | | | 281,178 | | | | 37,554,134 | |
| | | | | | | | |
| | | | | | | 507,645,437 | |
| | |
Specialty Retail 5.6% | | | | | | | | |
Advance Auto Parts, Inc. | | | 545,673 | | | | 89,506,742 | |
Burlington Stores, Inc.* | | | 337,136 | | | | 56,699,533 | |
Ross Stores, Inc. | | | 842,405 | | | | 80,685,550 | |
Ulta Beauty, Inc.* | | | 255,645 | | | | 66,467,700 | |
| | | | | | | | |
| | | | | | | 293,359,525 | |
| | |
Textiles, Apparel & Luxury Goods 0.6% | | | | | | | | |
PVH Corp. | | | 220,228 | | | | 31,527,840 | |
| | | | | | | | |
TOTAL LONG-TERM INVESTMENTS
(cost $3,415,997,060) | | | | | | | 5,166,979,963 | |
| | | | | | | | |
| | |
SHORT-TERM INVESTMENTS 5.2% | | | | | | | | |
| | |
AFFILIATED MUTUAL FUNDS | | | | | | | | |
PGIM Core Ultra Short Bond Fund(w) | | | 41,243,606 | | | | 41,243,606 | |
See Notes to Financial Statements.
| | | | |
| PGIM Jennison Mid-Cap Growth Fund | | | 21 | |
Schedule of Investments (continued)
as of August 31, 2018
| | | | | | | | |
| Description | | Shares | | | Value | |
AFFILIATED MUTUAL FUNDS (Continued) | | | | | | | | |
PGIM Institutional Money Market Fund
(cost $227,122,257; includes $226,706,793 of cash collateral for securities on loan)(b)(w) | | | 227,114,767 | | | $ | 227,137,479 | |
| | | | | | | | |
TOTAL SHORT-TERM INVESTMENTS
(cost $268,365,863) | | | | | | | 268,381,085 | |
| | | | | | | | |
TOTAL INVESTMENTS 104.7%
(cost $3,684,362,923) | | | | | | | 5,435,361,048 | |
Liabilities in excess of other assets (4.7)% | | | | | | | (243,419,830 | ) |
| | | | | | | | |
NET ASSETS 100.0% | | | | | | $ | 5,191,941,218 | |
| | | | | | | | |
The following abbreviation is used in the annual report:
REITs—Real Estate Investment Trusts
| * | Non-income producing security. |
| (a) | All or a portion of security is on loan. The aggregate market value of such securities, including those sold and pending settlement, is $223,374,751; cash collateral of $226,706,793 (included in liabilities) was received with which the Fund purchased highly liquid short-term investments. |
| (b) | Represents security purchased with cash collateral received for securities on loan and includes dividend reinvestment. |
| (w) | PGIM Investments LLC, the manager of the Fund, also serves as manager of the PGIM Core Ultra Short Bond Fund and PGIM Institutional Money Market Fund. |
Fair Value Measurements:
Various inputs are used in determining the value of the Fund’s investments. These inputs are summarized in the three broad levels listed below.
Level 1—unadjusted quoted prices generally in active markets for identical securities.
Level 2—quoted prices for similar securities, interest rates and yield curves, prepayment speeds, foreign currency exchange rates and other observable inputs.
Level 3—unobservable inputs for securities valued in accordance with Board approved fair valuation procedures.
The following is a summary of the inputs used as of August 31, 2018 in valuing such portfolio securities:
| | | | | | | | | | | | |
| | | Level 1 | | | Level 2 | | | Level 3 | |
Investments in Securities | | | | | | | | | | | | |
Common Stocks | | | | | | | | | | | | |
Aerospace & Defense | | $ | 103,195,363 | | | $ | — | | | $ | — | |
Air Freight & Logistics | | | 44,604,756 | | | | — | | | | — | |
Airlines | | | 15,570,736 | | | | — | | | | — | |
Auto Components | | | 69,455,468 | | | | — | | | | — | |
Banks | | | 68,263,497 | | | | — | | | | — | |
Biotechnology | | | 111,281,731 | | | | — | | | | — | |
Capital Markets | | | 257,221,395 | | | | — | | | | — | |
Chemicals | | | 146,459,976 | | | | — | | | | — | |
See Notes to Financial Statements.
| | | | | | | | | | | | |
| | | Level 1 | | | Level 2 | | | Level 3 | |
Investments in Securities (continued) | | | | | | | | | | | | |
Common Stocks (continued) | | | | | | | | | | | | |
Commercial Services & Supplies | | $ | 131,908,071 | | | $ | — | | | $ | — | |
Communications Equipment | | | 93,454,870 | | | | — | | | | — | |
Construction & Engineering | | | 52,564,278 | | | | — | | | | — | |
Construction Materials | | | 57,556,168 | | | | — | | | | — | |
Consumer Finance | | | 82,404,785 | | | | — | | | | — | |
Diversified Consumer Services | | | 39,979,312 | | | | — | | | | — | |
Electrical Equipment | | | 99,104,547 | | | | — | | | | — | |
Electronic Equipment, Instruments & Components | | | 195,572,149 | | | | — | | | | — | |
Energy Equipment & Services | | | 22,264,426 | | | | — | | | | — | |
Equity Real Estate Investment Trusts (REITs) | | | 161,174,880 | | | | — | | | | — | |
Food & Staples Retailing | | | 39,639,152 | | | | — | | | | — | |
Food Products | | | 54,977,171 | | | | — | | | | — | |
Health Care Equipment & Supplies | | | 177,668,088 | | | | — | | | | — | |
Health Care Providers & Services | | | 175,351,185 | | | | — | | | | — | |
Hotels, Restaurants & Leisure | | | 220,738,434 | | | | — | | | | — | |
Household Durables | | | 40,653,482 | | | | — | | | | — | |
Household Products | | | 89,976,462 | | | | — | | | | — | |
Industrial Conglomerates | | | 112,020,928 | | | | — | | | | — | |
Internet Software & Services | | | 36,078,947 | | | | — | | | | — | |
IT Services | | | 381,370,193 | | | | — | | | | — | |
Life Sciences Tools & Services | | | 136,899,852 | | | | — | | | | — | |
Machinery | | | 91,632,084 | | | | — | | | | — | |
Mortgage Real Estate Investment Trusts (REITs) | | | 65,372,946 | | | | — | | | | — | |
Multiline Retail | | | 78,611,422 | | | | — | | | | — | |
Oil, Gas & Consumable Fuels | | | 110,107,471 | | | | — | | | | — | |
Pharmaceuticals | | | 38,924,659 | | | | — | | | | — | |
Professional Services | | | 170,942,838 | | | | — | | | | — | |
Real Estate Management & Development | | | 155,740,985 | | | | — | | | | — | |
Road & Rail | | | 57,295,996 | | | | — | | | | — | |
Semiconductors & Semiconductor Equipment | | | 348,408,458 | | | | — | | | | — | |
Software | | | 507,645,437 | | | | — | | | | — | |
Specialty Retail | | | 293,359,525 | | | | — | | | | — | |
Textiles, Apparel & Luxury Goods | | | 31,527,840 | | | | — | | | | — | |
Affiliated Mutual Funds | | | 268,381,085 | | | | — | | | | — | |
| | | | | | | | | | | | |
Total | | $ | 5,435,361,048 | | | $ | — | | | $ | — | |
| | | | | | | | | | | | |
Industry Classification:
The industry classification of investments and liabilities in excess of other assets shown as a percentage of net assets as of August 31, 2018 were as follows (unaudited):
| | | | |
Software | | | 9.8 | % |
IT Services | | | 7.3 | |
Semiconductors & Semiconductor Equipment | | | 6.7 | |
Specialty Retail | | | 5.6 | |
| | | | |
Affiliated Mutual Funds (4.4% represents investments purchased with collateral from securities on loan) | | | 5.2 | % |
Capital Markets | | | 5.0 | |
Hotels, Restaurants & Leisure | | | 4.3 | |
Electronic Equipment, Instruments & Components | | | 3.8 | |
See Notes to Financial Statements.
| | | | |
| PGIM Jennison Mid-Cap Growth Fund | | | 23 | |
Schedule of Investments (continued)
as of August 31, 2018
Industry Classification (cont’d.)
| | | | |
Health Care Equipment & Supplies | | | 3.4 | % |
Health Care Providers & Services | | | 3.4 | |
Professional Services | | | 3.3 | |
Equity Real Estate Investment Trusts (REITs) | | | 3.1 | |
Real Estate Management & Development | | | 3.0 | |
Chemicals | | | 2.8 | |
Life Sciences Tools & Services | | | 2.6 | |
Commercial Services & Supplies | | | 2.5 | |
Industrial Conglomerates | | | 2.2 | |
Biotechnology | | | 2.1 | |
Oil, Gas & Consumable Fuels | | | 2.1 | |
Aerospace & Defense | | | 2.0 | |
Electrical Equipment | | | 1.9 | |
Communications Equipment | | | 1.8 | |
Machinery | | | 1.8 | |
Household Products | | | 1.7 | |
Consumer Finance | | | 1.6 | |
Multiline Retail | | | 1.5 | |
Auto Components | | | 1.3 | |
Banks | | | 1.3 | |
| | | | |
Mortgage Real Estate Investment Trusts (REITs) | | | 1.3 | % |
Construction Materials | | | 1.1 | |
Road & Rail | | | 1.1 | |
Food Products | | | 1.1 | |
Construction & Engineering | | | 1.0 | |
Air Freight & Logistics | | | 0.9 | |
Household Durables | | | 0.8 | |
Diversified Consumer Services | | | 0.8 | |
Food & Staples Retailing | | | 0.8 | |
Pharmaceuticals | | | 0.7 | |
Internet Software & Services | | | 0.7 | |
Textiles, Apparel & Luxury Goods | | | 0.6 | |
Energy Equipment & Services | | | 0.4 | |
Airlines | | | 0.3 | |
| | | | |
| | | 104.7 | |
Liabilities in excess of other assets | | | (4.7 | ) |
| | | | |
| | | 100.0 | % |
| | | | |
Financial Instruments/Transactions—Summary of Offsetting and Netting Arrangements:
The Fund entered into financial instruments/transactions during the reporting period that are either offset in accordance with current requirements or are subject to enforceable master netting arrangements or similar agreements that permit offsetting. The information about offsetting and related netting arrangements for financial instruments/transactions, where the legal right to set-off exists, is presented in the summary below.
Offsetting of financial instrument/transaction assets and liabilities:
| | | | | | | | | | | | |
Description | | Gross Market
Value of
Recognized
Assets/(Liabilities) | | | Collateral
Pledged/(Received)(1) | | | Net Amount | |
Securities on Loan | | $ | 223,374,751 | | | $ | (223,374,751 | ) | | $ | — | |
| | | | | | | | | | | | |
| (1) | Collateral amount disclosed by the Fund is limited to the market value of financial instruments/transactions. |
See Notes to Financial Statements.
Statement of Assets & Liabilities
as of August 31, 2018
| | | | |
Assets | | | | |
Investments at value, including securities on loan of $223,374,751: | | | | |
Unaffiliated investments (cost $3,415,997,060) | | $ | 5,166,979,963 | |
Affiliated investments (cost $268,365,863) | | | 268,381,085 | |
Receivable for investments sold | | | 9,575,183 | |
Receivable for Fund shares sold | | | 4,840,128 | |
Dividends receivable | | | 2,310,663 | |
| | | | |
Total Assets | | | 5,452,087,022 | |
| | | | |
| |
Liabilities | | | | |
Payable to broker for collateral for securities on loan | | | 226,706,793 | |
Payable for Fund shares reacquired | | | 20,765,042 | |
Payable for investments purchased | | | 7,672,646 | |
Management fee payable | | | 2,472,610 | |
Accrued expenses and other liabilities | | | 1,626,703 | |
Distribution fee payable | | | 473,202 | |
Affiliated transfer agent fee payable | | | 428,808 | |
| | | | |
Total Liabilities | | | 260,145,804 | |
| | | | |
| |
Net Assets | | $ | 5,191,941,218 | |
| | | | |
| | | | | |
Net assets were comprised of: | | | | |
Common stock, at par | | $ | 129,421 | |
Paid-in capital in excess of par | | | 2,413,655,516 | |
| | | | |
| | | 2,413,784,937 | |
Undistributed net investment income | | | 1,897,008 | |
Accumulated net realized gain on investment transactions | | | 1,025,261,148 | |
Net unrealized appreciation on investments | | | 1,750,998,125 | |
| | | | |
Net assets, August 31, 2018 | | $ | 5,191,941,218 | |
| | | | |
See Notes to Financial Statements.
| | | | |
| PGIM Jennison Mid-Cap Growth Fund | | | 25 | |
Statement of Assets & Liabilities
as of August 31, 2018
| | | | |
Class A | | | | |
Net asset value and redemption price per share,
($1,153,935,988 ÷ 30,220,303 shares of common stock issued and outstanding) | | $ | 38.18 | |
Maximum sales charge (5.50% of offering price) | | | 2.22 | |
| | | | |
Maximum offering price to public | | $ | 40.40 | |
| | | | |
| |
Class B | | | | |
Net asset value, offering price and redemption price per share,
($12,087,895 ÷ 409,329 shares of common stock issued and outstanding) | | $ | 29.53 | |
| | | | |
| |
Class C | | | | |
Net asset value, offering price and redemption price per share,
($114,840,826 ÷ 3,878,193 shares of common stock issued and outstanding) | | $ | 29.61 | |
| | | | |
| |
Class R | | | | |
Net asset value, offering price and redemption price per share,
($167,650,099 ÷ 4,549,299 shares of common stock issued and outstanding) | | $ | 36.85 | |
| | | | |
| |
Class Z | | | | |
Net asset value, offering price and redemption price per share,
($2,599,234,941 ÷ 62,988,167 shares of common stock issued and outstanding) | | $ | 41.27 | |
| | | | |
| |
Class R2 | | | | |
Net asset value, offering price and redemption price per share,
($10,796 ÷ 259 shares of common stock issued and outstanding) | | $ | 41.65 | |
| | | | |
| |
Class R4 | | | | |
Net asset value, offering price and redemption price per share,
($10,814 ÷ 259 shares of common stock issued and outstanding) | | $ | 41.72 | |
| | | | |
| |
Class R6 | | | | |
Net asset value, offering price and redemption price per share,
($1,144,169,859 ÷ 27,375,603 shares of common stock issued and outstanding) | | $ | 41.80 | |
| | | | |
See Notes to Financial Statements.
Statement of Operations
Year Ended August 31, 2018
| | | | |
Net Investment Income (Loss) | | | | |
Income | | | | |
Unaffiliated dividend income (net of $411 foreign withholding tax) | | $ | 43,345,781 | |
Affiliated dividend income | | | 1,771,108 | |
Income from securities lending, net (including affiliated income of $238,991) | | | 407,273 | |
| | | | |
Total income | | | 45,524,162 | |
| | | | |
| |
Expenses | | | | |
Management fee | | | 35,313,785 | |
Distribution fee(a) | | | 6,755,089 | |
Shareholder servicing fee(a) | | | 15 | |
Transfer agent’s fees and expenses (including affiliated expense of $2,734,551)(a) | | | 9,658,734 | |
Shareholders’ reports | | | 441,514 | |
Custodian and accounting fees | | | 383,628 | |
Registration fees(a) | | | 126,314 | |
Directors’ fees | | | 119,475 | |
Legal fees and expenses | | | 66,776 | |
Audit fee | | | 28,812 | |
Miscellaneous | | | 113,474 | |
| | | | |
Total expenses | | | 53,007,616 | |
Less: Fee waiver and/or expense reimbursement(a) | | | (34,059 | ) |
Distribution fee waiver(a) | | | (466,130 | ) |
| | | | |
Net expenses | | | 52,507,427 | |
| | | | |
Net investment income (loss) | | | (6,983,265 | ) |
| | | | |
| |
Realized And Unrealized Gain (Loss) On Investments | | | | |
Net realized gain (loss) on investment transactions (including affiliated of $2,328) | | | 1,234,358,515 | |
Net change in unrealized appreciation (depreciation) on investments (including affiliated of $5,806) | | | (252,685,252 | ) |
| | | | |
Net gain (loss) on investment transactions | | | 981,673,263 | |
| | | | |
Net Increase (Decrease) In Net Assets Resulting From Operations | | $ | 974,689,998 | |
| | | | |
| (a) | Class specific expenses and waivers were as follows: |
| | | | | | | | | | | | | | | | | | | | | | | | | | | | | | | | |
| | | Class A | | | Class B | | | Class C | | | Class R | | | Class Z | | | Class R2 | | | Class R4 | | | Class R6 | |
Distribution fee | | | 3,995,443 | | | | 148,294 | | | | 1,212,945 | | | | 1,398,390 | | | | — | | | | 17 | | | | — | | | | — | |
Shareholder servicing fee | | | — | | | | — | | | | — | | | | — | | | | — | | | | 7 | | | | 8 | | | | — | |
Transfer agent’s fees and expenses | | | 2,374,190 | | | | 43,912 | | | | 128,867 | | | | 287,591 | | | | 6,818,494 | | | | 58 | | | | 58 | | | | 5,564 | |
Registration fees | | | 15,025 | | | | 9,586 | | | | 9,771 | | | | 13,073 | | | | 29,935 | | | | 16,983 | | | | 16,983 | | | | 14,958 | |
Fee waiver and/or expense reimbursement | | | — | | | | — | | | | — | | | | — | | | | — | | | | (17,029 | ) | | | (17,030 | ) | | | — | |
Distribution fee waiver | | | — | | | | — | | | | — | | | | (466,130 | ) | | | — | | | | — | | | | — | | | | — | |
See Notes to Financial Statements.
| | | | |
| PGIM Jennison Mid-Cap Growth Fund | | | 27 | |
Statements of Changes in Net Assets
| | | | | | | | |
| | | Year Ended August 31, | |
| | | 2018 | | | 2017 | |
Increase (Decrease) in Net Assets | | | | | | | | |
Operations | | | | | | | | |
Net investment income (loss) | | $ | (6,983,265 | ) | | $ | (1,376,400 | ) |
Net realized gain (loss) on investment transactions | | | 1,234,358,515 | | | | 761,105,720 | |
Net change in unrealized appreciation (depreciation) on investments | | | (252,685,252 | ) | | | 285,070,933 | |
| | | | | | | | |
Net increase (decrease) in net assets resulting from operations | | | 974,689,998 | | | | 1,044,800,253 | |
| | | | | | | | |
| | |
Distributions from net realized gains | | | | | | | | |
Class A | | | (184,432,771 | ) | | | (146,980,877 | ) |
Class B | | | (2,495,280 | ) | | | (1,503,996 | ) |
Class C | | | (19,761,566 | ) | | | (10,792,763 | ) |
Class R | | | (25,555,099 | ) | | | (14,592,537 | ) |
Class Z | | | (405,439,242 | ) | | | (216,687,522 | ) |
Class R6 | | | (202,439,947 | ) | | | (54,250,039 | ) |
| | | | | | | | |
| | | (840,123,905 | ) | | | (444,807,734 | ) |
| | | | | | | | |
| | |
Fund share transactions (Net of share conversions) | | | | | | | | |
Net proceeds from shares sold | | | 994,475,124 | | | | 1,205,848,998 | |
Net asset value of shares issued in reinvestment of dividends and distributions | | | 768,732,705 | | | | 405,250,678 | |
Cost of shares reacquired | | | (3,631,436,559 | ) | | | (3,017,924,932 | ) |
| | | | | | | | |
Net increase (decrease) in net assets from Fund share transactions | | | (1,868,228,730 | ) | | | (1,406,825,256 | ) |
| | | | | | | | |
Total increase (decrease) | | | (1,733,662,637 | ) | | | (806,832,737 | ) |
| | |
Net Assets: | | | | | | | | |
Beginning of year | | | 6,925,603,855 | | | | 7,732,436,592 | |
| | | | | | | | |
End of year(a) | | $ | 5,191,941,218 | | | $ | 6,925,603,855 | |
| | | | | | | | |
(a) Includes undistributed/(distributions in excess of) net investment income of: | | $ | 1,897,008 | | | $ | 7,098,822 | |
| | | | | | | | |
See Notes to Financial Statements.
Notes to Financial Statements
Prudential Jennison Mid-Cap Growth Fund, Inc. (the “Company”) is registered under the Investment Company Act of 1940, as amended (“1940 Act”), as a diversified, open-end management investment company. PGIM Jennison Mid-Cap Growth Fund (the “Fund”) is the sole series of the Company. Effective June 11, 2018, the Fund became a series of the Company, the Fund’s name was changed by replacing “Prudential” with “PGIM” and the Fund’s Class Q shares were renamed Class R6 shares.
The investment objective of the Fund is to achieve long-term capital appreciation.
1. Accounting Policies
The Fund follows investment company accounting and reporting guidance of the Financial Accounting Standards Board (“FASB”) Accounting Standard Codification Topic 946 Financial Services—Investment Companies. The following accounting policies conform to U.S. generally accepted accounting principles. The Fund consistently follows such policies in the preparation of its financial statements.
Securities Valuation: The Fund holds securities and other assets and liabilities that are fair valued at the close of each day (generally, 4:00 PM Eastern time) the New York Stock Exchange (“NYSE”) is open for trading. Fair value is the price that would be received to sell an asset or paid to transfer a liability in an orderly transaction between market participants on the measurement date. The Company’s Board of Directors (the “Board”) has adopted valuation procedures for security valuation under which fair valuation responsibilities have been delegated to PGIM Investments LLC (“PGIM Investments” or “the Manager”). Pursuant to the Board’s delegation, a Valuation Committee has been established as two persons, being one or more officers of the Company, including: the Company’s Treasurer (or the Treasurer’s direct reports); and the Company’s Chief or Deputy Chief Compliance Officer (or Vice-President-level direct reports of the Chief or Deputy Chief Compliance Officer). Under the current valuation procedures, the Valuation Committee of the Board is responsible for supervising the valuation of portfolio securities and other assets and liabilities. The valuation procedures permit the Fund to utilize independent pricing vendor services, quotations from market makers, and alternative valuation methods when market quotations are either not readily available or not deemed representative of fair value. A record of the Valuation Committee’s actions is subject to the Board’s review, approval, and ratification at its next regularly scheduled quarterly meeting.
For the fiscal reporting period-end, securities and other assets and liabilities were fair valued at the close of the last U.S. business day. Trading in certain foreign securities may occur when the NYSE is closed (including weekends and holidays). Because such foreign securities trade in markets that are open on weekends and U.S. holidays, the values of some
| | | | |
| PGIM Jennison Mid-Cap Growth Fund | | | 29 | |
Notes to Financial Statements (continued)
of the Fund’s foreign investments may change on days when investors cannot purchase or redeem Fund shares.
Various inputs determine how the Fund’s investments are valued, all of which are categorized according to the three broad levels (Level 1, 2, or 3) detailed in the Schedule of Investments.
Common and preferred stocks, exchange-traded funds, and derivative instruments, such as futures or options, that are traded on a national securities exchange are valued at the last sale price as of the close of trading on the applicable exchange where the security principally trades. Securities traded via NASDAQ are valued at the NASDAQ official closing price. To the extent these securities are valued at the last sale price or NASDAQ official closing price, they are classified as Level 1 in the fair value hierarchy. In the event that no sale or official closing price on valuation date exists, these securities are generally valued at the mean between the last reported bid and ask prices, or at the last bid price in the absence of an ask price. These securities are classified as Level 2 in the fair value hierarchy.
Investments in open-end, non-exchange-traded mutual funds are valued at their net asset values as of the close of the NYSE on the date of valuation. These securities are classified as Level 1 in the fair value hierarchy since they may be purchased or sold at their net asset values on the date of valuation.
Securities and other assets that cannot be priced according to the methods described above are valued based on pricing methodologies approved by the Board. In the event that unobservable inputs are used when determining such valuations, the securities will be classified as Level 3 in the fair value hierarchy.
When determining the fair value of securities, some of the factors influencing the valuation include: the nature of any restrictions on disposition of the securities; assessment of the general liquidity of the securities; the issuer’s financial condition and the markets in which it does business; the cost of the investment; the size of the holding and the capitalization of the issuer; the prices of any recent transactions or bids/offers for such securities or any comparable securities; any available analyst media or other reports or information deemed reliable by the Manager regarding the issuer or the markets or industry in which it operates. Using fair value to price securities may result in a value that is different from a security’s most recent closing price and from the price used by other unaffiliated mutual funds to calculate their net asset values.
Restricted and Illiquid Securities: Subject to guidelines adopted by the Board, the Fund may invest up to 15% of its net assets in illiquid securities, including those which are restricted as to disposition under securities law (“restricted securities”). Restricted securities are
valued pursuant to the valuation procedures noted above. Illiquid securities are those that, because of the absence of a readily available market or due to legal or contractual restrictions on resale, cannot be sold within seven days in the ordinary course of business at approximately the amount at which the Fund has valued the investment. Therefore, the Fund may find it difficult to sell illiquid securities at the time considered most advantageous by its Subadviser and may incur transaction costs that would not be incurred in the sale of securities that were freely marketable. Certain securities that would otherwise be considered illiquid because of legal restrictions on resale to the general public may be traded among qualified institutional buyers under Rule 144A of the Securities Act of 1933. These Rule 144A securities, as well as commercial paper that is sold in private placements under Section 4(2) of the Securities Act, may be deemed liquid by the Fund’s Subadviser under the guidelines adopted by the Board of the Company. However, the liquidity of the Fund’s investments in Rule 144A securities could be impaired if trading does not develop or declines.
Master Netting Arrangements: The Fund is subject to various Master Agreements, or netting arrangements, with select counterparties. These are agreements which a subadviser may have negotiated and entered into on behalf of the Fund. A master netting arrangement between the Fund and the counterparty permits the Fund to offset amounts payable by the Fund to the same counterparty against amounts to be received; and by the receipt of collateral from the counterparty by the Fund to cover the Fund’s exposure to the counterparty. However, there is no assurance that such mitigating factors are easily enforceable. In addition to master netting arrangements, the right to set-off exists when all the conditions are met such that each of the parties owes the other determinable amounts, the reporting party has the right to set-off the amount owed with the amount owed by the other party, the reporting party intends to set-off and the right of set-off is enforceable by law. During the reporting period, there was no intention to settle on a net basis and all amounts are presented on a gross basis on the Statement of Assets and Liabilities.
Securities Lending: The Fund may lend its portfolio securities to banks and broker-dealers. The loans are secured by collateral at least equal to the market value of the securities loaned. Collateral pledged by each borrower is invested in an affiliated money market fund and is marked to market daily, based on the previous day’s market value, such that the value of the collateral exceeds the value of the loaned securities. In the event of significant appreciation in value of securities on loan on the last business day of the reporting period, the financial statements may reflect a collateral value that is less than the market value of the loaned securities. Such shortfall is remedied as described above. Loans are subject to termination at the option of the borrower or the Fund. Upon termination of the loan, the borrower will return to the Fund securities identical to the loaned securities. Should the borrower of the securities fail financially, the Fund has the right to repurchase the securities in the open market using the collateral.
The Fund recognizes income, net of any rebate and securities lending agent fees, for lending its securities in the form of fees or interest on the investment of any cash received as collateral. The borrower receives all interest and dividends from the securities loaned and
| | | | |
| PGIM Jennison Mid-Cap Growth Fund | | | 31 | |
Notes to Financial Statements (continued)
such payments are passed back to the lender in amounts equivalent thereto. The Fund also continues to recognize any unrealized gain (loss) in the market price of the securities loaned and on the change in the value of the collateral invested that may occur during the term of the loan. In addition, realized gain (loss) is recognized on changes in the value of the collateral invested upon liquidation of the collateral. Net earnings from securities lending are disclosed on the Statement of Operations as “Income from securities lending, net”.
Equity and Mortgage Real Estate Investment Trusts (collectively REITs): The Fund invests in equity REITs, which report information on the source of their distributions annually. Based on current and historical information, a portion of distributions received from equity REITs during the period is estimated to be dividend income, capital gain or return of capital and recorded accordingly. When material, these estimates are adjusted periodically when the actual source of distributions is disclosed by the equity REITs.
Securities Transactions and Net Investment Income: Securities transactions are recorded on the trade date. Realized gains (losses) from investment and currency transactions are calculated on the specific identification method. Dividend income is recorded on the ex-date. Expenses are recorded on an accrual basis, which may require the use of certain estimates by management that may differ from actual. Net investment income or loss (other than class specific expenses and waivers, which are allocated as noted below) and unrealized and realized gains (losses) are allocated daily to each class of shares based upon the relative proportion of adjusted net assets of each class at the beginning of the day. Class specific expenses and waivers, where applicable, are charged to the respective share classes. Class specific expenses include distribution fees and distribution fee waivers, shareholder servicing fee, transfer agent’s fees and expenses, registration fees and fee waivers and/or expense reimbursements, as applicable.
Taxes: It is the Fund’s policy to continue to meet the requirements of the Internal Revenue Code applicable to regulated investment companies and to distribute all of its taxable net investment income and capital gains, if any, to its shareholders. Therefore, no federal income tax provision is required. Withholding taxes on foreign dividends, interest and capital gains, if any, are recorded, net of reclaimable amounts, at the time the related income is earned.
Dividends and Distributions: The Fund expects to pay dividends from net investment income and distributions from net realized capital gains, if any, annually. Dividends and distributions to shareholders, which are determined in accordance with federal income tax regulations and which may differ from generally accepted accounting principles, are recorded on the ex-date. Permanent book/tax differences relating to income and gain (loss) are reclassified amongst undistributed net investment income, accumulated net realized gain (loss) and paid-in capital in excess of par, as appropriate.
Estimates: The preparation of financial statements requires management to make estimates and assumptions that affect the reported amounts and disclosures in the financial statements. Actual results could differ from those estimates.
2. Agreements
The Company, on behalf of the Fund has entered into a management agreement with PGIM Investments. Pursuant to this agreement, PGIM Investments has responsibility for all investment advisory services and supervises the Subadviser’s performance of such services. In addition, under the management agreement, PGIM Investments provides all of the administrative functions necessary for the organization, operation and management of the Fund. PGIM Investments administers the corporate affairs of the Fund and, in connection therewith, furnishes the Fund with office facilities, together with those ordinary clerical and bookkeeping services which are not being furnished by, the Fund’s custodian (the Custodian), and the Fund’s transfer agent. PGIM Investments is also responsible for the staffing and management of dedicated groups of legal, marketing, compliance and related personnel necessary for the operation of the Fund. The legal, marketing, compliance and related personnel are also responsible for the management and oversight of the various service providers to the Fund, including, but not limited to, the custodian, transfer agent, and accounting agent.
PGIM Investments has entered into a subadvisory agreement with Jennison Associates LLC (“Jennison”). The subadvisory agreement provides that Jennison will furnish investment advisory services in connection with the management of the Fund. In connection therewith, Jennison is obligated to keep certain books and records of the Fund. PGIM Investments pays for the services of Jennison, the cost of compensation of officers of the Fund, occupancy and certain clerical and bookkeeping costs of the Fund. The Fund bears all other costs and expenses.
The management fee paid to PGIM Investments is accrued daily and payable monthly, at an annual rate of 0.60% of the Fund’s average daily net assets up to $1 billion and 0.55% of the average daily net assets in excess of $1 billion. The effective management fee rate before any waivers and/or expense reimbursements was 0.56% for the year ended August 31, 2018.
PGIM Investments has contractually agreed, through December 31, 2019, to limit Total Annual Fund Operating Expenses after fee waivers and/or expense reimbursements to 1.99% of average daily net assets for Class B shares. Separately, PGIM Investments has contractually agreed, through December 31, 2019, to limit transfer agency, shareholder servicing, sub-transfer agency, and blue sky fees, as applicable, to the extent that such fees cause the Total Annual Fund Operating Expenses to exceed 1.08% of average daily net assets for Class R2 shares or 0.83% of average daily net assets for Class R4 shares. The contractual waiver and expense limitation exclude interest, brokerage, taxes (such as income and foreign withholding taxes, stamp duty and deferred tax expenses), acquired fund fees and expenses, extraordinary expenses, and certain other Fund expenses such as
| | | | |
| PGIM Jennison Mid-Cap Growth Fund | | | 33 | |
Notes to Financial Statements (continued)
dividend and interest expense and broker charges on short sales. Where applicable, PGIM Investments has voluntarily agreed through August 31, 2018, to waive management fees or shared operating expenses on any share class to the same extent that it waives similar expenses on any other share class and, in addition, Total Annual Fund Operating Expenses for Class R6 shares will not exceed Total Annual Fund Operating Expenses for Class Z shares. Effective September 1, 2018 this voluntary agreement became contractual through December 31, 2019. Fees and/or expenses waived and/or reimbursed by PGIM Investments may be recouped by PGIM Investments within the same fiscal year during which such waiver and/or reimbursement is made if such recoupment can be realized without exceeding the expense limit in effect at the time of the recoupment for that fiscal year.
The Fund has a distribution agreement with Prudential Investment Management Services LLC (“PIMS”), which acts as the distributor of the Fund’s Class A, Class B, Class C, Class R, Class Z, Class R2, Class R4 and Class R6 shares. The Fund compensates PIMS for distributing and servicing the Fund’s Class A, Class B, Class C, Class R and Class R2 shares, pursuant to plans of distribution (the “Distribution Plans”), regardless of expenses actually incurred by PIMS. The distribution fees are accrued daily and payable monthly. No distribution or service fees are paid to PIMS as distributor of the Class Z, Class R4 and Class R6 shares of the Fund.
Pursuant to the Distribution Plans, the Fund compensates PIMS for distribution related activities at an annual rate of up to 0.30%, 1%, 1%, 0.75% and 0.25% of the average daily net assets of the Class A, Class B, Class C, Class R and Class R2 shares, respectively. PIMS has contractually agreed through December 31, 2019 to limit such expenses to 0.50% of the average daily net assets of the Class R shares.
The Fund has adopted a Shareholder Services Plan with respect to Class R2 and Class R4 shares. Under the terms of the Shareholder Services Plan, Class R2 and Class R4 shares are authorized to pay to Prudential Mutual Fund Services LLC (“PMFS”), its affiliates or third-party service providers, as compensation for services rendered to the shareholders of such Class R2 or Class R4 shares, a shareholder service fee at an annual rate of 0.10% of the average daily net assets attributable to Class R2 and Class R4 shares. The shareholder service fee is accrued daily and paid monthly.
PIMS has advised the Fund that it received $257,704 in front-end sales charges resulting from sales of Class A shares during the year ended August 31, 2018. From these fees, PIMS paid such sales charges to broker-dealers, which in turn paid commissions to salespersons and incurred other distribution costs.
PIMS has advised the Fund that for the year ended August 31, 2018 that it received $96, $12,166 and $2,569 in contingent deferred sales charges imposed upon redemptions by certain Class A, Class B and Class C shareholders, respectively.
PGIM Investments, PIMS and Jennison are indirect, wholly-owned subsidiaries of Prudential Financial, Inc. (“Prudential”).
3. Other Transactions with Affiliates
Prudential Mutual Fund Services LLC (“PMFS”), an affiliate of PGIM Investments and an indirect, wholly-owned subsidiary of Prudential, serves as the Fund’s transfer agent. Transfer agent’s fees and expenses in the Statement of Operations include certain out-of-pocket expenses paid to non-affiliates, where applicable.
The Fund may enter into certain securities purchase or sale transactions under Board approved Rule 17a-7 procedures. Rule 17a-7 is an exemptive rule under the 1940 Act, that, subject to certain conditions, permits purchase and sale transactions among affiliated investment companies, or between an investment company and a person that is affiliated solely by reason of having a common (or affiliated) investment adviser, common directors, and/or common officers. Such transactions are subject to ratification by the Board. For the reporting period ended August 31, 2018 no such transactions were entered into by the Fund.
The Fund may invest its overnight sweep cash in the PGIM Core Ultra Short Bond Fund (the “Core Fund”), and its securities lending cash collateral in the PGIM Institutional Money Market Fund (the “Money Market Fund”), each a series of Prudential Investment Portfolios 2, registered under the 1940 Act and managed by PGIM Investments. For the reporting period ended August 31, 2018, PGIM, Inc. was compensated $123,229 by PGIM Investments for managing the Fund’s securities lending cash collateral as subadviser to the Money Market Fund. Earnings from the Core Fund and Money Market Fund are disclosed on the Statement of Operations as “Affiliated dividend income” and “Income from securities lending, net”, respectively.
4. Portfolio Securities
The aggregate cost of purchases and proceeds from sales of portfolio securities (excluding short-term investments and U.S. Government securities) for the year ended August 31, 2018, were $2,241,908,121 and $4,807,196,433, respectively.
| | | | |
| PGIM Jennison Mid-Cap Growth Fund | | | 35 | |
Notes to Financial Statements (continued)
A summary of the cost of purchases and proceeds from sales of shares of affiliated mutual funds for the year ended August 31, 2018, is presented as follows:
| | | | | | | | | | | | | | | | | | | | | | | | | | | | | | | | |
Affiliated Mutual Funds* | | Value,
Beginning
of Year | | | Cost of
Purchases | | | Proceeds
from Sales | | | Change in
Unrealized
Gain
(Loss) | | | Realized
Gain
(Loss) | | | Value,
End of
Year | | | Shares,
End of
Year | | | Dividend
Income | |
PGIM Core Ultra Short Bond Fund | | $ | 165,486,368 | | | $ | 2,015,743,096 | | | $ | 2,139,985,858 | | | $ | — | | | $ | — | | | $ | 41,243,606 | | | | 41,243,606 | | | $ | 1,771,108 | |
PGIM Institutional Money Market Fund | | | 133,614,058 | | | | 1,454,781,234 | | | | 1,361,265,947 | | | | 5,806 | | | | 2,328 | | | | 227,137,479 | | | | 227,114,767 | | | | 238,991 | ** |
| | | | | | | | | | | | | | | | | | | | | | | | | | | | | | | | |
| | $ | 299,100,426 | | | $ | 3,470,524,330 | | | $ | 3,501,251,805 | | | $ | 5,806 | | | $ | 2,328 | | | $ | 268,381,085 | | | | | | | $ | 2,010,099 | |
| | | | | | | | | | | | | | | | | | | | | | | | | | | | | | | | |
| * | The Funds did not have any capital gain distributions during the reporting period. |
| ** | This amount is included in “Income from Securities Lending, net” on the Statement of Operations. |
5. Distributions and Tax Information
Distributions to shareholders, which are determined in accordance with federal income tax regulations and which may differ from generally accepted accounting principles, are recorded on the ex-date. In order to present undistributed net investment income, accumulated net realized gain on investment transactions and paid-in capital in excess of par on the Statement of Assets and Liabilities that more closely represent their tax character, certain adjustments have been made to undistributed net investment income, accumulated net realized gain on investment transactions and paid-in capital in excess of par. For the year ended August 31, 2018, the adjustments were to increase undistributed net investment income by $1,781,451, increase accumulated net realized gain on investment transactions by $5,201,923 and decrease paid-in capital in excess of par by $6,983,374 due to net operating losses and other book to tax differences. Net investment income (loss), net realized gain (loss) on investment transactions and net assets were not affected by this change.
For the year ended August 31, 2018, the tax character of dividends paid by the Fund were $62,705,108 of ordinary income and $777,418,797 of long-term capital gains. For the year ended August 31, 2017, the tax character of dividends paid was $444,807,734 of long-term capital gains.
As of August 31, 2018, the accumulated undistributed earnings on a tax basis was $1,049,282,977 of long-term capital gains. This differs from the amount shown on the
Statement of Assets and Liabilities primarily due to cumulative timing differences between financial and tax reporting.
The United States federal income tax basis of the Fund’s investments and the net unrealized appreciation as of August 31, 2018 were as follows:
| | | | | | |
Tax Basis | | Gross Unrealized Appreciation | | Gross Unrealized Depreciation | | Net Unrealized Appreciation |
| $3,706,487,744 | | $1,842,421,298 | | $(113,547,994) | | $1,728,873,304 |
The difference between book basis and tax basis was primarily attributable to deferred losses on wash sales and other book to tax adjustments.
Management has analyzed the Fund’s tax positions taken on federal, state and local income tax returns for all open tax years and has concluded that no provision for income tax is required in the Fund’s financial statements for the current reporting period. The Fund’s federal, state and local income and federal excise tax returns for tax years for which the applicable statutes of limitations have not expired are subject to examination by the Internal Revenue Service and state departments of revenue.
6. Capital and Ownership
The Fund offers Class A, Class B, Class C, Class R, Class Z, Class R2, Class R4 and Class R6 shares. Class A shares are sold with a front-end sales charge of 5.50%. Investors who purchase $1 million or more of Class A shares and sell these shares within 12 months of purchase are subject to a contingent deferred sales charge (“CDSC”) of 1%, although they are not subject to an initial sales charge. The Class A CDSC is waived for certain retirement and/or benefit plans. A special exchange privilege is also available for shareholders who qualified to purchase Class A shares at net asset value. Class B shares are sold with a CDSC which declines from 5% to zero depending on the period of time the shares are held. Class B shares will automatically convert to Class A shares on a quarterly basis approximately seven years after purchase. Class B shares are closed to new purchases. Class C shares are sold with a CDSC of 1% on sales made within 12 months of purchase. Class R, Class Z, Class R2, Class R4, and Class R6 shares are not subject to any sales or redemption charge and are offered exclusively for sale to a limited group of investors.
Under certain circumstances, an exchange may be made from specified share classes of the Fund to one or more other share classes of the Fund as presented in the table of transactions in shares of common stock.
There are 2 billion shares of $0.001 par value common stock authorized divided into nine classes, designated Class A, Class B, Class C, Class R6, Class R, Class Z, Class T, Class R2 and Class R4 which consists of 345 million, 5 million, 25 million, 400 million, 125 million, 800 million, 100 million, 100 million and 100 million authorized shares, respectively.
| | | | |
| PGIM Jennison Mid-Cap Growth Fund | | | 37 | |
Notes to Financial Statements (continued)
The Fund currently does not have any Class T shares outstanding.
As of August 31, 2018, Prudential, through its affiliate entities, including affiliated funds (if applicable) owned 259 Class R2 shares, 259 Class R4 shares and 227,689 Class R6 shares of the Fund. At reporting period end, five shareholders of record held 51% of the Fund’s outstanding shares.
Transactions in shares of common stock were as follows:
| | | | | | | | |
Class A | | Shares | | | Amount | |
Year ended August 31, 2018: | | | | | | | | |
Shares sold | | | 3,274,094 | | | $ | 119,826,040 | |
Shares issued in reinvestment of dividends and distributions | | | 4,653,712 | | | | 162,461,102 | |
Shares reacquired | | | (16,309,800 | ) | | | (598,436,705 | ) |
| | | | | | | | |
Net increase (decrease) in shares outstanding before conversion | | | (8,381,994 | ) | | | (316,149,563 | ) |
Shares issued upon conversion from other share class(es) | | | 282,454 | | | | 10,578,282 | |
Shares reacquired upon conversion into other share class(es) | | | (828,355 | ) | | | (30,634,838 | ) |
| | | | | | | | |
Net increase (decrease) in shares outstanding | | | (8,927,895 | ) | | $ | (336,206,119 | ) |
| | | | | | | | |
Year ended August 31, 2017: | | | | | | | | |
Shares sold | | | 8,208,920 | | | $ | 286,985,300 | |
Shares issued in reinvestment of dividends and distributions | | | 4,000,525 | | | | 134,537,656 | |
Shares reacquired | | | (22,912,054 | ) | | | (805,424,990 | ) |
| | | | | | | | |
Net increase (decrease) in shares outstanding before conversion | | | (10,702,609 | ) | | | (383,902,034 | ) |
Shares issued upon conversion from other share class(es) | | | 332,524 | | | | 11,870,890 | |
Shares reacquired upon conversion into other share class(es) | | | (20,792,609 | ) | | | (736,390,133 | ) |
| | | | | | | | |
Net increase (decrease) in shares outstanding | | | (31,162,694 | ) | | $ | (1,108,421,277 | ) |
| | | | | | | | |
Class B | | | | | | |
Year ended August 31, 2018: | | | | | | | | |
Shares sold | | | 9,196 | | | $ | 265,255 | |
Shares issued in reinvestment of dividends and distributions | | | 86,787 | | | | 2,358,008 | |
Shares reacquired | | | (114,519 | ) | | | (3,308,719 | ) |
| | | | | | | | |
Net increase (decrease) in shares outstanding before conversion | | | (18,536 | ) | | | (685,456 | ) |
Shares reacquired upon conversion into other share class(es) | | | (138,376 | ) | | | (4,119,562 | ) |
| | | | | | | | |
Net increase (decrease) in shares outstanding | | | (156,912 | ) | | $ | (4,805,018 | ) |
| | | | | | | | |
Year ended August 31, 2017: | | | | | | | | |
Shares sold | | | 24,548 | | | $ | 694,443 | |
Shares issued in reinvestment of dividends and distributions | | | 51,327 | | | | 1,402,248 | |
Shares reacquired | | | (123,949 | ) | | | (3,552,910 | ) |
| | | | | | | | |
Net increase (decrease) in shares outstanding before conversion | | | (48,074 | ) | | | (1,456,219 | ) |
Shares reacquired upon conversion into other share class(es) | | | (171,606 | ) | | | (4,984,648 | ) |
| | | | | | | | |
Net increase (decrease) in shares outstanding | | | (219,680 | ) | | $ | (6,440,867 | ) |
| | | | | | | | |
| | | | | | | | |
Class C | | Shares | | | Amount | |
Year ended August 31, 2018: | | | | | | | | |
Shares sold | | | 277,564 | | | $ | 7,890,180 | |
Shares issued in reinvestment of dividends and distributions | | | 614,490 | | | | 16,714,114 | |
Shares reacquired | | | (944,007 | ) | | | (27,356,615 | ) |
| | | | | | | | |
Net increase (decrease) in shares outstanding before conversion | | | (51,953 | ) | | | (2,752,321 | ) |
Shares reacquired upon conversion into other share class(es) | | | (238,761 | ) | | | (6,977,793 | ) |
| | | | | | | | |
Net increase (decrease) in shares outstanding | | | (290,714 | ) | | $ | (9,730,114 | ) |
| | | | | | | | |
Year ended August 31, 2017: | | | | | | | | |
Shares sold | | | 404,494 | | | $ | 11,377,283 | |
Shares issued in reinvestment of dividends and distributions | | | 313,552 | | | | 8,569,374 | |
Shares reacquired | | | (1,301,171 | ) | | | (37,339,395 | ) |
| | | | | | | | |
Net increase (decrease) in shares outstanding before conversion | | | (583,125 | ) | | | (17,392,738 | ) |
Shares reacquired upon conversion into other share class(es) | | | (554,822 | ) | | | (16,028,317 | ) |
| | | | | | | | |
Net increase (decrease) in shares outstanding | | | (1,137,947 | ) | | $ | (33,421,055 | ) |
| | | | | | | | |
Class R | | | | | | |
Year ended August 31, 2018: | | | | | | | | |
Shares sold | | | 517,595 | | | $ | 18,440,165 | |
Shares issued in reinvestment of dividends and distributions | | | 731,452 | | | | 24,679,186 | |
Shares reacquired | | | (2,103,976 | ) | | | (74,998,300 | ) |
| | | | | | | | |
Net increase (decrease) in shares outstanding before conversion | | | (854,929 | ) | | | (31,878,949 | ) |
Shares issued upon conversion from other share class(es) | | | 779 | | | | 26,180 | |
Shares reacquired upon conversion into other share class(es) | | | (64 | ) | | | (2,288 | ) |
| | | | | | | | |
Net increase (decrease) in shares outstanding | | | (854,214 | ) | | $ | (31,855,057 | ) |
| | | | | | | | |
Year ended August 31, 2017: | | | | | | | | |
Shares sold | | | 812,968 | | | $ | 27,895,369 | |
Shares issued in reinvestment of dividends and distributions | | | 428,752 | | | | 14,024,490 | |
Shares reacquired | | | (2,913,362 | ) | | | (99,689,707 | ) |
| | | | | | | | |
Net increase (decrease) in shares outstanding before conversion | | | (1,671,642 | ) | | | (57,769,848 | ) |
Shares issued upon conversion from other share class(es) | | | 787 | | | | 27,037 | |
| | | | | | | | |
Net increase (decrease) in shares outstanding | | | (1,670,855 | ) | | $ | (57,742,811 | ) |
| | | | | | | | |
Class Z | | | | | | |
Year ended August 31, 2018: | | | | | | | | |
Shares sold | | | 13,561,725 | | | $ | 538,299,892 | |
Shares issued in reinvestment of dividends and distributions | | | 10,009,992 | | | | 376,976,306 | |
Shares reacquired | | | (46,717,751 | ) | | | (1,862,959,871 | ) |
| | | | | | | | |
Net increase (decrease) in shares outstanding before conversion | | | (23,146,034 | ) | | | (947,683,673 | ) |
Shares issued upon conversion from other share class(es) | | | 822,180 | | | | 32,967,968 | |
Shares reacquired upon conversion into other share class(es) | | | (2,180,092 | ) | | | (89,333,137 | ) |
| | | | | | | | |
Net increase (decrease) in shares outstanding | | | (24,503,946 | ) | | $ | (1,004,048,842 | ) |
| | | | | | | | |
Year ended August 31, 2017: | | | | | | | | |
Shares sold | | | 16,330,266 | | | $ | 614,379,946 | |
Shares issued in reinvestment of dividends and distributions | | | 5,459,462 | | | | 195,721,717 | |
Shares reacquired | | | (43,241,765 | ) | | | (1,614,734,223 | ) |
| | | | | | | | |
Net increase (decrease) in shares outstanding before conversion | | | (21,452,037 | ) | | | (804,632,560 | ) |
Shares issued upon conversion from other share class(es) | | | 19,840,244 | | | | 749,257,358 | |
Shares reacquired upon conversion into other share class(es) | | | (16,923,509 | ) | | | (617,906,399 | ) |
| | | | | | | | |
Net increase (decrease) in shares outstanding | | | (18,535,302 | ) | | $ | (673,281,601 | ) |
| | | | | | | | |
| | | | |
| PGIM Jennison Mid-Cap Growth Fund | | | 39 | |
Notes to Financial Statements (continued)
| | | | | | | | |
Class R2 | | Shares | | | Amount | |
Period ended August 31, 2018*: | | | | | | | | |
Shares sold | | | 259 | | | $ | 10,000 | |
| | | | | | | | |
Net increase (decrease) in shares outstanding | | | 259 | | | $ | 10,000 | |
| | | | | | | | |
Year ended: | | | | | | | | |
Class R4 | | | | | | |
Period ended August 31, 2018*: | | | | | | | | |
Shares sold | | | 259 | | | $ | 10,000 | |
| | | | | | | | |
Net increase (decrease) in shares outstanding | | | 259 | | | $ | 10,000 | |
| | | | | | | | |
Year ended: | | | | | | | | |
Class R6 | | | | | | |
Year ended August 31, 2018: | | | | | | | | |
Shares sold | | | 7,714,072 | | | $ | 309,733,592 | |
Shares issued in reinvestment of dividends and distributions | | | 4,872,479 | | | | 185,543,989 | |
Shares reacquired | | | (26,345,880 | ) | | | (1,064,376,349 | ) |
| | | | | | | | |
Net increase (decrease) in shares outstanding before conversion | | | (13,759,329 | ) | | | (569,098,768 | ) |
Shares issued upon conversion from other share class(es) | | | 2,124,745 | | | | 87,754,838 | |
Shares reacquired upon conversion into other share class(es) | | | (6,498 | ) | | | (259,650 | ) |
| | | | | | | | |
Net increase (decrease) in shares outstanding | | | (11,641,082 | ) | | $ | (481,603,580 | ) |
| | | | | | | | |
Year ended August 31, 2017: | | | | | | | | |
Shares sold | | | 6,998,497 | | | $ | 264,516,657 | |
Shares issued in reinvestment of dividends and distributions | | | 1,411,436 | | | | 50,995,193 | |
Shares reacquired | | | (12,043,540 | ) | | | (457,183,707 | ) |
| | | | | | | | |
Net increase (decrease) in shares outstanding before conversion | | | (3,633,607 | ) | | | (141,671,857 | ) |
Shares issued upon conversion from other share class(es) | | | 16,716,666 | | | | 615,353,701 | |
Shares reacquired upon conversion into other share class(es) | | | (32,653 | ) | | | (1,199,489 | ) |
| | | | | | | | |
Net increase (decrease) in shares outstanding | | | 13,050,406 | | | $ | 472,482,355 | |
| | | | | | | | |
| * | Commencement of offering was December 27, 2017. |
7. Borrowings
The Company, on behalf of the Fund, along with other affiliated registered investment companies (the “Funds”), is a party to a Syndicated Credit Agreement (“SCA”) with a group of banks. The purpose of the SCA is to provide an alternative source of temporary funding for capital share redemptions. The SCA provides for a commitment of $900 million for the period October 5, 2017 through October 4, 2018. The Funds pay an annualized commitment fee of 0.15% of the unused portion of the SCA. The Fund’s portion of the commitment fee for the unused amount, allocated based upon a method approved by the Board, is accrued daily and paid quarterly. Prior to October 5, 2017, the Funds had another SCA that provided a commitment of $900 million and the Funds paid an annualized commitment fee of 0.15% of the unused portion of the SCA.
Subsequent to the reporting period end, the SCA has been renewed effective October 4, 2018 and will continue to provide a commitment of $900 million through October 3, 2019. The commitment fee paid by the Funds will continue to be 0.15% of the unused portion of the SCA. The interest on borrowings under both SCAs is paid monthly and at a per annum interest rate based upon a contractual spread plus the higher of (1) the effective federal funds rate, (2) the 1-month London Interbank Offering Rate or (3) zero percent.
Other affiliated registered investment companies that are parties to the SCA include portfolios that are subject to a predetermined mathematical formula used to manage certain benefit guarantees offered under variable annuity contracts. The formula may result in large scale asset flows into and out of these portfolios. Consequently, these portfolios may be more likely to utilize the SCA for purposes of funding redemptions. It may be possible for those portfolios to fully exhaust the committed amount of the SCA, thereby requiring the Manager to allocate available funding per a Board-approved methodology designed to treat the Funds in the SCA equitably.
The Fund utilized the SCA during the reporting period ended August 31, 2018. The average daily balance for the 3 days that the Fund had loans outstanding during the period was $5,524,000, borrowed at a weighted average interest rate of 3.35%. The maximum loan balance outstanding during the period was $7,744,000. At August 31, 2018, the Fund did not have an outstanding loan balance.
8. Other Risks
The Fund’s risks include, but are not limited to, some or all of the risks discussed below:
Risk of Investing in Real Estate Investment Trusts (REITs): Real estate securities are subject to similar risks as direct investments in real estate and mortgages, and their value will depend on the value of the underlying properties or the underlying loans or interests. The underlying loans may be subject to the risks of default or of prepayments that occur earlier or later than expected, and such loans may also include so-called “subprime” mortgages. The value of these securities will rise and fall in response to many factors, including economic conditions, the demand for rental property and interest rates. In particular, the value of these securities may decline when interest rates rise and will also be affected by the real estate market and by the management of the underlying properties.
In addition, investing in REITs involves certain unique risks in addition to those risks associated with investing in the real estate industry in general. Equity REITs may be affected by changes in the value of the underlying property owned by the REITs, while mortgage REITs may be affected by the quality of any credit extended. REITs are dependent upon management skills, may not be diversified geographically or by property/mortgage asset type, and are subject to heavy cash flow dependency, default by borrowers and self-liquidation. REITs may be more volatile and/or more illiquid than other types of equity securities. REITs (especially mortgage REITs) are subject to interest rate risks. REITs may incur significant amounts of leverage. The Fund will indirectly bear a portion of the
| | | | |
| PGIM Jennison Mid-Cap Growth Fund | | | 41 | |
Notes to Financial Statements (continued)
expenses, including management fees, paid by each REIT in which it invests, in addition to the expenses of the Fund.
Liquidity Risk: The Fund may invest in instruments that trade in lower volumes and are less liquid than other investments. Liquidity risk exists when particular investments made by the Fund are difficult to purchase or sell. Liquidity risk includes the risk that the Fund may make investments that may become less liquid in response to market developments or adverse investor perceptions. Investments that are illiquid or that trade in lower volumes may be more difficult to value. If the Fund is forced to sell these investments to pay redemption proceeds or for other reasons, the Fund may lose money. In addition, when there is no willing buyer and investments cannot be readily sold at the desired time or price, the Fund may have to accept a lower price or may not be able to sell the instrument at all. The reduction in dealer market-making capacity in the fixed-income markets that has occurred in recent years also has the potential to reduce liquidity. An inability to sell a portfolio position can adversely affect the Fund’s value or prevent the Fund from being able to take advantage of other investment opportunities.
Market and Credit Risk: Securities markets may be volatile and the market prices of the Fund’s securities may decline. Securities fluctuate in price based on changes in an issuer’s financial condition and overall market and economic conditions. If the market prices of the securities owned by the Fund fall, the value of an investment in the Fund will decline. Additionally, the Fund may also be exposed to credit risk in the event that an issuer or guarantor fails to perform or that an institution or entity with which the Fund has unsettled or open transactions defaults.
9. Recent Accounting Pronouncements and Reporting Updates
In August 2018, the FASB issued Accounting Standards Update (“ASU”) No. 2018-13, which changes certain fair value measurement disclosure requirements. The new ASU, in addition to other modifications and additions, removes the requirement to disclose the amount and reasons for transfers between Level 1 and Level 2 of the fair value hierarchy, and the policy for the timing of transfers between levels. For investment companies, the amendments are effective for financial statements issued for fiscal years beginning after December 15, 2019, and interim periods within those fiscal years. Management has evaluated the implications of certain provisions of ASU No. 2018-13 and has determined to early adopt aspects related to the removal and modification of certain fair value measurement disclosures under the ASU effective immediately. At this time, management is evaluating the implications of certain provisions of the ASU related to new disclosure requirements and any impact on the financial statement disclosures has not yet been determined.
Financial Highlights
| | | | | | | | | | | | | | | | | | | | |
| Class A Shares | |
| | | Year Ended August 31, | |
| | | 2018 | | | 2017 | | | 2016 | | | 2015 | | | 2014 | |
| Per Share Operating Performance(a): | | | | | | | | | | | | | | | | | | | | |
| Net Asset Value, Beginning of Year | | | $37.70 | | | | $34.76 | | | | $37.93 | | | | $40.94 | | | | $35.49 | |
| Income (loss) from investment operations: | | | | | | | | | | | | | | | | | | | | |
| Net investment income (loss) | | | (0.13 | ) | | | (0.08 | ) | | | (0.13 | ) | | | (0.12 | ) | | | (0.04 | ) |
| Net realized and unrealized gain (loss) on investment transactions | | | 5.66 | | | | 5.27 | | | | 0.13 | | | | 1.36 | | | | 6.49 | |
| Total from investment operations | | | 5.53 | | | | 5.19 | | | | - | (b) | | | 1.24 | | | | 6.45 | |
| Less Dividends and Distributions: | | | | | | | | | | | | | | | | | | | | |
| Distributions from net realized gains | | | (5.05 | ) | | | (2.25 | ) | | | (3.17 | ) | | | (4.25 | ) | | | (1.00 | ) |
| Net asset value, end of year | | | $38.18 | | | | $37.70 | | | | $34.76 | | | | $37.93 | | | | $40.94 | |
| Total Return(c): | | | 15.93% | | | | 15.72% | | | | 0.14% | | | | 3.07% | | | | 18.42% | |
| |
| Ratios/Supplemental Data: | |
| Net assets, end of year (000) | | | $1,153,936 | | | | $1,475,747 | | | | $2,444,209 | | | | $3,309,898 | | | | $3,760,224 | |
| Average net assets (000) | | | $1,331,811 | | | | $1,964,894 | | | | $2,840,531 | | | | $3,508,750 | | | | $3,759,607 | |
| Ratios to average net assets(d): | | | | | | | | | | | | | | | | | | | | |
| Expenses after waivers and/or expense reimbursement | | | 1.06% | | | | 1.06% | | | | 1.06% | | | | 1.05% | | | | 1.05% | |
| Expenses before waivers and/or expense reimbursement | | | 1.06% | (e) | | | 1.06% | | | | 1.06% | | | | 1.05% | | | | 1.05% | |
| Net investment income (loss) | | | (0.34)% | | | | (0.23)% | | | | (0.37)% | | | | (0.29)% | | | | (0.09)% | |
| Portfolio turnover rate(f) | | | 36% | | | | 34% | | | | 24% | | | | 45% | | | | 42% | |
| (a) | Calculated based on average shares outstanding during the year. |
| (b) | Less than $0.005 per share. |
| (c) | Total return does not consider the effects of sales loads. Total return is calculated assuming a purchase of a share on the first day and a sale on the last day of each year reported and includes reinvestment of dividends and distributions, if any. Total returns may reflect adjustments to conform to generally accepted accounting principles. |
| (d) | Does not include expenses of the underlying funds in which the Fund invests. |
| (e) | Effective September 1, 2017, class specific expenses include Transfer Agent Fees and expenses and Registration Fees, which are charged to their respective share class. |
| (f) | The Fund’s portfolio turnover rate is calculated in accordance with regulatory requirements, without regard to transactions involving short term investments and certain derivatives. If such transactions were included, the Fund’s portfolio turnover rate may be higher. |
See Notes to Financial Statements.
| | | | |
| PGIM Jennison Mid-Cap Growth Fund | | | 43 | |
Financial Highlights (continued)
| | | | | | | | | | | | | | | | | | | | |
| Class B Shares | |
| | | Year Ended August 31, | |
| | | 2018 | | | 2017 | | | 2016 | | | 2015 | | | 2014 | |
| Per Share Operating Performance(a): | | | | | | | | | | | | | | | | | | | | |
| Net Asset Value, Beginning of Year | | | $30.47 | | | | $28.71 | | | | $32.09 | | | | $35.51 | | | | $31.11 | |
| Income (loss) from investment operations: | | | | | | | | | | | | | | | | | | | | |
| Net investment income (loss) | | | (0.35 | ) | | | (0.27 | ) | | | (0.31 | ) | | | (0.34 | ) | | | (0.27 | ) |
| Net realized and unrealized gain (loss) on investment transactions | | | 4.46 | | | | 4.28 | | | | 0.10 | | | | 1.17 | | | | 5.67 | |
| Total from investment operations | | | 4.11 | | | | 4.01 | | | | (0.21 | ) | | | 0.83 | | | | 5.40 | |
| Less Dividends and Distributions: | | | | | | | | | | | | | | | | | | | | |
| Distributions from net realized gains | | | (5.05 | ) | | | (2.25 | ) | | | (3.17 | ) | | | (4.25 | ) | | | (1.00 | ) |
| Net asset value, end of year | | | $29.53 | | | | $30.47 | | | | $28.71 | | | | $32.09 | | | | $35.51 | |
| Total Return(b): | | | 14.94% | | | | 14.88% | | | | (0.53)% | | | | 2.32% | | | | 17.62% | |
| |
| Ratios/Supplemental Data: | |
| Net assets, end of year (000) | | | $12,088 | | | | $17,253 | | | | $22,560 | | | | $32,455 | | | | $39,784 | |
| Average net assets (000) | | | $14,829 | | | | $19,198 | | | | $26,408 | | | | $36,900 | | | | $41,158 | |
| Ratios to average net assets(c): | | | | | | | | | | | | | | | | | | | | |
| Expenses after waivers and/or expense reimbursement | | | 1.94% | | | | 1.76% | | | | 1.76% | | | | 1.75% | | | | 1.76% | |
| Expenses before waivers and/or expense reimbursement | | | 1.94% | (d) | | | 1.76% | | | | 1.76% | | | | 1.75% | | | | 1.76% | |
| Net investment income (loss) | | | (1.22)% | | | | (0.94)% | | | | (1.07)% | | | | (0.99)% | | | | (0.80)% | |
| Portfolio turnover rate(e) | | | 36% | | | | 34% | | | | 24% | | | | 45% | | | | 42% | |
| (a) | Calculated based on average shares outstanding during the year. |
| (b) | Total return does not consider the effects of sales loads. Total return is calculated assuming a purchase of a share on the first day and a sale on the last day of each year reported and includes reinvestment of dividends and distributions, if any. Total returns may reflect adjustments to conform to generally accepted accounting principles. |
| (c) | Does not include expenses of the underlying funds in which the Fund invests. |
| (d) | Effective September 1, 2017, class specific expenses include Transfer Agent Fees and expenses and Registration Fees, which are charged to their respective share class. |
| (e) | The Fund’s portfolio turnover rate is calculated in accordance with regulatory requirements, without regard to transactions involving short term investments and certain derivatives. If such transactions were included, the Fund’s portfolio turnover rate may be higher. |
See Notes to Financial Statements.
| | | | | | | | | | | | | | | | | | | | |
| Class C Shares | |
| | | Year Ended August 31, | |
| | | 2018 | | | 2017 | | | 2016 | | | 2015 | | | 2014 | |
| Per Share Operating Performance(a): | | | | | | | | | | | | | | | | | | | | |
| Net Asset Value, Beginning of Year | | | $30.48 | | | | $28.71 | | | | $32.10 | | | | $35.51 | | | | $31.12 | |
| Income (loss) from investment operations: | | | | | | | | | | | | | | | | | | | | |
| Net investment income (loss) | | | (0.28 | ) | | | (0.27 | ) | | | (0.31 | ) | | | (0.34 | ) | | | (0.27 | ) |
| Net realized and unrealized gain (loss) on investment transactions | | | 4.46 | | | | 4.29 | | | | 0.09 | | | | 1.18 | | | | 5.66 | |
| Total from investment operations | | | 4.18 | | | | 4.02 | | | | (0.22 | ) | | | 0.84 | | | | 5.39 | |
| Less Dividends and Distributions: | | | | | | | | | | | | | | | | | | | | |
| Distributions from net realized gains | | | (5.05 | ) | | | (2.25 | ) | | | (3.17 | ) | | | (4.25 | ) | | | (1.00 | ) |
| Net asset value, end of year | | | $29.61 | | | | $30.48 | | | | $28.71 | | | | $32.10 | | | | $35.51 | |
| Total Return(b): | | | 15.19% | | | | 14.91% | | | | (0.57)% | | | | 2.35% | | | | 17.59% | |
| |
| Ratios/Supplemental Data: | |
| Net assets, end of year (000) | | | $114,841 | | | | $127,048 | | | | $152,365 | | | | $190,609 | | | | $215,599 | |
| Average net assets (000) | | | $121,294 | | | | $137,699 | | | | $165,788 | | | | $209,566 | | | | $220,173 | |
| Ratios to average net assets(c): | | | | | | | | | | | | | | | | | | | | |
| Expenses after waivers and/or expense reimbursement | | | 1.69% | | | | 1.76% | | | | 1.76% | | | | 1.75% | | | | 1.76% | |
| Expenses before waivers and/or expense reimbursement | | | 1.69% | (d) | | | 1.76% | | | | 1.76% | | | | 1.75% | | | | 1.76% | |
| Net investment income (loss) | | | (0.98)% | | | | (0.93)% | | | | (1.07)% | | | | (1.00)% | | | | (0.80)% | |
| Portfolio turnover rate(e) | | | 36% | | | | 34% | | | | 24% | | | | 45% | | | | 42% | |
| (a) | Calculated based on average shares outstanding during the year. |
| (b) | Total return does not consider the effects of sales loads. Total return is calculated assuming a purchase of a share on the first day and a sale on the last day of each year reported and includes reinvestment of dividends and distributions, if any. Total returns may reflect adjustments to conform to generally accepted accounting principles. |
| (c) | Does not include expenses of the underlying funds in which the Fund invests. |
| (d) | Effective September 1, 2017, class specific expenses include Transfer Agent Fees and expenses and Registration Fees, which are charged to their respective share class. |
| (e) | The Fund’s portfolio turnover rate is calculated in accordance with regulatory requirements, without regard to transactions involving short term investments and certain derivatives. If such transactions were included, the Fund’s portfolio turnover rate may be higher. |
See Notes to Financial Statements.
| | | | |
| PGIM Jennison Mid-Cap Growth Fund | | | 45 | |
Financial Highlights (continued)
| | | | | | | | | | | | | | | | | | | | |
| Class R Shares | |
| | | Year Ended August 31, | |
| | | 2018 | | | 2017 | | | 2016 | | | 2015 | | | 2014 | |
| Per Share Operating Performance(a): | | | | | | | | | | | | | | | | | | | | |
| Net Asset Value, Beginning of Year | | | $36.61 | | | | $33.89 | | | | $37.13 | | | | $40.23 | | | | $34.96 | |
| Income (loss) from investment operations: | | | | | | | | | | | | | | | | | | | | |
| Net investment income (loss) | | | (0.19 | ) | | | (0.15 | ) | | | (0.19 | ) | | | (0.19 | ) | | | (0.12 | ) |
| Net realized and unrealized gain (loss) on investment transactions | | | 5.48 | | | | 5.12 | | | | 0.12 | | | | 1.34 | | | | 6.39 | |
| Total from investment operations | | | 5.29 | | | | 4.97 | | | | (0.07 | ) | | | 1.15 | | | | 6.27 | |
| Less Dividends and Distributions: | | | | | | | | | | | | | | | | | | | | |
| Distributions from net realized gains | | | (5.05 | ) | | | (2.25 | ) | | | (3.17 | ) | | | (4.25 | ) | | | (1.00 | ) |
| Net asset value, end of year | | | $36.85 | | | | $36.61 | | | | $33.89 | | | | $37.13 | | | | $40.23 | |
| Total Return(b): | | | 15.73% | | | | 15.46% | | | | (0.05)% | | | | 2.89% | | | | 18.18% | |
| |
| Ratios/Supplemental Data: | |
| Net assets, end of year (000) | | | $167,650 | | | | $197,803 | | | | $239,720 | | | | $324,329 | | | | $375,174 | |
| Average net assets (000) | | | $186,452 | | | | $215,521 | | | | $272,878 | | | | $361,697 | | | | $383,032 | |
| Ratios to average net assets(c): | | | | | | | | | | | | | | | | | | | | |
| Expenses after waivers and/or expense reimbursement | | | 1.24% | | | | 1.26% | | | | 1.26% | | | | 1.25% | | | | 1.26% | |
| Expenses before waivers and/or expense reimbursement | | | 1.49% | (d) | | | 1.51% | | | | 1.51% | | | | 1.50% | | | | 1.51% | |
| Net investment income (loss) | | | (0.52)% | | | | (0.43)% | | | | (0.57)% | | | | (0.50)% | | | | (0.30)% | |
| Portfolio turnover rate(e) | | | 36% | | | | 34% | | | | 24% | | | | 45% | | | | 42% | |
| (a) | Calculated based on average shares outstanding during the year. |
| (b) | Total return is calculated assuming a purchase of a share on the first day and a sale on the last day of each year reported, and includes reinvestment of dividends and distributions, if any. Total returns may reflect adjustments to conform to generally accepted accounting principles. |
| (c) | Does not include expenses of the underlying funds in which the Fund invests. |
| (d) | Effective September 1, 2017, class specific expenses include Transfer Agent Fees and expenses and Registration Fees, which are charged to their respective share class. |
| (e) | The Fund’s portfolio turnover rate is calculated in accordance with regulatory requirements, without regard to transactions involving short term investments and certain derivatives. If such transactions were included, the Fund’s portfolio turnover rate may be higher. |
See Notes to Financial Statements.
| | | | | | | | | | | | | | | | | | | | |
| Class Z Shares | |
| | | Year Ended August 31, | |
| | | 2018 | | | 2017 | | | 2016 | | | 2015 | | | 2014 | |
| Per Share Operating Performance(a): | | | | | | | | | | | | | | | | | | | | |
| Net Asset Value, Beginning of Year | | | $40.26 | | | | $36.87 | | | | $39.93 | | | | $42.76 | | | | $36.92 | |
| Income (loss) from investment operations: | | | | | | | | | | | | | | | | | | | | |
| Net investment income (loss) | | | (0.03 | ) | | | 0.02 | | | | (0.03 | ) | | | - | (b) | | | 0.08 | |
| Net realized and unrealized gain (loss) on investment transactions | | | 6.09 | | | | 5.62 | | | | 0.14 | | | | 1.42 | | | | 6.76 | |
| Total from investment operations | | | 6.06 | | | | 5.64 | | | | 0.11 | | | | 1.42 | | | | 6.84 | |
| Less Dividends and Distributions: | | | | | | | | | | | | | | | | | | | | |
| Distributions from net realized gains | | | (5.05 | ) | | | (2.25 | ) | | | (3.17 | ) | | | (4.25 | ) | | | (1.00 | ) |
| Net asset value, end of year | | | $41.27 | | | | $40.26 | | | | $36.87 | | | | $39.93 | | | | $42.76 | |
| Total Return(c): | | | 16.26% | | | | 16.05% | | | | 0.43% | | | | 3.38% | | | | 18.77% | |
| |
| Ratios/Supplemental Data: | |
| Net assets, end of year (000) | | | $2,599,235 | | | | $3,522,414 | | | | $3,909,489 | | | | $4,805,518 | | | | $5,157,002 | |
| Average net assets (000) | | | $3,091,013 | | | | $3,529,158 | | | | $4,229,836 | | | | $5,173,326 | | | | $4,850,885 | |
| Ratios to average net assets(d): | | | | | | | | | | | | | | | | | | | | |
| Expenses after waivers and/or expense reimbursement | | | 0.80% | | | | 0.76% | | | | 0.76% | | | | 0.75% | | | | 0.77% | |
| Expenses before waivers and/or expense reimbursement | | | 0.80% | (e) | | | 0.76% | | | | 0.76% | | | | 0.75% | | | | 0.77% | |
| Net investment income (loss) | | | (0.08)% | | | | 0.07% | | | | (0.07)% | | | | -% | (f) | | | 0.19% | |
| Portfolio turnover rate(g) | | | 36% | | | | 34% | | | | 24% | | | | 45% | | | | 42% | |
| (a) | Calculated based on average shares outstanding during the year. |
| (b) | Less than $0.005 per share. |
| (c) | Total return is calculated assuming a purchase of a share on the first day and a sale on the last day of each year reported, and includes reinvestment of dividends and distributions, if any. Total returns may reflect adjustments to conform to generally accepted accounting principles. |
| (d) | Does not include expenses of the underlying funds in which the Fund invests. |
| (e) | Effective September 1, 2017, class specific expenses include Transfer Agent Fees and expenses and Registration Fees, which are charged to their respective share class. |
| (g) | The Fund’s portfolio turnover rate is calculated in accordance with regulatory requirements, without regard to transactions involving short term investments and certain derivatives. If such transactions were included, the Fund’s portfolio turnover rate may be higher. |
See Notes to Financial Statements.
| | | | |
| PGIM Jennison Mid-Cap Growth Fund | | | 47 | |
Financial Highlights (continued)
| | | | |
| Class R2 Shares | |
| | | December 27, 2017(a) through August 31, 2018 | |
| Per Share Operating Performance(b): | | | | |
| Net Asset Value, Beginning of Period | | | $38.58 | |
| Income (loss) from investment operations: | | | | |
| Net investment income (loss) | | | (0.11 | ) |
| Net realized and unrealized gain (loss) on investment transactions | | | 3.18 | |
| Total from investment operations | | | 3.07 | |
| Net asset value, end of period | | | $41.65 | |
| Total Return(c): | | | 7.96% | |
| |
| Ratios/Supplemental Data: | | | |
| Net assets, end of period (000) | | | $11 | |
| Average net assets (000) | | | $10 | |
| Ratios to average net assets(d): | | | | |
| Expenses after waivers and/or expense reimbursement | | | 1.08% | (e) |
| Expenses before waivers and/or expense reimbursement | | | 244.89% | (e) |
| Net investment income (loss) | | | (0.39)% | (e) |
| Portfolio turnover rate(f) | | | 36% | |
| (a) | Commencement of offering. |
| (b) | Calculated based on average shares outstanding during the period. |
| (c) | Total return is calculated assuming a purchase of a share on the first day and a sale on the last day of each period reported and includes reinvestment of dividends and distributions, if any. Total returns may reflect adjustments to conform to generally accepted accounting principles. Total returns for periods less than one full year are not annualized. |
| (d) | Does not include expenses of the underlying funds in which the Fund invests. |
| (f) | The Fund’s portfolio turnover rate is calculated in accordance with regulatory requirements, without regard to transactions involving short term investments and certain derivatives. If such transactions were included, the Fund’s portfolio turnover rate may be higher. |
See Notes to Financial Statements.
| | | | |
| Class R4 Shares | |
| | | December 27, 2017(a) through August 31, 2018 | |
| Per Share Operating Performance(b): | | | | |
| Net Asset Value, Beginning of Period | | | $38.58 | |
| Income (loss) from investment operations: | | | | |
| Net investment income (loss) | | | (0.04 | ) |
| Net realized and unrealized gain (loss) on investment transactions | | | 3.18 | |
| Total from investment operations | | | 3.14 | |
| Net asset value, end of period | | | $41.72 | |
| Total Return(c): | | | 8.14% | |
| |
| Ratios/Supplemental Data: | | | |
| Net assets, end of period (000) | | | $11 | |
| Average net assets (000) | | | $10 | |
| Ratios to average net assets(d): | | | | |
| Expenses after waivers and/or expense reimbursement | | | 0.83% | (e) |
| Expenses before waivers and/or expense reimbursement | | | 244.44% | (e) |
| Net investment income (loss) | | | (0.14)% | (e) |
| Portfolio turnover rate(f) | | | 36% | |
| (a) | Commencement of offering. |
| (b) | Calculated based on average shares outstanding during the period. |
| (c) | Total return is calculated assuming a purchase of a share on the first day and a sale on the last day of each period reported and includes reinvestment of dividends and distributions, if any. Total returns may reflect adjustments to conform to generally accepted accounting principles. Total returns for periods less than one full year are not annualized. |
| (d) | Does not include expenses of the underlying funds in which the Fund invests. |
| (f) | The Fund’s portfolio turnover rate is calculated in accordance with regulatory requirements, without regard to transactions involving short term investments and certain derivatives. If such transactions were included, the Fund’s portfolio turnover rate may be higher. |
See Notes to Financial Statements.
| | | | |
| PGIM Jennison Mid-Cap Growth Fund | | | 49 | |
Financial Highlights (continued)
| | | | | | | | | | | | | | | | | | | | |
| Class R6 Shares | |
| | | Year Ended August 31, | |
| | | 2018 | | | 2017 | | | 2016 | | | 2015 | | | 2014 | |
| Per Share Operating Performance(a): | | | | | | | | | | | | | | | | | | | | |
| Net Asset Value, Beginning of Year | | | $40.63 | | | | $37.13 | | | | $40.13 | | | | $42.89 | | | | $36.95 | |
| Income (loss) from investment operations: | | | | | | | | | | | | | | | | | | | | |
| Net investment income (loss) | | | 0.06 | | | | 0.09 | | | | 0.04 | | | | 0.06 | | | | 0.15 | |
| Net realized and unrealized gain (loss) on investment transactions | | | 6.16 | | | | 5.66 | | | | 0.13 | | | | 1.43 | | | | 6.79 | |
| Total from investment operations | | | 6.22 | | | | 5.75 | | | | 0.17 | | | | 1.49 | | | | 6.94 | |
| Less Dividends and Distributions: | | | | | | | | | | | | | | | | | | | | |
| Distributions from net realized gains | | | (5.05 | ) | | | (2.25 | ) | | | (3.17 | ) | | | (4.25 | ) | | | (1.00 | ) |
| Net asset value, end of year | | | $41.80 | | | | $40.63 | | | | $37.13 | | | | $40.13 | | | | $42.89 | |
| Total Return(b): | | | 16.53% | | | | 16.24% | | | | 0.58% | | | | 3.55% | | | | 19.03% | |
| |
| Ratios/Supplemental Data: | |
| Net assets, end of year (000) | | | $1,144,170 | | | | $1,585,340 | | | | $964,093 | | | | $904,800 | | | | $676,208 | |
| Average net assets (000) | | | $1,584,359 | | | | $1,307,593 | | | | $914,522 | | | | $794,215 | | | | $569,472 | |
| Ratios to average net assets(c): | | | | | | | | | | | | | | | | | | | | |
| Expenses after waivers and/or expense reimbursement | | | 0.58% | | | | 0.58% | | | | 0.58% | | | | 0.58% | | | | 0.58% | |
| Expenses before waivers and/or expense reimbursement | | | 0.58% | (d) | | | 0.58% | | | | 0.58% | | | | 0.58% | | | | 0.58% | |
| Net investment income (loss) | | | 0.15% | | | | 0.25% | | | | 0.10% | | | | 0.15% | | | | 0.38% | |
| Portfolio turnover rate(e) | | | 36% | | | | 34% | | | | 24% | | | | 45% | | | | 42% | |
| (a) | Calculated based on average shares outstanding during the year. |
| (b) | Total return is calculated assuming a purchase of a share on the first day and a sale on the last day of each year reported, and includes reinvestment of dividends and distributions, if any. Total returns may reflect adjustments to conform to generally accepted accounting principles. |
| (c) | Does not include expenses of the underlying funds in which the Fund invests. |
| (d) | Effective September 1, 2017, class specific expenses include Transfer Agent Fees and expenses and Registration Fees, which are charged to their respective share class. |
| (e) | The Fund’s portfolio turnover rate is calculated in accordance with regulatory requirements, without regard to transactions involving short term investments and certain derivatives. If such transactions were included, the Fund’s portfolio turnover rate may be higher. |
See Notes to Financial Statements.
Report of Independent Registered Public Accounting Firm
The Board of Directors and Shareholders
Prudential Jennison Mid-Cap Growth Fund, Inc.:
Opinion on the Financial Statements
We have audited the accompanying statement of assets and liabilities of PGIM Jennison Mid-Cap Growth Fund (formerly Prudential Jennison Mid-Cap Growth Fund, Inc.) (the Fund), a series of Prudential Jennison Mid-Cap Growth Fund, Inc., including the schedule of investments, as of August 31, 2018, the related statement of operations for the year then ended, the statements of changes in net assets for each of the years in the two-year period ended August 31, 2018, and the related notes (collectively, the financial statements) and the financial highlights for the years or periods indicated therein. In our opinion, the financial statements and financial highlights present fairly, in all material respects, the financial position of the Fund as of August 31, 2018, the results of its operations for the year then ended, the changes in its net assets for each of the years in the two-year period ended August 31, 2018, and the financial highlights for the years or periods indicated therein, in conformity with U.S. generally accepted accounting principles.
Basis for Opinion
These financial statements and financial highlights are the responsibility of the Fund’s management. Our responsibility is to express an opinion on these financial statements and financial highlights based on our audits. We are a public accounting firm registered with the Public Company Accounting Oversight Board (United States) (“PCAOB”) and are required to be independent with respect to the Fund in accordance with the U.S. federal securities laws and the applicable rules and regulations of the Securities and Exchange Commission and the PCAOB.
We conducted our audits in accordance with the standards of the PCAOB. Those standards require that we plan and perform the audit to obtain reasonable assurance about whether the financial statements and financial highlights are free of material misstatement, whether due to error or fraud. Our audits included performing procedures to assess the risks of material misstatement of the financial statements and financial highlights, whether due to error or fraud, and performing procedures that respond to those risks. Such procedures included examining, on a test basis, evidence regarding the amounts and disclosures in the financial statements and financial highlights. Such procedures also included confirmation of securities owned as of August 31, 2018, by correspondence with the custodians, transfer agents and brokers or by other appropriate auditing procedures when replies from brokers were not received. Our audits also included evaluating the accounting principles used and significant estimates made by management, as well as evaluating the overall presentation of the financial statements and financial highlights. We believe that our audits provide a reasonable basis for our opinion.

We have served as the auditor of one or more PGIM and/or Prudential Retail investment companies since 2003.
New York, New York
October 16, 2018
| | | | |
| PGIM Jennison Mid-Cap Growth Fund | | | 51 | |
Tax Information (unaudited)
We are advising you that during the year ended August 31, 2018, the Fund reports the maximum amount allowed per share, but not less than $4.67 for Class A, B, C, R, Z, and R6 shares as a capital gain distribution in accordance with Section 852(b)(3)(C) of the Internal Revenue Code.
For the year ended August 31, 2018, the Fund reports, in accordance with Section 854 of the Internal Revenue Code, the following percentages of the ordinary income dividends paid as 1) qualified dividend income (QDI); and 2) eligible for corporate dividends received deduction (DRD).
| | | | |
| | | QDI | | DRD |
PGIM Jennison Mid-Cap Growth Fund | | 79.51% | | 80.88% |
In January 2019, you will be advised on IRS Form 1099-DIV or substitute 1099-DIV as to the federal tax status of the distributions received by you in calendar year 2018.
INFORMATION ABOUT BOARD MEMBERS AND OFFICERS
(Unaudited)
Information about Board Members and Officers of the Fund is set forth below. Board Members who are not deemed to be “interested persons” of the Fund, as defined in the 1940 Act, are referred to as “Independent Board Members.” Board Members who are deemed to be “interested persons” of the Fund are referred to as “Interested Board Members.” The Board Members are responsible for the overall supervision of the operations of the Fund and perform the various duties imposed on the directors of investment companies by the 1940 Act. The Board in turn elects the Officers, who are responsible for administering the day-to-day operations of the Fund.
| | | | | | |
| Independent Board Members |
Name, Address, Age Position(s) Portfolios Overseen | | Principal Occupation(s) During Past Five Years | | Other Directorships Held During Past Five Years | | Length of Board Service |
Ellen S. Alberding (60) Board Member Portfolios Overseen: 91 | | President and Board Member, The Joyce Foundation (charitable foundation) (since 2002); Vice Chair, City Colleges of Chicago (community college system) (2011-2015); Trustee, National Park Foundation (charitable foundation for national park system) (2009-2018); Trustee, Economic Club of Chicago (since 2009); Trustee, Loyola University (since 2018). | | None. | | Since September 2013 |
Kevin J. Bannon (66) Board Member Portfolios Overseen: 91 | | Retired; Managing Director (April 2008-May 2015) and Chief Investment Officer (October 2008-November 2013) of Highmount Capital LLC (registered investment adviser); formerly Executive Vice President and Chief Investment Officer (April 1993-August 2007) of Bank of New York Company; President (May 2003-May 2007) of BNY Hamilton Family of Mutual Funds. | | Director of Urstadt Biddle Properties (equity real estate investment trust) (since September 2008). | | Since July 2008 |
Linda W. Bynoe (66) Board Member Portfolios Overseen: 91 | | President and Chief Executive Officer (since March 1995) and formerly Chief Operating Officer (December 1989-February 1995) of Telemat Ltd. (management consulting); formerly Vice President (January 1985-June 1989) at Morgan Stanley & Co. (broker-dealer). | | Director of Anixter International, Inc. (communication products distributor) (since January 2006); Director of Northern Trust Corporation (financial services) (since April 2006); Trustee of Equity Residential (residential real estate) (since December 2009). | | Since March 2005 |
PGIM Jennison Mid-Cap Growth Fund
| | | | | | |
| Independent Board Members |
Name, Address, Age Position(s) Portfolios Overseen | | Principal Occupation(s) During Past Five Years | | Other Directorships Held During Past Five Years | | Length of Board Service |
Barry H. Evans (57) Board Member Portfolios Overseen: 90 | | Retired; formerly President (2005-2016), Global Chief Operating Officer (2014-2016), Chief Investment Officer-Global Head of Fixed Income (1998-2014), and various portfolio manager roles (1986-2006), Manulife Asset Management U.S. | | Director, Manulife Trust Company (since 2011); formerly Director, Manulife Asset Management Limited (2015-2017); formerly Chairman of the Board of Directors of Manulife Asset Management U.S. (2005-2016); formerly Chairman of the Board, Declaration Investment Management and Research (2008-2016). | | Since September 2017 |
Keith F. Hartstein (62) Board Member & Independent Chair Portfolios Overseen: 91 | | Retired; Member (since November 2014) of the Governing Council of the Independent Directors Council (organization of independent mutual fund directors); formerly President and Chief Executive Officer (2005-2012), Senior Vice President (2004-2005), Senior Vice President of Sales and Marketing (1997-2004), and various executive management positions (1990-1997), John Hancock Funds, LLC (asset management); Chairman, Investment Company Institute’s Sales Force Marketing Committee (2003-2008). | | None. | | Since September 2013 |
Visit our website at pgiminvestments.com
| | | | | | |
| Independent Board Members |
Name, Address, Age Position(s) Portfolios Overseen | | Principal Occupation(s) During Past Five Years | | Other Directorships Held During Past Five Years | | Length of Board Service |
Laurie Simon Hodrick (56) Board Member Portfolios Overseen: 90 | | A. Barton Hepburn Professor Emerita of Economics in the Faculty of Business, Columbia Business School (since 2018); Visiting Professor of Law, Stanford Law School (since 2015); Visiting Fellow at the Hoover Institution, Stanford University (since 2015); Sole Member, ReidCourt LLC (since 2008) (a consulting firm); formerly A. Barton Hepburn Professor of Economics in the Faculty of Business, Columbia Business School (1996-2017); formerly Managing Director, Global Head of Alternative Investment Strategies, Deutsche Bank (2006-2008); Independent Director Kabbage, Inc. (since July 2018) (financial services). | | Independent Director, Corporate Capital Trust (since April 2017) (a business development company); Independent Director, Kabbage, Inc. (since July 2018) (financial services). | | Since September 2017 |
Michael S. Hyland, CFA (73) Board Member Portfolios Overseen: 91 | | Retired (since February 2005); formerly Senior Managing Director (July 2001-February 2005) of Bear Stearns & Co, Inc.; Global Partner, INVESCO (1999-2001); Managing Director and President of Salomon Brothers Asset Management (1989-1999). | | None. | | Since July 2008 |
Richard A. Redeker (75) Board Member Portfolios Overseen: 91 | | Retired Mutual Fund Senior Executive (50 years); Management Consultant; Director, Mutual Fund Directors Forum (since 2014); Independent Directors Council (organization of independent mutual fund directors)-Executive Committee, Chair of Policy Steering Committee, Governing Council. | | None. | | Since October 1993 |
PGIM Jennison Mid-Cap Growth Fund
| | | | | | |
| Independent Board Members |
Name, Address, Age Position(s) Portfolios Overseen | | Principal Occupation(s) During Past Five Years | | Other Directorships Held During Past Five Years | | Length of Board Service |
Brian K. Reid (56)# Board Member Portfolios Overseen: 90 | | Retired; formerly Chief Economist for the Investment Company Institute (ICI) (2005-2017); formerly Senior Economist and Director of Industry and Financial Analysis at the ICI (1998-2004); formerly Senior Economist, Industry and Financial Analysis at the ICI (1996-1998); formerly Staff Economist at the Federal Reserve Board (1989-1996); Director, ICI Mutual Insurance Company (2012-2017). | | None. | | Since March 2018 |
| # | Mr. Reid joined the Board effective as of March 1, 2018. |
| | | | | | |
| Interested Board Members |
Name, Address, Age Position(s) Portfolios Overseen | | Principal Occupation(s) During Past Five Years | | Other Directorships Held During Past Five Years | | Length of Board Service |
Stuart S. Parker (56) Board Member & President Portfolios Overseen: 91 | | President of PGIM Investments LLC (formerly known as Prudential Investments LLC) (since January 2012); Executive Vice President of Prudential Investment Management Services LLC (since December 2012); formerly Executive Vice President of Jennison Associates LLC and Head of Retail Distribution of PGIM Investments LLC (June 2005-December 2011). | | None. | | Since January 2012 |
Visit our website at pgiminvestments.com
| | | | | | |
| Interested Board Members |
Name, Address, Age Position(s) Portfolios Overseen | | Principal Occupation(s) During Past Five Years | | Other Directorships Held During Past Five Years | | Length of Board Service |
Scott E. Benjamin (45) Board Member & Vice President Portfolios Overseen: 91 | | Executive Vice President (since June 2009) of PGIM Investments LLC; Executive Vice President (June 2009-June 2012) and Vice President (since June 2012) of Prudential Investment Management Services LLC; Executive Vice President (since September 2009) of AST Investment Services, Inc.; Senior Vice President of Product Development and Marketing, PGIM Investments (since February 2006); formerly Vice President of Product Development and Product Management, PGIM Investments LLC (2003-2006). | | None. | | Since March 2010 |
Grace C. Torres* (59) Board Member Portfolios Overseen: 90 | | Retired; formerly Treasurer and Principal Financial and Accounting Officer of the PGIM Funds, Target Funds, Advanced Series Trust, Prudential Variable Contract Accounts and The Prudential Series Fund (1998-June 2014); Assistant Treasurer (March 1999-June 2014) and Senior Vice President (September 1999-June 2014) of PGIM Investments LLC; Assistant Treasurer (May 2003-June 2014) and Vice President (June 2005-June 2014) of AST Investment Services, Inc.; Senior Vice President and Assistant Treasurer (May 2003-June 2014) of Prudential Annuities Advisory Services, Inc. | | Formerly Director (July 2015-January 2018) of Sun Bancorp, Inc. N.A. and Sun National Bank; Director (since January 2018) of OceanFirst Financial Corp. and OceanFirst Bank. | | Since November 2014 |
| * | Note: Prior to her retirement in 2014, Ms. Torres was employed by PGIM Investments LLC. Due to her prior employment, she is considered to be an “interested person” under the 1940 Act. Ms. Torres is a Non-Management Interested Board Member. |
PGIM Jennison Mid-Cap Growth Fund
| | | | |
| Fund Officers(a) |
Name, Address and Age Position with Fund | | Principal Occupation(s) During Past Five Years | | Length of Service as Fund Officer |
| Raymond A. O’Hara (63) Chief Legal Officer | | Vice President and Corporate Counsel (since July 2010) of Prudential Insurance Company of America (Prudential); Vice President (March 2011-Present) of Pruco Life Insurance Company and Pruco Life Insurance Company of New Jersey; Vice President and Corporate Counsel (March 2011-Present) of Prudential Annuities Life Assurance Corporation; Chief Legal Officer of PGIM Investments LLC (since June 2012); Chief Legal Officer of Prudential Mutual Fund Services LLC (since June 2012) and Corporate Counsel of AST Investment Services, Inc. (since June 2012); formerly Assistant Vice President and Corporate Counsel (September 2008-July 2010) of The Hartford Financial Services Group, Inc.; formerly Associate (September 1980-December 1987) and Partner (January 1988-August 2008) of Blazzard & Hasenauer, P.C. (formerly, Blazzard, Grodd & Hasenauer, P.C.). | | Since June 2012 |
Chad A. Earnst (43) Chief Compliance Officer | | Chief Compliance Officer (September 2014-Present) of PGIM Investments LLC; Chief Compliance Officer (September 2014-Present) of the PGIM Funds, Target Funds, Advanced Series Trust, The Prudential Series Fund, Prudential’s Gibraltar Fund, Inc., PGIM Global Short Duration High Yield Income Fund, Inc., PGIM Short Duration High Yield Fund, Inc. and PGIM Jennison MLP Income Fund, Inc.; formerly Assistant Director (March 2010-August 2014) of the Asset Management Unit, Division of Enforcement, US Securities & Exchange Commission; Assistant Regional Director (January 2010-August 2014), Branch Chief (June 2006-December 2009) and Senior Counsel (April 2003-May 2006) of the Miami Regional Office, Division of Enforcement, US Securities & Exchange Commission. | | Since September 2014 |
Dino Capasso (44) Deputy Chief Compliance Officer | | Vice President and Deputy Chief Compliance Officer (June 2017-Present) of PGIM Investments LLC; formerly, Senior Vice President and Senior Counsel (January 2016-June 2017), and Vice President and Counsel (February 2012-December 2015) of Pacific Investment Management Company LLC. | | Since March 2018 |
| Deborah A. Docs (60) Secretary | | Vice President and Corporate Counsel (since January 2001) of Prudential; Vice President (since December 1996) and Assistant Secretary (since March 1999) of PGIM Investments LLC; formerly Vice President and Assistant Secretary (May 2003-June 2005) of AST Investment Services, Inc. | | Since May 2004 |
| Jonathan D. Shain (60) Assistant Secretary | | Vice President and Corporate Counsel (since August 1998) of Prudential; Vice President and Assistant Secretary (since May 2001) of PGIM Investments LLC; Vice President and Assistant Secretary (since February 2001) of Prudential Mutual Fund Services LLC; formerly Vice President and Assistant Secretary (May 2003-June 2005) of AST Investment Services, Inc. | | Since May 2005 |
Visit our website at pgiminvestments.com
| | | | |
| Fund Officers(a) |
Name, Address and Age Position with Fund | | Principal Occupation(s) During Past Five Years | | Length of Service as Fund Officer |
| Claudia DiGiacomo (44) Assistant Secretary | | Vice President and Corporate Counsel (since January 2005) of Prudential; Vice President and Assistant Secretary of PGIM Investments LLC (since December 2005); formerly Associate at Sidley Austin Brown & Wood LLP (1999-2004). | | Since December 2005 |
| Andrew R. French (55) Assistant Secretary | | Vice President and Corporate Counsel (since February 2010) of Prudential; formerly Director and Corporate Counsel (2006-2010) of Prudential; Vice President and Assistant Secretary (since January 2007) of PGIM Investments LLC; Vice President and Assistant Secretary (since January 2007) of Prudential Mutual Fund Services LLC. | | Since October 2006 |
| Charles H. Smith (45) Anti-Money Laundering Compliance Officer | | Vice President, Corporate Compliance, Anti-Money Laundering Unit (since January 2015) of Prudential; committee member of the American Council of Life Insurers Anti-Money Laundering and Critical Infrastructure Committee (since January 2016); formerly Global Head of Economic Sanctions Compliance at AIG Property Casualty (February 2007-December 2014); Assistant Attorney General at the New York State Attorney General’s Office, Division of Public Advocacy. (August 1998-January 2007). | | Since January 2017 |
Brian D. Nee (52) Treasurer and Principal Financial and Accounting Officer | | Vice President and Head of Finance of PGIM Investments LLC (since August 2015) and PGIM Global Partners (since February 2017); formerly, Vice President, Treasurer’s Department of Prudential (September 2007-August 2015). | | Since July 2018 |
Peter Parrella (60) Assistant Treasurer | | Vice President (since 2007) and Director (2004-2007) within Prudential Mutual Fund Administration; formerly Tax Manager at SSB Citi Fund Management LLC (1997-2004). | | Since June 2007 |
Lana Lomuti (51) Assistant Treasurer | | Vice President (since 2007) and Director (2005-2007), within Prudential Mutual Fund Administration; formerly Assistant Treasurer (December 2007-February 2014) of The Greater China Fund, Inc. | | Since April 2014 |
Linda McMullin (57) Assistant Treasurer | | Vice President (since 2011) and Director (2008-2011) within Prudential Mutual Fund Administration. | | Since April 2014 |
Kelly A. Coyne (50) Assistant Treasurer | | Director, Investment Operations of Prudential Mutual Fund Services LLC (since 2010). | | Since March 2015 |
PGIM Jennison Mid-Cap Growth Fund
| (a) | Excludes Mr. Parker and Mr. Benjamin, interested Board Members who also serve as President and Vice President, respectively. |
Explanatory Notes to Tables:
| • | | Board Members are deemed to be “Interested,” as defined in the 1940 Act, by reason of their affiliation with PGIM Investments LLC and/or an affiliate of PGIM Investments LLC. |
| • | | Unless otherwise noted, the address of all Board Members and Officers is c/o PGIM Investments LLC, 655 Broad Street, Newark, New Jersey 07102-4410. |
| • | | There is no set term of office for Board Members or Officers. The Board Members have adopted a retirement policy, which calls for the retirement of Board Members on December 31 of the year in which they reach the age of 75. |
| • | | “Other Directorships Held” includes only directorships of companies required to register or file reports with the SEC under the 1934 Act (that is, “public companies”) or other investment companies registered under the 1940 Act. |
| • | | “Portfolios Overseen” includes all investment companies managed by PGIM Investments LLC. The investment companies for which PGIM Investments LLC serves as manager include the PGIM Funds, The Prudential Variable Contract Accounts, PGIM ETF Trust, PGIM Short Duration High Yield Fund, Inc., PGIM Global Short Duration High Yield Fund, Inc., The Prudential Series Fund, Prudential’s Gibraltar Fund, Inc. and the Advanced Series Trust. |
Visit our website at pgiminvestments.com
Approval of Advisory Agreements (unaudited)
The Fund’s Board of Directors
The Board of Directors (the “Board”) of PGIM Jennison Mid-Cap Growth Fund (the “Fund”)1 consists of twelve individuals, nine of whom are not “interested persons” of the Fund, as defined in the Investment Company Act of 1940, as amended (the “1940 Act”) (the “Independent Directors”). The Board is responsible for the oversight of the Fund and its operations, and performs the various duties imposed on the directors of investment companies by the 1940 Act. The Independent Directors have retained independent legal counsel to assist them in connection with their duties. The Chair of the Board is an Independent Director. The Board has established four standing committees: the Audit Committee, the Nominating and Governance Committee, and two Investment Committees. Each committee is chaired by, and composed of, Independent Directors.
Annual Approval of the Fund’s Advisory Agreements
As required under the 1940 Act, the Board determines annually whether to renew the Fund’s management agreement with PGIM Investments LLC (“PGIM Investments”) and the Fund’s subadvisory agreement with Jennison Associates LLC (“Jennison”). In considering the renewal of the agreements, the Board, including all of the Independent Directors, met on June 7, 2018 and on June 19-21, 2018 and approved the renewal of the agreements through July 31, 2019, after concluding that the renewal of the agreements was in the best interests of the Fund and its shareholders.
In advance of the meetings, the Board requested and received materials relating to the agreements, and had the opportunity to ask questions and request further information in connection with its consideration. Among other things, the Board considered comparative fee information from PGIM Investments and Jennison. Also, the Board considered comparisons with other mutual funds in relevant Peer Universes and Peer Groups, as is further discussed below.
In approving the agreements, the Board, including the Independent Directors advised by independent legal counsel, considered the factors it deemed relevant, including the nature, quality and extent of services provided by PGIM Investments and the subadviser, the performance of the Fund, the profitability of PGIM Investments and its affiliates, expenses and fees, and the potential for economies of scale that may be shared with the Fund and its shareholders as the Fund’s assets grow. In their deliberations, the Directors did not identify any single factor which alone was responsible for the Board’s decision to approve the agreements with respect to the Fund. In connection with its deliberations, the Board considered information provided by PGIM Investments throughout the year at regular Board meetings, presentations from portfolio managers and other information, as well as
| 1 | PGIM Jennison Mid-Cap Growth Fund is the sole series of Prudential Jennison Mid-Cap Growth Fund, Inc. |
| | |
| PGIM Jennison Mid-Cap Growth Fund |
Approval of Advisory Agreements (continued)
information furnished at or in advance of the meetings on June 7, 2018 and on June 19-21, 2018.
The Directors determined that the overall arrangements between the Fund and PGIM Investments, which serves as the Fund’s investment manager pursuant to a management agreement, and between PGIM Investments and Jennison, which serves as the Fund’s subadviser pursuant to the terms of a subadvisory agreement with PGIM Investments, are in the best interests of the Fund and its shareholders in light of the services performed, fees charged and such other matters as the Directors considered relevant in the exercise of their business judgment.
The material factors and conclusions that formed the basis for the Directors’ reaching their determinations to approve the continuance of the agreements are separately discussed below.
Nature, Quality and Extent of Services
The Board received and considered information regarding the nature, quality and extent of services provided to the Fund by PGIM Investments and Jennison. The Board considered the services provided by PGIM Investments, including but not limited to the oversight of the subadviser for the Fund, as well as the provision of fund recordkeeping, compliance, and other services to the Fund. With respect to PGIM Investments’ oversight of the subadviser, the Board noted that PGIM Investments’ Strategic Investment Research Group (“SIRG”), which is a business unit of PGIM Investments, is responsible for monitoring and reporting to PGIM Investments’ senior management on the performance and operations of the subadviser. The Board also considered that PGIM Investments pays the salaries of all of the officers and interested Directors of the Fund who are part of Fund management. The Board also considered the investment subadvisory services provided by Jennison, including investment research and security selection, as well as adherence to the Fund’s investment restrictions and compliance with applicable Fund policies and procedures. The Board considered PGIM Investments’ evaluation of the subadviser, as well as PGIM Investments’ recommendation, based on its review of the subadviser, to renew the subadvisory agreement.
The Board considered the qualifications, backgrounds and responsibilities of PGIM Investments’ senior management responsible for the oversight of the Fund and Jennison, and also considered the qualifications, backgrounds and responsibilities of Jennison’s portfolio managers who are responsible for the day-to-day management of the Fund’s portfolio. The Board was provided with information pertaining to PGIM Investments’ and Jennison’s organizational structure, senior management, investment operations, and other relevant information pertaining to both PGIM Investments and Jennison. The Board also noted that it received favorable compliance reports from the Fund’s Chief Compliance
| | |
| Visit our website at pgiminvestments.com | | |
Officer (“CCO”) as to both PGIM Investments and Jennison. The Board noted that Jennison is affiliated with PGIM Investments.
The Board concluded that it was satisfied with the nature, extent and quality of the investment management services provided by PGIM Investments and the subadvisory services provided to the Fund by Jennison, and that there was a reasonable basis on which to conclude that the Fund benefits from the services provided by PGIM Investments and Jennison under the management and subadvisory agreements.
Costs of Services and Profits Realized by PGIM Investments
The Board was provided with information on the profitability of PGIM Investments and its affiliates in serving as the Fund’s investment manager. The Board discussed with PGIM Investments the methodology utilized in assembling the information regarding profitability and considered its reasonableness. The Board recognized that it is difficult to make comparisons of profitability from fund management contracts because comparative information is not generally publicly available and is affected by numerous factors, including the structure of the particular adviser, the types of funds it manages, its business mix, numerous assumptions regarding allocations and the adviser’s capital structure and cost of capital. Taking these factors into account, the Board concluded that the profitability of PGIM Investments and its affiliates in relation to the services rendered was not unreasonable.
Economies of Scale
The Board received and discussed information concerning economies of scale that PGIM Investments may realize as the Fund’s assets grow beyond current levels. The Board noted that the management fee schedule for the Fund includes breakpoints, which have the effect of decreasing the fee rate as assets increase. During the course of time, the Board has considered information regarding the launch date of the Fund, the management fees of the Fund compared to those of similarly managed funds and PGIM Investments’ investment in the Fund over time. The Board noted that economies of scale can be shared with the Fund in other ways, including low management fees from inception, additional technological and personnel investments to enhance shareholder services, and maintaining existing expense structures in the face of a rising cost environment. The Board also considered PGIM Investments’ assertion that it continually evaluates the management fee schedule of the Fund and the potential to share economies of scale through breakpoints or fee waivers as asset levels increase.
The Board recognized the inherent limitations of any analysis of economies of scale, stemming largely from the Board’s understanding that most of PGIM Investments’ costs are not specific to individual funds, but rather are incurred across a variety of products and services.
| | |
| PGIM Jennison Mid-Cap Growth Fund |
Approval of Advisory Agreements (continued)
Other Benefits to PGIM Investments and Jennison
The Board considered potential ancillary benefits that might be received by PGIM Investments, Jennison and their affiliates as a result of their relationship with the Fund. The Board concluded that potential benefits to be derived by PGIM Investments included transfer agency fees received by the Fund’s transfer agent (which is affiliated with PGIM Investments), as well as benefits to its reputation or other intangible benefits resulting from PGIM Investments’ association with the Fund. The Board concluded that the potential benefits to be derived by Jennison included its ability to use soft dollar credits, as well as the potential benefits consistent with those generally resulting from an increase in assets under management, specifically, potential access to additional research resources and benefits to its reputation. The Board concluded that the benefits derived by PGIM Investments and Jennison were consistent with the types of benefits generally derived by investment managers and subadvisers to mutual funds.
Performance of the Fund / Fees and Expenses
The Board considered certain additional specific factors and made related conclusions relating to the historical performance of the Fund for the one-, three-, five- and ten-year periods ended December 31, 2017.
The Board also considered the Fund’s actual management fee, as well as the Fund’s net total expense ratio, for the fiscal year ended August 31, 2017. The Board considered the management fee for the Fund as compared to the management fee charged by PGIM Investments to other funds and the fee charged by other advisers to comparable mutual funds in a Peer Group. The actual management fee represents the fee rate actually paid by Fund shareholders and includes any fee waivers or reimbursements. The net total expense ratio for the Fund represents the actual expense ratio incurred by Fund shareholders.
The mutual funds included in the Peer Universe, which was used to consider performance, and the Peer Group, which was used to consider fees and expenses, were objectively determined by Broadridge, an independent provider of mutual fund data. In certain circumstances, PGIM Investments also may have provided supplemental Peer Universe or Peer Group information for reasons addressed with the Board. The comparisons placed the Fund in various quartiles, with the first quartile being the best 25% of the mutual funds (for performance, the best performing mutual funds and, for expenses, the lowest cost mutual funds).
The section below summarizes key factors considered by the Board and the Board’s conclusions regarding the Fund’s performance, fees and overall expenses. The table sets forth gross performance comparisons (which do not reflect the impact on performance of fund expenses, or any subsidies, expense caps or waivers that may be applicable) with the
| | |
| Visit our website at pgiminvestments.com | | |
Peer Universe, actual management fees with the Peer Group (which reflect the impact of any subsidies or fee waivers), and net total expenses with the Peer Group, each of which were key factors considered by the Board.
| | | | | | | | |
Gross
Performance | | 1 Year | | 3 Years | | 5 Years | | 10 Years |
| | 4th Quartile | | 4th Quartile | | 4th Quartile | | 2nd Quartile |
| Actual Management Fees: 1st Quartile |
| Net Total Expenses: 1st Quartile |
| | • | | The Board noted that the Fund outperformed its benchmark index over the ten-year period, though it underperformed over the other periods. |
| | • | | The Board considered that the Fund experienced strong absolute returns over all rolling periods. |
| | • | | The Board also considered PGIM Investments’ assertion that, due to its lower risk posture compared with its benchmark index and its Peer Universe, the Fund typically does well during market downturns, when volatility rises and investors reward safety and quality. In this regard, the Board noted that during periods of negative market returns and moderate market returns, the Fund outperformed its Peer Universe 88% of the time and 77% of the time, respectively, from September 1, 2005 (inception of current portfolio management team) to April 30, 2018. |
| | ��� | | The Board and PGIM Investments agreed to retain the existing contractual expense cap, which (exclusive of certain fees and expenses) caps the operating expenses of the Fund’s Class B shares at 1.99% through December 31, 2019. |
| | • | | The Board and PGIM Investments also agreed to retain the existing expense cap, which (exclusive of certain fees and expenses) limits transfer agency, shareholder servicing, sub-transfer agency and blue sky fees to the extent that such fees cause total annual fund operating expenses to exceed 1.08% for Class R2 shares and 0.83% for Class R4 shares through December 31, 2019. |
| | • | | The Board concluded that, in light of the above, it would be in the best interests of the Fund and its shareholders to renew the agreements. |
| | • | | The Board concluded that the management fees (including subadvisory fees) and total expenses were reasonable in light of the services provided. |
* * *
After full consideration of these factors, the Board concluded that the approval of the agreements was in the best interests of the Fund and its shareholders.
| | |
| PGIM Jennison Mid-Cap Growth Fund |
| | | | |
| ∎ MAIL | | ∎ TELEPHONE | | ∎ WEBSITE |
655 Broad Street Newark, NJ 07102 | | (800) 225-1852 | | www.pgiminvestments.com |
|
| PROXY VOTING |
| The Board of Directors of the Fund has delegated to the Fund’s investment subadviser the responsibility for voting any proxies and maintaining proxy recordkeeping with respect to the Fund. A description of these proxy voting policies and procedures is available without charge, upon request, by calling (800) 225-1852. Information regarding how the Fund voted proxies relating to portfolio securities during the most recent 12-month period ended June 30 is available on the Fund’s website and on the Securities and Exchange Commission’s website. |
|
| DIRECTORS |
| Ellen S. Alberding • Kevin J. Bannon • Scott E. Benjamin • Linda W. Bynoe • Barry H. Evans • Keith F. Hartstein • Laurie Simon Hodrick • Michael S. Hyland • Stuart S. Parker • Richard A. Redeker • Brian K. Reid • Grace C. Torres |
|
| OFFICERS |
| Stuart S. Parker, President • Scott E. Benjamin, Vice President • Brian D. Nee, Treasurer and Principal Financial and Accounting Officer • Raymond A. O’Hara, Chief Legal Officer • Deborah A. Docs, Secretary • Chad A. Earnst, Chief Compliance Officer • Dino Capasso, Vice President and Deputy Chief Compliance Officer • Charles H. Smith, Anti-Money Laundering Compliance Officer • Jonathan D. Shain, Assistant Secretary • Claudia DiGiacomo, Assistant Secretary • Andrew R. French, Assistant Secretary • Peter Parrella, Assistant Treasurer • Lana Lomuti, Assistant Treasurer • Linda McMullin, Assistant Treasurer • Kelly A. Coyne, Assistant Treasurer |
| | | | |
| MANAGER | | PGIM Investments LLC | | 655 Broad Street
Newark, NJ 07102 |
|
| INVESTMENT SUBADVISER | | Jennison Associates LLC | | 466 Lexington Avenue
New York, NY 10017 |
|
| DISTRIBUTOR | | Prudential Investment
Management Services LLC | | 655 Broad Street
Newark, NJ 07102 |
|
| CUSTODIAN | | The Bank of New York Mellon | | 225 Liberty Street
New York, NY 10286 |
|
| TRANSFER AGENT | | Prudential Mutual Fund
Services LLC | | PO Box 9658
Providence, RI 02940 |
|
| INDEPENDENT REGISTERED PUBLIC ACCOUNTING FIRM | | KPMG LLP | | 345 Park Avenue
New York, NY 10154 |
|
| FUND COUNSEL | | Willkie Farr & Gallagher LLP | | 787 Seventh Avenue
New York, NY 10019 |
|
|
| An investor should consider the investment objectives, risks, charges, and expenses of the Fund carefully before investing. The prospectus and summary prospectus contain this and other information about the Fund. An investor may obtain a prospectus and summary prospectus by visiting our website at www.pgiminvestments.com or by calling (800) 225-1852. The prospectus and summary prospectus should be read carefully before investing. |
|
| E-DELIVERY |
| To receive your mutual fund documents online, go to www.pgiminvestments.com/edelivery and enroll. Instead of receiving printed documents by mail, you will receive notification via email when new materials are available. You can cancel your enrollment or change your email address at any time by visiting the website address above. |
|
| SHAREHOLDER COMMUNICATIONS WITH DIRECTORS |
| Shareholders can communicate directly with the Board of Directors by writing to the Chair of the Board, PGIM Jennison Mid-Cap Growth Fund, PGIM Investments, Attn: Board of Directors, 655 Broad Street, Newark, NJ 07102. Shareholders can communicate directly with an individual Director by writing to the same address. Communications are not screened before being delivered to the addressee. |
|
| AVAILABILITY OF PORTFOLIO SCHEDULE |
| The Fund files its complete schedule of portfolio holdings with the Securities and Exchange Commission for the first and third quarters of each fiscal year on Form N-Q. The Fund’s Forms N-Q are available on the Commission’s website at www.sec.gov. The Fund’s Forms N-Q may also be reviewed and copied at the Commission’s Public Reference Room in Washington, D.C. Information on the operation and location of the Public Reference Room may be obtained by calling 1-800-SEC-0330. The Fund’s schedule of portfolio holdings is also available on the Fund’s website as of the end of each month no sooner than 15 days after the end of the month. |
|
| The Fund’s Statement of Additional Information contains additional information about the Fund’s Directors and is available without charge, upon request, by calling (800) 225-1852. |
Mutual Funds:
| | | | |
| ARE NOT INSURED BY THE FDIC OR ANY FEDERAL GOVERNMENT AGENCY | | MAY LOSE VALUE | | ARE NOT A DEPOSIT OF OR GUARANTEED
BY ANY BANK OR ANY BANK AFFILIATE |
PGIM JENNISON MID-CAP GROWTH FUND
| | | | | | | | | | | | | | | | | | |
| | | SHARE CLASS | | A | | B | | C | | R | | Z | | R2 | | R4 | | R6* |
| | NASDAQ | | PEEAX | | PEEBX | | PEGCX | | JDERX | | PEGZX | | PEGEX | | PEGGX | | PJGQX |
| | CUSIP | | 74441C105 | | 74441C204 | | 74441C303 | | 74441C600 | | 74441C808 | | 74441C865 | | 74441C857 | | 74441C881 |
* Formerly known as Class Q shares.
MF173E
Item 2 – Code of Ethics – – See Exhibit (a)
As of the end of the period covered by this report, the registrant has adopted a code of ethics (the “Section 406 Standards for Investment Companies – Ethical Standards for Principal Executive and Financial Officers”) that applies to the registrant’s Principal Executive Officer and Principal Financial Officer; the registrant’s Principal Financial Officer also serves as the Principal Accounting Officer.
The registrant hereby undertakes to provide any person, without charge, upon request, a copy of the code of ethics. To request a copy of the code of ethics, contact the registrant 800-225-1852, and ask for a copy of the Section 406 Standards for Investment Companies - Ethical Standards for Principal Executive and Financial Officers.
Item 3 – Audit Committee Financial Expert –
The registrant’s Board has determined that Mr. Kevin J. Bannon, member of the Board’s Audit Committee is an “audit committee financial expert,” and that he is “independent,” for purposes of this Item.
Item 4 – Principal Accountant Fees and Services –
(a) Audit Fees
For the fiscal years ended August 31, 2018 and August 31, 2017, KPMG LLP (“KPMG”), the Registrant’s principal accountant, billed the Registrant $28,812 and $23,576 respectively, for professional services rendered for the audit of the Registrant’s annual financial statements or services that are normally provided in connection with statutory and regulatory filings.
(b) Audit-Related Fees
For the fiscal years ended August 31, 2018 and August 31, 2017: none.
(c) Tax Fees
For the fiscal years ended August 31, 2018 and August 31, 2017: none.
(d) All Other Fees
For the fiscal years ended August 31, 2018 and August 31, 2017: none.
(e) (1) Audit Committee Pre-Approval Policies and Procedures
THE PRUDENTIAL MUTUAL FUNDS
AUDIT COMMITTEE POLICY
on
Pre-Approval of Services Provided by the Independent Accountants
The Audit Committee of each Prudential Mutual Fund is charged with the responsibility to monitor the independence of the Fund’s independent accountants. As part of this responsibility, the Audit Committee must pre-approve the independent accounting firm’s engagement to render audit and/or permissible non-audit services, as required by law. In evaluating a proposed engagement of the independent accountants, the Audit Committee will assess the effect that the engagement might reasonably be expected to have on the accountant’s independence. The Committee’s evaluation will be based on:
| | • | | a review of the nature of the professional services expected to be provided, |
| | • | | a review of the safeguards put into place by the accounting firm to safeguard independence, and |
| | • | | periodic meetings with the accounting firm. |
Policy for Audit and Non-Audit Services Provided to the Funds
On an annual basis, the scope of audits for each Fund, audit fees and expenses, and audit-related and non-audit services (and fees proposed in respect thereof) proposed to be performed by the Fund’s independent accountants will be presented by the Treasurer and the independent accountants to the Audit Committee for review and, as appropriate, approval prior to the initiation of such services. Such presentation shall be accompanied by confirmation by both the Treasurer and the independent accountants that the proposed non-audit services will not adversely affect the independence of the independent accountants. Such proposed non-audit services shall be described in sufficient detail to enable the Audit Committee to assess the appropriateness of such services and fees, and the compatibility of the provision of such services with the auditor’s independence. The Committee shall receive periodic reports on the progress of the audit and other services which are approved by the Committee or by the Committee Chair pursuant to authority delegated in this Policy.
The categories of services enumerated under “Audit Services”, “Audit-related Services”, and “Tax Services” are intended to provide guidance to the Treasurer and the independent accountants as to those categories of services which the Committee believes are generally consistent with the independence of the independent accountants and which the Committee (or the Committee Chair) would expect upon the presentation of specific proposals to pre-approve. The enumerated categories are not intended as an exclusive list of audit, audit-related or tax services, which the Committee (or the Committee Chair) would consider for pre-approval.
Audit Services
The following categories of audit services are considered to be consistent with the role of the Fund’s independent accountants:
| | Ø | Annual Fund financial statement audits |
| | Ø | Seed audits (related to new product filings, as required) |
| | Ø | SEC and regulatory filings and consents |
Audit-related Services
The following categories of audit-related services are considered to be consistent with the role of the Fund’s independent accountants:
| | Ø | Accounting consultations |
| | Ø | Fund merger support services |
| | Ø | Agreed Upon Procedure Reports |
| | Ø | Other Internal Control Reports |
Individual audit-related services that fall within one of these categories (except for fund merger support services) and are not presented to the Audit Committee as part of the annual pre-approval process are subject to an authorized pre-approval by the Audit Committee so long as the estimated fee for those services does not exceed $30,000. Any services provided under such pre-approval will be reported to the Audit Committee at its next regular meeting. Should the amount of such services exceed $30,000 any additional fees will be subject to pre-approval by the Committee Chair (or any other Committee member on whom this responsibility has been delegated). Fees related to fund merger support services are subject to a separate authorized pre-approval by the Audit Committee with fees determined on a per occurrence and merger complexity basis.
Tax Services
The following categories of tax services are considered to be consistent with the role of the Fund’s independent accountants:
| | Ø | Tax compliance services related to the filing or amendment of the following: |
| | ◾ | Federal, state and local income tax compliance; and, |
| | ◾ | Sales and use tax compliance |
| | Ø | Timely RIC qualification reviews |
| | Ø | Tax distribution analysis and planning |
| | Ø | Tax authority examination services |
| | Ø | Tax appeals support services |
| | Ø | Accounting methods studies |
| | Ø | Fund merger support services |
| | Ø | Tax consulting services and related projects |
Individual tax services that fall within one of these categories and are not presented to the Audit Committee as part of the annual pre-approval process are subject to an authorized pre-approval by the Audit Committee so long as the estimated fee for those services does not exceed $30,000. Any services provided under such pre-approval will be reported to the Audit Committee at its next regular meeting. Should the amount of such services exceed $30,000 any additional fees will be subject to pre-approval by the Committee Chair (or any other Committee member on whom this responsibility has been delegated).
Other Non-Audit Services
Certain non-audit services that the independent accountants are legally permitted to render will be subject to pre-approval by the Committee or by one or more Committee members to whom the Committee has delegated this authority and who will report to the full Committee any pre-approval decisions made pursuant to this Policy. Non-audit services presented for pre-approval pursuant to this paragraph will be accompanied by a confirmation from both the Treasurer and the independent accountants that the proposed services will not adversely affect the independence of the independent accountants.
Proscribed Services
The Fund’s independent accountants will not render services in the following categories of non-audit services:
| | Ø | Bookkeeping or other services related to the accounting records or financial statements of the Fund |
| | Ø | Financial information systems design and implementation |
| | Ø | Appraisal or valuation services, fairness opinions, or contribution-in-kind reports |
| | Ø | Internal audit outsourcing services |
| | Ø | Management functions or human resources |
| | Ø | Broker or dealer, investment adviser, or investment banking services |
| | Ø | Legal services and expert services unrelated to the audit |
| | Ø | Any other service that the Public Company Accounting Oversight Board determines, by regulation, is impermissible. |
Pre-approval of Non-Audit Services Provided to Other Entities Within the Prudential Fund Complex
Certain non-audit services provided to PGIM Investments LLC or any of its affiliates that also provide ongoing services to the Prudential Mutual Funds will be subject to pre-approval by the Audit Committee. The only non-audit services provided to these entities that will require pre-approval are those related directly to the operations and financial reporting of the Funds. Individual projects that are not presented to the Audit Committee as part of the annual pre-approval process will be subject to pre-approval by the Committee Chair (or any other Committee member on whom this responsibility has been delegated) so long as the estimated fee for those services does not exceed $30,000. Services presented for pre-approval pursuant to this paragraph will be accompanied by a confirmation from both the Treasurer and the independent accountants that the proposed services will not adversely affect the independence of the independent accountants.
Although the Audit Committee will not pre-approve all services provided to PGIM Investments LLC and its affiliates, the Committee will receive an annual report from the Fund’s independent accounting firm showing the aggregate fees for all services provided to PGIM Investments and its affiliates.
(e) (2) Percentage of services referred to in 4(b) – 4(d) that were approved by the audit committee –
For the fiscal years ended August 31, 2018 and August 31, 2017: none.
|
(f) Percentage of hours expended attributable to work performed by other than full time employees of principal accountant if greater than 50%. |
The percentage of hours expended on the principal accountant’s engagement to audit the registrant’s financial statements for the most recent fiscal year that were attributed to work performed by persons other than the principal accountant’s full-time, permanent employees was 0%.
(g) Non-Audit Fees
The aggregate non-audit fees billed by KPMG for services rendered to the registrant’s investment adviser and any entity controlling, controlled by, or under common control with the investment adviser that provides ongoing services to the registrant for the fiscal years ended August 31, 2018 and August 31, 2017 was $0 and $0, respectively.
(h) Principal Accountant’s Independence
Not applicable as KPMG has not provided non-audit services to the registrant’s investment adviser and any entity controlling, controlled by, or under common control with the investment adviser that provides ongoing services to the registrant that were not pre-approved pursuant to Rule 2-01(c)(7)(ii) of Regulation S-X.
| Item 5 – | Audit Committee of Listed Registrants – Not applicable. |
| Item 6 – | Schedule of Investments – The schedule is included as part of the report to shareholders filed under Item 1 of this Form. |
| Item 7 – | Disclosure of Proxy Voting Policies and Procedures for Closed-End Management Investment Companies – Not applicable. |
| Item 8 – | Portfolio Managers of Closed-End Management Investment Companies – Not applicable. |
| Item 9 – | Purchases of Equity Securities by Closed-End Management Investment Company and Affiliated Purchasers – Not applicable. |
Item 10 – Submission of Matters to a Vote of Security Holders – Not applicable.
Item 11 – Controls and Procedures
| | (a) | It is the conclusion of the registrant’s principal executive officer and principal financial officer that the effectiveness of the registrant’s current disclosure controls and procedures (such disclosure controls and procedures having been evaluated within 90 days of the date of this filing) provide reasonable assurance that the information required to be disclosed by the registrant has been recorded, processed, summarized and reported within the time period specified in the Commission’s rules and forms and that the information required to be disclosed by the registrant has been accumulated and communicated to the registrant’s principal executive officer and principal financial officer in order to allow timely decisions regarding required disclosure. |
| | (b) | There has been no significant change in the registrant’s internal control over financial reporting that occurred during the registrant’s most recent fiscal quarter of the period covered by this report that has materially affected, or is likely to materially affect, the registrant’s internal control over financial reporting. |
Item 12 – Exhibits
| | (a) (1) | Code of Ethics – Attached hereto as Exhibit EX-99.CODE-ETH |
| | (2) | Certifications pursuant to Section 302 of the Sarbanes-Oxley Act – Attached hereto as Exhibit EX-99.CERT. |
| | (3) | Any written solicitation to purchase securities under Rule 23c-1. – Not applicable. |
| | (b) | Certifications pursuant to Section 906 of the Sarbanes-Oxley Act – Attached hereto as Exhibit EX-99.906CERT. |
SIGNATURES
Pursuant to the requirements of the Securities Exchange Act of 1934 and the Investment Company Act of 1940, the registrant has duly caused this report to be signed on its behalf by the undersigned, thereunto duly authorized.
| | |
| Registrant: | | Prudential Jennison Mid-Cap Growth Fund, Inc. |
| |
| By: | | /s/ Deborah A. Docs |
| | Deborah A. Docs |
| | Secretary |
| |
| Date: | | October 16, 2018 |
Pursuant to the requirements of the Securities Exchange Act of 1934 and the Investment Company Act of 1940, this report has been signed below by the following persons on behalf of the registrant and in the capacities and on the dates indicated.
| | |
| By: | | /s/ Stuart S. Parker |
| | Stuart S. Parker |
| | | President and Principal Executive Officer |
| |
| Date: | | October 16, 2018 |
| |
| By: | | /s/ Brian D. Nee |
| | Brian D. Nee |
| | Treasurer and Principal Financial and Accounting Officer |
| |
| Date: | | October 16, 2018 |