UNITED STATES
SECURITIES AND EXCHANGE COMMISSION
Washington, D.C. 20549
CERTIFIED SHAREHOLDER REPORT OF REGISTERED MANAGEMENT INVESTMENT COMPANIES
| | |
| Investment Company Act file number: | | 811-07811 |
| |
| Exact name of registrant as specified in charter: | | Prudential Jennison Mid-Cap Growth Fund, Inc. |
| |
| Address of principal executive offices: | | 655 Broad Street, 6 th Floor |
| | Newark, New Jersey 07102 |
| |
| Name and address of agent for service: | | Andrew R. French |
| | 655 Broad Street, 6 th Floor |
| | Newark, New Jersey 07102 |
| |
| Registrant’s telephone number, including area code: | | |
| |
| Date of fiscal year end: | | 8/31/2024 |
| |
| Date of reporting period: | | 8/31/2024 |
Item 1 – Reports to Stockholders
| | (a) | Report transmitted to stockholders pursuant to Rule 30e-1 under the Act (17 CFR 270.30e-1). |
PGIM Jennison Mid-Cap Growth Fund
ANNUAL SHAREHOLDER REPORT – August 31, 2024
This annual shareholder report contains important information about the Class A shares of PGIM Jennison Mid-Cap Growth Fund (the “Fund”) for
the period of September 1, 2023 to August 31, 2024.
You can find additional information about the Fund at
pgim.com/investments/mutual-funds/prospectuses-fact-sheets
. You can also request
this information by contacting us at (800) 225-1852 or (973) 367-3529 from outside the US.
This report describes changes to the Fund that occurred during the reporting period.
WHAT WERE THE FUND COSTS FOR THE LAST YEAR?
(Based on a hypothetical $10,000 investment)
| Costs of a $10,000 investment | Costs paid as a percentage of a $10,000 investment |
PGIM Jennison Mid-Cap Growth Fund—Class A | | |
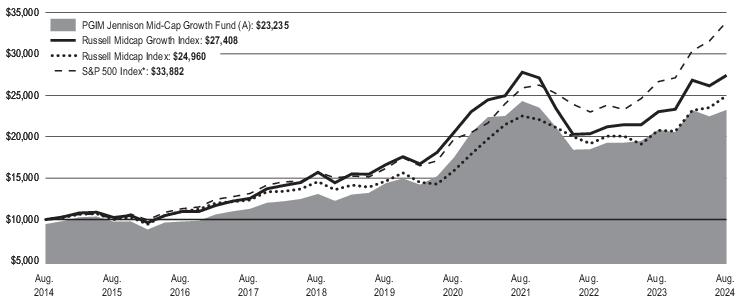
WHAT AFFECTED THE FUND’S PERFORMANCE DURING THE REPORTING PERIOD?
■
During the reporting period, equities generally posted solid results driven by enthusiasm regarding generative artificial intelligence, the end to
US Federal Reserve interest rate hikes, and continued growth in the US economy. Mid-cap stocks, as represented by the Russell Midcap Index,
performed well in aggregate but trailed the large-cap S&P 500 Index.
■
Security selection within the consumer sectors, especially specialty retail and food products, added the most to the Fund’s performance relative
to the Index. The Fund’s overweights in real estate and information technology and its underweight in healthcare also bolstered relative results.
■
Stock selection within healthcare (especially biotechnology), information technology (primarily due to software), and industrials (weighed down
by professional services) were primary sources of weakness relative to the Index.
HOW HAS THE FUND PERFORMED OVER THE PAST 10 YEARS?
The Fund’s past performance is not a good predictor of the Fund’s future performance.
The returns do not reflect the deduction of
taxes that a shareholder would pay on Fund distributions or redemption of Fund shares.
Visit
pgim.com/investments/mutual-funds/prospectuses-fact-sheets
or call (800) 225-1852 or (973) 367-3529 from outside the US for more recent performance data.
The line graph reflects a hypothetical $10,000 investment in Class A shares and assumes that all recurring fees (including management fees)
were deducted and dividend and distributions were reinvested. Without waiver of fees and/or expense reimbursements, if any, the returns would
have been lower.
Cumulative Performance: August 31, 2014 to August 31, 2024 Initial Investment of $10,000 |
The line graph reflects the return on the Fund's Class A shares with sales charges.
Average Annual Total Returns as of 8/31/2024 |
| | | |
Class A with sales charges | | | |
Class A without sales charges | | | |
Russell Midcap Growth Index | | | |
| | | |
Broad-Based Securities Market Index: S&P 500 Index* | | | |
*The Fund has added this broad-based index in response to new regulatory requirements.
WHAT ARE SOME KEY FUND STATISTICS AS OF 8/31/2024?
| |
| |
Total advisory fees paid for the year | |
Portfolio turnover rate for the year | |
WHAT ARE SOME CHARACTERISTICS OF THE FUND’S HOLDINGS AS OF 8/31/2024?
| |
| |
Hotels, Restaurants & Leisure | |
Semiconductors & Semiconductor Equipment | |
| |
Life Sciences Tools & Services | |
| |
Health Care Equipment & Supplies | |
| |
| |
| |
Real Estate Management & Development | |
Oil, Gas & Consumable Fuels | |
| |
| |
Consumer Staples Distribution & Retail | |
Commercial Services & Supplies | |
Interactive Media & Services | |
| |
| |
| |
Electronic Equipment, Instruments & Components | |
Affiliated Mutual Fund - Short-Term Investment | |
| |
| |
| |
| |
| |
Textiles, Apparel & Luxury Goods | |
| |
| |
| |
| |
| |
Trading Companies & Distributors | |
Construction & Engineering | |
| |
| |
Independent Power & Renewable Electricity | |
Energy Equipment & Services | |
| |
Liabilities in excess of other assets | |
| |
WERE THERE ANY CHANGES TO THE FUND THIS YEAR?
The following is a summary of certain changes to the Fund since September 1, 2023:
■
The Fund's principal risk disclosure was revised to include Sector Exposure Risk as a principal risk of the Fund due to changes in the Fund's
portfolio which may result in greater exposure to certain economic sectors.
For more complete information, you should review the Fund’s next prospectus, which we expect to be available by October 30, 2024 at
pgim.com/investments/mutual-funds/prospectuses-fact-sheets
or by request at (800) 225-1852.
You can find additional information at
pgim.com/investments/mutual-funds/prospectuses-fact-sheets
or by scanning the QR code below,
including the Fund’s prospectus, financial information, fund holdings, and proxy voting information. You can also request this information by
contacting us at (800) 225-1852 or (973) 367-3529 from outside the US.
To receive your fund documents online, go to
pgim.com/investments/resource/edelivery
and enroll.
PGIM Jennison Mid-Cap Growth Fund
PGIM Jennison Mid-Cap Growth Fund
ANNUAL SHAREHOLDER REPORT – August 31, 2024
This annual shareholder report contains important information about the Class C shares of PGIM Jennison Mid-Cap Growth Fund (the “Fund”) for
the period of September 1, 2023 to August 31, 2024.
You can find additional information about the Fund at
pgim.com/investments/mutual-funds/prospectuses-fact-sheets
. You can also request
this information by contacting us at (800) 225-1852 or (973) 367-3529 from outside the US.
This report describes changes to the Fund that occurred during the reporting period.
WHAT WERE THE FUND COSTS FOR THE LAST YEAR?
(Based on a hypothetical $10,000 investment)
| Costs of a $10,000 investment | Costs paid as a percentage of a $10,000 investment |
PGIM Jennison Mid-Cap Growth Fund—Class C | | |
WHAT AFFECTED THE FUND’S PERFORMANCE DURING THE REPORTING PERIOD?
■
During the reporting period, equities generally posted solid results driven by enthusiasm regarding generative artificial intelligence, the end to
US Federal Reserve interest rate hikes, and continued growth in the US economy. Mid-cap stocks, as represented by the Russell Midcap Index,
performed well in aggregate but trailed the large-cap S&P 500 Index.
■
Security selection within the consumer sectors, especially specialty retail and food products, added the most to the Fund’s performance relative
to the Index. The Fund’s overweights in real estate and information technology and its underweight in healthcare also bolstered relative results.
■
Stock selection within healthcare (especially biotechnology), information technology (primarily due to software), and industrials (weighed down
by professional services) were primary sources of weakness relative to the Index.
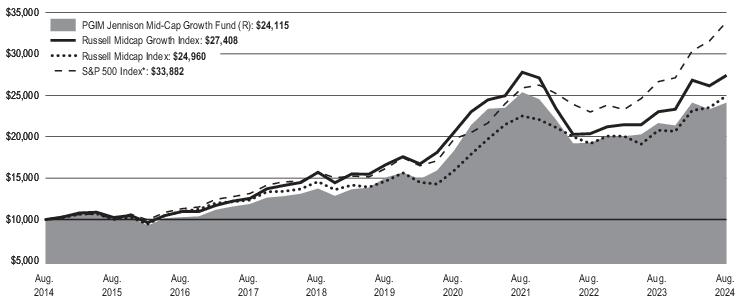
HOW HAS THE FUND PERFORMED OVER THE PAST 10 YEARS?
The Fund’s past performance is not a good predictor of the Fund’s future performance.
The returns do not reflect the deduction of
taxes that a shareholder would pay on Fund distributions or redemption of Fund shares.
Visit
pgim.com/investments/mutual-funds/prospectuses-fact-sheets
or call (800) 225-1852 or (973) 367-3529 from outside the US for more recent performance data.
The line graph reflects a hypothetical $10,000 investment in Class C shares and assumes that all recurring fees (including management fees)
were deducted and dividend and distributions were reinvested. Without waiver of fees and/or expense reimbursements, if any, the returns would
have been lower.
Cumulative Performance: August 31, 2014 to August 31, 2024 Initial Investment of $10,000 |
Average Annual Total Returns as of 8/31/2024 |
| | | |
Class C with sales charges | | | |
Class C without sales charges | | | |
Russell Midcap Growth Index | | | |
| | | |
Broad-Based Securities Market Index: S&P 500 Index * | | | |
*The Fund has added this broad-based index in response to new regulatory requirements.
WHAT ARE SOME KEY FUND STATISTICS AS OF 8/31/2024?
| |
| |
Total advisory fees paid for the year | |
Portfolio turnover rate for the year | |
WHAT ARE SOME CHARACTERISTICS OF THE FUND’S HOLDINGS AS OF 8/31/2024?
| |
| |
Hotels, Restaurants & Leisure | |
Semiconductors & Semiconductor Equipment | |
| |
Life Sciences Tools & Services | |
| |
Health Care Equipment & Supplies | |
| |
| |
| |
Real Estate Management & Development | |
Oil, Gas & Consumable Fuels | |
| |
| |
Consumer Staples Distribution & Retail | |
Commercial Services & Supplies | |
Interactive Media & Services | |
| |
| |
| |
Electronic Equipment, Instruments & Components | |
Affiliated Mutual Fund - Short-Term Investment | |
| |
| |
| |
| |
| |
Textiles, Apparel & Luxury Goods | |
| |
| |
| |
| |
| |
Trading Companies & Distributors | |
Construction & Engineering | |
| |
| |
Independent Power & Renewable Electricity | |
Energy Equipment & Services | |
| |
Liabilities in excess of other assets | |
| |
WERE THERE ANY CHANGES TO THE FUND THIS YEAR?
The following is a summary of certain changes to the Fund since September 1, 2023:
■
The Fund's principal risk disclosure was revised to include Sector Exposure Risk as a principal risk of the Fund due to changes in the Fund's
portfolio which may result in greater exposure to certain economic sectors.
For more complete information, you should review the Fund’s next prospectus, which we expect to be available by October 30, 2024 at
pgim.com/investments/mutual-funds/prospectuses-fact-sheets
or by request at (800) 225-1852.
You can find additional information at
pgim.com/investments/mutual-funds/prospectuses-fact-sheets
or by scanning the QR code below,
including the Fund’s prospectus, financial information, fund holdings, and proxy voting information. You can also request this information by
contacting us at (800) 225-1852 or (973) 367-3529 from outside the US.
To receive your fund documents online, go to
pgim.com/investments/resource/edelivery
and enroll.
PGIM Jennison Mid-Cap Growth Fund
PGIM Jennison Mid-Cap Growth Fund
ANNUAL SHAREHOLDER REPORT – August 31, 2024
This annual shareholder report contains important information about the Class R shares of PGIM Jennison Mid-Cap Growth Fund (the “Fund”) for
the period of September 1, 2023 to August 31, 2024.
You can find additional information about the Fund at
pgim.com/investments/mutual-funds/prospectuses-fact-sheets
. You can also request
this information by contacting us at (800) 225-1852 or (973) 367-3529 from outside the US.
This report describes changes to the Fund that occurred during the reporting period.
WHAT WERE THE FUND COSTS FOR THE LAST YEAR?
(Based on a hypothetical $10,000 investment)
| Costs of a $10,000 investment | Costs paid as a percentage of a $10,000 investment |
PGIM Jennison Mid-Cap Growth Fund—Class R | | |
WHAT AFFECTED THE FUND’S PERFORMANCE DURING THE REPORTING PERIOD?
■
During the reporting period, equities generally posted solid results driven by enthusiasm regarding generative artificial intelligence, the end to
US Federal Reserve interest rate hikes, and continued growth in the US economy. Mid-cap stocks, as represented by the Russell Midcap Index,
performed well in aggregate but trailed the large-cap S&P 500 Index.
■
Security selection within the consumer sectors, especially specialty retail and food products, added the most to the Fund’s performance relative
to the Index. The Fund’s overweights in real estate and information technology and its underweight in healthcare also bolstered relative results.
■
Stock selection within healthcare (especially biotechnology), information technology (primarily due to software), and industrials (weighed down
by professional services) were primary sources of weakness relative to the Index.
HOW HAS THE FUND PERFORMED OVER THE PAST 10 YEARS?
The Fund’s past performance is not a good predictor of the Fund’s future performance.
The returns do not reflect the deduction of
taxes that a shareholder would pay on Fund distributions or redemption of Fund shares.
Visit
pgim.com/investments/mutual-funds/prospectuses-fact-sheets
or call (800) 225-1852 or (973) 367-3529 from outside the US for more recent performance data.
The line graph reflects a hypothetical $10,000 investment in Class R shares and assumes that all recurring fees (including management fees)
were deducted and dividend and distributions were reinvested. Without waiver of fees and/or expense reimbursements, if any, the returns would
have been lower.
Cumulative Performance: August 31, 2014 to August 31, 2024 Initial Investment of $10,000 |
Average Annual Total Returns as of 8/31/2024 |
| | | |
| | | |
Russell Midcap Growth Index | | | |
| | | |
Broad-Based Securities Market Index: S&P 500 Index * | | | |
*The Fund has added this broad-based index in response to new regulatory requirements.
WHAT ARE SOME KEY FUND STATISTICS AS OF 8/31/2024?
| |
| |
Total advisory fees paid for the year | |
Portfolio turnover rate for the year | |
WHAT ARE SOME CHARACTERISTICS OF THE FUND’S HOLDINGS AS OF 8/31/2024?
| |
| |
Hotels, Restaurants & Leisure | |
Semiconductors & Semiconductor Equipment | |
| |
Life Sciences Tools & Services | |
| |
Health Care Equipment & Supplies | |
| |
| |
| |
Real Estate Management & Development | |
Oil, Gas & Consumable Fuels | |
| |
| |
Consumer Staples Distribution & Retail | |
Commercial Services & Supplies | |
Interactive Media & Services | |
| |
| |
| |
Electronic Equipment, Instruments & Components | |
Affiliated Mutual Fund - Short-Term Investment | |
| |
| |
| |
| |
| |
Textiles, Apparel & Luxury Goods | |
| |
| |
| |
| |
| |
Trading Companies & Distributors | |
Construction & Engineering | |
| |
| |
Independent Power & Renewable Electricity | |
Energy Equipment & Services | |
| |
Liabilities in excess of other assets | |
| |
WERE THERE ANY CHANGES TO THE FUND THIS YEAR?
The following is a summary of certain changes to the Fund since September 1, 2023:
■
The Fund's principal risk disclosure was revised to include Sector Exposure Risk as a principal risk of the Fund due to changes in the Fund's
portfolio which may result in greater exposure to certain economic sectors.
For more complete information, you should review the Fund’s next prospectus, which we expect to be available by October 30, 2024 at
pgim.com/investments/mutual-funds/prospectuses-fact-sheets
or by request at (800) 225-1852.
You can find additional information at
pgim.com/investments/mutual-funds/prospectuses-fact-sheets
or by scanning the QR code below,
including the Fund’s prospectus, financial information, fund holdings, and proxy voting information. You can also request this information by
contacting us at (800) 225-1852 or (973) 367-3529 from outside the US.
To receive your fund documents online, go to
pgim.com/investments/resource/edelivery
and enroll.
PGIM Jennison Mid-Cap Growth Fund
PGIM Jennison Mid-Cap Growth Fund
ANNUAL SHAREHOLDER REPORT – August 31, 2024
This annual shareholder report contains important information about the Class Z shares of PGIM Jennison Mid-Cap Growth Fund (the “Fund”) for
the period of September 1, 2023 to August 31, 2024.
You can find additional information about the Fund at
pgim.com/investments/mutual-funds/prospectuses-fact-sheets
. You can also request
this information by contacting us at (800) 225-1852 or (973) 367-3529 from outside the US.
This report describes changes to the Fund that occurred during the reporting period.
WHAT WERE THE FUND COSTS FOR THE LAST YEAR?
(Based on a hypothetical $10,000 investment)
| Costs of a $10,000 investment | Costs paid as a percentage of a $10,000 investment |
PGIM Jennison Mid-Cap Growth Fund—Class Z | | |
WHAT AFFECTED THE FUND’S PERFORMANCE DURING THE REPORTING PERIOD?
■
During the reporting period, equities generally posted solid results driven by enthusiasm regarding generative artificial intelligence, the end to
US Federal Reserve interest rate hikes, and continued growth in the US economy. Mid-cap stocks, as represented by the Russell Midcap Index,
performed well in aggregate but trailed the large-cap S&P 500 Index.
■
Security selection within the consumer sectors, especially specialty retail and food products, added the most to the Fund’s performance relative
to the Index. The Fund’s overweights in real estate and information technology and its underweight in healthcare also bolstered relative results.
■
Stock selection within healthcare (especially biotechnology), information technology (primarily due to software), and industrials (weighed down
by professional services) were primary sources of weakness relative to the Index.
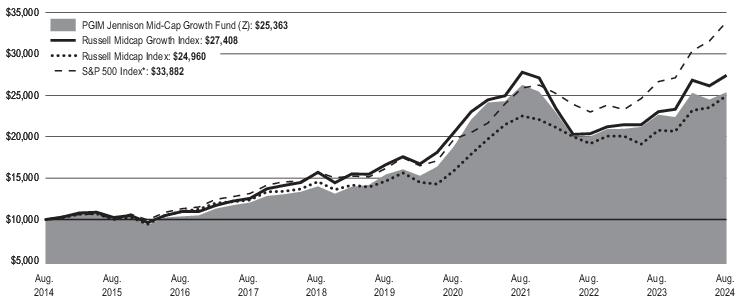
HOW HAS THE FUND PERFORMED OVER THE PAST 10 YEARS?
The Fund’s past performance is not a good predictor of the Fund’s future performance.
The returns do not reflect the deduction of
taxes that a shareholder would pay on Fund distributions or redemption of Fund shares.
Visit
pgim.com/investments/mutual-funds/prospectuses-fact-sheets
or call (800) 225-1852 or (973) 367-3529 from outside the US for more recent performance data.
The line graph reflects a hypothetical $10,000 investment in Class Z shares and assumes that all recurring fees (including management fees)
were deducted and dividend and distributions were reinvested. Without waiver of fees and/or expense reimbursements, if any, the returns would
have been lower.
Cumulative Performance: August 31, 2014 to August 31, 2024 Initial Investment of $10,000 |
Average Annual Total Returns as of 8/31/2024 |
| | | |
| | | |
Russell Midcap Growth Index | | | |
| | | |
Broad-Based Securities Market Index: S&P 500 Index * | | | |
*The Fund has added this broad-based index in response to new regulatory requirements.
WHAT ARE SOME KEY FUND STATISTICS AS OF 8/31/2024?
| |
| |
Total advisory fees paid for the year | |
Portfolio turnover rate for the year | |
WHAT ARE SOME CHARACTERISTICS OF THE FUND’S HOLDINGS AS OF 8/31/2024?
| |
| |
Hotels, Restaurants & Leisure | |
Semiconductors & Semiconductor Equipment | |
| |
Life Sciences Tools & Services | |
| |
Health Care Equipment & Supplies | |
| |
| |
| |
Real Estate Management & Development | |
Oil, Gas & Consumable Fuels | |
| |
| |
Consumer Staples Distribution & Retail | |
Commercial Services & Supplies | |
Interactive Media & Services | |
| |
| |
| |
Electronic Equipment, Instruments & Components | |
Affiliated Mutual Fund - Short-Term Investment | |
| |
| |
| |
| |
| |
Textiles, Apparel & Luxury Goods | |
| |
| |
| |
| |
| |
Trading Companies & Distributors | |
Construction & Engineering | |
| |
| |
Independent Power & Renewable Electricity | |
Energy Equipment & Services | |
| |
Liabilities in excess of other assets | |
| |
WERE THERE ANY CHANGES TO THE FUND THIS YEAR?
The following is a summary of certain changes to the Fund since September 1, 2023:
■
The Fund's principal risk disclosure was revised to include Sector Exposure Risk as a principal risk of the Fund due to changes in the Fund's
portfolio which may result in greater exposure to certain economic sectors.
For more complete information, you should review the Fund’s next prospectus, which we expect to be available by October 30, 2024 at
pgim.com/investments/mutual-funds/prospectuses-fact-sheets
or by request at (800) 225-1852.
You can find additional information at
pgim.com/investments/mutual-funds/prospectuses-fact-sheets
or by scanning the QR code below,
including the Fund’s prospectus, financial information, fund holdings, and proxy voting information. You can also request this information by
contacting us at (800) 225-1852 or (973) 367-3529 from outside the US.
To receive your fund documents online, go to
pgim.com/investments/resource/edelivery
and enroll.
PGIM Jennison Mid-Cap Growth Fund
PGIM Jennison Mid-Cap Growth Fund
ANNUAL SHAREHOLDER REPORT – August 31, 2024
This annual shareholder report contains important information about the Class R2 shares of PGIM Jennison Mid-Cap Growth Fund (the “Fund”)
for the period of September 1, 2023 to August 31, 2024.
You can find additional information about the Fund at
pgim.com/investments/mutual-funds/prospectuses-fact-sheets
. You can also request
this information by contacting us at (800) 225-1852 or (973) 367-3529 from outside the US.
This report describes changes to the Fund that occurred during the reporting period.
WHAT WERE THE FUND COSTS FOR THE LAST YEAR?
(Based on a hypothetical $10,000 investment)
| Costs of a $10,000 investment | Costs paid as a percentage of a $10,000 investment |
PGIM Jennison Mid-Cap Growth Fund—Class R2 | | |
WHAT AFFECTED THE FUND’S PERFORMANCE DURING THE REPORTING PERIOD?
■
During the reporting period, equities generally posted solid results driven by enthusiasm regarding generative artificial intelligence, the end to
US Federal Reserve interest rate hikes, and continued growth in the US economy. Mid-cap stocks, as represented by the Russell Midcap Index,
performed well in aggregate but trailed the large-cap S&P 500 Index.
■
Security selection within the consumer sectors, especially specialty retail and food products, added the most to the Fund’s performance relative
to the Index. The Fund’s overweights in real estate and information technology and its underweight in healthcare also bolstered relative results.
■
Stock selection within healthcare (especially biotechnology), information technology (primarily due to software), and industrials (weighed down
by professional services) were primary sources of weakness relative to the Index.
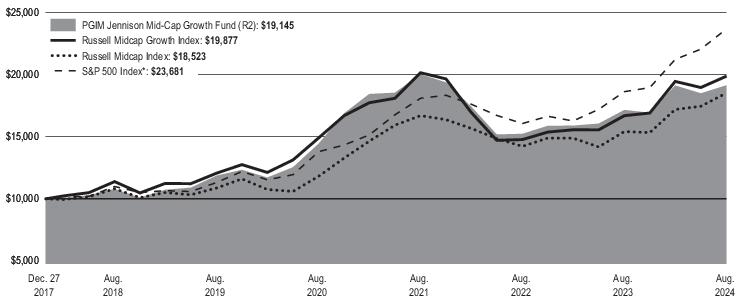
HOW HAS THE FUND PERFORMED OVER THE PAST 10 YEARS?
The Fund’s past performance is not a good predictor of the Fund’s future performance.
The returns do not reflect the deduction of
taxes that a shareholder would pay on Fund distributions or redemption of Fund shares.
Visit
pgim.com/investments/mutual-funds/prospectuses-fact-sheets
or call (800) 225-1852 or (973) 367-3529 from outside the US for more recent performance data.
The line graph reflects a hypothetical $10,000 investment in Class R2 shares and assumes that all recurring fees (including management fees)
were deducted and dividend and distributions were reinvested. Without waiver of fees and/or expense reimbursements, if any, the returns would
have been lower.
Cumulative Performance: December 27, 2017 to August 31, 2024 Initial Investment of $10,000 |
Average Annual Total Returns as of 8/31/2024 |
| | | |
| | | |
Russell Midcap Growth Index | | | |
| | | |
Broad-Based Securities Market Index: S&P 500 Index* | | | |
*The Fund has added this broad-based index in response to new r
egulat
ory requirements.
Since Inception returns are provided for the share class since it has less than 10 fiscal years of returns. Since Inception returns for the Index are measured from the closest
month
-end to the class’s inception date.
WHAT ARE SOME KEY FUND STATISTICS AS OF 8/31/2024?
| |
| |
Total advisory fees paid for the year | |
Portfolio turnover rate for the year | |
WHAT ARE SOME CHARACTERISTICS OF THE FUND’S HOLDINGS AS OF 8/31/2024?
| |
| |
Hotels, Restaurants & Leisure | |
Semiconductors & Semiconductor Equipment | |
| |
Life Sciences Tools & Services | |
| |
Health Care Equipment & Supplies | |
| |
| |
| |
Real Estate Management & Development | |
Oil, Gas & Consumable Fuels | |
| |
| |
Consumer Staples Distribution & Retail | |
Commercial Services & Supplies | |
Interactive Media & Services | |
| |
| |
| |
Electronic Equipment, Instruments & Components | |
Affiliated Mutual Fund - Short-Term Investment | |
| |
| |
| |
| |
| |
Textiles, Apparel & Luxury Goods | |
| |
| |
| |
| |
| |
Trading Companies & Distributors | |
Construction & Engineering | |
| |
| |
Independent Power & Renewable Electricity | |
Energy Equipment & Services | |
| |
Liabilities in excess of other assets | |
| |
WERE THERE ANY CHANGES TO THE FUND THIS YEAR?
The following is a summary of certain changes to the Fund since September 1, 2023:
■
The Fund's principal risk disclosure was revised to include Sector Exposure Risk as a principal risk of the Fund due to changes in the Fund's
portfolio which may result in greater exposure to certain economic sectors.
For more complete information, you should review the Fund’s next prospectus, which we expect to be available by October 30, 2024 at
pgim.com/investments/mutual-funds/prospectuses-fact-sheets
or by request at (800) 225-1852.
You can find additional information at
pgim.com/investments/mutual-funds/prospectuses-fact-sheets
or by scanning the QR code below,
including the Fund’s prospectus, financial information, fund holdings, and proxy voting information. You can also request this information by
contacting us at (800) 225-1852 or (973) 367-3529 from outside the US.
To receive your fund documents online, go to
pgim.com/investments/resource/edelivery
and enroll.
PGIM Jennison Mid-Cap Growth Fund
PGIM Jennison Mid-Cap Growth Fund
ANNUAL SHAREHOLDER REPORT – August 31, 2024
This annual shareholder report contains important information about the Class R4 shares of PGIM Jennison Mid-Cap Growth Fund (the “Fund”)
for the period of September 1, 2023 to August 31, 2024.
You can find additional information about the Fund at
pgim.com/investments/mutual-funds/prospectuses-fact-sheets
. You can also request
this information by contacting us at (800) 225-1852 or (973) 367-3529 from outside the US.
This report describes changes to the Fund that occurred during the reporting period.
WHAT WERE THE FUND COSTS FOR THE LAST YEAR?
(Based on a hypothetical $10,000 investment)
| Costs of a $10,000 investment | Costs paid as a percentage of a $10,000 investment |
PGIM Jennison Mid-Cap Growth Fund—Class R4 | | |
WHAT AFFECTED THE FUND’S PERFORMANCE DURING THE REPORTING PERIOD?
■
During the reporting period, equities generally posted solid results driven by enthusiasm regarding generative artificial intelligence, the end to
US Federal Reserve interest rate hikes, and continued growth in the US economy. Mid-cap stocks, as represented by the Russell Midcap Index,
performed well in aggregate but trailed the large-cap S&P 500 Index.
■
Security selection within the consumer sectors, especially specialty retail and food products, added the most to the Fund’s performance relative
to the Index. The Fund’s overweights in real estate and information technology and its underweight in healthcare also bolstered relative results.
■
Stock selection within healthcare (especially biotechnology), information technology (primarily due to software), and industrials (weighed down
by professional services) were primary sources of weakness relative to the Index.
HOW HAS THE FUND PERFORMED OVER THE PAST 10 YEARS?
The Fund’s past performance is not a good predictor of the Fund’s future performance.
The returns do not reflect the deduction of
taxes that a shareholder would pay on Fund distributions or redemption of Fund shares.
Visit
pgim.com/investments/mutual-funds/prospectuses-fact-sheets
or call (800) 225-1852 or (973) 367-3529 from outside the US for more recent performance data.
The line graph reflects a hypothetical $10,000 investment in Class R4 shares and assumes that all recurring fees (including management fees)
were deducted and dividend and distributions were reinvested. Without waiver of fees and/or expense reimbursements, if any, the returns would
have been lower.
Cumulative Performance: December 27, 2017 to August 31, 2024 Initial Investment of $10,000 |
Average Annual Total Returns as of 8/31/2024 |
| | | |
| | | |
Russell Midcap Growth Index | | | |
| | | |
Broad-Based Securities Market Index: S&P 500 Index* | | | |
*The Fund has added this broad-based index in response to new regulatory requirements.
Since Inception returns are provided for the share class since it has less than 10 fiscal years of returns. Since Inception r
eturns
for the Index are measured from
the
closest
month-end to the class’s inception date.
WHAT ARE SOME KEY FUND STATISTICS AS OF 8/31/2024?
| |
| |
Total advisory fees paid for the year | |
Portfolio turnover rate for the year | |
WHAT ARE SOME CHARACTERISTICS OF THE FUND’S HOLDINGS AS OF 8/31/2024?
| |
| |
Hotels, Restaurants & Leisure | |
Semiconductors & Semiconductor Equipment | |
| |
Life Sciences Tools & Services | |
| |
Health Care Equipment & Supplies | |
| |
| |
| |
Real Estate Management & Development | |
Oil, Gas & Consumable Fuels | |
| |
| |
Consumer Staples Distribution & Retail | |
Commercial Services & Supplies | |
Interactive Media & Services | |
| |
| |
| |
Electronic Equipment, Instruments & Components | |
Affiliated Mutual Fund - Short-Term Investment | |
| |
| |
| |
| |
| |
Textiles, Apparel & Luxury Goods | |
| |
| |
| |
| |
| |
Trading Companies & Distributors | |
Construction & Engineering | |
| |
| |
Independent Power & Renewable Electricity | |
Energy Equipment & Services | |
| |
Liabilities in excess of other assets | |
| |
WERE THERE ANY CHANGES TO THE FUND THIS YEAR?
The following is a summary of certain changes to the Fund since September 1, 2023:
■
The Fund's principal risk disclosure was revised to include Sector Exposure Risk as a principal risk of the Fund due to changes in the Fund's
portfolio which may result in greater exposure to certain economic sectors.
For more complete information, you should review the Fund’s next prospectus, which we expect to be available by October 30, 2024 at
pgim.com/investments/mutual-funds/prospectuses-fact-sheets
or by request at (800) 225-1852.
You can find additional information at
pgim.com/investments/mutual-funds/prospectuses-fact-sheets
or by scanning the QR code below,
including the Fund’s prospectus, financial information, fund holdings, and proxy voting information. You can also request this information by
contacting us at (800) 225-1852 or (973) 367-3529 from outside the US.
To receive your fund documents online, go to
pgim.com/investments/resource/edelivery
and enroll.
PGIM Jennison Mid-Cap Growth Fund
PGIM Jennison Mid-Cap Growth Fund
ANNUAL SHAREHOLDER REPORT – August 31, 2024
This annual shareholder report contains important information about the Class R6 shares of PGIM Jennison Mid-Cap Growth Fund (the “Fund”)
for the period of September 1, 2023 to August 31, 2024.
You can find additional information about the Fund at
pgim.com/investments/mutual-funds/prospectuses-fact-sheets
. You can also request
this information by contacting us at (800) 225-1852 or (973) 367-3529 from outside the US.
This report describes changes to the Fund that occurred during the reporting period.
WHAT WERE THE FUND COSTS FOR THE LAST YEAR?
(Based on a hypothetical $10,000 investment)
| Costs of a $10,000 investment | Costs paid as a percentage of a $10,000 investment |
PGIM Jennison Mid-Cap Growth Fund—Class R6 | | |
WHAT AFFECTED THE FUND’S PERFORMANCE DURING THE REPORTING PERIOD?
■
During the reporting period, equities generally posted solid results driven by enthusiasm regarding generative artificial intelligence, the end to
US Federal Reserve interest rate hikes, and continued growth in the US economy. Mid-cap stocks, as represented by the Russell Midcap Index,
performed well in aggregate but trailed the large-cap S&P 500 Index.
■
Security selection within the consumer sectors, especially specialty retail and food products, added the most to the Fund’s performance relative
to the Index. The Fund’s overweights in real estate and information technology and its underweight in healthcare also bolstered relative results.
■
Stock selection within healthcare (especially biotechnology), information technology (primarily due to software), and industrials (weighed down
by professional services) were primary sources of weakness relative to the Index.
HOW HAS THE FUND PERFORMED OVER THE PAST 10 YEARS?
The Fund’s past performance is not a good predictor of the Fund’s future performance.
The returns do not reflect the deduction of
taxes that a shareholder would pay on Fund distributions or redemption of Fund shares.
Visit
pgim.com/investments/mutual-funds/prospectuses-fact-sheets
or call (800) 225-1852 or (973) 367-3529 from outside the US for more recent performance data.
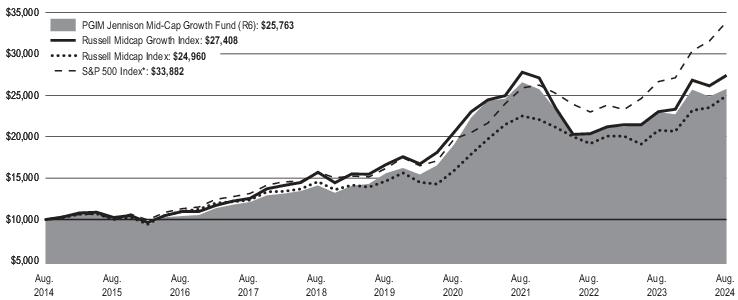
The line graph reflects a hypothetical $10,000 investment in Class R6 shares and assumes that all recurring fees (including management fees)
were deducted and dividend and distributions were reinvested. Without waiver of fees and/or expense reimbursements, if any, the returns would
have been lower.
Cumulative Performance: August 31, 2014 to August 31, 2024 Initial Investment of $10,000 |
Average Annual Total Returns as of 8/31/2024 |
| | | |
| | | |
Russell Midcap Growth Index | | | |
| | | |
Broad-Based Securities Market Index: S&P 500 Index * | | | |
*The Fund has added this broad-based index in response to new regulatory requirements.
WHAT ARE SOME KEY FUND STATISTICS AS OF 8/31/2024?
| |
| |
Total advisory fees paid for the year | |
Portfolio turnover rate for the year | |
WHAT ARE SOME CHARACTERISTICS OF THE FUND’S HOLDINGS AS OF 8/31/2024?
| |
| |
Hotels, Restaurants & Leisure | |
Semiconductors & Semiconductor Equipment | |
| |
Life Sciences Tools & Services | |
| |
Health Care Equipment & Supplies | |
| |
| |
| |
Real Estate Management & Development | |
Oil, Gas & Consumable Fuels | |
| |
| |
Consumer Staples Distribution & Retail | |
Commercial Services & Supplies | |
Interactive Media & Services | |
| |
| |
| |
Electronic Equipment, Instruments & Components | |
Affiliated Mutual Fund - Short-Term Investment | |
| |
| |
| |
| |
| |
Textiles, Apparel & Luxury Goods | |
| |
| |
| |
| |
| |
Trading Companies & Distributors | |
Construction & Engineering | |
| |
| |
Independent Power & Renewable Electricity | |
Energy Equipment & Services | |
| |
Liabilities in excess of other assets | |
| |
WERE THERE ANY CHANGES TO THE FUND THIS YEAR?
The following is a summary of certain changes to the Fund since September 1, 2023:
■
The Fund's principal risk disclosure was revised to include Sector Exposure Risk as a principal risk of the Fund due to changes in the Fund's
portfolio which may result in greater exposure to certain economic sectors.
For more complete information, you should review the Fund’s next prospectus, which we expect to be available by October 30, 2024 at
pgim.com/investments/mutual-funds/prospectuses-fact-sheets
or by request at (800) 225-1852.
You can find additional information at
pgim.com/investments/mutual-funds/prospectuses-fact-sheets
or by scanning the QR code below,
including the Fund’s prospectus, financial information, fund holdings, and proxy voting information. You can also request this information by
contacting us at (800) 225-1852 or (973) 367-3529 from outside the US.
To receive your fund documents online, go to
pgim.com/investments/resource/edelivery
and enroll.
PGIM Jennison Mid-Cap Growth Fund
| | (b) | Copy of each notice transmitted to stockholders in reliance on Rule 30e-3 under the Act (17 CFR 270.30e-3) that contains disclosures specified by paragraph (c)(3) of that rule – Not applicable. |
| Item | 2 – Code of Ethics – See Exhibit (a) |
As of the end of the period covered by this report, the registrant has adopted a code of ethics (the “Section 406 Standards for Investment Companies – Ethical Standards for Principal Executive and Financial Officers”) that applies to the registrant’s Principal Executive Officer, Principal Financial Officer and Principal Accounting Officer.
The registrant hereby undertakes to provide any person, without charge, upon request, a copy of the code of ethics. To request a copy of the code of ethics, contact the registrant 800-225-1852, and ask for a copy of the Section 406 Standards for Investment Companies - Ethical Standards for Principal Executive and Financial Officers.
| Item | 3 – Audit Committee Financial Expert – |
The registrant’s Board has determined that Ms. Grace C. Torres, member of the Board’s Audit Committee is an “audit committee financial expert,” and that she is “independent,” for purposes of this item.
| Item | 4 – Principal Accountant Fees and Services – |
For the fiscal years ended August 31, 2024 and August 31, 2023, PricewaterhouseCoopers LLP (“PwC”), the Registrant’s principal accountant, billed the Registrant $25,440 and $24,000, respectively, for professional services rendered for the audit of the Registrant’s annual financial statements or services that are normally provided in connection with statutory and regulatory filings.
For the fiscal years ended August 31, 2024 and August 31, 2023: none.
For the fiscal years ended August 31, 2024 and August 31, 2023: none.
For the fiscal years ended August 31, 2024 and August 31, 2023: none.
| | (e) (1) | Audit Committee Pre-Approval Policies and Procedures |
THE PGIM MUTUAL FUNDS
AUDIT COMMITTEE POLICY
on
Pre-Approval of Services Provided by the Independent
Accountants
The Audit Committee of each PGIM Mutual Fund is charged with the responsibility to monitor the independence of the Fund’s independent accountants. As part of this responsibility, the Audit Committee must pre-approve the independent accounting firm’s engagement to render audit and/or permissible non-audit services, as required by law. In evaluating a proposed engagement of the independent accountants, the Audit Committee will assess the effect that the engagement might reasonably be expected to have on the accountant’s independence. The Committee’s evaluation will be based on:
| | • | | a review of the nature of the professional services expected to be provided, |
| | • | | a review of the safeguards put into place by the accounting firm to safeguard independence, and |
| | • | | periodic meetings with the accounting firm. |
Policy for Audit and Non-Audit Services Provided to the Funds
On an annual basis, the scope of audits for each Fund, audit fees and expenses, and audit-related and non-audit services (and fees proposed in respect thereof) proposed to be performed by the Fund’s independent accountants will be presented by the Treasurer and the independent accountants to the Audit Committee for review and, as appropriate, approval prior to the initiation of such services.
Such presentation shall be accompanied by confirmation by both the Treasurer and the independent accountants that the proposed non-audit services will not adversely affect the independence of the independent accountants. Such proposed non-audit services shall be described in sufficient detail to enable the Audit Committee to assess the appropriateness of such services and fees, and the compatibility of the provision of such services with the auditor’s independence. The Committee shall receive periodic reports on the progress of the audit and other services which are approved by the Committee or by the Committee Chair pursuant to authority delegated in this Policy.
The categories of services enumerated under “Audit Services”, “Audit-related Services”, and “Tax Services” are intended to provide guidance to the Treasurer and the independent accountants as to those categories of services which the Committee believes are generally consistent with the independence of the independent accountants and which the Committee (or the Committee Chair) would expect upon the presentation of specific proposals to pre-approve. The enumerated categories are not intended as an exclusive list of audit, audit-related or tax services, which the Committee (or the Committee Chair) would consider for pre-approval.
Audit Services
The following categories of audit services are considered to be consistent with the role of the Fund’s independent accountants:
| | • | | Annual Fund financial statement audits |
| | • | | Seed audits (related to new product filings, as required) |
| | • | | SEC and regulatory filings and consents |
Audit-related Services
The following categories of audit-related services are considered to be consistent with the role of the Fund’s independent accountants:
| | • | | Accounting consultations |
| | • | | Fund merger support services |
| | • | | Agreed Upon Procedure Reports |
| | • | | Other Internal Control Reports |
Individual audit-related services that fall within one of these categories (except for fund merger support services) and are not presented to the Audit Committee as part of the annual pre-approval process are subject to an authorized pre-approval by the Audit Committee so long as the estimated fee for those services does not exceed $30,000. Any services provided under such pre-approval will be reported to the Audit Committee at its next regular meeting. Should the amount of such services exceed $30,000 any additional fees will be subject to pre-approval by the Committee Chair (or any other Committee member on whom this responsibility has been delegated). Fees related to fund merger support services are subject to a separate authorized pre-approval by the Audit Committee with fees determined on a per occurrence and merger complexity basis.
Tax Services
The following categories of tax services are considered to be consistent with the role of the Fund’s independent accountants:
| | • | | Tax compliance services related to the filing or amendment of the following: |
| | • | | Federal, state and local income tax compliance; and, |
| | • | | Sales and use tax compliance |
| | • | | Timely RIC qualification reviews |
| | • | | Tax distribution analysis and planning |
| | • | | Tax authority examination services |
| | • | | Tax appeals support services |
| | • | | Accounting methods studies |
| | • | | Fund merger support services |
| | • | | Tax consulting services and related projects |
Individual tax services that fall within one of these categories and are not presented to the Audit Committee as part of the annual pre-approval process are subject to an authorized pre-approval by the Audit Committee so long as the estimated fee for those services does not exceed $30,000. Any services provided under such pre-approval will be reported to the Audit Committee at its next regular meeting. Should the amount of such services exceed $30,000 any additional fees will be subject to pre-approval by the Committee Chair (or any other Committee member on whom this responsibility has been delegated).
Other Non-Audit Services
Certain non-audit services that the independent accountants are legally permitted to render will be subject to pre-approval by the Committee or by one or more Committee members to whom the Committee has delegated this authority and who will report to the full Committee any pre-approval decisions made pursuant to this Policy. Non-audit services presented for pre-approval pursuant to this paragraph will be accompanied by a confirmation from both the Treasurer and the independent accountants that the proposed services will not adversely affect the independence of the independent accountants.
Proscribed Services
The Fund’s independent accountants will not render services in the following categories of non-audit services:
| | • | | Bookkeeping or other services related to the accounting records or financial statements of the Fund |
| | • | | Financial information systems design and implementation |
| | • | | Appraisal or valuation services, fairness opinions, or contribution-in-kind reports |
| | • | | Internal audit outsourcing services |
| | • | | Management functions or human resources |
| | • | | Broker or dealer, investment adviser, or investment banking services |
| | • | | Legal services and expert services unrelated to the audit |
| | • | | Any other service that the Public Company Accounting Oversight Board determines, by regulation, is impermissible. |
Pre-approval of Non-Audit Services Provided to Other Entities Within the PGIM Fund Complex
Certain non-audit services provided to PGIM Investments LLC or any of its affiliates that also provide ongoing services to the PGIM Mutual Funds will be subject to pre-approval by the Audit Committee. The only non-audit services provided to these entities that will require pre-approval are those related directly to the operations and financial reporting of the Funds. Individual projects that are not presented to the Audit Committee as part of the annual pre-approval process will be subject to pre-approval by the Committee Chair (or any other Committee member on whom this responsibility has been delegated) so long as the estimated fee for those services does not exceed $30,000. Services presented for pre-approval pursuant to this paragraph will be accompanied by a confirmation from both the Treasurer and the independent accountants that the proposed services will not adversely affect the independence of the independent accountants.
Although the Audit Committee will not pre-approve all services provided to PGIM Investments LLC and its affiliates, the Committee will receive an annual report from the Fund’s independent accounting firm showing the aggregate fees for all services provided to PGIM Investments and its affiliates.
(e) (2) Percentage of services described in each of paragraphs (b) through (d) of this Item that were approved by the audit committee pursuant to paragraph (c)(7)(i)(C) of Rule 2-01 of Regulation S-X –
| | | | | | | | | | |
| | | | Fiscal Year Ended August 31, 2024 | | | | Fiscal Year Ended August 31, 2023 | | |
| | 4(b) | | Not applicable. | | | | Not applicable. | | |
| | 4(c) | | Not applicable. | | | | Not applicable. | | |
| | 4(d) | | Not applicable. | | | | Not applicable. | | |
(f) Percentage of hours expended attributable to work performed by other than full time employees of principal accountant if greater than 50%.
The percentage of hours expended on the principal accountant’s engagement to audit the registrant’s financial statements for the most recent fiscal year that were attributed to work performed by persons other than the principal accountant’s full-time, permanent employees was 0%.
(g) Non-Audit Fees
The aggregate non-audit fees billed by the Registrant’s principal accountant for services rendered to the registrant’s investment adviser and any entity controlling, controlled by, or under common control with the investment adviser that provides ongoing services to the registrant for the fiscal years ended August 31, 2024 and August 31, 2023 was $0 and $0, respectively.
(h) Principal Accountant’s Independence
Not applicable as the Registrant’s principal accountant has not provided non-audit services to the registrant’s investment adviser and any entity controlling, controlled by, or under common control with the investment adviser that provides ongoing services to the registrant that were not pre-approved pursuant to Rule 2-01(c)(7)(ii) of Regulation S-X.
(i) Not applicable.
(j) Not applicable.
| Item 5 – | Audit Committee of Listed Registrants – Not applicable. |
| Item 6 – | Investments – The registrant’s Schedule of Investments is included in the financial statements filed under Item 7 of this Form. |
| Items 7 – | 11 (Refer to Report below |

PRUDENTIAL JENNISON MID-CAP GROWTH FUND, INC.
PGIM Jennison Mid-Cap Growth Fund
FINANCIAL STATEMENTS AND OTHER INFORMATION
AUGUST 31, 2024

| | | | |
Table of Contents | | Financial Statements and Other Information | | August 31, 2024 |
Schedule of Investments
as of August 31, 2024
| | | | | | | | |
| | |
| Description | | Shares | | | Value | |
| | |
LONG-TERM INVESTMENTS 98.3% | | | | | | | | |
| | |
COMMON STOCKS | | | | | | | | |
| | |
Aerospace & Defense 4.0% | | | | | | | | |
| | |
BWX Technologies, Inc. | | | 362,374 | | | $ | 37,324,522 | |
HEICO Corp. | | | 238,652 | | | | 61,228,557 | |
| | | | | | | | |
| | |
| | | | | | | 98,553,079 | |
| | |
Banks 1.6% | | | | | | | | |
| | |
East West Bancorp, Inc. | | | 475,146 | | | | 39,945,524 | |
| | |
Biotechnology 4.0% | | | | | | | | |
| | |
Apellis Pharmaceuticals, Inc.* | | | 266,926 | | | | 10,383,421 | |
Argenx SE (Netherlands), ADR* | | | 34,799 | | | | 18,002,219 | |
Exact Sciences Corp.* | | | 737,349 | | | | 45,487,060 | |
Natera, Inc.* | | | 217,051 | | | | 25,668,451 | |
| | | | | | | | |
| | |
| | | | | | | 99,541,151 | |
| | |
Building Products 1.5% | | | | | | | | |
| | |
Zurn Elkay Water Solutions Corp. | | | 1,119,210 | | | | 36,295,980 | |
| | |
Capital Markets 1.1% | | | | | | | | |
| | |
Houlihan Lokey, Inc. | | | 47,732 | | | | 7,475,786 | |
LPL Financial Holdings, Inc. | | | 87,737 | | | | 19,682,918 | |
| | | | | | | | |
| | |
| | | | | | | 27,158,704 | |
| | |
Commercial Services & Supplies 2.1% | | | | | | | | |
| | |
GFL Environmental, Inc. | | | 1,201,779 | | | | 52,049,049 | |
| | |
Communications Equipment 0.8% | | | | | | | | |
| | |
Arista Networks, Inc.* | | | 54,958 | | | | 19,421,058 | |
| | |
Construction & Engineering 1.1% | | | | | | | | |
| | |
Quanta Services, Inc. | | | 93,616 | | | | 25,756,570 | |
| | |
Construction Materials 1.7% | | | | | | | | |
| | |
Martin Marietta Materials, Inc. | | | 76,924 | | | | 41,089,724 | |
| | |
Consumer Finance 1.8% | | | | | | | | |
| | |
Ally Financial, Inc. | | | 1,047,248 | | | | 45,230,641 | |
| | |
Consumer Staples Distribution & Retail 2.2% | | | | | | | | |
| | |
Performance Food Group Co.* | | | 737,834 | | | | 55,071,930 | |
See Notes to Financial Statements.
PGIM Jennison Mid-Cap Growth Fund 1
Schedule of Investments (continued)
as of August 31, 2024
| | | | | | | | |
| | |
| Description | | Shares | | | Value | |
| | |
COMMON STOCKS (Continued) | | | | | | | | |
| | |
Electrical Equipment 1.4% | | | | | | | | |
| | |
AMETEK, Inc. | | | 196,245 | | | $ | 33,567,707 | |
| | |
Electronic Equipment, Instruments & Components 1.8% | | | | | | | | |
| | |
Amphenol Corp. (Class A Stock) | | | 289,913 | | | | 19,554,632 | |
Cognex Corp. | | | 610,179 | | | | 24,639,028 | |
| | | | | | | | |
| | |
| | | | | | | 44,193,660 | |
| | |
Energy Equipment & Services 0.6% | | | | | | | | |
| | |
Weatherford International PLC | | | 129,673 | | | | 13,607,885 | |
| | |
Entertainment 1.9% | | | | | | | | |
| | |
Take-Two Interactive Software, Inc.* | | | 294,506 | | | | 47,624,565 | |
| | |
Financial Services 5.3% | | | | | | | | |
| | |
Apollo Global Management, Inc. | | | 414,553 | | | | 47,976,218 | |
Shift4 Payments, Inc. (Class A Stock)* | | | 763,650 | | | | 63,459,315 | |
WEX, Inc.* | | | 93,888 | | | | 17,934,486 | |
| | | | | | | | |
| | |
| | | | | | | 129,370,019 | |
| | |
Food Products 1.8% | | | | | | | | |
| | |
Freshpet, Inc.* | | | 328,143 | | | | 44,627,448 | |
| | |
Ground Transportation 2.3% | | | | | | | | |
| | |
J.B. Hunt Transport Services, Inc. | | | 153,564 | | | | 26,597,285 | |
Saia, Inc.* | | | 79,209 | | | | 29,769,118 | |
| | | | | | | | |
| | |
| | | | | | | 56,366,403 | |
| | |
Health Care Equipment & Supplies 4.0% | | | | | | | | |
| | |
Cooper Cos., Inc. (The)* | | | 427,880 | | | | 45,239,752 | |
Dexcom, Inc.* | | | 536,375 | | | | 37,192,243 | |
Insulet Corp.* | | | 82,461 | | | | 16,720,617 | |
| | | | | | | | |
| | |
| | | | | | | 99,152,612 | |
| | |
Hotels, Restaurants & Leisure 7.1% | | | | | | | | |
| | |
Churchill Downs, Inc. | | | 348,677 | | | | 48,455,643 | |
Domino’s Pizza, Inc. | | | 102,451 | | | | 42,436,229 | |
Hilton Worldwide Holdings, Inc. | | | 213,044 | | | | 46,792,984 | |
Texas Roadhouse, Inc. | | | 216,567 | | | | 36,545,681 | |
| | | | | | | | |
| | |
| | | | | | | 174,230,537 | |
See Notes to Financial Statements.
2
| | | | | | | | |
| | |
| Description | | Shares | | | Value | |
| | |
COMMON STOCKS (Continued) | | | | | | | | |
| | |
Household Durables 1.3% | | | | | | | | |
| | |
Lennar Corp. (Class A Stock) | | | 181,858 | | | $ | 33,109,068 | |
| | |
Independent Power & Renewable Electricity Producers 0.8% | | | | | | | | |
| | |
Vistra Corp. | | | 215,802 | | | | 18,435,965 | |
| | |
Insurance 0.9% | | | | | | | | |
Ryan Specialty Holdings, Inc. | | | 357,057 | | | | 23,076,594 | |
| | |
Interactive Media & Services 2.0% | | | | | | | | |
Pinterest, Inc. (Class A Stock)* | | | 1,531,255 | | | | 49,061,410 | |
| | |
IT Services 3.6% | | | | | | | | |
Gartner, Inc.* | | | 97,942 | | | | 48,183,546 | |
Globant SA* | | | 205,035 | | | | 41,466,279 | |
| | | | | | | | |
| | |
| | | | | | | 89,649,825 | |
| | |
Life Sciences Tools & Services 4.9% | | | | | | | | |
Agilent Technologies, Inc. | | | 121,561 | | | | 17,373,498 | |
Avantor, Inc.* | | | 1,580,046 | | | | 40,828,389 | |
ICON PLC* | | | 95,188 | | | | 30,656,247 | |
Illumina, Inc.* | | | 232,530 | | | | 30,554,442 | |
| | | | | | | | |
| | |
| | | | | | | 119,412,576 | |
| | |
Machinery 1.7% | | | | | | | | |
Xylem, Inc. | | | 307,301 | | | | 42,263,107 | |
| | |
Media 2.5% | | | | | | | | |
Trade Desk, Inc. (The) (Class A Stock)* | | | 584,582 | | | | 61,106,356 | |
| | |
Oil, Gas & Consumable Fuels 3.0% | | | | | | | | |
Cheniere Energy, Inc. | | | 286,858 | | | | 53,143,313 | |
Permian Resources Corp. | | | 1,524,699 | | | | 21,711,714 | |
| | | | | | | | |
| | |
| | | | | | | 74,855,027 | |
| | |
Personal Care Products 1.4% | | | | | | | | |
elf Beauty, Inc.* | | | 231,447 | | | | 34,668,446 | |
| | |
Professional Services 1.7% | | | | | | | | |
KBR, Inc. | | | 609,167 | | | | 42,251,823 | |
See Notes to Financial Statements.
PGIM Jennison Mid-Cap Growth Fund 3
Schedule of Investments (continued)
as of August 31, 2024
| | | | | | | | |
| | |
| Description | | Shares | | | Value | |
| | |
COMMON STOCKS (Continued) | | | | | | | | |
| | |
Real Estate Management & Development 3.3% | | | | | | | | |
| | |
CBRE Group, Inc. (Class A Stock)* | | | 373,909 | | | $ | 43,051,883 | |
CoStar Group, Inc.* | | | 493,524 | | | | 38,149,405 | |
| | | | | | | | |
| | |
| | | | | | | 81,201,288 | |
| | |
Semiconductors & Semiconductor Equipment 6.6% | | | | | | | | |
| | |
Entegris, Inc. | | | 238,416 | | | | 27,625,262 | |
Marvell Technology, Inc. | | | 654,351 | | | | 49,887,720 | |
Microchip Technology, Inc. | | | 426,146 | | | | 35,012,155 | |
Monolithic Power Systems, Inc. | | | 18,306 | | | | 17,110,252 | |
Universal Display Corp. | | | 165,533 | | | | 32,067,053 | |
| | | | | | | | |
| | |
| | | | | | | 161,702,442 | |
| | |
Software 9.8% | | | | | | | | |
| | |
Cadence Design Systems, Inc.* | | | 79,011 | | | | 21,248,428 | |
Crowdstrike Holdings, Inc. (Class A Stock)* | | | 137,639 | | | | 38,164,542 | |
CyberArk Software Ltd.* | | | 163,059 | | | | 46,755,538 | |
Datadog, Inc. (Class A Stock)* | | | 456,289 | | | | 53,048,159 | |
HubSpot, Inc.* | | | 79,045 | | | | 39,448,988 | |
Procore Technologies, Inc.* | | | 247,097 | | | | 14,645,439 | |
PTC, Inc.* | | | 154,062 | | | | 27,590,964 | |
| | | | | | | | |
| | |
| | | | | | | 240,902,058 | |
| | |
Specialty Retail 4.0% | | | | | | | | |
| | |
Burlington Stores, Inc.* | | | 257,434 | | | | 69,054,096 | |
O’Reilly Automotive, Inc.* | | | 26,071 | | | | 29,459,448 | |
| | | | | | | | |
| | |
| | | | | | | 98,513,544 | |
| | |
Textiles, Apparel & Luxury Goods 1.6% | | | | | | | | |
| | |
On Holding AG (Switzerland) (Class A Stock)* | | | 838,383 | | | | 39,387,233 | |
| | |
Trading Companies & Distributors 1.1% | | | | | | | | |
| | |
Watsco, Inc. | | | 55,552 | | | | 26,410,532 | |
| | | | | | | | |
| | |
TOTAL LONG-TERM INVESTMENTS | | | | | | | | |
(cost $1,807,815,920) | | | | | | | 2,418,861,540 | |
| | | | | | | | |
See Notes to Financial Statements.
4
| | | | | | | | |
| | |
| Description | | Shares | | | Value | |
| | |
SHORT-TERM INVESTMENT 1.8% | | | | | | | | |
| | |
AFFILIATED MUTUAL FUND | | | | | | | | |
PGIM Core Government Money Market Fund (7-day effective yield 5.562%)
(cost $43,601,356)(wb) | | | 43,601,356 | | | $ | 43,601,356 | |
| | | | | | | | |
| | |
TOTAL INVESTMENTS 100.1%
(cost $1,851,417,276) | | | | | | | 2,462,462,896 | |
| | |
Liabilities in excess of other assets (0.1)% | | | | | | | (2,250,112 | ) |
| | | | | | | | |
| | |
NET ASSETS 100.0% | | | | | | $ | 2,460,212,784 | |
| | | | | | | | |
Below is a list of the abbreviation(s) used in the annual report:
ADR—American Depositary Receipt
SOFR—Secured Overnight Financing Rate
| * | Non-income producing security. |
| (wb) | Represents an investment in a Fund affiliated with the Manager. |
Fair Value Measurements:
Various inputs are used in determining the value of the Fund’s investments. These inputs are summarized in the three broad levels listed below.
Level 1—unadjusted quoted prices generally in active markets for identical securities.
Level 2—quoted prices for similar securities, interest rates and yield curves, prepayment speeds, foreign currency exchange rates and other observable inputs.
Level 3—unobservable inputs for securities valued in accordance with Board approved fair valuation procedures.
The following is a summary of the inputs used as of August 31, 2024 in valuing such portfolio securities:
| | | | | | | | | | | | | | | | | | | | | | | | | | | | |
| | | Level 1 | | | Level 2 | | | Level 3 | |
Investments in Securities | | | | | | | | | | | | | | | | | | | | | | | | | | | | |
Assets | | | | | | | | | | | | | | | | | | | | | | | | | | | | |
Long-Term Investments | | | | | | | | | | | | | | | | | | | | | | | | | | | | |
Common Stocks | | | | | | | | | | | | | | | | | | | | | | | | | | | | |
Aerospace & Defense | | $ | 98,553,079 | | | | | | | | $— | | | | | | | | | | | | $— | | | | | |
Banks | | | 39,945,524 | | | | | | | | — | | | | | | | | | | | | — | | | | | |
Biotechnology | | | 99,541,151 | | | | | | | | — | | | | | | | | | | | | — | | | | | |
Building Products | | | 36,295,980 | | | | | | | | — | | | | | | | | | | | | — | | | | | |
Capital Markets | | | 27,158,704 | | | | | | | | — | | | | | | | | | | | | — | | | | | |
Commercial Services & Supplies | | | 52,049,049 | | | | | | | | — | | | | | | | | | | | | — | | | | | |
Communications Equipment | | | 19,421,058 | | | | | | | | — | | | | | | | | | | | | — | | | | | |
Construction & Engineering | | | 25,756,570 | | | | | | | | — | | | | | | | | | | | | — | | | | | |
Construction Materials | | | 41,089,724 | | | | | | | | — | | | | | | | | | | | | — | | | | | |
Consumer Finance | | | 45,230,641 | | | | | | | | — | | | | | | | | | | | | — | | | | | |
Consumer Staples Distribution & Retail | | | 55,071,930 | | | | | | | | — | | | | | | | | | | | | — | | | | | |
Electrical Equipment | | | 33,567,707 | | | | | | | | — | | | | | | | | | | | | — | | | | | |
See Notes to Financial Statements.
PGIM Jennison Mid-Cap Growth Fund 5
Schedule of Investments (continued)
as of August 31, 2024
| | | | | | | | | | | | |
| | | Level 1 | | | Level 2 | | | Level 3 | |
Investments in Securities (continued) | | | | | | | | | | | | |
Assets (continued) | | | | | | | | | | | | |
Long-Term Investments (continued) | | | | | | | | | | | | |
Common Stocks (continued) | | | | | | | | | | | | |
Electronic Equipment, Instruments & Components | | $ | 44,193,660 | | | | $— | | | | $— | |
Energy Equipment & Services | | | 13,607,885 | | | | — | | | | — | |
Entertainment | | | 47,624,565 | | | | — | | | | — | |
Financial Services | | | 129,370,019 | | | | — | | | | — | |
Food Products | | | 44,627,448 | | | | — | | | | — | |
Ground Transportation | | | 56,366,403 | | | | — | | | | — | |
Health Care Equipment & Supplies | | | 99,152,612 | | | | — | | | | — | |
Hotels, Restaurants & Leisure | | | 174,230,537 | | | | — | | | | — | |
Household Durables | | | 33,109,068 | | | | — | | | | — | |
Independent Power & Renewable Electricity Producers | | | 18,435,965 | | | | — | | | | — | |
Insurance | | | 23,076,594 | | | | — | | | | — | |
Interactive Media & Services | | | 49,061,410 | | | | — | | | | — | |
IT Services | | | 89,649,825 | | | | — | | | | — | |
Life Sciences Tools & Services | | | 119,412,576 | | | | — | | | | — | |
Machinery | | | 42,263,107 | | | | — | | | | — | |
Media | | | 61,106,356 | | | | — | | | | — | |
Oil, Gas & Consumable Fuels | | | 74,855,027 | | | | — | | | | — | |
Personal Care Products | | | 34,668,446 | | | | — | | | | — | |
Professional Services | | | 42,251,823 | | | | — | | | | — | |
Real Estate Management & Development | | | 81,201,288 | | | | — | | | | — | |
Semiconductors & Semiconductor Equipment | | | 161,702,442 | | | | — | | | | — | |
Software | | | 240,902,058 | | | | — | | | | — | |
Specialty Retail | | | 98,513,544 | | | | — | | | | — | |
Textiles, Apparel & Luxury Goods | | | 39,387,233 | | | | — | | | | — | |
Trading Companies & Distributors | | | 26,410,532 | | | | — | | | | — | |
Short-Term Investment | | | | | | | | | | | | |
Affiliated Mutual Fund | | | 43,601,356 | | | | — | | | | — | |
| | | | | | | | | | | | |
| | | |
Total | | $ | 2,462,462,896 | | | | $— | | | | $— | |
| | | | | | | | | | | | |
Industry Classification:
The industry classification of investments and liabilities in excess of other assets shown as a percentage of net assets as of August 31, 2024 were as follows:
| | | | |
Software | | | 9.8 | % |
Hotels, Restaurants & Leisure | | | 7.1 | |
Semiconductors & Semiconductor Equipment | | | 6.6 | |
Financial Services | | | 5.3 | |
Life Sciences Tools & Services | | | 4.9 | |
Biotechnology | | | 4.0 | |
Health Care Equipment & Supplies | | | 4.0 | |
Aerospace & Defense | | | 4.0 | |
Specialty Retail | | | 4.0 | |
| | | | |
IT Services | | | 3.6 | % |
Real Estate Management & Development | | | 3.3 | |
Oil, Gas & Consumable Fuels | | | 3.0 | |
Media | | | 2.5 | |
Ground Transportation | | | 2.3 | |
Consumer Staples Distribution & Retail | | | 2.2 | |
Commercial Services & Supplies | | | 2.1 | |
Interactive Media & Services | | | 2.0 | |
Entertainment | | | 1.9 | |
See Notes to Financial Statements.
6
Industry Classification (continued):
| | | | |
Consumer Finance | | | 1.8 | % |
Food Products | | | 1.8 | |
Electronic Equipment, Instruments & Components | | | 1.8 | |
Affiliated Mutual Fund | | | 1.8 | |
Machinery | | | 1.7 | |
Professional Services | | | 1.7 | |
Construction Materials | | | 1.7 | |
Banks | | | 1.6 | |
Textiles, Apparel & Luxury Goods | | | 1.6 | |
Building Products | | | 1.5 | |
Personal Care Products | | | 1.4 | |
Electrical Equipment | | | 1.4 | |
Household Durables | | | 1.3 | |
| | | | |
Capital Markets | | | 1.1 | % |
Trading Companies & Distributors | | | 1.1 | |
Construction & Engineering | | | 1.1 | |
Insurance | | | 0.9 | |
Communications Equipment | | | 0.8 | |
Independent Power & Renewable Electricity Producers | | | 0.8 | |
Energy Equipment & Services | | | 0.6 | |
| | | | |
| |
| | | 100.1 | |
Liabilities in excess of other assets | | | (0.1 | ) |
| | | | |
| |
| | | 100.0 | % |
| | | | |
See Notes to Financial Statements.
PGIM Jennison Mid-Cap Growth Fund 7
Statement of Assets and Liabilities
as of August 31, 2024
| | | | |
Assets | | | | |
| |
Investments at value: | | | | |
Unaffiliated investments (cost $1,807,815,920) | | $ | 2,418,861,540 | |
Affiliated investments (cost $43,601,356) | | | 43,601,356 | |
Receivable for Fund shares sold | | | 1,652,323 | |
Dividends receivable | | | 548,773 | |
Tax reclaim receivable | | | 17,763 | |
Prepaid expenses | | | 71 | |
| | | | |
| |
Total Assets | | | 2,464,681,826 | |
| | | | |
| |
Liabilities | | | | |
| |
Payable for Fund shares purchased | | | 2,644,597 | |
Management fee payable | | | 1,140,297 | |
Transfer agent’s fees and expenses payable | | | 225,723 | |
Distribution fee payable | | | 224,738 | |
Accrued expenses and other liabilities | | | 164,490 | |
Affiliated transfer agent fee payable | | | 62,503 | |
Directors’ fees payable | | | 6,694 | |
| | | | |
| |
Total Liabilities | | | 4,469,042 | |
| | | | |
| |
Net Assets | | $ | 2,460,212,784 | |
| | | | |
| |
| | | | |
| |
Net assets were comprised of: | | | | |
Common stock, at par | | $ | 129,701 | |
Paid-in capital in excess of par | | | 1,729,312,622 | |
Total distributable earnings (loss) | | | 730,770,461 | |
| | | | |
| |
Net assets, August 31, 2024 | | $ | 2,460,212,784 | |
| | | | |
See Notes to Financial Statements.
8
| | | | | | | | |
Class A | | | | | | | | |
| | |
Net asset value and redemption price per share, | | | | | | | | |
($739,129,698 ÷ 48,705,329 shares of common stock issued and outstanding) | | $ | 15.18 | | | | | |
Maximum sales charge (5.50% of offering price) | | | 0.88 | | | | | |
| | | | | | | | |
| | |
Maximum offering price to public | | $ | 16.06 | | | | | |
| | | | | | | | |
| | |
Class C | | | | | | | | |
| | |
Net asset value, offering price and redemption price per share, | | | | | | | | |
($10,129,690 ÷ 505,883 shares of common stock issued and outstanding) | | $ | 20.02 | | | | | |
| | | | | | | | |
| | |
Class R | | | | | | | | |
| | |
Net asset value, offering price and redemption price per share, | | | | | | | | |
($81,478,835 ÷ 6,513,856 shares of common stock issued and outstanding) | | $ | 12.51 | | | | | |
| | | | | | | | |
| | |
Class Z | | | | | | | | |
| | |
Net asset value, offering price and redemption price per share, | | | | | | | | |
($625,973,208 ÷ 29,409,215 shares of common stock issued and outstanding) | | $ | 21.28 | | | | | |
| | | | | | | | |
| | |
Class R2 | | | | | | | | |
| | |
Net asset value, offering price and redemption price per share, | | | | | | | | |
($4,200,365 ÷ 197,388 shares of common stock issued and outstanding) | | $ | 21.28 | | | | | |
| | | | | | | | |
| | |
Class R4 | | | | | | | | |
| | |
Net asset value, offering price and redemption price per share, | | | | | | | | |
($37,242,179 ÷ 1,698,856 shares of common stock issued and outstanding) | | $ | 21.92 | | | | | |
| | | | | | | | |
| | |
Class R6 | | | | | | | | |
| | |
Net asset value, offering price and redemption price per share, | | | | | | | | |
($962,058,809 ÷ 42,670,419 shares of common stock issued and outstanding) | | $ | 22.55 | | | | | |
| | | | | | | | |
See Notes to Financial Statements.
PGIM Jennison Mid-Cap Growth Fund 9
Statement of Operations
Year Ended August 31, 2024
| | | | |
Net Investment Income (Loss) | |
| |
Income | | | | |
Unaffiliated dividend income (net of $10,588 foreign withholding tax) | | $ | 9,699,512 | |
Affiliated dividend income | | | 2,687,974 | |
Income from securities lending, net (including affiliated income of $310,447) | | | 310,861 | |
| | | | |
Total income | | | 12,698,347 | |
| | | | |
| |
Expenses | | | | |
Management fee | | | 13,369,894 | |
Distribution fee(a) | | | 2,960,700 | |
Shareholder servicing fees(a) | | | 35,433 | |
Transfer agent’s fees and expenses (including affiliated expense of $378,361)(a) | | | 2,131,742 | |
Shareholders’ reports | | | 161,466 | |
Registration fees(a) | | | 146,993 | |
Custodian and accounting fees | | | 146,563 | |
Professional fees | | | 52,624 | |
Directors’ fees | | | 43,364 | |
Audit fee | | | 25,440 | |
Miscellaneous | | | 49,278 | |
| | | | |
Total expenses | | | 19,123,497 | |
Less: Fee waiver and/or expense reimbursement(a) | | | (24,414 | ) |
Distribution fee waiver(a) | | | (211,174 | ) |
| | | | |
Net expenses | | | 18,887,909 | |
| | | | |
Net investment income (loss) | | | (6,189,562 | ) |
| | | | |
| |
Realized And Unrealized Gain (Loss) On Investments | | | | |
| |
Net realized gain (loss) on investment transactions (including affiliated of $203,646) | | | 134,790,748 | |
Net change in unrealized appreciation (depreciation) on investments (including affiliated of $(176,728)) | | | 136,887,352 | |
| | | | |
| |
Net gain (loss) on investment transactions | | | 271,678,100 | |
| | | | |
| |
Net Increase (Decrease) In Net Assets Resulting From Operations | | $ | 265,488,538 | |
| | | | |
(a) Class specific expenses and waivers were as follows:
| | | | | | | | | | | | | | | | | | | | | | | | | | | | |
| | | Class A | | | Class C | | | Class R | | | Class Z | | | Class R2 | | | Class R4 | | | Class R6 | |
Distribution fee | | | 2,217,317 | | | | 101,052 | | | | 633,522 | | | | — | | | | 8,809 | | | | — | | | | — | |
Shareholder servicing fees | | | — | | | | — | | | | — | | | | — | | | | 3,524 | | | | 31,909 | | | | — | |
Transfer agent’s fees and expenses | | | 1,101,559 | | | | 26,428 | | | | 130,881 | | | | 775,061 | | | | 6,881 | | | | 49,218 | | | | 41,714 | |
Registration fees | | | 28,608 | | | | 21,008 | | | | 12,225 | | | | 35,375 | | | | 8,427 | | | | 8,926 | | | | 32,424 | |
Fee waiver and/or expense reimbursement | | | — | | | | — | | | | — | | | | — | | | | (10,432) | | | | (13,982) | | | | — | |
Distribution fee waiver | | | — | | | | — | | | | (211,174) | | | | — | | | | — | | | | — | | | | — | |
See Notes to Financial Statements.
10
Statements of Changes in Net Assets
| | | | | | | | |
| |
| | | Year Ended August 31, | |
| | | | |
| | |
| | | 2024 | | | 2023 | |
| | |
Increase (Decrease) in Net Assets | | | | | | | | |
| | |
Operations | | | | | | | | |
Net investment income (loss) | | $ | (6,189,562 | ) | | $ | (8,288,011 | ) |
Net realized gain (loss) on investment transactions | | | 134,790,748 | | | | 76,851,694 | |
Net change in unrealized appreciation (depreciation) on investments | | | 136,887,352 | | | | 178,231,787 | |
| | | | | | | | |
Net increase (decrease) in net assets resulting from operations | | | 265,488,538 | | | | 246,795,470 | |
| | | | | | | | |
| | |
Dividends and Distributions | | | | | | | | |
Distributions from distributable earnings | | | | | | | | |
Class A | | | (31,581,817 | ) | | | (13,462,342 | ) |
Class C | | | (325,753 | ) | | | (138,596 | ) |
Class R | | | (4,431,988 | ) | | | (1,866,862 | ) |
Class Z | | | (18,997,852 | ) | | | (7,166,248 | ) |
Class R2 | | | (103,422 | ) | | | (16,516 | ) |
Class R4 | | | (827,780 | ) | | | (282,910 | ) |
Class R6 | | | (22,527,625 | ) | | | (7,682,402 | ) |
| | | | | | | | |
| | | (78,796,237 | ) | | | (30,615,876 | ) |
| | | | | | | | |
Fund share transactions (Net of share conversions) | | | | | | | | |
Net proceeds from shares sold | | | 538,622,417 | | | | 358,855,839 | |
Net asset value of shares issued in reinvestment of dividends and distributions | | | 74,953,002 | | | | 29,165,538 | |
Cost of shares purchased | | | (518,688,493 | ) | | | (473,461,801 | ) |
| | | | | | | | |
Net increase (decrease) in net assets from Fund share transactions | | | 94,886,926 | | | | (85,440,424 | ) |
| | | | | | | | |
| | |
Total increase (decrease) | | | 281,579,227 | | | | 130,739,170 | |
| | |
Net Assets: | | | | | | | | |
| | |
Beginning of year | | | 2,178,633,557 | | | | 2,047,894,387 | |
| | | | | | | | |
End of year | | $ | 2,460,212,784 | | | $ | 2,178,633,557 | |
| | | | | | | | |
See Notes to Financial Statements.
PGIM Jennison Mid-Cap Growth Fund 11
Financial Highlights
| | | | | | | | | | | | | | | | | | | | |
| | | | | | |
| Class A Shares | | | | | | | | | | | | | | | |
| | |
| | | Year Ended August 31, | |
| | | | | | |
| | | 2024 | | | 2023 | | | 2022 | | | 2021 | | | 2020 | |
| | | | | | |
Per Share Operating Performance(a): | | | | | | | | | | | | | | | | | | | | |
Net Asset Value, Beginning of Year | | | $14.21 | | | | $12.85 | | | | $23.79 | | | | $25.32 | | | | $29.35 | |
Income (loss) from investment operations: | | | | | | | | | | | | | | | | | | | | |
Net investment income (loss) | | | (0.07 | ) | | | (0.08 | ) | | | (0.11 | ) | | | (0.15 | ) | | | (0.10 | ) |
| Net realized and unrealized gain (loss) on investment transactions | | | 1.66 | | | | 1.68 | | | | (3.99 | ) | | | 8.28 | | | | 4.84 | |
Total from investment operations | | | 1.59 | | | | 1.60 | | | | (4.10 | ) | | | 8.13 | | | | 4.74 | |
Less Dividends and Distributions: | | | | | | | | | | | | | | | | | | | | |
Distributions from net realized gains | | | (0.62 | ) | | | (0.24 | ) | | | (6.84 | ) | | | (9.66 | ) | | | (8.77 | ) |
Net asset value, end of year | | | $15.18 | | | | $14.21 | | | | $12.85 | | | | $23.79 | | | | $25.32 | |
Total Return(b): | | | 11.55 | % | | | 12.63 | % | | | (23.87 | )% | | | 38.68 | % | | | 21.73 | % |
| | | | | | | | | | | | | | | | | | | | | |
| Ratios/Supplemental Data: | | | | | | | | | | | | | | | |
Net assets, end of year (000) | | | $739,130 | | | | $748,452 | | | | $755,816 | | | | $1,126,764 | | | | $925,117 | |
Average net assets (000) | | | $739,106 | | | | $734,728 | | | | $925,727 | | | | $1,056,327 | | | | $867,188 | |
Ratios to average net assets(c): | | | | | | | | | | | | | | | | | | | | |
Expenses after waivers and/or expense reimbursement | | | 1.04 | % | | | 1.07 | % | | | 1.05 | % | | | 1.03 | % | | | 1.06 | % |
Expenses before waivers and/or expense reimbursement | | | 1.04 | % | | | 1.07 | % | | | 1.05 | % | | | 1.03 | % | | | 1.06 | % |
Net investment income (loss) | | | (0.50 | )% | | | (0.63 | )% | | | (0.69 | )% | | | (0.65 | )% | | | (0.42 | )% |
Portfolio turnover rate(d) | | | 61 | % | | | 38 | % | | | 51 | % | | | 71 | % | | | 58 | % |
| (a) | Calculated based on average shares outstanding during the year. |
| (b) | Total return does not consider the effects of sales loads. Total return is calculated assuming a purchase of a share on the first day and a sale on the last day of each year reported and includes reinvestment of dividends and distributions, if any. Total returns may reflect adjustments to conform to GAAP. |
| (c) | Does not include expenses of the underlying funds in which the Fund invests. |
| (d) | The Fund’s portfolio turnover rate is calculated in accordance with regulatory requirements, without regard to transactions involving short-term investments, certain derivatives and in-kind transactions (if any). If such transactions were included, the Fund’s portfolio turnover rate may be higher. |
See Notes to Financial Statements.
12
| | | | | | | | | | | | | | | | | | | | |
| | | | | | |
| Class C Shares | | | | | | | | | | | | | | | |
| | |
| | | Year Ended August 31, | |
| | | | | | |
| | | 2024 | | | 2023 | | | 2022(a) | | | 2021(a) | | | 2020(a) | |
| | | | | | |
Per Share Operating Performance(b): | | | | | | | | | | | | | | | | | | | | |
Net Asset Value, Beginning of Year | | | $18.74 | | | | $17.02 | | | | $29.48 | | | | $54.12 | | | | $79.08 | |
Income (loss) from investment operations: | | | | | | | | | | | | | | | | | | | | |
Net investment income (loss) | | | (0.29 | ) | | | (0.27 | ) | | | (0.33 | ) | | | (0.48 | ) | | | (0.60 | ) |
| Net realized and unrealized gain (loss) on investment transactions | | | 2.19 | | | | 2.23 | | | | (5.29 | ) | | | 14.48 | | | | 10.72 | |
Total from investment operations | | | 1.90 | | | | 1.96 | | | | (5.62 | ) | | | 14.00 | | | | 10.12 | |
Less Dividends and Distributions: | | | | | | | | | | | | | | | | | | | | |
Distributions from net realized gains | | | (0.62 | ) | | | (0.24 | ) | | | (6.84 | ) | | | (38.64 | ) | | | (35.08 | ) |
Net asset value, end of year | | | $20.02 | | | | $18.74 | | | | $17.02 | | | | $29.48 | | | | $54.12 | |
Total Return(c): | | | 10.44 | % | | | 11.64 | % | | | (24.54 | )% | | | 37.57 | % | | | 20.95 | % |
| | | | | | | | | | | | | | | | | | | | | |
| Ratios/Supplemental Data: | | | | | | | | | | | | | | | |
Net assets, end of year (000) | | | $10,130 | | | | $9,936 | | | | $10,966 | | | | $17,586 | | | | $29,633 | |
Average net assets (000) | | | $10,105 | | | | $10,180 | | | | $13,699 | | | | $22,913 | | | | $34,773 | |
Ratios to average net assets(d): | | | | | | | | | | | | | | | | | | | | |
Expenses after waivers and/or expense reimbursement | | | 2.06 | % | | | 1.99 | % | | | 1.91 | % | | | 1.79 | % | | | 1.76 | % |
Expenses before waivers and/or expense reimbursement | | | 2.06 | % | | | 1.99 | % | | | 1.91 | % | | | 1.79 | % | | | 1.76 | % |
Net investment income (loss) | | | (1.52 | )% | | | (1.56 | )% | | | (1.55 | )% | | | (1.39 | )% | | | (1.10 | )% |
Portfolio turnover rate(e) | | | 61 | % | | | 38 | % | | | 51 | % | | | 71 | % | | | 58 | % |
| (a) | The Fund had a 4-for-1 reverse stock split effective December 27, 2021. Prior year net asset values and per share amounts have been restated to reflect the impact of the reverse stock split. The net asset value reported at the original dates prior to the reverse stock split were $7.37 and $13.53 for the years ended August 31, 2021 and 2020, respectively. |
| (b) | Calculated based on average shares outstanding during the year. |
| (c) | Total return does not consider the effects of sales loads. Total return is calculated assuming a purchase of a share on the first day and a sale on the last day of each year reported and includes reinvestment of dividends and distributions, if any. Total returns may reflect adjustments to conform to GAAP. |
| (d) | Does not include expenses of the underlying funds in which the Fund invests. |
| (e) | The Fund’s portfolio turnover rate is calculated in accordance with regulatory requirements, without regard to transactions involving short-term investments, certain derivatives and in-kind transactions (if any). If such transactions were included, the Fund’s portfolio turnover rate may be higher. |
See Notes to Financial Statements.
PGIM Jennison Mid-Cap Growth Fund 13
Financial Highlights (continued)
| | | | | | | | | | | | | | | | | | | | |
| | | | | | |
| Class R Shares | | | | | | | | | | | | | | | |
| | |
| | | Year Ended August 31, | |
| | | | | | |
| | | 2024 | | | 2023 | | | 2022 | | | 2021 | | | 2020 | |
| | | | | | |
Per Share Operating Performance(a): | | | | | | | | | | | | | | | | | | | | |
Net Asset Value, Beginning of Year | | | $11.84 | | | | $10.77 | | | | $21.09 | | | | $23.41 | | | | $27.83 | |
Income (loss) from investment operations: | | | | | | | | | | | | | | | | | | | | |
Net investment income (loss) | | | (0.09 | ) | | | (0.09 | ) | | | (0.13 | ) | | | (0.18 | ) | | | (0.13 | ) |
| Net realized and unrealized gain (loss) on investment transactions | | | 1.38 | | | | 1.40 | | | | (3.35 | ) | | | 7.52 | | | | 4.48 | |
Total from investment operations | | | 1.29 | | | | 1.31 | | | | (3.48 | ) | | | 7.34 | | | | 4.35 | |
Less Dividends and Distributions: | | | | | | | | | | | | | | | | | | | | |
Distributions from net realized gains | | | (0.62 | ) | | | (0.24 | ) | | | (6.84 | ) | | | (9.66 | ) | | | (8.77 | ) |
Net asset value, end of year | | | $12.51 | | | | $11.84 | | | | $10.77 | | | | $21.09 | | | | $23.41 | |
Total Return(b): | | | 11.40 | % | | | 12.37 | % | | | (24.05 | )% | | | 38.38 | % | | | 21.56 | % |
| | | | | | | | | | | | | | | | | | | | | |
| Ratios/Supplemental Data: | | | | | | | | | | | | | | | |
Net assets, end of year (000) | | | $81,479 | | | | $87,966 | | | | $91,437 | | | | $139,403 | | | | $124,024 | |
Average net assets (000) | | | $84,470 | | | | $85,193 | | | | $111,055 | | | | $135,345 | | | | $121,955 | |
Ratios to average net assets(c): | | | | | | | | | | | | | | | | | | | | |
Expenses after waivers and/or expense reimbursement | | | 1.26 | % | | | 1.25 | % | | | 1.26 | % | | | 1.24 | % | | | 1.26 | % |
Expenses before waivers and/or expense reimbursement | | | 1.51 | % | | | 1.50 | % | | | 1.51 | % | | | 1.49 | % | | | 1.51 | % |
Net investment income (loss) | | | (0.72 | )% | | | (0.82 | )% | | | (0.90 | )% | | | (0.86 | )% | | | (0.61 | )% |
Portfolio turnover rate(d) | | | 61 | % | | | 38 | % | | | 51 | % | | | 71 | % | | | 58 | % |
| (a) | Calculated based on average shares outstanding during the year. |
| (b) | Total return is calculated assuming a purchase of a share on the first day and a sale on the last day of each year reported and includes reinvestment of dividends and distributions, if any. Total returns may reflect adjustments to conform to GAAP. |
| (c) | Does not include expenses of the underlying funds in which the Fund invests. |
| (d) | The Fund’s portfolio turnover rate is calculated in accordance with regulatory requirements, without regard to transactions involving short-term investments, certain derivatives and in-kind transactions (if any). If such transactions were included, the Fund’s portfolio turnover rate may be higher. |
See Notes to Financial Statements.
14
| | | | | | | | | | | | | | | | | | | | |
| | | | | | |
| Class Z Shares | | | | | | | | | | | | | | | |
| | |
| | | Year Ended August 31, | |
| | | | | | |
| | | 2024 | | | 2023 | | | 2022 | | | 2021 | | | 2020 | |
| | | | | | |
Per Share Operating Performance(a): | | | | | | | | | | | | | | | | | | | | |
Net Asset Value, Beginning of Year | | | $19.62 | | | | $17.59 | | | | $29.94 | | | | $29.67 | | | | $32.84 | |
Income (loss) from investment operations: | | | | | | | | | | | | | | | | | | | | |
Net investment income (loss) | | | (0.04 | ) | | | (0.05 | ) | | | (0.08 | ) | | | (0.09 | ) | | | (0.02 | ) |
| Net realized and unrealized gain (loss) on investment transactions | | | 2.32 | | | | 2.32 | | | | (5.43 | ) | | | 10.02 | | | | 5.62 | |
Total from investment operations | | | 2.28 | | | | 2.27 | | | | (5.51 | ) | | | 9.93 | | | | 5.60 | |
Less Dividends and Distributions: | | | | | | | | | | | | | | | | | | | | |
Distributions from net realized gains | | | (0.62 | ) | | | (0.24 | ) | | | (6.84 | ) | | | (9.66 | ) | | | (8.77 | ) |
Net asset value, end of year | | | $21.28 | | | | $19.62 | | | | $17.59 | | | | $29.94 | | | | $29.67 | |
Total Return(b): | | | 11.94 | % | | | 13.04 | % | | | (23.64 | )% | | | 39.12 | % | | | 22.16 | % |
| | | | | | | | | | | | | | | | | | | | | |
| Ratios/Supplemental Data: | | | | | | | | | | | | | | | |
Net assets, end of year (000) | | | $625,973 | | | | $595,557 | | | | $564,177 | | | | $845,309 | | | | $771,068 | |
Average net assets (000) | | | $618,082 | | | | $556,388 | | | | $682,445 | | | | $829,228 | | | | $896,694 | |
Ratios to average net assets(c): | | | | | | | | | | | | | | | | | | | | |
Expenses after waivers and/or expense reimbursement | | | 0.72 | % | | | 0.73 | % | | | 0.71 | % | | | 0.70 | % | | | 0.74 | % |
Expenses before waivers and/or expense reimbursement | | | 0.72 | % | | | 0.73 | % | | | 0.71 | % | | | 0.70 | % | | | 0.74 | % |
Net investment income (loss) | | | (0.18 | )% | | | (0.29 | )% | | | (0.36 | )% | | | (0.32 | )% | | | (0.08 | )% |
Portfolio turnover rate(d) | | | 61 | % | | | 38 | % | | | 51 | % | | | 71 | % | | | 58 | % |
| (a) | Calculated based on average shares outstanding during the year. |
| (b) | Total return is calculated assuming a purchase of a share on the first day and a sale on the last day of each year reported and includes reinvestment of dividends and distributions, if any. Total returns may reflect adjustments to conform to GAAP. |
| (c) | Does not include expenses of the underlying funds in which the Fund invests. |
| (d) | The Fund’s portfolio turnover rate is calculated in accordance with regulatory requirements, without regard to transactions involving short-term investments, certain derivatives and in-kind transactions (if any). If such transactions were included, the Fund’s portfolio turnover rate may be higher. |
See Notes to Financial Statements.
PGIM Jennison Mid-Cap Growth Fund 15
Financial Highlights (continued)
| | | | | | | | | | | | | | | | | | | | |
| | | | | | |
| Class R2 Shares | | | | | | | | | | | | | | | |
| | |
| | | Year Ended August 31, | |
| | | | | | |
| | | 2024 | | | 2023 | | | 2022 | | | 2021 | | | 2020 | |
| | | | | | |
Per Share Operating Performance(a): | | | | | | | | | | | | | | | | | | | | |
Net Asset Value, Beginning of Year | | | $19.68 | | | | $17.71 | | | | $30.19 | | | | $29.94 | | | | $33.15 | |
Income (loss) from investment operations: | | | | | | | | | | | | | | | | | | | | |
Net investment income (loss) | | | (0.11 | ) | | | (0.12 | ) | | | (0.16 | ) | | | (0.22 | ) | | | (0.12 | ) |
| Net realized and unrealized gain (loss) on investment transactions | | | 2.33 | | | | 2.33 | | | | (5.48 | ) | | | 10.13 | | | | 5.68 | |
Total from investment operations | | | 2.22 | | | | 2.21 | | | | (5.64 | ) | | | 9.91 | | | | 5.56 | |
Less Dividends and Distributions: | | | | | | | | | | | | | | | | | | | | |
Distributions from net realized gains | | | (0.62 | ) | | | (0.24 | ) | | | (6.84 | ) | | | (9.66 | ) | | | (8.77 | ) |
Net asset value, end of year | | | $21.28 | | | | $19.68 | | | | $17.71 | | | | $30.19 | | | | $29.94 | |
Total Return(b): | | | 11.59 | % | | | 12.60 | % | | | (23.92 | )% | | | 38.60 | % | | | 21.74 | % |
| | | | | | | | | | | | | | | | | | | | | |
| Ratios/Supplemental Data: | | | | | | | | | | | | | | | |
Net assets, end of year (000) | | | $4,200 | | | | $1,858 | | | | $1,269 | | | | $1,851 | | | | $650 | |
Average net assets (000) | | | $3,524 | | | | $1,402 | | | | $1,523 | | | | $1,050 | | | | $562 | |
Ratios to average net assets(c): | | | | | | | | | | | | | | | | | | | | |
Expenses after waivers and/or expense reimbursement | | | 1.08 | % | | | 1.08 | % | | | 1.08 | % | | | 1.08 | % | | | 1.08 | % |
Expenses before waivers and/or expense reimbursement | | | 1.38 | % | | | 1.56 | % | | | 1.63 | % | | | 1.98 | % | | | 3.70 | % |
Net investment income (loss) | | | (0.53 | )% | | | (0.64 | )% | | | (0.72 | )% | | | (0.75 | )% | | | (0.45 | )% |
Portfolio turnover rate(d) | | | 61 | % | | | 38 | % | | | 51 | % | | | 71 | % | | | 58 | % |
| (a) | Calculated based on average shares outstanding during the year. |
| (b) | Total return is calculated assuming a purchase of a share on the first day and a sale on the last day of each year reported and includes reinvestment of dividends and distributions, if any. Total returns may reflect adjustments to conform to GAAP. |
| (c) | Does not include expenses of the underlying funds in which the Fund invests. |
| (d) | The Fund’s portfolio turnover rate is calculated in accordance with regulatory requirements, without regard to transactions involving short-term investments, certain derivatives and in-kind transactions (if any). If such transactions were included, the Fund’s portfolio turnover rate may be higher. |
See Notes to Financial Statements.
16
| | | | | | | | | | | | | | | | | | | | |
| | | | | | |
| Class R4 Shares | | | | | | | | | | | | | | | |
| | |
| | | Year Ended August 31, | |
| | | | | | |
| | | 2024 | | | 2023 | | | 2022 | | | 2021 | | | 2020 | |
| | | | | | |
Per Share Operating Performance(a): | | | | | | | | | | | | | | | | | | | | |
Net Asset Value, Beginning of Year | | | $20.21 | | | | $18.13 | | | | $30.68 | | | | $30.24 | | | | $33.33 | |
Income (loss) from investment operations: | | | | | | | | | | | | | | | | | | | | |
Net investment income (loss) | | | (0.06 | ) | | | (0.07 | ) | | | (0.10 | ) | | | (0.14 | ) | | | (0.09 | ) |
| Net realized and unrealized gain (loss) on investment transactions | | | 2.39 | | | | 2.39 | | | | (5.61 | ) | | | 10.24 | | | | 5.77 | |
Total from investment operations | | | 2.33 | | | | 2.32 | | | | (5.71 | ) | | | 10.10 | | | | 5.68 | |
Less Dividends and Distributions: | | | | | | | | | | | | | | | | | | | | |
Distributions from net realized gains | | | (0.62 | ) | | | (0.24 | ) | | | (6.84 | ) | | | (9.66 | ) | | | (8.77 | ) |
Net asset value, end of year | | | $21.92 | | | | $20.21 | | | | $18.13 | | | | $30.68 | | | | $30.24 | |
Total Return(b): | | | 11.84 | % | | | 12.92 | % | | | (23.74 | )% | | | 38.90 | % | | | 22.05 | % |
| | | | | | | | | | | | | | | | | | | | | |
| Ratios/Supplemental Data: | | | | | | | | | | | | | | | |
Net assets, end of year (000) | | $ | 37,242 | | | $ | 26,663 | | | $ | 20,254 | | | | $1,810 | | | | $1,088 | |
Average net assets (000) | | $ | 31,909 | | | $ | 23,220 | | | $ | 17,358 | | | | $1,421 | | | | $531 | |
Ratios to average net assets(c): | | | | | | | | | | | | | | | | | | | | |
Expenses after waivers and/or expense reimbursement | | | 0.83 | % | | | 0.83 | % | | | 0.83 | % | | | 0.83 | % | | | 0.83 | % |
Expenses before waivers and/or expense reimbursement | | | 0.87 | % | | | 0.87 | % | | | 0.88 | % | | | 1.50 | % | | | 3.58 | % |
Net investment income (loss) | | | (0.29 | )% | | | (0.40 | )% | | | (0.46 | )% | | | (0.47 | )% | | | (0.33 | )% |
Portfolio turnover rate(d) | | | 61 | % | | | 38 | % | | | 51 | % | | | 71 | % | | | 58 | % |
| (a) | Calculated based on average shares outstanding during the year. |
| (b) | Total return is calculated assuming a purchase of a share on the first day and a sale on the last day of each year reported and includes reinvestment of dividends and distributions, if any. Total returns may reflect adjustments to conform to GAAP. |
| (c) | Does not include expenses of the underlying funds in which the Fund invests. |
| (d) | The Fund’s portfolio turnover rate is calculated in accordance with regulatory requirements, without regard to transactions involving short-term investments, certain derivatives and in-kind transactions (if any). If such transactions were included, the Fund’s portfolio turnover rate may be higher. |
See Notes to Financial Statements.
PGIM Jennison Mid-Cap Growth Fund 17
Financial Highlights (continued)
| | | | | | | | | | | | | | | | | | | | |
| | | | | | |
| Class R6 Shares | | | | | | | | | | | | | | | |
| | |
| | | Year Ended August 31, | |
| | | | | | |
| | | 2024 | | | 2023 | | | 2022 | | | 2021 | | | 2020 | |
| | | | | | |
Per Share Operating Performance(a): | | | | | | | | | | | | | | | | | | | | |
Net Asset Value, Beginning of Year | | | $20.72 | | | | $18.54 | | | | $31.16 | | | | $30.52 | | | | $33.50 | |
Income (loss) from investment operations: | | | | | | | | | | | | | | | | | | | | |
Net investment income (loss) | | | (0.01 | ) | | | (0.03 | ) | | | (0.05 | ) | | | (0.06 | ) | | | 0.01 | |
| Net realized and unrealized gain (loss) on investment transactions | | | 2.46 | | | | 2.45 | | | | (5.73 | ) | | | 10.36 | | | | 5.78 | |
Total from investment operations | | | 2.45 | | | | 2.42 | | | | (5.78 | ) | | | 10.30 | | | | 5.79 | |
Less Dividends and Distributions: | | | | | | | | | | | | | | | | | | | | |
Distributions from net realized gains | | | (0.62 | ) | | | (0.24 | ) | | | (6.84 | ) | | | (9.66 | ) | | | (8.77 | ) |
Net asset value, end of year | | | $22.55 | | | | $20.72 | | | | $18.54 | | | | $31.16 | | | | $30.52 | |
Total Return(b): | | | 12.13 | % | | | 13.18 | % | | | (23.57 | )% | | | 39.27 | % | | | 22.32 | % |
| | | | | | | | | | | | | | | | | | | | | |
| Ratios/Supplemental Data: | | | | | | | | | | | | | | | |
Net assets, end of year (000) | | $ | 962,059 | | | $ | 708,201 | | | $ | 603,976 | | | $ | 878,037 | | | $ | 682,514 | |
Average net assets (000) | | $ | 852,785 | | | $ | 633,368 | | | $ | 736,358 | | | $ | 789,403 | | | $ | 640,757 | |
Ratios to average net assets(c): | | | | | | | | | | | | | | | | | | | | |
Expenses after waivers and/or expense reimbursement | | | 0.60 | % | | | 0.60 | % | | | 0.60 | % | | | 0.59 | % | | | 0.60 | % |
Expenses before waivers and/or expense reimbursement | | | 0.60 | % | | | 0.60 | % | | | 0.60 | % | | | 0.59 | % | | | 0.60 | % |
Net investment income (loss) | | | (0.06 | )% | | | (0.17 | )% | | | (0.24 | )% | | | (0.21 | )% | | | 0.04 | % |
Portfolio turnover rate(d) | | | 61 | % | | | 38 | % | | | 51 | % | | | 71 | % | | | 58 | % |
| (a) | Calculated based on average shares outstanding during the year. |
| (b) | Total return is calculated assuming a purchase of a share on the first day and a sale on the last day of each year reported and includes reinvestment of dividends and distributions, if any. Total returns may reflect adjustments to conform to GAAP. |
| (c) | Does not include expenses of the underlying funds in which the Fund invests. |
| (d) | The Fund’s portfolio turnover rate is calculated in accordance with regulatory requirements, without regard to transactions involving short-term investments, certain derivatives and in-kind transactions (if any). If such transactions were included, the Fund’s portfolio turnover rate may be higher. |
See Notes to Financial Statements.
18
Notes to Financial Statements
Prudential Jennison Mid-Cap Growth Fund, Inc. (the “Registered Investment Company” or “RIC”) is registered under the Investment Company Act of 1940, as amended (“1940 Act”), as an open-end management investment company. The RIC is organized as a Maryland Corporation and PGIM Jennison Mid-Cap Growth Fund (the “Fund”) is the sole series of the RIC. The Fund is classified as a diversified fund for purposes of the 1940 Act.
The investment objective of the Fund is to achieve long-term capital appreciation.
The Fund follows the investment company accounting and reporting guidance of the Financial Accounting Standards Board (“FASB”) Accounting Standard Codification (“ASC”) Topic 946 Financial Services — Investment Companies. The following is a summary of significant accounting policies followed by the Fund in the preparation of its financial statements. The policies conform to U.S. generally accepted accounting principles (“GAAP”). The Fund consistently follows such policies in the preparation of its financial statements.
Securities Valuation: The Fund holds securities and other assets and liabilities that are fair valued as of the close of each day (generally, 4:00 PM Eastern time) the New York Stock Exchange (“NYSE”) is open for trading. As described in further detail below, the Fund’s investments are valued daily based on a number of factors, including the type of investment and whether market quotations are readily available. The RIC’s Board of Directors (the “Board”) has approved the Fund’s valuation policies and procedures for security valuation and designated PGIM Investments LLC (“PGIM Investments” or the “Manager”) as the “Valuation Designee,” as defined by Rule 2a-5(b) under the 1940 Act, to perform the fair value determination relating to all Fund investments. Pursuant to the Board’s oversight, the Valuation Designee has established a Valuation Committee to perform the duties and responsibilities of the Valuation Designee under Rule 2a-5. The valuation procedures permit the Fund to utilize independent pricing vendor services, quotations from market makers, and alternative valuation methods when market quotations are either not readily available or not deemed representative of fair value. Fair value is the estimated price that would be received to sell an asset or paid to transfer a liability in an orderly transaction between market participants on the measurement date.
For the fiscal reporting year-end, securities and other assets and liabilities were fair valued at the close of the last U.S. business day. Trading in certain foreign securities may occur when the NYSE is closed (including weekends and holidays). Because such foreign securities
PGIM Jennison Mid-Cap Growth Fund 19
Notes to Financial Statements (continued)
trade in markets that are open on weekends and U.S. holidays, the values of some of the Fund’s foreign investments may change on days when investors cannot purchase or redeem Fund shares.
Various inputs determine how the Fund’s investments are valued, all of which are categorized according to the three broad levels (Level 1, 2, or 3) detailed in the Schedule of Investments and referred to herein as the “fair value hierarchy” in accordance with FASB ASC Topic 820 Fair Value Measurement.
Common or preferred stocks, exchange-traded funds (“ETFs”) and derivative instruments, if applicable, that are traded on a national securities exchange are valued at the last sale price as of the close of trading on the applicable exchange where the security principally trades. Securities traded via NASDAQ are valued at the NASDAQ official closing price. To the extent these securities are valued at the last sale price or NASDAQ official closing price, they are classified as Level 1 in the fair value hierarchy. In the event that no sale or official closing price on a valuation date exists, these securities are generally valued at the mean between the last reported bid and ask prices, or at the last bid price in the absence of an ask price. These securities are classified as Level 2 in the fair value hierarchy.
Investments in open-end funds (other than ETFs) are valued at their net asset values as of the close of the NYSE on the date of valuation. These securities are classified as Level 1 in the fair value hierarchy since they may be purchased or sold at their net asset values on the date of valuation.
Securities and other assets that cannot be priced according to the methods described above are valued based on policies and procedures approved by the Board. In the event that unobservable inputs are used when determining such valuations, the securities will be classified as Level 3 in the fair value hierarchy. Altering one or more unobservable inputs may result in a significant change to a Level 3 security’s fair value measurement.
When determining the fair value of securities, some of the factors influencing the valuation include: the nature of any restrictions on disposition of the securities; assessment of the general liquidity of the securities; the issuer’s financial condition and the markets in which it does business; the cost of the investment; the size of the holding and the capitalization of the issuer; the prices of any recent transactions or bids/offers for such securities or any comparable securities; and any available analyst media or other reports or information deemed reliable by the Valuation Designee regarding the issuer or the markets or industry in which it operates. Using fair value to price securities may result in a value that is different from a security’s most recent closing price and from the price used by other unaffiliated mutual funds to calculate their net asset values.
20
Master Netting Arrangements: The RIC, on behalf of the Fund, is subject to various Master Agreements, or netting arrangements, with select counterparties. These are agreements which a subadviser may have negotiated and entered into on behalf of all or a portion of the Fund. A master netting arrangement between the Fund and the counterparty permits the Fund to offset amounts payable by the Fund to the same counterparty against amounts to be received and by the receipt of collateral from the counterparty by the Fund to cover the Fund’s exposure to the counterparty. However, there is no assurance that such mitigating factors are easily enforceable. In addition to master netting arrangements, the right to set-off exists when all the conditions are met such that each of the parties owes the other determinable amounts, the reporting party has the right to set-off the amount owed with the amount owed by the other party, the reporting party intends to set-off and the right of set-off is enforceable by law.
Securities Lending: The Fund lends its portfolio securities to banks and broker-dealers. The loans are secured by collateral at least equal to the market value of the securities loaned. Collateral pledged by each borrower is invested in an affiliated money market fund and is marked to market daily, based on the previous day’s market value, such that the value of the collateral exceeds the value of the loaned securities. In the event of significant appreciation in value of the securities on loan on the last business day of the reporting period, the financial statements may reflect a collateral value that is less than the market value of the loaned securities. Such shortfall is remedied as described above. Loans are subject to termination at the option of the borrower or the Fund. Upon termination of the loan, the borrower will return to the Fund securities identical to the loaned securities. The remaining open loans of the securities lending transactions are considered overnight and continuous. Should the borrower of the securities fail financially, the Fund has the right to repurchase the securities in the open market using the collateral.
The Fund recognizes income, net of any rebate and securities lending agent fees, for lending its securities in the form of fees or interest on the investment of any cash received as collateral. The borrower receives all interest and dividends from the securities loaned and such payments are passed back to the lender in amounts equivalent thereto, which are reflected in interest income or unaffiliated dividend income based on the nature of the payment on the Statement of Operations. The Fund also continues to recognize any unrealized gain (loss) in the market price of the securities loaned and on the change in the value of the collateral invested that may occur during the term of the loan. In addition, realized gain (loss) is recognized on changes in the value of the collateral invested upon liquidation of the collateral. Net earnings from securities lending are disclosed in the Statement of Operations.
Securities Transactions and Net Investment Income: Securities transactions are recorded on the trade date. Realized gains (losses) from investment and currency transactions are calculated on the specific identification method. Dividend income is recorded on the ex-date, or for certain foreign securities, when the Fund becomes aware of such dividends. Expenses are recorded on an accrual basis, which may require the use of certain estimates by management that may differ from actual expense amounts. Net investment income or
PGIM Jennison Mid-Cap Growth Fund 21
Notes to Financial Statements (continued)
loss (other than class specific expenses and waivers, which are allocated as noted below) and unrealized and realized gains (losses) are allocated daily to each class of shares based upon the relative proportion of adjusted net assets of each class at the beginning of the day. Class specific expenses and waivers, where applicable, are charged to the respective share classes. Such class specific expenses and waivers include distribution fees and distribution fee waivers, shareholder servicing fees, transfer agent’s fees and expenses, registration fees and fee waivers and/or expense reimbursements, as applicable.
Taxes: It is the Fund’s policy to continue to meet the requirements of the Internal Revenue Code applicable to regulated investment companies and to distribute all of its taxable net investment income and capital gains, if any, to its shareholders. Therefore, no federal income tax provision is required. Withholding taxes on foreign dividends, interest and capital gains, if any, are recorded, net of reclaimable amounts, at the time the related income is earned.
Dividends and Distributions: Dividends and distributions to shareholders, which are determined in accordance with federal income tax regulations and which may differ from GAAP, are recorded on the ex-date. Permanent book/tax differences relating to income and gain (loss) are reclassified between total distributable earnings (loss) and paid-in capital in excess of par, as appropriate. The chart below sets forth the expected frequency of dividend and capital gains distributions to shareholders. Various factors may impact the frequency of dividend distributions to shareholders, including but not limited to adverse market conditions or portfolio holding-specific events.
| | |
| | |
Expected Distribution Schedule to Shareholders* | | Frequency |
| |
Net Investment Income | | Annually |
| | |
Short-Term Capital Gains | | Annually |
| |
Long-Term Capital Gains | | Annually |
| * | Under certain circumstances, the Fund may make more than one distribution of short-term and/or long-term capital gains during a fiscal year. |
Estimates: The preparation of financial statements requires management to make estimates and assumptions that affect the reported amounts and disclosures in the financial statements. Actual results could differ from those estimates.
The RIC, on behalf of the Fund, has entered into a management agreement with the Manager pursuant to which it has responsibility for all investment advisory services, including supervision of the subadviser’s performance of such services, and for rendering administrative services.
22
The Manager has entered into a subadvisory agreement with Jennison Associates LLC (“Jennison” or “subadviser”). The Manager pays for the services of Jennison.
Fees payable under the management agreement are computed daily and paid monthly. For the reporting period ended August 31, 2024, the contractual and effective management fee rates were as follows:
| | | | |
| | |
| Contractual Management Rate | | Effective Management Fee, before any waivers
and/or expense reimbursements | |
0.60% of average daily net assets up to $1 billion; | | | 0.57% | |
0.55% of average daily net assets over $1 billion. | | | | |
The Manager has contractually agreed, through December 31, 2025, to limit transfer agency, shareholder servicing, sub-transfer agency, and blue sky fees, as applicable. This contractual expense limitation excludes interest, brokerage, taxes (such as income and foreign withholding taxes, stamp duty and deferred tax expenses), acquired fund fees and expenses, extraordinary expenses, and certain other Fund expenses such as dividend and interest expense and broker charges on short sales.
Where applicable, the Manager agrees to waive management fees or shared operating expenses on any share class to the same extent that it waives such expenses on any other share class. In addition, total annual operating expenses for Class R6 shares will not exceed total annual operating expenses for Class Z shares. Fees and/or expenses waived and/or reimbursed by the Manager for the purpose of preventing the expenses from exceeding a certain expense ratio limit may be recouped by the Manager within the same fiscal year during which such waiver and/or reimbursement is made if such recoupment can be realized without exceeding the expense limit in effect at the time of the waiver/reimbursement and/or recoupment for that fiscal year, as applicable. The expense limitations attributable to each class are as follows:
| | | | | | | | | | | | |
| | |
| Class | | Expense
Limitations | |
A | | | | | | | — | % | | | | |
C | | | | | | | — | | | | | |
R | | | | | | | — | | | | | |
| | | |
Z | | | | | | | — | | | | | |
| | | |
R2 | | | | | | | 1.08 | | | | | |
| | | |
R4 | | | | | | | 0.83 | | | | | |
| | | |
R6 | | | | | | | — | | | | | |
The RIC, on behalf of the Fund, has a distribution agreement with Prudential Investment Management Services LLC (“PIMS”), which acts as the distributor of the Class A, Class C, Class R, Class Z, Class R2, Class R4 and Class R6 shares of the Fund. The Fund compensates PIMS for distributing and servicing the Fund’s Class A, Class C, Class R and Class R2 shares, pursuant to the plans of distribution (the “Distribution Plans”), regardless of expenses actually incurred by PIMS.
PGIM Jennison Mid-Cap Growth Fund 23
Notes to Financial Statements (continued)
Pursuant to the Distribution Plans, the Fund compensates PIMS for distribution related activities at an annual rate based on average daily net assets per class. PIMS has contractually agreed through December 31, 2024 to limit such expenses. The distribution fees are accrued daily and payable monthly.
The Fund has adopted a Shareholder Services Plan with respect to Class R2 and Class R4 shares. Under the terms of the Shareholder Services Plan, Class R2 and Class R4 shares are authorized to compensate Prudential Mutual Fund Services LLC (“PMFS”), its affiliates or third-party service providers for services rendered to the shareholders of such Class R2 or Class R4 shares. The shareholder service fee is accrued daily and paid monthly, as applicable.
The Fund’s annual gross and net distribution rates and maximum shareholder service fee, where applicable, are as follows:
| | | | | | | | | | | | | | | | | | | | | | | | | | | | | | | | | | |
| | | | |
| Class | | Gross Distribution Fee | | | Net Distribution Fee | | | Shareholder Service Fee | |
| | | | | | | | | |
A | | | | | | | 0.30 | % | | | | | | | | | 0.30 | % | | | | | | | | | | | N/A | % | | | | |
| | | | | | | | | |
C | | | | | | | 1.00 | | | | | | | | | | 1.00 | | | | | | | | | | | | N/A | | | | | |
| | | | | | | | | |
R | | | | | | | 0.75 | | | | | | | | | | 0.50 | | | | | | | | | | | | N/A | | | | | |
| | | | | | | | | |
Z | | | | | | | N/A | | | | | | | | | | N/A | | | | | | | | | | | | N/A | | | | | |
| | | | | | | | | |
R2 | | | | | | | 0.25 | | | | | | | | | | 0.25 | | | | | | | | | | | | 0.10 | | | | | |
| | | | | | | | | |
R4 | | | | | | | N/A | | | | | | | | | | N/A | | | | | | | | | | | | 0.10 | | | | | |
| | | | | | | | | |
R6 | | | | | | | N/A | | | | | | | | | | N/A | | | | | | | | | | | | N/A | | | | | |
For the year ended August 31, 2024, PIMS received front-end sales charges (“FESL”) resulting from sales of certain class shares and contingent deferred sales charges (“CDSC”) imposed upon redemptions by certain shareholders. From these fees, PIMS paid such sales charges to broker-dealers, who in turn paid commissions to salespersons and incurred other distribution costs. The sales charges are as follows where applicable:
| | | | | | | | | | |
| | | | |
| Class | | FESL | | | | | | CDSC |
A | | $ | 166,558 | | | | | | | $274 |
C | | | — | | | | | | | 380 |
The RIC, on behalf of the Fund, has entered into brokerage commission recapture agreements with certain registered broker-dealers. Under the brokerage commission recapture program, a portion of the commission is returned to the Fund on whose behalf the trades were made. Commission recapture is paid solely to the Fund generating the applicable trades. Such amounts are included within realized gain (loss) on investment transactions presented in the Statement of Operations. For the reporting period ended August 31, 2024, brokerage commissions recaptured under these agreements was $52,687.
24
PGIM Investments, PIMS and Jennison are indirect, wholly-owned subsidiaries of Prudential Financial, Inc. (“Prudential”).
| 4. | Other Transactions with Affiliates |
PMFS serves as the Fund’s transfer agent and shareholder servicing agent. Transfer agent’s and shareholder servicing agent’s fees and expenses in the Statement of Operations include certain out-of-pocket expenses paid to non-affiliates, where applicable.
The Fund may invest its overnight sweep cash in the PGIM Core Government Money Market Fund (the “Core Government Fund”), a series of the Prudential Government Money Market Fund, Inc., and its securities lending cash collateral in the PGIM Institutional Money Market Fund (the “Money Market Fund”), a series of Prudential Investment Portfolios 2, each registered under the 1940 Act and managed by PGIM Investments. PGIM Investments and/or its affiliates are paid fees or reimbursed for providing their services to the Core Government Fund and the Money Market Fund. In addition to the realized and unrealized gains on investments in the Core Government Fund and the Money Market Fund, earnings from such investments are disclosed on the Statement of Operations as “Affiliated dividend income” and “Income from securities lending, net”, respectively.
The Fund may enter into certain securities purchase or sale transactions under Board approved Rule 17a-7 procedures. Rule 17a-7 is an exemptive rule under the 1940 Act that, subject to certain conditions, permits purchase and sale transactions among affiliated investment companies, or between an investment company and a person that is affiliated solely by reason of having a common (or affiliated) investment adviser, common directors/trustees, and/or common officers. For the year ended August 31, 2024, no Rule 17a-7 transactions were entered into by the Fund.
The aggregate cost of purchases and proceeds from sales of portfolio securities (excluding short-term investments and U.S. Government securities) for the reporting period ended August 31, 2024, were as follows:
| | |
| | |
| Cost of Purchases | | Proceeds from Sales |
| |
$1,389,626,632 | | $1,390,625,111 |
A summary of the cost of purchases and proceeds from sales of shares of affiliated mutual funds for the year ended August 31, 2024, is presented as follows:
PGIM Jennison Mid-Cap Growth Fund 25
Notes to Financial Statements (continued)
| | | | | | | | | | | | | | | | | | | | | | | | | | | | |
| | | | | | | | |
Value, Beginning of Year | | Cost of
Purchases | | | Proceeds from Sales | | | Change in
Unrealized Gain (Loss) | | | Realized Gain (Loss) | | | Value, End of Year | | | Shares, End of Year | | | Income | |
| | | | |
Short-Term Investments - Affiliated Mutual Funds: | | | | | | | | | | | | | | | | | |
| | |
PGIM Core Government Money Market Fund (7-day effective yield 5.562%)(1)(wb) | | | | | | | | | |
| | | | | | | |
$ 43,356,511 | | | $ 552,718,814 | | | | $ 552,473,969 | | | | $ — | | | | $ — | | | | $43,601,356 | | | | 43,601,356 | | | | $2,687,974 | |
|
PGIM Institutional Money Market Fund (7-day effective yield 5.595%)(1)(b)(wb) | |
| | | | | | | |
200,564,272 | | | 606,466,798 | | | | 807,057,988 | | | | (176,728) | | | | 203,646 | | | | — | | | | — | | | | 310,447 | (2) |
| | | | | | | |
$243,920,783 | | | $1,159,185,612 | | | | $1,359,531,957 | | | | $(176,728) | | | | $203,646 | | | | $43,601,356 | | | | | | | | $2,998,421 | |
| (1) | The Fund did not have any capital gain distributions during the reporting period. |
| (2) | The amount, or a portion thereof, represents the affiliated securities lending income shown on the Statement of Operations. |
| (b) | Represents security, or portion thereof, purchased with cash collateral received for securities on loan and includes dividend reinvestment. |
| (wb) | Represents an investment in a Fund affiliated with the Manager. |
| 6. | Distributions and Tax Information |
Distributions to shareholders, which are determined in accordance with federal income tax regulations and which may differ from GAAP, are recorded on the ex-date. In order to present total distributable earnings (loss) and paid-in capital in excess of par on the Statement of Assets and Liabilities that more closely represent their tax character, certain adjustments have been made to total distributable earnings (loss) and paid-in capital in excess of par for the Fund. The adjustments were due to a net operating loss.
For the year ended August 31, 2024, the adjustments were as follows:
| | | | | | |
| | | | |
| | | Total Distributable
Earnings (Loss) | | Paid-in Capital in Excess of Par | | |
| | | |
| | | $7,734,959 | | $(7,734,959) | | |
For the year ended August 31, 2024, the tax character of dividends paid as reflected in the Statement of Changes in Net Assets were as follows:
| | | | | | |
| | | | |
Ordinary
Income | | Long-Term
Capital Gains | | Tax Return
of Capital | | Total Dividends
and Distributions |
| | | |
| $— | | $78,796,237 | | $— | | $78,796,237 |
26
For the year ended August 31, 2023, the tax character of dividends paid as reflected in the Statement of Changes in Net Assets were as follows:
| | | | | | |
| | | | |
Ordinary
Income | | Long-Term
Capital Gains | | Tax Return
of Capital | | Total Dividends
and Distributions |
| | | |
| $— | | $30,615,876 | | $— | | $30,615,876 |
For the year ended August 31, 2024, the Fund had the following amounts of accumulated undistributed earnings on a tax basis:
| | | | | | | | |
| | | | | |
| | | Undistributed Ordinary Income | | | | Undistributed
Long-Term
Capital Gains | | |
| | | | |
| | | $— | | | | $131,701,863 | | |
The United States federal income tax basis of the Fund’s investments and the net unrealized appreciation as of August 31, 2024 were as follows:
| | | | | | |
| | | | |
| Tax Basis | | Gross
Unrealized
Appreciation | | Gross
Unrealized
Depreciation | | Net
Unrealized
Appreciation |
| | | |
| $1,860,128,251 | | $674,761,760 | | $(72,427,115) | | $602,334,645 |
The difference between GAAP and tax basis was primarily attributable to deferred losses on wash sales.
The Fund elected to treat the below approximated losses as having been incurred in the following fiscal year (August 31, 2025).
| | | | | | | | |
| | | | | |
| | | Qualified Late-Year
Losses | | | | Post-October
Capital Losses | | |
| | | | |
| | | $3,266,000 | | | | $— | | |
The Manager has analyzed the Fund’s tax positions taken on federal, state and local income tax returns for all open tax years and has concluded that no provision for income tax is required in the Fund’s financial statements for the current reporting period. Since tax authorities can examine previously filed tax returns, the Fund’s U.S. federal and state tax returns for each of the four fiscal years up to the most recent fiscal year ended August 31, 2024 are subject to such review.
The Fund offers Class A, Class C, Class R, Class Z, Class R2, Class R4 and Class R6 shares. Class A shares are sold with a maximum front-end sales charge of 5.50%. Investors who purchase $1 million or more of Class A shares and sell these shares within 12 months of purchase are subject to a CDSC of 1%, although they are not subject to an initial sales charge. The Class A CDSC is waived for certain retirement and/or benefit plans. A special exchange privilege is also available for shareholders who qualified to purchase Class A shares at net asset value. Class C shares are sold with a CDSC of 1% on sales made within
PGIM Jennison Mid-Cap Growth Fund 27
Notes to Financial Statements (continued)
12 months of purchase. Class C shares will automatically convert to Class A shares on a monthly basis approximately eight years (ten years prior to January 22, 2021) after purchase. Class R, Class Z, Class R2, Class R4 and Class R6 shares are not subject to any sales or redemption charges and are available exclusively for sale to a limited group of investors.
Under certain circumstances, an exchange may be made from specified share classes of the Fund to one or more other share classes of the Fund as presented in the table of transactions in shares of common stock, below.
The RIC is authorized to issue 2,000,000,000 shares of capital stock, $0.001 par value per share, designated as shares of the Fund. The shares are further classified and designated as follows:
| | | | | | | | |
| | | | | |
| Class | | | | | | | | Number of Shares |
| | | | |
| A | | | | | | | | 345,000,000 |
| | | | |
| B | | | | | | | | 5,000,000 |
| | | | |
| C | | | | | | | | 25,000,000 |
| | | | |
| R | | | | | | | | 125,000,000 |
| | | | |
| Z | | | | | | | | 800,000,000 |
| | | | |
| T | | | | | | | | 100,000,000 |
| | | | |
| R2 | | | | | | | | 100,000,000 |
| | | | |
| R4 | | | | | | | | 100,000,000 |
| | | | |
| R6 | | | | | | | | 400,000,000 |
The Fund currently does not have any Class B or Class T shares outstanding.
As of August 31, 2024, Prudential, through its affiliated entities, including affiliated funds (if applicable), owned shares of the Fund as follows:
| | | | |
| | | |
| Class | | Number of Shares | | Percentage of Outstanding Shares |
| | |
Z | | 7,303 | | 0.1% |
| | |
R4 | | 888 | | 0.1 |
At the reporting period end, the number of shareholders holding greater than 5% of the Fund are as follows:
| | | | |
| | | |
| | | Number of Shareholders | | Percentage of Outstanding Shares |
| | |
Affiliated | | — | | —% |
| | |
Unaffiliated | | 4 | | 40.4 |
28
Transactions in shares of common stock were as follows:
| | | | | | | | |
| | | |
| Share Class | | Shares | | | Amount | |
| | |
Class A | | | | | | | | |
Year ended August 31, 2024: | | | | | | | | |
Shares sold | | | 3,046,614 | | | $ | 43,774,272 | |
Shares issued in reinvestment of dividends and distributions | | | 2,215,738 | | | | 30,488,551 | |
Shares purchased | | | (9,145,227 | ) | | | (131,930,677 | ) |
Net increase (decrease) in shares outstanding before conversion | | | (3,882,875 | ) | | | (57,667,854 | ) |
Shares issued upon conversion from other share class(es) | | | 177,411 | | | | 2,537,958 | |
Shares purchased upon conversion into other share class(es) | | | (271,053 | ) | | | (3,922,426 | ) |
Net increase (decrease) in shares outstanding | | | (3,976,517 | ) | | $ | (59,052,322 | ) |
| | |
Year ended August 31, 2023: | | | | | | | | |
Shares sold | | | 3,006,850 | | | $ | 40,124,144 | |
Shares issued in reinvestment of dividends and distributions | | | 1,008,087 | | | | 12,984,167 | |
Shares purchased | | | (10,019,421 | ) | | | (131,865,922 | ) |
Net increase (decrease) in shares outstanding before conversion | | | (6,004,484 | ) | | | (78,757,611 | ) |
Shares issued upon conversion from other share class(es) | | | 200,911 | | | | 2,641,257 | |
Shares purchased upon conversion into other share class(es) | | | (353,713 | ) | | | (4,656,410 | ) |
Net increase (decrease) in shares outstanding | | | (6,157,286 | ) | | $ | (80,772,764 | ) |
| | |
Class C | | | | | | | | |
Year ended August 31, 2024: | | | | | | | | |
Shares sold | | | 97,824 | | | $ | 1,849,385 | |
Shares issued in reinvestment of dividends and distributions | | | 17,557 | | | | 321,122 | |
Shares purchased | | | (89,371 | ) | | | (1,704,719 | ) |
Net increase (decrease) in shares outstanding before conversion | | | 26,010 | | | | 465,788 | |
Shares purchased upon conversion into other share class(es) | | | (50,473 | ) | | | (959,951 | ) |
Net increase (decrease) in shares outstanding | | | (24,463 | ) | | $ | (494,163 | ) |
| | |
Year ended August 31, 2023: | | | | | | | | |
Shares sold | | | 110,861 | | | $ | 1,944,585 | |
Shares issued in reinvestment of dividends and distributions | | | 7,988 | | | | 136,598 | |
Shares purchased | | | (162,084 | ) | | | (2,843,478 | ) |
Net increase (decrease) in shares outstanding before conversion | | | (43,235 | ) | | | (762,295 | ) |
Shares purchased upon conversion into other share class(es) | | | (70,689 | ) | | | (1,228,849 | ) |
Net increase (decrease) in shares outstanding | | | (113,924 | ) | | $ | (1,991,144 | ) |
| | |
Class R | | | | | | | | |
Year ended August 31, 2024: | | | | | | | | |
Shares sold | | | 699,484 | | | $ | 8,354,770 | |
Shares issued in reinvestment of dividends and distributions | | | 390,136 | | | | 4,431,948 | |
Shares purchased | | | (2,004,033 | ) | | | (24,104,208 | ) |
Net increase (decrease) in shares outstanding | | | (914,413 | ) | | $ | (11,317,490 | ) |
PGIM Jennison Mid-Cap Growth Fund 29
Notes to Financial Statements (continued)
| | | | | | | | |
| | | |
| Share Class | | Shares | | | Amount | |
| | |
Year ended August 31, 2023: | | | | | | | | |
Shares sold | | | 945,679 | | | $ | 10,449,512 | |
Shares issued in reinvestment of dividends and distributions | | | 173,660 | | | | 1,866,846 | |
Shares purchased | | | (2,184,378 | ) | | | (23,797,060 | ) |
Net increase (decrease) in shares outstanding | | | (1,065,039 | ) | | $ | (11,480,702 | ) |
| | |
Class Z | | | | | | | | |
Year ended August 31, 2024: | | | | | | | | |
Shares sold | | | 6,645,638 | | | $ | 132,480,085 | |
Shares issued in reinvestment of dividends and distributions | | | 941,652 | | | | 18,126,804 | |
Shares purchased | | | (8,606,702 | ) | | | (173,622,171 | ) |
Net increase (decrease) in shares outstanding before conversion | | | (1,019,412 | ) | | | (23,015,282 | ) |
Shares issued upon conversion from other share class(es) | | | 180,322 | | | | 3,631,806 | |
Shares purchased upon conversion into other share class(es) | | | (107,711 | ) | | | (2,132,006 | ) |
Net increase (decrease) in shares outstanding | | | (946,801 | ) | | $ | (21,515,482 | ) |
| | |
Year ended August 31, 2023: | | | | | | | | |
Shares sold | | | 6,519,766 | | | $ | 119,776,686 | |
Shares issued in reinvestment of dividends and distributions | | | 385,645 | | | | 6,845,208 | |
Shares purchased | | | (8,467,651 | ) | | | (152,405,071 | ) |
Net increase (decrease) in shares outstanding before conversion | | | (1,562,240 | ) | | | (25,783,177 | ) |
Shares issued upon conversion from other share class(es) | | | 260,420 | | | | 4,725,662 | |
Shares purchased upon conversion into other share class(es) | | | (415,008 | ) | | | (7,585,460 | ) |
Net increase (decrease) in shares outstanding | | | (1,716,828 | ) | | $ | (28,642,975 | ) |
| | |
Class R2 | | | | | | | | |
Year ended August 31, 2024: | | | | | | | | |
Shares sold | | | 129,468 | | | $ | 2,576,656 | |
Shares issued in reinvestment of dividends and distributions | | | 5,359 | | | | 103,422 | |
Shares purchased | | | (31,829 | ) | | | (649,681 | ) |
Net increase (decrease) in shares outstanding | | | 102,998 | | | $ | 2,030,397 | |
| | |
Year ended August 31, 2023: | | | | | | | | |
Shares sold | | | 48,430 | | | $ | 887,304 | |
Shares issued in reinvestment of dividends and distributions | | | 925 | | | | 16,516 | |
Shares purchased | | | (26,621 | ) | | | (489,711 | ) |
Net increase (decrease) in shares outstanding | | | 22,734 | | | $ | 414,109 | |
30
| | | | | | | | |
| | | |
| Share Class | | Shares | | | Amount | |
| | |
Class R4 | | | | | | | | |
Year ended August 31, 2024: | | | | | | | | |
Shares sold | | | 691,318 | | | $ | 14,371,335 | |
Shares issued in reinvestment of dividends and distributions | | | 4,392 | | | | 87,133 | |
Shares purchased | | | (316,185 | ) | | | (6,594,551 | ) |
Net increase (decrease) in shares outstanding | | | 379,525 | | | $ | 7,863,917 | |
| | |
Year ended August 31, 2023: | | | | | | | | |
Shares sold | | | 348,957 | | | $ | 6,452,092 | |
Shares issued in reinvestment of dividends and distributions | | | 1,239 | | | | 22,665 | |
Shares purchased | | | (147,902 | ) | | | (2,786,372 | ) |
Net increase (decrease) in shares outstanding | | | 202,294 | | | $ | 3,688,385 | |
| | |
Class R6 | | | | | | | | |
Year ended August 31, 2024: | | | | | | | | |
Shares sold | | | 15,847,404 | | | $ | 335,215,914 | |
Shares issued in reinvestment of dividends and distributions | | | 1,050,271 | | | | 21,394,022 | |
Shares purchased | | | (8,446,110 | ) | | | (180,082,486 | ) |
Net increase (decrease) in shares outstanding before conversion | | | 8,451,565 | | | | 176,527,450 | |
Shares issued upon conversion from other share class(es) | | | 51,339 | | | | 1,088,858 | |
Shares purchased upon conversion into other share class(es) | | | (11,398 | ) | | | (244,239 | ) |
Net increase (decrease) in shares outstanding | | | 8,491,506 | | | $ | 177,372,069 | |
| | |
Year ended August 31, 2023: | | | | | | | | |
Shares sold | | | 9,254,008 | | | $ | 179,221,516 | |
Shares issued in reinvestment of dividends and distributions | | | 389,404 | | | | 7,293,538 | |
Shares purchased | | | (8,352,690 | ) | | | (159,274,187 | ) |
Net increase (decrease) in shares outstanding before conversion | | | 1,290,722 | | | | 27,240,867 | |
Shares issued upon conversion from other share class(es) | | | 325,992 | | | | 6,299,434 | |
Shares purchased upon conversion into other share class(es) | | | (10,115 | ) | | | (195,634 | ) |
Net increase (decrease) in shares outstanding | | | 1,606,599 | | | $ | 33,344,667 | |
On December 27, 2021, the Fund’s Class C shares implemented a four-into-one reverse stock split the net effect of which was to decrease the number of the Fund’s outstanding shares and increase the net asset value per share by a proportionate amount. While the number of the Fund’s outstanding shares decreased, neither the Fund’s holdings nor the total value of shareholders’ investments in the Fund were affected. Immediately after the reverse stock split, each shareholder maintained the same percentage of the Fund’s net assets prior to the reverse stock split. Per share data in the Financial Highlights for Class C shares have been retroactively adjusted to reflect the reverse stock split.
The RIC, on behalf of the Fund, along with other affiliated registered investment companies (the “Participating Funds”), is a party to a Syndicated Credit Agreement (“SCA”) with a
PGIM Jennison Mid-Cap Growth Fund 31
Notes to Financial Statements (continued)
group of banks. The purpose of the SCA is to provide an alternative source of temporary funding for capital share redemptions. The table below provides details of the current SCA in effect at the reporting period-end as well as the prior SCA.
| | | | |
| | | Current SCA | | Prior SCA |
Term of Commitment | | 9/29/2023 - 9/26/2024 | | 9/30/2022 – 9/28/2023 |
Total Commitment | | $ 1,200,000,000 | | $ 1,200,000,000 |
Annualized Commitment Fee on the Unused Portion of the SCA | | 0.15% | | 0.15% |
Annualized Interest Rate on Borrowings | | 1.00% plus the higher of (1)
the effective federal funds
rate, (2) the daily SOFR
rate plus 0.10% or (3) zero
percent | | 1.00% plus the higher of (1)
the effective federal funds
rate, (2) the daily SOFR
rate plus 0.10% or (3) zero
percent |
Subsequent to the reporting period end, the SCA has been renewed and effective September 27, 2024 will provide a commitment of $1,200,000,000 through September 25, 2025. The commitment fee allocated to the Participating Funds will continue to be 0.15% of the unused portion of the SCA. The interest on borrowings under the renewed SCA will be paid monthly and at a per annum interest rate of 1.00% plus the higher of (1) the effective federal funds rate, (2) the daily SOFR rate plus 0.10% or (3) zero percent.
Certain affiliated registered investment companies that are parties to the SCA include portfolios that are subject to a predetermined mathematical formula used to manage certain benefit guarantees offered under variable annuity contracts. The formula may result in large scale asset flows into and out of these portfolios. Consequently, these portfolios may be more likely to utilize the SCA for purposes of funding redemptions. It may be possible for those portfolios to fully exhaust the committed amount of the SCA, thereby requiring the Manager to allocate available funding per a Board-approved methodology designed to treat the Participating Funds in the SCA equitably.
The Fund did not utilize the SCA during the year ended August 31, 2024.
| 9. | Risks of Investing in the Fund |
The Fund’s risks include, but are not limited to, some or all of the risks discussed below. For further information on the Fund’s risks, please refer to the Fund’s Prospectus and Statement of Additional Information.
Economic and Market Events Risk: Events in the U.S. and global financial markets, including actions taken by the U.S. Federal Reserve or foreign central banks to stimulate or stabilize economic growth or the functioning of the securities markets, or otherwise reduce inflation, may at times result in unusually high market volatility, which could negatively
32
impact performance. Governmental efforts to curb inflation often have negative effects on the level of economic activity. Relatively reduced liquidity in credit and fixed income markets could adversely affect issuers worldwide.
Equity and Equity-Related Securities Risk: Equity and equity-related securities may be subject to changes in value, and their values may be more volatile than those of other asset classes. In addition to an individual security losing value, the value of the equity markets or a sector in which the Fund invests could go down. Different parts of a market can react differently to adverse issuer, market, regulatory, political and economic developments.
Growth Style Risk: The Fund’s growth style may subject the Fund to above-average fluctuations as a result of seeking higher than average capital growth. Growth stocks are generally more sensitive to market movements than other types of stocks primarily because their stock prices are based heavily on future expectations. Historically, growth stocks have performed best during later stages of economic expansion and value stocks have performed best during periods of economic recovery. Growth company stocks also typically lack the dividend yield that can lessen price declines in market downturns. Since the Fund follows a growth investment style, there is the risk that the growth investment style may be out of favor for a period of time. At times when the style is out of favor, the Fund may underperform the market in general, its benchmark and other mutual funds.
Increase in Expenses Risk: Your actual cost of investing in the Fund may be higher than the expenses shown in the expense table in the Fund’s prospectus for a variety of reasons. For example, expense ratios may be higher than those shown if average net assets decrease. Net assets are more likely to decrease and Fund expense ratios are more likely to increase when markets are volatile. Active and frequent trading of Fund securities can increase expenses.
Large Shareholder and Large Scale Redemption Risk: Certain individuals, accounts, funds (including funds affiliated with the Manager) or institutions, including the Manager and its affiliates, may from time to time own or control a substantial amount of the Fund’s shares. There is no requirement that these entities maintain their investment in the Fund. There is a risk that such large shareholders or that the Fund’s shareholders generally may redeem all or a substantial portion of their investments in the Fund in a short period of time, which could have a significant negative impact on the Fund’s NAV, liquidity, and brokerage costs. Large redemptions could also result in tax consequences to shareholders and impact the Fund’s ability to implement its investment strategy. The Fund’s ability to pursue its investment objective after one or more large scale redemptions may be impaired and, as a result, the Fund may invest a larger portion of its assets in cash or cash equivalents.
Management Risk: Actively managed funds are subject to management risk. The subadviser will apply investment techniques and risk analyses in making investment decisions for the Fund, but the subadviser’s judgments about the attractiveness, value or market trends affecting a particular security, industry or sector or about market movements may be
PGIM Jennison Mid-Cap Growth Fund 33
Notes to Financial Statements (continued)
incorrect. Additionally, the investments selected for the Fund may underperform the markets in general, the Fund’s benchmark and other funds with similar investment objectives.
Market Disruption and Geopolitical Risks: Market disruption can be caused by economic, financial or political events and factors, including but not limited to, international wars or conflicts (including Russia’s military invasion of Ukraine and the Israel-Hamas war), geopolitical developments (including trading and tariff arrangements, sanctions and cybersecurity attacks), instability in regions such as Asia, Eastern Europe and the Middle East, terrorism, natural disasters and public health epidemics (including the outbreak of COVID-19 globally).
The extent and duration of such events and resulting market disruptions cannot be predicted, but could be substantial and could magnify the impact of other risks to the Fund. These and other similar events could adversely affect the U.S. and foreign financial markets and lead to increased market volatility, reduced liquidity in the securities markets, significant negative impacts on issuers and the markets for certain securities and commodities and/or government intervention. They may also cause short- or long-term economic uncertainties in the United States and worldwide. As a result, whether or not the Fund invests in securities of issuers located in or with significant exposure to the countries directly affected, the value and liquidity of the Fund’s investments may be negatively impacted. Further, due to closures of certain markets and restrictions on trading certain securities, the value of certain securities held by the Fund could be significantly impacted, which could lead to such securities being valued at zero.
Market Risk: Securities markets may be volatile and the market prices of the Fund’s securities may decline. Securities fluctuate in price based on changes in an issuer’s financial condition and overall market and economic conditions. If the market prices of the securities owned by the Fund fall, the value of your investment in the Fund will decline.
Medium Capitalization (Mid-Cap) Company Risk: The Fund’s investments in mid-cap companies carry more risk than investments in larger capitalized companies. Investments in mid-cap companies carry additional risks because earnings of these companies tend to be less predictable; they often have limited product lines, markets, distribution channels or financial resources; and the management of such companies may be dependent on one or a few key people. The market movements of these companies’ securities may be more abrupt or erratic than the market movements of securities of larger, more established companies or the stock market in general. Historically, mid-cap companies have sometimes gone through extended periods when they did not perform as well as larger companies. Mid-cap companies generally are comparatively less liquid than larger companies, which may make such investments more difficult to sell at the time and price that the Fund would
34
like. Also, the stocks of mid-cap companies may fall out of favor relative to those of small- or large-capitalization companies, causing the Fund to underperform other equity funds that focus on small or large-capitalization companies.
Sector Exposure Risk: At times, the Fund may have a significant portion of its assets invested in the same economic sector such as the information technology and industrials sectors. Issuers in the same economic sector may be similarly affected by economic or market events, making the Fund more vulnerable to unfavorable developments in that economic sector than funds that invest more broadly.
PGIM Jennison Mid-Cap Growth Fund 35
Report of Independent Registered Public Accounting Firm
To the Board of Directors of Prudential Jennison Mid-Cap Growth Fund, Inc. and Shareholders of PGIM Jennison Mid-Cap Growth Fund
Opinion on the Financial Statements
We have audited the accompanying statement of assets and liabilities, including the schedule of investments, of PGIM Jennison Mid-Cap Growth Fund (the “Fund”) as of August 31, 2024, the related statement of operations for the year ended August 31, 2024, the statements of changes in net assets for each of the two years in the period ended August 31, 2024, including the related notes, and the financial highlights for each of the four years in the period ended August 31, 2024 (collectively referred to as the “financial statements”). In our opinion, the financial statements present fairly, in all material respects, the financial position of the Fund as of August 31, 2024, the results of its operations for the year then ended, the changes in its net assets for each of the two years in the period ended August 31, 2024 and the financial highlights for each of the four years in the period ended August 31, 2024 in conformity with accounting principles generally accepted in the United States of America.
The financial statements of the Fund as of and for the year ended August 31, 2020 and the financial highlights for each of the periods ended on or prior to August 31, 2020 (not presented herein, other than the financial highlights, prior to the reflection of the reverse stock split as described in Note 7) were audited by other auditors whose report dated October 15, 2020 expressed an unqualified opinion on those financial statements and financial highlights.
We also have audited the adjustments to the financial highlights for the year ended August 31, 2020 to reflect the reverse stock split, as described in Note 7. In our opinion, such adjustments are appropriate and have been properly applied. We were not engaged to audit, review, or apply any procedures to the 2020 financial statements and financial highlights of the Fund other than with respect to the adjustments and, accordingly, we do not express an opinion or any other form of assurance on the 2020 financial statements and financial highlights taken as a whole.
Basis for Opinion
These financial statements are the responsibility of the Fund’s management. Our responsibility is to express an opinion on the Fund’s financial statements based on our audits. We are a public accounting firm registered with the Public Company Accounting Oversight Board (United States) (PCAOB) and are required to be independent with respect to the Fund in accordance with the U.S. federal securities laws and the applicable rules and regulations of the Securities and Exchange Commission and the PCAOB.
We conducted our audits of these financial statements in accordance with the standards of the PCAOB. Those standards require that we plan and perform the audit to obtain reasonable assurance about whether the financial statements are free of material misstatement, whether due to error or fraud.
Our audits included performing procedures to assess the risks of material misstatement of the financial statements, whether due to error or fraud, and performing procedures that respond to those risks. Such procedures included examining, on a test basis, evidence regarding the amounts and disclosures in the financial statements. Our audits also included evaluating the accounting principles used and significant estimates made by management, as well as evaluating the overall presentation of the financial statements. Our procedures included confirmation of securities owned as of August 31, 2024 by correspondence with the custodian and transfer agent. We believe that our audits provide a reasonable basis for our opinion.
|
| /s/PricewaterhouseCoopers LLP |
| New York, New York |
| October 22, 2024 |
We have served as the auditor of one or more investment companies in the PGIM Retail Funds complex since 2020.
36
Other Information
Form N-CSR Item 8 - Changes in and Disagreements with Accountants for Open-End Management Investment Companies - None.
Form N-CSR Item 9 - Proxy Disclosures for Open-End Management Investment Companies- None.
Form N-CSR Item 10 - Remuneration Paid to Directors, Officers, and Others of Open-End Management Investment Companies – Included as part of the financial statements filed under Item 7 of this Form.
Form N-CSR Item 11 - Statement Regarding Basis for Approval of Investment Advisory Contract.
Approval of Advisory Agreements
The Fund’s Board of Directors
The Board of Directors (the “Board”) of PGIM Jennison Mid-Cap Growth Fund (the “Fund”)1 consists of ten individuals, eight of whom are not “interested persons” of the Fund, as defined in the Investment Company Act of 1940, as amended (the “1940 Act”) (the “Independent Directors”). The Board is responsible for the oversight of the Fund and its operations, and performs the various duties imposed on the directors of investment companies by the 1940 Act. The Independent Directors have retained independent legal counsel to assist them in connection with their duties. The Chair of the Board is an Independent Director. The Board has established five standing committees: the Audit Committee, the Nominating and Governance Committee, the Compliance Committee and two Investment Committees. Each committee is chaired by, and composed of, Independent Directors.
Annual Approval of the Fund’s Advisory Agreements
As required under the 1940 Act, the Board determines annually whether to renew the Fund’s management agreement with PGIM Investments LLC (“PGIM Investments”) and the Fund’s subadvisory agreement with Jennison Associates LLC (“Jennison”). In considering the renewal of the agreements, the Board, including all of the Independent Directors, met on May 28-and June 4-6, 2024 (the “Board Meeting”) and approved the renewal of the agreements through July 31, 2025, after concluding that the renewal of the agreements was in the best interests of the Fund and its shareholders.
In advance of the meetings, the Board requested and received materials relating to the agreements, and had the opportunity to ask questions and request further information in connection with its consideration. Among other things, the Board considered comparative fee information from PGIM Investments and Jennison. Also, the Board considered comparisons with other mutual funds in relevant peer universes and peer groups, as is further discussed below.
In approving the agreements, the Board, including the Independent Directors advised by independent legal counsel, considered the factors it deemed relevant, including the nature, quality and extent of services provided by PGIM Investments and the subadviser, the performance of the Fund, the profitability of PGIM Investments and its affiliates, expenses and fees, and the potential for economies of scale that may be shared with the Fund and its shareholders as the Fund’s assets grow. In their deliberations, the Directors did not identify any single factor which alone was responsible for the Board’s decision to approve an
1 PGIM Jennison Mid-Cap Growth Fund is the sole series of Prudential Jennison Mid-Cap Growth Fund, Inc.
PGIM Jennison Mid-Cap Growth Fund
Approval of Advisory Agreements (continued)
agreement with respect to the Fund. In connection with its deliberations, the Board considered information provided by PGIM Investments throughout the year at regular and special Board meetings, presentations from portfolio managers and other information, as well as information furnished at or in advance of the Board Meeting.
The Directors determined that the overall arrangements between the Fund and PGIM Investments, which serves as the Fund’s investment manager pursuant to a management agreement, and between PGIM Investments and Jennison, which serves as the Fund’s subadviser pursuant to the terms of a subadvisory agreement with PGIM Investments, are in the best interests of the Fund and its shareholders in light of the services performed, fees charged and such other matters as the Directors considered relevant in the exercise of their business judgment. The Board considered the approval of the agreements for the Fund as part of its consideration of agreements for multiple funds, but its approvals were made on a fund-by-fund basis.
The material factors and conclusions that formed the basis for the Directors’ reaching their determinations to approve the continuance of the agreements are separately discussed below.
Nature, Quality and Extent of Services
The Board received and considered information regarding the nature, quality and extent of services provided to the Fund by PGIM Investments and Jennison. The Board noted that Jennison is affiliated with PGIM Investments. The Board considered the services provided by PGIM Investments, including but not limited to the oversight of the subadviser for the Fund, as well as the provision of accounting oversight, fund recordkeeping, compliance and other services to the Fund, such as PGIM Investments’ role as administrator for the Fund’s liquidity risk management program and as valuation designee. With respect to PGIM Investments’ oversight of the subadviser, the Board noted that PGIM Investments’ Strategic Investment Research Group (“SIRG”), which is a business unit of PGIM Investments, is responsible for monitoring and reporting to PGIM Investments’ senior management on the performance and operations of the subadviser. The Board also considered that PGIM Investments pays the salaries of all of the officers and interested Directors of the Fund who are part of Fund management. The Board also considered the investment subadvisory services provided by Jennison, including investment research and security selection, as well as adherence to the Fund’s investment restrictions and compliance with applicable Fund policies and procedures. The Board considered PGIM Investments’ evaluation of the subadviser, as well as PGIM Investments’ recommendation, based on its review of the subadviser, to renew the subadvisory agreement.
Visit our website at pgim.com/investments
The Board considered the qualifications, backgrounds and responsibilities of PGIM Investments’ senior management responsible for the oversight of the Fund and Jennison, and also considered the qualifications, backgrounds and responsibilities of Jennison’s portfolio managers who are responsible for the day-to-day management of the Fund’s portfolio. The Board was provided with information pertaining to PGIM Investments’ and Jennison’s organizational structure, senior management, investment operations, and other relevant information pertaining to both PGIM Investments and Jennison. The Board also noted that it received favorable compliance reports from the Fund’s Chief Compliance Officer (“CCO”) as to both PGIM Investments and Jennison.
The Board concluded that it was satisfied with the nature, extent and quality of the investment management services provided by PGIM Investments and the subadvisory services provided to the Fund by Jennison, and that there was a reasonable basis on which to conclude that the Fund benefits from the services provided by PGIM Investments and Jennison under the management and subadvisory agreements.
Costs of Services and Profits Realized by PGIM Investments
The Board was provided with information on the profitability of PGIM Investments and its affiliates in serving as the Fund’s investment manager. The Board discussed with PGIM Investments the methodology utilized in assembling the information regarding profitability and considered its reasonableness. The Board recognized that it is difficult to make comparisons of profitability from fund management contracts because comparative information is not generally publicly available and is affected by numerous factors, including the structure of the particular adviser, the types of funds it manages, its business mix, numerous assumptions regarding allocations of direct and indirect costs, and the adviser’s capital structure and cost of capital. Taking these factors into account, the Board concluded that the profitability of PGIM Investments and its affiliates in relation to the services rendered was not unreasonable.
Economies of Scale
The Board received and discussed information concerning economies of scale that PGIM Investments may realize as the Fund’s assets grow beyond current levels. The Board noted that the management fee schedule for the Fund includes breakpoints, which have the effect of decreasing the fee rate as assets increase. During the course of time, the Board has considered information regarding the launch date of the Fund, the management fees of the Fund compared to those of similarly managed funds and PGIM Investments’ investment in the Fund over time. The Board noted that economies of scale can be shared with the Fund in other ways, including low management fees from inception, additional technological and personnel investments to enhance shareholder services, and maintaining
PGIM Jennison Mid-Cap Growth Fund
Approval of Advisory Agreements (continued)
existing expense structures in the face of a rising cost environment. The Board also considered PGIM Investments’ assertion that it continually evaluates the management fee schedule of the Fund and the potential to share economies of scale through breakpoints or fee waivers as asset levels increase.
The Board recognized the inherent limitations of any analysis of economies of scale, stemming largely from the Board’s understanding that most of PGIM Investments’ costs are not specific to individual funds, but rather are incurred across a variety of products and services.
Other Benefits to PGIM Investments and Jennison
The Board considered potential ancillary benefits that might be received by PGIM Investments, Jennison and their affiliates as a result of their relationship with the Fund. The Board concluded that potential benefits to be derived by PGIM Investments included transfer agency fees received by the Fund’s transfer agent (which is affiliated with PGIM Investments), as well as benefits to its reputation or other intangible benefits resulting from PGIM Investments’ association with the Fund. The Board concluded that the potential benefits to be derived by Jennison included its ability to use soft dollar credits, as well as the potential benefits consistent with those generally resulting from an increase in assets under management, specifically, potential access to additional research resources and benefits to its reputation. The Board concluded that the benefits derived by PGIM Investments and Jennison were consistent with the types of benefits generally derived by investment managers and subadvisers to mutual funds.
Performance of the Fund / Fees and Expenses
The Board considered certain additional factors and made related conclusions relating to the historical performance of the Fund for the one-, three-, five- and ten-year periods ended December 31, 2023.
The Board also considered the Fund’s actual management fee, as well as the Fund’s net total expense ratio, for the fiscal year ended August 31, 2023. The Board considered the management fee for the Fund as compared to the management fee charged by PGIM Investments to other funds and the fee charged by other advisers to comparable mutual funds in a peer group. The actual management fee represents the fee rate actually paid by Fund shareholders and includes any fee waivers or reimbursements. The net total expense ratio for the Fund represents the actual expense ratio incurred by Fund shareholders.
The mutual funds included in the peer universe, which was used to consider performance, and the peer group, which was used to consider fees and expenses, were objectively
Visit our website at pgim.com/investments
determined by Broadridge, an independent provider of mutual fund data. In certain circumstances, PGIM Investments also provided supplemental peer universe or peer group information for reasons addressed with the Board. The comparisons placed the Fund in various quartiles over various periods, with the first quartile being the best 25% of the mutual funds (for performance, the best performing mutual funds and, for expenses, the lowest cost mutual funds).
The section below summarizes key factors considered by the Board and the Board’s conclusions regarding the Fund’s performance, fees and overall expenses. The table sets forth net performance comparisons (which reflect the impact on performance of fund expenses, or any subsidies, expense caps or waivers that may be applicable) with the peer universe, actual management fees with the peer group (which reflect the impact of any subsidies or fee waivers), and net total expenses with the peer group, each of which were key factors considered by the Board.
| | | | | | | | |
| | | | | |
| Net Performance | | 1 Year | | 3 Years | | 5 Years | | 10 Years |
| | 2nd Quartile | | 2nd Quartile | | 1st Quartile | | 2nd Quartile |
Actual Management Fees: 1st Quartile |
Net Total Expenses: 1st Quartile |
| | · | The Board noted that the Fund outperformed its benchmark index over the five-year period, and underperformed over the remaining periods. |
| | · | The Board and PGIM Investments agreed to retain the existing contractual expense cap that (exclusive of certain fees and expenses) limits transfer agency, shareholder servicing, sub-transfer agency and blue sky fees to the extent that such fees cause total annual fund operating expenses to exceed 1.08% for Class R2 shares and 0.83% for Class R4 shares through December 31, 2024. |
| | · | In addition, PGIM Investments will waive management fees or shared operating expenses on any share class to the same extent that it waives such expenses on any other share class and has agreed that total annual fund operating expenses for Class R6 shares will not exceed total annual fund operating expenses for Class Z shares. |
| | · | The Board concluded that, in light of the above, it would be in the best interests of the Fund and its shareholders to renew the agreements. |
| | · | The Board concluded that the management fees (including subadvisory fees) and total expenses were reasonable in light of the services provided. |
* * *
After full consideration of these factors, the Board concluded that the approval of the agreements was in the best interests of the Fund and its shareholders.
PGIM Jennison Mid-Cap Growth Fund
| Item 12 – | Disclosure of Proxy Voting Policies and Procedures for Closed-End Management Investment Companies – Not applicable. |
| Item 13 – | Portfolio Managers of Closed-End Management Investment Companies – Not applicable. |
| Item 14 – | Purchases of Equity Securities by Closed-End Management Investment Company and Affiliated Purchasers – Not applicable. |
| Item 15 – | Submission of Matters to a Vote of Security Holders – There have been no material changes to the procedures by which shareholders may recommend nominees to the registrant’s board of directors. |
| Item 16 – | Controls and Procedures |
| | (a) | It is the conclusion of the registrant’s principal executive officer and principal financial officer that the effectiveness of the registrant’s current disclosure controls and procedures (such disclosure controls and procedures having been evaluated within 90 days of the date of this filing) provide reasonable assurance that the information required to be disclosed by the registrant has been recorded, processed, summarized and reported within the time period specified in the Commission’s rules and forms and that the information required to be disclosed by the registrant has been accumulated and communicated to the registrant’s principal executive officer and principal financial officer in order to allow timely decisions regarding required disclosure. |
| | (b) | There has been no significant change in the registrant’s internal control over financial reporting (as defined in Rule 30a-3(d) under the Act (17 CFR 270.30a-3(d))) that occurred during the period covered by this report that has materially affected, or is reasonably likely to materially affect, the registrant’s internal control over financial reporting. |
| Item 17 – | Disclosure of Securities Lending Activities for Closed-End Management Investment Companies – Not applicable. |
| Item 18 – | Recovery of Erroneously Awarded Compensation – Not applicable. |
| | (a)(2) | Policy required by the listing standards adopted pursuant to Rule 10D-1 under the Securities Exchange Act of 1934 – Not applicable. |
| | (a)(3)(1) | Any written solicitation to purchase securities under Rule 23c-1 under the Investment Company Act of 1940 – Not applicable. |
| | (a)(3)(2) | Change in the registrant’s independent public accountant – Not applicable. |
SIGNATURES
Pursuant to the requirements of the Securities Exchange Act of 1934 and the Investment Company Act of 1940, the registrant has duly caused this report to be signed on its behalf by the undersigned, thereunto duly authorized.
| | |
| Registrant: | | Prudential Jennison Mid-Cap Growth Fund, Inc. |
| |
| By: | | /s/ Andrew R. French |
| | Andrew R. French |
| | Secretary |
| |
| Date: | | October 22, 2024 |
Pursuant to the requirements of the Securities Exchange Act of 1934 and the Investment Company Act of 1940, this report has been signed below by the following persons on behalf of the registrant and in the capacities and on the dates indicated.
| | |
| By: | | /s/ Stuart S. Parker |
| | Stuart S. Parker |
| | President and Principal Executive Officer |
| |
| Date: | | October 22, 2024 |
| |
| By: | | /s/ Christian J. Kelly |
| | Christian J. Kelly |
| | Treasurer and Principal Financial and Accounting Officer |
| |
| Date: | | October 22, 2024 |