 | Ultra Petroleum Corp. |
NEWS RELEASE
FOR IMMEDIATE RELEASE
ULTRA PETROLEUM ANNOUNCES THIRD QUARTER 2013
FINANCIAL AND OPERATING RESULTS
ADJUSTED EPS OF $0.37 PER DILUTED SHARE
HOUSTON, Texas– November 1, 2013 – Ultra Petroleum Corp. (NYSE: UPL) today reported third quarter 2013 operating and financial results. Highlights during the quarter include:
| · | Third quarter production volumes of 57.5 Bcfe |
| · | Operating cash flow(1) of $117.9 million, or $0.76 per diluted share for the quarter |
| · | Reported net income of $57.9 million, or $0.37 per diluted share – adjusted(3) |
| · | Low per unit all-in costs of $2.80 per Mcfe with cash costs of $1.77 per Mcfe |
| · | Fourteen percent reduction in Wyoming well costs to $3.8 million per well |
| · | Positive margins in third quarter of 2013 (adjusted): 54 percent cash flow margin(5)and 26 percent net income margin(4) |
Third Quarter Results
Ultra Petroleum produced 57.5 billion feet equivalent (Bcfe) of natural gas and crude oil during the third quarter 2013. The company’s production was comprised of 55.7 billion cubic feet (Bcf) of natural gas and 297.3 thousand barrels (Mbls) of condensate.
Ultra’s average realized natural gas price for the quarter was $3.41 per thousand cubic feet (Mcf), including the effects of commodity hedges. The realized condensate price in the third quarter of 2013 was $100.06 per barrel (Bbl).
Ultra Petroleum reported operating cash flow(1) of $117.9 million, or $0.76 per diluted share in the third quarter. Adjusted net income(3) for the quarter was $57.9 million, or $0.37 per diluted share.
Ultra Petroleum Corp.
Third Quarter 2013 Results
| Page 1 of 10 |
Year-to-Date Results
The company’s natural gas and crude oil production for the nine month period ended September 30, 2013, was 175.3 Bcfe. Ultra’s production was comprised of 170.1 Bcf of natural gas and 864.7 Mbls of condensate.
Including the effects of commodity hedges, Ultra Petroleum’s average realized natural gas price was $3.57 per Mcf. The realized condensate price for the nine months ended September 30, 2013, was $92.25 per Bbl.
Ultra reported operating cash flow(1) of $375.9 million, or $2.44 per diluted share for the nine month period. Adjusted net income(3) was $188.3 million, or $1.22 per diluted share for the same nine month period in 2013.
“Our 2013 year-to-date results reflect our planned slowing of investment in our low cost, long life natural gas assets due to commodity price signals. Nine month cash flow of $376.0 million nearly equals our downwardly revised 2013 capital expenditure budget of $385.0 million, meaning fourth quarter cash flow is free cash,” stated Michael D. Watford, Chairman, President and Chief Executive Officer.
Wyoming - Operational Highlights
During the third quarter, Ultra Petroleum and its partners drilled 35 gross (17 net) Wyoming Lance wells and placed on production 39 gross (16 net) wells. The third quarter average initial production (IP) rate for new operated wells brought online was 7.7 million cubic feet equivalent (MMcfe) per day. Net production from Wyoming averaged 450 MMcfe per day in the third quarter.
Ultra Petroleum and its partners drilled 100 gross (46 net) Wyoming Lance wells and placed on production 109 gross (53 net) wells for the nine months ended September 30, 2013. The average IP rate for the wells placed on production during the nine month period was also 7.7 MMcfe per day. This compares to the year-to-date average IP rate for the Ultra operated wells brought online in its activity focus area of 9.0 MMcfe per day. The company produced 123.8 Bcfe from Wyoming during the nine months ended September 30, 2013.
During the third quarter, Ultra continued to reduce its total well costs to $3.8 million from $4.4 million during the second quarter of 2013, a fourteen percent reduction. More importantly, this represents a nineteen percent well cost reduction from the average cost to drill and complete a well in 2012 of $4.7 million. Continued completion design optimization was the primary driver of the $900,000 per well cost savings over the course of the year. These significant cost savings further enhance returns as illustrated in the table below:
| | Pinedale IRR’s |
| Well Cost ($/MM) | Reserve Size (Bcfe) |
| | 4.0 | 5.0 | 6.0 |
| $4.7 | 22% | 37% | 56% |
| $4.4 | 26% | 44% | 65% |
| $3.8 | 36% | 59% | 91% |
| | Economics at $4.00/Mcf wellhead price |
Ultra Petroleum Corp.
Third Quarter 2013 Results
| Page 2 of 10 |
Ultra achieved a new milestone during the third quarter by averaging 9.3 days spud to total depth (TD) with eighty-one percent of all operated wells being drilled in less than 10 days. Total days per well, as measured by rig-release to rig-release, averaged 11.3 days in the third quarter.
Pennsylvania - Operational Highlights
During the third quarter, Ultra participated in drilling 8 gross (4 net) horizontal Marcellus wells and initiated production from 6 gross (3 net) wells. Ultra’s Marcellus program demonstrated average IP rates of 7.6 MMcfe per day for the new wells placed online during the quarter. Third quarter Pennsylvania net production averaged 175 MMcfe per day.
For the nine month period ending September 30, 2013, Ultra and its partners drilled 21 gross (10 net) horizontal Marcellus wells and initiated production from 30 gross (15 net) wells. Ultra’s Marcellus average IP rate during the same nine month period was 6.4 MMcfe per day for the new wells brought online. Cumulative Marcellus production for the nine month period was 51.5 Bcfe.
A few notable completions during the quarter include a three well pad in Tioga County that came online with an average initial production (IP) rate of 9.2 MMcfe per day per well. The average 30-day production rate for the pad was 21.6 MMcfe per day. Subsequent to quarter-end, an extension well came online in Centre County at an initial constrained IP rate of 6.7 MMcfe per day. This step out well to the southwest of our development focus area in Lycoming County further validates the quality of the Marcellus resource across our acreage position.
Natural Gas Marketing
During the third quarter, basis differentials in the Northeast widened due to planned seasonal infrastructure maintenance coupled with a capacity constrained market. As a result of the temporary pricing dislocations, Ultra curtailed production by approximately 0.8 Bcfe. The company’s average discount to NYMEX in the Marcellus region was ($0.54) during the quarter. In the Rockies region, which is the primary source of the company’s revenue, cash flow and earnings, basis differentials averaged NYMEX less $0.18. On a combined basis, the company’s average corporate-wide differential to NYMEX was 7 percent or ($0.26) for the quarter.
Commodity Hedges
Currently, Ultra has 12.1 Bcf representing approximately 22 percent of the company’s remaining 2013 forecasted natural gas production hedged at a weighted-average price of $3.75 per Mcf. The company opportunistically hedges a portion of its forecasted production to lessen the volatility associated with swings in commodity prices and improve certainty of cash flows in support of the company’s capital investment program.
Financial Strength
As of September 30, 2013, 84 percent of Ultra Petroleum’s outstanding borrowings were comprised of long-term, fixed-rate debt with an average remaining term of 6.5 years and a 5.6 percent weighted average coupon rate. Ultra’s debt to trailing twelve months EBITDA(2) ratio registered 2.9 times with approximately $400.0 million in unused senior debt capacity. Ultra relies on total debt to EBITDA(2) as a measure of leverage because it appropriately removes the effect of certain non-cash items, such as impairment charges.
Ultra Petroleum Corp.
Third Quarter 2013 Results
| Page 3 of 10 |
Full-Year 2013 Capital Expenditure and Production Guidance
The company is reducing its annual capital expenditures for 2013 to $385.0 million from $415.0 million driven by operating efficiencies and lower well costs in Wyoming.
Ultra is reaffirming its annual production guidance range of 230 – 236 Bcfe. Based on the mid-point of the company’s guidance, approximately 70 percent of the company’s forecasted production will come from the Rockies and 30 percent of total company production will come from Appalachia.
Fourth Quarter 2013 Price Realizations and Differentials Guidance
In the fourth quarter of 2013, the company’s realized natural gas price is expected to average 5 – 7 percent below the NYMEX price due to regional differentials, before consideration of any hedging activity. Realized pricing for condensate is expected to be about $7.00 less than the average NYMEX crude oil price.
Fourth Quarter 2013 Expense Guidance
The following table presents the company’s expected expenses per Mcfe in the fourth quarter of 2013 assuming a $3.62 per MMbtu Henry Hub natural gas price and a $98.00 per Bbl NYMEX crude oil price:
| Costs Per Mcfe | | | Q4 2013 | |
| Lease operating expenses | | | $ 0.38 – 0.40 | |
| Production taxes | | | $ 0.30 – 0.32 | |
| Gathering fees | | | $ 0.23 – 0.25 | |
| Total lease operating costs | | | $ 0.91 – 0.97 | |
| | | | | |
| Transportation charges | | | $ 0.36 – 0.38 | |
| Depletion and depreciation | | | $ 1.03 – 1.08 | |
| General and administrative – total | | | $ 0.10 – 0.12 | |
| Interest and debt expense | | | $ 0.43 – 0.45 | |
| Total operating costs per Mcfe | | | $ 2.83 – 3.00 | |
2013 Annual Income Tax Guidance
Ultra currently projects a 1.5 percent book tax rate for 2013. This equates to forecasted annual cash taxes of $4.0 million with approximately $1.0 million remaining for the fourth quarter 2013.
Subsequent to Quarter-End
On October 21, 2013, the company announced that it had signed a definitive purchase and sale agreement to acquire oil-producing properties located in the Uinta Basin for $650.0 million. Ultra Petroleum expects to finance the acquisition through debt. It is anticipated that the transaction will close December 2013, subject to closing adjustments and customary terms and conditions, with an effective date of October 1, 2013.
Ultra Petroleum Corp.
Third Quarter 2013 Results
| Page 4 of 10 |
“We are maintaining exposure to 100 percent of our low cost, long life natural gas assets while adding a high-returning oil project that complements our technical skills. The project will provide exceptional returns even at realized oil prices of $60 per barrel,” commented Watford.
Conference Call Webcast Scheduled for November 1, 2013
Ultra Petroleum’s third quarter 2013 results conference call will be available via live audio webcast at 11:00 a.m. Eastern Daylight Time (10:00 a.m. Central Daylight Time) Friday, November 1, 2013. To listen to this webcast, log on towww.ultrapetroleum.comand follow the link to the webcast. The webcast replay and podcast will be archived on Ultra Petroleum’s website through February 20, 2014.
Please click here to view a presentation containing supplemental information.
Financial tables to follow.
Ultra Petroleum Corp.
Third Quarter 2013 Results
| Page 5 of 10 |
| Ultra Petroleum Corp. | | | | | | | | | | | | |
| Consolidated Statements of Income (unaudited) | | | | | | | | | |
| All amounts expressed in US$000's, | | | | | | | | | | | | |
| Except per unit data | | | | | | | | | | | | |
| | | For the Nine Months Ended | | | For the Quarter Ended | |
| | | September 30, | | | September 30, | |
| | | 2013 | | | 2012 | | | 2013 | | | 2012 | |
| Volumes | | | | | | | | | | | | | | | | |
| Natural gas (Mcf) | | | 170,069,532 | | | | 190,913,828 | | | | 55,718,130 | | | | 61,206,471 | |
| Oil liquids (Bbls) | | | 864,710 | | | | 1,001,127 | | | | 297,329 | | | | 309,573 | |
| Mcfe - Total | | | 175,257,792 | | | | 196,920,590 | | | | 57,502,104 | | | | 63,063,909 | |
| | | | | | | | | | | | | | | | | |
| Revenues | | | | | | | | | | | | | | | | |
| Natural gas sales | | $ | 628,438 | | | $ | 501,470 | | | $ | 191,453 | | | $ | 169,594 | |
| Oil sales | | | 79,769 | | | | 91,319 | | | | 29,752 | | | | 26,781 | |
| Total operating revenues | | | 708,207 | | | | 592,789 | | | | 221,205 | | | | 196,375 | |
| | | | | | | | | | | | | | | | | |
| Expenses | | | | | | | | | | | | | | | | |
| Lease operating expenses | | | 52,544 | | | | 45,982 | | | | 16,213 | | | | 16,741 | |
| LGS operating lease expense | | | 15,000 | | | | - | | | | 5,000 | | | | - | |
| Production taxes | | | 54,640 | | | | 46,634 | | | | 18,078 | | | | 15,047 | |
| Gathering fees | | | 38,400 | | | | 46,591 | | | | 12,682 | | | | 10,274 | |
| Total lease operating costs | | | 160,584 | | | | 139,207 | | | | 51,973 | | | | 42,062 | |
| | | | | | | | | | | | | | | | | |
| Transportation charges | | | 61,913 | | | | 63,477 | | | | 20,955 | | | | 21,055 | |
| Depletion and depreciation | | | 180,993 | | | | 314,115 | | | | 59,401 | | | | 86,645 | |
| Ceiling test and other impairments | | | - | | | | 2,475,963 | | | | - | | | | 606,827 | |
| General and administrative | | | 9,272 | | | | 11,478 | | | | 3,496 | | | | 3,692 | |
| Stock compensation | | | 6,625 | | | | 7,830 | | | | 564 | | | | 3,049 | |
| Total operating expenses | | | 419,387 | | | | 3,012,070 | | | | 136,389 | | | | 763,330 | |
| | | | | | | | | | | | | | | | | |
| Other (expense) income, net | | | (50 | ) | | | (27 | ) | | | (63 | ) | | | (42 | ) |
| Contract cancellation fees | | | - | | | | (9,220 | ) | | | - | | | | 291 | |
| Interest and debt expense, net | | | (76,176 | ) | | | (62,414 | ) | | | (25,174 | ) | | | (25,369 | ) |
| Deferred gain on sale of liquids gathering system | | | 7,914 | | | | - | | | | 2,638 | | | | - | |
| Realized (loss) gain on commodity derivatives | | | (21,074 | ) | | | 260,239 | | | | (1,310 | ) | | | 83,433 | |
| Unrealized (loss) gain on commodity derivatives | | | 523 | | | | (183,139 | ) | | | 3,384 | | | | (93,329 | ) |
| Income (loss) before income taxes | | | 199,957 | | | | (2,413,842 | ) | | | 64,291 | | | | (601,971 | ) |
| Income tax provision - current | | | 3,240 | | | | 3,386 | | | | 381 | | | | 363 | |
| Income tax provision (benefit) - deferred | | | - | | | | (712,363 | ) | | | - | | | | (188 | ) |
| | | | | | | | | | | | | | | | | |
| Net income (loss) | | $ | 196,717 | | | $ | (1,704,865 | ) | | $ | 63,910 | | | $ | (602,146 | ) |
| | | | | | | | | | | | | | | | | |
| | | | | | | | | | | | | | | | | |
| Ceiling test and other impairments | | $ | - | | | $ | 2,475,963 | | | $ | - | | | $ | 606,827 | |
| Deferred taxes | | | - | | | | (712,606 | ) | | | - | | | | (188 | ) |
| Contract cancellation fees | | | - | | | | 9,220 | | | | - | | | | (291 | ) |
| Deferred gain on sale of liquids gathering system | | | (7,914 | ) | | | - | | | | (2,638 | ) | | | - | |
| Unrealized loss (gain) on commodity derivatives | | | (523 | ) | | | 183,139 | | | | (3,384 | ) | | | 93,329 | |
| Adjusted net income (3) | | $ | 188,280 | | | $ | 250,851 | | | $ | 57,888 | | | $ | 97,531 | |
Ultra Petroleum Corp.
Third Quarter 2013 Results
| Page 6 of 10 |
| | | | | | | | | | | | | | | | | |
| Operating cash flow(1) | | | 375,898 | | | | 563,819 | | | | 117,850 | | | $ | 187,522 | |
| (see non-GAAP reconciliation) | | | | | | | | | | | | | | | | |
| | | | | | | | | | | | | | | | | |
| Weighted average shares (000's) | | | | | | | | | | | | | | | | |
| Basic | | | 152,957 | | | | 152,817 | | | | 152,976 | | | | 152,929 | |
| Fully diluted | | | 154,366 | | | | 152,817 | | | | 154,512 | | | | 152,929 | |
| | | | | | | | | | | | | | | | | |
| Earnings per share | | | | | | | | | | | | | | | | |
| Net income - basic | | $ | 1.29 | | | ($ | 11.16 | ) | | $ | 0.42 | | | ($ | 3.94 | ) |
| Net income - fully diluted | | $ | 1.27 | | | ($ | 11.16 | ) | | $ | 0.41 | | | ($ | 3.94 | ) |
| | | | | | | | | | | | | | | | | |
| Adjusted earnings per share(3) | | | | | | | | | | | | | | | | |
| Adjusted net income - basic | | $ | 1.23 | | | $ | 1.64 | | | $ | 0.38 | | | $ | 0.64 | |
| Adjusted net income - fully diluted | | $ | 1.22 | | | $ | 1.64 | | | $ | 0.37 | | | $ | 0.64 | |
| | | | | | | | | | | | | | | | | |
| Cash flow per share(1) | | | | | | | | | | | | | | | | |
| Cash flow per share - basic | | $ | 2.46 | | | $ | 3.69 | | | $ | 0.77 | | | $ | 1.23 | |
| Cash flow per share - fully diluted | | $ | 2.44 | | | $ | 3.69 | | | $ | 0.76 | | | $ | 1.23 | |
| | | | | | | | | | | | | | | | | |
| Realized Prices | | | | | | | | | | | | | | | | |
| Natural gas (Mcf), including realized gain (loss) | | | | | | | | | | | | | | | | |
| on commodity derivatives | | $ | 3.57 | | | $ | 3.99 | | | $ | 3.41 | | | $ | 4.13 | |
| Natural gas (Mcf), excluding realized gain (loss) | | | | | | | | | | | | | | | | |
| on commodity derivatives | | $ | 3.70 | | | $ | 2.63 | | | $ | 3.44 | | | $ | 2.77 | |
| Oil liquids (Bbls) | | $ | 92.25 | | | $ | 91.22 | | | $ | 100.06 | | | $ | 86.51 | |
| | | | | | | | | | | | | | | | | |
| Costs Per Mcfe | | | | | | | | | | | | | | | | |
| Lease operating expenses | | $ | 0.39 | | | $ | 0.23 | | | $ | 0.37 | | | $ | 0.27 | |
| Production taxes | | $ | 0.31 | | | $ | 0.24 | | | $ | 0.31 | | | $ | 0.24 | |
| Gathering fees | | $ | 0.22 | | | $ | 0.24 | | | $ | 0.22 | | | $ | 0.16 | |
| Transportation charges | | $ | 0.35 | | | $ | 0.32 | | | $ | 0.36 | | | $ | 0.33 | |
| Depletion and depreciation | | $ | 1.03 | | | $ | 1.60 | | | $ | 1.03 | | | $ | 1.37 | |
| General and administrative - total | | $ | 0.09 | | | $ | 0.10 | | | $ | 0.07 | | | $ | 0.11 | |
| Interest and debt expense | | $ | 0.43 | | | $ | 0.32 | | | $ | 0.44 | | | $ | 0.40 | |
| | | $ | 2.82 | | | $ | 3.05 | | | $ | 2.80 | | | $ | 2.88 | |
| | | | | | | | | | | | | | | | | |
| Note: Amounts on a per Mcfe basis may not total due to rounding. | | | | | | | | | | | | | | | |
| | | | | | | | | | | | | | | | | |
| Adjusted Margins | | | | | | | | | | | | | | | | |
| Adjusted Net Income(4) | | | 27 | % | | | 29 | % | | | 26 | % | | | 35 | % |
| Adjusted Operating Cash Flow Margin(5) | | | 55 | % | | | 66 | % | | | 54 | % | | | 67 | % |
Ultra Petroleum Corp.
Third Quarter 2013 Results
| Page 7 of 10 |
| | | | | | | |
| Ultra Petroleum Corp. | | | | | | |
| Supplemental Balance Sheet Data |
| All amounts expressed in US$000's |
| | | As of | |
| | | September 30, | | | December 31, | |
| | | 2013 | | | 2012 | |
| | | (Unaudited) | | | | |
| Cash and cash equivalents | | $ | 4,532 | | | $ | 12,921 | |
| Long-term debt | | | | | | | | |
| Bank indebtedness | | | 300,000 | | | | 277,000 | |
| Senior notes | | | 1,560,000 | | | | 1,560,000 | |
| | | $ | 1,860,000 | | | $ | 1,837,000 | |
| | | | | | | | | |
| Reconciliation of Operating Cash Flow and Net Cash Provided by Operating Activities (unaudited) | |
| All amounts expressed in US$000's | | | | | | | | |
| | | | | | | | | |
| The following table reconciles net cash provided by operating activities with operating cash flow as derived from the company’s financial information. |
| | | | | | | | | | | | | |
| | | For the Nine Months Ended | | | For the Quarter Ended | |
| | | September 30, | | | September 30, | |
| | | 2013 | | | 2012 | | | 2013 | | | 2012 | |
| | | | | | | | | | | | | |
| Net cash provided by operating activities | | $ | 327,071 | | | $ | 480,075 | | | $ | 117,937 | | | $ | 152,426 | |
| Net changes in operating assets and liabilities | | | | | | | | | | | | | | | | |
| and other non-cash items* | | | 48,827 | | | | 83,744 | | | | (87 | ) | | | 35,096 | |
| Net cash provided by operating activities before | | | | | | | | | | | | | | | | |
| changes in operating assets and liabilities | | $ | 375,898 | | | $ | 563,819 | | | $ | 117,850 | | | $ | 187,522 | |
Ultra Petroleum Corp.
Hedging Summary
November 1, 2013
The company has the following hedge positions in place to mitigate its commodity price exposure:
| NYMEX | | Q4 2013 |
| Volume (Bcf) | | 12.1 |
| MMbtu ($) | | $3.54 |
| Mcf ($) | | $3.75 |
Ultra Petroleum Corp.
Third Quarter 2013 Results
| Page 8 of 10 |
The company reports its financial results in accordance with accounting principles generally accepted in the United States of America ("GAAP"). However, management believes certain non-GAAP performance measures may provide users of this financial information with additional meaningful comparisons between current results and the results of the company’s peers and of prior periods.
(1)Operating Cash Flow is defined as Net cash provided by operating activities before changes in operating assets and liabilities and other non-cash items. Management believes that the non-GAAP measure of operating cash flow is useful as an indicator of an oil and gas exploration and production company's ability to internally fund exploration and development activities and to service or incur additional debt. The company has also included this information because changes in operating assets and liabilities relate to the timing of cash receipts and disbursements which the company may not control and may not relate to the period in which the operating activities occurred. Operating cash flow should not be considered in isolation or as a substitute for net cash provided by operating activities prepared in accordance with GAAP.
(2)EBITDA is defined as earnings before interest, taxes, DD&A and other non-cash charges.
Management presents the following measures because (i) they are consistent with the manner in which the company's performance is measured relative to the performance of its peers, (ii) these measures are more comparable to earnings estimates provided by securities analysts, and (iii) charges or amounts excluded cannot be reasonably estimated and guidance provided by the company excludes information regarding these types of items. These adjusted amounts are not a measure of financial performance under GAAP.
(3) Adjusted Net Income is defined as Net income (loss) adjusted to exclude certain charges or amounts in order to exclude the volatility associated with the effects of non-recurring charges, non-cash mark-to-market gains and losses on commodity derivatives, non-cash ceiling test impairments and other similar items.
(4) Adjusted Net Income Margin is defined as Adjusted Net Income divided by the sum of Oil and natural gas sales plus Realized gain (loss) on commodity derivatives.
(5) Adjusted Operating Cash Flow Margin is defined as Operating Cash Flow divided by the sum of Oil and natural gas sales plus Realized gain (loss) on commodity derivatives.
*Other non-cash items include reduction in tax benefit from stock based compensation and other.
Ultra Petroleum Corp.
Third Quarter 2013 Results
| Page 9 of 10 |
About Ultra Petroleum
Ultra Petroleum Corp. is an independent exploration and production company focused on developing its long-life natural gas reserves in the Green River Basin of Wyoming – the Pinedale and Jonah Fields – and is in the early exploration and development stages in the Appalachian Basin of Pennsylvania. Ultra is listed on the New York Stock Exchange and trades under the ticker symbol “UPL”. The company had 152,977,633 shares outstanding on September 30, 2013.
This release can be found at http://www.ultrapetroleum.com.
This news release includes “forward-looking statements” within the meaning of Section 27A of the Securities Act of 1933, as amended, and Section 21E of the Securities Exchange Act of 1934, as amended. The opinions, forecasts, projections or other statements, other than statements of historical fact, are forward-looking statements. Although the company believes that the expectations reflected in such forward-looking statements are reasonable, the company can give no assurance that such expectations will prove to have been correct. Certain risks and uncertainties inherent in the company’s businesses are set forth in its filings with the Securities and Exchange Commission (“SEC”), particularly in the section entitled “Risk Factors” included in its Annual Report on Form 10-K for the most recent fiscal year and from time to time in other filings made by the company with the SEC. These risks and uncertainties include, but are not limited to, increased competition, the timing and extent of changes in prices for oil and gas, the timing and extent of the company’s success in discovering, developing, producing and estimating reserves, the effects of weather and government regulation, availability of oil field personnel, services, drilling rigs and other equipment, as well as other factors listed in the reports filed by the company with the SEC. The SEC permits oil and gas companies to disclose only proved, probable and possible reserves in filings with the SEC. Information about reserves presented in this news release, which reflects estimates prepared the Company’s internal reserve engineers, may include references to certain terms that SEC does not allow oil and gas companies to include in their SEC filings such as “net risked reserves” or “resource potential.” The Company encourages investors to review the reserve disclosures in the Company’s filings with the SEC, which are available on the Company’s website or at the SEC’s website at www.sec.gov for more information about the Company’s reserves. Full details regarding the selected financial information provided above will be available in the company’s report on Form 10-Q for the quarter ended September 30, 2013.
For further information contact:
Kelly L. Whitley
Director, Investor Relations
Phone: 281-582-6602
Email:kwhitley@ultrapetroleum.com
Julie E. Danvers
Manager, Investor Relations
Phone:281-582-6604
Email:jdanvers@ultrapetroleum.com
Ultra Petroleum Corp.
Third Quarter 2013 Results
| Page 10 of 10 |
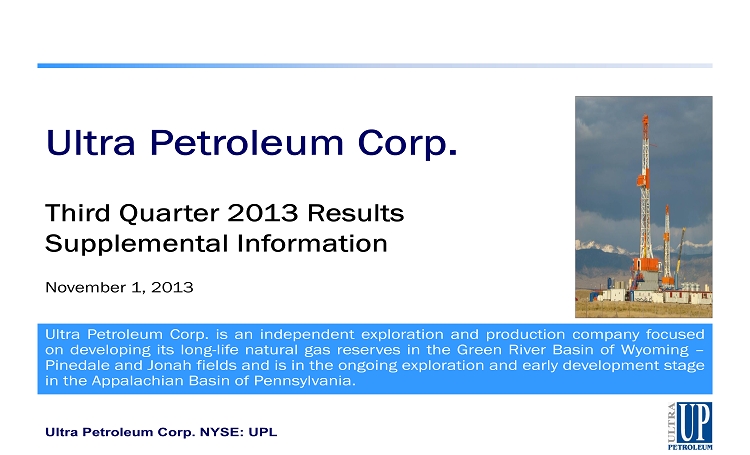
Ultra Petroleum Corp. Third Quarter 2013 Results Supplemental Information November 1, 2013 Ultra Petroleum Corp . is an independent exploration and production company focused on developing its long - life natural gas reserves in the Green River Basin of Wyoming – Pinedale and Jonah fields and is in the ongoing exploration and early development stage in the Appalachian Basin of Pennsylvania . Ultra Petroleum Corp. NYSE: UPL
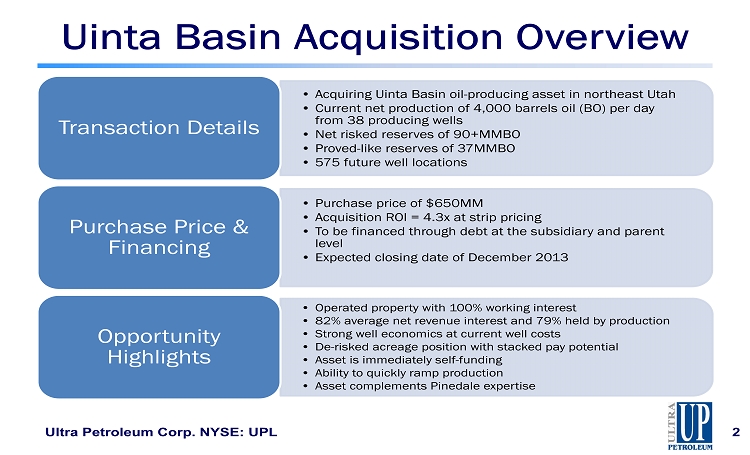
Uinta Basin Acquisition Overview • Acquiring Uinta Basin oil - producing asset in northeast Utah • Current net production of 4,000 barrels oil (BO) per day from 38 producing wells • Net risked reserves of 90+MMBO • Proved - like reserves of 37MMBO • 575 future well locations Transaction Details • Purchase price of $650MM • Acquisition ROI = 4.3x at strip pricing • To be financed through debt at the subsidiary and parent level • Expected closing date of December 2013 Purchase Price & Financing • Operated property with 100% working interest • 82% average net revenue interest and 79% held by production • Strong well economics at current well costs • De - risked acreage position with stacked pay potential • Asset is immediately self - funding • Ability to quickly ramp production • Asset complements Pinedale expertise Opportunity Highlights Ultra Petroleum Corp. NYSE: UPL 2
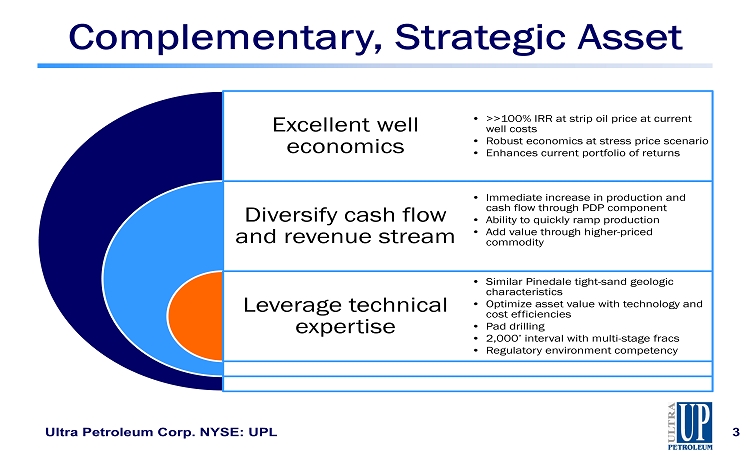
Complementary, Strategic Asset Excellent well economics Diversify cash flow and revenue stream Leverage technical expertise • >>100% IRR at strip oil price at current well costs • Robust economics at stress price scenario • Enhances current portfolio of returns • Immediate increase in production and cash flow through PDP component • Ability to quickly ramp production • Add value through higher - priced commodity • Similar Pinedale tight - sand geologic characteristics • Optimize asset value with technology and cost efficiencies • Pad drilling • 2,000’ interval with multi - stage fracs • Regulatory environment competency Ultra Petroleum Corp. NYSE: UPL 3
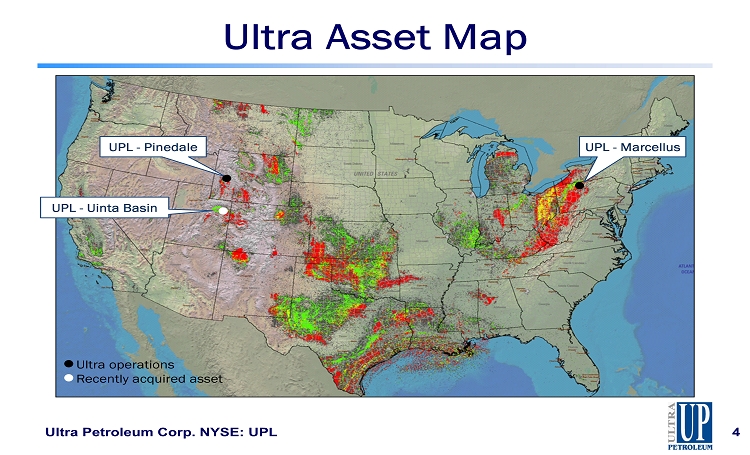
Ultra Asset Map Ultra Petroleum Corp. NYSE: UPL 4 UPL - Pinedale UPL - Marcellus UPL - Uinta Basin Ultra operations Recently acquired asset
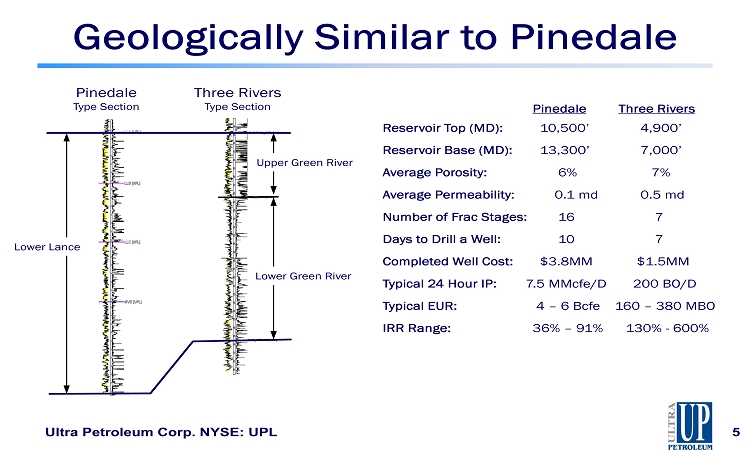
Ultra Petroleum Corp. NYSE: UPL 5 Upper Green River Lower Green River Lower Lance Pinedale Type Section Three Rivers Type Section Geologically Similar to Pinedale Pinedale Three Rivers Reservoir Top (MD): 10,500’ 4,900’ Reservoir Base (MD): 13,300’ 7,000’ Average Porosity: 6% 7% Average Permeability : 0.1 md 0.5 md Number of Frac Stages: 16 7 Days to Drill a Well: 10 7 Completed Well Cost: $3.8MM $1.5MM Typical 24 Hour IP: 7.5 MMcfe /D 200 BO/D Typical EUR: 4 – 6 Bcfe 160 – 380 MBO IRR Range: 36% – 91% 130% - 600%
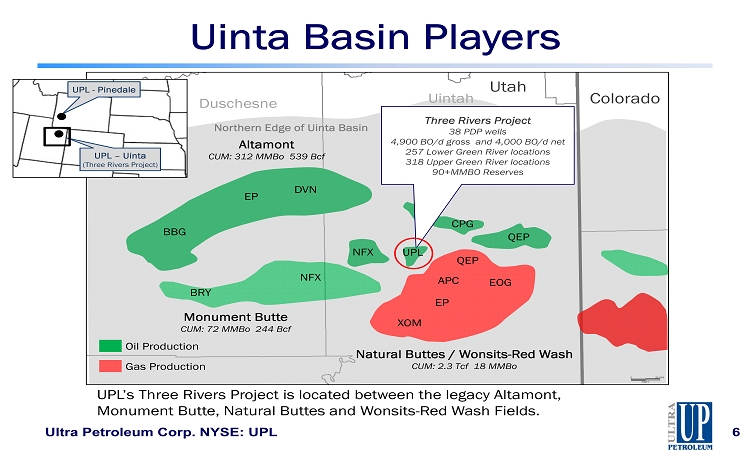
6 Uintah Altamont CUM: 312 MMBo 539 Bcf Natural Buttes / Wonsits - Red Wash CUM: 2.3 Tcf 18 MMBo Monument Butte CUM: 72 MMBo 244 Bcf Colorado EP DVN BBG BRY NFX QEP QEP EOG XOM EP CPG Oil Production Gas Production Three Rivers Project 38 PDP w ells 4,900 BO/d gross and 4,000 BO/d net 257 Lower Green River locations 318 Upper Green River locations 90+MMBO Reserves Duschesne Northern Edge of Uinta Basin NFX APC UPL - Pinedale UPL – Uinta (Three Rivers Project) UPL UPL’s Three Rivers Project is located between the legacy Altamont, Monument Butte, Natural Buttes and Wonsits - Red Wash Fields. Uinta Basin Players Ultra Petroleum Corp. NYSE: UPL Utah
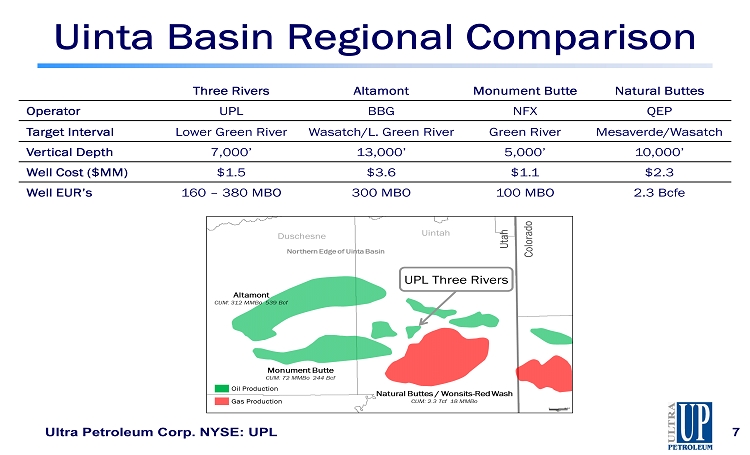
Uinta Basin Regional Comparison Three Rivers Altamont Monument Butte Natural Buttes Operator UPL BBG NFX QEP Target Interval Lower Green River Wasatch/L. Green River Green River Mesaverde/Wasatch Vertical Depth 7,000’ 13,000’ 5,000’ 10,000’ Well Cost ($MM) $1.5 $3.6 $1.1 $2.3 Well EUR’s 160 – 380 MBO 300 MBO 100 MBO 2.3 Bcfe Ultra Petroleum Corp. NYSE: UPL 7 UPL Three Rivers
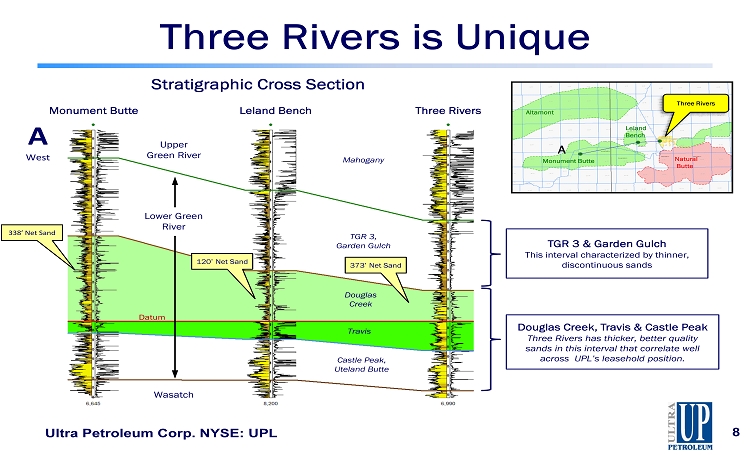
Ultra Petroleum Corp. NYSE: UPL 8 Stratigraphic Cross Section Douglas Creek Travis Castle Peak, Uteland Butte TGR 3, Garden Gulch Mahogany A West Datum Lower Green River Upper Green River Altamont Monument Butte Natural Butte Three Rivers A Leland Bench Three Rivers Leland Bench Monument Butte Douglas Creek, Travis & Castle Peak Three Rivers has thicker, better quality sands in this interval that correlate well across UPL’s leasehold position. Three Rivers is Unique TGR 3 & Garden Gulch This interval characterized by thinner, discontinuous sands 373’ Net Sand 120’ Net Sand 338’ Net Sand Wasatch
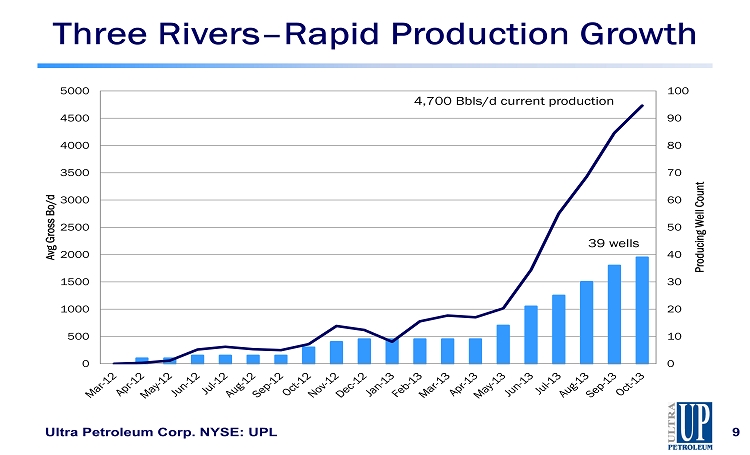
Three Rivers – Rapid Production Growth 0 10 20 30 40 50 60 70 80 90 100 0 500 1000 1500 2000 2500 3000 3500 4000 4500 5000 Producing Well Count Avg Gross Bo/d 4,700 Bbls /d current production 39 wells Ultra Petroleum Corp. NYSE: UPL 9
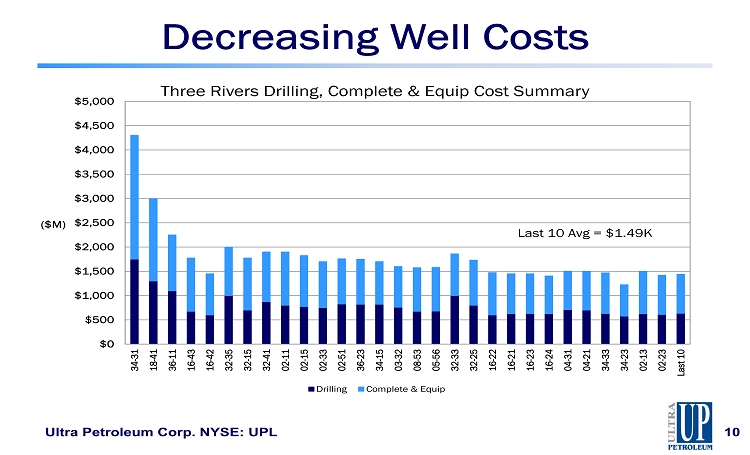
Decreasing Well Costs $0 $500 $1,000 $1,500 $2,000 $2,500 $3,000 $3,500 $4,000 $4,500 $5,000 34-31 18-41 36-11 16-43 16-42 32-35 32-15 32-41 02-11 02-15 02-33 02-51 36-23 34-15 03-32 08-53 05-56 32-33 32-25 16-22 16-21 16-23 16-24 04-31 04-21 34-33 34-23 02-13 02-23 Last 10 ($M) Three Rivers Drilling, Complete & Equip Cost Summary Drilling Complete & Equip Last 10 Avg = $ 1.49K Ultra Petroleum Corp. NYSE: UPL 10
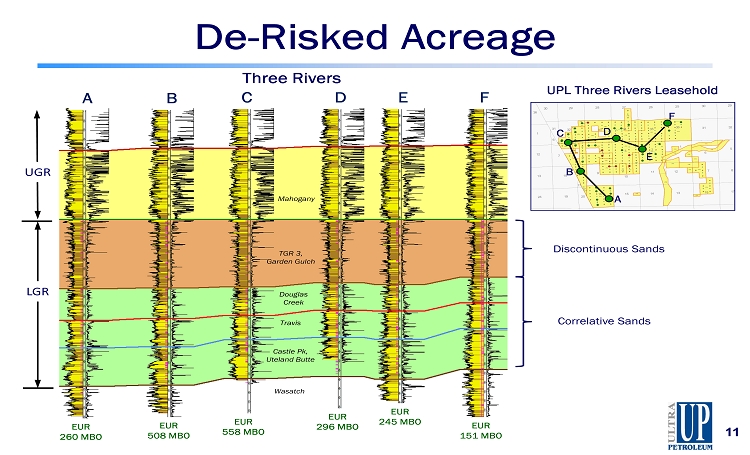
11 Three Rivers Douglas Creek Travis Castle Pk, Uteland Butte TGR 3, Garden Gulch Mahogany LGR UGR De - Risked Acreage Discontinuous Sands Correlative Sands A B C D E F A UPL Three Rivers Leasehold F B C D E Wasatch EUR 508 MBO EUR 558 MBO EUR 296 MBO EUR 245 MBO EUR 151 MBO EUR 260 MBO
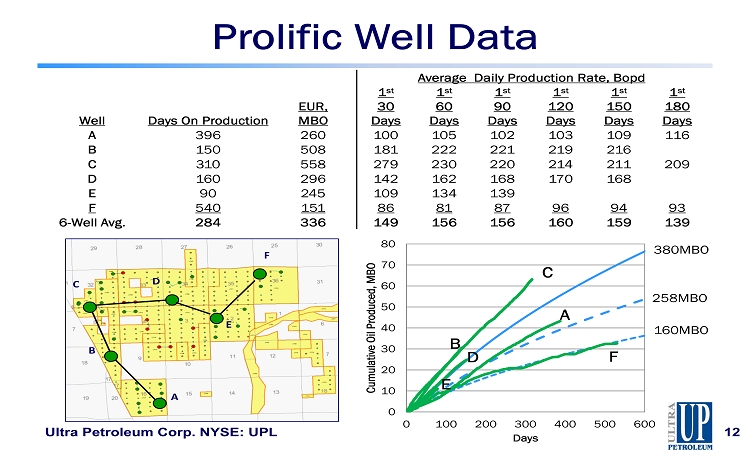
0 10 20 30 40 50 60 70 80 0 100 200 300 400 500 600 Cumulative Oil Produced, MBO Days Average Daily Production Rate, Bopd Well Days On Production EUR, MBO 1 st 30 Days 1 st 60 Days 1 st 90 Days 1 st 12 0 Days 1 st 150 Days 1 st 180 Days A 396 260 100 105 102 103 109 116 B 150 508 181 222 221 219 216 C 310 558 279 230 220 214 211 209 D 160 296 142 162 168 170 168 E 90 245 109 134 139 F 540 151 86 81 87 96 94 93 6 - Well Avg. 284 336 149 156 156 160 159 139 A B C D E F 380MBO 258MBO 160MBO A F B C D E Prolific Well Data Ultra Petroleum Corp. NYSE: UPL 12

Lower Green River Well Performance Ultra Petroleum Corp. NYSE: UPL 13 0 10 20 30 40 50 60 70 0 100 200 300 400 500 600 Cumulative Oil Produced, MBO Days Payout at 23,000 Bbls Recent 19 w ells 380 MBO Type Curve 258 MBO Type Curve Payout calculated using $80/ Bbl net oil price Cumulative Production First 12 w ells 160 MBO Type Curve
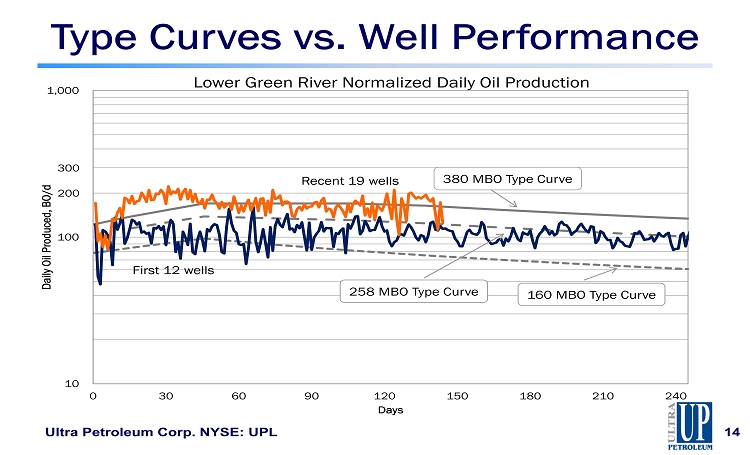
10 100 1,000 0 30 60 90 120 150 180 210 240 Daily Oil Produced, BO/d Days 200 3 00 Type Curves vs. Well Performance Ultra Petroleum Corp. NYSE: UPL 14 First 12 wells Recent 19 wells Lower Green River Normalized Daily Oil Production 380 MBO Type Curve 258 MBO Type Curve 160 MBO Type Curve
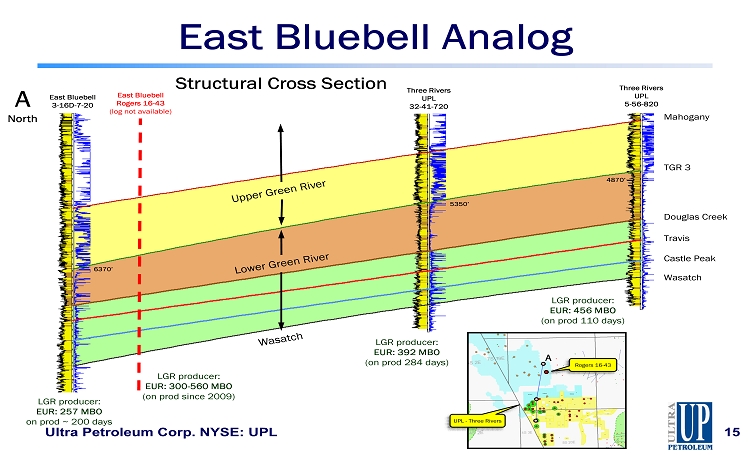
East Bluebell Analog 15 A North East Bluebell Rogers 16 - 43 (log not available) LGR producer: EUR: 300 - 560 MBO (on prod since 2009) LGR producer: EUR: 392 MBO (on prod 284 days) LGR producer: EUR: 456 MBO (on prod 110 days) Three Rivers UPL 32 - 41 - 720 Three Rivers UPL 5 - 56 - 820 East Bluebell 3 - 16D - 7 - 20 LGR producer: EUR: 257 MBO o n prod ~ 200 days 6370’ 5350’ 4870’ Structural Cross Section Rogers 16 - 43 A UPL - Three Rivers Mahogany TGR 3 Douglas Creek Travis Castle Peak Wasatch Ultra Petroleum Corp. NYSE: UPL

32 Months of Flat Production Ultra Petroleum Corp. NYSE: UPL 16 1 10 100 1000 BO/d Rogers 16 - 43 171 MBO Cumulative Production in ~4.5 years >100 BO/d for 32 continuous months

East Bluebell Analog 1 10 100 1000 BO/d Rogers 16 - 43 Ultra Petroleum Corp. NYSE: UPL 17 Economics at $1.5MM DC&E and strip pricing 171 MBO Cumulative Production at 7/2013 Hyperbolic 2: 560 MBO Hyperbolic: 530 MBO Harmonic: 470 MBO Exponential: 300 MBO
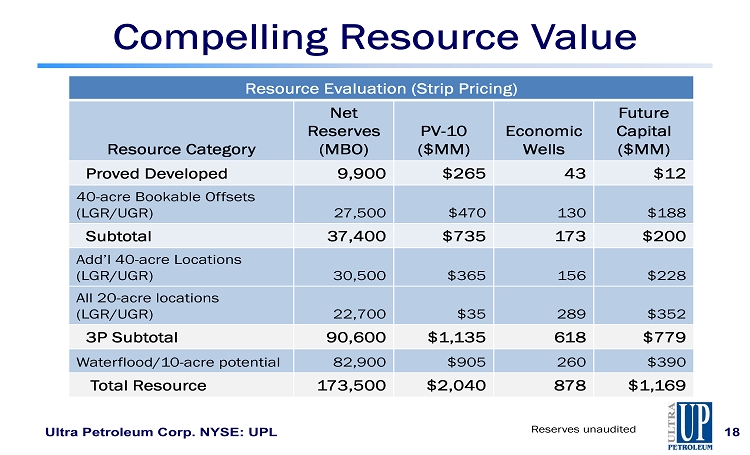
Compelling Resource Value Resource Evaluation (Strip Pricing) Resource Category Net Reserves (MBO) PV - 10 ($MM) Economic Wells Future Capital ($MM) Proved Developed 9,900 $265 43 $12 40 - acre Bookable Offsets (LGR/UGR) 27,500 $470 130 $188 Subtotal 37,400 $735 173 $200 Add’l 40 - acre Locations (LGR/UGR) 30,500 $365 156 $228 All 20 - acre locations (LGR/UGR) 22,700 $35 289 $352 3P Subtotal 90,600 $1,135 618 $779 Waterflood /10 - acre potential 82,900 $905 260 $390 Total Resource 173,500 $2,040 878 $1,169 Ultra Petroleum Corp. NYSE: UPL 18 Reserves unaudited
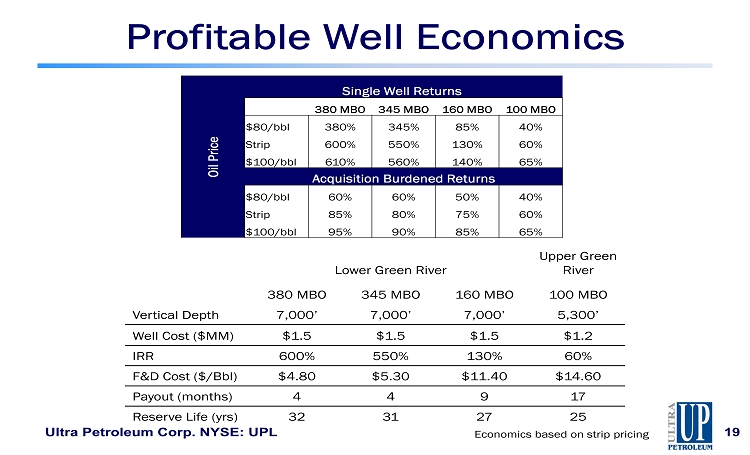
Profitable Well Economics Ultra Petroleum Corp. NYSE: UPL 19 Oil Price Single Well Returns 380 MBO 345 MBO 160 MBO 100 MBO $80/bbl 380% 345% 85% 40% Strip 600% 550% 130% 60% $100/bbl 610% 560% 140% 65% Acquisition Burdened Returns $80/bbl 60% 60% 50% 40% Strip 85% 80% 75% 60% $100/bbl 95% 90% 85% 65% Lower Green River Upper Green River 380 MBO 345 MBO 160 MBO 100 MBO Vertical Depth 7,000’ 7,000’ 7,000’ 5,300’ Well Cost ($MM) $1.5 $1.5 $1.5 $1.2 IRR 600% 550% 130% 60% F&D Cost ($/Bbl) $4.80 $5.30 $11.40 $14.60 Payout (months) 4 4 9 17 Reserve Life (yrs) 32 31 27 25 Economics based on strip pricing
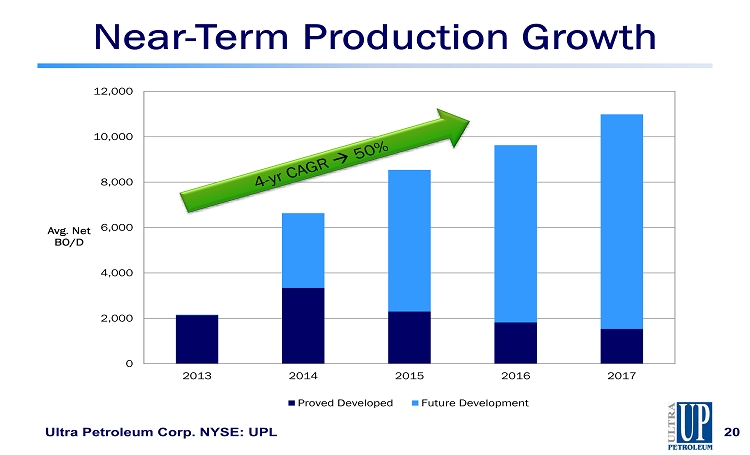
Near - Term Production Growth Ultra Petroleum Corp. NYSE: UPL 20 0 2,000 4,000 6,000 8,000 10,000 12,000 2013 2014 2015 2016 2017 Avg. Net BO/D Proved Developed Future Development

$0 $50 $100 $150 $200 $250 $MM Operating Cash Flow vs. Capital Expenditure Operating Cash Flow Capital Expenditure Self - Funding Development Ultra Petroleum Corp. NYSE: UPL 21 Economics based on strip pricing
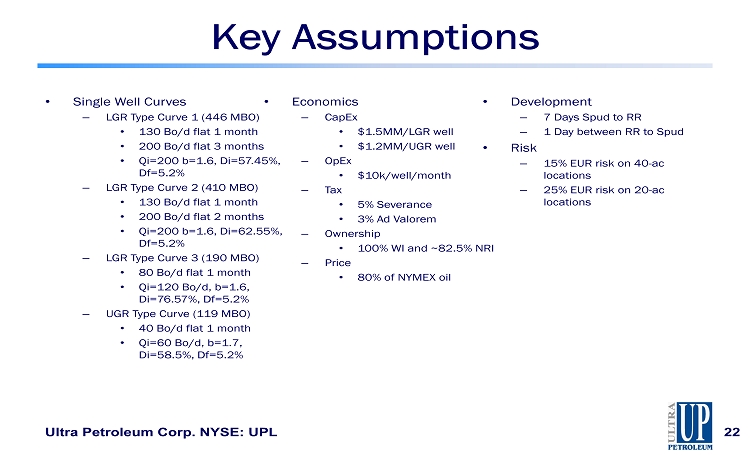
Key Assumptions Ultra Petroleum Corp. NYSE: UPL 22 • Single Well Curves – LGR Type Curve 1 (446 MBO) • 130 Bo/d flat 1 month • 200 Bo/d flat 3 months • Qi=200 b=1.6 , Di=57.45%, Df =5.2% – LGR Type Curve 2 (410 MBO) • 130 Bo/d flat 1 month • 200 Bo/d flat 2 months • Qi=200 b=1.6 , Di=62.55%, Df =5.2% – LGR Type Curve 3 (190 MBO) • 80 Bo/d flat 1 month • Qi=120 Bo/d, b=1.6, Di=76.57%, Df =5.2% – UGR Type Curve (119 MBO) • 40 Bo/d flat 1 month • Qi=60 Bo/d, b=1.7, Di=58.5%, Df =5.2% • Economics – CapEx • $1.5MM/LGR well • $1.2MM/UGR well – OpEx • $10k/well/month – Tax • 5% Severance • 3% Ad Valorem – Ownership • 100% WI and ~82.5% NRI – Price • 80% of NYMEX oil • Development – 7 Days Spud to RR – 1 Day between RR to Spud • Risk – 15% EUR risk on 40 - ac locations – 25% EUR risk on 20 - ac locations
Ultra Petroleum Corp. • Market Data as of September 30 , 2013 Shares of Common Stock Outstanding: 153.0MM Market Capitalization: $ 3.1 B Enterprise Value: $5.0B 52 Week Price Range: $ 15.26 ( 2 /15/13) - $ 24.26 ( 11 /1 /12) • Investor Contacts Kelly Whitley Julie Dan ver s Director, Investor Relations Manager, Investor Relations (281) 582 - 6602 (281) 582 - 6604 kwhitley@ultrapetroleum.com jdanvers@ultrapetroleum.com T his presentation contains or incorporates by reference forward looking statements within the meaning of the federal securities la ws. All statements other than statements of historical facts included in this document and other statements that include the words "believe", "expects ", "anticipates", "intends", "estimates", "projects", "target", "goal", "plans", "objective", "should", or similar words are forward looking statements an d r eflect the Company’s current views about future events and financial performance. No assurances can be given that such events or performance will occur as pr ojected, and actual results may differ materially from those projected. Important factors that may cause actual results to differ from the forward - looking statements in this presentation include: incr eased competition; the timing and extent of changes in prices for crude oil and natural gas; the timing and extent of discovery, development, produc tio n and estimation of oil and natural gas reserves; the effects of weather and government regulation; the availability of oil field personnel and services and equipment; and other risks detailed in the company’s SEC filings, particularly in its Annual Report on Form 10 - K available from Ultra Petroleum Corp. at 40 0 North Sam Houston Parkway E., Suite 1200, Houston, TX 77060 (Attention: Investor Relations). You can also obtain this information from the SEC by calling 1 - 800 - SEC - 0330 or from the SEC’s website at www.sec.gov. This presentation may contain certain non - GAAP financial measures. Reconciliation and calculation schedules for the non - GAAP fin ancial measures can be found on our website at www.ultrapetroleum.com . SEC guidelines permit oil and gas companies to disclose only proved, probable and possible reserves in filings with the SEC. In connection with this presentation, we may use the terms “risked reserves” or resource “potential” or “upside” or other descriptions of volumes of res erves or resource that the SEC’s guidelines may prohibit us from including in filings with the SEC. Investors are urged to review the reserve disclosu res in our SEC filings, which are available on our website or the SEC’s website .