The management of Steel Dynamics, Inc. is responsible for the preparation and integrity of the company’s consolidated financial statements, establishing and maintaining adequate internal control over financial reporting for the company (including its consolidated subsidiaries) and all related information appearing in this Form 10-K. The company maintains accounting and internal control systems which are intended to provide reasonable assurance that assets are safeguarded against loss from unauthorized use or disposition, transactions are executed in accordance with management’s authorization and accounting records are reliable for preparing financial statements in accordance with accounting principles generally accepted in the United States. We are dedicated to ensuring that we maintain the high standards of financial accounting and reporting that we have established. Our culture demands integrity and an unyielding commitment to strong internal practices and policies.
Under the supervision and with the participation of the company’s management, including the Chief Executive Officer and Chief Financial Officer, the company conducted an evaluation of the effectiveness of its internal control over financial reporting as of December 31, 2004. The framework on which such evaluation was based is contained in the report entitled “Internal Control—Integrated Framework” issued by the Committee of Sponsoring Organizations of the Treadway Commission (the “COSO Report”). Based on that evaluation, management concluded that its internal control over financial reporting was effective as of December 31, 2004.
Management’s assessment of the effectiveness of the company’s internal control over financial reporting as of December 31, 2004 has been audited by Ernst & Young LLP, an independent registered public accounting firm, as stated in their report which follows.
Back to Contents
REPORT OF INDEPENDENT REGISTERED PUBLIC ACCOUNTING FIRM
ON INTERNAL CONTROL OVER FINANCIAL REPORTING
To the Board of Directors and Stockholders of
Steel Dynamics, Inc.
We have audited management’s assessment, included in the accompanying Management’s Report on Internal Control over Financial Reporting, that Steel Dynamics, Inc. maintained effective internal control over financial reporting as of December 31, 2004, based on criteria established in Internal Control—Integrated Framework issued by the Committee of Sponsoring Organizations of the Treadway Commission (the COSO criteria). Steel Dynamic Inc.’s management is responsible for maintaining effective internal control over financial reporting and for its assessment of the effectiveness of internal control over financial reporting. Our responsibility is to express an opinion on management’s assessment and an opinion on the effectiveness of the company’s internal control over financial reporting based on our audit.
We conducted our audit in accordance with the standards of the Public Company Accounting Oversight Board (United States). Those standards require that we plan and perform the audit to obtain reasonable assurance about whether effective internal control over financial reporting was maintained in all material respects. Our audit included obtaining an understanding of internal control over financial reporting, evaluating management’s assessment, testing and evaluating the design and operating effectiveness of internal control, and performing such other procedures as we considered necessary in the circumstances. We believe that our audit provides a reasonable basis for our opinion.
A company’s internal control over financial reporting is a process designed to provide reasonable assurance regarding the reliability of financial reporting and the preparation of financial statements for external purposes in accordance with generally accepted accounting principles. A company’s internal control over financial reporting includes those policies and procedures that (1) pertain to the maintenance of records that, in reasonable detail, accurately and fairly reflect the transactions and dispositions of the assets of the company; (2) provide reasonable assurance that transactions are recorded as necessary to permit preparation of financial statements in accordance with generally accepted accounting principles, and that receipts and expenditures of the company are being made only in accordance with authorizations of management and directors of the company; and (3) provide reasonable assurance regarding prevention or timely detection of unauthorized acquisition, use, or disposition of the company’s assets that could have a material effect on the financial statements.
Because of its inherent limitations, internal control over financial reporting may not prevent or detect misstatements. Also, projections of any evaluation of effectiveness to future periods are subject to the risk that controls may become inadequate because of changes in conditions, or that the degree of compliance with the policies or procedures may deteriorate.
In our opinion, management’s assessment that Steel Dynamics, Inc. maintained effective internal control over financial reporting as of December 31, 2004, is fairly stated, in all material respects, based on the COSO criteria. Also, in our opinion, Steel Dynamics, Inc. maintained, in all material respects, effective internal control over financial reporting as of December 31, 2004, based on the COSO criteria.
We also have audited, in accordance with the standards of the Public Company Accounting Oversight Board (United States), the consolidated balance sheets of Steel Dynamics, Inc as of December 31, 2004 and 2003, and the related consolidated statements of income, shareholders’ equity, and cash flows for each of the three years in the period ended December 31, 2004 and our report dated February 23, 2005 expressed an unqualified opinion thereon.
Fort Wayne, Indiana
February 23, 2005
54
Back to Contents
REPORT OF INDEPENDENT REGISTERED PUBLIC ACCOUNTING FIRM
To the Board of Directors and Stockholders of
Steel Dynamics, Inc.
We have audited the accompanying consolidated balance sheets of Steel Dynamics, Inc. as of December 31, 2004 and 2003, and the related consolidated statements of income, stockholders’ equity, and cash flows for each of the three years in the period ended December 31, 2004. These financial statements are the responsibility of the Company’s management. Our responsibility is to express an opinion on these financial statements based on our audits.
We conducted our audits in accordance with auditing standards of the Public Company Accounting Oversight Board (United States). Those standards require that we plan and perform the audit to obtain reasonable assurance about whether the financial statements are free of material misstatement. An audit includes examining, on a test basis, evidence supporting the amounts and disclosures in the financial statements. An audit also includes assessing the accounting principles used and significant estimates made by management, as well as evaluating the overall financial statement presentation. We believe that our audits provide a reasonable basis for our opinion.
In our opinion, the financial statements referred to above present fairly, in all material respects, the consolidated financial position of Steel Dynamics, Inc. at December 31, 2004 and 2003, and the consolidated results of its operations and its cash flows for each of the three years in the period ended December 31, 2004, in conformity with U.S. generally accepted accounting principles.
We have also audited in accordance with standards of the Public Company Accounting Oversight Board (United States), the effectiveness of Steel Dynamics, Inc.’s internal control over financial reporting as of December 31, 2004, based on criteria established in Internal Control – Integrated Framework issued by the Committee of Sponsoring Organizations of the Treadway Commission and our report dated February 23, 2005 expressed an unqualified opinion thereon.
Fort Wayne, Indiana
February 23, 2005
55
Back to Contents
STEEL DYNAMICS, INC.
CONSOLIDATED BALANCE SHEETS
(in thousands, except share data)
| | | December 31,
| |
| | | 2004 | | 2003 | |
| | |
|
| |
|
| |
ASSETS | | | | | | | |
Current assets: | | | | | | | |
| Cash and equivalents | | $ | 16,334 | | $ | 65,430 | |
| Accounts receivable, net of allowance for doubtful accounts of $5,138 and $3,678 as of December 31, 2004 and 2003, respectively | | | 214,880 | | | 100,933 | |
| Accounts receivable-related parties | | | 38,981 | | | 25,090 | |
| Inventories | | | 381,488 | | | 184,496 | |
| Deferred income taxes | | | 6,856 | | | 23,217 | |
| Other current assets | | | 18,980 | | | 8,769 | |
| | |
|
| |
|
| |
| Total current assets | | | 677,519 | | | 407,935 | |
| | | | | | | | |
Property, plant and equipment, net | | | 1,024,044 | | | 1,001,116 | |
| | | | | | | | |
Restricted cash | | | 989 | | | 2,636 | |
| | | | | | | | |
Other assets | | | 31,067 | | | 36,752 | |
| | |
|
| |
|
| |
Total assets | | $ | 1,733,619 | | $ | 1,448,439 | |
| | |
|
| |
|
| |
| | | | | | | | |
LIABILITIES AND STOCKHOLDERS’ EQUITY | | | | | | | |
| | | | | | | | |
Current liabilities: | | | | | | | |
| Accounts payable | | $ | 136,517 | | $ | 42,698 | |
| Accounts payable-related parties | | | 5,371 | | | 36,628 | |
| Accrued interest | | | 8,796 | | | 11,312 | |
| Other accrued expenses | | | 75,750 | | | 46,678 | |
| Current maturities of long-term debt | | | 6,774 | | | 15,988 | |
| | |
|
| |
|
| |
| Total current liabilities | | | 233,208 | | | 153,304 | |
| | | | | | | | |
Long-term debt, including unamortized bond premium of $7,147 and $8,834, as of December 31, 2004 and 2003, respectively | | | 441,605 | | | 591,586 | |
| | | | | | | | |
Deferred income taxes | | | 209,215 | | | 115,703 | |
| | | | | | | | |
Minority interest | | | 2,469 | | | 613 | |
| | | | | | | | |
Commitments and contingencies | | | | | | | |
| | | | | | | | |
Stockholders’ equity: | | | | | | | |
| Common stock voting, $.01 par value; 100,000,000 shares authorized; 52,435,059 and 51,011,839 shares issued; 48,485,671 and 48,645,246 shares outstanding as of December 31, 2004 and 2003, respectively | | | 523 | | | 509 | |
| Treasury stock, at cost; 3,949,388 and 2,366,593 shares as of December 31, 2004 and 2003, respectively | | | (84,141 | ) | | (28,670 | ) |
| Additional paid-in capital | | | 390,505 | | | 362,328 | |
| Retained earnings | | | 540,235 | | | 257,254 | |
| Other accumulated comprehensive loss | | | — | | | (4,188 | ) |
| | |
|
| |
|
| |
| Total stockholders’ equity | | | 847,122 | | | 587,233 | |
| | |
|
| |
|
| |
Total liabilities and stockholders’ equity | | $ | 1,733,619 | | $ | 1,448,439 | |
| | |
|
| |
|
| |
See notes to consolidated financial statements.
56
Back to Contents
STEEL DYNAMICS, INC.
CONSOLIDATED STATEMENTS OF INCOME
(in thousands, except share data)
| | | Years ended December 31,
| |
| | | 2004 | | 2003 | | 2002 | |
| | |
|
| |
|
| |
|
| |
| Net sales: | | | | | | | | | | |
| Unrelated parties | | $ | 1,885,387 | | $ | 854,403 | | $ | 718,937 | |
| Related parties | | | 259,526 | | | 132,845 | | | 145,556 | |
| | |
|
| |
|
| |
|
| |
| Total net sales | | | 2,144,913 | | | 987,248 | | | 864,493 | |
| | | | | | | | | | | |
| Costs of goods sold | | | 1,541,423 | | | 841,920 | | | 646,958 | |
| | |
|
| |
|
| |
|
| |
Gross profit | | | 603,490 | | | 145,328 | | | 217,535 | |
| | | | | | | | | | | |
| Selling, general and administrative expenses | | | 96,581 | | | 48,721 | | | 59,168 | |
| | |
|
| |
|
| |
|
| |
Operating income | | | 506,909 | | | 96,607 | | | 158,367 | |
| | | | | | | | | | | |
| Interest expense | | | 38,907 | | | 34,493 | | | 30,201 | |
| Gain from debt extinguishment | | | — | | | 13,987 | | | — | |
| Other (income) expense | | | (7,031 | ) | | 664 | | | 3,689 | |
| | |
|
| |
|
| |
|
| |
| Income before income taxes | | | 475,033 | | | 75,437 | | | 124,477 | |
| Income taxes | | | 179,719 | | | 28,289 | | | 46,600 | |
| | |
|
| |
|
| |
|
| |
Net income | | $ | 295,314 | | $ | 47,148 | | $ | 77,877 | |
| | |
|
| |
|
| |
|
| |
| | | | | | | | | | | |
| Basic earnings per share | | $ | 5.99 | | $ | .99 | | $ | 1.65 | |
| | |
|
| |
|
| |
|
| |
| Weighted average common shares outstanding | | | 49,287 | | | 47,829 | | | 47,144 | |
| | |
|
| |
|
| |
|
| |
| Diluted earnings per share, including effect of assumed conversions | | $ | 5.27 | | $ | .91 | | $ | 1.64 | |
| | |
|
| |
|
| |
|
| |
| Weighted average common shares and share equivalents outstanding | | | 56,527 | | | 54,890 | | | 47,592 | |
| | |
|
| |
|
| |
|
| |
| Dividends declared per share | | $ | .25 | | $ | — | | $ | — | |
| | |
|
| |
|
| |
|
| |
See notes to consolidated financial statements.
57
Back to Contents
STEEL DYNAMICS, INC.
CONSOLIDATED STATEMENTS OF STOCKHOLDERS’ EQUITY
(in thousands)
| | | Shares
| | Common | | Additional
paid-in | | Retained | | Other
accumulated
comprehensive | | Treasury | | | | |
| | | Common | | Treasury | | stock | | capital | | earnings | | loss | | stock | | Total | |
| | |
|
| |
|
| |
|
| |
|
| |
|
| |
|
| |
|
| |
|
| |
Balances at January 1, 2002 | | | 45,743 | | | 3,843 | | $ | 495 | | $ | 337,733 | | $ | 132,229 | | $ | (5,356 | ) | $ | (46,526 | ) | $ | 418,575 | |
| Issuance of common stock (net of expenses) and proceeds from exercise of stock options, including related tax effect | | | 381 | | | — | | | 4 | | | 4,997 | | | — | | | — | | | — | | | 5,001 | |
| Issuance of treasury stock | | | 1,460 | | | (1,460 | ) | | — | | | 4,320 | | | — | | | — | | | 17,680 | | | 22,000 | |
| Purchase of treasury stock | | | (3 | ) | | 3 | | | — | | | — | | | — | | | — | | | (43 | ) | | (43 | ) |
| | | | | | | | | | | | | | | | | | | | | | | | | | |
| Comprehensive income: | | | | | | | | | | | | | | | | | | | | | | | | | |
| Net income | | | — | | | — | | | — | | | — | | | 77,877 | | | — | | | — | | | 77,877 | |
| Comprehensive loss: | | | | | | | | | | | | | | | | | | | | | | | | | |
| Unrealized loss related to interest rate, swaps, net tax of $2,590 | | | — | | | — | | | — | | | — | | | — | | | (4,317 | ) | | — | | | (4,317 | ) |
| Reclassification adjustment related to interest rate swaps, net tax of $1,891 | | | — | | | — | | | — | | | — | | | — | | | 3,152 | | | — | | | 3,152 | |
| Unrealized loss on available-for-sale securities, net tax of $347 | | | — | | | — | | | — | | | — | | | — | | | (585 | ) | | — | | | (585 | ) |
| | | | | | | | | | | | | | | | | | | | | | | | | | |
| Total comprehensive income | | | | | | | | | | | | | | | | | | | | | | | | 76,127 | |
| | |
|
| |
|
| |
|
| |
|
| |
|
| |
|
| |
|
| |
|
| |
Balances at December 31, 2002 | | | 47,581 | | | 2,386 | | | 499 | | | 347,050 | | | 210,106 | | | (7,106 | ) | | (28,889 | ) | | 521,660 | |
| | | | | | | | | | | | | | | | | | | | | | | | | | |
| Issuance of common stock (net of expenses) and proceeds from exercise of stock options, including related tax effect | | | 1,044 | | | — | | | 10 | | | 15,066 | | | — | | | — | | | — | | | 15,076 | |
| Issuance of treasury stock | | | 33 | | | (33 | ) | | — | | | 212 | | | — | | | — | | | 395 | | | 607 | |
| Purchase of treasury stock | | | (13 | ) | | 13 | | | — | | | — | | | — | | | — | | | (176 | ) | | (176 | ) |
| Comprehensive income: | | | | | | | | | | | | | | | | | | | | | | | | | |
| Net income | | | — | | | — | | | — | | | — | | | 47,148 | | | — | | | — | | | 47,148 | |
| Comprehensive income: | | | | | | | | | | | | | | | | | | | | | | | | | |
| Unrealized loss related to interest rate, swaps, net tax of $838 | | | — | | | — | | | — | | | — | | | — | | | (1,397 | ) | | — | | | (1,397 | ) |
| Reclassification adjustment related to interest rate swaps, net tax of $2,203 | | | — | | | — | | | — | | | — | | | — | | | 3,671 | | | — | | | 3,671 | |
| Unrealized gain on available-for-sale securities, net tax of $383 | | | — | | | — | | | — | | | — | | | — | | | 644 | | | — | | | 644 | |
| | | | | | | | | | | | | | | | | | | | | | | |
|
| |
| Total comprehensive income | | | | | | | | | | | | | | | | | | | | | | | | 50,066 | |
| | |
|
| |
|
| |
|
| |
|
| |
|
| |
|
| |
|
| |
|
| |
Balances at December 31, 2003 | | | 48,645 | | | 2,366 | | | 509 | | | 362,328 | | | 257,254 | | | (4,188 | ) | | (28,670 | ) | | 587,233 | |
| | | | | | | | | | | | | | | | | | | | | | | | | | |
| Issuance of common stock (net of expenses) and proceeds from exercise of stock options, including related tax effect | | | 1,424 | | | — | | | 14 | | | 27,885 | | | — | | | — | | | — | | | 27,899 | |
| Dividends declared | | | — | | | — | | | — | | | — | | | (12,333 | ) | | — | | | — | | | (12,333 | ) |
| Issuance of treasury stock | | | 15 | | | (15 | ) | | — | | | 292 | | | — | | | — | | | 190 | | | 482 | |
| Purchase of treasury stock | | | (1,598 | ) | | 1,598 | | | — | | | — | | | — | | | — | | | (55,661 | ) | | (55,661 | ) |
| Comprehensive income: | | | | | | | | | | | | | | | | | | | | | | | | | |
| Net income | | | — | | | — | | | — | | | — | | | 295,314 | | | — | | | — | | | 295,314 | |
| Comprehensive income (loss): | | | | | | | | | | | | | | | | | | | | | | | | | |
| Unrealized gain related to interest rate, swaps, net tax of $378 | | | — | | | — | | | — | | | — | | | — | | | 616 | | | — | | | 616 | |
| Reclassification adjustment related to interest rate swaps, net tax of $2,188 | | | — | | | — | | | — | | | — | | | — | | | 3,631 | | | — | | | 3,631 | |
| Unrealized gain on available-for-sale securities, net tax of $172 | | | — | | | — | | | — | | | — | | | — | | | 287 | | | — | | | 287 | |
| Reclassification adjustment for available-for-sale securities, net tax of $202 | | | — | | | — | | | — | | | — | | | — | | | (346 | ) | | — | | | (346 | ) |
| Total comprehensive income | | | | | | | | | | | | | | | | | | | | | | | | 299,502 | |
| | |
|
| |
|
| |
|
| |
|
| |
|
| |
|
| |
|
| |
|
| |
Balances at December 31, 2004 | | | 48,486 | | | 3,949 | | $ | 523 | | $ | 390,505 | | $ | 540,235 | | $ | — | | $ | (84,141 | ) | $ | 847,122 | |
| | |
|
| |
|
| |
|
| |
|
| |
|
| |
|
| |
|
| |
|
| |
See notes to consolidated financial statements.
58
Back to Contents
STEEL DYNAMICS, INC.
CONSOLIDATED STATEMENTS OF CASH FLOWS
(in thousands)
| | | Years ended December 31,
| |
| | | 2004 | | 2003 | | 2002 | |
| | |
|
| |
|
| |
|
| |
Operating activities: | | | | | | | | | | |
| Net income | | $ | 295,314 | | $ | 47,148 | | $ | 77,877 | |
| Adjustments to reconcile net income to net cash provided by operating activities: | | | | | | | | | | |
| Depreciation and amortization | | | 84,749 | | | 69,110 | | | 59,443 | |
| Deferred income taxes | | | 107,404 | | | 28,836 | | | 25,485 | |
| Gain from debt extinguishment | | | — | | | (13,987 | ) | | — | |
| Loss on disposal of property, plant and equipment | | | 815 | | | 240 | | | 113 | |
| Minority interest | | | 1,856 | | | (1,068 | ) | | (137 | ) |
| Changes in certain assets and liabilities: | | | | | | | | | | |
| Accounts receivable | | | (127,838 | ) | | (7,544 | ) | | (36,600 | ) |
| Inventories | | | (196,992 | ) | | (31,292 | ) | | (34,836 | ) |
| Other assets | | | (8,282 | ) | | (2,636 | ) | | (4,110 | ) |
| Accounts payable | | | 57,680 | | | 33,109 | | | 4,887 | |
| Accrued expenses | | | 33,213 | | | 5,690 | | | 22,900 | |
| | |
|
| |
|
| |
|
| |
| Net cash provided by operating activities | | | 247,919 | | | 127,606 | | | 115,022 | |
| | |
|
| |
|
| |
|
| |
| | | | | | | | | | | |
Investing activities: | | | | | | | | | | |
| Purchases of property, plant and equipment | | | (102,046 | ) | | (137,269 | ) | | (142,600 | ) |
| Other investing activities | | | 55 | | | (8,075 | ) | | 8,814 | |
| | |
|
| |
|
| |
|
| |
| Net cash used in investing activities | | | (101,991 | ) | | (145,344 | ) | | (133,786 | ) |
| | |
|
| |
|
| |
|
| |
| | | | | | | | | | | |
Financing activities: | | | | | | | | | | |
| Issuance of long-term debt | | | 188,292 | | | 191,820 | | | 598,991 | |
| Repayments of long-term debt | | | (347,487 | ) | | (144,009 | ) | | (621,465 | ) |
| Issuance of common stock (net of expenses) and proceeds and tax benefits from exercise of stock options | | | 27,899 | | | 15,288 | | | 5,001 | |
| Issuance (purchase) of treasury stock | | | (55,179 | ) | | 219 | | | (43 | ) |
| Dividends paid | | | (7,452 | ) | | — | | | — | |
| Debt issuance costs | | | (1,097 | ) | | (4,368 | ) | | (17,743 | ) |
| | |
|
| |
|
| |
|
| |
| Net cash provided by (used in) financing activities | | | (195,024 | ) | | 58,950 | | | (35,259 | ) |
| | |
|
| |
|
| |
|
| |
| | | | | | | | | | | |
| Increase (decrease) in cash and equivalents | | | (49,096 | ) | | 41,212 | | | (54,023 | ) |
| Cash and equivalents at beginning of year | | | 65,430 | | | 24,218 | | | 78,241 | |
| | |
|
| |
|
| |
|
| |
| Cash and equivalents at end of year | | $ | 16,334 | | $ | 65,430 | | $ | 24,218 | |
| | |
|
| |
|
| |
|
| |
See notes to consolidated financial statements.
59
Back to Contents
STEEL DYNAMICS, INC.
NOTES TO CONSOLIDATED FINANCIAL STATEMENTS
Note 1. Description of the Business and Summary of Significant Accounting Policies
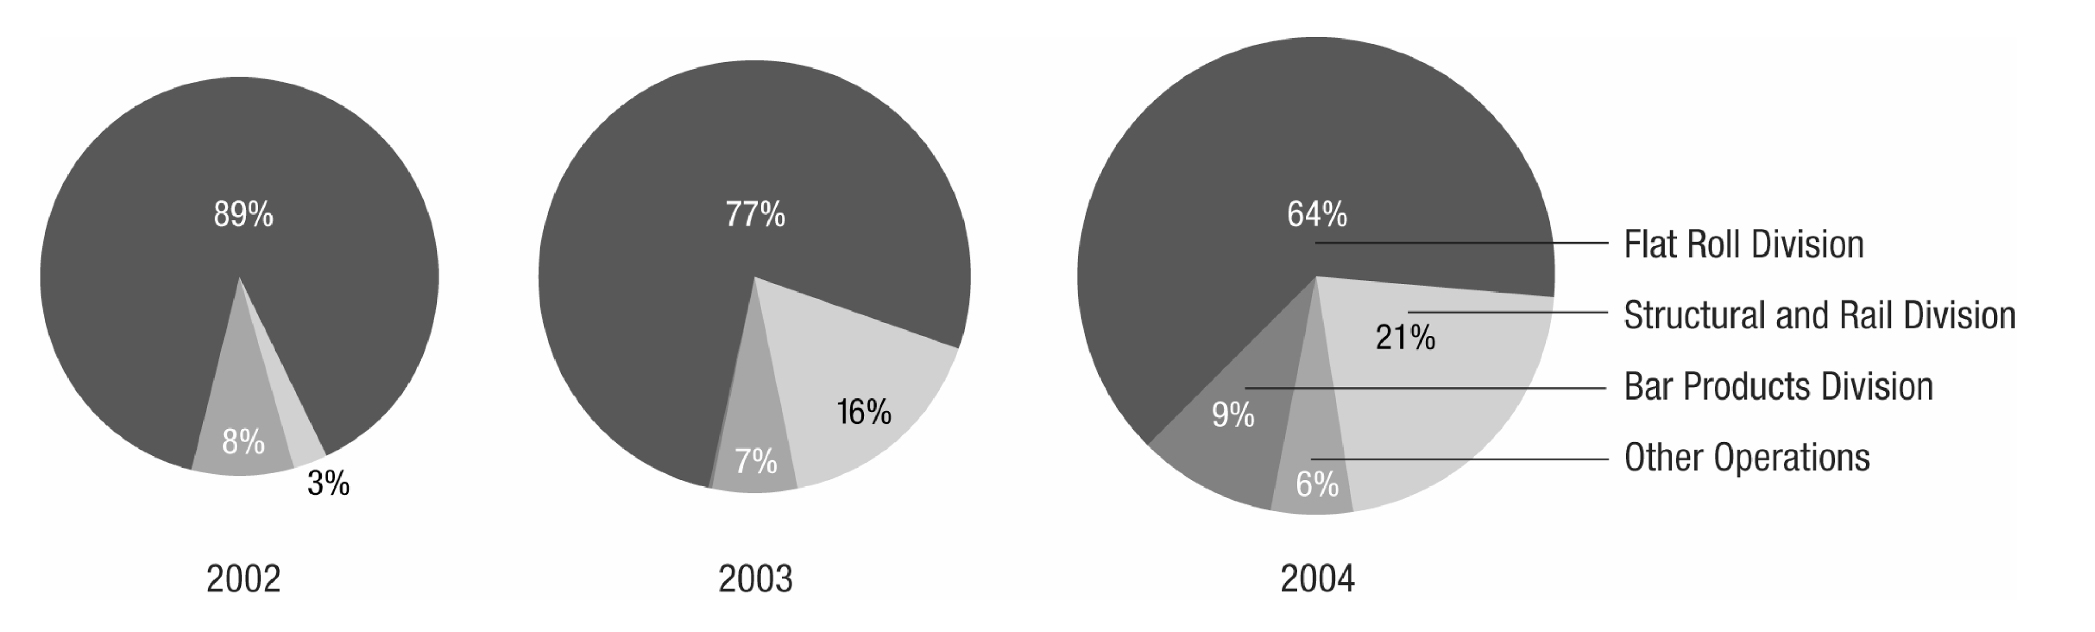
Steel Dynamics, Inc. (SDI), together with its subsidiaries (the company), is a domestic manufacturer of steel products with operations in the following businesses.
Steel Operations. Steel operations include the Flat Roll Division, the Structural and Rail Division and the Bar Products Division. The Flat Roll Division accounted for 66.5%, 76.8% and 88.8% of the company’s net sales during 2004, 2003 and 2002, respectively. This gradual decrease was the result of the company’s growth during this three year period during which the Structural and Rail Division commenced operations in the third quarter of 2002 and the Bar Products Division began operations on December 29, 2003.
The divisions operate technologically advanced mini-mills, producing steel from steel scrap, using electric arc melting furnaces, continuous casting and automated rolling mills. The Flat Roll Division sells a broad range of hot-rolled, cold-rolled and coated steel products, including a large variety of specialty products such as thinner gauge hot-rolled products, galvanized products, and painted products. The Structural and Rail Division sells structural steel beams, pilings, and other steel components. This facility is also designed to produce and sell a variety of standard and premium-grade rail for the railroad industry. During the fourth quarter of 2004, the division shipped its first industrial-quality rail, and anticipates shipping standard rail during the first half of 2005. The Bar Products Division currently sells special bar-quality and merchant bar-quality rounds and round-cornered squares. The divisions sell directly to end-users and service centers. These products are used in numerous industry sectors, including the automotive, construction, commercial, transportation and industrial machinery markets.
Steel Scrap Substitute and Other Operations. The Iron Dynamics scrap substitute facility involves the pioneering of a process to produce direct reduced iron, to compact that material to form hot-briquetted iron (HBI), and to then convert the HBI into liquid pig iron. HBI and liquid pig iron are high quality steel scrap substitutes that are used in our steelmaking operations. During 1999, IDI commenced initial start-up and produced and sold a minimal amount of liquid pig iron to the company’s Flat Roll Division. However, it was determined that IDI would require certain design and equipment modifications to attain its fully intended operating functionality. These modifications occurred during the second half of 2000 with completion and restart occurring in the first quarter of 2001. While IDI believed that many of the design and equipment deficiencies were corrected with these modifications, the company halted operations at IDI during July 2001 with no specific date set for resumption of actual production, as a result of higher-than-expected start-up and process refinement costs, lower-than-expected production quantities, exceptionally high energy costs and then historically low steel scrap pricing. From the time operations were halted in 2001 until the fourth quarter of 2002, the costs incurred at IDI were composed of those expenses required to maintain the facility and further evaluate the project and its related benefits. During the fourth quarter of 2002, IDI successfully completed certain operating trials utilizing a modified production process. This process reduced the per-unit cost of direct reduced iron production. Throughout 2003, the company invested $13.3 million for capital expenditures required to implement this modified production process, and Iron Dynamics restarted operations mid-November 2003. During 2004, IDI produced 173,000 tonnes of hot briquetted iron and after starting the submerged arc furnace in June, produced 47,000 tonnes of liquid pig iron during the second half of 2004.
The company also has two consolidated subsidiary operations: New Millennium Building Systems (NMBS), which receives revenue from the fabrication of trusses, girders, steel joists and steel decking for the non-residential construction industry and a 50%-owned facility that receives revenue from the further processing, or slitting, and sale of certain secondary and excess prime steel products.
60
Back to Contents
STEEL DYNAMICS, INC.
NOTES TO CONSOLIDATED FINANCIAL STATEMENTS — (Continued)
Note 1. Description of the Business and Summary of Significant Accounting Policies — (Continued)
Significant Accounting Policies |
Principles of Consolidation. The consolidated financial statements include the accounts of SDI, together with its subsidiaries, after elimination of significant intercompany accounts and transactions. Minority interest represents the minority shareholders’ proportionate share in the equity or income of the company’s consolidated subsidiaries.
Use of Estimates. These financial statements are prepared in conformity with accounting principles generally accepted in the United States which requires management to make estimates and assumptions that affect the reported amounts of assets and liabilities, the disclosure of contingent assets and liabilities at year-end and the reported amounts of revenues and expenses during the year. Significant items subject to such estimates and assumptions include the carrying value of property, plant and equipment; valuation allowances for trade receivables, inventories and deferred income tax assets; potential environmental liabilities, litigation claims and settlements. Actual results could differ from the estimates and assumptions used.
Reclassifications. Certain prior year amounts have been reclassified to conform to the fiscal 2004 presentation. The company reclassified certain costs related to the receipt of materials, internal transportation of inventories and related employee salaries and benefits from selling, general and administrative expenses to costs of goods sold. Generally, the company’s gross margin was reduced by approximately 1% due to this reclassification; however, total operating income was not affected.
Revenue Recognition. The company recognizes revenues from sales and the allowance for estimated costs associated with returns from these sales when the title of the product transfers. Provision is made for estimated product returns and customer claims based on estimates and actual historical experience. The company’s steel joist and steel decking operation, NMBS, recognizes revenues from construction contracts on a percentage of completion method based on steel tons used on completed units to date as a percentage of estimated total steel tons required by each contract. NMBS accounted for 4.2%, 5.1% and 4.3% of the company’s consolidated net sales during 2004, 2003 and 2002, respectively.
Freight Costs. The company reflects freight costs associated with shipping its products to customers as a component of costs of goods sold.
Cash and Equivalents. Cash and equivalents include all highly liquid investments with a maturity of three months or less at the date of acquisition. Restricted cash are funds held by trustees in debt service funds for the repayment of principal and interest related to the company’s municipal bonds and funds held in escrow related to the company’s workers’ compensation insurance program.
Marketable Securities. In accordance with Financial Accounting Standards Board (FASB) Statement No. 115, “Accounting for Certain Investments in Debt and Equity Securities,” the company has classified its marketable securities as “available for sale” and, accordingly, carries such securities at aggregate fair value. Unrealized gains or losses are included in other accumulated comprehensive loss as a component of stockholders’ equity. The aggregate fair market value of the company’s available for sale securities was $1.7 million at December 31, 2003 and was included in other current assets.
61
Back to Contents
STEEL DYNAMICS, INC.
NOTES TO CONSOLIDATED FINANCIAL STATEMENTS — (Continued)
Note 1. Description of the Business and Summary of Significant Accounting Policies — (Continued)
Inventories. Inventories are stated at lower of cost (principally standard cost which approximates actual cost on a first-in, first-out basis) or market. Inventory consisted of the following at December 31 (in thousands):
| | | 2004 | | 2003 | |
| | |
|
| |
|
| |
| Raw materials | | $ | 174,254 | | $ | 46,347 | |
| Supplies | | | 74,057 | | | 60,420 | |
| Work in progress | | | 33,864 | | | 15,996 | |
| Finished goods | | | 99,313 | | | 61,733 | |
| | |
|
| |
|
| |
| | | $ | 381,488 | | $ | 184,496 | |
| | |
|
| |
|
| |
Property, Plant and Equipment. Property, plant and equipment are stated at cost, which includes capitalized interest on construction-in-progress and is reduced by proceeds received from certain state and local government grants and other capital cost reimbursements. The company assigns each fixed asset a useful life ranging from five to 12 years for plant, machinery and equipment and 20 to 30 years for buildings and improvements. Repairs and maintenance are expensed as incurred. Depreciation for non-production assets is provided utilizing the straight-line depreciation methodology. Depreciation for production assets is provided utilizing the units-of-production depreciation methodology, based on units produced, subject to a minimum and maximum level. Depreciation expense was $78.3 million, $64.9 million and $56.4 million for the years ended December 31, 2004, 2003 and 2002, respectively.
In accordance with the methodology described in FASB Statement No. 144 (FAS 144), “Accounting for the Impairment or Disposal of Long-Lived Assets,” the company reviews long-lived assets for impairment whenever events or changes in circumstances indicate the carrying amount of such assets may not be recoverable. Impairment losses are recorded on long-lived assets used in operations when indicators of impairment are present and the undiscounted cash flows estimated to be generated during the life of those assets are less than the assets’ carrying amounts. The impairment loss is measured by comparing the fair value of the asset to its carrying amount.
Other Accumulated Comprehensive Loss. The company had no items that would be classified as other comprehensive income or loss at December 31, 2004. The following table presents the company’s components of other accumulated comprehensive loss at December 31, 2003 (in thousands):
| | | 2003 | |
| | |
|
| |
| Unrealized loss on interest rate swap agreements | | $ | (4,247 | ) |
| Unrealized gain on available for sale securities | | | 59 | |
| | |
|
| |
| | | $ | (4,188 | ) |
| | |
|
| |
Concentration of Credit Risk. Financial instruments that potentially subject the company to significant concentrations of credit risk principally consist of temporary cash investments and accounts receivable. The company places its temporary cash investments with high credit quality financial institutions and limits the amount of credit exposure from any one institution. The company is exposed to credit risk in the event of nonpayment by customers principally within the intermediate steel processor, service center, automotive, transportation and construction industries. Changes in these industries may significantly affect management’s estimates and the company’s financial performance. The company mitigates its exposure to credit risk, which it generally extends initially on an unsecured basis, by performing ongoing credit evaluations and taking further action if necessary, such as requiring letters of credit or other security interests to support the customer
62
Back to Contents
STEEL DYNAMICS, INC.
NOTES TO CONSOLIDATED FINANCIAL STATEMENTS — (Continued)
Note 1. Description of the Business and Summary of Significant Accounting Policies — (Continued)
receivable. Management’s estimation of the allowance for doubtful accounts is based upon known credit risks, historical loss experience and current economic conditions affecting the company’s customers.
Heidtman Steel Products (Heidtman) accounted for 12.1%, 13.5% and 16.8% of the company’s net sales for the years ended December 31, 2004, 2003 and 2002, respectively.
Earnings Per Share. The company computes and presents earnings per common share in accordance with FASB Statement No. 128, “Earnings Per Share”. Basic earnings per share is based on the weighted average shares of common stock outstanding during the period. Diluted earnings per share assumes, in addition to the above, the weighted average dilutive effect of common share equivalents outstanding during the period. Common share equivalents include dilutive stock options and dilutive shares related to the company’s convertible subordinated debt and are excluded from the computation in periods in which they have an anti-dilutive effect.
The following table presents a reconciliation of the numerators and the denominators of the company’s basic and diluted earnings per share computations for net income for the years ended December 31 (in thousands, except per share data):
| | | 2004
| | 2003
| |
| | | Net income
(numerator) | | Shares
(denominator) | | Per share
amount | | Net income
(numerator) | | Shares
(denominator) | | Per share
amount | |
| | |
|
| |
|
| |
|
| |
|
| |
|
| |
|
| |
| Basic earnings per share | | $ | 295,314 | | $ | 49,287 | | $ | 5.99 | | $ | 47,148 | | $ | 47,829 | | $ | .99 | |
| Dilutive stock option effect | | | — | | | 477 | | | | | | — | | | 298 | | | | |
| Convertible subordinated debt effect | | | 2,668 | | | 6,763 | | | | | | 2,731 | | | 6,763 | | | | |
| | |
| |
| | | | |
| |
| | | | |
| Diluted earnings per share | | $ | 297,982 | | | 56,527 | | $ | 5.27 | | $ | 49,879 | | | 54,890 | | $ | .91 | |
| | |
| |
| | | | |
| |
| | | | |
| | | | |
| | | 2002
| |
| | | Net income
(numerator) | | Shares
(denominator) | | Per share
amount | |
| | |
|
| |
|
| |
|
| |
| Basic earnings per share | | $ | 77,877 | | | 47,144 | | $ | 1.65 | |
| Dilutive stock option effect | | | — | | | 319 | | | | |
| Convertible subordinated debt effect | | | 53 | | | 129 | | | | |
| | |
| |
| | | | |
| Diluted earnings per share | | $ | 77,930 | | | 47,592 | | $ | 1.64 | |
| | |
| |
| | | | |
Derivative Financial Instruments. The company records derivative financial instruments in accordance with FASB Statement No. 133 (FAS 133), “Accounting for Derivative Instruments and Hedging Activities,” as amended. FAS 133 requires that an entity recognize all derivatives as either assets or liabilities in the statement of financial condition and measure those instruments at fair value. Derivatives that are not designated as hedges must be adjusted to fair value through income. Changes in the fair value of derivatives that are designated as hedges, depending on the nature of the hedge, are recognized as either an offset against the change in fair value of the hedged balance sheet item through earnings or as other comprehensive income, until the hedged item is recognized in earnings. The ineffective portion of a derivative’s change in fair value is immediately recognized in earnings as other income or expense. During October 2004, the company terminated its $100 million cash flow variable-to-fixed interest rate swap associated with the company’s senior secured credit facilities, which were also paid off in October 2004, and reclassified the cost to terminate the agreement of $705,000 into income. For the year ended December 31, 2003, the company recorded a $275,000 loss related to hedging
63
Back to Contents
STEEL DYNAMICS, INC.
NOTES TO CONSOLIDATED FINANCIAL STATEMENTS — (Continued)
Note 1. Description of the Business and Summary of Significant Accounting Policies — (Continued)
ineffectiveness. On an annual basis, there was no hedge ineffectiveness recorded through the statements of income during the year ended December 31, 2004 or 2002.
In the normal course of business, the company has limited involvement with derivative financial instruments in an effort to manage the company’s exposure to fluctuations in interest and foreign exchange rates. The company employs interest rate swap agreements, and periodically employs foreign currency exchange contracts as necessary. At the time of acquiring financial instruments, the company designates and assigns these instruments as hedges of specific assets, liabilities or anticipated transactions. When hedged assets or liabilities are sold or extinguished, or the anticipated transaction being hedged is no longer expected to occur, the company recognizes the gain or loss on the designated hedged financial instrument. The company classified its derivative financial instruments as held or issued for purposes other than trading.
Stock-Based Compensation. For the three years ended December 31, 2004, the company had three incentive stock option plans, which are described more fully in Note 6, and accounted for these plans under the recognition and measurement principles of APB Opinion No. 25, “Accounting for Stock Issued to Employees,” and related interpretations. Under APB 25, no stock-based employee compensation cost related to the incentive stock option plans is reflected in net income, as all options granted under those plans had an exercise price equal to the market value of the underlying common stock.
The following table illustrates the effect on net income and earnings per share as if the company had applied the fair value recognition provisions of FAS 123 to its stock-based employee compensation for the years ended December 31 (in thousands, except per share data):
| | | 2004 | | 2003 | | 2002 | |
| | |
|
| |
|
| |
|
| |
| Net income, as reported | | $ | 295,314 | | $ | 47,148 | | $ | 77,877 | |
| Total stock-based employee compensation expense using the fair value based method, net of tax effect | | | (3,354 | ) | | (2,340 | ) | | (2,380 | ) |
| | |
|
| |
|
| |
|
| |
| Pro forma net income | | | 291,960 | | | 44,808 | | | 75,497 | |
| Convertible subordinated debt effect, net of tax effect | | | 2,668 | | | 2,731 | | | 53 | |
| | |
|
| |
|
| |
|
| |
| Pro forma net income, diluted earnings per share | | $ | 294,628 | | $ | 47,539 | | $ | 75,550 | |
| | |
|
| |
|
| |
|
| |
| | | | | | | | | | | |
| Basic earnings per share: | | | | | | | | | | |
| As reported | | $ | 5.99 | | $ | .99 | | $ | 1.65 | |
| Pro forma | | | 5.92 | | | .94 | | | 1.60 | |
| | | | | | | | | | | |
| Diluted earnings per share: | | | | | | | | | | |
| As reported | | $ | 5.27 | | $ | .91 | | $ | 1.64 | |
| Pro forma | | | 5.21 | | | .87 | | | 1.59 | |
For purposes of pro forma disclosure, the estimated fair value of the options is amortized to expense over the vesting period. The estimated weighted-average fair value of the individual options granted during 2004, 2003 and 2002 was $11.52, $5.12 and $7.07 respectively, on the date of grant. The fair values at the date of grant were estimated using the Black-Scholes option-pricing model with the following assumptions: dividend-yield of 1.0%, risk-free interest rates from 2.5% to 3.6%, expected volatility from 33% to 44% and expected lives from five months to seven years.
Recent Accounting Pronouncements. In December 2004, the FASB issued FAS No. 123R (FAS 123R), “Share-Based Payments,” a revision of FAS 123, supersedes APB 25 and amends FAS 95, “Statement of Cash
64
Back to Contents
STEEL DYNAMICS, INC.
NOTES TO CONSOLIDATED FINANCIAL STATEMENTS — (Continued)
Note 1. Description of the Business and Summary of Significant Accounting Policies — (Continued)
Flows”. Among other items, FAS 123R eliminates the use of APB 25 and the intrinsic value method of accounting which the company uses, and requires companies to recognize the cost of employee services received in exchange for awards of equity instruments, based on the grant date fair value of those awards, in the financial statements. The effective date of FAS 123R is the first reporting period beginning after June 15, 2005, which is the third quarter of 2005 for the company. FAS 123R permits companies to adopt its requirements using either a “modified prospective” method or a “modified retrospective” method. Under the “modified prospective” method, compensation cost is recognized in the financial statements beginning with the effective date, based on the requirements of FAS 123R for all share-based payments granted after that date, and based on the requirements of FAS 123 for all unvested awards granted prior to the effective date of FAS 123R. Under the “modified retrospective” method, the requirements are the same, but also permit entities to restate financial statements of previous period based on proforma disclosures made in accordance with FAS 123.
The company currently utilizes the Black-Scholes standard option pricing model to measure the fair value of stock options granted to employees. FAS 123R permits companies to continue to use such a model or to use a “lattice” model. The company has not yet determined which model it will use to measure the fair value of employee stock options upon the adoption of FAS 123R. The company expects to adopt FAS 123R effective July 1, 2005; however, the company has not yet determined which of the aforementioned adoption methods or price models it will use. The impact of the adoption of FAS 123R cannot be predicted at this time because it will depend on the level of share-based payments in the future. However, had the company adopted FAS 123R in prior periods and utilized the Black- Scholes pricing model, the impact would have approximated the impact in the disclosure of pro forma net income and earnings per share presented earlier in Note 1 under the caption Stock-Based Compensation.
In November 2004, the FASB issued Statement No. 151 (FAS 151), “Inventory costs, an amendment of ARB No. 43, Chapter 4.” FAS 151 clarifies that abnormal amounts of idle facility expense, freight, handling costs and wasted materials (spoilage) should be recognized as current period charges. In addition, FAS 151 requires that allocation of fixed production overhead to inventory be based on the normal capacity of the production facilities. FAS 151 is effective for inventory costs incurred during fiscal years beginning after June 15, 2005. The company currently believes that the adoption of FAS 151 will not have a material impact on its consolidated financial statements.
In September 2004, the EITF reached a consensus on EITF Issue No. 04-8, “The Effect of Contingently Convertible Instruments on Diluted Earnings per Share.” This issue requires that contingently convertible debt securities with a market price trigger be included in the computation of diluted earrings per share, regardless of whether the market price trigger has been met. EITF 04-8 is effective for all periods ending after December 15, 2004 and requires retroactive restatement of previously reported earnings per share. The company adopted EITF 04-8 during the fourth quarter of 2004 and restated its diluted earnings per share for the years ended December 31, 2003 and 2002, to include the potentially dilutive effect of the company’s $115 million subordinated convertible notes of which $100 million were issued in December 2002 and $15 million were issued in January 2003.
In March 2004, the EITF reached a consensus on EITF Issue No. 03-16, “Accounting for Investments in Limited Liability Companies,” effective for reporting periods beginning after June 15, 2004. The issue relates to the accounting by the investor for investments in the common stock of limited liability companies that are not consolidated. The EITF concluded that an investment in a limited liability company that maintains a specific ownership account for each investor, similar to a partnership capital account structure, should be viewed as similar to an investment in a limited partnership for purposes of determining whether a noncontrolling
65
Back to Contents
STEEL DYNAMICS, INC.
NOTES TO CONSOLIDATED FINANCIAL STATEMENTS — (Continued)
Note 1. Description of the Business and Summary of Significant Accounting Policies — (Continued)
investment in a limited liability company should be accounted for using the cost method or the equity method. The company adopted EITF 03-16 during the third quarter of 2004 with no material impact to its consolidated financial statements.
In January 2003, the FASB issued Interpretation No. 46 (revised December 2003) (FIN 46R), “Consolidation of Variable Interest Entities, an interpretation of ARB No. 51.” FIN 46R provides a new framework for identifying variable interest entities (VIEs) and determining when a company should include the assets, liabilities, non-controlling interests and results of activities of a VIE in its consolidated financial statements and provides guidance related to a company’s initial and subsequent measurement of newly consolidated VIEs. In general, a VIE is a corporation, partnership, limited-liability corporation, trust or any other legal structure used to conduct activities or hold assets that either has: an insufficient amount of equity to carry out is principal activities without additional subordinated financial support; a group of equity owners that are unable to make significant decisions about its activities; or, a group of equity owners that do not have the obligation to absorb losses or the right to receive returns generated by its operations.
FIN 46R requires a VIE to be consolidated if a party with an ownership, contractual or other financial interest in the VIE is obligated to absorb a majority of the risk of loss from the VIE’s activities, is entitled to receive a majority of the VIE’s residual returns, or both. FIN 46R must be applied to all entities subject to this Interpretation as of March 31, 2004. However, prior to the required application of this Interpretation, FIN 46R must be applied to those entities that are considered to be special-purpose entities as of December 31, 2003. There was no financial statement impact from the application of this Interpretation.
Note 2. Property, Plant and Equipment
The company’s property, plant and equipment at December 31 consisted of the following (in thousands):
| | | 2004 | | 2003 | |
| | |
|
| |
|
| |
| Land and improvements | | $ | 57,450 | | $ | 45,407 | |
| Buildings and improvements | | | 145,101 | | | 127,782 | |
| Plant, machinery and equipment | | | 1,110,200 | | | 1,006,012 | |
| Construction in progress | | | 109,136 | | | 141,671 | |
| | |
|
| |
|
| |
| | | | 1,421,887 | | | 1,320,872 | |
| Less accumulated depreciation | | | 397,843 | | | 319,756 | |
| | |
|
| |
|
| |
| Property, plant and equipment, net | | $ | 1,024,044 | | $ | 1,001,116 | |
| | |
|
| |
|
| |
66
Back to Contents
STEEL DYNAMICS, INC.
NOTES TO CONSOLIDATED FINANCIAL STATEMENTS — (Continued)
Note 3. Debt and Other Long-term Contingent Liability
The company’s borrowings consisted of the following at December 31 (in thousands):
| | | 2004 | | 2003 | |
| | |
|
| |
|
| |
| SDI senior 9 1/2% unsecured notes, due March 2009, including unamortized bond premium of $7,147 and $8,834 at December 31, 2004 and 2003, respectively | | $ | 307,147 | | $ | 308,834 | |
| SDI 4.0% convertible subordinated notes, due December 2012 | | | 115,000 | | | 115,000 | |
| SDI senior secured notes payable | | | — | | | 111,287 | |
| NMBS senior secured notes payable | | | — | | | 13,719 | |
| State and local government municipal bond issues | | | 9,430 | | | 24,996 | |
| Electric utility, transmission facility and other loans | | | 16,802 | | | 33,738 | |
| | |
|
| |
|
| |
| Total debt | | | 448,379 | | | 607,574 | |
| Less current maturities | | | 6,774 | | | 15,988 | |
| | |
|
| |
|
| |
| Long-term debt | | $ | 441,605 | | $ | 591,586 | |
| | |
|
| |
|
| |
SDI Senior Secured Notes Payable. On June 30, 2004, the company refinanced its $350.0 million senior secured credit facility and replaced it with a four-year $230.0 million senior secured revolving credit facility. As part of the refinancing, the company also repaid the New Millennium senior secured notes payable of $12.3 million and New Millennium became a guarantor of the company’s senior secured revolving credit facility. In conjunction with the refinancing, the company expensed $3.1 million of previously capitalized financing costs during the second quarter of 2004. At December 31, 2004, the facility was undrawn.
The SDI senior secured revolving credit facility is secured by liens and mortgages on substantially all of the personal and real property assets of the company and its wholly-owned subsidiaries and by pledges of all shares of capital stock and inter-company debt held by the company and its wholly-owned subsidiaries. The facility contains financial covenants and other covenants that limit or restrict the company with respect to its ability to pay dividends, make capital expenditures, incur indebtedness, and make restricted payments or investments, among other things.
At December 31, 2004, the pricing grid related to the SDI senior secured revolving credit facility would have priced outstanding borrowings at LIBOR plus .75%. This pricing grid is adjusted based on the company’s leverage at the time of borrowing with a minimum price of LIBOR plus .75% and a maximum price of LIBOR plus 2.25%. The weighted-average interest rate of the company’s senior secured credit facilities was 4.2% as of December 31, 2003.
In October 2004, the company terminated its interest rate swap agreement with a notional amount of $100.0 million pursuant to which the company had agreed to make fixed rate payments at 6.9% on the tenth day of each January, April, July and October and to receive LIBOR payments. This interest rate swap agreement was accounted for as a cash flow hedge. New Millennium also terminated its interest rate swap agreement with a notional amount of $3.9 million at the time of the refinancing.
SDI Senior 9 1/2% Unsecured Notes. The company issued $200.0 million 9 1/2% senior unsecured notes during March 2002. On November 14, 2003, the company issued an additional $100.0 million of these notes at a price of 109% and accrued interest from the last semi-annual interest payment date of September 15, 2003 which resulted in net proceeds of $108.8 million. The issuance premium of $9.0 million is being amortized over the remaining life of the notes resulting in an approximate effective interest rate of 7.5% for the additional $100.0 million issuance. Approximately $58.8 million of the net proceeds was used to prefund certain capital
67
Back to Contents
STEEL DYNAMICS, INC.
NOTES TO CONSOLIDATED FINANCIAL STATEMENTS — (Continued)
Note 3. Debt and Other Long-term Contingent Liability — (Continued)
expenditures and $50.0 million was used to prepay a portion of the company’s then existing senior secured credit facility. The notes have a maturity of seven years (non-callable for four years) and are due March 2009.
The company may redeem the notes at any time on or after March 15, 2006, at a redemption price of 104.750%; on or after March 15, 2007, at a redemption price of 102.275%; and on or thereafter March 15, 2008, at a redemption price of 100.000%.
In addition, at any time prior to March 15, 2005, the company may redeem up to 35% of the principal amount of the notes with the net cash proceeds of its common stock at a redemption price of 109.500% plus accrued interest up to the redemption date, provided that certain other restrictions as described in the indenture are met. The notes bear interest at 9.5% payable semiannually on each March 15th and September 15th. The company entered into an interest rate swap agreement on January 9, 2004 with a notional amount of $200.0 million pursuant to which the company has agreed to receive fixed rate payments of 9.5% on the fifteenth day of each March and September and will pay six-month LIBOR in arrears plus 5.7%. This interest swap agreement matures March 15, 2009, and is accounted for as a fair value hedge. Due to the increasing interest rate environment during 2004 and anticipated in 2005, the company entered into two forward interest rate agreements during January 2005 to lock the six-month LIBOR setting of this fair value interest rate swap at 3.1% for the interest reset date of March 15, 2005 and at 3.7% for the interest reset date of September 15, 2005.
SDI 4.0% Convertible Subordinated Notes. During December 2002 the company issued $100.0 million of 4.0% convertible subordinated notes due December 15, 2012, and during January 2003, the original purchasers of the company’s 4.0% convertible subordinated notes exercised their right to purchase an additional $15.0 million aggregate principal, thereby increasing the issue to $115.0 million. The company used the $110.0 million in net proceeds to prepay a portion of its then existing senior secured credit facilities. The notes are non- callable for five years and bear interest at 4.0%, payable semiannually on each June 15th and December 15th. In addition, the company will pay contingent interest during any six-month period commencing December 15, 2007, if the trading price of the notes for each of the five trading days immediately preceding such period equals or exceeds 120% of the principal amount of the notes. Holders may convert the notes into shares of the company’s common stock at a conversion rate of 58.8076 shares per $1,000 principal amount of notes (6,762,874 shares), subject to adjustment, before close of business on December 15, 2012, only under the following circumstances: (1) at any time after the closing sale price of the company’s common stock exceeds 120% of the conversion price, or $20.41 per share, for at least 20 trading days in the 30 consecutive trading days ending on the last trading day of any fiscal quarter commencing after December 31, 2002; (2) upon the occurrence of specified credit rating events with respect to the notes; (3) if the notes have been called for redemption by the company; or (4) upon the occurrence of certain other corporate events. During the first quarter of 2004, the requirements for conversion were met and the holders are able to initiate conversion at their discretion. The company may redeem the notes at any time on or after December 18, 2007, at a redemption price of 101.143%; on or after December 15, 2008, at a redemption price of 100.571%; and on or thereafter December 15, 2009, at a redemption price of 100.000%.
IDI Settlement. In January 2002, the company entered into an agreement with the Iron Dynamics’ lenders to extinguish the debt under the IDI senior secured credit agreement of $59.0 million at the end of March 2002. The settlement agreement required the company to pay $15.0 million in cash and issue an aggregate of $22.0 million, or 1.5 million shares, of the company’s common stock to the IDI lender group. In addition, there was a provision within the agreement that if Iron Dynamics resumed operations by January 27, 2007, and generated positive cash flow (as defined in the settlement agreement), the company would be required to make contingent future payments in an aggregate amount not to exceed the remaining unpaid $22.0 million, thus potentially requiring the repayment of the entire $59.0 million outstanding. The company complied with each of
68
Back to Contents
STEEL DYNAMICS, INC.
NOTES TO CONSOLIDATED FINANCIAL STATEMENTS — (Continued)
Note 3. Debt and Other Long-term Contingent Liability — (Continued)
the settlement requirements, thus constituting full and final settlement of all of Iron Dynamics’ obligations and the Steel Dynamics’ guarantees under the Iron Dynamics credit agreement. At December 31, 2002, the contingent future payments were reflected as an other long-term contingent liability within the company’s financial statements pursuant to generally accepted accounting principles, which in these circumstances would not allow a gain or loss to be recorded on the restructured payable as long as there was a possibility of the IDI lenders being repaid in full. During December 2003, with the agreement of the IDI lenders, the company paid $8.0 million in cash to the IDI lenders, terminating all of the company’s obligations to make any additional future payments under the settlement agreement. The company’s 2003 financial statements reflect a gain of $14.0 million from the extinguishment of the $22.0 million contingent liability.
State and Local Government Municipal Bond Issues. In November 1998, the company received $10.0 million from Whitley County, Indiana, representing proceeds from solid waste and sewage disposal revenue bonds to be used to finance certain solid waste and sewage disposal facilities located at the Whitley County, Indiana, structural and rail mill. The bonds bear interest at 7.3%, with interest payable semi-annually and principal payments commencing November 2003 through final maturity in November 2018. The outstanding principal balance was $9.4 million and $9.7 million, as of December 31, 2004 and 2003, respectively.
Electric Utility Development Loans. In December 2001, the company entered into an agreement with Northeastern Rural Electric Membership Corporation (REMC) and Wabash Valley Power Association, Inc. to finance approximately $9.8 million related to the company’s portion of the cost to construct a transmission line and certain related facilities at the structural and rail division. This funding was provided in April 2002. The loan bears interest at 8.1%, with monthly principal and interest payments required in amounts sufficient to amortize the transmission facility loan over a period of 20 years, with the unpaid principal due at the end of 10 years. The company also has an undrawn $2.5 million outstanding stand-by letter of credit associated with the REMC agreement. The outstanding principal balance on the transmission facility loan was $9.2 million and $9.4 million as of December 31, 2004 and 2003, respectively.
The credit agreements contain customary representations and warranties and affirmative and negative covenants, including, among others, covenants relating to financial and compliance reporting, capital expenditures, restricted dividend payments, maintenance of certain financial ratios, incurrence of liens, sale or disposition of assets and incurrence of other debt.
Maturities of outstanding debt, as of December 31, 2004, are as follows (in thousands):
| 2005 | | $ | 6,774 | |
| 2006 | | | 2,016 | |
| 2007 | | | 664 | |
| 2008 | | | 719 | |
| 2009 | | | 300,772 | |
| Thereafter | | | 130,287 | |
| | |
|
| |
| | | | 441,232 | |
| Unamortized bond premium | | | 7,147 | |
| | |
|
| |
| | | $ | 448,379 | |
| | |
|
| |
The company capitalizes interest on construction-in-progress assets. For the years ended December 31, 2004, 2003 and 2002, total interest costs incurred were $45.8 million, $42.3 million and $41.6 million, respectively, of which $6.9 million, $7.8 million and $11.4 million, respectively, were capitalized. Cash paid for
69
Back to Contents
STEEL DYNAMICS, INC.
NOTES TO CONSOLIDATED FINANCIAL STATEMENTS — (Continued)
Note 3. Debt and Other Long-term Contingent Liability — (Continued)
interest was $48.4 million, $35.0 million and $35.7 million for the years ended December 31, 2003, 2002, and 2001, respectively.
Note 4. Income Taxes
The company files a consolidated federal income tax return. Cash paid for taxes was $78.7 million, $7.5 million and $22.7 million for the years ended December 31, 2004, 2003 and 2002, respectively. The current and deferred federal and state income tax expense for the years ended December 31 is as follows (in thousands):
| | | 2004 | | 2003 | | 2002 | |
| | |
|
| |
|
| |
|
| |
| Current income tax expense | | $ | 72,315 | | $ | 3,408 | | $ | 20,287 | |
| Deferred income tax expense | | | 107,404 | | | 24,881 | | | 26,313 | |
| | |
|
| |
|
| |
|
| |
| Total income tax expense | | $ | 179,719 | | $ | 28,289 | | $ | 46,600 | |
| | |
|
| |
|
| |
|
| |
A reconciliation of the statutory tax rates to the actual effective tax rates for the years ended December 31, are as follows:
| | | 2004 | | 2003 | | 2002 | |
| | |
|
| |
|
| |
|
| |
| Statutory federal tax rate | | | 35.0 | % | | 35.0 | % | | 35.0 | % |
| State income taxes, net of federal benefit | | | 2.0 | | | 1.9 | | | 2.3 | |
| Other permanent differences | | | .0 | | | (.2 | ) | | 0.1 | |
| Impact of rate changes on cumulative deferred taxes | | | .8 | | | .8 | | | — | |
| | |
|
| |
|
| |
|
| |
| Effective tax rate | | | 37.8 | % | | 37.5 | % | | 37.4 | % |
| | |
|
| |
|
| |
|
| |
Rate changes on cumulative deferred taxes for 2004 and 2003 are the result of changes in the effective state income tax rate in years when the deferred tax assets and liabilities are expected to reverse.
70
Back to Contents
STEEL DYNAMICS, INC.
NOTES TO CONSOLIDATED FINANCIAL STATEMENTS — (Continued)
Note 4. Income Taxes — (Continued)
Significant components of the company’s deferred tax assets and liabilities at December 31 are as follows (in thousands):
| | | 2004 | | 2003 | |
| | |
|
| |
|
| |
Deferred tax assets: | | | | | | | |
| Alternative minimum tax carryforwards | | $ | 12,558 | | $ | 50,973 | |
| Capitalized start-up costs | | | 22,045 | | | 21,381 | |
| Tax assets expensed for books | | | 13,359 | | | 13,937 | |
| Accrued expenses | | | 5,238 | | | 4,138 | |
| Net operating loss, capital loss, and credit carryforwards | | | — | | | 16,214 | |
| Interest rate swap liability | | | — | | | 2,567 | |
| | |
|
| |
|
| |
| Total deferred tax assets | | | 53,200 | | | 109,210 | |
| | |
|
| |
|
| |
Deferred tax liabilities: | | | | | | | |
| Depreciable assets | | | (238,478 | ) | | (189,662 | ) |
| Capitalized interest | | | (11,656 | ) | | (7,537 | ) |
| Amortization of fees | | | (5,241 | ) | | (4,293 | ) |
| Other | | | (184 | ) | | (204 | ) |
| | |
|
| |
|
| |
| Total deferred tax liabilities | | | (255,559 | ) | | (201,696 | ) |
| | |
|
| |
|
| |
| Net deferred tax liability | | $ | (202,359 | ) | $ | (92,486 | ) |
| | |
|
| |
|
| |
As of December 31, 2004, the company had no remaining net operating loss carryforwards or capital loss carryforwards as these losses were fully utilized during 2004.
Note 5. Common Stock
During October 2004, the company announced that its board of directors terminated the 1997 share repurchase plan and approved a new program authorizing the repurchase of up to 5.0 million shares, or approximately 5%, of our outstanding common stock. Pursuant to this plan, during the fourth quarter of 2004 the company repurchased 1.6 million shares of its common stock in the open market at an average cost of $35 per share. At December 31, 2004, the company had 3.4 million shares available for repurchase under the October 2004 repurchase program, of which 1.0 million shares were repurchased during January 2005 in the open market at an average cost of $35 per share.
Note 6. Incentive Stock Option and Other Plans
1994 and 1996 Incentive Stock Option Plans. The company reserved 6.0 million shares of common stock for issuance upon exercise of options or grants under the 1994 Incentive Stock Option Plan (1994 Plan) and the 1996 Incentive Stock Option Plan (1996 Plan). At December 31, 2004, there are 1.4 million reserved shares still available for issuance. The 1994 Plan was adopted for certain key employees who are responsible for management of the company. Options granted under the 1994 Plan vest two-thirds six months after the date of grant and one-third five years after the date of grant, with a maximum term of 10 years. All of the company’s employees are eligible for the 1996 Plan, with the options vesting 100% six months after the date of grant, with a maximum term of five years. Both plans grant options to purchase the company’s common stock at an exercise price of at least 100% of fair market value on the date of grant.
71
Back to Contents
STEEL DYNAMICS, INC.
NOTES TO CONSOLIDATED FINANCIAL STATEMENTS — (Continued)
Note 6. Incentive Stock Option and Other Plans — (Continued)
Non-Employee Director Stock Option Plan (Director Plan). The company has reserved 100,000 shares of common stock for issuance upon exercise of options or grants under the Director Plan, of which 23,000 shares were available for issuance at December 31, 2004. The Director Plan was adopted in May 2000, for members of the company’s board of directors who are not employees or officers of the company. Options granted under the Director Plan vest 100% six months after the date of grant, with a maximum term of five years.
The plan grants options to purchase the company’s common stock at an exercise price of at least 100% of fair market value on the date of grant.
The company’s combined stock option activity for the 1994 Plan, the 1996 Plan and the Director Plan is as follows:
| | | Options | | Weighted average
exercise price | |
| | |
|
| |
|
| |
| Balance outstanding at January 1, 2002 | | | 2,676,262 | | $ | 13.00 | |
| Granted | | | 575,738 | | | 14.80 | |
| Exercised | | | (376,964 | ) | | 10.37 | |
| Forfeited | | | (243,325 | ) | | 19.11 | |
| | | | | | | | |
| Balance outstanding at December 31, 2002 | | | 2,631,711 | | | 13.21 | |
| Granted | | | 828,084 | | | 15.69 | |
| Exercised | | | (999,279 | ) | | 11.99 | |
| Forfeited | | | (122,108 | ) | | 19.49 | |
| | | | | | | | |
| Balance outstanding at December 31, 2003 | | | 2,338,408 | | | 14.27 | |
| Granted | | | 513,197 | | | 30.56 | |
| Exercised | | | (1,375,262 | ) | | 14.17 | |
| Forfeited | | | (16,330 | ) | | 19.84 | |
| | | | | | | | |
| Balance outstanding at December 31, 2004 | | | 1,460,013 | | | 20.04 | |
The following table summarizes certain information concerning the company’s outstanding options as of December 31, 2004:
| | Range of
exercise price | | Outstanding
options | | Weighted average
remaining
contractual
life (years) | | Weighted average
exercise price | | Exercisable
options | | Weighted average
exercise price | |
| |
| |
|
| |
|
| |
|
| |
|
| |
|
| |
| | $ 3 to $10 | | | 152,132 | | | 0.5 | | $ | 7.59 | | | 152,132 | | $ | 7.59 | |
| | $10 to $15 | | | 413,804 | | | 2.6 | | | 12.34 | | | 413,804 | | | 12.34 | |
| | $15 to $20 | | | 339,269 | | | 3.2 | | | 18.81 | | | 339,269 | | | 18.81 | |
| | $20 to $25 | | | 54,999 | | | 2.9 | | | 22.45 | | | 54,999 | | | 22.45 | |
| | $25 to $30 | | | 282,611 | | | 4.1 | | | 25.44 | | | 282,611 | | | 25.44 | |
| | $30 to $40 | | | 217,198 | | | 4.9 | | | 37.71 | | | — | | | — | |
2003 Executive Incentive Compensation Plan (Executive Officer Plan). Pursuant to the company’s Executive Officer Plan certain officers of the company are eligible to receive cash bonuses based on predetermined formulas. In the event the cash portion of the bonus exceeds the predetermined maximum cash payout, the excess bonus is distributed as common stock of the company. A total of 750,000 shares have been reserved under this plan. At December 31, 2004, 706,000 shares remained available for issuance. Pursuant to the
72
Back to Contents
STEEL DYNAMICS, INC.
NOTES TO CONSOLIDATED FINANCIAL STATEMENTS — (Continued)
Note 6. Incentive Stock Option and Other Plans — (Continued)
Executive Officer Plan, for the years 2004 and 2003, respectively, shares were awarded with a market value of approximately $1.5 million and $72,000.
2004 Employee Stock Purchase Plan. During 2004, the company’s stockholders approved the Employee Stock Purchase Plan which the company implemented on November 1, 2004. The plan allows eligible employees, at their election, to purchase shares of the company’s stock on the open market at fair market value with a designated broker through payroll deductions. The maximum allowable payroll deduction for the plan, excluding company matching contributions, is $10,400 in any calendar year. The company provides matching contributions of 10% of employees’ payroll deductions. The Company’s total expense for the plan was $13,000 for the year ended December 31, 2004.
Note 7. Commitments and Contingencies
The company has an off-take agreement with Heidtman that extends through March 2007. Under the terms of the agreement, Heidtman is obligated to purchase, and the company is obligated to sell to Heidtman, at least 76,000 tons of hot-band products per quarter, or 336,000 tons annually, and at least 15,000 tons of cold-rolled products per quarter, or 60,000 tons annually. For hot-rolled steel, the company’s pricing to Heidtman is determined by either a market pricing formula based on an “all-in” cost-plus basis or a spot market pricing formula determined on the basis of a discounted market index. For cold-rolled products, the pricing is determined on a marginal revenue basis over hot-rolled sheet.
The company has entered into certain commitments with suppliers which are of a customary nature within the steel industry. Commitments have been entered into relating to future expected requirements for such commodities as natural gas, electricity and certain transportation services. Certain commitments contain provisions which require that the company “take or pay” for specified quantities without regard to actual usage for periods of up to 2 years. During the years ending December 31, 2005 and 2006, the company has commitments for natural gas and its transportation with “take or pay” or other similar commitment provisions for approximately $15.8 million and $2.4 million, respectively. The company fully utilized all such “take or pay” requirements during the past three years and purchased $20.5 million, $16.9 million and $14.0 million, during the years ended December 31, 2004, 2003 and 2002, respectively, under these contracts. The company believes that production requirements will be such that consumption of the products or services purchased under these commitments will occur in the normal production process. The company purchases its electricity consumed at its Flat Roll Division pursuant to a contract which extends through December 2007. The contract designates 140 hours as “interruptible service” during 2005, and these interruptible hours further decrease annually through expiration of the agreement. The contract also establishes an agreed fixed rate energy charge per Mill/kWh consumed for each year through the expiration of the agreement. At December 31, 2004, the company has outstanding construction-related commitments of $17.5 million primarily related to the New Millennium plant construction in Lake City, Florida.
The company is subject to litigation from time to time, which is incidental to its business. The company, based upon current knowledge including discussions with legal counsel, believes that the results of any threatened or pending litigation will not have a material effect on the company’s financial position, results of operations, or cash flows.
The company sells various flat-rolled products and occasionally purchases materials for its manufacturing process with Heidtman. The president and chief executive officer of Heidtman is a member of the company’s
73
Back to Contents
STEEL DYNAMICS, INC.
NOTES TO CONSOLIDATED FINANCIAL STATEMENTS — (Continued)
Note 8. Transactions with Affiliated Companies — (Continued)
board of directors and a stockholder of the company. During the first quarter of 2004, the president and chief operating officer of OmniSource, from which the company purchases a portion of its metallic raw materials, resigned as a member of the company’s board of directors; therefore, OmniSource is no longer considered an affiliated company. Transactions with Heidtman and OmniSource for the years ended December 31 are as follows (in millions):
| | | 2004 | | | 2003 | | | 2002 | |
| | |
|
| | |
|
| | |
|
| |
| Heidtman: | | | | | | | | | | | | |
| Sales | | $ | 259.5 | | | $ | 132.8 | | | $ | 145.6 | |
| Percentage of consolidated net sales | | | 12 | % | | | 13 | % | | | 17 | % |
| Accounts receivable | | | 38.9 | | | | 25.1 | | | | 34.7 | |
| Purchases | | | 67.1 | | | | — | | | | — | |
| Accounts payable | | | 5.4 | | | | — | | | | — | |
| | | | | | | | | | | | | |
| OmniSource: | | | | | | | | | | | | |
| Purchases | | | | | | $ | 354.7 | | | $ | 232.7 | |
| Accounts payable | | | | | | | 36.6 | | | | 18.8 | |
Note 9. Financial Instruments
The carrying amounts of financial instruments including cash and equivalents, accounts receivable and accounts payable approximate fair value, because of the relatively short maturity of these instruments. The fair value of long-term debt, including current maturities, was approximately $619.2 million at December 31, 2004. The fair value of the various interest rate swap agreements was estimated to be a liability of $3.9 million and $7.1 million at December 31, 2004 and 2003, respectively. The fair values are estimated by the use of quoted market prices, estimates obtained from brokers, and other appropriate valuation techniques based on references available.
During 2004, the company entered into a transaction relating to the short-sale of $66.0 million of U.S. Treasury Securities. The transaction was intended to address interest rate exposure and generate capital gains. As a result of this transaction, which concluded in November 2004, the company recorded short-term capital gains of $5.4 million, interest income of $485,000 and interest expense of $6.0 million during 2004.
Note 10. Retirement Plans
The company sponsors a 401(k) retirement savings and profit sharing plan for eligible employees, which is a “qualified plan” for federal income tax purposes. The company’s total expense for the plan was $32.6 million, $4.7 million and $6.9 million for the years ended December 31, 2004, 2003 and 2002, respectively.
74
Back to Contents
STEEL DYNAMICS, INC.
NOTES TO CONSOLIDATED FINANCIAL STATEMENTS — (Continued)
Note 11. Segment Information
The company has two reportable segments: steel operations and steel scrap substitute operations.
Steel Operations. The steel operations segment includes the company’s Flat Roll Division, Structural and Rail Division, and Bar Division. The Structural and Rail Division began operations during the third quarter of 2002 and the Bar Products Division began operations during January 2004.
The divisions each produce steel from steel scrap, using electric arc melting furnaces, continuous casting and automated rolling mills. The Flat Roll Division sells a broad range of hot-rolled, cold-rolled and coated steel products, including a large variety of specialty products such as thinner gauge hot-rolled products, galvanized products, and painted products. The Structural and Rail Division sells structural steel beams, pilings, and other steel components. This facility is also designed to produce and sell a variety of standard and premium- grade rail for the railroad industry. During the fourth quarter of 2004, the division shipped its first industrial-quality rail, and anticipates shipping standard rail during the first half of 2005. The Bar Products Division currently sells special bar-quality and merchant bar-quality rounds. The divisions sell directly to end-users and service centers, including Heidtman (an affiliate), which accounted for 13.0%, 14.7% and 18.5% of the segment’s external net sales for the years ended December 31, 2004, 2003 and 2002, respectively. These products are used in numerous industry sectors, including the automotive, construction, commercial, transportation and industrial machinery markets.
Steel Scrap Substitute Operations. Steel scrap substitute operations include the revenues and expenses associated with the company’s steel scrap substitute facility. From the time operations were halted in 2001 through the fourth quarter of 2002, the costs incurred at IDI were composed of those expenses required to maintain the facility and further evaluate the project and its related benefits. During the fourth quarter of 2002, IDI successfully completed certain operating trials utilizing a modified production process. This process reduced the per-unit cost of direct reduced iron production. Throughout 2003, the company invested $13.3 million for capital expenditures required to implement this modified production process, and Iron Dynamics restarted operations mid-November 2003. During 2004, IDI produced 173,000 tonnes of hot briquetted iron and after starting the submerged arc furnace in June, produced 47,000 tonnes of liquid pig iron during the second half of 2004.
Revenues included in the category “All Other” are from two subsidiary operations that are below the quantitative thresholds required for reportable segments. These revenues are from the fabrication of trusses, girders, steel joists and steel decking for the non-residential construction industry; from the further processing, or slitting, and sale of certain steel products; and from the resale of certain secondary and excess steel products. In addition, “All Other” also includes certain unallocated corporate accounts, such as the company’s senior secured credit facilities, senior unsecured notes, convertible subordinated notes, certain other investments and profit sharing expenses.
The company’s operations are primarily organized and managed by operating segment. Operating segment performance and resource allocations are primarily based on operating results before income taxes. The accounting policies of the reportable segments are consistent with those described in Note 1 to the financial statements. Intersegment sales and any related profits are eliminated in consolidation. The external net sales of the company’s steel operations include sales to non-U.S. companies of $67.8 million, $66.6 million and $10.1 million, for the years ended December 31, 2004, 2003 and 2002, respectively.
75
Back to Contents
STEEL DYNAMICS, INC.
NOTES TO CONSOLIDATED FINANCIAL STATEMENTS — (Continued)
Note 11. Segment Information — (Continued)
The company’s segment results for the years ended December 31, are as follows (in thousands):
| | | 2004 | | 2003 | | 2002 | |
| | |
|
| |
|
| |
|
| |
Steel Operations | | | | | | | | | | |
| Net sales | | | | | | | | | | |
| External | | $ | 1,994,246 | | $ | 903,837 | | $ | 785,007 | |
| Other segments | | | 99,130 | | | 52,720 | | | 48,578 | |
| Operating income | | | 553,841 | | | 120,704 | | | 188,081 | |
| Depreciation and amortization | | | 73,439 | | | 61,329 | | | 51,024 | |
| Assets | | | 1,455,691 | | | 1,161,368 | | | 1,057,509 | |
| Liabilities | | | 175,761 | | | 157,576 | | | 117,537 | |
| Capital expenditures | | | 74,229 | | | 122,527 | | | 143,045 | |
| | |
|
| | | | | | | | | | | |
| | | | | | | | | | | |
Steel Scrap Substitute Operations | | | | | | | | | | |
| Net sales | | | | | | | | | | |
| Other segments | | $ | 42,897 | | $ | 2,955 | | $ | 450 | |
| Operating loss | | | (8,341 | ) | | (10,902 | ) | | (10,471 | ) |
| Depreciation and amortization | | | 5,544 | | | 4,944 | | | 5,083 | |
| Assets | | | 140,697 | | | 157,428 | | | 149,651 | |
| Liabilities | | | 4,450 | | | 6,873 | | | 27,832 | |
| Capital expenditures | | | 5,838 | | | 13,326 | | | (2,999 | ) |
| | |
|
| | | | | | | | | | | |
| | | | | | | | | | | |
All Other | | | | | | | | | | |
| Net sales | | | | | | | | | | |
| External | | $ | 150,667 | | $ | 83,411 | | $ | 79,486 | |
| Other segments | | | 1,026 | | | 824 | | | 769 | |
| Operating loss | | | (34,095 | ) | | (13,628 | ) | | (18,968 | ) |
| Depreciation and amortization | | | 5,766 | | | 2,837 | | | 3,336 | |
| Assets | | | 195,169 | | | 234,800 | | | 169,157 | |
| Liabilities | | | 761,080 | | | 802,158 | | | 704,433 | |
| Capital expenditures | | | 21,979 | | | 1,208 | | | 2,554 | |
| | |
|
| | | | | | | | | | | |
| | | | | | | | | | | |
Eliminations | | | | | | | | | | |
| Net sales | | | | | | | | | | |
| Other segments | | $ | (143,053 | ) | $ | (56,499 | ) | $ | (49,797 | ) |
| Operating income (loss) | | | (4,496 | ) | | 433 | | | (275 | ) |
| Assets | | | (57,938 | ) | | (105,157 | ) | | (100,621 | ) |
| Liabilities | | | (54,794 | ) | | (105,401 | ) | | (95,766 | ) |
| | |
|
| | | | | | | | | | | |
| | | | | | | | | | | |
Consolidated | | | | | | | | | | |
| Net sales | | $ | 2,144,913 | | $ | 987,248 | | $ | 864,493 | |
| Operating income | | | 506,909 | | | 96,607 | | | 158,367 | |
| Depreciation and amortization | | | 84,749 | | | 69,110 | | | 59,443 | |
| Assets | | | 1,733,619 | | | 1,448,439 | | | 1,275,696 | |
| Liabilities | | | 886,497 | | | 861,206 | | | 754,036 | |
| Capital expenditures | | | 102,046 | | | 137,061 | | | 142,600 | |
| | |
|
76
Back to Contents
STEEL DYNAMICS, INC.
NOTES TO CONSOLIDATED FINANCIAL STATEMENTS — (Continued)
Note 12. Condensed Consolidating Information
Certain 100%-owned subsidiaries of SDI have fully and unconditionally guaranteed all of the indebtedness relating to the issuance of $300.0 million of senior notes due 2009. Following are condensed consolidating financial statements of the company, including the guarantors. The following condensed consolidating financial statements present the financial position, results of operations and cash flows of (i) SDI (in each case, reflecting investments in its consolidated subsidiaries under the equity method of accounting), (ii) the guarantor subsidiaries of SDI, (iii) the non-guarantor subsidiaries of SDI, and (iv) the eliminations necessary to arrive at the information for the company on a consolidated basis. The condensed consolidating financial statements should be read in conjunction with the accompanying consolidated financial statements of the company.
Condensed Consolidating Balance Sheet (in thousands): |
| |
| | | Parent | | Guarantors | | Combined
non-guarantors | | Consolidating
adjustments | | Total
consolidated | |
| | |
|
| |
|
| |
|
| |
|
| |
|
| |
| | | (As of December 31, 2004) | |
| Cash | | $ | 15,202 | | $ | 323 | | $ | 809 | | $ | — | | $ | 16,334 | |
| Accounts receivable | | | 188,675 | | | 130,903 | | | 29,636 | | | (95,353 | ) | | 253,861 | |
| Inventories | | | 281,594 | | | 65,691 | | | 36,212 | | | (2,009 | ) | | 381,488 | |
| Other current assets | | | 25,309 | | | 261 | | | 287 | | | (21 | ) | | 25,836 | |
| | |
|
| |
|
| |
|
| |
|
| |
|
| |
| Total current assets | | | 510,780 | | | 197,178 | | | 66,944 | | | (97,383 | ) | | 677,519 | |
| | | | | | | | | | | | | | | | | |
| Property, plant and equipment, net | | | 713,641 | | | 142,542 | | | 167,979 | | | (118 | ) | | 1,024,044 | |
| Other assets | | | 364,636 | | | 59,679 | | | 95 | | | (392,354 | ) | | 32,056 | |
| | |
|
| |
|
| |
|
| |
|
| |
|
| |
| Total assets | | $ | 1,589,057 | | $ | 399,399 | | $ | 235,018 | | $ | (489,855 | ) | $ | 1,733,619 | |
| | |
|
| |
|
| |
|
| |
|
| |
|
| |
| | | | | | | | | | | | | | | | | |
| Accounts payable | | $ | 115,458 | | $ | 9,800 | | $ | 14,674 | | $ | 1,956 | | $ | 141,888 | |
| Accrued expenses | | | 70,752 | | | 8,319 | | | 6,990 | | | (1,515 | ) | | 84,546 | |
| Current maturities of long-term debt | | | 2,095 | | | — | | | 4,702 | | | (23 | ) | | 6,774 | |
| | |
|
| |
|
| |
|
| |
|
| |
|
| |
| Total current liabilities | | | 188,305 | | | 18,119 | | | 26,366 | | | 418 | | | 233,208 | |
| | | | | | | | | | | | | | | | | |
| Other liabilities | | | 131,508 | | | 188,139 | | | 40,955 | | | (151,387 | ) | | 209,215 | |
| Long-term debt | | | 440,819 | | | — | | | 786 | | | — | | | 441,605 | |
| Minority interest | | | — | | | — | | | — | | | 2,469 | | | 2,469 | |
| | | | | | | | | | | | | | | | | |
| Common stock | | | 523 | | | 89,426 | | | 202,184 | | | (291,610 | ) | | 523 | |
| Treasury stock | | | (84,141 | ) | | — | | | — | | | — | | | (84,141 | ) |
| Additional paid-in capital | | | 390,505 | | | 116,868 | | | — | | | (116,868 | ) | | 390,505 | |
| Retained earnings | | | 521,538 | | | (13,153 | ) | | (35,273 | ) | | 67,123 | | | 540,235 | |
| | |
|
| |
|
| |
|
| |
|
| |
|
| |
| Total stockholders’ equity | | | 828,425 | | | 193,141 | | | 166,911 | | | (341,355 | ) | | 847,122 | |
| | |
|
| |
|
| |
|
| |
|
| |
|
| |
Total liabilities and stockholders’
equity | | $ | 1,589,057 | | $ | 399,399 | | $ | 235,018 | | $ | (489,855 | ) | $ | 1,733,619 | |
| | |
|
| |
|
| |
|
| |
|
| |
|
| |
77
Back to Contents
STEEL DYNAMICS, INC.
NOTES TO CONSOLIDATED FINANCIAL STATEMENTS — (Continued)
Note 12. Condensed Consolidating Information — (Continued)
Condensed Consolidating Balance Sheet (in thousands): |
| |
| | | Parent | | Guarantors | | Combined
non-guarantors | | Consolidating
adjustments | | Total
consolidated | |
| | |
|
| |
|
| |
|
| |
|
| |
|
| |
| | | (As of December 31, 2003) | |
| Cash | | $ | 64,008 | | $ | 496 | | $ | 926 | | $ | — | | $ | 65,430 | |
| Accounts receivable | | | 123,315 | | | 119,785 | | | 13,037 | | | (130,114 | ) | | 126,023 | |
| Inventories | | | 164,024 | | | 2,579 | | | 18,397 | | | (504 | ) | | 184,496 | |
| Other current assets | | | 32,938 | | | 68 | | | 168 | | | (1,188 | ) | | 31,986 | |
| | |
|
| |
|
| |
|
| |
|
| |
|
| |
| Total current assets | | | 384,285 | | | 122,928 | | | 32,528 | | | (131,806 | ) | | 407,935 | |
| | | | | | | | | | | | | | | | | |
| Property, plant and equipment, net | | | 755,707 | | | 96,757 | | | 148,769 | | | (117 | ) | | 1,001,116 | |
| Other assets | | | 260,538 | | | 36,855 | | | 262 | | | (258,267 | ) | | 39,388 | |
| | |
|
| |
|
| |
|
| |
|
| |
|
| |
| Total assets | | $ | 1,400,530 | | $ | 256,540 | | $ | 181,559 | | $ | (390,190 | ) | $ | 1,448,439 | |
| | |
|
| |
|
| |
|
| |
|
| |
|
| |
| Accounts payable | | $ | 64,069 | | $ | 15,618 | | $ | 11,025 | | $ | (11,386 | ) | $ | 79,326 | |
| Accrued expenses | | | 52,365 | | | 1,699 | | | 5,046 | | | (1,120 | ) | | 57,990 | |
| Current maturities of long-term debt | | | 11,765 | | | — | | | 4,243 | | | (20 | ) | | 15,988 | |
| | |
|
| |
|
| |
|
| |
|
| |
|
| |
| Total current liabilities | | | 128,199 | | | 17,317 | | | 20,314 | | | (12,526 | ) | | 153,304 | |
| | | | | | | | | | | | | | | | | |
| Other liabilities | | | 108,680 | | | 73,310 | | | (13,587 | ) | | (52,700 | ) | | 115,703 | |
| Long-term debt | | | 575,608 | | | — | | | 24,826 | | | (8,848 | ) | | 591,586 | |
| Minority interest | | | 28 | | | — | | | — | | | 585 | | | 613 | |
| | | | | | | | | | | | | | | | | |
| Common stock | | | 509 | | | 46,482 | | | 189,735 | | | (236,217 | ) | | 509 | |
| Treasury stock | | | (28,670 | ) | | — | | | — | | | — | | | (28,670 | ) |
| Additional paid-in capital | | | 362,328 | | | 116,868 | | | — | | | (116,868 | ) | | 362,328 | |
| Retained earnings | | | 257,919 | | | 2,563 | | | (39,612 | ) | | 36,384 | | | 257,254 | |
| Other accumulated comprehensive loss | | | (4,071 | ) | | — | | | (117 | ) | | — | | | (4,188 | ) |
| | |
|
| |
|
| |
|
| |
|
| |
|
| |
| Total stockholders’ equity | | | 588,015 | | | 165,913 | | | 150,006 | | | (316,701 | ) | | 587,233 | |
| | |
|
| |
|
| |
|
| |
|
| |
|
| |
| Total liabilities and stockholders’ equity | | $ | 1,400,530 | | $ | 256,540 | | $ | 181,559 | | $ | (390,190 | ) | $ | 1,448,439 | |
| | |
|
| |
|
| |
|
| |
|
| |
|
| |
78
Back to Contents
STEEL DYNAMICS, INC.
NOTES TO CONSOLIDATED FINANCIAL STATEMENTS — (Continued)
Note 12. Condensed Consolidating Information — (Continued)
Condensed Consolidating Statements of Income (in thousands): |
| |
| | | Parent | | Guarantors | | Combined
non-guarantors | | Consolidating
adjustments | | Total
consolidated | |
| | |
|
| |
|
| |
|
| |
|
| |
|
| |
| | | (Year ended December 31, 2004) | |
| Net sales | | $ | 1,892,647 | | $ | 2,093,375 | | $ | 194,415 | | $ | (2,035,524 | ) | $ | 2,144,913 | |
| Cost of goods sold | | | 1,356,679 | | | 2,077,179 | | | 172,830 | | | (2,065,265 | ) | | 1,541,423 | |
| | |
|
| |
|
| |
|
| |
|
| |
|
| |
| Gross profit | | | 535,968 | | | 16,196 | | | 21,585 | | | 29,741 | | | 603,490 | |
| Selling, general and administration | | | 74,698 | | | 11,684 | | | 12,862 | | | (2,663 | ) | | 96,581 | |
| | |
|
| |
|
| |
|
| |
|
| |
|
| |
| Operating income | | | 461,270 | | | 4,512 | | | 8,723 | | | 32,404 | | | 506,909 | |
| Interest expense | | | 36,381 | | | 1,244 | | | 1,605 | | | (323 | ) | | 38,907 | |
| Other (income) expense | | | 119,422 | | | (126,829 | ) | | (79 | ) | | 455 | | | (7,031 | ) |
| | |
|
| |
|
| |
|
| |
|
| |
|
| |
| Income (loss) before income taxes and equity in net income of subsidiaries | | | 305,467 | | | 130,097 | | | 7,197 | | | 32,272 | | | 475,033 | |
| Income tax expense (benefit) | | | 118,361 | | | 45,713 | | | 2,734 | | | 12,911 | | | 179,719 | |
| | |
|
| |
|
| |
|
| |
|
| |
|
| |
| | | | 187,106 | | | 84,384 | | | 4,463 | | | 19,361 | | | 295,314 | |
| Equity in net income of subsidiaries | | | 88,847 | | | — | | | — | | | (88,847 | ) | | — | |
| | |
|
| |
|
| |
|
| |
|
| |
|
| |
| Net income (loss) | | $ | 275,953 | | $ | 84,384 | | $ | 4,463 | | $ | (69,486 | ) | $ | 295,314 | |
| | |
|
| |
|
| |
|
| |
|
| |
|
| |
| | | | | | | | | | | | | | | | | |
| | | Parent | | Guarantors | | Combined
non-guarantors | | Consolidating
adjustments | | Total
consolidated | |
| | |
|
| |
|
| |
|
| |
|
| |
|
| |
| | | (Year ended December 31, 2003) | |
| Net sales | | $ | 956,552 | | $ | 956,556 | | $ | 87,190 | | $ | (1,013,050 | ) | $ | 987,248 | |
| Cost of goods sold | | | 808,384 | | | 950,131 | | | 88,148 | | | (1,004,743 | ) | | 841,920 | |
| | |
|
| |
|
| |
|
| |
|
| |
|
| |
| Gross profit | | | 148,168 | | | 6,425 | | | (958 | ) | | (8,307 | ) | | 145,328 | |
| Selling, general and administration | | | 34,881 | | | 10,814 | | | 8,963 | | | (5,937 | ) | | 48,721 | |
| | |
|
| |
|
| |
|
| |
|
| |
|
| |
| Operating income (loss) | | | 113,287 | | | (4,389 | ) | | (9,921 | ) | | (2,370 | ) | | 96,607 | |
| Interest expense | | | 34,841 | | | (1,360 | ) | | 1,688 | | | (676 | ) | | 34,493 | |
| Other (income) expense | | | 58,977 | | | (59,087 | ) | | (14,009 | ) | | 796 | | | (13,323 | ) |
| | |
|
| |
|
| |
|
| |
|
| |
|
| |
| Income before income taxes and equity in net income of subsidiaries | | | 19,469 | | | 56,058 | | | 2,400 | | | (2,490 | ) | | 75,437 | |
| Income tax expense (benefit) | | | 8,794 | | | 19,613 | | | 900 | | | (1,018 | ) | | 28,289 | |
| | |
|
| |
|
| |
|
| |
|
| |
|
| |
| | | | 10,675 | | | 36,445 | | | 1,500 | | | (1,472 | ) | | 47,148 | |
| Equity in net income of subsidiaries | | | 37,945 | | | — | | | — | | | (37,945 | ) | | — | |
| | |
|
| |
|
| |
|
| |
|
| |
|
| |
| Net income (loss) | | $ | 48,620 | | $ | 36,445 | | $ | 1,500 | | $ | (39,417 | ) | $ | 47,148 | |
| | |
|
| |
|
| |
|
| |
|
| |
|
| |
79
Back to Contents
STEEL DYNAMICS, INC.
NOTES TO CONSOLIDATED FINANCIAL STATEMENTS — (Continued)
Note 12. Condensed Consolidating Information — (Continued)
| | | Parent | | Guarantors | | Combined
non-guarantors | | Consolidating
adjustments | | Total
consolidated | |
| | |
|
| |
|
| |
|
| |
|
| |
|
| |
| | | (Year ended December 31, 2002) | |
| Net sales | | $ | 833,585 | | $ | — | | $ | 80,705 | | $ | (49,797 | ) | $ | 864,493 | |
| Cost of goods sold | | | 615,229 | | | — | | | 80,806 | | | (49,077 | ) | | 646,958 | |
| | |
|
| |
|
| |
|
| |
|
| |
|
| |
| Gross profit | | | 218,356 | | | — | | | (101 | ) | | (720 | ) | | 217,535 | |
| Selling, general and administration | | | 49,519 | | | 324 | | | 9,770 | | | (445 | ) | | 59,168 | |
| | |
|
| |
|
| |
|
| |
|
| |
|
| |
| Operating income (loss) | | | 168,837 | | | (324 | ) | | (9,871 | ) | | (275 | ) | | 158,367 | |
| Interest expense | | | 28,313 | | | — | | | 2,058 | | | (170 | ) | | 30,201 | |
| Other (income) expense | | | 54,303 | | | (50,879 | ) | | (24 | ) | | 289 | | | 3,689 | |
| | |
|
| |
|
| |
|
| |
|
| |
|
| |
| Income (loss) before income taxes and equity in net income of subsidiaries | | | 86,221 | | | 50,555 | | | (11,905 | ) | | (394 | ) | | 124,477 | |
| Income tax expense (benefit) | | | 33,406 | | | 17,687 | | | (4,493 | ) | | — | | | 46,600 | |
| | |
|
| |
|
| |
|
| |
|
| |
|
| |
| | | | 52,815 | | | 32,868 | | | (7,412 | ) | | (394 | ) | | 77,877 | |
| Equity in net income of subsidiaries | | | 25,456 | | | — | | | — | | | (25,456 | ) | | — | |
| | |
|
| |
|
| |
|
| |
|
| |
|
| |
| Net income (loss) | | $ | 78,271 | | $ | 32,868 | | $ | (7,412 | ) | $ | (25,850 | ) | $ | 77,877 | |
| | |
|
| |
|
| |
|
| |
|
| |
|
| |
Condensed Consolidating Statements of Cash Flows (in thousands): |
| |
| | | Parent | | Guarantors | | Combined
non-guarantors | | Total
consolidated | |
| | |
|
| |
|
| |
|
| |
|
| |
| | | (Year ended December 31, 2004) | |
| Net cash provided by operations | | $ | 188,472 | | $ | 47,488 | | $ | 11,959 | | $ | 247,919 | |
Net cash used in investing activities – primarily
purchases of property, plant and equipment | | | (23,855 | ) | | (50,573 | ) | | (27,563 | ) | | (101,991 | ) |
| Financing activities: | | | | | | | | | | | | | |
| Issuance of long-term debt | | | 120,600 | | | — | | | 67,692 | | | 188,292 | |
| Repayments of long-term debt | | | (256,216 | ) | | — | | | (91,271 | ) | | (347,487 | ) |
| Other | | | (89,462 | ) | | 14,461 | | | 39,172 | | | (35,829 | ) |
| | |
|
| |
|
| |
|
| |
|
| |
| Net cash provided by (used in) financing activities | | | (225,078 | ) | | 14,461 | | | 15,593 | | | (195,024 | ) |
| | |
|
| |
|
| |
|
| |
|
| |
| Increase (decrease) in cash and cash equivalents | | | (60,461 | ) | | 11,376 | | | (11 | ) | | (49,096 | ) |
| Cash and cash equivalents at beginning of year | | | 64,008 | | | 496 | | | 926 | | | 65,430 | |
| | |
|
| |
|
| |
|
| |
|
| |
| Cash and cash equivalents at end of year | | $ | 3,547 | | $ | 11,872 | | $ | 915 | | $ | 16,334 | |
| | |
|
| |
|
| |
|
| |
|
| |
80
Back to Contents
STEEL DYNAMICS, INC.
NOTES TO CONSOLIDATED FINANCIAL STATEMENTS — (Continued)
Note 12. Condensed Consolidating Information — (Continued)
| | | Parent | | Guarantors | | Combined
non-guarantors | | Total
consolidated | |
| | |
|
| |
|
| |
|
| |
|
| |
| | | (Year ended December 31, 2003) | |
| Net cash provided by (used in) operations | | $ | 188,681 | | $ | (68,265 | ) | $ | 7,190 | | $ | 127,606 | |
| Net cash used in investing activities – primarily purchases of property, plant and equipment | | | (79,927 | ) | | (50,674 | ) | | (14,743 | ) | | (145,344 | ) |
| Financing activities: | | | | | | | | | | | | | |
| Issuance of long-term debt | | | 153,540 | | | — | | | 38,280 | | | 191,820 | |
| Repayments of long-term debt | | | (85,765 | ) | | — | | | (58,244 | ) | | (144,009 | ) |
| Issuance of treasury stock | | | 219 | | | — | | | — | | | 219 | |
| Other | | | (135,270 | ) | | 119,153 | | | 27,037 | | | 10,920 | |
| | |
|
| |
|
| |
|
| |
|
| |
| Net cash provided by (used in) financing activities | | | (67,276 | ) | | 119,153 | | | 7,073 | | | 58,950 | |
| | |
|
| |
|
| |
|
| |
|
| |
| Increase (decrease) in cash and cash equivalents | | | 41,478 | | | 214 | | | (480 | ) | | 41,212 | |
| Cash and cash equivalents at beginning of year | | | 22,530 | | | 282 | | | 1,406 | | | 24,218 | |
| | |
|
| |
|
| |
|
| |
|
| |
| Cash and cash equivalents at end of year | | $ | 64,008 | | $ | 496 | | $ | 926 | | $ | 65,430 | |
| | |
|
| |
|
| |
|
| |
|
| |
| | | | | | | | | | | | | | |
| | | Parent | | Guarantors | | Combined
non-guarantors | | Total
consolidated | |
| | |
|
| |
|
| |
|
| |
|
| |
| | | (Year ended December 31, 2002) | |
| Net cash provided by operations | | $ | 80,838 | | $ | 33,976 | | $ | 208 | | $ | 115,022 | |
| Net cash used in investing activities – primarily purchases of property, plant and equipment | | | (88,203 | ) | | (46,140 | ) | | 557 | | | (133,786 | ) |
| Financing activities: | | | | | | | | | | | | | |
| Issuance of long-term debt | | | 582,411 | | | — | | | 16,580 | | | 598,991 | |
| Repayments of long-term debt | | | (566,450 | ) | | — | | | (55,015 | ) | | (621,465 | ) |
| Other | | | (63,473 | ) | | 12,363 | | | 38,325 | | | (12,785 | ) |
| | |
|
| |
|
| |
|
| |
|
| |
| Net cash provided by (used in) financing activities | | | (47,512 | ) | | 12,363 | | | (110 | ) | | (35,259 | ) |
| | |
|
| |
|
| |
|
| |
|
| |
| Increase (decrease) in cash and cash equivalents | | | (54,877 | ) | | 199 | | | 655 | | | (54,023 | ) |
| Cash and cash equivalents at beginning of year | | | 77,407 | | | 83 | | | 751 | | | 78,241 | |
| | |
|
| |
|
| |
|
| |
|
| |
| Cash and cash equivalents at end of year | | $ | 22,530 | | $ | 282 | | $ | 1,406 | | $ | 24,218 | |
| | |
|
| |
|
| |
|
| |
|
| |
81
Back to Contents
STEEL DYNAMICS, INC.
NOTES TO CONSOLIDATED FINANCIAL STATEMENTS — (Continued)
Note 13. Quarterly Financial Information (unaudited, in thousands, except per share data)
| | | 1st Quarter | | 2nd Quarter | | 3rd Quarter | | 4th Quarter | |
| | |
|
| |
|
| |
|
| |
|
| |
2004: | | | | | | | | | | | | | |
| Net sales | | $ | 384,145 | | $ | 525,657 | | $ | 634,741 | | $ | 600,370 | |
| Gross profit | | | 76,475 | | | 136,671 | | | 220,888 | | | 169,456 | |
| Operating income | | | 58,540 | | | 115,116 | | | 193,260 | | | 139,993 | |
| Net income | | | 31,962 | | | 67,292 | | | 113,614 | | | 82,446 | |
| Earnings per share: | | | | | | | | | | | | | |
| Basic | | | .65 | | | 1.36 | | | 2.29 | | | 1.67 | |
| Diluted | | | .58 | | | 1.20 | | | 2.01 | | | 1.47 | |
| | | | | | | | | | | | | | |
2003: | | | | | | | | | | | | | |
| Net sales | | $ | 235,504 | | $ | 218,632 | | $ | 253,952 | | $ | 279,160 | |
| Gross profit | | | 46,502 | | | 28,532 | | | 35,110 | | | 35,184 | |
| Operating income | | | 34,560 | | | 17,226 | | | 22,845 | | | 21,976 | |
| Net income | | | 15,778 | | | 5,430 | | | 9,191 | | | 16,749 | |
| Earnings per share: | | | | | | | | | | | | | |
| Basic | | | .33 | | | .11 | | | .19 | | | .35 | |
| Diluted | | | .30 | | | .11 | | | .18 | | | .31 | |
Earnings per share are computed independently for each of the quarters presented. Therefore, the sum of the quarterly earnings per share may not equal the total for the year. Pursuant to EITF 04-8, as discussed in Note 1 to these consolidated financial statements, the company recalculated diluted earnings per share for 2003.
82
Back to Contents
ITEM 9. CHANGES IN AND DISAGREEMENTS WITH ACCOUNTANTS ON ACCOUNTING AND FINANCIAL DISCLOSURE |
ITEM 9A. CONTROLS AND PROCEDURES |
(a) Evaluation of Disclosure Controls and Procedures. As required by Rule 13a-15(b) under the Securities Exchange Act of 1934, as amended (the “Exchange Act”), the company’s management carried out an evaluation, with the participation of the Chief Executive Officer and Chief Financial Officer, of the effectiveness of the design and operation of our disclosure controls and procedures (as defined in Rules 13a-15(e) of the Exchange Act), as of the period covered by this report. Based upon their evaluation, our Chief Executive Officer and Chief Financial Officer concluded that, as of the end of the period covered by this report, our disclosure controls and procedures were effective to ensure that information required to be disclosed by the company (including its consolidated subsidiaries) in the reports we file or submit under the Exchange Act is recorded, processed, summarized and reported within the time periods specified in the SEC’s rules and forms.
(b) Changes in Internal Control Over Financial Reporting. During our most recent fiscal quarter, there was no change in our internal control over financial reporting (as that term is defined in Rules 13a-15(f) and 15d-15(f) under the Exchange Act) that has materially affected, or is reasonably likely to materially affect, our internal control over financial reporting.
(c) Management’s Report on Internal Control Over Financial Reporting. Our management is responsible for establishing and maintaining adequate internal control over financial reporting, as such term is defined in Rule 13a-15(f) of the Exchange Act. Our management, including our Chief Executive Officer and our Chief Financial Officer, conducted an evaluation of the effectiveness of our internal control over financial reporting, as of December 31, 2004, based on the criteria set forth by the Committee of Sponsoring Organizations of the Treadway Commission, or COSO, in the report entitled “Internal Control — Integrated Framework.” Based on the evaluation using those criteria, management concluded that, as of December 31, 2004, our internal control over financial reporting was effective.
Our Management’s Report on Internal Control Over Financial Reporting, as of December 31, 2004, can be found on page 45 of this Form 10-K, and the related Report of Our Independent Registered Public Accounting Firm, Ernst & Young LLP, on Internal Control Over Financial Reporting can be found on page 46 of this Form 10-K, each of which is incorporated by referenced into this Item 9A.
ITEM 9B. OTHER INFORMATION |
Our board of directors has established the company’s authorized number of directors at eleven, effective March 1, 2005.
PART III
ITEM 10. DIRECTORS AND EXECUTIVE OFFICERS OF THE REGISTRANT |
The information required to be furnished pursuant to this item will be set forth under the caption “Election of Directors” in the 2005 Proxy Statement, which we will file no later than 120 days after the end of our fiscal year with the Securities and Exchange Commission. We incorporate that information herein by reference.
ITEM 11. EXECUTIVE COMPENSATION |
The information required to be furnished pursuant to this item will be set forth under the caption “Executive Compensation” in the 2005 Proxy Statement, which we will file no later than 120 days after the end
83
Back to Contents
of our fiscal year with the Securities and Exchange Commission. We incorporate that information herein by reference.
| |
ITEM 12. SECURITY OWNERSHIP OF CERTAIN BENEFICIAL OWNERS AND MANAGEMENT |
The information required to be furnished pursuant to this item will be set forth under the caption “Information on Directors and Executive Officers” in the 2005 Proxy Statement, which will be filed no later than 120 days after the end of our fiscal year with the Securities and Exchange Commission. We incorporate that information herein by reference.
Securities Authorized for Issuance Under Equity Compensation Plans |
We have four compensation plans approved by stockholders under which our equity securities are authorized for issuance to employees or directors in exchange for goods or services: The 1994 Incentive Stock Option Plan; The Amended and Restated 1996 Incentive Stock Option Plan; The 2003 Executive Officer Compensation Plan, which replaced The Revised Officer and Manager Cash and Stock Bonus Plan on January 1, 2003; and The Non-Employee Director Stock Option Plan. The following table summarizes information about our equity compensation plans at December 31, 2004:
Plan Category | | (a)
Number of Securities to be
issued upon exercise of
outstanding options, warrants
and rights | | (b)
Weighted-average exercise
price of outstanding options,
warrants and rights | | (c)
Number of securities remaining
available for future issuance
under equity compensation
plans (excluding securities
reflected in column (a) | |
| |
|
| |
|
| |
|
| |
| Equity compensation plans approved by security holders | | | 1,502,597 | | $ | 20.54 | | | 2,088,526 | |
| Equity compensation plans not approved by security holders | | | — | | | — | | | — | |
| |
ITEM 13. CERTAIN RELATIONSHIPS AND RELATED TRANSACTIONS |
Heidtman Contract. For the years ended December 31, 2004 and 2003, we sold approximately 490,000 tons and 419,000 tons of our steel products to Heidtman for $259.5 million and $132.8 million, representing approximately 12% and 13% of our total net sales for each year, respectively. We have a long-term “off-take” agreement with Heidtman that extends through March 2007. Under the off-take agreement, Heidtman is obligated to buy and we are obligated to sell to Heidtman, at least 76,000 tons of our hot band products per quarter, or 336,000 tons annually, and at least 15,000 tons of our cold-rolled products per quarter, or 60,000 tons annually. Our pricing to Heidtman is determined by either a market or a spot market pricing formula. For market priced sales of hot-rolled steel, pricing is determined on an “all-in” cost-plus basis, together with all published extras. For spot market sales of hot-rolled steel, pricing is determined on the basis of a discounted market index. Pricing for cold-rolled products is determined on a marginal revenue basis over hot-rolled sheet. John Bates is the President and Chief Executive Officer of Heidtman, is a member of our board of directors and is the beneficial owner of 5% of our common stock outstanding as of December 31, 2004.
We believe that the transactions described above are on terms no less favorable to us than could be obtained from unaffiliated third parties.
84
Back to Contents
ITEM 14. PRINCIPAL ACCOUNTANT FEES AND SERVICES |
| |
Independent Auditor Fee Information |
Fees for professional services provided by our independent auditors in each of the last two years, in each of the following categories are:
| | | 2004 | | 2003 | |
| | |
|
| |
|
| |
| Audit Fees | | $ | 508,000 | | $ | 280,000 | |
| Audit-Related Fees | | | 18,000 | | | 58,000 | |
| Tax Fees | | | 86,000 | | | 159,000 | |
| | |
|
| |
|
| |
| | | $ | 612,000 | | $ | 497,000 | |
| | |
|
| |
|
| |
Fees for audit services include fees associated with the annual audit, the reviews of the Company’s quarterly reports on Form 10-Q, comfort letter procedures, preparing consents, and assistance with review of documents filed with the Commission. Audit-related fees principally include accounting consultations and separate audit of a subsidiary. Tax fees principally include tax consultations, compliance review and planning assistance.
PART IV
ITEM 15. EXHIBITS AND FINANCIAL STATEMENT SCHEDULES |
(a) The following documents are filed as a part of this report:
See the Audited Consolidated Financial Statements of Steel Dynamics Inc. included as part of Item 8 and described in the Index on page xx of this Report.
2. Financial Statement Schedules:
85
Back to Contents
Exhibit
Number | | Description |
| |
|
| | | |
| 3.1a | | Amended and Restated Articles of Incorporation of Steel Dynamics, Inc., incorporated by reference from Exhibit 3.1a in Registrant’s Registration Statement on Form S-1, SEC File No. 333-12521, effective November 21, 1996. |
| 3.1b | | Articles of Incorporation of Iron Dynamics, Inc., incorporated by reference from Registrant’s 1996 Annual Report on Form 10-K, filed March 31, 1997. |
| 3.2a | | Amended Bylaws of Steel Dynamics, Inc., incorporated herein by reference from Exhibit 3.2a to our Registration Statement on Form S-3, SEC File No. 333-82210, effective February 28, 2002. |
| 3.2b | | Bylaws of Iron Dynamics, Inc., incorporated by reference from Registrant’s 1996 Annual Report on Form 10-K, filed March 31, 1997. |
| 4.1 | | Registration Agreement between Steel Dynamics, Inc. and certain stockholders of Steel Dynamics, Inc., incorporated by reference from Exhibit 10.31 to the Company’s Registration Statement on Form S-1, SEC File No. 333-12521, filed September 23, 1996. |
| 4.2 | | Registration Rights Agreement, dated as of January 28, 2002, among Steel Dynamics, Inc., various financial institutions which are to receive Steel Dynamics common stock under the Settlement Agreement referred to in Exhibit 2.1, and Mellon Bank, N.A., as Agent, incorporated by reference from Exhibit 4.1 to our Report on Form 8-K, filed February 26, 2002. |
| 4.3 | | Registration Rights Agreement between Steel Dynamics, Inc. as Issuer and Morgan Stanley & Co. Incorporated and Goldman, Sachs & Co. as Initial Purchasers, dated as of December 23, 2002, re $100,000,000 of our 4% Convertible Subordinated Notes due 2012, incorporated by reference from Exhibit 4.1c to our Registration Statement on Form S-3, File No. 333-103672, filed March 7, 2003. |
| 4.4 | | Indenture relating to Registrant’s issuance of $200 million senior unsecured notes, dated as of March 26, 2002, between Steel Dynamics, Inc. as Issuer and SDI Investment Company as Initial Subsidiary Guarantor, and Fifth Third Bank, Indiana as Trustee, incorporated by reference from Exhibit 10.3a to our 2001 Annual Report on Form 10-K, filed March 28, 2002. |
| 4.4a | | First Supplemental Indenture, dated as of September 6, 2002, relating to the Indenture described in Exhibit 4.4, incorporated herein by reference from our Exhibit 4.4a to our 2002 Annual Report on Form 10-K, filed March 28, 2003. |
| 4.4b | | Second Supplemental Indenture, dated as of September 30, 2002, relating to the Indenture described in Exhibit 4.4, incorporated herein by reference from our Exhibit 4.4b to our 2002 Annual Report on Form 10-K, filed March 28, 2003. |
| 4.4c | | Third Supplemental Indenture, dated as of December 31, 2002, relating to the Indenture described in Exhibit 4.4, incorporated herein by reference from our Exhibit 4.4c to our 2002 Annual Report on Form 10-K, filed March 28, 2003. |
| 4.4d | | Fourth Supplemental Indenture, dated as of November 26, 2003, relating to the Indenture described in Exhibit 4.4, incorporated herein by reference from our Exhibit 4.4d to our 2003 Annual Report on Form 10-K, filed March 12, 2004. |
86
Back to Contents
Exhibit
Number | | Description |
| |
|
| | | |
| 4.5 | | Indenture relating to our 4% Convertible Subordinated Notes due 2012, dated as of December 23, 2002, between Steel Dynamics, Inc. and Fifth Third Bank, Indiana as Trustee, incorporated by reference from Exhibit 4.2a to our Registration Statement on Form S-3, File No. 333-103672, filed March 7, 2003. |
| | | Material Contracts |
| 10.01 | | Credit Agreement relating to our $230 million senior secured revolving credit facility, dated as June 30, 2004, among Steel Dynamics, Inc. as Borrower, certain designed “Initial Lenders,” General Electric Capital Corporation as Collateral and Administrative Agent, Morgan Stanley Senior Funding, Inc., as Lead Arranger and Syndication Agent, and Harris Trust and Savings Bank and National City Bank as Documentation Agents, and others, incorporated herein by reference from Exhibit 10.01 to our September 30, 2004 Form 10-Q, filed November 8, 2004. |
| 10.01a | | First Amendment to Credit Agreement dated October 26, 2004, relating to the Credit Agreement described at Exhibit 10.01, incorporated herein by reference from Exhibit 10.01a to our September 30, 2004 Form 10-Q, filed November 8, 2004. |
| 10.3 | | Purchase Agreement dated December 17, 2002 between Steel Dynamics, Inc. and Morgan Stanley & Co. Incorporated herein, et al as Initial Purchasers re Steel Dynamics, Inc.’s 4% Convertible Subordinated Notes due 2012. |
| 10.12 | | Loan Agreement between Indiana Development Finance Authority and Steel Dynamics, Inc. re Taxable Economic Development Revenue bonds, Trust Indenture between Indiana Development Finance Authority and NBD Bank, N.A., as Trustee re Loan Agreement between Indiana Development Finance Authority and Steel Dynamics, Inc., incorporated herein by reference from Exhibit 10.12 to Registrant’s Registration Statement on Form S-1, File No. 333-12521, effective November 21, 1996. |
| 10.18 | | 1994 Incentive Stock Option Plan, incorporated herein by reference from Exhibit 10.18 to Registrant’s Registration Statement on Form S-1, File No. 333-12521, effective November 21, 1996. |
| 10.19† | | Amended and Restated 1996 Incentive Stock Option Plan, incorporated herein by reference from Exhibit 10.19 to our 2001 Annual Report on Form 10-K, filed March 28, 2002. |
| 10.23† | | Revised Officer and Manager Cash and Stock Bonus Plan, incorporated herein by reference from Exhibit 10.23 to our June 30, 2000 Form 10-Q, filed August 11, 2000. |
| 10.24† | | 2003 Executive Incentive Compensation Plan, approved by stockholders on May 29, 2003, incorporated herein by reference from our Exhibit 10.24 to our 2003 Annual Report on Form 10-K, filed March 12, 2004. |
| 10.25†* | | 2004 Employee Stock Purchase Plan, approved by stockholders on May 20, 2004. |
| 10.40 | | Non-Employee Director Stock Option Plan, incorporated herein by reference from Exhibit 10.40 to our June 30, 2000 Form 10-Q, filed August 11, 2000. |
| | | Other |
| 12.1* | | Computation of Ratio of Earnings to Fixed Charges |
87
Back to Contents
Exhibit
Number | | Description |
| |
|
| | | |
| 14.1 | | Code of Ethics for Principal Executive Officers and Senior Financial Officers, incorporate by reference herein from Exhibit 14.1 to our 2002 Annual Report on Form 10-K, filed March 28, 2003. |
| 21.1* | | List of our Subsidiaries |
| 23.1* | | Consent of Ernst & Young LLP. |
| 24.1 | | Powers of attorney (see signature page on page 75 of this Report). |
| | | Executive Officer Certifications |
| 31.1* | | Certification of Chief Executive Officer required by Item 307 of Regulation S-K as promulgated by the Securities and Exchange Commission and pursuant to Section 302 of the Sarbanes-Oxley Act of 2002 |
| 31.2* | | Certification of Chief Financial Officer required by Item 307 of Regulation S-K as promulgated by the Securities and Exchange Commission and pursuant to Section 302 of the Sarbanes-Oxley Act of 2002 |
| 32.1* | | Certification of Chief Executive Officer Pursuant to 18 U.S.C Section 1350, as Adopted Pursuant to Section 906 of the Sarbanes-Oxley Act of 2002 |
| 32.2* | | Certification of Chief Financial Officer Pursuant to 18 U.S.C Section 1350, as Adopted Pursuant to Section 906 of the Sarbanes-Oxley Act of 2002 |
| | | |
| | * | Filed concurrently herewith |
| | † | Indicates a management contract or compensatory plan or arrangement. |
| | (d) | Availability of Exhibits. Copies of this Annual Report on Form 10K (including Exhibit 24.1), Exhibits 12.1, 14.1, 21.1 and 23.1 are available to our stockholders without charge. Copies of other exhibits can be obtained by stockholders upon payment of 12 cents per page for such exhibits. Written requests should be sent to Investor Relations, Steel Dynamics, Inc., 6714 Pointe Inverness Way, Suite 200, Fort Wayne, Indiana 46804. |
88
Back to Contents
SIGNATURES
Pursuant to the requirements of Section 13 or 15(d) of Securities Exchange Act of 1934, Steel Dynamics, Inc. has duly caused this report to be signed on its behalf by the undersigned, thereunto duly authorized.
March 4, 2005
By: /s/ KEITH E. BUSSE
Keith E. BussePresident and Chief Executive Officer
POWER OF ATTORNEY
Each person whose signature appears below constitutes and appoints Keith E. Busse and Gary E. Heasley, either of whom may act without the joinder of the other, as his true and lawful attorneys-in-fact and agents with full power of substitution and resubstitution, for him, and in his name, place and stead, in any and all capacities to sign any and all amendments, and supplements to this 2004 Annual Report on Form 10-K, filed pursuant to Section 13 or 15(d) of the Securities Exchange Act of 1934, as amended, and to file the same, with all exhibits thereto, and all other documents in connection therewith, with the Securities and Exchange Commission, granting unto said attorneys-in-fact and agents full power and authority to do and performs each and every act and thing requisite and necessary to be done, as full to all intents and purposes as he might or could do in person, hereby ratifying and confirming all that said attorneys-in-fact and agents or their substitute or substitutes may lawfully do or cause to be done by virtue thereof.
Pursuant to the requirements of the Securities Exchange Act of 1934, this 2004 Annual Report on Form 10-K has been signed below by the following persons on behalf of Steel Dynamics, Inc. and in the capacities and on the dates indicated.
Signatures | | Title | | Date |
| |
| |
|
/s/ KEITH E. BUSSE
Keith E. Busse | | President & Chief Executive Officer and Director
(Principal Executive Officer) | | 03/04/05 |
/s/ GARY E. HEASLEY
Gary E. Heasley | | Vice President & Chief Financial Officer
(Principal Financial and Accounting Officer) | | 03/04/05 |
/s/ MARK D. MILLETT
Mark D. Millett | | Vice President and Director | | 03/04/05 |
/s/ RICHARD P. TEETS, JR.
Richard P. Teets, Jr. | | Vice President and Director | | 03/04/05 |
89
Back to Contents
Signatures | | Title | | Date |
| |
| |
|
/s/ JOHN C. BATES
John C. Bates | | Director | | 03/04/05 |
James E. Kelley | | Director | | |
/s/ DR. JüRGEN KOLB
Dr. Jürgen Kolb | | Director | | 03/04/05 |
/s/ NAOKI HIDAKA
Naoki Hidaka | | Director | | 03/04/05 |
/s/ JOSEPH D. RUFFOLO
Joseph D. Ruffolo | | Director | | 03/04/05 |
/s/ RICHARD J. FREELAND
Richard J. Freeland | | Director | | 03/04/05 |
Paul B. Edgerley | | Director | | |
90