The following table depicts our product mix by major product category based on tons shipped for the indicated periods (* indicates shipments of less than 1%). Generally, we incur higher production costs when manufacturing value-added products such as, cold rolled, galvanized, and painted flat roll steels; and special-bar-quality steels. During the third quarter of 2005, we also experienced an overall increase in our electricity and natural gas costs. As a percentage of our total costs of goods sold, combined electricity and natural gas costs increased from 8% during the full year 2004 timeframe to 10% during the third quarter of 2005. Given the recent disruption in natural gas supply in the Gulf Coast region, we expect to continue to experience higher natural gas costs; however, we do not expect this to have a material adverse impact on our financial position as natural gas consumption is a much less significant component in the production of steel through electric arc furnace operations, such as ours, than in traditional steel manufacturing blast furnace operations.
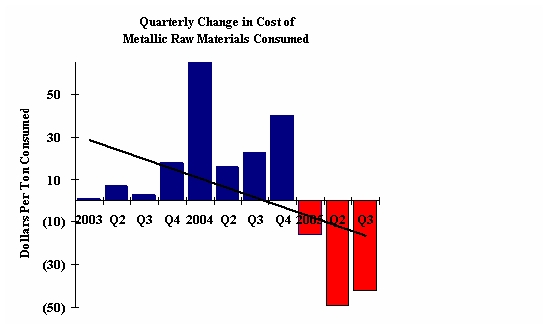
Metallic raw materials used in our electric arc furnaces represent our single-most significant manufacturing cost. Our metallic raw material cost per net ton consumed decreased $42 during the third quarter of 2005 and decreased $67 when compared to the same period of 2004. Historically our metallic raw material costs represented between 45% and 50% of our total manufacturing costs; however, for the year 2004 this percentage increased to 67% during the third quarter due to the elevated cost of our metallic raw materials, specifically steel scrap. This increase in the cost of our primary raw material as a percentage of our total manufacturing costs necessitated the initiation of a surcharge mechanism which was adopted by the steel industry during the first quarter of 2004. The surcharge is derived from an indexed scrap number and designed to pass some of the increased costs associated with rising metallic prices through to our customers. As these costs decrease, the surcharge also declines. During a portion of the second and third quarters of 2005 actual steel scrap costs were below the indexed surcharge numbers and in some instances no surcharge was utilized in determining prices for our products. Metallic raw materials represented 49% and 56% of our total manufacturing costs during the third quarter and first nine months of 2005, respectively.
Back to Contents
Selling, General and Administrative Expenses. Selling, general and administrative expenses were $23.4 million during the third quarter of 2005, as compared to $27.6 million during the same period in 2004, a decrease of $4.2 million, or 15%. During the third quarter of 2005 and 2004, our total selling, general and administrative expenses represented 5% and 4%, respectively, of net sales. In connection with our September 2005 refinancing, we wrote-off $1.9 million of previously capitalized financing costs during the quarter. We recorded expense of $4.6 million and $11.6 million during the third quarter of 2005 and 2004, respectively, related to our performance-based profit sharing plan allocation, which is based on 6% of pretax earnings.
Interest Expense. During the third quarter of 2005, gross interest expense decreased $2.6 million, or 21%, to $9.5 million and capitalized interest decreased $1.6 million to $39,000, as compared to the same period in 2004. This decrease in gross interest expense was the result of interest expense of $1.9 million that was recorded during the third quarter of 2004 in conjunction with a one-time short-term U.S. Treasury bond transaction. The interest capitalization that occurred during these periods resulted from the interest required to be capitalized with respect to construction activities at our Bar Products Division and Structural & Rail Division. We currently anticipate gross interest expense to remain consistent throughout the remainder of this year.
Other (Income) Expense. Other income was $1.5 million during the third quarter of 2005, as compared to $458,000 during 2004. During the third quarter of 2005, we recorded gains of $1.3 million from the sale of certain equity securities.
Income Taxes. During the third quarter of 2005, our income tax provision was $28.4 million, as compared to $69.6 million during the same period in 2004. Our effective income tax rate was increased to 38% for the second half of 2004 due to increased profitability. We further increased our effective income tax rate to 38.5% beginning January 1, 2005 in anticipation of the year’s expected profitability levels and the resulting impact to our state income taxes.
First Nine Months Operating Results 2005 vs. 2004
Net income was $156.8 million or $3.05 per diluted share during the first nine months of 2005, compared with $212.9 million or $3.80 per diluted share during the first nine months of 2004.
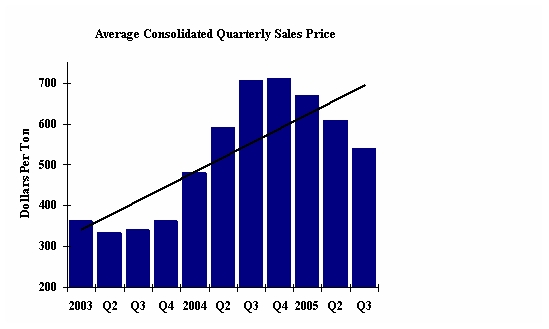
Gross Profit. During the first nine months of 2005, our net sales increased $70.7 million, or 5%, to $1.6 billion and our consolidated shipments increased 88,000 tons, or 3%, to 2.7 million tons, compared with the first nine months of 2004. The increase in shipments was primarily due to increased shipments of 52,000 tons from our Structural & Rail Division and 55,000 tons from our Bar Products Division, which started commercial operations during the first quarter of 2004, combined with a decrease of 37,000 tons from our Flat Roll Division. Our average consolidated selling price increased $7 per ton, or 1%, compared with the first nine months of 2004.
Selling, General and Administrative Expenses. Selling, general and administrative expenses were $65.9 million during the first nine months of 2005, as compared to $67.1 million during the same period in 2004, a decrease of $1.2 million, or 2%. During the first nine months of 2005 and 2004, selling, general and administrative expenses represented approximately 4% of net sales.
Interest Expense. During the first nine months of 2005, gross interest expense decreased $8.9 million, or 25%, to $27.0 million and capitalized interest decreased $4.8 million to $584,000, as compared to the same period in 2004. This decrease in gross interest expense was the result of the repayment of certain debt instruments during the second half of 2004 and due to interest expense of $5.4 million that was recorded during the first nine months of 2004 in conjunction with the aforementioned short-term U.S. Treasury bond transaction.
Other (Income) Expense. Other income was $2.2 million during the first nine months of 2005, as compared to $5.7 million during 2004. During the first quarter of 2004 we entered into a one-time short-term U.S. Treasury Bond transaction to generate net interest income in an increasing interest rate environment and to generate capital gains. This transaction was completed during the fourth quarter of 2004 and we recorded associated gains of $4.9 million during the first nine months of 2004. We also recorded a $1.0 million gain from the early extinguishment of certain debt associated with our Structural & Rail Division during the first nine months of 2004.
Income Taxes. During the first nine months of 2005, our income tax provision was $98.2 million, as compared to $129.2 million during the same period in 2004. Our effective income tax rate was 37.5% for the first half of 2004. We increased our effective income tax rate to 38% effective July 1, 2004 and increased it further to 38.5% beginning January 1, 2005 in anticipation of the year’s expected profitability levels and the resulting impact to our state income taxes.
Liquidity and Capital Resources
Our business is capital intensive and requires substantial expenditures for, among other things, the purchase and maintenance of equipment used in our steelmaking and finishing operations and to remain in compliance with environmental laws. Our short-term and long-term liquidity needs arise primarily from capital expenditures, working capital requirements and principal and interest payments related to our outstanding indebtedness. We have met these liquidity requirements with cash provided by operations, equity, long-term borrowings, state and local grants and capital cost reimbursements.
13
Back to Contents
Working Capital. During the first nine months of 2005, our operational working capital position, representing our cash invested in trade receivables and inventories less trade payables and accruals increased $12.0 million to $420.9 million compared to December 31, 2004. Due to decreased product pricing, trade receivables decreased $35.2 million during the first nine months to $218.6 million, of which 96%, were current or less than 60 days past due. Our largest customer is an affiliated company, Heidtman Steel, which represented 12% and 15% of our outstanding trade receivables at September 30, 2005 and December 31, 2004, respectively. During the first nine months of 2005 our inventories decreased $2.0 million to $379.5 million. Raw materials and supplies increased $31.1 million while finished goods inventories decreased $33.1 million. The increase in raw material and supplies was driven by increased alloy volumes required as product diversification increases at our Bar Products Division and by the addition of inventories at our New Millennium Lake City, Florida plant, which began operations during the first quarter of 2005. The decrease in our finished goods inventories resulted from record shipments at our Structural & Rail Division which reduced finished goods inventories by 74,000 tons, or 61%, during 2005. Our trade payables and accruals decreased $49.3 million, or 22%, during the first nine months of 2005 due to the timing of funding certain payables, including our 2004 401(k) retirement savings and profit sharing plan contribution in March 2005.
Capital Expenditures. During the first nine months of 2005 we invested $45.4 million in property, plant and equipment, of which $18.0 million, or 40%, related to the expansion of our joist and deck operations and the remainder represented improvement projects for our existing facilities. We believe these capital investments will increase our net sales and related cash flows as each project develops.
Capital Resources. During the first nine months of 2005 our total outstanding debt, including unamortized bond premium, increased $28.5 million to $476.9 million. Our long-term debt to capitalization ratio, representing our long-term debt divided by the sum of our long-term debt and our total stockholders’ equity, was 36% and 34% at September 30, 2005 and December 31, 2004, respectively.
On September 7, 2005, we replaced our $230 million 4-year revolving credit facility with a new 5-year $350 million senior secured revolving credit facility, which includes a provision to increase the new facility by as much as $100 million under certain circumstances. The proceeds from the revolver will be available for working capital and other general corporate purposes. As a result of this refinancing we wrote-off $1.9 million of previously capitalized financing costs associated with the refinanced debt during the third quarter of 2005.
At September 30, 2005, we had $30.0 million in outstanding borrowings related to our $350 million senior secured revolving credit facility. Our senior secured credit agreement is secured by substantially all of our receivables and inventories of our wholly-owned subsidiaries and by pledges of all shares of capital stock and inter-company debt held by us and each wholly-owned subsidiary. The senior secured credit agreement contains financial covenants and other covenants that limit or restrict our ability to make capital expenditures; incur indebtedness; permit liens on our property; enter into transaction with affiliates; make restricted payments or investments; enter into mergers, acquisitions or consolidations; conduct asset sales; pay dividends or distributions and enter into other specified transactions and activities. Our ability to draw down the revolver is dependent upon our continued compliance with the financial covenants and other covenants contained in our senior secured credit agreement. We were in compliance with these covenants at September 30, 2005, and expect to remain in compliance during the next twelve months.
During the third quarter of 2005, our board of directors declared a cash dividend of $.10 (ten cents) per common share for shareholders of record at close of business on September 30, 2005. The cash dividend of $4.3 million was paid on October 14, 2005. On April 20, 2005, we announced the approval of our board of directors to increase the shares available for the company to repurchase from 5 million shares to 7.5 million shares pursuant to the 2004 share repurchase program. At September 30, 2005, we had repurchased the entire 7.5 million shares, of which 200,000 shares was purchased during the third quarter, pursuant to the program in the open market at an average price of $32 per share.
On October 18, 2005, we announced the execution of a definitive agreement of merger with Roanoke Electric Steel Corporation, pursuant to which we will acquire Roanoke. Pursuant to the merger agreement, Roanoke stockholders will receive a fixed consideration equal to .400 shares of our common stock plus $9.75 in cash for each share of Roanoke stock outstanding at the effective time of the merger. At July 31, 2005, Roanoke had 11,145,813 shares outstanding. We plan to use current cash reserves and our senior secured revolving credit facility to fund the cash portion of this acquisition. Completion of the merger is subject to Roanoke stockholder approvals, regulatory approvals, including antitrust, and the satisfaction or waiver of customary conditions. The definitive agreement of merger contains certain termination rights for both parties, including a provision for a termination fee of $7.5 million plus expenses to be paid to us if the transaction is terminated under certain circumstances.
Roanoke has steel manufacturing facilities in Roanoke, Virginia and Huntington, West Virginia. These facilities produce angles, rounds, flats, channels, beams, special sections and billets, which are sold to steel service centers, fabricators, original equipment manufacturers and other steel producers. Roanoke also has certain subsidiaries involved in steel fabrication including bar joist and truck trailer beams and has two steel scrap processing locations.
Our ability to meet our debt service obligations and reduce our total debt will depend upon our future performance, which in turn, will depend upon general economic, financial and business conditions, along with competition, legislation and regulation factors that are largely beyond our control. In addition, we cannot assure you that our operating results, cash flow and capital resources will be sufficient for repayment of our indebtedness in the future. We believe that based upon current levels of operations and anticipated growth, cash flow from operations, together with other available sources of funds, including additional borrowings under our senior secured credit agreement, will be adequate for the next two years for making required payments of principal and interest on our indebtedness and for funding anticipated capital expenditures and working capital requirements.
14
Back to Contents
Other Matters
Inflation. We believe that inflation has not had a material effect on our results of operations.
Environmental and Other Contingencies. We have incurred, and in the future will continue to incur, capital expenditures and operating expenses for matters relating to environmental control, remediation, monitoring and compliance. We believe, apart from our dependence on environmental construction and operating permits for our existing and proposed manufacturing facilities, that compliance with current environmental laws and regulations is not likely to have a material adverse effect on our financial condition, results of operations or liquidity; however, environmental laws and regulations are subject to change and we may become subject to more stringent environmental laws and regulations in the future.
ITEM 3. QUANTITATIVE AND QUALITATIVE DISCLOSURES ABOUT MARKET RISK
Market Risk. In the normal course of business we are exposed to interest rate changes. Our objectives in managing exposure to interest rate changes are to limit the impact of these rate changes on earnings and cash flows and to lower overall borrowing costs. To achieve these objectives, we primarily use interest rate swaps to manage net exposure to interest rate changes related to our borrowings. We generally maintain fixed rate debt as a percentage of our net debt between a minimum and maximum percentage. A portion of our debt has an interest component that resets on a periodic basis to reflect current market conditions. At September 30, 2005, no material changes had occurred related to our interest rate risk from the information disclosed in our Annual Report on Form 10-K for the year ended December 31, 2004.
Commodity Risk. In the normal course of business we are exposed to the market risk and price fluctuations related to the sale of steel products and to the purchase of commodities used in our production process, such as metallic raw materials, electricity, natural gas and alloys. Our risk strategy associated with product sales has generally been to obtain competitive prices for our products and to allow operating results to reflect market price movements dictated by supply and demand. Generally, our risk strategy associated with the purchase of commodities utilized within our production process is to make certain commitments with suppliers relating to future expected requirements for such commodities. Certain of these commitments contain provisions which require us to “take or pay” for specified quantities without regard to actual usage for periods of up to two years. We believe that our production requirements will be such that consumption of the products or services purchased under these commitments will occur in the normal production process. At September 30, 2005, no material changes had occurred related to these commodity risks from the information disclosed in our Annual Report on Form 10-K for the year ended
December 31, 2004.
ITEM 4. CONTROLS AND PROCEDURES
(a) Evaluation of Disclosure Controls and Procedures. An evaluation was performed under the supervision and with the participation of registrant’s management, including the chief executive officer and chief financial officer, of the effectiveness of the design and operation of registrant’s disclosure controls and procedures, as of the end of the period covered by this report. Based upon their evaluation, registrant’s principal executive officer and principal financial officer have concluded that registrant’s disclosure controls and procedures (as defined in Rules 13a-15(e) and 15d-15(e) under the Securities Exchange Act of 1934) were effective to ensure that information required to be disclosed by registrant in reports that it files or submits under the Exchange Act is recorded, processed, summarized and reported within the time periods specified in Securities and Exchange Commission rules and forms.
(b) Changes in Internal Controls. There have been no significant changes in registrant’s internal controls or in other factors that could significantly affect internal controls subsequent to their evaluation. There were no significant deficiencies or material weaknesses, and, therefore, there were no corrective actions taken.
15
Back to Contents
PART II
OTHER INFORMATION
ITEM 2. CHANGES IN SECURITIES, USE OF PROCEEDS AND ISSUER PURCHASES OF EQUITY SECURITIES
On April 20, 2005, our board of directors approved an increase in the shares authorized for repurchase pursuant to the 2004 share repurchase program from 5 million shares to 7.5 million shares. The following table indicates shares repurchased during the nine months ended September 30, 2005.
Period
2005 | | Total Shares
Purchased | | | | Average Price
Paid Per Share | | | Total Program
Shares Purchased | | | Total Shares Still
Available For Purchase
Under the Program | |
| |
| | |
|
| | |
| | |
| |
| January 1 to 26 | | 1,037,100 | | | $ | 35.46 | | | 1,037,100 | | | 4,875,167 | |
| February 1 | | 10,076 | | | | 37.80 | | | — | | | 4,875,167 | |
| March 16 to 30 | | 1,099,400 | | | | 35.97 | | | 1,099,400 | | | 3,775,767 | |
| April 1 to 29 | | 1,875,767 | | | | 31.40 | | | 1,875,767 | | | 1,900,000 | |
| May 2 to 25 | | 1,302,000 | | | | 26.41 | | | 1,302,000 | | | 598,000 | |
| June 20 to 27 | | 398,000 | | | | 26.21 | | | 398,000 | | | 200,000 | |
| July 19 to 26 | | 200,000 | | | | 31.70 | | | 200,000 | | | — | |
ITEM 6. EXHIBITS
| 31.1 | | Chief Executive Officer Certification pursuant to Section 302 of the Sarbanes-Oxley Act of 2002 |
| 31.2 | | Principal Financial Officer Certification pursuant to Section 302 of the Sarbanes-Oxley Act of 2002 |
| 32.1 | | Chief Executive Officer Certification pursuant to 18 U.S.C. Section 1350 |
| 32.2 | | Principal Financial Officer Certification pursuant to 18 U.S.C. Section 1350 |
_____________________________________________________________________________________________________________
Items 1 and 3 through 5 of Part II are not applicable for this reporting period and have been omitted.
* Filed concurrently herewith.
SIGNATURE
Pursuant to the requirements of Section 13 or 15(d) of Securities Exchange Act of 1934, Steel Dynamics, Inc. has duly caused this report to be signed on its behalf by the undersigned, thereunto duly authorized.
November 2, 2005
| | | STEEL DYNAMICS, INC. |
| | By: | /s/ Gary E. Heasley |
| | | Gary E. Heasley |
| | | Vice President of Finance and CFO |
| | | |
| | | |
16
 Quarterly Report Pursuant to Section 13 or 15(d) of the Securities Exchange Act of 1934