Semiannual Report
Economic and Market Overview
The U.S. economy, as measured by gross domestic product, grew modestly during the six-month period ended June 30, 2012, as personal income and spending rose. The national unemployment rate for June 2012 stood at 8.2%, compared with 8.5% at the start of the period.1 Job growth was more pronounced in the first quarter, and jobless claims touched a four-year low; however, hiring slowed in the second quarter. Industrial production and manufacturing activity expanded during most of the period under review, but the manufacturing sector shrank unexpectedly in June. In keeping with its goal to strengthen U.S. economic recovery by fostering increased employment while keeping inflation in check, during June the Federal Reserve Board (Fed) extended through 2012 its program (dubbed Operation Twist) to buy long-term Treasuries in an attempt to lower long-term yields. The Fed also reaffirmed its intention to keep the federal funds target rate low at least through late 2014.
Global growth trends generally moderated, led by Europe, which narrowly avoided recession mainly because of German export strength. Yet, even the more resilient economies of Germany and China showed signs of a slowdown at period-end. The combination of flagging growth, political uncertainty and populist unrest pressured investor confidence, and ratings agencies downgraded global banks and European sovereigns. Concerns about Italian and Spanish borrowing costs added to investor anxiety as bond yields climbed. Europe s initial policy responses including enhanced liquidity measures and an ineffective Spanish banking bailout did little to address the structural imbalances of eurozone economies or the solvency fears plaguing the region s banking system.
Global developed stock markets, as measured by the MSCI World Index, delivered the best annual start in more than a decade, as signs of U.S. economic recovery and European policy relief underpinned a rally in cyclical stocks. During late March and early April 2012, U.S. stocks, as measured by the Standard & Poor s® 500 Index, reached multi-year highs.2 However, stocks dropped sharply in late spring amid renewed global economic weakness and European debt concerns before additional policy action prompted a rebound in June. Politics largely drove the markets during the first half of 2012 as

Semiannual Report | 3
investors closely monitored developments in Europe, where German-led austerity demands were met with increasing resentment from some highly indebted eurozone members. Fears of a Greek debt default and exit from the eurozone were somewhat mitigated in February by secured bailout financing and bond-holder concessions, as well as May and June elections that resulted in the formation of a new coalition government. The Fed s Operation Twist purchases and risk-averse investors seeking safety drove U.S. Treasury yields to historical lows during the period. In the latter part of the period, the euro declined while the U.S. dollar and Japanese yen made gains.
At the end of the reporting period, significant challenges to the U.S. and global economies remained, including weak jobs reports, lack of broad public and political agreement on how to achieve U.S. deficit reduction, and uncertainty surrounding deeply indebted European countries including Greece, Italy and Spain. Although long-term resolution of European debt issues remained unclear, the European Central Bank s plan to allow the European Stability Mechanism to directly recapitalize troubled banks throughout the eurozone, as well as a late-June proposal leaning toward fiscal and banking union, supported cautious optimism in U.S. and global markets.
The foregoing information reflects our analysis and opinions as of June 30, 2012. The information is not a complete analysis of every aspect of any market, country, industry, security or fund. Statements of fact are from sources considered reliable.
4 | Semiannual Report
We allocate the Fund s assets among the broad asset classes, and when selecting equity funds, we consider the fund investments foreign and domestic exposure, market capitalization ranges and investment styles (growth versus value). When selecting fixed income funds, we focus primarily on maximizing income appropriate to the Fund s risk profile.
Manager s Discussion
The Fund s performance can be attributed to its allocation among equities, fixed income securities, and short-term investments and other net assets, and to the actual performance of the fund investments.
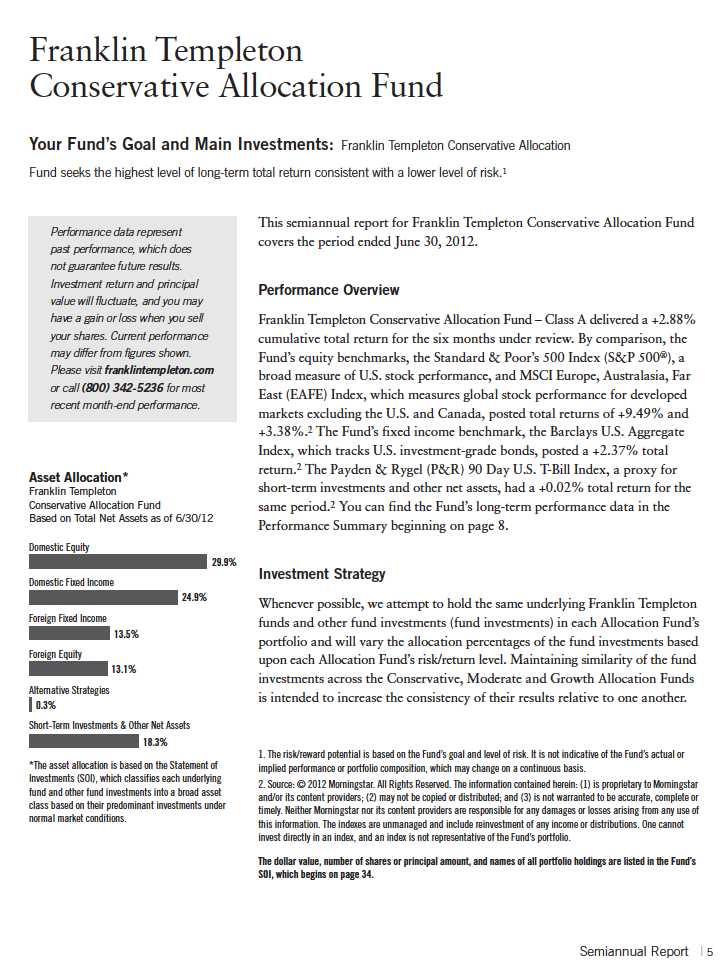
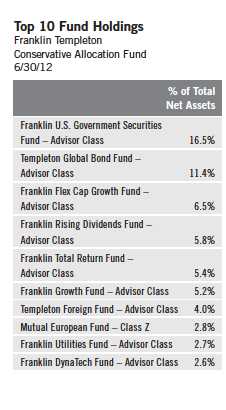
At period-end, Franklin Templeton Conservative Allocation Fund allocated 43.0% of total net assets to equity and 38.4% to fixed income. Domestic equity exposure was 69.5% of the total equity weighting, with the balance represented by foreign equity. The portfolio was diversified across capitalization sizes and investment styles, and on June 30, 2012, we held shares in large-, mid- and small-capitalization equity funds, representing both growth and value styles. Franklin Flex Cap Growth Fund Advisor Class, representing 6.5% of the Fund s total net assets, was our largest equity fund weighting at period-end. On the fixed income side, domestic exposure was 64.8% of the Fund s total income weighting, with the balance represented by foreign fixed income. Franklin U.S. Government Securities Fund Advisor Class was our largest fixed income fund weighting at 16.5% of total net assets.
During the six-month reporting period, our largest domestic growth fund holding, Franklin Flex Cap Growth Fund Advisor Class, and our largest domestic value fund holding, Franklin Rising Dividends Fund Advisor Class, under-performed the S&P 500. Our largest foreign equity fund holding, Templeton Foreign Fund Advisor Class, underperformed the MSCI EAFE Index. On the fixed income side, Franklin U.S. Government Securities Fund Advisor Class underperformed the Barclays U.S. Aggregate Index, while Templeton Global Bond Fund Advisor Class outperformed the index.
6 | Semiannual Report
Thank you for your continued participation in Franklin Templeton Conservative Allocation Fund. We look forward to serving your future investment needs.


T. Anthony Coffey, CFA Portfolio Manager
Franklin Templeton Conservative Allocation Fund
CFA® is a trademark owned by CFA Institute.
The foregoing information reflects our analysis, opinions and portfolio holdings as of June 30, 2012, the end of the reporting period. The way we implement our main investment strategies and the resulting portfolio holdings may change depending on factors such as market and economic conditions. These opinions may not be relied upon as investment advice or an offer for a particular security. The information is not a complete analysis of every aspect of any market, country, industry, security or the Fund. Statements of fact are from sources considered reliable, but the investment manager makes no representation or warranty as to their completeness or accuracy. Although historical performance is no guarantee of future results, these insights may help you understand our investment management philosophy.
Semiannual Report | 7
Performance Summary as of 6/30/12
Franklin Templeton Conservative Allocation Fund
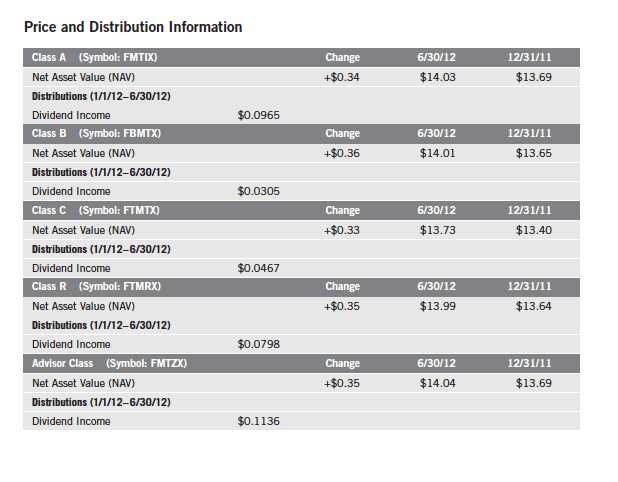
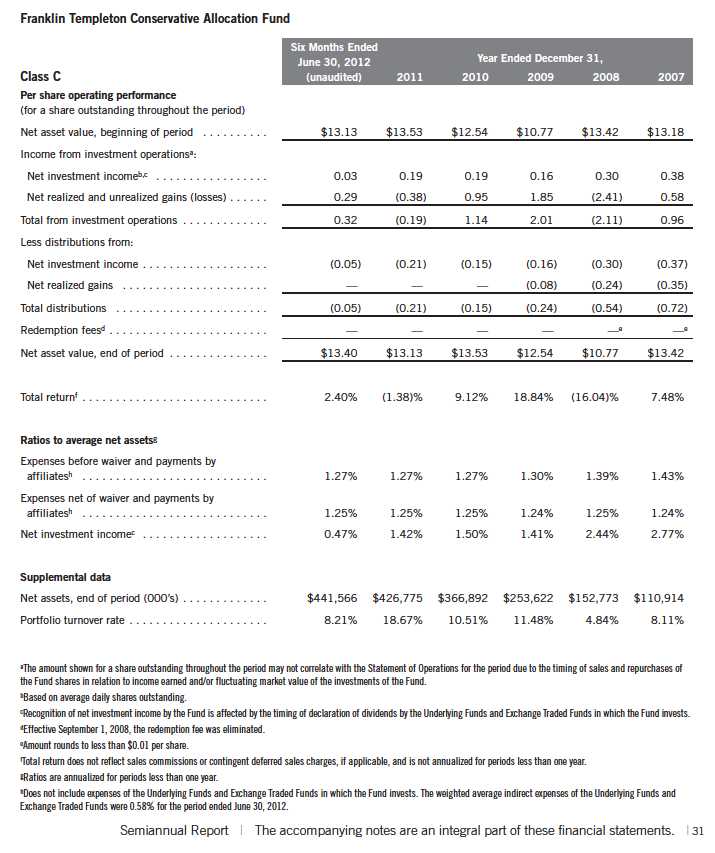
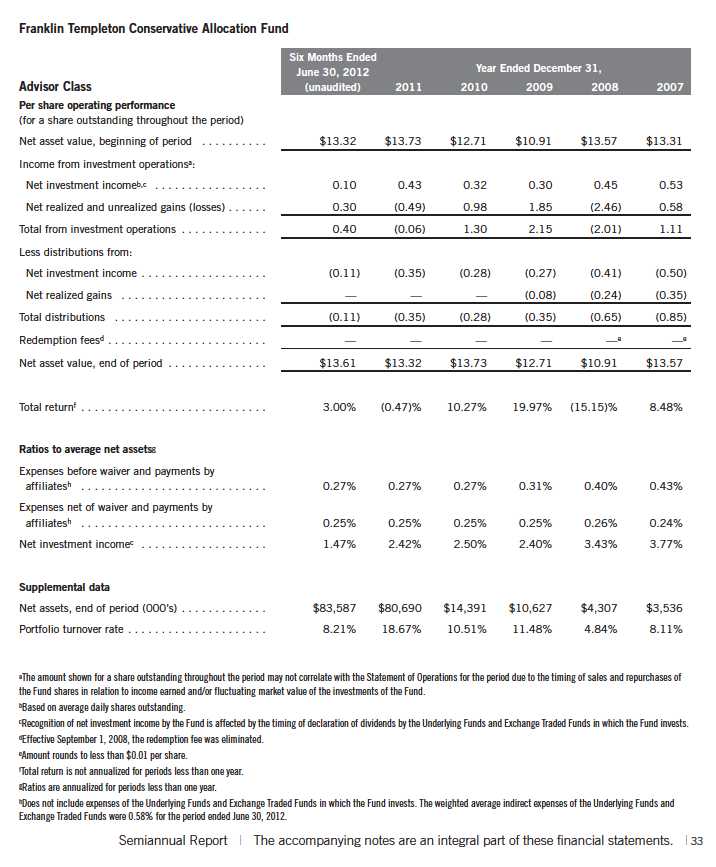
Your dividend income will vary depending on dividends or interest paid by securities in the Fund s portfolio, adjusted for operating expenses of each class. Capital gain distributions are net profits realized from the sale of portfolio securities. The performance table does not reflect any taxes that a shareholder would pay on Fund dividends, capital gain distributions, if any, or any realized gains on the sale of Fund shares. Total return reflects reinvestment of the Fund s dividends and capital gain distributions, if any, and any unrealized gains or losses.

8 | Semiannual Report
Performance Summary (continued)
Performance1
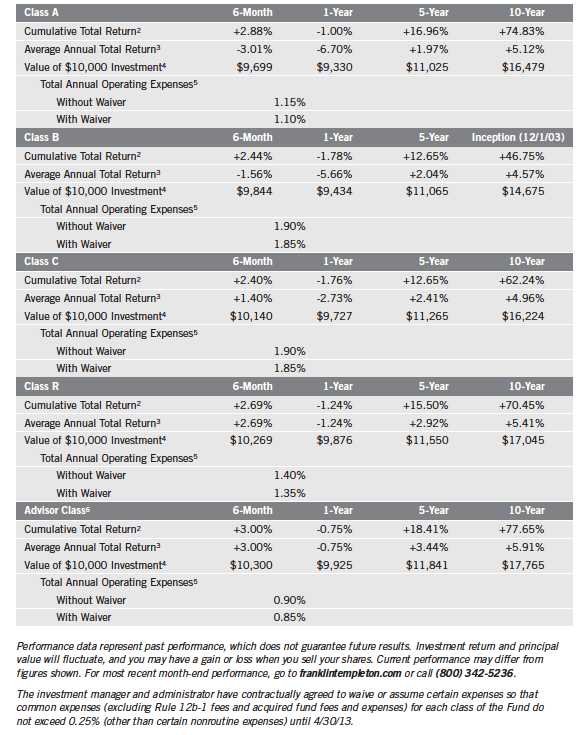
Cumulative total return excludes sales charges. Average annual total return and value of $10,000 investment include maximum sales charges. Class A: 5.75% maximum initial sales charge; Class B: contingent deferred sales charge (CDSC) declining from 4% to 1% over six years, and eliminated thereafter; Class C: 1% CDSC in first year only;
Class R/Advisor Class: no sales charges.
Semiannual Report | 9
Performance Summary (continued)
Endnotes
All investments involve risks, including possible loss of principal. Typically, the more aggressive the investment, or the greater the potential return, the more risk involved. Generally, investors should be comfortable with some fluctuation in the value of their investments, especially over the short term. Stock prices fluctuate, sometimes rapidly and dramatically, due to factors affecting individual companies, particular industries or sectors, or general market conditions. Bond prices generally move in the opposite direction of interest rates. Thus, as prices of bonds in a fund adjust to a rise in interest rates, that fund s share price may decline. Foreign investing carries additional risks such as currency and market volatility and political or social instability, risks that are heightened in developing countries. Because this Fund invests in underlying funds, which may engage in a variety of investment strategies involving certain risks, the Fund may be subject to those same risks. These risks are described in the Fund s prospectus. Investors should consult their financial advisor for help selecting the appropriate fund of funds, or fund combination, based on an evaluation of their investment objectives and risk tolerance. The Fund is actively managed but there is no guarantee that the manager s investment decisions will produce the desired results.
| |
Class B: Class C: | These shares have higher annual fees and expenses than Class A shares. Prior to 1/1/04, these shares were offered with an initial sales charge; thus actual total returns would have differed. These shares have higher annual fees and expenses than Class A shares. |
Class R: | Shares are available to certain eligible investors as described in the prospectus. These shares have higher annual fees and expenses than Class A shares. |
Advisor Class: | Shares are available to certain eligible investors as described in the prospectus. |
1. Fund investment results reflect the expense reduction, without which the results would have been lower. 2. Cumulative total return represents the change in value of an investment over the periods indicated.
3. Average annual total return represents the average annual change in value of an investment over the periods indicated. Six-month return has not been annualized.
4. These figures represent the value of a hypothetical $10,000 investment in the Fund over the periods indicated.
5. Figures are as stated in the Fund s prospectus current as of the date of this report and include the effect of acquired fund fees and expenses. In periods of market volatility, assets may decline significantly, causing total annual Fund operating expenses to become higher than the figures shown.
6. Effective 12/1/05, the Fund began offering Advisor Class shares, which do not have sales charges or a Rule 12b-1 plan. Performance quotations for this class reflect the following methods of calculation: (a) For periods prior to 12/1/05, a restated figure is used based upon the Fund s Class A performance, excluding the effect of Class A s maximum initial sales charge, but reflecting the effect of the Class A Rule 12b-1 fees; and (b) for periods after 12/1/05, actual Advisor Class performance is used reflecting all charges and fees applicable to that class. Since 12/1/05 (commencement of sales), the cumulative and average annual total returns of Advisor Class shares were +38.59% and +5.09%.
10 | Semiannual Report
Your Fund s Expenses
Franklin Templeton Conservative Allocation Fund
As a Fund shareholder, you can incur two types of costs:
- Transaction costs, including sales charges (loads) on Fund purchases; and
- Ongoing Fund costs, including management fees, distribution and service (12b-1) fees, and other Fund expenses. All mutual funds have ongoing costs, sometimes referred to as operating expenses.
The following table shows ongoing costs of investing in the Fund and can help you understand these costs and compare them with those of other mutual funds. The table assumes a $1,000 investment held for the six months indicated.
Actual Fund Expenses
The first line (Actual) for each share class listed in the table provides actual account values and expenses. The Ending Account Value is derived from the Fund s actual return, which includes the effect of Fund expenses.
You can estimate the expenses you paid during the period by following these steps. Of course, your account value and expenses will differ from those in this illustration:
| 1. | Divide your account value by $1,000. |
| | If an account had an $8,600 value, then $8,600 ÷ $1,000 = 8.6. |
| 2. | Multiply the result by the number under the heading Expenses Paid During Period. |
| | If Expenses Paid During Period were $7.50, then 8.6 x $7.50 = $64.50. |
In this illustration, the estimated expenses paid this period are $64.50.
Hypothetical Example for Comparison with Other Funds
Information in the second line (Hypothetical) for each class in the table can help you compare ongoing costs of investing in the Fund with those of other mutual funds. This information may not be used to estimate the actual ending account balance or expenses you paid during the period. The hypothetical Ending Account Value is based on the actual expense ratio for each class and an assumed 5% annual rate of return before expenses, which does not represent the Fund s actual return. The figure under the heading Expenses Paid During Period shows the hypothetical expenses your account would have incurred under this scenario. You can compare this figure with the 5% hypothetical examples that appear in shareholder reports of other funds.
Semiannual Report | 11
Your Fund s Expenses (continued)
Please note that expenses shown in the table are meant to highlight ongoing costs and do not reflect any transaction costs, such as sales charges. Therefore, the second line for each class is useful in comparing ongoing costs only, and will not help you compare total costs of owning different funds. In addition, if transaction costs were included, your total costs would have been higher. Please refer to the Fund prospectus for additional information on operating expenses.

*Expenses are calculated using the most recent six-month expense ratio excluding expenses of the fund investments, net of expense waivers, annualized for each class (A: 0.50%; B: 1.25%; C: 1.25%; R: 0.75%; and Advisor: 0.25%), multiplied by the average account value over the period, multiplied by 182/366 to reflect the one-half year period.
**Expenses are calculated using the most recent six-month expense ratio including expenses of the fund investments, net of expense waivers, annualized for each class (A:1.08%; B: 1.83%; C: 1.83%; R: 1.33%; and Advisor: 0.83%), multiplied by the average account value over the period, multiplied by 182/366 to reflect the one-half year period.
12 | Semiannual Report
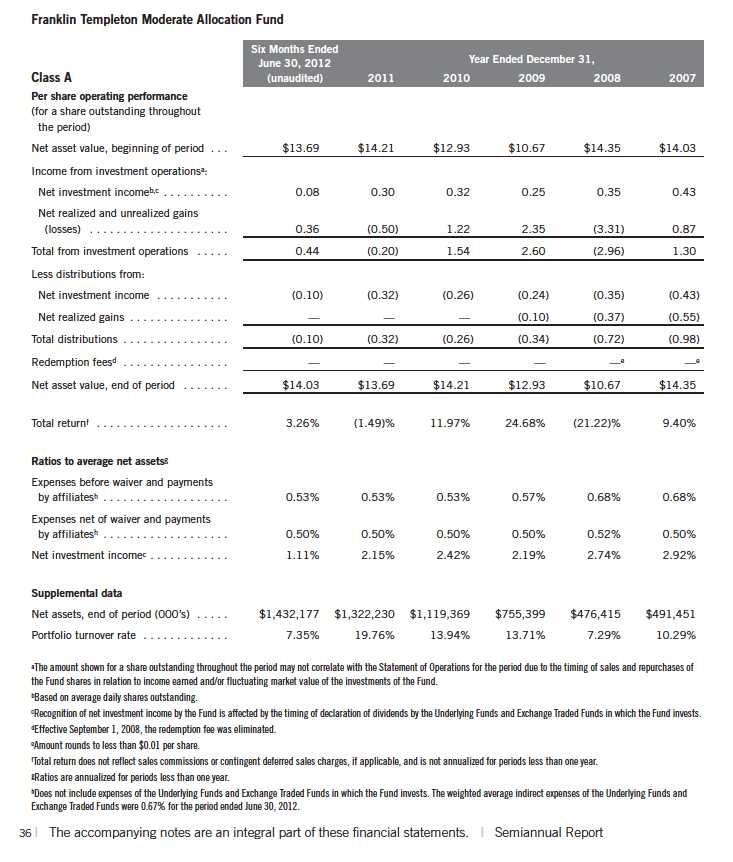
Franklin Templeton Moderate Allocation Fund
Your Fund s Goal and Main Investments: Franklin Templeton Moderate Allocation Fund
seeks the highest level of long-term total return consistent with a moderate level of risk.1

This semiannual report for Franklin Templeton Moderate Allocation Fund covers the period ended June 30, 2012.
Performance Overview
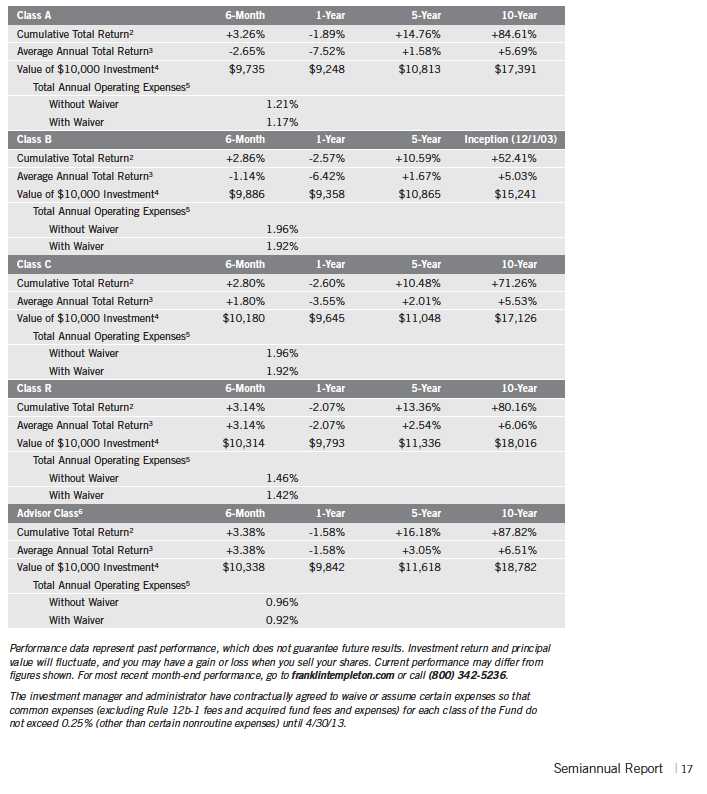
Franklin Templeton Moderate Allocation Fund Class A delivered a +3.26% cumulative total return for the six months under review. By comparison, the Fund s equity benchmarks, the Standard & Poor s 500 Index (S&P 500), a broad measure of U.S. stock performance, and MSCI Europe, Australasia, Far East (EAFE) Index, which measures global stock performance for developed markets excluding the U.S. and Canada, posted total returns of +9.49% and +3.38%.2 The Fund s fixed income benchmark, the Barclays U.S. Aggregate Index, which tracks U.S. investment-grade bonds, posted a +2.37% total return.2 The Payden & Rygel (P&R) 90 Day U.S. T-Bill Index, a proxy for short-term investments and other net assets, had a +0.02% total return for the same period.2 You can find the Fund s long-term performance data in the Performance Summary beginning on page 16.
Investment Strategy
Whenever possible, we attempt to hold the same underlying Franklin Templeton funds and other fund investments (fund investments) in each Allocation Fund s portfolio and will vary the allocation percentages of the fund investments based upon each Allocation Fund s risk/return level. Maintaining similarity of the fund investments across the Conservative, Moderate and Growth Allocation Funds is intended to increase the consistency of their results relative to one
1. The risk/reward potential is based on the Fund s goal and level of risk. It is not indicative of the Fund s actual or implied performance or portfolio composition, which may change on a continuous basis.
2. Source: © 2012 Morningstar. All Rights Reserved. The information contained herein: (1) is proprietary to Morningstar and/or its content providers; (2) may not be copied or distributed; and (3) is not warranted to be accurate, complete or timely. Neither Morningstar nor its content providers are responsible for any damages or losses arising from any use of this information. The indexes are unmanaged and include reinvestment of any income or distributions. One cannot invest directly in an index, and an index is not representative of the Fund s portfolio.
The dollar value, number of shares or principal amount, and names of all portfolio holdings are listed in the Fund s SOI, which begins on page 41.
Semiannual Report | 13
| | |
| Top 10 Fund Holdings Franklin Templeton Moderate Allocation Fund 6/30/12 % of Total Net Assets |
| | |
| Franklin U.S. Government Securities | | |
| Fund Advisor Class | 14.8 | % |
| Templeton Global Bond Fund | | |
| Advisor Class | 10.5 | % |
| Franklin Flex Cap Growth Fund | | |
| Advisor Class | 9.2 | % |
| Franklin Rising Dividends Fund | | |
| Advisor Class | 7.5 | % |
| Franklin Growth Fund Advisor Class | 6.6 | % |
| Templeton Foreign Fund Advisor Class | 5.2 | % |
| Franklin Total Return Fund | | |
| Advisor Class | 4.5 | % |
| Franklin Utilities Fund Advisor Class | 4.0 | % |
| Mutual European Fund Class Z | 3.9 | % |
| Franklin DynaTech Fund Advisor Class | 3.3 | % |
another. We allocate the Fund s assets among the broad asset classes, and when selecting equity funds, we consider the fund investments foreign and domestic exposure, market capitalization ranges and investment styles (growth versus value). When selecting fixed income funds, we focus primarily on maximizing income appropriate to the Fund s risk profile.
Manager s Discussion
The Fund s performance can be attributed to its allocation among equities, fixed income securities, and short-term investments and other net assets, and to the actual performance of the fund investments.
At period-end, Franklin Templeton Moderate Allocation Fund allocated 56.5% of total net assets to equity and 34.6% to fixed income. Domestic equity exposure was 69.7% of the total equity weighting, with the balance represented by foreign equity. The portfolio was diversified across capitalization sizes and investment styles, and on June 30, 2012, we held shares in large-, mid- and small-capitalization equity funds, representing both growth and value styles. Franklin Flex Cap Growth Fund Advisor Class, representing 9.2% of the Fund s total net assets, was our largest equity fund weighting at period-end. On the fixed income side, domestic exposure was 64.2% of the Fund s total income weighting, with the balance represented by foreign fixed income. Franklin U.S. Government Securities Fund Advisor Class was our largest fixed income fund weighting at 14.8% of total net assets.
During the six-month reporting period, our largest domestic growth fund holding, Franklin Flex Cap Growth Fund Advisor Class, and our largest domestic value fund holding, Franklin Rising Dividends Fund Advisor Class, under-performed the S&P 500. Our largest foreign equity fund holding, Templeton Foreign Fund Advisor Class, underperformed the MSCI EAFE Index. On the fixed income side, Franklin U.S. Government Securities Fund Advisor Class underperformed the Barclays U.S. Aggregate Index, while Templeton Global Bond Fund Advisor Class outperformed the index.
14 | Semiannual Report
Thank you for your continued participation in Franklin Templeton Moderate Allocation Fund. We look forward to serving your future investment needs.


T. Anthony Coffey, CFA Portfolio Manager
Franklin Templeton Moderate Allocation Fund
The foregoing information reflects our analysis, opinions and portfolio holdings as of June 30, 2012, the end of the reporting period. The way we implement our main investment strategies and the resulting portfolio holdings may change depending on factors such as market and economic conditions. These opinions may not be relied upon as investment advice or an offer for a particular security. The information is not a complete analysis of every aspect of any market, country, industry, security or the Fund. Statements of fact are from sources considered reliable, but the investment manager makes no representation or warranty as to their completeness or accuracy. Although historical performance is no guarantee of future results, these insights may help you understand our investment management philosophy.
Semiannual Report | 15
Performance Summary as of 6/30/12
Franklin Templeton Moderate Allocation Fund
Your dividend income will vary depending on dividends or interest paid by securities in the Fund s portfolio, adjusted for operating expenses of each class. Capital gain distributions are net profits realized from the sale of portfolio securities. The performance table does not reflect any taxes that a shareholder would pay on Fund dividends, capital gain distributions, if any, or any realized gains on the sale of Fund shares. Total return reflects reinvestment of the Fund s dividends and capital gain distributions, if any, and any unrealized gains or losses.
16 | Semiannual Report
Performance Summary (continued)
Performance1
Cumulative total return excludes sales charges. Average annual total return and value of $10,000 investment include maximum sales charges. Class A: 5.75% maximum initial sales charge; Class B: contingent deferred sales charge (CDSC) declining from 4% to 1% over six years, and eliminated thereafter; Class C: 1% CDSC in first year only;
Class R/Advisor Class: no sales charges.
Performance Summary (continued)
Endnotes
All investments involve risks, including possible loss of principal. Typically, the more aggressive the investment, or the greater the potential return, the more risk involved. Generally, investors should be comfortable with some fluctuation in the value of their investments, especially over the short term. Stock prices fluctuate, sometimes rapidly and dramatically, due to factors affecting individual companies, particular industries or sectors, or general market conditions. Bond prices generally move in the opposite direction of interest rates. Thus, as prices of bonds in a fund adjust to a rise in interest rates, that fund s share price may decline. Foreign investing carries additional risks such as currency and market volatility and political or social instability, risks that are heightened in developing countries. Because this Fund invests in underlying funds, which may engage in a variety of investment strategies involving certain risks, the Fund may be subject to those same risks. These risks are described in the Fund s prospectus. Investors should consult their financial advisor for help selecting the appropriate fund of funds, or fund combination, based on an evaluation of their investment objectives and risk tolerance. The Fund is actively managed but there is no guarantee that the manager s investment decisions will produce the desired results.
| |
Class B: Class C: | These shares have higher annual fees and expenses than Class A shares. Prior to 1/1/04, these shares were offered with an initial sales charge; thus actual total returns would have differed. These shares have higher annual fees and expenses than Class A shares. |
Class R: | Shares are available to certain eligible investors as described in the prospectus. These shares have higher annual fees and expenses than Class A shares. |
Advisor Class: | Shares are available to certain eligible investors as described in the prospectus. |
1. Fund investment results reflect the expense reduction, without which the results would have been lower. 2. Cumulative total return represents the change in value of an investment over the periods indicated.
3. Average annual total return represents the average annual change in value of an investment over the periods indicated. Six-month return has not been annualized.
4. These figures represent the value of a hypothetical $10,000 investment in the Fund over the periods indicated.
5. Figures are as stated in the Fund s prospectus current as of the date of this report and include the effect of acquired fund fees and expenses. In periods of market volatility, assets may decline significantly, causing total annual Fund operating expenses to become higher than the figures shown.
6. Effective 12/1/05, the Fund began offering Advisor Class shares, which do not have sales charges or a Rule 12b-1 plan. Performance quotations for this class reflect the following methods of calculation: (a) For periods prior to 12/1/05, a restated figure is used based upon the Fund s Class A performance, excluding the effect of Class A s maximum initial sales charge, but reflecting the effect of the Class A Rule 12b-1 fees; and (b) for periods after 12/1/05, actual Advisor Class performance is used reflecting all charges and fees applicable to that class. Since 12/1/05 (commencement of sales), the cumulative and average annual total returns of Advisor Class shares were +39.78% and +5.22%.
18 | Semiannual Report
Your Fund s Expenses
Franklin Templeton Moderate Allocation Fund
As a Fund shareholder, you can incur two types of costs:
- Transaction costs, including sales charges (loads) on Fund purchases; and
- Ongoing Fund costs, including management fees, distribution and service (12b-1) fees, and other Fund expenses. All mutual funds have ongoing costs, sometimes referred to as operating expenses.
The following table shows ongoing costs of investing in the Fund and can help you understand these costs and compare them with those of other mutual funds. The table assumes a $1,000 investment held for the six months indicated.
Actual Fund Expenses
The first line (Actual) for each share class listed in the table provides actual account values and expenses. The Ending Account Value is derived from the Fund s actual return, which includes the effect of Fund expenses.
You can estimate the expenses you paid during the period by following these steps. Of course, your account value and expenses will differ from those in this illustration:
| 1. | Divide your account value by $1,000. |
| | If an account had an $8,600 value, then $8,600 ÷ $1,000 = 8.6. |
| 2. | Multiply the result by the number under the heading Expenses Paid During Period. |
| | If Expenses Paid During Period were $7.50, then 8.6 x $7.50 = $64.50. |
In this illustration, the estimated expenses paid this period are $64.50.
Hypothetical Example for Comparison with Other Funds
Information in the second line (Hypothetical) for each class in the table can help you compare ongoing costs of investing in the Fund with those of other mutual funds. This information may not be used to estimate the actual ending account balance or expenses you paid during the period. The hypothetical Ending Account Value is based on the actual expense ratio for each class and an assumed 5% annual rate of return before expenses, which does not represent the Fund s actual return. The figure under the heading Expenses Paid During Period shows the hypothetical expenses your account would have incurred under this scenario. You can compare this figure with the 5% hypothetical examples that appear in shareholder reports of other funds.
Semiannual Report | 19
Your Fund s Expenses (continued)
Please note that expenses shown in the table are meant to highlight ongoing costs and do not reflect any transaction costs, such as sales charges. Therefore, the second line for each class is useful in comparing ongoing costs only, and will not help you compare total costs of owning different funds. In addition, if transaction costs were included, your total costs would have been higher. Please refer to the Fund prospectus for additional information on operating expenses.

20 | Semiannual Report
Franklin Templeton Growth Allocation Fund
Your Fund s Goal and Main Investments: Franklin Templeton Growth Allocation Fund
seeks the highest level of long-term total return consistent with a higher level of risk.1

This semiannual report for Franklin Templeton Growth Allocation Fund covers the period ended June 30, 2012.
Performance Overview
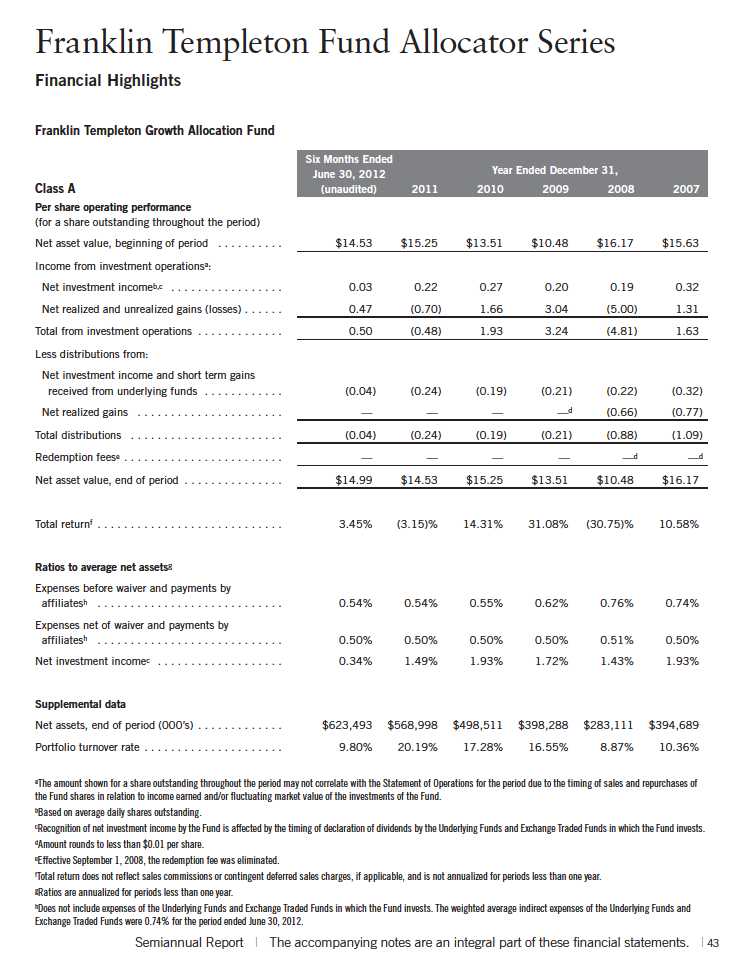
Franklin Templeton Growth Allocation Fund Class A delivered a +3.45% cumulative total return for the six months under review. By comparison, the Fund s equity benchmarks, the Standard & Poor s 500 Index (S&P 500), a broad measure of U.S. stock performance, and MSCI Europe, Australasia, Far East (EAFE) Index, which measures global stock performance for developed markets excluding the U.S. and Canada, posted total returns of +9.49% and +3.38%.2 The Fund s fixed income benchmark, the Barclays U.S. Aggregate Index, which tracks U.S. investment-grade bonds, posted a +2.37% total return.2 The Payden & Rygel (P&R) 90 Day U.S. T-Bill Index, a proxy for short-term investments and other net assets, had a +0.02% total return for the same period.2 You can find the Fund s long-term performance data in the Performance Summary beginning on page 24.
Investment Strategy
Whenever possible, we attempt to hold the same underlying Franklin Templeton funds and other fund investments (fund investments) in each Allocation Fund s portfolio and will vary the allocation percentages of the fund investments based upon each Allocation Fund s risk/return level. Maintaining similarity of the fund investments across the Conservative, Moderate and Growth Allocation Funds is intended to increase the consistency of their results relative to one another. We allocate the Fund s assets among the broad asset classes, and when
1. The risk/reward potential is based on the Fund s goal and level of risk. It is not indicative of the Fund s actual or implied performance or portfolio composition, which may change on a continuous basis.
2. Source: © 2012 Morningstar. All Rights Reserved. The information contained herein: (1) is proprietary to Morningstar and/or its content providers; (2) may not be copied or distributed; and (3) is not warranted to be accurate, complete or timely. Neither Morningstar nor its content providers are responsible for any damages or losses arising from any use of this information. The indexes are unmanaged and include reinvestment of any income or distributions. One cannot invest directly in an index, and an index is not representative of the Fund s portfolio.
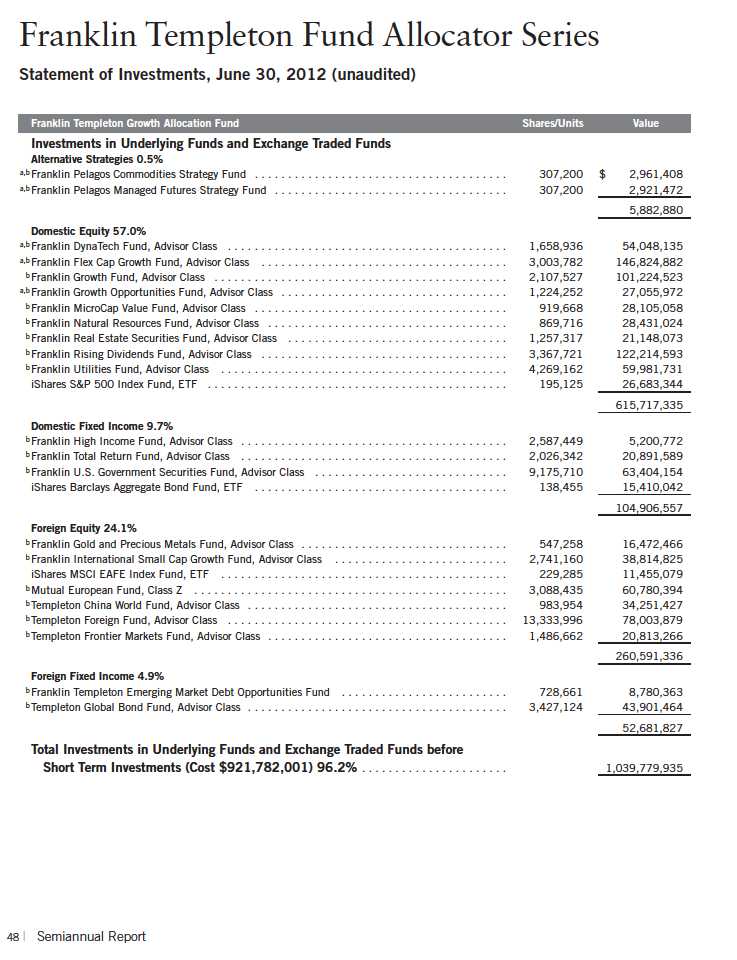
The dollar value, number of shares or principal amount, and names of all portfolio holdings are listed in the Fund s SOI, which begins on page 48.
Semiannual Report | 21
selecting equity funds, we consider the fund investments foreign and domestic exposure, market capitalization ranges and investment styles (growth versus value). When selecting fixed income funds, we focus primarily on maximizing income appropriate to the Fund s risk profile.
Manager s Discussion
The Fund s performance can be attributed to its allocation among equities, fixed income securities, and short-term investments and other net assets, and to the actual performance of the fund investments.
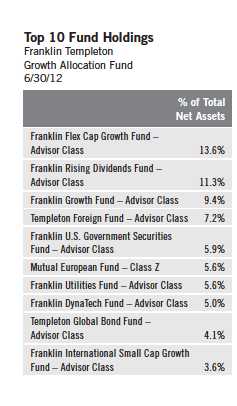
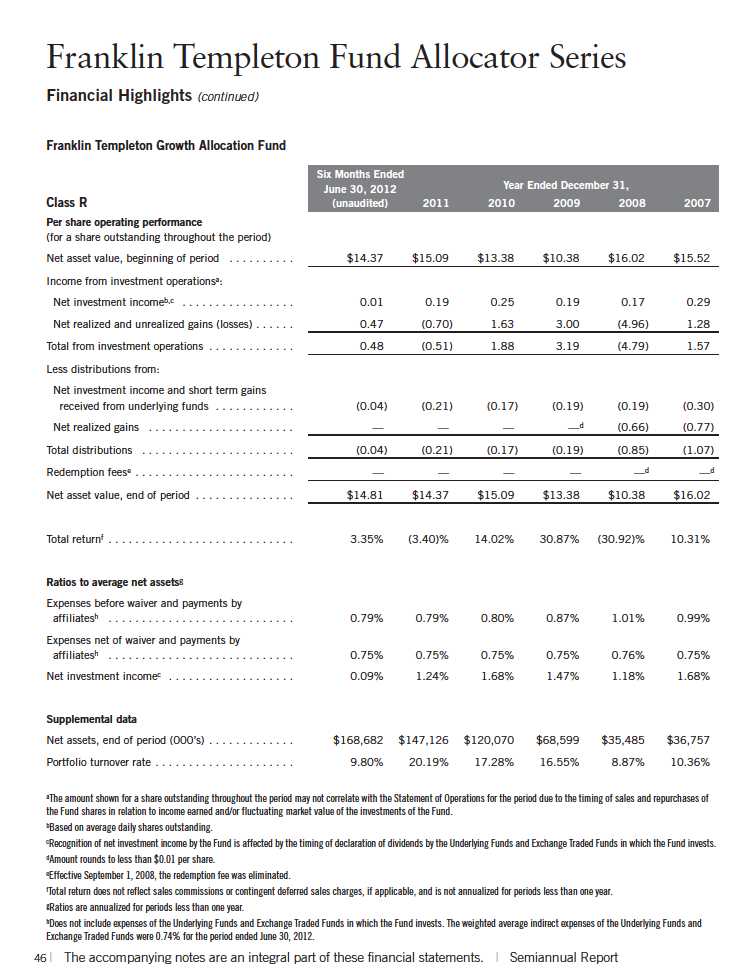
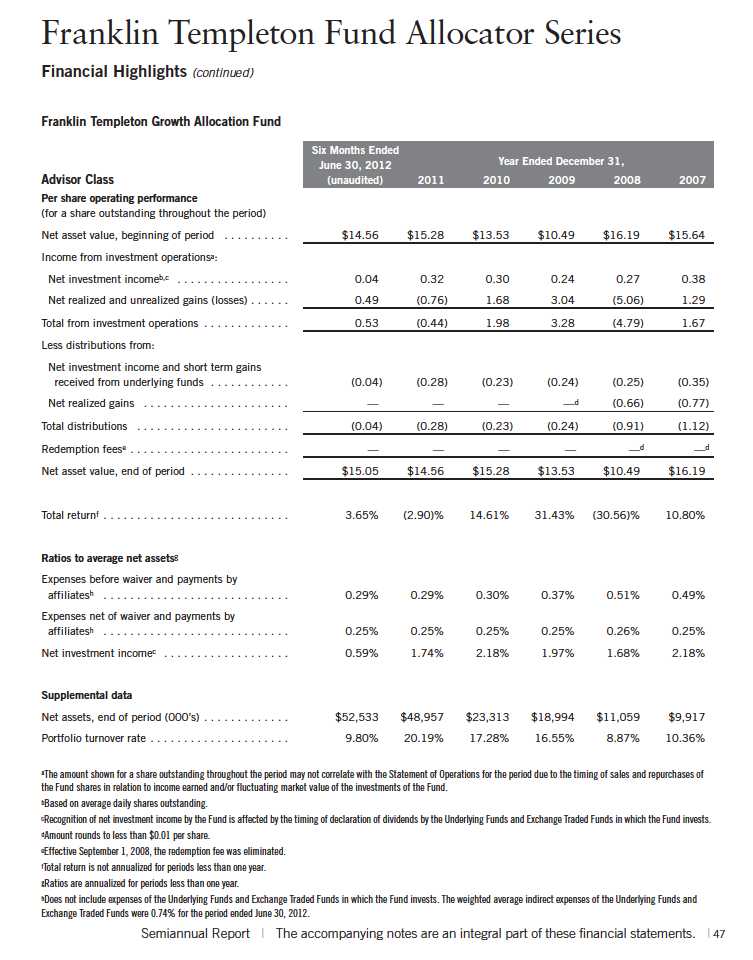
At period-end, Franklin Templeton Growth Allocation Fund allocated 81.1% of total net assets to equity and 14.6% to fixed income. Domestic equity exposure was 70.3% of the total equity weighting, with the balance represented by foreign equity. The portfolio was diversified across capitalization sizes and investment styles, and on June 30, 2012, we held shares in large-, mid- and small-capitalization equity funds, representing both growth and value styles. Franklin Flex Cap Growth Fund Advisor Class, representing 13.6% of the Fund s total net assets, was our largest equity fund weighting at period-end. On the fixed income side, domestic exposure was 66.4% of the Fund s total income weighting, with the balance represented by foreign fixed income. Franklin U.S. Government Securities Fund Advisor Class was our largest fixed income fund weighting at 5.9% of total net assets.
During the six-month reporting period, our largest domestic growth fund holding, Franklin Flex Cap Growth Fund Advisor Class, and our largest domestic value fund holding, Franklin Rising Dividends Fund Advisor Class, under-performed the S&P 500. Our largest foreign equity fund holding, Templeton Foreign Fund Advisor Class, underperformed the MSCI EAFE Index. On the fixed income side, Franklin U.S. Government Securities Fund Advisor Class underperformed the Barclays U.S. Aggregate Index, while Templeton Global Bond Fund Advisor Class outperformed the index.
22 | Semiannual Report
Thank you for your continued participation in Franklin Templeton Growth Allocation Fund. We look forward to serving your future investment needs.


T. Anthony Coffey, CFA Portfolio Manager
Franklin Templeton Growth Allocation Fund
The foregoing information reflects our analysis, opinions and portfolio holdings as of June 30, 2012, the end of the reporting period. The way we implement our main investment strategies and the resulting portfolio holdings may change depending on factors such as market and economic conditions. These opinions may not be relied upon as investment advice or an offer for a particular security. The information is not a complete analysis of every aspect of any market, country, industry, security or the Fund. Statements of fact are from sources considered reliable, but the investment manager makes no representation or warranty as to their completeness or accuracy. Although historical performance is no guarantee of future results, these insights may help you understand our investment management philosophy.
Semiannual Report | 23
Performance Summary as of 6/30/12
Franklin Templeton Growth Allocation Fund
Your dividend income will vary depending on dividends or interest paid by securities in the Fund s portfolio, adjusted for operating expenses of each class. Capital gain distributions are net profits realized from the sale of portfolio securities. The performance table does not reflect any taxes that a shareholder would pay on Fund dividends, capital gain distributions, if any, or any realized gains on the sale of Fund shares. Total return reflects reinvestment of the Fund s dividends and capital gain distributions, if any, and any unrealized gains or losses.
24 | Semiannual Report
Performance Summary (continued)
Performance1
Cumulative total return excludes sales charges. Average annual total return and value of $10,000 investment include maximum sales charges. Class A: 5.75% maximum initial sales charge; Class B: contingent deferred sales charge (CDSC) declining from 4% to 1% over six years, and eliminated thereafter; Class C: 1% CDSC in first year only;
Class R/Advisor Class: no sales charges.

Semiannual Report | 25
Performance Summary (continued)
Endnotes
All investments involve risks, including possible loss of principal. Typically, the more aggressive the investment, or the greater the potential
return, the more risk involved. Generally, investors should be comfortable with some fluctuation in the value of their investments, especially
over the short term. Stock prices fluctuate, sometimes rapidly and dramatically, due to factors affecting individual companies, particular
industries or sectors, or general market conditions. Bond prices generally move in the opposite direction of interest rates. Thus, as prices of
bonds in a fund adjust to a rise in interest rates, that fund s share price may decline. Foreign investing carries additional risks such as cur-
rency and market volatility and political or social instability, risks that are heightened in developing countries. Because this Fund invests in
underlying funds, which may engage in a variety of investment strategies involving certain risks, the Fund may be subject to those same risks.
These risks are described in the Fund s prospectus. Investors should consult their financial advisor for help selecting the appropriate fund of
funds, or fund combination, based on an evaluation of their investment objectives and risk tolerance. The Fund is actively managed but there
is no guarantee that the manager s investment decisions will produce the desired results.
Class B: These shares have higher annual fees and expenses than Class A shares.
Class C: Prior to 1/1/04, these shares were offered with an initial sales charge; thus actual total returns would have differed. These shares
have higher annual fees and expenses than Class A shares.
Class R: Shares are available to certain eligible investors as described in the prospectus. These shares have higher annual fees and
expenses than Class A shares.
Advisor Class: Shares are available to certain eligible investors as described in the prospectus.
1. Fund investment results reflect the expense reduction, without which the results would have been lower.
2. Cumulative total return represents the change in value of an investment over the periods indicated.
3. Average annual total return represents the average annual change in value of an investment over the periods indicated. Six-month return has not
been annualized.
4. These figures represent the value of a hypothetical $10,000 investment in the Fund over the periods indicated.
5. Figures are as stated in the Fund s prospectus current as of the date of this report and include the effect of acquired fund fees and expenses. In
periods of market volatility, assets may decline significantly, causing total annual Fund operating expenses to become higher than the figures
shown.
6. Effective 12/1/05, the Fund began offering Advisor Class shares, which do not have sales charges or a Rule 12b-1 plan. Performance quotations
for this class reflect the following methods of calculation: (a) For periods prior to 12/1/05, a restated figure is used based upon the Fund s Class A
performance, excluding the effect of Class A s maximum initial sales charge, but reflecting the effect of the Class A Rule 12b-1 fees; and (b) for periods
after 12/1/05, actual Advisor Class performance is used reflecting all charges and fees applicable to that class. Since 12/1/05 (commencement of
sales), the cumulative and average annual total returns of Advisor Class shares were +33.98% and +4.55%.
26 | Semiannual Report
Your Fund s Expenses
Franklin Templeton Growth Allocation Fund
As a Fund shareholder, you can incur two types of costs:
- Transaction costs, including sales charges (loads) on Fund purchases; and
- Ongoing Fund costs, including management fees, distribution and service (12b-1) fees, and other Fund expenses. All mutual funds have ongoing costs, sometimes referred to as operating expenses.
The following table shows ongoing costs of investing in the Fund and can help you understand these costs and compare them with those of other mutual funds. The table assumes a $1,000 investment held for the six months indicated.
Actual Fund Expenses
The first line (Actual) for each share class listed in the table provides actual account values and expenses. The Ending Account Value is derived from the Fund s actual return, which includes the effect of Fund expenses.
You can estimate the expenses you paid during the period by following these steps. Of course, your account value and expenses will differ from those in this illustration:
| 1. | Divide your account value by $1,000. |
| | If an account had an $8,600 value, then $8,600 ÷ $1,000 = 8.6. |
| 2. | Multiply the result by the number under the heading Expenses Paid During Period. |
| | If Expenses Paid During Period were $7.50, then 8.6 x $7.50 = $64.50. |
In this illustration, the estimated expenses paid this period are $64.50.
Hypothetical Example for Comparison with Other Funds
Information in the second line (Hypothetical) for each class in the table can help you compare ongoing costs of investing in the Fund with those of other mutual funds. This information may not be used to estimate the actual ending account balance or expenses you paid during the period. The hypothetical Ending Account Value is based on the actual expense ratio for each class and an assumed 5% annual rate of return before expenses, which does not represent the Fund s actual return. The figure under the heading Expenses Paid During Period shows the hypothetical expenses your account would have incurred under this scenario. You can compare this figure with the 5% hypothetical examples that appear in shareholder reports of other funds.
Semiannual Report | 27
Your Fund s Expenses (continued)
Please note that expenses shown in the table are meant to highlight ongoing costs and do not reflect any transaction costs, such as sales charges. Therefore, the second line for each class is useful in comparing ongoing costs only, and will not help you compare total costs of owning different funds. In addition, if transaction costs were included, your total costs would have been higher. Please refer to the Fund prospectus for additional information on operating expenses.

*Expenses are calculated using the most recent six-month expense ratio excluding expenses of the fund investments, net of expense waivers,
annualized for each class (A: 0.50%; B: 1.24%; C: 1.25%; R: 0.75%; and Advisor: 0.25%), multiplied by the average account value over the period,
multiplied by 182/366 to reflect the one-half year period.
**Expenses are calculated using the most recent six-month expense ratio including expenses of the fund investments, net of expense waivers,
annualized for each class (A: 1.24%; B: 1.98%; C: 1.99%; R: 1.49%; and Advisor: 0.99%), multiplied by the average account value over the period,
multiplied by 182/366 to reflect the one-half year period.
28 | Semiannual Report
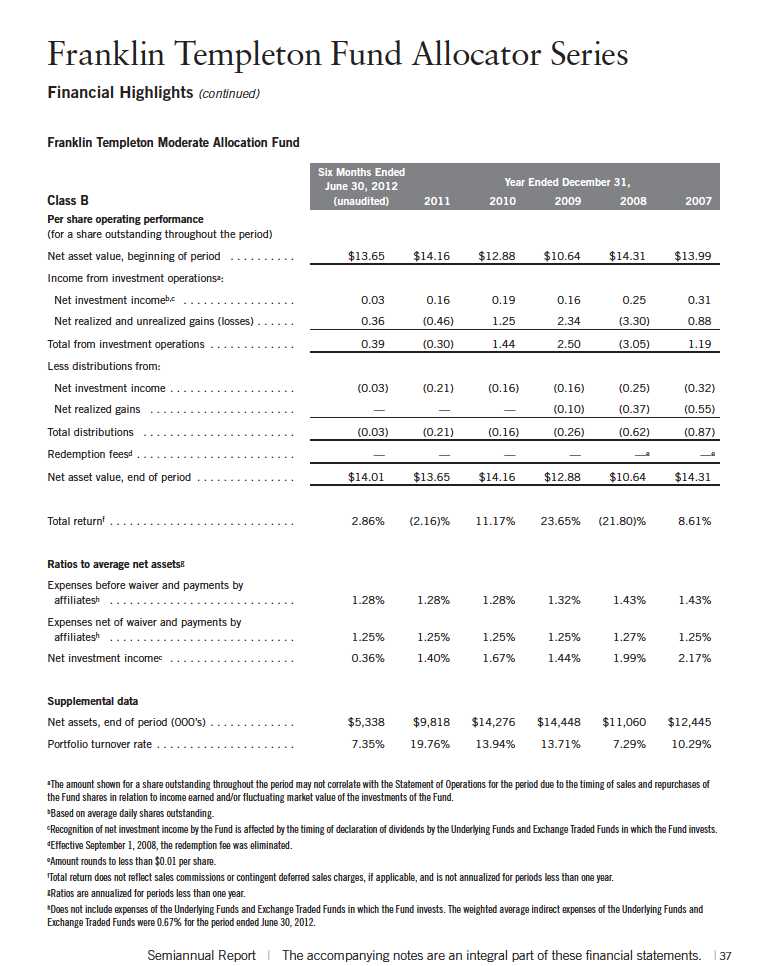
Franklin Templeton Fund Allocator Series
Financial Highlights

Franklin Templeton Fund Allocator Series
Financial Highlights (continued)
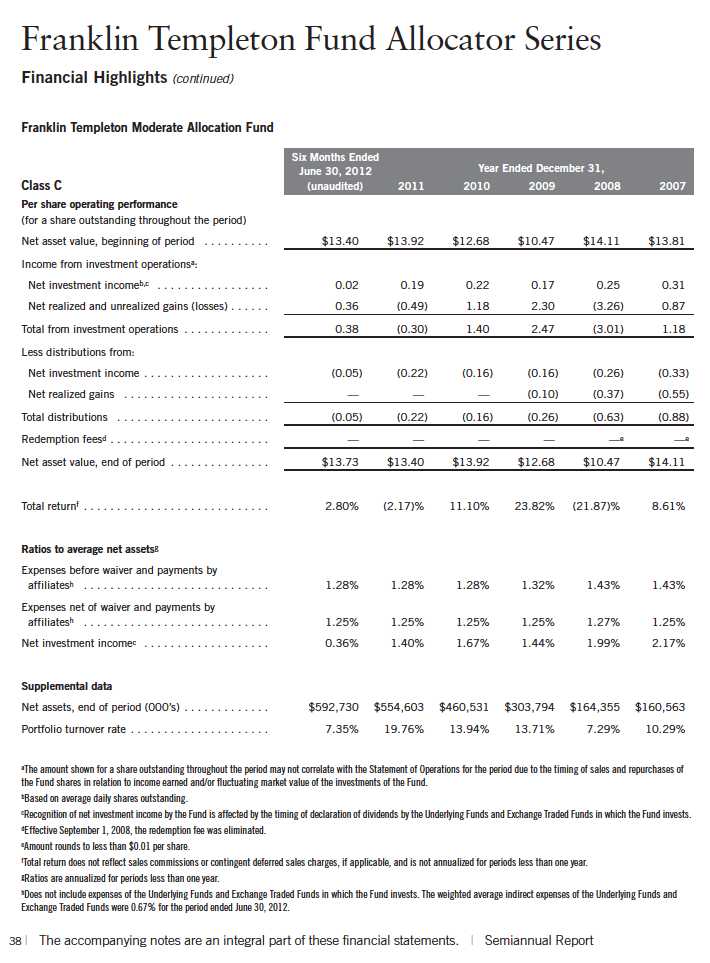
Franklin Templeton Fund Allocator Series
Financial Highlights (continued)
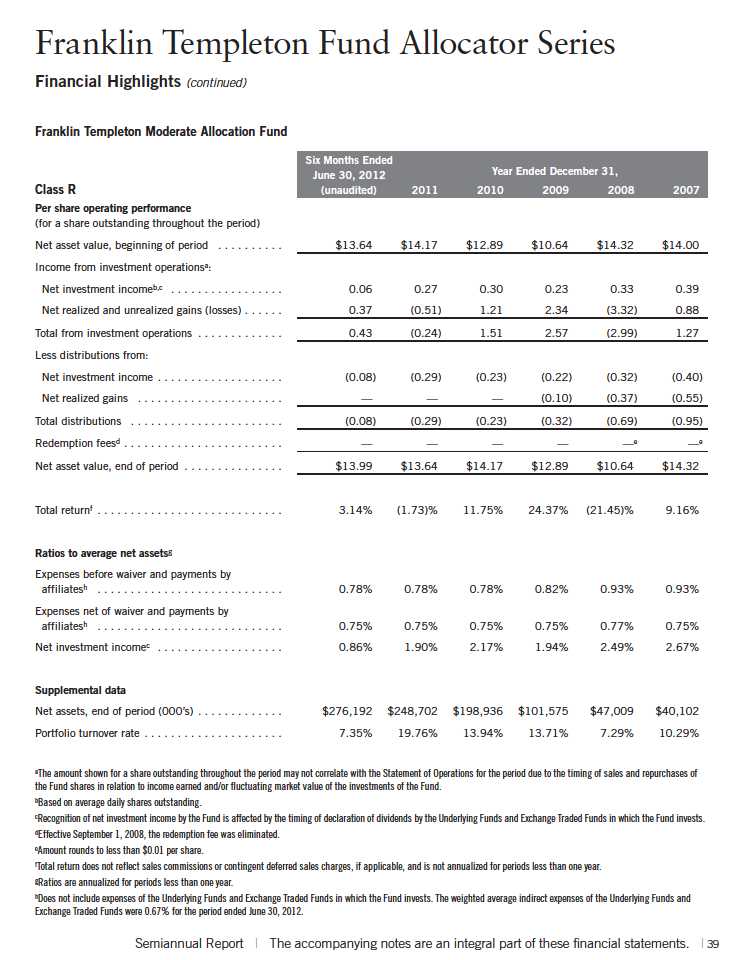
Franklin Templeton Fund Allocator Series
Financial Highlights (continued)

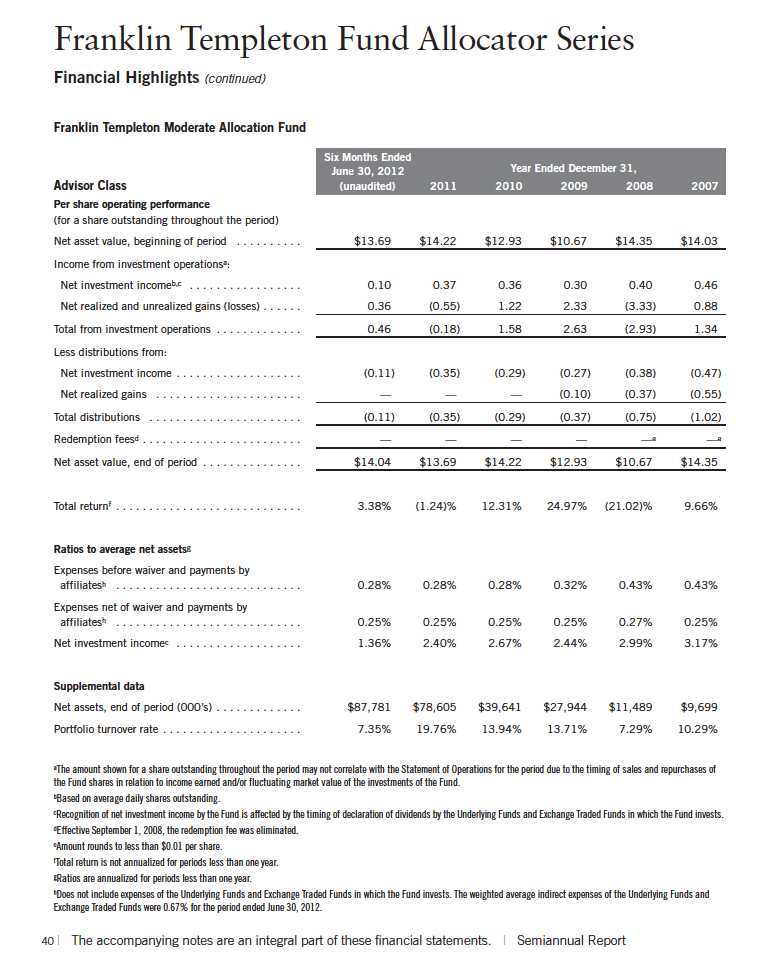
Franklin Templeton Fund Allocator Series
Financial Highlights (continued)
Franklin Templeton Fund Allocator Series
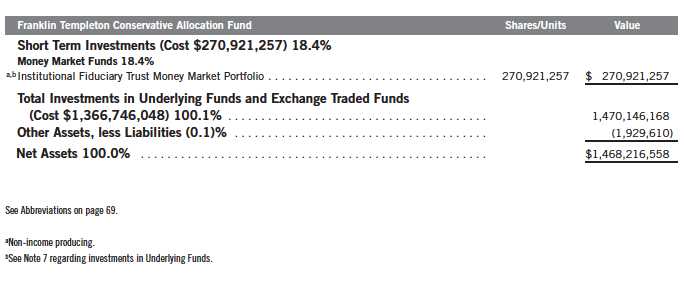
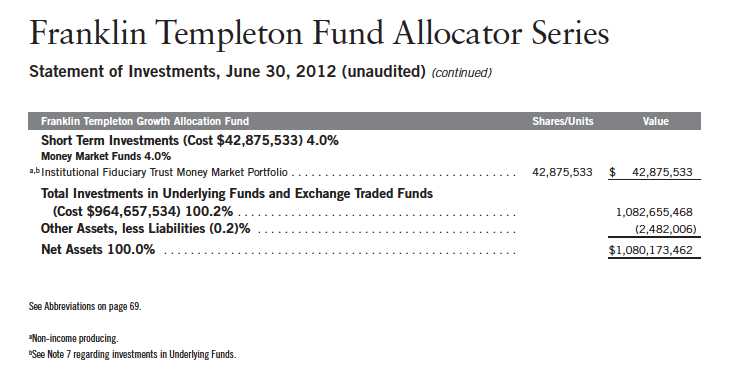
Statement of Investments, June 30, 2012 (unaudited)

Franklin Templeton Fund Allocator Series
Statement of Investments, June 30, 2012 (unaudited) (continued)
Semiannual Report | The accompanying notes are an integral part of these financial statements. | 35
Franklin Templeton Fund Allocator Series
Financial Highlights

42 | The accompanying notes are an integral part of these financial statements. | Semiannual Report
Semiannual Report | The accompanying notes are an integral part of these financial statements. | 49
Franklin Templeton Fund Allocator Series
Financial Statements
Statements of Assets and Liabilities
June 30, 2012 (unaudited)

50 | The accompanying notes are an integral part of these financial statements. | Semiannual Report
Franklin Templeton Fund Allocator Series
Financial Statements (continued)
Statements of Assets and Liabilities (continued)
June 30, 2012 (unaudited)

Semiannual Report | The accompanying notes are an integral part of these financial statements. | 51
Franklin Templeton Fund Allocator Series
Financial Statements (continued)
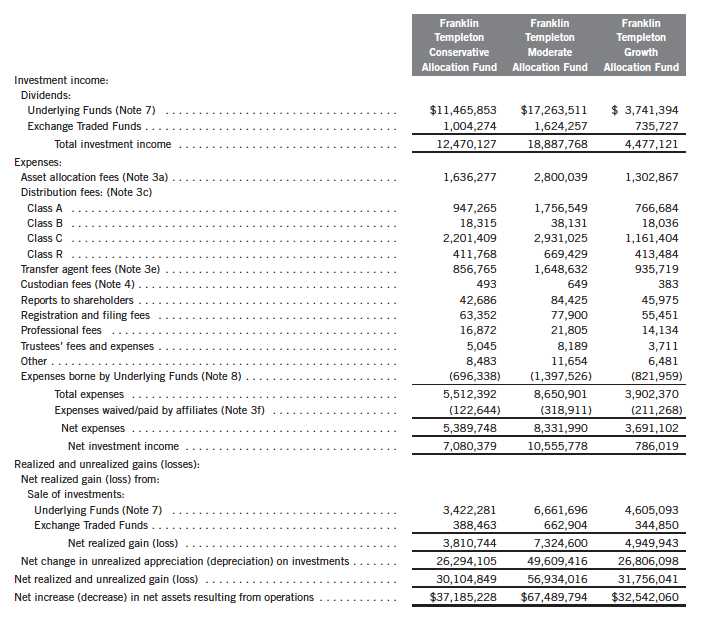
Statements of Operations for the six months ended June 30, 2012 (unaudited)
52 | The accompanying notes are an integral part of these financial statements. | Semiannual Report
Franklin Templeton Fund Allocator Series
Financial Statements (continued)

Semiannual Report | The accompanying notes are an integral part of these financial statements. | 53
Franklin Templeton Fund Allocator Series
Financial Statements (continued)
54 | The accompanying notes are an integral part of these financial statements. | Semiannual Report
Franklin Templeton Fund Allocator Series
Notes to Financial Statements (unaudited)
1. ORGANIZATION AND SIGNIFICANT ACCOUNTING POLICIES
Franklin Templeton Fund Allocator Series (Trust) is registered under the Investment Company Act of 1940, as amended, (1940 Act) as an open-end investment company, consisting of ten separate funds, three of which are included in this report (Funds). The financial statements of the remaining funds in the Trust are presented separately. The Funds invest primarily in Franklin Templeton mutual funds (Underlying Funds). The Funds offer five classes of shares: Class A, Class B, Class C, Class R, and Advisor Class. Each class of shares differs by its initial sales load, contingent deferred sales charges, distribution fees, voting rights on matters affecting a single class and its exchange privilege.
The following summarizes the Funds significant accounting policies.
a. Financial Instrument Valuation
The Funds investments in financial instruments are carried at fair value daily. Fair value is the price that would be received to sell an asset or paid to transfer a liability in an orderly transaction between market participants on the measurement date. Under procedures approved by the Trust s Board of Trustees (the Board), the Funds administrator, investment manager and other affiliates have formed the Valuation and Liquidity Oversight Committee (VLOC). The VLOC provides administration and oversight of the Funds valuation policies and procedures, which are approved annually by the Board. Investments in the Underlying Funds are valued at their closing net asset value each trading day. Exchange Traded Funds (ETFs) listed on an exchange or on the NASDAQ National Market System are valued at the last quoted sale price or the official closing price of the day, respectively.
b. Income Taxes
It is each fund s policy to qualify as a regulated investment company under the Internal Revenue Code. Each fund intends to distribute to shareholders substantially all of its taxable income and net realized gains to relieve it from federal income and excise taxes. As a result, no provision for U.S. federal income taxes is required.
Each fund recognizes the tax benefits of uncertain tax positions only when the position is more likely than not to be sustained upon examination by the tax authorities based on the technical merits of the tax position. As of June 30, 2012, and for all open tax years, each fund has determined that no liability for unrecognized tax benefits is required in each fund s financial statements related to uncertain tax positions taken on a tax return (or expected to be taken on future tax returns). Open tax years are those that remain subject to examination and are based on each tax jurisdiction statute of limitation.
Semiannual Report | 55
Franklin Templeton Fund Allocator Series
Notes to Financial Statements (unaudited) (continued)
| 1. | ORGANIZATION AND SIGNIFICANT ACCOUNTING POLICIES (continued) |
| c. | Security Transactions, Investment Income, Expenses and Distributions |
Security transactions are accounted for on trade date. Realized gains and losses on security transactions are determined on a specific identification basis. Estimated expenses are accrued daily. Dividend income and realized gain distributions by Underlying Funds and ETFs are recorded on the ex-dividend date. Distributions to shareholders are recorded on the ex-dividend date and are determined according to income tax regulations (tax basis). Distributable earnings determined on a tax basis may differ from earnings recorded in accordance with accounting principles generally accepted in the United States of America. These differences may be permanent or temporary. Permanent differences are reclassified among capital accounts to reflect their tax character. These reclassifications have no impact on net assets or the results of operations. Temporary differences are not reclassified, as they may reverse in subsequent periods.
Common expenses incurred by the Trust are allocated among the funds based on the ratio of net assets of each fund to the combined net assets of the Trust. Fund specific expenses are charged directly to the fund that incurred the expense.
The Funds indirectly bear their proportionate share of expenses from the Underlying Funds and ETFs. Since the Underlying Funds and ETFs have varied expense levels and the Funds may own different proportions of the Underlying Funds and ETFs at different times, the amount of expenses incurred indirectly by the Funds will vary.
Realized and unrealized gains and losses and net investment income, not including class specific expenses, are allocated daily to each class of shares based upon the relative proportion of net assets of each class. Differences in per share distributions, by class, are generally due to differences in class specific expenses.
d. Accounting Estimates
The preparation of financial statements in accordance with accounting principles generally accepted in the United States of America requires management to make estimates and assumptions that affect the reported amounts of assets and liabilities at the date of the financial statements and the amounts of income and expenses during the reporting period. Actual results could differ from those estimates.
e. Guarantees and Indemnifications
Under the Trust s organizational documents, its officers and trustees are indemnified by the Trust against certain liabilities arising out of the performance of their duties to the Trust. Additionally, in the normal course of business, the Trust, on behalf of the Funds, enters into contracts with service providers that contain general indemnification clauses. The Trust s maximum exposure under these arrangements is unknown as this would involve future claims that may be made against the Trust that have not yet occurred. Currently, the Trust expects the risk of loss to be remote.
56 | Semiannual Report
Franklin Templeton Fund Allocator Series
Notes to Financial Statements (unaudited) (continued)
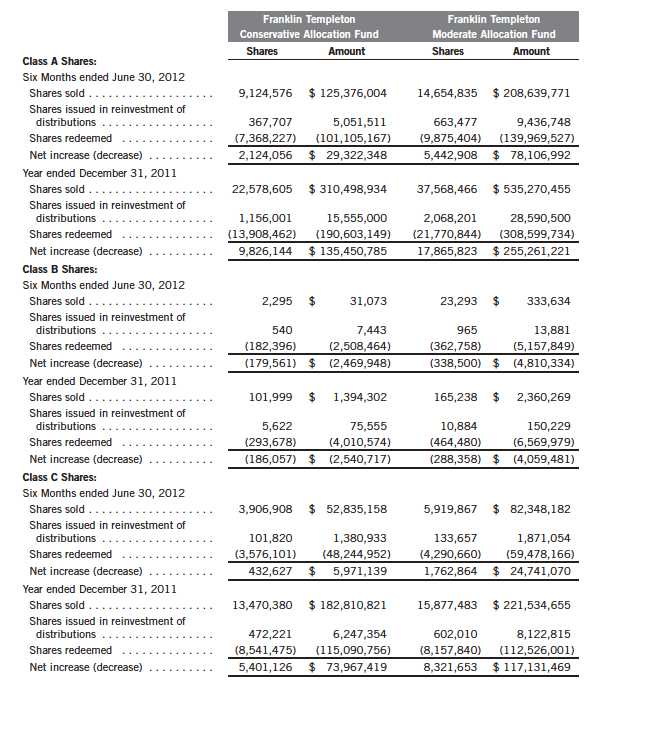
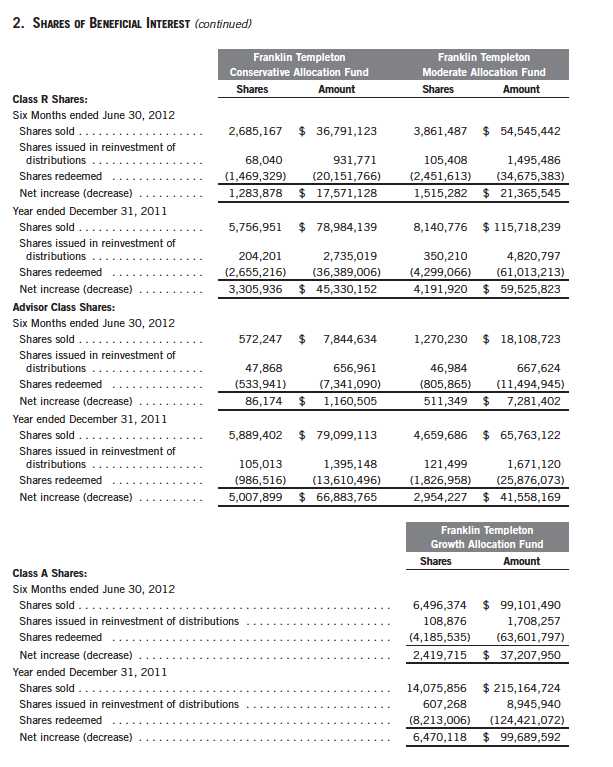
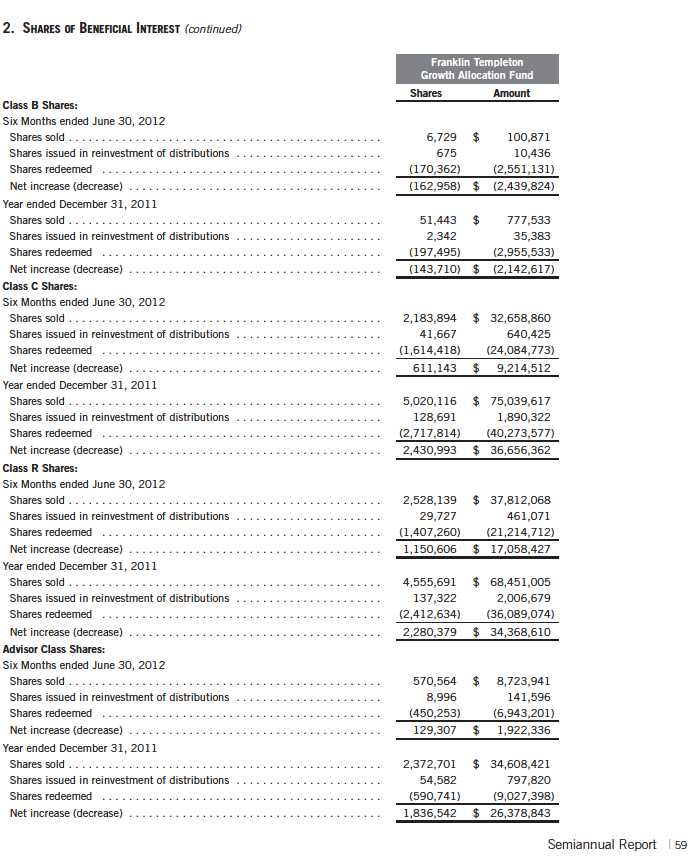
2. SHARES OF BENEFICIAL INTEREST
At June 30, 2012, there were an unlimited number of shares authorized (without par value).
Transactions in the Funds shares were as follows:
Semiannual Report | 57
Franklin Templeton Fund Allocator Series
Notes to Financial Statements (unaudited) (continued)
58 | Semiannual Report
Franklin Templeton Fund Allocator Series
Notes to Financial Statements (unaudited) (continued)
Franklin Templeton Fund Allocator Series
Notes to Financial Statements (unaudited) (continued)
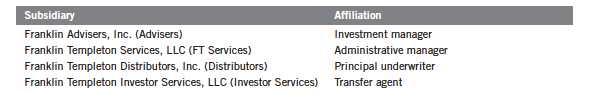
3. TRANSACTIONS WITH AFFILIATES
Franklin Resources, Inc. is the holding company for various subsidiaries that together are referred to as Franklin Templeton Investments. Certain officers and trustees of the Funds are also officers and/or directors/trustees of certain of the Underlying Funds and of the following subsidiaries:
a. Asset Allocation Fees
The Funds pay an asset allocation fee to Advisers of 0.25% per year of the average daily net assets of each of the Funds for investment advisory services, consisting principally of determining the allocation of assets of the Funds among the designated Underlying Funds and ETFs.
b. Administrative Fees
FT Services, under terms of an agreement, provides administrative services to the Funds and is not paid by the Funds for the services.
c. Distribution Fees
The Board has adopted distribution plans for each share class, with the exception of Advisor Class shares, pursuant to Rule 12b-1 under the 1940 Act. Under the Funds Class A reimbursement distribution plans, the Funds reimburse Distributors for costs incurred in connection with the servicing, sale and distribution of each fund s shares up to the maximum annual plan rate. Under the Class A reimbursement distribution plans, costs exceeding the maximum for the current plan year cannot be reimbursed in subsequent periods.
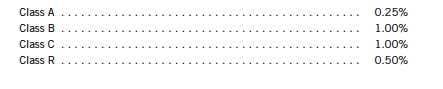
In addition, under the Funds Class B, C and R compensation distribution plans, the Funds pay Distributors for costs incurred in connection with the servicing, sale and distribution of each fund s shares up to the maximum annual plan rate for each class.
The maximum annual plan rates, based on the average daily net assets, for each class, are as follows:
60 | Semiannual Report
Franklin Templeton Fund Allocator Series
Notes to Financial Statements (unaudited) (continued)
| 3. | TRANSACTIONS WITH AFFILIATES (continued) |
| d. | Sales Charges/Underwriting Agreements |
Front-end sales charges and contingent deferred sales charges (CDSC) do not represent expenses of the Funds. These charges are deducted from the proceeds of sales of fund shares prior to investment or from redemption proceeds prior to remittance, as applicable. Distributors has advised the Funds of the following commission transactions related to the sales and redemptions of the Funds shares for the period:

e. Transfer Agent Fees
For the period ended June 30, 2012, the Funds paid transfer agent fees as noted in the Statements of Operations of which the following amounts were retained by Investor Services:
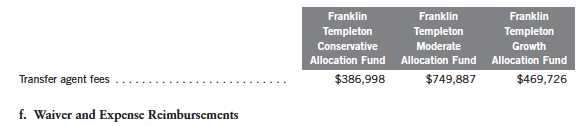
Advisers has contractually agreed in advance to waive or limit its fees and to assume as its own expense certain expenses otherwise payable by the Funds so that the common expenses (i.e. a combination of asset allocation fees and other expenses, but excluding distribution fees, and acquired fund fees and expenses) for each class of the funds do not exceed 0.25% (other than certain non-routine expenses or costs, including those relating to litigation, indemnification, reorganizations, and liquidations) until April 30, 2013.
4. EXPENSE OFFSET ARRANGEMENT
The Funds have entered into an arrangement with their custodian whereby credits realized as a result of uninvested cash balances are used to reduce a portion of the Funds custodian expenses. During the period ended June 30, 2012, there were no credits earned.
Semiannual Report | 61
Franklin Templeton Fund Allocator Series
Notes to Financial Statements (unaudited) (continued)
5. INCOME TAXES
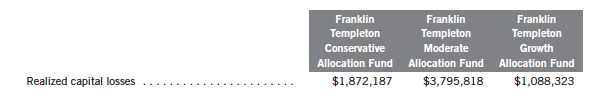
For tax purposes, capital losses may be carried over to offset future capital gains, if any. Capital loss carryforwards with no expiration, if any, must be fully utilized before those losses with expiration dates.
At December 31, 2011, the capital loss carryforwards were as follows:

For tax purposes, the Funds may elect to defer any portion of a post-October capital loss to the first day of the following fiscal year. At December 31, 2011, the deferred post-October capital losses were as follows:
At June 30, 2012, the cost of investments and net unrealized appreciation (depreciation) for income tax purposes were as follows:
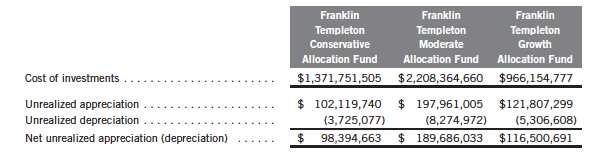
Differences between income and/or capital gains as determined on a book basis and a tax basis are primarily due to differing treatments of short term capital gains distributions from Underlying Funds and ETFs and wash sales.
62 | Semiannual Report
Franklin Templeton Fund Allocator Series
Notes to Financial Statements (unaudited) (continued)
6. INVESTMENT TRANSACTIONS
Purchases and sales of Underlying Funds and ETFs (excluding short term securities) for the period ended June 30, 2012, were as follows:

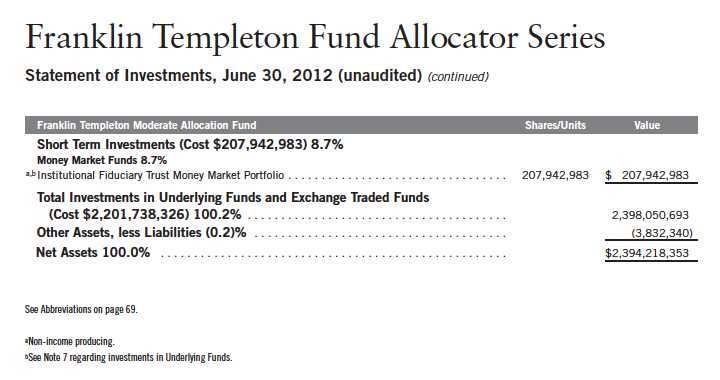
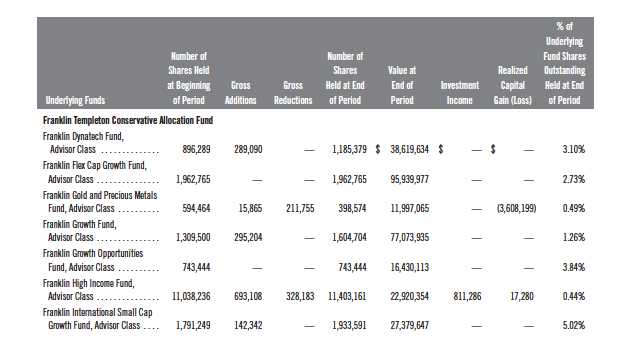
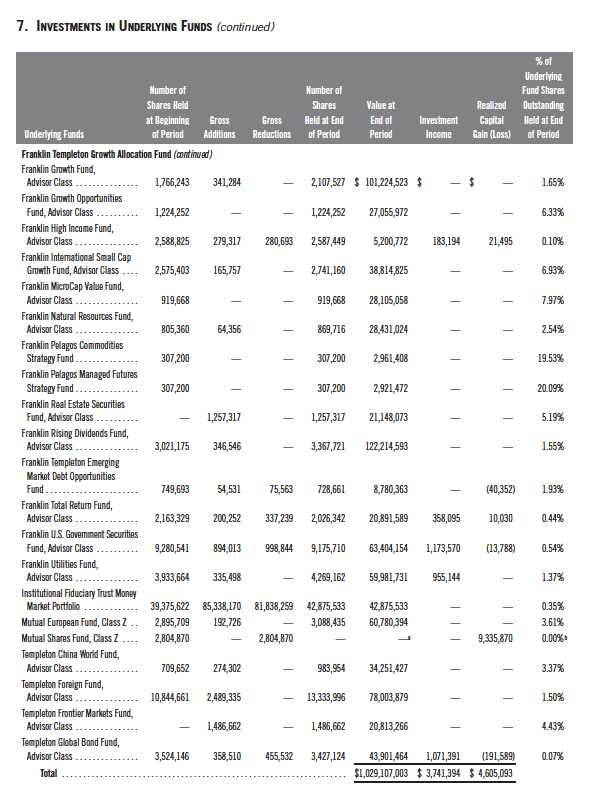
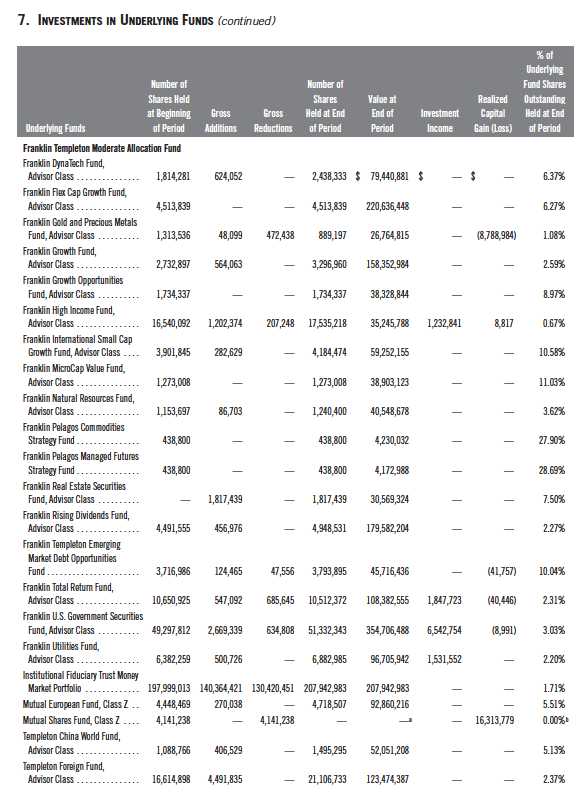
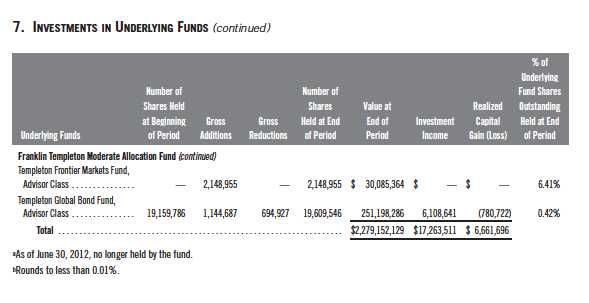
7. INVESTMENTS IN UNDERLYING FUNDS
The Funds invest primarily in the Underlying Funds which are managed by Advisers (or an affiliate of Advisers). The Funds do not invest in the Underlying Funds for the purpose of exercising a controlling influence over the management or policies.
The Funds may invest in the Institutional Fiduciary Trust Money Market Portfolio (Sweep Money Fund), an open-end investment company managed by Advisers. Asset allocation fees are reduced on assets invested in the Sweep Money Fund, in an amount not to exceed the management and administrative fees paid by the Sweep Money Fund.
Investments in Underlying Funds for the period ended June 30, 2012, were as follows:
Semiannual Report | 63
Franklin Templeton Fund Allocator Series
Notes to Financial Statements (unaudited) (continued)

64 | Semiannual Report
Franklin Templeton Fund Allocator Series
Notes to Financial Statements (unaudited) (continued)
Semiannual Report | 65
Franklin Templeton Fund Allocator Series
Notes to Financial Statements (unaudited) (continued)
66 | Semiannual Report
Franklin Templeton Fund Allocator Series
Notes to Financial Statements (unaudited) (continued)
8. SPECIAL SERVICING AGREEMENT
The Funds participate in a Special Servicing Agreement (SSA) with the Underlying Funds (except for the Franklin Pelagos Commodities Strategy Fund and Franklin Pelagos Managed Futures Strategy Fund) and certain service providers of the Funds and of the Underlying Funds. Under the SSA, each Underlying Fund may pay a portion of the Funds expenses (other than any asset allocation and distribution fees) to the extent such payments are less than the amount of the benefits realized or expected to be realized by the Underlying Fund (e.g., due to reduced costs associated with servicing accounts) from the investment in the Underlying Fund by the Funds. The amount of expenses borne by the Underlying Funds during the period ended June 30, 2012 is noted in the Statements of Operations.
9. CREDIT FACILITY
The Funds, together with other U.S. registered and foreign investment funds (collectively, Borrowers), managed by Franklin Templeton Investments, are borrowers in a joint syndicated senior unsecured credit facility totaling $1.5 billion (Global Credit Facility) which matures on January 18, 2013. This Global Credit Facility provides a source of funds to the Borrowers for temporary and emergency purposes, including the ability to meet future unanticipated or unusually large redemption requests.
Under the terms of the Global Credit Facility, the Funds shall, in addition to interest charged on any borrowings made by the Funds and other costs incurred by the Funds, pay their share of fees and expenses incurred in connection with the implementation and maintenance of the Global Credit Facility, based upon their relative share of the aggregate net assets of all of the Borrowers, including an annual commitment fee of 0.08% based upon the unused portion of the Global Credit Facility, which is reflected in other expenses on the Statements of Operations. During the period ended June 30, 2012, the Funds did not use the Global Credit Facility.
Semiannual Report | 67
Franklin Templeton Fund Allocator Series
Notes to Financial Statements (unaudited) (continued)
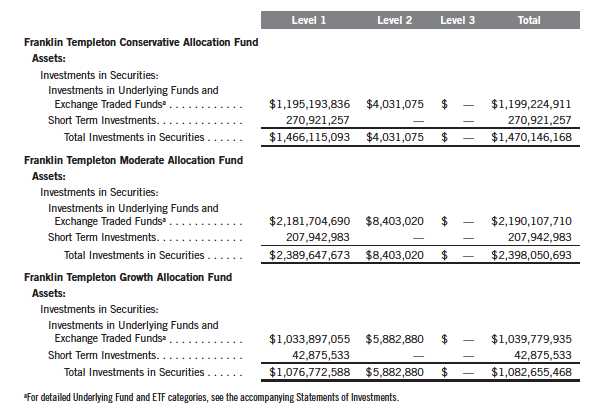
10. FAIR VALUE MEASUREMENTS
The Funds follow a fair value hierarchy that distinguishes between market data obtained from independent sources (observable inputs) and the Funds own market assumptions (unobservable inputs). These inputs are used in determining the value of the Funds financial instruments and are summarized in the following fair value hierarchy:
- Level 1 quoted prices in active markets for identical financial instruments
- Level 2 other significant observable inputs (including quoted prices for similar financial instruments, interest rates, prepayment speed, credit risk, etc.)
- Level 3 significant unobservable inputs (including the Funds own assumptions in determining the fair value of financial instruments)
The inputs or methodology used for valuing financial instruments are not an indication of the risk associated with investing in those financial instruments.
For movements between the levels within the fair value hierarchy, the Funds have adopted a policy of recognizing the transfers as of the date of the underlying event which caused the movement.
A summary of inputs used as of June 30, 2012, in valuing the Funds assets and liabilities carried at fair value, is as follows:
68 | Semiannual Report
Franklin Templeton Fund Allocator Series
Notes to Financial Statements (unaudited) (continued)
11. NEW ACCOUNTING PRONOUNCEMENTS
In December 2011, the Financial Accounting Standards Board (FASB) issued Accounting Standards Update (ASU) No. 2011-11, Balance Sheet (Topic 210): Disclosures about Offsetting Assets and Liabilities. The amendments in the ASU enhance disclosures about offsetting of financial assets and liabilities to enable investors to understand the effect of these arrangements on a fund s financial position. The ASU is effective for interim and annual reporting periods beginning on or after January 1, 2013. The Funds believe the adoption of this ASU will not have a material impact on their financial statements.
12. SUBSEQUENT EVENTS
The Funds have evaluated subsequent events through the issuance of the financial statements and determined that no events have occurred that require disclosure.

Semiannual Report | 69
Franklin Templeton Fund Allocator Series
Tax Information (unaudited)
During the fiscal year ended December 31, 2011, the Funds, qualified fund of funds under Section 852(g)(2) of the Internal Revenue Code (Code), received an allocation of foreign taxes paid from one or more of their Underlying Funds. In the 2011 Annual Report the Funds reported to shareholders the foreign source income and foreign taxes paid by the Underlying Funds, pursuant to Section 853 of the Code. The foreign tax paid reported in the table below has been revised from the information reported in the 2011 Annual Report. There are no changes to the information reported for Foreign Source Income and Foreign Qualified Dividends. This revised written statement will allow shareholders of record on December 27, 2011, to treat their proportionate share of foreign taxes paid by the Underlying funds as having been paid directly by them. The shareholder shall consider these amounts as foreign taxes paid in the tax year in which they receive the Fund s distribution.
In mid-February 2012, shareholders received Form 1099-DIV which correctly included their share of foreign taxes paid and foreign source income distributed during the calendar year 2011. The Foreign Source Income reported on Form 1099-DIV was not adjusted for the rate differential on foreign source qualified dividend income. Shareholders are advised to check with their tax advisors for information on the treatment of these amounts on their 2011 individual income tax returns.
The following table provides the per share amounts of foreign tax paid, foreign source income, and foreign qualified dividends as reported by the Funds, to Class A, Class B, Class C, Class R, and Advisor Class shareholders of record.
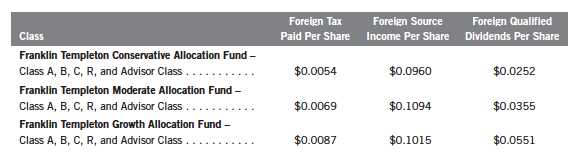
Foreign Tax Paid Per Share (Column 1) is the amount per share available to you, as a tax credit (assuming you held your shares in the Fund for a minimum of 16 days during the 31-day period beginning 15 days before the ex-dividend date of the Fund s distribution to which the foreign taxes relate), or, as a tax deduction.
Foreign Source Income Per Share (Column 2) is the amount per share of income dividends attributable to foreign securities held by the Fund, plus any foreign taxes withheld on these dividends. The amounts reported include foreign source qualified dividends that have not been adjusted for the rate differential applicable to such dividend income.
Foreign Qualified Dividends Per Share (Column 3) is the amount per share of foreign source qualified dividends plus any foreign taxes withheld on these dividends. These amounts represent the portion of the Foreign Source Income reported to you in column 2 that were derived from qualified foreign securities held by the Underlying Funds.
70 | Semiannual Report
Franklin Templeton Fund Allocator Series
Shareholder Information
Board Review of Investment Management Agreement
At a meeting held February 28, 2012, the Board of Trustees (Board), including a majority of non-interested or independent Trustees, approved renewal of the investment management agreement for each of the separate funds within Franklin Templeton Fund Allocator Series (Fund(s)). In reaching its decision to approve renewal of the investment management agreements, the Board took into account information furnished throughout the year at regular Board meetings, as well as information prepared specifically in connection with the annual renewal review process. Information furnished and discussed throughout the year included investment performance reports and related financial information for each Fund, as well as periodic reports on expenses, shareholder services, legal and compliance matters, pricing, brokerage commissions and execution and other services provided by the Investment Manager (Manager) and its affiliates. Information furnished specifically in connection with the renewal process included a report for each Fund prepared by Lipper, Inc. (Lipper), an independent organization, as well as additional material, including a Fund profitability analysis prepared by management. The Lipper reports compared each Fund s investment performance and expenses with those of other mutual funds deemed comparable to the Fund as selected by Lipper. The Fund profitability analysis discussed the profitability to Franklin Templeton Investments from its overall U.S. fund operations, as well as on an individual fund-by-fund basis. Additional material accompanying such profitability analysis included information on a fund-by-fund basis listing portfolio managers and other accounts they manage, as well as information on management fees charged by the Manager and its affiliates to U.S. mutual funds and other accounts, including management s explanation of differences where relevant. Such material also included a memorandum prepared by management describing project initiatives and capital investments relating to the services provided to the Funds by the Franklin Templeton Investments organization, as well as a memorandum relating to economies of scale and an analysis concerning transfer agent fees charged by an affiliate of the Manager.
In considering such materials, the independent Trustees received assistance and advice from and met separately with independent counsel. While the investment management agreements for all Funds were considered at the same Board meeting, the Board dealt with each Fund separately. In approving continuance of the investment management agreement for each Fund, the Board, including a majority of independent Trustees, determined that the existing management fee structure was fair and reasonable and that continuance of the investment management agreement was in the best interests of each Fund and its shareholders. While attention was given to all information furnished, the following discusses some primary factors relevant to the Board s decision.
NATURE, EXTENT AND QUALITY OF SERVICE. The Board was satisfied with the nature and quality of the overall services provided by the Manager and its affiliates to the Funds and their shareholders. In addition to investment performance and expenses discussed later, the Board s opinion was based, in part, upon periodic reports furnished it showing that the investment policies and restrictions for each Fund were consistently complied with as well as other reports periodically furnished the Board covering matters such as the compliance of portfolio managers and other
Semiannual Report | 71
Franklin Templeton Fund Allocator Series
Shareholder Information (continued)
Board Review of Investment Management Agreement (continued)
management personnel with the code of ethics adopted throughout the Franklin Templeton fund complex, the adherence to fair value pricing procedures established by the Board, and the accuracy of net asset value calculations. The Board also noted the extent of benefits provided Fund shareholders from being part of the Franklin Templeton family of funds, including the right to exchange investments between the same class of funds without a sales charge, the ability to reinvest Fund dividends into other funds and the right to combine holdings in other funds to obtain a reduced sales charge. Favorable consideration was given to management s continuous efforts and expenditures in establishing back-up systems and recovery procedures to function in the event of a natural disaster, it being noted that such systems and procedures had functioned smoothly during the Florida hurricanes and blackouts experienced in previous years. Among other factors taken into account by the Board were the Manager s best execution trading policies, including a favorable report by an independent portfolio trading analytical firm, which also covered FOREX transactions. Consideration was also given to the experience of each Fund s portfolio management team, the number of accounts managed and general method of compensation. In this latter respect, the Board noted that a primary factor in management s determination of a portfolio manager s bonus compensation was the relative investment performance of the funds he or she managed and that a portion of such bonus was required to be invested in a predesignated list of funds within such person s fund management area so as to be aligned with the interests of shareholders. The Board also took into account the quality of transfer agent and shareholder services provided Fund shareholders by an affiliate of the Manager and the continuous enhancements to the Franklin Templeton website. Particular attention was given to management s conservative approach and diligent risk management procedures, including continuous monitoring of counterparty credit risk and attention given to derivatives and other complex instruments including expanded collateralization requirements. The Board also took into account, among other things, management s efforts in establishing a global credit facility for the benefit of the Funds and other accounts managed by Franklin Templeton Investments to provide a source of cash for temporary and emergency purposes or to meet unusual redemption requests as well as the strong financial position of the Manager s parent company and its commitment to the mutual fund business as evidenced by its subsidization of money market funds.
INVESTMENT PERFORMANCE. The Board placed significant emphasis on the investment performance of each Fund in view of its importance to shareholders. While consideration was given to performance reports and discussions with portfolio managers at Board meetings throughout the year, particular attention in assessing performance was given to the Lipper reports furnished for the agreement renewals. The Lipper reports prepared for each individual Fund showed the investment performance of its Class A shares in comparison to a performance universe selected by Lipper. Comparative performance for each Fund was shown for the one-year period ended December 31, 2011, and for additional periods ended that date depending on when a particular Fund commenced operations. The following summarizes the performance results for each of the Funds and the Board s view of such performance.
72 | Semiannual Report
Franklin Templeton Fund Allocator Series
Shareholder Information (continued)
Board Review of Investment Management Agreement (continued)
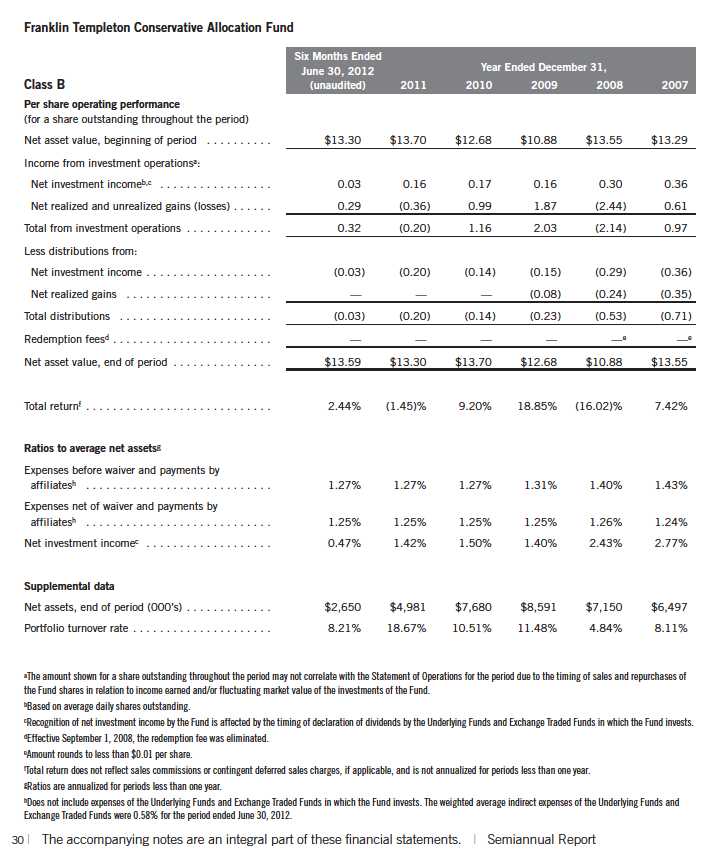
Franklin Templeton Conservative Allocation Fund The performance universe for this Fund consisted of the Fund and all retail and institutional mixed-asset target allocation conservative funds as selected by Lipper. The Lipper report showed the Fund s total return for 2011 to be in the lowest quintile of such performance universe, and on an annualized basis to be in the second-lowest quintile of such universe for the previous three-year period, the second-highest quintile of such universe for the previous five-year period, and the highest quintile of such universe for the previous 10-year period. In discussing 2011 performance, management explained that it largely reflected the underperformance of its holdings in Templeton Global Bond Fund, which historically has been a strong performer, as well as the fact that none of the other underlying funds held in its portfolio had a significant exposure to the outperforming U.S. Treasury market. The Board believed the Fund s overall performance to be satisfactory, noting its favorable longer term comparative performance, as well as the fact that it had outperformed the median of its Lipper performance universe during seven of the last 10 years as shown in the Lipper report.
Franklin Templeton Moderate Allocation Fund The performance universe for this Fund consisted of the Fund and all retail and institutional mixed-asset target allocation moderate funds as selected by Lipper. The Lipper report showed the Fund s 2011 total return to be in the second-lowest quin-tile of such performance universe, but its total return on an annualized basis to be in the middle quintile of such universe for the previous three-year period and to be in the highest quintile of such universe for each of the previous five- and 10-year periods. In discussing 2011 performance, management explained that it largely reflected the underperformance of its holdings in Templeton Global Bond Fund, which historically has been a strong performer, as well as the fact that none of the other underlying funds held in its portfolio had a significant exposure to the outperforming U.S. Treasury market. The Board was satisfied with the Fund s overall performance as set forth in the Lipper report, noting its favorable long-term comparative performance.
Franklin Templeton Growth Allocation Fund The performance universe for this Fund consisted of the Fund and all retail and institutional mixed-asset target allocation growth funds as selected by Lipper. The Lipper report showed the Fund s 2011 total return to be in the second-lowest quintile of such performance universe, but its total return on an annualized basis to be in the second-highest quintile of such universe during the previous three-year period and the highest quintile of such universe during each of the previous five- and 10-year periods. The Board discussed with management the reasons for the Fund s underperformance in 2011 but was satisfied with the Fund s overall comparative performance as shown in the Lipper report.
COMPARATIVE EXPENSES. Consideration was given to the management fee and total expense ratios of each Fund compared with those of a group of retail front-end load fund of funds selected by Lipper as its appropriate Lipper expense group. Lipper expense data is based upon information taken from each such fund s most recent annual report, which reflects historical asset levels that may be quite different from those currently existing, particularly in a period of market volatility. While recognizing such inherent limitation and the fact that expense ratios generally increase as
Semiannual Report | 73
Franklin Templeton Fund Allocator Series
Shareholder Information (continued)
Board Review of Investment Management Agreement (continued)
assets decline and decrease as assets grow, the Board believed the independent analysis conducted by Lipper to be an appropriate measure of comparative expenses. In reviewing comparative costs, Lipper provides information on each Fund s contractual investment management fee in comparison with the contractual investment management fee that would have been charged by other funds within its Lipper expense group assuming they were similar in size to the Fund, as well as the actual total expense ratios of the Funds including expenses of the underlying funds they invest in. The Board noted that the Funds pay an asset allocation advisory fee. The Lipper contractual investment management fee analysis includes the advisory and administrative fees directly charged to each of the Funds as being part of the contractual investment management fee, with the investment management fees charged underlying funds being included within actual total expenses. Contractual investment management fees and total expenses for comparative consistency are shown by Lipper for Fund Class A shares. The Lipper expense reports noted in the case of each Fund that expenses had been subsidized by management fee waivers and reimbursements. The Lipper reports for Franklin Templeton Moderate Allocation Fund and Franklin Templeton Conservative Allocation Fund showed in each case that their contractual management fee rates were at the median of their respective Lipper expense groups, and that their actual total expense ratios (including underlying fund expenses), were above but within 11 and six basis points, respectively, of the medians of their respective Lipper expense groups. The Lipper report for Franklin Templeton Growth Allocation Fund showed its effective management fee to be less than nine basis points above the median of its Lipper expense group and its total expense ratio to be less than five basis points above the median for such expense group. The Board found the comparative expenses of these Funds as shown in the Lipper report to be acceptable.
MANAGEMENT PROFITABILITY. The Board also considered the level of profits realized by the Manager and its affiliates in connection with the operation of each Fund. In this respect, the Board reviewed the Fund profitability analysis that addresses the overall profitability of Franklin Templeton s U.S. fund business, as well as its profits in providing management and other services to each of the individual funds during the 12-month period ended September 30, 2011, being the most recent fiscal year-end for Franklin Resources, Inc., the Manager s parent. In reviewing the analysis, attention was given to the methodology followed in allocating costs to each Fund, it being recognized that allocation methodologies are inherently subjective and various allocation methodologies may each be reasonable while producing different results. In this respect, the Board noted that, while being continuously refined and reflecting changes in the Manager s own cost accounting, the allocation methodology was consistent with that followed in profitability report presentations for the Funds made in prior years and that the Funds independent registered public accounting firm had been engaged by the Manager to review the reasonableness of the allocation methodologies solely for use by the Funds Board in reference to the profitability analysis. In reviewing and discussing such analysis, management discussed with the Board its belief that costs incurred in establishing the infrastructure necessary for the type of mutual fund operations conducted by the Manager and its affiliates may not be fully reflected in the expenses allocated to each Fund in determining its profitability, as well as the fact that the level of profits, to a certain extent, reflected
74 | Semiannual Report
Franklin Templeton Fund Allocator Series
Shareholder Information (continued)
Board Review of Investment Management Agreement (continued)
operational cost savings and efficiencies initiated by management. The Board also took into account management s expenditures in improving shareholder services provided the Funds, as well as the need to implement systems and meet additional regulatory and compliance requirements resulting from statutes such as the Sarbanes-Oxley and Dodd-Frank Acts and recent SEC and other regulatory requirements. In addition, the Board considered a third-party study comparing the profitability of the Manager s parent on an overall basis to other publicly held managers broken down to show profitability from management operations exclusive of distribution expenses, as well as profitability including distribution expenses. The Board also considered the extent to which the Manager and its affiliates might derive ancillary benefits from fund operations, including revenues generated from transfer agent services and potential benefits resulting from allocation of fund brokerage and the use of commission dollars to pay for research. Based upon its consideration of all these factors, and taking into account the fact that Fund expenses were being subsidized through fee waivers, the Board determined that the level of profits realized by the Manager and its affiliates from providing services to each Fund was not excessive in view of the nature, quality and extent of services provided.
ECONOMIES OF SCALE. The Board also considered whether economies of scale are realized by the Managers as the Funds grow larger and the extent to which this is reflected in the level of management fees charged. While recognizing that any precise determination is inherently subjective, the Board noted that based upon the Fund profitability analysis, it appears that as some funds get larger, at some point economies of scale do result in the Managers realizing a larger profit margin on management services provided such a fund. The Board also noted that economies of scale are shared with a fund and its shareholders through management fee breakpoints so that as a fund grows in size, its effective management fee rate declines. The management fees charged by all or substantially all the underlying funds in which the Funds invest provide for such management fee breakpoints. Consequently, to the extent economies of scale may be realized by the investment managers of these funds, the benefits are shared with each Fund and its shareholders through a reduction in actual total expense ratios.
Proxy Voting Policies and Procedures
The Trust s investment manager has established Proxy Voting Policies and Procedures (Policies) that the Trust uses to determine how to vote proxies relating to portfolio securities. Shareholders may view the Trust s complete Policies online at franklintempleton.com. Alternatively, shareholders may request copies of the Policies free of charge by calling the Proxy Group collect at (954) 527-7678 or by sending a written request to: Franklin Templeton Companies, LLC, 300 S.E. 2nd Street, Fort Lauderdale, FL 33301, Attention: Proxy Group. Copies of the Trust s proxy voting records are also made available online at franklintempleton.com and posted on the U.S. Securities and Exchange Commission s website at sec.gov and reflect the most recent 12-month period ended June 30.
Semiannual Report | 75
Franklin Templeton Fund Allocator Series
Shareholder Information (continued)
Quarterly Statement of Investments
The Trust files a complete statement of investments with the U.S. Securities and Exchange Commission for the first and third quarters for each fiscal year on Form N-Q. Shareholders may view the filed Form N-Q by visiting the Commission s website at sec.gov. The filed form may also be viewed and copied at the Commission s Public Reference Room in Washington, DC. Information regarding the operations of the Public Reference Room may be obtained by calling (800) SEC-0330.
76 | Semiannual Report
This page intentionally left blank.
This page intentionally left blank.

Semiannual Report
Economic and Market Overview
The U.S. economy, as measured by gross domestic product, grew modestly
during the six-month period ended June 30, 2012, as personal income and
spending rose. The national unemployment rate for June 2012 stood at
8.2%, compared with 8.5% at the start of the period.1 Job growth was more
pronounced in the first quarter, and jobless claims touched a four-year low;
however, hiring slowed in the second quarter. Industrial production and man-
ufacturing activity expanded during most of the period under review, but the
manufacturing sector shrank unexpectedly in June. In keeping with its goal to
strengthen U.S. economic recovery by fostering increased employment while
keeping inflation in check, during June the Federal Reserve Board (Fed)
extended through 2012 its program (dubbed Operation Twist) to buy long-term
Treasuries in an attempt to lower long-term yields. The Fed also reaffirmed its
intention to keep the federal funds target rate low at least through late 2014.
Global growth trends generally moderated, led by Europe, which narrowly
avoided recession mainly because of German export strength. Yet, even the
more resilient economies of Germany and China showed signs of a slowdown
at period-end. The combination of flagging growth, political uncertainty and
populist unrest pressured investor confidence, and ratings agencies down-
graded global banks and European sovereigns. Concerns about Italian and
Spanish borrowing costs added to investor anxiety as bond yields climbed.
Europe s initial policy responses including enhanced liquidity measures and
an ineffective Spanish banking bailout did little to address the structural
imbalances of eurozone economies or the solvency fears plaguing the region s
banking system.
Global developed stock markets, as measured by the MSCI World Index,
delivered the best annual start in more than a decade, as signs of U.S. eco-
nomic recovery and European policy relief underpinned a rally in cyclical
stocks. During late March and early April 2012, U.S. stocks, as measured
by the Standard & Poor s® 500 Index, reached multi-year highs.2 However,
stocks dropped sharply in late spring amid renewed global economic weak-
ness and European debt concerns before additional policy action prompted
a rebound in June. Politics largely drove the markets during the first half of
2012 as investors closely monitored developments in Europe, where German-
led austerity demands were met with increasing resentment from some highly
1. Source: Bureau of Labor Statistics.
2. STANDARD & POOR S®, S&P® and S&P 500® are registered trademarks of Standard & Poor s Financial Services LLC.
Semiannual Report | 3
indebted eurozone members. Fears of a Greek debt default and exit from the eurozone were somewhat mitigated in February by secured bailout financing and bondholder concessions, as well as May and June elections that resulted in the formation of a new coalition government. The Fed s Operation Twist purchases and risk-averse investors seeking safety drove U.S. Treasury yields to historical lows during the period. In the latter part of the period, the euro declined while the U.S. dollar and Japanese yen made gains.
At the end of the reporting period, significant challenges to the U.S. and global economies remained, including weak jobs reports, lack of broad public and political agreement on how to achieve U.S. deficit reduction, and uncertainty surrounding deeply indebted European countries including Greece, Italy and Spain. Although long-term resolution of European debt issues remained unclear, the European Central Bank s plan to allow the European Stability Mechanism to directly recapitalize troubled banks throughout the eurozone, as well as a late-June proposal leaning toward fiscal and banking union, supported cautious optimism in U.S. and global markets.
The foregoing information reflects our analysis and opinions as of June 30, 2012. The information is not a complete analysis of every aspect of any market, country, industry, security or fund. Statements of fact are from sources considered reliable.
4 | Semiannual Report
Franklin Templeton Corefolio Allocation Fund
Your Fund s Goal and Main Investments: Franklin Templeton Corefolio Allocation Fund seeks capital appreciation through investments in a combination of Franklin Flex Cap Growth Fund, Franklin Growth Fund, Mutual Shares Fund and Templeton Growth Fund.
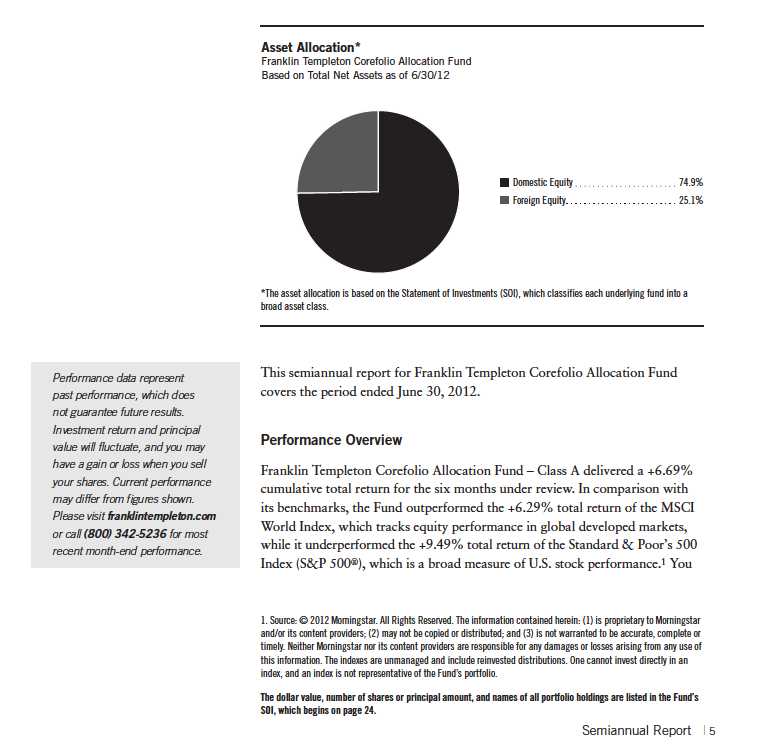
can find the Fund s long-term performance data in the Performance Summary beginning on page 7.
Investment Strategy
The Fund invests its assets allocated approximately 25% each in Franklin Flex Cap Growth Fund, Franklin Growth Fund, Mutual Shares Fund and Templeton Growth Fund. These underlying funds, in turn, invest primarily in U.S. and foreign equity securities and, to a lesser extent, fixed income and money market securities. As market conditions affect the underlying funds, we rebalance the Fund s allocations to maintain the predetermined weightings in each underlying fund whenever the actual allocations exceed plus or minus 3% of the fixed allocation percentages.
Portfolio Review
The Fund s performance can be attributed largely to maintaining a relatively static allocation among domestic and foreign equities, fixed income securities, and short-term investments and other net assets, and to the actual performance of the selected underlying funds.
During the period under review, Franklin Flex Cap Growth Fund Advisor Class, Franklin Growth Fund Advisor Class and Mutual Shares Fund Class Z underperformed the S&P 500, and Templeton Growth Fund Advisor Class underperformed the MSCI World Index.
Thank you for your continued participation in Franklin Templeton Corefolio Allocation Fund. We look forward to serving your future investment needs.


T. Anthony Coffey, CFA
Vice President of Franklin Advisers, Inc.
Franklin Templeton Corefolio Allocation Fund
CFA® is a trademark owned by CFA Institute.
The foregoing information reflects our analysis, opinions and portfolio holdings as of June 30, 2012, the end of the reporting period. The way we implement our main investment strategies and the resulting portfolio holdings may change depending on factors such as market and economic conditions. These opinions may not be relied upon as investment advice or an offer for a particular security. The information is not a complete analysis of every aspect of any market, country, industry, security or the Fund. Statements of fact are from sources considered reliable, but the investment manager makes no representation or warranty as to their completeness or accuracy. Although historical performance is no guarantee of future results, these insights may help you understand our investment management philosophy.
6 | Semiannual Report
Performance Summary as of 6/30/12
Franklin Templeton Corefolio Allocation Fund
Your dividend income will vary depending on dividends or interest paid by securities in the Fund s portfolio, adjusted for operating expenses of each class. Capital gain distributions are net profits realized from the sale of portfolio securities. The performance table does not reflect any taxes that a shareholder would pay on Fund dividends, capital gain distributions, if any, or any realized gains on the sale of Fund shares. Total return reflects reinvestment of the Fund s dividends and capital gain distributions, if any, and any unrealized gains or losses.
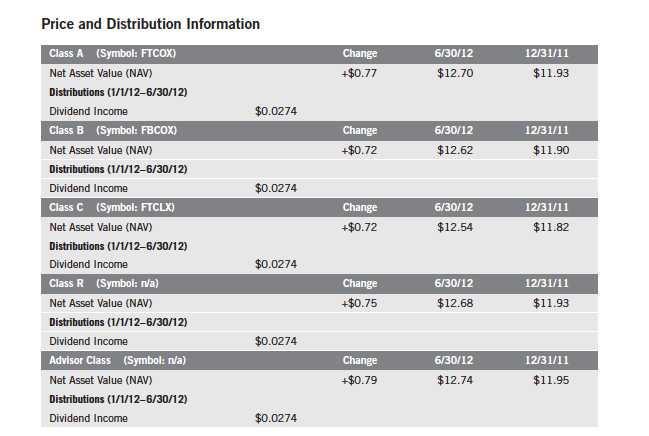
Semiannual Report | 7
Performance Summary (continued)
Performance1
Cumulative total return excludes sales charges. Average annual total return and value of $10,000 investment include maximum sales charges. Class A: 5.75% maximum initial sales charge; Class B: contingent deferred sales charge (CDSC) declining from 4% to 1% over six years, and eliminated thereafter; Class C: 1% CDSC in first year only;
Class R/Advisor Class: no sales charges.
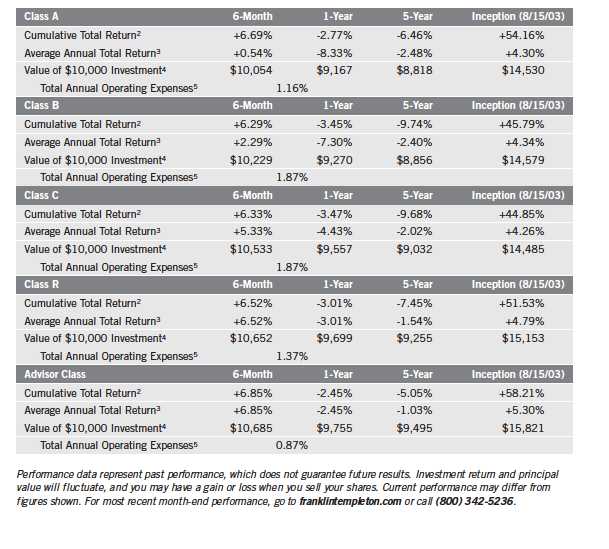
8 | Semiannual Report
Performance Summary (continued)
Endnotes
All investments involve risks, including possible loss of principal. Because the Fund invests in underlying funds that may engage in a variety of investment strategies involving certain risks, this Fund of funds may be subject to those same risks. Stock prices fluctuate, sometimes rapidly and dramatically, due to factors affecting individual companies, particular industries or sectors, or general market conditions. Foreign investing carries additional risks such as currency and market volatility, and political or social instability, risks that are heightened in developing countries. Smaller or relatively new or unseasoned companies can be particularly sensitive to changing economic conditions, and their prospects for growth are less certain than those of larger, more established companies. Value securities may not increase in price as anticipated or may decline further in value. These and other risks, including investments in specialized industry sectors such as the technology sector, which has been among the most volatile in the market, are discussed in the Fund s prospectus.
Class B: These shares have higher annual fees and expenses than Class A shares.
Class C: Prior to 1/1/04, these shares were offered with an initial sales charge; thus actual total returns would have differed. These shares
have higher annual fees and expenses than Class A shares.
Class R: Shares are available to certain eligible investors as described in the prospectus. These shares have higher annual fees and expenses
than Class A shares.
Advisor Class: Shares are available to certain eligible investors as described in the prospectus.
1. Past expense reductions by the administrator increased the Fund s total returns. Without these reductions, the Fund s total returns would have
been lower.
2. Cumulative total return represents the change in value of an investment over the periods indicated.
3. Average annual total return represents the average annual change in value of an investment over the periods indicated. Six-month return has not
been annualized.
4. These figures represent the value of a hypothetical $10,000 investment in the Fund over the periods indicated.
5. Figures are as stated in the Fund s prospectus current as of the date of this report and include the effect of acquired fund fees and expenses. In
periods of market volatility, assets may decline significantly, causing total annual Fund operating expenses to become higher than the figures shown.
Semiannual Report | 9
Your Fund s Expenses
Franklin Templeton Corefolio Allocation Fund
As a Fund shareholder, you can incur two types of costs:
- Transaction costs, including sales charges (loads) on Fund purchases; and
- Ongoing Fund costs, including management fees, distribution and service (12b-1) fees, and other Fund expenses. All mutual funds have ongoing costs, sometimes referred to as operating expenses.
The following table shows ongoing costs of investing in the Fund and can help you understand these costs and compare them with those of other mutual funds. The table assumes a $1,000 investment held for the six months indicated.
Actual Fund Expenses
The first line (Actual) for each share class listed in the table provides actual account values and expenses. The Ending Account Value is derived from the Fund s actual return, which includes the effect of Fund expenses.
You can estimate the expenses you paid during the period by following these steps. Of course, your account value and expenses will differ from those in this illustration:
| 1. | Divide your account value by $1,000. |
| | If an account had an $8,600 value, then $8,600 ÷ $1,000 = 8.6. |
| 2. | Multiply the result by the number under the heading Expenses Paid During Period. |
| | If Expenses Paid During Period were $7.50, then 8.6 x $7.50 = $64.50. |
In this illustration, the estimated expenses paid this period are $64.50.
Hypothetical Example for Comparison with Other Funds
Information in the second line (Hypothetical) for each class in the table can help you compare ongoing costs of investing in the Fund with those of other mutual funds. This information may not be used to estimate the actual ending account balance or expenses you paid during the period. The hypothetical Ending Account Value is based on the actual expense ratio for each class and an assumed 5% annual rate of return before expenses, which does not represent the Fund s actual return. The figure under the heading Expenses Paid During Period shows the hypothetical expenses your account would have incurred under this scenario. You can compare this figure with the 5% hypothetical examples that appear in shareholder reports of other funds.
10 | Semiannual Report
Your Fund s Expenses (continued)
Please note that expenses shown in the table are meant to highlight ongoing costs and do not reflect any transaction costs, such as sales charges. Therefore, the second line for each class is useful in comparing ongoing costs only, and will not help you compare total costs of owning different funds. In addition, if transaction costs were included, your total costs would have been higher. Please refer to the Fund prospectus for additional information on operating expenses.
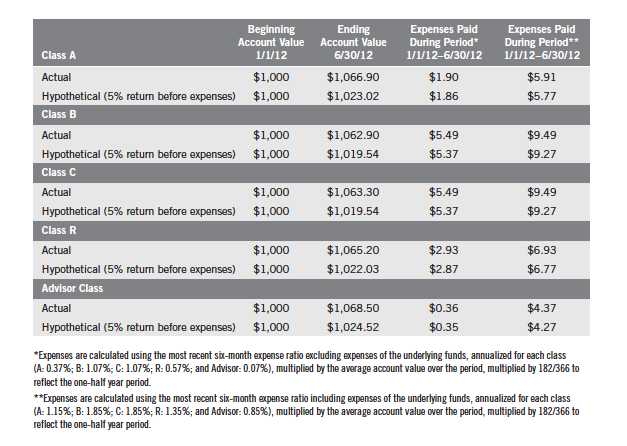
Semiannual Report | 11
Franklin Templeton
Founding Funds Allocation Fund
Your Fund s Goals and Main Investments: Franklin Templeton Founding Funds
Allocation Fund s principal investment goal is capital appreciation, with a secondary goal of income. The Fund invests in an equally weighted combination of Franklin Income Fund, Mutual Shares Fund and Templeton Growth Fund.
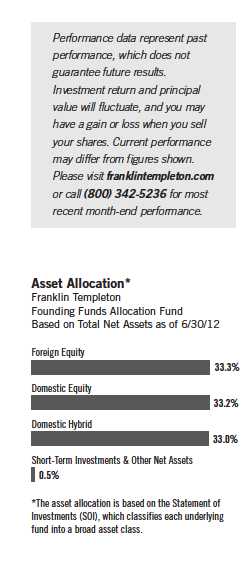
This semiannual report for the Franklin Templeton Founding Funds Allocation Fund covers the period ended June 30, 2012.
Performance Overview
Franklin Templeton Founding Funds Allocation Fund Class A delivered a +5.81% cumulative total return for the six months under review. In comparison with its benchmarks, the Fund underperformed the +9.49% total return of the Standard & Poor s 500 Index (S&P 500), which is a broad measure of U.S. stock performance, and underperformed the +6.29% total return of the MSCI World Index, which tracks equity performance in global developed markets.1 You can find the Fund s long-term performance data in the Performance Summary beginning on page 14.
Investment Strategy
The Fund invests its assets in an equally weighted combination of Franklin Income Fund, Mutual Shares Fund and Templeton Growth Fund. These underlying funds, in turn, invest primarily in U.S. and foreign equity securities and, to a lesser extent, fixed income and money market securities. As market conditions affect the underlying funds, we rebalance the Fund s allocations to maintain the predetermined equal weightings of approximately 33 1 / 3% of total net assets in each underlying fund whenever the actual allocations exceed plus or minus 3% of the fixed allocation percentages.
1. Source: © 2012 Morningstar. All Rights Reserved. The information contained herein: (1) is proprietary to Morningstar and/or its content providers; (2) may not be copied or distributed; and (3) is not warranted to be accurate, complete or timely. Neither Morningstar nor its content providers are responsible for any damages or losses arising from any use of this information. The indexes are unmanaged and include reinvested distributions. One cannot invest directly in an index, and an index is not representative of the Fund s portfolio.
The dollar value, number of shares or principal amount, and names of all portfolio holdings are listed in the Fund s SOI, which begins on page 30.
12 | Semiannual Report
Portfolio Review
The Fund s performance can be attributed largely to maintaining a relatively static allocation among domestic and foreign equities, fixed income securities, and short-term investments and other net assets, and to the actual performance of the selected underlying funds.
During the period under review, Franklin Income Fund Advisor Class and Mutual Shares Fund Class Z underperformed the S&P 500. Templeton Growth Fund Advisor Class underperformed the MSCI World Index.
Thank you for your continued participation in Franklin Templeton Founding Funds Allocation Fund. We look forward to serving your future investment needs.
The foregoing information reflects our analysis, opinions and portfolio holdings as of June 30, 2012, the end of the reporting period. The way we implement our main investment strategies and the resulting portfolio holdings may change depending on factors such as market and economic conditions. These opinions may not be relied upon as investment advice or an offer for a particular security. The information is not a complete analysis of every aspect of any market, country, industry, security or the Fund. Statements of fact are from sources considered reliable, but the investment manager makes no representation or warranty as to their completeness or accuracy. Although historical performance is no guarantee of future results, these insights may help you understand our investment management philosophy.
Semiannual Report | 13
Performance Summary as of 6/30/12
Franklin Templeton Founding Funds Allocation Fund
Your dividend income will vary depending on dividends or interest paid by securities in the Fund s portfolio, adjusted for operating expenses of each class. Capital gain distributions are net profits realized from the sale of portfolio securities. The performance table does not reflect any taxes that a shareholder would pay on Fund dividends, capital gain distributions, if any, or any realized gains on the sale of Fund shares. Total return reflects reinvestment of the Fund s dividends and capital gain distributions, if any, and any unrealized gains or losses.
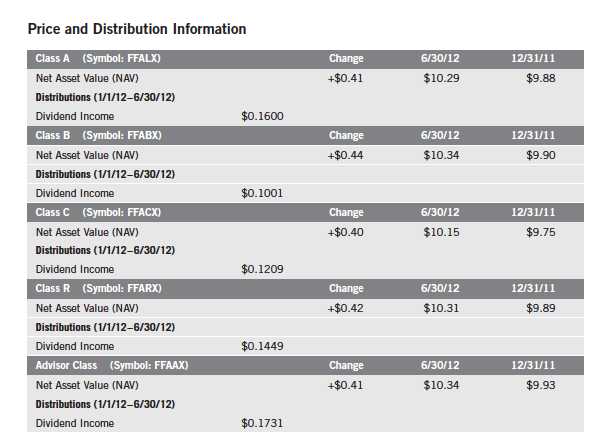
14 | Semiannual Report
Performance Summary (continued)
Performance1
Cumulative total return excludes sales charges. Average annual total return and value of $10,000 investment include maximum sales charges. Class A: 5.75% maximum initial sales charge; Class B: contingent deferred sales charge (CDSC) declining from 4% to 1% over six years, and eliminated thereafter; Class C: 1% CDSC in first year only;
Class R/Advisor Class: no sales charges.
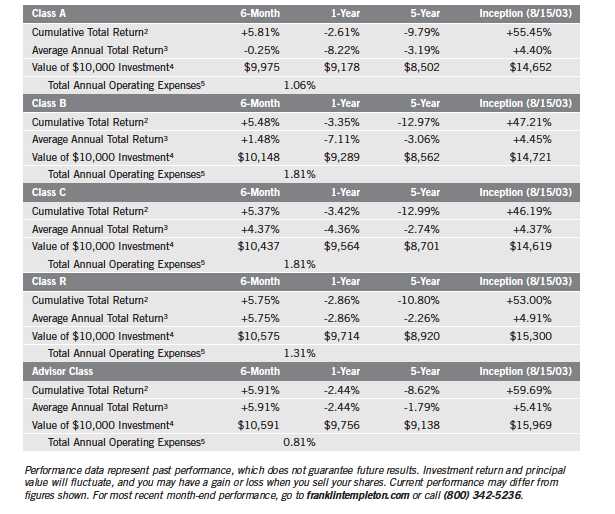
Semiannual Report | 15
Performance Summary (continued)
Endnotes
All investments involve risks, including possible loss of principal. Because the Fund invests in underlying funds that may engage in a variety of investment strategies involving certain risks, the Fund may be subject to these same risks. Stock prices fluctuate, sometimes rapidly and dramatically, due to factors affecting individual companies, particular industries or sectors, or general market conditions. Bonds are affected by changes in interest rates and the creditworthiness of their issuers. Bond prices generally move in the opposite direction of interest rates. Thus, as the prices of bonds adjust to a rise in interest rates, the Fund s share price may decline. Higher yielding, lower rated corporate bonds entail a greater degree of credit risk compared to investment-grade securities. Foreign investing carries additional risks such as currency and market volatility and political or social instability, risks that are heightened in developing countries. Value securities may not increase in price as anticipated or may decline further in value. The Fund s prospectus also includes a description of the main investment risks.
Class B: These shares have higher annual fees and expenses than Class A shares.
Class C: Prior to 1/1/04, these shares were offered with an initial sales charge; thus actual total returns would have differed. These shares
have higher annual fees and expenses than Class A shares.
Class R: Shares are available to certain eligible investors as described in the prospectus. These shares have higher annual fees and expenses
than Class A shares.
Advisor Class: Shares are available to certain eligible investors as described in the prospectus.
1. Past expense reductions by the administrator increased the Fund s total returns. Without these reductions, the Fund s total returns would have
been lower.
2. Cumulative total return represents the change in value of an investment over the periods indicated.
3. Average annual total return represents the average annual change in value of an investment over the periods indicated. Six-month return has not
been annualized.
4. These figures represent the value of a hypothetical $10,000 investment in the Fund over the periods indicated.
5. Figures are as stated in the Fund s prospectus current as of the date of this report and include the effect of acquired fund fees and expenses. In
periods of market volatility, assets may decline significantly, causing total annual Fund operating expenses to become higher than the figures shown.
16 | Semiannual Report
Your Fund s Expenses
Franklin Templeton Founding Funds Allocation Fund
As a Fund shareholder, you can incur two types of costs:
- Transaction costs, including sales charges (loads) on Fund purchases; and
- Ongoing Fund costs, including management fees, distribution and service (12b-1) fees, and other Fund expenses. All mutual funds have ongoing costs, sometimes referred to as operating expenses.
The following table shows ongoing costs of investing in the Fund and can help you understand these costs and compare them with those of other mutual funds. The table assumes a $1,000 investment held for the six months indicated.
Actual Fund Expenses
The first line (Actual) for each share class listed in the table provides actual account values and expenses. The Ending Account Value is derived from the Fund s actual return, which includes the effect of Fund expenses.
You can estimate the expenses you paid during the period by following these steps. Of course, your account value and expenses will differ from those in this illustration:
| 1. | Divide your account value by $1,000. |
| | If an account had an $8,600 value, then $8,600 ÷ $1,000 = 8.6. |
| 2. | Multiply the result by the number under the heading Expenses Paid During Period. |
| | If Expenses Paid During Period were $7.50, then 8.6 x $7.50 = $64.50. |
In this illustration, the estimated expenses paid this period are $64.50.
Hypothetical Example for Comparison with Other Funds
Information in the second line (Hypothetical) for each class in the table can help you compare ongoing costs of investing in the Fund with those of other mutual funds. This information may not be used to estimate the actual ending account balance or expenses you paid during the period. The hypothetical Ending Account Value is based on the actual expense ratio for each class and an assumed 5% annual rate of return before expenses, which does not represent the Fund s actual return. The figure under the heading Expenses Paid During Period shows the hypothetical expenses your account would have incurred under this scenario. You can compare this figure with the 5% hypothetical examples that appear in shareholder reports of other funds.
Semiannual Report | 17
Your Fund s Expenses (continued)
Please note that expenses shown in the table are meant to highlight ongoing costs and do not reflect any transaction costs, such as sales charges. Therefore, the second line for each class is useful in comparing ongoing costs only, and will not help you compare total costs of owning different funds. In addition, if transaction costs were included, your total costs would have been higher. Please refer to the Fund prospectus for additional information on operating expenses.

*Expenses are calculated using the most recent six-month expense ratio excluding expenses of the underlying funds, annualized for each class
(A: 0.33%; B: 1.08%; C: 1.08%; R: 0.58%; and Advisor: 0.08%), multiplied by the average account value over the period, multiplied by 182/366 to
reflect the one-half year period.
**Expenses are calculated using the most recent six-month expense ratio including expenses of the underlying funds, annualized for each class
(A: 1.06%; B: 1.81%; C: 1.81%; R: 1.31%; and Advisor: 0.81%), multiplied by the average account value over the period, multiplied by 182/366 to
reflect the one-half year period.
18 | Semiannual Report
Franklin Templeton Fund Allocator Series
Financial Highlights
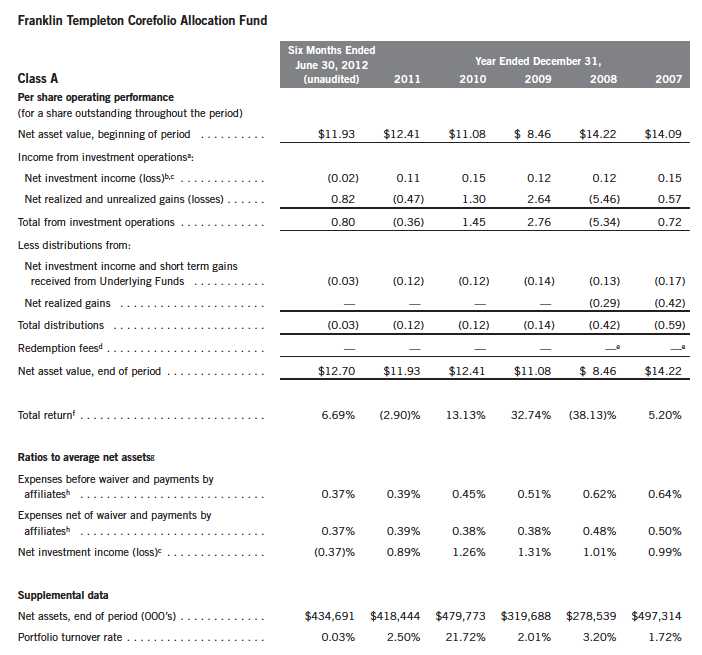
aThe amount shown for a share outstanding throughout the period may not correlate with the Statement of Operations for the period due to the timing of sales and repurchases of
the Fund shares in relation to income earned and/or fluctuating market value of the investments of the Fund.
bBased on average daily shares outstanding.
cRecognition of net investment income by the Fund is affected by the timing of declaration of dividends by the Underlying Funds in which the Fund invests.
dEffective September 1, 2008, the redemption fee was eliminated.
eAmount rounds to less than $0.01 per share.
fTotal return does not reflect sales commissions or contingent deferred sales charges, if applicable, and is not annualized for periods less than one year.
gRatios are annualized for periods less than one year.
hDoes not include expenses of the Underlying Funds in which the Fund invests. The weighted average indirect expenses of the Underlying Funds were 0.78% for the period ended
June 30, 2012.
Semiannual Report | The accompanying notes are an integral part of these financial statements. | 19
Franklin Templeton Fund Allocator Series
Financial Highlights (continued)

Franklin Templeton Fund Allocator Series
Financial Highlights (continued)

Franklin Templeton Fund Allocator Series
Financial Highlights (continued)
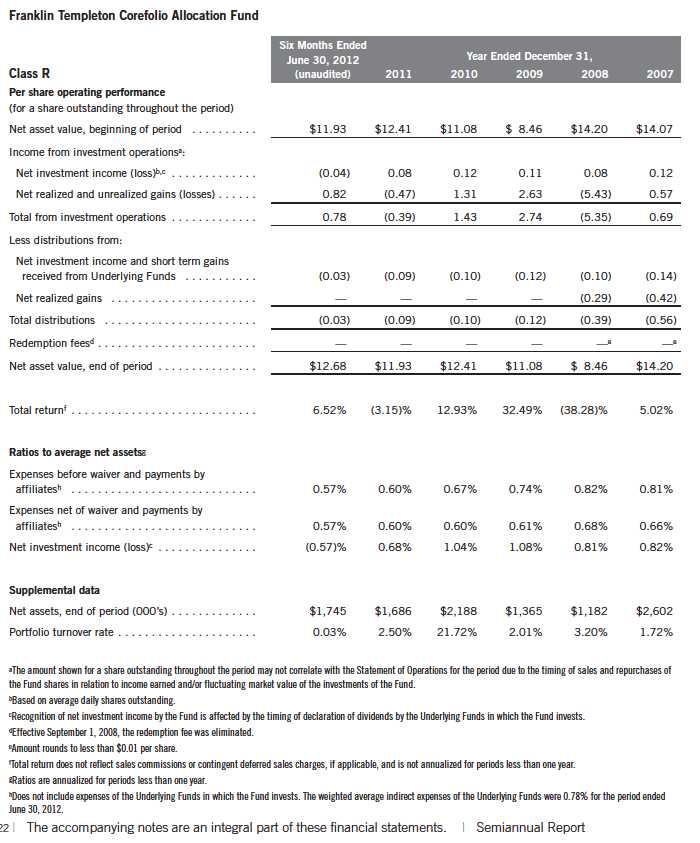
Franklin Templeton Fund Allocator Series
Financial Highlights (continued)
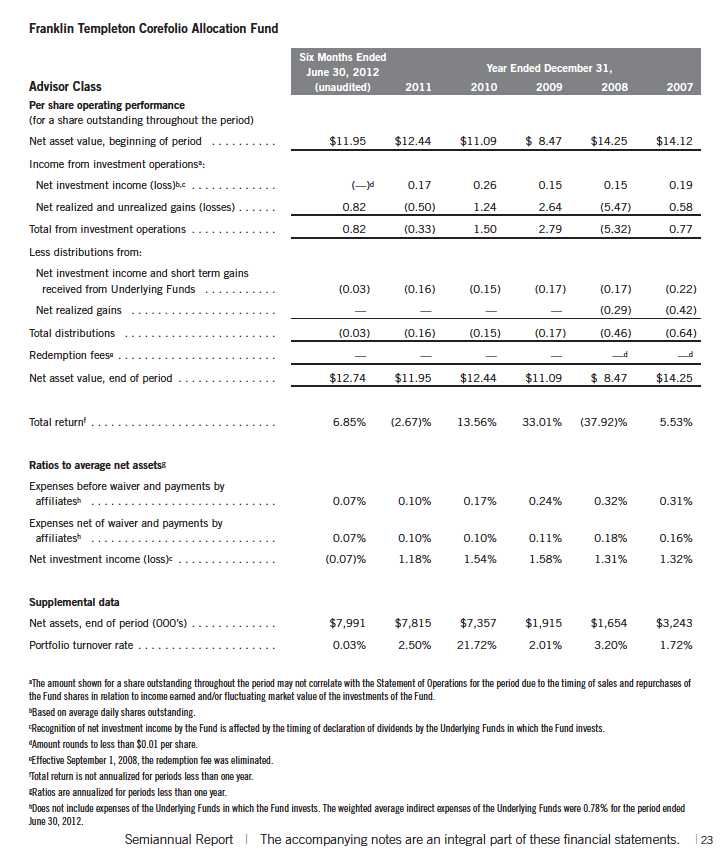
Franklin Templeton Fund Allocator Series
Statement of Investments, June 30, 2012 (unaudited)

24 | The accompanying notes are an integral part of these financial statements. | Semiannual Report
Franklin Templeton Fund Allocator Series
Financial Highlights
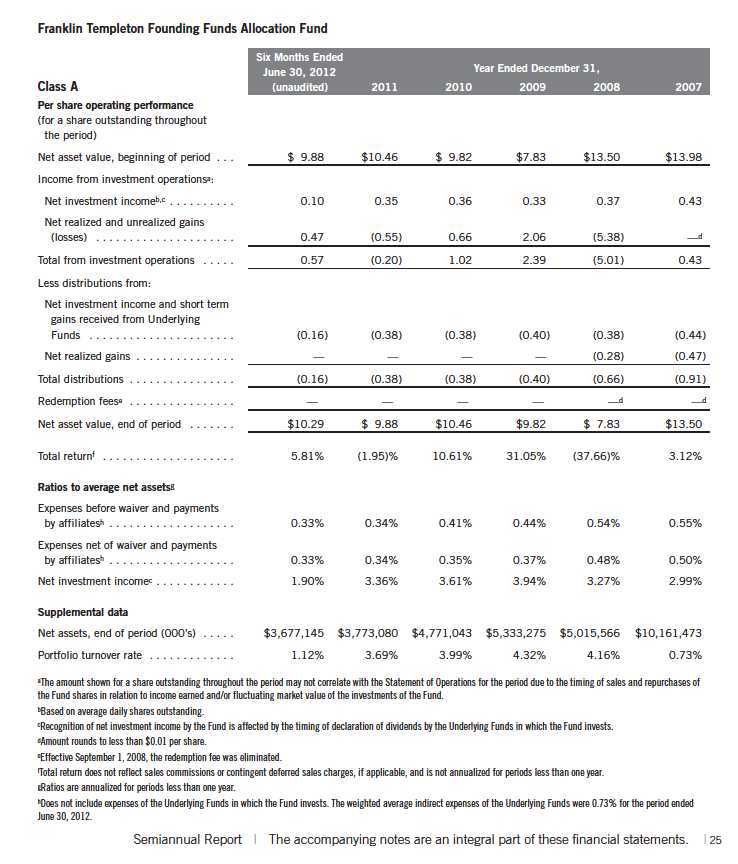
Franklin Templeton Fund Allocator Series
Financial Highlights (continued)

Franklin Templeton Fund Allocator Series
Financial Highlights (continued)
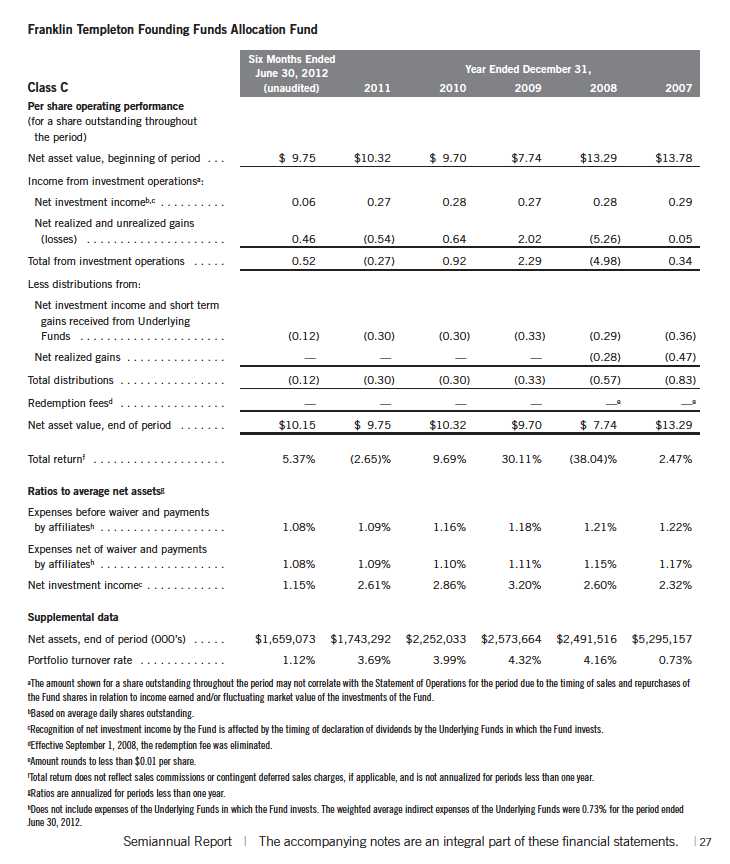
Franklin Templeton Fund Allocator Series
Financial Highlights (continued)
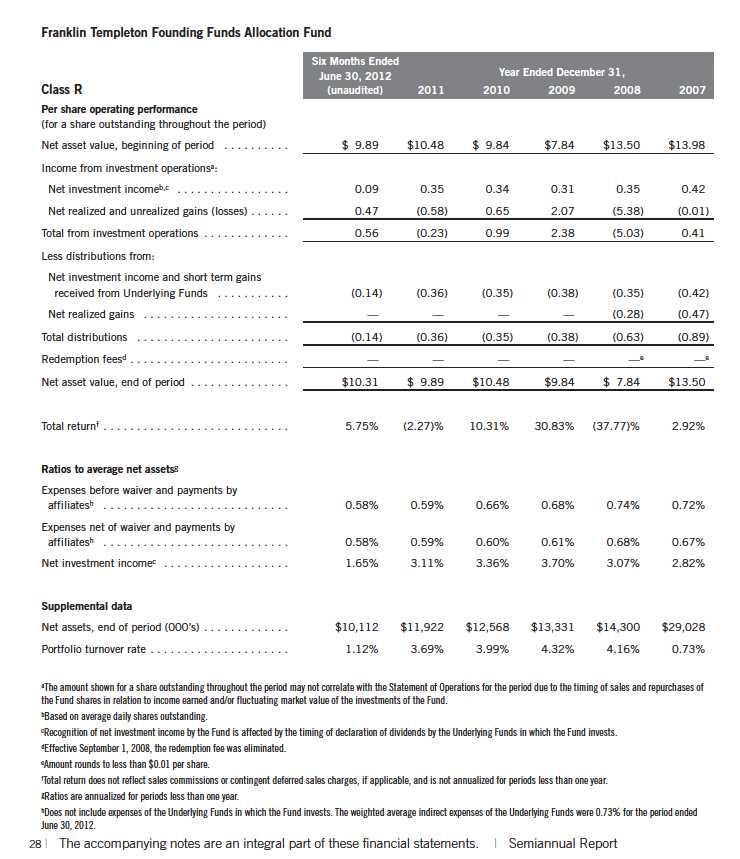
Franklin Templeton Fund Allocator Series
Financial Highlights (continued)
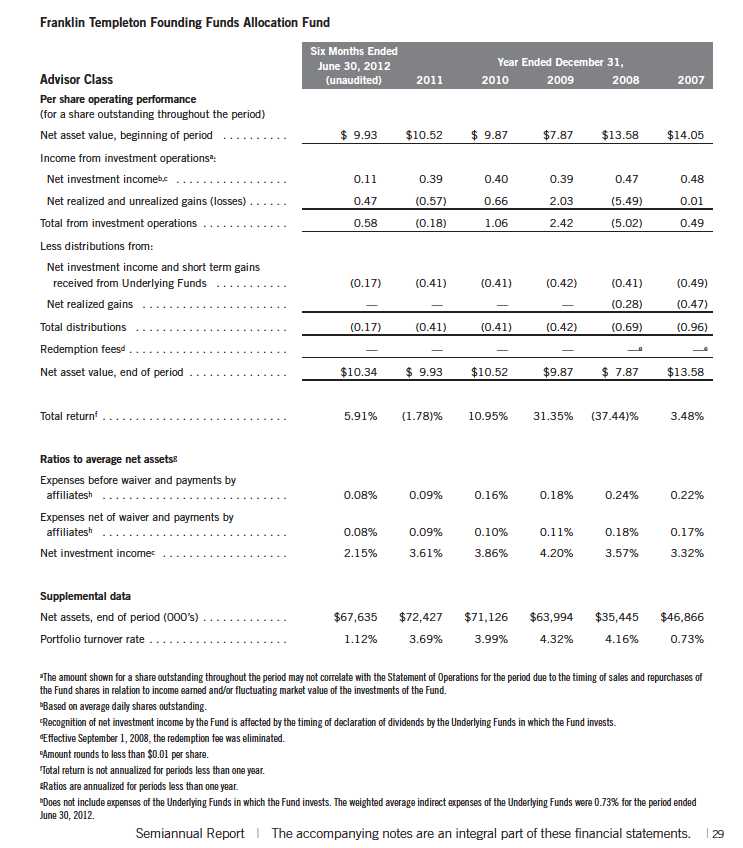
Franklin Templeton Fund Allocator Series
Statement of Investments, June 30, 2012 (unaudited)
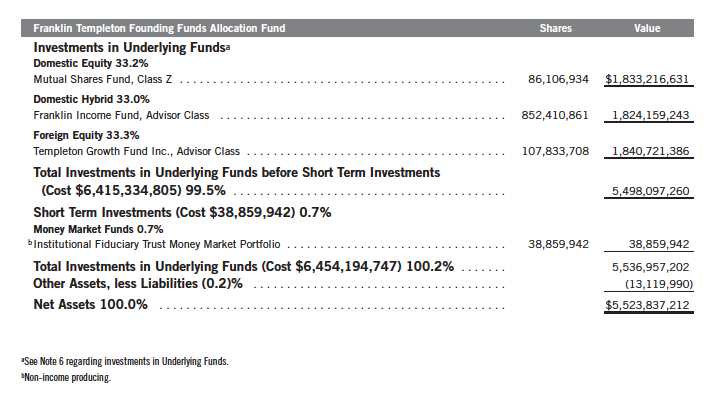
30 | The accompanying notes are an integral part of these financial statements. | Semiannual Report
Franklin Templeton Fund Allocator Series
Financial Statements
Statements of Assets and Liabilities
June 30, 2012 (unaudited)
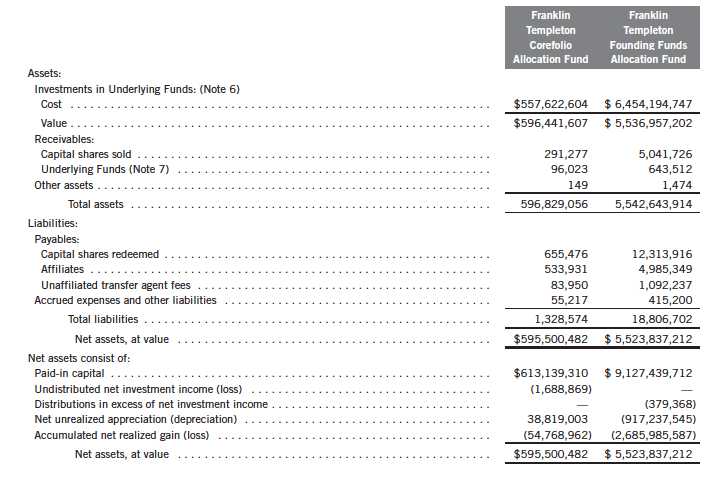
Semiannual Report | The accompanying notes are an integral part of these financial statements. | 31
Franklin Templeton Fund Allocator Series
Financial Statements (continued)
Statements of Assets and Liabilities (continued)
June 30, 2012 (unaudited)
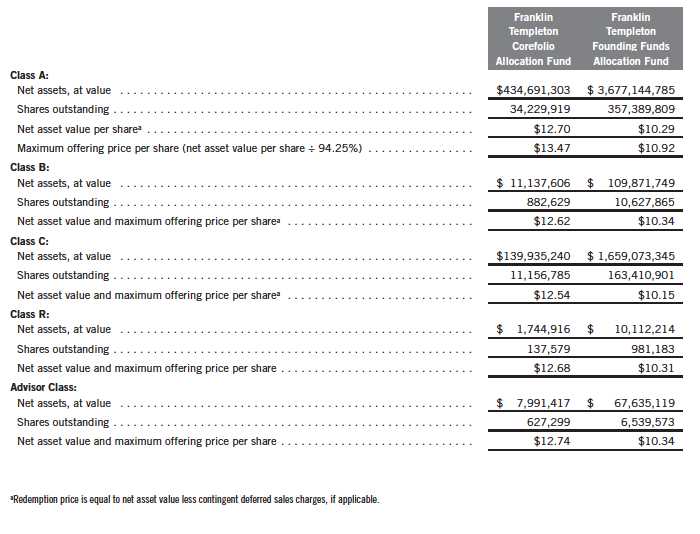
32 | The accompanying notes are an integral part of these financial statements. | Semiannual Report
Franklin Templeton Fund Allocator Series
Financial Statements (continued)
Statements of Operations
for the six months ended June 30, 2012 (unaudited)
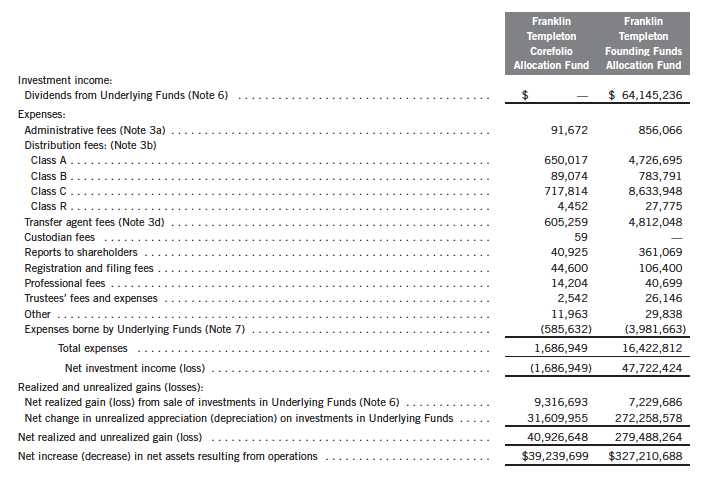
Semiannual Report | The accompanying notes are an integral part of these financial statements. | 33
Franklin Templeton Fund Allocator Series
Financial Statements (continued)
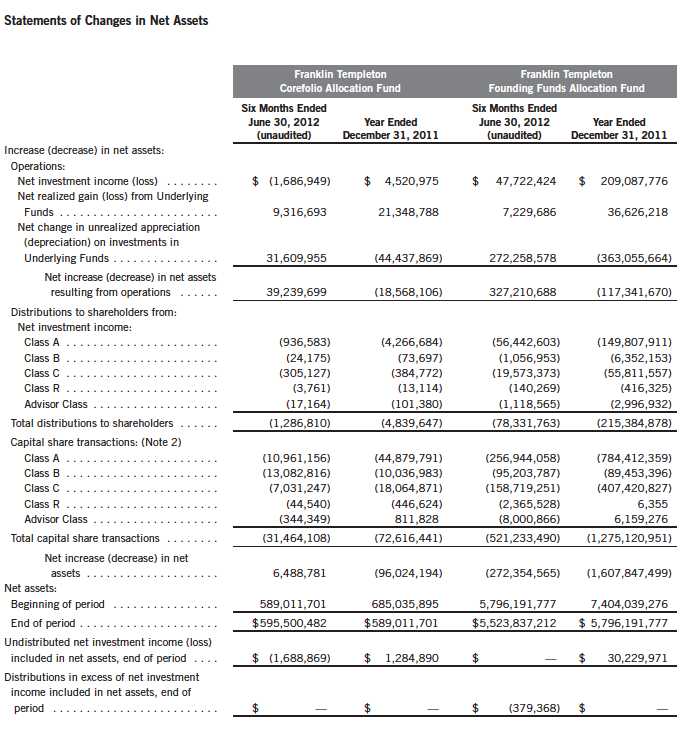
34 | The accompanying notes are an integral part of these financial statements. | Semiannual Report
Franklin Templeton Fund Allocator Series
Notes to Financial Statements (unaudited)
1. ORGANIZATION AND SIGNIFICANT ACCOUNTING POLICIES
Franklin Templeton Fund Allocator Series (Trust) is registered under the Investment Company Act of 1940, as amended, (1940 Act) as an open-end investment company, consisting of ten separate funds, two of which are included in this report (Funds). The financial statements of the remaining funds in the Trust are presented separately. The Funds invest primarily in Franklin Templeton mutual funds (Underlying Funds). The Funds offer five classes of shares: Class A, Class B, Class C, Class R, and Advisor Class. Each class of shares differs by its initial sales load, contingent deferred sales charges, distribution fees, voting rights on matters affecting a single class and its exchange privilege.
The following summarizes the Funds significant accounting policies.
a. Financial Instrument Valuation
The Funds investments in financial instruments are carried at fair value daily. Fair value is the price that would be received to sell an asset or paid to transfer a liability in an orderly transaction between market participants on the measurement date. Under procedures approved by the Trust s Board of Trustees (the Board), the Funds administrator and other affiliates have formed the Valuation and Liquidity Oversight Committee (VLOC). The VLOC provides administration and oversight of the Funds valuation policies and procedures, which are approved annually by the Board. Investments in the Underlying Funds are valued at their closing net asset value each trading day.
b. Income Taxes
It is each fund s policy to qualify as a regulated investment company under the Internal Revenue Code. Each fund intends to distribute to shareholders substantially all of its taxable income and net realized gains to relieve it from federal income and if applicable, excise taxes. As a result, no provision for U.S. federal income taxes is required.
Each fund recognizes the tax benefits of uncertain tax positions only when the position is more likely than not to be sustained upon examination by the tax authorities based on the technical merits of the tax position. As of June 30, 2012, and for all open tax years, each fund has determined that no liability for unrecognized tax benefits is required in each fund s financial statements related to uncertain tax positions taken on a tax return (or expected to be taken on future tax returns). Open tax years are those that remain subject to examination and are based on each tax jurisdiction statute of limitation.
c. Security Transactions, Investment Income, Expenses and Distributions
Security transactions are accounted for on trade date. Realized gains and losses on security transactions are determined on a specific identification basis. Estimated expenses are accrued daily. Dividend income is recorded on the ex-dividend date. Distributions to shareholders are recorded on the ex-dividend date and are determined according to income tax regulations (tax basis).
Semiannual Report | 35
Franklin Templeton Fund Allocator Series
Notes to Financial Statements (unaudited) (continued)
| 1. | ORGANIZATION AND SIGNIFICANT ACCOUNTING POLICIES (continued) |
| c. | Security Transactions, Investment Income, Expenses and Distributions (continued) |
Distributable earnings determined on a tax basis may differ from earnings recorded in accordance with accounting principles generally accepted in the United States of America. These differences may be permanent or temporary. Permanent differences are reclassified among capital accounts to reflect their tax character. These reclassifications have no impact on net assets or the results of operations. Temporary differences are not reclassified, as they may reverse in subsequent periods.
Common expenses incurred by the Trust are allocated among the Funds based on the ratio of net assets of each fund to the combined net assets of the Trust. Fund specific expenses are charged directly to the fund that incurred the expense.
The Funds indirectly bear their proportionate share of expenses from the Underlying Funds. Since the Underlying Funds have varied expense levels and the Funds may own different proportions of the Underlying Funds at different times, the amount of expenses incurred indirectly by the Funds will vary.
Realized and unrealized gains and losses and net investment income, not including class specific expenses, are allocated daily to each class of shares based upon the relative proportion of net assets of each class. Differences in per share distributions, by class, are generally due to differences in class specific expenses.
d. Accounting Estimates
The preparation of financial statements in accordance with accounting principles generally accepted in the United States of America requires management to make estimates and assumptions that affect the reported amounts of assets and liabilities at the date of the financial statements and the amounts of income and expenses during the reporting period. Actual results could differ from those estimates.
e. Guarantees and Indemnifications
Under the Trust s organizational documents, its officers and trustees are indemnified by the Trust against certain liabilities arising out of the performance of their duties to the Trust. Additionally, in the normal course of business, the Trust, on behalf of the Funds, enters into contracts with service providers that contain general indemnification clauses. The Trust s maximum exposure under these arrangements is unknown as this would involve future claims that may be made against the Trust that have not yet occurred. Currently, the Trust expects the risk of loss to be remote.
36 | Semiannual Report
Franklin Templeton Fund Allocator Series
Notes to Financial Statements (unaudited) (continued)
2. SHARES OF BENEFICIAL INTEREST
At June 30, 2012, there were an unlimited number of shares authorized (without par value).
Transactions in the Funds shares were as follows:
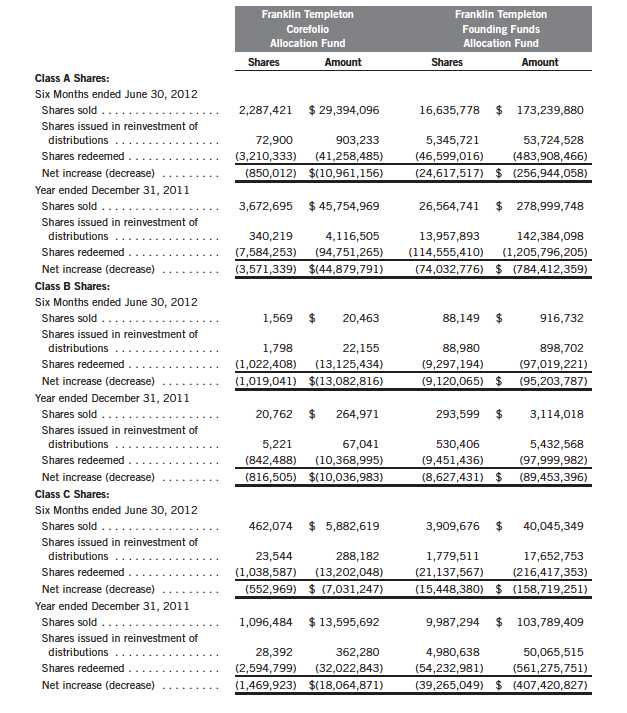
Semiannual Report | 37
Franklin Templeton Fund Allocator Series
Notes to Financial Statements (unaudited) (continued)
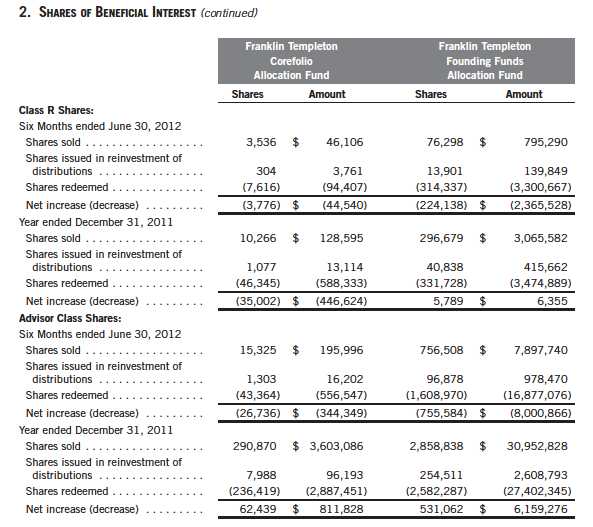
3. TRANSACTIONS WITH AFFILIATES
Franklin Resources, Inc. is the holding company for various subsidiaries that together are referred to as Franklin Templeton Investments. Certain officers and trustees of the Funds are also officers and/or directors/trustees of certain of the Underlying Funds and of the following subsidiaries:
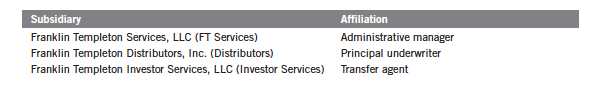
38 | Semiannual Report
Franklin Templeton Fund Allocator Series
Notes to Financial Statements (unaudited) (continued)
| 3. | TRANSACTIONS WITH AFFILIATES (continued) |
| a. | Administrative Fees |
The Funds pay an administrative fee to FT Services of 0.03% per year of the average daily net assets of each of the Funds for administrative services including monitoring and rebalancing the percentage of each Fund s investment in the Underlying Funds.
b. Distribution Fees
The Board has adopted distribution plans for each share class, with the exception of Advisor Class shares, pursuant to Rule 12b-1 under the 1940 Act. Under the Funds Class A reimbursement distribution plans, the Funds reimburse Distributors for costs incurred in connection with the servicing, sale and distribution of each Funds shares up to the maximum annual plan rate for each class. Under the Class A reimbursement distribution plans, costs exceeding the maximum for the current plan year cannot be reimbursed in subsequent periods.
In addition, under the Funds Class B, C and R compensation distribution plans, the Funds pay Distributors for costs incurred in connection with the servicing, sale and distribution of each fund s shares up to the maximum annual plan rate for each class.
The maximum annual plan rates, based on the average daily net assets, for each class, are as follows:
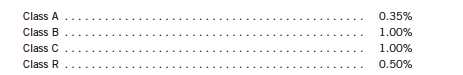
The Board has set the current rate at 0.30% per year for Class A shares for the Franklin Templeton Corefolio Allocation Fund and at 0.25% for Class A for the Franklin Templeton Founding Funds Allocation Fund until further notice and approval by the Board.
c. Sales Charges/Underwriting Agreements
Front-end sales charges and contingent deferred sales charges (CDSC) do not represent expenses of the Funds. These charges are deducted from the proceeds of sales of fund shares prior to investment or from redemption proceeds prior to remittance, as applicable. Distributors has advised the Funds of the following commission transactions related to the sales and redemptions of the Funds shares for the period:
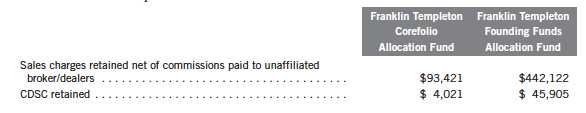
Semiannual Report | 39
Franklin Templeton Fund Allocator Series
Notes to Financial Statements (unaudited) (continued)
| 3. | TRANSACTIONS WITH AFFILIATES (continued) |
| d. | Transfer Agent Fees |
For the period ended June 30, 2012, the Funds paid transfer agent fees as noted in the Statements of Operations of which the following amounts were retained by Investor Services:
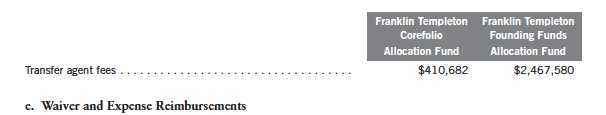
FT Services has contractually agreed in advance to waive or limit its fees and to assume as its own expense certain expenses otherwise payable by the Funds so that the common expenses (i.e. a combination of administrative fees and other expenses, but excluding distribution fees, and acquired fund fees and expenses) for each class of the Funds do not exceed 0.10% (other than certain non-routine expenses or costs, including those relating to litigation, indemnification, reorganizations, and liquidations) until April 30, 2013. For the period ended June 30, 2012, no expenses have been waived or limited.
4. INCOME TAXES
For tax purposes, capital losses may be carried over to offset future capital gains, if any. Capital loss carryforwards with no expiration, if any, must be fully utilized before those losses with expiration dates.
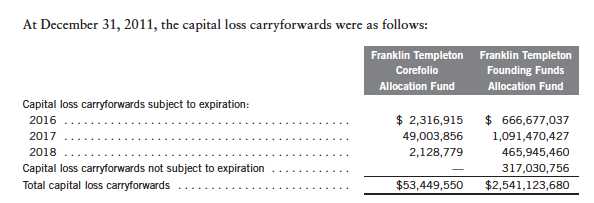
For tax purposes, the Funds may elect to defer any portion of a post-October capital loss to the first day of the following fiscal year. At December 31, 2011, the Franklin Templeton Founding Funds Allocation Fund deferred post-October capital losses of $25,074,004.
40 | Semiannual Report
Franklin Templeton Fund Allocator Series
Notes to Financial Statements (unaudited) (continued)
4. INCOME TAXES (continued)
At June 30, 2012, the cost of investments and net unrealized appreciation (depreciation) for income tax purposes were as follows:
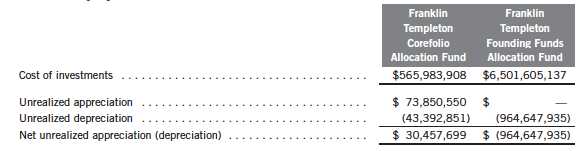
Differences between income and/or capital gains as determined on a book basis and a tax basis are primarily due to differing treatment of wash sales.
5. INVESTMENT TRANSACTIONS
Purchases and sales of Underlying Funds (excluding short term securities) for the period ended June 30, 2012, were as follows:

6. INVESTMENTS IN UNDERLYING FUNDS
The Funds invest primarily in the Underlying Funds which are managed by Franklin Advisers, Inc. (Advisers), an affiliate of FT Services, or by an affiliate of Advisers. The Funds do not invest in the Underlying Funds for the purpose of exercising a controlling influence over the management or policies.
The Funds may invest in the Institutional Fiduciary Trust Money Market Portfolio (Sweep Money Fund), an open-end investment company managed by Advisers. Administrative fees are reduced on assets invested in the Sweep Money Fund, in an amount not to exceed the management and administrative fees paid by the Sweep Money Fund.
Semiannual Report | 41
Franklin Templeton Fund Allocator Series
Notes to Financial Statements (unaudited) (continued)
6. INVESTMENTS IN UNDERLYING FUNDS (continued)
Investments in Underlying Funds for the period ended June 30, 2012, were as follows:
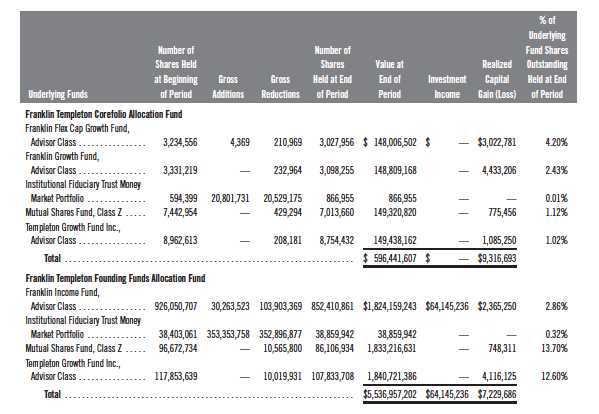
7. SPECIAL SERVICING AGREEMENT
The Funds participate in a Special Servicing Agreement (SSA) with the Underlying Funds and certain service providers of the Funds and of the Underlying Funds. Under the SSA, each Underlying Fund may pay a portion of the Funds expenses (other than any administrative and distribution fees) to the extent such payments are less than the amount of the benefits realized or expected to be realized by the Underlying Fund (e.g., due to reduced costs associated with servicing accounts) from the investment in the Underlying Fund by the Funds. The amount of expenses borne by the Underlying Funds during the period ended June 30, 2012 is noted in the Statements of Operations.
8. CREDIT FACILITY
The Funds, together with other U.S. registered and foreign investment funds (collectively, Borrowers), managed by Franklin Templeton Investments, are borrowers in a joint syndicated senior unsecured credit facility totaling $1.5 billion (Global Credit Facility) which matures on January 18, 2013. This Global Credit Facility provides a source of funds to the Borrowers for temporary and emergency purposes, including the ability to meet future unanticipated or unusually large redemption requests.
42 | Semiannual Report
Franklin Templeton Fund Allocator Series
Notes to Financial Statements (unaudited) (continued)
8. CREDIT FACILITY (continued)
Under the terms of the Global Credit Facility, the Funds shall, in addition to interest charged on any borrowings made by the Funds and other costs incurred by the Funds, pay their share of fees and expenses incurred in connection with the implementation and maintenance of the Global Credit Facility, based upon their relative share of the aggregate net assets of all of the Borrowers, including an annual commitment fee of 0.08% based upon the unused portion of the Global Credit Facility, which is reflected in other expenses on the Statements of Operations. During the period ended June 30, 2012, the Funds did not use the Global Credit Facility.
9. FAIR VALUE MEASUREMENTS
The Funds follow a fair value hierarchy that distinguishes between market data obtained from independent sources (observable inputs) and the Funds own market assumptions (unobservable inputs). These inputs are used in determining the value of the Funds financial instruments and are summarized in the following fair value hierarchy:
- Level 1 quoted prices in active markets for identical financial instruments
- Level 2 other significant observable inputs (including quoted prices for similar financial instruments, interest rates, prepayment speed, credit risk, etc.)
- Level 3 significant unobservable inputs (including the Funds own assumptions in determining the fair value of financial instruments)
The inputs or methodology used for valuing financial instruments are not an indication of the risk associated with investing in those financial instruments.
For movements between the levels within the fair value hierarchy, the Funds have adopted a policy of recognizing the transfers as of the date of the underlying event which caused the movement.
At June 30, 2012, all of the Funds investments in financial instruments carried at fair value were valued using Level 1 inputs. For detailed categories, see the accompanying Statements of Investments.
10. NEW ACCOUNTING PRONOUNCEMENTS
In December 2011, the Financial Accounting Standards Board (FASB) issued Accounting Standards Update (ASU) No. 2011-11, Balance Sheet (Topic 210): Disclosures about Offsetting Assets and Liabilities. The amendments in the ASU enhance disclosures about offsetting of financial assets and liabilities to enable investors to understand the effect of these arrangements on a fund s financial position. The ASU is effective for interim and annual reporting periods beginning on or after January 1, 2013. The Funds believe the adoption of this ASU will not have a material impact on their financial statements.
11. SUBSEQUENT EVENTS
The Funds have evaluated subsequent events through the issuance of the financial statements and determined that no events have occurred that require disclosure.
Semiannual Report | 43
Franklin Templeton Fund Allocator Series
Shareholder Information
Board Review of Investment Management Agreement
At a meeting held February 28, 2012, the Board of Trustees (Board), including a majority of non-interested or independent Trustees, approved renewal of the investment management agreement for each of the separate funds within Franklin Templeton Fund Allocator Series (Fund(s)). In reaching its decision to approve renewal of the investment management agreements, the Board took into account information furnished throughout the year at regular Board meetings, as well as information prepared specifically in connection with the annual renewal review process. Information furnished and discussed throughout the year included investment performance reports and related financial information for each Fund, as well as periodic reports on expenses, shareholder services, legal and compliance matters, pricing, brokerage commissions and execution and other services provided by the Investment Manager (Manager) and its affiliates. Information furnished specifically in connection with the renewal process included a report for each Fund prepared by Lipper, Inc. (Lipper), an independent organization, as well as additional material, including a Fund profitability analysis prepared by management. The Lipper reports compared each Fund s investment performance and expenses with those of other mutual funds deemed comparable to the Fund as selected by Lipper. The Fund profitability analysis discussed the profitability to Franklin Templeton Investments from its overall U.S. fund operations, as well as on an individual fund-by-fund basis. Additional material accompanying such profitability analysis included information on a fund-by-fund basis listing portfolio managers and other accounts they manage, as well as information on management fees charged by the Manager and its affiliates to U.S. mutual funds and other accounts, including management s explanation of differences where relevant. Such material also included a memorandum prepared by management describing project initiatives and capital investments relating to the services provided to the Funds by the Franklin Templeton Investments organization, as well as a memorandum relating to economies of scale and an analysis concerning transfer agent fees charged by an affiliate of the Manager.
In considering such materials, the independent Trustees received assistance and advice from and met separately with independent counsel. While the investment management agreements for all Funds were considered at the same Board meeting, the Board dealt with each Fund separately. In approving continuance of the investment management agreement for each Fund, the Board, including a majority of independent Trustees, determined that the existing management fee structure was fair and reasonable and that continuance of the investment management agreement was in the best interests of each Fund and its shareholders. While attention was given to all information furnished, the following discusses some primary factors relevant to the Board s decision.
NATURE, EXTENT AND QUALITY OF SERVICE. The Board was satisfied with the nature and quality of the overall services provided by the Manager and its affiliates to the Funds and their shareholders. In addition to investment performance and expenses discussed later, the Board s opinion was based, in part, upon periodic reports furnished it showing that the investment policies and restrictions for each Fund were consistently complied with as well as other reports periodically furnished the Board covering matters such as the compliance of portfolio managers and other
44 | Semiannual Report
Franklin Templeton Fund Allocator Series
Shareholder Information (continued)
Board Review of Investment Management Agreement (continued)
management personnel with the code of ethics adopted throughout the Franklin Templeton fund complex, the adherence to fair value pricing procedures established by the Board, and the accuracy of net asset value calculations. The Board also noted the extent of benefits provided Fund shareholders from being part of the Franklin Templeton family of funds, including the right to exchange investments between the same class of funds without a sales charge, the ability to reinvest Fund dividends into other funds and the right to combine holdings in other funds to obtain a reduced sales charge. Favorable consideration was given to management s continuous efforts and expenditures in establishing back-up systems and recovery procedures to function in the event of a natural disaster, it being noted that such systems and procedures had functioned smoothly during the Florida hurricanes and blackouts experienced in previous years. Among other factors taken into account by the Board were the Manager s best execution trading policies, including a favorable report by an independent portfolio trading analytical firm, which also covered FOREX transactions. Consideration was also given to the experience of each Fund s portfolio management team, the number of accounts managed and general method of compensation. In this latter respect, the Board noted that a primary factor in management s determination of a portfolio manager s bonus compensation was the relative investment performance of the funds he or she managed and that a portion of such bonus was required to be invested in a predesignated list of funds within such person s fund management area so as to be aligned with the interests of shareholders. The Board also took into account the quality of transfer agent and shareholder services provided Fund shareholders by an affiliate of the Manager and the continuous enhancements to the Franklin Templeton website. Particular attention was given to management s conservative approach and diligent risk management procedures, including continuous monitoring of counterparty credit risk and attention given to derivatives and other complex instruments including expanded collateralization requirements. The Board also took into account, among other things, management s efforts in establishing a global credit facility for the benefit of the Funds and other accounts managed by Franklin Templeton Investments to provide a source of cash for temporary and emergency purposes or to meet unusual redemption requests as well as the strong financial position of the Manager s parent company and its commitment to the mutual fund business as evidenced by its subsidization of money market funds.
INVESTMENT PERFORMANCE. The Board placed significant emphasis on the investment performance of each Fund in view of its importance to shareholders. While consideration was given to performance reports and discussions with portfolio managers at Board meetings throughout the year, particular attention in assessing performance was given to the Lipper reports furnished for the agreement renewals. The Lipper reports prepared for each individual Fund showed the investment performance of its Class A shares in comparison to a performance universe selected by Lipper. Comparative performance for each Fund was shown for the one-year period ended December 31, 2011, and for additional periods ended that date depending on when a particular Fund commenced operations. The following summarizes the performance results for each of the Funds and the Board s view of such performance.
Semiannual Report | 45
Franklin Templeton Fund Allocator Series
Shareholder Information (continued)
Board Review of Investment Management Agreement (continued)
Franklin Templeton Corefolio Allocation Fund The performance universe for this Fund consisted of the Fund and all retail and institutional multi-cap core funds as selected by Lipper. The Fund has been in operation for less than 10 years and the Lipper report showed its 2011 total return to be in the middle quintile of such universe, and its total return on an annualized basis to be in the middle quintile of such universe for the previous three-year period and the second-lowest quintile of such universe for the previous five-year period. The Fund s performance reflects those of the four underlying funds in which it invests in approximately equal allocations, and the Board has reviewed such performance and discussed with management the relative performance of certain of such underlying funds. Based on such review and discussions, the Board believes the Fund s investment strategy continues to be an appropriate one with no change in such strategy or portfolio management being warranted, and noted that the Fund s cumulative five-year return as set forth in the Lipper report was within 60 basis points of the performance universe median.
Franklin Templeton Founding Funds Allocation Fund The performance universe for this Fund consisted of the Fund and all retail and institutional mixed-asset target allocation growth funds as selected by Lipper. This Fund has been in operation for less than 10 years and seeks income as a secondary goal. The Lipper report showed its income return for both the one-year period and each of the annualized three- and five-year periods to be in the highest quintile of such universe. The Lipper report showed the Fund s total return for the one-year period to be in the middle quintile of its Lipper performance universe, and on an annualized basis for the previous three- and five-year periods to be in the second-highest quintile and the lowest quintile, respectively, of such universe. The Fund s performance reflects that of the three underlying funds in which it invests in approximately equal allocations, and the Board has reviewed and discussed with management the relative total return performance of certain of such underlying funds. Based on such review and discussions, the Board believes the Fund s investment strategy continues to be an appropriate one with no change in such strategy or portfolio management being warranted.
COMPARATIVE EXPENSES. Consideration was given to the management fee and total expense ratios of each Fund compared with those of a group of retail front-end load fund of funds selected by Lipper as its appropriate Lipper expense group. Lipper expense data is based upon information taken from each such fund s most recent annual report, which reflects historical asset levels that may be quite different from those currently existing, particularly in a period of market volatility. While recognizing such inherent limitation and the fact that expense ratios generally increase as assets decline and decrease as assets grow, the Board believed the independent analysis conducted by Lipper to be an appropriate measure of comparative expenses. In reviewing comparative costs, Lipper provides information on each Fund s contractual investment management fee in comparison with the contractual investment management fee that would have been charged by other funds within its Lipper expense group assuming they were similar in size to the Fund, as well as the actual total expense ratios of the Funds including expenses of the underlying funds they invest in. The Board
46 | Semiannual Report
Franklin Templeton Fund Allocator Series
Shareholder Information (continued)
Board Review of Investment Management Agreement (continued)
noted that for Franklin Templeton Corefolio Allocation Fund and Franklin Templeton Founding Funds Allocation Fund there is no investment advisory contract or investment advisory fee, but only an administration agreement with FT Services, LLC. The Lipper contractual investment management fee analysis includes the advisory and administrative fees directly charged to each of the Funds as being part of the contractual investment management fee, with the investment management fees charged underlying funds being included within actual total expenses. Contractual investment management fees and total expenses for comparative consistency are shown by Lipper for Fund Class A shares. The Lipper expense reports noted in the case of each Fund that expenses had been subsidized by management fee waivers and reimbursements. In the case of Franklin Templeton Corefolio Allocation Fund, the Lipper report showed its contractual management fee rate as well as its actual expense ratio (including underlying fund expenses) to be in the least expensive quintile of its expense group. In the case of Franklin Templeton Founding Funds Allocation Fund, the Lipper report showed both its contractual management fee rate and its actual total expense ratio (including expenses of the underlying funds) to be below the median of its Lipper expense group. The Board was satisfied with the comparative expenses of these Funds as shown in the Lipper reports.
MANAGEMENT PROFITABILITY. The Board also considered the level of profits realized by the Manager and its affiliates in connection with the operation of each Fund. In this respect, the Board reviewed the Fund profitability analysis that addresses the overall profitability of Franklin Templeton s U.S. fund business, as well as its profits in providing management and other services to each of the individual funds during the 12-month period ended September 30, 2011, being the most recent fiscal year-end for Franklin Resources, Inc., the Manager s parent. In reviewing the analysis, attention was given to the methodology followed in allocating costs to each Fund, it being recognized that allocation methodologies are inherently subjective and various allocation methodologies may each be reasonable while producing different results. In this respect, the Board noted that, while being continuously refined and reflecting changes in the Manager s own cost accounting, the allocation methodology was consistent with that followed in profitability report presentations for the Funds made in prior years and that the Funds independent registered public accounting firm had been engaged by the Manager to review the reasonableness of the allocation methodologies solely for use by the Funds Board in reference to the profitability analysis. In reviewing and discussing such analysis, management discussed with the Board its belief that costs incurred in establishing the infrastructure necessary for the type of mutual fund operations conducted by the Manager and its affiliates may not be fully reflected in the expenses allocated to each Fund in determining its profitability, as well as the fact that the level of profits, to a certain extent, reflected operational cost savings and efficiencies initiated by management. The Board also took into account management s expenditures in improving shareholder services provided the Funds, as well as the need to implement systems and meet additional regulatory and compliance requirements resulting from statutes such as the Sarbanes-Oxley and Dodd-Frank Acts and recent SEC and other regulatory requirements. In addition, the Board considered a third-party study comparing the profitability of the Manager s parent on an overall basis to other publicly held managers broken down to show
Semiannual Report | 47
Franklin Templeton Fund Allocator Series
Shareholder Information (continued)
Board Review of Investment Management Agreement (continued)
profitability from management operations exclusive of distribution expenses, as well as profitability including distribution expenses. The Board also considered the extent to which the Manager and its affiliates might derive ancillary benefits from fund operations, including revenues generated from transfer agent services and potential benefits resulting from allocation of fund brokerage and the use of commission dollars to pay for research. Based upon its consideration of all these factors, and taking into account the fact that Fund expenses were being subsidized through fee waivers, the Board determined that the level of profits realized by the Manager and its affiliates from providing services to each Fund was not excessive in view of the nature, quality and extent of services provided.
ECONOMIES OF SCALE. The Board also considered whether economies of scale are realized by the Managers as the Funds grow larger and the extent to which this is reflected in the level of management fees charged. While recognizing that any precise determination is inherently subjective, the Board noted that based upon the Fund profitability analysis, it appears that as some funds get larger, at some point economies of scale do result in the Managers realizing a larger profit margin on management services provided such a fund. The Board also noted that economies of scale are shared with a fund and its shareholders through management fee breakpoints so that as a fund grows in size, its effective management fee rate declines. The management fees charged by all or substantially all the underlying funds in which the Funds invest provide for such management fee breakpoints. Consequently, to the extent economies of scale may be realized by the investment managers of these funds, the benefits are shared with each Fund and its shareholders through a reduction in actual total expense ratios.
Proxy Voting Policies and Procedures
The Trust s investment manager has established Proxy Voting Policies and Procedures (Policies) that the Trust uses to determine how to vote proxies relating to portfolio securities. Shareholders may view the Trust s complete Policies online at franklintempleton.com. Alternatively, shareholders may request copies of the Policies free of charge by calling the Proxy Group collect at (954) 527-7678 or by sending a written request to: Franklin Templeton Companies, LLC, 300 S.E. 2nd Street, Fort Lauderdale, FL 33301, Attention: Proxy Group. Copies of the Trust s proxy voting records are also made available online at franklintempleton.com and posted on the U.S. Securities and Exchange Commission s website at sec.gov and reflect the most recent 12-month period ended June 30.
Quarterly Statement of Investments
The Trust files a complete statement of investments with the U.S. Securities and Exchange Commission for the first and third quarters for each fiscal year on Form N-Q. Shareholders may view the filed Form N-Q by visiting the Commission s website at sec.gov. The filed form may also be viewed and copied at the Commission s Public Reference Room in Washington, DC. Information regarding the operations of the Public Reference Room may be obtained by calling (800) SEC-0330.
48 | Semiannual Report
This page intentionally left blank.
This page intentionally left blank.

Semiannual Report
Economic and Market Overview
The U.S. economy, as measured by gross domestic product, grew modestly dur-
ing the six-month period ended June 30, 2012, as personal income and spending
rose. The national unemployment rate for June 2012 stood at 8.2%, compared
with 8.5% at the start of the period.1 Job growth was more pronounced in the
first quarter, and jobless claims touched a four-year low; however, hiring slowed
in the second quarter. Industrial production and manufacturing activity expanded
during most of the period under review, but the manufacturing sector shrank
unexpectedly in June. In keeping with its goal to strengthen U.S. economic
recovery by fostering increased employment while keeping inflation in check,
during June the Federal Reserve Board (Fed) extended through 2012 its pro-
gram (dubbed Operation Twist) to buy long-term Treasuries in an attempt to
lower long-term yields. The Fed also reaffirmed its intention to keep the federal
funds target rate low at least through late 2014.
Global growth trends generally moderated, led by Europe, which narrowly
avoided recession mainly because of German export strength. Yet, even the
more resilient economies of Germany and China showed signs of a slowdown
at period-end. The combination of flagging growth, political uncertainty and
populist unrest pressured investor confidence, and ratings agencies down-
graded global banks and European sovereigns. Concerns about Italian and
Spanish borrowing costs added to investor anxiety as bond yields climbed.
Europe s initial policy responses including enhanced liquidity measures and
an ineffective Spanish banking bailout did little to address the structural
imbalances of eurozone economies or the solvency fears plaguing the region s
banking system.
Global developed stock markets, as measured by the MSCI World Index,
delivered the best annual start in more than a decade, as signs of U.S. eco-
nomic recovery and European policy relief underpinned a rally in cyclical
stocks. During late March and early April 2012, U.S. stocks, as measured by
the Standard & Poor s® 500 Index, reached multi-year highs.2 However,
stocks dropped sharply in late spring amid renewed global economic weak-
ness and European debt concerns before additional policy action prompted a
rebound in June. Politics largely drove the markets during the first half of
1. Source: Bureau of Labor Statistics.
2. STANDARD & POOR S®, S&P® and S&P 500® are registered trademarks of Standard & Poor s Financial Services LLC.
Semiannual Report | 3
2012 as investors closely monitored developments in Europe, where German-led austerity demands were met with increasing resentment from some highly indebted eurozone members. Fears of a Greek debt default and exit from the eurozone were somewhat mitigated in February by secured bailout financing and bondholder concessions, as well as May and June elections that resulted in the formation of a new coalition government. The Fed s Operation Twist purchases and risk-averse investors seeking safety drove U.S. Treasury yields to historical lows during the period. In the latter part of the period, the euro declined while the U.S. dollar and Japanese yen made gains.
At the end of the reporting period, significant challenges to the U.S. and global economies remained, including weak jobs reports, lack of broad public and political agreement on how to achieve U.S. deficit reduction, and uncertainty surrounding deeply indebted European countries including Greece, Italy and Spain. Although long-term resolution of European debt issues remained unclear, the European Central Bank s plan to allow the European Stability Mechanism to directly recapitalize troubled banks throughout the eurozone, as well as a late-June proposal leaning toward fiscal and banking union, supported cautious optimism in U.S. and global markets.
The foregoing information reflects our analysis and opinions as of June 30, 2012. The information is not a complete analysis of every aspect of any market, country, industry, security or fund. Statements of fact are from sources considered reliable.
4 | Semiannual Report
Franklin Templeton
2015 Retirement Target Fund
Your Fund s Goal and Main Investments: Franklin Templeton 2015 Retirement Target Fund seeks the highest level of long-term total return, which consists of capital appreciation and income, consistent with the Fund s asset allocation. The Fund allocates among the broad asset classes of equity, fixed income and short-term (money market) investments by investing in a distinctly weighted combination of Franklin Templeton mutual funds (underlying funds), with an increasing emphasis on income as the target date of 2015 approaches. The target date is the approximate retirement year of the investor.

This semiannual report for Franklin Templeton 2015 Retirement Target Fund covers the period ended June 30, 2012.
Performance Overview
Franklin Templeton 2015 Retirement Target Fund Class A posted a +3.25% cumulative total return for the six months ended June 30, 2012. By comparison, the Fund s equity benchmarks, the Standard & Poor s 500 Index (S&P 500®), a broad measure of U.S. stock performance, and the MSCI Europe, Australasia, Far East (EAFE) Index, which measures global stock performance for developed markets excluding the U.S. and Canada, posted total returns of +9.49% and +3.38%.1 The Fund s fixed income benchmark, the Barclays U.S. Aggregate Index, which tracks U.S. investment-grade bonds, posted a +2.37% total return.1 The Payden & Rygel (P&R) 90 Day U.S. T-Bill Index, a proxy for short-term investments and other net assets, had a +0.02% total return for the same period.1 You can find the Fund s long-term performance data in the Performance Summary beginning on page 8.
Investment Strategy
When selecting equity funds, we consider the foreign and domestic exposure, market capitalization ranges, and investment style (growth vs. value) of the
1. Source: © 2012 Morningstar. All Rights Reserved. The information contained herein: (1) is proprietary to Morningstar and/or its content providers; (2) may not be copied or distributed; and (3) is not warranted to be accurate, complete or timely. Neither Morningstar nor its content providers are responsible for any damages or losses arising from any use of this information. The indexes are unmanaged and include reinvestment of any income or distributions. One cannot invest directly in an index, and an index is not representative of the Fund s portfolio.
The dollar value, number of shares or principal amount, and names of all portfolio holdings are listed in the Fund s SOI, which begins on page 41.
Semiannual Report | 5
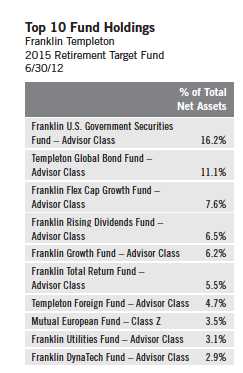
underlying Franklin Templeton funds and other fund investments (fund investments). When selecting fixed income funds, our primary focus is on maximizing income appropriate to the Fund s risk profile. In evaluating the risk level of the fund investments, we analyze such factors as: (a) relative and absolute performance, including correlations with other fund investments as well as corresponding benchmarks, and (b) their volatility (the variability of returns from one period to the next). We attempt to invest the assets of each Target Fund in the same fund investments and will vary the fund investments allocation percentages based upon each Fund s risk/return level. We change the Fund s target asset allocation over time, and it becomes increasingly conservative as the stated target date draws near. At the landing point (reached at the target date), the Fund reaches its most conservative asset allocation and thereafter, such strategic asset allocation will generally become fixed.
Manager s Discussion
The Fund s performance can be attributed largely to its allocation among equities, fixed income securities, and short-term investments and other net assets, and to the actual performance of the fund investments. This allocation shifts every year, in accordance with the retirement date associated with the portfolio.
At period-end, Franklin Templeton 2015 Retirement Target Fund allocated 49.8% of total net assets to equity and 37.8% to fixed income. Domestic equity exposure was 68.9% of the total equity weighting, and foreign equity made up the balance. The portfolio was diversified across capitalization sizes and investment styles, and on June 30, 2012, we held shares in large-, mid- and small-capitalization equity funds, representing both growth and value styles. Franklin Flex Cap Growth Fund Advisor Class, at 7.6% of the Fund s total net assets, was our largest equity fund weighting at period-end. On the fixed income side, domestic exposure was 65.1% of the Fund s total fixed income weighting, with the balance in foreign fixed income. Franklin U.S. Government Securities Fund Advisor Class was our largest fixed income fund weighting at 16.2% of total net assets.
Our largest domestic growth fund holding, Franklin Flex Cap Growth Fund Advisor Class, and our largest domestic value fund holding, Franklin Rising Dividends Fund Advisor Class, underperformed the S&P 500. Our largest foreign equity fund holding, Templeton Foreign Fund Advisor Class, under-performed the MSCI EAFE Index, while Mutual European Fund Class Z outperformed the index. On the fixed income side, Franklin U.S. Government Securities Fund Advisor Class underperformed the Barclay s U.S. Aggregate Index, and Templeton Global Bond Fund Advisor Class outperformed the index.
6 | Semiannual Report
Thank you for your continued participation in Franklin Templeton 2015 Retirement Target Fund. We look forward to serving your future investment needs.

CFA® is a trademark owned by CFA Institute.
The foregoing information reflects our analysis, opinions and portfolio holdings as of June 30, 2012, the end of the reporting period. The way we implement our main investment strategies and the resulting portfolio holdings may change depending on factors such as market and economic conditions. These opinions may not be relied upon as investment advice or an offer for a particular security. The information is not a complete analysis of every aspect of any market, country, industry, security or the Fund. Statements of fact are from sources considered reliable, but the investment manager makes no representation or warranty as to their completeness or accuracy. Although historical performance is no guarantee of future results, these insights may help you understand our investment management philosophy.
Semiannual Report | 7
Performance Summary as of 6/30/12
Franklin Templeton 2015 Retirement Target Fund
Your dividend income will vary depending on dividends or interest paid by securities in the Fund s portfolio, adjusted for operating expenses of each class. Capital gain distributions are net profits realized from the sale of portfolio securities. The performance table does not reflect any taxes that a shareholder would pay on Fund dividends, capital gain distributions, if any, or any realized gains on the sale of Fund shares. Total return reflects reinvestment of the Fund s dividends and capital gain distributions, if any, and any unrealized gains or losses.
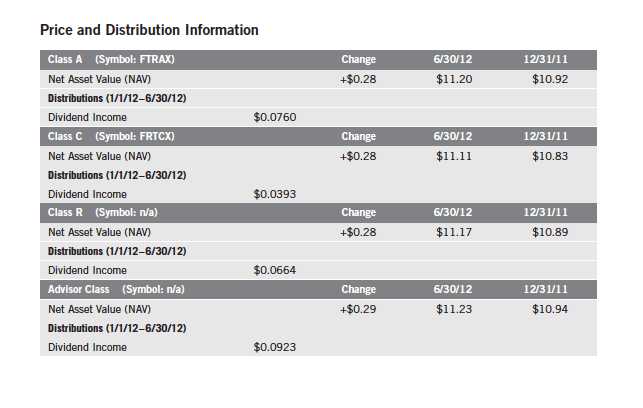
8 | Semiannual Report
Performance Summary (continued)
Performance1
Cumulative total return excludes sales charges. Average annual total return and value of $10,000 investment include maximum sales charges. Class A: 5.75% maximum initial sales charge; Class C: 1% contingent deferred sales charge in first year only; Class R/Advisor Class: no sales charges.
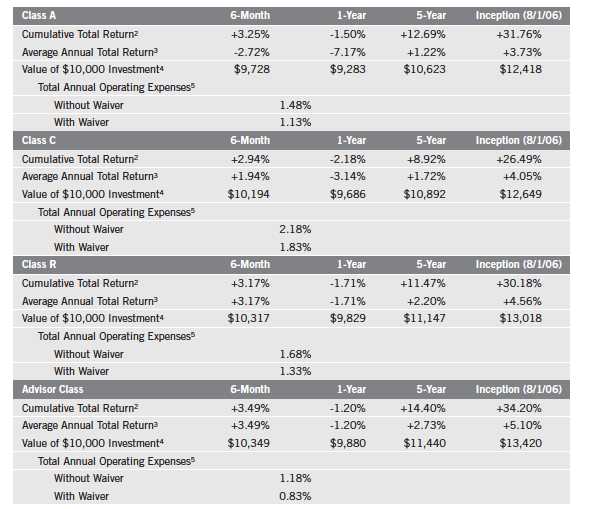
Performance data represent past performance, which does not guarantee future results. Investment return and principal value will fluctuate, and you may have a gain or loss when you sell your shares. Current performance may differ from figures shown. For most recent month-end performance, go to franklintempleton.com or call (800) 342-5236.
The investment manager and administrator have contractually agreed to waive or assume certain expenses so that common expenses (excluding Rule 12b-1 fees and acquired fund fees and expenses) for each class of the Fund do not exceed 0.15% (other than certain nonroutine expenses) until 4/30/13.
Semiannual Report | 9
Performance Summary (continued)
Endnotes
All investments involve risks, including possible loss of principal. It s important to note that the principal value of the Fund will fluctuate and is not guaranteed at any time, including at or after the stated target date for the Fund, nor is there any guarantee that the Fund will provide sufficient income, at or through the investor s retirement. Generally, investors should be comfortable with fluctuation in the value of their investments, especially over the short term. Stock prices fluctuate, sometimes rapidly and dramatically, due to factors affecting individual companies, particular industries or sectors, or general market conditions. Bond prices generally move in the opposite direction of interest rates. Thus, as prices of bonds in the Fund adjust to a rise in interest rates, the Fund s share price may decline. Foreign investing carries additional risks such as currency and market volatility and political or social instability, risks that are heightened in developing countries. Because the Fund invests in underlying funds, which may engage in a variety of investment strategies involving certain risks, the Fund may be subject to those same risks. These risks are described more fully in the Fund s prospectus. Investors should consult their financial advisor for help selecting the appropriate fund of funds, or fund combination, based on an evaluation of their investment objectives, retirement time horizons and risk tolerance. The Fund is actively managed but there is no guarantee that the manager s investment decisions will produce the desired results.
| |
Class C: Class R: | These shares have higher annual fees and expenses than Class A shares. Shares are available to certain eligible investors as described in the prospectus. These shares have higher annual fees and expenses than Class A shares. |
Advisor Class: | Shares are available to certain eligible investors as described in the prospectus. |
1. Fund investment results reflect the expense reduction, without which the results would have been lower. As of 5/1/11, the Fund s glide path was modified, and among other changes, reflects a lower starting allocation to equity funds; such a change can impact performance.
2. Cumulative total return represents the change in value of an investment over the periods indicated.
3. Average annual total return represents the average annual change in value of an investment over the periods indicated. Six-month return has not been annualized.
4. These figures represent the value of a hypothetical $10,000 investment in the Fund over the periods indicated.
5. Figures are as stated in the Fund s prospectus current as of the date of this report and include the effect of acquired fund fees and expenses. In periods of market volatility, assets may decline significantly, causing total annual Fund operating expenses to become higher than the figures shown.
10 | Semiannual Report
Your Fund s Expenses
Franklin Templeton 2015 Retirement Target Fund
As a Fund shareholder, you can incur two types of costs:
- Transaction costs, including sales charges (loads) on Fund purchases; and
- Ongoing Fund costs, including management fees, distribution and service (12b-1) fees, and other Fund expenses. All mutual funds have ongoing costs, sometimes referred to as operating expenses.
The following table shows ongoing costs of investing in the Fund and can help you understand these costs and compare them with those of other mutual funds. The table assumes a $1,000 investment held for the six months indicated.
Actual Fund Expenses
The first line (Actual) for each share class listed in the table provides actual account values and expenses. The Ending Account Value is derived from the Fund s actual return, which includes the effect of Fund expenses.
You can estimate the expenses you paid during the period by following these steps. Of course, your account value and expenses will differ from those in this illustration:
| 1. | Divide your account value by $1,000. |
| | If an account had an $8,600 value, then $8,600 ÷ $1,000 = 8.6. |
| 2. | Multiply the result by the number under the heading Expenses Paid During Period. |
| | If Expenses Paid During Period were $7.50, then 8.6 x $7.50 = $64.50. |
In this illustration, the estimated expenses paid this period are $64.50.
Hypothetical Example for Comparison with Other Funds
Information in the second line (Hypothetical) for each class in the table can help you compare ongoing costs of investing in the Fund with those of other mutual funds. This information may not be used to estimate the actual ending account balance or expenses you paid during the period. The hypothetical Ending Account Value is based on the actual expense ratio for each class and an assumed 5% annual rate of return before expenses, which does not represent the Fund s actual return. The figure under the heading Expenses Paid During Period shows the hypothetical expenses your account would have incurred under this scenario. You can compare this figure with the 5% hypothetical examples that appear in shareholder reports of other funds.
Semiannual Report | 11
Your Fund s Expenses (continued)
Please note that expenses shown in the table are meant to highlight ongoing costs and do not reflect any transaction costs, such as sales charges. Therefore, the second line for each class is useful in comparing ongoing costs only, and will not help you compare total costs of owning different funds. In addition, if transaction costs were included, your total costs would have been higher. Please refer to the Fund prospectus for additional information on operating expenses.
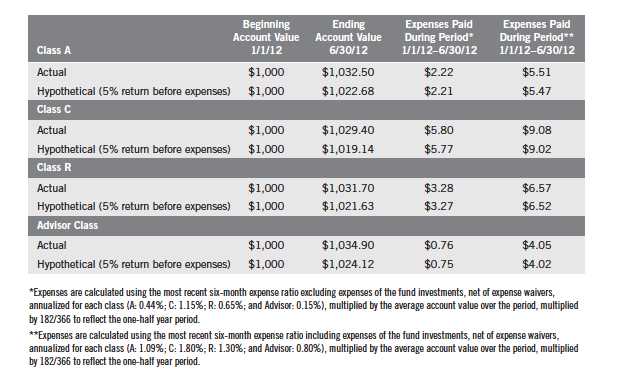
12 | Semiannual Report
Franklin Templeton
2025 Retirement Target Fund
Your Fund s Goal and Main Investments: Franklin Templeton 2025 Retirement Target Fund seeks the highest level of long-term total return, which consists of capital appreciation and income, consistent with the Fund s asset allocation. The Fund allocates among the broad asset classes of equity, fixed income and short-term (money market) investments by investing in a distinctly weighted combination of Franklin Templeton mutual funds (underlying funds), with an increasing emphasis on income as the target date of 2025 approaches. The target date is the approximate retirement year of the investor.

This semiannual report for Franklin Templeton 2025 Retirement Target Fund covers the period ended June 30, 2012.
Performance Overview
Franklin Templeton 2025 Retirement Target Fund Class A posted a +3.32% cumulative total return for the six months ended June 30, 2012. By comparison, the Fund s equity benchmarks, the Standard & Poor s 500 Index (S&P 500), a broad measure of U.S. stock performance, and the MSCI Europe, Australasia, Far East (EAFE) Index, which measures global stock performance for developed markets excluding the U.S. and Canada, posted total returns of +9.49% and +3.38%.1 The Fund s fixed income benchmark, the Barclays U.S. Aggregate Index, which tracks U.S. investment-grade bonds, posted a +2.37% total return.1 The Payden & Rygel (P&R) 90 Day U.S. T-Bill Index, a proxy for short-term investments and other net assets, had a +0.02% total return for the same period.1 You can find the Fund s long-term performance data in the Performance Summary beginning on page 16.
Investment Strategy
When selecting equity funds, we consider the foreign and domestic exposure, market capitalization ranges, and investment style (growth vs. value) of the underlying Franklin Templeton funds and other fund investments (fund investments). When selecting fixed income funds, our primary focus is on maximizing
1. Source: © 2012 Morningstar. All Rights Reserved. The information contained herein: (1) is proprietary to Morningstar and/or its content providers; (2) may not be copied or distributed; and (3) is not warranted to be accurate, complete or timely. Neither Morningstar nor its content providers are responsible for any damages or losses arising from any use of this information. The indexes are unmanaged and include reinvestment of any income distributions. One cannot invest directly in an index, and an index is not representative of the Fund s portfolio.
The dollar value, number of shares or principal amount, and names of all portfolio holdings are listed in the Fund s SOI, which begins on page 47.
Semiannual Report | 13
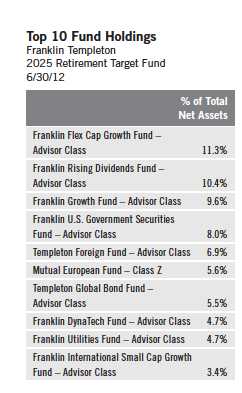
income appropriate to the Fund s risk profile. In evaluating the risk level of the fund investments, we analyze such factors as: (a) relative and absolute performance, including correlations with other fund investments as well as corresponding benchmarks, and (b) their volatility (the variability of returns from one period to the next). We attempt to invest the assets of each Target Fund in the same fund investments and will vary the fund investments allocation percentages based upon each Fund s risk/return level. We change the Fund s target asset allocation over time, and it becomes increasingly conservative as the stated target date draws near. At the landing point (reached at the target date), the Fund reaches its most conservative asset allocation and thereafter, such strategic asset allocation will generally become fixed.
Manager s Discussion
The Fund s performance can be attributed largely to its allocation among equities, fixed income securities, and short-term investments and other net assets, and to the actual performance of the fund investments. This allocation shifts every year, in accordance with the retirement date associated with the portfolio.
At period-end, Franklin Templeton 2025 Retirement Target Fund allocated 74.3% of total net assets to equity and 18.9% to fixed income. Domestic equity exposure was 68.8% of the total equity weighting, and foreign equity made up the balance. The portfolio was diversified across capitalization sizes and investment styles, and on June 30, 2012, we held shares in large-, mid-and small-capitalization equity funds, representing both growth and value styles. Franklin Flex Cap Growth Fund Advisor Class, at 11.3% of the Fund s total net assets, was our largest equity fund weighting at period-end. On the fixed income side, domestic exposure was 66.1% of the Fund s total fixed income weighting, with the balance in foreign fixed income. Franklin U.S. Government Securities Fund Advisor Class was our largest fixed income fund weighting at 8.0% of total net assets.
Our largest domestic growth fund holding, Franklin Flex Cap Growth Fund Advisor Class, and our largest domestic value fund holding, Franklin Rising Dividends Fund Advisor Class, underperformed the S&P 500. Our largest foreign equity fund holding, Templeton Foreign Fund Advisor Class, under-performed the MSCI EAFE Index, while Mutual European Fund Class Z outperformed the index. On the fixed income side, Franklin U.S. Government Securities Fund Advisor Class underperformed the Barclays U.S. Aggregate Index, and Templeton Global Bond Fund Advisor Class outperformed the index.
14 | Semiannual Report
Thank you for your continued participation in Franklin Templeton 2025 Retirement Target Fund. We look forward to serving your future investment needs.
The foregoing information reflects our analysis, opinions and portfolio holdings as of June 30, 2012, the end of the reporting period. The way we implement our main investment strategies and the resulting portfolio holdings may change depending on factors such as market and economic conditions. These opinions may not be relied upon as investment advice or an offer for a particular security. The information is not a complete analysis of every aspect of any market, country, industry, security or the Fund. Statements of fact are from sources considered reliable, but the investment manager makes no representation or warranty as to their completeness or accuracy. Although historical performance is no guarantee of future results, these insights may help you understand our investment management philosophy.
Semiannual Report | 15
Performance Summary as of 6/30/12
Franklin Templeton 2025 Retirement Target Fund
Your dividend income will vary depending on dividends or interest paid by securities in the Fund s portfolio, adjusted for operating expenses of each class. Capital gain distributions are net profits realized from the sale of portfolio securities. The performance table does not reflect any taxes that a shareholder would pay on Fund dividends, capital gain distributions, if any, or any realized gains on the sale of Fund shares. Total return reflects reinvestment of the Fund s dividends and capital gain distributions, if any, and any unrealized gains or losses.
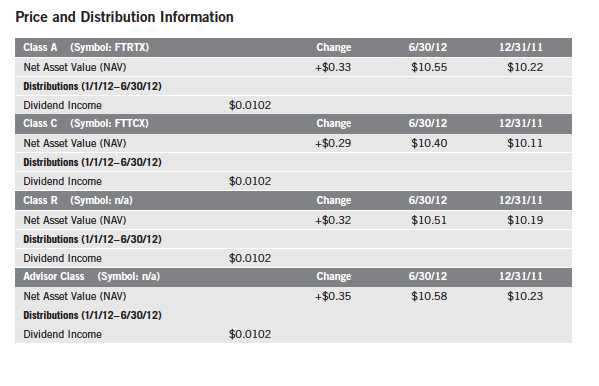
16 | Semiannual Report
Performance Summary (continued)
Performance1
Cumulative total return excludes sales charges. Average annual total return and value of $10,000 investment include maximum sales charges. Class A: 5.75% maximum initial sales charge; Class C: 1% contingent deferred sales charge in first year only; Class R/Advisor Class: no sales charges.
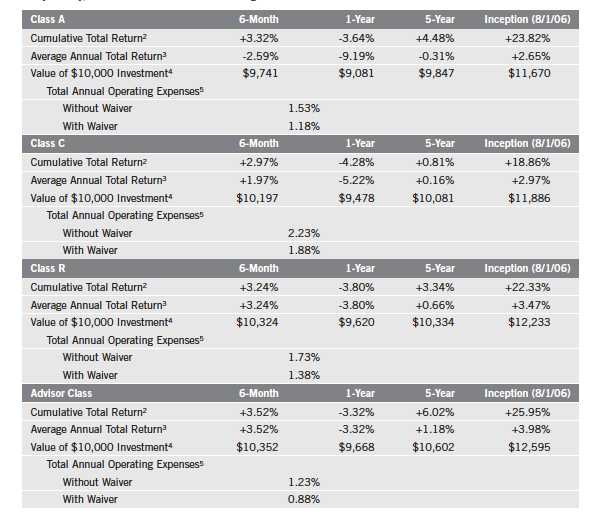
Performance data represent past performance, which does not guarantee future results. Investment return and principal value will fluctuate, and you may have a gain or loss when you sell your shares. Current performance may differ from figures shown. For most recent month-end performance, go to franklintempleton.com or call (800) 342-5236.
The investment manager and administrator have contractually agreed to waive or assume certain expenses so that common expenses (excluding Rule 12b-1 fees and acquired fund fees and expenses) for each class of the Fund do not exceed 0.15% (other than certain nonroutine expenses) until 4/30/13.
Semiannual Report | 17
Performance Summary (continued)
Endnotes
All investments involve risks, including possible loss of principal. It s important to note that the principal value of the Fund will fluctuate and is not guaranteed at any time, including at or after the stated target date for the Fund, nor is there any guarantee that the Fund will provide sufficient income, at or through the investor s retirement. Generally, investors should be comfortable with fluctuation in the value of their investments, especially over the short term. Stock prices fluctuate, sometimes rapidly and dramatically, due to factors affecting individual companies, particular industries or sectors, or general market conditions. Bond prices generally move in the opposite direction of interest rates. Thus, as prices of bonds in the Fund adjust to a rise in interest rates, the Fund s share price may decline. Foreign investing carries additional risks such as currency and market volatility and political or social instability, risks that are heightened in developing countries. Because the Fund invests in underlying funds, which may engage in a variety of investment strategies involving certain risks, the Fund may be subject to those same risks. These risks are described more fully in the Fund s prospectus. Investors should consult their financial advisor for help selecting the appropriate fund of funds, or fund combination, based on an evaluation of their investment objectives, retirement time horizons and risk tolerance. The Fund is actively managed but there is no guarantee that the manager s investment decisions will produce the desired results.
| |
Class C: Class R: | These shares have higher annual fees and expenses than Class A shares. Shares are available to certain eligible investors as described in the prospectus. These shares have higher annual fees and expenses than Class A shares. |
Advisor Class: | Shares are available to certain eligible investors as described in the prospectus. |
1. Fund investment results reflect the expense reduction, without which the results would have been lower. As of 5/1/11, the Fund s glide path was modified, and among other changes, reflects a lower starting allocation to equity funds; such a change can impact performance.
2. Cumulative total return represents the change in value of an investment over the periods indicated.
3. Average annual total return represents the average annual change in value of an investment over the periods indicated. Six-month return has not been annualized.
4. These figures represent the value of a hypothetical $10,000 investment in the Fund over the periods indicated.
5. Figures are as stated in the Fund s prospectus current as of the date of this report and include the effect of acquired fund fees and expenses. In periods of market volatility, assets may decline significantly, causing total annual Fund operating expenses to become higher than the figures shown.
18 | Semiannual Report
Your Fund s Expenses
Franklin Templeton 2025 Retirement Target Fund
As a Fund shareholder, you can incur two types of costs:
- Transaction costs, including sales charges (loads) on Fund purchases; and
- Ongoing Fund costs, including management fees, distribution and service (12b-1) fees, and other Fund expenses. All mutual funds have ongoing costs, sometimes referred to as operating expenses.
The following table shows ongoing costs of investing in the Fund and can help you understand these costs and compare them with those of other mutual funds. The table assumes a $1,000 investment held for the six months indicated.
Actual Fund Expenses
The first line (Actual) for each share class listed in the table provides actual account values and expenses. The Ending Account Value is derived from the Fund s actual return, which includes the effect of Fund expenses.
You can estimate the expenses you paid during the period by following these steps. Of course, your account value and expenses will differ from those in this illustration:
| 1. | Divide your account value by $1,000. |
| | If an account had an $8,600 value, then $8,600 ÷ $1,000 = 8.6. |
| 2. | Multiply the result by the number under the heading Expenses Paid During Period. |
| | If Expenses Paid During Period were $7.50, then 8.6 x $7.50 = $64.50. |
In this illustration, the estimated expenses paid this period are $64.50.
Hypothetical Example for Comparison with Other Funds
Information in the second line (Hypothetical) for each class in the table can help you compare ongoing costs of investing in the Fund with those of other mutual funds. This information may not be used to estimate the actual ending account balance or expenses you paid during the period. The hypothetical Ending Account Value is based on the actual expense ratio for each class and an assumed 5% annual rate of return before expenses, which does not represent the Fund s actual return. The figure under the heading Expenses Paid During Period shows the hypothetical expenses your account would have incurred under this scenario. You can compare this figure with the 5% hypothetical examples that appear in shareholder reports of other funds.
Semiannual Report | 19
Your Fund s Expenses (continued)
Please note that expenses shown in the table are meant to highlight ongoing costs and do not reflect any transaction costs, such as sales charges. Therefore, the second line for each class is useful in comparing ongoing costs only, and will not help you compare total costs of owning different funds. In addition, if transaction costs were included, your total costs would have been higher. Please refer to the Fund prospectus for additional information on operating expenses.

*Expenses are calculated using the most recent six-month expense ratio excluding expenses of the fund investments, net of expense waivers, annualized for each class (A: 0.45%; C: 1.15%; R: 0.65%; and Advisor: 0.15%), multiplied by the average account value over the period, multiplied by 182/366 to reflect the one-half year period.
**Expenses are calculated using the most recent six-month expense ratio including expenses of the fund investments, net of expense waivers, annualized for each class (A: 1.16%; C: 1.86%; R: 1.36%; and Advisor: 0.86%), multiplied by the average account value over the period, multiplied by 182/366 to reflect the one-half year period.
20 | Semiannual Report
Franklin Templeton
2035 Retirement Target Fund
Your Fund s Goal and Main Investments: Franklin Templeton 2035 Retirement Target Fund seeks the highest level of long-term total return, which consists of capital appreciation and income, consistent with the Fund s asset allocation. The Fund allocates among the broad asset classes of equity, fixed income and short-term (money market) investments by investing in a distinctly weighted combination of Franklin Templeton mutual funds (underlying funds), with an increasing emphasis on income as the target date of 2035 approaches. The target date is the approximate retirement year of the investor.
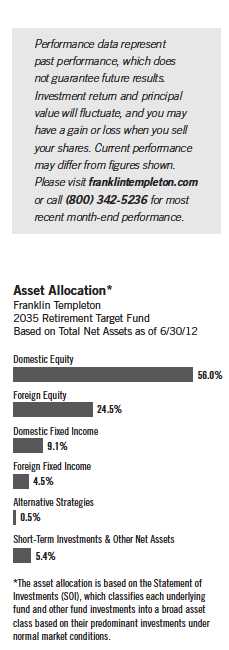
This semiannual report for Franklin Templeton 2035 Retirement Target Fund covers the period ended June 30, 2012.
Performance Overview
Franklin Templeton 2035 Retirement Target Fund Class A posted a +3.17% cumulative total return for the six months ended June 30, 2012. By comparison, the Fund s equity benchmarks, the Standard & Poor s 500 Index (S&P 500), a broad measure of U.S. stock performance, and the MSCI Europe, Australasia, Far East (EAFE) Index, which measures global stock performance for developed markets excluding the U.S. and Canada, posted total returns of +9.49% and +3.38%.1 The Fund s fixed income benchmark, the Barclays U.S. Aggregate Index, which tracks U.S. investment-grade bonds, posted a +2.37% total return.1 The Payden & Rygel (P&R) 90 Day U.S. T-Bill Index, a proxy for short-term investments and other net assets, had a +0.02% total return for the same period.1 You can find the Fund s long-term performance data in the Performance Summary beginning on page 24.
Investment Strategy
When selecting equity funds, we consider the foreign and domestic exposure, market capitalization ranges, and investment style (growth vs. value) of the underlying Franklin Templeton funds and other fund investments (fund investments). When selecting fixed income funds, our primary focus is on maximizing
1. Source: © 2012 Morningstar. All Rights Reserved. The information contained herein: (1) is proprietary to Morningstar and/or its content providers; (2) may not be copied or distributed; and (3) is not warranted to be accurate, complete or timely. Neither Morningstar nor its content providers are responsible for any damages or losses arising from any use of this information. The indexes are unmanaged and include reinvestment of any income or distributions. One cannot invest directly in an index, and an index is not representative of the Fund s portfolio.
The dollar value, number of shares or principal amount, and names of all portfolio holdings are listed in the Fund s SOI, which begins on page 53.
Semiannual Report | 21
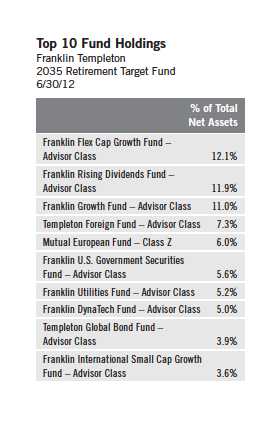
income appropriate to the Fund s risk profile. In evaluating the risk level of the fund investments, we analyze such factors as: (a) relative and absolute performance, including correlations with other fund investments as well as corresponding benchmarks, and (b) their volatility (the variability of returns from one period to the next). We attempt to invest the assets of each Target Fund in the same fund investments and will vary the fund investments allocation percentages based upon each Fund s risk/return level. We change the Fund s target asset allocation over time, and it becomes increasingly conservative as the stated target date draws near. At the landing point (reached at the target date), the Fund reaches its most conservative asset allocation and thereafter, such strategic asset allocation will generally become fixed.
Manager s Discussion
The Fund s performance can be attributed largely to its allocation among equities, fixed income securities, and short-term investments and other net assets, and to the actual performance of the fund investments. This allocation shifts every year, in accordance with the retirement date associated with the portfolio.
At period-end, Franklin Templeton 2035 Retirement Target Fund allocated 80.5% of total net assets to equity, and 13.6% to fixed income. Domestic equity exposure was 69.6% of the total equity weighting, and foreign equity made up the balance. The portfolio was diversified across capitalization sizes and investment styles, and on June 30, 2012, we held shares in large-, mid-and small-capitalization equity funds, representing both growth and value styles. Franklin Flex Cap Growth Fund Advisor Class, at 12.1% of the Fund s total net assets, was our largest equity fund weighting at period-end. On the fixed income side, domestic exposure was 66.9% of the Fund s total fixed income weighting, with the balance in foreign fixed income. Franklin U.S. Government Securities Fund Advisor Class was our largest fixed income fund weighting at 5.6% of total net assets.
Our largest domestic growth fund holding, Franklin Flex Cap Growth Fund Advisor Class, and our largest domestic value fund holding, Franklin Rising Dividends Fund Advisor Class, underperformed the S&P 500. Our largest foreign equity fund holding, Templeton Foreign Fund Advisor Class, underperformed the MSCI EAFE Index, while Mutual European Fund Class Z outperformed the index. On the fixed income side, Franklin U.S. Government Securities Fund Advisor Class underperformed the Barclays U.S. Aggregate Index, and Templeton Global Bond Fund Advisor Class outperformed the index.
22 | Semiannual Report
Thank you for your continued participation in Franklin Templeton 2035 Retirement Target Fund. We look forward to serving your future investment needs.
The foregoing information reflects our analysis, opinions and portfolio holdings as of June 30, 2012, the end of the reporting period. The way we implement our main investment strategies and the resulting portfolio holdings may change depending on factors such as market and economic conditions. These opinions may not be relied upon as investment advice or an offer for a particular security. The information is not a complete analysis of every aspect of any market, country, industry, security or the Fund. Statements of fact are from sources considered reliable, but the investment manager makes no representation or warranty as to their completeness or accuracy. Although historical performance is no guarantee of future results, these insights may help you understand our investment management philosophy.
Semiannual Report | 23
Performance Summary as of 6/30/12
Franklin Templeton 2035 Retirement Target Fund
Your dividend income will vary depending on dividends or interest paid by securities in the Fund s portfolio, adjusted for operating expenses of each class. Capital gain distributions are net profits realized from the sale of portfolio securities. The performance table does not reflect any taxes that a shareholder would pay on Fund dividends, capital gain distributions, if any, or any realized gains on the sale of Fund shares. Total return reflects reinvestment of the Fund s dividends and capital gain distributions, if any, and any unrealized gains or losses.
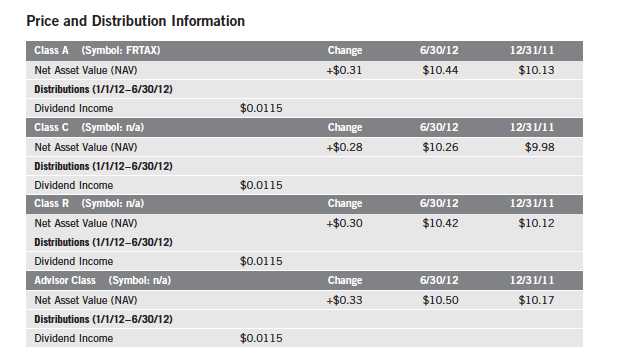
24 | Semiannual Report
Performance Summary (continued)
Performance1
Cumulative total return excludes sales charges. Average annual total return and value of $10,000 investment include maximum sales charges. Class A: 5.75% maximum initial sales charge; Class C: 1% contingent deferred sales charge in first year only; Class R/Advisor Class: no sales charges.
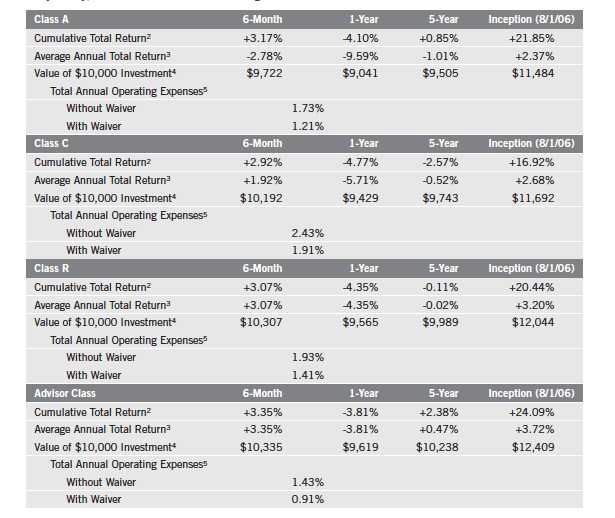
Performance data represent past performance, which does not guarantee future results. Investment return and principal value will fluctuate, and you may have a gain or loss when you sell your shares. Current performance may differ from figures shown. For most recent month-end performance, go to franklintempleton.com or call (800) 342-5236.
The investment manager and administrator have contractually agreed to waive or assume certain expenses so that common expenses (excluding Rule 12b-1 fees and acquired fund fees and expenses) for each class of the Fund do not exceed 0.15% (other than certain nonroutine expenses) until 4/30/13.
Semiannual Report | 25
Performance Summary (continued)
Endnotes
All investments involve risks, including possible loss of principal. It s important to note that the principal value of the Fund will fluctuate and is not guaranteed at any time, including at or after the stated target date for the Fund, nor is there any guarantee that the Fund will provide sufficient income, at or through the investor s retirement. Generally, investors should be comfortable with fluctuation in the value of their investments, especially over the short term. Stock prices fluctuate, sometimes rapidly and dramatically, due to factors affecting individual companies, particular industries or sectors, or general market conditions. Bond prices generally move in the opposite direction of interest rates. Thus, as prices of bonds in the Fund adjust to a rise in interest rates, the Fund s share price may decline. Foreign investing carries additional risks such as currency and market volatility and political or social instability, risks that are heightened in developing countries. Because the Fund invests in underlying funds, which may engage in a variety of investment strategies involving certain risks, the Fund may be subject to those same risks. These risks are described more fully in the Fund s prospectus. Investors should consult their financial advisor for help selecting the appropriate fund of funds, or fund combination, based on an evaluation of their investment objectives, retirement time horizons and risk tolerance. The Fund is actively managed but there is no guarantee that the manager s investment decisions will produce the desired results.
| |
Class C: Class R: | These shares have higher annual fees and expenses than Class A shares. Shares are available to certain eligible investors as described in the prospectus. These shares have higher annual fees and expenses than Class A shares. |
Advisor Class: | Shares are available to certain eligible investors as described in the prospectus. |
1. Fund investment results reflect the expense reduction, without which the results would have been lower. As of 5/1/11, the Fund s glide path was modified, and among other changes, reflects a lower starting allocation to equity funds; such a change can impact performance.
2. Cumulative total return represents the change in value of an investment over the periods indicated.
3. Average annual total return represents the average annual change in value of an investment over the periods indicated. Six-month return has not been annualized.
4. These figures represent the value of a hypothetical $10,000 investment in the Fund over the periods indicated.
5. Figures are as stated in the Fund s prospectus current as of the date of this report and include the effect of acquired fund fees and expenses. In periods of market volatility, assets may decline significantly, causing total annual Fund operating expenses to become higher than the figures shown.
26 | Semiannual Report
Your Fund s Expenses
Franklin Templeton 2035 Retirement Target Fund
As a Fund shareholder, you can incur two types of costs:
- Transaction costs, including sales charges (loads) on Fund purchases; and
- Ongoing Fund costs, including management fees, distribution and service (12b-1) fees, and other Fund expenses. All mutual funds have ongoing costs, sometimes referred to as operating expenses.
The following table shows ongoing costs of investing in the Fund and can help you understand these costs and compare them with those of other mutual funds. The table assumes a $1,000 investment held for the six months indicated.
Actual Fund Expenses
The first line (Actual) for each share class listed in the table provides actual account values and expenses. The Ending Account Value is derived from the Fund s actual return, which includes the effect of Fund expenses.
You can estimate the expenses you paid during the period by following these steps. Of course, your account value and expenses will differ from those in this illustration:
| 1. | Divide your account value by $1,000. |
| | If an account had an $8,600 value, then $8,600 ÷ $1,000 = 8.6. |
| 2. | Multiply the result by the number under the heading Expenses Paid During Period. |
| | If Expenses Paid During Period were $7.50, then 8.6 x $7.50 = $64.50. |
In this illustration, the estimated expenses paid this period are $64.50.
Hypothetical Example for Comparison with Other Funds
Information in the second line (Hypothetical) for each class in the table can help you compare ongoing costs of investing in the Fund with those of other mutual funds. This information may not be used to estimate the actual ending account balance or expenses you paid during the period. The hypothetical Ending Account Value is based on the actual expense ratio for each class and an assumed 5% annual rate of return before expenses, which does not represent the Fund s actual return. The figure under the heading Expenses Paid During Period shows the hypothetical expenses your account would have incurred under this scenario. You can compare this figure with the 5% hypothetical examples that appear in shareholder reports of other funds.
Semiannual Report | 27
Your Fund s Expenses (continued)
Please note that expenses shown in the table are meant to highlight ongoing costs and do not reflect any transaction costs, such as sales charges. Therefore, the second line for each class is useful in comparing ongoing costs only, and will not help you compare total costs of owning different funds. In addition, if transaction costs were included, your total costs would have been higher. Please refer to the Fund prospectus for additional information on operating expenses.
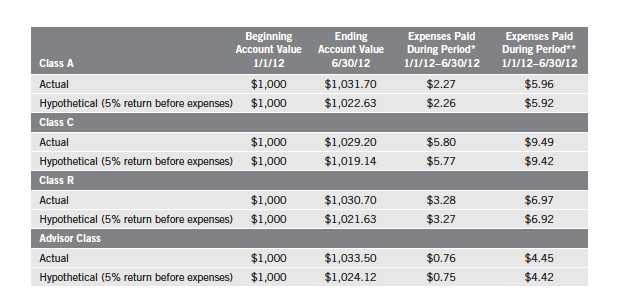
*Expenses are calculated using the most recent six-month expense ratio excluding expenses of the fund investments, net of expense waivers, annualized for each class (A: 0.45%; C: 1.15%; R: 0.65%; and Advisor: 0.15%), multiplied by the average account value over the period, multiplied by 182/366 to reflect the one-half year period.
**Expenses are calculated using the most recent six-month expense ratio including expenses of the fund investments, net of expense waivers, annualized for each class (A: 1.18%; C: 1.88%; R: 1.38%; and Advisor: 0.88%), multiplied by the average account value over the period, multiplied by 182/366 to reflect the one-half year period.
28 | Semiannual Report
Franklin Templeton
2045 Retirement Target Fund
Your Fund s Goal and Main Investments: Franklin Templeton 2045 Retirement Target Fund seeks the highest level of long-term total return, which consists of capital appreciation and income, consistent with the Fund s asset allocation. The Fund allocates among the broad asset classes of equity, fixed income and short-term (money market) investments by investing in a distinctly weighted combination of Franklin Templeton mutual funds (underlying funds), with an increasing emphasis on income as the target date of 2045 approaches. The target date is the approximate retirement year of the investor.

This semiannual report for Franklin Templeton 2045 Retirement Target Fund covers the period ended June 30, 2012.
Performance Overview
Franklin Templeton 2045 Retirement Target Fund Class A posted a +3.29% cumulative total return for the six months ended June 30, 2012. By comparison, the Fund s equity benchmarks, the Standard & Poor s 500 Index (S&P 500), a broad measure of U.S. stock performance, and the MSCI Europe, Australasia, Far East (EAFE) Index, which measures global stock performance for developed markets excluding the U.S. and Canada, posted total returns of +9.49% and +3.38%.1 The Fund s fixed income benchmark, the Barclays U.S. Aggregate Index, which tracks U.S. investment-grade bonds, posted a +2.37% total return.1 The Payden & Rygel (P&R) 90 Day U.S. T-Bill Index, a proxy for short-term investments and other net assets, had a +0.02% total return for the same period.1 You can find the Fund s long-term performance data in the Performance Summary beginning on page 32.
Investment Strategy
When selecting equity funds, we consider the foreign and domestic exposure, market capitalization ranges, and investment style (growth vs. value) of the underlying Franklin Templeton funds and other fund investments (fund investments). When selecting fixed income funds, our primary focus is on maximizing
1. Source: © 2012 Morningstar. All Rights Reserved. The information contained herein: (1) is proprietary to Morningstar and/or its content providers; (2) may not be copied or distributed; and (3) is not warranted to be accurate, complete or timely. Neither Morningstar nor its content providers are responsible for any damages or losses arising from any use of this information. The indexes are unmanaged and include reinvestment of any income or distributions. One cannot invest directly in an index, and an index is not representative of the Fund s portfolio.
The dollar value, number of shares or principal amount, and names of all portfolio holdings are listed in the Fund s SOI, which begins on page 59.
Semiannual Report | 29
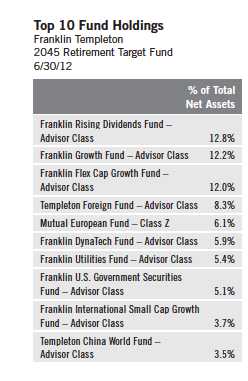
income appropriate to the Fund s risk profile. In evaluating the risk level of the fund investments, we analyze such factors as: (a) relative and absolute performance, including correlations with other fund investments as well as corresponding benchmarks, and (b) their volatility (the variability of returns from one period to the next). We attempt to invest the assets of each Target Fund in the same fund investments and will vary the fund investments allocation percentages based upon each Fund s risk/return level. We change the Fund s target asset allocation over time, and it becomes increasingly conservative as the stated target date draws near. At the landing point (reached at the target date), the Fund reaches its most conservative asset allocation and thereafter, such strategic asset allocation will generally become fixed.
Manager s Discussion
The Fund s performance can be attributed largely to its allocation among equities, fixed income securities, and short-term investments and other net assets, and to the actual performance of the fund investments. This allocation shifts every year, in accordance with the retirement date associated with the portfolio.
At period-end, Franklin Templeton 2045 Retirement Target Fund allocated 84.2% of total net assets to equity and 12.5% to fixed income. Domestic equity exposure was 69.5% of the total equity weighting, and foreign equity made up the balance. The portfolio was diversified across capitalization sizes and investment styles, and on June 30, 2012, we held shares in large-, mid-and small-capitalization equity funds, representing both growth and value styles. Franklin Rising Dividends Fund Advisor Class, at 12.8% of the Fund s total net assets, was our largest equity fund weighting at period-end. On the fixed income side, domestic exposure was 68.0% of the Fund s total fixed income weighting, with the balance in foreign fixed income. Franklin U.S. Government Securities Fund Advisor Class was our largest fixed income fund weighting at 5.1% of total net assets.
Our largest domestic growth fund holding, Franklin Growth Fund Advisor Class, and our largest domestic value fund holding, Franklin Rising Dividends Fund Advisor Class, underperformed the S&P 500. Our largest foreign equity fund holding, Templeton Foreign Fund Advisor Class, underperformed the MSCI EAFE Index, while Mutual European Fund Class Z outperformed the index. On the fixed income side, Franklin U.S. Government Securities Fund Advisor Class underperformed the Barclays U.S. Aggregate Index.
30 | Semiannual Report
Thank you for your continued participation in Franklin Templeton 2045 Retirement Target Fund. We look forward to serving your future investment needs.

The foregoing information reflects our analysis, opinions and portfolio holdings as of June 30, 2012, the end of the reporting period. The way we implement our main investment strategies and the resulting portfolio holdings may change depending on factors such as market and economic conditions. These opinions may not be relied upon as investment advice or an offer for a particular security. The information is not a complete analysis of every aspect of any market, country, industry, security or the Fund. Statements of fact are from sources considered reliable, but the investment manager makes no representation or warranty as to their completeness or accuracy. Although historical performance is no guarantee of future results, these insights may help you understand our investment management philosophy.
Semiannual Report | 31
Performance Summary as of 6/30/12
Franklin Templeton 2045 Retirement Target Fund
Your dividend income will vary depending on dividends or interest paid by securities in the Fund s portfolio, adjusted for operating expenses of each class. Capital gain distributions are net profits realized from the sale of portfolio securities. The performance table does not reflect any taxes that a shareholder would pay on Fund dividends, capital gain distributions, if any, or any realized gains on the sale of Fund shares. Total return reflects reinvestment of the Fund s dividends and capital gain distributions, if any, and any unrealized gains or losses.
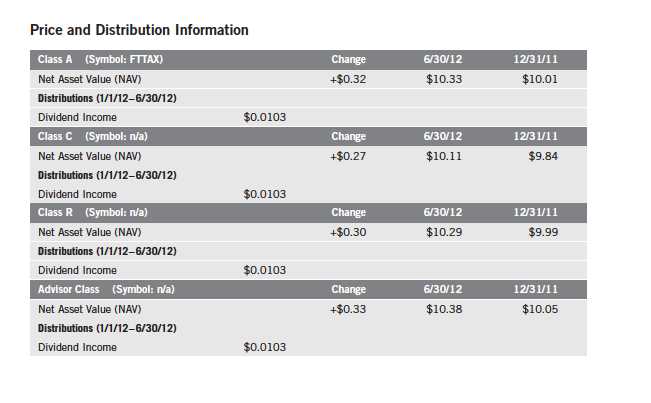
32 | Semiannual Report
Performance Summary (continued)
Performance1
Cumulative total return excludes sales charges. Average annual total return and value of $10,000 investment include maximum sales charges. Class A: 5.75% maximum initial sales charge; Class C: 1% contingent deferred sales charge in first year only; Class R/Advisor Class: no sales charges.
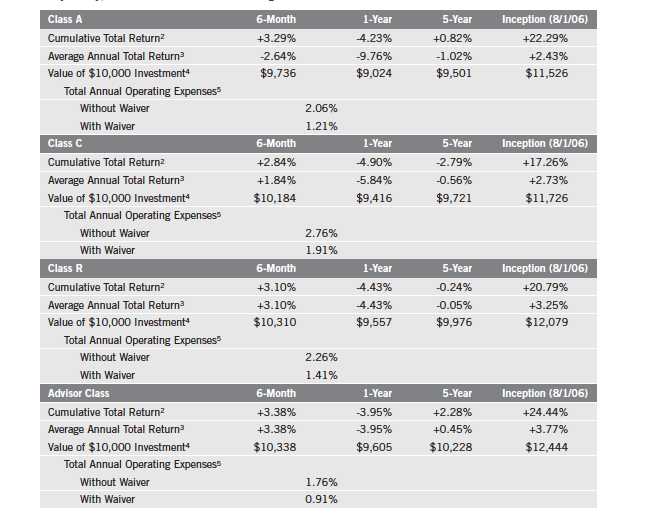
Performance data represent past performance, which does not guarantee future results. Investment return and principal value will fluctuate, and you may have a gain or loss when you sell your shares. Current performance may differ from figures shown. For most recent month-end performance, go to franklintempleton.com or call (800) 342-5236.
The investment manager and administrator have contractually agreed to waive or assume certain expenses so that common expenses (excluding Rule 12b-1 fees and acquired fund fees and expenses) for each class of the Fund do not exceed 0.15% (other than certain nonroutine expenses) until 4/30/13.
Semiannual Report | 33
Performance Summary (continued)
Endnotes
All investments involve risks, including possible loss of principal. It s important to note that the principal value of the Fund will fluctuate and is not guaranteed at any time, including at or after the stated target date for the Fund, nor is there any guarantee that the Fund will provide sufficient income, at or through the investor s retirement. Generally, investors should be comfortable with fluctuation in the value of their investments, especially over the short term. Stock prices fluctuate, sometimes rapidly and dramatically, due to factors affecting individual companies, particular industries or sectors, or general market conditions. Bond prices generally move in the opposite direction of interest rates. Thus, as prices of bonds in the Fund adjust to a rise in interest rates, the Fund s share price may decline. Foreign investing carries additional risks such as currency and market volatility and political or social instability, risks that are heightened in developing countries. Because the Fund invests in underlying funds, which may engage in a variety of investment strategies involving certain risks, the Fund may be subject to those same risks. These risks are described more fully in the Fund s prospectus. Investors should consult their financial advisor for help selecting the appropriate fund of funds, or fund combination, based on an evaluation of their investment objectives, retirement time horizons and risk tolerance. The Fund is actively managed but there is no guarantee that the manager s investment decisions will produce the desired results.
| |
Class C: Class R: | These shares have higher annual fees and expenses than Class A shares. Shares are available to certain eligible investors as described in the prospectus. These shares have higher annual fees and expenses than Class A shares. |
Advisor Class: | Shares are available to certain eligible investors as described in the prospectus. |
1. Fund investment results reflect the expense reduction, without which the results would have been lower. As of 5/1/11, the Fund s glide path was modified, and among other changes, reflects a lower starting allocation to equity funds; such a change can impact performance.
2. Cumulative total return represents the change in value of an investment over the periods indicated.
3. Average annual total return represents the average annual change in value of an investment over the periods indicated. Six-month return has not been annualized.
4. These figures represent the value of a hypothetical $10,000 investment in the Fund over the periods indicated.
5. Figures are as stated in the Fund s prospectus current as of the date of this report and include the effect of acquired fund fees and expenses. In periods of market volatility, assets may decline significantly, causing total annual Fund operating expenses to become higher than the figures shown.
34 | Semiannual Report
Your Fund s Expenses
Franklin Templeton 2045 Retirement Target Fund
As a Fund shareholder, you can incur two types of costs:
- Transaction costs, including sales charges (loads) on Fund purchases; and
- Ongoing Fund costs, including management fees, distribution and service (12b-1) fees, and other Fund expenses. All mutual funds have ongoing costs, sometimes referred to as operating expenses.
The following table shows ongoing costs of investing in the Fund and can help you understand these costs and compare them with those of other mutual funds. The table assumes a $1,000 investment held for the six months indicated.
Actual Fund Expenses
The first line (Actual) for each share class listed in the table provides actual account values and expenses. The Ending Account Value is derived from the Fund s actual return, which includes the effect of Fund expenses.
You can estimate the expenses you paid during the period by following these steps. Of course, your account value and expenses will differ from those in this illustration:
| 1. | Divide your account value by $1,000. |
| | If an account had an $8,600 value, then $8,600 ÷ $1,000 = 8.6. |
| 2. | Multiply the result by the number under the heading Expenses Paid During Period. |
| | If Expenses Paid During Period were $7.50, then 8.6 x $7.50 = $64.50. |
In this illustration, the estimated expenses paid this period are $64.50.
Hypothetical Example for Comparison with Other Funds
Information in the second line (Hypothetical) for each class in the table can help you compare ongoing costs of investing in the Fund with those of other mutual funds. This information may not be used to estimate the actual ending account balance or expenses you paid during the period. The hypothetical Ending Account Value is based on the actual expense ratio for each class and an assumed 5% annual rate of return before expenses, which does not represent the Fund s actual return. The figure under the heading Expenses Paid During Period shows the hypothetical expenses your account would have incurred under this scenario. You can compare this figure with the 5% hypothetical examples that appear in shareholder reports of other funds.
Semiannual Report | 35
Your Fund s Expenses (continued)
Please note that expenses shown in the table are meant to highlight ongoing costs and do not reflect any transaction costs, such as sales charges. Therefore, the second line for each class is useful in comparing ongoing costs only, and will not help you compare total costs of owning different funds. In addition, if transaction costs were included, your total costs would have been higher. Please refer to the Fund prospectus for additional information on operating expenses.

36 | Semiannual Report
Franklin Templeton Fund Allocator Series
Financial Highlights

aThe amount shown for a share outstanding throughout the period may not correlate with the Statement of Operations for the period due to the timing of sales and repurchases of
the Fund shares in relation to income earned and/or fluctuating market value of the investments of the Fund.
bBased on average daily shares outstanding.
cRecognition of net investment income by the Fund is affected by the timing of declaration of dividends by the Underlying Funds and Exchange Traded Funds in which the Fund invests.
dEffective September 1, 2008, the redemption fee was eliminated.
eAmount rounds to less than $0.01 per share.
fTotal return does not reflect sales commissions or contingent deferred sales charges, if applicable, and is not annualized for periods less than one year.
gRatios are annualized for periods less than one year.
hDoes not include expenses of the Underlying Funds and Exchange Traded Funds in which the Fund invests. The weighted average indirect expenses of the Underlying Funds and
Exchange Traded Funds were 0.65% for the period ended June 30, 2012.
Semiannual Report | The accompanying notes are an integral part of these financial statements. | 37
Franklin Templeton Fund Allocator Series
Financial Highlights (continued)
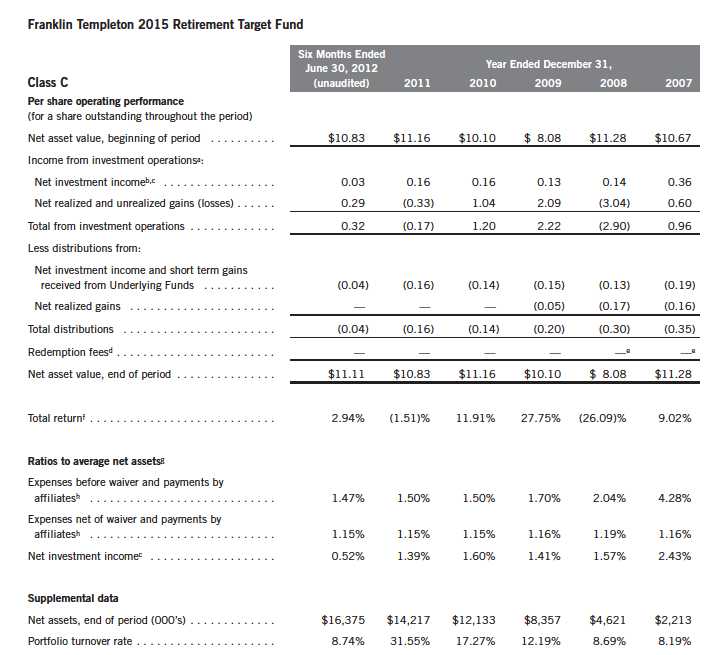
aThe amount shown for a share outstanding throughout the period may not correlate with the Statement of Operations for the period due to the timing of sales and repurchases of
the Fund shares in relation to income earned and/or fluctuating market value of the investments of the Fund.
bBased on average daily shares outstanding.
cRecognition of net investment income by the Fund is affected by the timing of declaration of dividends by the Underlying Funds and Exchange Traded Funds in which the Fund invests.
dEffective September 1, 2008, the redemption fee was eliminated.
eAmount rounds to less than $0.01 per share.
fTotal return does not reflect sales commissions or contingent deferred sales charges, if applicable, and is not annualized for periods less than one year.
gRatios are annualized for periods less than one year.
hDoes not include expenses of the Underlying Funds and Exchange Traded Funds in which the Fund invests. The weighted average indirect expenses of the Underlying Funds and
Exchange Traded Funds were 0.65% for the period ended June 30, 2012.
38 | The accompanying notes are an integral part of these financial statements. | Semiannual Report
Franklin Templeton Fund Allocator Series
Financial Highlights (continued)
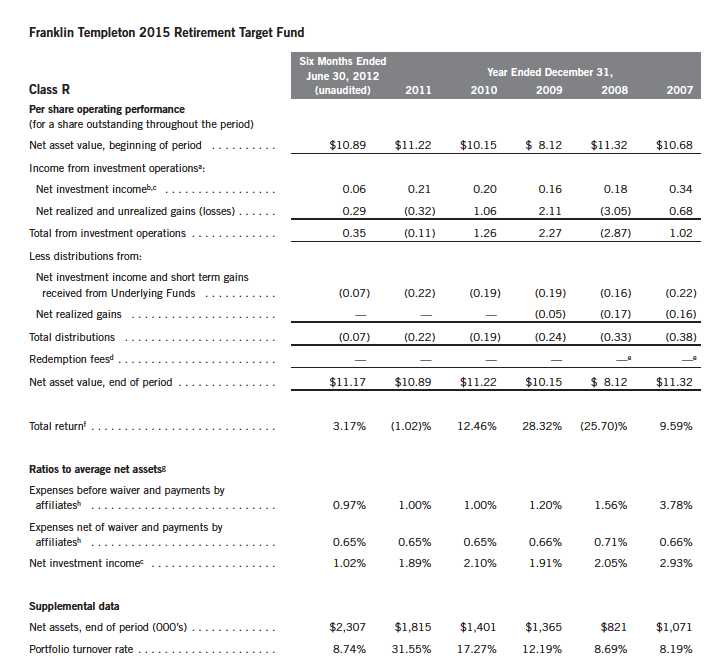
aThe amount shown for a share outstanding throughout the period may not correlate with the Statement of Operations for the period due to the timing of sales and repurchases of
the Fund shares in relation to income earned and/or fluctuating market value of the investments of the Fund.
bBased on average daily shares outstanding.
cRecognition of net investment income by the Fund is affected by the timing of declaration of dividends by the Underlying Funds and Exchange Traded Funds in which the Fund invests.
dEffective September 1, 2008, the redemption fee was eliminated.
eAmount rounds to less than $0.01 per share.
fTotal return does not reflect sales commissions or contingent deferred sales charges, if applicable, and is not annualized for periods less than one year.
gRatios are annualized for periods less than one year.
hDoes not include expenses of the Underlying Funds and Exchange Traded Funds in which the Fund invests. The weighted average indirect expenses of the Underlying Funds and
Exchange Traded Funds were 0.65% for the period ended June 30, 2012.
Semiannual Report | The accompanying notes are an integral part of these financial statements. | 39
Franklin Templeton Fund Allocator Series
Financial Highlights (continued)
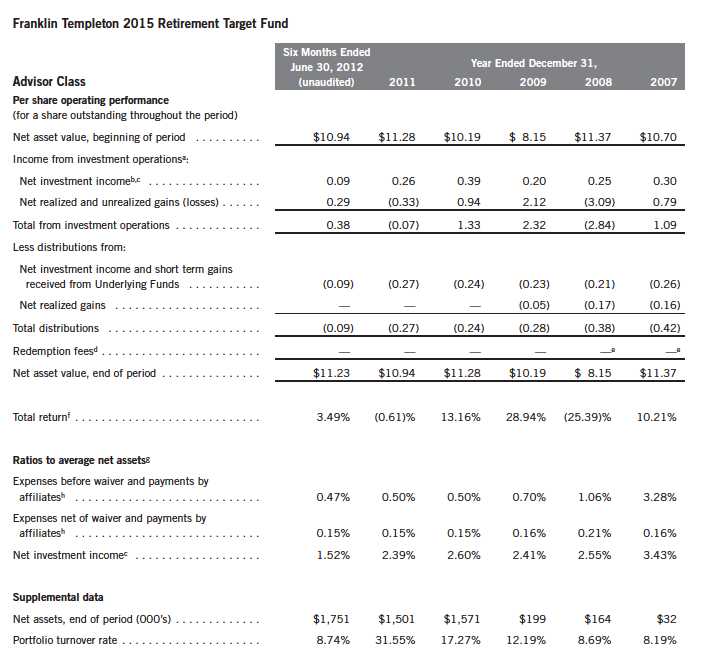
aThe amount shown for a share outstanding throughout the period may not correlate with the Statement of Operations for the period due to the timing of sales and repurchases of
the Fund shares in relation to income earned and/or fluctuating market value of the investments of the Fund.
bBased on average daily shares outstanding.
cRecognition of net investment income by the Fund is affected by the timing of declaration of dividends by the Underlying Funds and Exchange Traded Funds in which the Fund invests.
dEffective September 1, 2008, the redemption fee was eliminated.
eAmount rounds to less than $0.01 per share.
fTotal return is not annualized for periods less than one year.
gRatios are annualized for periods less than one year.
hDoes not include expenses of the Underlying Funds and Exchange Traded Funds in which the Fund invests. The weighted average indirect expenses of the Underlying Funds and
Exchange Traded Funds were 0.65% for the period ended June 30, 2012.
40 | The accompanying notes are an integral part of these financial statements. | Semiannual Report
Franklin Templeton Fund Allocator Series
Statement of Investments, June 30, 2012 (unaudited)
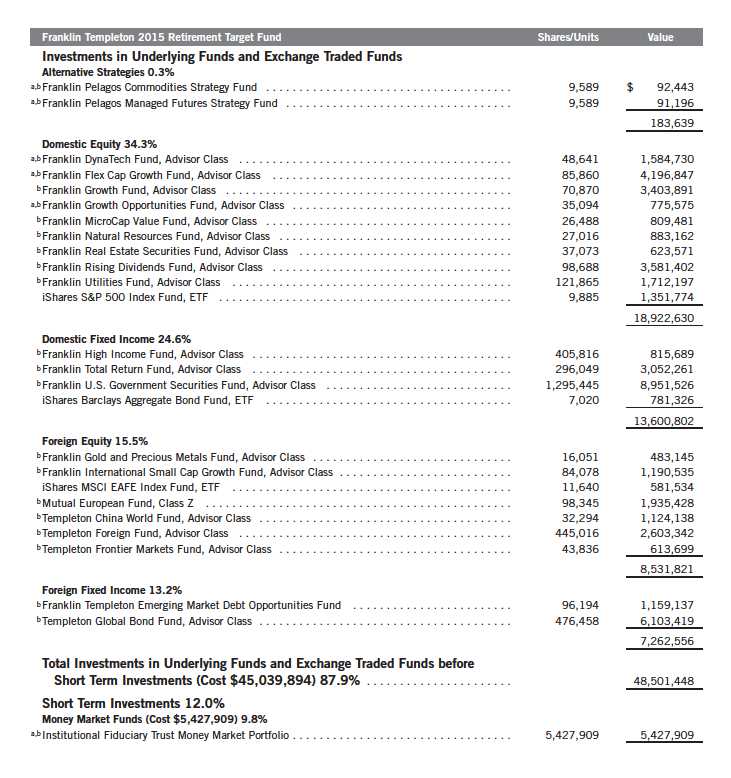
Semiannual Report | 41
Franklin Templeton Fund Allocator Series
Statement of Investments, June 30, 2012 (unaudited) (continued)
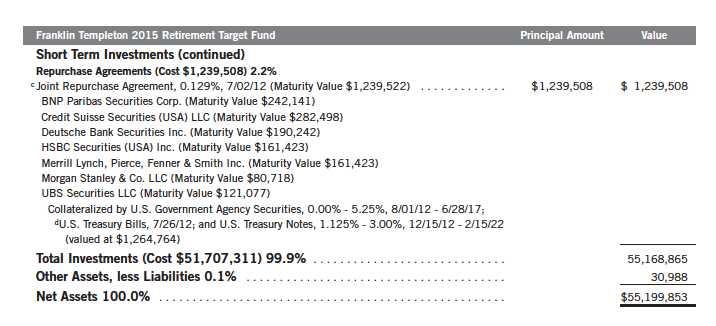
See Abbreviations on page 81.
aNon-income producing.
bSee Note 7 regarding investments in Underlying Funds.
cSee Note 1(b) regarding joint repurchase agreement.
dThe security is traded on a discount basis with no stated coupon rate.
42 | The accompanying notes are an integral part of these financial statements. | Semiannual Report
Franklin Templeton Fund Allocator Series
Financial Highlights
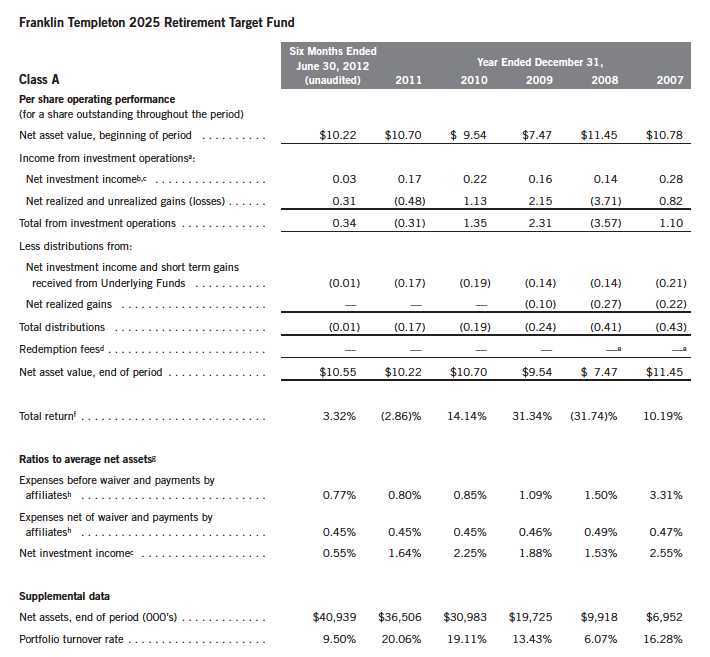
aThe amount shown for a share outstanding throughout the period may not correlate with the Statement of Operations for the period due to the timing of sales and repurchases of
the Fund shares in relation to income earned and/or fluctuating market value of the investments of the Fund.
bBased on average daily shares outstanding.
cRecognition of net investment income by the Fund is affected by the timing of declaration of dividends by the Underlying Funds and Exchange Traded Funds in which the Fund invests.
dEffective September 1, 2008, the redemption fee was eliminated.
eAmount rounds to less than $0.01 per share.
fTotal return does not reflect sales commissions or contingent deferred sales charges, if applicable, and is not annualized for periods less than one year.
gRatios are annualized for periods less than one year.
hDoes not include expenses of the Underlying Funds and Exchange Traded Funds in which the Fund invests. The weighted average indirect expenses of the Underlying Funds and
Exchange Traded Funds were 0.71% for the period ended June 30, 2012.
Semiannual Report | The accompanying notes are an integral part of these financial statements. | 43
Franklin Templeton Fund Allocator Series
Financial Highlights (continued)

aThe amount shown for a share outstanding throughout the period may not correlate with the Statement of Operations for the period due to the timing of sales and repurchases of
the Fund shares in relation to income earned and/or fluctuating market value of the investments of the Fund.
bBased on average daily shares outstanding.
cRecognition of net investment income by the Fund is affected by the timing of declaration of dividends by the Underlying Funds and Exchange Traded Funds in which the Fund invests.
dEffective September 1, 2008, the redemption fee was eliminated.
eAmount rounds to less than $0.01 per share.
fTotal return does not reflect sales commissions or contingent deferred sales charges, if applicable, and is not annualized for periods less than one year.
gRatios are annualized for periods less than one year.
hDoes not include expenses of the Underlying Funds and Exchange Traded Funds in which the Fund invests. The weighted average indirect expenses of the Underlying Funds and
Exchange Traded Funds were 0.71% for the period ended June 30, 2012.
44 | The accompanying notes are an integral part of these financial statements. | Semiannual Report
Franklin Templeton Fund Allocator Series
Financial Highlights (continued)
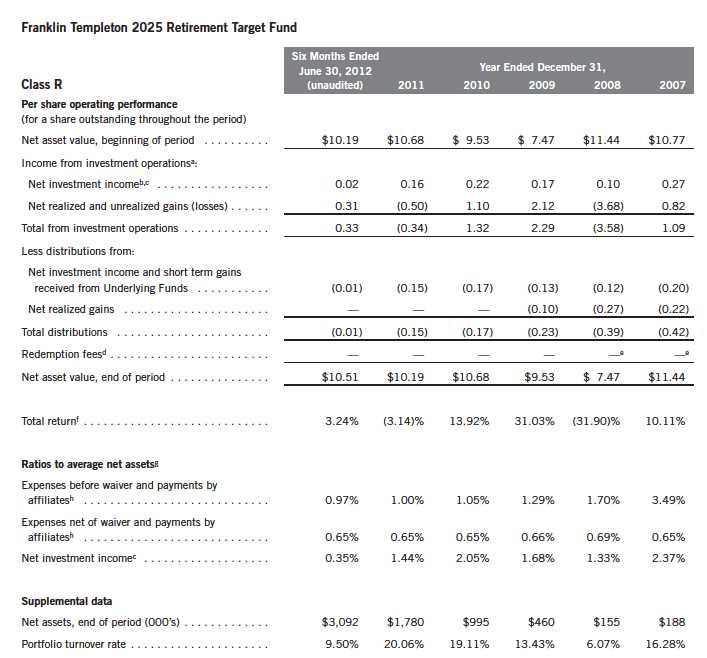
aThe amount shown for a share outstanding throughout the period may not correlate with the Statement of Operations for the period due to the timing of sales and repurchases of
the Fund shares in relation to income earned and/or fluctuating market value of the investments of the Fund.
bBased on average daily shares outstanding.
cRecognition of net investment income by the Fund is affected by the timing of declaration of dividends by the Underlying Funds and Exchange Traded Funds in which the Fund invests.
dEffective September 1, 2008, the redemption fee was eliminated.
eAmount rounds to less than $0.01 per share.
fTotal return does not reflect sales commissions or contingent deferred sales charges, if applicable, and is not annualized for periods less than one year.
gRatios are annualized for periods less than one year.
hDoes not include expenses of the Underlying Funds and Exchange Traded Funds in which the Fund invests. The weighted average indirect expenses of the Underlying Funds and
Exchange Traded Funds were 0.71% for the period ended June 30, 2012.
Semiannual Report | The accompanying notes are an integral part of these financial statements. | 45
Franklin Templeton Fund Allocator Series
Financial Highlights (continued)

aThe amount shown for a share outstanding throughout the period may not correlate with the Statement of Operations for the period due to the timing of sales and repurchases of
the Fund shares in relation to income earned and/or fluctuating market value of the investments of the Fund.
bBased on average daily shares outstanding.
cRecognition of net investment income by the Fund is affected by the timing of declaration of dividends by the Underlying Funds and Exchange Traded Funds in which the Fund invests.
dEffective September 1, 2008, the redemption fee was eliminated.
eAmount rounds to less than $0.01 per share.
fTotal return is not annualized for periods less than one year.
gRatios are annualized for periods less than one year.
hDoes not include expenses of the Underlying Funds and Exchange Traded Funds in which the Fund invests. The weighted average indirect expenses of the Underlying Funds and
Exchange Traded Funds were 0.71% for the period ended June 30, 2012.
46 | The accompanying notes are an integral part of these financial statements. | Semiannual Report
Franklin Templeton Fund Allocator Series
Statement of Investments, June 30, 2012 (unaudited)
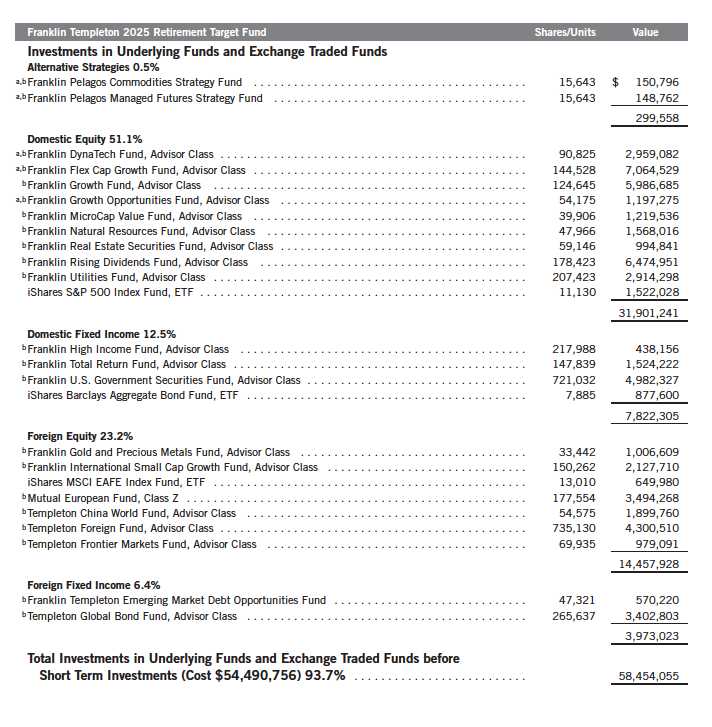
Semiannual Report | 47
Franklin Templeton Fund Allocator Series
Statement of Investments, June 30, 2012 (unaudited) (continued)
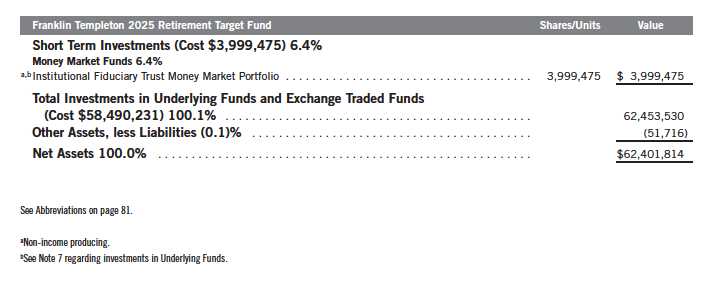
48 | The accompanying notes are an integral part of these financial statements. | Semiannual Report
Franklin Templeton Fund Allocator Series
Financial Highlights
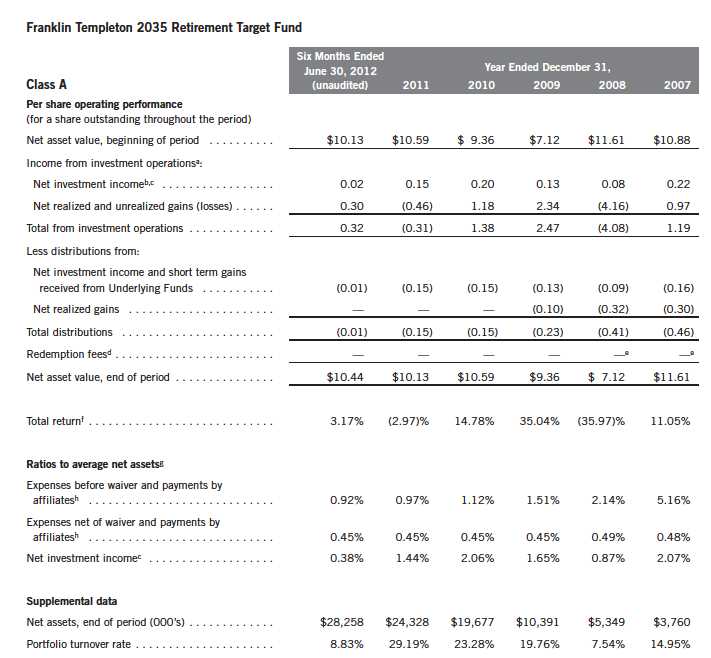
aThe amount shown for a share outstanding throughout the period may not correlate with the Statement of Operations for the period due to the timing of sales and repurchases of
the Fund shares in relation to income earned and/or fluctuating market value of the investments of the Fund.
bBased on average daily shares outstanding.
cRecognition of net investment income by the Fund is affected by the timing of declaration of dividends by the Underlying Funds and Exchange Traded Funds in which the Fund invests.
dEffective September 1, 2008, the redemption fee was eliminated.
eAmount rounds to less than $0.01 per share.
fTotal return does not reflect sales commissions or contingent deferred sales charges, if applicable, and is not annualized for periods less than one year.
gRatios are annualized for periods less than one year.
hDoes not include expenses of the Underlying Funds and Exchange Traded Funds in which the Fund invests. The weighted average indirect expenses of the Underlying Funds and
Exchange Traded Funds were 0.73% for the period ended June 30, 2012.
Semiannual Report | The accompanying notes are an integral part of these financial statements. | 49
Franklin Templeton Fund Allocator Series
Financial Highlights (continued)

aThe amount shown for a share outstanding throughout the period may not correlate with the Statement of Operations for the period due to the timing of sales and repurchases of
the Fund shares in relation to income earned and/or fluctuating market value of the investments of the Fund.
bBased on average daily shares outstanding.
cRecognition of net investment income by the Fund is affected by the timing of declaration of dividends by the Underlying Funds and Exchange Traded Funds in which the Fund invests.
dEffective September 1, 2008, the redemption fee was eliminated.
eAmount rounds to less than $0.01 per share.
fTotal return does not reflect sales commissions or contingent deferred sales charges, if applicable, and is not annualized for periods less than one year.
gRatios are annualized for periods less than one year.
hDoes not include expenses of the Underlying Funds and Exchange Traded Funds in which the Fund invests. The weighted average indirect expenses of the Underlying Funds and
Exchange Traded Funds were 0.73% for the period ended June 30, 2012.
50 | The accompanying notes are an integral part of these financial statements. | Semiannual Report
Franklin Templeton Fund Allocator Series
Financial Highlights (continued)

aThe amount shown for a share outstanding throughout the period may not correlate with the Statement of Operations for the period due to the timing of sales and repurchases of
the Fund shares in relation to income earned and/or fluctuating market value of the investments of the Fund.
bBased on average daily shares outstanding.
cRecognition of net investment income by the Fund is affected by the timing of declaration of dividends by the Underlying Funds and Exchange Traded Funds in which the Fund invests.
dEffective September 1, 2008, the redemption fee was eliminated.
eAmount rounds to less than $0.01 per share.
fTotal return does not reflect sales commissions or contingent deferred sales charges, if applicable, and is not annualized for periods less than one year.
gRatios are annualized for periods less than one year.
hDoes not include expenses of the Underlying Funds and Exchange Traded Funds in which the Fund invests. The weighted average indirect expenses of the Underlying Funds and
Exchange Traded Funds were 0.73% for the period ended June 30, 2012.
Semiannual Report | The accompanying notes are an integral part of these financial statements. | 51
Franklin Templeton Fund Allocator Series
Financial Highlights (continued)
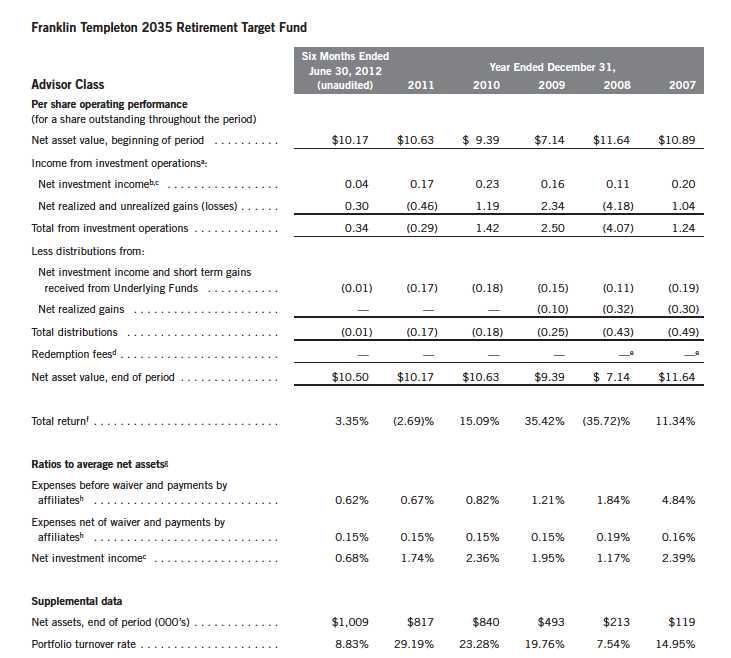
aThe amount shown for a share outstanding throughout the period may not correlate with the Statement of Operations for the period due to the timing of sales and repurchases of
the Fund shares in relation to income earned and/or fluctuating market value of the investments of the Fund.
bBased on average daily shares outstanding.
cRecognition of net investment income by the Fund is affected by the timing of declaration of dividends by the Underlying Funds and Exchange Traded Funds in which the Fund invests.
dEffective September 1, 2008, the redemption fee was eliminated.
eAmount rounds to less than $0.01 per share.
fTotal return is not annualized for periods less than one year.
gRatios are annualized for periods less than one year.
hDoes not include expenses of the Underlying Funds and Exchange Traded Funds in which the Fund invests. The weighted average indirect expenses of the Underlying Funds and
Exchange Traded Funds were 0.73% for the period ended June 30, 2012.
52 | The accompanying notes are an integral part of these financial statements. | Semiannual Report
Franklin Templeton Fund Allocator Series
Statement of Investments, June 30, 2012 (unaudited)
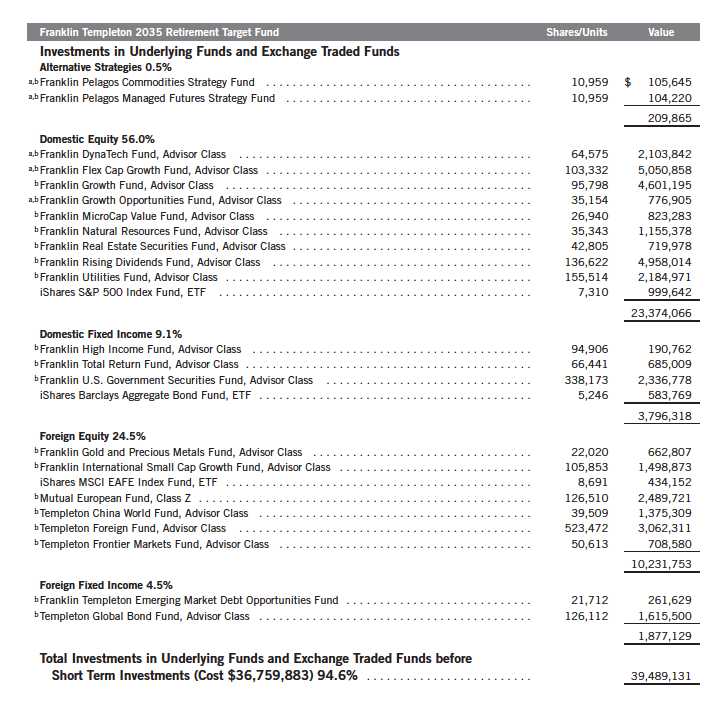
Semiannual Report | 53
Franklin Templeton Fund Allocator Series
Statement of Investments, June 30, 2012 (unaudited) (continued)
| | | |
| Franklin Templeton 2035 Retirement Target Fund | Shares/Units | | Value |
| Short Term Investments (Cost $2,192,870) 5.3% | | | |
| Money Market Funds 5.3% | | | |
| a,bInstitutional Fiduciary Trust Money Market Portfolio | 2,192,870 | $ | 2,192,870 |
| Total Investments in Underlying Funds and Exchange Traded Funds | | | |
| (Cost $38,952,753) 99.9% | | | 41,682,001 |
| Other Assets, less Liabilities 0.1% | | | 54,455 |
| Net Assets 100.0% | | $ | 41,736,456 |
See Abbreviations on page 81.
aNon-income producing.
bSee Note 7 regarding investments in Underlying Funds.
54 | The accompanying notes are an integral part of these financial statements. | Semiannual Report
Franklin Templeton Fund Allocator Series
Financial Highlights

aThe amount shown for a share outstanding throughout the period may not correlate with the Statement of Operations for the period due to the timing of sales and repurchases of
the Fund shares in relation to income earned and/or fluctuating market value of the investments of the Fund.
bBased on average daily shares outstanding.
cRecognition of net investment income by the Fund is affected by the timing of declaration of dividends by the Underlying Funds and Exchange Traded Funds in which the Fund invests.
dEffective September 1, 2008, the redemption fee was eliminated.
eAmount rounds to less than $0.01 per share.
fTotal return does not reflect sales commissions or contingent deferred sales charges, if applicable, and is not annualized for periods less than one year.
gRatios are annualized for periods less than one year.
hDoes not include expenses of the Underlying Funds and Exchange Traded Funds in which the Fund invests. The weighted average indirect expenses of the Underlying Funds and
Exchange Traded Funds were 0.74% for the period ended June 30, 2012.
Semiannual Report | The accompanying notes are an integral part of these financial statements. | 55
Franklin Templeton Fund Allocator Series
Financial Highlights (continued)
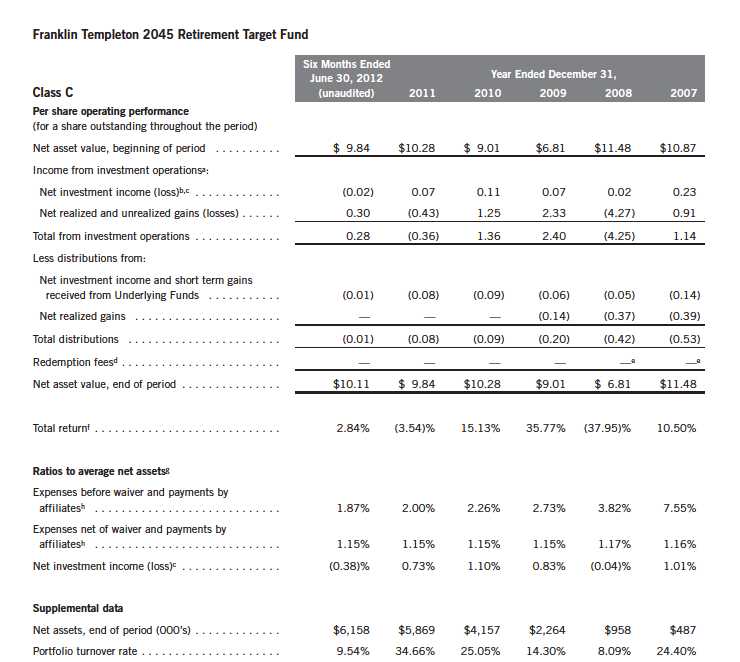
aThe amount shown for a share outstanding throughout the period may not correlate with the Statement of Operations for the period due to the timing of sales and repurchases of
the Fund shares in relation to income earned and/or fluctuating market value of the investments of the Fund.
bBased on average daily shares outstanding.
cRecognition of net investment income by the Fund is affected by the timing of declaration of dividends by the Underlying Funds and Exchange Traded Funds in which the Fund invests.
dEffective September 1, 2008, the redemption fee was eliminated.
eAmount rounds to less than $0.01 per share.
fTotal return does not reflect sales commissions or contingent deferred sales charges, if applicable, and is not annualized for periods less than one year.
gRatios are annualized for periods less than one year.
hDoes not include expenses of the Underlying Funds and Exchange Traded Funds in which the Fund invests. The weighted average indirect expenses of the Underlying Funds and
Exchange Traded Funds were 0.74% for the period ended June 30, 2012.
56 | The accompanying notes are an integral part of these financial statements. | Semiannual Report
Franklin Templeton Fund Allocator Series
Financial Highlights (continued)

aThe amount shown for a share outstanding throughout the period may not correlate with the Statement of Operations for the period due to the timing of sales and repurchases of
the Fund shares in relation to income earned and/or fluctuating market value of the investments of the Fund.
bBased on average daily shares outstanding.
cRecognition of net investment income by the Fund is affected by the timing of declaration of dividends by the Underlying Funds and Exchange Traded Funds in which the Fund invests.
dEffective September 1, 2008, the redemption fee was eliminated.
eAmount rounds to less than $0.01 per share.
fTotal return does not reflect sales commissions or contingent deferred sales charges, if applicable, and is not annualized for periods less than one year.
gRatios are annualized for periods less than one year.
hDoes not include expenses of the Underlying Funds and Exchange Traded Funds in which the Fund invests. The weighted average indirect expenses of the Underlying Funds and
Exchange Traded Funds were 0.74% for the period ended June 30, 2012.
Semiannual Report | The accompanying notes are an integral part of these financial statements. | 57
Franklin Templeton Fund Allocator Series
Financial Highlights (continued)
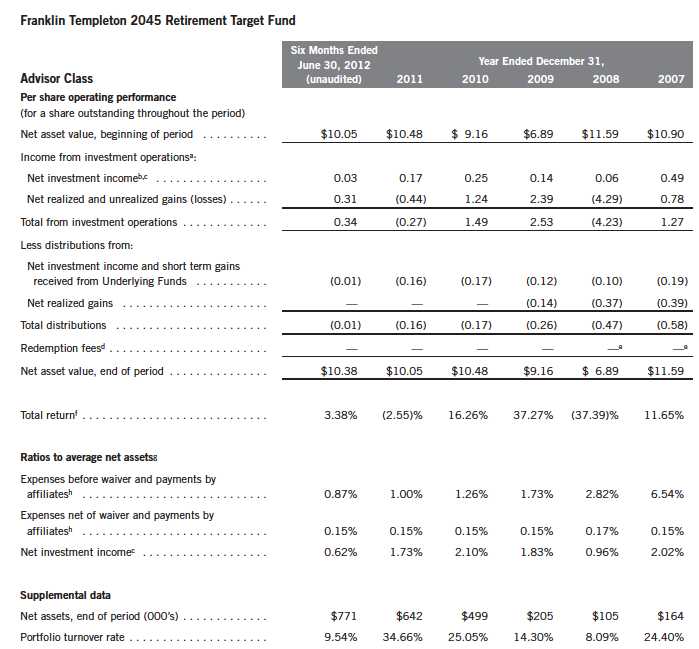
aThe amount shown for a share outstanding throughout the period may not correlate with the Statement of Operations for the period due to the timing of sales and repurchases of
the Fund shares in relation to income earned and/or fluctuating market value of the investments of the Fund.
bBased on average daily shares outstanding.
cRecognition of net investment income by the Fund is affected by the timing of declaration of dividends by the Underlying Funds and Exchange Traded Funds in which the Fund invests.
dEffective September 1, 2008, the redemption fee was eliminated.
eAmount rounds to less than $0.01 per share.
fTotal return is not annualized for periods less than one year.
gRatios are annualized for periods less than one year.
hDoes not include expenses of the Underlying Funds and Exchange Traded Funds in which the Fund invests. The weighted average indirect expenses of the Underlying Funds and
Exchange Traded Funds were 0.74% for the period ended June 30, 2012.
58 | The accompanying notes are an integral part of these financial statements. | Semiannual Report
Franklin Templeton Fund Allocator Series
Statement of Investments, June 30, 2012 (unaudited)
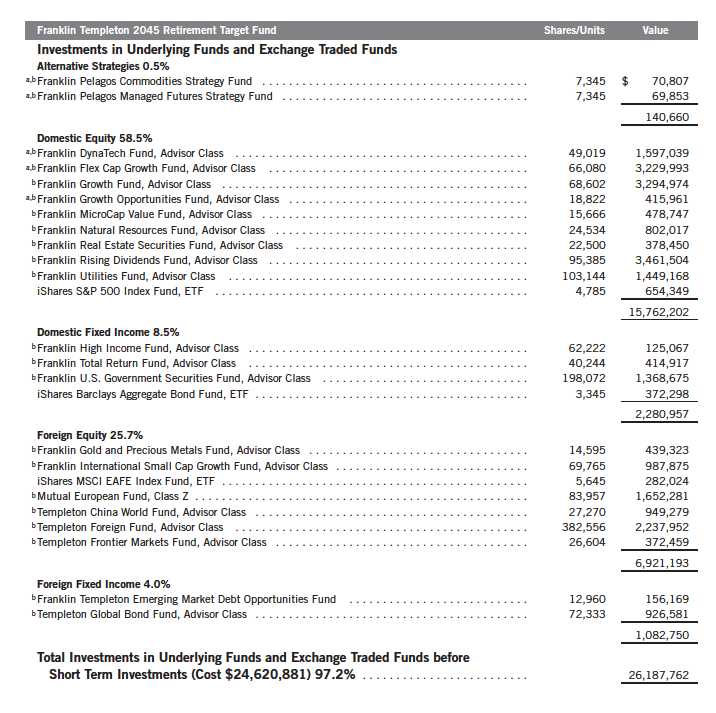
Semiannual Report | 59
Franklin Templeton Fund Allocator Series
Statement of Investments, June 30, 2012 (unaudited) (continued)

See Abbreviations on page 81.
aNon-income producing.
bSee Note 7 regarding investments in Underlying Funds.
60 | The accompanying notes are an integral part of these financial statements. | Semiannual Report
Franklin Templeton Fund Allocator Series
Financial Statements
Statements of Assets and Liabilities
June 30, 2012 (unaudited)
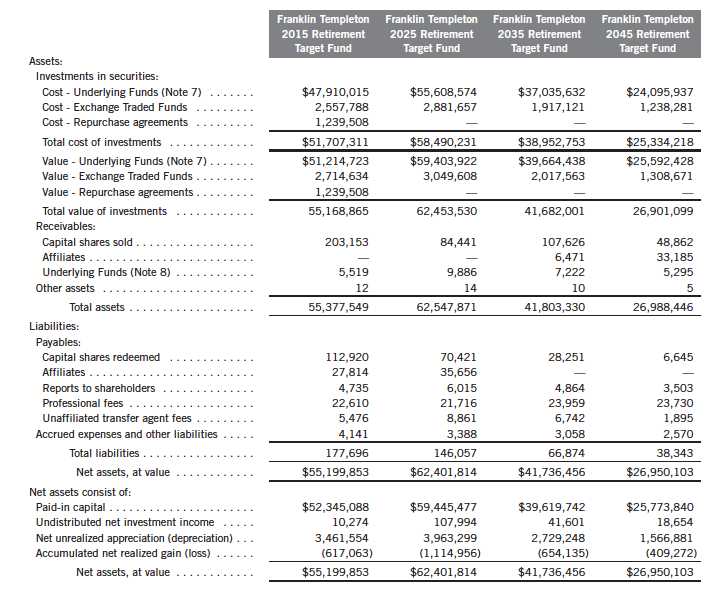
Semiannual Report | The accompanying notes are an integral part of these financial statements. | 61
Franklin Templeton Fund Allocator Series
Financial Statements (continued)
Statements of Assets and Liabilities (continued)
June 30, 2012 (unaudited)

62 | The accompanying notes are an integral part of these financial statements. | Semiannual Report
Franklin Templeton Fund Allocator Series
Financial Statements (continued)
Statements of Operations
for the six months ended June 30, 2012 (unaudited)
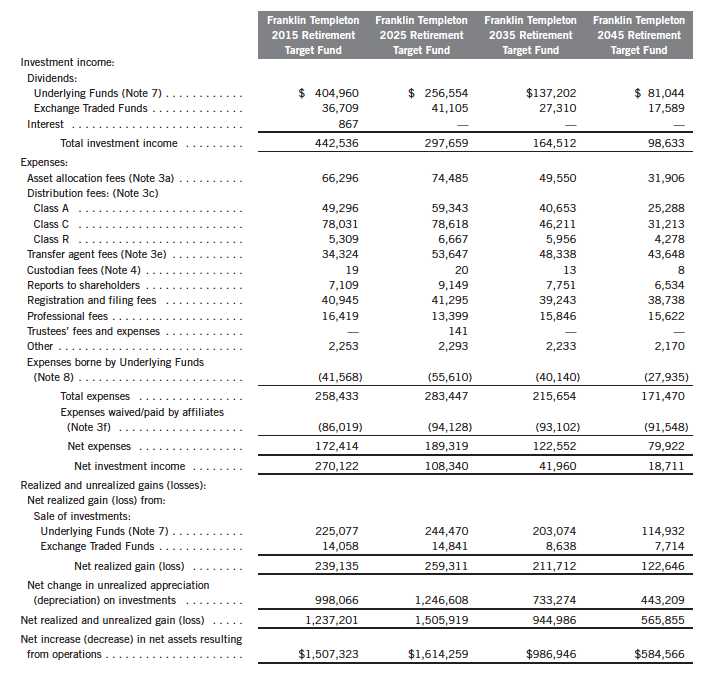
Semiannual Report | The accompanying notes are an integral part of these financial statements. | 63
Franklin Templeton Fund Allocator Series
Financial Statements (continued)
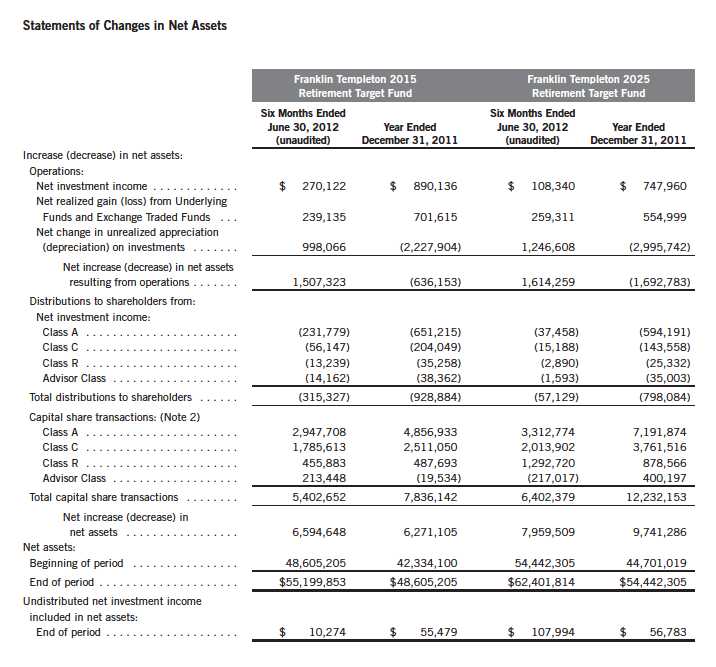
64 | The accompanying notes are an integral part of these financial statements. | Semiannual Report
Franklin Templeton Fund Allocator Series
Financial Statements (continued)
Statements of Changes in Net Assets (continued)
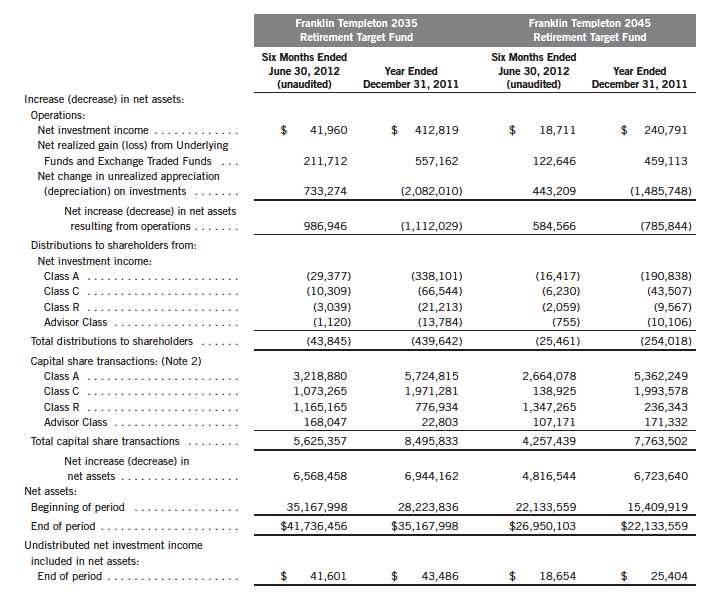
Semiannual Report | The accompanying notes are an integral part of these financial statements. | 65
Franklin Templeton Fund Allocator Series
Notes to Financial Statements (unaudited)
1. ORGANIZATION AND SIGNIFICANT ACCOUNTING POLICIES
Franklin Templeton Fund Allocator Series (Trust) is registered under the Investment Company Act of 1940, as amended, (1940 Act) as an open-end investment company, consisting of ten separate funds, four of which are included in this report (Funds). The financial statements of the remaining funds in the Trust are presented separately. The Funds invest primarily in Franklin Templeton mutual funds (Underlying Funds). The Funds offer four classes of shares: Class A, Class C, Class R, and Advisor Class. Each class of shares differs by its initial sales load, contingent deferred sales charges, distribution fees, voting rights on matters affecting a single class and its exchange privilege.
The following summarizes the Funds significant accounting policies.
a. Financial Instrument Valuation
The Funds investments in financial instruments are carried at fair value daily. Fair value is the price that would be received to sell an asset or paid to transfer a liability in an orderly transaction between market participants on the measurement date. Under procedures approved by the Trust s Board of Trustees (the Board), the Funds administrator, investment manager and other affiliates have formed the Valuation and Liquidity Oversight Committee (VLOC). The VLOC provides administration and oversight of the Funds valuation policies and procedures, which are approved annually by the Board. Investments in the Underlying Funds are valued at their closing net asset value each trading day. Exchange Traded Funds (ETFs) listed on an exchange or on the NASDAQ National Market System are valued at the last quoted sale price or the official closing price of the day, respectively.
b. Joint Repurchase Agreement
The Franklin Templeton 2015 Retirement Target Fund enters into a joint repurchase agreement whereby its uninvested cash balance is deposited into a joint cash account with other funds managed by the investment manager or an affiliate of the investment manager and is used to invest in one or more repurchase agreements. The value and face amount of the joint repurchase agreement are allocated to the funds based on their pro-rata interest. A repurchase agreement is accounted for as a loan by the fund to the seller, collateralized by securities which are delivered to the fund s custodian. The market value, including accrued interest, of the initial collateralization is required to be at least 102% of the dollar amount invested by the funds, with the value of the underlying securities marked to market daily to maintain coverage of at least 100%. The joint repurchase agreement held by the Fund at period end had been entered into on June 29, 2012.
c. Income Taxes
It is each fund s policy to qualify as a regulated investment company under the Internal Revenue Code. Each fund intends to distribute to shareholders substantially all of its taxable income and net realized gains to relieve it from federal income and if applicable, excise taxes. As a result, no provision for U.S. federal income taxes is required.
66 | Semiannual Report
Franklin Templeton Fund Allocator Series
Notes to Financial Statements (unaudited) (continued)
| 1. | ORGANIZATION AND SIGNIFICANT ACCOUNTING POLICIES (continued) |
| c. | Income Taxes (continued) |
Each fund recognizes the tax benefits of uncertain tax positions only when the position is more likely than not to be sustained upon examination by the tax authorities based on the technical merits of the tax position. As of June 30, 2012, and for all open tax years, each fund has determined that no liability for unrecognized tax benefits is required in each fund s financial statements related to uncertain tax positions taken on a tax return (or expected to be taken on future tax returns). Open tax years are those that remain subject to examination and are based on each tax jurisdiction statute of limitation.
d. Security Transactions, Investment Income, Expenses and Distributions
Security transactions are accounted for on trade date. Realized gains and losses on security transactions are determined on a specific identification basis. Estimated expenses are accrued daily. Dividend income and realized gain distributions by Underlying Funds and ETFs are recorded on the ex-dividend date. Distributions to shareholders are recorded on the ex-dividend date and are determined according to income tax regulations (tax basis). Distributable earnings determined on a tax basis may differ from earnings recorded in accordance with accounting principles generally accepted in the United States of America. These differences may be permanent or temporary. Permanent differences are reclassified among capital accounts to reflect their tax character. These reclassifications have no impact on net assets or the results of operations. Temporary differences are not reclassified, as they may reverse in subsequent periods.
Common expenses incurred by the Trust are allocated among the funds based on the ratio of net assets of each fund to the combined net assets of the Trust. Fund specific expenses are charged directly to the fund that incurred the expense.
The Funds indirectly bear their proportionate share of expenses from the Underlying Funds and ETFs. Since the Underlying Funds and ETFs have varied expense levels and the Funds may own different proportions of the Underlying Funds and ETFs at different times, the amount of expenses incurred indirectly by the Funds will vary.
Realized and unrealized gains and losses and net investment income, not including class specific expenses, are allocated daily to each class of shares based upon the relative proportion of net assets of each class. Differences in per share distributions, by class, are generally due to differences in class specific expenses.
e. Accounting Estimates
The preparation of financial statements in accordance with accounting principles generally accepted in the United States of America requires management to make estimates and assumptions that affect the reported amounts of assets and liabilities at the date of the financial statements and the amounts of income and expenses during the reporting period. Actual results could differ from those estimates.
Semiannual Report | 67
Franklin Templeton Fund Allocator Series
Notes to Financial Statements (unaudited) (continued)
| 1. | ORGANIZATION AND SIGNIFICANT ACCOUNTING POLICIES (continued) |
| f. | Guarantees and Indemnifications |
Under the Trust s organizational documents, its officers and trustees are indemnified by the Trust against certain liabilities arising out of the performance of their duties to the Trust. Additionally, in the normal course of business, the Trust, on behalf of the Funds, enters into contracts with service providers that contain general indemnification clauses. The Trust s maximum exposure under these arrangements is unknown as this would involve future claims that may be made against the Trust that have not yet occurred. Currently, the Trust expects the risk of loss to be remote.
2. SHARES OF BENEFICIAL INTEREST
At June 30, 2012, there were an unlimited number of shares authorized (without par value).
Transactions in the Funds shares were as follows:
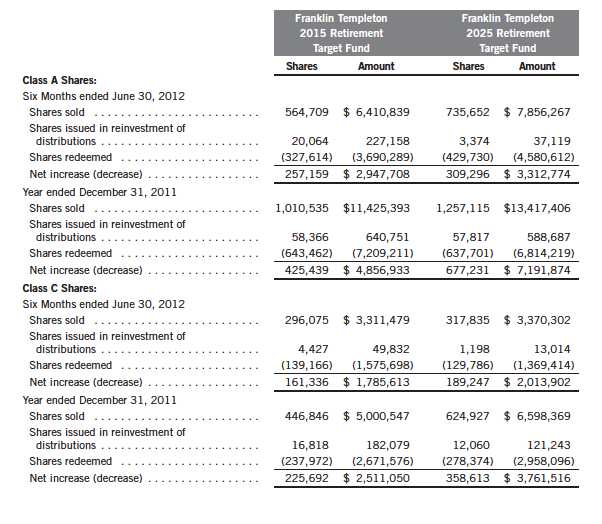
68 | Semiannual Report
Franklin Templeton Fund Allocator Series
Notes to Financial Statements (unaudited) (continued)
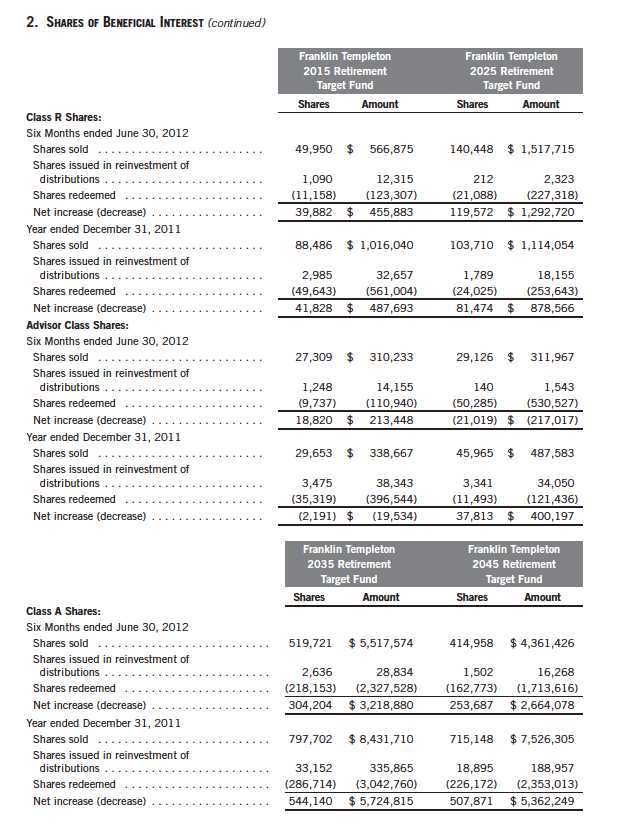
Semiannual Report | 69
Franklin Templeton Fund Allocator Series
Notes to Financial Statements (unaudited) (continued)
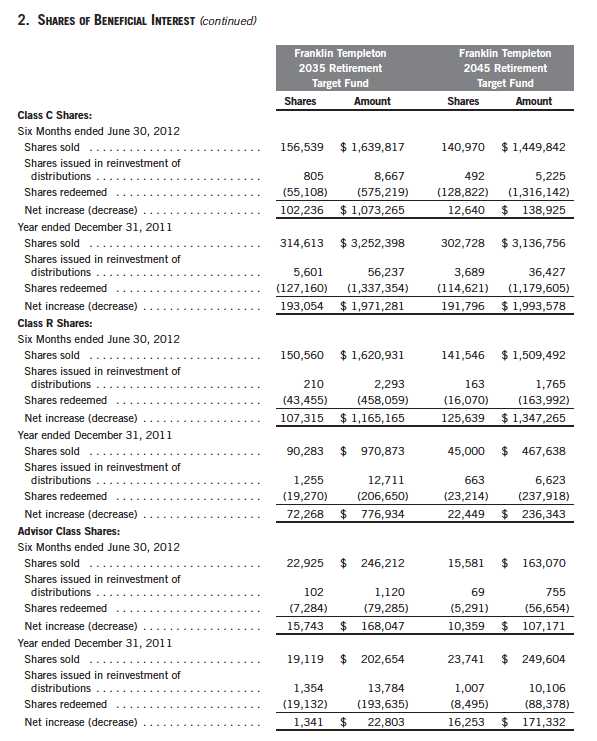
70 | Semiannual Report
Franklin Templeton Fund Allocator Series
Notes to Financial Statements (unaudited) (continued)
3. TRANSACTIONS WITH AFFILIATES
Franklin Resources, Inc. is the holding company for various subsidiaries that together are referred to as Franklin Templeton Investments. Certain officers and trustees of the Funds are also officers and/or directors/trustees of certain of the Underlying Funds and of the following subsidiaries:
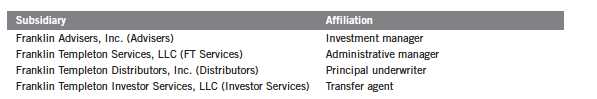
a. Asset Allocation Fees
The Funds pay an asset allocation fee to Advisers of 0.25% per year of the average daily net assets of each of the Funds for investment advisory services, consisting principally of determining the allocation of assets of the Funds among the designated Underlying Funds and ETFs.
b. Administrative Fees
FT Services, under terms of an agreement, provides administrative services to the Funds and is not paid by the Funds for the services.
c. Distribution Fees
The Board has adopted distribution plans for each share class, with the exception of Advisor Class shares, pursuant to Rule 12b-1 under the 1940 Act. Under the Funds Class A reimbursement distribution plan, the Funds reimburse Distributors for costs incurred in connection with the servicing, sale and distribution of each Funds shares up to the maximum annual plan rate. Under the Class A reimbursement distribution plan, costs exceeding the maximum for the current plan year cannot be reimbursed in subsequent periods.
In addition, under the Funds Class C and R compensation distribution plans, the Funds pay Distributors for costs incurred in connection with the servicing, sale and distribution of each fund s shares up to the maximum annual plan rate for each class.
The maximum annual plan rates, based on the average daily net assets, for each class, are as follows:
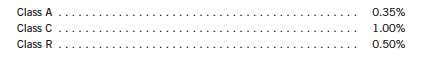
The Board has set the current rate at 0.30% per year for Class A shares until further notice and approval by the Board.
Semiannual Report | 71
Franklin Templeton Fund Allocator Series
Notes to Financial Statements (unaudited) (continued)
| 3. | TRANSACTIONS WITH AFFILIATES (continued) |
| d. | Sales Charges/Underwriting Agreements |
Front-end sales charges and contingent deferred sales charges (CDSC) do not represent expenses of the Funds. These charges are deducted from the proceeds of sales of fund shares prior to investment or from redemption proceeds prior to remittance, as applicable. Distributors has advised the Funds of the following commission transactions related to the sales and redemptions of the Funds shares for the period:
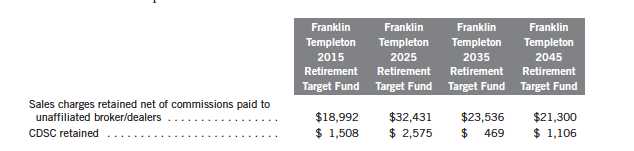
e. Transfer Agent Fees
For the period ended June 30, 2012, the Funds paid transfer agent fees as noted in the Statements of Operations of which the following amounts were retained by Investor Services:

Advisers has contractually agreed in advance to waive or limit its fees and to assume as its own expense certain expenses otherwise payable by the funds so that the common expenses (i.e. a combination of asset allocation fees, and other expenses, but excluding distribution fees, and acquired fund fees and expenses) for each class of the funds do not exceed 0.15% (other than certain non-routine expenses or costs, including those relating to litigation, indemnification, reorganizations, and liquidations) until April 30, 2013.
4. EXPENSE OFFSET ARRANGEMENT
The Funds have entered into an arrangement with their custodian whereby credits realized as a result of uninvested cash balances are used to reduce a portion of the Funds custodian expenses. During the period ended June 30, 2012, there were no credits earned.
72 | Semiannual Report
Franklin Templeton Fund Allocator Series
Notes to Financial Statements (unaudited) (continued)
5. INCOME TAXES
For tax purposes, capital losses may be carried over to offset future capital gains, if any. Capital loss carryforwards with no expiration, if any, must be fully utilized before those losses with expiration dates.
At December 31, 2011, the capital loss carryforwards were as follows:

For tax purposes, the Funds may elect to defer any portion of a post-October capital loss to the first day of the following fiscal year. At December 31, 2011, the deferred post-October capital losses were as follows:

At June 30, 2012, the cost of investments and net unrealized appreciation (depreciation) for income tax purposes were as follows:
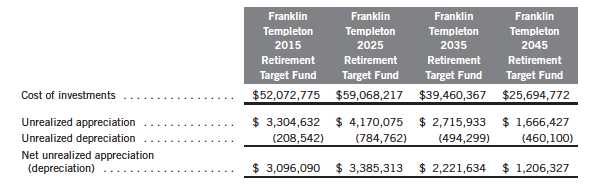
Differences between income and/or capital gains as determined on a book basis and a tax basis are primarily due to differing treatments of short term capital gains distributions from Underlying Funds and ETFs and wash sales.
Semiannual Report | 73
Franklin Templeton Fund Allocator Series
Notes to Financial Statements (unaudited) (continued)
6. INVESTMENT TRANSACTIONS
Purchases and sales of Underlying Funds and ETFs (excluding short term securities) for the period ended June 30, 2012, were as follows:
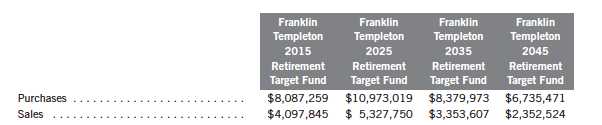
7. INVESTMENTS IN UNDERLYING FUNDS
The Funds invest primarily in the Underlying Funds which are managed by Advisers (or an affiliate of Advisers). The Funds do not invest in the Underlying Funds for the purpose of exercising a controlling influence over the management or policies.
The Funds may invest in the Institutional Fiduciary Trust Money Market Portfolio (Sweep Money Fund), an open-end investment company managed by Advisers. Asset allocation fees are reduced on assets invested in the Sweep Money Fund, in an amount not to exceed the management and administrative fees paid by the Sweep Money Fund.
Investments in Underlying Funds for the period ended June 30, 2012, were as follows:
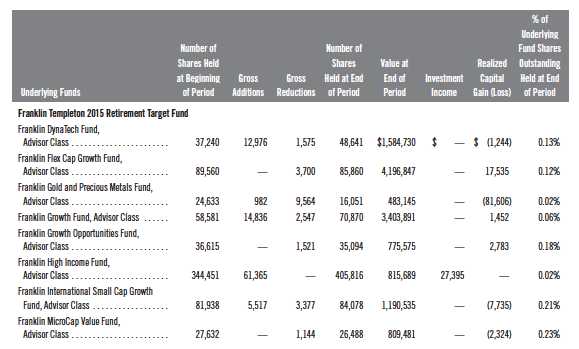
74 | Semiannual Report
Franklin Templeton Fund Allocator Series
Notes to Financial Statements (unaudited) (continued)
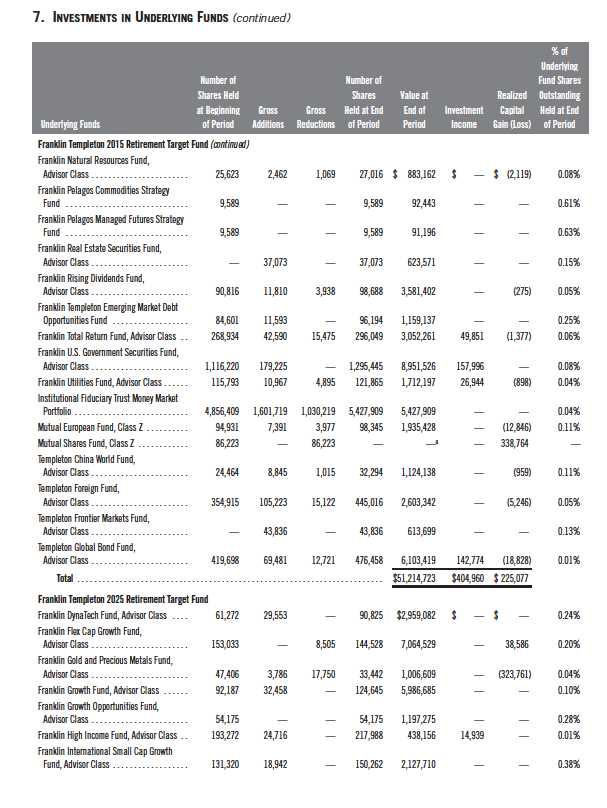
Semiannual Report | 75
Franklin Templeton Fund Allocator Series
Notes to Financial Statements (unaudited) (continued)
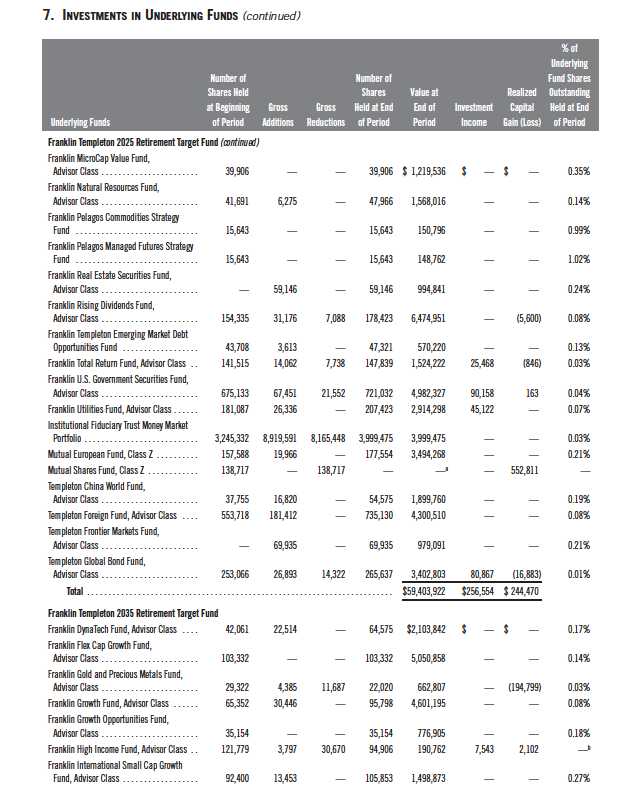
76 | Semiannual Report
Franklin Templeton Fund Allocator Series
Notes to Financial Statements (unaudited) (continued)
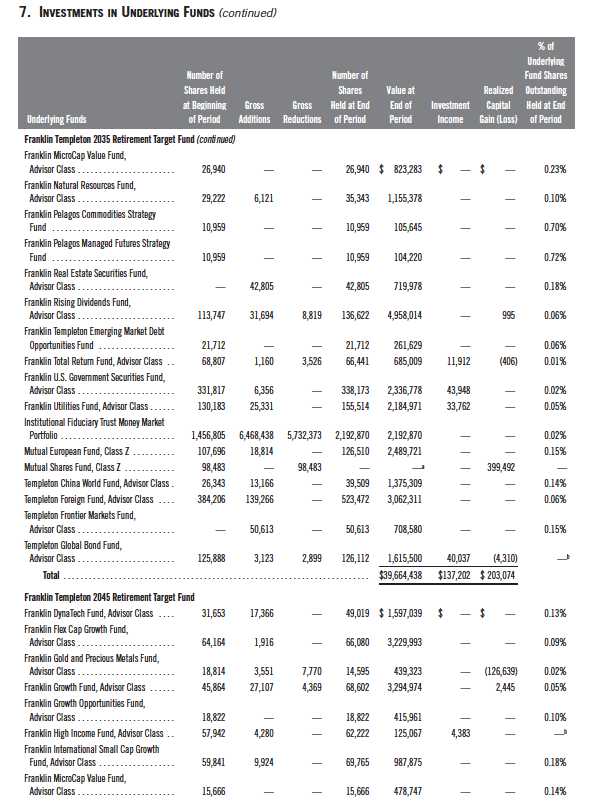
Semiannual Report | 77
Franklin Templeton Fund Allocator Series
Notes to Financial Statements (unaudited) (continued)
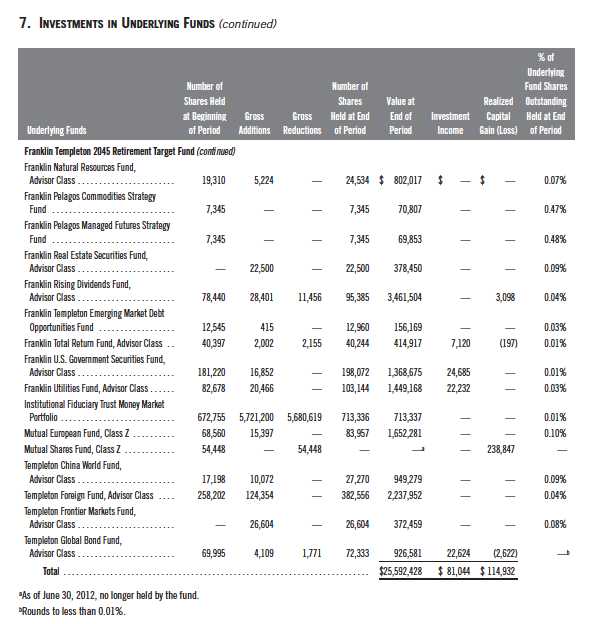
8. SPECIAL SERVICING AGREEMENT
The Funds participate in a Special Servicing Agreement (SSA) with the Underlying Funds (except for the Franklin Pelagos Commodities Strategy Fund and Franklin Pelagos Managed Futures Strategy Fund) and certain service providers of the Funds and of the Underlying Funds. Under the SSA, each Underlying Fund may pay a portion of the Funds expenses (other than any asset allocation and distribution fees) to the extent such payments are less than the amount of the benefits realized or expected to be realized by the Underlying Fund (e.g., due to reduced costs
78 | Semiannual Report
Franklin Templeton Fund Allocator Series
Notes to Financial Statements (unaudited) (continued)
8. SPECIAL SERVICING AGREEMENT (continued)
associated with servicing accounts) from the investment in the Underlying Fund by the Funds. The amount of expenses borne by the Underlying Funds during the period ended June 30, 2012 is noted in the Statements of Operations.
9. CREDIT FACILITY
The Funds, together with other U.S. registered and foreign investment funds (collectively, Borrowers), managed by Franklin Templeton Investments, are borrowers in a joint syndicated senior unsecured credit facility totaling $1.5 billion (Global Credit Facility) which matures on January 18, 2013. This Global Credit Facility provides a source of funds to the Borrowers for temporary and emergency purposes, including the ability to meet future unanticipated or unusually large redemption requests.
Under the terms of the Global Credit Facility, the Funds shall, in addition to interest charged on any borrowings made by the Funds and other costs incurred by the Funds, pay their share of fees and expenses incurred in connection with the implementation and maintenance of the Global Credit Facility, based upon their relative share of the aggregate net assets of all of the Borrowers, including an annual commitment fee of 0.08% based upon the unused portion of the Global Credit Facility, which is reflected in other expenses on the Statements of Operations. During the period ended June 30, 2012, the Funds did not use the Global Credit Facility.
10. FAIR VALUE MEASUREMENTS
The Funds follow a fair value hierarchy that distinguishes between market data obtained from independent sources (observable inputs) and the Funds own market assumptions (unobservable inputs). These inputs are used in determining the value of the Funds financial instruments and are summarized in the following fair value hierarchy:
- Level 1 quoted prices in active markets for identical financial instruments
- Level 2 other significant observable inputs (including quoted prices for similar financial instruments, interest rates, prepayment speed, credit risk, etc.)
- Level 3 significant unobservable inputs (including the Funds own assumptions in determining the fair value of financial instruments)
The inputs or methodology used for valuing financial instruments are not an indication of the risk associated with investing in those financial instruments.
For movements between the levels within the fair value hierarchy, the Funds have adopted a policy of recognizing the transfers as of the date of the underlying event which caused the movement.
Semiannual Report | 79
Franklin Templeton Fund Allocator Series
Notes to Financial Statements (unaudited) (continued)
| 10. | FAIR VALUE MEASUREMENTS (continued) |
| A | summary of inputs used as of June 30, 2012, in valuing the Funds assets carried at fair value |
is as follows:
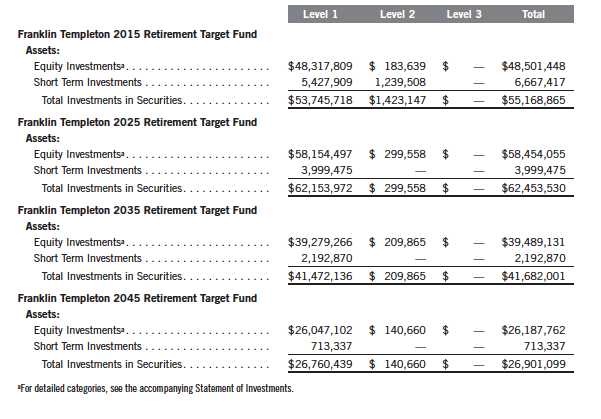
11. NEW ACCOUNTING PRONOUNCEMENTS
In December 2011, the Financial Accounting Standards Board (FASB) issued Accounting Standards Update (ASU) No. 2011-11, Balance Sheet (Topic 210): Disclosures about Offsetting Assets and Liabilities. The amendments in the ASU enhance disclosures about offsetting of financial assets and liabilities to enable investors to understand the effect of these arrangements on a fund s financial position. The ASU is effective for interim and annual reporting periods beginning on or after January 1, 2013. The Funds believe the adoption of this ASU will not have a material impact on their financial statements.
80 | Semiannual Report
Franklin Templeton Fund Allocator Series
Notes to Financial Statements (unaudited) (continued)

Semiannual Report | 81
Franklin Templeton Fund Allocator Series
Shareholder Information
Board Review of Investment Management Agreement
At a meeting held February 28, 2012, the Board of Trustees (Board), including a majority of non-interested or independent Trustees, approved renewal of the investment management agreement for each of the separate funds within Franklin Templeton Fund Allocator Series (Fund(s)). In reaching its decision to approve renewal of the investment management agreements, the Board took into account information furnished throughout the year at regular Board meetings, as well as information prepared specifically in connection with the annual renewal review process. Information furnished and discussed throughout the year included investment performance reports and related financial information for each Fund, as well as periodic reports on expenses, shareholder services, legal and compliance matters, pricing, brokerage commissions and execution and other services provided by the Investment Manager (Manager) and its affiliates. Information furnished specifically in connection with the renewal process included a report for each Fund prepared by Lipper, Inc. (Lipper), an independent organization, as well as additional material, including a Fund profitability analysis prepared by management. The Lipper reports compared each Fund s investment performance and expenses with those of other mutual funds deemed comparable to the Fund as selected by Lipper. The Fund profitability analysis discussed the profitability to Franklin Templeton Investments from its overall U.S. fund operations, as well as on an individual fund-by-fund basis. Additional material accompanying such profitability analysis included information on a fund-by-fund basis listing portfolio managers and other accounts they manage, as well as information on management fees charged by the Manager and its affiliates to U.S. mutual funds and other accounts, including management s explanation of differences where relevant. Such material also included a memorandum prepared by management describing project initiatives and capital investments relating to the services provided to the Funds by the Franklin Templeton Investments organization, as well as a memorandum relating to economies of scale and an analysis concerning transfer agent fees charged by an affiliate of the Manager.
In considering such materials, the independent Trustees received assistance and advice from and met separately with independent counsel. While the investment management agreements for all Funds were considered at the same Board meeting, the Board dealt with each Fund separately. In approving continuance of the investment management agreement for each Fund, the Board, including a majority of independent Trustees, determined that the existing management fee structure was fair and reasonable and that continuance of the investment management agreement was in the best interests of each Fund and its shareholders. While attention was given to all information furnished, the following discusses some primary factors relevant to the Board s decision.
NATURE, EXTENT AND QUALITY OF SERVICE. The Board was satisfied with the nature and quality of the overall services provided by the Manager and its affiliates to the Funds and their shareholders. In addition to investment performance and expenses discussed later, the Board s opinion was based, in part, upon periodic reports furnished it showing that the investment policies and restrictions for each Fund were consistently complied with as well as other reports periodically furnished the Board covering matters such as the compliance of portfolio managers and other
82 | Semiannual Report
Franklin Templeton Fund Allocator Series
Shareholder Information (continued)
Board Review of Investment Management Agreement (continued)
management personnel with the code of ethics adopted throughout the Franklin Templeton fund complex, the adherence to fair value pricing procedures established by the Board, and the accuracy of net asset value calculations. The Board also noted the extent of benefits provided Fund shareholders from being part of the Franklin Templeton family of funds, including the right to exchange investments between the same class of funds without a sales charge, the ability to reinvest Fund dividends into other funds and the right to combine holdings in other funds to obtain a reduced sales charge. Favorable consideration was given to management s continuous efforts and expenditures in establishing back-up systems and recovery procedures to function in the event of a natural disaster, it being noted that such systems and procedures had functioned smoothly during the Florida hurricanes and blackouts experienced in previous years. Among other factors taken into account by the Board were the Manager s best execution trading policies, including a favorable report by an independent portfolio trading analytical firm, which also covered FOREX transactions. Consideration was also given to the experience of each Fund s portfolio management team, the number of accounts managed and general method of compensation. In this latter respect, the Board noted that a primary factor in management s determination of a portfolio manager s bonus compensation was the relative investment performance of the funds he or she managed and that a portion of such bonus was required to be invested in a predesignated list of funds within such person s fund management area so as to be aligned with the interests of shareholders. The Board also took into account the quality of transfer agent and shareholder services provided Fund shareholders by an affiliate of the Manager and the continuous enhancements to the Franklin Templeton website. Particular attention was given to management s conservative approach and diligent risk management procedures, including continuous monitoring of counterparty credit risk and attention given to derivatives and other complex instruments including expanded collateralization requirements. The Board also took into account, among other things, management s efforts in establishing a global credit facility for the benefit of the Funds and other accounts managed by Franklin Templeton Investments to provide a source of cash for temporary and emergency purposes or to meet unusual redemption requests as well as the strong financial position of the Manager s parent company and its commitment to the mutual fund business as evidenced by its subsidization of money market funds.
INVESTMENT PERFORMANCE. The Board placed significant emphasis on the investment performance of each Fund in view of its importance to shareholders. While consideration was given to performance reports and discussions with portfolio managers at Board meetings throughout the year, particular attention in assessing performance was given to the Lipper reports furnished for the agreement renewals. The Lipper reports prepared for each individual Fund showed the investment performance of its Class A shares in comparison to a performance universe selected by Lipper. Comparative performance for each Fund was shown for the one-year period ended December 31, 2011, and for additional periods ended that date depending on when a particular Fund commenced operations. The following summarizes the performance results for each of the Funds and the Board s view of such performance.
Semiannual Report | 83
Franklin Templeton Fund Allocator Series
Shareholder Information (continued)
Board Review of Investment Management Agreement (continued)
Franklin Templeton 2015 Retirement Target Fund The performance universe for this Fund consisted of the Fund and all retail and institutional mixed-asset target 2015 funds as selected by Lipper. The Fund has been in operation for only five full years at the date of the Lipper report, which showed its 2011 total return to be in the second-lowest quintile of its performance universe, but its total return on an annualized basis to be in the highest quintile of such universe during each of the previous three- and five-year periods. In discussing 2011 performance, management explained that it largely reflected the underperformance of its holdings in Templeton Global Bond Fund, which historically has been a strong performer, as well as the fact that none of the other underlying funds held in its portfolio had a significant exposure to the outperforming U.S. Treasury market. The Board was satisfied with the Fund s overall comparative performance as set forth in the Lipper report, noting its longer cumulative performance.
Franklin Templeton 2025 Retirement Target Fund The performance universe for this Fund consisted of the Fund and all retail and institutional mixed-asset target 2025 funds as selected by Lipper. The Fund has been in operation for only five full years at the date of the Lipper report, which showed its 2011 total return to be in the second-lowest quintile of its performance universe, but its total return on an annualized basis to be in the highest quintile of such universe during each of the previous three- and five-year periods. In discussing 2011 performance, management explained that it largely reflected the underperformance of its holdings in Templeton Global Bond Fund, which historically has been a strong performer, as well as the fact that none of the other underlying funds held in its portfolio had a significant exposure to the outperforming U.S. Treasury market. The Board was satisfied with the Fund s overall comparative performance as set forth in the Lipper report, noting its longer cumulative performance.
Franklin Templeton 2035 Retirement Target Fund The performance universe for this Fund consisted of the Fund and all retail and institutional mixed-asset target 2035 funds as selected by Lipper. The Fund has been in operation for only five full years at the date of the Lipper report, which showed its 2011 total return to be in the second-highest quintile of its performance universe and its total return on an annualized basis to be in the highest quintile of such performance universe during each of the previous three- and five-year periods. The Board was satisfied with the Fund s comparative performance as set forth in the Lipper report.
Franklin Templeton 2045 Retirement Target Fund The performance universe for this Fund consisted of the Fund and all retail and institutional mixed-asset target 2045 funds as selected by Lipper. The Fund has been in operation for only five full years at the date of the Lipper report, which showed the Fund s 2011 total return to be in the second-highest quintile of its performance universe and its total return on an annualized basis to be in the highest quintile of such universe during each of the previous three- and five-year periods. The Board was satisfied with the Fund s comparative performance as set forth in the Lipper report.
84 | Semiannual Report
Franklin Templeton Fund Allocator Series
Shareholder Information (continued)
Board Review of Investment Management Agreement (continued)
COMPARATIVE EXPENSES. Consideration was given to the management fee and total expense ratios of each Fund compared with those of a group of retail front-end load fund of funds selected by Lipper as its appropriate Lipper expense group. Lipper expense data is based upon information taken from each such fund s most recent annual report, which reflects historical asset levels that may be quite different from those currently existing, particularly in a period of market volatility. While recognizing such inherent limitation and the fact that expense ratios generally increase as assets decline and decrease as assets grow, the Board believed the independent analysis conducted by Lipper to be an appropriate measure of comparative expenses. In reviewing comparative costs, Lipper provides information on each Fund s contractual investment management fee in comparison with the contractual investment management fee that would have been charged by other funds within its Lipper expense group assuming they were similar in size to the Fund, as well as the actual total expense ratios of the Funds including expenses of the underlying funds they invest in. The Board noted that the Funds pay an asset allocation advisory fee. The Lipper contractual investment management fee analysis includes the advisory and administrative fees directly charged to each of the Funds as being part of the contractual investment management fee, with the investment management fees charged underlying funds being included within actual total expenses. Contractual investment management fees and total expenses for comparative consistency are shown by Lipper for Fund Class A shares. The Lipper expense reports noted in the case of each Fund that expenses had been subsidized by management fee waivers and reimbursements. The Lipper reports for Franklin Templeton 2015 Target Retirement Fund, Franklin Templeton 2025 Target Retirement Fund, Franklin Templeton 2035 Target Retirement Fund and Franklin Templeton 2045 Target Retirement Fund showed in each case that their contractual management fee rates were above but within 13 basis points of their respective Lipper expense group medians and their actual total expense ratios (including expenses of their underlying funds), were above but within 16 basis points of their respective Lipper expense group medians. The Board found the comparative expenses of these Funds as shown in the Lipper report to be acceptable.
MANAGEMENT PROFITABILITY. The Board also considered the level of profits realized by the Manager and its affiliates in connection with the operation of each Fund. In this respect, the Board reviewed the Fund profitability analysis that addresses the overall profitability of Franklin Templeton s U.S. fund business, as well as its profits in providing management and other services to each of the individual funds during the 12-month period ended September 30, 2011, being the most recent fiscal year-end for Franklin Resources, Inc., the Manager s parent. In reviewing the analysis, attention was given to the methodology followed in allocating costs to each Fund, it being recognized that allocation methodologies are inherently subjective and various allocation methodologies may each be reasonable while producing different results. In this respect, the Board noted that, while being continuously refined and reflecting changes in the Manager s own cost accounting, the allocation methodology was consistent with that followed in profitability report presentations for the Funds made in prior years and that the Funds independent registered public accounting firm had been engaged by the Manager to review the reasonableness of the allocation methodologies solely for use by the Funds Board in reference to the profitability analysis. In reviewing and discussing such analysis, management discussed with the Board its belief that costs incurred in
Semiannual Report | 85
Franklin Templeton Fund Allocator Series
Shareholder Information (continued)
Board Review of Investment Management Agreement (continued)
establishing the infrastructure necessary for the type of mutual fund operations conducted by the Manager and its affiliates may not be fully reflected in the expenses allocated to each Fund in determining its profitability, as well as the fact that the level of profits, to a certain extent, reflected operational cost savings and efficiencies initiated by management. The Board also took into account management s expenditures in improving shareholder services provided the Funds, as well as the need to implement systems and meet additional regulatory and compliance requirements resulting from statutes such as the Sarbanes-Oxley and Dodd-Frank Acts and recent SEC and other regulatory requirements. In addition, the Board considered a third-party study comparing the profitability of the Manager s parent on an overall basis to other publicly held managers broken down to show profitability from management operations exclusive of distribution expenses, as well as profitability including distribution expenses. The Board also considered the extent to which the Manager and its affiliates might derive ancillary benefits from fund operations, including revenues generated from transfer agent services and potential benefits resulting from allocation of fund brokerage and the use of commission dollars to pay for research. Based upon its consideration of all these factors, and taking into account the fact that Fund expenses were being subsidized through fee waivers, the Board determined that the level of profits realized by the Manager and its affiliates from providing services to each Fund was not excessive in view of the nature, quality and extent of services provided.
ECONOMIES OF SCALE. The Board also considered whether economies of scale are realized by the Managers as the Funds grow larger and the extent to which this is reflected in the level of management fees charged. While recognizing that any precise determination is inherently subjective, the Board noted that based upon the Fund profitability analysis, it appears that as some funds get larger, at some point economies of scale do result in the Managers realizing a larger profit margin on management services provided such a fund. The Board also noted that economies of scale are shared with a fund and its shareholders through management fee breakpoints so that as a fund grows in size, its effective management fee rate declines. The management fees charged by all or substantially all the underlying funds in which the Funds invest provide for such management fee breakpoints. Consequently, to the extent economies of scale may be realized by the investment managers of these funds, the benefits are shared with each Fund and its shareholders through a reduction in actual total expense ratios.
Proxy Voting Policies and Procedures
The Trust s investment manager has established Proxy Voting Policies and Procedures (Policies) that the Trust uses to determine how to vote proxies relating to portfolio securities. Shareholders may view the Trust s complete Policies online at franklintempleton.com. Alternatively, shareholders may request copies of the Policies free of charge by calling the Proxy Group collect at (954) 527-7678 or by sending a written request to: Franklin Templeton Companies, LLC, 300 S.E. 2nd Street, Fort Lauderdale, FL 33301, Attention: Proxy Group. Copies of the Trust s proxy voting records are also made available online at franklintempleton.com and posted on the U.S. Securities and Exchange Commission s website at sec.gov and reflect the most recent 12-month period ended June 30.
86 | Semiannual Report
Franklin Templeton Fund Allocator Series
Shareholder Information (continued)
Quarterly Statement of Investments
The Trust files a complete statement of investments with the U.S. Securities and Exchange Commission for the first and third quarters for each fiscal year on Form N-Q. Shareholders may view the filed Form N-Q by visiting the Commission s website at sec.gov. The filed form may also be viewed and copied at the Commission s Public Reference Room in Washington, DC. Information regarding the operations of the Public Reference Room may be obtained by calling (800) SEC-0330.
Semiannual Report | 87
This page intentionally left blank.
This page intentionally left blank.
This page intentionally left blank.
Item 2. Code of Ethics.
(a) The Registrant has adopted a code of ethics that applies to its principal executive officers and principal financial and accounting officer.
| (c) | N/A |
| (d) | N/A |
| (f) | Pursuant to Item 12(a)(1), the Registrant is attaching as an exhibit a copy of its code of ethics that applies to its principal executive officers and principal financial and accounting officer. |
Item 3. Audit Committee Financial Expert.
(a)(1) The Registrant has an audit committee financial expert serving on its audit committee.
(2) The audit committee financial expert is John B. Wilson and he is "independent" as defined under the relevant Securities and Exchange Commission Rules and Releases.
| | | | |
| Item | 4 | . | Principal Accountant Fees and Services. | N/A |
| Item | 5 | . | Audit Committee of Listed Registrants. | N/A |
| Item | 6 | . | Schedule of Investments. | N/A |
| Item | 7 | . | Disclosure of Proxy Voting Policies and Procedures for Closed- |
| | | | End Management Investment Companies. | N/A |
| |
| Item | 8 | . | Portfolio Managers of Closed-End Management Investment |
| | | | Companies. | N/A |
| Item | 9 | . | Purchases of Equity Securities by Closed-End Management |
| | | | Investment Company and Affiliated Purchasers. N/A |
Item 10. Submission of Matters to a Vote of Security Holders.
There have been no changes to the procedures by which shareholders may recommend nominees to the Registrant's Board of Trustees that would require disclosure herein.
Item 11. Controls and Procedures.
(a) Evaluation of Disclosure Controls and Procedures. The Registrant maintains disclosure controls and procedures that are designed to ensure that information required to be disclosed in the Registrant s filings under the Securities Exchange Act of 1934 and the Investment Company Act of 1940 is recorded, processed, summarized and reported within the periods specified in the rules and forms of the Securities and Exchange Commission. Such information is accumulated and communicated to the Registrant s management, including its principal executive officer and principal financial officer, as appropriate, to allow timely decisions regarding required disclosure. The Registrant s management, including the principal executive officer and the principal financial officer, recognizes that any set of controls and procedures, no matter how well designed and operated, can provide only reasonable assurance of achieving the desired control objectives.
Within 90 days prior to the filing date of this Shareholder Report on Form N-CSR, the Registrant had carried out an evaluation, under the supervision and with the participation of the Registrant s management, including the Registrant s principal executive officer and the Registrant s principal financial officer, of the effectiveness of the design and operation of the Registrant s disclosure controls and procedures. Based on such evaluation, the Registrant s principal executive officer and principal financial officer concluded that the Registrant s disclosure controls and procedures are effective.
(b) Changes in Internal Controls. There have been no significant changes in the Registrant s internal controls or in other factors that could significantly affect the internal controls subsequent to the date of their evaluation in connection with the preparation of this Shareholder Report on Form N-CSR.
Item 12. Exhibits.
(a)(1) Code of Ethics
(a)(2) Certifications pursuant to Section 302 of the Sarbanes-Oxley Act of 2002 of Laura F. Fergerson, Chief Executive Officer - Finance and Administration, and Gaston Gardey, Chief Financial Officer and Chief Accounting Officer
(b) Certifications pursuant to Section 906 of the Sarbanes-Oxley Act of 2002 of Laura F. Fergerson, Chief Executive Officer - Finance and Administration, and Gaston Gardey, Chief Financial Officer and Chief Accounting Officer
SIGNATURES
Pursuant to the requirements of the Securities Exchange Act of 1934 and the Investment Company Act of 1940, the registrant has duly caused this report to be signed on its behalf by the undersigned, thereunto duly authorized.
FRANKLIN TEMPLETON FUND ALLOCATOR SERIES