UNITED STATES
SECURITIES AND EXCHANGE COMMISSION
Washington, DC 20549
FORMN-CSR
CERTIFIED SHAREHOLDER REPORT OF REGISTERED
MANAGEMENT INVESTMENT COMPANIES
Investment Company Act file number 811-07851
Franklin Fund Allocator Series
(Exact name of registrant as specified in charter)
One Franklin Parkway, San Mateo, CA 94403-1906
(Address of principal executive offices) (Zip code)
Craig S. Tyle, One Franklin Parkway, San Mateo, CA 94403-1906
(Name and address of agent for service)
Registrant’s telephone number, including area code: (650)312-2000
Date of fiscal year end: 12/31
Date of reporting period: 12/31/19
Item 1. Reports to Stockholders.
Internet Delivery of Fund Reports Unless You Request Paper Copies: Effective January 1, 2021, as permitted by the SEC, paper copies of the Fund’s shareholder reports will no longer be sent by mail, unless you specifically request them from the Fund or your financial intermediary. Instead, the reports will be made available on a website, and you will be notified by mail each time a report is posted and provided with a website link to access the report.
If you already elected to receive shareholder reports electronically, you will not be affected by this change and you need not take any action. If you have not signed up for electronic delivery, we would encourage you to join fellow shareholders who have. You may elect to receive shareholder reports and other communications electronically from the Fund by calling (800)632-2301 or by contacting your financial intermediary.
You may elect to continue to receive paper copies of all your future shareholder reports free of charge by contacting your financial intermediary or, if you invest directly with a Fund, calling (800)632-2301 to let the Fund know of your request. Your election to receive reports in paper will apply to all funds held in your account.
SHAREHOLDER LETTER
Dear Shareholder:
The U.S. economy, after moderating for two consecutive quarters, grew during the 12 months ended December 31, 2019, and the unemployment rate declined. In January 2019, the U.S. Federal Reserve (Fed) signaled the end of its tightening cycle and cut the federal funds rate by 0.25% at each of its July, September and October 2019 meetings, decreasing the rate from 2.50% to 1.75% byperiod-end. The Fed cited muted inflation pressures, some soft business indicators and the potential effects of global developments on the U.S. economy as rationale for its more accommodative monetary policy. Stocks responded positively to the interest-rate cuts, despite some volatility due to U.S.-China trade tensions, and stocks gained further in December 2019 after the Fed indicated it would likely leave interest rates unchanged in 2020.
In this environment, the prices of U.S. stocks, as measured by the Standard & Poor’s® 500 Index (S&P 500®), returned +28.88% (the index increasing from 2,506.85 to 3,230.78).1,3 The prices of stocks in global developed markets, as measured by the MSCI World Index, returned +25.19% (the index increasing from 1,883.901 to 2,358.468).2,3 Investment-grade bonds, as measured by the Bloomberg Barclays U.S. Aggregate Bond Index (Bloomberg Index), posted a +8.72% total return (an index increase from 2,046.60 to 2,225.00), which includes reinvestment of income and distributions.4
We are committed to our long-term perspective and disciplined investment approach as we conduct a rigorous, fundamental analysis of securities with a regular emphasis on investment risk management.
We believe active, professional investment management serves investors well. We also recognize the important role
of financial advisors in today’s markets and encourage investors to continue to seek their advice. Amid changing markets and economic conditions, we are confident investors with a well-diversified portfolio and a patient, long-term outlook should be well positioned for the years ahead.
In addition, Franklin Fund Allocator Series’ annual report includes more detail about prevailing conditions and a discussion about investment decisions during the period. As you know, all securities markets fluctuate, as do mutual fund share prices.
We thank you for investing with Franklin, welcome your questions and comments, and look forward to assisting your future investment plans.
Sincerely,

Rupert H. Johnson, Jr.
Chairman
Franklin Fund Allocator Series
This letter reflects our analysis and opinions as of December 31, 2019, unless otherwise indicated. The information is not a complete analysis of every aspect of any market, country, industry, security or fund. Statements of fact are from sources considered reliable.
1. Source: Copyright© 2020, S&P Dow Jones Indices LLC. All rights reserved.
2. Source: MSCI.
3. Source: Morningstar. The changes in index prices shown for the S&P 500 and MSCI World Index do not include reinvestments of income and distributions, which are included in their total returns, which were: S&P 500 +31.49% (index total return resulting in an increase from 4,984.22 to 6,553.57) and MSCI World Index +28.40% (index total return resulting in an increase from 7,771.710 to 9,979.034).
4. Sources: Morningstar and Bloomberg Barclays Indices. For the Bloomberg Index, only total return as shown is available, not price change without the inclusion of reinvested income and distributions.
See www.franklintempletondatasources.com for additional data provider information.
|
Not FDIC Insured | May Lose Value | No Bank Guarantee |
| | | | |
franklintempleton.com | | Not part of the annual report | | 1 |
Contents
|
| Visitfranklintempleton.comfor fund updates, to access your account, or to find helpful financial planning tools. |
| | | | |
| | | |
2 | | Annual Report | | franklintempleton.com |
ANNUAL REPORT
Economic and Market Overview
Global developed and emerging market stocks, as measured by the MSCI All Country World Index, posted strong returns during the reporting period. Although global economic growth slowed from 2018, interest-rate cuts from many central banks and the easing of trade tensions nearperiod-end contributed to the generally positive environment for equities worldwide. Reflecting investor optimism and slowing but resilient economic growth, stocks advanced in every major region of the globe.
In the U.S., solid economic growth also supported equities, as healthy consumer spending and a strong labor market kept the economy afloat. The unemployment rate fell during the year, reaching 3.5% in September, November and December 2019, the lowest recorded unemployment rate in 50 years.1 Wages also grew, albeit at a moderate pace, and inflation remained persistently low. In addition, deficit spending by the U.S. government boosted current growth at the expense of long-term debt. Despite the strength in the consumer sector, some parts of the economy struggled, particularly heavy industry. Annual industrial production contracted late in the reporting period, manufacturing output stalled and capital spending declined.
The U.S. Federal Reserve (Fed) provided a substantial boost to equity markets early in the reporting period as it shifted to a more accommodative monetary policy. In January 2019, the Fed signaled the end of its tightening cycle and cut the federal funds rate three times thereafter, lowering it to a range of 1.50%–1.75%. Stocks responded positively to the interest-rate cuts and gained further in December 2019 after the Fed indicated it would likely leave interest rates unchanged in 2020.
Growth slowed overall in the eurozone, particularly in Germany and Italy. Germany, which is heavily reliant on exports, was adversely affected by the trade conflict between the U.S. and China and the resulting slowdown in global trade. In Italy, political uncertainty and budget concerns caused the country’s annual gross domestic product (GDP) growth to stall in 2019’s first quarter before accelerating in the second quarter. Despite sluggish economic conditions, European developed market equities, as measured by the MSCI Europe Index, posted strong returns overall, as easing trade tensions buoyed investor optimism and an electoral victory by the Conservative Party in the U.K. alleviated uncertainty
surrounding Brexit. Although the European Central Bank left its headline refinancing rate unchanged, it lowered the deposit rate and restarted its bond-buying stimulus program, further supporting stocks.
Economic growth in Asia was relatively solid overall, despite slowdowns in several large emerging market countries, such as China and India. Japan’s economy grew amid the Bank of Japan’s sizable stimulus program. The trade war between the U.S. and China provided the backdrop for Asian stocks, which rose and fell in sync with investor sentiment regarding a trade deal. A phase one trade agreement reached between the two countries in December 2019 propelled Asian developed and emerging market stocks, which ultimately ended with strong returns over the12-month period, as measured by the MSCI All Country Asia Index.
Emerging market stocks overall experienced several sharp selloffs and subsequent rebounds throughout the reporting period before ending with gains. In aggregate, economic growth slowed somewhat from 2018 but remained solid, although there was some variation among individual countries. Many central banks in emerging markets cut interest rates throughout the reporting period which, along with resilient GDP growth, provided a supportive environment for equities. Russian stocks posted the highest returns among emerging markets as the threat of further sanctions receded and a solid fiscal environment reassured investors. Overall, global emerging markets, as measured by the MSCI Emerging Markets Index, posted robust returns for the period.
The foregoing information reflects our analysis and opinions as of December 31, 2019. The information is not a complete analysis of every aspect of any market, country, industry, security or fund. Statements of fact are from sources considered reliable.
1. Source: U.S. Bureau of Labor Statistics.
See www.franklintempletondatasources.com for additional data provider information.
| | | | |
franklintempleton.com | | Annual Report | | 3 |
Franklin Conservative Allocation Fund
This annual report for Franklin Conservative Allocation Fund covers the fiscal year ended December 31, 2019.
Your Fund’s Goal and Main Investments
The Fund seeks the highest level of long-term total return consistent with an acceptable level of risk.1
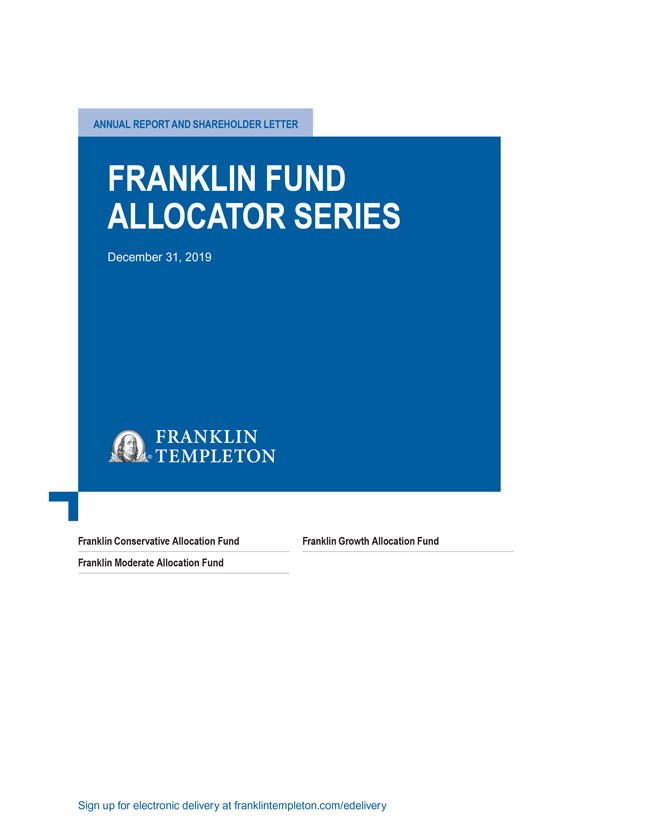
Asset Allocation*
Based on Total Net Assets as of 12/31/19
*The asset allocation is based on the Statement of Investments (SOI), which classifies each underlying fund and other fund investments into a broad asset class based on its predominant investments under normal market conditions.
Performance Overview
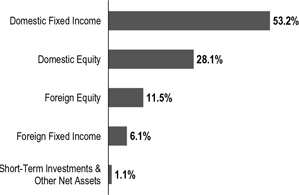
The Fund’s Class A shares posted a +13.25% cumulative total return for the 12 months under review. In comparison, the Custom Franklin Conservative Allocation Fund Index (Blended Benchmark) posted a +15.03% cumulative total return.2 The Fund’s equity benchmark, the MSCI All Country World Index (ACWI), which measures equity market performance in global developed and emerging markets, posted a +27.30% total return.3 The Fund’s fixed income benchmark, the Bloomberg Barclays Multiverse Index, a broad-based measure of the global fixed income bond market, posted a +7.13% total return.3 You can find the
Fund’s long-term performance data in the Performance Summary beginning on page 6.
Performance data represent past performance, which does not guarantee future results. Investment return and principal value will fluctuate, and you may have a gain or loss when you sell your shares. Current performance may differ from figures shown. For most recentmonth-end performance, go tofranklintempleton.comor call(800)342-5236.
Investment Strategy
Whenever possible, we attempt to hold the same underlying Franklin Templeton funds and other fund investments (collectively, “fund investments”) in each Allocation Fund’s portfolio and will vary the allocation percentages of the fund investments based upon each Allocation Fund’s risk/return level. Maintaining similarity of the fund investments across the Conservative, Moderate and Growth Allocation Funds is intended to increase the consistency of their results relative to one another. We allocate the Fund’s assets among the broad asset classes of equity and fixed-income investments by investing primarily in a distinctly-weighted combination of underlying funds, based on each underlying fund’s predominant asset class. When selecting equity funds, we consider the fund investments’ foreign and domestic exposure, market capitalization ranges and investment styles (growth versus value). When selecting fixed income funds, we focus primarily on maximizing income appropriate to the Fund’s risk profile.
Manager’s Discussion
The Fund’s performance can be attributed to its allocation among equity and fixed income securities and to the actual performance of the fund investments.
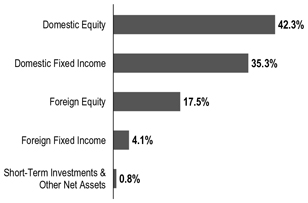
Atperiod-end, Franklin Conservative Allocation Fund allocated 59.3% of total net assets to fixed income and 39.6% to equity. Domestic fixed income exposure was 89.7% of the total fixed income weighting, with the balance
1. The risk/reward potential is based on the Fund’s goal and level of risk. It is not indicative of the Fund’s actual or implied performance or portfolio composition, which may change on a continuous basis.
2. Source: FactSet. The Fund’s Blended Benchmark was calculated internally. Effective January 1, 2015, the Blended Benchmark changed to 40% MSCI ACWI and 60% Bloomberg Barclays Multiverse Index. From January 1, 2013, to December 31, 2014, the Blended Benchmark was composed of 28% Standard & Poor’s 500 Index (S&P 500), 12% MSCI Europe, Australasia, Far East (EAFE) Index and 60% Bloomberg Barclays U.S. Aggregate Bond Index. Prior to January 1, 2013, the Blended Benchmark was composed of 28% S&P 500, 12% MSCI EAFE Index, 40% Bloomberg Barclays U.S. Aggregate Bond Index and 20% Payden & Rygel 90 DayT-Bill Index.
3. Source: Morningstar.
The indexes are unmanaged and include reinvestment of any income or distributions. They do not reflect any fees, expenses or sales charges. One cannot invest directly in an index, and an index is not representative of the Fund’s portfolio.
See www.franklintempletondatasources.com for additional data provider information.
The dollar value, number of shares or principal amount, and names of all portfolio holdings are listed in the Fund’s SOI which begins on page 27.
| | | | |
| | | |
4 | | Annual Report | | franklintempleton.com |
FRANKLIN CONSERVATIVE ALLOCATION FUND
Top 10 Fund Holdings
12/31/19
| | |
| | | % of Total
Net Assets |
Franklin Liberty U.S. Core Bond ETF | | 24.6% |
Franklin Low Duration Total Return Fund – Class R6 | | 14.5% |
Franklin Growth Fund – Class R6 | | 8.3% |
Franklin LibertyQ U.S. Equity ETF | | 7.9% |
Franklin U.S. Core Equity (IU) Fund | | 7.1% |
Franklin Liberty Investment Grade Corporate ETF | | 5.0% |
Templeton Global Total Return Fund – Class R6 | | 4.6% |
Vanguard Total International Bond ETF | | 4.3% |
Franklin Rising Dividends Fund – Class R6 | | 4.2% |
Franklin International Core Equity (IU) Fund | | 3.7% |
represented by foreign fixed income. Franklin Liberty U.S. Core Bond ETF was our largest fixed income fund weighting at 24.6% of the Fund’s total net assets. On the equity side, domestic exposure was 71.0% of the Fund’s total equity weighting, with the balance represented by foreign equity. The Portfolio was diversified across capitalization sizes and investment styles, and on December 31, 2019, we held shares in large-,mid- and small-capitalization equity funds, representing both growth and value styles. Franklin Growth Fund – Class R6 was our largest equity fund weighting at 8.3% of total net assets.
During the12-month reporting period, our largest domestic growth fund holding, Franklin Growth Fund – Class R6, and our largest domestic value fund holding, Franklin LibertyQ U.S. Equity ETF, outperformed the MSCI ACWI. Our largest foreign equity fund holding, Franklin International Core Equity (IU) Fund, which was incepted on August 9, 2019, outperformed the MSCI ACWI for the period since its inception through December 31, 2019. On the fixed income side, our largest domestic fixed income fund holding, Franklin Liberty U.S. Core Bond ETF, which was incepted on September 17, 2019, outperformed the Bloomberg Barclays Multiverse Index for the period since its inception through December 31, 2019. Our largest foreign fixed income holding, Templeton Global Total Return Fund – Class R6, underperformed the Bloomberg Barclays Multiverse Index during the 12 months under review.
Thank you for your continued participation in Franklin Conservative Allocation Fund. We look forward to serving your future investment needs.
The foregoing information reflects our analysis, opinions and portfolio holdings as of December 31, 2019, the end of the reporting period. The way we implement our main investment strategies and the resulting portfolio holdings may change depending on factors such as market and economic conditions. These opinions may not be relied upon as investment advice or an offer for a particular security. The information is not a complete analysis of every aspect of any market, country, industry, security or the Fund. Statements of fact are from sources considered reliable, but the investment manager makes no representation or warranty as to their completeness or accuracy. Although historical performance is no guarantee of future results, these insights may help you understand our investment management philosophy.
CFA® is a trademark owned by CFA Institute.
| | | | |
franklintempleton.com | | Annual Report | | 5 |
FRANKLIN CONSERVATIVE ALLOCATION FUND
Performance Summary as of December 31, 2019
The performance table and graphs do not reflect any taxes that a shareholder would pay on Fund dividends, capital gain distributions, if any, or any realized gains on the sale of Fund shares. Total return reflects reinvestment of the Fund’s dividends and capital gain distributions, if any, and any unrealized gains or losses. Your dividend income will vary depending on dividends or interest paid by securities in the Fund’s portfolio, adjusted for operating expenses of each class. Capital gain distributions are net profits realized from the sale of portfolio securities.
Performance as of 12/31/191
Cumulative total return excludes sales charges. Average annual total return includes maximum sales charges. Sales charges will vary depending on the size of the investment and the class of share purchased. The maximum is 5.50% and the minimum is 0%.Class A:5.50% maximum initial sales charge;Advisor Class:no sales charges. For other share classes, visitfranklintempleton.com.
| | | | | | | | |
| | | Cumulative | | | | Average Annual | |
Share Class | | | Total Return | 2 | | | Total Return | 3 |
| |
A4 | | | | | | | | |
1-Year | | | +13.25% | | | | +6.99% | |
| |
5-Year | | | +23.38% | | | | +3.11% | |
| |
10-Year | | | +66.02% | | | | +4.61% | |
| |
| | |
Advisor | | | | | | | | |
1-Year | | | +13.53% | | | | +13.53% | |
| |
5-Year | | | +25.01% | | | | +4.57% | |
| |
10-Year | | | +70.33% | | | | +5.47% | |
| |
Performance data represent past performance, which does not guarantee future results. Investment return and principal value will fluctuate, and you may have a gain or loss when you sell your shares. Current performance may differ from figures shown. For most recentmonth-end performance, go tofranklintempleton.comor call(800)342-5236.
See page 8 for Performance Summary footnotes.
| | | | |
| | | |
6 | | Annual Report | | franklintempleton.com |
FRANKLIN CONSERVATIVE ALLOCATION FUND
PERFORMANCE SUMMARY
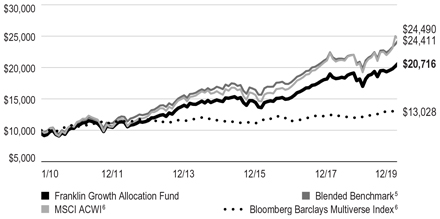
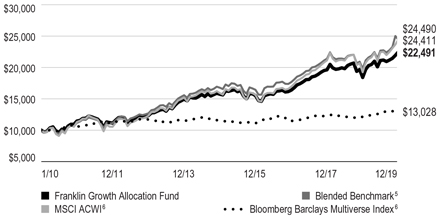
Total Return Index Comparison for a Hypothetical $10,000 Investment1
Total return represents the change in value of an investment over the periods shown. It includes any applicable maximum sales charge, Fund expenses, account fees and reinvested distributions. The unmanaged indexes include reinvestment of any income or distributions. They differ from the Fund in composition and do not pay management fees or expenses. One cannot invest directly in an index.
Class A(1/1/10–12/31/19)
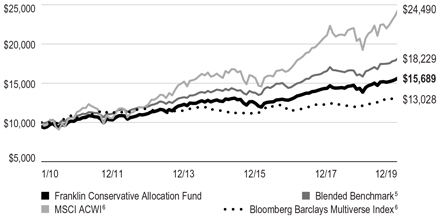
Advisor Class(1/1/10–12/31/19)
See page 8 for Performance Summary footnotes.
| | | | |
franklintempleton.com | | Annual Report | | 7 |
FRANKLIN CONSERVATIVE ALLOCATION FUND
PERFORMANCE SUMMARY
Distributions(1/1/19–12/31/19)
| | | | | | | | | | | | | | | | |
| Share Class | | Net Investment
Income | | | Short-Term
Capital Gain | | | Long-Term
Capital Gain | | | Total | |
A | | | $0.3318 | | | | $0.0004 | | | | $0.6738 | | | | $1.0060 | |
C | | | $0.2224 | | | | $0.0004 | | | | $0.6738 | | | | $0.8966 | |
R | | | $0.2943 | | | | $0.0004 | | | | $0.6738 | | | | $0.9685 | |
R6 | | | $0.3793 | | | | $0.0004 | | | | $0.6738 | | | | $1.0535 | |
Advisor | | | $0.3680 | | | | $0.0004 | | | | $0.6738 | | | | $1.0422 | |
Total Annual Operating Expenses7
| | | | | | | | |
| Share Class | | With Fee
Waiver | | | Without Fee
Waiver | |
A | | | 1.13% | | | | 1.13% | |
Advisor | | | 0.88% | | | | 0.88% | |
Each class of shares is available to certain eligible investors and has different annual fees and expenses, as described in the prospectus.
All investments involve risks, including possible loss of principal. Because this Fund invests in underlying funds, it is subject to the same risks, and indirectly bears the fees and expenses, of the underlying funds. Stock prices fluctuate, sometimes rapidly and dramatically, due to factors affecting individual companies, particular industries or sectors, or general market conditions. Bond prices generally move in the opposite direction of interest rates. Thus, as the prices of bonds in a fund adjust to a rise in interest rates, that fund’s share price may decline. Foreign investing carries additional risks such as currency and market volatility and political or social instability, risks which are heightened in developing countries. Investors should consult their financial advisor for help selecting the appropriate fund of funds, or fund combination, based on an evaluation of their investment objectives and risk tolerance. The Fund’s prospectus also includes a description of the main investment risks.
1. The Fund has an expense reduction and a fee waiver associated with any investments it makes in a Franklin Templeton money fund and/or other Franklin Templeton fund, contractually guaranteed through 4/30/20. Fund investment results reflect the expense reduction and fee waiver; without these reductions, the results would have been lower. As of 1/1/13, the Fund changed its target allocation, with short-term investments (formerly a targeted allocation of 20%) combined into the fixed income allocations; such a change can impact performance.
2. Cumulative total return represents the change in value of an investment over the periods indicated.
3. Average annual total return represents the average annual change in value of an investment over the periods indicated. Return for less than one year, if any, has not been annualized.
4. Prior to 9/10/18, these shares were offered at a higher initial sales charge of 5.75%, thus actual returns (with sales charges) would have differed. Average annual total returns (with sales charges) have been restated to reflect the current maximum initial sales charge of 5.50%.
5. Source: FactSet. The Fund’s Blended Benchmark was calculated internally. Effective January 1, 2015, the Blended Benchmark changed to 40% MSCI ACWI and 60% Bloomberg Barclays Multiverse Index. From January 1, 2013, to December 31, 2014, the Blended Benchmark was composed of 28% S&P 500, 12% MSCI EAFE Index and 60% Bloomberg Barclays U.S. Aggregate Bond Index. Prior to January 1, 2013, the Blended Benchmark was composed of 28% S&P 500, 12% MSCI EAFE Index, 40% Bloomberg Barclays U.S. Aggregate Bond Index and 20% Payden & Rygel 90 DayT-Bill Index.
6. Source: Morningstar. The MSCI ACWI is a free float-adjusted, market capitalization-weighted index designed to measure equity market performance in global developed and emerging markets. The Bloomberg Barclays Multiverse Index provides a broad-based measure of the global fixed income bond market. The index represents the union of the Global Aggregate Index and the Global High Yield Index and captures investment-grade and high-yield securities in all eligible currencies.
7. Figures are as stated in the Fund’s current prospectus, including the effect of acquired fund fees and expenses, and may differ from the expense ratios disclosed in the Your Fund’s Expenses and Financial Highlights sections in this report. In periods of market volatility, assets may decline significantly, causing total annual Fund operating expenses to become higher than the figures shown.
See www.franklintempletondatasources.com for additional data provider information.
| | | | |
| | | |
8 | | Annual Report | | franklintempleton.com |
FRANKLIN CONSERVATIVE ALLOCATION FUND
Your Fund’s Expenses
As a Fund shareholder, you can incur two types of costs: (1) transaction costs, including sales charges (loads) on Fund purchases and redemptions; and (2) ongoing Fund costs, including management fees, distribution and service(12b-1) fees, and other Fund expenses. All mutual funds have ongoing costs, sometimes referred to as operating expenses. The table below shows ongoing costs of investing in the Fund and can help you understand these costs and compare them with those of other mutual funds. The table assumes a $1,000 investment held for the six months indicated.
Actual Fund Expenses
The table below provides information about actual account values and actual expenses in the columns under the heading “Actual.” In these columns the Fund’s actual return, which includes the effect of Fund expenses, is used to calculate the “Ending Account Value” for each class of shares. You can estimate the expenses you paid during the period by following these steps (of course, your account value and expenses will differ from those in this illustration): Divide your account value by $1,000 (if your account had an $8,600 value, then $8,600÷ $1,000 = 8.6). Then multiply the result by the number in the row for your class of shares under the headings “Actual” and “Expenses Paid During Period” (if Actual Expenses Paid During Period were $7.50, then 8.6 x $7.50 = $64.50). In this illustration, the actual expenses paid this period are $64.50.
Hypothetical Example for Comparison with Other Funds
Under the heading “Hypothetical” in the table, information is provided about hypothetical account values and hypothetical expenses based on the Fund’s actual expense ratio and an assumed rate of return of 5% per year before expenses, which is not the Fund’s actual return. This information may not be used to estimate the actual ending account balance or expenses you paid for the period, but it can help you compare ongoing costs of investing in the Fund with those of other funds. To do so, compare this 5% hypothetical example for the class of shares you hold with the 5% hypothetical examples that appear in the shareholder reports of other funds.
Please note that expenses shown in the table are meant to highlight ongoing costs and do not reflect any transactional costs. Therefore, information under the heading “Hypothetical” is useful in comparing ongoing costs only, and will not help you compare total costs of owning different funds. In addition, if transactional costs were included, your total costs would have been higher.
| | | | | | | | | | | | | | | | | | |
| | | | | | | Actual (actual return after expenses) | | | | Hypothetical (5% annual return before expenses) | | | | |
Share Class | | Beginning
Account
Value 7/1/19 | | | | Ending Account
Value 12/31/19 | | Expenses
Paid During
Period
7/1/19–12/31/191, 2 | | | | Ending Account
Value 12/31/19 | | Expenses
Paid During
Period
7/1/19–12/31/191, 2 | | | | Net Annualized Expense Ratio2 |
| | | | | | | | | | | | |
| A | | $1,000 | | | | $1,035.40 | | $3.18 | | | | $1,022.08 | | $3.16 | | | | 0.62% |
| C | | $1,000 | | | | $1,031.20 | | $7.01 | | | | $1,018.30 | | $6.97 | | | | 1.37% |
| R | | $1,000 | | | | $1,034.10 | | $4.46 | | | | $1,020.82 | | $4.43 | | | | 0.87% |
| R6 | | $1,000 | | | | $1,037.30 | | $1.54 | | | | $1,023.69 | | $1.53 | | | | 0.30% |
| Advisor | | $1,000 | | | | $1,036.80 | | $1.90 | | | | $1,023.34 | | $1.89 | | | | 0.37% |
1. Expenses are equal to the annualized expense ratio for thesix-month period as indicated above—in the far right column—multiplied by the simple average account value over the period indicated, and then multiplied by 184/365 to reflect theone-half year period.
2. Reflects expenses after fee waivers and expense reimbursements, for Class R6. Does not include acquired fund fees and expenses.
| | | | |
franklintempleton.com | | Annual Report | | 9 |
Franklin Moderate Allocation Fund
This annual report for Franklin Moderate Allocation Fund covers the fiscal year ended December 31, 2019.
Your Fund’s Goal and Main Investments
The Fund seeks the highest level of long-term total return consistent with an acceptable level of risk.1
Asset Allocation*
Based on Total Net Assets as of 12/31/19
*The asset allocation is based on the Statement of Investments (SOI), which classifies each underlying fund and other fund investments into a broad asset class based on its predominant investments under normal market conditions.
Performance Overview
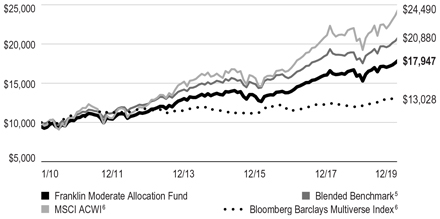
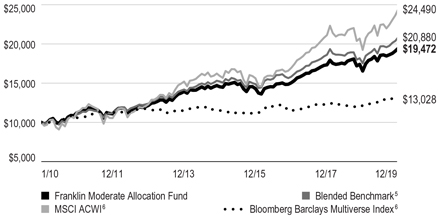
The Fund’s Class A shares posted a +17.40% cumulative total return for the 12 months under review. In comparison, the Custom Franklin Moderate Allocation Fund Index (Blended Benchmark) posted a +19.07% cumulative total return.2 The Fund’s equity benchmark, the MSCI All Country World Index (ACWI), which measures equity market performance in global developed and emerging markets, posted a +27.30% total return.3 The Fund’s fixed income benchmark, the Bloomberg Barclays Multiverse Index, a broad-based measure of the global fixed income bond market, posted a +7.13% total return.3 You can find the
Fund’s long-term performance data in the Performance Summary beginning on page 12.
Performance data represent past performance, which does not guarantee future results. Investment return and principal value will fluctuate, and you may have a gain or loss when you sell your shares. Current performance may differ from figures shown. For most recentmonth-end performance, go tofranklintempleton.comor call(800)342-5236.
Investment Strategy
Whenever possible, we attempt to hold the same underlying Franklin Templeton funds and other fund investments (collectively, “fund investments”) in each Allocation Fund’s portfolio and will vary the allocation percentages of the fund investments based upon each Allocation Fund’s risk/return level. Maintaining similarity of the fund investments across the Conservative, Moderate and Growth Allocation Funds is intended to increase the consistency of their results relative to one another. We allocate the Fund’s assets among the broad asset classes of equity and fixed-income investments by investing primarily in a distinctly-weighted combination of underlying funds, based on each underlying fund’s predominant asset class. When selecting equity funds, we consider the fund investments’ foreign and domestic exposure, market capitalization ranges and investment styles (growth versus value). When selecting fixed income funds, we focus primarily on maximizing income appropriate to the Fund’s risk profile.
Manager’s Discussion
The Fund’s performance can be attributed to its allocation among equity and fixed income securities and to the actual performance of the fund investments.
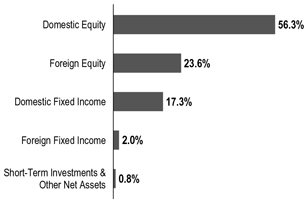
Atperiod-end, Franklin Moderate Allocation Fund allocated 59.8% of total net assets to equity and 39.4% to fixed income. Domestic equity exposure was 70.7% of the total equity weighting, with the balance represented by foreign
1. The risk/reward potential is based on the Fund’s goal and level of risk. It is not indicative of the Fund’s actual or implied performance or portfolio composition, which may change on a continuous basis.
2. Source: The Fund’s Blended Benchmark was calculated internally. Effective January 1, 2015, the Blended Benchmark changed to 60% MSCI ACWI and 40% Bloomberg Barclays Multiverse Index. From January 1, 2013, to December 31, 2014, the Blended Benchmark was composed of 38.5% Standard & Poor’s 500 Index (S&P 500), 16.5% MSCI Europe, Australasia, Far East (EAFE) Index and 45% Bloomberg Barclays U.S. Aggregate Bond Index. Prior to January 1, 2013, the Blended Benchmark was composed of 38.5% S&P 500, 16.5% MSCI EAFE Index, 35% Bloomberg Barclays U.S. Aggregate Bond Index and 10% Payden & Rygel 90 DayT-Bill Index.
3. Source: Morningstar.
The indexes are unmanaged and include reinvestment of any income or distributions. They do not reflect any fees, expenses or sales charges. One cannot invest directly in an index, and an index is not representative of the Fund’s portfolio.
See www.franklintempletondatasources.com for additional data provider information.
The dollar value, number of shares or principal amount, and names of all portfolio holdings are listed in the Fund’s SOI, which begins on page 34.
| | | | |
| | | |
10 | | Annual Report | | franklintempleton.com |
FRANKLIN MODERATE ALLOCATION FUND
Top 10 Fund Holdings
12/31/19
| | | | |
| | | % of Total
Net Assets | |
Franklin Liberty U.S. Core Bond ETF | | | 19.7% | |
Franklin Growth Fund – Class R6 | | | 12.6% | |
Franklin LibertyQ U.S. Equity ETF | | | 11.9% | |
Franklin U.S. Core Equity (IU) Fund | | | 10.7% | |
Franklin Low Duration Total Return Fund – Class R6 | | | 6.7% | |
Franklin Rising Dividends Fund – Class R6 | | | 6.3% | |
Franklin International Core Equity (IU) Fund | | | 5.7% | |
iShares Core U.S. Aggregate Bond ETF | | | 4.4% | |
Franklin Emerging Market Core Equity (IU) Fund | | | 3.3% | |
Templeton Global Total Return Fund – Class R6 | | | 3.0% | |
equity. The Portfolio was diversified across capitalization sizes and investment styles, and on December 31, 2019, we held shares in large-,mid- and small-capitalization equity funds, representing both growth and value styles. Franklin Growth Fund – Class R6 was our largest equity fund weighting at 12.6% of total net assets. On the fixed income side, domestic exposure was 89.6% of the Fund’s total fixed income weighting, with the balance represented by foreign fixed income. Franklin Liberty U.S. Core Bond ETF was our largest fixed income fund weighting at 19.7% of total net assets.
During the12-month reporting period, our largest domestic growth fund holding, Franklin Growth Fund – Class R6, and our largest domestic value fund holding, Franklin LibertyQ U.S. Equity ETF, outperformed the MSCI ACWI. Our largest foreign equity fund holding, Franklin International Core Equity (IU) Fund, which was incepted on August 9, 2019, outperformed the MSCI ACWI for the period since its inception through December 31, 2019. On the fixed income side, our largest domestic fixed income fund holding, Franklin Liberty U.S. Core Bond ETF, which was incepted on September 17, 2019, outperformed the Bloomberg Barclays Multiverse Index for the period since its inception through December 31, 2019. Our largest foreign fixed income holding, Templeton Global Total Return Fund – Class R6, underperformed the Bloomberg Barclays Multiverse Index during the 12 months under review.
Thank you for your continued participation in Franklin Moderate Allocation Fund. We look forward to serving your future investment needs.
The foregoing information reflects our analysis, opinions and portfolio holdings as of December 31, 2019, the end of the reporting period. The way we implement our main investment strategies and the resulting portfolio holdings may change depending on factors such as market and economic conditions. These opinions may not be relied upon as investment advice or an offer for a particular security. The information is not a complete analysis of every aspect of any market, country, industry, security or the Fund. Statements of fact are from sources considered reliable, but the investment manager makes no representation or warranty as to their completeness or accuracy. Although historical performance is no guarantee of future results, these insights may help you understand our investment management philosophy.
| | | | |
franklintempleton.com | | Annual Report | | 11 |
FRANKLIN MODERATE ALLOCATION FUND
Performance Summary as of December 31, 2019
The performance table and graphs do not reflect any taxes that a shareholder would pay on Fund dividends, capital gain distributions, if any, or any realized gains on the sale of Fund shares. Total return reflects reinvestment of the Fund’s dividends and capital gain distributions, if any, and any unrealized gains or losses. Your dividend income will vary depending on dividends or interest paid by securities in the Fund’s portfolio, adjusted for operating expenses of each class. Capital gain distributions are net profits realized from the sale of portfolio securities.
Performance as of 12/31/191
Cumulative total return excludes sales charges. Average annual total return includes maximum sales charges. Sales charges will vary depending on the size of the investment and the class of share purchased. The maximum is 5.50% and the minimum is 0%.Class A:5.50% maximum initial sales charge;Advisor Class:no sales charges. For other share classes, visitfranklintempleton.com.
| | | | | | | | |
| | | Cumulative | | | | Average Annual | |
Share Class | | | Total Return | 2 | | | Total Return | 3 |
| |
A4 | | | | | | | | |
1-Year | | | +17.40% | | | | +10.93% | |
| |
5-Year | | | +32.28% | | | | +4.57% | |
| |
10-Year | | | +89.88% | | | | +6.02% | |
| |
| | |
Advisor | | | | | | | | |
1-Year | | | +17.68% | | | | +17.68% | |
| |
5-Year | | | +33.92% | | | | +6.02% | |
| |
10-Year | | | +94.72% | | | | +6.89% | |
| |
Performance data represent past performance, which does not guarantee future results. Investment return and principal value will fluctuate, and you may have a gain or loss when you sell your shares. Current performance may differ from figures shown. For most recentmonth-end performance, go tofranklintempleton.comor call(800)342-5236.
See page 14 for Performance Summary footnotes.
| | | | |
| | | |
12 | | Annual Report | | franklintempleton.com |
FRANKLIN MODERATE ALLOCATION FUND
PERFORMANCE SUMMARY
Total Return Index Comparison for a Hypothetical $10,000 Investment1
Total return represents the change in value of an investment over the periods shown. It includes any applicable maximum sales charge, Fund expenses, account fees and reinvested distributions. The unmanaged indexes include reinvestment of any income or distributions. They differ from the Fund in composition and do not pay management fees or expenses. One cannot invest directly in an index.
Class A(1/1/10–12/31/19)
Advisor Class(1/1/10–12/31/19)
See page 14 for Performance Summary footnotes.
| | | | |
franklintempleton.com | | Annual Report | | 13 |
FRANKLIN MODERATE ALLOCATION FUND
PERFORMANCE SUMMARY
Distributions(1/1/19–12/31/19)
| | | | | | | | | | | | | | | | |
| Share Class | | Net Investment
Income | | | Short-Term
Capital Gain | | | Long-Term
Capital Gain | | | Total | |
A | | | $0.2818 | | | | $0.0067 | | | | $1.1255 | | | | $1.4140 | |
C | | | $0.1649 | | | | $0.0067 | | | | $1.1255 | | | | $1.2971 | |
R | | | $0.2410 | | | | $0.0067 | | | | $1.1255 | | | | $1.3732 | |
R6 | | | $0.3356 | | | | $0.0067 | | | | $1.1255 | | | | $1.4678 | |
Advisor | | | $0.3206 | | | | $0.0067 | | | | $1.1255 | | | | $1.4528 | |
Total Annual Operating Expenses7
| | | | | | | | |
| Share Class | | With Fee
Waiver | | | Without Fee
Waiver | |
A | | | 1.14% | | | | 1.14% | |
Advisor | | | 0.89% | | | | 0.89% | |
Each class of shares is available to certain eligible investors and has different annual fees and expenses, as described in the prospectus.
All investments involve risks, including possible loss of principal. Because this Fund invests in underlying funds, it is subject to the same risks, and indirectly bears the fees and expenses, of the underlying funds. Stock prices fluctuate, sometimes rapidly and dramatically, due to factors affecting individual companies, particular industries or sectors, or general market conditions. Smaller or relatively new or unseasoned companies can be particularly sensitive to changing economic conditions, and their prospects for growth are less certain than those of larger, more established companies. Bond prices generally move in the opposite direction of interest rates. Thus, as the prices of bonds in a fund adjust to a rise in interest rates, that fund’s share price may decline. Foreign investing carries additional risks such as currency and market volatility and political or social instability, risks which are heightened in developing countries. Investors should consult their financial advisor for help selecting the appropriate fund of funds, or fund combination, based on an evaluation of their investment objectives and risk tolerance. The Fund’s prospectus also includes a description of the main investment risks.
1. The Fund has an expense reduction and a fee waiver associated with any investments it makes in a Franklin Templeton money fund and/or other Franklin Templeton fund, contractually guaranteed through 4/30/20. Fund investment results reflect the expense reduction and fee waiver; without these reductions, the results would have been lower. As of 1/1/13, the Fund changed its target allocation, with short-term investments (formerly a targeted allocation of 20%) combined into the fixed income allocations; such a change can impact performance.
2. Cumulative total return represents the change in value of an investment over the periods indicated.
3. Average annual total return represents the average annual change in value of an investment over the periods indicated. Return for less than one year, if any, has not been annualized.
4. Prior to 9/10/18, these shares were offered at a higher initial sales charge of 5.75%, thus actual returns (with sales charges) would have differed. Average annual total returns (with sales charges) have been restated to reflect the current maximum initial sales charge of 5.50%.
5. Source: The Fund’s Blended Benchmark was calculated internally. Effective January 1, 2015, the Blended Benchmark changed to 60% MSCI ACWI and 40% Bloomberg Barclays Multiverse Index. From January 1, 2013, to December 31, 2014, the Blended Benchmark was composed of 38.5% S&P 500, 16.5% EAFE Index and 45% Bloomberg Barclays U.S. Aggregate Bond Index. Prior to January 1, 2013, the Blended Benchmark was composed of 38.5% S&P 500, 16.5% MSCI EAFE Index, 35% Bloomberg Barclays U.S. Aggregate Bond Index and 10% Payden & Rygel 90 DayT-Bill Index.
6. Source: Morningstar. The MSCI ACWI is a free float-adjusted, market capitalization-weighted index designed to measure equity market performance in global developed and emerging markets. The Bloomberg Barclays Multiverse Index provides a broad-based measure of the global fixed income bond market. The index represents the union of the Global Aggregate Index and the Global High Yield Index and captures investment-grade and high-yield securities in all eligible currencies.
7. Figures are as stated in the Fund’s current prospectus, including the effect of acquired fund fees and expenses, and may differ from the expense ratios disclosed in the Your Fund’s Expenses and Financial Highlights sections in this report. In periods of market volatility, assets may decline significantly, causing total annual Fund operating expenses to become higher than the figures shown.
See www.franklintempletondatasources.com for additional data provider information.
| | | | |
| | | |
14 | | Annual Report | | franklintempleton.com |
FRANKLIN MODERATE ALLOCATION FUND
Your Fund’s Expenses
As a Fund shareholder, you can incur two types of costs: (1) transaction costs, including sales charges (loads) on Fund purchases and redemptions; and (2) ongoing Fund costs, including management fees, distribution and service(12b-1) fees, and other Fund expenses. All mutual funds have ongoing costs, sometimes referred to as operating expenses. The table below shows ongoing costs of investing in the Fund and can help you understand these costs and compare them with those of other mutual funds. The table assumes a $1,000 investment held for the six months indicated.
Actual Fund Expenses
The table below provides information about actual account values and actual expenses in the columns under the heading “Actual.” In these columns the Fund’s actual return, which includes the effect of Fund expenses, is used to calculate the “Ending Account Value” for each class of shares. You can estimate the expenses you paid during the period by following these steps (of course, your account value and expenses will differ from those in this illustration): Divide your account value by $1,000 (if your account had an $8,600 value, then $8,600÷ $1,000 = 8.6). Then multiply the result by the number in the row for your class of shares under the headings “Actual” and “Expenses Paid During Period” (if Actual Expenses Paid During Period were $7.50, then 8.6 x $7.50 = $64.50). In this illustration, the actual expenses paid this period are $64.50.
Hypothetical Example for Comparison with Other Funds
Under the heading “Hypothetical” in the table, information is provided about hypothetical account values and hypothetical expenses based on the Fund’s actual expense ratio and an assumed rate of return of 5% per year before expenses, which is not the Fund’s actual return. This information may not be used to estimate the actual ending account balance or expenses you paid for the period, but it can help you compare ongoing costs of investing in the Fund with those of other funds. To do so, compare this 5% hypothetical example for the class of shares you hold with the 5% hypothetical examples that appear in the shareholder reports of other funds.
Please note that expenses shown in the table are meant to highlight ongoing costs and do not reflect any transactional costs. Therefore, information under the heading “Hypothetical” is useful in comparing ongoing costs only, and will not help you compare total costs of owning different funds. In addition, if transactional costs were included, your total costs would have been higher.
| | | | | | | | | | | | | | | | | | |
| | | | | | | Actual
(actual return after expenses) | | | | Hypothetical
(5% annual return before expenses) | | | | |
Share Class | | Beginning
Account
Value 7/1/19 | | | | Ending Account
Value 12/31/19 | | Expenses Paid During Period
7/1/19–12/31/191, 2 | | | | Ending
Account
Value 12/31/19 | | Expenses Paid During
Period
7/1/19–12/31/191, 2 | | | | Net Annualized
Expense Ratio2 |
| | | | | | | | | | | | |
| A | | $1,000 | | | | $1,048.40 | | $3.25 | | | | $1,022.03 | | $3.21 | | | | 0.63% |
| C | | $1,000 | | | | $1,044.90 | | $7.11 | | | | $1,018.25 | | $7.02 | | | | 1.38% |
| R | | $1,000 | | | | $1,047.00 | | $4.54 | | | | $1,020.77 | | $4.48 | | | | 0.88% |
| R6 | | $1,000 | | | | $1,051.10 | | $1.50 | | | | $1,023.74 | | $1.48 | | | | 0.29% |
| Advisor | | $1,000 | | | | $1,049.80 | | $1.96 | | | | $1,023.29 | | $1.94 | | | | 0.38% |
1. Expenses are equal to the annualized expense ratio for thesix-month period as indicated above—in the far right column—multiplied by the simple average account value over the period indicated, and then multiplied by 184/365 to reflect theone-half year period.
2. Reflects expenses after fee waivers and expense reimbursements, for Class R6. Does not include acquired fund fees and expenses.
| | | | |
franklintempleton.com | | Annual Report | | 15 |
Franklin Growth Allocation Fund
This annual report for Franklin Growth Allocation Fund covers the fiscal year ended December 31, 2019.
Your Fund’s Goal and Main Investments
The Fund seeks the highest level of long-term total return consistent with an acceptable level of risk.1
Asset Allocation*
Based on Total Net Assets as of 12/31/19
*The asset allocation is based on the Statement of Investments (SOI), which classifies each underlying fund and other fund investments into a broad asset class based on its predominant investments under normal market conditions.
Performance Overview
The Fund’s Class A shares posted a +21.90% cumulative total return for the 12 months under review. In comparison, the Custom Franklin Growth Allocation Fund Index (Blended Benchmark) posted a +23.16% cumulative total return.2 The Fund’s equity benchmark, the MSCI All Country World Index (ACWI), which measures equity market performance in global developed and emerging markets, posted a +27.30% total return.3 The Fund’s fixed income benchmark, the Bloomberg Barclays Multiverse Index, a broad-based measure of the global fixed income bond market, posted a +7.13% total return.3 You can find the Fund’s long-term
performance data in the Performance Summary beginning on page 64.
Performance data represent past performance, which does not guarantee future results. Investment return and principal value will fluctuate, and you may have a gain or loss when you sell your shares. Current performance may differ from figures shown. For most recentmonth-end performance, go tofranklintempleton.comor call(800)342-5236.
Investment Strategy
Whenever possible, we attempt to hold the same underlying Franklin Templeton funds and other fund investments (collectively, “fund investments”) in each Allocation Fund’s portfolio and will vary the allocation percentages of the fund investments based upon each Allocation Fund’s risk/return level. Maintaining similarity of the fund investments across the Conservative, Moderate and Growth Allocation Funds is intended to increase the consistency of their results relative to one another. We allocate the Fund’s assets among the broad asset classes of equity and fixed-income investments by investing primarily in a distinctly-weighted combination of underlying funds, based on each underlying fund’s predominant asset class. When selecting equity funds, we consider the fund investments’ foreign and domestic exposure, market capitalization ranges and investment styles (growth versus value). When selecting fixed income funds, we focus primarily on maximizing income appropriate to the Fund’s risk profile.
Manager’s Discussion
The Fund’s performance can be attributed to its allocation among equity and fixed income securities and to the actual performance of the fund investments.
Atperiod-end, Franklin Growth Allocation Fund allocated 79.9% of total net assets to equity and 19.3% to fixed income. Domestic equity exposure was 70.5% of the total equity weighting, with the balance represented by foreign
1. The risk/reward potential is based on the Fund’s goal and level of risk. It is not indicative of the Fund’s actual or implied performance or portfolio composition, which may change on a continuous basis.
2. Source: FactSet. The Fund’s Blended Benchmark was calculated internally. Effective January 1, 2015, the Blended Benchmark changed to 80% MSCI ACWI and 20% Bloomberg Barclays Multiverse Index. From January 1, 2013, to December 31, 2014, the Blended Benchmark was composed of 56% Standard & Poor’s Index (S&P 500), 24% MSCI Europe, Australasia, Far East (EAFE) Index and 20% Bloomberg Barclays U.S. Aggregate Bond Index. Prior to January 1, 2013, the Blended Benchmark was composed of 56% S&P 500, 24% MSCI EAFE Index, 15% Bloomberg Barclays U.S. Aggregate Bond Index and 5% Payden & Rygel 90 DayT-Bill Index.
3. Source: Morningstar.
The indexes are unmanaged and include reinvestment of any income or distributions. They do not reflect any fees, expenses or sales charges. One cannot invest directly in an index, and an index is not representative of the Fund’s portfolio.
See www.franklintempletondatasources.com for additional data provider information.
The dollar value, number of shares or principal amount, and names of all portfolio holdings are listed in the Fund’s SOI which begins on page 41.
| | | | |
| | | |
16 | | Annual Report | | franklintempleton.com |
FRANKLIN GROWTH ALLOCATION FUND
Top 10 Fund Holdings
12/31/19
| | |
| | | % of Total
Net Assets |
Franklin Growth Fund – Class R6 | | 16.9% |
Franklin LibertyQ U.S. Equity ETF | | 15.7% |
Franklin U.S. Core Equity (IU) Fund | | 14.1% |
Franklin Liberty U.S. Core Bond ETF | | 8.8% |
Franklin Rising Dividends Fund – Class R6 | | 8.5% |
Franklin International Core Equity (IU) Fund | | 7.5% |
Franklin Emerging Market Core Equity (IU) Fund | | 4.3% |
Templeton Foreign Fund – Class R6 | | 3.4% |
Franklin Low Duration Total Return Fund – Class R6 | | 3.3% |
Franklin International Growth Fund – Class R6 | | 3.3% |
equity. The portfolio was diversified across capitalization sizes and investment styles, and on December 31, 2019, we held shares in large-,mid- and small-capitalization equity funds, representing both growth and value styles. Franklin Growth Fund – Class R6 was our largest equity fund weighting at 16.9% of total net assets. On the fixed income side, domestic exposure was 89.6% of the Fund’s total fixed income weighting, with the balance represented by foreign fixed income. Franklin Liberty U.S. Core Bond ETF was our largest fixed income fund weighting at 8.8% of total net assets.
During the12-month reporting period, our largest domestic growth fund holding, Franklin Growth Fund – Class R6, and our largest domestic value fund holding, Franklin LibertyQ U.S. Equity ETF, outperformed the MSCI ACWI. Our largest foreign equity fund holding, Franklin International Core Equity (IU) Fund, which was incepted on August 9, 2019, outperformed the MSCI ACWI for the period since its inception through December 31, 2019. On the fixed income side, our largest domestic fixed income fund holding, Franklin Liberty U.S. Core Bond ETF, which was incepted on September 17, 2019, outperformed the Bloomberg Barclays Multiverse Index for the period since its inception through December 31, 2019. Our largest foreign fixed income holding, Templeton Global Total Return Fund – Class R6, underperformed the Bloomberg Barclays Multiverse Index during the 12 months under review.
Thank you for your continued participation in Franklin Growth Allocation Fund. We look forward to serving your future investment needs.
The foregoing information reflects our analysis, opinions and portfolio holdings as of December 31, 2019, the end of the reporting period. The way we implement our main investment strategies and the resulting portfolio holdings may change depending on factors such as market and economic conditions. These opinions may not be relied upon as investment advice or an offer for a particular security. The information is not a complete analysis of every aspect of any market, country, industry, security or the Fund. Statements of fact are from sources considered reliable, but the investment manager makes no representation or warranty as to their completeness or accuracy. Although historical performance is no guarantee of future results, these insights may help you understand our investment management philosophy.
| | | | |
franklintempleton.com | | Annual Report | | 17 |
FRANKLIN GROWTH ALLOCATION FUND
Performance Summary as of December 31, 2019
The performance table and graphs do not reflect any taxes that a shareholder would pay on Fund dividends, capital gain distributions, if any, or any realized gains on the sale of Fund shares. Total return reflects reinvestment of the Fund’s dividends and capital gain distributions, if any, and any unrealized gains or losses. Your dividend income will vary depending on dividends or interest paid by securities in the Fund’s portfolio, adjusted for operating expenses of each class. Capital gain distributions are net profits realized from the sale of portfolio securities.
Performance as of 12/31/191
Cumulative total return excludes sales charges. Average annual total return includes maximum sales charges. Sales charges will vary depending on the size of the investment and the class of share purchased. The maximum is 5.50% and the minimum is 0%.Class A:5.50% maximum initial sales charge;Advisor Class:no sales charges. For other share classes, visitfranklintempleton.com.
| | | | | | | | |
| Share Class | | Cumulative
Total Return2 | | | Average Annual
Total Return3 | |
| |
A4 | | | | | | | | |
1-Year | | | +21.90% | | | | +15.21% | |
| |
5-Year | | | +41.14% | | | | +5.93% | |
| |
10-Year | | | +119.27% | | | | +7.55% | |
| |
| | |
Advisor | | | | | | | | |
1-Year | | | +22.22% | | | | +22.22% | |
| |
5-Year | | | +42.90% | | | | +7.40% | |
| |
10-Year | | | +124.91% | | | | +8.44% | |
| |
Performance data represent past performance, which does not guarantee future results. Investment return and principal value will fluctuate, and you may have a gain or loss when you sell your shares. Current performance may differ from figures shown. For most recentmonth-end performance, go tofranklintempleton.comor call(800)342-5236.
See page 20 for Performance Summary footnotes.
| | | | |
| | | |
18 | | Annual Report | | franklintempleton.com |
FRANKLIN GROWTH ALLOCATION FUND
PERFORMANCE SUMMARY
Total Return Index Comparison for a Hypothetical $10,000 Investment1
Total return represents the change in value of an investment over the periods shown. It includes any applicable maximum sales charge, Fund expenses, account fees and reinvested distributions. The unmanaged indexes include reinvestment of any income or distributions. They differ from the Fund in composition and do not pay management fees or expenses. One cannot invest directly in an index.
Class A(1/1/10–12/31/19)
Advisor Class(1/1/10–12/31/19)
See page 20 for Performance Summary footnotes.
| | | | |
franklintempleton.com | | Annual Report | | 19 |
FRANKLIN GROWTH ALLOCATION FUND
PERFORMANCE SUMMARY
Distributions(1/1/19–12/31/19)
| | | | | | | | | | | | | | | | |
| Share Class | | Net Investment
Income | | | Short-Term
Capital Gain | | | Long-Term
Capital Gain | | | Total | |
A | | | $0.2530 | | | | $0.0098 | | | | $1.7564 | | | | $2.0192 | |
C | | | $0.0994 | | | | $0.0098 | | | | $1.7564 | | | | $1.8656 | |
R | | | $0.1939 | | | | $0.0098 | | | | $1.7564 | | | | $1.9601 | |
R6 | | | $0.3236 | | | | $0.0098 | | | | $1.7564 | | | | $2.0898 | |
Advisor | | | $0.3003 | | | | $0.0098 | | | | $1.7564 | | | | $2.0665 | |
Total Annual Operating Expenses7
| | | | | | | | |
| Share Class | | With Fee
Waiver | | | Without Fee
Waiver | |
A | | | 1.18% | | | | 1.21% | |
Advisor | | | 0.93% | | | | 0.96% | |
Each class of shares is available to certain eligible investors and has different annual fees and expenses, as described in the prospectus.
All investments involve risks, including possible loss of principal. Because this Fund invests in underlying funds, it is subject to the same risks, and indirectly bears the fees and expenses, of the underlying funds. Stock prices fluctuate, sometimes rapidly and dramatically, due to factors affecting individual companies, particular industries or sectors, or general market conditions. Bond prices generally move in the opposite direction of interest rates. Thus, as the prices of bonds in a fund adjust to a rise in interest rates, that fund’s share price may decline. Foreign investing carries additional risks such as currency and market volatility and political or social instability, risks which are heightened in developing countries. Growth stock prices reflect projections of future earnings or revenues, and can therefore fall dramatically if the company fails to meet those projections. Value securities may not increase in price as anticipated or may decline further in value. Investors should consult their financial advisor for help selecting the appropriate fund of funds, or fund combination, based on an evaluation of their investment objectives and risk tolerance. The Fund’s prospectus also includes a description of the main investment risks.
1. The Fund has an expense reduction and a fee waiver associated with any investments it makes in a Franklin Templeton money fund and/or other Franklin Templeton fund, contractually guaranteed through 4/30/20. Fund investment results reflect the expense reduction and fee waiver; without these reductions, the results would have been lower. As of 1/1/13, the Fund changed its target allocation, with short-term investments (formerly a targeted allocation of 20%) combined into the fixed income allocations; such a change can impact performance.
2. Cumulative total return represents the change in value of an investment over the periods indicated.
3. Average annual total return represents the average annual change in value of an investment over the periods indicated. Return for less than one year, if any, has not been annualized.
4. Prior to 9/10/18, these shares were offered at a higher initial sales charge of 5.75%, thus actual returns (with sales charges) would have differed. Average annual total returns (with sales charges) have been restated to reflect the current maximum initial sales charge of 5.50%.
5. Source: FactSet. The Fund’s Blended Benchmark was calculated internally. Effective January 1, 2015, the Blended Benchmark changed to 80% MSCI ACWI and 20% Bloomberg Barclays Multiverse Index. From January 1, 2013, to December 31, 2014, the Blended Benchmark was composed of 56% S&P 500, 24% MSCI EAFE Index and 20% Bloomberg Barclays U.S. Aggregate Bond Index. Prior to January 1, 2013, the Blended Benchmark was composed of 56% S&P 500, 24% MSCI EAFE Index, 15% Bloomberg Barclays U.S. Aggregate Bond Index and 5% Payden & Rygel 90 DayT-Bill Index.
6. Source: Morningstar. The MSCI ACWI is a free float-adjusted, market capitalization-weighted index designed to measure equity market performance in global developed and emerging markets. The Bloomberg Barclays Multiverse Index provides a broad-based measure of the global fixed income bond market. The index represents the union of the Global Aggregate Index and the Global High Yield Index and captures investment-grade and high-yield securities in all eligible currencies.
7. Figures are as stated in the Fund’s current prospectus, including the effect of acquired fund fees and expenses, and may differ from the expense ratios disclosed in the Your Fund’s Expenses and Financial Highlights sections in this report. In periods of market volatility, assets may decline significantly, causing total annual Fund operating expenses to become higher than the figures shown.
See www.franklintempletondatasources.com for additional data provider information.
| | | | |
| | | |
20 | | Annual Report | | franklintempleton.com |
FRANKLIN GROWTH ALLOCATION FUND
Your Fund’s Expenses
As a Fund shareholder, you can incur two types of costs: (1) transaction costs, including sales charges (loads) on Fund purchases and redemptions; and (2) ongoing Fund costs, including management fees, distribution and service(12b-1) fees, and other Fund expenses. All mutual funds have ongoing costs, sometimes referred to as operating expenses. The table below shows ongoing costs of investing in the Fund and can help you understand these costs and compare them with those of other mutual funds. The table assumes a $1,000 investment held for the six months indicated.
Actual Fund Expenses
The table below provides information about actual account values and actual expenses in the columns under the heading “Actual.” In these columns the Fund’s actual return, which includes the effect of Fund expenses, is used to calculate the “Ending Account Value” for each class of shares. You can estimate the expenses you paid during the period by following these steps (of course, your account value and expenses will differ from those in this illustration): Divide your account value by $1,000 (if your account had an $8,600 value, then $8,600÷ $1,000 = 8.6). Then multiply the result by the number in the row for your class of shares under the headings “Actual” and “Expenses Paid During Period” (if Actual Expenses Paid During Period were $7.50, then 8.6 x $7.50 = $64.50). In this illustration, the actual expenses paid this period are $64.50.
Hypothetical Example for Comparison with Other Funds
Under the heading “Hypothetical” in the table, information is provided about hypothetical account values and hypothetical expenses based on the Fund’s actual expense ratio and an assumed rate of return of 5% per year before expenses, which is not the Fund’s actual return. This information may not be used to estimate the actual ending account balance or expenses you paid for the period, but it can help you compare ongoing costs of investing in the Fund with those of other funds. To do so, compare this 5% hypothetical example for the class of shares you hold with the 5% hypothetical examples that appear in the shareholder reports of other funds.
Please note that expenses shown in the table are meant to highlight ongoing costs and do not reflect any transactional costs. Therefore, information under the heading “Hypothetical” is useful in comparing ongoing costs only, and will not help you compare total costs of owning different funds. In addition, if transactional costs were included, your total costs would have been higher.
| | | | | | | | | | | | | | | | | | |
| | | | | | | Actual
(actual return after expenses) | | | | Hypothetical
(5% annual return before expenses) | | | | |
Share
Class | | Beginning
Account
Value 7/1/19 | | | | Ending
Account
Value 12/31/19 | | Expenses Paid During
Period 7/1/19–12/31/191, 2 | | | | Ending
Account
Value 12/31/19 | | Expenses
Paid During Period 7/1/19–12/31/191, 2 | | | | Net Annualized
Expense Ratio2 |
| | | | | | | | | | | | |
| A | | $1,000 | | | | $1,063.50 | | $3.38 | | | | $1,021.93 | | $3.31 | | | | 0.65% |
| C | | $1,000 | | | | $1,059.70 | | $7.27 | | | | $1,018.15 | | $7.12 | | | | 1.40% |
| R | | $1,000 | | | | $1,062.30 | | $4.68 | | | | $1,020.67 | | $4.58 | | | | 0.90% |
| R6 | | $1,000 | | | | $1,065.90 | | $1.41 | | | | $1,023.84 | | $1.38 | | | | 0.27% |
| Advisor | | $1,000 | | | | $1,065.20 | | $2.08 | | | | $1,023.19 | | $2.04 | | | | 0.40% |
1. Expenses are equal to the annualized expense ratio for thesix-month period as indicated above—in the far right column—multiplied by the simple average account value over the period indicated, and then multiplied by 184/365 to reflect theone-half year period.
2. Reflects expenses after fee waivers and expense reimbursements. Does not include acquired fund fees and expenses.
| | | | |
franklintempleton.com | | Annual Report | | 21 |
FRANKLIN FUND ALLOCATOR SERIES
Financial Highlights
Franklin Conservative Allocation Fund
| | | | | | | | | | | | | | | | | | | | |
| | | Year Ended December 31, | |
| | | 2019 | | | 2018 | | | 2017 | | | 2016 | | | 2015 | |
| | | | | |
Class A | | | | | | | | | | | | | | | | | | | | |
| | | | | |
Per share operating performance | | | | | | | | | | | | | | | | | | | | |
(for a share outstanding throughout the year) | | | | | | | | | | | | | | | | | | | | |
| | | | | |
Net asset value, beginning of year | | | $13.33 | | | | $14.86 | | | | $13.74 | | | | $13.40 | | | | $14.53 | |
| | | | | |
Income from investment operationsa: | | | | | | | | | | | | | | | | | | | | |
| | | | | |
Net investment incomeb,c | | | 0.32 | | | | 0.39 | | | | 0.20 | | | | 0.14 | | | | 0.28 | |
| | | | | |
Net realized and unrealized gains (losses) | | | 1.43 | | | | (0.90 | ) | | | 1.25 | | | | 0.45 | | | | (0.60 | ) |
| | | | | |
Total from investment operations | | | 1.75 | | | | (0.51 | ) | | | 1.45 | | | | 0.59 | | | | (0.32 | ) |
| | | | | |
Less distributions from: | | | | | | | | | | | | | | | | | | | | |
| | | | | |
Net investment income and short term gains received from Underlying Funds and exchange traded funds | | | (0.33 | ) | | | (0.38 | ) | | | (0.24 | ) | | | (0.15 | ) | | | (0.28 | ) |
| | | | | |
Net realized gains | | | (0.67 | ) | | | (0.64 | ) | | | (0.09 | ) | | | (0.10 | ) | | | (0.53 | ) |
| | | | | |
Total distributions | | | (1.00 | ) | | | (1.02 | ) | | | (0.33 | ) | | | (0.25 | ) | | | (0.81 | ) |
| | | | | |
Net asset value, end of year | | | $14.08 | | | | $13.33 | | | | $14.86 | | | | $13.74 | | | | $13.40 | |
| | | | | |
Total returnd | | | 13.25% | | | | (3.44)% | | | | 10.58% | | | | 4.39% | | | | (2.26)% | |
| | | | | |
Ratios to average net assets | | | | | | | | | | | | | | | | | | | | |
| | | | | |
Expensese,f | | | 0.63% | g | | | 0.63% | g | | | 0.63% | | | | 0.63% | | | | 0.62% | |
| | | | | |
Net investment incomec | | | 2.25% | | | | 2.57% | | | | 1.37% | | | | 1.01% | | | | 1.97% | |
| | | | | |
Supplemental data | | | | | | | | | | | | | | | | | | | | |
| | | | | |
Net assets, end of year (000’s) | | | $839,134 | | | | $778,221 | | | | $800,141 | | | | $809,039 | | | | $905,537 | |
| | | | | |
Portfolio turnover rate | | | 86.76% | | | | 30.70% | | | | 17.99% | | | | 34.83% | | | | 17.69% | |
aThe amount shown for a share outstanding throughout the period may not correlate with the Statement of Operations for the period due to the timing of sales and repurchases of the Fund’s shares in relation to income earned and/or fluctuating fair value of the investments of the Fund.
bBased on average daily shares outstanding.
cRecognition of net investment income by the Fund is affected by the timing of declaration of dividends by the Underlying Funds and exchange traded funds in which the Fund invests.
dTotal return does not reflect sales commissions or contingent deferred sales charges, if applicable.
eBenefit of waiver and payments by affiliates rounds to less than 0.01%.
fDoes not include expenses of the Underlying Funds and exchange traded funds in which the Fund invests. The weighted average indirect expenses of the Underlying Funds and exchange traded funds was 0.38% for the year ended December 31, 2019.
gBenefit of expense reduction rounds to less than 0.01%.
| | | | |
| | | |
22 | | Annual Report| The accompanying notes are an integral part of these financial statements. | | franklintempleton.com |
FRANKLIN FUND ALLOCATOR SERIES
FINANCIAL HIGHLIGHTS
Franklin Conservative Allocation Fund(continued)
| | | | | | | | | | | | | | | | | | | | |
| | | Year Ended December 31, | |
| | | 2019 | | | 2018 | | | 2017 | | | 2016 | | | 2015 | |
| | | | | |
Class C | | | | | | | | | | | | | | | | | | | | |
| | | | | |
Per share operating performance | | | | | | | | | | | | | | | | | | | | |
(for a share outstanding throughout the year) | | | | | | | | | | | | | | | | | | | | |
| | | | | |
Net asset value, beginning of year | | | $13.06 | | | | $14.57 | | | | $13.47 | | | | $13.15 | | | | $14.27 | |
| | | | | |
Income from investment operationsa: | | | | | | | | | | | | | | | | | | | | |
| | | | | |
Net investment incomeb,c | | | 0.20 | | | | 0.24 | | | | 0.09 | | | | 0.04 | | | | 0.17 | |
| | | | | |
Net realized and unrealized gains (losses) | | | 1.40 | | | | (0.84 | ) | | | 1.23 | | | | 0.43 | | | | (0.58 | ) |
| | | | | |
Total from investment operations | | | 1.60 | | | | (0.60 | ) | | | 1.32 | | | | 0.47 | | | | (0.41 | ) |
| | | | | |
Less distributions from: | | | | | | | | | | | | | | | | | | | | |
| | | | | |
Net investment income and short term gains received from Underlying Funds and exchange traded funds | | | (0.22 | ) | | | (0.27 | ) | | | (0.13 | ) | | | (0.05 | ) | | | (0.18 | ) |
| | | | | |
Net realized gains | | | (0.67 | ) | | | (0.64 | ) | | | (0.09 | ) | | | (0.10 | ) | | | (0.53 | ) |
| | | | | |
Total distributions | | | (0.89 | ) | | | (0.91 | ) | | | (0.22 | ) | | | (0.15 | ) | | | (0.71 | ) |
| | | | | |
Net asset value, end of year | | | $13.77 | | | | $13.06 | | | | $14.57 | | | | $13.47 | | | | $13.15 | |
| | | | | |
Total returnd | | | 12.35% | | | | (4.14)% | | | | 9.80% | | | | 3.55% | | | | (2.96)% | |
| | | | | |
Ratios to average net assets | | | | | | | | | | | | | | | | | | | | |
| | | | | |
Expensese,f | | | 1.38% | g | | | 1.38% | g | | | 1.38% | | | | 1.37% | | | | 1.37% | |
| | | | | |
Net investment incomec | | | 1.50% | | | | 1.82% | | | | 0.62% | | | | 0.27% | | | | 1.22% | |
| | | | | |
Supplemental data | | | | | | | | | | | | | | | | | | | | |
| | | | | |
Net assets, end of year (000’s) | | | $252,407 | | | | $285,547 | | | | $423,890 | | | | $470,582 | | | | $536,548 | |
| | | | | |
Portfolio turnover rate | | | 86.76% | | | | 30.70% | | | | 17.99% | | | | 34.83% | | | | 17.69% | |
aThe amount shown for a share outstanding throughout the period may not correlate with the Statement of Operations for the period due to the timing of sales and repurchases of the Fund’s shares in relation to income earned and/or fluctuating fair value of the investments of the Fund.
bBased on average daily shares outstanding.
cRecognition of net investment income by the Fund is affected by the timing of declaration of dividends by the Underlying Funds and exchange traded funds in which the Fund invests.
dTotal return does not reflect sales commissions or contingent deferred sales charges, if applicable.
eBenefit of waiver and payments by affiliates rounds to less than 0.01%.
fDoes not include expenses of the Underlying Funds and exchange traded funds in which the Fund invests. The weighted average indirect expenses of the Underlying Funds and exchange traded funds was 0.38% for the year ended December 31, 2019.
gBenefit of expense reduction rounds to less than 0.01%.
| | | | |
franklintempleton.com | | The accompanying notes are an integral part of these financial statements. | Annual Report | | 23 |
FRANKLIN FUND ALLOCATOR SERIES
FINANCIAL HIGHLIGHTS
Franklin Conservative Allocation Fund(continued)
| | | | | | | | | | | | | | | | | | | | |
| | | Year Ended December 31, | |
| | | 2019 | | | 2018 | | | 2017 | | | 2016 | | | 2015 | |
| | | | | |
Class R | | | | | | | | | | | | | | | | | | | | |
| | | | | |
Per share operating performance | | | | | | | | | | | | | | | | | | | | |
(for a share outstanding throughout the year) | | | | | | | | | | | | | | | | | | | | |
| | | | | |
Net asset value, beginning of year | | | $13.28 | | | | $14.80 | | | | $13.69 | | | | $13.35 | | | | $14.48 | |
| | | | | |
Income from investment operationsa: | | | | | | | | | | | | | | | | | | | | |
| | | | | |
Net investment incomeb,c | | | 0.28 | | | | 0.33 | | | | 0.16 | | | | 0.10 | | | | 0.24 | |
| | | | | |
Net realized and unrealized gains (losses) | | | 1.42 | | | | (0.87 | ) | | | 1.24 | | | | 0.45 | | | | (0.59 | ) |
| | | | | |
Total from investment operations | | | 1.70 | | | | (0.54 | ) | | | 1.40 | | | | 0.55 | | | | (0.35 | ) |
| | | | | |
Less distributions from: | | | | | | | | | | | | | | | | | | | | |
| | | | | |
Net investment income and short term gains received from Underlying Funds and exchange traded funds | | | (0.29 | ) | | | (0.34 | ) | | | (0.20 | ) | | | (0.11 | ) | | | (0.25 | ) |
| | | | | |
Net realized gains | | | (0.67 | ) | | | (0.64 | ) | | | (0.09 | ) | | | (0.10 | ) | | | (0.53 | ) |
| | | | | |
Total distributions | | | (0.96 | ) | | | (0.98 | ) | | | (0.29 | ) | | | (0.21 | ) | | | (0.78 | ) |
| | | | | |
Net asset value, end of year | | | $14.02 | | | | $13.28 | | | | $14.80 | | | | $13.69 | | | | $13.35 | |
| | | | | |
Total return | | | 12.93% | | | | (3.64)% | | | | 10.25% | | | | 4.15% | | | | (2.52)% | |
| | | | | |
Ratios to average net assets | | | | | | | | | | | | | | | | | | | | |
| | | | | |
Expensesd,e | | | 0.88% | f | | | 0.88% | f | | | 0.88% | | | | 0.88% | | | | 0.87% | |
| | | | | |
Net investment incomec | | | 2.00% | | | | 2.32% | | | | 1.12% | | | | 0.76% | | | | 1.72% | |
| | | | | |
Supplemental data | | | | | | | | | | | | | | | | | | | | |
| | | | | |
Net assets, end of year (000’s) | | | $71,153 | | | | $80,338 | | | | $103,629 | | | | $124,018 | | | | $139,592 | |
| | | | | |
Portfolio turnover rate | | | 86.76% | | | | 30.70% | | | | 17.99% | | | | 34.83% | | | | 17.69% | |
aThe amount shown for a share outstanding throughout the period may not correlate with the Statement of Operations for the period due to the timing of sales and repurchases of the Fund’s shares in relation to income earned and/or fluctuating fair value of the investments of the Fund.
bBased on average daily shares outstanding.
cRecognition of net investment income by the Fund is affected by the timing of declaration of dividends by the Underlying Funds and exchange traded funds in which the Fund invests.
dBenefit of waiver and payments by affiliates rounds to less than 0.01%.
eDoes not include expenses of the Underlying Funds and exchange traded funds in which the Fund invests. The weighted average indirect expenses of the Underlying Funds and exchange traded funds was 0.38% for the year ended December 31, 2019.
fBenefit of expense reduction rounds to less than 0.01%.
| | | | |
| | | |
24 | | Annual Report | The accompanying notes are an integral part of these financial statements. | | franklintempleton.com |
FRANKLIN FUND ALLOCATOR SERIES
FINANCIAL HIGHLIGHTS
Franklin Conservative Allocation Fund(continued)
| | | | | | | | | | | | | | | | | | | | |
| | | Year Ended December 31, | |
| | | 2019 | | | 2018 | | | 2017 | | | 2016 | | | 2015 | |
| | | | | |
Class R6 | | | | | | | | | | | | | | | | | | | | |
| | | | | |
Per share operating performance | | | | | | | | | | | | | | | | | | | | |
(for a share outstanding throughout the year) | | | | | | | | | | | | | | | | | | | | |
| | | | | |
Net asset value, beginning of year | | | $13.31 | | | | $14.84 | | | | $13.72 | | | | $13.39 | | | | $14.52 | |
| | | | | |
Income from investment operationsa: | | | | | | | | | | | | | | | | | | | | |
| | | | | |
Net investment incomeb,c | | | 0.36 | | | | 0.44 | | | | 0.25 | | | | 0.18 | | | | 0.36 | |
| | | | | |
Net realized and unrealized gains (losses) | | | 1.44 | | | | (0.90 | ) | | | 1.25 | | | | 0.44 | | | | (0.63 | ) |
| | | | | |
Total from investment operations | | | 1.80 | | | | (0.46 | ) | | | 1.50 | | | | 0.62 | | | | (0.27 | ) |
| | | | | |
Less distributions from: | | | | | | | | | | | | | | | | | | | | |
| | | | | |
Net investment income and short term gains received from Underlying Funds and exchange traded funds | | | (0.38 | ) | | | (0.43 | ) | | | (0.29 | ) | | | (0.19 | ) | | | (0.33 | ) |
| | | | | |
Net realized gains | | | (0.67 | ) | | | (0.64 | ) | | | (0.09 | ) | | | (0.10 | ) | | | (0.53 | ) |
| | | | | |
Total distributions | | | (1.05 | ) | | | (1.07 | ) | | | (0.38 | ) | | | (0.29 | ) | | | (0.86 | ) |
| | | | | |
Net asset value, end of year | | | $14.06 | | | | $13.31 | | | | $14.84 | | | | $13.72 | | | | $13.39 | |
| | | | | |
Total return | | | 13.64% | | | | (3.11)% | | | | 10.99% | | | | 4.69% | | | | (1.93)% | |
| | | | | |
Ratios to average net assets | | | | | | | | | | | | | | | | | | | | |
| | | | | |
Expenses before waiver and payments by affiliatesd | | | 0.42% | | | | 0.40% | | | | 0.32% | | | | 0.30% | | | | 0.29% | |
| | | | | |
Expenses net of waiver and payments by affiliatesd | | | 0.31% | e | | | 0.29% | e | | | 0.28% | | | | 0.28% | | | | 0.28% | |
| | | | | |
Net investment incomec | | | 2.57% | | | | 2.91% | | | | 1.72% | | | | 1.36% | | | | 2.31% | |
| | | | | |
Supplemental data | | | | | | | | | | | | | | | | | | | | |
| | | | | |
Net assets, end of year (000’s) | | | $2,364 | | | | $2,253 | | | | $2,149 | | | | $2,197 | | | | $2,282 | |
| | | | | |
Portfolio turnover rate | | | 86.76% | | | | 30.70% | | | | 17.99% | | | | 34.83% | | | | 17.69% | |
aThe amount shown for a share outstanding throughout the period may not correlate with the Statement of Operations for the period due to the timing of sales and repurchases of the Fund’s shares in relation to income earned and/or fluctuating fair value of the investments of the Fund.
bBased on average daily shares outstanding.
cRecognition of net investment income by the Fund is affected by the timing of declaration of dividends by the Underlying Funds and exchange traded funds in which the Fund invests.
dDoes not include expenses of the Underlying Funds and exchange traded funds in which the Fund invests. The weighted average indirect expenses of the Underlying Funds and exchange traded funds was 0.38% for the year ended December 31, 2019.
eBenefit of expense reduction rounds to less than 0.01%.
| | | | |
franklintempleton.com | | The accompanying notes are an integral part of these financial statements. | Annual Report | | 25 |
FRANKLIN FUND ALLOCATOR SERIES
FINANCIAL HIGHLIGHTS
Franklin Conservative Allocation Fund(continued)
| | | | | | | | | | | | | | | | | | | | |
| | | Year Ended December 31, | |
| | | 2019 | | | 2018 | | | 2017 | | | 2016 | | | 2015 | |
| | | | | |
Advisor Class | | | | | | | | | | | | | | | | | | | | |
| | | | | |
Per share operating performance | | | | | | | | | | | | | | | | | | | | |
(for a share outstanding throughout the year) | | | | | | | | | | | | | | | | | | | | |
| | | | | |
Net asset value, beginning of year | | | $13.33 | | | | $14.86 | | | | $13.74 | | | | $13.39 | | | | $14.52 | |
| | | | | |
Income from investment operationsa: | | | | | | | | | | | | | | | | | | | | |
| | | | | |
Net investment incomeb,c | | | 0.36 | | | | 0.43 | | | | 0.25 | | | | 0.17 | | | | 0.32 | |
| | | | | |
Net realized and unrealized gains (losses) | | | 1.43 | | | | (0.90 | ) | | | 1.24 | | | | 0.45 | | | | (0.60 | ) |
| | | | | |
Total from investment operations | | | 1.79 | | | | (0.47 | ) | | | 1.49 | | | | 0.62 | | | | (0.28 | ) |
| | | | | |
Less distributions from: | | | | | | | | | | | | | | | | | | | | |
| | | | | |
Net investment income and short term gains received from Underlying Funds and exchange traded funds | | | (0.37 | ) | | | (0.42 | ) | | | (0.28 | ) | | | (0.17 | ) | | | (0.32 | ) |
| | | | | |
Net realized gains | | | (0.67 | ) | | | (0.64 | ) | | | (0.09 | ) | | | (0.10 | ) | | | (0.53 | ) |
| | | | | |
Total distributions | | | (1.04 | ) | | | (1.06 | ) | | | (0.37 | ) | | | (0.27 | ) | | | (0.85 | ) |
| | | | | |
Net asset value, end of year | | | $14.08 | | | | $13.33 | | | | $14.86 | | | | $13.74 | | | | $13.39 | |
| | | | | |
Total return | | | 13.53% | | | | (3.19)% | | | | 10.88% | | | | 4.69% | | | | (2.02)% | |
| | | | | |
Ratios to average net assets | | | | | | | | | | | | | | | | | | | | |
| | | | | |
Expensesd,e | | | 0.38% | f | | | 0.38% | f | | | 0.38% | | | | 0.38% | | | | 0.37% | |
| | | | | |
Net investment incomec | | | 2.50% | | | | 2.82% | | | | 1.62% | | | | 1.26% | | | | 2.22% | |
| | | | | |
Supplemental data | | | | | | | | | | | | | | | | | | | | |
| | | | | |
Net assets, end of year (000’s) | | | $44,022 | | | | $38,031 | | | | $38,934 | | | | $27,578 | | | | $82,234 | |
| | | | | |
Portfolio turnover rate | | | 86.76% | | | | 30.70% | | | | 17.99% | | | | 34.83% | | | | 17.69% | |
aThe amount shown for a share outstanding throughout the period may not correlate with the Statement of Operations for the period due to the timing of sales and repurchases of the Fund’s shares in relation to income earned and/or fluctuating fair value of the investments of the Fund.
bBased on average daily shares outstanding.
cRecognition of net investment income by the Fund is affected by the timing of declaration of dividends by the Underlying Funds and exchange traded funds in which the Fund invests.
dBenefit of waiver and payments by affiliates rounds to less than 0.01%.
eDoes not include expenses of the Underlying Funds and exchange traded funds in which the Fund invests. The weighted average indirect expenses of the Underlying Funds and exchange traded funds was 0.38% for the year ended December 31, 2019.
fBenefit of expense reduction rounds to less than 0.01%.
| | | | |
| | | |
26 | | Annual Report| The accompanying notes are an integral part of these financial statements. | | franklintempleton.com |
FRANKLIN FUND ALLOCATOR SERIES
Statement of Investments, December 31, 2019
Franklin Conservative Allocation Fund
| | | | | | | | |
| | | Shares | | | Value | |
| | |
Investments in Underlying Funds and Exchange Traded Funds 98.9% | | | | | | | | |
| | |
Domestic Equity 28.1% | | | | | | | | |
aFranklin Growth Fund, Class R6 | | | 898,962 | | | $ | 100,953,428 | |
aFranklin LibertyQ U.S. Equity ETF | | | 2,727,638 | | | | 95,440,054 | |
aFranklin Rising Dividends Fund, Class R6 | | | 726,394 | | | | 50,520,703 | |
aFranklin U.S. Core Equity (IU) Fund | | | 7,946,208 | | | | 85,739,586 | |
Vanguard S&P 500 ETF | | | 22,725 | | | | 6,722,055 | |
| | | | | | | | |
| | |
| | | | | | | 339,375,826 | |
| | | | | | | | |
| | |
Domestic Fixed Income 53.2% | | | | | | | | |
aFranklin Liberty Investment Grade Corporate ETF | | | 2,344,650 | | | | 60,127,611 | |
aFranklin Liberty U.S. Core Bond ETF | | | 11,863,350 | | | | 297,650,265 | |
aFranklin Low Duration Total Return Fund, Class R6 | | | 18,060,178 | | | | 175,003,128 | |
iShares Core U.S. Aggregate Bond ETF | | | 254,642 | | | | 28,614,121 | |
Vanguard Intermediate-Term Corporate Bond ETF | | | 333,922 | | | | 30,497,097 | |
Vanguard Total International Bond ETF | | | 921,287 | | | | 52,126,419 | |
| | | | | | | | |
| | |
| | | | | | | 644,018,641 | |
| | | | | | | | |
| | |
Foreign Equity 11.5% | | | | | | | | |
aFranklin Emerging Market Core Equity (IU) Fund | | | 2,393,786 | | | | 26,164,081 | |
aFranklin FTSE Europe ETF | | | 386,855 | | | | 9,768,089 | |
aFranklin FTSE Japan ETF | | | 186,957 | | | | 4,888,926 | |
aFranklin International Core Equity (IU) Fund | | | 3,978,178 | | | | 44,157,780 | |
aFranklin International Growth Fund, Class R6 | | | 1,118,367 | | | | 18,620,806 | |
aFranklin LibertyQ Emerging Markets ETF | | | 552,274 | | | | 16,448,929 | |
aTempleton Foreign Fund, Class R6 | | | 2,640,670 | | | | 18,827,976 | |
| | | | | | | | |
| | | | | | | 138,876,587 | |
| | | | | | | | |
| | |
Foreign Fixed Income 6.1% | | | | | | | | |
aFranklin Liberty High Yield Corporate ETF | | | 712,969 | | | | 18,669,307 | |
aTempleton Global Total Return Fund, Class R6 | | | 5,007,975 | | | | 55,538,436 | |
| | | | | | | | |
| | | | | | | 74,207,743 | |
| | | | | | | | |
| | |
Total Investments in Underlying Funds and Exchange Traded Funds before Short Term Investments (Cost $1,075,059,221) | | | | | | | 1,196,478,797 | |
| | | | | | | | |
| | |
Short Term Investments 1.1% | | | | | | | | |
| | |
Money Market Funds (Cost $16,214) 0.0%† | | | | | | | | |
a,bInstitutional Fiduciary Trust Money Market Portfolio, 1.26% | | | 16,214 | | | | 16,214 | |
| | | | | | | | |
| | | | |
franklintempleton.com | | Annual Report | | 27 |
FRANKLIN FUND ALLOCATOR SERIES
STATEMENT OF INVESTMENTS
Franklin Conservative Allocation Fund(continued)
| | | | | | | | |
| | | Principal
Amount | | | Value | |
| | |
Short Term Investments (continued) | | | | | | | | |
| | |
Repurchase Agreements (Cost $13,100,718) 1.1% | | | | | | | | |
cJoint Repurchase Agreement, 1.536%, 1/02/20 (Maturity Value $13,101,836) | | | | | | | | |
BNP Paribas Securities Corp. (Maturity Value $7,184,261) | | | | | | | | |
Deutsche Bank Securities Inc. (Maturity Value $2,325,445) | | | | | | | | |
HSBC Securities (USA) Inc. (Maturity Value $3,592,130) | | | | | | | | |
| | |
Collateralized by U.S. Treasury Notes, 1.375% - 2.75%, 9/30/20 - 10/31/24; and U.S. Treasury Notes, Index Linked, 0.125%, 1/15/23 (valued at $13,370,145) | | $ | 13,100,718 | | | $ | 13,100,718 | |
| | | | | | | | |
| | |
Total Investments (Cost $1,088,176,153) 100.0% | | | | | | | 1,209,595,729 | |
| | |
Other Assets, less Liabilities (0.0)%† | | | | | | | (515,641 | ) |
| | | | | | | | |
| | |
Net Assets 100.0% | | | | | | $ | 1,209,080,088 | |
| | | | | | | | |
See Abbreviations on page 64.
†Rounds to less than 0.1% of net assets.
aSee Note 3(f) regarding investments in FT Underlying Funds.
bThe rate shown is the annualizedseven-day effective yield at period end.
cSee Note 1(b) regarding joint repurchase agreement.
| | | | |
| | | |
28 | | Annual Report | The accompanying notes are an integral part of these financial statements. | | franklintempleton.com |
FRANKLIN FUND ALLOCATOR SERIES
Financial Highlights
Franklin Moderate Allocation Fund
| | | | | | | | | | | | | | | | | | | | |
| | | Year Ended December 31, | |
| | | 2019 | | | 2018 | | | 2017 | | | 2016 | | | 2015 | |
| | | | | |
Class A | | | | | | | | | | | | | | | | | | | | |
| | | | | |
Per share operating performance (for a share outstanding throughout the year) | | | | | | | | | | | | | | | | | | | | |
| | | | | |
Net asset value, beginning of year | | | $14.06 | | | | $16.11 | | | | $14.86 | | | | $14.49 | | | | $15.71 | |
| | | | | |
Income from investment operationsa: | | | | | | | | | | | | | | | | | | | | |
| | | | | |
Net investment incomeb,c | | | 0.28 | | | | 0.34 | | | | 0.20 | | | | 0.14 | | | | 0.24 | |
| | | | | |
Net realized and unrealized gains (losses) | | | 2.15 | | | | (1.11 | ) | | | 2.01 | | | | 0.56 | | | | (0.51 | ) |
| | | | | |
Total from investment operations | | | 2.43 | | | | (0.77 | ) | | | 2.21 | | | | 0.70 | | | | (0.27 | ) |
| | | | | |
Less distributions from: | | | | | | | | | | | | | | | | | | | | |
| | | | | |
Net investment income and short term gains received from Underlying Funds and exchange traded funds | | | (0.28 | ) | | | (0.33 | ) | | | (0.29 | ) | | | (0.12 | ) | | | (0.25 | ) |
| | | | | |
Net realized gains | | | (1.13 | ) | | | (0.95 | ) | | | (0.67 | ) | | | (0.21 | ) | | | (0.70 | ) |
| | | | | |
Total distributions | | | (1.41 | ) | | | (1.28 | ) | | | (0.96 | ) | | | (0.33 | ) | | | (0.95 | ) |
| | | | | |
Net asset value, end of year | | | $15.08 | | | | $14.06 | | | | $16.11 | | | | $14.86 | | | | $14.49 | |
| | | | | |
Total returnd | | | 17.40% | | | | (4.82)% | | | | 14.98% | | | | 4.94% | | | | (1.89)% | |
| | | | | |
Ratios to average net assets | | | | | | | | | | | | | | | | | | | | |
| | | | | |
Expenses before waiver and payments by affiliatese | | | 0.63% | | | | 0.63% | | | | 0.66% | | | | 0.63% | | | | 0.63% | |
| | | | | |
Expenses net of waiver and payments by affiliatese | | | 0.63% | f,g | | | 0.63% | g | | | 0.65% | | | | 0.63% | g | | | 0.63% | g |
| | | | | |
Net investment incomec | | | 1.78% | | | | 2.02% | | | | 1.23% | | | | 0.93% | | | | 1.52% | |
| | | | | |
| Supplemental data | | | | | | | | | | | | | | | | | | | | |
| | | | | |
Net assets, end of year (000’s) | | | $1,456,531 | | | | $1,318,198 | | | | $1,407,956 | | | | $1,416,532 | | | | $1,594,882 | |
| | | | | |
Portfolio turnover rate | | | 71.70% | | | | 33.65% | | | | 16.86% | | | | 29.22% | | | | 22.08% | |
aThe amount shown for a share outstanding throughout the period may not correlate with the Statement of Operations for the period due to the timing of sales and repurchases of the Fund’s shares in relation to income earned and/or fluctuating fair value of the investments of the Fund.
bBased on average daily shares outstanding.
cRecognition of net investment income by the Fund is affected by the timing of declaration of dividends by the Underlying Funds and exchange traded funds in which the Fund invests.
dTotal return does not reflect sales commissions or contingent deferred sales charges, if applicable.
eDoes not include expenses of the Underlying Funds and exchange traded funds in which the Fund invests. The weighted average indirect expenses of the Underlying Funds and exchange traded funds was 0.39% for the year ended December 31, 2019.
fBenefit of expense reduction rounds to less than 0.01%.
gBenefit of waiver and payments by affiliates rounds to less than 0.01%.
| | | | |
franklintempleton.com | | The accompanying notes are an integral part of these financial statements. | Annual Report | | 29 |
FRANKLIN FUND ALLOCATOR SERIES
FINANCIAL HIGHLIGHTS
Franklin Moderate Allocation Fund(continued)
| | | | | | | | | | | | | | | | | | | | |
| | | Year Ended December 31, | |
| | | 2019 | | | 2018 | | | 2017 | | | 2016 | | | 2015 | |
| | | | | |
Class C | | | | | | | | | | | | | | | | | | | | |
| | | | | |
Per share operating performance (for a share outstanding throughout the year) | | | | | | | | | | | | | | | | | | | | |
| | | | | |
Net asset value, beginning of year | | | $13.65 | | | | $15.66 | | | | $14.48 | | | | $14.12 | | | | $15.33 | |
| | | | | |
Income from investment operationsa: | | | | | | | | | | | | | | | | | | | | |
| | | | | |
Net investment incomeb,c | | | 0.15 | | | | 0.17 | | | | 0.07 | | | | 0.03 | | | | 0.12 | |
| | | | | |
Net realized and unrealized gains (losses) | | | 2.09 | | | | (1.02 | ) | | | 1.94 | | | | 0.55 | | | | (0.49 | ) |
| | | | | |
Total from investment operations | | | 2.24 | | | | (0.85 | ) | | | 2.01 | | | | 0.58 | | | | (0.37 | ) |
| | | | | |
Less distributions from: | | | | | | | | | | | | | | | | | | | | |
| | | | | |
Net investment income and short term gains received from Underlying Funds and exchange traded funds | | | (0.16 | ) | | | (0.21 | ) | | | (0.16 | ) | | | (0.01 | ) | | | (0.14 | ) |
| | | | | |
Net realized gains | | | (1.13 | ) | | | (0.95 | ) | | | (0.67 | ) | | | (0.21 | ) | | | (0.70 | ) |
| | | | | |
Total distributions | | | (1.29 | ) | | | (1.16 | ) | | | (0.83 | ) | | | (0.22 | ) | | | (0.84 | ) |
| | | | | |
Net asset value, end of year | | | $14.60 | | | | $13.65 | | | | $15.66 | | | | $14.48 | | | | $14.12 | |
| | | | | |
Total returnd | | | 16.52% | | | | (5.54)% | | | | 14.10% | | | | 4.25% | | | | (2.68)% | |
| | | | | |
Ratios to average net assets | | | | | | | | | | | | | | | | | | | | |
| | | | | |
Expenses before waiver and payments by affiliatese | | | 1.38% | | | | 1.38% | | | | 1.41% | | | | 1.37% | | | | 1.38% | |
| | | | | |
Expenses net of waiver and payments by affiliatese | | | 1.38% | f,g | | | 1.38% | g | | | 1.40% | | | | 1.37% | g | | | 1.38% | g |
| | | | | |
Net investment incomec | | | 1.03% | | | | 1.27% | | | | 0.48% | | | | 0.19% | | | | 0.77% | |
| | | | | |
| Supplemental data | | | | | | | | | | | | | | | | | | | | |
| | | | | |
Net assets, end of year (000’s) | | | $339,845 | | | | $375,494 | | | | $568,280 | | | | $595,911 | | | | $692,872 | |
| | | | | |
Portfolio turnover rate | | | 71.70% | | | | 33.65% | | | | 16.86% | | | | 29.22% | | | | 22.08% | |
aThe amount shown for a share outstanding throughout the period may not correlate with the Statement of Operations for the period due to the timing of sales and repurchases of the Fund’s shares in relation to income earned and/or fluctuating fair value of the investments of the Fund.
bBased on average daily shares outstanding.
cRecognition of net investment income by the Fund is affected by the timing of declaration of dividends by the Underlying Funds and exchange traded funds in which the Fund invests.
dTotal return does not reflect sales commissions or contingent deferred sales charges, if applicable.
eDoes not include expenses of the Underlying Funds and exchange traded funds in which the Fund invests. The weighted average indirect expenses of the Underlying Funds and exchange traded funds was 0.39% for the year ended December 31, 2019.
fBenefit of expense reduction rounds to less than 0.01%.
gBenefit of waiver and payments by affiliates rounds to less than 0.01%.
| | | | |
| | | |
30 | | Annual Report| The accompanying notes are an integral part of these financial statements. | | franklintempleton.com |
FRANKLIN FUND ALLOCATOR SERIES
FINANCIAL HIGHLIGHTS
Franklin Moderate Allocation Fund(continued)
| | | | | | | | | | | | | | | | | | | | |
| | | Year Ended December 31, | |
| | | 2019 | | | 2018 | | | 2017 | | | 2016 | | | 2015 | |
| | | | | |
Class R | | | | | | | | | | | | | | | | | | | | |
| | | | | |
Per share operating performance (for a share outstanding throughout the year) | | | | | | | | | | | | | | | | | | | | |
| | | | | |
Net asset value, beginning of year | | | $14.04 | | | | $16.08 | | | | $14.82 | | | | $14.44 | | | | $15.66 | |
| | | | | |
Income from investment operationsa: | | | | | | | | | | | | | | | | | | | | |
| | | | | |
Net investment incomeb,c | | | 0.23 | | | | 0.27 | | | | 0.14 | | | | 0.10 | | | | 0.19 | |
| | | | | |
Net realized and unrealized gains (losses) | | | 2.15 | | | | (1.07 | ) | | | 2.02 | | | | 0.57 | | | | (0.51 | ) |
| | | | | |
Total from investment operations | | | 2.38 | | | | (0.80 | ) | | | 2.16 | | | | 0.67 | | | | (0.32 | ) |
| | | | | |
Less distributions from: | �� | | | | | | | | | | | | | | | | | | | |
| | | | | |
Net investment income and short term gains received from Underlying Funds and exchange traded funds | | | (0.24 | ) | | | (0.29 | ) | | | (0.23 | ) | | | (0.08 | ) | | | (0.20 | ) |
| | | | | |
Net realized gains | | | (1.13 | ) | | | (0.95 | ) | | | (0.67 | ) | | | (0.21 | ) | | | (0.70 | ) |
| | | | | |
Total distributions | | | (1.37 | ) | | | (1.24 | ) | | | (0.90 | ) | | | (0.29 | ) | | | (0.90 | ) |
| | | | | |
Net asset value, end of year | | | $15.05 | | | | $14.04 | | | | $16.08 | | | | $14.82 | | | | $14.44 | |
| | | | | |
Total return | | | 17.05% | | | | (5.04)% | | | | 14.69% | | | | 4.71% | | | | (2.18)% | |
| | | | | |
Ratios to average net assets | | | | | | | | | | | | | | | | | | | | |
| | | | | |
Expenses before waiver and payments by affiliatesd | | | 0.88% | | | | 0.88% | | | | 0.91% | | | | 0.88% | | | | 0.88% | |
| | | | | |
Expenses net of waiver and payments by affiliatesd | | | 0.88% | e,f | | | 0.88% | f | | | 0.90% | | | | 0.88% | f | | | 0.88% | f |
| | | | | |
Net investment incomec | | | 1.53% | | | | 1.77% | | | | 0.98% | | | | 0.68% | | | | 1.27% | |
| | | | | |
| Supplemental data | | | | | | | | | | | | | | | | | | | | |
| | | | | |
Net assets, end of year (000’s) | | | $78,999 | | | | $87,277 | | | | $119,920 | | | | $158,192 | | | | $202,854 | |
| | | | | |
Portfolio turnover rate | | | 71.70% | | | | 33.65% | | | | 16.86% | | | | 29.22% | | | | 22.08% | |
aThe amount shown for a share outstanding throughout the period may not correlate with the Statement of Operations for the period due to the timing of sales and repurchases of the Fund’s shares in relation to income earned and/or fluctuating fair value of the investments of the Fund.
bBased on average daily shares outstanding.
cRecognition of net investment income by the Fund is affected by the timing of declaration of dividends by the Underlying Funds and exchange traded funds in which the Fund invests.
dDoes not include expenses of the Underlying Funds and exchange traded funds in which the Fund invests. The weighted average indirect expenses of the Underlying Funds and exchange traded funds was 0.39% for the year ended December 31, 2019.
eBenefit of expense reduction rounds to less than 0.01%.
fBenefit of waiver and payments by affiliates rounds to less than 0.01%.
| | | | |
franklintempleton.com | | The accompanying notes are an integral part of these financial statements. | Annual Report | | 31 |
FRANKLIN FUND ALLOCATOR SERIES
FINANCIAL HIGHLIGHTS
Franklin Moderate Allocation Fund(continued)
| | | | | | | | | | | | | | | | | | | | |
| | | Year Ended December 31, | |
| | | 2019 | | | 2018 | | | 2017 | | | 2016 | | | 2015 | |
| | | | | |
Class R6 | | | | | | | | | | | | | | | | | | | | |
| | | | | |
Per share operating performance (for a share outstanding throughout the year) | | | | | | | | | | | | | | | | | | | | |
| | | | | |
Net asset value, beginning of year | | | $14.06 | | | | $16.11 | | | | $14.86 | | | | $14.49 | | | | $15.72 | |
| | | | | |
Income from investment operationsa: | | | | | | | | | | | | | | | | | | | | |
| | | | | |
Net investment incomeb,c | | | 0.34 | | | | 0.41 | | | | 0.26 | | | | 0.19 | | | | 0.31 | |
| | | | | |
Net realized and unrealized gains (losses) | | | 2.15 | | | | (1.12 | ) | | | 2.01 | | | | 0.57 | | | | (0.54 | ) |
| | | | | |
Total from investment operations | | | 2.49 | | | | (0.71 | ) | | | 2.27 | | | | 0.76 | | | | (0.23 | ) |
| | | | | |
Less distributions from: | | | | | | | | | | | | | | | | | | | | |
| | | | | |
Net investment income and short term gains received from Underlying Funds and exchange traded funds | | | (0.34 | ) | | | (0.39 | ) | | | (0.35 | ) | | | (0.18 | ) | | | (0.30 | ) |
| | | | | |
Net realized gains | | | (1.13 | ) | | | (0.95 | ) | | | (0.67 | ) | | | (0.21 | ) | | | (0.70 | ) |
| | | | | |
Total distributions | | | (1.47 | ) | | | (1.34 | ) | | | (1.02 | ) | | | (0.39 | ) | | | (1.00 | ) |
| | | | | |
Net asset value, end of year | | | $15.08 | | | | $14.06 | | | | $16.11 | | | | $14.86 | | | | $14.49 | |
| | | | | |
Total return | | | 17.81% | | | | (4.49)% | | | | 15.40% | | | | 5.34% | | | | (1.59)% | |
| | | | | |
Ratios to average net assets | | | | | | | | | | | | | | | | | | | | |
| | | | | |
Expenses before waiver and payments by affiliatesd | | | 0.34% | | | | 0.35% | | | | 0.30% | | | | 0.28% | | | | 0.28% | |
| | | | | |
Expenses net of waiver and payments by affiliatesd | | | 0.29% | e | | | 0.29% | | | | 0.28% | | | | 0.28% | f | | | 0.28% | f |
| | | | | |
Net investment incomec | | | 2.12% | | | | 2.36% | | | | 1.60% | | | | 1.28% | | | | 1.87% | |
| | | | | |
| Supplemental data | | | | | | | | | | | | | | | | | | | | |
| | | | | |
Net assets, end of year (000’s) | | | $6,666 | | | | $5,141 | | | | $4,492 | | | | $5,106 | | | | $4,779 | |
| | | | | |
Portfolio turnover rate | | | 71.70% | | | | 33.65% | | | | 16.86% | | | | 29.22% | | | | 22.08% | |
aThe amount shown for a share outstanding throughout the period may not correlate with the Statement of Operations for the period due to the timing of sales and repurchases of the Fund’s shares in relation to income earned and/or fluctuating fair value of the investments of the Fund.
bBased on average daily shares outstanding.
cRecognition of net investment income by the Fund is affected by the timing of declaration of dividends by the Underlying Funds and exchange traded funds in which the Fund invests.
dDoes not include expenses of the Underlying Funds and exchange traded funds in which the Fund invests. The weighted average indirect expenses of the Underlying Funds and exchange traded funds was 0.39% for the year ended December 31, 2019.
eBenefit of expense reduction rounds to less than 0.01%.
fBenefit of waiver and payments by affiliates rounds to less than 0.01%.
| | | | |
| | | |
32 | | Annual Report | The accompanying notes are an integral part of these financial statements. | | franklintempleton.com |
FRANKLIN FUND ALLOCATOR SERIES
FINANCIAL HIGHLIGHTS
Franklin Moderate Allocation Fund(continued)
| | | | | | | | | | | | | | | | | | | | |
| | | Year Ended December 31, | |
| | | 2019 | | | 2018 | | | 2017 | | | 2016 | | | 2015 | |
| | | | | |
Advisor Class | | | | | | | | | | | | | | | | | | | | |
| | | | | |
Per share operating performance (for a share outstanding throughout the year) | | | | | | | | | | | | | | | | | | | | |
| | | | | |
Net asset value, beginning of year | | | $14.07 | | | | $16.12 | | | | $14.88 | | | | $14.50 | | | | $15.72 | |
| | | | | |
Income from investment operationsa: | | | | | | | | | | | | | | | | | | | | |
| | | | | |
Net investment incomeb,c | | | 0.32 | | | | 0.39 | | | | 0.26 | | | | 0.17 | | | | 0.25 | |
| | | | | |
Net realized and unrealized gains (losses) | | | 2.15 | | | | (1.11 | ) | | | 1.98 | | | | 0.58 | | | | (0.49 | ) |
| | | | | |
Total from investment operations | | | 2.47 | | | | (0.72 | ) | | | 2.24 | | | | 0.75 | | | | (0.24 | ) |
| | | | | |
Less distributions from: | | | | | | | | | | | | | | | | | | | | |
| | | | | |
Net investment income and short term gains received from Underlying Funds and exchange traded funds. | | | (0.32 | ) | | | (0.38 | ) | | | (0.33 | ) | | | (0.16 | ) | | | (0.28 | ) |
| | | | | |
Net realized gains | | | (1.13 | ) | | | (0.95 | ) | | | (0.67 | ) | | | (0.21 | ) | | | (0.70 | ) |
| | | | | |
Total distributions | | | (1.45 | ) | | | (1.33 | ) | | | (1.00 | ) | | | (0.37 | ) | | | (0.98 | ) |
| | | | | |
Net asset value, end of year | | | $15.09 | | | | $14.07 | | | | $16.12 | | | | $14.88 | | | | $14.50 | |
| | | | | |
Total return | | | 17.68% | | | | (4.57)% | | | | 15.20% | | | | 5.26% | | | | (1.66)% | |
| | | | | |
Ratios to average net assets | | | | | | | | | | | | | | | | | | | | |
| | | | | |
Expenses before waiver and payments by affiliatesd | | | 0.38% | | | | 0.38% | | | | 0.41% | | | | 0.38% | | | | 0.38% | |
| | | | | |
Expenses net of waiver and payments by affiliatesd | | | 0.38% | e,f | | | 0.38% | f | | | 0.40% | | | | 0.38% | f | | | 0.38% | f |
| | | | | |
Net investment incomec | | | 2.03% | | | | 2.27% | | | | 1.48% | | | | 1.18% | | | | 1.77% | |
| | | | | |
| Supplemental data | | | | | | | | | | | | | | | | | | | | |
| | | | | |
Net assets, end of year (000’s) | | | $61,026 | | | | $55,052 | | | | $52,575 | | | | $39,052 | | | | $52,975 | |
| | | | | |
Portfolio turnover rate | | | 71.70% | | | | 33.65% | | | | 16.86% | | | | 29.22% | | | | 22.08% | |
aThe amount shown for a share outstanding throughout the period may not correlate with the Statement of Operations for the period due to the timing of sales and repurchases of the Fund’s shares in relation to income earned and/or fluctuating fair value of the investments of the Fund.
bBased on average daily shares outstanding.
cRecognition of net investment income by the Fund is affected by the timing of declaration of dividends by the Underlying Funds and exchange traded funds in which the Fund invests.
dDoes not include expenses of the Underlying Funds and exchange traded funds in which the Fund invests. The weighted average indirect expenses of the Underlying Funds and exchange traded funds was 0.39% for the year ended December 31, 2019.
eBenefit of expense reduction rounds to less than 0.01%.
fBenefit of waiver and payments by affiliates rounds to less than 0.01%.
| | | | |
franklintempleton.com | | The accompanying notes are an integral part of these financial statements. | Annual Report | | 33 |
FRANKLIN FUND ALLOCATOR SERIES
Statement of Investments, December 31, 2019
Franklin Moderate Allocation Fund
| | | | | | | | |
| | | Shares | | | Value | |
| | |
Investments in Underlying Funds and Exchange Traded Funds 99.2% | | | | | | | | |
Domestic Equity 42.3% | | | | | | | | |
aFranklin Growth Fund, Class R6 | | | 2,183,666 | | | $ | 245,225,738 | |
aFranklin LibertyQ U.S. Equity ETF | | | 6,589,526 | | | | 230,567,515 | |
aFranklin Rising Dividends Fund, Class R6 | | | 1,763,774 | | | | 122,670,489 | |
aFranklin U.S. Core Equity (IU) Fund | | | 19,197,079 | | | | 207,136,477 | |
Vanguard S&P 500 ETF | | | 55,125 | | | | 16,305,975 | |
| | | | | | | | |
| | |
| | | | | | | 821,906,194 | |
| | | | | | | | |
Domestic Fixed Income 35.3% | | | | | | | | |
aFranklin Liberty U.S. Core Bond ETF | | | 15,276,873 | | | | 383,295,216 | |
aFranklin Low Duration Total Return Fund, Class R6 | | | 13,417,027 | | | | 130,010,994 | |
iShares Core U.S. Aggregate Bond ETF | | | 764,118 | | | | 85,863,940 | |
Vanguard Intermediate-Term Corporate Bond ETF | | | 352,906 | | | | 32,230,905 | |
Vanguard Total International Bond ETF | | | 978,220 | | | | 55,347,688 | |
| | | | | | | | |
| | |
| | | | | | | 686,748,743 | |
| | | | | | | | |
Foreign Equity 17.5% | | | | | | | | |
aFranklin Emerging Market Core Equity (IU) Fund | | | 5,769,854 | | | | 63,064,506 | |
aFranklin FTSE Europe ETF | | | 915,287 | | | | 23,110,997 | |
aFranklin FTSE Japan ETF | | | 429,602 | | | | 11,234,092 | |
aFranklin International Core Equity (IU) Fund | | | 9,873,914 | | | | 109,600,441 | |
aFranklin International Growth Fund, Class R6 | | | 2,791,060 | | | | 46,471,153 | |
aFranklin LibertyQ Emerging Markets ETF | | | 1,339,065 | | | | 39,882,712 | |
aTempleton Foreign Fund, Class R6 | | | 6,612,032 | | | | 47,143,784 | |
| | | | | | | | |
| | |
| | | | | | | 340,507,685 | |
| | | | | | | | |
Foreign Fixed Income 4.1% | | | | | | | | |
aFranklin Liberty High Yield Corporate ETF | | | 753,489 | | | | 19,730,336 | |
aTempleton Global Total Return Fund, Class R6 | | | 5,316,691 | | | | 58,962,107 | |
| | | | | | | | |
| | |
| | | | | | | 78,692,443 | |
| | | | | | | | |
| | | | | | | | |
| | |
Total Investments in Underlying Funds and Exchange Traded Funds before Short Term Investments (Cost $1,629,621,132) | | | | | | | 1,927,855,065 | |
| | | | | | | | |
| | | | | | | | |
| | |
Short Term Investments 1.0% | | | | | | | | |
Money Market Funds (Cost $26,056) 0.0%† | | | | | | | | |
a,bInstitutional Fiduciary Trust Money Market Portfolio, 1.26% | | | 26,056 | | | | 26,056 | |
| | | | | | | | |
| | | | |
| | | |
34 | | Annual Report | | franklintempleton.com |
FRANKLIN FUND ALLOCATOR SERIES
STATEMENT OF INVESTMENTS
Franklin Moderate Allocation Fund(continued)
| | | | | | | | |
| | | Principal
Amount | | | Value | |
| | |
Short Term Investments(continued) | | | | | | | | |
Repurchase Agreements (Cost $18,831,074) 1.0% | | | | | | | | |
cJoint Repurchase Agreement, 1.536%, 1/02/20 (Maturity Value $18,832,682) | | | | | | | | |
BNP Paribas Securities Corp. (Maturity Value $10,326,713) | | | | | | | | |
Deutsche Bank Securities Inc. (Maturity Value $3,342,613) | | | | | | | | |
HSBC Securities (USA) Inc. (Maturity Value $5,163,356) | | | | | | | | |
Collateralized by U.S. Treasury Notes, 1.375%—2.75%, 9/30/20—10/31/24; and U.S. Treasury Notes, | | | | | | | | |
Index Linked, 0.125%, 1/15/23 (valued at $19,218,352) | | $ | 18,831,074 | | | $ | 18,831,074 | |
| | | | | | | | |
| | |
Total Investments (Cost $1,648,478,262) 100.2% | | | | | | | 1,946,712,195 | |
| | |
Other Assets, less Liabilities (0.2)% | | | | | | | (3,644,861 | ) |
| | | | | | | | |
| | |
Net Assets 100.0% | | | | | | $ | 1,943,067,334 | |
| | | | | | | | |
See Abbreviations on page 64.
†Rounds to less than 0.1% of net assets.
aSee Note 3(f) regarding investments in FT Underlying Funds.
bThe rate shown is the annualizedseven-day effective yield at period end.
cSee Note 1(b) regarding joint repurchase agreement.
| | | | |
franklintempleton.com | | The accompanying notes are an integral part of these financial statements. | Annual Report | | 35 |
FRANKLIN FUND ALLOCATOR SERIES
Financial Highlights
Franklin Growth Allocation Fund
| | | | | | | | | | | | | | | | | | | | |
| | | Year Ended December 31, | |
| | | 2019 | | | 2018 | | | 2017 | | | 2016 | | | 2015 | |
| | | | | |
Class A | | | | | | | | | | | | | | | | | | | | |
| | | | | |
Per share operating performance | | | | | | | | | | | | | | | | | | | | |
(for a share outstanding throughout the year) | | | | | | | | | | | | | | | | | | | | |
| | | | | |
Net asset value, beginning of year | | | $16.54 | | | | $19.34 | | | | $17.43 | | | | $17.01 | | | | $18.57 | |
| | | | | |
Income from investment operationsa: | | | | | | | | | | | | | | | | | | | | |
| | | | | |
Net investment incomeb,c | | | 0.25 | | | | 0.30 | | | | 0.22 | | | | 0.14 | | | | 0.21 | |
| | | | | |
Net realized and unrealized gains (losses) | | | 3.36 | | | | (1.54 | ) | | | 3.12 | | | | 0.75 | | | | (0.48 | ) |
| | | | | |
Total from investment operations | | | 3.61 | | | | (1.24 | ) | | | 3.34 | | | | 0.89 | | | | (0.27 | ) |
| | | | | |
Less distributions from: | | | | | | | | | | | | | | | | | | | | |
| | | | | |
Net investment income and short term gains received from Underlying Funds and exchange traded funds | | | (0.25 | ) | | | (0.30 | ) | | | (0.32 | ) | | | (0.14 | ) | | | (0.21 | ) |
| | | | | |
Net realized gains | | | (1.77 | ) | | | (1.26 | ) | | | (1.11 | ) | | | (0.33 | ) | | | (1.08 | ) |
| | | | | |
Total distributions | | | (2.02 | ) | | | (1.56 | ) | | | (1.43 | ) | | | (0.47 | ) | | | (1.29 | ) |
| | | | | |
Net asset value, end of year | | | $18.13 | | | | $16.54 | | | | $19.34 | | | | $17.43 | | | | $17.01 | |
| | | | | |
Total returnd | | | 21.90% | | | | (6.45)% | | | | 19.45% | | | | 5.36% | | | | (1.66)% | |
| | | | | |
Ratios to average net assets | | | | | | | | | | | | | | | | | | | | |
| | | | | |
Expenses before waiver and payments by affiliatese | | | 0.68% | | | | 0.67% | | | | 0.70% | | | | 0.69% | | | | 0.67% | |
| | | | | |
Expenses net of waiver and payments by affiliatese | | | 0.65% | f | | | 0.65% | f | | | 0.65% | f | | | 0.65% | | | | 0.65% | |
| | | | | |
Net investment incomec | | | 1.32% | | | | 1.48% | | | | 1.14% | | | | 0.83% | | | | 1.10% | |
| | | | | |
Supplemental data | | | | | | | | | | | | | | | | | | | | |
| | | | | |
Net assets, end of year (000’s) | | | $974,391 | | | | $837,327 | | | | $873,011 | | | | $822,833 | | | | $888,096 | |
| | | | | |
Portfolio turnover rate | | | 63.65% | | | | 30.79% | | | | 16.90% | | | | 30.19% | | | | 20.40% | |
aThe amount shown for a share outstanding throughout the period may not correlate with the Statement of Operations for the period due to the timing of sales and repurchases of the Fund’s shares in relation to income earned and/or fluctuating fair value of the investments of the Fund.
bBased on average daily shares outstanding.
cRecognition of net investment income by the Fund is affected by the timing of declaration of dividends by the Underlying Funds and exchange traded funds in which the Fund invests.
dTotal return does not reflect sales commissions or contingent deferred sales charges, if applicable.
eDoes not include expenses of the Underlying Funds and exchange traded funds in which the Fund invests. The weighted average indirect expenses of the Underlying Funds and exchange traded funds was 0.40% for the year ended December 31, 2019.
fBenefit of expense reduction rounds to less than 0.01%.
| | | | |
| | | |
36 | | Annual Report | The accompanying notes are an integral part of these financial statements. | | franklintempleton.com |
FRANKLIN FUND ALLOCATOR SERIES
FINANCIAL HIGHLIGHTS
Franklin Growth Allocation Fund(continued)
| | | | | | | | | | | | | | | | | | | | |
| | | Year Ended December 31, | |
| | | 2019 | | | 2018 | | | 2017 | | | 2016 | | | 2015 | |
| | | | | |
Class C | | | | | | | | | | | | | | | | | | | | |
| | | | | |
Per share operating performance | | | | | | | | | | | | | | | | | | | | |
(for a share outstanding throughout the year) | | | | | | | | | | | | | | | | | | | | |
| | | | | |
Net asset value, beginning of year | | | $16.12 | | | | $18.81 | | | | $16.99 | | | | $16.59 | | | | $18.15 | |
| | | | | |
Income from investment operationsa: | | | | | | | | | | | | | | | | | | | | |
| | | | | |
Net investment incomeb,c | | | 0.10 | | | | 0.10 | | | | 0.07 | | | | 0.02 | | | | 0.07 | |
| | | | | |
Net realized and unrealized gains (losses) | | | 3.27 | | | | (1.43 | ) | | | 3.04 | | | | 0.72 | | | | (0.47 | ) |
| | | | | |
Total from investment operations | | | 3.37 | | | | (1.33 | ) | | | 3.11 | | | | 0.74 | | | | (0.40 | ) |
| | | | | |
Less distributions from: | | | | | | | | | | | | | | | | | | | | |
| | | | | |
Net investment income and short term gains received from Underlying Funds and exchange traded funds | | | (0.10 | ) | | | (0.10 | ) | | | (0.18 | ) | | | (0.01 | ) | | | (0.08 | ) |
| | | | | |
Net realized gains | | | (1.77 | ) | | | (1.26 | ) | | | (1.11 | ) | | | (0.33 | ) | | | (1.08 | ) |
| | | | | |
Total distributions | | | (1.87 | ) | | | (1.36 | ) | | | (1.29 | ) | | | (0.34 | ) | | | (1.16 | ) |
| | | | | |
Net asset value, end of year | | | $17.62 | | | | $16.12 | | | | $18.81 | | | | $16.99 | | | | $16.59 | |
| | | | | |
Total returnd | | | 20.95% | | | | (7.13)% | | | | 18.56% | | | | 4.59% | | | | (2.41)% | |
| | | | | |
Ratios to average net assets | | | | | | | | | | | | | | | | | | | | |
| | | | | |
Expenses before waiver and payments by affiliatese | | | 1.43% | | | | 1.42% | | | | 1.45% | | | | 1.43% | | | | 1.42% | |
| | | | | |
Expenses net of waiver and payments by affiliatese | | | 1.40% | f | | | 1.40% | f | | | 1.40% | f | | | 1.39% | | | | 1.40% | |
| | | | | |
Net investment incomec | | | 0.57% | | | | 0.73% | | | | 0.39% | | | | 0.09% | | | | 0.35% | |
| | | | | |
Supplemental data | | | | | | | | | | | | | | | | | | | | |
| | | | | |
Net assets, end of year (000’s) | | | $202,689 | | | | $206,933 | | | | $311,640 | | | | $308,736 | | | | $336,557 | |
| | | | | |
Portfolio turnover rate | | | 63.65% | | | | 30.79% | | | | 16.90% | | | | 30.19% | | | | 20.40% | |
aThe amount shown for a share outstanding throughout the period may not correlate with the Statement of Operations for the period due to the timing of sales and repurchases of the Fund’s shares in relation to income earned and/or fluctuating fair value of the investments of the Fund.
bBased on average daily shares outstanding.
cRecognition of net investment income by the Fund is affected by the timing of declaration of dividends by the Underlying Funds and exchange traded funds in which the Fund invests.
dTotal return does not reflect sales commissions or contingent deferred sales charges, if applicable.
eDoes not include expenses of the Underlying Funds and exchange traded funds in which the Fund invests. The weighted average indirect expenses of the Underlying Funds and exchange traded funds was 0.40% for the year ended December 31, 2019.
fBenefit of expense reduction rounds to less than 0.01%.
| | | | |
franklintempleton.com | | The accompanying notes are an integral part of these financial statements. | Annual Report | | 37 |
FRANKLIN FUND ALLOCATOR SERIES
FINANCIAL HIGHLIGHTS
Franklin Growth Allocation Fund(continued)
| | | | | | | | | | | | | | | | | | | | |
| | | Year Ended December 31, | |
| | | 2019 | | | 2018 | | | 2017 | | | 2016 | | | 2015 | |
| | | | | |
Class R | | | | | | | | | | | | | | | | | | | | |
| | | | | |
Per share operating performance | | | | | | | | | | | | | | | | | | | | |
(for a share outstanding throughout the year) | | | | | | | | | | | | | | | | | | | | |
| | | | | |
Net asset value, beginning of year | | | $16.34 | | | | $19.10 | | | | $17.22 | | | | $16.80 | | | | $18.34 | |
| | | | | |
Income from investment operationsa: | | | | | | | | | | | | | | | | | | | | |
| | | | | |
Net investment incomeb,c | | | 0.18 | | | | 0.22 | | | | 0.15 | | | | 0.09 | | | | 0.14 | |
| | | | | |
Net realized and unrealized gains (losses) | | | 3.33 | | | | (1.49 | ) | | | 3.11 | | | | 0.75 | | | | (0.44 | ) |
| | | | | |
Total from investment operations | | | 3.51 | | | | (1.27 | ) | | | 3.26 | | | | 0.84 | | | | (0.30 | ) |
| | | | | |
Less distributions from: | | | | | | | | | | | | | | | | | | | | |
| | | | | |
Net investment income and short term gains received from Underlying Funds and exchange traded funds | | | (0.19 | ) | | | (0.23 | ) | | | (0.27 | ) | | | (0.09 | ) | | | (0.16 | ) |
| | | | | |
Net realized gains | | | (1.77 | ) | | | (1.26 | ) | | | (1.11 | ) | | | (0.33 | ) | | | (1.08 | ) |
| | | | | |
Total distributions | | | (1.96 | ) | | | (1.49 | ) | | | (1.38 | ) | | | (0.42 | ) | | | (1.24 | ) |
| | | | | |
Net asset value, end of year | | | $17.89 | | | | $16.34 | | | | $19.10 | | | | $17.22 | | | | $16.80 | |
| | | | | |
Total return | | | 21.56% | | | | (6.68)% | | | | 19.17% | | | | 5.12% | | | | (1.93)% | |
| | | | | |
Ratios to average net assets | | | | | | | | | | | | | | | | | | | | |
| | | | | |
Expenses before waiver and payments by affiliatesd | | | 0.93% | | | | 0.92% | | | | 0.95% | | | | 0.94% | | | | 0.92% | |
| | | | | |
Expenses net of waiver and payments by affiliatesd | | | 0.90% | e | | | 0.90% | e | | | 0.90% | e | | | 0.90% | | | | 0.90% | |
| | | | | |
Net investment incomec | | | 1.07% | | | | 1.23% | | | | 0.89% | | | | 0.58% | | | | 0.85% | |
| | | | | |
Supplemental data | | | | | | | | | | | | | | | | | | | | |
| | | | | |
Net assets, end of year (000’s) | | | $62,973 | | | | $72,100 | | | | $100,258 | | | | $112,272 | | | | $147,426 | |
| | | | | |
Portfolio turnover rate | | | 63.65% | | | | 30.79% | | | | 16.90% | | | | 30.19% | | | | 20.40% | |
aThe amount shown for a share outstanding throughout the period may not correlate with the Statement of Operations for the period due to the timing of sales and repurchases of the Fund’s shares in relation to income earned and/or fluctuating fair value of the investments of the Fund.
bBased on average daily shares outstanding.
cRecognition of net investment income by the Fund is affected by the timing of declaration of dividends by the Underlying Funds and exchange traded funds in which the Fund invests.
dDoes not include expenses of the Underlying Funds and exchange traded funds in which the Fund invests. The weighted average indirect expenses of the Underlying Funds and exchange traded funds was 0.40% for the year ended December 31, 2019.
eBenefit of expense reduction rounds to less than 0.01%.
| | | | |
| | | |
38 | | Annual Report| The accompanying notes are an integral part of these financial statements. | | franklintempleton.com |
FRANKLIN FUND ALLOCATOR SERIES
FINANCIAL HIGHLIGHTS
Franklin Growth Allocation Fund(continued)
| | | | | | | | | | | | | | | | | | | | |
| | | Year Ended December 31, | |
| | | 2019 | | | 2018 | | | 2017 | | | 2016 | | | 2015 | |
| | | | | |
Class R6 | | | | | | | | | | | | | | | | | | | | |
| | | | | |
Per share operating performance | | | | | | | | | | | | | | | | | | | | |
(for a share outstanding throughout the year) | | | | | | | | | | | | | | | | | | | | |
| | | | | |
Net asset value, beginning of year | | | $16.60 | | | | $19.40 | | | | $17.48 | | | | $17.06 | | | | $18.61 | |
| | | | | |
Income from investment operationsa: | | | | | | | | | | | | | | | | | | | | |
| | | | | |
Net investment incomeb,c | | | 0.32 | | | | 0.40 | | | | 0.31 | | | | 0.22 | | | | 0.32 | |
| | | | | |
Net realized and unrealized gains (losses) | | | 3.37 | | | | (1.57 | ) | | | 3.12 | | | | 0.74 | | | | (0.51 | ) |
| | | | | |
Total from investment operations | | | 3.69 | | | | (1.17 | ) | | | 3.43 | | | | 0.96 | | | | (0.19 | ) |
| | | | | |
Less distributions from: | | | | | | | | | | | | | | | | | | | | |
| | | | | |
Net investment income and short term gains received from Underlying Funds and exchange traded funds. | | | (0.32 | ) | | | (0.37 | ) | | | (0.40 | ) | | | (0.21 | ) | | | (0.28 | ) |
| | | | | |
Net realized gains | | | (1.77 | ) | | | (1.26 | ) | | | (1.11 | ) | | | (0.33 | ) | | | (1.08 | ) |
| | | | | |
Total distributions | | | (2.09 | ) | | | (1.63 | ) | | | (1.51 | ) | | | (0.54 | ) | | | (1.36 | ) |
| | | | | |
Net asset value, end of year | | | $18.20 | | | | $16.60 | | | | $19.40 | | | | $17.48 | | | | $17.06 | |
| | | | | |
Total return | | | 22.30% | | | | (6.07)% | | | | 19.90% | | | | 5.77% | | | | (1.27)% | |
| | | | | |
Ratios to average net assets | | | | | | | | | | | | | | | | | | | | |
| | | | | |
Expenses before waiver and payments by affiliatesd | | | 0.37% | | | | 0.36% | | | | 0.31% | | | | 0.30% | | | | 0.29% | |
| | | | | |
Expenses net of waiver and payments by affiliatesd | | | 0.27% | e | | | 0.28% | e | | | 0.25% | e | | | 0.26% | | | | 0.26% | |
| | | | | |
Net investment incomec | | | 1.70% | | | | 1.85% | | | | 1.54% | | | | 1.22% | | | | 1.49% | |
| | | | | |
Supplemental data | | | | | | | | | | | | | | | | | | | | |
| | | | | |
Net assets, end of year (000’s) | | | $4,806 | | | | $4,224 | | | | $3,364 | | | | $2,822 | | | | $2,549 | |
| | | | | |
Portfolio turnover rate | | | 63.65% | | | | 30.79% | | | | 16.90% | | | | 30.19% | | | | 20.40% | |
aThe amount shown for a share outstanding throughout the period may not correlate with the Statement of Operations for the period due to the timing of sales and repurchases of the Fund’s shares in relation to income earned and/or fluctuating fair value of the investments of the Fund.
bBased on average daily shares outstanding.
cRecognition of net investment income by the Fund is affected by the timing of declaration of dividends by the Underlying Funds and exchange traded funds in which the Fund invests.
dDoes not include expenses of the Underlying Funds and exchange traded funds in which the Fund invests. The weighted average indirect expenses of the Underlying Funds and exchange traded funds was 0.40% for the year ended December 31, 2019.
eBenefit of expense reduction rounds to less than 0.01%.
| | | | |
franklintempleton.com | | The accompanying notes are an integral part of these financial statements. | Annual Report | | 39 |
FRANKLIN FUND ALLOCATOR SERIES
FINANCIAL HIGHLIGHTS
Franklin Growth Allocation Fund(continued)
| | | | | | | | | | | | | | | | | | | | |
| | | Year Ended December 31, | |
| | | 2019 | | | 2018 | | | 2017 | | | 2016 | | | 2015 | |
| | | | | |
Advisor Class | | | | | | | | | | | | | | | | | | | | |
| | | | | |
Per share operating performance | | | | | | | | | | | | | | | | | | | | |
(for a share outstanding throughout the year) | | | | | | | | | | | | | | | | | | | | |
| | | | | |
Net asset value, beginning of year | | | $16.61 | | | | $19.42 | | | | $17.49 | | | | $17.06 | | | | $18.62 | |
| | | | | |
Income from investment operationsa: | | | | | | | | | | | | | | | | | | | | |
| | | | | |
Net investment incomeb,c | | | 0.30 | | | | 0.36 | | | | 0.26 | | | | 0.18 | | | | 0.25 | |
| | | | | |
Net realized and unrealized gains (losses) | | | 3.38 | | | | (1.56 | ) | | | 3.15 | | | | 0.76 | | | | (0.47 | ) |
| | | | | |
Total from investment operations | | | 3.68 | | | | (1.20 | ) | | | 3.41 | | | | 0.94 | | | | (0.22 | ) |
| | | | | |
Less distributions from: | | | | | | | | | | | | | | | | | | | | |
| | | | | |
Net investment income and short term gains received from Underlying Funds and exchange traded funds | | | (0.30 | ) | | | (0.35 | ) | | | (0.37 | ) | | | (0.18 | ) | | | (0.26 | ) |
| | | | | |
Net realized gains | | | (1.77 | ) | | | (1.26 | ) | | | (1.11 | ) | | | (0.33 | ) | | | (1.08 | ) |
| | | | | |
Total distributions | | | (2.07 | ) | | | (1.61 | ) | | | (1.48 | ) | | | (0.51 | ) | | | (1.34 | ) |
| | | | | |
Net asset value, end of year | | | $18.22 | | | | $16.61 | | | | $19.42 | | | | $17.49 | | | | $17.06 | |
| | | | | |
Total return | | | 22.22% | | | | (6.23)% | | | | 19.77% | | | | 5.60% | | | | (1.41)% | |
| | | | | |
Ratios to average net assets | | | | | | | | | | | | | | | | | | | | |
| | | | | |
Expenses before waiver and payments by affiliatesd | | | 0.43% | | | | 0.42% | | | | 0.45% | | | | 0.44% | | | | 0.42% | |
| | | | | |
Expenses net of waiver and payments by affiliatesd | | | 0.40% | e | | | 0.40% | e | | | 0.40% | e | | | 0.40% | | | | 0.40% | |
| | | | | |
Net investment incomec | | | 1.57% | | | | 1.73% | | | | 1.39% | | | | 1.08% | | | | 1.35% | |
| | | | | |
Supplemental data | | | | | | | | | | | | | | | | | | | | |
| | | | | |
Net assets, end of year (000’s) | | | $44,684 | | | | $38,685 | | | | $38,912 | | | | $39,211 | | | | $49,634 | |
| | | | | |
Portfolio turnover rate | | | 63.65% | | | | 30.79% | | | | 16.90% | | | | 30.19% | | | | 20.40% | |
aThe amount shown for a share outstanding throughout the period may not correlate with the Statement of Operations for the period due to the timing of sales and repurchases of the Fund’s shares in relation to income earned and/or fluctuating fair value of the investments of the Fund.
bBased on average daily shares outstanding.
cRecognition of net investment income by the Fund is affected by the timing of declaration of dividends by the Underlying Funds and exchange traded funds in which the Fund invests.
dDoes not include expenses of the Underlying Funds and exchange traded funds in which the Fund invests. The weighted average indirect expenses of the Underlying Funds and exchange traded funds was 0.40% for the year ended December 31, 2019.
eBenefit of expense reduction rounds to less than 0.01%.
| | | | |
| | | |
40 | | Annual Report| The accompanying notes are an integral part of these financial statements. | | franklintempleton.com |
FRANKLIN FUND ALLOCATOR SERIES
Statement of Investments, December 31, 2019
Franklin Growth Allocation Fund
| | | | | | | | |
| | | Shares | | | Value | |
| | |
Investments in Underlying Funds and Exchange Traded Funds 99.2% | | | | | | | | |
Domestic Equity 56.3% | | | | | | | | |
a Franklin Growth Fund, Class R6 | | | 1,938,841 | | | $ | 217,731,867 | |
a Franklin LibertyQ U.S. Equity ETF | | | 5,793,581 | | | | 202,717,399 | |
a Franklin Rising Dividends Fund, Class R6 | | | 1,572,908 | | | | 109,395,743 | |
a Franklin U.S. Core Equity (IU) Fund | | | 16,878,335 | | | | 182,117,237 | |
Vanguard S&P 500 ETF | | | 49,250 | | | | 14,568,150 | |
| | | | | | | | |
| | |
| | | | | | | 726,530,396 | |
| | | | | | | | |
| | |
Domestic Fixed Income 17.3% | | | | | | | | |
a Franklin Liberty U.S. Core Bond ETF | | | 4,519,525 | | | | 113,394,431 | |
a Franklin Low Duration Total Return Fund, Class R6 | | | 4,351,944 | | | | 42,170,338 | |
iShares Core U.S. Aggregate Bond ETF | | | 343,119 | | | | 38,556,282 | |
Vanguard Intermediate-Term Corporate Bond ETF | | | 114,455 | | | | 10,453,175 | |
Vanguard Total International Bond ETF | | | 317,698 | | | | 17,975,353 | |
| | | | | | | | |
| | |
| | | | | | | 222,549,579 | |
| | | | | | | | |
| | |
Foreign Equity 23.6% | | | | | | | | |
a Franklin Emerging Market Core Equity (IU) Fund | | | 5,095,917 | | | | 55,698,377 | |
a Franklin FTSE Europe ETF | | | 851,550 | | | | 21,501,637 | |
a Franklin FTSE Japan ETF | | | 411,500 | | | | 10,760,725 | |
a Franklin International Core Equity (IU) Fund | | | 8,716,407 | | | | 96,752,117 | |
a Franklin International Growth Fund, Class R6 | | | 2,516,774 | | | | 41,904,280 | |
a Franklin LibertyQ Emerging Markets ETF | | | 1,175,705 | | | | 35,017,198 | |
a Templeton Foreign Fund, Class R6 | | | 6,078,293 | | | | 43,338,229 | |
| | | | | | | | |
| | |
| | | | | | | 304,972,563 | |
| | | | | | | | |
| | |
Foreign Fixed Income 2.0% | | | | | | | | |
a Franklin Liberty High Yield Corporate ETF | | | 244,401 | | | | 6,399,714 | |
a Templeton Global Total Return Fund, Class R6 | | | 1,725,981 | | | | 19,141,122 | |
| | | | | | | | |
| | |
| | | | | | | 25,540,836 | |
| | | | | | | | |
Total Investments in Underlying Funds and Exchange Traded Funds before Short Term Investments (Cost $1,021,230,223) | | | | | | | 1,279,593,374 | |
| | | | | | | | |
| | |
Short Term Investments 1.1% | | | | | | | | |
| | |
Money Market Funds (Cost $18,251) 0.0%† | | | | | | | | |
a,b Institutional Fiduciary Trust Money Market Portfolio, 1.26% | | | 18,251 | | | | 18,251 | |
| | | | | | | | |
| | | | |
franklintempleton.com | | Annual Report | | 41 |
FRANKLIN FUND ALLOCATOR SERIES
STATEMENT OF INVESTMENTS
Franklin Growth Allocation Fund(continued)
| | | | | | | | |
| | | Principal
Amount | | | Value | |
| | |
Short Term Investments(continued) | | | | | | | | |
| | |
Repurchase Agreements (Cost $13,778,388) 1.1% | | | | | | | | |
cJoint Repurchase Agreement, 1.536%, 1/02/20 (Maturity Value $13,779,564) | | | | | | | | |
BNP Paribas Securities Corp. (Maturity Value $7,555,886) | | | | | | | | |
Deutsche Bank Securities Inc. (Maturity Value $2,445,735) | | | | | | | | |
HSBC Securities (USA) Inc. (Maturity Value $3,777,943) | | | | | | | | |
Collateralized by U.S. Treasury Notes, 1.375% - 2.75%, 9/30/20 - 10/31/24; and U.S. Treasury Notes, | | | | | | | | |
Index Linked, 0.125%, 1/15/23 (valued at $14,061,752) | | $ | 13,778,388 | | | $ | 13,778,388 | |
| | | | | | | | |
Total Investments (Cost $1,035,026,862) 100.3% | | | | | | | 1,293,390,013 | |
Other Assets, less Liabilities (0.3)% | | | | | | | (3,847,688 | ) |
| | | | | | | | |
Net Assets 100.0% | | | | | | $ | 1,289,542,325 | |
| | | | | | | | |
See Abbreviations on page 64.
†Rounds to less than 0.1% of net assets.
aSee Note 3(f) regarding investments in FT Underlying Funds.
bThe rate shown is the annualizedseven-day effective yield at period end.
cSee Note 1(b) regarding joint repurchase agreement.
| | | | |
| | | |
42 | | Annual Report | The accompanying notes are an integral part of these financial statements. | | franklintempleton.com |
FRANKLIN FUND ALLOCATOR SERIES
FINANCIAL STATEMENTS
Statements of Assets and Liabilities
December 31, 2019
| | | | | | | | | | | | |
| | | Franklin
Conservative
Allocation Fund | | | Franklin
Moderate
Allocation Fund | | | Franklin
Growth
Allocation Fund | |
| |
| | | |
Assets: | | | | | | | | | | | | |
Investments in securities: | | | | | | | | | | | | |
Cost - Unaffiliated issuers | | $ | 118,124,824 | | | $ | 186,572,475 | | | $ | 79,450,705 | |
Cost - Controlled affiliates (Note 3f) | | | 317,053,372 | | | | 781,972,674 | | | | 333,282,156 | |
Cost -Non-controlled affiliates (Note 3f) | | | 639,897,239 | | | | 661,102,039 | | | | 608,515,613 | |
Cost - Unaffiliated repurchase agreements | | | 13,100,718 | | | | 18,831,074 | | | | 13,778,388 | |
| | | | |
| | | |
Value - Unaffiliated issuers | | $ | 117,959,692 | | | $ | 189,748,508 | | | $ | 81,552,960 | |
Value - Controlled affiliates (Note 3f) | | | 316,319,572 | | | | 805,937,973 | | | | 356,069,368 | |
| | | |
Value -Non-controlled affiliates (Note 3f) | | | 762,215,747 | | | | 932,194,640 | | | | 841,989,297 | |
Value - Unaffiliated repurchase agreements | | | 13,100,718 | | | | 18,831,074 | | | | 13,778,388 | |
Receivables: | | | | | | | | | | | | |
Capital shares sold | | | 2,087,412 | | | | 3,022,594 | | | | 1,856,809 | |
| | | |
Dividends | | | 1,529,209 | | | | 1,549,844 | | | | 490,786 | |
Other assets | | | 146 | | | | 231 | | | | 148 | |
| | | | |
| | | |
Total assets | | | 1,213,212,496 | | | | 1,951,284,864 | | | | 1,295,737,756 | |
| | | | |
Liabilities: | | | | | | | | | | | | |
Payables: | | | | | | | | | | | | |
Capital shares redeemed | | | 3,178,497 | | | | 6,703,614 | | | | 5,211,853 | |
Asset allocation fees | | | 252,667 | | | | 405,722 | | | | 231,650 | |
Distribution fees | | | 420,706 | | | | 626,699 | | | | 400,539 | |
Transfer agent fees | | | 207,223 | | | | 362,087 | | | | 228,880 | |
Distributions to shareholders | | | — | | | | — | | | | 32,628 | |
Accrued expenses and other liabilities | | | 73,315 | | | | 119,408 | | | | 89,881 | |
| | | | |
| | | |
Total liabilities | | | 4,132,408 | | | | 8,217,530 | | | | 6,195,431 | |
| | | | |
| | | |
Net assets, at value | | $ | 1,209,080,088 | | | $ | 1,943,067,334 | | | $ | 1,289,542,325 | |
| | | | |
Net assets consist of: | | | | | | | | | | | | |
Paid-in capital | | $ | 1,081,922,052 | | | $ | 1,607,625,376 | | | $ | 993,522,699 | |
Total distributable earnings (losses) | | | 127,158,036 | | | | 335,441,958 | | | | 296,019,626 | |
| | | | |
| | | |
Net assets, at value | | $ | 1,209,080,088 | | | $ | 1,943,067,334 | | | $ | 1,289,542,325 | |
| | | | |
| | | | |
franklintempleton.com | | The accompanying notes are an integral part of these financial statements. | Annual Report | | 43 |
FRANKLIN FUND ALLOCATOR SERIES
FINANCIAL STATEMENTS
Statements of Assets and Liabilities(continued)
December 31, 2019
| | | | | | | | | | | | |
| | | Franklin
Conservative
Allocation Fund | | | Franklin
Moderate
Allocation Fund | | | Franklin
Growth
Allocation Fund | |
| | | |
Class A: | | | | | | | | | | | | |
Net assets, at value | | $ | 839,134,366 | | | $ | 1,456,530,882 | | | $ | 974,390,771 | |
| | | | |
Shares outstanding | | | 59,614,953 | | | | 96,580,110 | | | | 53,753,969 | |
| | | | |
Net asset value per sharea | | $ | 14.08 | | | $ | 15.08 | | | $ | 18.13 | |
| | | | |
Maximum offering price per share (net asset value per share ÷ 94.50%) | | $ | 14.90 | | | $ | 15.96 | | | $ | 19.19 | |
| | | | |
Class C: | | | | | | | | | | | | |
Net assets, at value | | $ | 252,406,875 | | | $ | 339,844,964 | | | $ | 202,689,131 | |
| | | | |
Shares outstanding | | | 18,328,535 | | | | 23,277,240 | | | | 11,502,051 | |
| | | | |
Net asset value and maximum offering price per sharea | | $ | 13.77 | | | $ | 14.60 | | | $ | 17.62 | |
| | | | |
Class R: | | | | | | | | | | | | |
Net assets, at value | | $ | 71,153,091 | | | $ | 78,999,482 | | | $ | 62,973,124 | |
| | | | |
Shares outstanding | | | 5,076,148 | | | | 5,247,931 | | | | 3,520,543 | |
| | | | |
Net asset value and maximum offering price per share | | $ | 14.02 | | | $ | 15.05 | | | $ | 17.89 | |
| | | | |
Class R6: | | | | | | | | | | | | |
Net assets, at value | | $ | 2,364,222 | | | $ | 6,665,687 | | | $ | 4,805,671 | |
| | | | |
Shares outstanding | | | 168,198 | | | | 442,083 | | | | 264,052 | |
| | | | |
Net asset value and maximum offering price per share | | $ | 14.06 | | | $ | 15.08 | | | $ | 18.20 | |
| | | | |
Advisor Class: | | | | | | | | | | | | |
Net assets, at value | | $ | 44,021,534 | | | $ | 61,026,319 | | | $ | 44,683,628 | |
| | | | |
Shares outstanding | | | 3,127,468 | | | | 4,042,961 | | | | 2,452,834 | |
| | | | |
Net asset value and maximum offering price per share | | $ | 14.08 | | | $ | 15.09 | | | $ | 18.22 | |
| | | | |
aRedemption price is equal to net asset value less contingent deferred sales charges, if applicable.
| | | | |
| | | |
44 | | Annual Report | The accompanying notes are an integral part of these financial statements. | | franklintempleton.com |
FRANKLIN FUND ALLOCATOR SERIES
FINANCIAL STATEMENTS
Statements of Operations
for the year ended December 31, 2019
| | | | | | | | | | | | |
| | | Franklin
Conservative
Allocation Fund | | | Franklin
Moderate
Allocation Fund | | | Franklin
Growth
Allocation Fund | |
| | | |
Investment income: | | | | | | | | | | | | |
Dividends: | | | | | | | | | | | | |
Unaffiliated issuers | | $ | 4,207,246 | | | $ | 5,344,571 | | | $ | 2,131,934 | |
Controlled affiliates (Note 3f) | | | 2,097,878 | | | | 6,784,666 | | | | 3,179,850 | |
Non-controlled affiliates (Note 3f) | | | 28,441,165 | | | | 34,441,096 | | | | 19,454,964 | |
Interest: | | | | | | | | | | | | |
Unaffiliated issuers | | | 62,749 | | | | 86,303 | | | | 42,412 | |
| | | | |
Total investment income | | | 34,809,038 | | | | 46,656,636 | | | | 24,809,160 | |
| | | | |
Expenses: | | | | | | | | | | | | |
Asset allocation fees (Note 3a) | | | 3,017,887 | | | | 4,828,081 | | | | 3,133,410 | |
Distribution fees: (Note 3c) | | | | | | | | | | | | |
Class A | | | 2,042,171 | | | | 3,533,729 | | | | 2,315,168 | |
Class C | | | 2,719,941 | | | | 3,633,385 | | | | 2,093,140 | |
Class R | | | 386,594 | | | | 431,031 | | | | 345,183 | |
Transfer agent fees: (Note 3e) | | | | | | | | | | | | |
Class A | | | 897,712 | | | | 1,763,033 | | | | 1,458,645 | |
Class C | | | 299,074 | | | | 453,812 | | | | 330,285 | |
Class R | | | 85,038 | | | | 107,650 | | | | 108,928 | |
Class R6 | | | 3,682 | | | | 4,806 | | | | 4,065 | |
Advisor Class | | | 45,959 | | | | 75,014 | | | | 67,467 | |
Custodian fees (Note 4) | | | 951 | | | | 1,199 | | | | 563 | |
Reports to shareholders | | | 72,829 | | | | 139,942 | | | | 110,772 | |
Registration and filing fees | | | 102,287 | | | | 113,907 | | | | 112,206 | |
Professional fees | | | 65,240 | | | | 79,200 | | | | 70,799 | |
Trustees’ fees and expenses | | | 11,380 | | | | 17,994 | | | | 11,584 | |
Other | | | 27,949 | | | | 35,459 | | | | 28,599 | |
| | | | |
Total expenses | | | 9,778,694 | | | | 15,218,242 | | | | 10,190,814 | |
Expense reductions (Note 4) | | | (35 | ) | | | (64 | ) | | | (47 | ) |
Expenses waived/paid by affiliates (Note 3f and 3g) | | | (77,348 | ) | | | (119,660 | ) | | | (434,617 | ) |
| | | | |
Net expenses | | | 9,701,311 | | | | 15,098,518 | | | | 9,756,150 | |
| | | | |
Net investment income | | | 25,107,727 | | | | 31,558,118 | | | | 15,053,010 | |
| | | | |
Realized and unrealized gains (losses):
Net realized gain (loss) from: | | | | | | | | | | | | |
Sale of investments: | | | | | | | | | | | | |
Unaffiliated issuers | | | 7,601,882 | | | | 9,828,242 | | | | 6,613,692 | |
Controlled affiliates (Note 3f) | | | — | | | | (22,417,347 | ) | | | (1,660,298 | ) |
Non-controlled affiliates (Note 3f) | | | 68,693,747 | | | | 196,690,302 | | | | 145,055,591 | |
Capital gain distributions from Underlying Funds: | | | | | | | | | | | | |
Controlled affiliates (Note 3f) | | | 365,023 | | | | 463,593 | | | | 507 | |
Non-controlled affiliates (Note 3f) | | | 6,313,825 | | | | 14,934,838 | | | | 13,265,346 | |
| | | | |
Net realized gain (loss) | | | 82,974,477 | | | | 199,499,628 | | | | 163,274,838 | |
| | | | |
Net change in unrealized appreciation (depreciation) on: | | | | | | | | | | | | |
Investments: | | | | | | | | | | | | |
Unaffiliated issuers | | | (295,410 | ) | | | 2,876,659 | | | | 1,985,610 | |
Controlled affiliates (Note 3f) | | | (733,800 | ) | | | 50,401,544 | | | | 27,345,968 | |
Non-controlled affiliates (Note 3f) | | | 40,737,703 | | | | 20,589,169 | | | | 35,649,934 | |
| | | | |
franklintempleton.com | | The accompanying notes are an integral part of these financial statements. | Annual Report | | 45 |
FRANKLIN FUND ALLOCATOR SERIES
FINANCIAL STATEMENTS
Statements of Operations(continued)
for the year ended December 31, 2019
| | | | | | | | | | | | |
| | | Franklin
Conservative
Allocation Fund | | | Franklin
Moderate
Allocation Fund | | | Franklin
Growth
Allocation Fund | |
Net change in unrealized appreciation (depreciation) | | | $ 39,708,493 | | | | $ 73,867,372 | | | | $ 64,981,512 | |
| | | | |
Net realized and unrealized gain (loss) | | | 122,682,970 | | | | 273,367,000 | | | | 228,256,350 | |
| | | | |
Net increase (decrease) in net assets resulting from operations | | | $147,790,697 | | | | $304,925,118 | | | | $243,309,360 | |
| | | | |
| | | | |
| | | |
46 | | Annual Report| The accompanying notes are an integral part of these financial statements. | | franklintempleton.com |
FRANKLIN FUND ALLOCATOR SERIES
FINANCIAL STATEMENTS
Statements of Changes in Net Assets
| | | | | | | | | | | | | | | | |
| | | Franklin Conservative Allocation Fund | | | Franklin Moderate Allocation Fund | |
| | | Year Ended December 31, | | | Year Ended December 31, | |
| | | 2019 | | | 2018 | | | 2019 | | | 2018 | |
| | | | |
Increase (decrease) in net assets: | | | | | | | | | | | | | | | | |
Operations: | | | | | | | | | | | | | | | | |
Net investment income | | | $ 25,107,727 | | | | $ 30,777,503 | | | | $ 31,558,118 | | | | $ 37,968,817 | |
Net realized gain (loss) | | | 82,974,477 | | | | 46,558,045 | | | | 199,499,628 | | | | 109,263,916 | |
Net change in unrealized appreciation (depreciation) | | | 39,708,493 | | | | (121,175,670 | ) | | | 73,867,372 | | | | (241,567,079 | ) |
| | | | |
Net increase (decrease) in net assets resulting from operations | | | 147,790,697 | | | | (43,840,122 | ) | | | 304,925,118 | | | | (94,334,346 | ) |
| | | | |
Distributions to shareholders: | | | | | | | | | | | | | | | | |
Class A | | | (57,057,141 | ) | | | (56,229,864 | ) | | | (127,472,477 | ) | | | (111,971,367 | ) |
Class C | | | (15,889,976 | ) | | | (20,364,459 | ) | | | (28,361,419 | ) | | | (31,437,636 | ) |
Class R | | | (4,845,238 | ) | | | (5,844,031 | ) | | | (6,940,804 | ) | | | (7,566,500 | ) |
Class R6 | | | (171,894 | ) | | | (170,442 | ) | | | (596,547 | ) | | | (448,472 | ) |
Advisor Class | | | (3,083,117 | ) | | | (2,956,605 | ) | | | (5,530,382 | ) | | | (4,817,371 | ) |
| | | | |
| | | | |
Total distributions to shareholders | | | (81,047,366 | ) | | | (85,565,401 | ) | | | (168,901,629 | ) | | | (156,241,346 | ) |
| | | | |
Capital share transactions: (Note 2) | | | | | | | | | | | | | | | | |
Class A | | | 17,443,983 | | | | 61,562,778 | | | | 41,588,899 | | | | 87,813,396 | |
Class C | | | (49,562,208 | ) | | | (105,523,223 | ) | | | (63,732,864 | ) | | | (139,902,883 | ) |
Class R | | | (13,811,072 | ) | | | (14,649,675 | ) | | | (15,013,845 | ) | | | (20,646,406 | ) |
Class R6 | | | (29,922 | ) | | | 349,050 | | | | 1,178,267 | | | | 1,363,772 | |
Advisor Class | | | 3,905,956 | | | | 3,314,119 | | | | 1,860,972 | | | | 9,886,472 | |
| | | | |
| | | | |
Total capital share transactions | | | (42,053,263 | ) | | | (54,946,951 | ) | | | (34,118,571 | ) | | | (61,485,649 | ) |
| | | | |
Net increase (decrease) in net assets | | | 24,690,068 | | | | (184,352,474 | ) | | | 101,904,918 | | | | (312,061,341 | ) |
Net assets: | | | | | | | | | | | | | | | | |
Beginning of year | | | 1,184,390,020 | | | | 1,368,742,494 | | | | 1,841,162,416 | | | | 2,153,223,757 | |
| | | | |
| | | | |
End of year | | | $1,209,080,088 | | | | $1,184,390,020 | | | | $1,943,067,334 | | | | $1,841,162,416 | |
| | | | |
| | | | |
franklintempleton.com | | The accompanying notes are an integral part of these financial statements. | Annual Report | | 47 |
FRANKLIN FUND ALLOCATOR SERIES
FINANCIAL STATEMENTS
Statements of Changes in Net Assets(continued)
| | | | | | | | |
| | | Franklin Growth Allocation Fund | |
| | | Year Ended December 31, | |
| | | 2019 | | | 2018 | |
| | |
Increase (decrease) in net assets: | | | | | | | | |
Operations: | | | | | | | | |
Net investment income | | | $ 15,053,010 | | | | $ 17,070,481 | |
Net realized gain (loss) | | | 163,274,838 | | | | 77,837,338 | |
Net change in unrealized appreciation (depreciation) | | | 64,981,512 | | | | (176,409,620 | ) |
| | | | |
| | |
Net increase (decrease) in net assets resulting from operations | | | 243,309,360 | | | | (81,501,801 | ) |
| | | | |
Distributions to shareholders: | | | | | | | | |
Class A | | | (98,874,755 | ) | | | (72,770,211 | ) |
Class C | | | (19,758,707 | ) | | | (17,489,220 | ) |
Class R | | | (6,587,169 | ) | | | (6,388,754 | ) |
Class R6 | | | (497,982 | ) | | | (373,760 | ) |
Advisor Class | | | (4,679,908 | ) | | | (3,455,507 | ) |
| | | | |
| | |
Total distributions to shareholders | | | (130,398,521 | ) | | | (100,477,452 | ) |
| | | | |
Capital share transactions: (Note 2) | | | | | | | | |
Class A | | | 55,726,659 | | | | 94,771,993 | |
Class C | | | (24,496,389 | ) | | | (71,389,287 | ) |
Class R | | | (16,283,716 | ) | | | (16,759,033 | ) |
Class R6 | | | 161,696 | | | | 1,538,700 | |
Advisor Class | | | 2,253,086 | | | | 5,901,218 | |
| | | | |
| | |
Total capital share transactions | | | 17,361,336 | | | | 14,063,591 | |
| | | | |
Net increase (decrease) in net assets | | | 130,272,175 | | | | (167,915,662 | ) |
Net assets: | | | | | | | | |
Beginning of year | | | 1,159,270,150 | | | | 1,327,185,812 | |
| | | | |
| | |
End of year | | | $1,289,542,325 | | | | $1,159,270,150 | |
| | | | |
| | | | |
| | | |
48 | | Annual Report| The accompanying notes are an integral part of these financial statements. | | franklintempleton.com |
FRANKLIN FUND ALLOCATOR SERIES
Notes to Financial Statements
1. Organization and Significant Accounting Policies
Franklin Fund Allocator Series (Trust) is registered under the Investment Company Act of 1940 (1940 Act) as anopen-end management investment company, consisting of twenty-five separate funds, three of which are included in this report (Funds) and applies the specialized accounting and reporting guidance in U.S. Generally Accepted Accounting Principles (U.S. GAAP). The Funds invest primarily in mutual funds (Underlying Funds) and exchange traded funds (ETFs), including affiliated funds managed by Franklin Templeton (FT Underlying Funds). The Funds offer five classes of shares: Class A, Class C, Class R, Class R6, and Advisor Class. Class C shares automatically convert to Class A shares after they have been held for 10 years. Each class of shares may differ by its initial sales load, contingent deferred sales charges, voting rights on matters affecting a single class, its exchange privilege and fees due to differing arrangements for distribution and transfer agent fees.
The accounting policies of the Underlying Funds are outlined in their respective shareholder reports. A copy of the Underlying Funds’ shareholder reports, in which each Fund invests, is available on the U.S. Securities and Exchange Commission (SEC) website at sec.gov. The Underlying Funds’ shareholder reports are not covered by this report.
The following summarizes the Funds’ significant accounting policies.
a. Financial Instrument Valuation
The Funds’ investments in financial instruments are carried at fair value daily. Fair value is the price that would be received to sell an asset or paid to transfer a liability in an orderly transaction between market participants on the measurement date. The Funds calculate the net asset value (NAV) per share each business day as of 4 p.m. Eastern time or the regularly scheduled close of the New York Stock Exchange (NYSE), whichever is earlier. Under compliance policies and procedures approved by the Trust’s Board of Trustees (the Board), the Funds’ administrator has responsibility for oversight of valuation, including leading the cross-functional Valuation Committee (VC). The Funds may utilize independent pricing services, quotations from securities and financial instrument dealers, and other market sources to determine fair value.
Investments in the Underlying Funds are valued at their closing NAV each trading day. ETFs listed on an exchange or on the NASDAQ National Market System are valued at the last quoted sale price or the official closing price of the day, respectively.
Investments in repurchase agreements are valued at cost, which approximates fair value.
b. Joint Repurchase Agreement
Certain or all Funds enter into a joint repurchase agreement whereby their uninvested cash balance is deposited into a joint cash account with other funds managed by the investment manager or an affiliate of the investment manager and is used to invest in one or more repurchase agreements. The value and face amount of the joint repurchase agreement are allocated to the funds based on theirpro-rata interest. A repurchase agreement is accounted for as a loan by the Fund to the seller, collateralized by securities which are delivered to the Funds’ custodian. The fair value, including accrued interest, of the initial collateralization is required to be at least 102% of the dollar amount invested by the funds, with the value of the underlying securities marked to market daily to maintain coverage of at least 100%. Repurchase agreements are subject to the terms of Master Repurchase Agreements (MRAs) with approved counterparties (sellers). The MRAs contain various provisions, including but not limited to events of default and maintenance of collateral for repurchase agreements. In the event of default by either the seller or the Funds, certain MRAs may permit thenon-defaulting party to net andclose-out all transactions, if any, traded under such agreements. The Funds may sell securities it holds as collateral and apply the proceeds towards the repurchase price and any other amounts owed by the seller to the Funds in the event of default by the seller. This could involve costs or delays in addition to a loss on the securities if their value falls below the repurchase price owed by the seller. The joint repurchase agreement held by the Funds at year end, as indicated in the Statements of Investments, had been entered into on December 31, 2019.
c. Income Taxes
It is each Fund’s policy to qualify as a regulated investment company under the Internal Revenue Code. Each Fund intends to distribute to shareholders substantially all of its taxable income and net realized gains to relieve it from federal income and excise taxes. As a result, no provision for U.S. federal income taxes is required.
| | | | |
franklintempleton.com | | Annual Report | | 49 |
FRANKLIN FUND ALLOCATOR SERIES
NOTES TO FINANCIAL STATEMENTS
1. Organization and Significant Accounting Policies (continued)
c. Income Taxes (continued)
Each Fund may recognize an income tax liability related to its uncertain tax positions under U.S. GAAP when the uncertain tax position has a less than 50% probability that it will be sustained upon examination by the tax authorities based on its technical merits. As of December 31, 2019, each Fund has determined that no tax liability is required in its financial statements related to uncertain tax positions for any open tax years (or expected to be taken in future tax years). Open tax years are those that remain subject to examination and are based on the statute of limitations in each jurisdiction in which the Fund invests.
d. Security Transactions, Investment Income, Expenses and Distributions
Security transactions are accounted for on trade date. Realized gains and losses on security transactions are determined on a specific identification basis. Interest income and estimated expenses are accrued daily. Dividend income and realized gain distributions by Underlying Funds and ETFs are recorded on theex-dividend date. Distributions to shareholders are recorded on theex-dividend date. Distributable earnings are determined according to income tax regulations (tax basis) and may differ from earnings recorded in accordance with U.S. GAAP. These differences may be permanent or temporary. Permanent differences are reclassified among capital accounts to reflect their tax character. These reclassifications have no impact on net assets or the results of operations. Temporary differences are not reclassified, as they may reverse in subsequent periods.
Common expenses incurred by the Trust are allocated among the Funds based on the ratio of net assets of each Fund to the combined net assets of the Trust or based on the ratio of number of shareholders of each Fund to the combined number of shareholders of the Trust. Fund specific expenses are charged directly to the Fund that incurred the expense.
The Funds indirectly bear their proportionate share of expenses from the Underlying Funds and ETFs. Since the Underlying Funds and ETFs have varied expense levels and the Funds may own different proportions of the Underlying Funds and ETFs at different times, the amount of expenses incurred indirectly by the Funds will vary.
Realized and unrealized gains and losses and net investment income, excluding class specific expenses, are allocated daily to each class of shares based upon the relative proportion of net assets of each class. Differences in per share distributions by class are generally due to differences in class specific expenses.
e. Accounting Estimates
The preparation of financial statements in accordance with U.S. GAAP requires management to make estimates and assumptions that affect the reported amounts of assets and liabilities at the date of the financial statements and the amounts of income and expenses during the reporting period. Actual results could differ from those estimates.
f. Guarantees and Indemnifications
Under the Trust’s organizational documents, its officers and trustees are indemnified by the Trust against certain liabilities arising out of the performance of their duties to the Trust. Additionally, in the normal course of business, the Trust, on behalf of the Funds, enters into contracts with service providers that contain general indemnification clauses. The Trust’s maximum exposure under these arrangements is unknown as this would involve future claims that may be made against the Trust that have not yet occurred. Currently, the Trust expects the risk of loss to be remote.
| | | | |
| | | |
50 | | Annual Report | | franklintempleton.com |
FRANKLIN FUND ALLOCATOR SERIES
NOTES TO FINANCIAL STATEMENTS
2. Shares of Beneficial Interest
At December 31, 2019, there were an unlimited number of shares authorized (without par value). Transactions in the Funds’ shares were as follows:
| | | | | | | | | | | | | | | | | | | | |
| | | Franklin Conservative Allocation Fund | | | | | | Franklin Moderate Allocation Fund | |
| | | | |
| | | | | |
| | | Shares | | | Amount | | | | | | Shares | | | Amount | |
| |
| | | | | |
Class A Shares: | | | | | | | | | | | | | | | | | | | | |
| | | | | |
Year ended December 31, 2019 | | | | | | | | | | | | | | | | | | | | |
| | | | | |
Shares solda | | | 9,240,415 | | | $ | 132,372,358 | | | | | | | | 11,595,147 | | | $ | 178,905,379 | |
| | | | | |
Shares issued in reinvestment of distributions | | | 3,951,904 | | | | 55,815,055 | | | | | | | | 8,307,144 | | | | 125,651,819 | |
| | | | | |
Shares redeemed | | | (11,945,088 | ) | | | (170,743,430 | ) | | | | | | | (17,069,619 | ) | | | (262,968,299) | |
| | | | |
| | | | | |
Net increase (decrease) | | | 1,247,231 | | | $ | 17,443,983 | | | | | | | | 2,832,672 | | | $ | 41,588,899 | |
| | | | |
| | | | | |
Year ended December 31, 2018 | | | | | | | | | | | | | | | | | | | | |
| | | | | |
Shares solda | | | 12,081,764 | | | $ | 177,443,374 | | | | | | | | 15,523,200 | | | $ | 248,179,398 | |
| | | | | |
Shares issued in reinvestment of distributions | | | 4,034,542 | | | | 55,016,697 | | | | | | | | 7,649,537 | | | | 110,163,010 | |
| | | | | |
Shares redeemed | | | (11,598,052 | ) | | | (170,897,293 | ) | | | | | | | (16,830,686 | ) | | | (270,529,012) | |
| | | | |
| | | | | |
Net increase (decrease) | | | 4,518,254 | | | $ | 61,562,778 | | | | | | | | 6,342,051 | | | $ | 87,813,396 | |
| | | | |
| | | | | |
Class C Shares: | | | | | | | | | | | | | | | | | | | | |
| | | | | |
Year ended December 31, 2019 | | | | | | | | | | | | | | | | | | | | |
| | | | | |
Shares sold | | | 2,306,121 | | | $ | 32,284,847 | | | | | | | | 2,880,868 | | | $ | 43,190,637 | |
| | | | | |
Shares issued in reinvestment of distributions | | | 1,119,382 | | | | 15,451,899 | | | | | | | | 1,903,555 | | | | 27,852,917 | |
| | | | | |
Shares redeemeda | | | (6,958,708 | ) | | | (97,298,954 | ) | | | | | | | (9,018,336 | ) | | | (134,776,418) | |
| | | | |
| | | | | |
Net increase (decrease) | | | (3,533,205 | ) | | $ | (49,562,208 | ) | | | | | | | (4,233,913 | ) | | $ | (63,732,864) | |
| | | | |
| | | | | |
Year ended December 31, 2018 | | | | | | | | | | | | | | | | | | | | |
| | | | | |
Shares sold | | | 2,785,956 | | | $ | 40,367,570 | | | | | | | | 4,101,280 | | | $ | 64,134,250 | |
| | | | | |
Shares issued in reinvestment of distributions | | | 1,481,552 | | | | 19,810,147 | | | | | | | | 2,206,819 | | | | 30,776,943 | |
| | | | | |
Shares redeemeda | | | (11,501,386 | ) | | | (165,700,940 | ) | | | | | | | (15,077,289 | ) | | | (234,814,076) | |
| | | | |
| | | | | |
Net increase (decrease) | | | (7,233,878 | ) | | $ | (105,523,223 | ) | | | | | | | (8,769,190 | ) | | $ | (139,902,883) | |
| | | | |
| | | | | |
Class R Shares: | | | | | | | | | | | | | | | | | | | | |
| | | | | |
Year ended December 31, 2019 | | | | | | | | | | | | | | | | | | | | |
| | | | | |
Shares sold | | | 810,137 | | | $ | 11,581,508 | | | | | | | | 590,710 | | | $ | 9,051,968 | |
| | | | | |
Shares issued in reinvestment of distributions | | | 340,829 | | | | 4,792,738 | | | | | | | | 452,084 | | | | 6,824,543 | |
| | | | | |
Shares redeemed | | | (2,124,391 | ) | | | (30,185,318 | ) | | | | | | | (2,012,772 | ) | | | (30,890,356) | |
| | | | |
| | | | | |
Net increase (decrease) | | | (973,425 | ) | | $ | (13,811,072) | | | | | | | | (969,978 | ) | | $ | (15,013,845) | |
| | | | |
| | | | | |
Year ended December 31, 2018 | | | | | | | | | | | | | | | | | | | | |
| | | | | |
Shares sold | | | 765,914 | | | $ | 11,297,144 | | | | | | | | 749,501 | | | $ | 12,083,262 | |
| | | | | |
Shares issued in reinvestment of distributions | | | 407,765 | | | | 5,547,093 | | | | | | | | 515,960 | | | | 7,427,656 | |
| | | | | |
Shares redeemed | | | (2,125,473 | ) | | | (31,493,912 | ) | | | | | | | (2,507,518 | ) | | | (40,157,324) | |
| | | | |
| | | | | |
Net increase (decrease) | | | (951,794 | ) | | $ | (14,649,675 | ) | | | | | | | (1,242,057 | ) | | $ | (20,646,406) | |
| | | | |
| | | | |
franklintempleton.com | | Annual Report | | 51 |
FRANKLIN FUND ALLOCATOR SERIES
NOTES TO FINANCIAL STATEMENTS
2. Shares of Beneficial Interest(continued)
| | | | | | | | | | | | | | | | | | | | |
| | | Franklin Conservative
Allocation Fund | | | | | | Franklin Moderate
Allocation Fund | |
| | | | |
| | | | | |
| | | Shares | | | Amount | | | | | | Shares | | | Amount | |
| |
| | | | | |
Class R6 Shares: | | | | | | | | | | | | | | | | | | | | |
| | | | | |
Year ended December 31, 2019 | | | | | | | | | | | | | | | | | | | | |
| | | | | |
Shares sold | | | 60,936 | | | $ | 868,835 | | | | | | | | 125,617 | | | $ | 1,956,765 | |
| | | | | |
Shares issued in reinvestment of distributions | | | 12,180 | | | | 171,894 | | | | | | | | 39,446 | | | | 596,547 | |
| | | | | |
Shares redeemed | | | (74,119 | ) | | | (1,070,651 | ) | | | | | | | (88,644 | ) | | | (1,375,045 | ) |
| | | | |
| | | | | |
Net increase (decrease) | | | (1,003 | ) | | $ | (29,922) | | | | | | | | 76,419 | | | $ | 1,178,267 | |
| | | | |
| | | | | |
Year ended December 31, 2018 | | | | | | | | | | | | | | | | | | | | |
| | | | | |
Shares sold | | | 44,331 | | | $ | 662,423 | | | | | | | | 82,180 | | | $ | 1,341,854 | |
| | | | | |
Shares issued in reinvestment of distributions | | | 12,483 | | | | 170,442 | | | | | | | | 31,050 | | | | 448,472 | |
| | | | | |
Shares redeemed | | | (32,381 | ) | | | (483,815 | ) | | | | | | | (26,491 | ) | | | (426,554 | ) |
| | | | |
| | | | | |
Net increase (decrease) | | | 24,433 | | | $ | 349,050 | | | | | | | | 86,739 | | | $ | 1,363,772 | |
| | | | |
Advisor Class Shares: | | | | | | | | | | | | | | | | | | | | |
| | | | | |
Year ended December 31, 2019 | | | | | | | | | | | | | | | | | | | | |
| | | | | |
Shares sold | | | 1,226,806 | | | $ | 17,518,543 | | | | | | | | 1,350,825 | | | $ | 20,876,845 | |
| | | | | |
Shares issued in reinvestment of distributions | | | 194,739 | | | | 2,751,084 | | | | | | | | 325,037 | | | | 4,922,110 | |
| | | | | |
Shares redeemed | | | (1,146,606 | ) | | | (16,363,671 | ) | | | | | | | (1,544,989 | ) | | | (23,937,983 | ) |
| | | | |
| | | | | |
Net increase (decrease) | | | 274,939 | | | $ | 3,905,956 | | | | | | | | 130,873 | | | $ | 1,860,972 | |
| | | | |
| | | | | |
Year ended December 31, 2018 | | | | | | | | | | | | | | | | | | | | |
| | | | | |
Shares sold | | | 1,351,389 | | | $ | 19,964,830 | | | | | | | | 2,127,729 | | | $ | 34,069,063 | |
| | | | | |
Shares issued in reinvestment of distributions | | | 187,101 | | | | 2,560,700 | | | | | | | | 294,731 | | | | 4,257,371 | |
| | | | | |
Shares redeemed | | | (1,306,194 | ) | | | (19,211,411 | ) | | | | | | | (1,771,687 | ) | | | (28,439,962 | ) |
| | | | |
| | | | | |
Net increase (decrease) | | | 232,296 | | | $ | 3,314,119 | | | | | | | | 650,773 | | | $ | 9,886,472 | |
| | | | |
aMay include a portion of Class C shares that were automatically converted to Class A.
| | | | | | | | |
| | | Franklin Growth | |
| | | Allocation Fund | |
| | | | |
| | |
| | | Shares | | | Amount | |
| |
| | |
Class A Shares: | | | | | | | | |
| | |
Year ended December 31, 2019 | | | | | | | | |
| | |
Shares solda | | | 6,259,778 | | | $ | 116,026,941 | |
| | |
Shares issued in reinvestment of distributions | | | 5,381,223 | | | | 97,592,988 | |
| | |
Shares redeemed | | | (8,509,421 | ) | | | (157,893,270) | |
| | | | |
| | |
Net increase (decrease) | | | 3,131,580 | | | $ | 55,726,659 | |
| | | | |
| | |
Year ended December 31, 2018 | | | | | | | | |
| | |
Shares solda | | | 9,411,831 | | | $ | 181,419,633 | |
| | |
Shares issued in reinvestment of distributions | | | 4,261,084 | | | | 71,799,771 | |
| | |
Shares redeemed | | | (8,184,666 | ) | | | (158,447,411) | |
| | | | |
| | |
Net increase (decrease) | | | 5,488,249 | | | $ | 94,771,993 | |
| | | | |
| | | | |
| | | |
52 | | Annual Report | | franklintempleton.com |
FRANKLIN FUND ALLOCATOR SERIES
NOTES TO FINANCIAL STATEMENTS
| | | | | | | | |
| | | Franklin Growth | |
| | | Allocation Fund | |
| | | | |
| | |
| | | Shares | | | Amount | |
| |
| | |
Class C Shares: | | | | | | | | |
| | |
Year ended December 31, 2019 | | | | | | | | |
| | |
Shares sold | | | 1,388,707 | | | $ | 24,985,521 | |
| | |
Shares issued in reinvestment of distributions | | | 1,107,638 | | | | 19,536,755 | |
| | |
Shares redeemeda | | | (3,831,975 | ) | | | (69,018,665 | ) |
| | | | |
| | |
Net increase (decrease) | | | (1,335,630 | ) | | $ | (24,496,389 | ) |
| | | | |
| | |
Year ended December 31, 2018 | | | | | | | | |
| | |
Shares sold | | | 2,290,945 | | | $ | 43,225,242 | |
| | |
Shares issued in reinvestment of distributions | | | 1,040,994 | | | | 17,275,116 | |
| | |
Shares redeemeda | | | (7,057,658 | ) | | | (131,889,645 | ) |
| | | | |
| | |
Net increase (decrease) | | | (3,725,719 | ) | | $ | (71,389,287 | ) |
| | | | |
| | |
Class R Shares: | | | | | | | | |
| | |
Year ended December 31, 2019 | | | | | | | | |
| | |
Shares sold | | | 361,071 | | | $ | 6,612,171 | |
| | |
Shares issued in reinvestment of distributions | | | 365,944 | | | | 6,550,138 | |
| | |
Shares redeemed | | | (1,619,946 | ) | | | (29,446,025 | ) |
| | | | |
| | |
Net increase (decrease) | | | (892,931 | ) | | $ | (16,283,716 | ) |
| | | | |
| | |
Year ended December 31, 2018 | | | | | | | | |
| | |
Shares sold | | | 469,006 | | | $ | 9,011,111 | |
| | |
Shares issued in reinvestment of distributions | | | 372,999 | | | | 6,239,723 | |
| | |
Shares redeemed | | | (1,677,731 | ) | | | (32,009,867 | ) |
| | | | |
| | |
Net increase (decrease) | | | (835,726 | ) | | $ | (16,759,033 | ) |
| | | | |
| | |
Class R6 Shares: | | | | | | | | |
| | |
Year ended December 31, 2019 | | | | | | | | |
| | |
Shares sold | | | 27,196 | | | $ | 506,243 | |
| | |
Shares issued in reinvestment of distributions | | | 27,338 | | | | 497,982 | |
| | |
Shares redeemed | | | (45,001 | ) | | | (842,529 | ) |
| | | | |
| | |
Net increase (decrease) | | | 9,533 | | | $ | 161,696 | |
| | | | |
| | |
Year ended December 31, 2018 | | | | | | | | |
| | |
Shares sold | | | 71,669 | | | $ | 1,412,310 | |
| | |
Shares issued in reinvestment of distributions | | | 22,158 | | | | 373,761 | |
| | |
Shares redeemed | | | (12,701 | ) | | | (247,371 | ) |
| | | | |
| | |
Net increase (decrease) | | | 81,126 | | | $ | 1,538,700 | |
| | | | |
| | | | |
franklintempleton.com | | Annual Report | | 53 |
FRANKLIN FUND ALLOCATOR SERIES
NOTES TO FINANCIAL STATEMENTS
2. Shares of Beneficial Interest(continued)
| | | | | | | | |
| | | Franklin Growth | |
| | | Allocation Fund | |
| | | | |
| | |
| | | Shares | | | Amount | |
| |
| | |
Advisor Class Shares: | | | | | | | | |
| | |
Year ended December 31, 2019 | | | | | | | | |
| | |
Shares sold | | | 521,307 | | | $ | 9,751,537 | |
| | |
Shares issued in reinvestment of distributions | | | 211,955 | | | | 3,863,038 | |
| | |
Shares redeemed | | | (609,204 | ) | | | (11,361,489 | ) |
| | | | |
| | |
Net increase (decrease) | | | 124,058 | | | $ | 2,253,086 | |
| | | | |
| | |
Year ended December 31, 2018 | | | | | | | | |
| | |
Shares sold | | | 665,107 | | | $ | 12,993,054 | |
| | |
Shares issued in reinvestment of distributions | | | 169,710 | | | | 2,869,802 | |
| | |
Shares redeemed | | | (509,652 | ) | | | (9,961,638 | ) |
| | | | |
| | |
Net increase (decrease) | | | 325,165 | | | $ | 5,901,218 | |
| | | | |
aMay include a portion of Class C shares that were automatically converted to Class A.
3. Transactions with Affiliates
Franklin Resources, Inc. is the holding company for various subsidiaries that together are referred to as Franklin Templeton. Certain officers and trustees of the Funds are also officers and/or directors/trustees of certain of the FT Underlying Funds and of the following subsidiaries:
| | |
| Subsidiary | | Affiliation |
Franklin Advisers, Inc. (Advisers) | | Investment manager |
Franklin Templeton Services, LLC (FT Services) | | Administrative manager |
Franklin Templeton Distributors, Inc. (Distributors) | | Principal underwriter |
Franklin Templeton Investor Services, LLC (Investor Services) | | Transfer agent |
a. Asset Allocation Fees
The Funds pay an asset allocation fee to Advisers of 0.25% per year of the average daily net assets of each of the Funds for investment advisory services, consisting principally of determining the allocation of assets of the Funds among the Underlying Funds and ETFs.
b. Administrative Fees
Under an agreement with Advisers, FT Services provides administrative services to the Funds and is not paid by the Funds for the services.
c. Distribution Fees
The Board has adopted distribution plans for each share class, with the exception of Class R6 and Advisor Class shares, pursuant to Rule12b-1 under the 1940 Act. Under the Funds’ Class A reimbursement distribution plans, the Funds reimburse Distributors for costs incurred in connection with the servicing, sale and distribution of each Fund’s shares up to the maximum annual plan rate. Under the Class A reimbursement distribution plans, costs exceeding the maximum for the current plan year cannot be reimbursed in subsequent periods. In addition, under the Funds’ Class C and R compensation distribution plans, the
| | | | |
| | | |
54 | | Annual Report | | franklintempleton.com |
FRANKLIN FUND ALLOCATOR SERIES
NOTES TO FINANCIAL STATEMENTS
Funds pay Distributors for costs incurred in connection with the servicing, sale and distribution of each Fund’s shares up to the maximum annual plan rate for each class. The plan year, for purposes of monitoring compliance with the maximum annual plan rates, is February 1 through January 31 for each Fund.
The maximum annual plan rates, based on the average daily net assets, for each class, are as follows:
| | | | |
Class A | | | 0.25% | |
Class C | | | 1.00% | |
Class R | | | 0.50% | |
d. Sales Charges/Underwriting Agreements
Front-end sales charges and contingent deferred sales charges (CDSC) do not represent expenses of the Funds. These charges are deducted from the proceeds of sales of fund shares prior to investment or from redemption proceeds prior to remittance, as applicable. Distributors has advised the Funds of the following commission transactions related to the sales and redemptions of the Funds’ shares for the year:
| | | | | | | | | | | | |
| | | Franklin
Conservative
Allocation Fund | | | Franklin
Moderate
Allocation Fund | | | Franklin
Growth
Allocation Fund | |
| |
Sales charges retained net of commissions paid to unaffiliated brokers/dealers | | $ | 142,345 | | | $ | 237,377 | | | $ | 213,154 | |
CDSC retained | | $ | 12,194 | | | $ | 20,387 | | | $ | 13,975 | |
e. Transfer Agent Fees
Each class of shares pays transfer agent fees to Investor Services for its performance of shareholder servicing obligations. The fees are based on an annualized asset based fee of 0.02% plus a transaction based fee. In addition, each class reimburses Investor Services for out of pocket expenses incurred and, except for Class R6, reimburses shareholder servicing fees paid to third parties. These fees are allocated daily based upon their relative proportion of such classes’ aggregate net assets. Class R6 pays Investor Services transfer agent fees specific to that class.
For the year ended December 31, 2019, the Funds paid transfer agent fees as noted in the Statements of Operations of which the following amounts were retained by Investor Services:
| | | | | | | | | | | | |
| | | Franklin
Conservative
Allocation Fund | | | Franklin
Moderate
Allocation Fund | | | Franklin
Growth
Allocation Fund | |
| |
Transfer agent fees | | $ | 668,108 | | | $ | 1,260,243 | | | $ | 1,080,632 | |
f. Investments in FT Underlying Funds
The Funds invest primarily in FT Underlying Funds which are managed by Advisers (or by an affiliate of Advisers). The Funds do not invest in FT Underlying Funds for the purpose of exercising a controlling influence over the management or policies. Asset allocation fees paid by the Funds are waived on assets invested in Institutional Fiduciary Trust Money Market Portfolio (Sweep Money Fund), as noted in the Statements of Operations, in an amount not to exceed the management and administrative fees paid directly or indirectly by the Sweep Money Fund.
| | | | |
franklintempleton.com | | Annual Report | | 55 |
FRANKLIN FUND ALLOCATOR SERIES
NOTES TO FINANCIAL STATEMENTS
3. Transactions with Affiliates(continued)
f. Investments in FT Underlying Funds(continued)
Investments in FT Underlying Funds for the year ended December 31, 2019, were as follows:
| | | | | | | | | | | | | | | | | | | | | | | | | | | | | | | | |
| | | Value at
Beginning of
Year | | | Purchases | | | Sales | | | Realized
Gain (Loss) | | | Net Change in
Unrealized
Appreciation
(Depreciation) | | | Value at
End of
Year | | | Number of
Shares
Held at End
of Year | | | Dividend
Income | |
| |
Franklin Conservative Allocation Fund
Controlled Affiliates | | | | | | | | | | | | | | | | | | | | | |
Franklin Liberty High Yield Corporate ETF | | $ | — | | | $ | 18,436,532 | | | $ | — | | | $ | — | | | $ | 232,775 | | | $ | 18,669,307 | | | | 712,969 | | | $ | 308,591 | a |
Franklin Liberty U.S. Core Bond ETF | | | — | | | | 298,616,840 | | | | — | | | | — | | | | (966,575 | ) | | | 297,650,265 | | | | 11,863,350 | | | | 2,154,310 | a |
| | | | | | | | | | | | |
Total Controlled Affiliates | | $ | — | | | $ | 317,053,372 | | | $ | — | | | $ | — | | | $ | (733,800 | ) | | $ | 316,319,572 | | | | | | | $ | 2,462,901 | |
| | | | | | | | | | | | |
| | | | | | |
Non-Controlled Affiliates | | | | | | | | | | | | | | | | | | | | | | | | | |
Franklin DynaTech Fund, Class R6 | | | 56,915,523 | | | | 302,942 | | | | (71,706,460 | ) | | | 40,783,321 | | | | (26,295,326 | ) | | | — | b | | | — | | | | — | |
Franklin Emerging Market Core Equity (IU) Fund | | | — | | | | 25,040,066 | | | | — | | | | — | | | | 1,124,015 | | | | 26,164,081 | | | | 2,393,786 | | | | 106,060 | a |
Franklin Emerging Market Debt Opportunities Fund | | | 37,597,752 | | | | 11,711 | | | | (37,967,811 | ) | | | (3,544,417 | ) | | | 3,902,765 | | | | — | b | | | — | | | | — | |
Franklin Floating Rate Daily Access Fund, Class R6 | | | 41,605,935 | | | | 1,296,080 | | | | (43,492,018 | ) | | | (1,527,178 | ) | | | 2,117,181 | | | | — | b | | | — | | | | 148,347 | |
Franklin FTSE Europe ETF | | | 10,800,877 | | | | 6,176,470 | | | | (9,126,847 | ) | | | (863,618 | ) | | | 2,781,207 | | | | 9,768,089 | | | | 386,855 | | | | 401,818 | |
Franklin FTSE Japan ETF | | | 11,525,783 | | | | 59,088 | | | | (7,897,394 | ) | | | (1,423,984 | ) | | | 2,625,433 | | | | 4,888,926 | | | | 186,957 | | | | 134,107 | |
Franklin Growth Fund, Class R6 | | | 119,464,184 | | | | 8,737,619 | | | | (51,862,566 | ) | | | 21,187,490 | | | | 3,426,701 | | | | 100,953,428 | | | | 898,962 | | | | 5,912,984 | a |
Franklin International Core Equity (IU) Fund | | | — | | | | 40,809,398 | | | | — | | | | — | | | | 3,348,382 | | | | 44,157,780 | | | | 3,978,178 | | | | 467,700 | |
Franklin International Growth Fund, Class R6 | | | — | | | | 18,357,272 | | | | (2,082,168 | ) | | | 162,651 | | | | 2,183,051 | | | | 18,620,806 | | | | 1,118,367 | | | | 81,171 | |
Franklin International Small Cap Fund, Class R6 | | | 25,613,745 | | | | 2,793,031 | | | | (30,426,985 | ) | | | 3,812,825 | | | | (1,792,616 | ) | | | — | b | | | — | | | | — | |
Franklin Liberty Investment Grade Corporate ETF | | | — | | | | 60,157,857 | | | | — | | | | — | | | | (30,246 | ) | | | 60,127,611 | | | | 2,344,650 | | | | 438,449 | a |
Franklin LibertyQ Emerging Markets ETF | | | 33,210,679 | | | | 11,749,528 | | | | (30,707,261 | ) | | | 1,995,087 | | | | 200,896 | | | | 16,448,929 | | | | 552,274 | | | | 1,243,970 | |
| | | | |
| | | |
56 | | Annual Report | | franklintempleton.com |
FRANKLIN FUND ALLOCATOR SERIES
NOTES TO FINANCIAL STATEMENTS
| | | | | | | | | | | | | | | | | | | | | | | | | | | | | | | | |
| | | Value at
Beginning
of Year | | | Purchases | | | Sales | | | Realized
Gain (Loss) | | | Net Change in
Unrealized
Appreciation
(Depreciation) | | | Value at End of Year | | | Number of
Shares
Held at End
of Year | | | Dividend
Income | |
| |
| Franklin Conservative Allocation Fund(continued) | | | | | | | | | | | | | | | | | | | | | | | | | |
Non-Controlled Affiliates(continued) | | | | | | | | | | | | | | | | | | | | | |
Franklin LibertyQ U.S. Equity ETF | | $ | 62,074,238 | | | $ | 29,409,143 | | | $ | (14,827,272 | ) | | $ | (104,894 | ) | | $ | 18,888,839 | | | $ | 95,440,054 | | | | 2,727,638 | | | $ | 1,704,661 | |
Franklin Low Duration Total Return Fund, Class R6 | | | 182,843,581 | | | | 134,871,178 | | | | (144,549,582 | ) | | | (3,818,761 | ) | | | 5,656,712 | | | | 175,003,128 | | | | 18,060,178 | | | | 7,991,281 | |
Franklin Mutual European Fund, Class R6 | | | 20,039,889 | | | | 679,506 | | | | (23,337,160 | ) | | | 4,749,641 | | | | (2,131,876 | ) | | | — | b | | | — | | | | — | |
Franklin Pelagos Commodities Strategy Fund, Class R6 | | | 58,924,603 | | | | 3,217,645 | | | | (62,835,507 | ) | | | (11,254,126 | ) | | | 11,947,385 | | | | — | b | | | — | | | | 373,425 | |
Franklin Rising Dividends Fund, Class R6 | | | 64,774,725 | | | | 3,212,295 | | | | (30,552,090 | ) | | | 8,039,086 | | | | 5,046,687 | | | | 50,520,703 | | | | 726,394 | | | | 1,683,429 | a |
Franklin Strategic Income Fund, Class R6 | | | 117,609,696 | | | | 5,179,664 | | | | (126,654,877 | ) | | | 497,142 | | | | 3,368,375 | | | | — | b | | | — | | | | 2,168,323 | |
Franklin U.S. Core Equity (IU) Fund | | | — | | | | 80,146,619 | | | | — | | | | — | | | | 5,592,967 | | | | 85,739,586 | | | | 7,946,208 | | | | 489,962 | |
Franklin U.S. Government Securities Fund, Class R6 | | | 164,661,149 | | | | 85,355,091 | | | | (256,765,100 | ) | | | (1,556,145 | ) | | | 8,305,005 | | | | — | b | | | — | | | | 4,799,501 | |
Franklin Utilities Fund, Class R6 | | | 22,357,316 | | | | 589,722 | | | | (26,168,402 | ) | | | 11,513,252 | | | | (8,291,888 | ) | | | — | b | | | — | | | | 262,392 | |
Institutional Fiduciary | | | | | | | | | | | | | | | | | | | | | | | | | | | | | | | | |
Trust Money Market Portfolio, 1.26% | | | 35,798 | | | | 223,660,619 | | | | (223,680,203 | ) | | | — | | | | — | | | | 16,214 | | | | 16,214 | | | | 562,849 | |
Templeton Foreign Fund, Class R6 | | | 35,923,843 | | | | 1,617,478 | | | | (21,371,641 | ) | | | 1,618,475 | | | | 1,039,821 | | | | 18,827,976 | | | | 2,640,670 | | | | 691,934 | |
Templeton Global Total Return Fund, Class R6 | | | 81,260,291 | | | | 9,332,848 | | | | (31,206,836 | ) | | | (1,572,100 | ) | | | (2,275,767 | ) | | | 55,538,436 | | | | 5,007,975 | | | | 5,092,627 | |
| | | | | | | | | | | | |
Total Non- Controlled Affiliates | | $ | 1,147,239,607 | | | $ | 752,762,870 | | | $ | (1,247,218,180 | ) | | $ | 68,693,747 | | | $ | 40,737,703 | | | $ | 762,215,747 | | | | | | | $ | 34,754,990 | |
| | | | | | | | | | | | |
Total Affiliated Securities | | $ | 1,147,239,607 | | | $ | 1,069,816,242 | | | $ | (1,247,218,180 | ) | | $ | 68,693,747 | | | $ | 40,003,903 | | | $ | 1,078,535,319 | | | | | | | $ | 37,217,891 | |
| | | | | | | | | | | | |
| | | | | |
Franklin Moderate Allocation Fund | | | | | | | | | | | | | | | | | | | | | |
| | | | | | |
Controlled Affiliates | | | | | | | | | | | | | | | | | | | | | | | | | |
Franklin Emerging Market Core Equity (IU) Fund | | $ | — | | | $ | 60,354,251 | | | $ | — | | | $ | — | | | $ | 2,710,255 | | | $ | 63,064,506 | | | | 5,769,854 | | | $ | 255,642 | a |
Franklin FTSE Europe ETF | | | 25,439,836 | | | | 15,470,373 | | | | (22,384,679 | ) | | | (2,033,986 | ) | | | 6,619,453 | | | | 23,110,997 | | | | 915,287 | | | | 980,045 | |
| | | | |
franklintempleton.com | | Annual Report | | 57 |
FRANKLIN FUND ALLOCATOR SERIES
NOTES TO FINANCIAL STATEMENTS
3. Transactions with Affiliates(continued)
f. Investments in FT Underlying Funds(continued)
| | | | | | | | | | | | | | | | | | | | | | | | | | | | | | | | |
| | | Value at
Beginning
of Year | | | Purchases | | | Sales | | | Realized
Gain (Loss) | | | Net Change in
Unrealized
Appreciation
(Depreciation) | | | Value at
End of
Year | | | Number of
Shares
Held at End
of Year | | | Dividend
Income | |
| |
| Franklin Moderate Allocation Fund(continued) | | | | | | | | | | | | | | | | | | | | | |
Controlled Affiliates(continued) | | | | | | | | | | | | | | | | | | | | | | | | | | | | | |
Franklin International Core Equity (IU) Fund | | $ | — | | | $ | 101,324,750 | | | $ | — | | | $ | — | | | $ | 8,275,691 | | | $ | 109,600,441 | | | | 9,873,914 | | | $ | 1,161,275 | |
Franklin Liberty High Yield Corporate ETF | | | — | | | | 19,448,133 | | | | — | | | | — | | | | 282,203 | | | | 19,730,336 | | | | 753,489 | | | | 320,480 | a |
Franklin Liberty U.S. Core Bond ETF | | | — | | | | 385,715,021 | | | | — | | | | — | | | | (2,419,805 | ) | | | 383,295,216 | | | | 15,276,873 | | | | 2,736,196 | a |
Franklin Pelagos Commodities Strategy Fund, Class R6 | | | 91,248,228 | | | | 5,485,477 | | | | (97,672,147 | ) | | | (20,383,361 | ) | | | 21,321,803 | | | | — | b | | | — | | | | 602,511 | |
Franklin U.S. Core Equity (IU) Fund | | | — | | | | 193,524,533 | | | | — | | | | — | | | | 13,611,944 | | | | 207,136,477 | | | | 19,197,079 | | | | 1,192,110 | |
| | | | | | | | | | | | |
Total Controlled Affiliates | | $ | 116,688,064 | | | $ | 781,322,538 | | | $ | (120,056,826 | ) | | $ | (22,417,347 | ) | | $ | 50,401,544 | | | $ | 805,937,973 | | | | | | | $ | 7,248,259 | |
| | | | | | | | | | | | |
| | | | | | | | |
Non-Controlled Affiliates | | | | | | | | | | | | | | | | | | | | | | | | | | | | | | | | |
Franklin DynaTech Fund, Class R6 | | | 131,830,259 | | | | 660,207 | | | | (166,739,550 | ) | | | 91,650,764 | | | | (57,401,680 | ) | | | — | b | | | — | | | | — | |
Franklin Emerging Market Debt Opportunities Fund | | | 37,608,902 | | | | — | | | | (37,969,118 | ) | | | (3,475,205 | ) | | | 3,835,421 | | | | — | b | | | — | | | | — | |
Franklin Floating Rate Daily Access Fund, Class R6 | | | 38,683,399 | | | | 1,838,069 | | | | (41,068,817 | ) | | | (1,380,650 | ) | | | 1,927,999 | | | | — | b | | | — | | | | 138,808 | |
Franklin FTSE Japan ETF | | | 27,611,482 | | | | 113,622 | | | | (19,393,153 | ) | | | (3,422,048 | ) | | | 6,324,189 | | | | 11,234,092 | | | | 429,602 | | | | 323,134 | |
Franklin Growth Fund, Class R6 | | | 278,927,077 | | | | 15,385,646 | | | | (108,118,235 | ) | | | 46,324,687 | | | | 12,706,563 | | | | 245,225,738 | | | | 2,183,666 | | | | 14,289,473 | a |
Franklin International Growth Fund, Class R6 | | | — | | | | 46,185,181 | | | | (5,444,043 | ) | | | 281,868 | | | | 5,448,147 | | | | 46,471,153 | | | | 2,791,060 | | | | 202,574 | |
Franklin International Small Cap Fund, Class R6 | | | 59,120,152 | | | | 7,583,513 | | | | (71,171,969 | ) | | | 7,699,190 | | | | (3,230,886 | ) | | | — | b | | | — | | | | — | |
Franklin LibertyQ Emerging Markets ETF | | | 74,846,213 | | | | 30,272,651 | | | | (70,271,358 | ) | | | 4,385,934 | | | | 649,272 | | | | 39,882,712 | | | | 1,339,065 | | | | 3,012,410 | |
Franklin LibertyQ U.S. Equity ETF | | | 143,550,227 | | | | 71,396,211 | | | | (29,594,334 | ) | | | 87,589 | | | | 45,127,822 | | | | 230,567,515 | | | | 6,589,526 | | | | 4,158,791 | |
Franklin Low Duration Total Return Fund, Class R6 | | | 178,021,586 | | | | 63,632,532 | | | | (113,814,440 | ) | | | (2,545,370 | ) | | | 4,716,686 | | | | 130,010,994 | | | | 13,417,027 | | | | 7,450,014 | |
| | | | |
| | | |
58 | | Annual Report | | franklintempleton.com |
FRANKLIN FUND ALLOCATOR SERIES
NOTES TO FINANCIAL STATEMENTS
| | | | | | | | | | | | | | | | | | | | | | | | | | | | | | | | |
| | | Value at
Beginning
of Year | | | Purchases | | | Sales | | | Realized
Gain (Loss) | | | Net Change in
Unrealized
Appreciation
(Depreciation) | | | Value at End of Year | | | Number of
Shares
Held at End
of Year | | | Dividend
Income | |
| |
| Franklin Moderate Allocation Fund(continued) | | | | | | | | | | | | | | | | | | | | | | | | | |
Non-Controlled Affiliates(continued) | | | | | | | | | | | | | | | | | | | | | |
Franklin Mutual European Fund, Class R6 | | $ | 47,971,953 | | | $ | 519,608 | | | $ | (54,879,351 | ) | | $ | 11,089,927 | | | $ | (4,702,137 | ) | | $ | — | b | | | — | | | $ | — | |
Franklin Rising Dividends Fund, Class R6 | | | 148,089,939 | | | | 6,557,689 | | | | (63,006,387 | ) | | | 16,435,288 | | | | 14,593,960 | | | | 122,670,489 | | | | 1,763,774 | | | | 4,083,989 | a |
Franklin Strategic Income Fund, Class R6 | | | 111,626,569 | | | | 8,997,435 | | | | (124,330,334 | ) | | | 616,145 | | | | 3,090,185 | | | | — | b | | | — | | | | 2,259,401 | |
Franklin U.S. Government Securities Fund, Class R6 | | | 159,143,007 | | | | 88,185,908 | | | | (254,061,424 | ) | | | (305,491 | ) | | | 7,038,000 | | | | — | b | | | — | | | | 4,969,410 | |
Franklin Utilities Fund, Class R6 | | | 50,426,474 | | | | 2,203,315 | | | | (60,223,729 | ) | | | 27,547,794 | | | | (19,953,854 | ) | | | — | b | | | — | | | | 634,483 | |
Institutional Fiduciary Trust Money Market Portfolio, 1.26% | | | 56,065 | | | | 354,548,609 | | | | (354,578,618 | ) | | | — | | | | — | | | | 26,056 | | | | 26,056 | | | | 883,464 | |
Templeton Foreign Fund, Class R6 | | | 82,834,369 | | | | 4,073,236 | | | | (45,899,957 | ) | | | 3,199,727 | | | | 2,936,409 | | | | 47,143,784 | | | | 6,612,032 | | | | 1,732,548 | |
Templeton Global Total Return Fund, Class R6 | | | 79,180,477 | | | | 13,586,071 | | | | (29,787,667 | ) | | | (1,499,847 | ) | | | (2,516,927 | ) | | | 58,962,107 | | | | 5,316,691 | | | | 5,237,435 | |
| | | | | | | | | | | | |
Total Non- Controlled Affiliates | | $ | 1,649,528,150 | | | $ | 715,739,503 | | | $ | (1,650,352,484 | ) | | $ | 196,690,302 | | | $ | 20,589,169 | | | $ | 932,194,640 | | | | | | | $ | 49,375,934 | |
| | | | | | | | | | | | |
Total Affiliated Securities | | $ | 1,766,216,214 | | | $ | 1,497,062,041 | | | $ | (1,770,409,310 | ) | | $ | 174,272,955 | | | $ | 70,990,713 | | | $ | 1,738,132,613 | | | | | | | $ | 56,624,193 | |
| | | | | | | | | | | | |
Franklin Growth Allocation Fund | | | | | | | | | | | | | | | | | | | | | | | | | | | | | |
Controlled Affiliates | | | | | | | | | | | | | | | | | | | | | | | | | |
Franklin Emerging Market Core Equity (IU) Fund | | $ | — | | | $ | 53,311,504 | | | $ | — | | | $ | — | | | $ | 2,386,873 | | | $ | 55,698,377 | | | | 5,095,917 | | | $ | 225,782 | a |
Franklin FTSE Europe ETF | | | 21,922,080 | | | | 13,555,985 | | | | (18,019,316 | ) | | | (1,660,298 | ) | | | 5,703,186 | | | | 21,501,637 | | | | 851,550 | | | | 881,777 | |
Franklin International Core Equity (IU) Fund | | | — | | | | 89,460,128 | | | | — | | | | — | | | | 7,291,989 | | | | 96,752,117 | | | | 8,716,407 | | | | 1,025,079 | |
Franklin U.S. Core Equity (IU) Fund | | | — | | | | 170,153,317 | | | | — | | | | — | | | | 11,963,920 | | | | 182,117,237 | | | | 16,878,335 | | | | 1,047,719 | |
| | | | | | | | | | | | |
Total Controlled Affiliates | | $ | 21,922,080 | | | $ | 326,480,934 | | | $ | (18,019,316 | ) | | $ | (1,660,298 | ) | | $ | 27,345,968 | | | $ | 356,069,368 | | | | | | | $ | 3,180,357 | |
| | | | | | | | | | | | |
| | | | |
franklintempleton.com | | Annual Report | | 59 |
FRANKLIN FUND ALLOCATOR SERIES
NOTES TO FINANCIAL STATEMENTS
3. Transactions with Affiliates(continued)
f. Investments in FT Underlying Funds(continued)
| | | | | | | | | | | | | | | | | | | | | | | | | | | | | | | | |
| | | Value at
Beginning
of Year | | | Purchases | | | Sales | | | Realized
Gain (Loss) | | | Net Change in
Unrealized
Appreciation
(Depreciation) | | | Value at End of Year | | | Number of
Shares
Held at End
of Year | | | Dividend
Income | |
| |
Franklin Growth Allocation Fund(continued) | | | | | | | | | | | | | | | | | | | | | | | | | |
Non-Controlled Affiliates | | | | | | | | | | | | | | | | | | | | | | | | | | | | | |
Franklin DynaTech Fund, Class R6 | | $ | 109,789,861 | | | $ | 308,723 | | | $ | (139,435,807 | ) | | $ | 78,324,490 | | | $ | (48,987,267 | ) | | $ | — | b | | | — | | | $ | — | |
Franklin Emerging Market Debt Opportunities Fund | | | 8,968,255 | | | | — | | | | (9,055,121 | ) | | | (791,173 | ) | | | 878,039 | | | | — | b | | | — | | | | — | |
Franklin Floating Rate Daily Access Fund, Class R6 | | | 10,049,028 | | | | 990,476 | | | | (11,180,602 | ) | | | (312,751 | ) | | | 453,849 | | | | — | b | | | — | | | | 36,727 | |
Franklin FTSE Japan ETF | | | 22,716,000 | | | | 92,282 | | | | (14,538,886 | ) | | | (2,577,311 | ) | | | 5,068,640 | | | | 10,760,725 | | | | 411,500 | | | | 294,293 | |
Franklin Growth Fund, Class R6 | | | 231,954,267 | | | | 14,091,994 | | | | (78,772,527 | ) | | | 24,981,722 | | | | 25,476,411 | | | | 217,731,867 | | | | 1,938,841 | | | | 12,559,618 | a |
Franklin International Growth Fund, Class R6 | | | — | | | | 40,908,494 | | | | (4,184,214 | ) | | | 267,260 | | | | 4,912,740 | | | | 41,904,280 | | | | 2,516,774 | | | | 182,666 | |
Franklin International Small Cap Fund, Class R6 | | | 49,599,678 | | | | 6,966,668 | | | | (60,212,427 | ) | | | 5,401,081 | | | | (1,755,000 | ) | | | — | b | | | — | | | | — | |
Franklin Liberty High Yield Corporate ETF | | | — | | | | 6,318,746 | | | | — | | | | — | | | | 80,968 | | | | 6,399,714 | | | | 244,401 | | | | 105,605 | a |
Franklin Liberty U.S. Core Bond ETF | | | — | | | | 114,001,405 | | | | — | | | | — | | | | (606,974 | ) | | | 113,394,431 | | | | 4,519,525 | | | | 812,627 | a |
Franklin LibertyQ Emerging Markets ETF | | | 62,311,312 | | | | 27,665,311 | | | | (59,228,412 | ) | | | 3,567,863 | | | | 701,124 | | | | 35,017,198 | | | | 1,175,705 | | | | 2,634,249 | |
Franklin LibertyQ U.S. Equity ETF | | | 119,744,604 | | | | 63,892,120 | | | | (20,028,279 | ) | | | 246,825 | | | | 38,862,129 | | | | 202,717,399 | | | | 5,793,581 | | | | 3,633,959 | |
Franklin Low Duration Total Return Fund, Class R6 | | | 45,152,022 | | | | 31,977,663 | | | | (35,477,976 | ) | | | (324,051 | ) | | | 842,680 | | | | 42,170,338 | | | | 4,351,944 | | | | 2,205,426 | |
Franklin Mutual European Fund, Class R6 | | | 40,510,549 | | | | 519,795 | | | | (46,524,241 | ) | | | 10,107,032 | | | | (4,613,135 | ) | | | — | b | | | — | | | | — | |
Franklin Pelagos Commodities Strategy Fund, Class R6 | | | 56,835,748 | | | | 3,323,060 | | | | (60,640,902 | ) | | | (11,015,668 | ) | | | 11,497,762 | | | | — | b | | | — | | | | 392,647 | |
Franklin Rising Dividends Fund, Class R6 | | | 123,494,926 | | | | 6,614,954 | | | | (47,383,810 | ) | | | 11,285,277 | | | | 15,384,396 | | | | 109,395,743 | | | | 1,572,908 | | | | 3,578,274 | a |
Franklin Strategic Income Fund, Class R6 | | | 26,754,417 | | | | 5,935,823 | | | | (33,622,075 | ) | | | 262,640 | | | | 669,195 | | | | — | b | | | — | | | | 644,286 | |
| | | | |
| | | |
60 | | Annual Report | | franklintempleton.com |
FRANKLIN FUND ALLOCATOR SERIES
NOTES TO FINANCIAL STATEMENTS
| | | | | | | | | | | | | | | | | | | | | | | | | | | | | | | | |
| | | Value at Beginning of Year | | | Purchases | | | Sales | | | Realized
Gain (Loss) | | | Net Change in
Unrealized
Appreciation
(Depreciation) | | | Value at End of Year | | | Number of
Shares
Held at End
of Year | | | Dividend
Income | |
| |
| Franklin Growth Allocation Fund(continued) | | | | | | | | | | | | | | | | | | | | | | | | | |
Non-Controlled Affiliates(continued) | | | | | | | | | | | | | | | | | | | | | | | | | | | | | |
| Franklin U.S. Government Securities Fund, Class R6 | | $ | 39,210,505 | | | $ | 39,734,690 | | | $ | (80,904,922 | ) | | $ | 1,037,394 | | | $ | 922,333 | | | $ | — | b | | | — | | | $ | 1,394,051 | |
Franklin Utilities Fund, Class R6 | | | 41,286,615 | | | | 2,341,509 | | | | (50,070,573 | ) | | | 22,788,807 | | | | (16,346,358 | ) | | | — | b | | | — | | | | 550,477 | |
| Institutional Fiduciary Trust Money Market Portfolio, 1.26% | | | 36,422 | | | | 240,966,486 | | | | (240,984,657 | ) | | | — | | | | — | | | | 18,251 | | | | 18,251 | | | | 580,748 | |
Templeton Foreign Fund, Class R6 | | | 69,665,758 | | | | 3,767,387 | | | | (35,357,968 | ) | | | 2,156,096 | | | | 3,106,956 | | | | 43,338,229 | | | | 6,078,293 | | | | 1,592,693 | |
| Templeton Global Total Return Fund, Class R6 | | | 18,800,160 | | | | 8,511,361 | | | | (6,921,903 | ) | | | (349,942 | ) | | | (898,554 | ) | | | 19,141,122 | | | | 1,725,981 | | | | 1,521,964 | |
| | | | | | | | | | | | |
Total Non- Controlled Affiliates | | $ | 1,076,880,127 | | | $ | 618,928,947 | | | $ | (1,034,525,302 | ) | | $ | 145,055,591 | | | $ | 35,649,934 | | | $ | 841,989,297 | | | | | | | $ | 32,720,310 | |
| | | | | | | | | | | | |
| Total Affiliated Securities | | $ | 1,098,802,207 | | | $ | 945,409,881 | | | $ | (1,052,544,618 | ) | | $ | 143,395,293 | | | $ | 62,995,902 | | | $ | 1,198,058,665 | | | | | | | $ | 35,900,667 | |
| | | | | | | | | | | | |
aDividend income includes capital gain distributions received, if any, from underlying funds, and are presented in corresponding line item in the Statement of Operations. bAs of December 31, 2019, no longer held by the fund.
g. Waiver and Expense Reimbursements
Advisers and Investor Services have contractually agreed in advance to waive or limit their respective fees and to assume as their own expense certain expenses otherwise payable by Franklin Growth Allocation Fund so that the expenses (excluding distribution fees, and acquired fund fees and expenses and certainnon-routine expenses or costs, including those relating to litigation, indemnification, reorganizations, and liquidations) for Class A, Class C, Class R, Advisor Class and for Class R6 of the Fund do not exceed 0.40% and 0.27%, respectively, based on the average net assets of each class until April 30, 2020. Total expenses waived or paid are not subject to recapture subsequent to the Funds’ fiscal year end.
Prior to May 1, 2019, expenses (excluding certain fees and expenses as previously disclosed) for Franklin Growth Allocation Fund for Class A, Class C, Class R and Advisor Class were limited to 0.40%, and expenses for Class R6 were limited to 0.28% based on the average net assets of each class.
Investor Services has contractually agreed in advance to waive or limit its fees so that the Class R6 transfer agent fees do not exceed 0.03% based on the average net assets of the class until April 30, 2020.
4. Expense Offset Arrangement
The Funds have entered into an arrangement with their custodian whereby credits realized as a result of uninvested cash balances are used to reduce a portion of the Funds’ custodian expenses. During the year ended December 31, 2019, the custodian fees were reduced as noted in the Statements of Operations.
| | | | |
franklintempleton.com | | Annual Report | | 61 |
FRANKLIN FUND ALLOCATOR SERIES
NOTES TO FINANCIAL STATEMENTS
5. Income Taxes
The tax character of distributions paid during the years ended December 31, 2019 and 2018, was as follows:
| | | | | | | | | | | | | | | | | | | | | | | | |
| | | Franklin Conservative
Allocation Fund | | | Franklin Moderate
Allocation Fund | | | Franklin Growth
Allocation Fund | |
| | | 2019 | | | 2018 | | | 2019 | | | 2018 | | | 2019 | | | 2018 | |
| |
| | | | | | |
| Distributions paid from: | | | | | | | | | | | | | | | | | | | | | | | | |
Ordinary income | | $ | 25,683,084 | | | $ | 32,363,606 | | | $ | 32,803,976 | | | $ | 43,773,340 | | | $ | 15,530,614 | | | $ | 21,174,619 | |
| | | | | | |
| Long term capital gain | | | 55,364,282 | | | | 53,201,795 | | | | 136,097,653 | | | | 112,468,006 | | | | 114,867,907 | | | | 79,302,833 | |
| | | | |
| | $ | 81,047,366 | | | $ | 85,565,401 | | | $ | 168,901,629 | | | $ | 156,241,346 | | | $ | 130,398,521 | | | $ | 100,477,452 | |
| | | | |
At December 31, 2019, the cost of investments, net unrealized appreciation (depreciation), undistributed ordinary income and undistributed long term capital gains for income tax purposes were as follows:
| | | | | | | | | | | | |
| | | Franklin
Conservative
Allocation Fund | | | Franklin
Moderate
Allocation Fund | | | Franklin Growth
Allocation Fund | |
| |
| | | |
Cost of investments | | $ | 1,097,262,858 | | | $ | 1,656,406,677 | | | $ | 1,037,156,965 | |
| | | | |
| | | |
Unrealized appreciation | | $ | 126,087,651 | | | $ | 304,489,539 | | | $ | 260,422,072 | |
| | | |
Unrealized depreciation | | | (13,754,780 | ) | | | (14,184,021) | | | | (4,189,024) | |
| | | | |
| | | |
Net unrealized appreciation (depreciation) | | $ | 112,332,871 | | | $ | 290,305,518 | | | $ | 256,233,048 | |
| | | | |
| | | |
Distributable earnings: | | | | | | | | | | | | |
| | | |
Undistributed ordinary income | | $ | 847,663 | | | $ | 1,696,117 | | | $ | 1,299,082 | |
| | | |
Undistributed long term capital gains | | | 13,977,490 | | | | 43,440,322 | | | | 38,520,130 | |
| | | | |
| | | |
Total distributable earnings | | $ | 14,825,153 | | | $ | 45,136,439 | | | $ | 39,819,212 | |
| | | | |
Differences between income and/or capital gains as determined on a book basis and a tax basis are primarily due to differing treatment of wash sales.
The Funds utilized a tax accounting practice to treat a portion of the proceeds from capital shares redeemed as a distribution from realized capital gains.
6. Investment Transactions
Purchases and sales of Underlying Funds and ETFs (excluding short term securities) for the year ended December 31, 2019, were as follows:
| | | | | | | | | | | | |
| | | Franklin
Conservative
Allocation Fund | | | Franklin
Moderate
Allocation Fund | | | Franklin
Growth
Allocation Fund | |
| |
| | | |
Purchases | | $ | 1,023,529,047 | | | $ | 1,348,752,030 | | | $ | 776,508,555 | |
| | | |
Sales | | $ | 1,140,942,897 | | | $ | 1,537,235,999 | | | $ | 878,255,474 | |
| | | | |
| | | |
62 | | Annual Report | | franklintempleton.com |
FRANKLIN FUND ALLOCATOR SERIES
NOTES TO FINANCIAL STATEMENTS
7. Credit Facility
The Funds, together with other U.S. registered and foreign investment funds (collectively, Borrowers), managed by Franklin Templeton, are borrowers in a joint syndicated senior unsecured credit facility totaling $2 billion (Global Credit Facility) which matured on February 7, 2020. This Global Credit Facility provides a source of funds to the Borrowers for temporary and emergency purposes, including the ability to meet future unanticipated or unusually large redemption requests. Effective February 7, 2020, the Borrowers renewed the Global Credit Facility for a one year term, maturing February 5, 2021, for a total of $2 billion.
Under the terms of the Global Credit Facility, the Funds shall, in addition to interest charged on any borrowings made by the Funds and other costs incurred by the Funds, pay their share of fees and expenses incurred in connection with the implementation and maintenance of the Global Credit Facility, based upon their relative share of the aggregate net assets of all of the Borrowers, including an annual commitment fee of 0.15% based upon the unused portion of the Global Credit Facility. These fees are reflected in other expenses in the Statements of Operations. During the year ended December 31, 2019, the Funds did not use the Global Credit Facility.
8. Fair Value Measurements
The Funds follow a fair value hierarchy that distinguishes between market data obtained from independent sources (observable inputs) and the Funds’ own market assumptions (unobservable inputs). These inputs are used in determining the value of the Funds’ financial instruments and are summarized in the following fair value hierarchy:
| | • | Level 1 – quoted prices in active markets for identical financial instruments |
| | • | Level 2 – other significant observable inputs (including quoted prices for similar financial instruments, interest rates, prepayment speed, credit risk, etc.) |
| | • | Level 3 – significant unobservable inputs (including the Funds’ own assumptions in determining the fair value of financial instruments) |
The input levels are not necessarily an indication of the risk or liquidity associated with financial instruments at that level.
A summary of inputs used as of December 31, 2019, in valuing the Funds’ assets carried at fair value, is as follows:
| | | | | | | | | | | | | | | | |
| | | Level 1 | | | Level 2 | | | Level 3 | | | Total | |
| |
| | | | |
Franklin Conservative Allocation Fund | | | | | | | | | | | | | | | | |
| | | | |
Assets: | | | | | | | | | | | | | | | | |
| | | | |
Investments in Securities:a | | | | | | | | | | | | | | | | |
| | | | |
Underlying Funds and Exchange Traded Funds | | $ | 1,196,478,797 | | | $ | — | | | $ | — | | | $ | 1,196,478,797 | |
| | | | |
Short Term Investments | | | 16,214 | | | | 13,100,718 | | | | — | | | | 13,116,932 | |
| | | | |
| | | | |
Total Investments in Securities | | $ | 1,196,495,011 | | | $ | 13,100,718 | | | $ | — | | | $ | 1,209,595,729 | |
| | | | |
| | | | |
Franklin Moderate Allocation Fund | | | | | | | | | | | | | | | | |
| | | | |
Assets: | | | | | | | | | | | | | | | | |
| | | | |
Investments in Securities:a | | | | | | | | | | | | | | | | |
| | | | |
Underlying Funds and Exchange Traded Funds | | $ | 1,927,855,065 | | | $ | — | | | $ | — | | | $ | 1,927,855,065 | |
| | | | |
Short Term Investments | | | 26,056 | | | | 18,831,074 | | | | — | | | | 18,857,130 | |
| | | | |
| | | | |
Total Investments in Securities | | $ | 1,927,881,121 | | | $ | 18,831,074 | | | $ | — | | | $ | 1,946,712,195 | |
| | | | |
| | | | |
franklintempleton.com | | Annual Report | | 63 |
FRANKLIN FUND ALLOCATOR SERIES
NOTES TO FINANCIAL STATEMENTS
8. Fair Value Measurements(continued)
| | | | | | | | | | | | | | | | |
| | | Level 1 | | | Level 2 | | | Level 3 | | | Total | |
| |
| | | | |
Franklin Growth Allocation Fund | | | | | | | | | | | | | | | | |
| | | | |
Assets: | | | | | | | | | | | | | | | | |
| | | | |
Investments in Securities:a | | | | | | | | | | | | | | | | |
| | | | |
Underlying Funds and Exchange Traded Funds | | $ | 1,279,593,374 | | | $ | — | | | $ | — | | | $ | 1,279,593,374 | |
| | | | |
Short Term Investments | | | 18,251 | | | | 13,778,388 | | | | — | | | | 13,796,639 | |
| | | | |
| | | | |
Total Investments in Securities | | $ | 1,279,611,625 | | | $ | 13,778,388 | | | $ | — | | | $ | 1,293,390,013 | |
| | | | |
aFor detailed categories, see the accompanying Statement of Investments.
9. Subsequent Events
The Funds have evaluated subsequent events through the issuance of the financial statements and determined that no events have occurred that require disclosure other than those already disclosed in the financial statements.
Abbreviations
| | |
| ETF | | Exchange Traded Fund |
| |
| FTSE | | Financial Times Stock Exchange |
| | | | |
| | | |
64 | | Annual Report | | franklintempleton.com |
FRANKLIN FUND ALLOCATOR SERIES
Report of Independent Registered Public Accounting Firm
To the Board of Trustees of Franklin Fund Allocator Series and Shareholders of Franklin Conservative Allocation Fund, Franklin Moderate Allocation Fund and Franklin Growth Allocation Fund
Opinions on the Financial Statements
We have audited the accompanying statements of assets and liabilities, including the statements of investments, of Franklin Conservative Allocation Fund, Franklin Moderate Allocation Fund and Franklin Growth Allocation Fund (the “Funds”) as of December 31, 2019, the related statements of operations for the year ended December 31, 2019, the statements of changes in net assets for each of the two years in the period ended December 31, 2019, including the related notes, and the financial highlights for each of the five years in the period ended December 31, 2019 (collectively referred to as the “financial statements”). In our opinion, the financial statements present fairly, in all material respects, the financial position of each of the Funds as of December 31, 2019, the results of each of their operations for the year then ended, the changes in each of their net assets for each of the two years in the period ended December 31, 2019 and each of the financial highlights for each of the five years in the period ended December 31, 2019 in conformity with accounting principles generally accepted in the United States of America.
Basis for Opinions
These financial statements are the responsibility of the Funds’ management. Our responsibility is to express an opinion on the Funds’ financial statements based on our audits. We are a public accounting firm registered with the Public Company Accounting Oversight Board (United States) (PCAOB) and are required to be independent with respect to the Funds in accordance with the U.S. federal securities laws and the applicable rules and regulations of the Securities and Exchange Commission and the PCAOB.
We conducted our audits of these financial statements in accordance with the standards of the PCAOB. Those standards require that we plan and perform the audit to obtain reasonable assurance about whether the financial statements are free of material misstatement, whether due to error or fraud.
Our audits included performing procedures to assess the risks of material misstatement of the financial statements, whether due to error or fraud, and performing procedures that respond to those risks. Such procedures included examining, on a test basis, evidence regarding the amounts and disclosures in the financial statements. Our audits also included evaluating the accounting principles used and significant estimates made by management, as well as evaluating the overall presentation of the financial statements. Our procedures included confirmation of securities owned as of December 31, 2019 by correspondence with the custodian, transfer agent and brokers; when replies were not received from brokers, we performed other auditing procedures. We believe that our audits provide a reasonable basis for our opinions.
PricewaterhouseCoopers LLP
San Francisco, California
February 20, 2020
We have served as the auditor of one or more investment companies in the Franklin Templeton Group of Funds since 1948.
| | | | |
franklintempleton.com | | Annual Report | | 65 |
FRANKLIN FUND ALLOCATOR SERIES
Tax Information (unaudited)
Under Section 852(b)(3)(C) of the Internal Revenue Code, the Funds hereby report the maximum amount allowable but no less than the following amounts as long term capital gain dividends for the fiscal year ended December 31, 2019:
| | | | | | | | | | |
Franklin
Conservative
Allocation Fund | | | Franklin
Moderate
Allocation Fund | | | Franklin
Growth
Allocation Fund | |
| | |
| | $62,860,586 | | | | $152,173,232 | | | | $126,621,590 | |
Under Section 871(k)(2)(C) of the Internal Revenue Code, the Funds hereby report the maximum amount allowable but no less than the following amounts as short term capital gain dividends for purposes of the tax imposed under Section 871(a)(1)(A) of the Internal Revenue Code for the fiscal year ended December 31, 2019:
| | | | | | | | | | |
Franklin
Conservative
Allocation Fund | | | Franklin
Moderate
Allocation Fund | | | Franklin
Growth
Allocation Fund | |
| | |
| | $29,942 | | | | $831,668 | | | | $659,661 | |
Under Section 854(b)(1)(A) of the Internal Revenue Code, the Funds hereby report the following percentage amounts of the ordinary income dividends as income qualifying for the dividends received deduction for the fiscal year ended December 31, 2019:
| | | | | | | | | | |
Franklin
Conservative
Allocation Fund | | | Franklin
Moderate
Allocation Fund | | | Franklin
Growth
Allocation Fund | |
| | |
| | 13.23% | | | | 25.20% | | | | 46.51% | |
Under Section 854(b)(1)(B) of the Internal Revenue Code, the Funds hereby report the maximum amount allowable but no less than the following amounts as qualified dividends for purposes of the maximum rate under Section 1(h)(11) of the Internal Revenue Code for the fiscal year ended December 31, 2019:
| | | | | | | | | | |
Franklin
Conservative
Allocation Fund | | | Franklin
Moderate
Allocation Fund | | | Franklin
Growth
Allocation Fund | |
| | |
| | $6,478,617 | | | | $15,815,013 | | | | $13,950,647 | |
Distributions, including qualified dividend income, paid during calendar year 2019 will be reported to shareholders on Form1099-DIV bymid-February 2020. Shareholders are advised to check with their tax advisors for information on the treatment of these amounts on their individual income tax returns.
During the fiscal year ended December 31, 2019, the Funds, qualified fund of funds under Section 852(g)(2) of Internal Revenue Code, received an allocation of foreign taxes paid from one or more of their underlying funds. As shown in the table below, the Funds hereby report to shareholders the foreign source income and foreign taxes paid by underlying funds, pursuant to Section 853 of the Internal Revenue Code. This written statement will allow shareholders of record on December 27, 2019, to treat their proportionate share of foreign taxes paid by the underlying funds as having been paid directly by them. The shareholder shall consider these amounts as foreign taxes paid in the tax year in which they receive the Fund distribution.
| | | | |
| | | |
66 | | Annual Report | | franklintempleton.com |
FRANKLIN FUND ALLOCATOR SERIES
TAX INFORMATION
The following table provides a detailed analysis of foreign tax paid, foreign source income, and foreign source qualified dividends as reported by the Funds, to shareholders of record.
| | | | | | | | | | | | |
| Class | | Foreign Tax Paid
Per Share | | | Foreign Source
Income Per Share | | | Foreign Source Qualified
Dividends Per Share | |
| | | |
Franklin Conservative Allocation Fund | | | | | | | | | | | | |
| | | |
Class A | | | $0.0066 | | | | $0.1049 | | | | $0.0262 | |
| | | |
Class C | | | $0.0066 | | | | $0.1049 | | | | $0.0262 | |
| | | |
Class R | | | $0.0066 | | | | $0.1049 | | | | $0.0262 | |
| | | |
Class R6 | | | $0.0066 | | | | $0.1049 | | | | $0.0262 | |
| | | |
Advisor Class | | | $0.0066 | | | | $0.1049 | | | | $0.0262 | |
| | | |
Franklin Moderate Allocation Fund | | | | | | | | | | | | |
| | | |
Class A | | | $0.0084 | | | | $0.1092 | | | | $0.0439 | |
| | | |
Class C | | | $0.0084 | | | | $0.1092 | | | | $0.0439 | |
| | | |
Class R | | | $0.0084 | | | | $0.1092 | | | | $0.0439 | |
| | | |
Class R6 | | | $0.0084 | | | | $0.1092 | | | | $0.0439 | |
| | | |
Advisor Class | | | $0.0084 | | | | $0.1092 | | | | $0.0439 | |
| | | |
Franklin Growth Allocation Fund | | | | | | | | | | | | |
| | | |
Class A | | | $0.0118 | | | | $0.1262 | | | | $0.0719 | |
| | | |
Class C | | | $0.0118 | | | | $0.1262 | | | | $0.0719 | |
| | | |
Class R | | | $0.0118 | | | | $0.1262 | | | | $0.0719 | |
| | | |
Class R6 | | | $0.0118 | | | | $0.1262 | | | | $0.0719 | |
| | | |
Advisor Class | | | $0.0118 | | | | $0.1262 | | | | $0.0719 | |
Foreign Tax Paid Per Share is the amount per share available to you, as a tax credit (assuming you held your shares in the Fund for a minimum of 16 days during the31-day period beginning 15 days before theex-dividend date of the Fund’s distribution to which the foreign taxes relate), or, as a tax deduction.
Foreign Source Income Per Share is the amount per share of income dividends attributable to foreign securities held by the Fund, plus any foreign taxes withheld on these dividends. The amounts reported include foreign source qualified dividends that have not been adjusted for the rate differential applicable to such dividend income.1
Foreign Source Qualified Dividends Per Share is the amount per share of foreign source qualified dividends plus any foreign taxes withheld on these dividends. These amounts represent the portion of the Foreign Source Income Per Share that were derived from qualified foreign securities held by the Fund.1
At the beginning of each calendar year, shareholders will receive Form 1099-DIV which will include their share of taxes paid and foreign source income distributed during the prior calendar year. The Foreign Source Income reported on Form1099-DIV has not been adjusted for the rate differential on foreign source qualified dividend income. Shareholders are advised to check with their tax advisors for information on the treatment of these amounts on their individual income tax returns.
1. Qualified dividends are taxed at reduced long term capital gains tax rates. In determining the amount of foreign tax credit that may be applied against the U.S. tax liability of individuals receiving foreign source qualified dividends, adjustments may be required to the foreign tax credit limitation calculation to reflect the rate differential applicable to such dividend income. The rules however permit certain individuals to elect not to apply the rate differential adjustments for capital gains and/or dividends for any taxable year. Please consult your tax advisor and the instructions to Form 1116 for more information.
| | | | |
franklintempleton.com | | Annual Report | | 67 |
FRANKLIN FUND ALLOCATOR SERIES
Board Members and Officers
The name, year of birth and address of the officers and board members, as well as their affiliations, positions held with the Trust, principal occupations during at least the past five years and number of U.S. registered portfolios overseen in the Franklin Templeton fund complex, are shown below. Generally, each board member serves until that person’s successor is elected and qualified.
Independent Board Members
| | | | | | | | |
Name, Year of Birth and Address | | Position | | Length of
Time Served | | Number of Portfolios in
Fund Complex Overseen
by Board Member* | | Other Directorships Held During at Least the Past 5 Years |
| Harris J. Ashton (1932) | | Trustee | | Since 1995 | | 132 | | Bar-S Foods (meat packing company) |
| One Franklin Parkway | | | | | | | | (1981-2010). |
| San Mateo, CA 94403-1906 | | | | | | | | |
| | |
| Principal Occupation During at Least the Past 5 Years: | | | | |
| Director of various companies; andformerly, Director, RBC Holdings, Inc. (bank holding company) (until 2002); and President, Chief Executive Officer and Chairman of the Board, General Host Corporation (nursery and craft centers) (until 1998). |
| | | | | | | | | |
| | | | |
| Terrence J. Checki (1945) | | Trustee | | Since 2017 | | 111 | | Hess Corporation (exploration of oil |
| One Franklin Parkway | | | | | | | | and gas) (2014-present). |
| San Mateo, CA 94403-1906 | | | | | | | | |
| | |
| Principal Occupation During at Least the Past 5 Years: | | | | |
| Member of the Council on Foreign Relations (1996-present); Member of the National Committee on U.S.-China Relations (1999-present); member of the Board of Trustees of the Economic Club of New York (2013-present); member of the Board of Trustees of the Foreign Policy Association (2005-present) and member of various other boards of trustees and advisory boards; andformerly, Executive Vice President of the Federal Reserve Bank of New York and Head of its Emerging Markets and Internal Affairs Group and Member of Management Committee (1995-2014); and Visiting Fellow at the Council on Foreign Relations (2014). |
| | | | | | | | | |
| | | | |
| Mary C. Choksi (1950) | | Trustee | | Since 2014 | | 132 | | Avis Budget Group Inc. (car rental) |
| One Franklin Parkway | | | | | | | | (2007-present), Omnicom Group Inc. |
| San Mateo, CA 94403-1906 | | | | | | | | (advertising and marketing |
| | | | | | | | communications services) |
| | | | | | | | (2011-present) and White Mountains |
| | | | | | | | Insurance Group, Ltd. (holding |
| | | | | | | | company) (2017-present). |
| | |
| Principal Occupation During at Least the Past 5 Years: | | | | |
| Director of various companies; andformerly, Founder and Senior Advisor, Strategic Investment Group (investment management group) (2015-2017); Founding Partner and Senior Managing Director, Strategic Investment Group (1987-2015); Founding Partner and Managing Director, Emerging Markets Management LLC (investment management firm) (1987-2011); and Loan Officer/Senior Loan Officer/Senior Pension Investment Officer, World Bank Group (international financial institution) (1977-1987). |
| | | | | | | | | |
| | | | |
| Edith E. Holiday (1952) | | Lead | | Trustee since 1998 | | 132 | | Hess Corporation (exploration of oil |
| One Franklin Parkway | | Independent | | and Lead | | | | and gas) (1993-present), Canadian |
| San Mateo, CA 94403-1906 | | Trustee | | Independent | | | | National Railway (railroad) |
| | | | Trustee since | | | | (2001-present), White Mountains |
| | | | March 2019 | | | | Insurance Group, Ltd. (holding |
| | | | | | | | company) (2004-present), Santander |
| | | | | | | | Consumer USA Holdings, Inc. |
| | | | | | | | (consumer finance) (2016-present), |
| | | | | | | | RTI International Metals, Inc. |
| | | | | | | | (manufacture and distribution of |
| | | | | | | | titanium) (1999-2015) and H.J. Heinz |
| | | | | | | | Company (processed foods and allied |
| | | | | | | | products) (1994-2013). |
| | |
| Principal Occupation During at Least the Past 5 Years: | | | | |
| Director or Trustee of various companies and trusts; andformerly, Assistant to the President of the United States and Secretary of the Cabinet (1990-1993); General Counsel to the United States Treasury Department (1989-1990); and Counselor to the Secretary and Assistant Secretary for Public Affairs and Public Liaison–United States Treasury Department (1988-1989). |
| | | | | | | | | |
| | | | |
| | | |
68 | | Annual Report | | franklintempleton.com |
FRANKLIN FUND ALLOCATOR SERIES
Independent Board Members(continued)
| | | | | | | | |
Name, Year of Birth and Address | | Position | | Length of
Time Served | | Number of Portfolios in
Fund Complex Overseen
by Board Member* | | Other Directorships Held During at Least the Past 5 Years |
| | | | |
| J. Michael Luttig (1954) | | Trustee | | Since 2009 | | 132 | | Boeing Capital Corporation (aircraft |
| One Franklin Parkway | | | | | | | | financing) (2006-2010). |
| San Mateo, CA 94403-1906 | | | | | | | | |
| | |
| Principal Occupation During at Least the Past 5 Years: | | | | |
| Private investor; andformerly, Counselor and Senior Advisor to the Chairman, CEO, and Board of Directors, of The Boeing Company (aerospace company), and member of the Executive Council (May 2019-January 1, 2020); Executive Vice President, General Counsel and member of the Executive Council, The Boeing Company (2006-2019); and Federal Appeals Court Judge, United States Court of Appeals for the Fourth Circuit (1991-2006). |
| | | | | | | | | |
| | | | |
| Larry D. Thompson (1945) | | Trustee | | Since 2007 | | 132 | | The Southern Company (energy |
| One Franklin Parkway | | | | | | | | company) (2014-present; previously |
| San Mateo, CA 94403-1906 | | | | | | | | 2010-2012), Graham Holdings |
| | | | | | | | Company (education and media |
| | | | | | | | organization) (2011-present) and |
| | | | | | | | Cbeyond, Inc. (business |
| | | | | | | | communications provider) |
| | | | | | | | (2010-2012). |
| | |
| Principal Occupation During at Least the Past 5 Years: | | | | |
| Director of various companies; Counsel, Finch McCranie, LLP (law firm) (2015-present); Independent Compliance Monitor and Auditor, Volkswagen AG (manufacturer of automobiles and commercial vehicles) (2017-present); John A. Sibley Professor of Corporate and Business Law, University of Georgia School of Law (2015-present; previously 2011-2012); andformerly, Executive Vice President – Government Affairs, General Counsel and Corporate Secretary, PepsiCo, Inc. (consumer products) (2012-2014); Senior Vice President – Government Affairs, General Counsel and Secretary, PepsiCo, Inc. (2004-2011); Senior Fellow of The Brookings Institution (2003-2004); Visiting Professor, University of Georgia School of Law (2004); and Deputy Attorney General, U.S. Department of Justice (2001-2003). |
| | | | | | | | | |
Interested Board Members and Officers
| | | | | | | | |
| | | Position | | Length of
Time Served | | Number of Portfolios in
Fund Complex Overseen
by Board Member* | | Other Directorships Held During at Least the Past 5 Years |
| **Gregory E. Johnson (1961) | | Trustee | | Since 2007 | | 144 | | None |
| One Franklin Parkway | | | | | | | | |
| San Mateo, CA 94403-1906 | | | | | | | | |
| | |
| Principal Occupation During at Least the Past 5 Years: | | | | |
| Chairman of the Board, Member – Office of the Chairman, Director and Chief Executive Officer, Franklin Resources, Inc.; officer and/or director or trustee, as the case may be, of some of the other subsidiaries of Franklin Resources, Inc. and of 39 of the investment companies in Franklin Templeton; Vice Chairman, Investment Company Institute; andformerly, President, Franklin Resources, Inc. (1994-2015). |
| | | | | | | | | |
| **Rupert H. Johnson, Jr. (1940) | | Chairman of | | Since 2013 | | 132 | | None |
| One Franklin Parkway | | the Board | | | | | | |
| San Mateo, CA 94403-1906 | | and Trustee | | | | | | |
| | |
| Principal Occupation During at Least the Past 5 Years: | | | | |
| Vice Chairman, Member – Office of the Chairman and Director, Franklin Resources, Inc.; Director, Franklin Advisers, Inc. and officer and/or director or trustee, as the case may be, of some of the other subsidiaries of Franklin Resources, Inc. and of 37 of the investment companies in Franklin Templeton. |
| | | | | | | | | |
| Alison E. Baur (1964) | | Vice President | | Since 2012 | | Not Applicable | | Not Applicable |
| One Franklin Parkway | | | | | | | | |
| San Mateo, CA 94403-1906 | | | | | | | | |
| | |
| Principal Occupation During at Least the Past 5 Years: | | | | |
| Deputy General Counsel, Franklin Templeton; and officer of some of the other subsidiaries of Franklin Resources, Inc. and of 41 of the investment companies in Franklin Templeton. |
| | | | | | | | | |
| | | | |
franklintempleton.com | | Annual Report | | 69 |
FRANKLIN FUND ALLOCATOR SERIES
Interested Board Members and Officers(continued)
| | | | | | | | |
| | | Position | | Length of
Time Served | | Number of Portfolios in
Fund Complex Overseen
by Board Member* | | Other Directorships Held
During at Least the Past 5 Years |
| Breda M. Beckerle (1958) | | Interim Chief | | Since January | | Not Applicable | | Not Applicable |
| 280 Park Avenue | | Compliance | | 2009 | | | | |
| New York, NY 10017 | | Officer | | | | | | |
| | |
| Principal Occupation During at Least the Past 5 Years: | | | | |
| Chief Compliance Officer, Fiduciary Investment Management International, Inc., Franklin Advisers, Inc., Franklin Advisory Services, LLC, Franklin Mutual Advisers, LLC, Franklin Templeton Institutional, LLC; and officer of 41 of the investment companies in Franklin Templeton. |
| | | | | | | | | |
| Gaston Gardey (1967) | | Treasurer, | | Since 2009 | | Not Applicable | | Not Applicable |
| One Franklin Parkway | | Chief Financial | | | | | | |
| San Mateo, CA 94403-1906 | | Officer and | | | | | | |
| | Chief | | | | | | |
| | Accounting | | | | | | |
| | Officer | | | | | | |
| | |
| Principal Occupation During at Least the Past 5 Years: | | | | |
| Treasurer, U.S. Fund Administration & Reporting, and officer of 24 of the investment companies in Franklin Templeton. |
| | | | | | | | | |
| Steven J. Gray (1955) | | Vice President | | Vice President | | Not Applicable | | Not Applicable |
| One Franklin Parkway | | and | | since 2009 | | | | |
| San Mateo, CA 94403-1906 | | Co-Secretary | | andCo-Secretary | | | | |
| | | | |
| | | | since 2019 | | | | |
| | |
| Principal Occupation During at Least the Past 5 Years: | | | | |
| Senior Associate General Counsel, Franklin Templeton; Vice President, Franklin Templeton Distributors, Inc. and FASA, LLC; and officer of 41 of the investment companies in Franklin Templeton. |
| | | | | | | | | |
| Matthew T. Hinkle (1971) | | Chief Executive | | Since 2017 | | Not Applicable | | Not Applicable |
| One Franklin Parkway | | Officer – | | | | | | |
| San Mateo, CA 94403-1906 | | Finance and | | | | | | |
| | | | |
| | Administration | | | | | | |
| | |
| Principal Occupation During at Least the Past 5 Years: | | | | |
| Senior Vice President, Franklin Templeton Services, LLC; officer of 41 of the investment companies in Franklin Templeton; andformerly,Vice President, Global Tax (2012-April 2017) and Treasurer/Assistant Treasurer, Franklin Templeton (2009-2017). |
| | | | | | | | | |
| Robert Lim (1948) | | Vice President | | Since 2016 | | Not Applicable | | Not Applicable |
| One Franklin Parkway | | –AML | | | | | | |
| San Mateo, CA 94403-1906 | | Compliance | | | | | | |
| | |
| Principal Occupation During at Least the Past 5 Years: | | | | |
| Vice President, Franklin Templeton Companies, LLC; Chief Compliance Officer, Franklin Templeton Distributors, Inc. and Franklin Templeton Investor Services, LLC; and officer of 41 of the investment companies in Franklin Templeton. |
| | | | | | | | | |
| Edward D. Perks (1970) | | President and | | Since 2018 | | Not Applicable | | Not Applicable |
| One Franklin Parkway | | Chief Executive | | | | | | |
| San Mateo, CA 94403-1906 | | Officer – | | | | | | |
| | Investment | | | | | | |
| | Management | | | | | | |
| | |
| Principal Occupation During at Least the Past 5 Years: | | | | |
| President and Director, Franklin Advisers, Inc.; and officer of eight of the investment companies in Franklin Templeton (since December 2018). |
| | | | | | | | | |
| Navid J. Tofigh (1972) | | Vice President | | Since 2015 | | Not Applicable | | Not Applicable |
| One Franklin Parkway | | | | | | | | |
| San Mateo, CA 94403-1906 | | | | | | | | |
| | |
| Principal Occupation During at Least the Past 5 Years: | | | | |
| Associate General Counsel, and officer of 41 of the investment companies in Franklin Templeton. |
| | | | | | | | | |
| | | | |
| | | |
70 | | Annual Report | | franklintempleton.com |
FRANKLIN FUND ALLOCATOR SERIES
Interested Board Members and Officers(continued)
| | | | | | | | |
| | | Position | | Length of
Time Served | | Number of Portfolios in
Fund Complex Overseen
by Board Member* | | Other Directorships Held
During at Least the Past 5 Years |
| Craig S. Tyle (1960) | | Vice President | | Since 2005 | | Not Applicable | | Not Applicable |
| One Franklin Parkway | | | | | | | | |
| San Mateo, CA 94403-1906 | | | | | | | | |
| | |
| Principal Occupation During at Least the Past 5 Years: | | | | |
| General Counsel, Executive Vice President, Franklin Resources, Inc.; and officer of some of the other subsidiaries of Franklin Resources, Inc. and of 41 of the investment companies in Franklin Templeton. |
| | | | | | | | | |
| Lori A. Weber (1964) | | Vice President | | Vice President | | Not Applicable | | Not Applicable |
| 300 S.E. 2nd Street | | and | | since 2011 | | | | |
| Fort Lauderdale, FL 33301-1923 | | Co-Secretary | | andCo-Secretary | | | | |
| | | | |
| | | | since 2019 | | | | |
| | |
| Principal Occupation During at Least the Past 5 Years: | | | | |
| Senior Associate General Counsel, Franklin Templeton; Assistant Secretary, Franklin Resources, Inc.; Vice President and Secretary, Templeton Investment Counsel, LLC; and officer of 41 of the investment companies in Franklin Templeton. |
| | | | | | | | | |
*We base the number of portfolios on each separate series of the U.S. registered investment companies within the Franklin Templeton fund complex. These portfolios have a common investment manager or affiliated investment managers.
**Gregory E. Johnson is considered to be an interested person of the Fund under the federal securities laws due to his position as an officer and director of Franklin Resources, Inc. (Resources), which is the parent company of the Fund’s investment manager and distributor. Rupert H. Johnson, Jr. is considered to be an interested person of the Fund under the federal securities laws due to his position as an officer and director and major shareholder of Resources.
Note 1: Rupert H. Johnson, Jr. is the uncle of Gregory E. Johnson.
Note 2: Effective March 12, 2019, John B. Wilson ceased to be a trustee of the Trust.
Note 3: Officer information is current as of the date of this report. It is possible that after this date, information about officers may change.
The Sarbanes-Oxley Act of 2002 and Rules adopted by the Securities and Exchange Commission require the Fund to disclose whether the Fund’s Audit Committee includes at least one member who is an audit committee financial expert within the meaning of such Act and Rules. The Fund’s Board has determined that there is at least one such financial expert on the Audit Committee and has designated Mary C. Choksi as its audit committee financial expert. The Board believes that Ms. Choksi qualifies as such an expert in view of her extensive business background and experience. She currently serves as a director of Avis Budget Group, Inc. (2007-present) and formerly, Founder and Senior Advisor, Strategic Investment Group (1987 to 2017). Ms. Choksi has been a Member of the Fund’s Audit Committee since 2014. As a result of such background and experience, the Board believes that Ms. Choksi has acquired an understanding of generally accepted accounting principles and financial statements, the general application of such principles in connection with the accounting estimates, accruals and reserves, and analyzing and evaluating financial statements that present a breadth and level of complexity of accounting issues generally comparable to those of the Fund, as well as an understanding of internal controls and procedures for financial reporting and an understanding of audit committee functions. Ms. Choksi is an independent Board member as that term is defined under the relevant Securities and Exchange Commission Rules and Releases.
The Statement of Additional Information (SAI) includes additional information about the board members and is available, without charge, upon request. Shareholders may call (800) DIALBEN/342-5236 to request the SAI.
| | | | |
franklintempleton.com | | Annual Report | | 71 |
FRANKLIN FUND ALLOCATOR SERIES
Shareholder Information
Proxy Voting Policies and Procedures
The Trust’s investment manager has established Proxy Voting Policies and Procedures (Policies) that the Trust uses to determine how to vote proxies relating to portfolio securities. Shareholders may view the Trust’s complete Policies online at franklintempleton.com. Alternatively, shareholders may request copies of the Policies free of charge by calling the Proxy Group collect at (954)527-7678 or by sending a written request to: Franklin Templeton Companies, LLC, 300 S.E. 2nd Street, Fort Lauderdale, FL 33301, Attention: Proxy Group. Copies of the Trust’s proxy voting records are also made available online at franklintempleton.com and posted on the U.S. Securities and Exchange Commission’s website at sec.gov and reflect the most recent12-month period ended June 30.
Quarterly Statement of Investments
The Trust files a complete statement of investments with the U.S. Securities and Exchange Commission for the first and third quarters for each fiscal year as an exhibit to its report onForm N-PORT. Shareholders may view the filed FormN-PORT by visiting the Commission’s website at sec.gov. The filed form may also be viewed and copied at the Commission’s Public Reference Room in Washington, DC. Information regarding the operations of the Public Reference Room may be obtained by calling(800) SEC-0330.
Householding of Reports and Prospectuses
You will receive each Fund’s financial reports every six months as well as an annual updated summary prospectus (prospectus available upon request). To reduce Fund expenses, we try to identify related shareholders in a household and send only one copy of the financial reports and summary prospectus. This process, called “householding,” will continue indefinitely unless you instruct us otherwise. If you prefer not to have these documents householded, please call us at (800)632-2301. At any time you may view current prospectuses/summary prospectuses and financial reports on our website. If you choose, you may receive these documents through electronic delivery.
| | | | |
| | | |
72 | | Annual Report | | franklintempleton.com |
Authorized for distribution only when accompanied or preceded by a summary prospectus and/or prospectus. Investors should carefully consider a fund’s investment goals, risks, charges and expenses before investing. A prospectus contains this and other information; please read it carefully before investing.
To help ensure we provide you with quality service, all calls to and from our service areas are monitored and/or recorded.
| | | | | | |
 | | Annual Report and Shareholder Letter Franklin Fund Allocator Series | | |
| | Investment Manager | | Distributor | | Shareholder Services |
| | Franklin Advisers, Inc. | | Franklin Templeton Distributors, Inc. | | (800)632-2301 |
| | | | (800) DIAL BEN®/342-5236 | | |
| | | | franklintempleton.com | | |
| | |
| © 2020 Franklin Templeton Investments. All rights reserved. | | FAS A 02/20 |
Internet Delivery of Fund Reports Unless You Request Paper Copies: Effective January 1, 2021, as permitted by the SEC, paper copies of the Fund’s shareholder reports will no longer be sent by mail, unless you specifically request them from the Fund or your financial intermediary. Instead, the reports will be made available on a website, and you will be notified by mail each time a report is posted and provided with a website link to access the report.
If you already elected to receive shareholder reports electronically, you will not be affected by this change and you need not take any action. If you have not signed up for electronic delivery, we would encourage you to join fellow shareholders who have. You may elect to receive shareholder reports and other communications electronically from the Fund by calling (800)632-2301 or by contacting your financial intermediary.
You may elect to continue to receive paper copies of all your future shareholder reports free of charge by contacting your financial intermediary or, if you invest directly with a Fund, calling (800)632-2301 to let the Fund know of your request. Your election to receive reports in paper will apply to all funds held in your account.
SHAREHOLDER LETTER
Dear Shareholder:
The U.S. economy, after moderating for two consecutive quarters, grew during the 12 months ended December 31, 2019, and the unemployment rate declined. In January 2019, the U.S. Federal Reserve (Fed) signaled the end of its tightening cycle and cut the federal funds rate by 0.25% at each of its July, September and October 2019 meetings, decreasing the rate from 2.50% to 1.75% byperiod-end. The Fed cited muted inflation pressures, some soft business indicators and the potential effects of global developments on the U.S. economy as rationale for its more accommodative monetary policy. Stocks responded positively to the interest-rate cuts, despite some volatility due to U.S.-China trade tensions, and stocks gained further in December 2019 after the Fed indicated it would likely leave interest rates unchanged in 2020.
In this environment, the prices of U.S. stocks, as measured by the Standard & Poor’s® 500 Index (S&P 500®), returned +28.88% (the index increasing from 2,506.85 to 3,230.78).1,3 The prices of stocks in global developed markets, as measured by the MSCI World Index, returned +25.19% (the index increasing from 1,883.901 to 2,358.468).2,3 Investment-grade bonds, as measured by the Bloomberg Barclays U.S. Aggregate Bond Index (Bloomberg Index), posted a +8.72% total return (an index increase from 2,046.60 to 2,225.00), which includes reinvestment of income and distributions.4
We are committed to our long-term perspective and disciplined investment approach as we conduct a rigorous, fundamental analysis of securities with a regular emphasis on investment risk management.
We believe active, professional investment management serves investors well. We also recognize the important role
of financial advisors in today’s markets and encourage investors to continue to seek their advice. Amid changing markets and economic conditions, we are confident investors with a well-diversified portfolio and a patient, long-term outlook should be well positioned for the years ahead.
In addition, Franklin Fund Allocator Series’ annual report includes more detail about prevailing conditions and a discussion about investment decisions during the period. As you know, all securities markets fluctuate, as do mutual fund share prices.
We thank you for investing with Franklin, welcome your questions and comments, and look forward to assisting your future investment plans.
Sincerely,

Rupert H. Johnson, Jr.
Chairman
Franklin Fund Allocator Series
This letter reflects our analysis and opinions as of December 31, 2019, unless otherwise indicated. The information is not a complete analysis of every aspect of any market, country, industry, security or fund. Statements of fact are from sources considered reliable.
1. Source: Copyright© 2020, S&P Dow Jones Indices LLC. All rights reserved.
2. Source: MSCI.
3. Source: Morningstar. The changes in index prices shown for the S&P 500 and MSCI World Index do not include reinvestments of income and distributions, which are included in their total returns, which were: S&P 500 +31.49% (index total return resulting in an increase from 4,984.22 to 6,553.57) and MSCI World Index +28.40% (index total return resulting in an increase from 7,771.710 to 9,979.034).
4. Sources: Morningstar and Bloomberg Barclays Indices. For the Bloomberg Index, only total return as shown is available, not price change without the inclusion of reinvested income and distributions.
See www.franklintempletondatasources.com for additional data provider information.
| | | | |
franklintempleton.com | | Annual Report | | 1 |
Contents
|
| Visitfranklintempleton.comfor fund updates, to access your account, or to find helpful financial planning tools. |
| | | | |
| | | |
2 | | Annual Report | | franklintempleton.com |
ANNUAL REPORT
Economic and Market Overview
Global developed and emerging market stocks, as measured by the MSCI All Country World Index, posted strong returns during the reporting period. Although global economic growth slowed from 2018, interest-rate cuts from many central banks and the easing of trade tensions nearperiod-end contributed to the generally positive environment for equities worldwide. Reflecting investor optimism and slowing but resilient economic growth, stocks advanced in every major region of the globe.
In the U.S., solid economic growth also supported equities, as healthy consumer spending and a strong labor market kept the economy afloat. The unemployment rate fell during the year, reaching 3.5% in September, November and December 2019, the lowest recorded unemployment rate in 50 years.1 Wages also grew, albeit at a moderate pace, and inflation remained persistently low. In addition, deficit spending by the U.S. government boosted current growth at the expense of long-term debt. Despite the strength in the consumer sector, some parts of the economy struggled, particularly heavy industry. Annual industrial production contracted late in the reporting period, manufacturing output stalled and capital spending declined.
The U.S. Federal Reserve (Fed) provided a substantial boost to equity markets early in the reporting period as it shifted to a more accommodative monetary policy. In January 2019, the Fed signaled the end of its tightening cycle and cut the federal funds rate three times thereafter, lowering it to a range of 1.50%–1.75%. Stocks responded positively to the interest-rate cuts and gained further in December 2019 after the Fed indicated it would likely leave interest rates unchanged in 2020.
Growth slowed overall in the eurozone, particularly in Germany and Italy. Germany, which is heavily reliant on exports, was adversely affected by the trade conflict between the U.S. and China and the resulting slowdown in global trade. In Italy, political uncertainty and budget concerns caused the country’s annual gross domestic product (GDP) growth to stall in 2019’s first quarter before accelerating in the second quarter. Despite sluggish economic conditions, European developed market equities, as measured by the MSCI Europe Index, posted strong returns overall, as easing trade tensions buoyed investor optimism and an electoral victory by the Conservative Party in the U.K. alleviated uncertainty surrounding Brexit. Although the European Central Bank
left its headline refinancing rate unchanged, it lowered the deposit rate and restarted its bond-buying stimulus program, further supporting stocks.
Economic growth in Asia was relatively solid overall, despite slowdowns in several large emerging market countries, such as China and India. Japan’s economy grew amid the Bank of Japan’s sizable stimulus program. The trade war between the U.S. and China provided the backdrop for Asian stocks, which rose and fell in sync with investor sentiment regarding a trade deal. A phase one agreement reached in December 2019 propelled Asian developed and emerging market stocks, which ultimately ended with strong returns over the12-month period, as measured by the MSCI All Country Asia Index.
Emerging market stocks overall experienced several sharp selloffs and subsequent rebounds throughout the reporting period before ending with gains. In aggregate, economic growth slowed somewhat from 2018 but remained solid, although there was some variation among individual countries. Many central banks in emerging markets cut interest rates throughout the reporting period which, along with resilient GDP growth, provided a supportive environment for equities. Russian stocks posted the highest returns among emerging markets as the threat of further sanctions receded and a solid fiscal environment reassured investors. Overall, global emerging markets, as measured by the MSCI Emerging Markets Index, posted robust returns for the period.
The foregoing information reflects our analysis and opinions as of December 31, 2019. The information is not a complete analysis of every aspect of any market, country, industry, security or fund. Statements of fact are from sources considered reliable.
| | | | |
franklintempleton.com | | Annual Report | | 3 |
Franklin Corefolio Allocation Fund
This annual report for Franklin Corefolio Allocation Fund covers the fiscal year ended December 31, 2019.
Your Fund’s Goal and Main Investments
The Fund seeks capital appreciation through investments in a combination of Franklin Growth Fund, Franklin Growth Opportunities Fund, Franklin Mutual Shares Fund and Templeton Growth Fund.
Asset Allocation*
Based on Total Net Assets as of 12/31/19
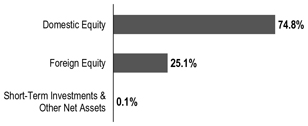
*The asset allocation is based on the Statement of Investments (SOI), which classifies each underlying fund into a broad asset class.
Performance Overview
The Fund’s Class A shares posted a +25.79% cumulative total return for the 12 months under review. In comparison, the Fund’s benchmarks, the Standard & Poor’s® 500 Index (S&P 500®), which is a broad measure of U.S. stock performance, posted a +31.49% cumulative total return, and the MSCI World Index, which tracks equity performance in global developed markets, posted a +28.40% total return.1 You can find the Fund’s long-term performance data in the Performance Summary beginning on page 6.
Performance data represent past performance, which does not guarantee future results. Investment return and principal value will fluctuate, and you may have a gain or loss when you sell your shares. Current performance may differ from figures shown. For most recentmonth-end performance, go tofranklintempleton.comor call(800)342-5236.
Investment Strategy
The Fund invests its assets allocated approximately 25% each in Franklin Growth Fund, Franklin Growth Opportunities Fund, Franklin Mutual Shares Fund and Templeton Growth Fund. These underlying funds, in turn, invest primarily in U.S. and foreign equity securities and, to a lesser extent, fixed income and money market securities. As market conditions affect the underlying funds, we rebalance the Fund’s allocations to maintain the predetermined weightings in each underlying fund whenever the actual allocations exceed plus or minus 3% of the fixed allocation percentages.
Portfolio Review
The Fund’s performance can be attributed largely to maintaining a relatively static allocation among domestic and foreign equities, fixed income securities, and short-term investments and other net assets, and to the actual performance of the selected underlying funds.
During the period under review, Franklin Growth Fund – Class R6 and Franklin Growth Opportunities Fund –Class R6 outperformed the S&P 500, while Franklin Mutual Shares Fund – Class R6 underperformed the index. Templeton Growth Fund – Class R6 underperformed the MSCI World Index.
1. Source: Morningstar.
The indexes are unmanaged and include reinvestment of any income distributions. It does not reflect any fees, expenses or sales charges. One cannot invest directly in an index, and an index is not representative of the Fund’s portfolio.
See www.franklintempletondatasources.com for additional data provider information.
The dollar value, number of shares or principal amount, and names of all portfolio holdings are listed in the Fund’s SOI, which begins on page 21.
| | | | |
| | | |
4 | | Annual Report | | franklintempleton.com |
FRANKLIN COREFOLIO ALLOCATION FUND
Thank you for your continued participation in Franklin Corefolio Allocation Fund. We look forward to serving your future investment needs.
| | |
 | | 
Thomas A. Nelson, CFA Co-Lead Portfolio Manager |
| | |
 | | 
May Tong, CFA Co-Lead Portfolio Manager |
The foregoing information reflects our analysis, opinions and portfolio holdings as of December 31, 2019, the end of the reporting period. The way we implement our main investment strategies and the resulting portfolio holdings may change depending on factors such as market and economic conditions. These opinions may not be relied upon as investment advice or an offer for a particular security. The information is not a complete analysis of every aspect of any market, country, industry, security or the Fund. Statements of fact are from sources considered reliable, but the investment manager makes no representation or warranty as to their completeness or accuracy. Although historical performance is no guarantee of future results, these insights may help you understand our investment management philosophy.
CFA®is a trademark owned by CFA Institute.
| | | | |
franklintempleton.com | | Annual Report | | 5 |
FRANKLIN COREFOLIO ALLOCATION FUND
Performance Summary as of December 31, 2019
The performance table and graphs do not reflect any taxes that a shareholder would pay on Fund dividends, capital gain distributions, if any, or any realized gains on the sale of Fund shares. Total return reflects reinvestment of the Fund’s dividends and capital gain distributions, if any, and any unrealized gains or losses. Your dividend income will vary depending on dividends or interest paid by securities in the Fund’s portfolio, adjusted for operating expenses of each class. Capital gain distributions are net profits realized from the sale of portfolio securities.
Performance as of 12/31/19
Cumulative total return excludes sales charges. Average annual total return includes maximum sales charges. Sales charges will vary depending on the size of the investment and the class of share purchased. The maximum is 5.50% and the minimum is 0%.Class A:5.50% maximum initial sales charge;Advisor Class:no sales charges. For other share classes, visitfranklintempleton.com.
| | | | | | | | |
Share Class | | Cumulative
Total Return1 | | | Average Annual
Total Return2 | |
| |
A3 | | | | | | | | |
1-Year | | | +25.79% | | | | +18.86% | |
| |
5-Year | | | +49.23% | | | | +7.11% | |
| |
10-Year | | | +162.50% | | | | +9.52% | |
| |
Advisor | | | | | | | | |
1-Year | | | +26.10% | | | | +26.10% | |
| |
5-Year | | | +51.14% | | | | +8.61% | |
| |
10-Year | | | +169.76% | | | | +10.43% | |
| |
Performance data represent past performance, which does not guarantee future results. Investment return and principal value will fluctuate, and you may have a gain or loss when you sell your shares. Current performance may differ from figures shown. For most recentmonth-end performance, go tofranklintempleton.comor call(800)342-5236.
See page 8 for Performance Summary footnotes.
| | | | |
| | | |
6 | | Annual Report | | franklintempleton.com |
FRANKLIN COREFOLIO ALLOCATION FUND
PERFORMANCE SUMMARY
Total Return Index Comparison for a Hypothetical $10,000 Investment
Total return represents the change in value of an investment over the periods shown. It includes any applicable maximum sales charge, Fund expenses, account fees and reinvested distributions. The unmanaged indexes include reinvestment of any income or distributions. They differ from the Fund in composition and do not pay management fees or expenses. One cannot invest directly in an index.
Class A(1/1/10–12/31/19)
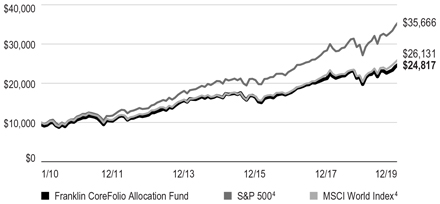
Advisor Class(1/1/10–12/31/19)
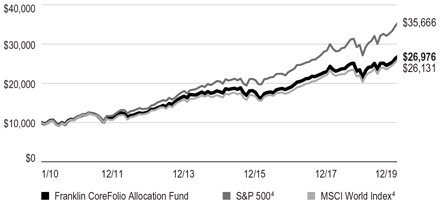
| | | | |
franklintempleton.com | | Annual Report | | 7 |
FRANKLIN COREFOLIO ALLOCATION FUND
PERFORMANCE SUMMARY
Distributions(1/1/19–12/31/19)
| | | | | | | | | | | | | | | | |
| Share Class | | Net Investment
Income | | | Short-Term
Capital Gain | | | Long-Term
Capital Gain | | | Total | |
A | | | $0.2022 | | | | $0.0923 | | | | $1.3615 | | | | $1.6560 | |
C | | | $0.0466 | | | | $0.0923 | | | | $1.3615 | | | | $1.5004 | |
R | | | $0.1501 | | | | $0.0923 | | | | $1.3615 | | | | $1.6039 | |
R6 | | | $0.2732 | | | | $0.0923 | | | | $1.3615 | | | | $1.7270 | |
Advisor | | | $0.2518 | | | | $0.0923 | | | | $1.3615 | | | | $1.7056 | |
Total Annual Operating Expenses5
| | | | |
| Share Class | | | |
A | | | 1.04% | |
Advisor | | | 0.79% | |
Each class of shares is available to certain eligible investors and has different annual fees and expenses, as described in the prospectus.
All investments involve risks, including possible loss of principal. Because the Fund invests in underlying funds that may engage in a variety of investment strategies involving certain risks, this fund of funds may be subject to those same risks. Stock prices fluctuate, sometimes rapidly and dramatically, due to factors affecting individual companies, particular industries or sectors, or general market conditions. Growth stock prices reflect projections of future earnings or revenues, and can therefore fall dramatically if the company fails to meet those projections. Value securities may not increase in price as anticipated or may decline further in value. Foreign investing carries additional risks such as currency and market volatility, and political or social instability; risks that are heightened in developing countries. The Fund includes investments in specialized industry sectors such as the technology sector, which has been among the most volatile in the market. The Fund’s prospectus also includes a description of the main investment risks.
1. Cumulative total return represents the change in value of an investment over the periods indicated.
2. Average annual total return represents the average annual change in value of an investment over the periods indicated. Return for less than one year, if any, has not been annualized.
3. Prior to 9/10/18 these shares were offered at a higher initial sales charge of 5.75%, thus actual returns (with sales charges) would have differed. Average annual total returns (with sales charges) have been restated to reflect the current maximum initial sales charge of 5.50%.
4. Source: Morningstar. The S&P 500 is a market capitalization-weighted index of 500 stocks designed to measure total U.S. equity market performance. The MSCI World Index is a free float-adjusted, market capitalization-weighted index designed to measure equity market performance in global developed markets.
5. Figures are as stated in the Fund’s current prospectus and may differ from the expense ratios disclosed in the Your Fund’s Expenses and Financial Highlights sections in this report. In periods of market volatility, assets may decline significantly, causing total annual Fund operating expenses to become higher than the figures shown.
See www.franklintempletondatasources.com for additional data provider information.
| | | | |
| | | |
8 | | Annual Report | | franklintempleton.com |
FRANKLIN COREFOLIO ALLOCATION FUND
Your Fund’s Expenses
As a Fund shareholder, you can incur two types of costs: (1) transaction costs, including sales charges (loads) on Fund purchases and redemptions; and (2) ongoing Fund costs, including management fees, distribution and service(12b-1) fees, and other Fund expenses. All mutual funds have ongoing costs, sometimes referred to as operating expenses. The table below shows ongoing costs of investing in the Fund and can help you understand these costs and compare them with those of other mutual funds. The table assumes a $1,000 investment held for the six months indicated.
Actual Fund Expenses
The table below provides information about actual account values and actual expenses in the columns under the heading “Actual.” In these columns the Fund’s actual return, which includes the effect of Fund expenses, is used to calculate the “Ending Account Value” for each class of shares. You can estimate the expenses you paid during the period by following these steps (of course, your account value and expenses will differ from those in this illustration): Divide your account value by $1,000 (if your account had an $8,600 value, then $8,600÷ $1,000 = 8.6). Then multiply the result by the number in the row for your class of shares under the headings “Actual” and “Expenses Paid During Period” (if Actual Expenses Paid During Period were $7.50, then 8.6 x $7.50 = $64.50). In this illustration, the actual expenses paid this period are $64.50.
Hypothetical Example for Comparison with Other Funds
Under the heading “Hypothetical” in the table, information is provided about hypothetical account values and hypothetical expenses based on the Fund’s actual expense ratio and an assumed rate of return of 5% per year before expenses, which is not the Fund’s actual return. This information may not be used to estimate the actual ending account balance or expenses you paid for the period, but it can help you compare ongoing costs of investing in the Fund with those of other funds. To do so, compare this 5% hypothetical example for the class of shares you hold with the 5% hypothetical examples that appear in the shareholder reports of other funds.
Please note that expenses shown in the table are meant to highlight ongoing costs and do not reflect any transactional costs. Therefore, information under the heading “Hypothetical” is useful in comparing ongoing costs only, and will not help you compare total costs of owning different funds. In addition, if transactional costs were included, your total costs would have been higher.
| | | | | | | | | | | | | | | | | | |
| | | | | | | Actual (actual return after expenses) | | | | Hypothetical (5% annual return before expenses) | | | | |
Share Class | | Beginning Account Value 7/1/19 | | | | Ending Account
Value 12/31/19 | | Expenses
Paid During
Period
7/1/19–12/31/191, 2 | | | | Ending Account
Value 12/31/19 | | Expenses Paid During
Period 7/1/19–12/31/191,
2 | | | | Net Annualized
Expense Ratio2 |
| | | | | | | | | | | | |
| A | | $1,000 | | | | $1,073.10 | | $2.25 | | | | $1,023.04 | | $2.19 | | | | 0.43% |
| C | | $1,000 | | | | $1,069.40 | | $6.15 | | | | $1,019.26 | | $6.01 | | | | 1.18% |
| R | | $1,000 | | | | $1,072.50 | | $3.45 | | | | $1,021.88 | | $3.36 | | | | 0.66% |
| R6 | | $1,000 | | | | $1,075.10 | | $0.47 | | | | $1,024.75 | | $0.46 | | | | 0.09% |
| Advisor | | $1,000 | | | | $1,074.40 | | $0.94 | | | | $1,024.30 | | $0.92 | | | | 0.18% |
1. Expenses are equal to the annualized expense ratio for thesix-month period as indicated above—in the far right column—multiplied by the simple average account value over the period indicated, and then multiplied by 184/365 to reflect theone-half year period.
2. Reflects expenses after fee waivers and expense reimbursements. Does not include acquired fund fees and expenses.
| | | | |
franklintempleton.com | | Annual Report | | 9 |
Franklin Founding Funds Allocation Fund
This annual report for Franklin Founding Funds Allocation Fund covers the fiscal year ended December 31, 2019.
Your Fund’s Goal and Main Investments
The Fund’s principal investment goal is capital appreciation, with a secondary goal of income. The Fund invests in an equally weighted combination of Franklin Income Fund, Franklin Mutual Shares Fund and Templeton Growth Fund.
Asset Allocation*
Based on Total Net Assets as of 12/31/19
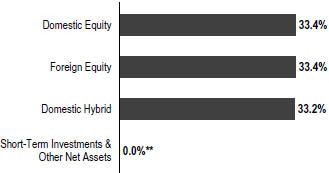
* The asset allocation is based on the Statement of Investments (SOI), which classifies each underlying fund into a broad asset class.
** Rounds to less than 0.1% of net assets.
Performance Overview
The Fund’s Class A shares posted a +17.81% cumulative total return for the 12 months under review. In comparison, the Fund’s benchmarks, the Standard & Poor’s 500 Index (S&P 500), which is a broad measure of U.S. stock performance, posted a +31.49% total return and the MSCI World Index, which tracks equity performance in global developed markets, posted a +28.40% total return.1 You can find the Fund’s long-term performance data in the Performance Summary beginning on page 12.
Performance data represent past performance, which does not guarantee future results. Investment return and principal value will fluctuate, and you may have a gain or loss when you sell your shares. Current performance may differ from figures shown. For most recentmonth-end performance, go tofranklintempleton.comor call(800)342-5236.
Investment Strategy
The Fund invests its assets in an equally weighted combination of Franklin Income Fund, Franklin Mutual Shares Fund and Templeton Growth Fund. These underlying funds, in turn, invest primarily in U.S. and foreign equity securities and, to a lesser extent, fixed income and money market securities. As market conditions affect the underlying funds, we rebalance the Fund’s allocations to maintain the predetermined equal weightings of approximately 33% of total net assets in each underlying fund whenever the actual allocations exceed plus or minus 3% of the fixed allocation percentages.
Portfolio Review
The Fund’s performance can be attributed largely to maintaining a relatively static allocation among domestic and foreign equities, fixed income securities, and short-term investments and other net assets, and to the actual performance of the selected underlying funds.
During the period under review, Franklin Income Fund – Class R6 and Franklin Mutual Shares Fund – Class R6 underperformed the S&P 500. Templeton Growth Fund – Class R6 underperformed the MSCI World Index.
1. Source: Morningstar.
The indexes are unmanaged and include reinvestment of any income or distributions. It does not reflect any fees, expenses or sales charges. One cannot invest directly in an index, and an index is not representative of the Fund’s portfolio.
See www.franklintempletondatasources.com for additional data provider information.
The dollar value, number of shares or principal amount, and names of all portfolio holdings are listed in the Fund’s SOI, which begins on page 27.
| | | | |
| | | |
10 | | Annual Report | | franklintempleton.com |
FRANKLIN FOUNDING FUNDS ALLOCATION FUND
Thank you for your continued participation in Franklin Founding Funds Allocation Fund. We look forward to serving your future investment needs.
| | |
| |
Thomas A. Nelson, CFA Co-Lead Portfolio Manager |
| | |
| |
May Tong, CFA Co-Lead Portfolio Manager |
The foregoing information reflects our analysis, opinions and portfolio holdings as of December 31, 2019, the end of the reporting period. The way we implement our main investment strategies and the resulting portfolio holdings may change depending on factors such as market and economic conditions. These opinions may not be relied upon as investment advice or an offer for a particular security. The information is not a complete analysis of every aspect of any market, country, industry, security or the Fund. Statements of fact are from sources considered reliable, but the investment manager makes no representation or warranty as to their completeness or accuracy. Although historical performance is no guarantee of future results, these insights may help you understand our investment management philosophy.
| | | | |
franklintempleton.com | | Annual Report | | 11 |
FRANKLIN FOUNDING FUNDS ALLOCATION FUND
Performance Summary as of December 31, 2019
The performance table and graphs do not reflect any taxes that a shareholder would pay on Fund dividends, capital gain distributions, if any, or any realized gains on the sale of Fund shares. Total return reflects reinvestment of the Fund’s dividends and capital gain distributions, if any, and any unrealized gains or losses. Your dividend income will vary depending on dividends or interest paid by securities in the Fund’s portfolio, adjusted for operating expenses of each class. Capital gain distributions are net profits realized from the sale of portfolio securities.
Performance as of 12/31/19
Cumulative total return excludes sales charges. Average annual total return includes maximum sales charges. Sales charges will vary depending on the size of the investment and the class of share purchased. The maximum is 5.50% and the minimum is 0%.Class A:5.50% maximum initial sales charge;Advisor Class:no sales charges. For other share classes, visitfranklintempleton.com.
| | | | | | | | |
| Share Class | | Cumulative
Total Return1 | | | Average Annual
Total Return2 | |
| |
A3 | | | | | | | | |
1-Year | | | +17.81% | | | | +11.29% | |
| |
5-Year | | | +25.82% | | | | +3.53% | |
| |
10-Year | | | +102.76% | | | | +6.72% | |
| |
Advisor | | | | | | | | |
1-Year | | | +18.06% | | | | +18.06% | |
| |
5-Year | | | +27.43% | | | | +4.97% | |
| |
10-Year | | | +107.87% | | | | +7.59% | |
| |
Performance data represent past performance, which does not guarantee future results. Investment return and principal value will fluctuate, and you may have a gain or loss when you sell your shares. Current performance may differ from figures shown. For most recentmonth-end performance, go tofranklintempleton.comor call(800)342-5236.
See page 14 for Performance Summary footnotes.
| | | | |
| | | |
12 | | Annual Report | | franklintempleton.com |
FRANKLIN FOUNDING FUNDS ALLOCATION FUND
PERFORMANCE SUMMARY
Total Return Index Comparison for a Hypothetical $10,000 Investment
Total return represents the change in value of an investment over the periods shown. It includes any applicable maximum sales charge, Fund expenses, account fees and reinvested distributions. The unmanaged indexes include reinvestment of any income or distributions. They differ from the Fund in composition and do not pay management fees or expenses. One cannot invest directly in an index.
Class A(1/1/10–12/31/19)
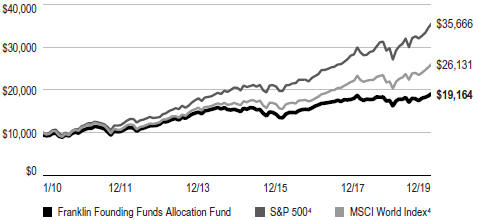
Advisor Class(1/1/10–12/31/19)
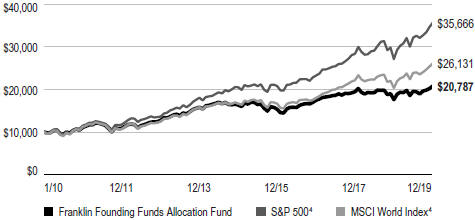
| | | | |
franklintempleton.com | | Annual Report | | 13 |
FRANKLIN FOUNDING FUNDS ALLOCATION FUND
PERFORMANCE SUMMARY
Distributions(1/1/19–12/31/19)
| | | | |
| Share Class | | Net Investment
Income | |
A | | | $0.4358 | |
C | | | $0.3215 | |
R | | | $0.3995 | |
R6 | | | $0.4805 | |
Advisor | | | $0.4711 | |
Total Annual Operating Expenses5
| | | | |
| Share Class | | | |
A | | | 0.99% | |
Advisor | | | 0.74% | |
Each class of shares is available to certain eligible investors and has different annual fees and expenses, as described in the prospectus.
All investments involve risks, including possible loss of principal. Because the Fund invests in underlying funds that may engage in a variety of investment strategies involving certain risks, the Fund is subject to these same risks. Stock prices fluctuate, sometimes rapidly and dramatically, due to factors affecting individual companies, particular industries or sectors, or general market conditions. Bonds are affected by changes in interest rates and the creditworthiness of their issuers. Bond prices generally move in the opposite direction of interest rates. Thus, as the prices of bonds adjust to a rise in interest rates, the Fund’s share price may decline. Higher-yielding, lower-rated corporate bonds entail a greater degree of credit risk compared to investment-grade securities. Value securities may not increase in price as anticipated or may decline further in value. Foreign investing carries additional risks such as currency and market volatility and political or social instability, risks that are heightened in developing countries. To the extent the Fund focuses on particular countries, regions, industries, sectors or types of investments from time to time, it may be subject to greater risks of adverse developments in such areas of focus than a fund that invests in a wider variety of countries, regions, industries, sectors or investments. The Fund’s prospectus also includes a description of the main investment risks.
1. Cumulative total return represents the change in value of an investment over the periods indicated.
2. Average annual total return represents the average annual change in value of an investment over the periods indicated. Return for less than one year, if any, has not been annualized.
3. Prior to 9/10/18 these shares were offered at a higher initial sales charge of 5.75%, thus actual returns (with sales charges) would have differed. Average annual total returns (with sales charges) have been restated to reflect the current maximum initial sales charge of 5.50%.
4. Source: Morningstar. The S&P 500 is a market capitalization-weighted index of 500 stocks designed to measure total U.S. equity market performance. The MSCI World Index is a free float-adjusted, market capitalization-weighted index designed to measure equity market performance in global developed markets.
5. Figures are as stated in the Fund’s current prospectus and may differ from the expense ratios disclosed in the Your Fund’s Expenses and Financial Highlights sections in this report. In periods of market volatility, assets may decline significantly, causing total annual Fund operating expenses to become higher than the figures shown.
See www.franklintempletondatasources.com for additional data provider information.
| | | | |
| | | |
14 | | Annual Report | | franklintempleton.com |
FRANKLIN FOUNDING FUNDS ALLOCATION FUND
Your Fund’s Expenses
As a Fund shareholder, you can incur two types of costs: (1) transaction costs, including sales charges (loads) on Fund purchases and redemptions; and (2) ongoing Fund costs, including management fees, distribution and service(12b-1) fees, and other Fund expenses. All mutual funds have ongoing costs, sometimes referred to as operating expenses. The table below shows ongoing costs of investing in the Fund and can help you understand these costs and compare them with those of other mutual funds. The table assumes a $1,000 investment held for the six months indicated.
Actual Fund Expenses
The table below provides information about actual account values and actual expenses in the columns under the heading “Actual.” In these columns the Fund’s actual return, which includes the effect of Fund expenses, is used to calculate the “Ending Account Value” for each class of shares. You can estimate the expenses you paid during the period by following these steps (of course, your account value and expenses will differ from those in this illustration): Divide your account value by $1,000 (if your account had an $8,600 value, then $8,600÷ $1,000 = 8.6). Then multiply the result by the number in the row for your class of shares under the headings “Actual” and “Expenses Paid During Period” (if Actual Expenses Paid During Period were $7.50, then 8.6 x $7.50 = $64.50). In this illustration, the actual expenses paid this period are $64.50.
Hypothetical Example for Comparison with Other Funds
Under the heading “Hypothetical” in the table, information is provided about hypothetical account values and hypothetical expenses based on the Fund’s actual expense ratio and an assumed rate of return of 5% per year before expenses, which is not the Fund’s actual return. This information may not be used to estimate the actual ending account balance or expenses you paid for the period, but it can help you compare ongoing costs of investing in the Fund with those of other funds. To do so, compare this 5% hypothetical example for the class of shares you hold with the 5% hypothetical examples that appear in the shareholder reports of other funds.
Please note that expenses shown in the table are meant to highlight ongoing costs and do not reflect any transactional costs. Therefore, information under the heading “Hypothetical” is useful in comparing ongoing costs only, and will not help you compare total costs of owning different funds. In addition, if transactional costs were included, your total costs would have been higher.
| | | | | | | | | | | | | | | | | | |
| | | | | | | Actual (actual return after expenses) | | | | Hypothetical (5% annual return before expenses) | | | | |
Share
Class | | Beginning
Account
Value 7/1/19 | | | | Ending
Account
Value 12/31/19 | | Expenses
Paid During
Period
7/1/19–12/31/191, 2 | | | | Ending
Account
Value 12/31/19 | | Expenses Paid
During Period
7/1/19–12/31/191, 2 | | | | Net
Annualized
Expense Ratio2 |
| | | | | | | | | | | | |
| A | | $1,000 | | | | $1,061.10 | | $2.08 | | | | $1,023.19 | | $2.04 | | | | 0.40% |
| C | | $1,000 | | | | $1,057.00 | | $5.96 | | | | $1,019.41 | | $5.85 | | | | 1.15% |
| R | | $1,000 | | | | $1,059.30 | | $3.37 | | | | $1,021.93 | | $3.31 | | | | 0.65% |
| R6 | | $1,000 | | | | $1,062.40 | | $0.42 | | | | $1,024.80 | | $0.41 | | | | 0.08% |
| Advisor | | $1,000 | | | | $1,062.10 | | $0.78 | | | | $1,024.45 | | $0.77 | | | | 0.15% |
1. Expenses are equal to the annualized expense ratio for thesix-month period as indicated above—in the far right column—multiplied by the simple average account value over the period indicated, and then multiplied by 184/365 to reflect theone-half year period.
2. Reflects expenses after fee waivers and expense reimbursements. Does not include acquired fund fees and expenses.
| | | | |
franklintempleton.com | | Annual Report | | 15 |
FRANKLIN FUND ALLOCATOR SERIES
Financial Highlights
Franklin Corefolio Allocation Fund
| | | | | | | | | | | | | | | | | | | | |
| | | Year Ended December 31, | |
| | | 2019 | | | 2018 | | | 2017 | | | 2016 | | | 2015 | |
| | | | | |
Class A | | | | | | | | | | | | | | | | | | | | |
| | | | | |
Per share operating performance | | | | | | | | | | | | | | | | | | | | |
(for a share outstanding throughout the year) | | | | | | | | | | | | | | | | | | | | |
| | | | | |
Net asset value, beginning of year | | | $17.32 | | | | $19.68 | | | | $17.06 | | | | $16.80 | | | | $18.00 | |
| | | | | |
Income from investment operationsa: | | | | | | | | | | | | | | | | | | | | |
| | | | | |
Net investment incomeb,c | | | 0.20 | | | | 0.17 | | | | 0.17 | | | | 0.14 | | | | 0.14 | |
| | | | | |
Net realized and unrealized gains (losses) | | | 4.17 | | | | (1.51 | ) | | | 3.23 | | | | 1.07 | | | | (0.32 | ) |
| | | | | |
Total from investment operations | | | 4.37 | | | | (1.34 | ) | | | 3.40 | | | | 1.21 | | | | (0.18 | ) |
| | | | | |
Less distributions from: | | | | | | | | | | | | | | | | | | | | |
| | | | | |
Net investment income and short term gains received from Underlying Funds | | | (0.20 | ) | | | (0.15 | ) | | | (0.18 | ) | | | (0.17 | ) | | | (0.16 | ) |
| | | | | |
Net realized gains | | | (1.45 | ) | | | (0.87 | ) | | | (0.60 | ) | | | (0.78 | ) | | | (0.86 | ) |
| | | | | |
Total distributions | | | (1.65 | ) | | | (1.02 | ) | | | (0.78 | ) | | | (0.95 | ) | | | (1.02 | ) |
| | | | | |
Net asset value, end of year | | | $20.04 | | | | $17.32 | | | | $19.68 | | | | $17.06 | | | | $16.80 | |
| | | | | |
Total returnd | | | 25.79% | | | | (7.10)% | | | | 20.07% | | | | 7.64% | | | | (1.20)% | |
| | | | | |
Ratios to average net assets | | | | | | | | | | | | | | | | | | | | |
| | | | | |
Expensese,f | | | 0.44% | | | | 0.41% | | | | 0.47% | | | | 0.45% | | | | 0.47% | |
| | | | | |
Net investment incomec | | | 1.02% | | | | 0.76% | | | | 0.90% | | | | 0.83% | | | | 0.80% | |
| | | | | |
Supplemental data | | | | | | | | | | | | | | | | | | | | |
| | | | | |
Net assets, end of year (000’s) | | | $717,806 | | | | $593,983 | | | | $579,707 | | | | $507,530 | | | | $523,540 | |
| | | | | |
Portfolio turnover rate | | | 2.12% | | | | 3.94% | | | | 0.71% | | | | 0.40% | | | | 0.53% | |
aThe amount shown for a share outstanding throughout the period may not correlate with the Statement of Operations for the period due to the timing of sales and repurchases of the Fund’s shares in relation to income earned and/or fluctuating fair value of the investments of the Fund.
bBased on average daily shares outstanding.
cRecognition of net investment income by the Fund is affected by the timing of declaration of dividends by the Underlying Funds in which the Fund invests.
dTotal return does not reflect sales commissions or contingent deferred sales charges, if applicable.
eBenefit of waiver and payments by affiliates rounds to less than 0.01%.
fDoes not include expenses of the Underlying Funds in which the Fund invests. The weighted average indirect expenses of the Underlying Funds was 0.62% for the year ended December 31, 2019.
| | | | |
| | | |
16 | | Annual Report | The accompanying notes are an integral part of these financial statements. | | franklintempleton.com |
FRANKLIN FUND ALLOCATOR SERIES
FINANCIAL HIGHLIGHTS
Franklin Corefolio Allocation Fund(continued)
| | | | | | | | | | | | | | | | | | | | |
| | | Year Ended December 31, | |
| | | 2019 | | | 2018 | | | 2017 | | | 2016 | | | 2015 | |
| | | | | |
Class C | | | | | | | | | | | | | | | | | | | | |
| | | | | |
Per share operating performance | | | | | | | | | | | | | | | | | | | | |
(for a share outstanding throughout the year) | | | | | | | | | | | | | | | | | | | | |
| | | | | |
Net asset value, beginning of year | | | $17.10 | | | | $19.43 | | | | $16.85 | | | | $16.61 | | | | $17.81 | |
| | | | | |
Income from investment operationsa: | | | | | | | | | | | | | | | | | | | | |
| | | | | |
Net investment income (loss)b,c | | | 0.04 | | | | (0.10 | ) | | | 0.02 | | | | 0.01 | | | | 0.02 | |
| | | | | |
Net realized and unrealized gains (losses) | | | 4.12 | | | | (1.35 | ) | | | 3.19 | | | | 1.05 | | | | (0.33 | ) |
| | | | | |
Total from investment operations | | | 4.16 | | | | (1.45 | ) | | | 3.21 | | | | 1.06 | | | | (0.31 | ) |
| | | | | |
Less distributions from: | | | | | | | | | | | | | | | | | | | | |
| | | | | |
Net investment income and short term gains received from Underlying Funds | | | (0.05 | ) | | | (0.01 | ) | | | (0.03 | ) | | | (0.04 | ) | | | (0.03 | ) |
| | | | | |
Net realized gains | | | (1.45 | ) | | | (0.87 | ) | | | (0.60 | ) | | | (0.78 | ) | | | (0.86 | ) |
| | | | | |
Total distributions | | | (1.50 | ) | | | (0.88 | ) | | | (0.63 | ) | | | (0.82 | ) | | | (0.89 | ) |
| | | | | |
Net asset value, end of year | | | $19.76 | | | | $17.10 | | | | $19.43 | | | | $16.85 | | | | $16.61 | |
| | | | | |
Total returnd | | | 24.83% | | | | (7.76)% | | | | 19.20% | | | | 6.82% | | | | (1.92)% | |
| | | | | |
Ratios to average net assets | | | | | | | | | | | | | | | | | | | | |
| | | | | |
Expensese,f | | | 1.19% | | | | 1.16% | | | | 1.22% | | | | 1.20% | | | | 1.19% | |
| | | | | |
Net investment incomec | | | 0.27% | | | | 0.01% | | | | 0.15% | | | | 0.08% | | | | 0.08% | |
| | | | | |
Supplemental data | | | | | | | | | | | | | | | | | | | | |
| | | | | |
Net assets, end of year (000’s) | | | $75,745 | | | | $72,124 | | | | $170,218 | | | | $160,729 | | | | $172,116 | |
| | | | | |
Portfolio turnover rate | | | 2.12% | | | | 3.94% | | | | 0.71% | | | | 0.40% | | | | 0.53% | |
aThe amount shown for a share outstanding throughout the period may not correlate with the Statement of Operations for the period due to the timing of sales and repurchases of the Fund’s shares in relation to income earned and/or fluctuating fair value of the investments of the Fund.
bBased on average daily shares outstanding.
cRecognition of net investment income by the Fund is affected by the timing of declaration of dividends by the Underlying Funds in which the Fund invests.
dTotal return does not reflect sales commissions or contingent deferred sales charges, if applicable.
eBenefit of waiver and payments by affiliates rounds to less than 0.01%.
fDoes not include expenses of the Underlying Funds in which the Fund invests. The weighted average indirect expenses of the Underlying Funds was 0.62% for the year ended December 31, 2019.
| | | | |
franklintempleton.com | | The accompanying notes are an integral part of these financial statements. | Annual Report | | 17 |
FRANKLIN FUND ALLOCATOR SERIES
FINANCIAL HIGHLIGHTS
Franklin Corefolio Allocation Fund(continued)
| | | | | | | | | | | | | | | | | | | | |
| | | Year Ended December 31, | |
| | | 2019 | | | 2018 | | | 2017 | | | 2016 | | | 2015 | |
| | | | | |
Class R | | | | | | | | | | | | | | | | | | | | |
| | | | | |
Per share operating performance | | | | | | | | | | | | | | | | | | | | |
(for a share outstanding throughout the year) | | | | | | | | | | | | | | | | | | | | |
| | | | | |
Net asset value, beginning of year | | | $17.34 | | | | $19.68 | | | | $17.06 | | | | $16.81 | | | | $18.01 | |
| | | | | |
Income from investment operationsa: | | | | | | | | | | | | | | | | | | | | |
| | | | | |
Net investment incomeb,c | | | 0.14 | | | | 0.10 | | | | 0.12 | | | | 0.10 | | | | 0.10 | |
| | | | | |
Net realized and unrealized gains (losses) | | | 4.19 | | | | (1.48 | ) | | | 3.23 | | | | 1.06 | | | | (0.32 | ) |
| | | | | |
Total from investment operations | | | 4.33 | | | | (1.38 | ) | | | 3.35 | | | | 1.16 | | | | (0.22 | ) |
| | | | | |
Less distributions from: | | | | | | | | | | | | | | | | | | | | |
| | | | | |
Net investment income and short term gains received from Underlying Funds | | | (0.15 | ) | | | (0.09 | ) | | | (0.13 | ) | | | (0.13 | ) | | | (0.12 | ) |
| | | | | |
Net realized gains | | | (1.45 | ) | | | (0.87 | ) | | | (0.60 | ) | | | (0.78 | ) | | | (0.86 | ) |
| | | | | |
Total distributions | | | (1.60 | ) | | | (0.96 | ) | | | (0.73 | ) | | | (0.91 | ) | | | (0.98 | ) |
| | | | | |
Net asset value, end of year | | | $20.07 | | | | $17.34 | | | | $19.68 | | | | $17.06 | | | | $16.81 | |
| | | | | |
Total return | | | 25.51% | | | | (7.30)% | | | | 19.79% | | | | 7.33% | | | | (1.43)% | |
| | | | | |
Ratios to average net assets | | | | | | | | | | | | | | | | | | | | |
| | | | | |
Expensesd,e | | | 0.67% | | | | 0.65% | | | | 0.72% | | | | 0.70% | | | | 0.69% | |
| | | | | |
Net investment incomec | | | 0.79% | | | | 0.52% | | | | 0.65% | | | | 0.58% | | | | 0.58% | |
| | | | | |
Supplemental data | | | | | | | | | | | | | | | | | | | | |
| | | | | |
Net assets, end of year (000’s) | | | $1,387 | | | | $1,412 | | | | $1,629 | | | | $1,461 | | | | $1,423 | |
| | | | | |
Portfolio turnover rate | | | 2.12% | | | | 3.94% | | | | 0.71% | | | | 0.40% | | | | 0.53% | |
aThe amount shown for a share outstanding throughout the period may not correlate with the Statement of Operations for the period due to the timing of sales and repurchases of the Fund’s shares in relation to income earned and/or fluctuating fair value of the investments of the Fund.
bBased on average daily shares outstanding.
cRecognition of net investment income by the Fund is affected by the timing of declaration of dividends by the Underlying Funds in which the Fund invests.
dBenefit of waiver and payments by affiliates rounds to less than 0.01%.
eDoes not include expenses of the Underlying Funds in which the Fund invests. The weighted average indirect expenses of the Underlying Funds was 0.62% for the year ended December 31, 2019.
| | | | |
| | | |
18 | | Annual Report| The accompanying notes are an integral part of these financial statements. | | franklintempleton.com |
FRANKLIN FUND ALLOCATOR SERIES
FINANCIAL HIGHLIGHTS
Franklin Corefolio Allocation Fund(continued)
| | | | | | | | | | | | |
| | | Year Ended December 31, | |
| | | 2019 | | | 2018 | | | 2017a | |
| | | |
Class R6 | | | | | | | | | | | | |
| | | |
Per share operating performance | | | | | | | | | | | | |
(for a share outstanding throughout the year) | | | | | | | | | | | | |
| | | |
Net asset value, beginning of year | | | $17.34 | | | | $19.67 | | | | $19.18 | |
| | | |
Income from investment operationsb: | | | | | | | | | | | | |
| | | |
Net investment incomec,d | | | 0.70 | | | | 0.27 | | | | 0.26 | |
| | | |
Net realized and unrealized gains (losses) | | | 3.75 | | | | (1.52 | ) | | | 0.73 | |
| | | |
Total from investment operations | | | 4.45 | | | | (1.25 | ) | | | 0.99 | |
| | | |
Less distributions from: | | | | | | | | | | | | |
| | | |
Net investment income | | | (0.27 | ) | | | (0.21 | ) | | | (0.25 | ) |
| | | |
Net realized gains | | | (1.45 | ) | | | (0.87 | ) | | | (0.25 | ) |
| | | |
Total distributions | | | (1.72 | ) | | | (1.08 | ) | | | (0.50 | ) |
| | | |
Net asset value, end of year | | | $20.07 | | | | $17.34 | | | | $19.67 | |
| | | |
Total returne | | | 26.24% | | | | (6.78)% | | | | 5.28% | |
| | | |
Ratios to average net assetsf | | | | | | | | | | | | |
| | | |
Expenses before waiver and payments by affiliatesg | | | 0.12% | | | | 0.23% | | | | 3.47% | |
| | | |
Expenses net of waiver and payments by affiliatesg | | | 0.09% | | | | 0.09% | | | | 0.08% | |
| | | |
Net investment incomed | | | 1.37% | | | | 1.08% | | | | 1.29% | |
| | | |
Supplemental data | | | | | | | | | | | | |
| | | |
Net assets, end of year (000’s) | | | $3,385 | | | | $75 | | | | $5 | |
| | | |
Portfolio turnover rate | | | 2.12% | | | | 3.94% | | | | 0.71% | |
aFor the period August 1, 2017 (effective date) to December 31, 2017.
bThe amount shown for a share outstanding throughout the period may not correlate with the Statement of Operations for the period due to the timing of sales and repurchases of the Fund’s shares in relation to income earned and/or fluctuating fair value of the investments of the Fund.
cBased on average daily shares outstanding.
dRecognition of net investment income by the Fund is affected by the timing of declaration of dividends by the Underlying Funds in which the Fund invests.
eTotal return is not annualized for periods less than one year.
fRatios are annualized for periods less than one year.
gDoes not include expenses of the Underlying Funds in which the Fund invests. The weighted average indirect expenses of the Underlying Funds was 0.62% for the year ended December 31, 2019.
| | | | |
franklintempleton.com | | The accompanying notes are an integral part of these financial statements. | Annual Report | | 19 |
FRANKLIN FUND ALLOCATOR SERIES
FINANCIAL HIGHLIGHTS
Franklin Corefolio Allocation Fund(continued)
| | | | | | | | | | | | | | | | | | | | |
| | | Year Ended December 31, | |
| | | 2019 | | | 2018 | | | 2017 | | | 2016 | | | 2015 | |
| | | | | |
Advisor Class | | | | | | | | | | | | | | | | | | | | |
| | | | | |
Per share operating performance | | | | | | | | | | | | | | | | | | | | |
(for a share outstanding throughout the year) | | | | | | | | | | | | | | | | | | | | |
| | | | | |
Net asset value, beginning of year | | | $17.35 | | | | $19.71 | | | | $17.08 | | | | $16.82 | | | | $18.03 | |
| | | | | |
Income from investment operationsa: | | | | | | | | | | | | | | | | | | | | |
| | | | | |
Net investment incomeb,c | | | 0.27 | | | | 0.24 | | | | 0.25 | | | | 0.21 | | | | 0.21 | |
| | | | | |
Net realized and unrealized gains (losses) | | | 4.16 | | | | (1.53 | ) | | | 3.21 | | | | 1.04 | | | | (0.35 | ) |
| | | | | |
Total from investment operations | | | 4.43 | | | | (1.29 | ) | | | 3.46 | | | | 1.25 | | | | (0.14 | ) |
| | | | | |
Less distributions from: | | | | | | | | | | | | | | | | | | | | |
| | | | | |
Net investment income and short term gains received from Underlying Funds | | | (0.25 | ) | | | (0.20 | ) | | | (0.23 | ) | | | (0.21 | ) | | | (0.21 | ) |
| | | | | |
Net realized gains | | | (1.45 | ) | | | (0.87 | ) | | | (0.60 | ) | | | (0.78 | ) | | | (0.86 | ) |
| | | | | |
Total distributions | | | (1.70 | ) | | | (1.07 | ) | | | (0.83 | ) | | | (0.99 | ) | | | (1.07 | ) |
| | | | | |
Net asset value, end of year | | | $20.08 | | | | $17.35 | | | | $19.71 | | | | $17.08 | | | | $16.82 | |
| | | | | |
Total return | | | 26.10% | | | | (6.85)% | | | | 20.40% | | | | 7.90% | | | | (0.96)% | |
| | | | | |
Ratios to average net assets | | | | | | | | | | | | | | | | | | | | |
| | | | | |
Expensesd,e | | | 0.19% | | | | 0.16% | | | | 0.22% | | | | 0.20% | | | | 0.19% | |
| | | | | |
Net investment incomec | | | 1.27% | | | | 1.01% | | | | 1.15% | | | | 1.08% | | | | 1.08% | |
| | | | | |
Supplemental data | | | | | | | | | | | | | | | | | | | | |
| | | | | |
Net assets, end of year (000’s) | | | $52,512 | | | | $40,399 | | | | $33,607 | | | | $22,721 | | | | $19,396 | |
| | | | | |
Portfolio turnover rate | | | 2.12% | | | | 3.94% | | | | 0.71% | | | | 0.40% | | | | 0.53% | |
aThe amount shown for a share outstanding throughout the period may not correlate with the Statement of Operations for the period due to the timing of sales and repurchases of the Fund’s shares in relation to income earned and/or fluctuating fair value of the investments of the Fund.
bBased on average daily shares outstanding.
cRecognition of net investment income by the Fund is affected by the timing of declaration of dividends by the Underlying Funds in which the Fund invests.
dBenefit of waiver and payments by affiliates rounds to less than 0.01%.
eDoes not include expenses of the Underlying Funds in which the Fund invests. The weighted average indirect expenses of the Underlying Funds was 0.62% for the year ended December 31, 2019.
| | | | |
| | | |
20 | | Annual Report| The accompanying notes are an integral part of these financial statements. | | franklintempleton.com |
FRANKLIN FUND ALLOCATOR SERIES
Statement of Investments, December 31, 2019
Franklin Corefolio Allocation Fund
| | | | | | | | |
| | | Shares | | | Value | |
| | |
Investments in Underlying Funds 99.9% | | | | | | | | |
Domestic Equity 74.8% | | | | | | | | |
aFranklin Growth Fund, Class R6 | | | 1,911,755 | | | $ | 214,690,054 | |
a,bFranklin Growth Opportunities Fund, Class R6 | | | 4,797,989 | | | | 207,896,880 | |
aFranklin Mutual Shares Fund, Class R6 | | | 7,772,456 | | | | 214,131,158 | |
| | | | | | | | |
| | |
| | | | | | | 636,718,092 | |
| | | | | | | | |
Foreign Equity 25.1% | | | | | | | | |
aTempleton Growth Fund Inc., Class R6 | | | 9,468,941 | | | | 213,524,625 | |
| | | | | | | | |
| | |
Total Investments in Underlying Funds before Short Term Investments (Cost $595,973,271) | | | | | | | 850,242,717 | |
| | | | | | | | |
| | |
Short Term Investments (Cost $184) 0.0%† | | | | | | | | |
| | |
Money Market Funds 0.0%† | | | | | | | | |
a,cInstitutional Fiduciary Trust Money Market Portfolio, 1.26%. | | | 184 | | | | 184 | |
| | | | | | | | |
| | |
Total Investments in Underlying Funds (Cost $595,973,455) 99.9% | | | | | | | 850,242,901 | |
Other Assets, less Liabilities 0.1% | | | | | | | 593,263 | |
| | | | | | | | |
| | |
Net Assets 100.0% | | | | | | $ | 850,836,164 | |
| | | | | | | | |
†Rounds to less than 0.1% of net assets.
aSee Note 3(e) regarding investments in FT Underlying Funds.
bNon-income producing.
cThe rate shown is the annualizedseven-day effective yield at period end.
| | | | |
franklintempleton.com | | The accompanying notes are an integral part of these financial statements. | Annual Report | | 21 |
FRANKLIN FUND ALLOCATOR SERIES
Financial Highlights
Franklin Founding Funds Allocation Fund
| | | | | | | | | | | | | | | | | | | | |
| | | Year Ended December 31, | |
| | | 2019 | | | 2018 | | | 2017 | | | 2016 | | | 2015 | |
| | | | | |
Class A | | | | | | | | | | | | | | | | | | | | |
| | | | | |
Per share operating performance | | | | | | | | | | | | | | | | | | | | |
(for a share outstanding throughout the year) | | | | | | | | | | | | | | | | | | | | |
| | | | | |
Net asset value, beginning of year | | | $12.63 | | | | $14.54 | | | | $13.47 | | | | $12.14 | | | | $13.31 | |
| | | | | |
Income from investment operationsa: | | | | | | | | | | | | | | | | | | | | |
| | | | | |
Net investment incomeb,c | | | 0.42 | | | | 0.41 | | | | 0.40 | | | | 0.36 | | | | 0.35 | |
| | | | | |
Net realized and unrealized gains (losses) | | | 1.82 | | | | (1.82 | ) | | | 1.10 | | | | 1.26 | | | | (1.16 | ) |
| | | | | |
Total from investment operations | | | 2.24 | | | | (1.41 | ) | | | 1.50 | | | | 1.62 | | | | (0.81 | ) |
| | | | | |
Less distributions from: | | | | | | | | | | | | | | | | | | | | |
| | | | | |
Net investment income | | | (0.44 | ) | | | (0.50 | ) | | | (0.43 | ) | | | (0.29 | ) | | | (0.36 | ) |
| | | | | |
Net asset value, end of year | | | $14.43 | | | | $12.63 | | | | $14.54 | | | | $13.47 | | | | $12.14 | |
| | | | | |
Total returnd | | | 17.81% | | | | (9.82)% | | | | 11.20% | | | | 13.52% | | | | (6.18)% | |
| | | | | |
Ratios to average net assets | | | | | | | | | | | | | | | | | | | | |
| | | | | |
Expensese,f | | | 0.40% | | | | 0.39% | | | | 0.43% | | | | 0.42% | | | | 0.41% | |
| | | | | |
Net investment incomec | | | 2.99% | | | | 2.66% | | | | 2.81% | | | | 2.87% | | | | 2.65% | |
| | | | | |
Supplemental data | | | | | | | | | | | | | | | | | | | | |
| | | | | |
Net assets, end of year (000’s) | | | $3,397,662 | | | | $3,209,751 | | | | $3,300,005 | | | | $3,310,397 | | | | $3,346,192 | |
| | | | | |
Portfolio turnover rate | | | 0.29% | | | | 0.73% | | | | 0.48% | | | | 0.06% | | | | —% | |
aThe amount shown for a share outstanding throughout the period may not correlate with the Statement of Operations for the period due to the timing of sales and repurchases of the Fund’s shares in relation to income earned and/or fluctuating fair value of the investments of the Fund.
bBased on average daily shares outstanding.
cRecognition of net investment income by the Fund is affected by the timing of declaration of dividends by the Underlying Funds in which the Fund invests.
dTotal return does not reflect sales commissions or contingent deferred sales charges, if applicable.
eBenefit of waiver and payments by affiliates rounds to less than 0.01%.
fDoes not include expenses of the Underlying Funds in which the Fund invests. The weighted average indirect expenses of the Underlying Funds was 0.61% for the year ended December 31, 2019.
| | | | |
| | | |
22 | | Annual Report| The accompanying notes are an integral part of these financial statements. | | franklintempleton.com |
FRANKLIN FUND ALLOCATOR SERIES
FINANCIAL HIGHLIGHTS
Franklin Founding Funds Allocation Fund(continued)
| | | | | | | | | | | | | | | | | | | | |
| | | Year Ended December 31, | |
| | | 2019 | | | 2018 | | | 2017 | | | 2016 | | | 2015 | |
| | | | | |
Class C | | | | | | | | | | | | | | | | | | | | |
| | | | | |
Per share operating performance | | | | | | | | | | | | | | | | | | | | |
(for a share outstanding throughout the year) | | | | | | | | | | | | | | | | | | | | |
| | | | | |
Net asset value, beginning of year | | | $12.54 | | | | $14.33 | | | | $13.27 | | | | $11.96 | | | | $13.11 | |
| | | | | |
Income from investment operationsa: | | | | | | | | | | | | | | | | | | | | |
| | | | | |
Net investment incomeb,c | | | 0.29 | | | | 0.18 | | | | 0.28 | | | | 0.26 | | | | 0.25 | |
| | | | | |
Net realized and unrealized gains (losses) | | | 1.82 | | | | (1.67 | ) | | | 1.10 | | | | 1.25 | | | | (1.14 | ) |
| | | | | |
Total from investment operations | | | 2.11 | | | | (1.49 | ) | | | 1.38 | | | | 1.51 | | | | (0.89 | ) |
| | | | | |
Less distributions from: | | | | | | | | | | | | | | | | | | | | |
| | | | | |
Net investment income | | | (0.32 | ) | | | (0.30 | ) | | | (0.32 | ) | | | (0.20 | ) | | | (0.26 | ) |
| | | | | |
Net asset value, end of year | | | $14.33 | | | | $12.54 | | | | $14.33 | | | | $13.27 | | | | $11.96 | |
| | | | | |
Total returnd | | | 16.91% | | | | (10.54)% | | | | 10.43% | | | | 12.71% | | | | (6.85)% | |
| | | | | |
Ratios to average net assets | | | | | | | | | | | | | | | | | | | | |
| | | | | |
Expensese,f | | | 1.15% | | | | 1.14% | | | | 1.18% | | | | 1.17% | | | | 1.16% | |
| | | | | |
Net investment incomec | | | 2.24% | | | | 1.91% | | | | 2.06% | | | | 2.12% | | | | 1.90% | |
| | | | | |
Supplemental data | | | | | | | | | | | | | | | | | | | | |
| | | | | |
Net assets, end of year (000’s) | | | $300,699 | | | | $362,833 | | | | $1,261,997 | | | | $1,402,623 | | | | $1,458,281 | |
| | | | | |
Portfolio turnover rate | | | 0.29% | | | | 0.73% | | | | 0.48% | | | | 0.06% | | | | —% | |
aThe amount shown for a share outstanding throughout the period may not correlate with the Statement of Operations for the period due to the timing of sales and repurchases of the Fund’s shares in relation to income earned and/or fluctuating fair value of the investments of the Fund.
bBased on average daily shares outstanding.
cRecognition of net investment income by the Fund is affected by the timing of declaration of dividends by the Underlying Funds in which the Fund invests.
dTotal return does not reflect sales commissions or contingent deferred sales charges, if applicable.
eBenefit of waiver and payments by affiliates rounds to less than 0.01%.
fDoes not include expenses of the Underlying Funds in which the Fund invests. The weighted average indirect expenses of the Underlying Funds was 0.61% for the year ended December 31, 2019.
| | | | |
franklintempleton.com | | The accompanying notes are an integral part of these financial statements. | Annual Report | | 23 |
FRANKLIN FUND ALLOCATOR SERIES
FINANCIAL HIGHLIGHTS
Franklin Founding Funds Allocation Fund(continued)
| | | | | | | | | | | | | | | | | | | | |
| | | Year Ended December 31, | |
| | | 2019 | | | 2018 | | | 2017 | | | 2016 | | | 2015 | |
| | | | | |
Class R | | | | | | | | | | | | | | | | | | | | |
| | | | | |
Per share operating performance | | | | | | | | | | | | | | | | | | | | |
(for a share outstanding throughout the year) | | | | | | | | | | | | | | | | | | | | |
| | | | | |
Net asset value, beginning of year | | | $12.68 | | | | $14.58 | | | | $13.49 | | | | $12.16 | | | | $13.33 | |
| | | | | |
Income from investment operationsa: | | | | | | | | | | | | | | | | | | | | |
| | | | | |
Net investment incomeb,c | | | 0.37 | | | | 0.34 | | | | 0.34 | | | | 0.33 | | | | 0.32 | |
| | | | | |
Net realized and unrealized gains (losses) | | | 1.83 | | | | (1.78 | ) | | | 1.13 | | | | 1.26 | | | | (1.16 | ) |
| | | | | |
Total from investment operations | | | 2.20 | | | | (1.44 | ) | | | 1.47 | | | | 1.59 | | | | (0.84 | ) |
| | | | | |
Less distributions from: | | | | | | | | | | | | | | | | | | | | |
| | | | | |
Net investment income | | | (0.40 | ) | | | (0.46 | ) | | | (0.38 | ) | | | (0.26 | ) | | | (0.33 | ) |
| | | | | |
Net asset value, end of year | | | $14.48 | | | | $12.68 | | | | $14.58 | | | | $13.49 | | | | $12.16 | |
| | | | | |
Total return | | | 17.44% | | | | (10.01)% | | | | 10.97% | | | | 13.22% | | | | (6.40)% | |
| | | | | |
Ratios to average net assets | | | | | | | | | | | | | | | | | | | | |
| | | | | |
Expensesd,e | | | 0.65% | | | | 0.64% | | | | 0.68% | | | | 0.67% | | | | 0.66% | |
| | | | | |
Net investment incomec | | | 2.74% | | | | 2.41% | | | | 2.56% | | | | 2.62% | | | | 2.40% | |
| | | | | |
Supplemental data | | | | | | | | | | | | | | | | | | | | |
| | | | | |
Net assets, end of year (000’s) | | | $5,699 | | | | $5,513 | | | | $7,843 | | | | $10,776 | | | | $10,724 | |
| | | | | |
Portfolio turnover rate | | | 0.29% | | | | 0.73% | | | | 0.48% | | | | 0.06% | | | | —% | |
aThe amount shown for a share outstanding throughout the period may not correlate with the Statement of Operations for the period due to the timing of sales and repurchases of the Fund’s shares in relation to income earned and/or fluctuating fair value of the investments of the Fund.
bBased on average daily shares outstanding.
cRecognition of net investment income by the Fund is affected by the timing of declaration of dividends by the Underlying Funds in which the Fund invests.
dBenefit of waiver and payments by affiliates rounds to less than 0.01%.
eDoes not include expenses of the Underlying Funds in which the Fund invests. The weighted average indirect expenses of the Underlying Funds was 0.61% for the year ended December 31, 2019.
| | | | |
| | | |
24 | | Annual Report| The accompanying notes are an integral part of these financial statements. | | franklintempleton.com |
FRANKLIN FUND ALLOCATOR SERIES
FINANCIAL HIGHLIGHTS
Franklin Founding Funds Allocation Fund(continued)
| | | | | | | | | | | | |
| | | Year Ended December 31, | |
| | | 2019 | | | 2018 | | | 2017a | |
| | | |
Class R6 | | | | | | | | | | | | |
| | | |
Per share operating performance | | | | | | | | | | | | |
(for a share outstanding throughout the year) | | | | | | | | | | | | |
| | | |
Net asset value, beginning of year | | | $12.95 | | | | $14.62 | | | | $14.46 | |
| | | | |
| | | |
Income from investment operationsb: | | | | | | | | | | | | |
| | | |
Net investment incomec,d | | | 0.46 | | | | 0.37 | | | | 0.30 | |
| | | |
Net realized and unrealized gains (losses) | | | 1.88 | | | | (1.75 | ) | | | 0.06 | |
| | | | |
| | | |
Total from investment operations | | | 2.34 | | | | (1.38 | ) | | | 0.36 | |
| | | | |
| | | |
Less distributions from: | | | | | | | | | | | | |
| | | |
Net investment income | | | (0.48 | ) | | | (0.29 | ) | | | (0.20 | ) |
| | | | |
| | | |
Net asset value, end of year | | | $14.81 | | | | $12.95 | | | | $14.62 | |
| | | | |
| | | |
Total returne | | | 18.18% | | | | (9.57)% | | | | 2.56% | |
| | | |
Ratios to average net assetsf | | | | | | | | | | | | |
| | | |
Expenses before waiver and payments by affiliatesg | | | 3.23% | | | | 0.08% | | | | 4.28% | |
| | | |
Expenses net of waiver and payments by affiliatesg | | | 0.07% | | | | 0.07% | | | | 0.06% | |
| | | |
Net investment incomed | | | 3.32% | | | | 2.98% | | | | 3.18% | |
| | | |
Supplemental data | | | | | | | | | | | | |
| | | |
Net assets, end of year (000’s) | | | $5 | | | | $4 | | | | $5 | |
| | | |
Portfolio turnover rate | | | 0.29% | | | | 0.73% | | | | 0.48% | |
aFor the period August 1, 2017 (effective date) to December 31, 2017.
bThe amount shown for a share outstanding throughout the period may not correlate with the Statement of Operations for the period due to the timing of sales and repurchases of the Fund’s shares in relation to income earned and/or fluctuating fair value of the investments of the Fund.
cBased on average daily shares outstanding.
dRecognition of net investment income by the Fund is affected by the timing of declaration of dividends by the Underlying Funds in which the Fund invests.
eTotal return is not annualized for periods less than one year.
fRatios are annualized for periods less than one year.
gDoes not include expenses of the Underlying Funds in which the Fund invests. The weighted average indirect expenses of the Underlying Funds was 0.61% for the year ended December 31, 2019.
| | | | |
franklintempleton.com | | The accompanying notes are an integral part of these financial statements. | Annual Report | | 25 |
FRANKLIN FUND ALLOCATOR SERIES
FINANCIAL HIGHLIGHTS
Franklin Founding Funds Allocation Fund(continued)
| | | | | | | | | | | | | | | | | | | | |
| | | Year Ended December 31, | |
| | | 2019 | | | 2018 | | | 2017 | | | 2016 | | | 2015 | |
| | | | | |
Advisor Class | | | | | | | | | | | | | | | | | | | | |
| | | | | |
Per share operating performance | | | | | | | | | | | | | | | | | | | | |
(for a share outstanding throughout the year) | | | | | | | | | | | | | | | | | | | | |
| | | | | |
Net asset value, beginning of year | | | $12.71 | | | | $14.63 | | | | $13.54 | | | | $12.20 | | | | $13.38 | |
| | | | | |
Income from investment operationsa: | | | | | | | | | | | | | | | | | | | | |
| | | | | |
Net investment incomeb,c | | | 0.45 | | | | 0.43 | | | | 0.46 | | | | 0.40 | | | | 0.39 | |
| | | | | |
Net realized and unrealized gains (losses) | | | 1.83 | | | | (1.81 | ) | | | 1.10 | | | | 1.26 | | | | (1.18 | ) |
| | | | | |
Total from investment operations | | | 2.28 | | | | (1.38 | ) | | | 1.56 | | | | 1.66 | | | | (0.79 | ) |
| | | | | |
Less distributions from: | | | | | | | | | | | | | | | | | | | | |
| | | | | |
Net investment income | | | (0.47 | ) | | | (0.54 | ) | | | (0.47 | ) | | | (0.32 | ) | | | (0.39 | ) |
| | | | | |
Net asset value, end of year | | | $14.52 | | | | $12.71 | | | | $14.63 | | | | $13.54 | | | | $12.20 | |
| | | | | |
Total return | | | 18.06% | | | | (9.60)% | | | | 11.58% | | | | 13.82% | | | | (5.98)% | |
| | | | | |
Ratios to average net assets | | | | | | | | | | | | | | | | | | | | |
| | | | | |
Expensesd,e | | | 0.15% | | | | 0.14% | | | | 0.18% | | | | 0.17% | | | | 0.16% | |
| | | | | |
Net investment incomec | | | 3.24% | | | | 2.91% | | | | 3.06% | | | | 3.12% | | | | 2.90% | |
| | | | | |
Supplemental data | | | | | | | | | | | | | | | | | | | | |
| | | | | |
Net assets, end of year (000’s) | | | $156,275 | | | | $145,522 | | | | $174,219 | | | | $131,368 | | | | $123,966 | |
| | | | | |
Portfolio turnover rate | | | 0.29% | | | | 0.73% | | | | 0.48% | | | | 0.06% | | | | —% | |
aThe amount shown for a share outstanding throughout the period may not correlate with the Statement of Operations for the period due to the timing of sales and repurchases of the Fund’s shares in relation to income earned and/or fluctuating fair value of the investments of the Fund.
bBased on average daily shares outstanding.
cRecognition of net investment income by the Fund is affected by the timing of declaration of dividends by the Underlying Funds in which the Fund invests.
dBenefit of waiver and payments by affiliates rounds to less than 0.01%.
eDoes not include expenses of the Underlying Funds in which the Fund invests. The weighted average indirect expenses of the Underlying Funds was 0.61% for the year ended December 31, 2019.
| | | | |
| | | |
26 | | Annual Report| The accompanying notes are an integral part of these financial statements. | | franklintempleton.com |
FRANKLIN FUND ALLOCATOR SERIES
Statement of Investments, December 31, 2019
Franklin Founding Funds Allocation Fund
| | | | | | | | |
| | |
| | | Shares | | | Value | |
| Investments in Underlying Funds 100.0% | | | | | | |
| Domestic Equity 33.4% | | | | | | |
aFranklin Mutual Shares Fund, Class R6 | | | 46,904,895 | | | $ | 1,292,229,850 | |
| | | | | | | | |
| Domestic Hybrid 33.2% | | | | | | |
aFranklin Income Fund, Class R6 | | | 549,701,272 | | | | 1,280,803,963 | |
| | | | | | | | |
| Foreign Equity 33.4% | | | | | | |
aTempleton Growth Fund Inc., Class R6 | | | 57,160,167 | | �� | | 1,288,961,776 | |
| | | | | | | | |
Total Investments in Underlying Funds before Short Term Investments
(Cost $3,871,324,058) | | | | | | | 3,861,995,589 | |
| | | | | | | | |
| | |
| Short Term Investments (Cost $152) 0.0%† | | | | | | |
| | |
| Money Market Funds 0.0%† | | | | | | |
a,bInstitutional Fiduciary Trust Money Market Portfolio, 1.26% | | | 152 | | | | 152 | |
| | | | | | | | |
Total Investments in Underlying Funds (Cost $3,871,324,210) 100.0% | | | | | | | 3,861,995,741 | |
Other Assets, less Liabilities (0.0)%† | | | | | | | (1,654,841 | ) |
| | | | | | | | |
Net Assets 100.0%. | | | | | | $ | 3,860,340,900 | |
| | | | | | | | |
† Rounds to less than 0.1% of net assets.
a See Note 3(e) regarding investments in FT Underlying Funds.
b The rate shown is the annualizedseven-day effective yield at period end.
| | | | |
franklintempleton.com | | The accompanying notes are an integral part of these financial statements. | Annual Report | | 27 |
FRANKLIN FUND ALLOCATOR SERIES
FINANCIAL STATEMENTS
Statements of Assets and Liabilities
December 31, 2019
| | | | | | | | |
| | |
| | | Franklin
Corefolio
Allocation Fund | | | Franklin
Founding
Funds
Allocation Fund | |
Assets: | | | | | | | | |
Investments in securities: | | | | | | | | |
Cost -Non-controlled affiliates (Note 3e) | | $ | 595,973,455 | | | $ | 3,871,324,210 | |
| | | | |
Value -Non-controlled affiliates (Note 3e) | | $ | 850,242,901 | | | $ | 3,861,995,741 | |
Receivables: | | | | | | | | |
Investment securities sold | | | 1,372,555 | | | | 11,017,346 | |
Capital shares sold | | | 856,069 | | | | 2,387,260 | |
Other assets | | | 93 | | | | 476 | |
| | | | |
Total assets | | | 852,471,618 | | | | 3,875,400,823 | |
| | | | |
Liabilities: | | | | | | | | |
Payables: | | | | | | | | |
Capital shares redeemed | | | 671,027 | | | | 5,386,753 | |
Administrative fees | | | 21,399 | | | | 97,594 | |
Distribution fees | | | 214,352 | | | | 971,536 | |
Transfer agent fees | | | 121,998 | | | | 680,202 | |
Funds advanced by custodian | | | 550,079 | | | | 7,733,745 | |
Accrued expenses and other liabilities. | | | 56,599 | | | | 190,093 | |
| | | | |
Total liabilities | | | 1,635,454 | | | | 15,059,923 | |
| | | | |
Net assets, at value | | $ | 850,836,164 | | | $ | 3,860,340,900 | |
| | | | |
Net assets consist of: | | | | | | | | |
Paid-in capital | | $ | 566,310,208 | | | $ | 3,720,277,567 | |
Total distributable earnings (losses) | | | 284,525,956 | | | | 140,063,333 | |
| | | | |
Net assets, at value | | $ | 850,836,164 | | | $ | 3,860,340,900 | |
| | | | |
| | | | |
| | | |
28 | | Annual Report| The accompanying notes are an integral part of these financial statements. | | franklintempleton.com |
FRANKLIN FUND ALLOCATOR SERIES
FINANCIAL STATEMENTS
Statements of Assets and Liabilities(continued)
December 31, 2019
| | | | | | | | |
| | | Franklin
Corefolio
Allocation Fund | | | Franklin
Founding
Funds
Allocation Fund | |
| | |
Class A: | | | | | | | | |
Net assets, at value | | $ | 717,806,493 | | | $ | 3,397,662,364 | |
| | | | |
Shares outstanding | | | 35,820,898 | | | | 235,497,012 | |
| | | | |
Net asset value per sharea | | $ | 20.04 | | | $ | 14.43 | |
| | | | |
Maximum offering price per share (net asset value per share ÷ 94.50%) | | $ | 21.21 | | | $ | 15.27 | |
| | | | |
Class C: | | | | | | | | |
Net assets, at value | | $ | 75,745,159 | | | $ | 300,699,421 | |
| | | | |
Shares outstanding | | | 3,833,588 | | | | 20,986,370 | |
| | | | |
Net asset value and maximum offering price per sharea | | $ | 19.76 | | | $ | 14.33 | |
| | | | |
Class R: | | | | | | | | |
Net assets, at value | | $ | 1,387,086 | | | $ | 5,699,352 | |
| | | | |
Shares outstanding | | | 69,121 | | | | 393,645 | |
| | | | |
Net asset value and maximum offering price per share | | $ | 20.07 | | | $ | 14.48 | |
| | | | |
Class R6: | | | | | | | | |
Net assets, at value | | $ | 3,385,079 | | | $ | 5,124 | |
| | | | |
Shares outstanding | | | 168,672 | | | | 346 | |
| | | | |
Net asset value and maximum offering price per share | | $ | 20.07 | | | $ | 14.81 | |
| | | | |
Advisor Class: | | | | | | | | |
Net assets, at value | | $ | 52,512,347 | | | $ | 156,274,639 | |
| | | | |
Shares outstanding | | | 2,615,058 | | | | 10,765,086 | |
| | | | |
Net asset value and maximum offering price per share | | $ | 20.08 | | | $ | 14.52 | |
| | | | |
aRedemption price is equal to net asset value less contingent deferred sales charges, if applicable.
| | | | |
franklintempleton.com | | The accompanying notes are an integral part of these financial statements. | Annual Report | | 29 |
FRANKLIN FUND ALLOCATOR SERIES
FINANCIAL STATEMENTS
Statements of Operations
for the year ended December 31, 2019
| | | | | | | | |
| | | Franklin
Corefolio
Allocation Fund | | | Franklin
Founding
Funds
Allocation Fund | |
| | |
Investment income: | | | | | | | | |
Dividends: | | | | | | | | |
Non-controlled affiliates (Note 3e) | | | $11,623,441 | | | | $131,120,950 | |
| | | | |
Expenses: | | | | | | | | |
Administrative fees (Note 3a) | | | 238,881 | | | | 1,156,942 | |
Distribution fees: (Note 3b) | | | | | | | | |
Class A | | | 1,677,554 | | | | 8,395,100 | |
Class C | | | 760,552 | | | | 3,363,681 | |
Class R | | | 6,633 | | | | 28,976 | |
Transfer agent fees: (Note 3d) | | | | | | | | |
Class A | | | 841,312 | | | | 3,852,922 | |
Class C | | | 95,348 | | | | 387,055 | |
Class R | | | 1,734 | | | | 6,689 | |
Class R6 | | | 783 | | | | 282 | |
Advisor Class | | | 58,330 | | | | 176,638 | |
Reports to shareholders | | | 61,604 | | | | 301,017 | |
Registration and filing fees | | | 104,237 | | | | 137,197 | |
Professional fees | | | 39,028 | | | | 58,780 | |
Trustees’ fees and expenses | | | 7,265 | | | | 36,241 | |
Other | | | 18,943 | | | | 44,239 | |
| | | | |
Total expenses | | | 3,912,204 | | | | 17,945,759 | |
Expenses waived/paid by affiliates (Note 3e and 3f) | | | (512 | ) | | | (354 | ) |
| | | | |
Net expenses | | | 3,911,692 | | | | 17,945,405 | |
| | | | |
Net investment income | | | 7,711,749 | | | | 113,175,545 | |
| | | | |
Realized and unrealized gains (losses): | | | | | | | | |
Net realized gain (loss) from: | | | | | | | | |
Sale of investments: | | | | | | | | |
Non-controlled affiliates (Note 3e) | | | 11,574,911 | | | | 30,970,894 | |
Capital gain distributions from Underlying Funds: | | | | | | | | |
Non-controlled affiliates (Note 3e) | | | 43,948,383 | | | | 109,228,899 | |
| | | | |
Net realized gain (loss) | | | 55,523,294 | | | | 140,199,793 | |
| | | | |
Net change in unrealized appreciation (depreciation) on: | | | | | | | | |
Investments: | | | | | | | | |
Non-controlled affiliates (Note 3e) | | | 115,385,770 | | | | 371,362,001 | |
| | | | |
Net realized and unrealized gain (loss) | | | 170,909,064 | | | | 511,561,794 | |
| | | | |
Net increase (decrease) in net assets resulting from operations | | | $178,620,813 | | | | $624,737,339 | |
| | | | |
| | | | |
| | | |
30 | | Annual Report| The accompanying notes are an integral part of these financial statements. | | franklintempleton.com |
FRANKLIN FUND ALLOCATOR SERIES
FINANCIAL STATEMENTS
Statements of Changes in Net Assets
| | | | | | | | | | | | | | | | |
| | | Franklin Corefolio Allocation Fund | | | Franklin Founding Funds Allocation Fund | |
| | | Year Ended December 31, | | | Year Ended December 31, | |
| | | 2019 | | | 2018 | | | 2019 | | | 2018 | |
| | | | |
Increase (decrease) in net assets: | | | | | | | | | | | | | | | | |
Operations: | | | | | | | | | | | | | | | | |
Net investment income | | $ | 7,711,749 | | | $ | 4,964,970 | | | $ | 113,175,545 | | | $ | 109,824,974 | |
Net realized gain (loss) | | | 55,523,294 | | | | 56,299,785 | | | | 140,199,793 | | | | 237,245,597 | |
Net change in unrealized appreciation (depreciation) | | | 115,385,770 | | | | (115,422,185 | ) | | | 371,362,001 | | | | (765,133,150 | ) |
| | | | |
Net increase (decrease) in net assets resulting from operations | | | 178,620,813 | | | | (54,157,430 | ) | | | 624,737,339 | | | | (418,062,579 | ) |
| | | | |
Distributions to shareholders: | | | | | | | | | | | | | | | | |
Class A | | | (56,514,085 | ) | | | (31,429,597 | ) | | | (102,914,076 | ) | | | (116,621,060 | ) |
Class C | | | (5,786,775 | ) | | | (6,261,482 | ) | | | (7,191,749 | ) | | | (19,814,740 | ) |
Class R | | | (109,031 | ) | | | (76,122 | ) | | | (161,302 | ) | | | (206,016 | ) |
Class R6 | | | (165,432 | ) | | | (4,072 | ) | | | (256 | ) | | | (300,471 | ) |
Advisor Class | | | (4,068,534 | ) | | | (2,113,981 | ) | | | (5,065,959 | ) | | | (5,943,055 | ) |
| | | | |
Total distributions to shareholders | | | (66,643,857 | ) | | | (39,885,254 | ) | | | (115,333,342 | ) | | | (142,885,342 | ) |
| | | | |
Capital share transactions: (Note 2) | | | | | | | | | | | | | | | | |
Class A | | | 29,666,701 | | | | 92,218,327 | | | | (253,837,338 | ) | | | 368,804,104 | |
Class C | | | (7,382,046 | ) | | | (87,999,400 | ) | | | (108,626,694 | ) | | | (821,039,175 | ) |
Class R | | | (237,087 | ) | | | (27,449 | ) | | | (559,910 | ) | | | (1,509,563 | ) |
Class R6 | | | 3,207,157 | | | | 83,314 | | | | (424 | ) | | | 1,869,543 | |
Advisor Class | | | 5,611,518 | | | | 12,594,513 | | | | (9,661,948 | ) | | | (7,623,342 | ) |
| | | | |
Total capital share transactions | | | 30,866,243 | | | | 16,869,305 | | | | (372,686,314 | ) | | | (459,498,433 | ) |
Net increase (decrease) in net assets | | | 142,843,199 | | | | (77,173,379 | ) | | | 136,717,683 | | | | (1,020,446,354 | ) |
| | | | |
Net assets: | | | | | | | | | | | | | | | | |
Beginning of year | | | 707,992,965 | | | | 785,166,344 | | | | 3,723,623,217 | | | | 4,744,069,571 | |
| | | | |
| | | | |
End of year | | $ | 850,836,164 | | | $ | 707,992,965 | | | $ | 3,860,340,900 | | | $ | 3,723,623,217 | |
| | | | |
| | | | |
franklintempleton.com | | The accompanying notes are an integral part of these financial statements. | Annual Report | | 31 |
FRANKLIN FUND ALLOCATOR SERIES
Notes to Financial Statements
1. Organization and Significant Accounting Policies
Franklin Fund Allocator Series (Trust) is registered under the Investment Company Act of 1940 (1940 Act) as anopen-end management investment company, consisting of twenty-five separate funds, two of which are included in this report (Funds) and applies the specialized accounting and reporting guidance in U.S. Generally Accepted Accounting Principles (U.S. GAAP). The Funds invest in affiliated mutual funds managed by Franklin Templeton (Underlying Funds). The Funds offer five classes of shares: Class A, Class C, Class R, Class R6 and Advisor Class. Class C shares automatically convert to Class A shares after they have been held for 10 years. Each class of shares may differ by its initial sales load, contingent deferred sales charges, voting rights on matters affecting a single class, its exchange privilege and fees due to differing arrangements for distribution and transfer agent fees.
The accounting policies of the Underlying Funds are outlined in their respective shareholder reports. A copy of the Underlying Funds’ shareholder reports, in which each Fund invests, is available on the U.S. Securities and Exchange Commission (SEC) website at sec.gov. The Underlying Funds’ shareholder reports are not covered by this report.
The following summarizes the Fund’s significant accounting polocies.
a. Financial Instrument Valuation
The Funds’ investments in financial instruments are carried at fair value daily. Fair value is the price that would be received to sell an asset or paid to transfer a liability in an orderly transaction between market participants on the measurement date. The Funds calculate the net asset value (NAV) per share each business day as of 4 p.m. Eastern time or the regularly scheduled close of the New York Stock Exchange (NYSE), whichever is earlier. Under compliance policies and procedures approved by the Trust’s Board of Trustees (the Board), the Funds’ administrator has responsibility for oversight of valuation, including leading the cross-functional Valuation Committee (VC). The Funds may utilize independent pricing services, quotations from securities and financial instrument dealers, and other market sources to determine fair value.
Investments in the Underlying Funds are valued at their closing NAV each trading day.
b. Income Taxes
It is each Fund’s policy to qualify as a regulated investment company under the Internal Revenue Code. Each Fund intends to distribute to shareholders substantially all of its taxable income and net realized gains to relieve it from federal income and excise taxes. As a result, no provision for U.S. federal income taxes is required.
Each Fund may recognize an income tax liability related to its uncertain tax positions under U.S. GAAP when the uncertain tax position has a less than 50% probability that it will be sustained upon examination by the tax authorities based on its technical merits. As of December 31, 2019, each Fund has determined that no tax liability is required in its financial statements related to uncertain tax positions for any open tax years (or expected to be taken in future tax years). Open tax years are those that remain subject to examination and are based on the statute of limitations in each jurisdiction in which the Fund invests.
c. Security Transactions, Investment Income, Expenses and Distributions
Security transactions are accounted for on trade date. Realized gains and losses on security transactions are determined on a specific identification basis. Estimated expenses are accrued daily. Dividend income and capital gain distributions by Underlying Funds are recorded on theex-dividend date. Distributions to shareholders are recorded on theex-dividend date. Distributable earnings are determined according to income tax regulations (tax basis) and may differ from earnings recorded in accordance with U.S. GAAP. These differences may be permanent or temporary. Permanent differences are reclassified among capital accounts to reflect their tax character. These reclassifications have no impact on net assets or the results of operations. Temporary differences are not reclassified, as they may reverse in subsequent periods.
Common expenses incurred by the Trust are allocated among the Funds based on the ratio of net assets of each Fund to the combined net assets of the Trust or based on the ratio of number of shareholders of each Fund to the combined number of shareholders of the Trust. Fund specific expenses are charged directly to the Fund that incurred the expense.
The Funds indirectly bear their proportionate share of expenses from the Underlying Funds. Since the Underlying Funds have varied expense levels and the Funds may own
| | | | |
| | | |
32 | | Annual Report | | franklintempleton.com |
FRANKLIN FUND ALLOCATOR SERIES
NOTES TO FINANCIAL STATEMENTS
different proportions of the Underlying Funds at different times, the amount of expenses incurred indirectly by the Funds will vary.
Realized and unrealized gains and losses and net investment income, excluding class specific expenses, are allocated daily to each class of shares based upon the relative proportion of net assets of each class. Differences in per share distributions by class are generally due to differences in class specific expenses.
d. Accounting Estimates
The preparation of financial statements in accordance with U.S. GAAP requires management to make estimates and assumptions that affect the reported amounts of assets and liabilities at the date of the financial statements and the amounts of income and expenses during the reporting period. Actual results could differ from those estimates.
e. Guarantees and Indemnifications
Under the Trust’s organizational documents, its officers and trustees are indemnified by the Trust against certain liabilities arising out of the performance of their duties to the Trust. Additionally, in the normal course of business, the Trust, on behalf of the Funds, enters into contracts with service providers that contain general indemnification clauses. The Trust’s maximum exposure under these arrangements is unknown as this would involve future claims that may be made against the Trust that have not yet occurred. Currently, the Trust expects the risk of loss to be remote.
2. Shares of Beneficial Interest
At December 31, 2019, there were an unlimited number of shares authorized (without par value). Transactions in the Funds’ shares were as follows:
| | | | | | | | | | | | | | | | |
| | | Franklin Corefolio
Allocation Fund | | | Franklin Founding Funds
Allocation Fund | |
| | | | |
| | | | |
| | | Shares | | | Amount | | | Shares | | | Amount | |
| |
| | | | |
Class A Shares: | | | | | | | | | | | | | | | | |
| | | | |
Year ended December 31, 2019 | | | | | | | | | | | | | | | | |
| | | | |
Shares solda | | | 3,752,082 | | | $ | 72,858,466 | | | | 12,695,529 | | | $ | 175,645,857 | |
| | | | |
Shares issued in reinvestment of distributions | | | 2,861,103 | | | | 55,420,177 | | | | 6,993,175 | | | | 98,632,685 | |
| | | | |
Shares redeemed | | | (5,084,593 | ) | | | (98,611,942 | ) | | | (38,238,202 | ) | | | (528,115,880) | |
| | | | |
| | | | |
Net increase (decrease) | | | 1,528,592 | | | $ | 29,666,701 | | | | (18,549,498 | ) | | $ | (253,837,338) | |
| | | | |
| | | | |
Year ended December 31, 2018 | | | | | | | | | | | | | | | | |
| | | | |
Shares solda | | | 7,627,736 | | | $ | 150,603,231 | | | | 56,210,520 | | | $ | 790,491,720 | |
| | | | |
Shares issued in reinvestment of distributions | | | 1,661,540 | | | | 30,730,226 | | | | 8,380,784 | | | | 111,330,439 | |
| | | | |
Shares redeemed | | | (4,456,618 | ) | | | (89,115,130 | ) | | | (37,436,285 | ) | | | (533,018,055) | |
| | | | |
| | | | |
Net increase (decrease) | | | 4,832,658 | | | $ | 92,218,327 | | | | 27,155,019 | | | $ | 368,804,104 | |
| | | | |
| | | | |
franklintempleton.com | | Annual Report | | 33 |
FRANKLIN FUND ALLOCATOR SERIES
NOTES TO FINANCIAL STATEMENTS
2. Shares of Beneficial Interest (continued)
| | | | | | | | | | | | | | | | |
| | | Franklin Corefolio
Allocation Fund | | | Franklin Founding Funds
Allocation Fund | |
| | | | |
| | | | |
| | | Shares | | | Amount | | | Shares | | | Amount | |
| |
| | | | |
Class C Shares: | | | | | | | | | | | | | | | | |
| | | | |
Year ended December 31, 2019 | | | | | | | | | | | | | | | | |
| | | | |
Shares sold | | | 676,110 | | | $ | 12,900,947 | | | | 2,055,351 | | | $ | 28,136,207 | |
| | | | |
Shares issued in reinvestment of distributions | | | 297,765 | | | | 5,652,670 | | | | 497,845 | | | | 6,965,116 | |
| | | | |
Shares redeemeda | | | (1,358,405 | ) | | | (25,935,663 | ) | | | (10,494,806 | ) | | | (143,728,017) | |
| | | | |
| | | | |
Net increase (decrease) | | | (384,530 | ) | | $ | (7,382,046 | ) | | | (7,941,610 | ) | | $ | (108,626,694) | |
| | | | |
| | | | |
Year ended December 31, 2018 | | | | | | | | | | | | | | | | |
| | | | |
Shares sold | | | 1,105,173 | | | $ | 21,834,828 | | | | 4,059,067 | | | $ | 56,982,121 | |
| | | | |
Shares issued in reinvestment of distributions | | | 327,572 | | | | 6,166,942 | | | | 1,422,319 | | | | 19,460,023 | |
| | | | |
Shares redeemeda | | | (5,975,628 | ) | | | (116,001,170 | ) | | | (64,640,423 | ) | | | (897,481,319) | |
| | | | |
| | | | |
Net increase (decrease) | | | (4,542,883 | ) | | $ | (87,999,400 | ) | | | (59,159,037 | ) | | $ | (821,039,175) | |
| | | | |
| | | | |
Class R Shares: | | | | | | | | | | | | | | | | |
| | | | |
Year ended December 31, 2019 | | | | | | | | | | | | | | | | |
| | | | |
Shares sold | | | 3,112 | | | $ | 60,934 | | | | 32,461 | | | $ | 449,584 | |
| | | | |
Shares issued in reinvestment of distributions | | | 5,635 | | | | 109,031 | | | | 11,274 | | | | 159,460 | |
| | | | |
Shares redeemed | | | (21,072 | ) | | | (407,052 | ) | | | (84,995 | ) | | | (1,168,954) | |
| | | | |
| | | | |
Net increase (decrease) | | | (12,325 | ) | | $ | (237,087) | | | | (41,260 | ) | | $ | (559,910) | |
| | | | |
| | | | |
Year ended December 31, 2018 | | | | | | | | | | | | | | | | |
| | | | |
Shares sold | | | 6,220 | | | $ | 121,209 | | | | 36,015 | | | $ | 515,730 | |
| | | | |
Shares issued in reinvestment of distributions | | | 4,080 | | | | 76,122 | | | | 15,217 | | | | 204,363 | |
| | | | |
Shares redeemed | | | (11,641 | ) | | | (224,780 | ) | | | (154,224 | ) | | | (2,229,656) | |
| | | | |
| | | | |
Net increase (decrease) | | | (1,341 | ) | | $ | (27,449) | | | | (102,992 | ) | | $ | (1,509,563) | |
| | | | |
| | | | |
Class R6 Shares: | | | | | | | | | | | | | | | | |
| | | | |
Year ended December 31, 2019 | | | | | | | | | | | | | | | | |
| | | | |
Shares sold | | | 177,781 | | | $ | 3,471,091 | | | | 469 | | | $ | 6,585 | |
| | | | |
Shares issued in reinvestment of distributions | | | 8,382 | | | | 165,160 | | | | 6 | | | | 90 | |
| | | | |
Shares redeemed | | | (21,826 | ) | | | (429,094 | ) | | | (475 | ) | | | (7,099) | |
| | | | |
| | | | |
Net increase (decrease) | | | 164,337 | | | $ | 3,207,157 | | | | — | | | $ | (424) | |
| | | | |
| | | | |
Year ended December 31, 2018 | | | | | | | | | | | | | | | | |
| | | | |
Shares sold | | | 3,868 | | | $ | 79,523 | | | | 1,264,813 | | | $ | 18,906,774 | |
| | | | |
Shares issued in reinvestment of distributions | | | 206 | | | | 3,791 | | | | 21,242 | | | | 300,369 | |
| | | | |
Shares redeemed | | | — | | | | — | | | | (1,286,055 | ) | | | (17,337,600) | |
| | | | |
| | | | |
Net increase (decrease) | | | 4,074 | | | $ | 83,314 | | | | — | | | $ | 1,869,543 | |
| | | | |
| | | | |
| | | |
34 | | Annual Report | | franklintempleton.com |
FRANKLIN FUND ALLOCATOR SERIES
NOTES TO FINANCIAL STATEMENTS
| | | | | | | | | | | | | | | | |
| | | Franklin Corefolio
Allocation Fund | | | Franklin Founding Funds
Allocation Fund | |
| | | | |
| | | | |
| | | Shares | | | Amount | | | Shares | | | Amount | |
| |
| | | | |
Advisor Class Shares: | | | | | | | | | | | | | | | | |
| | | | |
Year ended December 31, 2019 | | | | | | | | | | | | | | | | |
| | | | |
Shares sold | | | 670,304 | | | $ | 12,943,164 | | | | 2,558,679 | | | $ | 35,435,253 | |
| | | | |
Shares issued in reinvestment of distributions | | | 182,685 | | | | 3,555,865 | | | | 316,923 | | | | 4,498,812 | |
| | | | |
Shares redeemed | | | (566,172 | ) | | | (10,887,511 | ) | | | (3,560,226 | ) | | | (49,596,013) | |
| | | | |
| | | | |
Net increase (decrease) | | | 286,817 | | | $ | 5,611,518 | | | | (684,624 | ) | | $ | (9,661,948) | |
| | | | |
| | | | |
Year ended December 31, 2018 | | | | | | | | | | | | | | | | |
| | | | |
Shares sold | | | 1,258,647 | | | $ | 25,392,315 | | | | 3,576,234 | | | $ | 51,468,103 | |
| | | | |
Shares issued in reinvestment of distributions | | | 97,110 | | | | 1,785,709 | | | | 390,538 | | | | 5,230,657 | |
| | | | |
Shares redeemed | | | (732,501 | ) | | | (14,583,511 | ) | | | (4,427,603 | ) | | | (64,322,102) | |
| | | | |
| | | | |
Net increase (decrease) | | | 623,256 | | | $ | 12,594,513 | | | | (460,831 | ) | | $ | (7,623,342) | |
| | | | |
aMay include a portion of Class C shares that were automatically converted to Class A.
3. Transactions with Affiliates
Franklin Resources, Inc. is the holding company for various subsidiaries that together are referred to as Franklin Templeton. Certain officers and trustees of the Funds are also officers, and/or directors trustees of certain of the Underlying Funds and of the following subsidiaries:
| | |
| Subsidiary | | Affiliation |
Franklin Templeton Services, LLC (FT Services) | | Administrative manager |
Franklin Templeton Distributors, Inc. (Distributors) | | Principal underwriter |
Franklin Templeton Investor Services, LLC (Investor Services) | | Transfer agent |
a. Administrative Fees
The Funds pay an administrative fee to FT Services of 0.03% per year of the average daily net assets of each of the Funds for administrative services including monitoring and rebalancing the percentage of each Fund’s investment in the Underlying Funds.
b. Distribution Fees
The Board has adopted distribution plans for each share class, with the exception of Class R6 and Advisor Class shares, pursuant to Rule12b-1 under the 1940 Act. Under the Funds’ Class A reimbursement distribution plans, the Funds reimburse Distributors for costs incurred in connection with the servicing, sale and distribution of each Fund’s shares up to the maximum annual plan rate for each class. Under the Class A reimbursement distribution plans, costs exceeding the maximum for the current plan year cannot be reimbursed in subsequent periods. In addition, under the Funds’ Class C and R compensation distribution plans, the Funds pay Distributors for costs incurred in connection with the servicing, sale and distribution of each Fund’s shares up to the maximum annual plan rate for each class. The plan year, for purposes of monitoring compliance with the maximum annual plan rates, is February 1 through January 31 for each Fund.
| | | | |
franklintempleton.com | | Annual Report | | 35 |
FRANKLIN FUND ALLOCATOR SERIES
NOTES TO FINANCIAL STATEMENTS
3. Transactions with Affiliates(continued)
b. Distribution Fees(continued)
The maximum annual plan rates, based on the average daily net assets, for each class, are as follows:
| | | | |
Class A | | | 0.35% | |
Class C | | | 1.00% | |
Class R | | | 0.50% | |
The Board has set the current rate at 0.25% per year for Class A shares until further notice and approval by the Board.
c. Sales Charges/Underwriting Agreements
Front-end sales charges and contingent deferred sales charges (CDSC) do not represent expenses of the Funds. These charges are deducted from the proceeds of sales of fund shares prior to investment or from redemption proceeds prior to remittance, as applicable. Distributors has advised the Funds of the following commission transactions related to the sales and redemptions of the Funds’ shares for the year:
| | | | | | | | |
| | | Franklin
Corefolio
Allocation Fund | | | Franklin
Founding Funds
Allocation Fund | |
| |
Sales charges retained net of commissions paid to unaffiliated brokers/dealers | | $ | 117,380 | | | $ | 206,330 | |
CDSC retained | | $ | (703 | ) | | $ | 21,504 | |
d. Transfer Agent Fees
Each class of shares pays transfer agent fees to Investor Services for its performance of shareholder servicing obligations. The fees are based on an annualized asset based fee of 0.02% plus a transaction based fee. In addition, each class reimburses Investor Services for out of pocket expenses incurred and, except for Class R6, reimburses shareholder servicing fees paid to third parties. These fees are allocated daily based upon their relative proportion of such classes’ aggregate net assets. Class R6 pays Investor Services transfer agent fees specific to that class.
For the year ended December 31, 2019, the Funds paid transfer agent fees as noted in the Statements of Operations of which the following amounts were retained by Investor Services:
| | | | | | | | |
| | | Franklin
Corefolio
Allocation Fund | | | Franklin
Founding Funds
Allocation Fund | |
| |
Transfer agent fees | | | $626,931 | | | | $1,917,421 | |
e. Investments in Underlying Funds
The Funds invest in Underlying Funds which are managed by Franklin Advisers, Inc. (Advisers), an affiliate of FT Services or an affiliate of Advisers). The Funds do not invest in Underlying Funds for the purpose of exercising a controlling influence over the management or policies. Administrative fees paid by the Funds are waived on assets invested in Institutional Fiduciary Trust Money Market Portfolio (Sweep Money Fund), as noted in the Statements of Operations, in an amount not to exceed the management and administrative fees paid directly or indirectly by the Sweep Money Fund.
| | | | |
| | | |
36 | | Annual Report | | franklintempleton.com |
FRANKLIN FUND ALLOCATOR SERIES
NOTES TO FINANCIAL STATEMENTS
Investments in Underlying Funds for the year ended December 31, 2019, were as follows:
| | | | | | | | | | | | | | | | | | | | | | | | | | | | | | | | |
| | | Value at
Beginning
of Year | | | Purchases | | | Sales | | | Realized
Gain (Loss) | | | Net Change in
Unrealized
Appreciation
(Depreciation) | | | Value at End of Year | | | Number of
Shares
Held at End
of Year | | | Dividend
Income | |
| |
| Franklin Corefolio Allocation Fund | | | | | | | | | | | | | | | | | |
Non-Controlled Affiliates | | | | | | | | | | | | | | | | | | | | | | | | | | | | | | | | |
Franklin Growth Fund, Class R6 | | $ | 176,634,458 | | | $ | 13,045,578 | | | $ | (18,043,708 | ) | | $ | 8,768,149 | | | $ | 34,285,577 | | | $ | 214,690,054 | | | | 1,911,755 | | | $ | 12,445,578 | a |
Franklin Growth Opportunities Fund, Class R6 | | | 177,449,161 | | | | 15,205,500 | | | | (27,177,540 | ) | | | 4,202,740 | | | | 38,217,019 | | | | 207,896,880 | | | | 4,797,989 | | | | 15,205,500 | a |
Franklin Mutual Shares Fund, Class R6 | | | 176,217,841 | | | | 17,097,844 | | | | (3,657,504 | ) | | | (88,689 | ) | | | 24,561,666 | | | | 214,131,158 | | | | 7,772,456 | | | | 16,495,071 | a |
Institutional Fiduciary Trust Money Market Portfolio, 1.26% | | | 1,566 | | | | 24,897,209 | | | | (24,898,591 | ) | | | — | | | | — | | | | 184 | | | | 184 | | | | 6,098 | |
Templeton Growth Fund Inc., Class R6 | | | 175,974,947 | | | | 27,005,772 | | | | (6,470,313 | ) | | | (1,307,289 | ) | | | 18,321,508 | | | | 213,524,625 | | | | 9,468,941 | | | | 11,419,577 | a |
| | | | | | | | | | | | |
Total Affiliated Securities | | $ | 706,277,973 | | | $ | 97,251,903 | | | $ | (80,247,656 | ) | | $ | 11,574,911 | | | $ | 115,385,770 | | | $ | 850,242,901 | | | | | | | $ | 55,571,824 | |
| | | | | | | | | | | | |
| |
Franklin Founding Funds Allocation Fund | �� | | | | |
Non-Controlled Affiliates | | | | | |
Franklin Income Fund, Class R6 | | $ | 1,237,646,875 | | | $ | 69,792,153 | | | $ | (147,597,505 | ) | | $ | (3,800,871 | ) | | $ | 124,763,311 | | | $ | 1,280,803,963 | | | | 549,701,272 | | | $ | 69,792,150 | |
Franklin Mutual Shares Fund, Class R6 | | | 1,248,713,107 | | | | 100,853,451 | | | | (227,312,103 | ) | | | 29,428,479 | | | | 140,546,916 | | | | 1,292,229,850 | | | | 46,904,895 | | | | 100,853,451 | a |
Institutional Fiduciary Trust Money Market Portfolio, 1.26% | | | 4,344 | | | | 30,587,241 | | | | (30,591,433 | ) | | | — | | | | — | | | | 152 | | | | 152 | | | | 4,948 | |
Templeton Growth Fund Inc., | | | | | | | | | | | | | | | | | | | | | | | | | | | | | | | | |
Class R6 | | | 1,242,448,619 | | | | 80,699,300 | | | | (145,581,203 | ) | | | 5,343,286 | | | | 106,051,774 | | | | 1,288,961,776 | | | | 57,160,167 | | | | 69,699,300 | a |
| | | | | | | | | | | | |
Total Affiliated Securities | | $ | 3,728,812,945 | | | $ | 281,932,145 | | | $ | (551,082,244 | ) | | $ | 30,970,894 | | | $ | 371,362,001 | | | $ | 3,861,995,741 | | | | | | | $ | 240,349,849 | |
| | | | | | | | | | | | |
aDividend income includes capital gain distributions received, if any, from underlying funds, and are presented in corresponding line item in the Statement of Operations.
f. Waiver and Expense Reimbursements
Investor Services has contractually agreed in advance to waive or limit its fees so that the Class R6 transfer agent fees do not exceed 0.03% based on the average net assets of the class until April 30, 2020.
| | | | |
franklintempleton.com | | Annual Report | | 37 |
FRANKLIN FUND ALLOCATOR SERIES
NOTES TO FINANCIAL STATEMENTS
4. Income Taxes
The tax character of distributions paid during the years ended December 31, 2019 and 2018, was as follows:
| | | | | | | | | | | | | | | | |
| | | Franklin Corefolio Allocation Fund | | | Franklin Founding Funds
Allocation Fund | |
| | | | |
| | | | |
| | | 2019 | | | 2018 | | | 2019 | | | 2018 | |
| |
Distributions paid from: | | | | | | | | | | | | | | | | |
Ordinary income | | $ | 11,702,399 | | | $ | 6,797,708 | | | $ | 115,333,342 | | | $ | 142,885,342 | |
Long term capital gain | | | 54,941,458 | | | | 33,087,546 | | | | — | | | | — | |
| | | | |
| | | | |
| | $ | 66,643,857 | | | $ | 39,885,254 | | | $ | 115,333,342 | | | $ | 142,885,342 | |
| | | | |
At December 31, 2019, the cost of investments, net unrealized appreciation (depreciation), undistributed ordinary income and undistributed long term capital gains for income tax purposes were as follows:.
| | | | | | | | |
| | |
| | | Franklin
Corefolio
Allocation Fund | | | Franklin Founding
Funds Allocation Fund | |
| |
| | |
Cost of investments | | $ | 601,466,798 | | | $ | 3,881,183,743 | |
| | | | |
| | |
Unrealized appreciation | | $ | 254,269,446 | | | $ | 87,036,144 | |
| | |
Unrealized depreciation | | | (5,493,343 | ) | | | (106,224,146) | |
| | | | |
| | |
Net unrealized appreciation (depreciation) | | $ | 248,776,103 | | | $ | (19,188,002 | ) |
| | | | |
| | |
Distributable earnings: | | | | | | | | |
| | |
Undistributed ordinary income | | $ | 1,280,092 | | | $ | 41,618,193 | |
| | |
Undistributed long term capital gains | | | 34,469,764 | | | | 117,633,142 | |
| | | | |
| | |
Total distributable earnings | | $ | 35,749,856 | | | $ | 159,251,335 | |
| | | | |
Differences between income and/or capital gains as determined on a book basis and a tax basis are primarily due to differing treatments of short term capital gains distributions from Underlying Funds and wash sales.
Franklin Corefolio Allocation Fund utilized a tax accounting practice to treat a portion of the proceeds from capital shares redeemed as a distribution from realized capital gains.
5. Investment Transactions
Purchases and sales of Underlying Funds (excluding short term securities) for the year ended December 31, 2019, were as follows:
| | | | | | | | |
| | |
| | | Franklin
Corefolio
Allocation Fund | | | Franklin
Founding Funds
Allocation Fund | |
| |
| | |
Purchases | | $ | 16,788,968 | | | $ | 11,000,000 | |
| | |
Sales | | $ | 55,349,066 | | | $ | 520,490,808 | |
| | | | |
| | | |
38 | | Annual Report | | franklintempleton.com |
FRANKLIN FUND ALLOCATOR SERIES
NOTES TO FINANCIAL STATEMENTS
6. Credit Facility
The Funds, together with other U.S. registered and foreign investment funds (collectively, Borrowers), managed by Franklin Templeton, are borrowers in a joint syndicated senior unsecured credit facility totaling $2 billion (Global Credit Facility) which matured on February 7, 2020. This Global Credit Facility provides a source of funds to the Borrowers for temporary and emergency purposes, including the ability to meet future unanticipated or unusually large redemption requests. Effective February 7, 2020, the Borrowers renewed the Global Credit Facility for a one year term, maturing February 5, 2021, for a total of $2 billion.
Under the terms of the Global Credit Facility, the Funds shall, in addition to interest charged on any borrowings made by the Funds and other costs incurred by the Funds, pay their share of fees and expenses incurred in connection with the implementation and maintenance of the Global Credit Facility, based upon their relative share of the aggregate net assets of all of the Borrowers, including an annual commitment fee of 0.15% based upon the unused portion of the Global Credit Facility. These fees are reflected in other expenses in the Statements of Operations. During the year ended December 31, 2019, the Funds did not use the Global Credit Facility.
7. Fair Value Measurements
The Funds follow a fair value hierarchy that distinguishes between market data obtained from independent sources (observable inputs) and the Funds’ own market assumptions (unobservable inputs). These inputs are used in determining the value of the Funds’ financial instruments and are summarized in the following fair value hierarchy:
| | • | Level 1 – quoted prices in active markets for identical financial instruments |
| | • | Level 2 – other significant observable inputs (including quoted prices for similar financial instruments, interest rates, prepayment speed, credit risk, etc.) |
| | • | Level 3 – significant unobservable inputs (including the Funds’ own assumptions in determining the fair value of financial instruments) |
The input levels are not necessarily an indication of the risk or liquidity associated with financial instruments at that level.
At December 31, 2019, all of the Funds’ investments in financial instruments carried at fair value were valued using Level 1 inputs. For detailed categories, see the accompanying Statements of Investments.
8. Subsequent Events
The Funds have evaluated subsequent events through the issuance of the financial statements and determined that no events have occurred that require disclosure other than those already disclosed in the financial statements.
| | | | |
franklintempleton.com | | Annual Report | | 39 |
FRANKLIN FUND ALLOCATOR SERIES
Report of Independent Registered Public Accounting Firm
To the Board of Trustees of Franklin Fund Allocator Series and Shareholders of Franklin Corefolio Allocation Fund and Franklin Founding Funds Allocation Fund
Opinions on the Financial Statements
We have audited the accompanying statements of assets and liabilities, including the statements of investments, of Franklin Corefolio Allocation Fund and Franklin Founding Funds Allocation Fund (the “Funds”) as of December 31, 2019, the related statements of operations for the year ended December 31, 2019, the statements of changes in net assets for each of the two years in the period ended December 31, 2019, including the related notes, and the financial highlights for each of the periods indicated therein (collectively referred to as the “financial statements”). In our opinion, the financial statements present fairly, in all material respects, the financial position of each of the Funds as of December 31, 2019, the results of each of their operations for the year then ended, the changes in each of their net assets for each of the two years in the period ended December 31, 2019 and each of the financial highlights for each of the periods indicated therein in conformity with accounting principles generally accepted in the United States of America.
Basis for Opinions
These financial statements are the responsibility of the Funds’ management. Our responsibility is to express an opinion on the Funds’ financial statements based on our audits. We are a public accounting firm registered with the Public Company Accounting Oversight Board (United States) (PCAOB) and are required to be independent with respect to the Funds in accordance with the U.S. federal securities laws and the applicable rules and regulations of the Securities and Exchange Commission and the PCAOB.
We conducted our audits of these financial statements in accordance with the standards of the PCAOB. Those standards require that we plan and perform the audit to obtain reasonable assurance about whether the financial statements are free of material misstatement, whether due to error or fraud.
Our audits included performing procedures to assess the risks of material misstatement of the financial statements, whether due to error or fraud, and performing procedures that respond to those risks. Such procedures included examining, on a test basis, evidence regarding the amounts and disclosures in the financial statements. Our audits also included evaluating the accounting principles used and significant estimates made by management, as well as evaluating the overall presentation of the financial statements. Our procedures included confirmation of securities owned as of December 31, 2019 by correspondence with the transfer agent. We believe that our audits provide a reasonable basis for our opinions.
PricewaterhouseCoopers LLP
San Francisco, California
February 20, 2020
We have served as the auditor of one or more investment companies in the Franklin Templeton Group of Funds since 1948.
| | | | |
| | | |
40 | | Annual Report| The accompanying notes are an integral part of these financial statements. | | franklintempleton.com |
FRANKLIN FUND ALLOCATOR SERIES
Tax Information (unaudited)
Under Section 852(b)(3)(C) of the Internal Revenue Code, Franklin Corefolio Allocation Fund hereby reports the maximum amount allowable but no less than $58,318,068 as long term capital gain dividend for the fiscal year ended December 31, 2019.
Under Section 871(k)(2)(C) of the Internal Revenue Code, Franklin Corefolio Allocation Fund hereby report the maximum amount allowable but no less than $3,813,959 as short term capital gain dividend for purposes of the tax imposed under Section 871(a)(1)(A) of the Internal Revenue Code for the fiscal year ended December 31, 2019:
Under Section 854(b)(1)(A) of the Internal Revenue Code, the Funds hereby report the following percentage amounts of the ordinary income dividends as income qualifying for the dividends received deduction for the fiscal year ended December 31, 2019:
| | | | | | |
| |
Franklin
Corefolio
Allocation Fund | | | Franklin
Founding Funds
Allocation Fund | |
| | 57.08% | | | | 38.15% | |
Under Section 854(b)(1)(B) of the Internal Revenue Code, the Funds hereby report the maximum amount allowable but no less than the following amounts as qualified dividends for purposes of the maximum rate under Section 1(h)(11) of the Internal Revenue Code for the fiscal year ended December 31, 2019:
| | | | | | |
| |
Franklin
Corefolio
Allocation
Fund | | | Franklin
Founding Funds
Allocation Fund | |
| | $12,137,178 | | | | $83,167,771 | |
Distributions, including qualified dividend income, paid during calendar year 2019 will be reported to shareholders on Form1099-DIV bymid-February 2020. Shareholders are advised to check with their tax advisors for information on the treatment of these amounts on their individual income tax returns.
During the fiscal year ended December 31, 2019, the Funds, qualified fund of funds under Section 852(g)(2) of Internal Revenue Code, received an allocation of foreign taxes paid from one or more of their underlying funds. As shown in the table below, the Funds hereby report to shareholders the foreign source income and foreign taxes paid by underlying funds, pursuant to Section 853 of the Internal Revenue Code. This written statement will allow shareholders of record on December 27, 2019, to treat their proportionate share of foreign taxes paid by the underlying funds as having been paid directly by them. The shareholder shall consider these amounts as foreign taxes paid in the tax year in which they receive the Fund distribution.
| | | | |
franklintempleton.com | | The accompanying notes are an integral part of these financial statements. | Annual Report | | 41 |
FRANKLIN FUND ALLOCATOR SERIES
The following table provides a detailed analysis of foreign tax paid, foreign source income, and foreign source qualified dividends as reported by the Funds, to shareholders of record.
| | | | | | | | | | | | |
| | | |
| Class | | Foreign Tax Paid
Per Share | | | Foreign Source
Income Per Share | | | Foreign Source Qualified
Dividends Per Share | |
| | | |
| Franklin Corefolio Allocation Fund | | | | | | | | | | | | |
Class A | | | $0.0124 | | | | $0.1151 | | | | $0.0911 | |
Class C | | | $0.0124 | | | | $0.1151 | | | | $0.0911 | |
Class R | | | $0.0124 | | | | $0.1151 | | | | $0.0911 | |
Class R6 | | | $0.0124 | | | | $0.1151 | | | | $0.0911 | |
Advisor Class | | | $0.0124 | | | | $0.1151 | | | | $0.0911 | |
| | | |
| Franklin Founding Funds Allocation Fund | | | | | | | | | | | | |
Class A | | | $0.0119 | | | | $0.1100 | | | | $0.0871 | |
Class C | | | $0.0119 | | | | $0.1100 | | | | $0.0871 | |
Class R | | | $0.0119 | | | | $0.1100 | | | | $0.0871 | |
Class R6 | | | $0.0119 | | | | $0.1100 | | | | $0.0871 | |
Advisor Class | | | $0.0119 | | | | $0.1100 | | | | $0.0871 | |
Foreign Tax Paid Per Share is the amount per share available to you, as a tax credit (assuming you held your shares in the Fund for a minimum of 16 days during the31-day period beginning 15 days before theex-dividend date of the Fund’s distribution to which the foreign taxes relate), or, as a tax deduction.
Foreign Source Income Per Share is the amount per share of income dividends attributable to foreign securities held by the Fund, plus any foreign taxes withheld on these dividends. The amounts reported include foreign source qualified dividends that have not been adjusted for the rate differential applicable to such dividend income.1
Foreign Source Qualified Dividends Per Share is the amount per share of foreign source qualified dividends plus any foreign taxes withheld on these dividends. These amounts represent the portion of the Foreign Source Income Per Share that were derived from qualified foreign securities held by the Fund.1
At the beginning of each calendar year, shareholders will receive Form 1099-DIV which will include their share of taxes paid and foreign source income distributed during the prior calendar year. The Foreign Source Income reported on Form1099-DIV has not been adjusted for the rate differential on foreign source qualified dividend income. Shareholders are advised to check with their tax advisors for information on the treatment of these amounts on their individual income tax returns.
1Qualified dividends are taxed at reduced long term capital gains tax rates. In determining the amount of foreign tax credit that may be applied against the U.S. tax liability of individuals receiving foreign source qualified dividends, adjustments may be required to the foreign tax credit limitation calculation to reflect the rate differential applicable to such dividend income. The rules however permit certain individuals to elect not to apply the rate differential adjustments for capital gains and/or dividends for any taxable year. Please consult your tax advisor and the instructions to Form 1116 for more information.
| | | | |
| | | |
42 | | Annual Report | | franklintempleton.com |
FRANKLIN FUND ALLOCATOR SERIES
Board Members and Officers
The name, year of birth and address of the officers and board members, as well as their affiliations, positions held with the Trust, principal occupations during at least the past five years and number of U.S. registered portfolios overseen in the Franklin Templeton fund complex, are shown below. Generally, each board member serves until that person’s successor is elected and qualified.
Independent Board Members
| | | | | | | | |
| | | | |
Name, Year of Birth
and Address | | Position | | Length of
Time Served | | Number of Portfolios in
Fund Complex Overseen
by Board Member* | | Other Directorships Held
During at Least the Past 5 Years |
| | | | |
Harris J. Ashton (1932)
One Franklin Parkway
San Mateo, CA 94403-1906 | | Trustee | | Since 1995 | | 132 | | Bar-S Foods (meat packing company) (1981-2010). |
| | |
| Principal Occupation During at Least the Past 5 Years: | | | | |
| Director of various companies; andformerly, Director, RBC Holdings, Inc. (bank holding company) (until 2002); and President, Chief Executive Officer and Chairman of the Board, General Host Corporation (nursery and craft centers) (until 1998). |
| | | | |
Terrence J. Checki (1945)
One Franklin Parkway
San Mateo, CA 94403-1906 | | Trustee | | Since 2017 | | 111 | | Hess Corporation (exploration of oil and gas) (2014-present). |
| | |
| Principal Occupation During at Least the Past 5 Years: | | | | |
| Member of the Council on Foreign Relations (1996-present); Member of the National Committee on U.S.-China Relations (1999-present); member of the Board of Trustees of the Economic Club of New York (2013-present); member of the Board of Trustees of the Foreign Policy Association (2005-present) and member of various other boards of trustees and advisory boards; andformerly, Executive Vice President of the Federal Reserve Bank of New York and Head of its Emerging Markets and Internal Affairs Group and Member of Management Committee (1995-2014); and Visiting Fellow at the Council on Foreign Relations (2014). |
| | | | |
Mary C. Choksi (1950)
One Franklin Parkway
San Mateo, CA 94403-1906 | | Trustee | | Since 2014 | | 132 | | Avis Budget Group Inc. (car rental) (2007-present), Omnicom Group Inc. (advertising and marketing communications services) (2011-present) and White Mountains Insurance Group, Ltd. (holding company) (2017-present). |
| | |
| Principal Occupation During at Least the Past 5 Years: | | | | |
| Director of various companies; andformerly, Founder and Senior Advisor, Strategic Investment Group (investment management group) (2015-2017); Founding Partner and Senior Managing Director, Strategic Investment Group (1987-2015); Founding Partner and Managing Director, Emerging Markets Management LLC (investment management firm) (1987-2011); and Loan Officer/Senior Loan Officer/Senior Pension Investment Officer, World Bank Group (international financial institution) (1977-1987). |
| | | | |
Edith E. Holiday (1952)
One Franklin Parkway
San Mateo, CA 94403-1906 | | Lead Independent Trustee | | Trustee since 1998 and Lead Independent Trustee since March 2019 | | 132 | | Hess Corporation (exploration of oil and gas) (1993-present), Canadian National Railway (railroad) (2001-present), White Mountains Insurance Group, Ltd. (holding company) (2004-present), Santander Consumer USA Holdings, Inc. (consumer finance) (2016-present), RTI International Metals, Inc. (manufacture and distribution of titanium) (1999-2015) and H.J. Heinz Company (processed foods and allied products) (1994-2013). |
| | |
| Principal Occupation During at Least the Past 5 Years: | | | | |
| Director or Trustee of various companies and trusts; andformerly, Assistant to the President of the United States and Secretary of the Cabinet (1990-1993); General Counsel to the United States Treasury Department (1989-1990); and Counselor to the Secretary and Assistant Secretary for Public Affairs and Public Liaison–United States Treasury Department (1988-1989). |
| | | | |
franklintempleton.com | | Annual Report | | 43 |
FRANKLIN FUND ALLOCATOR SERIES
Independent Board Members(continued)
| | | | | | | | |
| | | | |
Name, Year of Birth
and Address | | Position | | Length of
Time Served | | Number of Portfolios in
Fund Complex Overseen
by Board Member* | | Other Directorships Held
During at Least the Past 5 Years |
| | | | |
J. Michael Luttig (1954) One Franklin Parkway San Mateo, CA 94403-1906 | | Trustee | | Since 2009 | | 132 | | Boeing Capital Corporation (aircraft financing) (2006-2010). |
| | |
| Principal Occupation During at Least the Past 5 Years: | | | | |
| Private investor; andformerly, Counselor and Senior Advisor to the Chairman, CEO, and Board of Directors, of The Boeing Company (aerospace company), and member of the Executive Council (May 2019-January 1, 2020); Executive Vice President, General Counsel and member of the Executive Council, The Boeing Company (2006-2019); and Federal Appeals Court Judge, United States Court of Appeals for the Fourth Circuit (1991-2006). |
| | | | |
Larry D. Thompson (1945) One Franklin Parkway San Mateo, CA 94403-1906 | | Trustee | | Since 2007 | | 132 | | The Southern Company (energy company) (2014-present; previously 2010-2012), Graham Holdings Company (education and media organization) (2011-present) and Cbeyond, Inc. (business communications provider) (2010-2012). |
| | |
| Principal Occupation During at Least the Past 5 Years: | | | | |
| Director of various companies; Counsel, Finch McCranie, LLP (law firm) (2015-present); Independent Compliance Monitor and Auditor, Volkswagen AG (manufacturer of automobiles and commercial vehicles) (2017-present); John A. Sibley Professor of Corporate and Business Law, University of Georgia School of Law (2015-present; previously 2011-2012); andformerly, Executive Vice President – Government Affairs, General Counsel and Corporate Secretary, PepsiCo, Inc. (consumer products) (2012-2014); Senior Vice President – Government Affairs, General Counsel and Secretary, PepsiCo, Inc. (2004-2011); Senior Fellow of The Brookings Institution (2003-2004); Visiting Professor, University of Georgia School of Law (2004); and Deputy Attorney General, U.S. Department of Justice (2001-2003). |
Interested Board Members and Officers
| | | | | | | | |
| | | | |
| | | | |
| | | Position | | Length of
Time Served | | Number of Portfolios in
Fund Complex Overseen
by Board Member* | | Other Directorships Held
During at Least the Past 5 Years |
| | | | |
**Gregory E. Johnson (1961) One Franklin Parkway San Mateo, CA 94403-1906 | | Trustee | | Since 2007 | | 144 | | None |
| | |
| Principal Occupation During at Least the Past 5 Years: | | | | |
| Chairman of the Board, Member – Office of the Chairman, Director and Chief Executive Officer, Franklin Resources, Inc.; officer and/or director or trustee, as the case may be, of some of the other subsidiaries of Franklin Resources, Inc. and of 39 of the investment companies in Franklin Templeton; Vice Chairman, Investment Company Institute; andformerly, President, Franklin Resources, Inc. (1994-2015). |
| | | | |
**Rupert H. Johnson, Jr. (1940) One Franklin Parkway San Mateo, CA 94403-1906 | | Chairman of the Board and Trustee | | Since 2013 | | 132 | | None |
| | |
| Principal Occupation During at Least the Past 5 Years: | | | | |
| Vice Chairman, Member – Office of the Chairman and Director, Franklin Resources, Inc.; Director, Franklin Advisers, Inc. and officer and/or director or trustee, as the case may be, of some of the other subsidiaries of Franklin Resources, Inc. and of 37 of the investment companies in Franklin Templeton. |
| | | | |
Alison E. Baur (1964)
One Franklin Parkway San Mateo, CA 94403-1906 | | Vice President | | Since 2012 | | Not Applicable | | Not Applicable |
| | |
| Principal Occupation During at Least the Past 5 Years: | | | | |
| Deputy General Counsel, Franklin Templeton; and officer of some of the other subsidiaries of Franklin Resources, Inc. and of 41 of the investment companies in Franklin Templeton. |
| | |
| | | | |
| | | |
44 | | Annual Report | | franklintempleton.com |
FRANKLIN FUND ALLOCATOR SERIES
Interested Board Members and Officers(continued)
| | | | | | | | |
| | | | |
| | | Position | | Length of
Time Served | | Number of Portfolios in
Fund Complex Overseen
by Board Member* | | Other Directorships Held
During at Least the Past 5 Years |
| | | | |
Breda M. Beckerle (1958)
280 Park Avenue New York, NY 10017 | | Interim Chief Compliance Officer | | Since January 2009 | | Not Applicable | | Not Applicable |
| | |
| Principal Occupation During at Least the Past 5 Years: | | | | |
| Chief Compliance Officer, Fiduciary Investment Management International, Inc., Franklin Advisers, Inc., Franklin Advisory Services, LLC, Franklin Mutual Advisers, LLC, Franklin Templeton Institutional, LLC; and officer of 41 of the investment companies in Franklin Templeton. |
| | | | |
Gaston Gardey (1967) One Franklin Parkway
San Mateo, CA 94403-1906 | | Treasurer, Chief Financial Officer and Chief Accounting Officer | | Since 2009 | | Not Applicable | | Not Applicable |
| | |
| Principal Occupation During at Least the Past 5 Years: | | | | |
| Treasurer, U.S. Fund Administration & Reporting, and officer of 24 of the investment companies in Franklin Templeton. |
| | | | |
Steven J. Gray (1955) One Franklin Parkway
San Mateo, CA 94403-1906 | | Vice President andCo-Secretary | | Vice President since 2009 andCo-Secretary since 2019 | | Not Applicable | | Not Applicable |
| | |
| Principal Occupation During at Least the Past 5 Years: | | | | |
| Senior Associate General Counsel, Franklin Templeton; Vice President, Franklin Templeton Distributors, Inc. and FASA, LLC; and officer of 41 of the investment companies in Franklin Templeton. |
| | | | |
Matthew T. Hinkle (1971) One Franklin Parkway
San Mateo, CA 94403-1906 | | Chief Executive Officer – Finance and Administration | | Since 2017 | | Not Applicable | | Not Applicable |
| | |
| Principal Occupation During at Least the Past 5 Years: | | | | |
| Senior Vice President, Franklin Templeton Services, LLC; officer of 41 of the investment companies in Franklin Templeton; andformerly,Vice President, Global Tax (2012-April 2017) and Treasurer/Assistant Treasurer, Franklin Templeton (2009-2017). |
| | | | |
Robert Lim (1948)
One Franklin Parkway
San Mateo, CA 94403-1906 | | Vice President – AML Compliance | | Since 2016 | | Not Applicable | | Not Applicable |
| | |
| Principal Occupation During at Least the Past 5 Years: | | | | |
| Vice President, Franklin Templeton Companies, LLC; Chief Compliance Officer, Franklin Templeton Distributors, Inc. and Franklin Templeton Investor Services, LLC; and officer of 41 of the investment companies in Franklin Templeton. |
| | | | |
Edward D. Perks (1970)
One Franklin Parkway
San Mateo, CA 94403-1906 | | President and Chief Executive Officer – Investment Management | | Since 2018 | | Not Applicable | | Not Applicable |
| | |
| Principal Occupation During at Least the Past 5 Years: | | | | |
| President and Director, Franklin Advisers, Inc.; and officer of eight of the investment companies in Franklin Templeton (since December 2018). |
| | | | |
Navid J. Tofigh (1972)
One Franklin Parkway San Mateo, CA 94403-1906 | | Vice President | | Since 2015 | | Not Applicable | | Not Applicable |
| | |
| Principal Occupation During at Least the Past 5 Years: | | | | |
| Associate General Counsel, and officer of 41 of the investment companies in Franklin Templeton. |
| | | | |
franklintempleton.com | | Annual Report | | 45 |
FRANKLIN FUND ALLOCATOR SERIES
Interested Board Members and Officers(continued)
| | | | | | | | |
| | | | |
| | | Position | | Length of
Time Served | | Number of Portfolios in
Fund Complex Overseen
by Board Member* | | Other Directorships Held
During at Least the Past 5 Years |
| | | | |
Craig S. Tyle (1960)
One Franklin Parkway San Mateo, CA 94403-1906 | | Vice President | | Since 2005 | | Not Applicable | | Not Applicable |
| | |
| Principal Occupation During at Least the Past 5 Years: | | | | |
| General Counsel, Executive Vice President, Franklin Resources, Inc.; and officer of some of the other subsidiaries of Franklin Resources, Inc. and of 41 of the investment companies in Franklin Templeton. |
| | | | |
Lori A. Weber (1964) 300 S.E. 2nd Street Fort Lauderdale, FL 33301-1923 | | Vice President andCo-Secretary | | Vice President since 2011 andCo-Secretary since 2019 | | Not Applicable | | Not Applicable |
| | |
| Principal Occupation During at Least the Past 5 Years: | | | | |
| Senior Associate General Counsel, Franklin Templeton; Assistant Secretary, Franklin Resources, Inc.; Vice President and Secretary, Templeton Investment Counsel, LLC; and officer of 41 of the investment companies in Franklin Templeton. |
*We base the number of portfolios on each separate series of the U.S. registered investment companies within the Franklin Templeton fund complex. These portfolios have a common investment manager or affiliated investment managers.
**Gregory E. Johnson is considered to be an interested person of the Fund under the federal securities laws due to his position as an officer and director of Franklin Resources, Inc. (Resources), which is the parent company of the Fund’s investment manager and distributor. Rupert H. Johnson, Jr. is considered to be an interested person of the Fund under the federal securities laws due to his position as an officer and director and major shareholder of Resources.
Note 1: Rupert H. Johnson, Jr. is the uncle of Gregory E. Johnson.
Note 2: Effective March 12, 2019, John B. Wilson ceased to be a trustee of the Trust.
Note 3: Officer information is current as of the date of this report. It is possible that after this date, information about officers may change.
The Sarbanes-Oxley Act of 2002 and Rules adopted by the Securities and Exchange Commission require the Fund to disclose whether the Fund’s Audit Committee includes at least one member who is an audit committee financial expert within the meaning of such Act and Rules. The Fund’s Board has determined that there is at least one such financial expert on the Audit Committee and has designated Mary C. Choksi as its audit committee financial expert. The Board believes that Ms. Choksi qualifies as such an expert in view of her extensive business background and experience. She currently serves as a director of Avis Budget Group, Inc. (2007-present) and formerly, Founder and Senior Advisor, Strategic Investment Group (1987 to 2017). Ms. Choksi has been a Member of the Fund’s Audit Committee since 2014. As a result of such background and experience, the Board believes that Ms. Choksi has acquired an understanding of generally accepted accounting principles and financial statements, the general application of such principles in connection with the accounting estimates, accruals and reserves, and analyzing and evaluating financial statements that present a breadth and level of complexity of accounting issues generally comparable to those of the Fund, as well as an understanding of internal controls and procedures for financial reporting and an understanding of audit committee functions. Ms. Choksi is an independent Board member as that term is defined under the relevant Securities and Exchange Commission Rules and Releases.
The Statement of Additional Information (SAI) includes additional information about the board members and is available, without charge, upon request. Shareholders may call (800) DIALBEN/342-5236 to request the SAI.
| | | | |
| | | |
46 | | Annual Report | | franklintempleton.com |
FRANKLIN FUND ALLOCATOR SERIES
Shareholder Information
Proxy Voting Policies and Procedures
The Trust’s investment manager has established Proxy Voting Policies and Procedures (Policies) that the Trust uses to determine how to vote proxies relating to portfolio securities. Shareholders may view the Trust’s complete Policies online at franklintempleton.com. Alternatively, shareholders may request copies of the Policies free of charge by calling the Proxy Group collect at (954)527-7678 or by sending a written request to: Franklin Templeton Companies, LLC, 300 S.E. 2nd Street, Fort Lauderdale, FL 33301, Attention: Proxy Group. Copies of the Trust’s proxy voting records are also made available online at franklintempleton.com and posted on the U.S. Securities and Exchange Commission’s website at sec.gov and reflect the most recent12-month period ended June 30.
Quarterly Statement of Investments
The Trust files a complete statement of investments with the U.S. Securities and Exchange Commission for the first and third quarters for each fiscal year as an exhibit to its report on FormN-PORT. Shareholders may view the filed FormN-PORT by visiting the Commission’s website at sec.gov. The filed form may also be viewed and copied at the Commission’s Public Reference Room in Washington, DC. Information regarding the operations of the Public Reference Room may be obtained by calling(800) SEC-0330.
Householding of Reports and Prospectuses
You will receive each Fund’s financial reports every six months as well as an annual updated summary prospectus (prospectus available upon request). To reduce Fund expenses, we try to identify related shareholders in a household and send only one copy of the financial reports and summary prospectus. This process, called “house- holding,” will continue indefinitely unless you instruct us otherwise. If you prefer not to have these documents householded, please call us at (800)632-2301. At any time you may view current prospectuses/summary prospectuses and financial reports on our website. If you choose, you may receive these documents through electronic delivery.
| | | | |
franklintempleton.com | | Annual Report | | 47 |
This page intentionally left blank.
Authorized for distribution only when accompanied or preceded by a summary prospectus and/or prospectus. Investors should carefully consider a fund’s investment goals, risks, charges and expenses before investing. A prospectus contains this and other information; please read it carefully before investing.
To help ensure we provide you with quality service, all calls to and from our service areas are monitored and/or recorded.
| | | | | | |
| | Annual Report and Shareholder Letter
Franklin Fund Allocator Series | | |
| | Fund Administrator | | Distributor | | Shareholder Services |
| | Franklin Templeton | | Franklin Templeton Distributors, Inc. | | (800)632-2301 |
| | Services, LLC | | (800) DIAL BEN®/342-5236 | | |
| | | | franklintempleton.com | | |
| | |
| © 2020 Franklin Templeton Investments. All rights reserved. | | FAS2 A 02/20 |
| | | | | | |
| Franklin LifeSmart™ | | | | | | |
| | | |
| Retirement Income Fund | | | | 2040 Retirement Target Fund | | |
| | | |
| 2020 Retirement Target Fund | | | | 2045 Retirement Target Fund | | |
| | | |
| 2025 Retirement Target Fund | | | | 2050 Retirement Target Fund | | |
| | | |
| 2030 Retirement Target Fund | | | | 2055 Retirement Target Fund | | |
| | | |
| 2035 Retirement Target Fund | | | | | | |
| |
| Sign up for electronic delivery at franklintempleton.com/edelivery | | |
Internet Delivery of Fund Reports Unless You Request Paper Copies: Effective January 1, 2021, as permitted by the SEC, paper copies of the Fund’s shareholder reports will no longer be sent by mail, unless you specifically request them from the Fund or your financial intermediary. Instead, the reports will be made available on a website, and you will be notified by mail each time a report is posted and provided with a website link to access the report.
If you already elected to receive shareholder reports electronically, you will not be affected by this change and you need not take any action. If you have not signed up for electronic delivery, we would encourage you to join fellow shareholders who have. You may elect to receive shareholder reports and other communications electronically from the Fund by calling (800)632-2301 or by contacting your financial intermediary.
You may elect to continue to receive paper copies of all your future shareholder reports free of charge by contacting your financial intermediary or, if you invest directly with a Fund, calling (800)632-2301 to let the Fund know of your request. Your election to receive reports in paper will apply to all funds held in your account.
SHAREHOLDER LETTER
Dear Shareholder:
The U.S. economy, after moderating for two consecutive quarters, grew during the 12 months ended December 31, 2019, and the unemployment rate declined. In January 2019, the U.S. Federal Reserve (Fed) signaled the end of its tightening cycle and cut the federal funds rate by 0.25% at each of its July, September and October 2019 meetings, decreasing the rate from 2.50% to 1.75% byperiod-end. The Fed cited muted inflation pressures, some soft business indicators and the potential effects of global developments on the U.S. economy as rationale for its more accommodative monetary policy. Stocks responded positively to the interest-rate cuts, despite some volatility due to U.S.-China trade tensions, and stocks gained further in December 2019 after the Fed indicated it would likely leave interest rates unchanged in 2020.
In this environment, the prices of U.S. stocks, as measured by the Standard & Poor’s® 500 Index (S&P 500®), returned +28.88% (the index increasing from 2,506.85 to 3,230.78).1,3 The prices of stocks in global developed markets, as measured by the MSCI World Index, returned +25.19% (the index increasing from 1,883.901 to 2,358.468).2,3 Investment-grade bonds, as measured by the Bloomberg Barclays U.S. Aggregate Bond Index (Bloomberg Index), posted a +8.72% total return (an index increase from 2,046.60 to 2,225.00), which includes reinvestment of income and distributions.4
We are committed to our long-term perspective and disciplined investment approach as we conduct a rigorous, fundamental analysis of securities with a regular emphasis on investment risk management.
We believe active, professional investment management serves investors well. We also recognize the important role
of financial advisors in today’s markets and encourage investors to continue to seek their advice. Amid changing markets and economic conditions, we are confident investors with a well-diversified portfolio and a patient, long-term outlook should be well positioned for the years ahead.
In addition, Franklin Fund Allocator Series’ annual report includes more detail about prevailing conditions and a discussion about investment decisions during the period. As you know, all securities markets fluctuate, as do mutual fund share prices.
We thank you for investing with Franklin, welcome your questions and comments, and look forward to assisting your future investment plans.
Sincerely,
Rupert H. Johnson, Jr.
Chairman
Franklin Fund Allocator Series
This letter reflects our analysis and opinions as of December 31, 2019, unless otherwise indicated. The information is not a complete analysis of every aspect of any market, country, industry, security or fund. Statements of fact are from sources considered reliable.
1. Source: Copyright © 2020, S&P Dow Jones Indices LLC. All rights reserved.
2. Source: MSCI.
3. Source: Morningstar. The changes in index prices shown for the S&P 500 and MSCI World Index do not include reinvestments of income and distributions, which are included in their total returns, which were: S&P 500 +31.49% (index total return resulting in an increase from 4,984.22 to 6,553.57) and MSCI World Index +28.40% (index total return resulting in an increase from 7,771.710 to 9,979.034).
4. Sources: Morningstar and Bloomberg Barclays Indices. For the Bloomberg Index, only total return as shown is available, not price change without the inclusion of reinvested income and distributions.
See www.franklintempletondatasources.com for additional data provider information.
|
Not FDIC Insured | May Lose Value | No Bank Guarantee |
| | | | |
franklintempleton.com | | Not part of the annual report | | 1 |
Contents
|
| Visitfranklintempleton.comfor fund updates, to access your account, or to find helpful financial planning tools. |
| | | | |
| | | |
2 | | Annual Report | | franklintempleton.com |
ANNUAL REPORT
Economic and Market Overview
Global developed and emerging market stocks, as measured by the MSCI All Country World Index, posted strong returns during the reporting period. Although global economic growth slowed from 2018, interest-rate cuts from many central banks and the easing of trade tensions nearperiod-end contributed to the generally positive environment for equities worldwide. Reflecting investor optimism and slowing but resilient economic growth, stocks advanced in every major region of the globe.
In the U.S., solid economic growth also supported equities, as healthy consumer spending and a strong labor market kept the economy afloat. The unemployment rate fell during the year, reaching 3.5% in September, November and December 2019, the lowest recorded unemployment rate in 50 years.1 Wages also grew, albeit at a moderate pace, and inflation remained persistently low. In addition, deficit spending by the U.S. government boosted current growth at the expense of long-term debt. Despite the strength in the consumer sector, some parts of the economy struggled, particularly heavy industry. Annual industrial production contracted late in the reporting period, manufacturing output stalled and capital spending declined.
The U.S. Federal Reserve (Fed) provided a substantial boost to equity markets early in the reporting period as it shifted to a more accommodative monetary policy. In January 2019, the Fed signaled the end of its tightening cycle and cut the federal funds rate three times thereafter, lowering it to a range of 1.50%–1.75%. Stocks responded positively to the interest-rate cuts and gained further in December 2019 after the Fed indicated it would likely leave interest rates unchanged in 2020.
Growth slowed overall in the eurozone, particularly in Germany and Italy. Germany, which is heavily reliant on exports, was adversely affected by the trade conflict between the U.S. and China and the resulting slowdown in global trade. In Italy, political uncertainty and budget concerns caused the country’s annual gross domestic product (GDP) growth to stall in 2019’s first quarter before accelerating in the second quarter. Despite sluggish economic conditions, European developed market equities, as measured by the MSCI Europe Index, posted strong returns overall, as easing trade tensions buoyed investor optimism and an electoral victory by the Conservative Party in the U.K. alleviated uncertainty
surrounding Brexit. Although the European Central Bank left its headline refinancing rate unchanged, it lowered the deposit rate and restarted its bond-buying stimulus program, further supporting stocks.
Economic growth in Asia was relatively solid overall, despite slowdowns in several large emerging market countries, such as China and India. Japan’s economy grew amid the Bank of Japan’s sizable stimulus program. The trade war between the U.S. and China provided the backdrop for Asian stocks, which rose and fell in sync with investor sentiment regarding a trade deal. A phase one trade agreement between the two countries reached in December 2019 propelled Asian developed and emerging market stocks, which ultimately ended with strong returns over the12-month period, as measured by the MSCI All Country Asia Index.
Emerging market stocks overall experienced several sharp selloffs and subsequent rebounds throughout the reporting period before ending with gains. In aggregate, economic growth slowed somewhat from 2018 but remained solid, although there was some variation among individual countries. Many central banks in emerging markets cut interest rates throughout the reporting period which, along with resilient GDP growth, provided a supportive environment for equities. Russian stocks posted the highest returns among emerging markets as the threat of further sanctions receded and a solid fiscal environment reassured investors. Overall, global emerging markets, as measured by the MSCI Emerging Markets Index, posted robust returns for the period.
The foregoing information reflects our analysis and opinions as of December 31, 2019. The information is not a complete analysis of every aspect of any market, country, industry, security or fund. Statements of fact are from sources considered reliable.
1. Source: U.S. Bureau of Labor Statistics.
See www.franklintempletondatasources.com for additional data provider information.
| | | | |
franklintempleton.com | | Annual Report | | 3 |
Franklin LifeSmart™ Retirement Income Fund
This annual report for Franklin LifeSmart™ Retirement Income Fund covers the fiscal year ended December 31, 2019.
Your Fund’s Goal and Main Investments
The Fund seeks to make monthly distributions, while preserving the investors’ capital over the long term. The Fund employs an asset allocation strategy, combined with an income generation strategy, designed for investors in retirement. Under normal market conditions, the Fund allocates its assets among the broad asset classes of equity, fixed income and alternative(non-traditional) investments by investing primarily in a distinctly weighted combination of underlying funds, predominantly other Franklin Templeton mutual funds and exchange-traded funds (ETFs), based on each underlying fund’s predominant asset class and strategy.
Asset Allocation*
Based on Total Net Assets as of 12/31/19
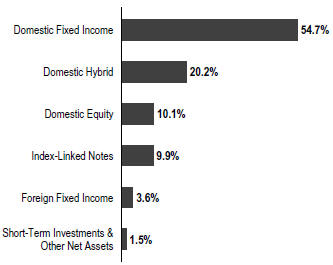
*The asset allocation is based on the Statement of Investments (SOI), which classifies each underlying fund and other fund investments into a broad asset class based on its predominant investments under normal market conditions.
Performance Overview
The Fund’s Class A shares posted a +11.93% cumulative total return for the 12 months ended December 31, 2019. In comparison, the Fund’s equity benchmark, the MSCI All
Country World Index (ACWI), which measures equity market performance in global developed and emerging markets, posted a +27.30% total return.1 The Fund’s fixed income benchmark, the Bloomberg Barclays Multiverse Index, a broad-based measure of the global fixed income bond market, posted a +7.13% total return.1 You can find the Fund’s long-term performance data in the Performance Summary beginning on page 6.
Performance data represent past performance, which does not guarantee future results. Investment return and principal value will fluctuate, and you may have a gain or loss when you sell your shares. Current performance may differ from figures shown. For most recentmonth-end performance, go tofranklintempleton.comor call(800)342-5236.
Investment Strategy
When selecting equity funds, the investment manager considers the underlying funds’ foreign and domestic exposure, market capitalization ranges, and investment style (growth vs. value). When selecting fixed-income funds, the investment manager focuses primarily on maximizing income, appropriate to the Fund’s risk profile, and considers the credit quality, duration and maturity of the underlying funds’ portfolios. Certain fixed-income funds may hold securities across the credit quality spectrum, including below investment grade or “junk” bonds. In evaluating the risk level of the underlying funds, including alternative investments funds, the investment manager analyzes such factors as: (a) relative and absolute performance, including correlations with other underlying funds as well as corresponding benchmarks, and (b) their volatility (the variability of returns from one period to the next).
Manager’s Discussion
The Fund’s performance can be attributed largely to its allocation among equities and fixed income securities and to the actual performance of the fund investments.
Atperiod-end, our largest domestic fixed income fund holding, Franklin U.S. Government Securities Fund –Class R6, underperformed the Fund’s fixed income benchmark, the Bloomberg Barclays Multiverse Index. Our
1. Source: Morningstar.
The indexes are unmanaged and include reinvestment of any income or distributions. They do not reflect any fees, expenses or sale charges. One cannot invest directly in an index, and an index is not representative of the Fund’s portfolio.
See www.franklintempletondatasources.com for additional data provider information.
The dollar value, number of shares or principal amount, and names of all portfolio holdings are listed in the Fund’s SOI, which begins on page 64.
| | | | |
| | | |
4 | | Annual Report | | franklintempleton.com |
FRANKLIN LIFESMART™ RETIREMENT INCOME FUND
Top Fund Holdings
12/31/19
| | | | |
| | | % of Total
Net Assets | |
| |
Franklin Income Fund – Class R6 | | | 20.2% | |
| |
Franklin U.S. Government Securities Fund – Class R6 | | | 20.0% | |
| |
Franklin Liberty U.S. Core Bond ETF | | | 19.8% | |
| |
Franklin LibertyQ U.S. Equity ETF | | | 10.1% | |
| |
iShares Core U.S. Aggregate Bond ETF | | | 9.9% | |
| |
UBS AG London Branch – senior note | | | 5.1% | |
| |
Vanguard Intermediate-Term Corporate Bond ETF | | | 5.0% | |
| |
Credit Suisse AG – senior note | | | 4.8% | |
| |
Templeton Global Total Return Fund – Class R6 | | | 3.6% | |
foreign fixed income fund holding, Templeton Global Total Return Fund – Class R6, underperformed the Fund’s fixed income benchmark, the Bloomberg Barclays Multiverse Index. Our domestic equity fund holding, Franklin LibertyQ U.S. Equity ETF, outperformed the Fund’s equity benchmark, the MSCI ACWI. Our domestic hybrid fund holding, Franklin Income Fund – Class R6, underperformed the MSCI ACWI and outperformed the Bloomberg Barclays Multiverse Index. The index-linked note increased the level of income the Fund was able to generate.
Thank you for your continued participation in Franklin LifeSmart™ Retirement Income Fund. We look forward to serving your future investment needs.
| | |
 | | 
Thomas A. Nelson, CFA Co-Lead Portfolio Manager |
| | |
| |
May Tong, CFA Co-Lead Portfolio Manager |
The foregoing information reflects our analysis, opinions and portfolio holdings as of December 31, 2019, the end of the reporting period. The way we implement our main investment strategies and the resulting portfolio holdings may change depending on factors such as market and economic conditions. These opinions may not be relied upon as investment advice or an offer for a particular security. The information is not a complete analysis of every aspect of any market, country, industry, security or the Fund. Statements of fact are from sources considered reliable, but the investment manager makes no representation or warranty as to their completeness or accuracy. Although historical performance is no guarantee of future results, these insights may help you understand our investment management philosophy.
CFA®is a trademark owned by CFA Institute.
| | | | |
franklintempleton.com | | Annual Report | | 5 |
FRANKLIN LIFESMART™ RETIREMENT INCOME FUND
Performance Summary as of December 31, 2019
The performance tables and graphs do not reflect any taxes that a shareholder would pay on Fund dividends, capital gain distributions, if any, or any realized gains on the sale of Fund shares. Total return reflects reinvestment of the Fund’s dividends and capital gain distributions, if any, and any unrealized gains or losses. Your dividend income will vary depending on dividends or interest paid by securities in the Fund’s portfolio, adjusted for operating expenses of each class. Capital gain distributions are net profits realized from the sale of portfolio securities.
Performance as of 12/31/191
Cumulative total return excludes sales charges. Average annual total return includes maximum sales charges. Sales charges will vary depending on the size of the investment and the class of share purchased. The maximum is 5.50% and the minimum is 0%.Class A:5.50% maximum initial sales charge;Advisor Class:no sales charges. For other share classes, visitfranklintempleton.com.
| | | | | | | | |
| Share Class | | Cumulative
Total Return2 | | | Average Annual
Total Return3 | |
A4 | | | | | | | | |
1-Year | | | +11.93% | | | | +5.79% | |
5-Year | | | +17.31% | | | | +2.08% | |
10-Year | | | +65.78% | | | | +4.59% | |
| | |
Advisor | | | | | | | | |
1-Year | | | +12.16% | | | | +12.16% | |
5-Year | | | +18.73% | | | | +3.49% | |
10-Year | | | +70.39% | | | | +5.47% | |
| | | | | | | | | | | | |
| | | Distribution | | | 30-Day Standardized Yield6 | |
| Share Class | | Rate5 | | | (with fee waiver) | | | (without fee waiver) | |
A | | | 3.55% | | | | 2.97% | | | | 2.32% | |
Advisor | | | 3.99% | | | | 3.39% | | | | 2.71% | |
Performance data represent past performance, which does not guarantee future results. Investment return and principal value will fluctuate, and you may have a gain or loss when you sell your shares. Current performance may differ from figures shown. For most recentmonth-end performance, go tofranklintempleton.comor call(800)342-5236.
See page 9 for Performance Summary footnotes.
| | | | |
| | | |
6 | | Annual Report | | franklintempleton.com |
FRANKLIN LIFESMART™ RETIREMENT INCOME FUND
PERFORMANCE SUMMARY
Total Return Index Comparison for a Hypothetical $10,000 Investment1
Total return represents the change in value of an investment over the periods shown. It includes any applicable maximum sales charge, Fund expenses, account fees and reinvested distributions. The unmanaged indexes include reinvestment of any income or distributions. They differ from the Fund in composition and do not pay management fees or expenses. One cannot invest directly in an index.
Class A(1/1/10–12/31/19)
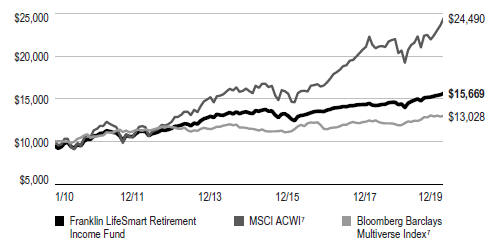
Advisor Class(1/1/10–12/31/19)
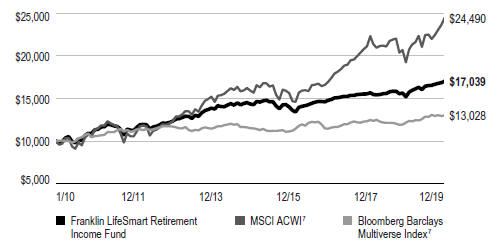
See page 9 for Performance Summary footnotes.
| | | | |
franklintempleton.com | | Annual Report | | 7 |
FRANKLIN LIFESMART™ RETIREMENT INCOME FUND
PERFORMANCE SUMMARY
Net Asset Value
| | | | | | | | | | | | |
| Share Class (Symbol) | | 12/31/19 | | | 12/31/18 | | | Change | |
A (FTRAX) | | | $11.15 | | | | $10.35 | | | | +$0.80 | |
C (FRTCX) | | | $11.01 | | | | $10.23 | | | | +$0.78 | |
R (FBRLX) | | | $11.11 | | | | $10.31 | | | | +$0.80 | |
R6(FLMTX) | | | $11.20 | | | | $10.40 | | | | +$0.80 | |
Advisor(FLRDX) | | | $11.19 | | | | $10.39 | | | | +$0.80 | |
Distributions(1/1/19–12/31/19)
| | | | |
| Share Class | | Net Investment
Income | |
A | | | $0.4185 | |
C | | | $0.3369 | |
R | | | $0.3909 | |
R6 | | | $0.4509 | |
Advisor | | | $0.4461 | |
Total Annual Operating Expenses8
| | | | | | | | |
| Share Class | | With Fee
Waiver | | | Without Fee
Waiver | |
A | | | 0.71% | | | | 1.41% | |
Advisor | | | 0.46% | | | | 1.16% | |
See page 9 for Performance Summary footnotes.
| | | | |
| | | |
8 | | Annual Report | | franklintempleton.com |
FRANKLIN LIFESMART™ RETIREMENT INCOME FUND
PERFORMANCE SUMMARY
Each class of shares is available to certain eligible investors and has different annual fees and expenses, as described in the prospectus.
All investments involve risks, including possible loss of principal. Since the Fund invests in underlying funds, including ETFs, which may engage in a variety of investment strategies involving certain risks, the Fund is subject to those same risks. Stock prices fluctuate, sometimes rapidly and dramatically, due to factors affecting individual companies, particular industries or sectors, or general market conditions. Bond prices generally move in the opposite direction of interest rates. Thus, as the prices of bonds in the Fund adjust to a rise in interest rates, the Fund’s share price may decline. Foreign investing carries additional risks such as currency and market volatility and political or social instability, risks which are heightened in developing countries. Investments in equity-linked notes (ELNs) often have risks similar to their underlying securities, which could include management, market, and, as applicable, foreign securities and currency risks. In addition, ELNs are subject to certain debt securities risks, such as interest rate and credit risks, as well as counterparty and liquidity risk. Investments in equity index-linked notes (ILNs) often have risks similar to securities in the underlying index, which could include management risk, market risk and, as applicable, foreign securities and currency risks. Investments in derivatives involve costs and can create economic leverage, which may result in significant volatility and cause the fund to participate in losses (as well as gains) that exceed the fund’s initial investment.
The Fund is not guaranteed to achieve its investment goal of preserving capital while making monthly distributions nor is there any guarantee that the Fund will provide sufficient income at or through the investor’s retirement. In addition, some of its distributions may be treated in part as a return of capital which will decrease shareholders’ cost basis in the Fund and affect the amount of any capital gain or loss that shareholders realize when selling or exchanging Fund shares. The annual payout rate may be adjusted higher or lower from year to year, and could vary substantially over time. It is possible for the Fund to suffer substantial investment losses and simultaneously experience additional asset reductions as a result of its distributions to shareholders under the managed distribution policy. Investors who hold the Fund within atax-advantaged retirement account should consult their tax advisors to discuss tax consequences of receiving cash distributions. In addition, use of the Fund or election of the option to receive distribution payments in cash may be restricted in certain retirement plans by the terms of the governing plan documents and/or the discretion of the plan administrator. Investors are strongly advised to consult with their financial advisor for assistance before selecting the appropriate fund, based on their goals and personal situations, including time horizon, retirement income needs, risk tolerance and tax bracket. These and other risks are described more fully in the Fund’s prospectus.
1. The Fund has an expense reduction and a fee waiver associated with any investments it makes in a Franklin Templeton money fund, contractually guaranteed through 4/30/20. Fund investment results reflect the expense reduction and fee waiver; without these reductions, the results would have been lower. As of May 1, 2016, the Fund changed its name from Franklin LifeSmart 2015 Retirement Target Date Fund in connection with changes to its strategies including, among other things, the addition of an income generation strategy to support the Fund’s managed distribution policy. Prior to that, as of October 2013, the Fund’s glide path was modified, and among other changes, reflects a lower starting allocation to equity funds; such a change can impact performance.
2. Cumulative total return represents the change in value of an investment over the periods indicated.
3. Average annual total return represents the average annual change in value of an investment over the period indicated. Return for less than one year, if any, has not been annualized.
4. Prior to 9/10/18, these shares were offered at a higher initial sales charge of 5.75%, thus actual returns (with sales charges) would have differed. Average annual total returns (with sales charges) have been restated to reflect the current maximum initial sales charge of 5.50%.
5. Distribution rate is based on an annualization of the respective class’s December dividend and the maximum offering price (NAV for Advisor Class) per share on 12/31/19.
6. The Fund’s30-day standardized yield is calculated over a trailing30-day period using the yield to maturity on bonds and/or the dividends accrued on stocks. It may not equal the Fund’s actual income distribution rate, which reflects the Fund’s past dividends paid to shareholders.
7. Source: Morningstar. The MSCI ACWI is a free float-adjusted, market capitalization-weighted index designed to measure equity market performance in global developed and emerging markets. The Bloomberg Barclays Multiverse Index provides a broad-based measure of the global fixed income bond market. The index represents the union of the Global Aggregate Index and the Global High Yield Index and captures investment-grade and high yield securities in all eligible currencies.
8. Figures are as stated in the Fund’s current prospectus, including the effect of acquired fund fees and expenses, and may differ from the expense ratios disclosed in the Your Fund’s Expenses and Financial Highlights sections in this report. In periods of market volatility, assets may decline significantly, causing total annual Fund operating expenses to become higher than the figures shown.
See www.franklintempletondatasources.com for additional data provider information.
| | | | |
franklintempleton.com | | Annual Report | | 9 |
FRANKLIN LIFESMART™ RETIREMENT INCOME FUND
Your Fund’s Expenses
As a Fund shareholder, you can incur two types of costs: (1) transaction costs, including sales charges (loads) on Fund purchases and redemptions; and (2) ongoing Fund costs, including management fees, distribution and service(12b-1) fees, and other Fund expenses. All mutual funds have ongoing costs, sometimes referred to as operating expenses. The table below shows ongoing costs of investing in the Fund and can help you understand these costs and compare them with those of other mutual funds. The table assumes a $1,000 investment held for the six months indicated.
Actual Fund Expenses
The table below provides information about actual account values and actual expenses in the columns under the heading “Actual.” In these columns the Fund’s actual return, which includes the effect of Fund expenses, is used to calculate the “Ending Account Value” for each class of shares. You can estimate the expenses you paid during the period by following these steps (ofcourse, your account value and expenses will differ from those in this illustration):Divide your account value by $1,000 (ifyour account had an $8,600 value, then $8,600÷ $1,000 = 8.6). Then multiply the result by the number in the row for your class of shares under the headings “Actual” and “Expenses Paid During Period” (ifActual Expenses Paid During Period were $7.50, then 8.6 x $7.50 = $64.50). In this illustration, the actual expenses paid this period are $64.50.
Hypothetical Example for Comparison with Other Funds
Under the heading “Hypothetical” in the table, information is provided about hypothetical account values and hypothetical expenses based on the Fund’s actual expense ratio and an assumed rate of return of 5% per year before expenses, which is not the Fund’s actual return. This information may not be used to estimate the actual ending account balance or expenses you paid for the period, but it can help you compare ongoing costs of investing in the Fund with those of other funds. To do so, compare this 5% hypothetical example for the class of shares you hold with the 5% hypothetical examples that appear in the shareholder reports of other funds.
Please note that expenses shown in the table are meant to highlight ongoing costs and do not reflect any transactional costs. Therefore, information under the heading “Hypothetical” is useful in comparing ongoing costs only, and will not help you compare total costs of owning different funds. In addition, if transactional costs were included, your total costs would have been higher.
| | | | | | | | | | | | | | | | | | |
| | | | | | | Actual
(actual return after expenses) | | | | Hypothetical (5% annual return before expenses) | | | | |
Share Class | | Beginning
Account
Value 7/1/19 | | | | Ending
Account
Value 12/31/19 | | Expenses Paid During Period
7/1/19–12/31/191, 2 | | | | Ending
Account
Value 12/31/19 | | Expenses Paid During
Period
7/1/19–12/31/191, 2 | | | | Net Annualized
Expense Ratio2 |
| | | | | | | | | | | | |
| A | | $1,000 | | | | $1,035.30 | | $1.54 | | | | $1,023.69 | | $1.53 | | | | 0.30% |
| C | | $1,000 | | | | $1,031.00 | | $5.38 | | | | $1,019.91 | | $5.35 | | | | 1.05% |
| R | | $1,000 | | | | $1,034.20 | | $2.56 | | | | $1,022.68 | | $2.55 | | | | 0.50% |
| R6 | | $1,000 | | | | $1,036.70 | | $0.00 | | | | $1,025.21 | | $0.00 | | | | 0.00% |
| Advisor | | $1,000 | | | | $1,036.50 | | $0.26 | | | | $1,024.95 | | $0.26 | | | | 0.05% |
1. Expenses are equal to the annualized expense ratio for thesix-month period as indicated above—in the far right column—multiplied by the simple average account value over the period indicated, and then multiplied by 184/365 to reflect theone-half year period.
2. Reflects expenses after fee waivers and expense reimbursements. Does not include acquired fund fees and expenses.
| | | | |
| | | |
10 | | Annual Report | | franklintempleton.com |
Franklin LifeSmart™ 2020 Retirement Target Fund
This annual report for Franklin LifeSmart™ 2020 Retirement Target Fund covers the fiscal year ended December 31, 2019.
Your Fund’s Goal and Main Investments
The Fund seeks the highest level of long-term total return, which consists of capital appreciation and income, consistent with the Fund’s asset allocation. Under normal market conditions, the Fund allocates its assets among the broad asset classes of equity, fixed income and alternative(non-traditional) investments by investing primarily in a distinctly weighted combination of underlying funds, predominantly other Franklin Templeton mutual funds and exchange-traded funds (ETFs), with an increasing emphasis on income as the target date of 2020 approaches. The target date is the approximate retirement year of the investor.
Asset Allocation*
Based on Total Net Assets as of 12/31/19
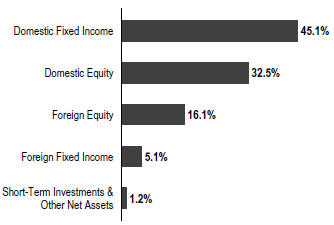
*The asset allocation is based on the Statement of Investments (SOI), which classifies each underlying fund and other fund investments into a broad asset class based on its predominant investments under normal market conditions.
Performance Overview
The Fund’s Class A shares posted a +13.43% cumulative total return for the 12 months ended December 31, 2019. In comparison, the Fund’s equity benchmark, the MSCI All Country World Index (ACWI), which measures equity market performance in global developed and emerging markets, posted a +27.30% total return. The Fund’s fixed income
benchmark, the Bloomberg Barclays Multiverse Index, a broad-based measure of the global fixed income bond market, posted a +7.13% total return.1 You can find more of the Fund’s performance data in the Performance Summary beginning on page 13.
Performance data represent past performance, which does not guarantee future results. Investment return and principal value will fluctuate, and you may have a gain or loss when you sell your shares. Current performance may differ from figures shown. For most recentmonth-end performance, go tofranklintempleton.comor call(800)342-5236.
Investment Strategy
Under normal market conditions, the investment manager uses a predetermined glide path as a guide in allocating the Fund’s assets among underlying funds in the broad asset classes (the Neutral Glide Path). However, when the investment manager’s proprietary risk indicator model signals a sustained level of market turbulence or a prolonged down (or bear) market, the investment manager may, in its sole discretion, employ a defensive glide path, which has higher fixed income and lower equity allocations than the Neutral Glide Path (the Defensive Glide Path). Then, if the market stabilizes, the investment manager may, in its sole discretion, shift the Fund’s portfolio back to the Neutral Glide Path. These glide path shifts are executed through purchases and sales of underlying funds and ETFs to increase or decrease the Funds’ equity and fixed income allocations.
The target asset allocations in the Neutral and Defensive Glide Paths change over time, reducing their exposure to equity investments and becoming increasingly conservative until five years after the stated target date. At approximately five years after the target date, the Fund’s final asset allocation mix will be 40% equity funds and 60% fixed-income funds under the Neutral Glide Path and 30% equity funds and 70% fixed-income funds under the Defensive Glide Path.
When selecting equity funds, the investment manager considers the underlying funds’ foreign and domestic exposure, market capitalization ranges, and investment style
1. Source: Morningstar.
The indexes are unmanaged and include reinvestment of any income or distributions. They do not reflect any fees, expenses or sale charges. One cannot invest directly in an index, and an index is not representative of the Fund’s portfolio.
See www.franklintempletondatasources.com for additional data provider information.
The dollar value, number of shares or principal amount, and names of all portfolio holdings are listed in the Fund’s SOI, which begins on
page 70.
| | | | |
franklintempleton.com | | Annual Report | | 11 |
FRANKLIN LIFESMART™ 2020 RETIREMENT TARGET FUND
(growth vs. value). When selecting fixed-income funds, the investment manager considers the need for reduced market risks and lower volatility, appropriate to the Fund’s risk profile, and considers the credit quality, duration and maturity of the underlying funds’ portfolios.
Top 10 Fund Holdings
12/31/19
| | | | |
| | | % of Total
Net Assets | |
| |
Franklin Liberty U.S. Core Bond ETF | | | 21.4% | |
| |
Franklin Growth Fund – Class R6 | | | 9.7% | |
| |
iShares Core U.S. Aggregate Bond ETF | | | 9.4% | |
| |
Franklin LibertyQ U.S. Equity ETF | | | 9.0% | |
| |
Franklin Low Duration Total Return Fund – Class R6 | | | 8.6% | |
| |
Franklin U.S. Core Equity (IU) Fund | | | 8.3% | |
| |
Franklin International Core Equity (IU) Fund | | | 5.2% | |
| |
Franklin Rising Dividends Fund – Class R6 | | | 4.9% | |
| |
Templeton Global Total Return Fund – Class R6 | | | 3.8% | |
| |
Vanguard Total International Bond ETF | | | 3.6% | |
Manager’s Discussion
The Fund’s performance can be attributed largely to its allocation among equities and fixed income securities and to the actual performance of the fund investments. This allocation shifts every year, in accordance with the target date associated with the portfolio.
Atperiod-end, our largest domestic value fund holding, Franklin Rising Dividends Fund – Class R6, and our largest domestic growth fund holding, Franklin Growth Fund – Class R6, outperformed the Fund’s equity benchmark, the MSCI ACWI, while our largest foreign equity fund holding, Franklin International Core Equity (IU) Fund, which incepted on August 9, 2019, outperformed the index for the period since its inception through December 31, 2019. On the fixed income side, our largest domestic fixed income fund holding, Franklin Liberty U.S. Core Bond ETF, which was incepted on September 17, 2019, outperformed the Fund’s fixed income benchmark, the Bloomberg Barclays Multiverse Index, for the period since its inception through December 31, 2019. Our foreign fixed income fund holding, Templeton Global Total Return Fund – Class R6, underperformed the Fund’s fixed income benchmark, the Bloomberg Barclays Multiverse Index.
Thank you for your continued participation in Franklin LifeSmart™ 2020 Retirement Target Fund. We look forward to serving your future investment needs.
| | |
| | |
Thomas A. Nelson, CFA Co-Lead Portfolio Manager |
| |
May Tong, CFA Co-Lead Portfolio Manager |
The foregoing information reflects our analysis, opinions and portfolio holdings as of December 31, 2019, the end of the reporting period. The way we implement our main investment strategies and the resulting portfolio holdings may change depending on factors such as market and economic conditions. These opinions may not be relied upon as investment advice or an offer for a particular security. The information is not a complete analysis of every aspect of any market, country, industry, security or the Fund. Statements of fact are from sources considered reliable, but the investment manager makes no representation or warranty as to their completeness or accuracy. Although historical performance is no guarantee of future results, these insights may help you understand our investment management philosophy.
| | | | |
| | | |
12 | | Annual Report | | franklintempleton.com |
FRANKLIN LIFESMART™ 2020 RETIREMENT TARGET FUND
Performance Summary as of December 31, 2019
The performance table and graphs do not reflect any taxes that a shareholder would pay on Fund dividends, capital gain distributions, if any, or any realized gains on the sale of Fund shares. Total return reflects reinvestment of the Fund’s dividends and capital gain distributions, if any, and any unrealized gains or losses. Your dividend income will vary depending on dividends or interest paid by securities in the Fund’s portfolio, adjusted for operating expenses of each class. Capital gain distributions are net profits realized from the sale of portfolio securities.
Performance as of 12/31/191
Cumulative total return excludes sales charges. Average annual total return includes maximum sales charges. Sales charges will vary depending on the size of the investment and the class of share purchased. The maximum is 5.50% and the minimum is 0%.Class A:5.50% maximum initial sales charge;Advisor Class:no sales charges. For other share classes, visitfranklintempleton.com.
| | | | | | | | |
| Share Class | | Cumulative Total Return2 | | | Average Annual Total Return3 | |
| | |
A4 | | | | | | | | |
| | |
1-Year | | | +13.43% | | | | +7.19% | |
| | |
5-Year | | | +22.69% | | | | +3.00% | |
| | |
Since Inception (7/1/13) | | | +42.36% | | | | +4.67% | |
| | |
Advisor | | | | | | | | |
| | |
1-Year | | | +13.77% | | | | +13.77% | |
| | |
5-Year | | | +24.36% | | | | +4.46% | |
| | |
Since Inception (7/1/13) | | | +44.82% | | | | +5.86% | |
Performance data represent past performance, which does not guarantee future results. Investment return and principal value will fluctuate, and you may have a gain or loss when you sell your shares. Current performance may differ from figures shown. For most recentmonth-end performance, go tofranklintempleton.comor call(800)342-5236.
See page 15 for Performance Summary footnotes.
| | | | |
franklintempleton.com | | Annual Report | | 13 |
FRANKLIN LIFESMART™ 2020 RETIREMENT TARGET FUND
PERFORMANCE SUMMARY
Total Return Index Comparison for a Hypothetical $10,000 Investment1
Total return represents the change in value of an investment over the periods shown. It includes any applicable maximum sales charge, Fund expenses, account fees and reinvested distributions. The unmanaged indexes include reinvestment of any income or distributions. They differ from the Fund in composition and do not pay management fees or expenses. One cannot invest directly in an index.
Class A(7/1/13–12/31/19)
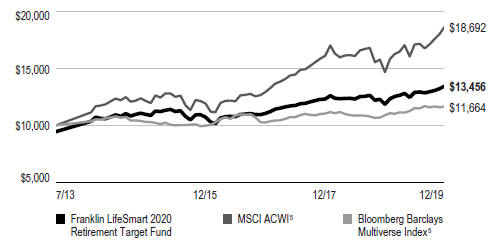
Advisor Class(7/1/13–12/31/19)
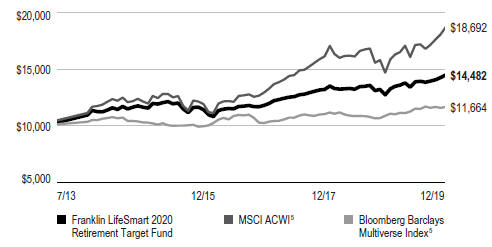
See page 15 for Performance Summary footnotes.
| | | | |
| | | |
14 | | Annual Report | | franklintempleton.com |
FRANKLIN LIFESMART™ 2020 RETIREMENT TARGET FUND
PERFORMANCE SUMMARY
Distributions (1/1/19–12/31/19)
| | | | |
| Share Class | | Net Investment
Income | |
A | | | $0.2953 | |
C | | | $0.2082 | |
R | | | $0.2643 | |
R6 | | | $0.3306 | |
Advisor | | | $0.3247 | |
Total Annual Operating Expenses6
| | | | | | | | |
| Share Class | | With Fee
Waiver | | | Without Fee
Waiver | |
A | | | 0.70% | | | | 1.43% | |
Advisor | | | 0.45% | | | | 1.18% | |
Each class of shares is available to certain eligible investors and has different annual fees and expenses, as described in the prospectus.
The Fund’s investment risk changes over time as its asset allocation changes. Since the Fund invests in underlying funds, including ETFs, which may engage in a variety of investment strategies involving certain risks, the Fund is subject to those same risks. All investments involve risks, including loss of principal. Principal invested is not guaranteed at any time, including at or after the Fund’s retirement target date; nor is there any guarantee that the Fund will provide sufficient income at or through the investor’s retirement. Stock prices fluctuate, sometimes rapidly and dramatically, due to factors affecting individual companies, particular industries or sectors, or general market conditions. Bond prices generally move in the opposite direction of interest rates. Thus, as the price of bonds in the Fund adjust to a rise in interest rates, the Fund’s share price may decline. Foreign investing carries additional risks such as currency and market volatility and political or social instability, risks which are heightened in developing countries. These risks are described more fully in the Fund’s prospectus. Investors should consult their financial advisor for help selecting the appropriate fund of funds, or fund combination, based on an evaluation of their investment objectives, retirement horizons and risk tolerance.
1. The Fund has an expense reduction and a fee waiver associated with any investments it makes in a Franklin Templeton money fund and/or other underlying fund, contractually guaranteed through 4/30/20. Fund investment results reflect the expense reduction and fee waiver; without these reductions, the results would have been lower. As of May 2019, the Fund’s predetermined asset allocation glide path was modified, and among other changes, establishes neutral and defensive glide paths, between which the Funds’ investment manager could shift depending on projected market volatility; such a change can impact performance. Previously, as of October 2013, the Fund’s glide path was modified, and among other changes, reflects a lower starting allocation to equity funds; such a change can impact performance.
2. Cumulative total return represents the change in value of an investment over the periods indicated.
3. Average annual total return represents the average annual change in value of an investment over the period indicated. Return for less than one year, if any, has not been annualized.
4. Prior to 9/10/18, these shares were offered at a higher initial sales charge of 5.75%, thus actual returns (with sales charges) would have differed. Average annual total returns (with sales charges) have been restated to reflect the current maximum initial sales charge of 5.50%.
5. Source: Morningstar. The MSCI ACWI is a free float-adjusted, market capitalization-weighted index designed to measure equity market performance in global developed and emerging markets. The Bloomberg Barclays Multiverse Index provides a broad-based measure of the global fixed income bond market. The index represents the union of the Global Aggregate Index and the Global High Yield Index and captures investment-grade and high yield securities in all eligible currencies.
6. Figures are as stated in the Fund’s current prospectus, including the effect of acquired fund fees and expenses, and may differ from the expense ratios disclosed in the Your Fund’s Expenses and Financial Highlights sections in this report. In periods of market volatility, assets may decline significantly, causing total annual Fund operating expenses to become higher than the figures shown.
See www.franklintempletondatasources.com for additional data provider information.
| | | | |
franklintempleton.com | | Annual Report | | 15 |
FRANKLIN LIFESMART™ 2020 RETIREMENT TARGET FUND
Your Fund’s Expenses
As a Fund shareholder, you can incur two types of costs: (1) transaction costs, including sales charges (loads) on Fund purchases and redemptions; and (2) ongoing Fund costs, including management fees, distribution and service(12b-1) fees, and other Fund expenses. All mutual funds have ongoing costs, sometimes referred to as operating expenses. The table below shows ongoing costs of investing in the Fund and can help you understand these costs and compare them with those of other mutual funds. The table assumes a $1,000 investment held for the six months indicated.
Actual Fund Expenses
The table below provides information about actual account values and actual expenses in the columns under the heading “Actual.” In these columns the Fund’s actual return, which includes the effect of Fund expenses, is used to calculate the “Ending Account Value” for each class of shares. You can estimate the expenses you paid during the period by following these steps (ofcourse, your account value and expenses will differ from those in this illustration):Divide your account value by $1,000 (ifyour account had an $8,600 value, then $8,600÷ $1,000 = 8.6). Then multiply the result by the number in the row for your class of shares under the headings “Actual” and “Expenses Paid During Period” (ifActual Expenses Paid During Period were $7.50, then 8.6 x $7.50 = $64.50). In this illustration, the actual expenses paid this period are $64.50.
Hypothetical Example for Comparison with Other Funds
Under the heading “Hypothetical” in the table, information is provided about hypothetical account values and hypothetical expenses based on the Fund’s actual expense ratio and an assumed rate of return of 5% per year before expenses, which is not the Fund’s actual return. This information may not be used to estimate the actual ending account balance or expenses you paid for the period, but it can help you compare ongoing costs of investing in the Fund with those of other funds. To do so, compare this 5% hypothetical example for the class of shares you hold with the 5% hypothetical examples that appear in the shareholder reports of other funds.
Please note that expenses shown in the table are meant to highlight ongoing costs and do not reflect any transactional costs. Therefore, information under the heading “Hypothetical” is useful in comparing ongoing costs only, and will not help you compare total costs of owning different funds. In addition, if transactional costs were included, your total costs would have been higher.
| | | | | | | | | | | | | | | | | | |
| | | | | | | Actual
(actual return after expenses) | | | | Hypothetical
(5% annual return before expenses) | | | | |
Share Class | | Beginning
Account
Value 7/1/19 | | | | Ending
Account
Value 12/31/19 | | Expenses Paid During
Period 7/1/19–12/31/191, 2 | | | | Ending
Account
Value 12/31/19 | | Expenses Paid During
Period 7/1/19–12/31/191, 2 | | | | Net
Annualized
Expense
Ratio2 |
| | | | | | | | | | | | |
A | | $1,000 | | | | $1,042.40 | | $2.01 | | | | $1,023.24 | | $1.99 | | | | 0.39% |
C | | $1,000 | | | | $1,037.70 | | $5.86 | | | | $1,019.46 | | $5.80 | | | | 1.14% |
R | | $1,000 | | | | $1,041.10 | | $3.29 | | | | $1,021.98 | | $3.26 | | | | 0.64% |
R6 | | $1,000 | | | | $1,044.00 | | $0.46 | | | | $1,024.75 | | $0.46 | | | | 0.09% |
Advisor | | $1,000 | | | | $1,043.70 | | $0.72 | | | | $1,024.50 | | $0.71 | | | | 0.14% |
1. Expenses are equal to the annualized expense ratio for thesix-month period as indicated above—in the far right column—multiplied by the simple average account value over the period indicated, and then multiplied by 184/365 to reflect theone-half year period.
2. Reflects expenses after fee waivers and expense reimbursements. Does not include acquired fund fees and expenses.
| | | | |
| | | |
16 | | Annual Report | | franklintempleton.com |
Franklin LifeSmart™ 2025 Retirement Target Fund
This annual report for Franklin LifeSmart™ 2025 Retirement Target Fund covers the fiscal year ended December 31, 2019.
Your Fund’s Goal and Main Investments
The Fund seeks the highest level of long-term total return, which consists of capital appreciation and income, consistent with the Fund’s asset allocation. Under normal market conditions, the Fund allocates its assets among the broad asset classes of equity, fixed income and alternative(non-traditional) investments by investing primarily in a distinctly weighted combination of underlying funds, predominantly other Franklin Templeton mutual funds and exchange-traded funds (ETFs), with an increasing emphasis on income as the target date of 2025 approaches. The target date is the approximate retirement year of the investor.
Asset Allocation*
Based on Total Net Assets as of 12/31/19
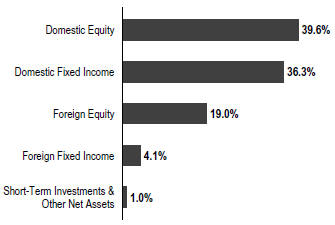
*The asset allocation is based on the Statement of Investments (SOI), which classifies each underlying fund and other fund investments into a broad asset class based on its predominant investments under normal market conditions.
Performance Overview
The Fund’s Class A shares posted a +16.85% cumulative total return for the 12 months ended December 31, 2019. In comparison, the Fund’s equity benchmark, the MSCI All Country World Index (ACWI), which measures equity market performance in global developed and emerging markets, posted a +27.30% total return.1 The Fund’s fixed income
benchmark, the Bloomberg Barclays Multiverse Index, a broad-based measure of the global fixed income bond market, posted a +7.13% total return.1 You can find the Fund’s long-term performance data in the Performance Summary beginning on page 19.
Performance data represent past performance, which does not guarantee future results. Investment return and principal value will fluctuate, and you may have a gain or loss when you sell your shares. Current performance may differ from figures shown. For most recentmonth-end performance, go tofranklintempleton.comor call(800)342-5236.
Investment Strategy
Under normal market conditions, the investment manager uses a predetermined glide path as a guide in allocating the Fund’s assets among underlying funds in the broad asset classes (the Neutral Glide Path). However, when the investment manager’s proprietary risk indicator model signals a sustained level of market turbulence or a prolonged down (or bear) market, the investment manager may, in its sole discretion, employ a defensive glide path, which has higher fixed income and lower equity allocations than the Neutral Glide Path (the Defensive Glide Path). Then, if the market stabilizes, the investment manager may, in its sole discretion, shift the Fund’s portfolio back to the Neutral Glide Path. These glide path shifts are executed through purchases and sales of underlying funds and ETFs to increase or decrease the Funds’ equity and fixed income allocations.
The target asset allocations in the Neutral and Defensive Glide Paths change over time, reducing their exposure to equity investments and becoming increasingly conservative until five years after the stated target date. At approximately five years after the target date, the Fund’s final asset allocation mix will be 40% equity funds and 60% fixed-income funds under the Neutral Glide Path and 30% equity funds and 70% fixed-income funds under the Defensive Glide Path.
When selecting equity funds, the investment manager considers the underlying funds’ foreign and domestic exposure, market capitalization ranges, and investment style
1. Source: Morningstar.
The indexes are unmanaged and include reinvestment of any income or distributions. They do not reflect any fees, expenses or sale charges. One cannot invest directly in an index, and an index is not representative of the Fund’s portfolio.
See www.franklintempletondatasources.com for additional data provider information.
The dollar value, number of shares or principal amount, and names of all portfolio holdings are listed in the Fund’s SOI, which begins on
page 77.
| | | | |
franklintempleton.com | | Annual Report | | 17 |
FRANKLIN LIFESMART™ 2025 RETIREMENT TARGET FUND
(growth vs. value). When selecting fixed-income funds, the investment manager considers the need for reduced market risks and lower volatility, appropriate to the Fund’s risk profile, and considers the credit quality, duration and maturity of the underlying funds’ portfolios.
Top 10 Fund Holdings
12/31/19
| | | | |
| | | % of Total Net Assets | |
| |
Franklin Liberty U.S. Core Bond ETF | | | 17.3% | |
| |
Franklin Growth Fund – Class R6 | | | 11.9% | |
| |
Franklin LibertyQ U.S. Equity ETF | | | 11.0% | |
| |
Franklin U.S. Core Equity (IU) Fund | | | 9.9% | |
| |
iShares Core U.S. Aggregate Bond ETF | | | 7.6% | |
| |
Franklin Low Duration Total Return Fund – Class R6 | | | 6.8% | |
| |
Franklin International Core Equity (IU) Fund | | | 6.0% | |
| |
Franklin Rising Dividends Fund – Class R6 | | | 6.0% | |
| |
Franklin Emerging Market Core Equity (IU) Fund | | | 3.5% | |
| |
Templeton Global Total Return Fund – Class R6 | | | 3.1% | |
Manager’s Discussion
The Fund’s performance can be attributed largely to its allocation among equities and fixed income securities and to the actual performance of the fund investments. This allocation shifts every year, in accordance with the target date associated with the portfolio.
Atperiod-end, our largest domestic value fund holding, Franklin Rising Dividends Fund – Class R6, and our largest domestic growth fund holding, Franklin Growth Fund – Class R6 outperformed the Fund’s equity benchmark, the MSCI ACWI, while our largest foreign equity fund holding, Franklin International Core Equity (IU) Fund, which incepted on August 9, 2019, outperformed the index for the period since its inception through December 31, 2019. On the fixed income side, our largest domestic fixed income fund holding, Franklin Liberty U.S. Core Bond ETF, which was incepted on September 17, 2019, outperformed the Fund’s fixed income benchmark, the Bloomberg Barclays Multiverse Index, for the period since its inception through December 31, 2019. Our foreign fixed income fund holding, Templeton Global Total Return Fund – Class R6, underperformed the Fund’s fixed income benchmark, the Bloomberg Barclays Multiverse Index.
Thank you for your continued participation in Franklin LifeSmart™ 2025 Retirement Target Fund. We look forward to serving your future investment needs.
| | |
| |
Thomas A. Nelson, CFA Co-Lead Portfolio Manager |
| |
May Tong, CFA Co-Lead Portfolio Manager |
The foregoing information reflects our analysis, opinions and portfolio holdings as of December 31, 2019, the end of the reporting period. The way we implement our main investment strategies and the resulting portfolio holdings may change depending on factors such as market and economic conditions. These opinions may not be relied upon as investment advice or an offer for a particular security. The information is not a complete analysis of every aspect of any market, country, industry, security or the Fund. Statements of fact are from sources considered reliable, but the investment manager makes no representation or warranty as to their completeness or accuracy. Although historical performance is no guarantee of future results, these insights may help you understand our investment management philosophy.
| | | | |
| | | |
18 | | Annual Report | | franklintempleton.com |
FRANKLIN LIFESMART™ 2025 RETIREMENT TARGET FUND
Performance Summary as of December 31, 2019
The performance table and graphs do not reflect any taxes that a shareholder would pay on Fund dividends, capital gain distributions, if any, or any realized gains on the sale of Fund shares. Total return reflects reinvestment of the Fund’s dividends and capital gain distributions, if any, and any unrealized gains or losses. Your dividend income will vary depending on dividends or interest paid by securities in the Fund’s portfolio, adjusted for operating expenses of each class. Capital gain distributions are net profits realized from the sale of portfolio securities.
Performance as of 12/31/191
Cumulative total return excludes sales charges. Average annual total return includes maximum sales charges. Sales charges will vary depending on the size of the investment and the class of share purchased. The maximum is 5.50% and the minimum is 0%.Class A:5.50% maximum initial sales charge;Advisor Class:no sales charges. For other share classes, visitfranklintempleton.com.
| | | | | | | | |
| Share Class | | Cumulative Total Return2 | | | Average Annual Total Return3 | |
A4 | | | | | | | | |
| 1-Year | | | +16.85% | | | | +10.43% | |
| 5-Year | | | +28.03% | | | | +3.88% | |
| 10-Year | | | +96.42% | | | | +6.38% | |
| | |
Advisor | | | | | | | | |
1-Year | | | +17.09% | | | | +17.09% | |
5-Year | | | +29.70% | | | | +5.34% | |
10-Year | | | +101.86% | | | | +7.28% | |
Performance data represent past performance, which does not guarantee future results. Investment return and principal value will fluctuate, and you may have a gain or loss when you sell your shares. Current performance may differ from figures shown. For most recentmonth-end performance, go tofranklintempleton.comor call(800)342-5236.
See page 21 for Performance Summary footnotes.
| | | | |
franklintempleton.com | | Annual Report | | 19 |
FRANKLIN LIFESMART™ 2025 RETIREMENT TARGET FUND
PERFORMANCE SUMMARY
Total Return Index Comparison for a Hypothetical $10,000 Investment1
Total return represents the change in value of an investment over the periods shown. It includes any applicable maximum sales charge, Fund expenses, account fees and reinvested distributions. The unmanaged indexes include reinvestment of any income or distributions. They differ from the Fund in composition and do not pay management fees or expenses. One cannot invest directly in an index.
Class A(1/1/10–12/31/19)
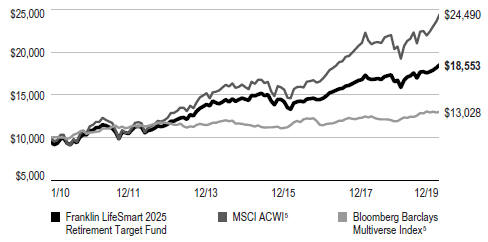
Advisor Class(1/1/10–12/31/19)
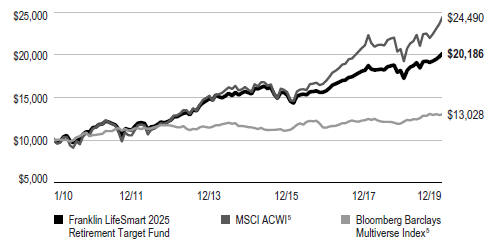
See page 21 for Performance Summary footnotes.
| | | | |
| | | |
20 | | �� Annual Report | | franklintempleton.com |
FRANKLIN LIFESMART™ 2025 RETIREMENT TARGET FUND
PERFORMANCE SUMMARY
Distributions(1/1/19–12/31/19)
| | | | | | | | | | | | |
| Share Class | | Net Investment
Income | | | Long-Term
Capital Gain | | | Total | |
A | | | $0.2764 | | | | $0.1899 | | | | $0.4663 | |
C | | | $0.1829 | | | | $0.1899 | | | | $0.3728 | |
R | | | $0.2433 | | | | $0.1899 | | | | $0.4332 | |
R6 | | | $0.3149 | | | | $0.1899 | | | | $0.5048 | |
Advisor | | | $0.3076 | | | | $0.1899 | | | | $0.4975 | |
Total Annual Operating Expenses6
| | | | | | | | |
| Share Class | | With Fee
Waiver | | | Without Fee
Waiver | |
A | | | 0.70% | | | | 1.27% | |
Advisor | | | 0.45% | | | | 1.02% | |
Each class of shares is available to certain eligible investors and has different annual fees and expenses, as described in the prospectus.
The Fund’s investment risk changes over time as its asset allocation changes. Since the Fund invests in underlying funds, including ETFs, which may engage in a variety of investment strategies involving certain risks, the Fund is subject to those same risks. All investments involve risks, including loss of principal. Principal invested is not guaranteed at any time, including at or after the Fund’s retirement target date; nor is there any guarantee that the Fund will provide sufficient income at or through the investor’s retirement. Stock prices fluctuate, sometimes rapidly and dramatically, due to factors affecting individual companies, particular industries or sectors, or general market conditions. Bond prices generally move in the opposite direction of interest rates. Thus, as the price of bonds in the Fund adjust to a rise in interest rates, the Fund’s share price may decline. Foreign investing carries additional risks such as currency and market volatility and political or social instability, risks which are heightened in developing countries. These risks are described more fully in the Fund’s prospectus. Investors should consult their financial advisor for help selecting the appropriate fund of funds, or fund combination, based on an evaluation of their investment objectives, retirement horizons and risk tolerance.
1. The Fund has an expense reduction and a fee waiver associated with any investments it makes in a Franklin Templeton money fund and/or other underlying fund, contractually guaranteed through 4/30/20. Fund investment results reflect the expense reduction and fee waiver; without these reductions, the results would have been lower. As of May 2019, the Fund’s predetermined asset allocation glide path was modified, and among other changes, establishes neutral and defensive glide paths, between which the Funds’ investment manager could shift depending on projected market volatility; such a change can impact performance. Previously, as of October 2013, the Fund’s glide path was modified, and among other changes, reflects a lower starting allocation to equity funds; such a change can impact performance.
2. Cumulative total return represents the change in value of an investment over the periods indicated.
3. Average annual total return represents the average annual change in value of an investment over the period indicated. Return for less than one year, if any, has not been annualized.
4. Prior to 9/10/18, these shares were offered at a higher initial sales charge of 5.75%, thus actual returns (with sales charges) would have differed. Average annual total returns (with sales charges) have been restated to reflect the current maximum initial sales charge of 5.50%.
5. Source: Morningstar. The MSCI ACWI is a free float-adjusted, market capitalization-weighted index designed to measure equity market performance in global developed and emerging markets. The Bloomberg Barclays Multiverse Index provides a broad-based measure of the global fixed income bond market. The index represents the union of the Global Aggregate Index and the Global High Yield Index and captures investment-grade and high yield securities in all eligible currencies.
6. Figures are as stated in the Fund’s current prospectus, including the effect of acquired fund fees and expenses, and may differ from the expense ratios disclosed in the Your Fund’s Expenses and Financial Highlights sections in this report. In periods of market volatility, assets may decline significantly, causing total annual Fund operating expenses to become higher than the figures shown.
See www.franklintempletondatasources.com for additional data provider information.
| | | | |
franklintempleton.com | | Annual Report | | 21 |
FRANKLIN LIFESMART™ 2025 RETIREMENT TARGET FUND
Your Fund’s Expenses
As a Fund shareholder, you can incur two types of costs: (1) transaction costs, including sales charges (loads) on Fund purchases and redemptions; and (2) ongoing Fund costs, including management fees, distribution and service(12b-1) fees, and other Fund expenses. All mutual funds have ongoing costs, sometimes referred to as operating expenses. The table below shows ongoing costs of investing in the Fund and can help you understand these costs and compare them with those of other mutual funds. The table assumes a $1,000 investment held for the six months indicated.
Actual Fund Expenses
The table below provides information about actual account values and actual expenses in the columns under the heading “Actual.” In these columns the Fund’s actual return, which includes the effect of Fund expenses, is used to calculate the “Ending Account Value” for each class of shares. You can estimate the expenses you paid during the period by following these steps (ofcourse, your account value and expenses will differ from those in this illustration):Divide your account value by $1,000 (ifyour account had an $8,600 value, then $8,600÷ $1,000 = 8.6). Then multiply the result by the number in the row for your class of shares under the headings “Actual” and “Expenses Paid During Period” (ifActual Expenses Paid During Period were $7.50, then 8.6 x $7.50 = $64.50). In this illustration, the actual expenses paid this period are $64.50.
Hypothetical Example for Comparison with Other Funds
Under the heading “Hypothetical” in the table, information is provided about hypothetical account values and hypothetical expenses based on the Fund’s actual expense ratio and an assumed rate of return of 5% per year before expenses, which is not the Fund’s actual return. This information may not be used to estimate the actual ending account balance or expenses you paid for the period, but it can help you compare ongoing costs of investing in the Fund with those of other funds. To do so, compare this 5% hypothetical example for the class of shares you hold with the 5% hypothetical examples that appear in the shareholder reports of other funds.
Please note that expenses shown in the table are meant to highlight ongoing costs and do not reflect any transactional costs. Therefore, information under the heading “Hypothetical” is useful in comparing ongoing costs only, and will not help you compare total costs of owning different funds. In addition, if transactional costs were included, your total costs would have been higher.
| | | | | | | | | | | | | | | | | | |
| | | | | | | Actual (actual return after expenses) | | | | Hypothetical (5% annual return
before expenses) | | | | |
Share Class | | Beginning
Account
Value 7/1/19 | | | | Ending
Account
Value 12/31/19 | | Expenses Paid During
Period 7/1/19–12/31/191, 2 | | | | Ending
Account
Value 12/31/19 | | Expenses Paid During
Period 7/1/19–12/31/191, 2 | | | | Net Annualized
Expense Ratio2 |
| | | | | | | | | | | | |
| A | | $1,000 | | | | $1,049.50 | | $2.07 | | | | $1,023.19 | | $2.04 | | | | 0.40% |
| C | | $1,000 | | | | $1,045.30 | | $5.93 | | | | $1,019.41 | | $5.85 | | | | 1.15% |
| R | | $1,000 | | | | $1,048.30 | | $3.36 | | | | $1,021.93 | | $3.31 | | | | 0.65% |
| R6 | | $1,000 | | | | $1,051.10 | | $0.52 | | | | $1,024.70 | | $0.51 | | | | 0.10% |
| Advisor | | $1,000 | | | | $1,050.80 | | $0.78 | | | | $1,024.45 | | $0.77 | | | | 0.15% |
1. Expenses are equal to the annualized expense ratio for thesix-month period as indicated above—in the far right column—multiplied by the simple average account value over the period indicated, and then multiplied by 184/365 to reflect theone-half year period.
2. Reflects expenses after fee waivers and expense reimbursements. Does not include acquired fund fees and expenses.
| | | | |
| | | |
22 | | Annual Report | | franklintempleton.com |
Franklin LifeSmart™ 2030 Retirement Target Fund
This annual report for Franklin LifeSmart™ 2030 Retirement Target Fund covers the fiscal year ended December 31, 2019.
Your Fund’s Goal and Main Investments
The Fund seeks the highest level of long-term total return, which consists of capital appreciation and income, consistent with the Fund’s asset allocation. Under normal market conditions, the Fund allocates its assets among the broad asset classes of equity, fixed income and alternative(non-traditional) investments by investing primarily in a distinctly weighted combination of underlying funds, predominantly other Franklin Templeton mutual funds and exchange-traded funds (ETFs), with an increasing emphasis on income as the target date of 2030 approaches. The target date is the approximate retirement year of the investor.
Asset Allocation*
Based on Total Net Assets as of 12/31/19
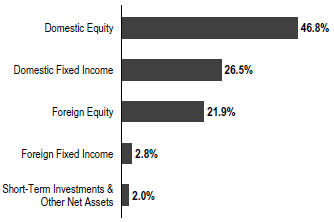
*The asset allocation is based on the Statement of Investments (SOI), which classifies each underlying fund and other fund investments into a broad asset class based on its predominant investments under normal market conditions.
Performance Overview
The Fund’s Class A shares posted a +18.80% cumulative total return for the 12 months ended December 31, 2019. In comparison, the Fund’s equity benchmark, the MSCI All Country World Index (ACWI), which measures equity market performance in global developed and emerging markets, posted a +27.30% total return.1 The Fund’s fixed income
benchmark, the Bloomberg Barclays Multiverse Index, a broad-based measure of the global fixed income bond market, posted a +7.13% total return.1 You can find more of the Fund’s performance data in the Performance Summary beginning on page 25.
Performance data represent past performance, which does not guarantee future results. Investment return and principal value will fluctuate, and you may have a gain or loss when you sell your shares. Current performance may differ from figures shown. For most recentmonth-end performance, go tofranklintempleton.comor call(800)342-5236.
Investment Strategy
Under normal market conditions, the investment manager uses a predetermined glide path as a guide in allocating the Fund’s assets among underlying funds in the broad asset classes (the Neutral Glide Path). However, when the investment manager’s proprietary risk indicator model signals a sustained level of market turbulence or a prolonged down (or bear) market, the investment manager may, in its sole discretion, employ a defensive glide path, which has higher fixed income and lower equity allocations than the Neutral Glide Path (the Defensive Glide Path). Then, if the market stabilizes, the investment manager may, in its sole discretion, shift the Fund’s portfolio back to the Neutral Glide Path. These glide path shifts are executed through purchases and sales of underlying funds and ETFs to increase or decrease the Funds’ equity and fixed income allocations.
The target asset allocations in the Neutral and Defensive Glide Paths change over time, reducing their exposure to equity investments and becoming increasingly conservative until five years after the stated target date. At approximately five years after the target date, the Fund’s final asset allocation mix will be 40% equity funds and 60% fixed-income funds under the Neutral Glide Path and 30% equity funds and 70% fixed-income funds under the Defensive Glide Path.
When selecting equity funds, the investment manager considers the underlying funds’ foreign and domestic exposure, market capitalization ranges, and investment style
1. Source: Morningstar.
The indexes are unmanaged and include reinvestment of any income or distributions. They do not reflect any fees, expenses or sale charges. One cannot invest directly in an index, and an index is not representative of the Fund’s portfolio.
See www.franklintempletondatasources.com for additional data provider information.
The dollar value, number of shares or principal amount, and names of all portfolio holdings are listed in the Fund’s SOI, which begins on
page 84.
| | | | |
franklintempleton.com | | Annual Report | | 23 |
FRANKLIN LIFESMART™ 2030 RETIREMENT TARGET FUND
(growth vs. value). When selecting fixed-income funds, the investment manager considers the need for reduced market risks and lower volatility, appropriate to the Fund’s risk profile, and considers the credit quality, duration and maturity of the underlying funds’ portfolios.
Top 10 Fund Holdings
12/31/19
| | | | |
| | | % of Total Net Assets | |
| |
Franklin Growth Fund – Class R6 | | | 14.1% | |
| |
Franklin LibertyQ U.S. Equity ETF | | | 13.1% | |
| |
Franklin Liberty U.S. Core Bond ETF | | | 12.6% | |
| |
Franklin U.S. Core Equity (IU) Fund | | | 11.7% | |
| |
Franklin Rising Dividends Fund – Class R6 | | | 7.0% | |
| |
Franklin International Core Equity (IU) Fund | | | 6.9% | |
| |
iShares Core U.S. Aggregate Bond ETF | | | 5.5% | |
| |
Franklin Low Duration Total Return Fund – Class R6 | | | 5.0% | |
| |
Franklin Emerging Market Core Equity (IU) Fund | | | 4.0% | |
| |
Franklin International Growth Fund – Class R6 | | | 3.1% | |
Manager’s Discussion
The Fund’s performance can be attributed largely to its allocation among equities and fixed income securities and to the actual performance of the fund investments. This allocation shifts every year, in accordance with the target date associated with the portfolio.
Atperiod-end, our largest domestic value fund holding, Franklin Rising Dividends Fund – Class R6, and our largest domestic growth fund holding, Franklin Growth Fund – Class R6, outperformed the Fund’s equity benchmark, the MSCI ACWI, while our largest foreign equity fund holding, Franklin International Core Equity (IU) Fund, which incepted
on August 9, 2019, outperformed the index for the period since its inception through December 31, 2019. On the fixed income side, our largest domestic fixed income fund holding, Franklin Liberty U.S. Core Bond ETF, which was incepted on September 17, 2019, outperformed the Fund’s fixed income benchmark, the Bloomberg Barclays Multiverse Index, for the period since its inception through December 31, 2019. Our foreign fixed income fund holding, Templeton Global Total Return Fund – Class R6, underperformed the Fund’s fixed income benchmark, the Bloomberg Barclays Multiverse Index.
Thank you for your continued participation in Franklin LifeSmart™ 2030 Retirement Target Fund. We look forward to serving your future investment needs.
| | |
| | |
Thomas A. Nelson, CFA Co-Lead Portfolio Manager |
| | |
| |
May Tong, CFA Co-Lead Portfolio Manager |
The foregoing information reflects our analysis, opinions and portfolio holdings as of December 31, 2019, the end of the reporting period. The way we implement our main investment strategies and the resulting portfolio holdings may change depending on factors such as market and economic conditions. These opinions may not be relied upon as investment advice or an offer for a particular security. The information is not a complete analysis of every aspect of any market, country, industry, security or the Fund. Statements of fact are from sources considered reliable, but the investment manager makes no representation or warranty as to their completeness or accuracy. Although historical performance is no guarantee of future results, these insights may help you understand our investment management philosophy.
| | | | |
| | | |
24 | | Annual Report | | franklintempleton.com |
FRANKLIN LIFESMART™ 2030 RETIREMENT TARGET FUND
Performance Summary as of December 31, 2019
The performance table and graphs do not reflect any taxes that a shareholder would pay on Fund dividends, capital gain distributions, if any, or any realized gains on the sale of Fund shares. Total return reflects reinvestment of the Fund’s dividends and capital gain distributions, if any, and any unrealized gains or losses. Your dividend income will vary depending on dividends or interest paid by securities in the Fund’s portfolio, adjusted for operating expenses of each class. Capital gain distributions are net profits realized from the sale of portfolio securities.
Performance as of 12/31/191
Cumulative total return excludes sales charges. Average annual total return includes maximum sales charges. Sales charges will vary depending on the size of the investment and the class of share purchased. The maximum is 5.50% and the minimum is 0%.Class A:5.50% maximum initial sales charge;Advisor Class:no sales charges. For other share classes, visitfranklintempleton.com.
| | | | | | | | |
Share Class | | Cumulative Total Return2
| | | Average Annual Total Return3 | |
A4 | | | | | | | | |
1-Year | | | +18.80% | | | | +12.26% | |
5-Year | | | +31.38% | | | | +4.42% | |
Since Inception (7/1/13) | | | +55.18% | | | | +6.07% | |
| | |
Advisor | | | | | | | | |
1-Year | | | +19.22% | | | | +19.22% | |
5-Year | | | +33.14% | | | | +5.89% | |
Since Inception (7/1/13) | | | +57.85% | | | | +7.27% | |
Performance data represent past performance, which does not guarantee future results. Investment return and principal value will fluctuate, and you may have a gain or loss when you sell your shares. Current performance may differ from figures shown. For most recentmonth-end performance, go tofranklintempleton.comor call(800)342-5236.
See page 27 for Performance Summary footnotes.
| | | | |
franklintempleton.com | | Annual Report | | 25 |
FRANKLIN LIFESMART™ 2030 RETIREMENT TARGET FUND
PERFORMANCE SUMMARY
Total Return Index Comparison for a Hypothetical $10,000 Investment1
Total return represents the change in value of an investment over the periods shown. It includes any applicable maximum sales charge, Fund expenses, account fees and reinvested distributions. The unmanaged indexes include reinvestment of any income or distributions. They differ from the Fund in composition and do not pay management fees or expenses. One cannot invest directly in an index.
Class A(7/1/13–12/31/19)
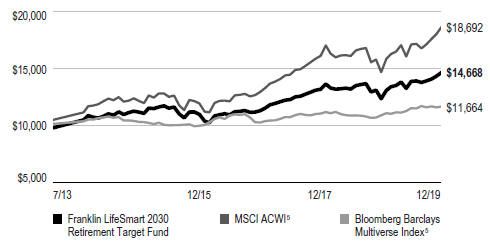
Advisor Class(7/1/13–12/31/19)
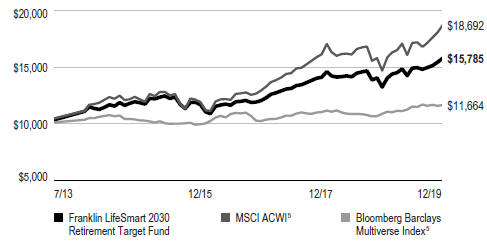
See page 27 for Performance Summary footnotes.
| | | | |
| | | |
26 | | Annual Report | | franklintempleton.com |
FRANKLIN LIFESMART™ 2030 RETIREMENT TARGET FUND
PERFORMANCE SUMMARY
Distributions(1/1/19–12/31/19)
| | | | | | | | | | | | |
Share Class | | Net Investment Income | | | Long-Term Capital Gain | | | Total | |
A | | | $0.2291 | | | | $0.1359 | | | | $0.3650 | |
C | | | $0.1360 | | | | $0.1359 | | | | $0.2719 | |
R | | | $0.1984 | | | | $0.1359 | | | | $0.3343 | |
R6 | | | $0.2667 | | | | $0.1359 | | | | $0.4026 | |
Advisor | | | $0.2605 | | | | $0.1359 | | | | $0.3964 | |
Total Annual Operating Expenses6
| | | | | | | | |
Share Class | | With Fee Waiver | | | Without Fee Waiver | |
A | | | 0.70% | | | | 1.49% | |
Advisor | | | 0.45% | | | | 1.24% | |
Each class of shares is available to certain eligible investors and has different annual fees and expenses, as described in the prospectus.
The Fund’s investment risk changes over time as its asset allocation changes. Since the Fund invests in underlying funds, including ETFs, which may engage in a variety of investment strategies involving certain risks, the Fund is subject to those same risks. All investments involve risks, including loss of principal. Principal invested is not guaranteed at any time, including at or after the Fund’s retirement target date; nor is there any guarantee that the Fund will provide sufficient income at or through the investor’s retirement. Stock prices fluctuate, sometimes rapidly and dramatically, due to factors affecting individual companies, particular industries or sectors, or general market conditions. Bond prices generally move in the opposite direction of interest rates. Thus, as the price of bonds in the Fund adjust to a rise in interest rates, the Fund’s share price may decline. Foreign investing carries additional risks such as currency and market volatility and political or social instability, risks which are heightened in developing countries. These risks are described more fully in the Fund’s prospectus. Investors should consult their financial advisor for help selecting the appropriate fund of funds, or fund combination, based on an evaluation of their investment objectives, retirement horizons and risk tolerance.
1. The Fund has an expense reduction and a fee waiver associated with any investments it makes in a Franklin Templeton money fund and/or other underlying fund, contractually guaranteed through 4/30/20. Fund investment results reflect the expense reduction and fee waiver; without these reductions, the results would have been lower. As of May 2019, the Fund’s predetermined asset allocation glide path was modified, and among other changes, establishes neutral and defensive glide paths, between which the Funds’ investment manager could shift depending on projected market volatility; such a change can impact performance. Previously, as of October 2013, the Fund’s glide path was modified, and among other changes, reflects a lower starting allocation to equity funds; such a change can impact performance.
2. Cumulative total return represents the change in value of an investment over the periods indicated.
3. Average annual total return represents the average annual change in value of an investment over the period indicated. Return for less than one year, if any, has not been annualized.
4. Prior to 9/10/18, these shares were offered at a higher initial sales charge of 5.75%, thus actual returns (with sales charges) would have differed. Average annual total returns (with sales charges) have been restated to reflect the current maximum initial sales charge of 5.50%.
5. Source: Morningstar. The MSCI ACWI is a free float-adjusted, market capitalization-weighted index designed to measure equity market performance in global developed and emerging markets. The Bloomberg Barclays Multiverse Index provides a broad-based measure of the global fixed income bond market. The index represents the union of the Global Aggregate Index and the Global High Yield Index and captures investment-grade and high yield securities in all eligible currencies.
6. Figures are as stated in the Fund’s current prospectus, including the effect of acquired fund fees and expenses, and may differ from the expense ratios disclosed in the Your Fund’s Expenses and Financial Highlights sections in this report. In periods of market volatility, assets may decline significantly, causing total annual Fund operating expenses to become higher than the figures shown.
See www.franklintempletondatasources.com for additional data provider information.
| | | | |
franklintempleton.com | | Annual Report | | 27 |
FRANKLIN LIFESMART™ 2030 RETIREMENT TARGET FUND
Your Fund’s Expenses
As a Fund shareholder, you can incur two types of costs: (1) transaction costs, including sales charges (loads) on Fund purchases and redemptions; and (2) ongoing Fund costs, including management fees, distribution and service(12b-1) fees, and other Fund expenses. All mutual funds have ongoing costs, sometimes referred to as operating expenses. The table below shows ongoing costs of investing in the Fund and can help you understand these costs and compare them with those of other mutual funds. The table assumes a $1,000 investment held for the six months indicated.
Actual Fund Expenses
The table below provides information about actual account values and actual expenses in the columns under the heading “Actual.” In these columns the Fund’s actual return, which includes the effect of Fund expenses, is used to calculate the “Ending Account Value” for each class of shares. You can estimate the expenses you paid during the period by following these steps (ofcourse, your account value and expenses will differ from those in this illustration):Divide your account value by $1,000 (ifyour account had an $8,600 value, then $8,600÷ $1,000 = 8.6). Then multiply the result by the number in the row for your class of shares under the headings “Actual” and “Expenses Paid During Period” (ifActual Expenses Paid During Period were $7.50, then 8.6 x $7.50 = $64.50). In this illustration, the actual expenses paid this period are $64.50.
Hypothetical Example for Comparison with Other Funds
Under the heading “Hypothetical” in the table, information is provided about hypothetical account values and hypothetical expenses based on the Fund’s actual expense ratio and an assumed rate of return of 5% per year before expenses, which is not the Fund’s actual return. This information may not be used to estimate the actual ending account balance or expenses you paid for the period, but it can help you compare ongoing costs of investing in the Fund with those of other funds. To do so, compare this 5% hypothetical example for the class of shares you hold with the 5% hypothetical examples that appear in the shareholder reports of other funds.
Please note that expenses shown in the table are meant to highlight ongoing costs and do not reflect any transactional costs. Therefore, information under the heading “Hypothetical” is useful in comparing ongoing costs only, and will not help you compare total costs of owning different funds. In addition, if transactional costs were included, your total costs would have been higher.
| | | | | | | | | | | | | | | | | | |
| | | | | | | Actual (actual return after expenses) | | | | Hypothetical (5% annual return before expenses) | | | | |
Share Class | | Beginning
Account
Value 7/1/19 | | | | Ending
Account
Value 12/31/19 | | Expenses Paid During Period
7/1/19–12/31/191, 2 | | | | Ending
Account
Value 12/31/19 | | Expenses Paid During
Period
7/1/19–12/31/191, 2 | | | | Net Annualized
Expense Ratio2 |
| | | | | | | | | | | | |
| A | | $1,000 | | | | $1,056.90 | | $1.92 | | | | $1,023.34 | | $1.89 | | | | 0.37% |
| C | | $1,000 | | | | $1,053.50 | | $5.80 | | | | $1,019.56 | | $5.70 | | | | 1.12% |
| R | | $1,000 | | | | $1,056.40 | | $3.21 | | | | $1,022.08 | | $3.16 | | | | 0.62% |
| R6 | | $1,000 | | | | $1,059.10 | | $0.36 | | | | $1,024.85 | | $0.36 | | | | 0.07% |
| Advisor | | $1,000 | | | | $1,058.90 | | $0.62 | | | | $1,024.60 | | $0.61 | | | | 0.12% |
1. Expenses are equal to the annualized expense ratio for thesix-month period as indicated above—in the far right column—multiplied by the simple average account value over the period indicated, and then multiplied by 184/365 to reflect theone-half year period.
2. Reflects expenses after fee waivers and expense reimbursements. Does not include acquired fund fees and expenses.
| | | | |
| | | |
28 | | Annual Report | | franklintempleton.com |
Franklin LifeSmart™ 2035 Retirement Target Fund
This annual report for Franklin LifeSmart™ 2035 Retirement Target Fund covers the fiscal year ended December 31, 2019.
Your Fund’s Goal and Main Investments
The Fund seeks the highest level of long-term total return, which consists of capital appreciation and income, consistent with the Fund’s asset allocation. Under normal market conditions, the Fund allocates its assets among the broad asset classes of equity, fixed income and alternative(non-traditional) investments by investing primarily in a distinctly weighted combination of underlying funds, predominantly other Franklin Templeton mutual funds and exchange-traded funds (ETFs), with an increasing emphasis on income as the target date of 2035 approaches. The target date is the approximate retirement year of the investor.
Asset Allocation*
Based on Total Net Assets as of 12/31/19
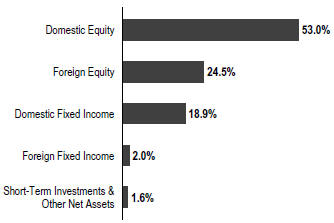
*The asset allocation is based on the Statement of Investments (SOI), which classifies each underlying fund and other fund investments into a broad asset class based on its predominant investments under normal market conditions.
Performance Overview
The Fund’s Class A shares posted a +20.36% cumulative total return for the 12 months ended December 31, 2019. In comparison, the Fund’s equity benchmark, the MSCI All Country World Index (ACWI), which measures equity market performance in global developed and emerging markets, posted a +27.30% total return.1 The Fund’s fixed income
benchmark, the Bloomberg Barclays Multiverse Index, a broad-based measure of the global fixed income bond market, posted a +7.13% total return.1 You can find the Fund’s long-term performance data in the Performance Summary beginning on page 31.
Performance data represent past performance, which does not guarantee future results. Investment return and principal value will fluctuate, and you may have a gain or loss when you sell your shares. Current performance may differ from figures shown. For most recentmonth-end performance, go tofranklintempleton.comor call(800)342-5236.
Investment Strategy
Under normal market conditions, the investment manager uses a predetermined glide path as a guide in allocating the Fund’s assets among underlying funds in the broad asset classes (the Neutral Glide Path). However, when the investment manager’s proprietary risk indicator model signals a sustained level of market turbulence or a prolonged down (or bear) market, the investment manager may, in its sole discretion, employ a defensive glide path, which has higher fixed income and lower equity allocations than the Neutral Glide Path (the Defensive Glide Path). Then, if the market stabilizes, the investment manager may, in its sole discretion, shift the Fund’s portfolio back to the Neutral Glide Path. These glide path shifts are executed through purchases and sales of underlying funds and ETFs to increase or decrease the Funds’ equity and fixed income allocations.
The target asset allocations in the Neutral and Defensive Glide Paths change over time, reducing their exposure to equity investments and becoming increasingly conservative until five years after the stated target date. At approximately five years after the target date, the Fund’s final asset allocation mix will be 40% equity funds and 60% fixed-income funds under the Neutral Glide Path and 30% equity funds and 70% fixed-income funds under the Defensive Glide Path.
When selecting equity funds, the investment manager considers the underlying funds’ foreign and domestic exposure, market capitalization ranges, and investment style
1. Source: Morningstar.
The indexes are unmanaged and include reinvestment of any income or distributions. They do not reflect any fees, expenses or sale charges. One cannot invest directly in an index, and an index is not representative of the Fund’s portfolio.
See www.franklintempletondatasources.com for additional data provider information.
The dollar value, number of shares or principal amount, and names of all portfolio holdings are listed in the Fund’s SOI, which begins on
page 91.
| | | | |
franklintempleton.com | | Annual Report | | 29 |
FRANKLIN LIFESMART™ 2035 RETIREMENT TARGET FUND
(growth vs. value). When selecting fixed-income funds, the investment manager considers the need for reduced market risks and lower volatility, appropriate to the Fund’s risk profile, and considers the credit quality, duration and maturity of the underlying funds’ portfolios.
Top 10 Fund Holdings
12/31/19
| | | | |
| | | % of Total
Net Assets | |
| |
Franklin Growth Fund – Class R6 | | | 15.9% | |
| |
Franklin LibertyQ U.S. Equity ETF | | | 14.8% | |
| |
Franklin U.S. Core Equity (IU) Fund | | | 13.3% | |
| |
Franklin Liberty U.S. Core Bond ETF | | | 9.0% | |
| |
Franklin Rising Dividends Fund – Class R6 | | | 7.9% | |
| |
Franklin International Core Equity (IU) Fund | | | 7.7% | |
| |
Franklin Emerging Market Core Equity (IU) Fund | | | 4.5% | |
| |
iShares Core U.S. Aggregate Bond ETF | | | 4.0% | |
| |
Franklin Low Duration Total Return Fund – Class R6 | | | 3.6% | |
| |
Franklin International Growth Fund – Class R6 | | | 3.5% | |
Manager’s Discussion
The Fund’s performance can be attributed largely to its allocation among equities and fixed income securities and to the actual performance of the fund investments. This allocation shifts every year, in accordance with the target date associated with the portfolio.
Atperiod-end, our largest domestic value fund holding, Franklin Rising Dividends Fund – Class R6, and our largest domestic growth fund holding, Franklin Growth Fund –Class R6 outperformed the Fund’s equity benchmark, the MSCI ACWI, while our largest foreign equity fund holding, Franklin International Core Equity (IU) Fund, which incepted on August 9, 2019, outperformed the index for the period since its inception through December 31, 2019. On the fixed income side, our largest domestic fixed income fund holding, Franklin Liberty U.S. Core Bond ETF, which was incepted on September 17, 2019, outperformed the Fund’s fixed income benchmark, the Bloomberg Barclays Multiverse Index, for the period since its inception through December 31, 2019. Our foreign fixed income fund holding, Templeton Global Total Return Fund – Class R6, underperformed the Fund’s fixed income benchmark, the Bloomberg Barclays Multiverse Index.
Thank you for your continued participation in Franklin LifeSmart™ 2035 Retirement Target Fund. We look forward to serving your future investment needs.
| | |
| |
Thomas A. Nelson, CFA Co-Lead Portfolio Manager |
| | |
| |
May Tong, CFA Co-Lead Portfolio Manager |
The foregoing information reflects our analysis, opinions and portfolio holdings as of December 31, 2019, the end of the reporting period. The way we implement our main investment strategies and the resulting portfolio holdings may change depending on factors such as market and economic conditions. These opinions may not be relied upon as investment advice or an offer for a particular security. The information is not a complete analysis of every aspect of any market, country, industry, security or the Fund. Statements of fact are from sources considered reliable, but the investment manager makes no representation or warranty as to their completeness or accuracy. Although historical performance is no guarantee of future results, these insights may help you understand our investment management philosophy.
| | | | |
| | | |
30 | | Annual Report | | franklintempleton.com |
FRANKLIN LIFESMART™ 2035 RETIREMENT TARGET FUND
Performance Summary as of December 31, 2019
The performance table and graphs do not reflect any taxes that a shareholder would pay on Fund dividends, capital gain distributions, if any, or any realized gains on the sale of Fund shares. Total return reflects reinvestment of the Fund’s dividends and capital gain distributions, if any, and any unrealized gains or losses. Your dividend income will vary depending on dividends or interest paid by securities in the Fund’s portfolio, adjusted for operating expenses of each class. Capital gain distributions are net profits realized from the sale of portfolio securities.
Performance as of 12/31/191
Cumulative total return excludes sales charges. Average annual total return includes maximum sales charges. Sales charges will vary depending on the size of the investment and the class of share purchased. The maximum is 5.50% and the minimum is 0%.Class A:5.50% maximum initial sales charge;Advisor Class:no sales charges. For other share classes, visitfranklintempleton.com.
| | | | | | |
| Share Class | | Cumulative Total Return2 | | | Average
Annual Total Return3 |
A4 | | | | | | |
1-Year | | | +20.36% | | | +13.74% |
5-Year | | | +33.58% | | | +4.76% |
10-Year | | | +110.29% | | | +7.11% |
| | |
Advisor | | | | | | |
1-Year | | | +20.73% | | | +20.73% |
5-Year | | | +35.37% | | | +6.24% |
10-Year | | | +116.37% | | | +8.02% |
Performance data represent past performance, which does not guarantee future results. Investment return and principal value will fluctuate, and you may have a gain or loss when you sell your shares. Current performance may differ from figures shown. For most recentmonth-end performance, go tofranklintempleton.comor call(800)342-5236.
See page 33 for Performance Summary footnotes.
| | | | |
franklintempleton.com | | Annual Report | | 31 |
FRANKLIN LIFESMART™ 2035 RETIREMENT TARGET FUND
PERFORMANCE SUMMARY
Total Return Index Comparison for a Hypothetical $10,000 Investment1
Total return represents the change in value of an investment over the periods shown. It includes any applicable maximum sales charge, Fund expenses, account fees and reinvested distributions. The unmanaged indexes include reinvestment of any income or distributions. They differ from the Fund in composition and do not pay management fees or expenses. One cannot invest directly in an index.
Class A(1/1/10–12/31/19)
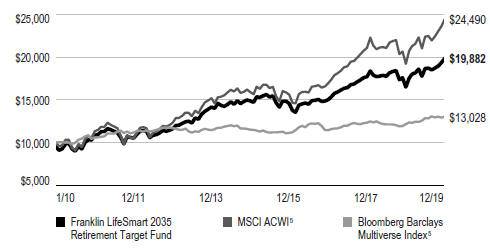
Advisor Class(1/1/10–12/31/19)
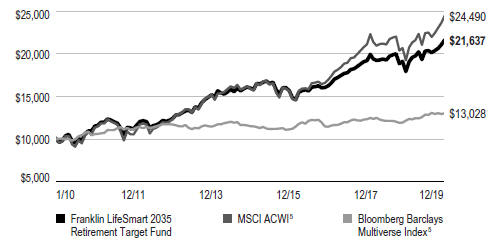
See page 33 for Performance Summary footnotes.
| | | | |
| | | |
32 | | Annual Report | | franklintempleton.com |
FRANKLIN LIFESMART™ 2035 RETIREMENT TARGET FUND
PERFORMANCE SUMMARY
Distributions(1/1/19–12/31/19)
| | | | | | | | | | | | | | |
| Share Class | | Net Investment
Income | | | Short-Term
Capital Gain | | | Long-Term
Capital Gain | | | Total |
A | | | $0.2416 | | | | $0.0007 | | | | $0.2785 | | | $0.5208 |
C | | | $0.1440 | | | | $0.0007 | | | | $0.2785 | | | $0.4232 |
R | | | $0.2080 | | | | $0.0007 | | | | $0.2785 | | | $0.4872 |
R6 | | | $0.2818 | | | | $0.0007 | | | | $0.2785 | | | $0.5610 |
Advisor | | | $0.2748 | | | | $0.0007 | | | | $0.2785 | | | $0.5540 |
Total Annual Operating Expenses6
| | | | | | |
| Share Class | | With Fee
Waiver | | | Without Fee
Waiver |
A | | | 0.70% | | | 1.33% |
Advisor | | | 0.45% | | | 1.08% |
Each class of shares is available to certain eligible investors and has different annual fees and expenses, as described in the prospectus.
The Fund’s investment risk changes over time as its asset allocation changes. Since the Fund invests in underlying funds, including ETFs, which may engage in a variety of investment strategies involving certain risks, the Fund is subject to those same risks. All investments involve risks, including loss of principal. Principal invested is not guaranteed at any time, including at or after the Fund’s retirement target date; nor is there any guarantee that the Fund will provide sufficient income at or through the investor’s retirement. Stock prices fluctuate, sometimes rapidly and dramatically, due to factors affecting individual companies, particular industries or sectors, or general market conditions. Bond prices generally move in the opposite direction of interest rates. Thus, as the price of bonds in the Fund adjust to a rise in interest rates, the Fund’s share price may decline. Foreign investing carries additional risks such as currency and market volatility and political or social instability, risks which are heightened in developing countries. These risks are described more fully in the Fund’s prospectus. Investors should consult their financial advisor for help selecting the appropriate fund of funds, or fund combination, based on an evaluation of their investment objectives, retirement horizons and risk tolerance.
1. The Fund has an expense reduction and a fee waiver associated with any investments it makes in a Franklin Templeton money fund and/or other underlying fund, contractually guaranteed through 4/30/20. Fund investment results reflect the expense reduction and fee waiver; without these reductions, the results would have been lower. As of May 2019, the Fund’s predetermined asset allocation glide path was modified, and among other changes, establishes neutral and defensive glide paths, between which the Funds’ investment manager could shift depending on projected market volatility; such a change can impact performance. Previously, as of October 2013, the Fund’s glide path was modified, and among other changes, reflects a lower starting allocation to equity funds; such a change can impact performance.
2. Cumulative total return represents the change in value of an investment over the periods indicated.
3. Average annual total return represents the average annual change in value of an investment over the period indicated. Return for less than one year, if any, has not been annualized.
4. Prior to 9/10/18, these shares were offered at a higher initial sales charge of 5.75%, thus actual returns (with sales charges) would have differed. Average annual total returns (with sales charges) have been restated to reflect the current maximum initial sales charge of 5.50%.
5. Source: Morningstar. The MSCI ACWI is a free float-adjusted, market capitalization-weighted index designed to measure equity market performance in global developed and emerging markets. The Bloomberg Barclays Multiverse Index provides a broad-based measure of the global fixed income bond market. The index represents the union of the Global Aggregate Index and the Global High Yield Index and captures investment-grade and high yield securities in all eligible currencies.
6. Figures are as stated in the Fund’s current prospectus, including the effect of acquired fund fees and expenses, and may differ from the expense ratios disclosed in the Your Fund’s Expenses and Financial Highlights sections in this report. In periods of market volatility, assets may decline significantly, causing total annual Fund operating expenses to become higher than the figures shown.
See www.franklintempletondatasources.com for additional data provider information.
| | | | |
franklintempleton.com | | Annual Report | | 33 |
FRANKLIN LIFESMART™ 2035 RETIREMENT TARGET FUND
Your Fund’s Expenses
As a Fund shareholder, you can incur two types of costs: (1) transaction costs, including sales charges (loads) on Fund purchases and redemptions; and (2) ongoing Fund costs, including management fees, distribution and service(12b-1) fees, and other Fund expenses. All mutual funds have ongoing costs, sometimes referred to as operating expenses. The table below shows ongoing costs of investing in the Fund and can help you understand these costs and compare them with those of other mutual funds. The table assumes a $1,000 investment held for the six months indicated.
Actual Fund Expenses
The table below provides information about actual account values and actual expenses in the columns under the heading “Actual.” In these columns the Fund’s actual return, which includes the effect of Fund expenses, is used to calculate the “Ending Account Value” for each class of shares. You can estimate the expenses you paid during the period by following these steps (of course, your account value and expenses will differ from those in this illustration): Divide your account value by $1,000 (if your account had an $8,600 value, then $8,600÷ $1,000 = 8.6). Then multiply the result by the number in the row for your class of shares under the headings “Actual” and “Expenses Paid During Period” (if Actual Expenses Paid During Period were $7.50, then 8.6 x $7.50 = $64.50). In this illustration, the actual expenses paid this period are $64.50.
Hypothetical Example for Comparison with Other Funds
Under the heading “Hypothetical” in the table, information is provided about hypothetical account values and hypothetical expenses based on the Fund’s actual expense ratio and an assumed rate of return of 5% per year before expenses, which is not the Fund’s actual return. This information may not be used to estimate the actual ending account balance or expenses you paid for the period, but it can help you compare ongoing costs of investing in the Fund with those of other funds. To do so, compare this 5% hypothetical example for the class of shares you hold with the 5% hypothetical examples that appear in the shareholder reports of other funds.
Please note that expenses shown in the table are meant to highlight ongoing costs and do not reflect any transactional costs. Therefore, information under the heading “Hypothetical” is useful in comparing ongoing costs only, and will not help you compare total costs of owning different funds. In addition, if transactional costs were included, your total costs would have been higher.
| | | | | | | | | | | | | | | | | | |
| | | | | | | Actual (actual return after expenses) | | | | Hypothetical (5% annual return before expenses) | | | | |
Share Class | | Beginning
Account Value 7/1/19 | | | | Ending Account Value 12/31/19 | | Expenses Paid During
Period 7/1/19–12/31/191, 2 | | | | Ending Account Value 12/31/19 | | Expenses Paid During
Period 7/1/19–12/31/191, 2 | | | | Net Annualized
Expense Ratio2 |
| | | | | | | | | | | | |
| A | | $1,000 | | | | $1,063.00 | | $1.98 | | | | $1,023.29 | | $1.94 | | | | 0.38% |
| C | | $1,000 | | | | $1,058.80 | | $5.86 | | | | $1,019.51 | | $5.75 | | | | 1.13% |
| R | | $1,000 | | | | $1,061.60 | | $3.22 | | | | $1,022.08 | | $3.16 | | | | 0.62% |
| R6 | | $1,000 | | | | $1,065.00 | | $0.42 | | | | $1,024.80 | | $0.41 | | | | 0.08% |
| Advisor | | $1,000 | | | | $1,064.60 | | $0.68 | | | | $1,024.55 | | $0.66 | | | | 0.13% |
1. Expenses are equal to the annualized expense ratio for thesix-month period as indicated above—in the far right column—multiplied by the simple average account value over the period indicated, and then multiplied by 184/365 to reflect theone-half year period.
2. Reflects expenses after fee waivers and expense reimbursements. Does not include acquired fund fees and expenses.
| | | | |
| | | |
34 | | Annual Report | | franklintempleton.com |
Franklin LifeSmart™ 2040 Retirement Target Fund
This annual report for Franklin LifeSmart™ 2040 Retirement Target Fund covers the fiscal year ended December 31, 2019.
Your Fund’s Goal and Main Investments
The Fund seeks the highest level of long-term total return, which consists of capital appreciation and income, consistent with the Fund’s asset allocation. Under normal market conditions, the Fund allocates its assets among the broad asset classes of equity, fixed income and alternative(non-traditional) investments by investing primarily in a distinctly weighted combination of underlying funds, predominantly other Franklin Templeton mutual funds and exchange-traded funds (ETFs), with an increasing emphasis on income as the target date of 2040 approaches. The target date is the approximate retirement year of the investor.
Asset Allocation*
Based on Total Net Assets as of 12/31/19
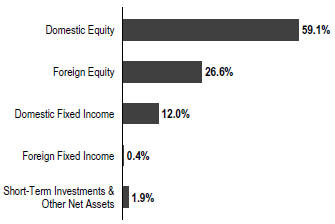
*The asset allocation is based on the Statement of Investments (SOI), which classifies each underlying fund and other fund investments into a broad asset class based on its predominant investments under normal market conditions.
Performance Overview
The Fund’s Class A shares posted a +21.50% cumulative total return for the 12 months ended December 31, 2019. In comparison, the Fund’s equity benchmark, the MSCI All Country World Index (ACWI), which measures equity market performance in global developed and emerging markets, posted a +27.30% total return.1 The Fund’s fixed income
benchmark, the Bloomberg Barclays Multiverse Index, a broad-based measure of the global fixed income bond market, posted a +7.13% total return.1 You can find more of the Fund’s performance data in the Performance Summary beginning on page 37.
Performance data represent past performance, which does not guarantee future results. Investment return and principal value will fluctuate, and you may have a gain or loss when you sell your shares. Current performance may differ from figures shown. For most recentmonth-end performance, go tofranklintempleton.comor call(800)342-5236.
Investment Strategy
Under normal market conditions, the investment manager uses a predetermined glide path as a guide in allocating the Fund’s assets among underlying funds in the broad asset classes (the Neutral Glide Path). However, when the investment manager’s proprietary risk indicator model signals a sustained level of market turbulence or a prolonged down (or bear) market, the investment manager may, in its sole discretion, employ a defensive glide path, which has higher fixed income and lower equity allocations than the Neutral Glide Path (the Defensive Glide Path). Then, if the market stabilizes, the investment manager may, in its sole discretion, shift the Fund’s portfolio back to the Neutral Glide Path. These glide path shifts are executed through purchases and sales of underlying funds and ETFs to increase or decrease the Funds’ equity and fixed income allocations.
The target asset allocations in the Neutral and Defensive Glide Paths change over time, reducing their exposure to equity investments and becoming increasingly conservative until five years after the stated target date. At approximately five years after the target date, the Fund’s final asset allocation mix will be 40% equity funds and 60% fixed-income funds under the Neutral Glide Path and 30% equity funds and 70% fixed-income funds under the Defensive Glide Path.
When selecting equity funds, the investment manager considers the underlying funds’ foreign and domestic exposure, market capitalization ranges, and investment style
1. Source: Morningstar.
The indexes are unmanaged and include reinvestment of any income or distributions. They do not reflect any fees, expenses or sale charges. One cannot invest directly in an index, and an index is not representative of the Fund’s portfolio.
See www.franklintempletondatasources.com for additional data provider information.
The dollar value, number of shares or principal amount, and names of all portfolio holdings are listed in the Fund’s SOI, which begins on
page 98.
| | | | |
franklintempleton.com | | Annual Report | | 35 |
FRANKLIN LIFESMART™ 2040 RETIREMENT TARGET FUND
(growth vs. value). When selecting fixed-income funds, the investment manager considers the need for reduced market risks and lower volatility, appropriate to the Fund’s risk profile, and considers the credit quality, duration and maturity of the underlying funds’ portfolios.
Top 10 Fund Holdings
12/31/19
| | | | |
| | | % of Total
Net Assets | |
| |
Franklin Growth Fund – Class R6 | | | 17.7% | |
| |
Franklin LibertyQ U.S. Equity ETF | | | 16.6% | |
| |
Franklin U.S. Core Equity (IU) Fund | | | 14.7% | |
| |
Franklin Rising Dividends Fund – Class R6 | | | 8.9% | |
| |
Franklin International Core Equity (IU) Fund | | | 8.3% | |
| |
Franklin Liberty U.S. Core Bond ETF | | | 6.2% | |
| |
Franklin Emerging Market Core Equity (IU) Fund | | | 4.9% | |
| |
Templeton Foreign Fund – Class R6 | | | 3.8% | |
| |
Franklin International Growth Fund – Class R6 | | | 3.7% | |
| |
Franklin LibertyQ Emerging Markets ETF | | | 3.3% | |
Manager’s Discussion
The Fund’s performance can be attributed largely to its allocation among equities and fixed income securities and to the actual performance of the fund investments. This allocation shifts every year, in accordance with the target date associated with the portfolio.
Atperiod-end, our largest domestic value fund holding, Franklin Rising Dividends Fund – Class R6, and our largest domestic growth fund holding, Franklin Growth Fund – Class R6 outperformed the Fund’s equity benchmark, the MSCI ACWI, while our largest foreign equity fund holding, Franklin International Core Equity (IU) Fund, which incepted on August 9, 2019 outperformed the index for the period since its inception through December 31, 2019. On the fixed income side, our largest domestic fixed income fund holding, Franklin Liberty U.S. Core Bond ETF, which was incepted on August 9, 2019, outperformed the Fund’s fixed income benchmark, the Bloomberg Barclays Multiverse Index, for the period since its inception through December 31, 2019. Our foreign fixed income fund holding, Franklin Liberty High Yield Corporate ETF, outperformed the Fund’s fixed income benchmark, the Bloomberg Barclays Multiverse Index.
Thank you for your continued participation in Franklin LifeSmart™ 2040 Retirement Target Fund. We look forward to serving your future investment needs.
| | |
| | |
Thomas A. Nelson, CFA Co-Lead Portfolio Manager |
| | | |
| |
May Tong, CFA Co-Lead Portfolio Manager |
The foregoing information reflects our analysis, opinions and portfolio holdings as of December 31, 2019, the end of the reporting period. The way we implement our main investment strategies and the resulting portfolio holdings may change depending on factors such as market and economic conditions. These opinions may not be relied upon as investment advice or an offer for a particular security. The information is not a complete analysis of every aspect of any market, country, industry, security or the Fund. Statements of fact are from sources considered reliable, but the investment manager makes no representation or warranty as to their completeness or accuracy. Although historical performance is no guarantee of future results, these insights may help you understand our investment management philosophy.
| | | | |
| | | |
36 | | Annual Report | | franklintempleton.com |
FRANKLIN LIFESMART™ 2040 RETIREMENT TARGET FUND
Performance Summary as of December 31, 2019
The performance table and graphs do not reflect any taxes that a shareholder would pay on Fund dividends, capital gain distributions, if any, or any realized gains on the sale of Fund shares. Total return reflects reinvestment of the Fund’s dividends and capital gain distributions, if any, and any unrealized gains or losses. Your dividend income will vary depending on dividends or interest paid by securities in the Fund’s portfolio, adjusted for operating expenses of each class. Capital gain distributions are net profits realized from the sale of portfolio securities.
Performance as of 12/31/191
Cumulative total return excludes sales charges. Average annual total return includes maximum sales charges. Sales charges will vary depending on the size of the investment and the class of share purchased. The maximum is 5.50% and the minimum is 0%.Class A:5.50% maximum initial sales charge;Advisor Class:no sales charges. For other share classes, visitfranklintempleton.com.
| | | | | | | | |
| Share Class | | Cumulative
Total Return2 | | | Average Annual
Total Return3 | |
A4 | | | | | | | | |
1-Year | | | +21.50% | | | | +14.78% | |
5-Year | | | +35.11% | | | | +5.02% | |
Since Inception (7/1/13) | | | +61.21% | | | | +6.69% | |
| | |
Advisor | | | | | | | | |
1-Year | | | +21.68% | | | | +21.68% | |
5-Year | | | +36.63% | | | | +6.44% | |
Since Inception (7/1/13) | | | +63.84% | | | | +7.89% | |
Performance data represent past performance, which does not guarantee future results. Investment return and principal value will fluctuate, and you may have a gain or loss when you sell your shares. Current performance may differ from figures shown. For most recentmonth-end performance, go tofranklintempleton.comor call(800)342-5236.
See page 39 for Performance Summary footnotes.
| | | | |
franklintempleton.com | | Annual Report | | 37 |
FRANKLIN LIFESMART™ 2040 RETIREMENT TARGET FUND
PERFORMANCE SUMMARY
Total Return Index Comparison for a Hypothetical $10,000 Investment1
Total return represents the change in value of an investment over the periods shown. It includes any applicable maximum sales charge, Fund expenses, account fees and reinvested distributions. The unmanaged indexes include reinvestment of any income or distributions. They differ from the Fund in composition and do not pay management fees or expenses. One cannot invest directly in an index.
Class A(7/1/13–12/31/19)
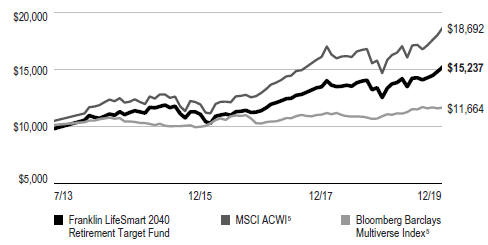
Advisor Class(7/1/13–12/31/19)
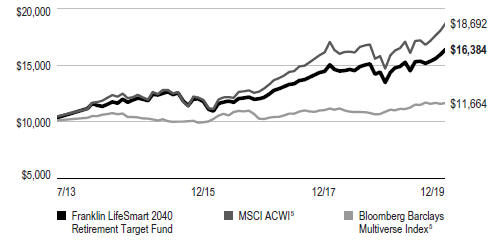
See page 39 for Performance Summary footnotes.
| | | | |
| | | |
38 | | Annual Report | | franklintempleton.com |
FRANKLIN LIFESMART™ 2040 RETIREMENT TARGET FUND
PERFORMANCE SUMMARY
Distributions(1/1/19–12/31/19)
| | | | | | | | | | | | |
| Share Class | | Net Investment
Income | | | Long-Term
Capital Gain | | | Total | |
A | | | $0.1839 | | | | $0.1436 | | | | $0.3275 | |
C | | | $0.0918 | | | | $0.1436 | | | | $0.2354 | |
R | | | $0.1510 | | | | $0.1436 | | | | $0.2946 | |
R6 | | | $0.2219 | | | | $0.1436 | | | | $0.3655 | |
Advisor | | | $0.2163 | | | | $0.1436 | | | | $0.3599 | |
Total Annual Operating Expenses6
| | | | | | | | |
| | | With Fee | | | Without Fee | |
| Share Class | | Waiver | | | Waiver | |
A | | | 0.70% | | | | 1.68% | |
Advisor | | | 0.45% | | | | 1.43% | |
Each class of shares is available to certain eligible investors and has different annual fees and expenses, as described in the prospectus.
The Fund’s investment risk changes over time as its asset allocation changes. Since the Fund invests in underlying funds, including ETFs, which may engage in a variety of investment strategies involving certain risks, the Fund is subject to those same risks. All investments involve risks, including loss of principal. Principal invested is not guaranteed at any time, including at or after the Fund’s retirement target date; nor is there any guarantee that the Fund will provide sufficient income at or through the investor’s retirement. Stock prices fluctuate, sometimes rapidly and dramatically, due to factors affecting individual companies, particular industries or sectors, or general market conditions. Bond prices generally move in the opposite direction of interest rates. Thus, as the price of bonds in the Fund adjust to a rise in interest rates, the Fund’s share price may decline. Foreign investing carries additional risks such as currency and market volatility and political or social instability, risks which are heightened in developing countries. These risks are described more fully in the Fund’s prospectus. Investors should consult their financial advisor for help selecting the appropriate fund of funds, or fund combination, based on an evaluation of their investment objectives, retirement horizons and risk tolerance.
1. The Fund has an expense reduction and a fee waiver associated with any investments it makes in a Franklin Templeton money fund and/or other underlying fund, contractually guaranteed through 4/30/20. Fund investment results reflect the expense reduction and fee waiver; without these reductions, the results would have been lower. As of May 2019, the Fund’s predetermined asset allocation glide path was modified, and among other changes, establishes neutral and defensive glide paths, between which the Funds’ investment manager could shift depending on projected market volatility; such a change can impact performance. Previously, as of October 2013, the Fund’s glide path was modified, and among other changes, reflects a lower starting allocation to equity funds; such a change can impact performance.
2. Cumulative total return represents the change in value of an investment over the periods indicated.
3. Average annual total return represents the average annual change in value of an investment over the period indicated. Return for less than one year, if any, has not been annualized.
4. Prior to 9/10/18, these shares were offered at a higher initial sales charge of 5.75%, thus actual returns (with sales charges) would have differed. Average annual total returns (with sales charges) have been restated to reflect the current maximum initial sales charge of 5.50%.
5. Source: Morningstar. The MSCI ACWI is a free float-adjusted, market capitalization-weighted index designed to measure equity market performance in global developed and emerging markets. The Bloomberg Barclays Multiverse Index provides a broad-based measure of the global fixed income bond market. The index represents the union of the Global Aggregate Index and the Global High Yield Index and captures investment-grade and high yield securities in all eligible currencies.
6. Figures are as stated in the Fund’s current prospectus, including the effect of acquired fund fees and expenses, and may differ from the expense ratios disclosed in the Your Fund’s Expenses and Financial Highlights sections in this report. In periods of market volatility, assets may decline significantly, causing total annual Fund operating expenses to become higher than the figures shown.
See www.franklintempletondatasources.com for additional data provider information.
| | | | |
franklintempleton.com | | Annual Report | | 39 |
FRANKLIN LIFESMART™ 2040 RETIREMENT TARGET FUND
Your Fund’s Expenses
As a Fund shareholder, you can incur two types of costs: (1) transaction costs, including sales charges (loads) on Fund purchases and redemptions; and (2) ongoing Fund costs, including management fees, distribution and service(12b-1) fees, and other Fund expenses. All mutual funds have ongoing costs, sometimes referred to as operating expenses. The table below shows ongoing costs of investing in the Fund and can help you understand these costs and compare them with those of other mutual funds. The table assumes a $1,000 investment held for the six months indicated.
Actual Fund Expenses
The table below provides information about actual account values and actual expenses in the columns under the heading “Actual.” In these columns the Fund’s actual return, which includes the effect of Fund expenses, is used to calculate the “Ending Account Value” for each class of shares. You can estimate the expenses you paid during the period by following these steps (ofcourse, your account value and expenses will differ from those in this illustration):Divide your account value by $1,000 (ifyour account had an $8,600 value, then $8,600÷ $1,000 = 8.6). Then multiply the result by the number in the row for your class of shares under the headings “Actual” and “Expenses Paid During Period” (ifActual Expenses Paid During Period were $7.50, then 8.6 x $7.50 = $64.50). In this illustration, the actual expenses paid this period are $64.50.
Hypothetical Example for Comparison with Other Funds
Under the heading “Hypothetical” in the table, information is provided about hypothetical account values and hypothetical expenses based on the Fund’s actual expense ratio and an assumed rate of return of 5% per year before expenses, which is not the Fund’s actual return. This information may not be used to estimate the actual ending account balance or expenses you paid for the period, but it can help you compare ongoing costs of investing in the Fund with those of other funds. To do so, compare this 5% hypothetical example for the class of shares you hold with the 5% hypothetical examples that appear in the shareholder reports of other funds.
Please note that expenses shown in the table are meant to highlight ongoing costs and do not reflect any transactional costs. Therefore, information under the heading “Hypothetical” is useful in comparing ongoing costs only, and will not help you compare total costs of owning different funds. In addition, if transactional costs were included, your total costs would have been higher.
| | | | | | | | | | | | | | | | | | |
| | | | | | | Actual (actual return after expenses) | | | | Hypothetical (5% annual return before expenses) | | | | |
Share
Class | | Beginning
Account
Value 7/1/19 | | | | Ending Account Value 12/31/19 | | Expenses Paid During
Period 7/1/19–12/31/191, 2 | | | | Ending Account
Value 12/31/19 | | Expenses Paid During Period 7/1/19–12/31/191, 2 | | | | Net Annualized
Expense Ratio2 |
| | | | | | | | | | | | |
| A | | $1,000 | | | | $1,069.80 | | $1.88 | | | | $1,023.39 | | $1.84 | | | | 0.36% |
| C | | $1,000 | | | | $1,066.10 | | $5.78 | | | | $1,019.61 | | $5.65 | | | | 1.11% |
| R | | $1,000 | | | | $1,068.30 | | $3.18 | | | | $1,022.13 | | $3.11 | | | | 0.61% |
| R6 | | $1,000 | | | | $1,071.70 | | $0.31 | | | | $1,024.90 | | $0.31 | | | | 0.06% |
| Advisor | | $1,000 | | | | $1,070.90 | | $0.57 | | | | $1,024.65 | | $0.56 | | | | 0.11% |
1. Expenses are equal to the annualized expense ratio for thesix-month period as indicated above—in the far right column—multiplied by the simple average account value over the period indicated, and then multiplied by 184/365 to reflect theone-half year period.
2. Reflects expenses after fee waivers and expense reimbursements. Does not include acquired fund fees and expenses.
| | | | |
| | | |
40 | | Annual Report | | franklintempleton.com |
Franklin LifeSmart™ 2045 Retirement Target Fund
This annual report for Franklin LifeSmart™ 2045 Retirement Target Fund covers the fiscal year ended December 31, 2019.
Your Fund’s Goal and Main Investments
The Fund seeks the highest level of long-term total return, which consists of capital appreciation and income, consistent with the Fund’s asset allocation. Under normal market conditions, the Fund allocates its assets among the broad asset classes of equity, fixed income and alternative(non-traditional) investments by investing primarily in a distinctly weighted combination of underlying funds, predominantly other Franklin Templeton mutual funds and exchange-traded funds (ETFs), with an increasing emphasis on income as the target date of 2045 approaches. The target date is the approximate retirement year of the investor.
Asset Allocation*
Based on Total Net Assets as of 12/31/19
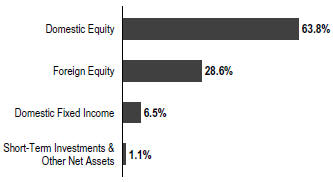
*The asset allocation is based on the Statement of Investments (SOI), which classifies each underlying fund and other fund investments into a broad asset class based on its predominant investments under normal market conditions.
Performance Overview
The Fund’s Class A shares posted a +22.33% cumulative total return for the 12 months ended December 31, 2019. In comparison, the Fund’s equity benchmark, the MSCI All Country World Index (ACWI), which measures equity market performance in global developed and emerging markets, posted a +27.30% total return.1 The Fund’s fixed income benchmark, the Bloomberg Barclays Multiverse Index, a broad-based measure of the global fixed income bond
market, posted a +7.13% total return.1 You can find the Fund’s long-term performance data in the Performance Summary beginning on page 43.
Performance data represent past performance, which does not guarantee future results. Investment return and principal value will fluctuate, and you may have a gain or loss when you sell your shares. Current performance may differ from figures shown. For most recentmonth-end performance, go tofranklintempleton.comor call(800)342-5236.
Investment Strategy
Under normal market conditions, the investment manager uses a predetermined glide path as a guide in allocating the Fund’s assets among underlying funds in the broad asset classes (the Neutral Glide Path). However, when the investment manager’s proprietary risk indicator model signals a sustained level of market turbulence or a prolonged down (or bear) market, the investment manager may, in its sole discretion, employ a defensive glide path, which has higher fixed income and lower equity allocations than the Neutral Glide Path (the Defensive Glide Path). Then, if the market stabilizes, the investment manager may, in its sole discretion, shift the Fund’s portfolio back to the Neutral Glide Path. These glide path shifts are executed through purchases and sales of underlying funds and ETFs to increase or decrease the Funds’ equity and fixed income allocations.
The target asset allocations in the Neutral and Defensive Glide Paths change over time, reducing their exposure to equity investments and becoming increasingly conservative until five years after the stated target date. At approximately five years after the target date, the Fund’s final asset allocation mix will be 40% equity funds and 60% fixed-income funds under the Neutral Glide Path and 30% equity funds and 70% fixed-income funds under the Defensive Glide Path.
When selecting equity funds, the investment manager considers the underlying funds’ foreign and domestic exposure, market capitalization ranges, and investment style (growth vs. value). When selecting fixed-income funds, the investment manager considers the need for reduced market
1. Source: Morningstar.
The indexes are unmanaged and include reinvestment of any income or distributions. They do not reflect any fees, expenses or sale charges. One cannot invest directly in an index, and an index is not representative of the Fund’s portfolio.
See www.franklintempletondatasources.com for additional data provider information.
The dollar value, number of shares or principal amount, and names of all portfolio holdings are listed in the Fund’s SOI, which begins on page 105.
| | | | |
franklintempleton.com | | Annual Report | | 41 |
FRANKLIN LIFESMART™ 2045 RETIREMENT TARGET FUND
risks and lower volatility, appropriate to the Fund’s risk profile, and considers the credit quality, duration and maturity of the underlying funds’ portfolios.
Top 10 Fund Holdings
12/31/19
| | | | |
| | | % of Total
Net Assets | |
| |
Franklin Growth Fund – Class R6 | | | 19.1% | |
| |
Franklin LibertyQ U.S. Equity ETF | | | 17.9% | |
| |
Franklin U.S. Core Equity (IU) Fund | | | 15.9% | |
| |
Franklin Rising Dividends Fund – Class R6 | | | 9.6% | |
| |
Franklin International Core Equity (IU) Fund | | | 8.8% | |
| |
Franklin Emerging Market Core Equity (IU) Fund | | | 5.4% | |
| |
Franklin International Growth Fund – Class R6 | | | 4.0% | |
| |
Templeton Foreign Fund – Class R6 | | | 3.9% | |
| |
Franklin LibertyQ Emerging Markets ETF | | | 3.6% | |
| |
iShares Core U.S. Aggregate Bond ETF | | | 3.3% | |
Manager’s Discussion
The Fund’s performance can be attributed largely to its allocation among equities and fixed income securities and to the actual performance of the fund investments. This allocation shifts every year, in accordance with the target date associated with the portfolio.
Atperiod-end, our largest domestic value fund holding, Franklin Rising Dividends Fund – Class R6, and our largest domestic growth fund holding, Franklin Growth Fund –Class R6 outperformed the Fund’s equity benchmark, the MSCI ACWI, while our largest foreign equity fund holding, Franklin International Core Equity (IU) Fund, which incepted on August 9, 2019, outperformed the index for the period since its inception through December 31, 2019. On the fixed income side, our largest domestic fixed income fund holding, iShares Core U.S. Aggregate Bond ETF, outperformed the Fund’s fixed income benchmark, the Bloomberg Barclays Multiverse Index. The Fund did not have any foreign fixed income holdings atperiod-end.
Thank you for your continued participation in Franklin LifeSmart™ 2045 Retirement Target Fund. We look forward to serving your future investment needs.
| | |
| | |
Thomas A. Nelson, CFA Co-Lead Portfolio Manager |
| | |
| |
May Tong, CFA Co-Lead Portfolio Manager |
The foregoing information reflects our analysis, opinions and portfolio holdings as of December 31, 2019, the end of the reporting period. The way we implement our main investment strategies and the resulting portfolio holdings may change depending on factors such as market and economic conditions. These opinions may not be relied upon as investment advice or an offer for a particular security. The information is not a complete analysis of every aspect of any market, country, industry, security or the Fund. Statements of fact are from sources considered reliable, but the investment manager makes no representation or warranty as to their completeness or accuracy. Although historical performance is no guarantee of future results, these insights may help you understand our investment management philosophy.
| | | | |
| | | |
42 | | Annual Report | | franklintempleton.com |
FRANKLIN LIFESMART™ 2045 RETIREMENT TARGET FUND
Performance Summary as of December 31, 2019
The performance table and graphs do not reflect any taxes that a shareholder would pay on Fund dividends, capital gain distributions, if any, or any realized gains on the sale of Fund shares. Total return reflects reinvestment of the Fund’s dividends and capital gain distributions, if any, and any unrealized gains or losses. Your dividend income will vary depending on dividends or interest paid by securities in the Fund’s portfolio, adjusted for operating expenses of each class. Capital gain distributions are net profits realized from the sale of portfolio securities.
Performance as of 12/31/191
Cumulative total return excludes sales charges. Average annual total return includes maximum sales charges. Sales charges will vary depending on the size of the investment and the class of share purchased. The maximum is 5.50% and the minimum is 0%.Class A:5.50% maximum initial sales charge;Advisor Class:no sales charges. For other share classes, visitfranklintempleton.com.
| | | | | | | | |
| Share Class | | Cumulative
Total Return2
| | | Average Annual
Total Return3 | |
| | |
A4 | | | | | | | | |
| | |
1-Year | | | +22.33% | | | | +15.61% | |
| | |
5-Year | | | +35.87% | | | | +5.13% | |
| | |
10-Year | | | +118.67% | | | | +7.53% | |
| | |
Advisor | | | | | | | | |
| | |
1-Year | | | +22.53% | | | | +22.53% | |
| | |
5-Year | | | +37.62% | | | | +6.59% | |
| | |
10-Year | | | +124.54% | | | | +8.42% | |
Performance data represent past performance, which does not guarantee future results. Investment return and principal value will fluctuate, and you may have a gain or loss when you sell your shares. Current performance may differ from figures shown. For most recentmonth-end performance, go tofranklintempleton.comor call(800)342-5236.
See page 45 for Performance Summary footnotes.
| | | | |
franklintempleton.com | | Annual Report | | 43 |
FRANKLIN LIFESMART™ 2045 RETIREMENT TARGET FUND
PERFORMANCE SUMMARY
Total Return Index Comparison for a Hypothetical $10,000 Investment1
Total return represents the change in value of an investment over the periods shown. It includes any applicable maximum sales charge, Fund expenses, account fees and reinvested distributions. The unmanaged indexes include reinvestment of any income or distributions. They differ from the Fund in composition and do not pay management fees or expenses. One cannot invest directly in an index.
Class A(1/1/10–12/31/19)
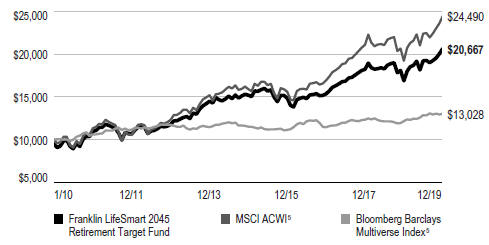
Advisor Class(1/1/10–12/31/19)
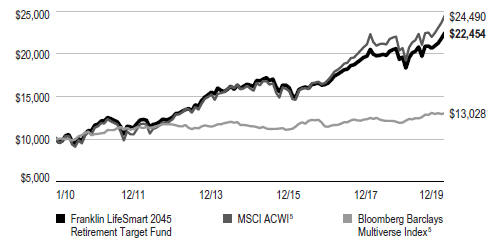
See page 45 for Performance Summary footnotes.
| | | | |
| | | |
44 | | Annual Report | | franklintempleton.com |
FRANKLIN LIFESMART™ 2045 RETIREMENT TARGET FUND
PERFORMANCE SUMMARY
Distributions(1/1/19–12/31/19)
| | | | | | | | | | | | |
Share Class | | Net Investment Income | | | Long-Term Capital Gain | | | Total | |
A | | | $0.2096 | | | | $0.2173 | | | | $0.4269 | |
C | | | $0.1113 | | | | $0.2173 | | | | $0.3286 | |
R | | | $0.1751 | | | | $0.2173 | | | | $0.3924 | |
R6 | | | $0.2498 | | | | $0.2173 | | | | $0.4671 | |
Advisor | | | $0.2431 | | | | $0.2173 | | | | $0.4604 | |
Total Annual Operating Expenses6
| | | | | | | | |
Share Class | | With Fee Waiver | | | Without Fee Waiver | |
A | | | 0.70% | | | | 1.46% | |
Advisor | | | 0.45% | | | | 1.21% | |
Each class of shares is available to certain eligible investors and has different annual fees and expenses, as described in the prospectus.
The Fund’s investment risk changes over time as its asset allocation changes. Since the Fund invests in underlying funds, including ETFs, which may engage in a variety of investment strategies involving certain risks, the Fund is subject to those same risks. All investments involve risks, including loss of principal. Principal invested is not guaranteed at any time, including at or after the Fund’s retirement target date; nor is there any guarantee that the Fund will provide sufficient income at or through the investor’s retirement. Stock prices fluctuate, sometimes rapidly and dramatically, due to factors affecting individual companies, particular industries or sectors, or general market conditions. Bond prices generally move in the opposite direction of interest rates. Thus, as the price of bonds in the Fund adjust to a rise in interest rates, the Fund’s share price may decline. Foreign investing carries additional risks such as currency and market volatility and political or social instability, risks which are heightened in developing countries. These risks are described more fully in the Fund’s prospectus. Investors should consult their financial advisor for help selecting the appropriate fund of funds, or fund combination, based on an evaluation of their investment objectives, retirement horizons and risk tolerance.
1. The Fund has an expense reduction and a fee waiver associated with any investments it makes in a Franklin Templeton money fund and/or other underlying fund, contractually guaranteed through 4/30/20. Fund investment results reflect the expense reduction and fee waiver; without these reductions, the results would have been lower. As of May 2019, the Fund’s predetermined asset allocation glide path was modified, and among other changes, establishes neutral and defensive glide paths, between which the Funds’ investment manager could shift depending on projected market volatility; such a change can impact performance. Previously, as of October 2013, the Fund’s glide path was modified, and among other changes, reflects a lower starting allocation to equity funds; such a change can impact performance.
2. Cumulative total return represents the change in value of an investment over the periods indicated.
3. Average annual total return represents the average annual change in value of an investment over the period indicated. Return for less than one year, if any, has not been annualized.
4. Prior to 9/10/18, these shares were offered at a higher initial sales charge of 5.75%, thus actual returns (with sales charges) would have differed. Average annual total returns (with sales charges) have been restated to reflect the current maximum initial sales charge of 5.50%.
5. Source: Morningstar. The MSCI ACWI is a free float-adjusted, market capitalization-weighted index designed to measure equity market performance in global developed and emerging markets. The Bloomberg Barclays Multiverse Index provides a broad-based measure of the global fixed income bond market. The index represents the union of the Global Aggregate Index and the Global High Yield Index and captures investment-grade and high yield securities in all eligible currencies.
6. Figures are as stated in the Fund’s current prospectus, including the effect of acquired fund fees and expenses, and may differ from the expense ratios disclosed in the Your Fund’s Expenses and Financial Highlights sections in this report. In periods of market volatility, assets may decline significantly, causing total annual Fund operating expenses to become higher than the figures shown.
See www.franklintempletondatasources.com for additional data provider information.
| | | | |
franklintempleton.com | | Annual Report | | 45 |
FRANKLIN LIFESMART™ 2045 RETIREMENT TARGET FUND
Your Fund’s Expenses
As a Fund shareholder, you can incur two types of costs: (1) transaction costs, including sales charges (loads) on Fund purchases and redemptions; and (2) ongoing Fund costs, including management fees, distribution and service(12b-1) fees, and other Fund expenses. All mutual funds have ongoing costs, sometimes referred to as operating expenses. The table below shows ongoing costs of investing in the Fund and can help you understand these costs and compare them with those of other mutual funds. The table assumes a $1,000 investment held for the six months indicated.
Actual Fund Expenses
The table below provides information about actual account values and actual expenses in the columns under the heading “Actual.” In these columns the Fund’s actual return, which includes the effect of Fund expenses, is used to calculate the “Ending Account Value” for each class of shares. You can estimate the expenses you paid during the period by following these steps (ofcourse, your account value and expenses will differ from those in this illustration):Divide your account value by $1,000 (ifyour account had an $8,600 value, then $8,600÷ $1,000 = 8.6). Then multiply the result by the number in the row for your class of shares under the headings “Actual” and “Expenses Paid During Period” (ifActual Expenses Paid During Period were $7.50, then 8.6 x $7.50 = $64.50). In this illustration, the actual expenses paid this period are $64.50.
Hypothetical Example for Comparison with Other Funds
Under the heading “Hypothetical” in the table, information is provided about hypothetical account values and hypothetical expenses based on the Fund’s actual expense ratio and an assumed rate of return of 5% per year before expenses, which is not the Fund’s actual return. This information may not be used to estimate the actual ending account balance or expenses you paid for the period, but it can help you compare ongoing costs of investing in the Fund with those of other funds. To do so, compare this 5% hypothetical example for the class of shares you hold with the 5% hypothetical examples that appear in the shareholder reports of other funds.
Please note that expenses shown in the table are meant to highlight ongoing costs and do not reflect any transactional costs. Therefore, information under the heading “Hypothetical” is useful in comparing ongoing costs only, and will not help you compare total costs of owning different funds. In addition, if transactional costs were included, your total costs would have been higher.
| | | | | | | | | | | | | | | | | | |
| | | | | | | Actual (actual return after expenses) | | | | Hypothetical (5% annual return
before expenses) | | | | |
Share
Class | | Beginning
Account Value 7/1/19 | | | | Ending
Account Value 12/31/19 | | Expenses Paid During
Period
7/1/19–12/31/191, 2 | | | | Ending
Account Value 12/31/19 | | Expenses Paid During
Period
7/1/19–12/31/191, 2 | | | | Net Annualized
Expense Ratio2 |
| | | | | | | | | | | | | | | | |
| A | | $1,000 | | | | $1,074.10 | | $1.93 | | | | $1,023.34 | | $1.89 | | | | 0.37% |
| C | | $1,000 | | | | $1,069.70 | | $5.84 | | | | $1,019.56 | | $5.70 | | | | 1.12% |
| R | | $1,000 | | | | $1,073.00 | | $3.24 | | | | $1,022.08 | | $3.16 | | | | 0.62% |
| R6 | | $1,000 | | | | $1,076.00 | | $0.37 | | | | $1,024.85 | | $0.36 | | | | 0.07% |
| Advisor | | $1,000 | | | | $1,074.90 | | $0.63 | | | | $1,024.60 | | $0.61 | | | | 0.12% |
1. Expenses are equal to the annualized expense ratio for thesix-month period as indicated above—in the far right column—multiplied by the simple average account value over the period indicated, and then multiplied by 184/365 to reflect theone-half year period.
2. Reflects expenses after fee waivers and expense reimbursements. Does not include acquired fund fees and expenses.
| | | | |
| | | |
46 | | Annual Report | | franklintempleton.com |
Franklin LifeSmart™ 2050 Retirement Target Fund
This annual report for Franklin LifeSmart™ 2050 Retirement Target Fund covers the fiscal year ended December 31, 2019.
Your Fund’s Goal and Main Investments
The Fund seeks the highest level of long-term total return, which consists of capital appreciation and income, consistent with the Fund’s asset allocation. Under normal market conditions, the Fund allocates its assets among the broad asset classes of equity, fixed income and alternative(non-traditional) investments by investing primarily in a distinctly weighted combination of underlying funds, predominantly other Franklin Templeton mutual funds and exchange-traded funds (ETFs), with an increasing emphasis on income as the target date of 2050 approaches. The target date is the approximate retirement year of the investor.
Asset Allocation*
Based on Total Net Assets as of 12/31/19
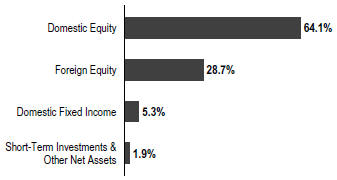
*The asset allocation is based on the Statement of Investments (SOI), which classifies each underlying fund and other fund investments into a broad asset class based on its predominant investments under normal market conditions.
Performance Overview
The Fund’s Class A shares posted a +22.00% cumulative total return for the 12 months ended December 31, 2019. In comparison, the Fund’s equity benchmark, the MSCI All Country World Index (ACWI), which measures equity market performance in global developed and emerging markets, posted a +27.30% total return.1 The Fund’s fixed income benchmark, the Bloomberg Barclays Multiverse Index, a broad-based measure of the global fixed income bond
market, posted a +7.13% total return.1 You can find more of the Fund’s performance data in the Performance Summary beginning on page 49.
Performance data represent past performance, which does not guarantee future results. Investment return and principal value will fluctuate, and you may have a gain or loss when you sell your shares. Current performance may differ from figures shown. For most recentmonth-end performance, go tofranklintempleton.comor call(800)342-5236.
Investment Strategy
Under normal market conditions, the investment manager uses a predetermined glide path as a guide in allocating the Fund’s assets among underlying funds in the broad asset classes (the Neutral Glide Path). However, when the investment manager’s proprietary risk indicator model signals a sustained level of market turbulence or a prolonged down (or bear) market, the investment manager may, in its sole discretion, employ a defensive glide path, which has higher fixed income and lower equity allocations than the Neutral Glide Path (the Defensive Glide Path). Then, if the market stabilizes, the investment manager may, in its sole discretion, shift the Fund’s portfolio back to the Neutral Glide Path. These glide path shifts are executed through purchases and sales of underlying funds and ETFs to increase or decrease the Funds’ equity and fixed income allocations.
The target asset allocations in the Neutral and Defensive Glide Paths change over time, reducing their exposure to equity investments and becoming increasingly conservative until five years after the stated target date. At approximately five years after the target date, the Fund’s final asset allocation mix will be 40% equity funds and 60% fixed-income funds under the Neutral Glide Path and 30% equity funds and 70% fixed-income funds under the Defensive Glide Path.
When selecting equity funds, the investment manager considers the underlying funds’ foreign and domestic exposure, market capitalization ranges, and investment style (growth vs. value). When selecting fixed-income funds, the investment manager considers the need for reduced market
1. Source: Morningstar.
The indexes are unmanaged and include reinvestment of any income or distributions. They do not reflect any fees, expenses or sale charges. One cannot invest directly in an index, and an index is not representative of the Fund’s portfolio.
See www.franklintempletondatasources.com for additional data provider information.
The dollar value, number of shares or principal amount, and names of all portfolio holdings are listed in the Fund’s SOI, which begins on page 112.
| | | | |
franklintempleton.com | | Annual Report | | 47 |
FRANKLIN LIFESMART™ 2050 RETIREMENT TARGET FUND
risks and lower volatility, appropriate to the Fund’s risk profile, and considers the credit quality, duration and maturity of the underlying funds’ portfolios.
Top 10 Fund Holdings
12/31/19
| | | | |
| | | % of Total
Net Assets | |
| |
Franklin Growth Fund – Class R6 | | | 19.3% | |
| |
Franklin LibertyQ U.S. Equity ETF | | | 17.9% | |
| |
Franklin U.S. Core Equity (IU) Fund | | | 16.0% | |
| |
Franklin Rising Dividends Fund – Class R6 | | | 9.7% | |
| |
Franklin International Core Equity (IU) Fund | | | 8.9% | |
| |
Franklin Emerging Market Core Equity (IU) Fund | | | 5.3% | |
| |
Franklin International Growth Fund – Class R6 | | | 4.0% | |
| |
Templeton Foreign Fund – Class R6 | | | 4.0% | |
| |
Franklin LibertyQ Emerging Markets ETF | | | 3.6% | |
| |
Franklin Liberty U.S. Core Bond ETF | | | 2.7% | |
Manager’s Discussion
The Fund’s performance can be attributed largely to its allocation among equities and fixed income securities and to the actual performance of the fund investments. This allocation shifts every year, in accordance with the target date associated with the portfolio.
Atperiod-end, our largest domestic value fund holding, Franklin Rising Dividends Fund – Class R6, and our largest domestic growth fund holding, Franklin Growth Fund –Class R6 outperformed the Fund’s equity benchmark, the MSCI ACWI, while our largest foreign equity fund holding, Franklin International Core Equity (IU) Fund, which incepted on August 9, 2019, outperformed the index for the period since its inception through December 31, 2019. On the fixed income side, our largest domestic fixed income fund holding, Franklin Liberty U.S. Core Bond ETF, which was incepted on September 17, 2019, outperformed the Fund’s fixed income benchmark, the Bloomberg Barclays Multiverse Index, for the period since its inception through December 31, 2019. The Fund did not have any foreign fixed income holdings atperiod-end.
Thank you for your continued participation in Franklin LifeSmart™ 2050 Retirement Target Fund. We look forward to serving your future investment needs.
| | |
| |
Thomas A. Nelson, CFA Co-Lead Portfolio Manager |
| |
May Tong, CFA Co-Lead Portfolio Manager |
The foregoing information reflects our analysis, opinions and portfolio holdings as of December 31, 2019, the end of the reporting period. The way we implement our main investment strategies and the resulting portfolio holdings may change depending on factors such as market and economic conditions. These opinions may not be relied upon as investment advice or an offer for a particular security. The information is not a complete analysis of every aspect of any market, country, industry, security or the Fund.
Statements of fact are from sources considered reliable, but the investment manager makes no representation or warranty as to their completeness or accuracy. Although historical performance is no guarantee of future results, these insights may help you understand our investment management philosophy.
| | | | |
| | | |
48 | | Annual Report | | franklintempleton.com |
FRANKLIN LIFESMART™ 2050 RETIREMENT TARGET FUND
Performance Summary as of December 31, 2019
The performance table and graphs do not reflect any taxes that a shareholder would pay on Fund dividends, capital gain distributions, if any, or any realized gains on the sale of Fund shares. Total return reflects reinvestment of the Fund’s dividends and capital gain distributions, if any, and any unrealized gains or losses. Your dividend income will vary depending on dividends or interest paid by securities in the Fund’s portfolio, adjusted for operating expenses of each class. Capital gain distributions are net profits realized from the sale of portfolio securities.
Performance as of 12/31/191
Cumulative total return excludes sales charges. Average annual total return includes maximum sales charges. Sales charges will vary depending on the size of the investment and the class of share purchased. The maximum is 5.50% and the minimum is 0%.Class A:5.50% maximum initial sales charge;Advisor Class:no sales charges. For other share classes, visitfranklintempleton.com.
| | | | | | | | |
| Share Class | | Cumulative Total Return2 | | | Average Annual Total Return3 | |
| | |
A4 | | | | | | | | |
| | |
1-Year | | | +22.00% | | | | +15.32% | |
| | |
5-Year | | | +36.42% | | | | +5.20% | |
| | |
Since Inception (7/1/13) | | | +63.30% | | | | +6.90% | |
| | |
Advisor | | | | | | | | |
| | |
1-Year | | | +22.44% | | | | +22.44% | |
| | |
5-Year | | | +38.25% | | | | +6.69% | |
| | |
Since Inception (7/1/13) | | | +66.32% | | | | +8.14% | |
Performance data represent past performance, which does not guarantee future results. Investment return and principal value will fluctuate, and you may have a gain or loss when you sell your shares. Current performance may differ from figures shown. For most recentmonth-end performance, go tofranklintempleton.comor call(800)342-5236.
See page 51 for Performance Summary footnotes.
| | | | |
franklintempleton.com | | Annual Report | | 49 |
FRANKLIN LIFESMART™ 2050 RETIREMENT TARGET FUND
PERFORMANCE SUMMARY
Total Return Index Comparison for a Hypothetical $10,000 Investment1
Total return represents the change in value of an investment over the periods shown. It includes any applicable maximum sales charge, Fund expenses, account fees and reinvested distributions. The unmanaged indexes include reinvestment of any income or distributions. They differ from the Fund in composition and do not pay management fees or expenses. One cannot invest directly in an index.
Class A(7/1/13–12/31/19)
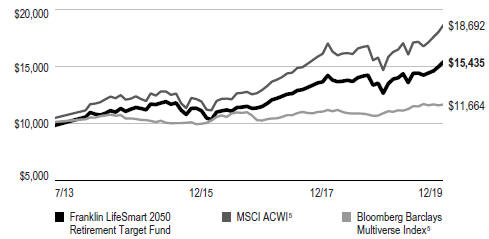
Advisor Class(7/1/13–12/31/19)
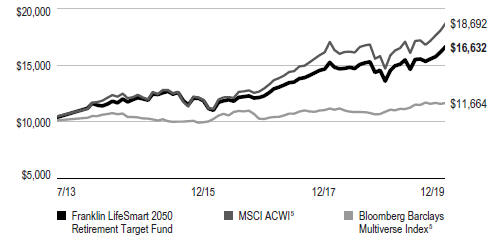
See page 51 for Performance Summary footnotes.
| | | | |
| | | |
50 | | Annual Report | | franklintempleton.com |
FRANKLIN LIFESMART™ 2050 RETIREMENT TARGET FUND
PERFORMANCE SUMMARY
Distributions(1/1/19–12/31/19)
| | | | | | | | | | | | |
| Share Class | | Net Investment
Income | | | Long-Term
Capital Gain | | | Total | |
A | | | $0.1622 | | | | $0.1339 | | | | $0.2961 | |
C | | | $0.0679 | | | | $0.1339 | | | | $0.2018 | |
R | | | $0.1303 | | | | $0.1339 | | | | $0.2642 | |
R6 | | | $0.2014 | | | | $0.1339 | | | | $0.3353 | |
Advisor | | | $0.1948 | | | | $0.1339 | | | | $0.3287 | |
Total Annual Operating Expenses6
| | | | | | | | |
| Share Class | | With Fee
Waiver | | | Without Fee
Waiver | |
A | | | 0.70% | | | | 1.86% | |
Advisor | | | 0.45% | | | | 1.61% | |
Each class of shares is available to certain eligible investors and has different annual fees and expenses, as described in the prospectus.
The Fund’s investment risk changes over time as its asset allocation changes. Since the Fund invests in underlying funds, including ETFs, which may engage in a variety of investment strategies involving certain risks, the Fund is subject to those same risks. All investments involve risks, including loss of principal. Principal invested is not guaranteed at any time, including at or after the Fund’s retirement target date; nor is there any guarantee that the Fund will provide sufficient income at or through the investor’s retirement. Stock prices fluctuate, sometimes rapidly and dramatically, due to factors affecting individual companies, particular industries or sectors, or general market conditions. Bond prices generally move in the opposite direction of interest rates. Thus, as the price of bonds in the Fund adjust to a rise in interest rates, the Fund’s share price may decline. Foreign investing carries additional risks such as currency and market volatility and political or social instability, risks which are heightened in developing countries. These risks are described more fully in the Fund’s prospectus. Investors should consult their financial advisor for help selecting the appropriate fund of funds, or fund combination, based on an evaluation of their investment objectives, retirement horizons and risk tolerance.
1. The Fund has an expense reduction and a fee waiver associated with any investments it makes in a Franklin Templeton money fund and/or other underlying fund, contractually guaranteed through 4/30/20. Fund investment results reflect the expense reduction and fee waiver; without these reductions, the results would have been lower. As of May 2019, the Fund’s predetermined asset allocation glide path was modified, and among other changes, establishes neutral and defensive glide paths, between which the Funds’ investment manager could shift depending on projected market volatility; such a change can impact performance. Previously, as of October 2013, the Fund’s glide path was modified, and among other changes, reflects a lower starting allocation to equity funds; such a change can impact performance.
2. Cumulative total return represents the change in value of an investment over the periods indicated.
3. Average annual total return represents the average annual change in value of an investment over the period indicated. Return for less than one year, if any, has not been annualized.
4. Prior to 9/10/18, these shares were offered at a higher initial sales charge of 5.75%, thus actual returns (with sales charges) would have differed. Average annual total returns (with sales charges) have been restated to reflect the current maximum initial sales charge of 5.50%.
5. Source: Morningstar. The MSCI ACWI is a free float-adjusted, market capitalization-weighted index designed to measure equity market performance in global developed and emerging markets. The Bloomberg Barclays Multiverse Index provides a broad-based measure of the global fixed income bond market. The index represents the union of the Global Aggregate Index and the Global High Yield Index and captures investment-grade and high yield securities in all eligible currencies.
6. Figures are as stated in the Fund’s current prospectus, including the effect of acquired fund fees and expenses, and may differ from the expense ratios disclosed in the Your Fund’s Expenses and Financial Highlights sections in this report. In periods of market volatility, assets may decline significantly, causing total annual Fund operating expenses to become higher than the figures shown.
See www.franklintempletondatasources.com for additional data provider information.
| | | | |
franklintempleton.com | | Annual Report | | 51 |
FRANKLIN LIFESMART™ 2050 RETIREMENT TARGET FUND
Your Fund’s Expenses
As a Fund shareholder, you can incur two types of costs: (1) transaction costs, including sales charges (loads) on Fund purchases and redemptions; and (2) ongoing Fund costs, including management fees, distribution and service(12b-1) fees, and other Fund expenses. All mutual funds have ongoing costs, sometimes referred to as operating expenses. The table below shows ongoing costs of investing in the Fund and can help you understand these costs and compare them with those of other mutual funds. The table assumes a $1,000 investment held for the six months indicated.
Actual Fund Expenses
The table below provides information about actual account values and actual expenses in the columns under the heading “Actual.” In these columns the Fund’s actual return, which includes the effect of Fund expenses, is used to calculate the “Ending Account Value” for each class of shares. You can estimate the expenses you paid during the period by following these steps (ofcourse, your account value and expenses will differ from those in this illustration):Divide your account value by $1,000 (ifyour account had an $8,600 value, then $8,600÷ $1,000 = 8.6). Then multiply the result by the number in the row for your class of shares under the headings “Actual” and “Expenses Paid During Period” (ifActual Expenses Paid During Period were $7.50, then 8.6 x $7.50 = $64.50). In this illustration, the actual expenses paid this period are $64.50.
Hypothetical Example for Comparison with Other Funds
Under the heading “Hypothetical” in the table, information is provided about hypothetical account values and hypothetical expenses based on the Fund’s actual expense ratio and an assumed rate of return of 5% per year before expenses, which is not the Fund’s actual return. This information may not be used to estimate the actual ending account balance or expenses you paid for the period, but it can help you compare ongoing costs of investing in the Fund with those of other funds. To do so, compare this 5% hypothetical example for the class of shares you hold with the 5% hypothetical examples that appear in the shareholder reports of other funds.
Please note that expenses shown in the table are meant to highlight ongoing costs and do not reflect any transactional costs. Therefore, information under the heading “Hypothetical” is useful in comparing ongoing costs only, and will not help you compare total costs of owning different funds. In addition, if transactional costs were included, your total costs would have been higher.
| | | | | | | | | | | | | | | | | | |
| | | | | | | Actual (actual return after expenses) | | | | Hypothetical (5% annual return
before expenses) | | | | |
Share Class | | Beginning
Account Value 7/1/19 | | | | Ending Account Value 12/31/19 | | Expenses Paid During
Period
7/1/19–12/31/191, 2 | | | | Ending Account Value 12/31/19 | | Expenses Paid During
Period
7/1/19–12/31/191, 2 | | | | Net Annualized
Expense Ratio2 |
| | | | | | | | | | | | |
| A | | $1,000 | | | | $1,071.30 | | $1.88 | | | | $1,023.39 | | $1.84 | | | | 0.36% |
| C | | $1,000 | | | | $1,067.80 | | $5.79 | | | | $1,019.61 | | $5.65 | | | | 1.11% |
| R | | $1,000 | | | | $1,070.80 | | $3.18 | | | | $1,022.13 | | $3.11 | | | | 0.61% |
| R6 | | $1,000 | | | | $1,073.30 | | $0.31 | | | | $1,024.90 | | $0.31 | | | | 0.06% |
| Advisor | | $1,000 | | | | $1,073.10 | | $0.57 | | | | $1,024.65 | | $0.56 | | | | 0.11% |
1. Expenses are equal to the annualized expense ratio for thesix-month period as indicated above—in the far right column—multiplied by the simple average account value over the period indicated, and then multiplied by 184/365 to reflect theone-half year period.
2. Reflects expenses after fee waivers and expense reimbursements. Does not include acquired fund fees and expenses.
| | | | |
| | | |
52 | | Annual Report | | franklintempleton.com |
Franklin LifeSmart™ 2055 Retirement Target Fund
This annual report for Franklin LifeSmart™ 2055 Retirement Target Fund covers the fiscal year ended December 31, 2019.
Your Fund’s Goal and Main Investments
The Fund seeks the highest level of long-term total return, which consists of capital appreciation and income, consistent with the Fund’s asset allocation. Under normal market conditions, the Fund allocates its assets among the broad asset classes of equity, fixed income and alternative(non-traditional) investments by investing primarily in a distinctly weighted combination of underlying funds, predominantly other Franklin Templeton mutual funds and exchange-traded funds (ETFs), with an increasing emphasis on income as the target date of 2055 approaches. The target date is the approximate retirement year of the investor.
Asset Allocation*
Based on Total Net Assets as of 12/31/19
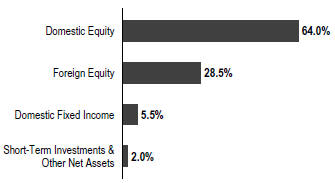
*The asset allocation is based on the Statement of Investments (SOI), which classifies each underlying fund and other fund investments into a broad asset class based on its predominant investments under normal market conditions.
Performance Overview
The Fund’s Class A shares posted a +22.39% cumulative total return for the 12 months ended December 31, 2019. In comparison, the Fund’s equity benchmark, the MSCI All Country World Index (ACWI), which measures equity market performance in global developed and emerging markets, posted a +27.30% total return.1The Fund’s fixed income benchmark, the Bloomberg Barclays Multiverse Index, a broad-based measure of the global fixed income bond
market, posted a +7.13% total return.1 You can find the Fund’s long-term performance data in the Performance Summary beginning on page 55.
Performance data represent past performance, which does not guarantee future results. Investment return and principal value will fluctuate, and you may have a gain or loss when you sell your shares. Current performance may differ from figures shown. For most recentmonth-end performance, go tofranklintempleton.comor call(800)342-5236.
Investment Strategy
Under normal market conditions, the investment manager uses a predetermined glide path as a guide in allocating the Fund’s assets among underlying funds in the broad asset classes (the Neutral Glide Path). However, when the investment manager’s proprietary risk indicator model signals a sustained level of market turbulence or a prolonged down (or bear) market, the investment manager may, in its sole discretion, employ a defensive glide path, which has higher fixed income and lower equity allocations than the Neutral Glide Path (the Defensive Glide Path). Then, if the market stabilizes, the investment manager may, in its sole discretion, shift the Fund’s portfolio back to the Neutral Glide Path. These glide path shifts are executed through purchases and sales of underlying funds and ETFs to increase or decrease the Funds’ equity and fixed income allocations.
The target asset allocations in the Neutral and Defensive Glide Paths change over time, reducing their exposure to equity investments and becoming increasingly conservative until five years after the stated target date. At approximately five years after the target date, the Fund’s final asset allocation mix will be 40% equity funds and 60% fixed-income funds under the Neutral Glide Path and 30% equity funds and 70% fixed-income funds under the Defensive Glide Path.
When selecting equity funds, the investment manager considers the underlying funds’ foreign and domestic exposure, market capitalization ranges, and investment style (growth vs. value). When selecting fixed-income funds, the investment manager considers the need for reduced market
1. Source: Morningstar.
The indexes are unmanaged and include reinvestment of any income or distributions. They do not reflect any fees, expenses or sale charges. One cannot invest directly in an index, and an index is not representative of the Fund’s portfolio.
See www.franklintempletondatasources.com for additional data provider information.
The dollar value, number of shares or principal amount, and names of all portfolio holdings are listed in the Fund’s SOI, which begins on page 119.
| | | | |
franklintempleton.com | | Annual Report | | 53 |
FRANKLIN LIFESMART™ 2055 RETIREMENT TARGET FUND
risks and lower volatility, appropriate to the Fund’s risk profile, and considers the credit quality, duration and maturity of the underlying funds’ portfolios.
Top 10 Fund Holdings
12/31/19
| | | | |
| | | % of Total
Net Assets | |
| |
Franklin Growth Fund – Class R6 | | | 19.2% | |
| |
Franklin LibertyQ U.S. Equity ETF | | | 17.9% | |
| |
Franklin U.S. Core Equity (IU) Fund | | | 16.0% | |
| |
Franklin Rising Dividends Fund – Class R6 | | | 9.6% | |
| |
Franklin International Core Equity (IU) Fund | | | 8.8% | |
| |
Franklin Emerging Market Core Equity (IU) Fund | | | 5.2% | |
| |
Franklin International Growth Fund – Class R6 | | | 4.0% | |
| |
Templeton Foreign Fund – Class R6 | | | 4.0% | |
| |
Franklin LibertyQ Emerging Markets ETF | | | 3.6% | |
| |
Franklin Liberty U.S. Core Bond ETF | | | 2.7% | |
Manager’s Discussion
The Fund’s performance can be attributed largely to its allocation among equities and fixed income securities and to the actual performance of the fund investments. This allocation shifts every year, in accordance with the target date associated with the portfolio.
Atperiod-end, our largest domestic value fund holding, Franklin Rising Dividends Fund – Class R6, and our largest domestic growth fund holding, Franklin Growth Fund –Class R6 outperformed the Fund’s equity benchmark, the MSCI ACWI, while our largest foreign equity fund holding, Franklin International Core Equity (IU) Fund, which incepted on August 9, 2019, outperformed the index for the period since its inception through December 31, 2019. On the fixed income side, our largest domestic fixed income fund holding, Franklin Liberty U.S. Core Bond ETF, which was incepted on September 17, 2019, outperformed the Fund’s fixed income benchmark, the Bloomberg Barclays Multiverse Index, for the period since its inception through December 31, 2019. The Fund did not have any foreign fixed income holdings atperiod-end.
Thank you for your continued participation in Franklin LifeSmart™ 2055 Retirement Target Fund. We look forward to serving your future investment needs.
| | |
| | |
Thomas A. Nelson, CFA Co-Lead Portfolio Manager |
| | |
| | |
May Tong, CFA Co-Lead Portfolio Manager |
The foregoing information reflects our analysis, opinions and portfolio holdings as of December 31, 2019, the end of the reporting period. The way we implement our main investment strategies and the resulting portfolio holdings may change depending on factors such as market and economic conditions. These opinions may not be relied upon as investment advice or an offer for a particular security. The information is not a complete analysis of every aspect of any market, country, industry, security or the Fund. Statements of fact are from sources considered reliable, but the investment manager makes no representation or warranty as to their completeness or accuracy. Although historical performance is no guarantee of future results, these insights may help you understand our investment management philosophy.
| | | | |
| | | |
54 | | Annual Report | | franklintempleton.com |
FRANKLIN LIFESMART™ 2055 RETIREMENT TARGET FUND
Performance Summary as of December 31, 2019
The performance table and graphs do not reflect any taxes that a shareholder would pay on Fund dividends, capital gain distributions, if any, or any realized gains on the sale of Fund shares. Total return reflects reinvestment of the Fund’s dividends and capital gain distributions, if any, and any unrealized gains or losses. Your dividend income will vary depending on dividends or interest paid by securities in the Fund’s portfolio, adjusted for operating expenses of each class. Capital gain distributions are net profits realized from the sale of portfolio securities.
Performance as of 12/31/191
Cumulative total return excludes sales charges. Average annual total return includes maximum sales charges. Sales charges will vary depending on the size of the investment and the class of share purchased. The maximum is 5.50% and the minimum is 0%.Class A:5.50% maximum initial sales charge;Advisor Class:no sales charges. For other share classes, visitfranklintempleton.com.
| | | | | | | | |
| Share Class | | Cumulative
Total Return2
| | | Average Annual
Total Return3 | |
| | |
A4 | | | | | | | | |
| | |
1-Year | | | +22.39% | | | | +15.60% | |
| | |
3-Year | | | +34.97% | | | | +8.45% | |
| | |
Since Inception (5/1/15) | | | +31.68% | | | | +4.80% | |
| | |
Advisor | | | | | | | | |
| | |
1-Year | | | +22.67% | | | | +22.67% | |
| | |
3-Year | | | +35.83% | | | | +10.75% | |
| | |
Since Inception (5/1/15) | | | +32.97% | | | | +6.29% | |
Performance data represent past performance, which does not guarantee future results. Investment return and principal value will fluctuate, and you may have a gain or loss when you sell your shares. Current performance may differ from figures shown. For most recentmonth-end performance, go tofranklintempleton.comor call(800)342-5236.
See page 57 for Performance Summary footnotes.
| | | | |
franklintempleton.com | | Annual Report | | 55 |
FRANKLIN LIFESMART™ 2055 RETIREMENT TARGET FUND
PERFORMANCE SUMMARY
Total Return Index Comparison for a Hypothetical $10,000 Investment1
Total return represents the change in value of an investment over the periods shown. It includes any applicable maximum sales charge, Fund expenses, account fees and reinvested distributions. The unmanaged indexes include reinvestment of any income or distributions. They differ from the Fund in composition and do not pay management fees or expenses. One cannot invest directly in an index.
Class A(5/1/15–12/31/19)
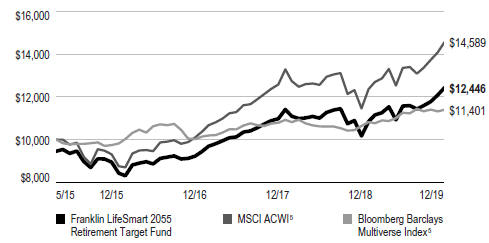
Advisor Class(5/1/15–12/31/19)
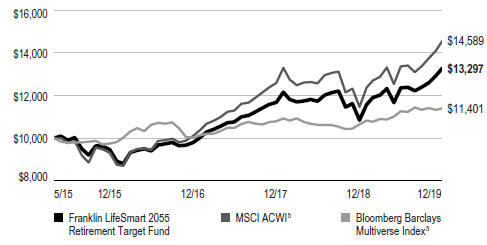
See page 57 for Performance Summary footnotes.
| | | | |
| | | |
56 | | Annual Report | | franklintempleton.com |
FRANKLIN LIFESMART™ 2055 RETIREMENT TARGET FUND
PERFORMANCE SUMMARY
Distributions(1/1/19–12/31/19)
| | | | | | | | | | | | |
| Share Class | | Net Investment
Income | | | Long-Term
Capital Gain | | | Total | |
A | | | $0.1174 | | | | $0.1008 | | | | $0.2182 | |
C | | | $0.0412 | | | | $0.1008 | | | | $0.1420 | |
R | | | $0.0917 | | | | $0.1008 | | | | $0.1925 | |
R6 | | | $0.1500 | | | | $0.1008 | | | | $0.2508 | |
Advisor | | | $0.1457 | | | | $0.1008 | | | | $0.2465 | |
Total Annual Operating Expenses6
| | | | | | | | |
| Share Class | | With Fee
Waiver | | | Without Fee
Waiver | |
A | | | 0.70% | | | | 3.12% | |
Advisor | | | 0.45% | | | | 2.87% | |
Each class of shares is available to certain eligible investors and has different annual fees and expenses, as described in the prospectus.
The Fund’s investment risk changes over time as its asset allocation changes. Since the Fund invests in underlying funds, including ETFs, which may engage in a variety of investment strategies involving certain risks, the Fund is subject to those same risks. All investments involve risks, including loss of principal. Principal invested is not guaranteed at any time, including at or after the Fund’s retirement target date; nor is there any guarantee that the Fund will provide sufficient income at or through the investor’s retirement. Stock prices fluctuate, sometimes rapidly and dramatically, due to factors affecting individual companies, particular industries or sectors, or general market conditions. Bond prices generally move in the opposite direction of interest rates. Thus, as the price of bonds in the Fund adjust to a rise in interest rates, the Fund’s share price may decline. Foreign investing carries additional risks such as currency and market volatility and political or social instability, risks which are heightened in developing countries. These risks are described more fully in the Fund’s prospectus. Investors should consult their financial advisor for help selecting the appropriate fund of funds, or fund combination, based on an evaluation of their investment objectives, retirement horizons and risk tolerance.
1. The Fund has an expense reduction and a fee waiver associated with any investments it makes in a Franklin Templeton money fund and/or other underlying fund, contractually guaranteed through 4/30/20. Fund investment results reflect the expense reduction and fee waiver; without these reductions, the results would have been lower. As of May 2019, the Fund’s predetermined asset allocation glide path was modified, and among other changes, establishes neutral and defensive glide paths, between which the Funds’ investment manager could shift depending on projected market volatility; such a change can impact performance. Previously, as of October 2013, the Fund’s glide path was modified, and among other changes, reflects a lower starting allocation to equity funds; such a change can impact performance.
2. Cumulative total return represents the change in value of an investment over the periods indicated.
3. Average annual total return represents the average annual change in value of an investment over the period indicated. Return for less than one year, if any, has not been annualized.
4. Prior to 9/10/18, these shares were offered at a higher initial sales charge of 5.75%, thus actual returns (with sales charges) would have differed. Average annual total returns (with sales charges) have been restated to reflect the current maximum initial sales charge of 5.50%.
5. Source: Morningstar. The MSCI ACWI is a free float-adjusted, market capitalization-weighted index designed to measure equity market performance in global developed and emerging markets. The Bloomberg Barclays Multiverse Index provides a broad-based measure of the global fixed income bond market. The index represents the union of the Global Aggregate Index and the Global High Yield Index and captures investment-grade and high yield securities in all eligible currencies.
6. Figures are as stated in the Fund’s current prospectus, including the effect of acquired fund fees and expenses, and may differ from the expense ratios disclosed in the Your Fund’s Expenses and Financial Highlights sections in this report. In periods of market volatility, assets may decline significantly, causing total annual Fund operating expenses to become higher than the figures shown.
See www.franklintempletondatasources.com for additional data provider information.
| | | | |
franklintempleton.com | | Annual Report | | 57 |
FRANKLIN LIFESMART™ 2055 RETIREMENT TARGET FUND
Your Fund’s Expenses
As a Fund shareholder, you can incur two types of costs: (1) transaction costs, including sales charges (loads) on Fund purchases and redemptions; and (2) ongoing Fund costs, including management fees, distribution and service(12b-1) fees, and other Fund expenses. All mutual funds have ongoing costs, sometimes referred to as operating expenses. The table below shows ongoing costs of investing in the Fund and can help you understand these costs and compare them with those of other mutual funds. The table assumes a $1,000 investment held for the six months indicated.
Actual Fund Expenses
The table below provides information about actual account values and actual expenses in the columns under the heading “Actual.” In these columns the Fund’s actual return, which includes the effect of Fund expenses, is used to calculate the “Ending Account Value” for each class of shares. You can estimate the expenses you paid during the period by following these steps (ofcourse, your account value and expenses will differ from those in this illustration):Divide your account value by $1,000 (ifyour account had an $8,600 value, then $8,600÷ $1,000 = 8.6). Then multiply the result by the number in the row for your class of shares under the headings “Actual” and “Expenses Paid During Period” (ifActual Expenses Paid During Period were $7.50, then 8.6 x $7.50 = $64.50). In this illustration, the actual expenses paid this period are $64.50.
Hypothetical Example for Comparison with Other Funds
Under the heading “Hypothetical” in the table, information is provided about hypothetical account values and hypothetical expenses based on the Fund’s actual expense ratio and an assumed rate of return of 5% per year before expenses, which is not the Fund’s actual return. This information may not be used to estimate the actual ending account balance or expenses you paid for the period, but it can help you compare ongoing costs of investing in the Fund with those of other funds. To do so, compare this 5% hypothetical example for the class of shares you hold with the 5% hypothetical examples that appear in the shareholder reports of other funds.
Please note that expenses shown in the table are meant to highlight ongoing costs and do not reflect any transactional costs. Therefore, information under the heading “Hypothetical” is useful in comparing ongoing costs only, and will not help you compare total costs of owning different funds. In addition, if transactional costs were included, your total costs would have been higher.
| | | | | | | | | | | | | | | | | | |
| | | | | | | Actual (actual return after expenses) | | | | Hypothetical (5% annual return before expenses) | | | | |
Share
Class | | Beginning
Account Value 7/1/19 | | | | Ending
Account Value 12/31/19 | | Expenses Paid During
Period 7/1/19–12/31/191, 2 | | | | Ending
Account Value 12/31/19 | | Expenses Paid During
Period 7/1/19–12/31/191, 2 | | | | Net Annualized
Expense Ratio2 |
| | | | | | | | | | | | |
| A | | $1,000 | | | | $1,075.30 | | $1.94 | | | | $1,023.34 | | $1.89 | | | | 0.37% |
| C | | $1,000 | | | | $1,070.50 | | $5.85 | | | | $1,019.56 | | $5.70 | | | | 1.12% |
| R | | $1,000 | | | | $1,074.10 | | $3.24 | | | | $1,022.08 | | $3.16 | | | | 0.62% |
| R6 | | $1,000 | | | | $1,075.90 | | $0.37 | | | | $1,024.85 | | $0.36 | | | | 0.07% |
| Advisor | | $1,000 | | | | $1,076.60 | | $0.63 | | | | $1,024.60 | | $0.61 | | | | 0.12% |
1. Expenses are equal to the annualized expense ratio for thesix-month period as indicated above—in the far right column—multiplied by the simple average account value over the period indicated, and then multiplied by 184/365 to reflect theone-half year period.
2. Reflects expenses after fee waivers and expense reimbursements. Does not include acquired fund fees and expenses.
| | | | |
| | | |
58 | | Annual Report | | franklintempleton.com |
FRANKLIN FUND ALLOCATOR SERIES
Financial Highlights
Franklin LifeSmart™ Retirement Income Fund
| | | | | | | | | | | | | | | | | | | | |
| | | Year Ended December 31, | |
| | | 2019 | | | 2018 | | | 2017 | | | 2016 | | | 2015 | |
| | | | | |
Class A | | | | | | | | | | | | | | | | | | | | |
| | | | | |
Per share operating performance | | | | | | | | | | | | | | | | | | | | |
(for a share outstanding throughout the year) | | | | | | | | | | | | | | | | | | | | |
| | | | | |
Net asset value, beginning of year | | | $10.35 | | | | $11.06 | | | | $10.96 | | | | $10.78 | | | | $11.67 | |
| | | | | |
Income from investment operationsa: | | | | | | | | | | | | | | | | | | | | |
| | | | | |
Net investment incomeb,c | | | 0.43 | | | | 0.50 | | | | 0.43 | | | | 0.27 | | | | 0.26 | |
| | | | | |
Net realized and unrealized gains (losses) | | | 0.79 | | | | (0.77 | ) | | | 0.10 | | | | 0.28 | | | | (0.55 | ) |
| | | | | |
Total from investment operations | | | 1.22 | | | | (0.27 | ) | | | 0.53 | | | | 0.55 | | | | (0.29 | ) |
| | | | | |
Less distributions from: | | | | | | | | | | | | | | | | | | | | |
| | | | | |
Net investment income | | | (0.42 | ) | | | (0.44 | ) | | | (0.43 | ) | | | (0.28 | ) | | | (0.27 | ) |
| | | | | |
Net realized gains | | | — | | | | — | | | | — | | | | (0.05 | ) | | | (0.33 | ) |
| | | | | |
Tax return of capital. | | | — | | | | — | | | | — | | | | (0.04 | ) | | | — | |
| | | | | |
Total distributions | | | (0.42 | ) | | | (0.44 | ) | | | (0.43 | ) | | | (0.37 | ) | | | (0.60 | ) |
| | | | | |
Net asset value, end of year | | | $11.15 | | | | $10.35 | | | | $11.06 | | | | $10.96 | | | | $10.78 | |
| | | | | |
Total returnd | | | 11.93% | | | | (2.48)% | | | | 4.84% | | | | 5.25% | | | | (2.59)% | |
| | | | | |
Ratios to average net assets | | | | | | | | | | | | | | | | | | | | |
| | | | | |
Expenses before waiver and payments by affiliatese | | | 0.95% | | | | 0.90% | | | | 0.92% | | | | 0.90% | | | | 0.92% | |
| | | | | |
Expenses net of waiver and payments by affiliatese | | | 0.30% | f | | | 0.30% | f | | | 0.30% | f | | | 0.30% | | | | 0.33% | |
| | | | | |
Net investment incomec | | | 3.91% | | | | 4.63% | | | | 3.89% | | | | 2.50% | | | | 2.27% | |
| | | | | |
Supplemental data | | | | | | | | | | | | | | | | | | | | |
| | | | | |
Net assets, end of year (000’s) | | | $34,363 | | | | $31,461 | | | | $32,397 | | | | $39,713 | | | | $44,823 | |
| | | | | |
Portfolio turnover rate | | | 82.72% | | | | 46.27% | | | | 28.12% | | | | 149.53% | | | | 38.48% | |
aThe amount shown for a share outstanding throughout the period may not correlate with the Statement of Operations for the period due to the timing of sales and repurchases of the Fund’s shares in relation to income earned and/or fluctuating fair value of the investments of the Fund.
bBased on average daily shares outstanding.
cRecognition of net investment income by the Fund is affected by the timing of declaration of dividends by the Underlying Funds and exchange traded funds in which the Fund invests.
dTotal return does not reflect sales commissions or contingent deferred sales charges, if applicable.
eDoes not include expenses of the Underlying Funds and exchange traded funds in which the Fund invests. The weighted average indirect expenses of the Underlying Funds and exchange traded funds was 0.33% for the year ended December 31, 2019.
fBenefit of expense reduction rounds to less than 0.01%.
| | | | |
franklintempleton.com | | The accompanying notes are an integral part of these financial statements. | Annual Report | | 59 |
FRANKLIN FUND ALLOCATOR SERIES
FINANCIAL HIGHLIGHTS
Franklin LifeSmart™ Retirement Income Fund(continued)
| | | | | | | | | | | | | | | | | | | | |
| | | Year Ended December 31, | |
| | | 2019 | | | 2018 | | | 2017 | | | 2016 | | | 2015 | |
| | | | | |
Class C | | | | | | | | | | | | | | | | | | | | |
| | | | | |
Per share operating performance | | | | | | | | | | | | | | | | | | | | |
(for a share outstanding throughout the year) | | | | | | | | | | | | | | | | | | | | |
| | | | | |
Net asset value, beginning of year | | | $10.23 | | | | $10.92 | | | | $10.83 | | | | $10.66 | | | | $11.55 | |
| | | | | |
Income from investment operationsa: | | | | | | | | | | | | | | | | | | | | |
| | | | | |
Net investment incomeb,c | | | 0.34 | | | | 0.42 | | | | 0.34 | | | | 0.19 | | | | 0.18 | |
| | | | | |
Net realized and unrealized gains (losses) | | | 0.78 | | | | (0.76 | ) | | | 0.10 | | | | 0.28 | | | | (0.55 | ) |
| | | | | |
Total from investment operations | | | 1.12 | | | | (0.34 | ) | | | 0.44 | | | | 0.47 | | | | (0.37 | ) |
| | | | | |
Less distributions from: | | | | | | | | | | | | | | | | | | | | |
| | | | | |
Net investment income | | | (0.34 | ) | | | (0.35 | ) | | | (0.35 | ) | | | (0.22 | ) | | | (0.19 | ) |
| | | | | |
Net realized gains | | | — | | | | — | | | | — | | | | (0.05 | ) | | | (0.33 | ) |
| | | | | |
Tax return of capital. | | | — | | | | — | | | | — | | | | (0.03 | ) | | | — | |
| | | | | |
Total distributions | | | (0.34 | ) | | | (0.35 | ) | | | (0.35 | ) | | | (0.30 | ) | | | (0.52 | ) |
| | | | | |
Net asset value, end of year | | | $11.01 | | | | $10.23 | | | | $10.92 | | | | $10.83 | | | | $10.66 | |
| | | | | |
Total returnd | | | 11.14% | | | | (3.29)% | | | | 4.07% | | | | 4.50% | | | | (3.32)% | |
| | | | | |
Ratios to average net assets | | | | | | | | | | | | | | | | | | | | |
| | | | | |
Expenses before waiver and payments by affiliatese | | | 1.69% | | | | 1.65% | | | | 1.67% | | | | 1.64% | | | | 1.64% | |
| | | | | |
Expenses net of waiver and payments by affiliatese | | | 1.04% | f | | | 1.05% | f | | | 1.05% | f | | | 1.04% | | | | 1.05% | |
| | | | | |
Net investment incomec | | | 3.17% | | | | 3.88% | | | | 3.14% | | | | 1.76% | | | | 1.55% | |
| | | | | |
Supplemental data | | | | | | | | | | | | | | | | | | | | |
| | | | | |
Net assets, end of year (000’s) | | | $10,568 | | | | $11,796 | | | | $16,070 | | | | $17,570 | | | | $20,858 | |
| | | | | |
Portfolio turnover rate | | | 82.72% | | | | 46.27% | | | | 28.12% | | | | 149.53% | | | | 38.48% | |
aThe amount shown for a share outstanding throughout the period may not correlate with the Statement of Operations for the period due to the timing of sales and repurchases of the Fund’s shares in relation to income earned and/or fluctuating fair value of the investments of the Fund.
bBased on average daily shares outstanding.
cRecognition of net investment income by the Fund is affected by the timing of declaration of dividends by the Underlying Funds and exchange traded funds in which the Fund invests.
dTotal return does not reflect sales commissions or contingent deferred sales charges, if applicable.
eDoes not include expenses of the Underlying Funds and exchange traded funds in which the Fund invests. The weighted average indirect expenses of the Underlying Funds and exchange traded funds was 0.33% for the year ended December 31, 2019.
fBenefit of expense reduction rounds to less than 0.01%.
| | | | |
| | | |
60 | | Annual Report| The accompanying notes are an integral part of these financial statements. | | franklintempleton.com |
FRANKLIN FUND ALLOCATOR SERIES
FINANCIAL HIGHLIGHTS
Franklin LifeSmart™ Retirement Income Fund(continued)
| | | | | | | | | | | | | | | | | | | | |
| | | Year Ended December 31, | |
| | | 2019 | | | 2018 | | | 2017 | | | 2016 | | | 2015 | |
| | | | | |
Class R | | | | | | | | | | | | | | | | | | | | |
| | | | | |
Per share operating performance | | | | | | | | | | | | | | | | | | | | |
(for a share outstanding throughout the year) | | | | | | | | | | | | | | | | | | | | |
| | | | | |
Net asset value, beginning of year | | | $10.31 | | | | $11.01 | | | | $10.92 | | | | $10.74 | | | | $11.64 | |
| | | | | |
Income from investment operationsa: | | | | | | | | | | | | | | | | | | | | |
| | | | | |
Net investment incomeb,c | | | 0.40 | | | | 0.48 | | | | 0.40 | | | | 0.25 | | | | 0.25 | |
| | | | | |
Net realized and unrealized gains (losses) | | | 0.79 | | | | (0.77 | ) | | | 0.09 | | | | 0.28 | | | | (0.57 | ) |
| | | | | |
Total from investment operations | | | 1.19 | | | | (0.29 | ) | | | 0.49 | | | | 0.53 | | | | (0.32 | ) |
| | | | | |
Less distributions from: | | | | | | | | | | | | | | | | | | | | |
| | | | | |
Net investment income | | | (0.39 | ) | | | (0.41 | ) | | | (0.40 | ) | | | (0.26 | ) | | | (0.25 | ) |
| | | | | |
Net realized gains | | | — | | | | — | | | | — | | | | (0.05 | ) | | | (0.33 | ) |
| | | | | |
Tax return of capital | | | — | | | | — | | | | — | | | | (0.04 | ) | | | — | |
| | | | | |
Total distributions | | | (0.39 | ) | | | (0.41 | ) | | | (0.40 | ) | | | (0.35 | ) | | | (0.58 | ) |
| | | | | |
Net asset value, end of year | | | $11.11 | | | | $10.31 | | | | $11.01 | | | | $10.92 | | | | $10.74 | |
| | | | | |
Total return | | | 11.69% | | | | (2.67)% | | | | 4.57% | | | | 4.94% | | | | (2.87)% | |
| | | | | |
Ratios to average net assets | | | | | | | | | | | | | | | | | | | | |
| | | | | |
Expenses before waiver and payments by affiliatesd | | | 1.16% | | | | 1.11% | | | | 1.17% | | | | 1.15% | | | | 1.14% | |
| | | | | |
Expenses net of waiver and payments by affiliatesd | | | 0.51% | e | | | 0.51% | e | | | 0.55% | e | | | 0.55% | | | | 0.55% | |
| | | | | |
Net investment incomec | | | 3.70% | | | | 4.42% | | | | 3.64% | | | | 2.25% | | | | 2.05% | |
| | | | | |
Supplemental data | | | | | | | | | | | | | | | | | | | | |
| | | | | |
Net assets, end of year (000’s) | | | $2,336 | | | | $2,876 | | | | $4,071 | | | | $4,920 | | | | $4,130 | |
| | | | | |
Portfolio turnover rate | | | 82.72% | | | | 46.27% | | | | 28.12% | | | | 149.53% | | | | 38.48% | |
aThe amount shown for a share outstanding throughout the period may not correlate with the Statement of Operations for the period due to the timing of sales and repurchases of the Fund’s shares in relation to income earned and/or fluctuating fair value of the investments of the Fund.
bBased on average daily shares outstanding.
cRecognition of net investment income by the Fund is affected by the timing of declaration of dividends by the Underlying Funds and exchange traded funds in which the Fund invests.
dDoes not include expenses of the Underlying Funds and exchange traded funds in which the Fund invests. The weighted average indirect expenses of the Underlying Funds and exchange traded funds was 0.33% for the year ended December 31, 2019.
eBenefit of expense reduction rounds to less than 0.01%.
| | | | |
franklintempleton.com | | The accompanying notes are an integral part of these financial statements. | Annual Report | | 61 |
FRANKLIN FUND ALLOCATOR SERIES
FINANCIAL HIGHLIGHTS
Franklin LifeSmart™ Retirement Income Fund(continued)
| | | | | | | | | | | | | | | | | | | | |
| | | Year Ended December 31, | |
| | | 2019 | | | 2018 | | | 2017 | | | 2016 | | | 2015 | |
| | | | | |
Class R6 | | | | | | | | | | | | | | | | | | | | |
| | | | | |
Per share operating performance | | | | | | | | | | | | | | | | | | | | |
(for a share outstanding throughout the year) | | | | | | | | | | | | | | | | | | | | |
| | | | | |
Net asset value, beginning of year | | | $10.40 | | | | $11.11 | | | | $11.01 | | | | $10.82 | | | | $11.72 | |
| | | | | |
Income from investment operationsa: | | | | | | | | | | | | | | | | | | | | |
| | | | | |
Net investment incomeb,c | | | 0.47 | | | | 0.54 | | | | 0.47 | | | | 0.30 | | | | 0.31 | |
| | | | | |
Net realized and unrealized gains (losses) | | | 0.78 | | | | (0.78 | ) | | | 0.10 | | | | 0.29 | | | | (0.57 | ) |
| | | | | |
Total from investment operations | | | 1.25 | | | | (0.24 | ) | | | 0.57 | | | | 0.59 | | | | (0.26 | ) |
| | | | | |
Less distributions from: | | | | | | | | | | | | | | | | | | | | |
| | | | | |
Net investment income | | | (0.45 | ) | | | (0.47 | ) | | | (0.47 | ) | | | (0.31 | ) | | | (0.31 | ) |
| | | | | |
Net realized gains | | | — | | | | — | | | | — | | | | (0.05 | ) | | | (0.33 | ) |
| | | | | |
Tax return of capital | | | — | | | | — | | | | — | | | | (0.04 | ) | | | — | |
| | | | | |
Total distributions | | | (0.45 | ) | | | (0.47 | ) | | | (0.47 | ) | | | (0.40 | ) | | | (0.64 | ) |
| | | | | |
Net asset value, end of year | | | $11.20 | | | | $10.40 | | | | $11.11 | | | | $11.01 | | | | $10.82 | |
| | | | | |
Total return | | | 12.20% | | | | (2.16)% | | | | 5.14% | | | | 5.60% | | | | (2.34)% | |
| | | | | |
Ratios to average net assets | | | | | | | | | | | | | | | | | | | | |
| | | | | |
Expenses before waiver and payments by affiliatesd | | | 0.59% | | | | 0.54% | | | | 0.52% | | | | 0.55% | | | | 0.53% | |
| | | | | |
Expenses net of waiver and payments by affiliatesd | | | —% | e | | | —% | e | | | —% | e | | | —% | | | | —% | |
| | | | | |
Net investment incomec | | | 4.21% | | | | 4.93% | | | | 4.19% | | | | 2.80% | | | | 2.60% | |
| | | | | |
Supplemental data | | | | | | | | | | | | | | | | | | | | |
| | | | | |
Net assets, end of year (000’s) | | | $2,043 | | | | $1,798 | | | | $4,031 | | | | $3,930 | | | | $6,828 | |
| | | | | |
Portfolio turnover rate | | | 82.72% | | | | 46.27% | | | | 28.12% | | | | 149.53% | | | | 38.48% | |
aThe amount shown for a share outstanding throughout the period may not correlate with the Statement of Operations for the period due to the timing of sales and repurchases of the Fund’s shares in relation to income earned and/or fluctuating fair value of the investments of the Fund.
bBased on average daily shares outstanding.
cRecognition of net investment income by the Fund is affected by the timing of declaration of dividends by the Underlying Funds and exchange traded funds in which the Fund invests.
dDoes not include expenses of the Underlying Funds and exchange traded funds in which the Fund invests. The weighted average indirect expenses of the Underlying Funds and exchange traded funds was 0.33% for the year ended December 31, 2019.
eBenefit of expense reduction rounds to less than 0.01%.
| | | | |
| | | |
62 | | Annual Report | The accompanying notes are an integral part of these financial statements. | | franklintempleton.com |
FRANKLIN FUND ALLOCATOR SERIES
FINANCIAL HIGHLIGHTS
Franklin LifeSmart™ Retirement Income Fund(continued)
| | | | | | | | | | | | | | | | | | | | |
| | | Year Ended December 31, | |
| | | 2019 | | | 2018 | | | 2017 | | | 2016 | | | 2015 | |
| | | | | |
Advisor Class | | | | | | | | | | | | | | | | | | | | |
| | | | | |
Per share operating performance | | | | | | | | | | | | | | | | | | | | |
(for a share outstanding throughout the year) | | | | | | | | | | | | | | | | | | | | |
| | | | | |
Net asset value, beginning of year | | | $10.39 | | | | $11.10 | | | | $11.00 | | | | $10.81 | | | | $11.71 | |
| | | | | |
Income from investment operationsa: | | | | | | | | | | | | | | | | | | | | |
| | | | | |
Net investment incomeb,c | | | 0.46 | | | | 0.53 | | | | 0.46 | | | | 0.29 | | | | 0.25 | |
| | | | | |
Net realized and unrealized gains (losses) | | | 0.79 | | | | (0.77 | ) | | | 0.10 | | | | 0.29 | | | | (0.52 | ) |
| | | | | |
Total from investment operations | | | 1.25 | | | | (0.24 | ) | | | 0.56 | | | | 0.58 | | | | (0.27 | ) |
| | | | | |
Less distributions from: | | | | | | | | | | | | | | | | | | | | |
| | | | | |
Net investment income | | | (0.45 | ) | | | (0.47 | ) | | | (0.46 | ) | | | (0.30 | ) | | | (0.30 | ) |
| | | | | |
Net realized gains | | | — | | | | — | | | | — | | | | (0.05 | ) | | | (0.33 | ) |
| | | | | |
Tax return of capital | | | — | | | | — | | | | — | | | | (0.04 | ) | | | — | |
| | | | | |
Total distributions | | | (0.45 | ) | | | (0.47 | ) | | | (0.46 | ) | | | (0.39 | ) | | | (0.63 | ) |
| | | | | |
Net asset value, end of year | | | $11.19 | | | | $10.39 | | | | $11.10 | | | | $11.00 | | | | $10.81 | |
| | | | | |
Total return | | | 12.16% | | | | (2.21)% | | | | 5.09% | | | | 5.55% | | | | (2.40)% | |
| | | | | |
Ratios to average net assets | | | | | | | | | | | | | | | | | | | | |
| | | | | |
Expenses before waiver and payments by affiliatesd | | | 0.70% | | | | 0.65% | | | | 0.67% | | | | 0.65% | | | | 0.64% | |
| | | | | |
Expenses net of waiver and payments by affiliatesd | | | 0.05% | e | | | 0.05% | e | | | 0.05% | e | | | 0.05% | | | | 0.05% | |
| | | | | |
Net investment incomec | | | 4.16% | | | | 4.88% | | | | 4.14% | | | | 2.75% | | | | 2.55% | |
| | | | | |
Supplemental data | | | | | | | | | | | | | | | | | | | | |
| | | | | |
Net assets, end of year (000’s) | | | $1,875 | | | | $1,409 | | | | $2,122 | | | | $1,696 | | | | $880 | |
| | | | | |
Portfolio turnover rate | | | 82.72% | | | | 46.27% | | | | 28.12% | | | | 149.53% | | | | 38.48% | |
aThe amount shown for a share outstanding throughout the period may not correlate with the Statement of Operations for the period due to the timing of sales and repurchases of the Fund’s shares in relation to income earned and/or fluctuating fair value of the investments of the Fund.
bBased on average daily shares outstanding.
cRecognition of net investment income by the Fund is affected by the timing of declaration of dividends by the Underlying Funds and exchange traded funds in which the Fund invests.
dDoes not include expenses of the Underlying Funds and exchange traded funds in which the Fund invests. The weighted average indirect expenses of the Underlying Funds and exchange traded funds was 0.33% for the year ended December 31, 2019.
eBenefit of expense reduction rounds to less than 0.01%.
| | | | |
franklintempleton.com | | The accompanying notes are an integral part of these financial statements. | Annual Report | | 63 |
FRANKLIN FUND ALLOCATOR SERIES
Statement of Investments, December 31, 2019
Franklin LifeSmart™ Retirement Income Fund
| | | | | | | | |
| | | Shares | | | Value | |
| | |
Investments in Underlying Funds and Exchange Traded Funds 88.6% | | | | | | | | |
| | |
Domestic Equity 10.1% | | | | | | | | |
aFranklin LibertyQ U.S. Equity ETF | | | 148,348 | | | $ | 5,190,696 | |
| | | | | | | | |
| | |
Domestic Fixed Income 54.7% | | | | | | | | |
aFranklin Liberty U.S. Core Bond ETF | | | 404,681 | | | | 10,153,406 | |
aFranklin U.S. Government Securities Fund, Class R6 | | | 1,686,075 | | | | 10,217,615 | |
iShares Core U.S. Aggregate Bond ETF | | | 45,240 | | | | 5,083,619 | |
Vanguard Intermediate-Term Corporate Bond ETF | | | 27,878 | | | | 2,546,098 | |
| | | | | | | | |
| | |
| | | | | | | 28,000,738 | |
| | | | | | | | |
| | |
Domestic Hybrid 20.2% | | | | | | | | |
aFranklin Income Fund, Class R6 | | | 4,438,264 | | | | 10,341,156 | |
| | | | | | | | |
| | |
Foreign Fixed Income 3.6% | | | | | | | | |
aTempleton Global Total Return Fund, Class R6 | | | 164,278 | | | | 1,821,838 | |
| | | | | | | | |
| | |
Total Investments in Underlying Funds and Exchange Traded Funds
(Cost $43,615,035) | | | | | | | 45,354,428 | |
| | | | | | | | |
| | |
| | | Units | | | | |
| | |
bIndex-Linked Notes 9.9% | | | | | | | | |
cCredit Suisse AG, senior note, 8.16%, 2/08/21 | | | 800 | | | | 2,471,688 | |
c,dUBS AG London Branch, senior note, 144A, 7.008%, 5/07/21 | | | 2,500 | | | | 2,594,575 | |
| | | | | | | | |
| | |
Total Index-Linked Notes (Cost $4,911,640) | | | | | | | 5,066,263 | |
| | | | | | | | |
| | |
Total Investments before Short Term Investments (Cost $48,526,675) | | | | | | | 50,420,691 | |
| | | | | | | | |
| | |
| | | Shares | | | | |
| | |
Short Term Investments (Cost $870,194) 1.7% | | | | | | | | |
| | |
Money Market Funds 1.7% | | | | | | | | |
a,eInstitutional Fiduciary Trust Money Market Portfolio, 1.26% | | | 870,194 | | | | 870,194 | |
| | | | | | | | |
| | |
Total Investments (Cost $49,396,869) 100.2% | | | | | | | 51,290,885 | |
| | |
Other Assets, less Liabilities (0.2)% | | | | | | | (106,102 | ) |
| | | | | | | | |
| | |
Net Assets 100.0% | | | | | | $ | 51,184,783 | |
| | | | | | | | |
See Abbreviations on page 162.
aSee Note 3(f) regarding investments in FT Underlying Funds.
bSee Note 1(c) regarding index-linked notes.
cSecurity pays variable interest based on the distributions of the strategy index and proceeds earned from related equity derivatives. The coupon rate shown represents the combined rate at period end. Cash payment at maturity or upon early redemption is based on the performance of the strategy index.
dSecurity was purchased pursuant to Rule 144A under the Securities Act of 1933 and may be sold in transactions exempt from registration only to qualified institutional buyers or in a public offering registered under the Securities Act of 1933. At December 31, 2019, the value of this security was $2,594,575, representing 5.1% of net assets.
eThe rate shown is the annualizedseven-day effective yield at period end.
| | | | | | |
| | | |
64 | | Annual Report | The accompanying notes are an integral part of these financial statements. | | franklintempleton.com |
FRANKLIN FUND ALLOCATOR SERIES
Financial Highlights
Franklin LifeSmart™ 2020 Retirement Target Fund
| | | | | | | | | | | | | | | | | | | | |
| | | Year Ended December 31, | |
| | | 2019 | | | 2018 | | | 2017 | | | 2016 | | | 2015 | |
| | | | | |
Class A | | | | | | | | | | | | | | | | | | | | |
| | | | | |
Per share operating performance | | | | | | | | | | | | | | | | | | | | |
(for a share outstanding throughout the year) | | | | | | | | | | | | | | | | | | | | |
| | | | | |
Net asset value, beginning of year | | | $11.00 | | | | $11.76 | | | | $10.68 | | | | $10.61 | | | | $11.14 | |
| | | | | |
Income from investment operationsa: | | | | | | | | | | | | | | | | | | | | |
| | | | | |
Net investment incomeb,c | | | 0.29 | | | | 0.35 | | | | 0.18 | | | | 0.13 | | | | 0.24 | |
| | | | | |
Net realized and unrealized gains (losses) | | | 1.18 | | | | (0.79 | ) | | | 1.05 | | | | 0.19 | | | | (0.48 | ) |
| | | | | |
Total from investment operations | | | 1.47 | | | | (0.44 | ) | | | 1.23 | | | | 0.32 | | | | (0.24 | ) |
| | | | | |
Less distributions from: | | | | | | | | | | | | | | | | | | | | |
| | | | | |
Net investment income | | | (0.30 | ) | | | (0.32 | ) | | | (0.15 | ) | | | (0.17 | ) | | | (0.19 | ) |
| | | | | |
Net realized gains | | | — | | | | — | | | | — | | | | (0.08 | ) | | | (0.10 | ) |
| | | | | |
Total distributions | | | (0.30 | ) | | | (0.32 | ) | | | (0.15 | ) | | | (0.25 | ) | | | (0.29 | ) |
| | | | | |
Net asset value, end of year | | | $12.17 | | | | $11.00 | | | | $11.76 | | | | $10.68 | | | | $10.61 | |
| | | | | |
Total returnd | | | 13.43% | | | | (3.78)% | | | | 11.53% | | | | 3.03% | | | | (2.18)% | |
| | | | | |
Ratios to average net assets | | | | | | | | | | | | | | | | | | | | |
| | | | | |
Expenses before waiver and payments by affiliatese | | | 0.97% | | | | 0.94% | | | | 1.02% | | | | 0.98% | | | | 1.05% | |
| | | | | |
Expenses net of waiver and payments by affiliatese | | | 0.35% | | | | 0.30% | | | | 0.30% | | | | 0.30% | | | | 0.32% | |
| | | | | |
Net investment incomec | | | 2.47% | | | | 2.92% | | | | 1.58% | | | | 1.25% | | | | 2.06% | |
| | | | | |
Supplemental data | | | | | | | | | | | | | | | | | | | | |
| | | | | |
Net assets, end of year (000’s) | | | $27,016 | | | | $24,108 | | | | $20,289 | | | | $19,292 | | | | $19,895 | |
| | | | | |
Portfolio turnover rate | | | 120.35% | | | | 57.42% | | | | 47.93% | | | | 87.38% | | | | 47.51% | |
aThe amount shown for a share outstanding throughout the period may not correlate with the Statement of Operations for the period due to the timing of sales and repurchases of the Fund’s shares in relation to income earned and/or fluctuating fair value of the investments of the Fund.
bBased on average daily shares outstanding.
cRecognition of net investment income by the Fund is affected by the timing of declaration of dividends by the Underlying Funds and exchange traded funds in which the Fund invests.
dTotal return does not reflect sales commissions or contingent deferred sales charges, if applicable.
eDoes not include expenses of the Underlying Funds and exchange traded funds in which the Fund invests. The weighted average indirect expenses of the Underlying Funds and exchange traded funds was 0.36% for the year ended December 31, 2019.
| | | | |
franklintempleton.com | | The accompanying notes are an integral part of these financial statements. | Annual Report | | 65 |
FRANKLIN FUND ALLOCATOR SERIES
FINANCIAL HIGHLIGHTS
Franklin LifeSmart™ 2020 Retirement Target Fund(continued)
| | | | | | | | | | | | | | | | | | | | |
| | | Year Ended December 31, | |
| | | 2019 | | | 2018 | | | 2017 | | | 2016 | | | 2015 | |
| | | | | |
Class C | | | | | | | | | | | | | | | | | | | | |
| | | | | |
Per share operating performance | | | | | | | | | | | | | | | | | | | | |
(for a share outstanding throughout the year) | | | | | | | | | | | | | | | | | | | | |
| | | | | |
Net asset value, beginning of year | | | $10.93 | | | | $11.69 | | | | $10.62 | | | | $10.56 | | | | $11.08 | |
| | | | | |
Income from investment operationsa: | | | | | | | | | | | | | | | | | | | | |
| | | | | |
Net investment incomeb,c | | | 0.20 | | | | 0.24 | | | | 0.10 | | | | 0.05 | | | | 0.14 | |
| | | | | |
Net realized and unrealized gains (losses) | | | 1.17 | | | | (0.76 | ) | | | 1.03 | | | | 0.18 | | | | (0.44 | ) |
| | | | | |
Total from investment operations | | | 1.37 | | | | (0.52 | ) | | | 1.13 | | | | 0.23 | | | | (0.30 | ) |
| | | | | |
Less distributions from: | | | | | | | | | | | | | | | | | | | | |
| | | | | |
Net investment income | | | (0.21 | ) | | | (0.24 | ) | | | (0.06 | ) | | | (0.09 | ) | | | (0.12 | ) |
| | | | | |
Net realized gains | | | — | | | | — | | | | — | | | | (0.08 | ) | | | (0.10 | ) |
| | | | | |
Total distributions | | | (0.21 | ) | | | (0.24 | ) | | | (0.06 | ) | | | (0.17 | ) | | | (0.22 | ) |
| | | | | |
Net asset value, end of year | | | $12.09 | | | | $10.93 | | | | $11.69 | | | | $10.62 | | | | $10.56 | |
| | | | | |
Total returnd | | | 12.59% | | | | (4.53)% | | | | 10.69% | | | | 2.29% | | | | (2.84)% | |
| | | | | |
Ratios to average net assets | | | | | | | | | | | | | | | | | | | | |
| | | | | |
Expenses before waiver and payments by affiliatese | | | 1.72% | | | | 1.69% | | | | 1.77% | | | | 1.73% | | | | 1.78% | |
| | | | | |
Expenses net of waiver and payments by affiliatese | | | 1.10% | | | | 1.05% | | | | 1.05% | | | | 1.05% | | | | 1.05% | |
| | | | | |
Net investment incomec | | | 1.72% | | | | 2.17% | | | | 0.83% | | | | 0.50% | | | | 1.33% | |
| | | | | |
Supplemental data | | | | | | | | | | | | | | | | | | | | |
| | | | | |
Net assets, end of year (000’s) | | | $6,811 | | | | $6,364 | | | | $6,287 | | | | $5,138 | | | | $5,221 | |
| | | | | |
Portfolio turnover rate | | | 120.35% | | | | 57.42% | | | | 47.93% | | | | 87.38% | | | | 47.51% | |
aThe amount shown for a share outstanding throughout the period may not correlate with the Statement of Operations for the period due to the timing of sales and repurchases of the Fund’s shares in relation to income earned and/or fluctuating fair value of the investments of the Fund.
bBased on average daily shares outstanding.
cRecognition of net investment income by the Fund is affected by the timing of declaration of dividends by the Underlying Funds and exchange traded funds in which the Fund invests.
dTotal return does not reflect sales commissions or contingent deferred sales charges, if applicable.
eDoes not include expenses of the Underlying Funds and exchange traded funds in which the Fund invests. The weighted average indirect expenses of the Underlying Funds and exchange traded funds was 0.36% for the year ended December 31, 2019.
| | | | |
| | | |
66 | | Annual Report | The accompanying notes are an integral part of these financial statements. | | franklintempleton.com |
FRANKLIN FUND ALLOCATOR SERIES
FINANCIAL HIGHLIGHTS
Franklin LifeSmart™ 2020 Retirement Target Fund(continued)
| | | | | | | | | | | | | | | | | | | | |
| | | Year Ended December 31, | |
| | | 2019 | | | 2018 | | | 2017 | | | 2016 | | | 2015 | |
| | | | | |
Class R | | | | | | | | | | | | | | | | | | | | |
| | | | | |
Per share operating performance | | | | | | | | | | | | | | | | | | | | |
(for a share outstanding throughout the year) | | | | | | | | | | | | | | | | | | | | |
| | | | | |
Net asset value, beginning of year | | | $10.99 | | | | $11.75 | | | | $10.66 | | | | $10.59 | | | | $11.12 | |
| | | | | |
Income from investment operationsa: | | | | | | | | | | | | | | | | | | | | |
| | | | | |
Net investment incomeb,c | | | 0.26 | | | | 0.29 | | | | 0.12 | | | | 0.10 | | | | 0.35 | |
| | | | | |
Net realized and unrealized gains (losses) | | | 1.17 | | | | (0.76 | ) | | | 1.08 | | | | 0.18 | | | | (0.61 | ) |
| | | | | |
Total from investment operations | | | 1.43 | | | | (0.47 | ) | | | 1.20 | | | | 0.28 | | | | (0.26 | ) |
| | | | | |
Less distributions from: | | | | | | | | | | | | | | | | | | | | |
| | | | | |
Net investment income | | | (0.26 | ) | | | (0.29 | ) | | | (0.11 | ) | | | (0.13 | ) | | | (0.17 | ) |
| | | | | |
Net realized gains | | | — | | | | — | | | | — | | | | (0.08 | ) | | | (0.10 | ) |
| | | | | |
Total distributions | | | (0.26 | ) | | | (0.29 | ) | | | (0.11 | ) | | | (0.21 | ) | | | (0.27 | ) |
| | | | | |
Net asset value, end of year | | | $12.16 | | | | $10.99 | | | | $11.75 | | | | $10.66 | | | | $10.59 | |
| | | | | |
Total return | | | 13.25% | | | | (4.14)% | | | | 11.26% | | | | 2.74% | | | | (2.35)% | |
| | | | | |
Ratios to average net assets | | | | | | | | | | | | | | | | | | | | |
| | | | | |
Expenses before waiver and payments by affiliatesd | | | 1.22% | | | | 1.19% | | | | 1.27% | | | | 1.23% | | | | 1.28% | |
| | | | | |
Expenses net of waiver and payments by affiliatesd | | | 0.60% | | | | 0.55% | | | | 0.55% | | | | 0.55% | | | | 0.55% | |
| | | | | |
Net investment incomec | | | 2.22% | | | | 2.67% | | | | 1.33% | | | | 1.00% | | | | 1.83% | |
| | | | | |
Supplemental data | | | | | | | | | | | | | | | | | | | | |
| | | | | |
Net assets, end of year (000’s) | | | $745 | | | | $767 | | | | $969 | | | | $3,145 | | | | $3,189 | |
| | | | | |
Portfolio turnover rate | | | 120.35% | | | | 57.42% | | | | 47.93% | | | | 87.38% | | | | 47.51% | |
aThe amount shown for a share outstanding throughout the period may not correlate with the Statement of Operations for the period due to the timing of sales and repurchases of the Fund’s shares in relation to income earned and/or fluctuating fair value of the investments of the Fund.
bBased on average daily shares outstanding.
cRecognition of net investment income by the Fund is affected by the timing of declaration of dividends by the Underlying Funds and exchange traded funds in which the Fund invests.
dDoes not include expenses of the Underlying Funds and exchange traded funds in which the Fund invests. The weighted average indirect expenses of the Underlying Funds and exchange traded funds was 0.36% for the year ended December 31, 2019.
| | | | |
franklintempleton.com | | The accompanying notes are an integral part of these financial statements. | Annual Report | | 67 |
FRANKLIN FUND ALLOCATOR SERIES
FINANCIAL HIGHLIGHTS
Franklin LifeSmart™ 2020 Retirement Target Fund(continued)
| | | | | | | | | | | | | | | | | | | | |
| | | Year Ended December 31, | |
| | | 2019 | | | 2018 | | | 2017 | | | 2016 | | | 2015 | |
| | | | | |
Class R6 | | | | | | | | | | | | | | | | | | | | |
| | | | | |
Per share operating performance | | | | | | | | | | | | | | | | | | | | |
(for a share outstanding throughout the year) | | | | | | | | | | | | | | | | | | | | |
| | | | | |
Net asset value, beginning of year | | | $11.02 | | | | $11.79 | | | | $10.70 | | | | $10.64 | | | | $11.15 | |
| | | | | |
Income from investment operationsa: | | | | | | | | | | | | | | | | | | | | |
| | | | | |
Net investment incomeb,c | | | 0.32 | | | | 0.37 | | | | 0.21 | | | | 0.17 | | | | 0.23 | |
| | | | | |
Net realized and unrealized gains (losses) | | | 1.19 | | | | (0.78 | ) | | | 1.06 | | | | 0.17 | | | | (0.42 | ) |
| | | | | |
Total from investment operations | | | 1.51 | | | | (0.41 | ) | | | 1.27 | | | | 0.34 | | | | (0.19 | ) |
| | | | | |
Less distributions from: | | | | | | | | | | | | | | | | | | | | |
| | | | | |
Net investment income | | | (0.33 | ) | | | (0.36 | ) | | | (0.18 | ) | | | (0.20 | ) | | | (0.22 | ) |
| | | | | |
Net realized gains | | | — | | | | — | | | | — | | | | (0.08 | ) | | | (0.10 | ) |
| | | | | |
Total distributions | | | (0.33 | ) | | | (0.36 | ) | | | (0.18 | ) | | | (0.28 | ) | | | (0.32 | ) |
| | | | | |
Net asset value, end of year | | | $12.20 | | | | $11.02 | | | | $11.79 | | | | $10.70 | | | | $10.64 | |
| | | | | |
Total return | | | 13.83% | | | | (3.57)% | | | | 11.93% | | | | 3.33% | | | | (1.80)% | |
| | | | | |
Ratios to average net assets | | | | | | | | | | | | | | | | | | | | |
| | | | | |
Expenses before waiver and payments by affiliatesd | | | 0.60% | | | | 0.58% | | | | 0.59% | | | | 0.57% | | | | 0.66% | |
| | | | | |
Expenses net of waiver and payments by affiliatesd | | | 0.05% | | | | —% | | | | —% | | | | —% | | | | —% | |
| | | | | |
Net investment incomec | | | 2.77% | | | | 3.22% | | | | 1.88% | | | | 1.55% | | | | 2.38% | |
| | | | | |
Supplemental data | | | | | | | | | | | | | | | | | | | | |
| | | | | |
Net assets, end of year (000’s) | | | $7,429 | | | | $8,562 | | | | $8,831 | | | | $6,670 | | | | $6,751 | |
| | | | | |
Portfolio turnover rate | | | 120.35% | | | | 57.42% | | | | 47.93% | | | | 87.38% | | | | 47.51% | |
aThe amount shown for a share outstanding throughout the period may not correlate with the Statement of Operations for the period due to the timing of sales and repurchases of the Fund’s shares in relation to income earned and/or fluctuating fair value of the investments of the Fund.
bBased on average daily shares outstanding.
cRecognition of net investment income by the Fund is affected by the timing of declaration of dividends by the Underlying Funds and exchange traded funds in which the Fund invests.
dDoes not include expenses of the Underlying Funds and exchange traded funds in which the Fund invests. The weighted average indirect expenses of the Underlying Funds and exchange traded funds was 0.36% for the year ended December 31, 2019.
| | | | |
| | | |
68 | | Annual Report | The accompanying notes are an integral part of these financial statements. | | franklintempleton.com |
FRANKLIN FUND ALLOCATOR SERIES
FINANCIAL HIGHLIGHTS
Franklin LifeSmart™ 2020 Retirement Target Fund(continued)
| | | | | | | | | | | | | | | | | | | | |
| | | Year Ended December 31, | |
| | | 2019 | | | 2018 | | | 2017 | | | 2016 | | | 2015 | |
| | | | | |
Advisor Class | | | | | | | | | | | | | | | | | | | | |
| | | | | |
Per share operating performance | | | | | | | | | | | | | | | | | | | | |
(for a share outstanding throughout the year) | | | | | | | | | | | | | | | | | | | | |
| | | | | |
Net asset value, beginning of year | | | $11.03 | | | | $11.79 | | | | $10.70 | | | | $10.63 | | | | $11.15 | |
| | | | | |
Income from investment operationsa: | | | | | | | | | | | | | | | | | | | | |
| | | | | |
Net investment incomeb,c | | | 0.32 | | | | 0.35 | | | | 0.23 | | | | 0.16 | | | | 0.25 | |
| | | | | |
Net realized and unrealized gains (losses) | | | 1.17 | | | | (0.76 | ) | | | 1.04 | | | | 0.18 | | | | (0.45 | ) |
| | | | | |
Total from investment operations | | | 1.49 | | | | (0.41 | ) | | | 1.27 | | | | 0.34 | | | | (0.20 | ) |
| | | | | |
Less distributions from: | | | | | | | | | | | | | | | | | | | | |
| | | | | |
Net investment income | | | (0.32 | ) | | | (0.35 | ) | | | (0.18 | ) | | | (0.19 | ) | | | (0.22 | ) |
| | | | | |
Net realized gains | | | — | | | | — | | | | — | | | | (0.08 | ) | | | (0.10 | ) |
| | | | | |
Total distributions | | | (0.32 | ) | | | (0.35 | ) | | | (0.18 | ) | | | (0.27 | ) | | | (0.32 | ) |
| | | | | |
Net asset value, end of year | | | $12.20 | | | | $11.03 | | | | $11.79 | | | | $10.70 | | | | $10.63 | |
| | | | | |
Total return | | | 13.77% | | | | (3.62)% | | | | 11.88% | | | | 3.28% | | | | (1.85)% | |
| | | | | |
Ratios to average net assets | | | | | | | | | | | | | | | | | | | | |
| | | | | |
Expenses before waiver and payments by affiliatesd | | | 0.72% | | | | 0.69% | | | | 0.77% | | | | 0.73% | | | | 0.78% | |
| | | | | |
Expenses net of waiver and payments by affiliatesd | | | 0.10% | | | | 0.05% | | | | 0.05% | | | | 0.05% | | | | 0.05% | |
| | | | | |
Net investment incomec | | | 2.72% | | | | 3.17% | | | | 1.83% | | | | 1.50% | | | | 2.33% | |
| | | | | |
Supplemental data | | | | | | | | | | | | | | | | | | | | |
| | | | | |
Net assets, end of year (000’s) | | | $745 | | | | $637 | | | | $691 | | | | $317 | | | | $290 | |
| | | | | |
Portfolio turnover rate | | | 120.35% | | | | 57.42% | | | | 47.93% | | | | 87.38% | | | | 47.51% | |
aThe amount shown for a share outstanding throughout the period may not correlate with the Statement of Operations for the period due to the timing of sales and repurchases of the Fund’s shares in relation to income earned and/or fluctuating fair value of the investments of the Fund.
bBased on average daily shares outstanding.
cRecognition of net investment income by the Fund is affected by the timing of declaration of dividends by the Underlying Funds and exchange traded funds in which the Fund invests.
dDoes not include expenses of the Underlying Funds and exchange traded funds in which the Fund invests. The weighted average indirect expenses of the Underlying Funds and exchange traded funds was 0.36% for the year ended December 31, 2019.
| | | | |
franklintempleton.com | | The accompanying notes are an integral part of these financial statements. | Annual Report | | 69 |
FRANKLIN FUND ALLOCATOR SERIES
Statement of Investments, December 31, 2019
Franklin LifeSmart™ 2020 Retirement Target Fund
| | | | | | | | |
| | | Shares | | | Value | |
| | |
Investments in Underlying Funds and Exchange Traded Funds 98.8% | | | | | | | | |
| | |
Domestic Equity 32.5% | | | | | | | | |
aFranklin Growth Fund, Class R6 | | | 36,835 | | | $ | 4,136,520 | |
aFranklin LibertyQ U.S. Equity ETF | | | 109,854 | | | | 3,843,792 | |
aFranklin Rising Dividends Fund, Class R6 | | | 29,718 | | | | 2,066,897 | |
aFranklin U.S. Core Equity (IU) Fund | | | 329,300 | | | | 3,553,150 | |
Vanguard S&P 500 ETF | | | 968 | | | | 286,334 | |
| | | | | | | | |
| | |
| | | | | | | 13,886,693 | |
| | | | | | | | |
| | |
Domestic Fixed Income 45.1% | | | | | | | | |
aFranklin Liberty U.S. Core Bond ETF | | | 363,802 | | | | 9,127,756 | |
aFranklin Low Duration Total Return Fund, Class R6 | | | 379,764 | | | | 3,679,911 | |
iShares Core U.S. Aggregate Bond ETF | | | 35,776 | | | | 4,020,149 | |
Vanguard Intermediate-Term Corporate Bond ETF | | | 10,016 | | | | 914,761 | |
Vanguard Total International Bond ETF | | | 27,402 | | | | 1,550,405 | |
| | | | | | | | |
| | |
| | | | | | | 19,292,982 | |
| | | | | | | | |
| | |
Foreign Equity 16.1% | | | | | | | | |
aFranklin Emerging Market Core Equity (IU) Fund | | | 113,046 | | | | 1,235,597 | |
aFranklin FTSE Europe ETF | | | 19,077 | | | | 481,694 | |
aFranklin FTSE Japan ETF | | | 8,918 | | | | 233,206 | |
aFranklin International Core Equity (IU) Fund | | | 198,136 | | | | 2,199,303 | |
aFranklin International Growth Fund, Class R6 | | | 56,963 | | | | 948,429 | |
aFranklin LibertyQ Emerging Markets ETF | | | 27,339 | | | | 814,265 | |
aTempleton Foreign Fund, Class R6 | | | 132,509 | | | | 944,789 | |
| | | | | | | | |
| | |
| | | | | | | 6,857,283 | |
| | | | | | | | |
| | |
Foreign Fixed Income 5.1% | | | | | | | | |
aFranklin Liberty High Yield Corporate ETF | | | 21,230 | | | | 555,914 | |
aTempleton Global Total Return Fund, Class R6 | | | 146,460 | | | | 1,624,246 | |
| | | | | | | | |
| | |
| | | | | | | 2,180,160 | |
| | | | | | | | |
| | |
Total Investments in Underlying Funds and Exchange Traded Funds before Short Term Investments (Cost $38,686,914) | | | | | | | 42,217,118 | |
| | | | | | | | |
| | |
Short Term Investments 1.0% | | | | | | | | |
| | |
Money Market Funds (Cost $272,558) 0.6% | | | | | | | | |
a,bInstitutional Fiduciary Trust Money Market Portfolio, 1.26% | | | 272,558 | | | | 272,558 | |
| | | | | | | | |
| | | | |
| | | |
70 | | Annual Report | | franklintempleton.com |
FRANKLIN FUND ALLOCATOR SERIES
STATEMENT OF INVESTMENTS
Franklin LifeSmart™ 2020 Retirement Target Fund(continued)
| | | | | | | | |
| | | Principal
Amount | | | Value | |
| | |
Short Term Investments(continued) | | | | | | | | |
| | |
Repurchase Agreements (Cost $172,955) 0.4% | | | | | | | | |
cJoint Repurchase Agreement, 1.536%, 1/02/20 (Maturity Value $172,970) | | | | | | | | |
BNP Paribas Securities Corp. (Maturity Value $94,846) | | | | | | | | |
Deutsche Bank Securities Inc. (Maturity Value $30,701) | | | | | | | | |
HSBC Securities (USA) Inc. (Maturity Value $47,423) | | | | | | | | |
Collateralized by U.S. Treasury Notes, 1.375% - 2.75%, 9/30/20 - 10/31/24; and U.S. Treasury Notes, Index Linked, 0.125%, 1/15/23 (valued at $176,512) | | $ | 172,955 | | | $ | 172,955 | |
| | | | | | | | |
| | |
Total Investments (Cost $39,132,427) 99.8% | | | | | | | 42,662,631 | |
| | |
Other Assets, less Liabilities 0.2% | | | | | | | 84,853 | |
| | | | | | | | |
| | |
Net Assets 100.0% | | | | | | $ | 42,747,484 | |
| | | | | | | | |
See Abbreviations on page 162.
aSee Note 3(f) regarding investments in FT Underlying Funds.
bThe rate shown is the annualizedseven-day effective yield at period end.
cSee Note 1(b) regarding joint repurchase agreement.
| | | | | | |
franklintempleton.com | | The accompanying notes are an integral part of these financial statements. | | | Annual Report | | 71 |
FRANKLIN FUND ALLOCATOR SERIES
Financial Highlights
Franklin LifeSmart™ 2025 Retirement Target Fund
| | | | | | | | | | | | | | | | | | | | |
| | | Year Ended December 31, | |
| | | 2019 | | | 2018 | | | 2017 | | | 2016 | | | 2015 | |
| | | | | |
Class A | | | | | | | | | | | | | | | | | | | | |
| | | | | |
Per share operating performance | | | | | | | | | | | | | | | | | | | | |
(for a share outstanding throughout the year) | | | | | | | | | | | | | | | | | | | | |
| | | | | |
Net asset value, beginning of year | | | $11.52 | | | | $12.97 | | | | $11.49 | | | | $11.44 | | | | $12.36 | |
| | | | | |
Income from investment operationsa: | | | | | | | | | | | | | | | | | | | | |
| | | | | |
Net investment incomeb,c | | | 0.27 | | | | 0.32 | | | | 0.19 | | | | 0.14 | | | | 0.19 | |
| | | | | |
Net realized and unrealized gains (losses) | | | 1.66 | | | | (1.02 | ) | | | 1.52 | | | | 0.19 | | | | (0.43 | ) |
| | | | | |
Total from investment operations | | | 1.93 | | | | (0.70 | ) | | | 1.71 | | | | 0.33 | | | | (0.24 | ) |
| | | | | |
Less distributions from: | | | | | | | | | | | | | | | | | | | | |
| | | | | |
Net investment income and short term gains received from Underlying Funds and exchange traded funds | | | (0.28 | ) | | | (0.33 | ) | | | (0.23 | ) | | | (0.13 | ) | | | (0.19 | ) |
| | | | | |
Net realized gains | | | (0.19 | ) | | | (0.42 | ) | | | — | | | | (0.15 | ) | | | (0.49 | ) |
| | | | | |
Total distributions | | | (0.47 | ) | | | (0.75 | ) | | | (0.23 | ) | | | (0.28 | ) | | | (0.68 | ) |
| | | | | |
Net asset value, end of year | | | $12.98 | | | | $11.52 | | | | $12.97 | | | | $11.49 | | | | $11.44 | |
| | | | | |
Total returnd | | | 16.85% | | | | (5.46)% | | | | 14.95% | | | | 2.96% | | | | (2.08)% | |
| | | | | |
Ratios to average net assets | | | | | | | | | | | | | | | | | | | | |
| | | | | |
Expenses before waiver and payments by affiliatese | | | 0.80% | | | | 0.77% | | | | 0.80% | | | | 0.76% | | | | 0.77% | |
| | | | | |
Expenses net of waiver and payments by affiliatese | | | 0.35% | | | | 0.30% | f | | | 0.30% | | | | 0.30% | | | | 0.33% | |
| | | | | |
Net investment incomec | | | 2.15% | | | | 2.41% | | | | 1.52% | | | | 1.18% | | | | 1.52% | |
| | | | | |
Supplemental data | | | | | | | | | | | | | | | | | | | | |
| | | | | |
Net assets, end of year (000’s) | | | $86,084 | | | | $76,050 | | | | $77,510 | | | | $74,746 | | | | $72,625 | |
| | | | | |
Portfolio turnover rate | | | 84.18% | | | | 52.98% | | | | 34.08% | | | | 83.67% | | | | 36.22% | |
aThe amount shown for a share outstanding throughout the period may not correlate with the Statement of Operations for the period due to the timing of sales and repurchases of the Fund’s shares in relation to income earned and/or fluctuating fair value of the investments of the Fund.
bBased on average daily shares outstanding.
cRecognition of net investment income by the Fund is affected by the timing of declaration of dividends by the Underlying Funds and exchange traded funds in which the Fund invests.
dTotal return does not reflect sales commissions or contingent deferred sales charges, if applicable.
eDoes not include expenses of the Underlying Funds and exchange traded funds in which the Fund invests. The weighted average indirect expenses of the Underlying Funds and exchange traded funds was 0.37% for the year ended December 31, 2019.
fBenefit of expense reduction rounds to less than 0.01%.
| | | | |
| | | |
72 | | Annual Report | The accompanying notes are an integral part of these financial statements. | | franklintempleton.com |
FRANKLIN FUND ALLOCATOR SERIES
FINANCIAL HIGHLIGHTS
Franklin LifeSmart™ 2025 Retirement Target Fund(continued)
| | | | | | | | | | | | | | | | | | | | |
| | | Year Ended December 31, | |
| | | 2019 | | | 2018 | | | 2017 | | | 2016 | | | 2015 | |
| | | | | |
Class C | | | | | | | | | | | | | | | | | | | | |
| | | | | |
Per share operating performance | | | | | | | | | | | | | | | | | | | | |
(for a share outstanding throughout the year) | | | | | | | | | | | | | | | | | | | | |
| | | | | |
Net asset value, beginning of year | | | $11.34 | | | | $12.77 | | | | $11.32 | | | | $11.27 | | | | $12.18 | |
| | | | | |
Income from investment operationsa: | | | | | | | | | | | | | | | | | | | | |
| | | | | |
Net investment incomeb,c | | | 0.17 | | | | 0.20 | | | | 0.09 | | | | 0.05 | | | | 0.10 | |
| | | | | |
Net realized and unrealized gains (losses) | | | 1.62 | | | | (0.97 | ) | | | 1.50 | | | | 0.20 | | | | (0.42 | ) |
| | | | | |
Total from investment operations | | | 1.79 | | | | (0.77 | ) | | | 1.59 | | | | 0.25 | | | | (0.32 | ) |
| | | | | |
Less distributions from: | | | | | | | | | | | | | | | | | | | | |
| | | | | |
Net investment income and short term gains received from Underlying Funds and exchange traded funds | | | (0.18 | ) | | | (0.24 | ) | | | (0.14 | ) | | | (0.05 | ) | | | (0.10 | ) |
| | | | | |
Net realized gains | | | (0.19 | ) | | | (0.42 | ) | | | — | | | | (0.15 | ) | | | (0.49 | ) |
| | | | | |
Total distributions | | | (0.37 | ) | | | (0.66 | ) | | | (0.14 | ) | | | (0.20 | ) | | | (0.59 | ) |
| | | | | |
Net asset value, end of year | | | $12.76 | | | | $11.34 | | | | $12.77 | | | | $11.32 | | | | $11.27 | |
| | | | | |
Total returnd | | | 15.90% | | | | (6.12)% | | | | 14.06% | | | | 2.21% | | | | (2.74)% | |
| | | | | |
Ratios to average net assets | | | | | | | | | | | | | | | | | | | | |
| | | | | |
Expenses before waiver and payments by affiliatese | | | 1.55% | | | | 1.51% | | | | 1.55% | | | | 1.51% | | | | 1.49% | |
| | | | | |
Expenses net of waiver and payments by affiliatese | | | 1.10% | | | | 1.04% | f | | | 1.05% | | | | 1.05% | | | | 1.05% | |
| | | | | |
Net investment incomec | | | 1.40% | | | | 1.67% | | | | 0.77% | | | | 0.43% | | | | 0.80% | |
| | | | | |
Supplemental data | | | | | | | | | | | | | | | | | | | | |
| | | | | |
Net assets, end of year (000’s) | | | $23,450 | | | | $21,907 | | | | $27,301 | | | | $26,401 | | | | $29,425 | |
| | | | | |
Portfolio turnover rate | | | 84.18% | | | | 52.98% | | | | 34.08% | | | | 83.67% | | | | 36.22% | |
aThe amount shown for a share outstanding throughout the period may not correlate with the Statement of Operations for the period due to the timing of sales and repurchases of the Fund’s shares in relation to income earned and/or fluctuating fair value of the investments of the Fund.
bBased on average daily shares outstanding.
cRecognition of net investment income by the Fund is affected by the timing of declaration of dividends by the Underlying Funds and exchange traded funds in which the Fund invests.
dTotal return does not reflect sales commissions or contingent deferred sales charges, if applicable.
eDoes not include expenses of the Underlying Funds and exchange traded funds in which the Fund invests. The weighted average indirect expenses of the Underlying Funds and exchange traded funds was 0.37% for the year ended December 31, 2019.
fBenefit of expense reduction rounds to less than 0.01%.
| | | | |
franklintempleton.com | | The accompanying notes are an integral part of these financial statements. | Annual Report | | 73 |
FRANKLIN FUND ALLOCATOR SERIES
FINANCIAL HIGHLIGHTS
Franklin LifeSmart™ 2025 Retirement Target Fund(continued)
| | | | | | | | | | | | | | | | | | | | |
| | | Year Ended December 31, | |
| | | 2019 | | | 2018 | | | 2017 | | | 2016 | | | 2015 | |
| | | | | |
Class R | | | | | | | | | | | | | | | | | | | | |
| | | | | |
Per share operating performance | | | | | | | | | | | | | | | | | | | | |
(for a share outstanding throughout the year) | | | | | | | | | | | | | | | | | | | | |
| | | | | |
Net asset value, beginning of year | | | $11.48 | | | | $12.93 | | | | $11.44 | | | | $11.40 | | | | $12.31 | |
| | | | | |
Income from investment operationsa: | | | | | | | | | | | | | | | | | | | | |
| | | | | |
Net investment incomeb,c | | | 0.23 | | | | 0.26 | | | | 0.14 | | | | 0.11 | | | | 0.17 | |
| | | | | |
Net realized and unrealized gains (losses) | | | 1.65 | | | | (0.99 | ) | | | 1.54 | | | | 0.19 | | | | (0.42 | ) |
| | | | | |
Total from investment operations | | | 1.88 | | | | (0.73 | ) | | | 1.68 | | | | 0.30 | | | | (0.25 | ) |
| | | | | |
Less distributions from: | | | | | | | | | | | | | | | | | | | | |
| | | | | |
Net investment income and short term gains received from Underlying Funds and exchange traded funds | | | (0.24 | ) | | | (0.30 | ) | | | (0.19 | ) | | | (0.11 | ) | | | (0.17 | ) |
| | | | | |
Net realized gains | | | (0.19 | ) | | | (0.42 | ) | | | — | | | | (0.15 | ) | | | (0.49 | ) |
| | | | | |
Total distributions | | | (0.43 | ) | | | (0.72 | ) | | | (0.19 | ) | | | (0.26 | ) | | | (0.66 | ) |
| | | | | |
Net asset value, end of year | | | $12.93 | | | | $11.48 | | | | $12.93 | | | | $11.44 | | | | $11.40 | |
| | | | | |
Total return | | | 16.52% | | | | (5.73)% | | | | 14.73% | | | | 2.65% | | | | (2.20)% | |
| | | | | |
Ratios to average net assets | | | | | | | | | | | | | | | | | | | | |
| | | | | |
Expenses before waiver and payments by affiliatesd | | | 1.05% | | | | 1.02% | | | | 1.05% | | | | 1.01% | | | | 0.99% | |
| | | | | |
Expenses net of waiver and payments by affiliatesd | | | 0.60% | | | | 0.55% | e | | | 0.55% | | | | 0.55% | | | | 0.55% | |
| | | | | |
Net investment incomec | | | 1.90% | | | | 2.16% | | | | 1.27% | | | | 0.93% | | | | 1.30% | |
| | | | | |
Supplemental data | | | | | | | | | | | | | | | | | | | | |
| | | | | |
Net assets, end of year (000’s) | | | $3,930 | | | | $4,510 | | | | $6,166 | | | | $7,411 | | | | $6,062 | |
| | | | | |
Portfolio turnover rate | | | 84.18% | | | | 52.98% | | | | 34.08% | | | | 83.67% | | | | 36.22% | |
aThe amount shown for a share outstanding throughout the period may not correlate with the Statement of Operations for the period due to the timing of sales and repurchases of the Fund’s shares in relation to income earned and/or fluctuating fair value of the investments of the Fund.
bBased on average daily shares outstanding.
cRecognition of net investment income by the Fund is affected by the timing of declaration of dividends by the Underlying Funds and exchange traded funds in which the Fund invests.
dDoes not include expenses of the Underlying Funds and exchange traded funds in which the Fund invests. The weighted average indirect expenses of the Underlying Funds and exchange traded funds was 0.37% for the year ended December 31, 2019.
eBenefit of expense reduction rounds to less than 0.01%.
| | | | |
| | | |
74 | | Annual Report | The accompanying notes are an integral part of these financial statements. | | franklintempleton.com |
FRANKLIN FUND ALLOCATOR SERIES
FINANCIAL HIGHLIGHTS
Franklin LifeSmart™ 2025 Retirement Target Fund(continued)
| | | | | | | | | | | | | | | | | | | | |
| | | Year Ended December 31, | |
| | | 2019 | | | 2018 | | | 2017 | | | 2016 | | | 2015 | |
| | | | | |
Class R6 | | | | | | | | | | | | | | | | | | | | |
| | | | | |
Per share operating performance | | | | | | | | | | | | | | | | | | | | |
(for a share outstanding throughout the year) | | | | | | | | | | | | | | | | | | | | |
| | | | | |
Net asset value, beginning of year | | | $11.56 | | | | $13.01 | | | | $11.52 | | | | $11.47 | | | | $12.39 | |
| | | | | |
Income from investment operationsa: | | | | | | | | | | | | | | | | | | | | |
| | | | | |
Net investment incomeb,c | | | 0.31 | | | | 0.34 | | | | 0.23 | | | | 0.17 | | | | 0.24 | |
| | | | | |
Net realized and unrealized gains (losses) | | | 1.65 | | | | (1.00 | ) | | | 1.53 | | | | 0.20 | | | | (0.44 | ) |
| | | | | |
Total from investment operations | | | 1.96 | | | | (0.66 | ) | | | 1.76 | | | | 0.37 | | | | (0.20 | ) |
| | | | | |
Less distributions from: | | | | | | | | | | | | | | | | | | | | |
| | | | | |
Net investment income and short term gains received from Underlying Funds and exchange traded funds | | | (0.31 | ) | | | (0.37 | ) | | | (0.27 | ) | | | (0.17 | ) | | | (0.23 | ) |
| | | | | |
Net realized gains | | | (0.19 | ) | | | (0.42 | ) | | | — | | | | (0.15 | ) | | | (0.49 | ) |
| | | | | |
Total distributions | | | (0.50 | ) | | | (0.79 | ) | | | (0.27 | ) | | | (0.32 | ) | | | (0.72 | ) |
| | | | | |
Net asset value, end of year | | | $13.02 | | | | $11.56 | | | | $13.01 | | | | $11.52 | | | | $11.47 | |
| | | | | |
Total return | | | 17.14% | | | | (5.15)% | | | | 15.34% | | | | 3.24% | | | | (1.74)% | |
| | | | | |
Ratios to average net assets | | | | | | | | | | | | | | | | | | | | |
| | | | | |
Expenses before waiver and payments by affiliatesd | | | 0.41% | | | | 0.38% | | | | 0.37% | | | | 0.37% | | | | 0.36% | |
| | | | | |
Expenses net of waiver and payments by affiliatesd | | | 0.05% | | | | —% | e | | | —% | | | | —% | | | | —% | |
| | | | | |
Net investment incomec | | | 2.45% | | | | 2.71% | | | | 1.82% | | | | 1.48% | | | | 1.85% | |
| | | | | |
Supplemental data | | | | | | | | | | | | | | | | | | | | |
| | | | | |
Net assets, end of year (000’s) | | | $14,717 | | | | $14,228 | | | | $17,009 | | | | $13,936 | | | | $17,129 | |
| | | | | |
Portfolio turnover rate | | | 84.18% | | | | 52.98% | | | | 34.08% | | | | 83.67% | | | | 36.22% | |
aThe amount shown for a share outstanding throughout the period may not correlate with the Statement of Operations for the period due to the timing of sales and repurchases of the Fund’s shares in relation to income earned and/or fluctuating fair value of the investments of the Fund.
bBased on average daily shares outstanding.
cRecognition of net investment income by the Fund is affected by the timing of declaration of dividends by the Underlying Funds and exchange traded funds in which the Fund invests.
dDoes not include expenses of the Underlying Funds and exchange traded funds in which the Fund invests. The weighted average indirect expenses of the Underlying Funds and exchange traded funds was 0.37% for the year ended December 31, 2019.
eBenefit of expense reduction rounds to less than 0.01%.
| | | | |
franklintempleton.com | | The accompanying notes are an integral part of these financial statements. | Annual Report | | 75 |
FRANKLIN FUND ALLOCATOR SERIES
FINANCIAL HIGHLIGHTS
Franklin LifeSmart™ 2025 Retirement Target Fund(continued)
| | | | | | | | | | | | | | | | | | | | |
| | | Year Ended December 31, | |
| | | 2019 | | | 2018 | | | 2017 | | | 2016 | | | 2015 | |
| | | | | |
Advisor Class | | | | | | | | | | | | | | | | | | | | |
| | | | | |
Per share operating performance | | | | | | | | | | | | | | | | | | | | |
(for a share outstanding throughout the year) | | | | | | | | | | | | | | | | | | | | |
| | | | | |
Net asset value, beginning of year | | | $11.55 | | | | $13.00 | | | | $11.51 | | | | $11.46 | | | | $12.38 | |
| | | | | |
Income from investment operationsa: | | | | | | | | | | | | | | | | | | | | |
| | | | | |
Net investment incomeb,c | | | 0.30 | | | | 0.33 | | | | 0.23 | | | | 0.17 | | | | 0.16 | |
| | | | | |
Net realized and unrealized gains (losses) | | | 1.66 | | | | (1.00 | ) | | | 1.52 | | | | 0.19 | | | | (0.37 | ) |
| | | | | |
Total from investment operations | | | 1.96 | | | | (0.67 | ) | | | 1.75 | | | | 0.36 | | | | (0.21 | ) |
| | | | | |
Less distributions from: | | | | | | | | | | | | | | | | | | | | |
| | | | | |
Net investment income and short term gains received from Underlying Funds and exchange traded funds | | | (0.31 | ) | | | (0.36 | ) | | | (0.26 | ) | | | (0.16 | ) | | | (0.22 | ) |
| | | | | |
Net realized gains | | | (0.19 | ) | | | (0.42 | ) | | | — | | | | (0.15 | ) | | | (0.49 | ) |
| | | | | |
Total distributions | | | (0.50 | ) | | | (0.78 | ) | | | (0.26 | ) | | | (0.31 | ) | | | (0.71 | ) |
| | | | | |
Net asset value, end of year | | | $13.01 | | | | $11.55 | | | | $13.00 | | | | $11.51 | | | | $11.46 | |
| | | | | |
Total return | | | 17.09% | | | | (5.20)% | | | | 15.30% | | | | 3.20% | | | | (1.80)% | |
| | | | | |
Ratios to average net assets | | | | | | | | | | | | | | | | | | | | |
| | | | | |
Expenses before waiver and payments by affiliatesd | | | 0.55% | | | | 0.52% | | | | 0.55% | | | | 0.51% | | | | 0.49% | |
| | | | | |
Expenses net of waiver and payments by affiliatesd | | | 0.10% | | | | 0.05% | e | | | 0.05% | | | | 0.05% | | | | 0.05% | |
| | | | | |
Net investment incomec | | | 2.40% | | | | 2.66% | | | | 1.77% | | | | 1.43% | | | | 1.80% | |
| | | | | |
Supplemental data | | | | | | | | | | | | | | | | | | | | |
| | | | | |
Net assets, end of year (000’s) | | | $1,532 | | | | $1,449 | | | | $1,866 | | | | $1,381 | | | | $1,194 | |
| | | | | |
Portfolio turnover rate | | | 84.18% | | | | 52.98% | | | | 34.08% | | | | 83.67% | | | | 36.22% | |
aThe amount shown for a share outstanding throughout the period may not correlate with the Statement of Operations for the period due to the timing of sales and repurchases of the Fund’s shares in relation to income earned and/or fluctuating fair value of the investments of the Fund.
bBased on average daily shares outstanding.
cRecognition of net investment income by the Fund is affected by the timing of declaration of dividends by the Underlying Funds and exchange traded funds in which the Fund invests.
dDoes not include expenses of the Underlying Funds and exchange traded funds in which the Fund invests. The weighted average indirect expenses of the Underlying Funds and exchange traded funds was 0.37% for the year ended December 31, 2019.
eBenefit of expense reduction rounds to less than 0.01%.
| | | | |
| | | |
76 | | Annual Report | The accompanying notes are an integral part of these financial statements. | | franklintempleton.com |
FRANKLIN FUND ALLOCATOR SERIES
Statement of Investments, December 31, 2019
Franklin LifeSmart™ 2025 Retirement Target Fund
| | | | | | | | |
| | | Shares | | | Value | |
| | |
Investments in Underlying Funds and Exchange Traded Funds 99.0% | | | | | | | | |
| | |
Domestic Equity 39.6% | | | | | | | | |
aFranklin Growth Fund, Class R6 | | | 137,936 | | | $ | 15,490,253 | |
aFranklin LibertyQ U.S. Equity ETF | | | 409,160 | | | | 14,316,509 | |
aFranklin Rising Dividends Fund, Class R6 | | | 111,105 | | | | 7,727,333 | |
aFranklin U.S. Core Equity (IU) Fund | | | 1,192,043 | | | | 12,862,146 | |
Vanguard S&P 500 ETF | | | 3,475 | | | | 1,027,905 | |
| | | | | | | | |
| | |
| | | | | | | 51,424,146 | |
| | | | | | | | |
| | |
Domestic Fixed Income 36.3% | | | | | | | | |
aFranklin Liberty U.S. Core Bond ETF | | | 893,551 | | | | 22,419,105 | |
aFranklin Low Duration Total Return Fund, Class R6 | | | 907,651 | | | | 8,795,133 | |
iShares Core U.S. Aggregate Bond ETF | | | 88,034 | | | | 9,892,381 | |
Vanguard Intermediate-Term Corporate Bond ETF | | | 23,855 | | | | 2,178,677 | |
Vanguard Total International Bond ETF | | | 67,419 | | | | 3,814,567 | |
| | | | | | | | |
| | |
| | | | | | | 47,099,863 | |
| | | | | | | | |
| | |
Foreign Equity 19.0% | | | | | | | | |
aFranklin Emerging Market Core Equity (IU) Fund | | | 413,561 | | | | 4,520,225 | |
aFranklin FTSE Europe ETF | | | 67,137 | | | | 1,695,209 | |
aFranklin FTSE Japan ETF | | | 31,373 | | | | 820,404 | |
aFranklin International Core Equity (IU) Fund | | | 696,427 | | | | 7,730,338 | |
aFranklin International Growth Fund, Class R6 | | | 208,590 | | | | 3,473,014 | |
aFranklin LibertyQ Emerging Markets ETF | | | 100,483 | | | | 2,992,786 | |
aTempleton Foreign Fund, Class R6 | | | 480,295 | | | | 3,424,502 | |
| | | | | | | | |
| | |
| | | | | | | 24,656,478 | |
| | | | | | | | |
| | |
Foreign Fixed Income 4.1% | | | | | | | | |
aFranklin Liberty High Yield Corporate ETF | | | 50,217 | | | | 1,314,947 | |
aTempleton Global Total Return Fund, Class R6 | | | 356,916 | | | | 3,958,203 | |
| | | | | | | | |
| | |
| | | | | | | 5,273,150 | |
| | | | | | | | |
| | |
Total Investments in Underlying Funds and Exchange Traded Funds
before Short Term Investments (Cost $111,503,956) | | | | | | | 128,453,637 | |
| | | | | | | | |
| | |
Short Term Investments 1.0% | | | | | | | | |
| | |
Money Market Funds (Cost $1,981) 0.0%† | | | | | | | | |
a,bInstitutional Fiduciary Trust Money Market Portfolio, 1.26%. | | | 1,981 | | | | 1,981 | |
| | | | | | | | |
| | | | |
franklintempleton.com | | Annual Report | | 77 |
FRANKLIN FUND ALLOCATOR SERIES
STATEMENT OF INVESTMENTS
Franklin LifeSmart™ 2025 Retirement Target Fund(continued)
| | | | | | | | |
| | | Principal
Amount | | | Value | |
| | |
Short Term Investments(continued) | | | | | | | | |
| | |
Repurchase Agreements (Cost $1,299,292) 1.0% | | | | | | | | |
cJoint Repurchase Agreement, 1.536%, 1/02/20 (Maturity Value $1,299,403) | | | | | | | | |
BNP Paribas Securities Corp. (Maturity Value $712,515) | | | | | | | | |
Deutsche Bank Securities Inc. (Maturity Value $230,631) | | | | | | | | |
HSBC Securities (USA) Inc. (Maturity Value $356,257) | | | | | | | | |
Collateralized by U.S. Treasury Notes, 1.375% - 2.75%, 9/30/20 - 10/31/24; and U.S. Treasury Notes, Index Linked, 0.125%, 1/15/23 (valued at $1,326,013) | | $ | 1,299,292 | | | $ | 1,299,292 | |
| | | | | | | | |
| | |
Total Investments (Cost $112,805,229) 100.0% | | | | | | | 129,754,910 | |
| | |
Other Assets, less Liabilities (0.0)%† | | | | | | | (41,386 | ) |
| | | | | | | | |
| | |
Net Assets 100.0% | | | | | | $ | 129,713,524 | |
| | | | | | | | |
See Abbreviations on page 162.
†Rounds to less than 0.1% of net assets.
aSee Note 3(f) regarding investments in FT Underlying Funds.
bThe rate shown is the annualizedseven-day effective yield at period end.
cSee Note 1(b) regarding joint repurchase agreement.
| | | | |
| | | |
78 | | Annual Report | The accompanying notes are an integral part of these financial statements. | | franklintempleton.com |
FRANKLIN FUND ALLOCATOR SERIES
Financial Highlights
Franklin LifeSmart™ 2030 Retirement Target Fund
| | | | | | | | | | | | | | | | | | | | |
| | | Year Ended December 31, | |
| | | 2019 | | | 2018 | | | 2017 | | | 2016 | | | 2015 | |
| | | | | |
Class A | | | | | | | | | | | | | | | | | | | | |
| | | | | |
Per share operating performance | | | | | | | | | | | | | | | | | | | | |
(for a share outstanding throughout the year) | | | | | | | | | | | | | | | | | | | | |
| | | | | |
Net asset value, beginning of year | | | $11.50 | | | | $12.70 | | | | $11.08 | | | | $10.95 | | | | $11.45 | |
| | | | | |
Income from investment operationsa: | | | | | | | | | | | | | | | | | | | | |
| | | | | |
Net investment incomeb,c | | | 0.25 | | | | 0.29 | | | | 0.19 | | | | 0.13 | | | | 0.20 | |
| | | | | |
Net realized and unrealized gains (losses) | | | 1.90 | | | | (1.09 | ) | | | 1.65 | | | | 0.19 | | | | (0.39 | ) |
| | | | | |
Total from investment operations | | | 2.15 | | | | (0.80 | ) | | | 1.84 | | | | 0.32 | | | | (0.19 | ) |
| | | | | |
Less distributions from: | | | | | | | | | | | | | | | | | | | | |
| | | | | |
Net investment income and short term gains received from Underlying Funds and exchange traded funds | | | (0.23 | ) | | | (0.32 | ) | | | (0.22 | ) | | | (0.09 | ) | | | (0.16 | ) |
| | | | | |
Net realized gains | | | (0.14 | ) | | | (0.08 | ) | | | — | | | | (0.10 | ) | | | (0.15 | ) |
| | | | | |
Total distributions | | | (0.37 | ) | | | (0.40 | ) | | | (0.22 | ) | | | (0.19 | ) | | | (0.31 | ) |
| | | | | |
Net asset value, end of year | | | $13.28 | | | | $11.50 | | | | $12.70 | | | | $11.08 | | | | $10.95 | |
| | | | | |
Total returnd | | | 18.80% | | | | (6.32)% | | | | 16.73% | | | | 2.93% | | | | (1.75)% | |
| | | | | |
Ratios to average net assets | | | | | | | | | | | | | | | | | | | | |
| | | | | |
Expenses before waiver and payments by affiliatese | | | 1.02% | | | | 0.98% | | | | 1.08% | | | | 1.02% | | | | 1.17% | |
| | | | | |
Expenses net of waiver and payments by affiliatese | | | 0.34% | f | | | 0.30% | f | | | 0.30% | | | | 0.30% | | | | 0.32% | |
| | | | | |
Net investment incomec | | | 1.96% | | | | 2.24% | | | | 1.60% | | | | 1.17% | | | | 1.55% | |
| | | | | |
Supplemental data | | | | | | | | | | | | | | | | | | | | |
| | | | | |
Net assets, end of year (000’s) | | | $27,248 | | | | $22,447 | | | | $19,270 | | | | $16,788 | | | | $13,631 | |
| | | | | |
Portfolio turnover rate | | | 93.46% | | | | 47.37% | | | | 37.45% | | | | 81.66% | | | | 44.47% | |
aThe amount shown for a share outstanding throughout the period may not correlate with the Statement of Operations for the period due to the timing of sales and repurchases of the Fund’s shares in relation to income earned and/or fluctuating fair value of the investments of the Fund.
bBased on average daily shares outstanding.
cRecognition of net investment income by the Fund is affected by the timing of declaration of dividends by the Underlying Funds and exchange traded funds in which the Fund invests.
dTotal return does not reflect sales commissions or contingent deferred sales charges, if applicable.
eDoes not include expenses of the Underlying Funds and exchange traded funds in which the Fund invests. The weighted average indirect expenses of the Underlying Funds and exchange traded funds was 0.37% for the year ended December 31, 2019.
fBenefit of expense reduction rounds to less than 0.01%.
| | | | |
franklintempleton.com | | The accompanying notes are an integral part of these financial statements. | Annual Report | | 79 |
FRANKLIN FUND ALLOCATOR SERIES
FINANCIAL HIGHLIGHTS
Franklin LifeSmart™ 2030 Retirement Target Fund(continued)
| | | | | | | | | | | | | | | | | | | | |
| | | Year Ended December 31, | |
| | | 2019 | | | 2018 | | | 2017 | | | 2016 | | | 2015 | |
| | | | | |
Class C | | | | | | | | | | | | | | | | | | | | |
| | | | | |
Per share operating performance | | | | | | | | | | | | | | | | | | | | |
(for a share outstanding throughout the year) | | | | | | | | | | | | | | | | | | | | |
| | | | | |
Net asset value, beginning of year | | | $11.37 | | | | $12.56 | | | | $10.97 | | | | $10.86 | | | | $11.38 | |
| | | | | |
Income from investment operationsa: | | | | | | | | | | | | | | | | | | | | |
| | | | | |
Net investment incomeb,c | | | 0.15 | | | | 0.18 | | | | 0.11 | | | | 0.05 | | | | 0.11 | |
| | | | | |
Net realized and unrealized gains (losses) | | | 1.89 | | | | (1.06 | ) | | | 1.63 | | | | 0.17 | | | | (0.38 | ) |
| | | | | |
Total from investment operations | | | 2.04 | | | | (0.88 | ) | | | 1.74 | | | | 0.22 | | | | (0.27 | ) |
| | | | | |
Less distributions from: | | | | | | | | | | | | | | | | | | | | |
| | | | | |
Net investment income and short term gains received from Underlying Funds and exchange traded funds | | | (0.14 | ) | | | (0.23 | ) | | | (0.15 | ) | | | (0.01 | ) | | | (0.10 | ) |
| | | | | |
Net realized gains | | | (0.14 | ) | | | (0.08 | ) | | | — | | | | (0.10 | ) | | | (0.15 | ) |
| | | | | |
Total distributions | | | (0.28 | ) | | | (0.31 | ) | | | (0.15 | ) | | | (0.11 | ) | | | (0.25 | ) |
| | | | | |
Net asset value, end of year | | | $13.13 | | | | $11.37 | | | | $12.56 | | | | $10.97 | | | | $10.86 | |
| | | | | |
Total returnd | | | 17.98% | | | | (7.02)% | | | | 15.89% | | | | 2.08% | | | | (2.43)% | |
| | | | | |
Ratios to average net assets | | | | | | | | | | | | | | | | | | | | |
| | | | | |
Expenses before waiver and payments by affiliatese | | | 1.77% | | | | 1.73% | | | | 1.83% | | | | 1.77% | | | | 1.90% | |
| | | | | |
Expenses net of waiver and payments by affiliatese | | | 1.09% | f | | | 1.05% | f | | | 1.05% | | | | 1.05% | | | | 1.05% | |
| | | | | |
Net investment incomec | | | 1.21% | | | | 1.49% | | | | 0.85% | | | | 0.42% | | | | 0.82% | |
| | | | | |
Supplemental data | | | | | | | | | | | | | | | | | | | | |
| | | | | |
Net assets, end of year (000’s) | | | $9,146 | | | | $7,460 | | | | $7,642 | | | | $5,127 | | | | $4,124 | |
| | | | | |
Portfolio turnover rate | | | 93.46% | | | | 47.37% | | | | 37.45% | | | | 81.66% | | | | 44.47% | |
aThe amount shown for a share outstanding throughout the period may not correlate with the Statement of Operations for the period due to the timing of sales and repurchases of the Fund’s shares in relation to income earned and/or fluctuating fair value of the investments of the Fund.
bBased on average daily shares outstanding.
cRecognition of net investment income by the Fund is affected by the timing of declaration of dividends by the Underlying Funds and exchange traded funds in which the Fund invests.
dTotal return does not reflect sales commissions or contingent deferred sales charges, if applicable.
eDoes not include expenses of the Underlying Funds and exchange traded funds in which the Fund invests. The weighted average indirect expenses of the Underlying Funds and exchange traded funds was 0.37% for the year ended December 31, 2019.
fBenefit of expense reduction rounds to less than 0.01%.
| | | | |
| | | |
80 | | Annual Report | The accompanying notes are an integral part of these financial statements. | | franklintempleton.com |
FRANKLIN FUND ALLOCATOR SERIES
FINANCIAL HIGHLIGHTS
Franklin LifeSmart™ 2030 Retirement Target Fund(continued)
| | | | | | | | | | | | | | | | | | | | |
| | | Year Ended December 31, | |
| | | 2019 | | | 2018 | | | 2017 | | | 2016 | | | 2015 | |
| | | | | |
Class R | | | | | | | | | | | | | | | | | | | | |
| | | | | |
Per share operating performance | | | | | | | | | | | | | | | | | | | | |
(for a share outstanding throughout the year) | | | | | | | | | | | | | | | | | | | | |
| | | | | |
Net asset value, beginning of year | | | $11.48 | | | | $12.68 | | | | $11.06 | | | | $10.94 | | | | $11.44 | |
| | | | | |
Income from investment operationsa: | | | | | | | | | | | | | | | | | | | | |
| | | | | |
Net investment incomeb,c | | | 0.22 | | | | 0.23 | | | | 0.15 | | | | 0.10 | | | | 0.18 | |
| | | | | |
Net realized and unrealized gains (losses) | | | 1.91 | | | | (1.06 | ) | | | 1.65 | | | | 0.18 | | | | (0.39 | ) |
| | | | | |
Total from investment operations | | | 2.13 | | | | (0.83 | ) | | | 1.80 | | | | 0.28 | | | | (0.21 | ) |
| | | | | |
Less distributions from: | | | | | | | | | | | | | | | | | | | | |
| | | | | |
Net investment income and short term gains received from Underlying Funds and exchange traded funds | | | (0.20 | ) | | | (0.29 | ) | | | (0.18 | ) | | | (0.06 | ) | | | (0.14 | ) |
| | | | | |
Net realized gains | | | (0.14 | ) | | | (0.08 | ) | | | — | | | | (0.10 | ) | | | (0.15 | ) |
| | | | | |
Total distributions | | | (0.34 | ) | | | (0.37 | ) | | | (0.18 | ) | | | (0.16 | ) | | | (0.29 | ) |
| | | | | |
Net asset value, end of year | | | $13.27 | | | | $11.48 | | | | $12.68 | | | | $11.06 | | | | $10.94 | |
| | | | | |
Total return | | | 18.64% | | | | (6.59)% | | | | 16.39% | | | | 2.60% | | | | (1.89)% | |
| | | | | |
Ratios to average net assets | | | | | | | | | | | | | | | | | | | | |
| | | | | |
Expenses before waiver and payments by affiliatesd | | | 1.27% | | | | 1.23% | | | | 1.33% | | | | 1.27% | | | | 1.40% | |
| | | | | |
Expenses net of waiver and payments by affiliatesd | | | 0.59% | e | | | 0.55% | e | | | 0.55% | | | | 0.55% | | | | 0.55% | |
| | | | | |
Net investment incomec | | | 1.71% | | | | 1.99% | | | | 1.35% | | | | 0.92% | | | | 1.32% | |
| | | | | |
Supplemental data | | | | | | | | | | | | | | | | | | | | |
| | | | | |
Net assets, end of year (000’s) | | | $1,058 | | | | $816 | | | | $1,148 | | | | $1,398 | | | | $870 | |
| | | | | |
Portfolio turnover rate | | | 93.46% | | | | 47.37% | | | | 37.45% | | | | 81.66% | | | | 44.47% | |
aThe amount shown for a share outstanding throughout the period may not correlate with the Statement of Operations for the period due to the timing of sales and repurchases of the Fund’s shares in relation to income earned and/or fluctuating fair value of the investments of the Fund.
bBased on average daily shares outstanding.
cRecognition of net investment income by the Fund is affected by the timing of declaration of dividends by the Underlying Funds and exchange traded funds in which the Fund invests.
dDoes not include expenses of the Underlying Funds and exchange traded funds in which the Fund invests. The weighted average indirect expenses of the Underlying Funds and exchange traded funds was 0.37% for the year ended December 31, 2019.
eBenefit of expense reduction rounds to less than 0.01%.
| | | | |
franklintempleton.com | | The accompanying notes are an integral part of these financial statements. | Annual Report | | 81 |
FRANKLIN FUND ALLOCATOR SERIES
FINANCIAL HIGHLIGHTS
Franklin LifeSmart™ 2030 Retirement Target Fund(continued)
| | | | | | | | | | | | | | | | | | | | |
| | | Year Ended December 31, | |
| | | 2019 | | | 2018 | | | 2017 | | | 2016 | | | 2015 | |
| | | | | |
Class R6 | | | | | | | | | | | | | | | | | | | | |
| | | | | |
Per share operating performance | | | | | | | | | | | | | | | | | | | | |
(for a share outstanding throughout the year) | | | | | | | | | | | | | | | | | | | | |
| | | | | |
Net asset value, beginning of year | | | $11.54 | | | | $12.74 | | | | $11.12 | | | | $10.99 | | | | $11.47 | |
| | | | | |
Income from investment operationsa: | | | | | | | | | | | | | | | | | | | | |
| | | | | |
Net investment incomeb,c | | | 0.29 | | | | 0.32 | | | | 0.23 | | | | 0.16 | | | | 0.20 | |
| | | | | |
Net realized and unrealized gains (losses) | | | 1.92 | | | | (1.08 | ) | | | 1.65 | | | | 0.19 | | | | (0.35 | ) |
| | | | | |
Total from investment operations | | | 2.21 | | | | (0.76 | ) | | | 1.88 | | | | 0.35 | | | | (0.15 | ) |
| | | | | |
Less distributions from: | | | | | | | | | | | | | | | | | | | | |
| | | | | |
Net investment income and short term gains received from Underlying Funds and exchange traded funds | | | (0.27 | ) | | | (0.36 | ) | | | (0.26 | ) | | | (0.12 | ) | | | (0.18 | ) |
| | | | | |
Net realized gains | | | (0.14 | ) | | | (0.08 | ) | | | — | | | | (0.10 | ) | | | (0.15 | ) |
| | | | | |
Total distributions | | | (0.41 | ) | | | (0.44 | ) | | | (0.26 | ) | | | (0.22 | ) | | | (0.33 | ) |
| | | | | |
Net asset value, end of year | | | $13.34 | | | | $11.54 | | | | $12.74 | | | | $11.12 | | | | $10.99 | |
| | | | | |
Total return | | | 19.26% | | | | (6.02)% | | | | 17.01% | | | | 3.20% | | | | (1.34)% | |
| | | | | |
Ratios to average net assets | | | | | | | | | | | | | | | | | | | | |
| | | | | |
Expenses before waiver and payments by affiliatesd | | | 0.53% | | | | 0.52% | | | | 0.54% | | | | 0.57% | | | | 0.68% | |
| | | | | |
Expenses net of waiver and payments by affiliatesd | | | 0.04% | e | | | —% | e | | | —% | | | | —% | | | | —% | |
| | | | | |
Net investment incomec | | | 2.26% | | | | 2.54% | | | | 1.90% | | | | 1.47% | | | | 1.87% | |
| | | | | |
Supplemental data | | | | | | | | | | | | | | | | | | | | |
| | | | | |
Net assets, end of year (000’s) | | | $22,064 | | | | $18,389 | | | | $18,260 | | | | $14,455 | | | | $13,041 | |
| | | | | |
Portfolio turnover rate | | | 93.46% | | | | 47.37% | | | | 37.45% | | | | 81.66% | | | | 44.47% | |
aThe amount shown for a share outstanding throughout the period may not correlate with the Statement of Operations for the period due to the timing of sales and repurchases of the Fund’s shares in relation to income earned and/or fluctuating fair value of the investments of the Fund.
bBased on average daily shares outstanding.
cRecognition of net investment income by the Fund is affected by the timing of declaration of dividends by the Underlying Funds and exchange traded funds in which the Fund invests.
dDoes not include expenses of the Underlying Funds and exchange traded funds in which the Fund invests. The weighted average indirect expenses of the Underlying Funds and exchange traded funds was 0.37% for the year ended December 31, 2019.
eBenefit of expense reduction rounds to less than 0.01%.
| | | | |
| | | |
82 | | Annual Report | The accompanying notes are an integral part of these financial statements. | | franklintempleton.com |
FRANKLIN FUND ALLOCATOR SERIES
FINANCIAL HIGHLIGHTS
Franklin LifeSmart™ 2030 Retirement Target Fund(continued)
| | | | | | | | | | | | | | | | | | | | |
| | | Year Ended December 31, | |
| | | 2019 | | | 2018 | | | 2017 | | | 2016 | | | 2015 | |
| | | | | |
Advisor Class | | | | | | | | | | | | | | | | | | | | |
| | | | | |
Per share operating performance | | | | | | | | | | | | | | | | | | | | |
(for a share outstanding throughout the year) | | | | | | | | | | | | | | | | | | | | |
| | | | | |
Net asset value, beginning of year | | | $11.53 | | | | $12.73 | | | | $11.11 | | | | $10.98 | | | | $11.47 | |
| | | | | |
Income from investment operationsa: | | | | | | | | | | | | | | | | | | | | |
| | | | | |
Net investment incomeb,c | | | 0.28 | | | | 0.31 | | | | 0.23 | | | | 0.15 | | | | 0.27 | |
| | | | | |
Net realized and unrealized gains (losses) | | | 1.92 | | | | (1.08 | ) | | | 1.64 | | | | 0.19 | | | | (0.43 | ) |
| | | | | |
Total from investment operations | | | 2.20 | | | | (0.77 | ) | | | 1.87 | | | | 0.34 | | | | (0.16 | ) |
| | | | | |
Less distributions from: | | | | | | | | | | | | | | | | | | | | |
| | | | | |
Net investment income and short term gains received from Underlying Funds and exchange traded funds | | | (0.26 | ) | | | (0.35 | ) | | | (0.25 | ) | | | (0.11 | ) | | | (0.18 | ) |
| | | | | |
Net realized gains | | | (0.14 | ) | | | (0.08 | ) | | | — | | | | (0.10 | ) | | | (0.15 | ) |
| | | | | |
Total distributions | | | (0.40 | ) | | | (0.43 | ) | | | (0.25 | ) | | | (0.21 | ) | | | (0.33 | ) |
| | | | | |
Net asset value, end of year | | | $13.33 | | | | $11.53 | | | | $12.73 | | | | $11.11 | | | | $10.98 | |
| | | | | |
Total return | | | 19.22% | | | | (6.08)% | | | | 16.97% | | | | 3.15% | | | | (1.46)% | |
| | | | | |
Ratios to average net assets | | | | | | | | | | | | | | | | | | | | |
| | | | | |
Expenses before waiver and payments by affiliatesd | | | 0.77% | | | | 0.73% | | | | 0.83% | | | | 0.77% | | | | 0.90% | |
| | | | | |
Expenses net of waiver and payments by affiliatesd | | | 0.09% | e | | | 0.05% | e | | | 0.05% | | | | 0.05% | | | | 0.05% | |
| | | | | |
Net investment incomec | | | 2.21% | | | | 2.49% | | | | 1.85% | | | | 1.42% | | | | 1.82% | |
| | | | | |
Supplemental data | | | | | | | | | | | | | | | | | | | | |
| | | | | |
Net assets, end of year (000’s) | | | $997 | | | | $785 | | | | $662 | | | | $332 | | | | $303 | |
| | | | | |
Portfolio turnover rate | | | 93.46% | | | | 47.37% | | | | 37.45% | | | | 81.66% | | | | 44.47% | |
aThe amount shown for a share outstanding throughout the period may not correlate with the Statement of Operations for the period due to the timing of sales and repurchases of the Fund’s shares in relation to income earned and/or fluctuating fair value of the investments of the Fund.
bBased on average daily shares outstanding.
cRecognition of net investment income by the Fund is affected by the timing of declaration of dividends by the Underlying Funds and exchange traded funds in which the Fund invests.
dDoes not include expenses of the Underlying Funds and exchange traded funds in which the Fund invests. The weighted average indirect expenses of the Underlying Funds and exchange traded funds was 0.37% for the year ended December 31, 2019.
eBenefit of expense reduction rounds to less than 0.01%.
| | | | |
franklintempleton.com | | The accompanying notes are an integral part of these financial statements. | Annual Report | | 83 |
FRANKLIN FUND ALLOCATOR SERIES
Statement of Investments, December 31, 2019
Franklin LifeSmart™ 2030 Retirement Target Fund
| | | | | | | | |
| | | Shares | | | Value | |
| | |
Investments in Underlying Funds and Exchange Traded Funds 98.0% | | | | | | | | |
| | |
Domestic Equity 46.8% | | | | | | | | |
aFranklin Growth Fund, Class R6 | | | 75,791 | | | $ | 8,511,403 | |
aFranklin LibertyQ U.S. Equity ETF | | | 226,883 | | | | 7,938,636 | |
aFranklin Rising Dividends Fund, Class R6 | | | 61,187 | | | | 4,255,533 | |
aFranklin U.S. Core Equity (IU) Fund | | | 652,684 | | | | 7,042,457 | |
Vanguard S&P 500 ETF | | | 1,900 | | | | 562,020 | |
| | | | | | | | |
| | |
| | | | | | | 28,310,049 | |
| | | | | | | | |
| | |
Domestic Fixed Income 26.5% | | | | | | | | |
aFranklin Liberty U.S. Core Bond ETF | | | 302,882 | | | | 7,599,279 | |
aFranklin Low Duration Total Return Fund, Class R6 | | | 314,399 | | | | 3,046,531 | |
iShares Core U.S. Aggregate Bond ETF | | | 29,732 | | | | 3,340,985 | |
Vanguard Intermediate-Term Corporate Bond ETF | | | 8,302 | | | | 758,221 | |
Vanguard Total International Bond ETF | | | 22,587 | | | | 1,277,972 | |
| | | | | | | | |
| | |
| | | | | | | 16,022,988 | |
| | | | | | | | |
| | |
Foreign Equity 21.9% | | | | | | | | |
aFranklin Emerging Market Core Equity (IU) Fund | | | 219,496 | | | | 2,399,088 | |
aFranklin FTSE Europe ETF | | | 36,005 | | | | 909,126 | |
aFranklin FTSE Japan ETF | | | 17,565 | | | | 459,325 | |
aFranklin International Core Equity (IU) Fund | | | 373,564 | | | | 4,146,561 | |
aFranklin International Growth Fund, Class R6 | | | 111,884 | | | | 1,862,871 | |
aFranklin LibertyQ Emerging Markets ETF | | | 54,647 | | | | 1,627,606 | |
aTempleton Foreign Fund, Class R6 | | | 257,637 | | | | 1,836,950 | |
| | | | | | | | |
| | |
| | | | | | | 13,241,527 | |
| | | | | | | | |
| | |
Foreign Fixed Income 2.8% | | | | | | | | |
aFranklin Liberty High Yield Corporate ETF | | | 17,353 | | | | 454,394 | |
aTempleton Global Total Return Fund, Class R6 | | | 115,392 | | | | 1,279,699 | |
| | | | | | | | |
| | |
| | | | | | | 1,734,093 | |
| | | | | | | | |
| | |
Total Investments in Underlying Funds and Exchange Traded Funds before Short Term Investments (Cost $52,608,067) | | | | | | | 59,308,657 | |
| | | | | | | | |
| | |
Short Term Investments 1.9% | | | | | | | | |
| | |
Money Market Funds (Cost $687,164) 1.2% | | | | | | | | |
a,bInstitutional Fiduciary Trust Money Market Portfolio, 1.26% | | | 687,164 | | | | 687,164 | |
| | | | | | | | |
| | | | |
| | | |
84 | | Annual Report | | franklintempleton.com |
FRANKLIN FUND ALLOCATOR SERIES
STATEMENT OF INVESTMENTS
Franklin LifeSmart™ 2030 Retirement Target Fund(continued)
| | | | | | | | |
| | | Principal
Amount | | | Value | |
| | |
Short Term Investments(continued) | | | | | | | | |
| | |
Repurchase Agreements (Cost $428,718) 0.7% | | | | | | | | |
cJoint Repurchase Agreement, 1.536%, 1/02/20 (Maturity Value $428,755) | | | | | | | | |
BNP Paribas Securities Corp. (Maturity Value $235,103) | | | | | | | | |
Deutsche Bank Securities Inc. (Maturity Value $76,100) | | | | | | | | |
HSBC Securities (USA) Inc. (Maturity Value $117,552) | | | | | | | | |
Collateralized by U.S. Treasury Notes, 1.375% - 2.75%, 9/30/20 - 10/31/24; and U.S. Treasury Notes, Index Linked, 0.125%, 1/15/23 (valued at $437,535) | | $ | 428,718 | | | $ | 428,718 | |
| | | | | | | | |
| | |
Total Investments (Cost $53,723,949) 99.9% | | | | | | | 60,424,539 | |
| | |
Other Assets, less Liabilities 0.1% | | | | | | | 88,742 | |
| | | | | | | | |
| | |
Net Assets 100.0% | | | | | | $ | 60,513,281 | |
| | | | | | | | |
See Abbreviations on page 162.
aSee Note 3(f) regarding investments in FT Underlying Funds.
bThe rate shown is the annualizedseven-day effective yield at period end.
cSee Note 1(b) regarding joint repurchase agreement.
| | | | | | |
franklintempleton.com | | The accompanying notes are an integral part of these financial statements. | | Annual Report | | 85 |
FRANKLIN FUND ALLOCATOR SERIES
Financial Highlights
Franklin LifeSmart™ 2035 Retirement Target Fund
| | | | | | | | | | | | | | | | | | | | |
| | | Year Ended December 31, | |
| | | 2019 | | | 2018 | | | 2017 | | | 2016 | | | 2015 | |
| | | | | |
Class A | | | | | | | | | | | | | | | | | | | | |
| | | | | |
Per share operating performance | | | | | | | | | | | | | | | | | | | | |
(for a share outstanding throughout the year) | | | | | | | | | | | | | | | | | | | | |
| | | | | |
Net asset value, beginning of year | | | $12.03 | | | | $13.70 | | | | $11.86 | | | | $11.78 | | | | $12.67 | |
| | | | | |
Income from investment operationsa: | | | | | | | | | | | | | | | | | | | | |
| | | | | |
Net investment incomeb,c | | | 0.24 | | | | 0.29 | | | | 0.20 | | | | 0.13 | | | | 0.17 | |
| | | | | |
Net realized and unrealized gains (losses) | | | 2.19 | | | | (1.21 | ) | | | 1.92 | | | | 0.23 | | | | (0.41 | ) |
| | | | | |
Total from investment operations | | | 2.43 | | | | (0.92 | ) | | | 2.12 | | | | 0.36 | | | | (0.24 | ) |
| | | | | |
Less distributions from: | | | | | | | | | | | | | | | | | | | | |
| | | | | |
Net investment income and short term gains received from Underlying Funds and exchange traded funds | | | (0.24 | ) | | | (0.30 | ) | | | (0.28 | ) | | | (0.10 | ) | | | (0.18 | ) |
| | | | | |
Net realized gains | | | (0.28 | ) | | | (0.45 | ) | | | — | | | | (0.18 | ) | | | (0.47 | ) |
| | | | | |
Total distributions | | | (0.52 | ) | | | (0.75 | ) | | | (0.28 | ) | | | (0.28 | ) | | | (0.65 | ) |
| | | | | |
Net asset value, end of year | | | $13.94 | | | | $12.03 | | | | $13.70 | | | | $11.86 | | | | $11.78 | |
| | | | | |
Total returnd | | | 20.36% | | | | (6.87)% | | | | 17.93% | | | | 3.11% | | | | (2.00)% | |
| | | | | |
Ratios to average net assets | | | | | | | | | | | | | | | | | | | | |
| | | | | |
Expenses before waiver and payments by affiliatese | | | 0.86% | | | | 0.81% | | | | 0.86% | | | | 0.82% | | | | 0.84% | |
| | | | | |
Expenses net of waiver and payments by affiliatese | | | 0.34% | | | | 0.30% | f | | | 0.30% | | | | 0.30% | | | | 0.33% | |
| | | | | |
Net investment incomec | | | 1.81% | | | | 2.04% | | | | 1.55% | | | | 1.15% | | | | 1.30% | |
| | | | | |
Supplemental data | | | | | | | | | | | | | | | | | | | | |
| | | | | |
Net assets, end of year (000’s) | | | $72,425 | | | | $60,087 | | | | $61,238 | | | | $56,650 | | | | $53,701 | |
| | | | | |
Portfolio turnover rate | | | 79.04% | | | | 47.85% | | | | 31.98% | | | | 77.39% | | | | 33.86% | |
aThe amount shown for a share outstanding throughout the period may not correlate with the Statement of Operations for the period due to the timing of sales and repurchases of the Fund’s shares in relation to income earned and/or fluctuating fair value of the investments of the Fund.
bBased on average daily shares outstanding.
cRecognition of net investment income by the Fund is affected by the timing of declaration of dividends by the Underlying Funds and exchange traded funds in which the Fund invests.
dTotal return does not reflect sales commissions or contingent deferred sales charges, if applicable.
eDoes not include expenses of the Underlying Funds and exchange traded funds in which the Fund invests. The weighted average indirect expenses of the Underlying Funds and exchange traded funds was 0.38% for the year ended December 31, 2019.
fBenefit of expense reduction rounds to less than 0.01%.
| | | | |
| | | |
86 | | Annual Report | The accompanying notes are an integral part of these financial statements. | | franklintempleton.com |
FRANKLIN FUND ALLOCATOR SERIES
FINANCIAL HIGHLIGHTS
Franklin LifeSmart™ 2035 Retirement Target Fund(continued)
| | | | | | | | | | | | | | | | | | | | |
| | | Year Ended December 31, | |
| | | 2019 | | | 2018 | | | 2017 | | | 2016 | | | 2015 | |
| | | | | |
Class C | | | | | | | | | | | | | | | | | | | | |
| | | | | |
Per share operating performance | | | | | | | | | | | | | | | | | | | | |
(for a share outstanding throughout the year) | | | | | | | | | | | | | | | | | | | | |
| | | | | |
Net asset value, beginning of year | | | $11.75 | | | | $13.40 | | | | $11.61 | | | | $11.54 | | | | $12.43 | |
| | | | | |
Income from investment operationsa: | | | | | | | | | | | | | | | | | | | | |
| | | | | |
Net investment incomeb,c | | | 0.14 | | | | 0.16 | | | | 0.10 | | | | 0.04 | | | | 0.07 | |
| | | | | |
Net realized and unrealized gains (losses) | | | 2.13 | | | | (1.16 | ) | | | 1.88 | | | | 0.22 | | | | (0.40 | ) |
| | | | | |
Total from investment operations | | | 2.27 | | | | (1.00 | ) | | | 1.98 | | | | 0.26 | | | | (0.33 | ) |
| | | | | |
Less distributions from: | | | | | | | | | | | | | | | | | | | | |
| | | | | |
Net investment income and short term gains received from Underlying Funds and exchange traded funds | | | (0.14 | ) | | | (0.20 | ) | | | (0.19 | ) | | | (0.01 | ) | | | (0.09 | ) |
| | | | | |
Net realized gains | | | (0.28 | ) | | | (0.45 | ) | | | — | | | | (0.18 | ) | | | (0.47 | ) |
| | | | | |
Total distributions | | | (0.42 | ) | | | (0.65 | ) | | | (0.19 | ) | | | (0.19 | ) | | | (0.56 | ) |
| | | | | |
Net asset value, end of year | | | $13.60 | | | | $11.75 | | | | $13.40 | | | | $11.61 | | | | $11.54 | |
| | | | | |
Total returnd | | | 19.46% | | | | (7.58)% | | | | 17.09% | | | | 2.34% | | | | (2.76)% | |
| | | | | |
Ratios to average net assets | | | | | | | | | | | | | | | | | | | | |
| | | | | |
Expenses before waiver and payments by affiliatese | | | 1.61% | | | | 1.56% | | | | 1.60% | | | | 1.57% | | | | 1.56% | |
| | | | | |
Expenses net of waiver and payments by affiliatese | | | 1.09% | | | | 1.05% | f | | | 1.04% | | | | 1.05% | | | | 1.05% | |
| | | | | |
Net investment incomec | | | 1.06% | | | | 1.29% | | | | 0.81% | | | | 0.40% | | | | 0.58% | |
| | | | | |
Supplemental data | | | | | | | | | | | | | | | | | | | | |
| | | | | |
Net assets, end of year (000’s) | | | $21,115 | | | | $18,350 | | | | $21,451 | | | | $18,781 | | | | $19,953 | |
| | | | | |
Portfolio turnover rate | | | 79.04% | | | | 47.85% | | | | 31.98% | | | | 77.39% | | | | 33.86% | |
aThe amount shown for a share outstanding throughout the period may not correlate with the Statement of Operations for the period due to the timing of sales and repurchases of the Fund’s shares in relation to income earned and/or fluctuating fair value of the investments of the Fund.
bBased on average daily shares outstanding.
cRecognition of net investment income by the Fund is affected by the timing of declaration of dividends by the Underlying Funds and exchange traded funds in which the Fund invests.
dTotal return does not reflect sales commissions or contingent deferred sales charges, if applicable.
eDoes not include expenses of the Underlying Funds and exchange traded funds in which the Fund invests. The weighted average indirect expenses of the Underlying Funds and exchange traded funds was 0.38% for the year ended December 31, 2019.
fBenefit of expense reduction rounds to less than 0.01%.
| | | | |
franklintempleton.com | | The accompanying notes are an integral part of these financial statements. | Annual Report | | 87 |
FRANKLIN FUND ALLOCATOR SERIES
FINANCIAL HIGHLIGHTS
Franklin LifeSmart™ 2035 Retirement Target Fund(continued)
| | | | | | | | | | | | | | | | | | | | |
| | | Year Ended December 31, | |
| | | 2019 | | | 2018 | | | 2017 | | | 2016 | | | 2015 | |
| | | | | |
Class R | | | | | | | | | | | | | | | | | | | | |
| | | | | |
Per share operating performance | | | | | | | | | | | | | | | | | | | | |
(for a share outstanding throughout the year) | | | | | | | | | | | | | | | | | | | | |
| | | | | |
Net asset value, beginning of year | | | $12.01 | | | | $13.69 | | | | $11.84 | | | | $11.77 | | | | $12.66 | |
| | | | | |
Income from investment operationsa: | | | | | | | | | | | | | | | | | | | | |
| | | | | |
Net investment incomeb,c | | | 0.20 | | | | 0.24 | | | | 0.15 | | | | 0.12 | | | | 0.13 | |
| | | | | |
Net realized and unrealized gains (losses) | | | 2.20 | | | | (1.20 | ) | | | 1.94 | | | | 0.21 | | | | (0.40 | ) |
| | | | | |
Total from investment operations | | | 2.40 | | | | (0.96 | ) | | | 2.09 | | | | 0.33 | | | | (0.27 | ) |
| | | | | |
Less distributions from: | | | | | | | | | | | | | | | | | | | | |
| | | | | |
Net investment income and short term gains received from Underlying Funds and exchange traded funds | | | (0.21 | ) | | | (0.27 | ) | | | (0.24 | ) | | | (0.08 | ) | | | (0.15 | ) |
| | | | | |
Net realized gains | | | (0.28 | ) | | | (0.45 | ) | | | — | | | | (0.18 | ) | | | (0.47 | ) |
| | | | | |
Total distributions | | | (0.49 | ) | | | (0.72 | ) | | | (0.24 | ) | | | (0.26 | ) | | | (0.62 | ) |
| | | | | |
Net asset value, end of year | | | $13.92 | | | | $12.01 | | | | $13.69 | | | | $11.84 | | | | $11.77 | |
| | | | | |
Total return | | | 20.10% | | | | (7.18)% | | | | 17.71% | | | | 2.87% | | | | (2.25)% | |
| | | | | |
Ratios to average net assets | | | | | | | | | | | | | | | | | | | | |
| | | | | |
Expenses before waiver and payments by affiliatesd | | | 1.10% | | | | 1.05% | | | | 1.11% | | | | 1.07% | | | | 1.06% | |
| | | | | |
Expenses net of waiver and payments by affiliatesd | | | 0.58% | | | | 0.54% | e | | | 0.55% | | | | 0.55% | | | | 0.55% | |
| | | | | |
Net investment incomec | | | 1.57% | | | | 1.80% | | | | 1.30% | | | | 0.90% | | | | 1.08% | |
| | | | | |
Supplemental data | | | | | | | | | | | | | | | | | | | | |
| | | | | |
Net assets, end of year (000’s) | | | $4,966 | | | | $4,762 | | | | $5,745 | | | | $6,080 | | | | $4,688 | |
| | | | | |
Portfolio turnover rate | | | 79.04% | | | | 47.85% | | | | 31.98% | | | | 77.39% | | | | 33.86% | |
aThe amount shown for a share outstanding throughout the period may not correlate with the Statement of Operations for the period due to the timing of sales and repurchases of the Fund’s shares in relation to income earned and/or fluctuating fair value of the investments of the Fund.
bBased on average daily shares outstanding.
cRecognition of net investment income by the Fund is affected by the timing of declaration of dividends by the Underlying Funds and exchange traded funds in which the Fund invests.
dDoes not include expenses of the Underlying Funds and exchange traded funds in which the Fund invests. The weighted average indirect expenses of the Underlying Funds and exchange traded funds was 0.38% for the year ended December 31, 2019.
eBenefit of expense reduction rounds to less than 0.01%.
| | | | |
| | | |
88 | | Annual Report | The accompanying notes are an integral part of these financial statements. | | franklintempleton.com |
FRANKLIN FUND ALLOCATOR SERIES
FINANCIAL HIGHLIGHTS
Franklin LifeSmart™ 2035 Retirement Target Fund(continued)
| | | | | | | | | | | | | | | | | | | | |
| | | Year Ended December 31, | |
| | | 2019 | | | 2018 | | | 2017 | | | 2016 | | | 2015 | |
| | | | | |
Class R6 | | | | | | | | | | | | | | | | | | | | |
| | | | | |
Per share operating performance | | | | | | | | | | | | | | | | | | | | |
(for a share outstanding throughout the year) | | | | | | | | | | | | | | | | | | | | |
| | | | | |
Net asset value, beginning of year | | | $12.12 | | | | $13.80 | | | | $11.94 | | | | $11.85 | | | | $12.75 | |
| | | | | |
Income from investment operationsa: | | | | | | | | | | | | | | | | | | | | |
| | | | | |
Net investment incomeb,c | | | 0.29 | | | | 0.31 | | | | 0.25 | | | | 0.17 | | | | 0.22 | |
| | | | | |
Net realized and unrealized gains (losses) | | | 2.20 | | | | (1.20 | ) | | | 1.93 | | | | 0.23 | | | | (0.43 | ) |
| | | | | |
Total from investment operations | | | 2.49 | | | | (0.89 | ) | | | 2.18 | | | | 0.40 | | | | (0.21 | ) |
| | | | | |
Less distributions from: | | | | | | | | | | | | | | | | | | | | |
| | | | | |
Net investment income and short term gains received from Underlying Funds and exchange traded funds | | | (0.28 | ) | | | (0.34 | ) | | | (0.32 | ) | | | (0.13 | ) | | | (0.22 | ) |
| | | | | |
Net realized gains | | | (0.28 | ) | | | (0.45 | ) | | | — | | | | (0.18 | ) | | | (0.47 | ) |
| | | | | |
Total distributions | | | (0.56 | ) | | | (0.79 | ) | | | (0.32 | ) | | | (0.31 | ) | | | (0.69 | ) |
| | | | | |
Net asset value, end of year | | | $14.05 | | | | $12.12 | | | | $13.80 | | | | $11.94 | | | | $11.85 | |
| | | | | |
Total return | | | 20.73% | | | | (6.63)% | | | | 18.31% | | | | 3.48% | | | | (1.75)% | |
| | | | | |
Ratios to average net assets | | | | | | | | | | | | | | | | | | | | |
| | | | | |
Expenses before waiver and payments by affiliatesd | | | 0.41% | | | | 0.39% | | | | 0.38% | | | | 0.39% | | | | 0.38% | |
| | | | | |
Expenses net of waiver and payments by affiliatesd | | | 0.04% | | | | —% | e | | | —% | | | | —% | | | | —% | |
| | | | | |
Net investment incomec | | | 2.11% | | | | 2.34% | | | | 1.85% | | | | 1.45% | | | | 1.63% | |
| | | | | |
Supplemental data | | | | | | | | | | | | | | | | | | | | |
| | | | | |
Net assets, end of year (000’s) | | | $28,513 | | | | $22,207 | | | | $26,497 | | | | $22,068 | | | | $20,244 | |
| | | | | |
Portfolio turnover rate | | | 79.04% | | | | 47.85% | | | | 31.98% | | | | 77.39% | | | | 33.86% | |
aThe amount shown for a share outstanding throughout the period may not correlate with the Statement of Operations for the period due to the timing of sales and repurchases of the Fund’s shares in relation to income earned and/or fluctuating fair value of the investments of the Fund.
bBased on average daily shares outstanding.
cRecognition of net investment income by the Fund is affected by the timing of declaration of dividends by the Underlying Funds and exchange traded funds in which the Fund invests.
dDoes not include expenses of the Underlying Funds and exchange traded funds in which the Fund invests. The weighted average indirect expenses of the Underlying Funds and exchange traded funds was 0.38% for the year ended December 31, 2019.
eBenefit of expense reduction rounds to less than 0.01%.
| | | | |
franklintempleton.com | | The accompanying notes are an integral part of these financial statements. | Annual Report | | 89 |
FRANKLIN FUND ALLOCATOR SERIES
FINANCIAL HIGHLIGHTS
Franklin LifeSmart™ 2035 Retirement Target Fund(continued)
| | | | | | | | | | | | | | | | | | | | |
| | | Year Ended December 31, | |
| | | 2019 | | | 2018 | | | 2017 | | | 2016 | | | 2015 | |
| | | | | |
Advisor Class | | | | | | | | | | | | | | | | | | | | |
| | | | | |
Per share operating performance | | | | | | | | | | | | | | | | | | | | |
(for a share outstanding throughout the year) | | | | | | | | | | | | | | | | | | | | |
| | | | | |
Net asset value, beginning of year | | | $12.13 | | | | $13.81 | | | | $11.95 | | | | $11.86 | | | | $12.75 | |
| | | | | |
Income from investment operationsa: | | | | | | | | | | | | | | | | | | | | |
| | | | | |
Net investment incomeb,c | | | 0.28 | | | | 0.32 | | | | 0.23 | | | | 0.16 | | | | 0.16 | |
| | | | | |
Net realized and unrealized gains (losses) | | | 2.21 | | | | (1.22 | ) | | | 1.94 | | | | 0.23 | | | | (0.37 | ) |
| | | | | |
Total from investment operations | | | 2.49 | | | | (0.90 | ) | | | 2.17 | | | | 0.39 | | | | (0.21 | ) |
| | | | | |
Less distributions from: | | | | | | | | | | | | | | | | | | | | |
| | | | | |
Net investment income and short term gains received from Underlying Funds and exchange traded funds | | | (0.27 | ) | | | (0.33 | ) | | | (0.31 | ) | | | (0.12 | ) | | | (0.21 | ) |
| | | | | |
Net realized gains | | | (0.28 | ) | | | (0.45 | ) | | | — | | | | (0.18 | ) | | | (0.47 | ) |
| | | | | |
Total distributions | | | (0.55 | ) | | | (0.78 | ) | | | (0.31 | ) | | | (0.30 | ) | | | (0.68 | ) |
| | | | | |
Net asset value, end of year | | | $14.07 | | | | $12.13 | | | | $13.81 | | | | $11.95 | | | | $11.86 | |
| | | | | |
Total return | | | 20.73% | | | | (6.67)% | | | | 18.24% | | | | 3.42% | | | | (1.76)% | |
| | | | | |
Ratios to average net assets | | | | | | | | | | | | | | | | | | | | |
| | | | | |
Expenses before waiver and payments by affiliatesd | | | 0.61% | | | | 0.56% | | | | 0.61% | | | | 0.57% | | | | 0.56% | |
| | | | | |
Expenses net of waiver and payments by affiliatesd | | | 0.09% | | | | 0.05% | e | | | 0.05% | | | | 0.05% | | | | 0.05% | |
| | | | | |
Net investment incomec | | | 2.06% | | | | 2.29% | | | | 1.80% | | | | 1.40% | | | | 1.58% | |
| | | | | |
Supplemental data | | | | | | | | | | | | | | | | | | | | |
| | | | | |
Net assets, end of year (000’s) | | | $2,145 | | | | $1,723 | | | | $1,578 | | | | $1,451 | | | | $1,722 | |
| | | | | |
Portfolio turnover rate | | | 79.04% | | | | 47.85% | | | | 31.98% | | | | 77.39% | | | | 33.86% | |
aThe amount shown for a share outstanding throughout the period may not correlate with the Statement of Operations for the period due to the timing of sales and repurchases of the Fund’s shares in relation to income earned and/or fluctuating fair value of the investments of the Fund.
bBased on average daily shares outstanding.
cRecognition of net investment income by the Fund is affected by the timing of declaration of dividends by the Underlying Funds and exchange traded funds in which the Fund invests.
dDoes not include expenses of the Underlying Funds and exchange traded funds in which the Fund invests. The weighted average indirect expenses of the Underlying Funds and exchange traded funds was 0.38% for the year ended December 31, 2019.
eBenefit of expense reduction rounds to less than 0.01%.
| | | | |
| | | |
90 | | Annual Report | The accompanying notes are an integral part of these financial statements. | | franklintempleton.com |
FRANKLIN FUND ALLOCATOR SERIES
Statement of Investments, December 31, 2019
Franklin LifeSmart™ 2035 Retirement Target Fund
| | | | | | | | |
| | | Shares | | | Value | |
| | |
Investments in Underlying Funds and Exchange Traded Funds 98.4% | | | | | | | | |
| | |
Domestic Equity 53.0% | | | | | | | | |
aFranklin Growth Fund, Class R6 | | | 182,602 | | | $ | 20,506,241 | |
aFranklin LibertyQ U.S. Equity ETF | | | 546,719 | | | | 19,129,698 | |
aFranklin Rising Dividends Fund, Class R6 | | | 146,654 | | | | 10,199,784 | |
aFranklin U.S. Core Equity (IU) Fund | | | 1,595,429 | | | | 17,214,672 | |
Vanguard S&P 500 ETF | | | 4,650 | | | | 1,375,472 | |
| | | | | | | | |
| | |
| | | | | | | 68,425,867 | |
| | | | | | | | |
| | |
Domestic Fixed Income 18.9% | | | | | | | | |
aFranklin Liberty U.S. Core Bond ETF | | | 461,932 | | | | 11,589,828 | |
aFranklin Low Duration Total Return Fund, Class R6 | | | 483,961 | | | | 4,689,585 | |
iShares Core U.S. Aggregate Bond ETF | | | 45,374 | | | | 5,098,676 | |
Vanguard Intermediate-Term Corporate Bond ETF | | | 12,803 | | | | 1,169,298 | |
Vanguard Total International Bond ETF | | | 32,476 | | | | 1,837,492 | |
| | | | | | | | |
| | |
| | | | | | | 24,384,879 | |
| | | | | | | | |
| | |
Foreign Equity 24.5% | | | | | | | | |
aFranklin Emerging Market Core Equity (IU) Fund | | | 534,433 | | | | 5,841,353 | |
aFranklin FTSE Europe ETF | | | 86,135 | | | | 2,174,909 | |
aFranklin FTSE Japan ETF | | | 40,257 | | | | 1,052,721 | |
aFranklin International Core Equity (IU) Fund | | | 893,622 | | | | 9,919,205 | |
aFranklin International Growth Fund, Class R6 | | | 267,691 | | | | 4,457,050 | |
aFranklin LibertyQ Emerging Markets ETF | | | 130,689 | | | | 3,892,441 | |
aTempleton Foreign Fund, Class R6 | | | 616,315 | | | | 4,394,327 | |
| | | | | | | | |
| | |
| | | | | | | 31,732,006 | |
| | | | | | | | |
| | |
Foreign Fixed Income 2.0% | | | | | | | | |
aFranklin Liberty High Yield Corporate ETF | | | 26,515 | | | | 694,303 | |
aTempleton Global Total Return Fund, Class R6 | | | 173,528 | | | | 1,924,420 | |
| | | | | | | | |
| | |
| | | | | | | 2,618,723 | |
| | | | | | | | |
| | |
Total Investments in Underlying Funds and Exchange Traded Funds
before Short Term Investments (Cost $107,205,698) | | | | | | | 127,161,475 | |
| | | | | | | | |
| | |
Short Term Investments 1.2% | | | | | | | | |
| | |
Money Market Funds (Cost $1,866) 0.0%† | | | | | | | | |
a,bInstitutional Fiduciary Trust Money Market Portfolio, 1.26% | | | 1,866 | | | | 1,866 | |
| | | | | | | | |
| | | | |
franklintempleton.com | | Annual Report | | 91 |
FRANKLIN FUND ALLOCATOR SERIES
STATEMENT OF INVESTMENTS
Franklin LifeSmart™ 2035 Retirement Target Fund(continued)
| | | | | | | | |
| | | Principal
Amount | | | Value | |
| | |
Short Term Investments(continued) | | | | | | | | |
| | |
Repurchase Agreements (Cost $1,541,507) 1.2% | | | | | | | | |
cJoint Repurchase Agreement, 1.536%, 1/02/20 (Maturity Value $1,541,639) | | | | | | | | |
BNP Paribas Securities Corp. (Maturity Value $845,342) | | | | | | | | |
Deutsche Bank Securities Inc. (Maturity Value $273,626) | | | | | | | | |
HSBC Securities (USA) Inc. (Maturity Value $422,671) | | | | | | | | |
Collateralized by U.S. Treasury Notes, 1.375% - 2.75%, 9/30/20 - 10/31/24; and U.S. Treasury Notes, Index Linked, 0.125%, 1/15/23 (valued at $1,573,210) | | $ | 1,541,507 | | | $ | 1,541,507 | |
| | | | | | | | |
| | |
Total Investments (Cost $108,749,071) 99.6% | | | | | | | 128,704,848 | |
| | |
Other Assets, less Liabilities 0.4% | | | | | | | 458,417 | |
| | | | | | | | |
| | |
Net Assets 100.0% | | | | | | $ | 129,163,265 | |
| | | | | | | | |
See Abbreviations on page 162.
†Rounds to less than 0.1% of net assets.
aSee Note 3(f) regarding investments in FT Underlying Funds.
bThe rate shown is the annualizedseven-day yield at period end.
cSee Note 1(b) regarding joint repurchase agreement.
| | | | |
| | | |
92 | | Annual Report | The accompanying notes are an integral part of these financial statements. | | franklintempleton.com |
FRANKLIN FUND ALLOCATOR SERIES
Financial Highlights
Franklin LifeSmart™ 2040 Retirement Target Fund
| | | | | | | | | | | | | | | | | | | | |
| | | Year Ended December 31, | |
| | | 2019 | | | 2018 | | | 2017 | | | 2016 | | | 2015 | |
| | | | | |
Class A | | | | | | | | | | | | | | | | | | | | |
| | | | | |
Per share operating performance | | | | | | | | | | | | | | | | | | | | |
(for a share outstanding throughout the year) | | | | | | | | | | | | | | | | | | | | |
| | | | | |
Net asset value, beginning of year | | | $11.61 | | | | $13.03 | | | | $11.20 | | | | $11.06 | | | | $11.58 | |
| | | | | |
Income from investment operationsa: | | | | | | | | | | | | | | | | | | | | |
| | | | | |
Net investment incomeb,c | | | 0.22 | | | | 0.27 | | | | 0.18 | | | | 0.14 | | | | 0.18 | |
| | | | | |
Net realized and unrealized gains (losses) | | | 2.25 | | | | (1.17 | ) | | | 1.88 | | | | 0.17 | | | | (0.40 | ) |
| | | | | |
Total from investment operations | | | 2.47 | | | | (0.90 | ) | | | 2.06 | | | | 0.31 | | | | (0.22 | ) |
| | | | | |
Less distributions from: | | | | | | | | | | | | | | | | | | | | |
| | | | | |
Net investment income and short term gains received from Underlying Funds and exchange traded funds | | | (0.18 | ) | | | (0.30 | ) | | | (0.23 | ) | | | (0.08 | ) | | | (0.15 | ) |
| | | | | |
Net realized gains | | | (0.14 | ) | | | (0.22 | ) | | | — | | | | (0.09 | ) | | | (0.15 | ) |
| | | | | |
Total distributions | | | (0.32 | ) | | | (0.52 | ) | | | (0.23 | ) | | | (0.17 | ) | | | (0.30 | ) |
| | | | | |
Net asset value, end of year | | | $13.76 | | | | $11.61 | | | | $13.03 | | | | $11.20 | | | | $11.06 | |
| | | | | |
Total returnd | | | 21.50% | | | | (7.00)% | | | | 18.50% | | | | 2.91% | | | | (1.94)% | |
| | | | | |
Ratios to average net assets | | | | | | | | | | | | | | | | | | | | |
| | | | | |
Expenses before waiver and payments by affiliatese | | | 1.18% | | | | 1.14% | | | | 1.26% | | | | 1.19% | | | | 1.40% | |
| | | | | |
Expenses net of waiver and payments by affiliatese | | | 0.34% | f | | | 0.30% | f | | | 0.30% | | | | 0.30% | | | | 0.32% | |
| | | | | |
Net investment incomec | | | 1.67% | | | | 2.03% | | | | 1.55% | | | | 1.22% | | | | 1.410% | |
| | | | | |
Supplemental data | | | | | | | | | | | | | | | | | | | | |
| | | | | |
Net assets, end of year (000’s) | | | $19,322 | | | | $15,921 | | | | $14,001 | | | | $13,213 | | | | $8,177 | |
| | | | | |
Portfolio turnover rate | | | 90.08% | | | | 41.77% | | | | 39.11% | | | | 72.22% | | | | 41.55% | |
aThe amount shown for a share outstanding throughout the period may not correlate with the Statement of Operations for the period due to the timing of sales and repurchases of the Fund’s shares in relation to income earned and/or fluctuating fair value of the investments of the Fund.
bBased on average daily shares outstanding.
cRecognition of net investment income by the Fund is affected by the timing of declaration of dividends by the Underlying Funds and exchange traded funds in which the Fund invests.
dTotal return does not reflect sales commissions or contingent deferred sales charges, if applicable.
eDoes not include expenses of the Underlying Funds and exchange traded funds in which the Fund invests. The weighted average indirect expenses of the Underlying Funds and exchange traded funds was 0.38% for the year ended December 31, 2019.
fBenefit of expense reduction rounds to less than 0.01%.
| | | | |
franklintempleton.com | | The accompanying notes are an integral part of these financial statements. | Annual Report | | 93 |
FRANKLIN FUND ALLOCATOR SERIES
FINANCIAL HIGHLIGHTS
Franklin LifeSmart™ 2040 Retirement Target Fund(continued)
| | | | | | | | | | | | | | | | | | | | |
| | | Year Ended December 31, | |
| | | 2019 | | | 2018 | | | 2017 | | | 2016 | | | 2015 | |
| | | | | |
Class C | | | | | | | | | | | | | | | | | | | | |
| | | | | |
Per share operating performance | | | | | | | | | | | | | | | | | | | | |
(for a share outstanding throughout the year) | | | | | | | | | | | | | | | | | | | | |
| | | | | |
Net asset value, beginning of year | | | $11.42 | | | | $12.83 | | | | $11.05 | | | | $10.97 | | | | $11.52 | |
| | | | | |
Income from investment operationsa: | | | | | | | | | | | | | | | | | | | | |
| | | | | |
Net investment incomeb,c | | | 0.12 | | | | 0.16 | | | | 0.11 | | | | 0.05 | | | | 0.11 | |
| | | | | |
Net realized and unrealized gains (losses) | | | 2.21 | | | | (1.14 | ) | | | 1.83 | | | | 0.18 | | | | (0.41 | ) |
| | | | | |
Total from investment operations | | | 2.33 | | | | (0.98 | ) | | | 1.94 | | | | 0.23 | | | | (0.30 | ) |
| | | | | |
Less distributions from: | | | | | | | | | | | | | | | | | | | | |
| | | | | |
Net investment income and short term gains received from Underlying Funds and exchange traded funds | | | (0.09 | ) | | | (0.21 | ) | | | (0.16 | ) | | | (0.06 | ) | | | (0.10 | ) |
| | | | | |
Net realized gains | | | (0.14 | ) | | | (0.22 | ) | | | — | | | | (0.09 | ) | | | (0.15 | ) |
| | | | | |
Total distributions | | | (0.23 | ) | | | (0.43 | ) | | | (0.16 | ) | | | (0.15 | ) | | | (0.25 | ) |
| | | | | |
Net asset value, end of year | | | $13.52 | | | | $11.42 | | | | $12.83 | | | | $11.05 | | | | $10.97 | |
| | | | | |
Total returnd | | | 20.56% | | | | (7.71)% | | | | 17.63% | | | | 2.17% | | | | (2.66)% | |
| | | | | |
Ratios to average net assets | | | | | | | | | | | | | | | | | | | | |
| | | | | |
Expenses before waiver and payments by affiliatese | | | 1.93% | | | | 1.89% | | | | 2.01% | | | | 1.94% | | | | 2.13% | |
| | | | | |
Expenses net of waiver and payments by affiliatese | | | 1.09% | f | | | 1.05% | f | | | 1.05% | | | | 1.05% | | | | 1.05% | |
| | | | | |
Net investment incomec | | | 0.92% | | | | 1.28% | | | | 0.80% | | | | 0.47% | | | | 0.68% | |
| | | | | |
Supplemental data | | | | | | | | | | | | | | | | | | | | |
| | | | | |
Net assets, end of year (000’s) | | | $5,630 | | | | $4,286 | | | | $4,015 | | | | $2,686 | | | | $1,988 | |
| | | | | |
Portfolio turnover rate | | | 90.08% | | | | 41.77% | | | | 39.11% | | | | 72.22% | | | | 41.55% | |
aThe amount shown for a share outstanding throughout the period may not correlate with the Statement of Operations for the period due to the timing of sales and repurchases of the Fund’s shares in relation to income earned and/or fluctuating fair value of the investments of the Fund.
bBased on average daily shares outstanding.
cRecognition of net investment income by the Fund is affected by the timing of declaration of dividends by the Underlying Funds and exchange traded funds in which the Fund invests.
dTotal return does not reflect sales commissions or contingent deferred sales charges, if applicable.
eDoes not include expenses of the Underlying Funds and exchange traded funds in which the Fund invests. The weighted average indirect expenses of the Underlying Funds and exchange traded funds was 0.38% for the year ended December 31, 2019.
fBenefit of expense reduction rounds to less than 0.01%.
| | | | |
| | | |
94 | | Annual Report | The accompanying notes are an integral part of these financial statements. | | franklintempleton.com |
FRANKLIN FUND ALLOCATOR SERIES
FINANCIAL HIGHLIGHTS
Franklin LifeSmart™ 2040 Retirement Target Fund(continued)
| | | | | | | | | | | | | | | | | | | | |
| | | Year Ended December 31, | |
| | | 2019 | | | 2018 | | | 2017 | | | 2016 | | | 2015 | |
| | | | | |
Class R | | | | | | | | | | | | | | | | | | | | |
| | | | | |
Per share operating performance | | | | | | | | | | | | | | | | | | | | |
(for a share outstanding throughout the year) | | | | | | | | | | | | | | | | | | | | |
| | | | | |
Net asset value, beginning of year | | | $11.60 | | | | $13.02 | | | | $11.17 | | | | $11.05 | | | | $11.58 | |
| | | | | |
Income from investment operationsa: | | | | | | | | | | | | | | | | | | | | |
| | | | | |
Net investment incomeb,c | | | 0.18 | | | | 0.22 | | | | 0.13 | | | | 0.13 | | | | 0.17 | |
| | | | | |
Net realized and unrealized gains (losses) | | | 2.25 | | | | (1.16 | ) | | | 1.91 | | | | 0.16 | | | | (0.41 | ) |
| | | | | |
Total from investment operations | | | 2.43 | | | | (0.94 | ) | | | 2.04 | | | | 0.29 | | | | (0.24 | ) |
| | | | | |
Less distributions from: | | | | | | | | | | | | | | | | | | | | |
| | | | | |
Net investment income and short term gains received from Underlying Funds and exchange traded funds | | | (0.15 | ) | | | (0.26 | ) | | | (0.19 | ) | | | (0.08 | ) | | | (0.14 | ) |
| | | | | |
Net realized gains | | | (0.14 | ) | | | (0.22 | ) | | | — | | | | (0.09 | ) | | | (0.15 | ) |
| | | | | |
Total distributions | | | (0.29 | ) | | | (0.48 | ) | | | (0.19 | ) | | | (0.17 | ) | | | (0.29 | ) |
| | | | | |
Net asset value, end of year | | | $13.74 | | | | $11.60 | | | | $13.02 | | | | $11.17 | | | | $11.05 | |
| | | | | |
Total return | | | 21.13% | | | | (7.27)% | | | | 18.31% | | | | 2.66% | | | | (2.14)% | |
| | | | | |
Ratios to average net assets | | | | | | | | | | | | | | | | | | | | |
| | | | | |
Expenses before waiver and payments by affiliatesd | | | 1.43% | | | | 1.39% | | | | 1.51% | | | | 1.43% | | | | 1.63% | |
| | | | | |
Expenses net of waiver and payments by affiliatesd | | | 0.59% | e | | | 0.55% | e | | | 0.55% | | | | 0.54% | | | | 0.55% | |
| | | | | |
Net investment incomec | | | 1.42% | | | | 1.78% | | | | 1.30% | | | | 0.98% | | | | 1.18% | |
| | | | | |
Supplemental data | | | | | | | | | | | | | | | | | | | | |
| | | | | |
Net assets, end of year (000’s) | | | $1,528 | | | | $1,273 | | | | $1,519 | | | | $2,188 | | | | $1,009 | |
| | | | | |
Portfolio turnover rate | | | 90.08% | | | | 41.77% | | | | 39.11% | | | | 72.22% | | | | 41.55% | |
aThe amount shown for a share outstanding throughout the period may not correlate with the Statement of Operations for the period due to the timing of sales and repurchases of the Fund’s shares in relation to income earned and/or fluctuating fair value of the investments of the Fund.
bBased on average daily shares outstanding.
cRecognition of net investment income by the Fund is affected by the timing of declaration of dividends by the Underlying Funds and exchange traded funds in which the Fund invests.
dDoes not include expenses of the Underlying Funds and exchange traded funds in which the Fund invests. The weighted average indirect expenses of the Underlying Funds and exchange traded funds was 0.38% for the year ended December 31, 2019.
eBenefit of expense reduction rounds to less than 0.01%.
| | | | |
franklintempleton.com | | The accompanying notes are an integral part of these financial statements. | Annual Report | | 95 |
FRANKLIN FUND ALLOCATOR SERIES
FINANCIAL HIGHLIGHTS
Franklin LifeSmart™ 2040 Retirement Target Fund(continued)
| | | | | | | | | | | | | | | | | | | | |
| | | Year Ended December 31, | |
| | | 2019 | | | 2018 | | | 2017 | | | 2016 | | | 2015 | |
| | | | | |
Class R6 | | | | | | | | | | | | | | | | | | | | |
| | | | | |
Per share operating performance | | | | | | | | | | | | | | | | | | | | |
(for a share outstanding throughout the year) | | | | | | | | | | | | | | | | | | | | |
| | | | | |
Net asset value, beginning of year | | | $11.69 | | | | $13.11 | | | | $11.26 | | | | $11.10 | | | | $11.61 | |
| | | | | |
Income from investment operationsa: | | | | | | | | | | | | | | | | | | | | |
| | | | | |
Net investment incomeb,c | | | 0.25 | | | | 0.30 | | | | 0.23 | | | | 0.16 | | | | 0.19 | |
| | | | | |
Net realized and unrealized gains (losses) | | | 2.27 | | | | (1.16 | ) | | | 1.89 | | | | 0.18 | | | | (0.37 | ) |
| | | | | |
Total from investment operations | | | 2.52 | | | | (0.86 | ) | | | 2.12 | | | | 0.34 | | | | (0.18 | ) |
| | | | | |
Less distributions from: | | | | | | | | | | | | | | | | | | | | |
| | | | | |
Net investment income and short term gains received from Underlying Funds and exchange traded funds | | | (0.22 | ) | | | (0.34 | ) | | | (0.27 | ) | | | (0.09 | ) | | | (0.18 | ) |
| | | | | |
Net realized gains | | | (0.14 | ) | | | (0.22 | ) | | | — | | | | (0.09 | ) | | | (0.15 | ) |
| | | | | |
Total distributions | | | (0.36 | ) | | | (0.56 | ) | | | (0.27 | ) | | | (0.18 | ) | | | (0.33 | ) |
| | | | | |
Net asset value, end of year | | | $13.85 | | | | $11.69 | | | | $13.11 | | | | $11.26 | | �� | | $11.10 | |
| | | | | |
Total return | | | 21.89% | | | | (6.77)% | | | | 18.92% | | | | 3.16% | | | | (1.62)% | |
| | | | | |
Ratios to average net assets | | | | | | | | | | | | | | | | | | | | |
| | | | | |
Expenses before waiver and payments by affiliatesd | | | 0.58% | | | | 0.58% | | | | 0.61% | | | | 0.65% | | | | 0.82% | |
| | | | | |
Expenses net of waiver and payments by affiliatesd | | | 0.04% | e | | | —% | e | | | —% | | | | —% | | | | —% | |
| | | | | |
Net investment incomec | | | 1.97% | | | | 2.33% | | | | 1.85% | | | | 1.52% | | | | 1.73% | |
| | | | | |
Supplemental data | | | | | | | | | | | | | | | | | | | | |
| | | | | |
Net assets, end of year (000’s) | | | $22,250 | | | | $18,247 | | | | $17,521 | | | | $13,867 | | | | $12,037 | |
| | | | | |
Portfolio turnover rate | | | 90.08% | | | | 41.77% | | | | 39.11% | | | | 72.22% | | | | 41.55% | |
aThe amount shown for a share outstanding throughout the period may not correlate with the Statement of Operations for the period due to the timing of sales and repurchases of the Fund’s shares in relation to income earned and/or fluctuating fair value of the investments of the Fund.
bBased on average daily shares outstanding.
cRecognition of net investment income by the Fund is affected by the timing of declaration of dividends by the Underlying Funds and exchange traded funds in which the Fund invests.
dDoes not include expenses of the Underlying Funds and exchange traded funds in which the Fund invests. The weighted average indirect expenses of the Underlying Funds and exchange traded funds was 0.38% for the year ended December 31, 2019.
eBenefit of expense reduction rounds to less than 0.01%.
| | | | |
| | | |
96 | | Annual Report | The accompanying notes are an integral part of these financial statements. | | franklintempleton.com |
FRANKLIN FUND ALLOCATOR SERIES
FINANCIAL HIGHLIGHTS
Franklin LifeSmart™ 2040 Retirement Target Fund(continued)
| | | | | | | | | | | | | | | | | | | | |
| | | Year Ended December 31, | |
| | | 2019 | | | 2018 | | | 2017 | | | 2016 | | | 2015 | |
| | | | | |
Advisor Class | | | | | | | | | | | | | | | | | | | | |
| | | | | |
Per share operating performance | | | | | | | | | | | | | | | | | | | | |
(for a share outstanding throughout the year) | | | | | | | | | | | | | | | | | | | | |
| | | | | |
Net asset value, beginning of year | | | $11.67 | | | | $13.10 | | | | $11.25 | | | | $11.09 | | | | $11.61 | |
| | | | | |
Income from investment operationsa: | | | | | | | | | | | | | | | | | | | | |
| | | | | |
Net investment incomeb,c | | | 0.33 | | | | 0.27 | | | | 0.22 | | | | 0.15 | | | | 0.40 | |
| | | | | |
Net realized and unrealized gains (losses) | | | 2.18 | | | | (1.15 | ) | | | 1.89 | | | | 0.19 | | | | (0.59 | ) |
| | | | | |
Total from investment operations | | | 2.51 | | | | (0.88 | ) | | | 2.11 | | | | 0.34 | | | | (0.19 | ) |
| | | | | |
Less distributions from: | | | | | | | | | | | | | | | | | | | | |
| | | | | |
Net investment income and short term gains received from Underlying Funds and exchange traded funds | | | (0.22 | ) | | | (0.33 | ) | | | (0.26 | ) | | | (0.09 | ) | | | (0.18 | ) |
| | | | | |
Net realized gains | | | (0.14 | ) | | | (0.22 | ) | | | — | | | | (0.09 | ) | | | (0.15 | ) |
| | | | | |
Total distributions | | | (0.36 | ) | | | (0.55 | ) | | | (0.26 | ) | | | (0.18 | ) | | | (0.33 | ) |
| | | | | |
Net asset value, end of year | | | $13.82 | | | | $11.67 | | | | $13.10 | | | | $11.25 | | | | $11.09 | |
| | | | | |
Total return | | | 21.68% | | | | (6.82)% | | | | 18.88% | | | | 3.15% | | | | (1.72)% | |
| | | | | |
Ratios to average net assets | | | | | | | | | | | | | | | | | | | | |
| | | | | |
Expenses before waiver and payments by affiliatesd | | | 0.93% | | | | 0.89% | | | | 1.01% | | | | 0.94% | | | | 1.13% | |
| | | | | |
Expenses net of waiver and payments by affiliatesd | | | 0.09% | e | | | 0.05% | e | | | 0.05% | | | | 0.05% | | | | 0.05% | |
| | | | | |
Net investment incomec | | | 1.92% | | | | 2.28% | | | | 1.80% | | | | 1.47% | | | | 1.68% | |
| | | | | |
Supplemental data | | | | | | | | | | | | | | | | | | | | |
| | | | | |
Net assets, end of year (000’s) | | | $146 | | | | $165 | | | | $155 | | | | $141 | | | | $121 | |
| | | | | |
Portfolio turnover rate | | | 90.08% | | | | 41.77% | | | | 39.11% | | | | 72.22% | | | | 41.55% | |
aThe amount shown for a share outstanding throughout the period may not correlate with the Statement of Operations for the period due to the timing of sales and repurchases of the Fund’s shares in relation to income earned and/or fluctuating fair value of the investments of the Fund.
bBased on average daily shares outstanding.
cRecognition of net investment income by the Fund is affected by the timing of declaration of dividends by the Underlying Funds and exchange traded funds in which the Fund invests.
dDoes not include expenses of the Underlying Funds and exchange traded funds in which the Fund invests. The weighted average indirect expenses of the Underlying Funds and exchange traded funds was 0.38% for the year ended December 31, 2019.
eBenefit of expense reduction rounds to less than 0.01%.
| | | | |
franklintempleton.com | | The accompanying notes are an integral part of these financial statements. | Annual Report | | 97 |
FRANKLIN FUND ALLOCATOR SERIES
Statement of Investments, December 31, 2019
Franklin LifeSmart™ 2040 Retirement Target Fund
| | | | | | | | |
| | | Shares | | | Value | |
| | |
Investments in Underlying Funds and Exchange Traded Funds 98.1% | | | | | | | | |
| | |
Domestic Equity 59.1% | | | | | | | | |
aFranklin Growth Fund, Class R6 | | | 77,144 | | | $ | 8,663,276 | |
aFranklin LibertyQ U.S. Equity ETF | | | 231,255 | | | | 8,091,613 | |
aFranklin Rising Dividends Fund, Class R6 | | | 62,382 | | | | 4,338,643 | |
aFranklin U.S. Core Equity (IU) Fund | | | 666,552 | | | | 7,192,094 | |
Vanguard S&P 500 ETF | | | 2,025 | | | | 598,995 | |
| | | | | | | | |
| | |
| | | | | | | 28,884,621 | |
| | | | | | | | |
| | |
Domestic Fixed Income 12.0% | | | | | | | | |
aFranklin Liberty U.S. Core Bond ETF | | | 121,261 | | | | 3,042,427 | |
aFranklin Low Duration Total Return Fund, Class R6 | | | 125,414 | | | | 1,215,264 | |
iShares Core U.S. Aggregate Bond ETF | | | 11,855 | | | | 1,332,146 | |
Vanguard Intermediate-Term Corporate Bond ETF | | | 3,228 | | | | 294,813 | |
| | | | | | | | |
| | |
| | | | | | | 5,884,650 | |
| | | | | | | | |
| | |
Foreign Equity 26.6% | | | | | | | | |
aFranklin Emerging Market Core Equity (IU) Fund | | | 218,766 | | | | 2,391,108 | |
aFranklin FTSE Europe ETF | | | 35,382 | | | | 893,395 | |
aFranklin FTSE Japan ETF | | | 16,520 | | | | 431,998 | |
aFranklin International Core Equity (IU) Fund | | | 367,132 | | | | 4,075,168 | |
aFranklin International Growth Fund, Class R6 | | | 108,782 | | | | 1,811,218 | |
aFranklin LibertyQ Emerging Markets ETF | | | 53,610 | | | | 1,596,720 | |
aTempleton Foreign Fund, Class R6 | | | 256,224 | | | | 1,826,881 | |
| | | | | | | | |
| | |
| | | | | | | 13,026,488 | |
| | | | | | | | |
| | |
Foreign Fixed Income 0.4% | | | | | | | | |
aFranklin Liberty High Yield Corporate ETF | | | 6,604 | | | | 172,928 | |
| | | | | | | | |
| | |
Total Investments in Underlying Funds and Exchange Traded Funds
before Short Term Investments (Cost $41,696,657) | | | | | | | 47,968,687 | |
| | | | | | | | |
| | |
Short Term Investments 1.8% | | | | | | | | |
| | |
Money Market Funds (Cost $800,528) 1.7% | | | | | | | | |
a,bInstitutional Fiduciary Trust Money Market Portfolio, 1.26% | | | 800,528 | | | | 800,528 | |
| | | | | | | | |
| | | | |
| | | |
98 | | Annual Report | | franklintempleton.com |
FRANKLIN FUND ALLOCATOR SERIES
STATEMENT OF INVESTMENTS
Franklin LifeSmart™ 2040 Retirement Target Fund(continued)
| | | | | | | | |
| | | Principal
Amount | | | Value | |
| | |
Short Term Investments (continued) | | | | | | | | |
| | |
Repurchase Agreements (Cost $66,841) 0.1% | | | | | | | | |
cJoint Repurchase Agreement, 1.536%, 1/02/20 (Maturity Value $66,847) | | | | | | | | |
BNP Paribas Securities Corp. (Maturity Value $36,655) | | | | | | | | |
Deutsche Bank Securities Inc. (Maturity Value $11,865) | | | | | | | | |
HSBC Securities (USA) Inc. (Maturity Value $18,327) | | | | | | | | |
Collateralized by U.S. Treasury Notes, 1.375% - 2.75%, 9/30/20 - 10/31/24; and U.S. Treasury Notes, Index Linked, 0.125%, 1/15/23 (valued at $68,215) | | $ | 66,841 | | | $ | 66,841 | |
| | | | | | | | |
| | |
Total Investments (Cost $42,564,026) 99.9% | | | | | | | 48,836,056 | |
| | |
Other Assets, less Liabilities 0.1% | | | | | | | 40,721 | |
| | | | | | | | |
| | |
Net Assets 100.0% | | | | | | $ | 48,876,777 | |
| | | | | | | | |
See Abbreviations on page 162.
aSee Note 3(f) regarding investments in FT Underlying Funds.
bThe rate shown is the annualizedseven-day effective yield at period end.
cSee Note 1(b) regarding joint repurchase agreement.
| | | | | | |
franklintempleton.com | | The accompanying notes are an integral part of these financial statements. | | Annual Report | | 99 |
FRANKLIN FUND ALLOCATOR SERIES
Financial Highlights
Franklin LifeSmart��� 2045 Retirement Target Fund
| | | | | | | | | | | | | | | | | | | | |
| | | Year Ended December 31, | |
| | | 2019 | | | 2018 | | | 2017 | | | 2016 | | | 2015 | |
| | | | | |
Class A | | | | | | | | | | | | | | | | | | | | |
| | | | | |
Per share operating performance | | | | | | | | | | | | | | | | | | | | |
(for a share outstanding throughout the year) | | | | | | | | | | | | | | | | | | | | |
| | | | | |
Net asset value, beginning of year | | | $12.04 | | | | $13.78 | | | | $11.86 | | | | $11.75 | | | | $12.70 | |
| | | | | |
Income from investment operationsa: | | | | | | | | | | | | | | | | | | | | |
| | | | | |
Net investment incomeb,c | | | 0.21 | | | | 0.27 | | | | 0.20 | | | | 0.14 | | | | 0.16 | |
| | | | | |
Net realized and unrealized gains (losses) | | | 2.45 | | | | (1.26 | ) | | | 2.01 | | | | 0.24 | | | | (0.42 | ) |
| | | | | |
Total from investment operations | | | 2.66 | | | | (0.99 | ) | | | 2.21 | | | | 0.38 | | | | (0.26 | ) |
| | | | | |
Less distributions from: | | | | | | | | | | | | | | | | | | | | |
| | | | | |
Net investment income and short term gains received from Underlying Funds and exchange traded funds | | | (0.21 | ) | | | (0.27 | ) | | | (0.29 | ) | | | (0.10 | ) | | | (0.17 | ) |
| | | | | |
Net realized gains | | | (0.22 | ) | | | (0.48 | ) | | | — | | | | (0.17 | ) | | | (0.52 | ) |
| | | | | |
Total distributions | | | (0.43 | ) | | | (0.75 | ) | | | (0.29 | ) | | | (0.27 | ) | | | (0.69 | ) |
| | | | | |
Net asset value, end of year | | | $14.27 | | | | $12.04 | | | | $13.78 | | | | $11.86 | | | | $11.75 | |
| | | | | |
Total returnd | | | 22.33% | | | | (7.42)% | | | | 18.72% | | | | 3.29% | | | | (2.17)% | |
| | | | | |
Ratios to average net assets | | | | | | | | | | | | | | | | | | | | |
| | | | | |
Expenses before waiver and payments by affiliatese | | | 0.98% | | | | 0.93% | | | | 1.01% | | | | 0.97% | | | | 1.01% | |
| | | | | |
Expenses net of waiver and payments by affiliatese | | | 0.34% | f | | | 0.30% | f | | | 0.30% | | | | 0.30% | | | | 0.33% | |
| | | | | |
Net investment incomec | | | 1.57% | | | | 1.91% | | | | 1.53% | | | | 1.15% | | | | 1.26% | |
| | | | | |
Supplemental data | | | | | | | | | | | | | | | | | | | | |
| | | | | |
Net assets, end of year (000’s) | | | $51,412 | | | | $44,978 | | | | $46,783 | | | | $44,521 | | | | $38,444 | |
| | | | | |
Portfolio turnover rate | | | 86.25% | | | | 43.20% | | | | 31.69% | | | | 75.72% | | | | 34.07% | |
aThe amount shown for a share outstanding throughout the period may not correlate with the Statement of Operations for the period due to the timing of sales and repurchases of the Fund’s shares in relation to income earned and/or fluctuating fair value of the investments of the Fund.
bBased on average daily shares outstanding.
cRecognition of net investment income by the Fund is affected by the timing of declaration of dividends by the Underlying Funds and exchange traded funds in which the Fund invests.
dTotal return does not reflect sales commissions or contingent deferred sales charges, if applicable.
eDoes not include expenses of the Underlying Funds and exchange traded funds in which the Fund invests. The weighted average indirect expenses of the Underlying Funds and exchange traded funds was 0.38% for the year ended December 31, 2019.
fBenefit of expense reduction rounds to less than 0.01%.
| | | | |
| | | |
100 | | Annual Report | The accompanying notes are an integral part of these financial statements. | | franklintempleton.com |
FRANKLIN FUND ALLOCATOR SERIES
FINANCIAL HIGHLIGHTS
Franklin LifeSmart™ 2045 Retirement Target Fund(continued)
| | | | | | | | | | | | | | | | | | | | |
| | | Year Ended December 31, | |
| | | 2019 | | | 2018 | | | 2017 | | | 2016 | | | 2015 | |
| | | | | |
Class C | | | | | | | | | | | | | | | | | | | | |
| | | | | |
Per share operating performance | | | | | | | | | | | | | | | | | | | | |
(for a share outstanding throughout the year) | | | | | | | | | | | | | | | | | | | | |
| | | | | |
Net asset value, beginning of year | | | $11.72 | | | | $13.44 | | | | $11.57 | | | | $11.48 | | | | $12.42 | |
| | | | | |
Income from investment operationsa: | | | | | | | | | | | | | | | | | | | | |
| | | | | |
Net investment incomeb,c | | | 0.11 | | | | 0.15 | | | | 0.10 | | | | 0.04 | | | | 0.07 | |
| | | | | |
Net realized and unrealized gains (losses) | | | 2.38 | | | | (1.22 | ) | | | 1.96 | | | | 0.23 | | | | (0.40 | ) |
| | | | | |
Total from investment operations | | | 2.49 | | | | (1.07 | ) | | | 2.06 | | | | 0.27 | | | | (0.33 | ) |
| | | | | |
Less distributions from: | | | | | | | | | | | | | | | | | | | | |
| | | | | |
Net investment income and short term gains received from Underlying Funds | | | (0.11 | ) | | | (0.17 | ) | | | (0.19 | ) | | | (0.01 | ) | | | (0.09 | ) |
| | | | | |
Net realized gains | | | (0.22 | ) | | | (0.48 | ) | | | — | | | | (0.17 | ) | | | (0.52 | ) |
| | | | | |
Total distributions | | | (0.33 | ) | | | (0.65 | ) | | | (0.19 | ) | | | (0.18 | ) | | | (0.61 | ) |
| | | | | |
Net asset value, end of year | | | $13.88 | | | | $11.72 | | | | $13.44 | | | | $11.57 | | | | $11.48 | |
| | | | | |
Total returnd | | | 21.35% | | | | (8.07)% | | | | 17.92% | | | | 2.43% | | | | (2.82)% | |
| | | | | |
Ratios to average net assets | | | | | | | | | | | | | | | | | | | | |
| | | | | |
Expenses before waiver and payments by affiliatese | | | 1.73% | | | | 1.67% | | | | 1.75% | | | | 1.72% | | | | 1.73% | |
| | | | | |
Expenses net of waiver and payments by affiliatese | | | 1.09% | f | | | 1.04% | f | | | 1.04% | | | | 1.05% | | | | 1.05% | |
| | | | | |
Net investment incomec | | | 0.82% | | | | 1.17% | | | | 0.79% | | | | 0.40% | | | | 0.54% | |
| | | | | |
Supplemental data | | | | | | | | | | | | | | | | | | | | |
| | | | | |
Net assets, end of year (000’s) | | | $13,333 | | | | $11,738 | | | | $13,190 | | | | $12,527 | | | | $12,850 | |
| | | | | |
Portfolio turnover rate | | | 86.25% | | | | 43.20% | | | | 31.69% | | | | 75.72% | | | | 34.07% | |
aThe amount shown for a share outstanding throughout the period may not correlate with the Statement of Operations for the period due to the timing of sales and repurchases of the Fund’s shares in relation to income earned and/or fluctuating fair value of the investments of the Fund.
bBased on average daily shares outstanding.
cRecognition of net investment income by the Fund is affected by the timing of declaration of dividends by the Underlying Funds and exchange traded funds in which the Fund invests.
dTotal return does not reflect sales commissions or contingent deferred sales charges, if applicable.
eDoes not include expenses of the Underlying Funds and exchange traded funds in which the Fund invests. The weighted average indirect expenses of the Underlying Funds and exchange traded funds was 0.38% for the year ended December 31, 2019.
fBenefit of expense reduction rounds to less than 0.01%.
| | | | |
franklintempleton.com | | The accompanying notes are an integral part of these financial statements. | Annual Report | | 101 |
FRANKLIN FUND ALLOCATOR SERIES
FINANCIAL HIGHLIGHTS
Franklin LifeSmart™ 2045 Retirement Target Fund(continued)
| | | | | | | | | | | | | | | | | | | | |
| | | Year Ended December 31, | |
| | | 2019 | | | 2018 | | | 2017 | | | 2016 | | | 2015 | |
| | | | | |
Class R | | | | | | | | | | | | | | | | | | | | |
| | | | | |
Per share operating performance | | | | | | | | | | | | | | | | | | | | |
(for a share outstanding throughout the year) | | | | | | | | | | | | | | | | | | | | |
| | | | | |
Net asset value, beginning of year | | | $11.98 | | | | $13.72 | | | | $11.81 | | | | $11.71 | | | | $12.66 | |
| | | | | |
Income from investment operationsa: | | | | | | | | | | | | | | | | | | | | |
| | | | | |
Net investment incomeb,c | | | 0.17 | | | | 0.23 | | | | 0.17 | | | | 0.11 | | | | 0.14 | |
| | | | | |
Net realized and unrealized gains (losses) | | | 2.45 | | | | (1.25 | ) | | | 2.00 | | | | 0.23 | | | | (0.42 | ) |
| | | | | |
Total from investment operations | | | 2.62 | | | | (1.02 | ) | | | 2.17 | | | | 0.34 | | | | (0.28 | ) |
| | | | | |
Less distributions from: | | | | | | | | | | | | | | | | | | | | |
| | | | | |
Net investment income and short term gains received from Underlying Funds and exchange traded funds | | | (0.18 | ) | | | (0.24 | ) | | | (0.26 | ) | | | (0.07 | ) | | | (0.15 | ) |
| | | | | |
Net realized gains | | | (0.22 | ) | | | (0.48 | ) | | | — | | | | (0.17 | ) | | | (0.52 | ) |
| | | | | |
Total distributions | | | (0.40 | ) | | | (0.72 | ) | | | (0.26 | ) | | | (0.24 | ) | | | (0.67 | ) |
| | | | | |
Net asset value, end of year | | | $14.20 | | | | $11.98 | | | | $13.72 | | | | $11.81 | | | | $11.71 | |
| | | | | |
Total return | | | 21.95% | | | | (7.61)% | | | | 18.43% | | | | 2.99% | | | | (2.35)% | |
| | | | | |
Ratios to average net assets | | | | | | | | | | | | | | | | | | | | |
| | | | | |
Expenses before waiver and payments by affiliatesd | | | 1.22% | | | | 1.17% | | | | 1.26% | | | | 1.22% | | | | 1.23% | |
| | | | | |
Expenses net of waiver and payments by affiliatesd | | | 0.58% | e | | | 0.54% | e | | | 0.55% | | | | 0.55% | | | | 0.55% | |
| | | | | |
Net investment incomec | | | 1.33% | | | | 1.67% | | | | 1.28% | | | | 0.90% | | | | 1.04% | |
| | | | | |
Supplemental data | | | | | | | | | | | | | | | | | | | | |
| | | | | |
Net assets, end of year (000’s) | | | $4,838 | | | | $5,146 | | | | $5,464 | | | | $4,682 | | | | $4,327 | |
| | | | | |
Portfolio turnover rate | | | 86.25% | | | | 43.20% | | | | 31.69% | | | | 75.72% | | | | 34.07% | |
aThe amount shown for a share outstanding throughout the period may not correlate with the Statement of Operations for the period due to the timing of sales and repurchases of the Fund’s shares in relation to income earned and/or fluctuating fair value of the investments of the Fund.
bBased on average daily shares outstanding.
cRecognition of net investment income by the Fund is affected by the timing of declaration of dividends by the Underlying Funds and exchange traded funds in which the Fund invests.
dDoes not include expenses of the Underlying Funds and exchange traded funds in which the Fund invests. The weighted average indirect expenses of the Underlying Funds and exchange traded funds was 0.38% for the year ended December 31, 2019.
eBenefit of expense reduction rounds to less than 0.01%.
| | | | |
| | | |
102 | | Annual Report | The accompanying notes are an integral part of these financial statements. | | franklintempleton.com |
FRANKLIN FUND ALLOCATOR SERIES
FINANCIAL HIGHLIGHTS
Franklin LifeSmart™ 2045 Retirement Target Fund(continued)
| | | | | | | | | | | | | | | | | | | | |
| | | Year Ended December 31, | |
| | | 2019 | | | 2018 | | | 2017 | | | 2016 | | | 2015 | |
| | | | | |
Class R6 | | | | | | | | | | | | | | | | | | | | |
| | | | | |
Per share operating performance | | | | | | | | | | | | | | | | | | | | |
(for a share outstanding throughout the year) | | | | | | | | | | | | | | | | | | | | |
| | | | | |
Net asset value, beginning of year | | | $12.12 | | | | $13.88 | | | | $11.94 | | | | $11.83 | | | | $12.77 | |
| | | | | |
Income from investment operationsa: | | | | | | | | | | | | | | | | | | | | |
| | | | | |
Net investment incomeb,c | | | 0.27 | | | | 0.30 | | | | 0.25 | | | | 0.17 | | | | 0.21 | |
| | | | | |
Net realized and unrealized gains (losses) | | | 2.46 | | | | (1.27 | ) | | | 2.02 | | | | 0.24 | | | | (0.42 | ) |
| | | | | |
Total from investment operations | | | 2.73 | | | | (0.97 | ) | | | 2.27 | | | | 0.41 | | | | (0.21 | ) |
| | | | | |
Less distributions from: | | | | | | | | | | | | | | | | | | | | |
| | | | | |
Net investment income and short term gains received from Underlying Funds and exchange traded funds | | | (0.25 | ) | | | (0.31 | ) | | | (0.33 | ) | | | (0.13 | ) | | | (0.21 | ) |
| | | | | |
Net realized gains | | | (0.22 | ) | | | (0.48 | ) | | | — | | | | (0.17 | ) | | | (0.52 | ) |
| | | | | |
Total distributions | | | (0.47 | ) | | | (0.79 | ) | | | (0.33 | ) | | | (0.30 | ) | | | (0.73 | ) |
| | | | | |
Net asset value, end of year | | | $14.38 | | | | $12.12 | | | | $13.88 | | | | $11.94 | | | | $11.83 | |
| | | | | |
Total return | | | 22.69% | | | | (7.16)% | | | | 19.10% | | | | 3.55% | | | | (1.77)% | |
| | | | | |
Ratios to average net assets | | | | | | | | | | | | | | | | | | | | |
| | | | | |
Expenses before waiver and payments by affiliatesd | | | 0.46% | | | | 0.46% | | | | 0.43% | | | | 0.44% | | | | 0.45% | |
| | | | | |
Expenses net of waiver and payments by affiliatesd | | | 0.04% | e | | | —% | e | | | —% | | | | —% | | | | —% | |
| | | | | |
Net investment incomec | | | 1.87% | | | | 2.21% | | | | 1.83% | | | | 1.45% | | | | 1.59% | |
| | | | | |
Supplemental data | | | | | | | | | | | | | | | | | | | | |
| | | | | |
Net assets, end of year (000’s) | | | $20,022 | | | | $12,681 | | | | $13,787 | | | | $10,912 | | | | $10,975 | |
| | | | | |
Portfolio turnover rate | | | 86.25% | | | | 43.20% | | | | 31.69% | | | | 75.72% | | | | 34.07% | |
aThe amount shown for a share outstanding throughout the period may not correlate with the Statement of Operations for the period due to the timing of sales and repurchases of the Fund’s shares in relation to income earned and/or fluctuating fair value of the investments of the Fund.
bBased on average daily shares outstanding.
cRecognition of net investment income by the Fund is affected by the timing of declaration of dividends by the Underlying Funds and exchange traded funds in which the Fund invests.
dDoes not include expenses of the Underlying Funds and exchange traded funds in which the Fund invests. The weighted average indirect expenses of the Underlying Funds and exchange traded funds was 0.38% for the year ended December 31, 2019.
eBenefit of expense reduction rounds to less than 0.01%.
| | | | |
franklintempleton.com | | The accompanying notes are an integral part of these financial statements. | Annual Report | | 103 |
FRANKLIN FUND ALLOCATOR SERIES
FINANCIAL HIGHLIGHTS
Franklin LifeSmart™ 2045 Retirement Target Fund(continued)
| | | | | | | | | | | | | | | | | | | | |
| | | Year Ended December 31, | |
| | | 2019 | | | 2018 | | | 2017 | | | 2016 | | | 2015 | |
| | | | | |
Advisor Class | | | | | | | | | | | | | | | | | | | | |
| | | | | |
Per share operating performance | | | | | | | | | | | | | | | | | | | | |
(for a share outstanding throughout the year) | | | | | | | | | | | | | | | | | | | | |
| | | | | |
Net asset value, beginning of year | | | $12.13 | | | | $13.88 | | | | $11.94 | | | | $11.83 | | | | $12.76 | |
| | | | | |
Income from investment operationsa: | | | | | | | | | | | | | | | | | | | | |
| | | | | |
Net investment incomeb,c | | | 0.25 | | | | 0.31 | | | | 0.23 | | | | 0.15 | | | | 0.13 | |
| | | | | |
Net realized and unrealized gains (losses) | | | 2.46 | | | | (1.28 | ) | | | 2.03 | | | | 0.25 | | | | (0.34 | ) |
| | | | | |
Total from investment operations | | | 2.71 | | | | (0.97 | ) | | | 2.26 | | | | 0.40 | | | | (0.21 | ) |
| | | | | |
Less distributions from: | | | | | | | | | | | | | | | | | | | | |
| | | | | |
Net investment income and short term gains received from Underlying Funds and exchange traded funds | | | (0.24 | ) | | | (0.30 | ) | | | (0.32 | ) | | | (0.12 | ) | | | (0.20 | ) |
| | | | | |
Net realized gains | | | (0.22 | ) | | | (0.48 | ) | | | — | | | | (0.17 | ) | | | (0.52 | ) |
| | | | | |
Total distributions | | | (0.46 | ) | | | (0.78 | ) | | | (0.32 | ) | | | (0.29 | ) | | | (0.72 | ) |
| | | | | |
Net asset value, end of year | | | $14.38 | | | | $12.13 | | | | $13.88 | | | | $11.94 | | | | $11.83 | |
| | | | | |
Total return | | | 22.53% | | | | (7.13)% | | | | 19.04% | | | | 3.49% | | | | (1.82)% | |
| | | | | |
Ratios to average net assets | | | | | | | | | | | | | | | | | | | | |
| | | | | |
Expenses before waiver and payments by affiliatesd | | | 0.73% | | | | 0.68% | | | | 0.76% | | | | 0.72% | | | | 0.73% | |
| | | | | |
Expenses net of waiver and payments by affiliatesd | | | 0.09% | e | | | 0.05% | e | | | 0.05% | | | | 0.05% | | | | 0.05% | |
| | | | | |
Net investment incomec | | | 1.82% | | | | 2.16% | | | | 1.78% | | | | 1.40% | | | | 1.54% | |
| | | | | |
Supplemental data | | | | | | | | | | | | | | | | | | | | |
| | | | | |
Net assets, end of year (000’s) | | | $819 | | | | $639 | | | | $602 | | | | $479 | | | | $532 | |
| | | | | |
Portfolio turnover rate | | | 86.25% | | | | 43.20% | | | | 31.69% | | | | 75.72% | | | | 34.07% | |
aThe amount shown for a share outstanding throughout the period may not correlate with the Statement of Operations for the period due to the timing of sales and repurchases of the Fund’s shares in relation to income earned and/or fluctuating fair value of the investments of the Fund.
bBased on average daily shares outstanding.
cRecognition of net investment income by the Fund is affected by the timing of declaration of dividends by the Underlying Funds and exchange traded funds in which the Fund invests.
dDoes not include expenses of the Underlying Funds and exchange traded funds in which the Fund invests. The weighted average indirect expenses of the Underlying Funds and exchange traded funds was 0.38% for the year ended December 31, 2019.
eBenefit of expense reduction rounds to less than 0.01%.
| | | | |
| | | |
104 | | Annual Report | The accompanying notes are an integral part of these financial statements. | | franklintempleton.com |
FRANKLIN FUND ALLOCATOR SERIES
Statement of Investments, December 31, 2019
Franklin LifeSmart™ 2045 Retirement Target Fund
| | | | | | | | |
| | | Shares | | | Value | |
| | |
Investments in Underlying Funds and Exchange Traded Funds 98.9% | | | | | | | | |
| | |
Domestic Equity 63.8% | | | | | | | | |
aFranklin Growth Fund, Class R6 | | | 153,975 | | | $ | 17,291,424 | |
aFranklin LibertyQ U.S. Equity ETF | | | 461,440 | | | | 16,145,786 | |
aFranklin Rising Dividends Fund, Class R6 | | | 124,504 | | | | 8,659,213 | |
aFranklin U.S. Core Equity (IU) Fund | | | 1,330,664 | | | | 14,357,868 | |
Vanguard S&P 500 ETF | | | 3,975 | | | | 1,175,806 | |
| | | | | | | | |
| | |
| | | | | | | 57,630,097 | |
| | | | | | | | |
| | |
Domestic Fixed Income 6.5% | | | | | | | | |
aFranklin Liberty U.S. Core Bond ETF | | | 117,400 | | | | 2,945,554 | |
iShares Core U.S. Aggregate Bond ETF | | | 26,271 | | | | 2,952,072 | |
| | | | | | | | |
| | |
| | | | | | | 5,897,626 | |
| | | | | | | | |
| | |
Foreign Equity 28.6% | | | | | | | | |
aFranklin Emerging Market Core Equity (IU) Fund | | | 443,002 | | | | 4,842,006 | |
aFranklin FTSE Europe ETF | | | 69,484 | | | | 1,754,471 | |
aFranklin FTSE Japan ETF | | | 32,473 | | | | 849,169 | |
aFranklin International Core Equity (IU) Fund | | | 720,809 | | | | 8,000,985 | |
aFranklin International Growth Fund, Class R6 | | | 215,967 | | | | 3,595,852 | |
aFranklin LibertyQ Emerging Markets ETF | | | 109,601 | | | | 3,264,356 | |
aTempleton Foreign Fund, Class R6 | | | 497,170 | | | | 3,544,825 | |
| | | | | | | | |
| | |
| | | | | | | 25,851,664 | |
| | | | | | | | |
| | |
Total Investments in Underlying Funds and Exchange Traded Funds before Short Term Investments (Cost $74,027,828) | | | | | | | 89,379,387 | |
| | | | | | | | |
| | |
Short Term Investments 1.6% | | | | | | | | |
| | |
Money Market Funds (Cost $648,227) 0.7% | | | | | | | | |
a,bInstitutional Fiduciary Trust Money Market Portfolio, 1.26% | | | 648,227 | | | | 648,227 | |
| | | | | | | | |
| | | | |
franklintempleton.com | | Annual Report | | 105 |
FRANKLIN FUND ALLOCATOR SERIES STATEMENT OF INVESTMENTS
Franklin LifeSmart™ 2045 Retirement Target Fund(continued)
| | | | | | | | |
| | | Principal
Amount | | | Value | |
| | |
Short Term Investments(continued) | | | | | | | | |
| | |
Repurchase Agreements (Cost $833,516) 0.9% | | | | | | | | |
cJoint Repurchase Agreement, 1.536%, 1/02/20 (Maturity Value $833,587) | | | | | | | | |
BNP Paribas Securities Corp. (Maturity Value $457,089) | | | | | | | | |
Deutsche Bank Securities Inc. (Maturity Value $147,953) | | | | | | | | |
HSBC Securities (USA) Inc. (Maturity Value $228,545) | | | | | | | | |
Collateralized by U.S. Treasury Notes, 1.375% - 2.75%, 9/30/20 - 10/31/24; and U.S. Treasury Notes, Index Linked, 0.125%, 1/15/23 (valued at $850,658) | | $ | 833,516 | | | $ | 833,516 | |
| | | | | | | | |
| | |
Total Investments (Cost $75,509,571) 100.5% | | | | | | | 90,861,130 | |
| | |
Other Assets, less Liabilities (0.5)% | | | | | | | (438,306 | ) |
| | | | | | | | |
| | |
Net Assets 100.0% | | | | | | $ | 90,422,824 | |
| | | | | | | | |
See Abbreviations on page 162.
aSee Note 3(f) regarding investments in FT Underlying Funds.
bThe rate shown is the annualizedseven-day effective yield at period end.
cSee Note 1(b) regarding joint repurchase agreement.
| | | | |
| | | |
106 | | Annual Report | The accompanying notes are an integral part of these financial statements. | | franklintempleton.com |
FRANKLIN FUND ALLOCATOR SERIES
Financial Highlights
Franklin LifeSmart™ 2050 Retirement Target Fund
| | | | | | | | | | | | | | | | | | | | |
| | | Year Ended December 31, | |
| | | 2019 | | | 2018 | | | 2017 | | | 2016 | | | 2015 | |
| | | | | |
Class A | | | | | | | | | | | | | | | | | | | | |
| | | | | |
Per share operating performance | | | | | | | | | | | | | | | | | | | | |
(for a share outstanding throughout the year) | | | | | | | | | | | | | | | | | | | | |
| | | | | |
Net asset value, beginning of year | | | $11.74 | | | | $13.19 | | | | $11.29 | | | | $11.11 | | | | $11.62 | |
| | | | | |
Income from investment operationsa: | | | | | | | | | | | | | | | | | | | | |
| | | | | |
Net investment incomeb,c | | | 0.19 | | | | 0.27 | | | | 0.20 | | | | 0.14 | | | | 0.22 | |
| | | | | |
Net realized and unrealized gains (losses) | | | 2.37 | | | | (1.23 | ) | | | 1.93 | | | | 0.23 | | | | (0.41 | ) |
| | | | | |
Total from investment operations | | | 2.56 | | | | (0.96 | ) | | | 2.13 | | | | 0.37 | | | | (0.19 | ) |
| | | | | |
Less distributions from: | | | | | | | | | | | | | | | | | | | | |
| | | | | |
Net investment income and short term gains received from Underlying Funds and exchange traded funds | | | (0.16 | ) | | | (0.30 | ) | | | (0.23 | ) | | | (0.09 | ) | | | (0.16 | ) |
| | | | | |
Net realized gains | | | (0.13 | ) | | | (0.19 | ) | | | — | | | | (0.10 | ) | | | (0.16 | ) |
| | | | | |
Total distributions | | | (0.29 | ) | | | (0.49 | ) | | | (0.23 | ) | | | (0.19 | ) | | | (0.32 | ) |
| | | | | |
Net asset value, end of year | | | $14.01 | | | | $11.74 | | | | $13.19 | | | | $11.29 | | | | $11.11 | |
| | | | | |
Total returnd | | | 22.00% | | | | (7.40)% | | | | 18.96% | | | | 3.32% | | | | (1.76)% | |
| | | | | |
Ratios to average net assets | | | | | | | | | | | | | | | | | | | | |
| | | | | |
Expenses before waiver and payments by affiliatese | | | 1.35% | | | | 1.30% | | | | 1.53% | | | | 1.47% | | | | 1.82% | |
| | | | | |
Expenses net of waiver and payments by affiliatese | | | 0.34% | f | | | 0.30% | f | | | 0.30% | | | | 0.30% | | | | 0.32% | |
| | | | | |
Net investment incomec | | | 1.55% | | | | 1.98% | | | | 1.62% | | | | 1.17% | | | | 1.47% | |
| | | | | |
Supplemental data | | | | | | | | | | | | | | | | | | | | |
| | | | | |
Net assets, end of year (000’s) | | | $16,729 | | | | $16,856 | | | | $13,823 | | | | $10,597 | | | | $6,762 | |
| | | | | |
Portfolio turnover rate | | | 94.67% | | | | 43.18% | | | | 35.70% | | | | 89.82% | | | | 48.90% | |
aThe amount shown for a share outstanding throughout the period may not correlate with the Statement of Operations for the period due to the timing of sales and repurchases of the Fund’s shares in relation to income earned and/or fluctuating fair value of the investments of the Fund.
bBased on average daily shares outstanding.
cRecognition of net investment income by the Fund is affected by the timing of declaration of dividends by the Underlying Funds and exchange traded funds in which the Fund invests.
dTotal return does not reflect sales commissions or contingent deferred sales charges, if applicable.
eDoes not include expenses of the Underlying Funds and exchange traded funds in which the Fund invests. The weighted average indirect expenses of the Underlying Funds and exchange traded funds was 0.38% for the year ended December 31, 2019.
fBenefit of expense reduction rounds to less than 0.01%.
| | | | |
franklintempleton.com | | The accompanying notes are an integral part of these financial statements. | Annual Report | | 107 |
FRANKLIN FUND ALLOCATOR SERIES
FINANCIAL HIGHLIGHTS
Franklin LifeSmart™ 2050 Retirement Target Fund(continued)
| | | | | | | | | | | | | | | | | | | | |
| | | Year Ended December 31, | |
| | | 2019 | | | 2018 | | | 2017 | | | 2016 | | | 2015 | |
| | | | | |
Class C | | | | | | | | | | | | | | | | | | | | |
| | | | | |
Per share operating performance | | | | | | | | | | | | | | | | | | | | |
(for a share outstanding throughout the year) | | | | | | | | | | | | | | | | | | | | |
| | | | | |
Net asset value, beginning of year | | | $11.66 | | | | $13.11 | | | | $11.24 | | | | $11.07 | | | | $11.56 | |
| | | | | |
Income from investment operationsa: | | | | | | | | | | | | | | | | | | | | |
| | | | | |
Net investment incomeb,c | | | 0.11 | | | | 0.16 | | | | 0.11 | | | | 0.05 | | | | 0.07 | |
| | | | | |
Net realized and unrealized gains (losses) | | | 2.34 | | | | (1.22 | ) | | | 1.91 | | | | 0.23 | | | | (0.33 | ) |
| | | | | |
Total from investment operations | | | 2.45 | | | | (1.06 | ) | | | 2.02 | | | | 0.28 | | | | (0.26 | ) |
| | | | | |
Less distributions from: | | | | | | | | | | | | | | | | | | | | |
| | | | | |
Net investment income and short term gains received from Underlying Funds and exchange traded funds | | | (0.07 | ) | | | (0.20 | ) | | | (0.15 | ) | | | (0.01 | ) | | | (0.07 | ) |
| | | | | |
Net realized gains | | | (0.13 | ) | | | (0.19 | ) | | | — | | | | (0.10 | ) | | | (0.16 | ) |
| | | | | |
Total distributions | | | (0.20 | ) | | | (0.39 | ) | | | (0.15 | ) | | | (0.11 | ) | | | (0.23 | ) |
| | | | | |
Net asset value, end of year | | | $13.91 | | | | $11.66 | | | | $13.11 | | | | $11.24 | | | | $11.07 | |
| | | | | |
Total returnd | | | 21.13% | | | | (8.12)% | | | | 18.03% | | | | 2.56% | | | | (2.40)% | |
| | | | | |
Ratios to average net assets | | | | | | | | | | | | | | | | | | | | |
| | | | | |
Expenses before waiver and payments by affiliatese | | | 2.10% | | | | 2.05% | | | | 2.28% | | | | 2.22% | | | | 2.55% | |
| | | | | |
Expenses net of waiver and payments by affiliatese | | | 1.09% | f | | | 1.05% | f | | | 1.05% | | | | 1.05% | | | | 1.05% | |
| | | | | |
Net investment incomec | | | 0.80% | | | | 1.23% | | | | 0.87% | | | | 0.42% | | | | 0.74% | |
| | | | | |
Supplemental data | | | | | | | | | | | | | | | | | | | | |
| | | | | |
Net assets, end of year (000’s) | | | $5,658 | | | | $4,167 | | | | $3,797 | | | | $2,675 | | | | $1,921 | |
| | | | | |
Portfolio turnover rate | | | 94.67% | | | | 43.18% | | | | 35.70% | | | | 89.82% | | | | 48.90% | |
aThe amount shown for a share outstanding throughout the period may not correlate with the Statement of Operations for the period due to the timing of sales and repurchases of the Fund’s shares in relation to income earned and/or fluctuating fair value of the investments of the Fund.
bBased on average daily shares outstanding.
cRecognition of net investment income by the Fund is affected by the timing of declaration of dividends by the Underlying Funds and exchange traded funds in which the Fund invests.
dTotal return does not reflect sales commissions or contingent deferred sales charges, if applicable.
eDoes not include expenses of the Underlying Funds and exchange traded funds in which the Fund invests. The weighted average indirect expenses of the Underlying Funds and exchange traded funds was 0.38% for the year ended December 31, 2019.
fBenefit of expense reduction rounds to less than 0.01%.
| | | | |
| | | |
108 | | Annual Report | The accompanying notes are an integral part of these financial statements. | | franklintempleton.com |
FRANKLIN FUND ALLOCATOR SERIES
FINANCIAL HIGHLIGHTS
Franklin LifeSmart™ 2050 Retirement Target Fund(continued)
| | | | | | | | | | | | | | | | | | | | |
| | | Year Ended December 31, | |
| | | 2019 | | | 2018 | | | 2017 | | | 2016 | | | 2015 | |
| | | | | |
Class R | | | | | | | | | | | | | | | | | | | | |
| | | | | |
Per share operating performance | | | | | | | | | | | | | | | | | | | | |
(for a share outstanding throughout the year) | | | | | | | | | | | | | | | | | | | | |
| | | | | |
Net asset value, beginning of year | | | $11.74 | | | | $13.19 | | | | $11.29 | | | | $11.12 | | | | $11.63 | |
| | | | | |
Income from investment operationsa: | | | | | | | | | | | | | | | | | | | | |
| | | | | |
Net investment incomeb,c | | | 0.17 | | | | 0.23 | | | | 0.16 | | | | 0.11 | | | | 0.16 | |
| | | | | |
Net realized and unrealized gains (losses) | | | 2.36 | | | | (1.22 | ) | | | 1.94 | | | | 0.22 | | | | (0.37 | ) |
| | | | | |
Total from investment operations | | | 2.53 | | | | (0.99 | ) | | | 2.10 | | | | 0.33 | | | | (0.21 | ) |
| | | | | |
Less distributions from: | | | | | | | | | | | | | | | | | | | | |
| | | | | |
Net investment income and short term gains received from Underlying Funds and exchange traded funds | | | (0.13 | ) | | | (0.27 | ) | | | (0.20 | ) | | | (0.06 | ) | | | (0.14 | ) |
| | | | | |
Net realized gains | | | (0.13 | ) | | | (0.19 | ) | | | — | | | | (0.10 | ) | | | (0.16 | ) |
| | | | | |
Total distributions | | | (0.26 | ) | | | (0.46 | ) | | | (0.20 | ) | | | (0.16 | ) | | | (0.30 | ) |
| | | | | |
Net asset value, end of year | | | $14.01 | | | | $11.74 | | | | $13.19 | | | | $11.29 | | | | $11.12 | |
| | | | | |
Total return | | | 21.72% | | | | (7.62)% | | | | 18.67% | | | | 3.01% | | | | (1.98)% | |
| | | | | |
Ratios to average net assets | | | | | | | | | | | | | | | | | | | | |
| | | | | |
Expenses before waiver and payments by affiliatesd | | | 1.60% | | | | 1.55% | | | | 1.78% | | | | 1.71% | | | | 2.05% | |
| | | | | |
Expenses net of waiver and payments by affiliatesd | | | 0.59% | e | | | 0.55% | e | | | 0.55% | | | | 0.54% | | | | 0.55% | |
| | | | | |
Net investment incomec | | | 1.30% | | | | 1.73% | | | | 1.37% | | | | 0.93% | | | | 1.24% | |
| | | | | |
Supplemental data | | | | | | | | | | | | | | | | | | | | |
| | | | | |
Net assets, end of year (000’s) | | | $2,364 | | | | $1,814 | | | | $1,608 | | | | $1,219 | | | | $747 | |
| | | | | |
Portfolio turnover rate | | | 94.67% | | | | 43.18% | | | | 35.70% | | | | 89.82% | | | | 48.90% | |
aThe amount shown for a share outstanding throughout the period may not correlate with the Statement of Operations for the period due to the timing of sales and repurchases of the Fund’s shares in relation to income earned and/or fluctuating fair value of the investments of the Fund.
bBased on average daily shares outstanding.
cRecognition of net investment income by the Fund is affected by the timing of declaration of dividends by the Underlying Funds and exchange traded funds in which the Fund invests.
dDoes not include expenses of the Underlying Funds and exchange traded funds in which the Fund invests. The weighted average indirect expenses of the Underlying Funds and exchange traded funds was 0.38% for the year ended December 31, 2019.
eBenefit of expense reduction rounds to less than 0.01%.
| | | | |
franklintempleton.com | | The accompanying notes are an integral part of these financial statements. | Annual Report | | 109 |
FRANKLIN FUND ALLOCATOR SERIES
FINANCIAL HIGHLIGHTS
Franklin LifeSmart™ 2050 Retirement Target Fund(continued)
| | | | | | | | | | | | | | | | | | | | |
| | | Year Ended December 31, | |
| | | 2019 | | | 2018 | | | 2017 | | | 2016 | | | 2015 | |
| | | | | |
Class R6 | | | | | | | | | | | | | | | | | | | | |
| | | | | |
Per share operating performance | | | | | | | | | | | | | | | | | | | | |
(for a share outstanding throughout the year) | | | | | | | | | | | | | | | | | | | | |
| | | | | |
Net asset value, beginning of year | | | $11.80 | | | | $13.26 | | | | $11.34 | | | | $11.16 | | | | $11.65 | |
| | | | | |
Income from investment operationsa: | | | | | | | | | | | | | | | | | | | | |
| | | | | |
Net investment incomeb,c | | | 0.26 | | | | 0.29 | | | | 0.24 | | | | 0.15 | | | | 0.19 | |
| | | | | |
Net realized and unrealized gains (losses) | | | 2.37 | | | | (1.23 | ) | | | 1.94 | | | | 0.24 | | | | (0.34 | ) |
| | | | | |
Total from investment operations | | | 2.63 | | | | (0.94 | ) | | | 2.18 | | | | 0.39 | | | | (0.15 | ) |
| | | | | |
Less distributions from: | | | | | | | | | | | | | | | | | | | | |
| | | | | |
Net investment income and short term gains received from Underlying Funds and exchange traded funds | | | (0.20 | ) | | | (0.33 | ) | | | (0.26 | ) | | | (0.11 | ) | | | (0.18 | ) |
| | | | | |
Net realized gains | | | (0.13 | ) | | | (0.19 | ) | | | — | | | | (0.10 | ) | | | (0.16 | ) |
| | | | | |
Total distributions | | | (0.33 | ) | | | (0.52 | ) | | | (0.26 | ) | | | (0.21 | ) | | | (0.34 | ) |
| | | | | |
Net asset value, end of year | | | $14.10 | | | | $11.80 | | | | $13.26 | | | | $11.34 | | | | $11.16 | |
| | | | | |
Total return | | | 22.50% | | | | (7.18)% | | | | 19.36% | | | | 3.55% | | | | (1.39)% | |
| | | | | |
Ratios to average net assets | | | | | | | | | | | | | | | | | | | | |
| | | | | |
Expenses before waiver and payments by affiliatesd | | | 0.62% | | | | 0.65% | | | | 0.69% | | | | 0.75% | | | | 1.00% | |
| | | | | |
Expenses net of waiver and payments by affiliatesd | | | 0.04% | e | | | —% | e | | | —% | | | | —% | | | | —% | |
| | | | | |
Net investment incomec | | | 1.85% | | | | 2.28% | | | | 1.92% | | | | 1.47% | | | | 1.79% | |
| | | | | |
Supplemental data | | | | | | | | | | | | | | | | | | | | |
| | | | | |
Net assets, end of year (000’s) | | | $17,560 | | | | $11,800 | | | | $12,099 | | | | $9,174 | | | | $8,012 | |
| | | | | |
Portfolio turnover rate | | | 94.67% | | | | 43.18% | | | | 35.70% | | | | 89.82% | | | | 48.90% | |
aThe amount shown for a share outstanding throughout the period may not correlate with the Statement of Operations for the period due to the timing of sales and repurchases of the Fund’s shares in relation to income earned and/or fluctuating fair value of the investments of the Fund.
bBased on average daily shares outstanding.
cRecognition of net investment income by the Fund is affected by the timing of declaration of dividends by the Underlying Funds and exchange traded funds in which the Fund invests.
dDoes not include expenses of the Underlying Funds and exchange traded funds in which the Fund invests. The weighted average indirect expenses of the Underlying Funds and exchange traded funds was 0.38% for the year ended December 31, 2019.
eBenefit of expense reduction rounds to less than 0.01%.
| | | | |
| | | |
110 | | Annual Report | The accompanying notes are an integral part of these financial statements. | | franklintempleton.com |
FRANKLIN FUND ALLOCATOR SERIES
FINANCIAL HIGHLIGHTS
Franklin LifeSmart™ 2050 Retirement Target Fund(continued)
| | | | | | | | | | | | | | | | | | | | |
| | | Year Ended December 31, | |
| | | 2019 | | | 2018 | | | 2017 | | | 2016 | | | 2015 | |
| | | | | |
Advisor Class | | | | | | | | | | | | | | | | | | | | |
| | | | | |
Per share operating performance | | | | | | | | | | | | | | | | | | | | |
(for a share outstanding throughout the year) | | | | | | | | | | | | | | | | | | | | |
| | | | | |
Net asset value, beginning of year | | | $11.80 | | | | $13.26 | | | | $11.35 | | | | $11.16 | | | | $11.65 | |
| | | | | |
Income from investment operationsa: | | | | | | | | | | | | | | | | | | | | |
| | | | | |
Net investment incomeb,c | | | 0.24 | | | | 0.28 | | | | 0.23 | | | | 0.15 | | | | 0.18 | |
| | | | | |
Net realized and unrealized gains (losses) | | | 2.38 | | | | (1.22 | ) | | | 1.94 | | | | 0.25 | | | | (0.33 | ) |
| | | | | |
Total from investment operations | | | 2.62 | | | | (0.94 | ) | | | 2.17 | | | | 0.40 | | | | (0.15 | ) |
| | | | | |
Less distributions from: | | | | | | | | | | | | | | | | | | | | |
| | | | | |
Net investment income and short term gains received from Underlying Funds and exchange traded funds | | | (0.19 | ) | | | (0.33 | ) | | | (0.26 | ) | | | (0.11 | ) | | | (0.18 | ) |
| | | | | |
Net realized gains | | | (0.13 | ) | | | (0.19 | ) | | | — | | | | (0.10 | ) | | | (0.16 | ) |
| | | | | |
Total distributions | | | (0.32 | ) | | | (0.52 | ) | | | (0.26 | ) | | | (0.21 | ) | | | (0.34 | ) |
| | | | | |
Net asset value, end of year | | | $14.10 | | | | $11.80 | | | | $13.26 | | | | $11.35 | | | | $11.16 | |
| | | | | |
Total return | | | 22.44% | | | | (7.23)% | | | | 19.20% | | | | 3.59% | | | | (1.43)% | |
| | | | | |
Ratios to average net assets | | | | | | | | | | | | | | | | | | | | |
| | | | | |
Expenses before waiver and payments by affiliatesd | | | 1.10% | | | | 1.05% | | | | 1.28% | | | | 1.22% | | | | 1.55% | |
| | | | | |
Expenses net of waiver and payments by affiliatesd | | | 0.09% | e | | | 0.05% | e | | | 0.05% | | | | 0.05% | | | | 0.05% | |
| | | | | |
Net investment incomec | | | 1.80% | | | | 2.23% | | | | 1.87% | | | | 1.42% | | | | 1.74% | |
| | | | | |
Supplemental data | | | | | | | | | | | | | | | | | | | | |
| | | | | |
Net assets, end of year (000’s) | | | $617 | | | | $468 | | | | $512 | | | | $395 | | | | $394 | |
| | | | | |
Portfolio turnover rate | | | 94.67% | | | | 43.18% | | | | 35.70% | | | | 89.82% | | | | 48.90% | |
aThe amount shown for a share outstanding throughout the period may not correlate with the Statement of Operations for the period due to the timing of sales and repurchases of the Fund’s shares in relation to income earned and/or fluctuating fair value of the investments of the Fund.
bBased on average daily shares outstanding.
cRecognition of net investment income by the Fund is affected by the timing of declaration of dividends by the Underlying Funds and exchange traded funds in which the Fund invests.
dDoes not include expenses of the Underlying Funds and exchange traded funds in which the Fund invests. The weighted average indirect expenses of the Underlying Funds and exchange traded funds was 0.38% for the year ended December 31, 2019.
eBenefit of expense reduction rounds to less than 0.01%.
| | | | |
franklintempleton.com | | The accompanying notes are an integral part of these financial statements. | Annual Report | | 111 |
FRANKLIN FUND ALLOCATOR SERIES
Statement of Investments, December 31, 2019
Franklin LifeSmart™ 2050 Retirement Target Fund
| | | | | | | | |
| | | Shares | | | Value | |
| | |
Investments in Underlying Funds and Exchange Traded Funds 98.1% | | | | | | | | |
| | |
Domestic Equity 64.1% | | | | | | | | |
aFranklin Growth Fund, Class R6 | | | 73,765 | | | $ | 8,283,790 | |
aFranklin LibertyQ U.S. Equity ETF | | | 220,197 | | | | 7,704,693 | |
aFranklin Rising Dividends Fund, Class R6 | | | 59,576 | | | | 4,143,530 | |
aFranklin U.S. Core Equity (IU) Fund | | | 636,270 | | | | 6,865,361 | |
Vanguard S&P 500 ETF | | | 1,841 | | | | 544,569 | |
| | | | | | | | |
| | |
| | | | | | | 27,541,943 | |
| | | | | | | | |
| | |
Domestic Fixed Income 5.3% | | | | | | | | |
aFranklin Liberty U.S. Core Bond ETF | | | 45,557 | | | | 1,143,020 | |
iShares Core U.S. Aggregate Bond ETF | | | 10,159 | | | | 1,141,567 | |
| | | | | | | | |
| | |
| | | | | | | 2,284,587 | |
| | | | | | | | |
| | |
Foreign Equity 28.7% | | | | | | | | |
aFranklin Emerging Market Core Equity (IU) Fund | | | 207,673 | | | | 2,269,867 | |
aFranklin FTSE Europe ETF | | | 33,243 | | | | 839,386 | |
aFranklin FTSE Japan ETF | | | 15,536 | | | | 406,266 | |
aFranklin International Core Equity (IU) Fund | | | 344,993 | | | | 3,829,422 | |
aFranklin International Growth Fund, Class R6 | | | 103,371 | | | | 1,721,122 | |
aFranklin LibertyQ Emerging Markets ETF | | | 51,861 | | | | 1,544,628 | |
aTempleton Foreign Fund, Class R6 | | | 237,966 | | | | 1,696,698 | |
| | | | | | | | |
| | |
| | | | | | | 12,307,389 | |
| | | | | | | | |
| | |
Total Investments in Underlying Funds and Exchange Traded Funds
before Short Term Investments (Cost $36,250,488) | | | | | | | 42,133,919 | |
| | | | | | | | |
| | |
Short Term Investments 1.5% | | | | | | | | |
| | |
Money Market Funds (Cost $508,225) 1.2% | | | | | | | | |
a,bInstitutional Fiduciary Trust Money Market Portfolio, 1.26% | | | 508,225 | | | | 508,225 | |
| | | | | | | | |
| | | | |
| | | |
112 | | Annual Report | | franklintempleton.com |
FRANKLIN FUND ALLOCATOR SERIES
STATEMENT OF INVESTMENTS
Franklin LifeSmart™ 2050 Retirement Target Fund(continued)
| | | | | | | | |
| | | Principal
Amount | | | Value | |
| | |
Short Term Investments(continued) | | | | | | | | |
| | |
Repurchase Agreements (Cost $115,579) 0.3% | | | | | | | | |
cJoint Repurchase Agreement, 1.536%, 1/02/20 (Maturity Value $115,589) | | | | | | | | |
BNP Paribas Securities Corp. (Maturity Value $63,382) | | | | | | | | |
Deutsche Bank Securities Inc. (Maturity Value $20,516) | | | | | | | | |
HSBC Securities (USA) Inc. (Maturity Value $31,691) | | | | | | | | |
Collateralized by U.S. Treasury Notes, 1.375% - 2.75%, 9/30/20 - 10/31/24; and U.S. Treasury Notes, Index Linked, 0.125%, 1/15/23 (valued at $117,956) | | $ | 115,579 | | | $ | 115,579 | |
| | | | | | | | |
| | |
Total Investments (Cost $36,874,292) 99.6% | | | | | | | 42,757,723 | |
| | |
Other Assets, less Liabilities 0.4% | | | | | | | 170,590 | |
| | | | | | | | |
| | |
Net Assets 100.0% | | | | | | $ | 42,928,313 | |
| | | | | | | | |
See Abbreviations on page 162.
aSee Note 3(f) regarding investments in FT Underlying Funds.
bThe rate shown is the annualizedseven-day effective yield at period end.
cSee Note 1(b) regarding joint repurchase agreement.
| | | | |
franklintempleton.com | | The accompanying notes are an integral part of these financial statements. | Annual Report | | 113 |
FRANKLIN FUND ALLOCATOR SERIES
Financial Highlights
Franklin LifeSmart™ 2055 Retirement Target Fund
| | | | | | | | | | | | | | | | | | | | |
| | | Year Ended December 31, | |
| | | 2019 | | | 2018 | | | 2017 | | | 2016 | | | 2015a | |
| | | | | |
Class A | | | | | | | | | | | | | | | | | | | | |
| | | | | |
Per share operating performance | | | | | | | | | | | | | | | | | | | | |
(for a share outstanding throughout the year) | | | | | | | | | | | | | | | | | | | | |
| | | | | |
Net asset value, beginning of year | | | $ 9.88 | | | | $11.05 | | | | $ 9.47 | | | | $ 9.34 | | | | $10.00 | |
| | | | | |
Income from investment operationsb: | | | | | | | | | | | | | | | | | | | | |
| | | | | |
Net investment incomec,d | | | 0.18 | | | | 0.23 | | | | 0.18 | | | | 0.12 | | | | 0.16 | |
| | | | | |
Net realized and unrealized gains (losses) | | | 2.02 | | | | (1.03 | ) | | | 1.62 | | | | 0.17 | | | | (0.70 | ) |
| | | | | |
Total from investment operations | | | 2.20 | | | | (0.80 | ) | | | 1.80 | | | | 0.29 | | | | (0.54 | ) |
| | | | | |
Less distributions from: | | | | | | | | | | | | | | | | | | | | |
| | | | | |
Net investment income and short term gains received from Underlying Funds and exchange traded funds | | | (0.12 | ) | | | (0.20 | ) | | | (0.19 | ) | | | (0.10 | ) | | | (0.12 | ) |
| | | | | |
Net realized gains | | | (0.10 | ) | | | (0.17 | ) | | | (0.03 | ) | | | (0.06 | ) | | | — | |
| | | | | |
Total distributions | | | (0.22 | ) | | | (0.37 | ) | | | (0.22 | ) | | | (0.16 | ) | | | (0.12 | ) |
| | | | | |
Net asset value, end of year | | | $11.86 | | | | $ 9.88 | | | | $11.05 | | | | $ 9.47 | | | | $ 9.34 | |
| | | | | |
Total returne | | | 22.39% | | | | (7.37)% | | | | 19.06% | | | | 3.13% | | | | (5.40)% | |
| | | | | |
Ratios to average net assetsf | | | | | | | | | | | | | | | | | | | | |
| | | | | |
Expenses before waiver and payments by affiliatesg | | | 2.50% | | | | 2.51% | | | | 3.18% | | | | 5.09% | | | | 9.66% | |
| | | | | |
Expenses net of waiver and payments by affiliatesg | | | 0.34% | | | | 0.30% | h | | | 0.30% | | | | 0.32% | | | | 0.19% | |
| | | | | |
Net investment incomed | | | 1.65% | | | | 2.01% | | | | 1.75% | | | | 1.43% | | | | 2.62% | |
| | | | | |
Supplemental data | | | | | | | | | | | | | | | | | | | | |
| | | | | |
Net assets, end of year (000’s) | | | $8,254 | | | | $6,104 | | | | $4,684 | | | | $2,732 | | | | $1,817 | |
| | | | | |
Portfolio turnover rate | | | 90.64% | | | | 42.85% | | | | 31.85% | | | | 93.35% | | | | 78.16% | |
aFor the period May 1, 2015 (commencement of operations) to December 31, 2015.
bThe amount shown for a share outstanding throughout the period may not correlate with the Statement of Operations for the period due to the timing of sales and repurchases of the Fund’s shares in relation to income earned and/or fluctuating fair value of the investments of the Fund.
cBased on average daily shares outstanding.
dRecognition of net investment income by the Fund is affected by the timing of declaration of dividends by the Underlying Funds and exchange traded funds in which the Fund invests.
eTotal return does not reflect sales commissions or contingent deferred sales charges, if applicable, and is not annualized for periods less than one year.
fRatios are annualized for periods less than one year, except fornon-recurring expenses, if any.
gDoes not include expenses of the Underlying Funds and exchange traded funds in which the Fund invests. The weighted average indirect expenses of the Underlying Funds and exchange traded funds was 0.37% for the year ended December 31, 2019.
hBenefit of expense reduction rounds to less than 0.01%.
| | | | |
| | | |
114 | | Annual Report | The accompanying notes are an integral part of these financial statements. | | franklintempleton.com |
FRANKLIN FUND ALLOCATOR SERIES
FINANCIAL HIGHLIGHTS
Franklin LifeSmart™ 2055 Retirement Target Fund(continued)
| | | | | | | | | | | | | | | | | | | | |
| | | Year Ended December 31, | |
| | | 2019 | | | 2018 | | | 2017 | | | 2016 | | | 2015a | |
| | | | | |
Class C | | | | | | | | | | | | | | | | | | | | |
| | | | | |
Per share operating performance | | | | | | | | | | | | | | | | | | | | |
(for a share outstanding throughout the year) | | | | | | | | | | | | | | | | | | | | |
| | | | | |
Net asset value, beginning of year | | | $ 9.75 | | | | $10.92 | | | | $ 9.39 | | | | $ 9.30 | | | | $10.00 | |
| | | | | |
Income from investment operationsb: | | | | | | | | | | | | | | | | | | | | |
| | | | | |
Net investment incomec,d | | | 0.09 | | | | 0.15 | | | | 0.12 | | | | 0.08 | | | | 0.24 | |
| | | | | |
Net realized and unrealized gains (losses) | | | 1.99 | | | | (1.02 | ) | | | 1.58 | | | | 0.14 | | | | (0.84 | ) |
| | | | | |
Total from investment operations | | | 2.08 | | | | (0.87 | ) | | | 1.70 | | | | 0.22 | | | | (0.60 | ) |
| | | | | |
Less distributions from: | | | | | | | | | | | | | | | | | | | | |
| | | | | |
Net investment income and short term gains received from Underlying Funds and exchange traded funds | | | (0.04 | ) | | | (0.13 | ) | | | (0.14 | ) | | | (0.07 | ) | | | (0.10 | ) |
| | | | | |
Net realized gains | | | (0.10 | ) | | | (0.17 | ) | | | (0.03 | ) | | | (0.06 | ) | | | — | |
| | | | | |
Total distributions | | | (0.14 | ) | | | (0.30 | ) | | | (0.17 | ) | | | (0.13 | ) | | | (0.10 | ) |
| | | | | |
Net asset value, end of year | | | $11.69 | | | | $ 9.75 | | | | $10.92 | | | | $ 9.39 | | | | $ 9.30 | |
| | | | | |
Total returne | | | 21.45% | | | | (8.04)% | | | | 18.10% | | | | 2.36% | | | | (5.99)% | |
| | | | | |
Ratios to average net assetsf | | | | | | | | | | | | | | | | | | | | |
| | | | | |
Expenses before waiver and payments by affiliatesg | | | 3.25% | | | | 3.26% | | | | 3.93% | | | | 5.82% | | | | 10.52% | |
| | | | | |
Expenses net of waiver and payments by affiliatesg | | | 1.09% | | | | 1.05% | h | | | 1.05% | | | | 1.05% | | | | 1.05% | |
| | | | | |
Net investment incomed | | | 0.90% | | | | 1.26% | | | | 1.00% | | | | 0.70% | | | | 1.76% | |
| | | | | |
Supplemental data | | | | | | | | | | | | | | | | | | | | |
| | | | | |
Net assets, end of year (000’s) | | | $3,563 | | | | $2,338 | | | | $1,428 | | | | $572 | | | | $172 | |
| | | | | |
Portfolio turnover rate | | | 90.64% | | | | 42.85% | | | | 31.85% | | | | 93.35% | | | | 78.16% | |
aFor the period May 1, 2015 (commencement of operations) to December 31, 2015.
bThe amount shown for a share outstanding throughout the period may not correlate with the Statement of Operations for the period due to the timing of sales and repurchases of the Fund’s shares in relation to income earned and/or fluctuating fair value of the investments of the Fund.
cBased on average daily shares outstanding.
dRecognition of net investment income by the Fund is affected by the timing of declaration of dividends by the Underlying Funds and exchange traded funds in which the Fund invests.
eTotal return does not reflect sales commissions or contingent deferred sales charges, if applicable, and is not annualized for periods less than one year.
fRatios are annualized for periods less than one year, except fornon-recurring expenses, if any.
gDoes not include expenses of the Underlying Funds and exchange traded funds in which the Fund invests. The weighted average indirect expenses of the Underlying Funds and exchange traded funds was 0.37% for the year ended December 31, 2019.
hBenefit of expense reduction rounds to less than 0.01%.
| | | | |
franklintempleton.com | | The accompanying notes are an integral part of these financial statements. | Annual Report | | 115 |
FRANKLIN FUND ALLOCATOR SERIES
FINANCIAL HIGHLIGHTS
Franklin LifeSmart™ 2055 Retirement Target Fund(continued)
| | | | | | | | | | | | | | | | | | | | |
| | | Year Ended December 31, | |
| | | 2019 | | | 2018 | | | 2017 | | | 2016 | | | 2015a | |
| | | | | |
Class R | | | | | | | | | | | | | | | | | | | | |
| | | | | |
Per share operating performance | | | | | | | | | | | | | | | | | | | | |
(for a share outstanding throughout the year) | | | | | | | | | | | | | | | | | | | | |
| | | | | |
Net asset value, beginning of year | | | $ 9.85 | | | | $11.01 | | | | $ 9.44 | | | | $ 9.33 | | | | $10.00 | |
| | | | | |
Income from investment operationsb: | | | | | | | | | | | | | | | | | | | | |
| | | | | |
Net investment incomec,d | | | 0.15 | | | | 0.19 | | | | 0.13 | | | | 0.12 | | | | 0.18 | |
| | | | | |
Net realized and unrealized gains (losses) | | | 2.01 | | | | (1.01 | ) | | | 1.63 | | | | 0.14 | | | | (0.74 | ) |
| | | | | |
Total from investment operations | | | 2.16 | | | | (0.82 | ) | | | 1.76 | | | | 0.26 | | | | (0.56 | ) |
| | | | | |
Less distributions from: | | | | | | | | | | | | | | | | | | | | |
| | | | | |
Net investment income and short term gains received from Underlying Funds and exchange traded funds | | | (0.09 | ) | | | (0.17 | ) | | | (0.16 | ) | | | (0.09 | ) | | | (0.11 | ) |
| | | | | |
Net realized gains | | | (0.10 | ) | | | (0.17 | ) | | | (0.03 | ) | | | (0.06 | ) | | | — | |
| | | | | |
Total distributions | | | (0.19 | ) | | | (0.34 | ) | | | (0.19 | ) | | | (0.15 | ) | | | (0.11 | ) |
| | | | | |
Net asset value, end of year | | | $11.82 | | | | $ 9.85 | | | | $11.01 | | | | $ 9.44 | | | | $ 9.33 | |
| | | | | |
Total returne | | | 22.08% | | | | (7.53)% | | | | 18.69% | | | | 2.84% | | | | (5.61)% | |
| | | | | |
Ratios to average net assetsf | | | | | | | | | | | | | | | | | | | | |
| | | | | |
Expenses before waiver and payments by affiliatesg | | | 2.75% | | | | 2.76% | | | | 3.43% | | | | 5.32% | | | | 9.98% | |
| | | | | |
Expenses net of waiver and payments by affiliatesg | | | 0.59% | | | | 0.55% | h | | | 0.55% | | | | 0.55% | | | | 0.51% | |
| | | | | |
Net investment incomed | | | 1.40% | | | | 1.76% | | | | 1.50% | | | | 1.20% | | | | 2.30% | |
| | | | | |
Supplemental data | | | | | | | | | | | | | | | | | | | | |
| | | | | |
Net assets, end of year (000’s) | | | $539 | | | | $425 | | | | $354 | | | | $357 | | | | $41 | |
| | | | | |
Portfolio turnover rate | | | 90.64% | | | | 42.85% | | | | 31.85% | | | | 93.35% | | | | 78.16% | |
aFor the period May 1, 2015 (commencement of operations) to December 31, 2015.
bThe amount shown for a share outstanding throughout the period may not correlate with the Statement of Operations for the period due to the timing of sales and repurchases of the Fund’s shares in relation to income earned and/or fluctuating fair value of the investments of the Fund.
cBased on average daily shares outstanding.
dRecognition of net investment income by the Fund is affected by the timing of declaration of dividends by the Underlying Funds and exchange traded funds in which the Fund invests.
eTotal return is not annualized for periods less than one year.
fRatios are annualized for periods less than one year, except fornon-recurring expenses, if any.
gDoes not include expenses of the Underlying Funds and exchange traded funds in which the Fund invests. The weighted average indirect expenses of the Underlying Funds and exchange traded funds was 0.37% for the year ended December 31, 2019.
hBenefit of expense reduction rounds to less than 0.01%.
| | | | |
| | | |
116 | | Annual Report | The accompanying notes are an integral part of these financial statements. | | franklintempleton.com |
FRANKLIN FUND ALLOCATOR SERIES
FINANCIAL HIGHLIGHTS
Franklin LifeSmart™ 2055 Retirement Target Fund(continued)
| | | | | | | | | | | | | | | | | | | | |
| | | Year Ended December 31, | |
| | | 2019 | | | 2018 | | | 2017 | | | 2016 | | | 2015a | |
| | | | | |
Class R6 | | | | | | | | | | | | | | | | | | | | |
| | | | | |
Per share operating performance | | | | | | | | | | | | | | | | | | | | |
(for a share outstanding throughout the year) | | | | | | | | | | | | | | | | | | | | |
| | | | | |
Net asset value, beginning of year | | | $ 9.89 | | | | $11.06 | | | | $ 9.48 | | | | $ 9.34 | | | | $10.00 | |
| | | | | |
Income from investment operationsb: | | | | | | | | | | | | | | | | | | | | |
| | | | | |
Net investment incomec,d | | | 0.22 | | | | 0.24 | | | | 0.22 | | | | 0.21 | | | | 0.32 | |
| | | | | |
Net realized and unrealized gains (losses) | | | 2.01 | | | | (1.01 | ) | | | 1.61 | | | | 0.11 | | | | (0.85 | ) |
| | | | | |
Total from investment operations | | | 2.23 | | | | (0.77 | ) | | | 1.83 | | | | 0.32 | | | | (0.53 | ) |
| | | | | |
Less distributions from: | | | | | | | | | | | | | | | | | | | | |
| | | | | |
Net investment income and short term gains received from Underlying Funds and exchange traded funds | | | (0.15 | ) | | | (0.23 | ) | | | (0.22 | ) | | | (0.12 | ) | | | (0.13 | ) |
| | | | | |
Net realized gains | | | (0.10 | ) | | | (0.17 | ) | | | (0.03 | ) | | | (0.06 | ) | | | — | |
| | | | | |
Total distributions | | | (0.25 | ) | | | (0.40 | ) | | | (0.25 | ) | | | (0.18 | ) | | | (0.13 | ) |
| | | | | |
Net asset value, end of year | | | $11.87 | | | | $ 9.89 | | | | $11.06 | | | | $ 9.48 | | | | $ 9.34 | |
| | | | | |
Total returne | | | 22.72% | | | | (7.12)% | | | | 19.32% | | | | 3.49% | | | | (5.33)% | |
| | | | | |
Ratios to average net assetsf | | | | | | | | | | | | | | | | | | | | |
| | | | | |
Expenses before waiver and payments by affiliatesg | | | 1.18% | | | | 1.35% | | | | 1.85% | | | | 4.21% | | | | 10.04% | |
| | | | | |
Expenses net of waiver and payments by affiliatesg | | | 0.04% | | | | —% | h | | | —% | | | | —% | | | | —% | |
| | | | | |
Net investment incomed | | | 1.95% | | | | 2.31% | | | | 2.05% | | | | 1.75% | | | | 2.81% | |
| | | | | |
Supplemental data | | | | | | | | | | | | | | | | | | | | |
| | | | | |
Net assets, end of year (000’s) | | | $7,296 | | | | $3,573 | | | | $3,184 | | | | $1,618 | | | | $92 | |
| | | | | |
Portfolio turnover rate | | | 90.64% | | | | 42.85% | | | | 31.85% | | | | 93.35% | | | | 78.16% | |
aFor the period May 1, 2015 (commencement of operations) to December 31, 2015.
bThe amount shown for a share outstanding throughout the period may not correlate with the Statement of Operations for the period due to the timing of sales and repurchases of the Fund’s shares in relation to income earned and/or fluctuating fair value of the investments of the Fund.
cBased on average daily shares outstanding.
dRecognition of net investment income by the Fund is affected by the timing of declaration of dividends by the Underlying Funds and exchange traded funds in which the Fund invests.
eTotal return is not annualized for periods less than one year.
fRatios are annualized for periods less than one year, except fornon-recurring expenses, if any.
gDoes not include expenses of the Underlying Funds and exchange traded funds in which the Fund invests. The weighted average indirect expenses of the Underlying Funds and exchange traded funds was 0.37% for the year ended December 31, 2019.
hBenefit of expense reduction rounds to less than 0.01%.
| | | | |
franklintempleton.com | | The accompanying notes are an integral part of these financial statements. | Annual Report | | 117 |
FRANKLIN FUND ALLOCATOR SERIES
FINANCIAL HIGHLIGHTS
Franklin LifeSmart™ 2055 Retirement Target Fund(continued)
| | | | | | | | | | | | | | | | | | | | |
| | | Year Ended December 31, | |
| | | 2019 | | | 2018 | | | 2017 | | | 2016 | | | 2015a | |
| | | | | |
Advisor Class | | | | | | | | | | | | | | | | | | | | |
| | | | | |
Per share operating performance | | | | | | | | | | | | | | | | | | | | |
(for a share outstanding throughout the year) | | | | | | | | | | | | | | | | | | | | |
| | | | | |
Net asset value, beginning of year | | | $ 9.90 | | | | $11.06 | | | | $ 9.48 | | | | $ 9.35 | | | | $10.00 | |
| | | | | |
Income from investment operationsb: | | | | | | | | | | | | | | | | | | | | |
| | | | | |
Net investment incomec,d | | | 0.23 | | | | 0.25 | | | | 0.20 | | | | 0.13 | | | | 0.10 | |
| | | | | |
Net realized and unrealized gains (losses) | | | 1.99 | | | | (1.02 | ) | | | 1.62 | | | | 0.18 | | | | (0.63 | ) |
| | | | | |
Total from investment operations | | | 2.22 | | | | (0.77 | ) | | | 1.82 | | | | 0.31 | | | | (0.53 | ) |
| | | | | |
Less distributions from: | | | | | | | | | | | | | | | | | | | | |
| | | | | |
Net investment income and short term gains received from Underlying Funds and exchange traded funds | | | (0.15 | ) | | | (0.22 | ) | | | (0.21 | ) | | | (0.12 | ) | | | (0.12 | ) |
| | | | | |
Net realized gains | | | (0.10 | ) | | | (0.17 | ) | | | (0.03 | ) | | | (0.06 | ) | | | — | |
| | | | | |
Total distributions | | | (0.25 | ) | | | (0.39 | ) | | | (0.24 | ) | | | (0.18 | ) | | | (0.12 | ) |
| | | | | |
Net asset value, end of year | | | $11.87 | | | | $ 9.90 | | | | $11.06 | | | | $ 9.48 | | | | $ 9.35 | |
| | | | | |
Total returne | | | 22.67% | | | | (7.16)% | | | | 19.27% | | | | 3.45% | | | | (5.37)% | |
| | | | | |
Ratios to average net assetsf | | | | | | | | | | | | | | | | | | | | |
| | | | | |
Expenses before waiver and payments by affiliatesg | | | 2.25% | | | | 2.26% | | | | 2.93% | | | | 4.82% | | | | 9.52% | |
| | | | | |
Expenses net of waiver and payments by affiliatesg | | | 0.09% | | | | 0.05% | h | | | 0.05% | | | | 0.05% | | | | 0.05% | |
| | | | | |
Net investment incomed | | | 1.90% | | | | 2.26% | | | | 2.00% | | | | 1.70% | | | | 2.76% | |
| | | | | |
Supplemental data | | | | | | | | | | | | | | | | | | | | |
| | | | | |
Net assets, end of year (000’s) | | | $134 | | | | $46 | | | | $32 | | | | $13 | | | | $11 | |
| | | | | |
Portfolio turnover rate | | | 90.64% | | | | 42.85% | | | | 31.85% | | | | 93.35% | | | | 78.16% | |
aFor the period May 1, 2015 (commencement of operations) to December 31, 2015.
bThe amount shown for a share outstanding throughout the period may not correlate with the Statement of Operations for the period due to the timing of sales and repurchases of the Fund’s shares in relation to income earned and/or fluctuating fair value of the investments of the Fund.
cBased on average daily shares outstanding.
dRecognition of net investment income by the Fund is affected by the timing of declaration of dividends by the Underlying Funds and exchange traded funds in which the Fund invests.
eTotal return is not annualized for periods less than one year.
fRatios are annualized for periods less than one year, except fornon-recurring expenses, if any.
gDoes not include expenses of the Underlying Funds and exchange traded funds in which the Fund invests. The weighted average indirect expenses of the Underlying Funds and exchange traded funds was 0.37% for the year ended December 31, 2019.
hBenefit of expense reduction rounds to less than 0.01%.
| | | | |
| | | |
118 | | Annual Report | The accompanying notes are an integral part of these financial statements. | | franklintempleton.com |
FRANKLIN FUND ALLOCATOR SERIES
Statement of Investments, December 31, 2019
Franklin LifeSmart™ 2055 Retirement Target Fund
| | | | | | | | |
| | | Shares | | | Value | |
| | |
Investments in Underlying Funds and Exchange Traded Funds 98.0% | | | | | | | | |
| | |
Domestic Equity 64.0% | | | | | | | | |
aFranklin Growth Fund, Class R6 | | | 33,822 | | | $ | 3,798,188 | |
aFranklin LibertyQ U.S. Equity ETF | | | 101,183 | | | | 3,540,393 | |
aFranklin Rising Dividends Fund, Class R6 | | | 27,296 | | | | 1,898,474 | |
aFranklin U.S. Core Equity (IU) Fund | | | 292,996 | | | | 3,161,422 | |
Vanguard S&P 500 ETF | | | 900 | | | | 266,220 | |
| | | | | | | | |
| | |
| | | | | | | 12,664,697 | |
| | | | | | | | |
| | |
Domestic Fixed Income 5.5% | | | | | | | | |
aFranklin Liberty U.S. Core Bond ETF | | | 21,516 | | | | 539,834 | |
iShares Core U.S. Aggregate Bond ETF | | | 4,786 | | | | 537,803 | |
| | | | | | | | |
| | |
| | | | | | | 1,077,637 | |
| | | | | | | | |
| | |
Foreign Equity 28.5% | | | | | | | | |
aFranklin Emerging Market Core Equity (IU) Fund | | | 94,824 | | | | 1,036,424 | |
aFranklin FTSE Europe ETF | | | 15,382 | | | | 388,396 | |
aFranklin FTSE Japan ETF | | | 7,469 | | | | 195,314 | |
aFranklin International Core Equity (IU) Fund | | | 157,471 | | | | 1,747,933 | |
aFranklin International Growth Fund, Class R6 | | | 46,898 | | | | 780,860 | |
aFranklin LibertyQ Emerging Markets ETF | | | 23,818 | | | | 709,395 | |
aTempleton Foreign Fund, Class R6 | | | 109,312 | | | | 779,392 | |
| | | | | | | | |
| | |
| | | | | | | 5,637,714 | |
| | | | | | | | |
| | |
Total Investments in Underlying Funds and Exchange Traded Funds
before Short Term Investments (Cost $17,269,937) | | | | | | | 19,380,048 | |
| | | | | | | | |
| | |
Short Term Investments (Cost $396,974) 2.0% | | | | | | | | |
| | |
Money Market Funds 2.0% | | | | | | | | |
a,bInstitutional Fiduciary Trust Money Market Portfolio, 1.26% | | | 396,974 | | | | 396,974 | |
| | | | | | | | |
| | |
Total Investments in Underlying Funds and Exchange Traded Funds
(Cost $17,666,911) 100.0% | | | | | | | 19,777,022 | |
| | |
Other Assets, less Liabilities 0.0%† | | | | | | | 7,735 | |
| | | | | | | | |
| | |
Net Assets 100.0% | | | | | | $ | 19,784,757 | |
| | | | | | | | |
See Abbreviations on page 162.
†Rounds to less than 0.1% of net assets.
aSee Note 3(f) regarding investments in FT Underlying Funds.
bThe rate shown is the annualizedseven-day effective yield at period end.
| | | | |
franklintempleton.com | | The accompanying notes are an integral part of these financial statements.| Annual Report | | 119 |
FRANKLIN FUND ALLOCATOR SERIES
FINANCIAL STATEMENTS
Statements of Assets and Liabilities
December 31, 2019
| | | | | | | | | | | | |
| | | Franklin LifeSmart™ Retirement Income Fund | | | Franklin LifeSmart™ 2020 Retirement Target Fund | | | Franklin LifeSmart™ 2025 Retirement Target Fund | |
| |
| | | |
Assets: | | | | | | | | | | | | |
Investments in securities: | | | | | | | | | | | | |
Cost - Unaffiliated issuers | | | $12,286,786 | | | | $ 6,642,743 | | | | $ 16,603,624 | |
Cost -Non-controlled affiliates (Note 3f) | | | 37,110,083 | | | | 32,316,729 | | | | 94,902,313 | |
Cost - Unaffiliated repurchase agreements | | | — | | | | 172,955 | | | | 1,299,292 | |
| | | | |
Value - Unaffiliated issuers | | | $12,695,980 | | | | $ 6,771,649 | | | | $ 16,913,530 | |
| | | |
Value -Non-controlled affiliates (Note 3f) | | | 38,594,905 | | | | 35,718,027 | | | | 111,542,088 | |
Value - Unaffiliated repurchase agreements | | | — | | | | 172,955 | | | | 1,299,292 | |
Receivables: | | | | | | | | | | | | |
Capital shares sold | | | 3,255 | | | | 55,730 | | | | 302,800 | |
| | | |
Dividends and interest | | | 67,171 | | | | 37,126 | | | | 91,890 | |
Affiliates | | | 66,380 | | | | 51,620 | | | | 42,305 | |
Other assets. | | | 7 | | | | 4 | | | | 16 | |
| | | | |
| | | |
Total assets | | | 51,427,698 | | | | 42,807,111 | | | | 130,191,921 | |
| | | | |
Liabilities: | | | | | | | | | | | | |
Payables: | | | | | | | | | | | | |
Capital shares redeemed | | | 177,897 | | | | 11,500 | | | | 377,880 | |
Distribution fees | | | 17,275 | | | | 11,753 | | | | 39,605 | |
Transfer agent fees | | | 10,386 | | | | 6,522 | | | | 22,367 | |
Reports to shareholders | | | 7,427 | | | | 4,138 | | | | 8,703 | |
Professional fees | | | 29,437 | | | | 25,536 | | | | 26,132 | |
Accrued expenses and other liabilities | | | 493 | | | | 178 | | | | 3,710 | |
| | | | |
| | | |
Total liabilities | | | 242,915 | | | | 59,627 | | | | 478,397 | |
| | | | |
| | | |
Net assets, at value | | | $51,184,783 | | | | $42,747,484 | | | | $129,713,524 | |
| | | | |
Net assets consist of: | | | | | | | | | | | | |
Paid-in capital | | | $51,263,544 | | | | $39,443,938 | | | | $111,101,873 | |
Total distributable earnings (losses) | | | (78,761 | ) | | | 3,303,546 | | | | 18,611,651 | |
| | | | |
| | | |
Net assets, at value | | | $51,184,783 | | | | $42,747,484 | | | | $129,713,524 | |
| | | | |
| | | | |
| | | |
120 | | Annual Report | The accompanying notes are an integral part of these financial statements. | | franklintempleton.com |
FRANKLIN FUND ALLOCATOR SERIES
FINANCIAL STATEMENTS
Statements of Assets and Liabilities(continued)
December 31, 2019
| | | | | | | | | | | | |
| | | Franklin
LifeSmart™
Retirement
Income Fund | | | Franklin
LifeSmart™
2020 Retirement
Target Fund | | | Franklin
LifeSmart™
2025 Retirement
Target Fund | |
| | | |
Class A: | | | | | | | | | | | | |
Net assets, at value | | | $34,363,081 | | | | $27,016,207 | | | | $86,083,868 | |
| | | | |
Shares outstanding | | | 3,082,083 | | | | 2,220,018 | | | | 6,632,787 | |
| | | | |
Net asset value per sharea | | | $11.15 | | | | $12.17 | | | | $12.98 | |
| | | | |
Maximum offering price per share (net asset value per share ÷ 94.50%) | | | $11.80 | | | | $12.88 | | | | $13.74 | |
| | | | |
Class C: | | | | | | | | | | | | |
Net assets, at value | | | $10,567,604 | | | | $ 6,811,385 | | | | $23,450,434 | |
| | | | |
Shares outstanding | | | 959,807 | | | | 563,162 | | | | 1,837,886 | |
| | | | |
Net asset value and maximum offering price per sharea | | | $11.01 | | | | $12.09 | | | | $12.76 | |
| | | | |
Class R: | | | | | | | | | | | | |
Net assets, at value | | | $ 2,336,171 | | | | $ 745,239 | | | | $ 3,930,489 | |
| | | | |
Shares outstanding | | | 210,291 | | | | 61,293 | | | | 303,994 | |
| | | | |
Net asset value and maximum offering price per share | | | $11.11 | | | | $12.16 | | | | $12.93 | |
| | | | |
Class R6: | | | | | | | | | | | | |
Net assets, at value | | | $ 2,043,065 | | | | $ 7,429,476 | | | | $14,717,189 | |
| | | | |
Shares outstanding | | | 182,380 | | | | 608,984 | | | | 1,130,378 | |
| | | | |
Net asset value and maximum offering price per share | | | $11.20 | | | | $12.20 | | | | $13.02 | |
| | | | |
Advisor Class: | | | | | | | | | | | | |
Net assets, at value | | | $ 1,874,862 | | | | $ 745,177 | | | | $ 1,531,544 | |
| | | | |
Shares outstanding | | | 167,521 | | | | 61,065 | | | | 117,737 | |
| | | | |
Net asset value and maximum offering price per share | | | $11.19 | | | | $12.20 | | | | $13.01 | |
| | | | |
aRedemption price is equal to net asset value less contingent deferred sales charges, if applicable.
| | | | |
franklintempleton.com | | The accompanying notes are an integral part of these financial statements. | Annual Report | | 121 |
FRANKLIN FUND ALLOCATOR SERIES
FINANCIAL STATEMENTS
Statements of Assets and Liabilities(continued)
December 31, 2019
| | | | | | | | | | | | |
| | | Franklin
LifeSmart™ 2030 Retirement
Target Fund | | | Franklin
LifeSmart™
2035 Retirement
Target Fund | | | Franklin
LifeSmart™
2040 Retirement
Target Fund | |
| |
| | | |
Assets: | | | | | | | | | | | | |
Investments in securities: | | | | | | | | | | | | |
Cost - Unaffiliated issuers | | | $ 5,822,036 | | | | $ 9,252,352 | | | | $ 2,133,546 | |
Cost -Non-controlled affiliates (Note 3f) | | | 47,473,195 | | | | 97,955,212 | | | | 40,363,639 | |
Cost - Unaffiliated repurchase agreements | | | 428,718 | | | | 1,541,507 | | | | 66,841 | |
| | | | |
Value - Unaffiliated issuers | | | $ 5,939,198 | | | | $ 9,480,938 | | | | $ 2,225,954 | |
| | | |
Value -Non-controlled affiliates (Note 3f) | | | 54,056,623 | | | | 117,682,403 | | | | 46,543,261 | |
Value - Unaffiliated repurchase agreements | | | 428,718 | | | | 1,541,507 | | | | 66,841 | |
Receivables: | | | | | | | | | | | | |
Capital shares sold | | | 225,485 | | | | 763,906 | | | | 194,145 | |
| | | |
Dividends | | | 31,744 | | | | 50,090 | | | | 13,628 | |
Affiliates | | | 63,404 | | | | 69,338 | | | | 71,292 | |
Other assets | | | 7 | | | | 15 | | | | 4 | |
| | | | |
| | | |
Total assets | | | 60,745,179 | | | | 129,588,197 | | | | 49,115,125 | |
| | | | |
Liabilities: | | | | | | | | | | | | |
Payables: | | | | | | | | | | | | |
Investment securities purchased | | | 152,810 | | | | — | | | | 185,029 | |
Capital shares redeemed | | | 26,163 | | | | 331,602 | | | | 4,063 | |
Distribution fees | | | 13,691 | | | | 34,920 | | | | 9,270 | |
Transfer agent fees | | | 10,531 | | | | 24,506 | | | | 10,734 | |
Reports to shareholders | | | 5,088 | | | | 8,542 | | | | 4,803 | |
Professional fees | | | 23,244 | | | | 24,573 | | | | 24,109 | |
Accrued expenses and other liabilities | | | 371 | | | | 789 | | | | 340 | |
| | | | |
| | | |
Total liabilities | | | 231,898 | | | | 424,932 | | | | 238,348 | |
| | | | |
| | | |
Net assets, at value | | | $60,513,281 | | | | $129,163,265 | | | | $48,876,777 | |
| | | | |
Net assets consist of: | | | | | | | | | | | | |
Paid-in capital | | | $53,389,206 | | | | $107,036,047 | | | | $41,914,414 | |
Total distributable earnings (losses) | | | 7,124,075 | | | | 22,127,218 | | | | 6,962,363 | |
| | | | |
| | | |
Net assets, at value | | | $60,513,281 | | | | $129,163,265 | | | | $48,876,777 | |
| | | | |
| | | | |
| | | |
122 | | Annual Report | The accompanying notes are an integral part of these financial statements. | | franklintempleton.com |
FRANKLIN FUND ALLOCATOR SERIES
FINANCIAL STATEMENTS
Statements of Assets and Liabilities(continued)
December 31, 2019
| | | | | | | | | | | | |
| | | Franklin
LifeSmart™
2030 Retirement
Target Fund | | | Franklin
LifeSmart™
2035 Retirement
Target Fund | | | Franklin
LifeSmart™
2040 Retirement
Target Fund | |
| | | |
Class A: | | | | | | | | | | | | |
Net assets, at value | | | $27,247,682 | | | | $72,424,677 | | | | $19,322,425 | |
| | | | |
Shares outstanding | | | 2,051,200 | | | | 5,195,374 | | | | 1,404,546 | |
| | | | |
Net asset value per sharea | | | $13.28 | | | | $13.94 | | | | $13.76 | |
| | | | |
Maximum offering price per share (net asset value per share ÷ 94.50%) | | | $14.05 | | | | $14.75 | | | | $14.56 | |
| | | | |
Class C: | | | | | | | | | | | | |
Net assets, at value | | | $ 9,146,169 | | | | $21,114,810 | | | | $ 5,630,461 | |
| | | | |
Shares outstanding | | | 696,668 | | | | 1,552,150 | | | | 416,493 | |
| | | | |
Net asset value and maximum offering price per sharea | | | $13.13 | | | | $13.60 | | | | $13.52 | |
| | | | |
Class R: | | | | | | | | | | | | |
Net assets, at value | | | $ 1,058,480 | | | | $ 4,965,985 | | | | $ 1,528,421 | |
| | | | |
Shares outstanding | | | 79,792 | | | | 356,669 | | | | 111,226 | |
| | | | |
Net asset value and maximum offering price per share | | | $13.27 | | | | $13.92 | | | | $13.74 | |
| | | | |
Class R6: | | | | | | | | | | | | |
Net assets, at value | | | $22,064,413 | | | | $28,512,949 | | | | $22,249,752 | |
| | | | |
Shares outstanding | | | 1,654,424 | | | | 2,029,553 | | | | 1,606,730 | |
| | | | |
Net asset value and maximum offering price per share | | | $13.34 | | | | $14.05 | | | | $13.85 | |
| | | | |
Advisor Class: | | | | | | | | | | | | |
Net assets, at value | | | $ 996,537 | | | | $ 2,144,844 | | | | $ 145,718 | |
| | | | |
Shares outstanding | | | 74,786 | | | | 152,486 | | | | 10,543 | |
| | | | |
Net asset value and maximum offering price per share | | | $13.33 | | | | $14.07 | | | | $13.82 | |
| | | | |
aRedemption price is equal to net asset value less contingent deferred sales charges, if applicable.
| | | | |
franklintempleton.com | | The accompanying notes are an integral part of these financial statements. | Annual Report | | 123 |
FRANKLIN FUND ALLOCATOR SERIES
FINANCIAL STATEMENTS
Statements of Assets and Liabilities(continued)
December 31, 2019
| | | | | | | | | | | | |
| | | Franklin
LifeSmart™
2045 Retirement
Target Fund | | | Franklin
LifeSmart™
2050 Retirement
Target Fund | | | Franklin
LifeSmart™
2055 Retirement
Target Fund | |
| | | |
Assets: | | | | | | | | | | | | |
Investments in securities: | | | | | | | | | | | | |
Cost - Unaffiliated issuers | | | $ 3,912,661 | | | | $ 1,585,311 | | | | $ 779,237 | |
Cost -Non-controlled affiliates (Note 3f) | | | 70,763,394 | | | | 35,173,402 | | | | 16,887,674 | |
Cost - Unaffiliated repurchase agreements | | | 833,516 | | | | 115,579 | | | | — | |
| | | | |
Value - Unaffiliated issuers | | | $ 4,127,878 | | | | $ 1,686,136 | | | | $ 804,023 | |
| | | |
Value -Non-controlled affiliates (Note 3f) | | | 85,899,736 | | | | 40,956,008 | | | | 18,972,999 | |
Value - Unaffiliated repurchase agreements | | | 833,516 | | | | 115,579 | | | | — | |
Receivables: | | | | | | | | | | | | |
Capital shares sold | | | 358,450 | | | | 138,172 | | | | 60,971 | |
| | | |
Dividends | | | 13,519 | | | | 5,723 | | | | 2,609 | |
Affiliates | | | 92,948 | | | | 84,454 | | | | 97,227 | |
Other assets | | | 8 | | | | 4 | | | | 3 | |
| | | | |
| | | |
Total assets | | | 91,326,055 | | | | 42,986,076 | | | | 19,937,832 | |
| | | | |
Liabilities: | | | | | | | | | | | | |
Payables: | | | | | | | | | | | | |
Investment securities purchased | | | 330,024 | | | | — | | | | 82,389 | |
Capital shares redeemed | | | 489,022 | | | | 3,246 | | | | 26,394 | |
Distribution fees | | | 24,073 | | | | 9,153 | | | | 4,236 | |
Transfer agent fees | | | 24,037 | | | | 15,754 | | | | 10,817 | |
Reports to shareholders | | | 9,083 | | | | 5,655 | | | | 5,147 | |
Professional fees | | | 26,558 | | | | 23,566 | | | | 24,062 | |
Accrued expenses and other liabilities | | | 434 | | | | 389 | | | | 30 | |
| | | | |
| | | |
Total liabilities | | | 903,231 | | | | 57,763 | | | | 153,075 | |
| | | | |
| | | |
Net assets, at value | | | $90,422,824 | | | | $42,928,313 | | | | $19,784,757 | |
| | | | |
Net assets consist of: | | | | | | | | | | | | |
Paid-in capital | | | $73,092,938 | | | | $36,544,869 | | | | $17,497,993 | |
Total distributable earnings (losses) | | | 17,329,886 | | | | 6,383,444 | | | | 2,286,764 | |
| | | | |
| | | |
Net assets, at value | | | $90,422,824 | | | | $42,928,313 | | | | $19,784,757 | |
| | | | |
| | | | |
| | | |
124 | | Annual Report | The accompanying notes are an integral part of these financial statements. | | franklintempleton.com |
FRANKLIN FUND ALLOCATOR SERIES
FINANCIAL STATEMENTS
Statements of Assets and Liabilities(continued)
December 31, 2019
| | | | | | | | | | | | |
| | | Franklin
LifeSmart™
2045 Retirement
Target Fund | | | Franklin
LifeSmart™
2050 Retirement
Target Fund | | | Franklin
LifeSmart™
2055 Retirement
Target Fund | |
| | | |
Class A: | | | | | | | | | | | | |
Net assets, at value | | | $51,412,132 | | | | $16,728,919 | | | | $8,253,916 | |
| | | | |
Shares outstanding | | | 3,603,815 | | | | 1,193,839 | | | | 696,129 | |
| | | | |
Net asset value per sharea | | | $14.27 | | | | $14.01 | | | | $11.86 | |
| | | | |
Maximum offering price per share (net asset value per share ÷ 94.50%) | | | $15.10 | | | | $14.83 | | | | $12.55 | |
| | | | |
Class C: | | | | | | | | | | | | |
Net assets, at value | | | $13,332,667 | | | | $ 5,658,326 | | | | $3,562,780 | |
| | | | |
Shares outstanding | | | 960,540 | | | | 406,703 | | | | 304,788 | |
| | | | |
Net asset value and maximum offering price per sharea | | | $13.88 | | | | $13.91 | | | | $11.69 | |
| | | | |
Class R: | | | | | | | | | | | | |
Net assets, at value | | | $ 4,837,579 | | | | $ 2,364,358 | | | | $ 538,634 | |
| | | | |
Shares outstanding | | | 340,670 | | | | 168,748 | | | | 45,583 | |
| | | | |
Net asset value and maximum offering price per share | | | $14.20 | | | | $14.01 | | | | $11.82 | |
| | | | |
Class R6: | | | | | | | | | | | | |
Net assets, at value | | | $20,021,921 | | | | $17,559,549 | | | | $7,295,613 | |
| | | | |
Shares outstanding | | | 1,392,706 | | | | 1,245,664 | | | | 614,450 | |
| | | | |
Net asset value and maximum offering price per share | | | $14.38 | | | | $14.10 | | | | $11.87 | |
| | | | |
Advisor Class: | | | | | | | | | | | | |
Net assets, at value | | | $ 818,525 | | | | $ 617,161 | | | | $ 133,814 | |
| | | | |
Shares outstanding | | | 56,922 | | | | 43,776 | | | | 11,272 | |
| | | | |
Net asset value and maximum offering price per share | | | $14.38 | | | | $14.10 | | | | $11.87 | |
| | | | |
aRedemption price is equal to net asset value less contingent deferred sales charges, if applicable.
| | | | |
franklintempleton.com | | The accompanying notes are an integral part of these financial statements. | Annual Report | | 125 |
FRANKLIN FUND ALLOCATOR SERIES .
FINANCIAL STATEMENTS
Statements of Operations
for the year ended December 31, 2019
| | | | | | | | | | | | |
| | | Franklin
LifeSmart™
Retirement
Income Fund | | | Franklin
LifeSmart™
2020 Retirement
Target Fund | | | Franklin
LifeSmart™
2025 Retirement
Target Fund | |
| |
| | | |
Investment income: | | | | | | | | | | | | |
Dividends: | | | | | | | | | | | | |
Unaffiliated issuers | | | $ 298,335 | | | | $ 190,853 | | | | $ 469,916 | |
Non-controlled affiliates (Note 3f) | | | 1,501,286 | | | | 1,027,944 | | | | 2,676,775 | |
Interest: | | | | | | | | | | | | |
Unaffiliated issuers | | | 363,972 | | | | 2,592 | | | | 5,565 | |
| | | | |
| | | |
Total investment income | | | 2,163,593 | | | | 1,221,389 | | | | 3,152,256 | |
| | | | |
| | | |
Expenses: | | | | | | | | | | | | |
Management & Asset allocation fees (Note 3a) | | | 128,591 | | | | 108,447 | | | | 314,927 | |
Distribution fees: (Note 3c) | | | | | | | | | | | | |
Class A | | | 83,329 | | | | 67,799 | | | | 206,020 | |
Class C | | | 114,105 | | | | 65,985 | | | | 232,614 | |
Class R | | | 11,968 | | | | 3,562 | | | | 21,486 | |
Transfer agent fees: (Note 3e) | | | | | | | | | | | | |
Class A | | | 53,953 | | | | 40,482 | | | | 142,083 | |
Class C | | | 18,561 | | | | 9,869 | | | | 40,095 | |
Class R | | | 4,189 | | | | 1,065 | | | | 7,425 | |
Class R6 | | | 1,140 | | | | 2,397 | | | | 3,936 | |
Advisor Class | | | 2,872 | | | | 1,036 | | | | 2,694 | |
Custodian fees (Note 4) | | | 1,052 | | | | 31 | | | | 236 | |
Reports to shareholders | | | 16,217 | | | | 12,676 | | | | 27,852 | |
Registration and filing fees | | | 74,223 | | | | 75,913 | | | | 79,151 | |
Professional fees | | | 49,935 | | | | 46,777 | | | | 47,586 | |
Trustees’ fees and expenses | | | 504 | | | | — | | | | 1,214 | |
Other | | | 4,816 | | | | 3,955 | | | | 5,112 | |
| | | | |
| | | |
Total expenses | | | 565,455 | | | | 439,994 | | | | 1,132,431 | |
| | | |
Expense reductions (Note 4) | | | (35 | ) | | | — | | | | — | |
| | | |
Expenses waived/paid by affiliates (Note 3f and 3g) | | | (331,450 | ) | | | (263,438 | ) | | | (554,795 | ) |
| | | | |
| | | |
Net expenses | | | 233,970 | | | | 176,556 | | | | 577,636 | |
| | | | |
| | | |
Net investment income | | | 1,929,623 | | | | 1,044,833 | | | | 2,574,620 | |
| | | | |
| | | |
Realized and unrealized gains (losses): | | | | | | | | | | | | |
Net realized gain (loss) from: | | | | | | | | | | | | |
Sale of investments: | | | | | | | | | | | | |
Unaffiliated issuers | | | 69,789 | | | | 148,279 | | | | 556,245 | |
Non-controlled affiliates (Note 3f) | | | (105,699 | ) | | | 180,625 | | | | 4,557,587 | |
Capital gain distributions from Underlying Funds: | | | | | | | | | | | | |
Non-controlled affiliates (Note 3f) | | | 11,412 | | | | 267,316 | | | | 954,558 | |
| | | | |
| | | |
Net realized gain (loss) | | | (24,498 | ) | | | 596,220 | | | | 6,068,390 | |
| | | | |
| | | |
Net change in unrealized appreciation (depreciation) on: | | | | | | | | | | | | |
Investments: | | | | | | | | | | | | |
Unaffiliated issuers | | | 1,173,448 | | | | 129,604 | | | | 311,518 | |
Non-controlled affiliates (Note 3f) | | | 2,590,040 | | | | 3,587,109 | | | | 10,234,802 | |
| | | | |
| | | |
Net change in unrealized appreciation (depreciation) | | | 3,763,488 | | | | 3,716,713 | | | | 10,546,320 | |
| | | | |
| | | |
Net realized and unrealized gain (loss) | | | 3,738,990 | | | | 4,312,933 | | | | 16,614,710 | |
| | | | |
| | | |
Net increase (decrease) in net assets resulting from operations | | | $5,668,613 | | | | $5,357,766 | | | | $19,189,330 | |
| | | | |
| | | | |
| | | |
126 | | Annual Report| The accompanying notes are an integral part of these financial statements. | | franklintempleton.com |
FRANKLIN FUND ALLOCATOR SERIES
FINANCIAL STATEMENTS
Statements of Operations(continued)
for the year ended December 31, 2019
| | | | | | | | | | | | |
| | | Franklin
LifeSmart™
2030 Retirement
Target Fund | | | Franklin
LifeSmart™
2035 Retirement
Target Fund | | | Franklin
LifeSmart™
2040 Retirement
Target Fund | |
| |
| | | |
Investment income: | | | | | | | | | | | | |
Dividends: | | | | | | | | | | | | |
Unaffiliated issuers | | | $ 171,626 | | | | $ 316,513 | | | | $ 90,537 | |
Non-controlled affiliates (Note 3f) | | | 1,101,726 | | | | 2,274,266 | | | | 821,497 | |
Interest: | | | | | | | | | | | | |
Unaffiliated issuers | | | 1,887 | | | | 3,596 | | | | 1,252 | |
| | | | |
| | | |
Total investment income | | | 1,275,239 | | | | 2,594,375 | | | | 913,286 | |
| | | | |
| | | |
Expenses: | | | | | | | | | | | | |
Asset allocation fees (Note 3a) | | | 138,251 | | | | 301,441 | | | | 113,891 | |
Distribution fees: (Note 3c) | | | | | | | | | | | | |
Class A | | | 62,699 | | | | 169,356 | | | | 44,310 | |
Class C | | | 82,201 | | | | 198,631 | | | | 50,323 | |
Class R | | | 4,903 | | | | 24,370 | | | | 7,489 | |
Transfer agent fees: (Note 3e) | | | | | | | | | | | | |
Class A | | | 66,980 | | | | 153,098 | | | | 67,275 | |
Class C | | | 21,951 | | | | 44,994 | | | | 19,101 | |
Class R | | | 2,620 | | | | 11,214 | | | | 5,686 | |
Class R6 | | | 5,171 | | | | 6,664 | | | | 5,621 | |
Advisor Class | | | 2,432 | | | | 4,506 | | | | 297 | |
Custodian fees (Note 4) | | | 32 | | | | 67 | | | | 22 | |
Reports to shareholders | | | 14,693 | | | | 26,634 | | | | 13,501 | |
Registration and filing fees | | | 75,241 | | | | 78,296 | | | | 75,053 | |
Professional fees | | | 44,561 | | | | 46,087 | | | | 45,257 | |
Trustees’ fees and expenses | | | 519 | | | | 1,135 | | | | — | |
Other | | | 4,271 | | | | 5,321 | | | | 4,223 | |
| | | | |
| | | |
Total expenses | | | 526,525 | | | | 1,071,814 | | | | 452,049 | |
| | | |
Expense reductions (Note 4) | | | (6 | ) | | | — | | | | (6 | ) |
| | | |
Expenses waived/paid by affiliates (Note 3f and 3g) | | | (335,179 | ) | | | (583,781 | ) | | | (320,809 | ) |
| | | | |
| | | |
Net expenses | | | 191,340 | | | | 488,033 | | | | 131,234 | |
| | | | |
| | | |
Net investment income | | | 1,083,899 | | | | 2,106,342 | | | | 782,052 | |
| | | | |
| | | |
Realized and unrealized gains (losses): | | | | | | | | | | | | |
Net realized gain (loss) from: | | | | | | | | | | | | |
Sale of investments: | | | | | | | | | | | | |
Unaffiliated issuers | | | 248,122 | | | | 607,623 | | | | 221,229 | |
Non-controlled affiliates (Note 3f) | | | 380,003 | | | | 3,332,283 | | | | 469,982 | |
Capital gain distributions from Underlying Funds: | | | | | | | | | | | | |
Non-controlled affiliates (Note 3f) | | | 516,922 | | | | 1,255,119 | | | | 522,128 | |
| | | | |
| | | |
Net realized gain (loss) | | | 1,145,047 | | | | 5,195,025 | | | | 1,213,339 | |
| | | | |
| | | |
Net change in unrealized appreciation (depreciation) on: | | | | | | | | | | | | |
Investments: | | | | | | | | | | | | |
Unaffiliated issuers | | | 129,018 | | | | 239,862 | | | | 109,329 | |
Non-controlled affiliates (Note 3f) | | | 6,999,861 | | | | 14,334,977 | | | | 6,545,173 | |
| | | | |
| | | |
Net change in unrealized appreciation (depreciation) | | | 7,128,879 | | | | 14,574,839 | | | | 6,654,502 | |
| | | | |
| | | |
Net realized and unrealized gain (loss) | | | 8,273,926 | | | | 19,769,864 | | | | 7,867,841 | |
| | | | |
| | | |
Net increase (decrease) in net assets resulting from operations | | | $9,357,825 | | | | $21,876,206 | | | | $8,649,893 | |
| | | | |
| | | | |
franklintempleton.com | | The accompanying notes are an integral part of these financial statements. | Annual Report | | 127 |
FRANKLIN FUND ALLOCATOR SERIES
FINANCIAL STATEMENTS
Statements of Operations(continued)
for the year ended December 31, 2019
| | | | | | | | | | | | |
| | | Franklin
LifeSmart™
2045 Retirement
Target Fund | | | Franklin
LifeSmart™
2050 Retirement
Target Fund | | | Franklin
LifeSmart™
2055 Retirement
Target Fund | |
| |
| | | |
Investment income: | | | | | | | | | | | | |
Dividends: | | | | | | | | | | | | |
Unaffiliated issuers | | | $ 194,550 | | | | $ 88,524 | | | | $ 33,438 | |
Non-controlled affiliates (Note 3f) | | | 1,420,941 | | | | 684,811 | | | | 285,934 | |
Interest: | | | | | | | | | | | | |
Unaffiliated issuers | | | 2,515 | | | | 1,161 | | | | — | |
| | | | |
| | | |
Total investment income | | | 1,618,006 | | | | 774,496 | | | | 319,372 | |
| | | | |
| | | |
Expenses: | | | | | | | | | | | | |
Asset allocation fees (Note 3a) | | | 211,178 | | | | 102,482 | | | | 39,968 | |
Distribution fees: (Note 3c) | | | | | | | | | | | | |
Class A | | | 123,417 | | | | 46,001 | | | | 17,058 | |
Class C | | | 124,498 | | | | 48,445 | | | | 30,050 | |
Class R | | | 25,692 | | | | 10,661 | | | | 2,387 | |
Transfer agent fees: (Note 3e) | | | | | | | | | | | | |
Class A | | | 150,217 | | | | 93,077 | | | | 76,328 | |
Class C | | | 38,008 | | | | 24,501 | | | | 33,613 | |
Class R | | | 15,824 | | | | 10,792 | | | | 5,345 | |
Class R6 | | | 5,233 | | | | 4,472 | | | | 2,623 | |
Advisor Class | | | 2,251 | | | | 2,779 | | | | 937 | |
Custodian fees (Note 4) | | | 41 | | | | 19 | | | | 4 | |
Reports to shareholders | | | 23,691 | | | | 15,756 | | | | 15,852 | |
Registration and filing fees | | | 75,809 | | | | 76,023 | | | | 76,593 | |
Professional fees | | | 47,969 | | | | 44,886 | | | | 44,982 | |
Trustees’ fees and expenses | | | 810 | | | | — | | | | — | |
Other | | | 4,619 | | | | 4,181 | | | | 3,735 | |
| | | | |
| | | |
Total expenses | | | 849,257 | | | | 484,075 | | | | 349,475 | |
| | | |
Expense reductions (Note 4) | | | (13 | ) | | | (6 | ) | | | — | |
| | | |
Expenses waived/paid by affiliates (Note 3f and 3g) | | | (507,425 | ) | | | (350,495 | ) | | | (287,749 | ) |
| | | | |
| | | |
Net expenses | | | 341,819 | | | | 133,574 | | | | 61,726 | |
| | | | |
| | | |
Net investment income | | | 1,276,187 | | | | 640,922 | | | | 257,646 | |
| | | | |
| | | |
Realized and unrealized gains (losses): | | | | | | | | | | | | |
Net realized gain (loss) from: | | | | | | | | | | | | |
Sale of investments: | | | | | | | | | | | | |
Unaffiliated issuers | | | 479,936 | | | | 181,996 | | | | 80,633 | |
Non-controlled affiliates (Note 3f) | | | 2,037,542 | | | | 328,639 | | | | 31,490 | |
Capital gain distributions from Underlying Funds: | | | | | | | | | | | | |
Non-controlled affiliates (Note 3f) | | | 1,038,187 | | | | 496,181 | | | | 224,148 | |
| | | | |
| | | |
Net realized gain (loss) | | | 3,555,665 | | | | 1,006,816 | | | | 336,271 | |
| | | | |
| | | |
Net change in unrealized appreciation (depreciation) on: | | | | | | | | | | | | |
Investments: | | | | | | | | | | | | |
Unaffiliated issuers | | | 225,197 | | | | 125,582 | | | | 42,004 | |
Non-controlled affiliates (Note 3f) | | | 11,614,963 | | | | 6,108,240 | | | | 2,515,524 | |
| | | | |
| | | |
Net change in unrealized appreciation (depreciation) | | | 11,840,160 | | | | 6,233,822 | | | | 2,557,528 | |
| | | | |
| | | |
Net realized and unrealized gain (loss) | | | 15,395,825 | | | | 7,240,638 | | | | 2,893,799 | |
| | | | |
| | | |
Net increase (decrease) in net assets resulting from operations | | | $16,672,012 | | | | $7,881,560 | | | | $3,151,445 | |
| | | | |
| | | | |
| | | |
128 | | Annual Report| The accompanying notes are an integral part of these financial statements. | | franklintempleton.com |
FRANKLIN FUND ALLOCATOR SERIES
FINANCIAL STATEMENTS
Statements of Changes in Net Assets
| | | | | | | | | | | | | | | | |
| | | Franklin LifeSmart™ Retirement Income Fund | | | Franklin LifeSmart™ 2020
Retirement Target Fund | |
| | | Year Ended December 31, | | | Year Ended December 31, | |
| | | | |
| | | 2019 | | | 2018 | | | 2019 | | | 2018 | |
| | | | |
Increase (decrease) in net assets: | | | | | | | | | | | | | | | | |
Operations: | | | | | | | | | | | | | | | | |
Net investment income | | $ | 1,929,623 | | | $ | 2,460,093 | | | $ | 1,044,833 | | | $ | 1,140,201 | |
Net realized gain (loss) | | | (24,498 | ) | | | (381,077 | ) | | | 596,220 | | | | 558,196 | |
| | | | |
Net change in unrealized appreciation (depreciation) | | | 3,763,488 | | | | (3,393,694 | ) | | | 3,716,713 | | | | (3,371,541 | ) |
| | | | |
| | | | |
Net increase (decrease) in net assets resulting from operations | | | 5,668,613 | | | | (1,314,678 | ) | | | 5,357,766 | | | | (1,673,144 | ) |
| | | | |
| | | | |
Distributions to shareholders: | | | | | | | | | | | | | | | | |
Class A | | | (1,276,767 | ) | | | (1,265,546 | ) | | | (681,367 | ) | | | (659,797 | ) |
Class C | | | (354,915 | ) | | | (475,415 | ) | | | (117,703 | ) | | | (137,095 | ) |
Class R | | | (92,451 | ) | | | (133,884 | ) | | | (15,536 | ) | | | (20,875 | ) |
Class R6 | | | (92,676 | ) | | | (164,232 | ) | | | (233,070 | ) | | | (270,527 | ) |
Advisor Class | | | (72,973 | ) | | | (69,736 | ) | | | (19,078 | ) | | | (20,098 | ) |
| | | | |
| | | | |
Total distributions to shareholders | | | (1,889,782 | ) | | | (2,108,813 | ) | | | (1,066,754 | ) | | | (1,108,392 | ) |
| | | | |
| | | | |
Capital share transactions: (Note 2) | | | | | | | | | | | | | | | | |
Class A | | | 466,914 | | | | 1,109,498 | | | | 251,395 | | | | 5,474,693 | |
Class C | | | (2,093,619 | ) | | | (3,397,662 | ) | | | (203,456 | ) | | | 519,765 | |
Class R | | | (742,153 | ) | | | (983,295 | ) | | | (98,631 | ) | | | (149,570 | ) |
Class R6 | | | 87,827 | | | | (2,043,494 | ) | | | (1,970,403 | ) | | | 318,551 | |
Advisor Class | | | 347,505 | | | | (613,612 | ) | | | 39,851 | | | | (11,432 | ) |
| | | | |
| | | | |
Total capital share transactions | | | (1,933,526 | ) | | | (5,928,565 | ) | | | (1,981,244 | ) | | | 6,152,007 | |
| | | | |
| | | | |
Net increase (decrease) in net assets | | | 1,845,305 | | | | (9,352,056 | ) | | | 2,309,768 | | | | 3,370,471 | |
| | | | |
Net assets: | | | | | | | | | | | | | | | | |
Beginning of year | | | 49,339,478 | | | | 58,691,534 | | | | 40,437,716 | | | | 37,067,245 | |
| | | | |
| | | | |
End of year | | $ | 51,184,783 | | | $ | 49,339,478 | | | $ | 42,747,484 | | | $ | 40,437,716 | |
| | | | |
| | | | |
franklintempleton.com | | The accompanying notes are an integral part of these financial statements. | Annual Report | | 129 |
FRANKLIN FUND ALLOCATOR SERIES
FINANCIAL STATEMENTS
Statements of Changes in Net Assets(continued)
| | | | | | | | | | | | | | | | |
| | | Franklin LifeSmart™ 2025
Retirement Target Fund | | | Franklin LifeSmart™ 2030
Retirement Target Fund | |
| | | Year Ended December 31, | | | Year Ended December 31, | |
| | | | |
| | | 2019 | | | 2018 | | | 2019 | | | 2018 | |
| | | | |
Increase (decrease) in net assets: | | | | | | | | | | | | | | | | |
Operations: | | | | | | | | | | | | | | | | |
Net investment income | | $ | 2,574,620 | | | $ | 3,003,480 | | | $ | 1,083,899 | | | $ | 1,122,081 | |
Net realized gain (loss) | | | 6,068,390 | | | | 3,812,211 | | | | 1,145,047 | | | | 1,119,123 | |
Net change in unrealized appreciation (depreciation) | | | 10,546,320 | | | | (13,809,351 | ) | | | 7,128,879 | | | | (5,595,596 | ) |
| | | | |
| | | | |
Net increase (decrease) in net assets resulting from operations | | | 19,189,330 | | | | (6,993,660 | ) | | | 9,357,825 | | | | (3,354,392 | ) |
| | | | |
Distributions to shareholders: | | | | | | | | | | | | | | | | |
Class A | | | (3,045,510 | ) | | | (4,729,261 | ) | | | (731,665 | ) | | | (733,628 | ) |
Class C | | | (688,301 | ) | | | (1,271,613 | ) | | | (177,159 | ) | | | (200,814 | ) |
Class R | | | (142,497 | ) | | | (288,382 | ) | | | (26,329 | ) | | | (27,160 | ) |
Class R6 | | | (562,509 | ) | | | (1,012,283 | ) | | | (639,478 | ) | | | (677,876 | ) |
Advisor Class | | | (59,263 | ) | | | (99,618 | ) | | | (28,917 | ) | | | (29,589 | ) |
| | | | |
| | | | |
Total distributions to shareholders | | | (4,498,080 | ) | | | (7,401,157 | ) | | | (1,603,548 | ) | | | (1,669,067 | ) |
| | | | |
| | | | |
Capital share transactions: (Note 2) | | | | | | | | | | | | | | | | |
Class A | | | 486,785 | | | | 7,682,847 | | | | 1,275,501 | | | | 5,393,551 | |
Class C | | | (1,149,678 | ) | | | (2,660,758 | ) | | | 524,197 | | | | 590,557 | |
Class R | | | (1,103,245 | ) | | | (1,104,813 | ) | | | 107,214 | | | | (252,387 | ) |
Class R6 | | | (1,254,003 | ) | | | (995,143 | ) | | | 868,076 | | | | 2,000,010 | |
Advisor Class | | | (102,196 | ) | | | (235,402 | ) | | | 86,613 | | | | 206,579 | |
| | | | |
| | | | |
Total capital share transactions | | | (3,122,337 | ) | | | 2,686,731 | | | | 2,861,601 | | | | 7,938,310 | |
| | | | |
| | | | |
Net increase (decrease) in net assets | | | 11,568,913 | | | | (11,708,086 | ) | | | 10,615,878 | | | | 2,914,851 | |
| | | | |
Net assets: | | | | | | | | | | | | | | | | |
Beginning of year | | | 118,144,611 | | | | 129,852,697 | | | | 49,897,403 | | | | 46,982,552 | |
| | | | |
| | | | |
End of year | | $ | 129,713,524 | | | $ | 118,144,611 | | | $ | 60,513,281 | | | $ | 49,897,403 | |
| | | | |
| | | | |
| | | |
130 | | Annual Report | The accompanying notes are an integral part of these financial statements. | | franklintempleton.com |
FRANKLIN FUND ALLOCATOR SERIES
FINANCIAL STATEMENTS
Statements of Changes in Net Assets(continued)
| | | | | | | | | | | | | | | | |
| | | Franklin LifeSmart™ 2035
Retirement Target Fund | | | Franklin LifeSmart™ 2040
Retirement Target Fund | |
| | | Year Ended December 31, | | | Year Ended December 31, | |
| | | | |
| | | 2019 | | | 2018 | | | 2019 | | | 2018 | |
| | | | |
Increase (decrease) in net assets: | | | | | | | | | | | | | | | | |
Operations: | | | | | | | | | | | | | | | | |
Net investment income | | $ | 2,106,342 | | | $ | 2,293,282 | | | $ | 782,052 | | | $ | 847,776 | |
Net realized gain (loss) | | | 5,195,025 | | | | 3,859,355 | | | | 1,213,339 | | | | 958,425 | |
Net change in unrealized appreciation (depreciation) | | | 14,574,839 | | | | (14,177,765 | ) | | | 6,654,502 | | | | (4,838,326 | ) |
| | | | |
| | | | |
Net increase (decrease) in net assets resulting from operations | | | 21,876,206 | | | | (8,025,128 | ) | | | 8,649,893 | | | | (3,032,125 | ) |
| | | | |
| | | | |
Distributions to shareholders: | | | | | | | | | | | | | | | | |
Class A | | | (2,650,612 | ) | | | (3,502,326 | ) | | | (454,576 | ) | | | (672,314 | ) |
Class C | | | (642,691 | ) | | | (987,591 | ) | | | (94,774 | ) | | | (154,808 | ) |
Class R | | | (176,421 | ) | | | (279,358 | ) | | | (34,053 | ) | | | (52,003 | ) |
Class R6 | | | (1,090,008 | ) | | | (1,429,713 | ) | | | (606,642 | ) | | | (835,051 | ) |
Advisor Class | | | (83,743 | ) | | | (106,260 | ) | | | (2,459 | ) | | | (6,715 | ) |
| | | | |
Total distributions to shareholders | | | (4,643,475 | ) | | | (6,305,248 | ) | | | (1,192,504 | ) | | | (1,720,891 | ) |
| | | | |
| | | | |
Capital share transactions: (Note 2) | | | | | | | | | | | | | | | | |
Class A | | | 2,644,878 | | | | 6,810,464 | | | | 455,027 | | | | 3,820,457 | |
Class C | | | (109,181 | ) | | | (603,017 | ) | | | 524,059 | | | | 787,563 | |
Class R | | | (515,294 | ) | | | (363,210 | ) | | | 13,556 | | | | (95,889 | ) |
Class R6 | | | 2,641,808 | | | | (1,275,766 | ) | | | 563,689 | | | | 2,897,191 | |
Advisor Class | | | 138,806 | | | | 381,299 | | | | (30,122 | ) | | | 25,423 | |
| | | | |
Total capital share transactions | | | 4,801,017 | | | | 4,949,770 | | | | 1,526,209 | | | | 7,434,745 | |
| | | | |
| | | | |
Net increase (decrease) in net assets | | | 22,033,748 | | | | (9,380,606 | ) | | | 8,983,598 | | | | 2,681,729 | |
| | | | |
Net assets: | | | | | | | | | | | | | | | | |
Beginning of year | | | 107,129,517 | | | | 116,510,123 | | | | 39,893,179 | | | | 37,211,450 | |
| | | | |
| | | | |
End of year | | $ | 129,163,265 | | | $ | 107,129,517 | | | $ | 48,876,777 | | | $ | 39,893,179 | |
| | | | |
| | | | |
franklintempleton.com | | The accompanying notes are an integral part of these financial statements. | Annual Report | | 131 |
FRANKLIN FUND ALLOCATOR SERIES
FINANCIAL STATEMENTS
Statements of Changes in Net Assets(continued)
| | | | | | | | | | | | | | | | |
| | | Franklin LifeSmart™ 2045
Retirement Target Fund | | | Franklin LifeSmart™ 2050
Retirement Target Fund | |
| | | Year Ended December 31, | | | Year Ended December 31, | |
| | | | |
| | | 2019 | | | 2018 | | | 2019 | | | 2018 | |
| | | | |
Increase (decrease) in net assets: | | | | | | | | | | | | | | | | |
Operations: | | | | | | | | | | | | | | | | |
Net investment income | | $ | 1,276,187 | | | $ | 1,500,972 | | | $ | 640,922 | | | $ | 694,632 | |
Net realized gain (loss) | | | 3,555,665 | | | | 2,756,646 | | | | 1,006,816 | | | | 766,254 | |
Net change in unrealized appreciation (depreciation) | | | 11,840,160 | | | | (10,314,331 | ) | | | 6,233,822 | | | | (4,293,456 | ) |
| | | | |
| | | | |
Net increase (decrease) in net assets resulting from operations | | | 16,672,012 | | | | (6,056,713 | ) | | | 7,881,560 | | | | (2,832,570 | ) |
| | | | |
| | | | |
Distributions to shareholders: | | | | | | | | | | | | | | | | |
Class A | | | (1,557,379 | ) | | | (2,653,305 | ) | | | (420,909 | ) | | | (643,844 | ) |
Class C | | | (310,595 | ) | | | (631,126 | ) | | | (75,423 | ) | | | (136,313 | ) |
Class R | | | (149,104 | ) | | | (290,065 | ) | | | (42,749 | ) | | | (65,856 | ) |
Class R6 | | | (616,228 | ) | | | (816,627 | ) | | | (399,544 | ) | | | (502,397 | ) |
Advisor Class | | | (25,065 | ) | | | (38,954 | ) | | | (13,716 | ) | | | (20,381 | ) |
| | | | |
| | | | |
Total distributions to shareholders | | | (2,658,371 | ) | | | (4,430,077 | ) | | | (952,341 | ) | | | (1,368,791 | ) |
| | | | |
| | | | |
Capital share transactions: (Note 2) | | | | | | | | | | | | | �� | | | |
Class A | | | (1,767,654 | ) | | | 4,433,504 | | | | (3,200,320 | ) | | | 5,033,748 | |
Class C | | | (516,518 | ) | | | 213,125 | | | | 654,068 | | | | 883,885 | |
Class R | | | (1,190,716 | ) | | | 380,231 | | | | 184,278 | | | | 425,810 | |
Class R6 | | | 4,646,121 | | | | 682,622 | | | | 3,204,608 | | | | 1,110,776 | |
Advisor Class | | | 56,659 | | | | 131,996 | | | | 51,345 | | | | 12,334 | |
| | | | |
| | | | |
Total capital share transactions | | | 1,227,892 | | | | 5,841,478 | | | | 893,979 | | | | 7,466,553 | |
| | | | |
Net increase (decrease) in net assets | | | 15,241,533 | | | | (4,645,312 | ) | | | 7,823,198 | | | | 3,265,192 | |
| | | | |
Net assets: | | | | | | | | | | | | | | | | |
Beginning of year | | | 75,181,291 | | | | 79,826,603 | | | | 35,105,115 | | | | 31,839,923 | |
| | | | |
| | | | |
End of year | | $ | 90,422,824 | | | $ | 75,181,291 | | | $ | 42,928,313 | | | $ | 35,105,115 | |
| | | | |
| | | | |
| | | |
132 | | Annual Report | The accompanying notes are an integral part of these financial statements. | | franklintempleton.com |
FRANKLIN FUND ALLOCATOR SERIES
FINANCIAL STATEMENTS
Statements of Changes in Net Assets(continued)
| | | | | | | | |
| | | Franklin LifeSmart™ 2055
Retirement Target Fund | |
| | | Year Ended December 31, | |
| | | 2019 | | | 2018 | |
| | |
Increase (decrease) in net assets: | | | | | | | | |
Operations: | | | | | | | | |
Net investment income | | $ | 257,646 | | | $ | 233,963 | |
Net realized gain (loss) | | | 336,271 | | | | 129,172 | |
Net change in unrealized appreciation (depreciation) | | | 2,557,528 | | | | (1,392,034) | |
| | | | |
| | |
Net increase (decrease) in net assets resulting from operations | | | 3,151,445 | | | | (1,028,899) | |
| | | | |
| | |
Distributions to shareholders: | | | | | | | | |
Class A | | | (134,928) | | | | (205,410) | |
Class C | | | (39,940) | | | | (64,563) | |
Class R | | | (8,843) | | | | (13,634) | |
Class R6 | | | (136,446) | | | | (139,527) | |
Advisor Class | | | (2,359) | | | | (1,790) | |
| | | | |
| | |
Total distributions to shareholders | | | (322,516) | | | | (424,924) | |
| | | | |
| | |
Capital share transactions: (Note 2) | | | | | | | | |
Class A | | | 883,611 | | | | 2,124,795 | |
Class C | | | 707,288 | | | | 1,182,923 | |
Class R | | | 30,079 | | | | 121,483 | |
Class R6 | | | 2,775,929 | | | | 808,786 | |
Advisor Class | | | 73,474 | | | | 19,567 | |
| | | | |
| | |
Total capital share transactions | | | 4,470,381 | | | | 4,257,554 | |
| | | | |
Net increase (decrease) in net assets | | | 7,299,310 | | | | 2,803,731 | |
| | |
Net assets: | | | | | | | | |
Beginning of year | | | 12,485,447 | | | | 9,681,716 | |
| | | | |
| | |
End of year | | $ | 19,784,757 | | | $ | 12,485,447 | |
| | | | |
| | | | |
franklintempleton.com | | The accompanying notes are an integral part of these financial statements. | Annual Report | | 133 |
FRANKLIN FUND ALLOCATOR SERIES
Notes to Financial Statements
1. Organization and Significant Accounting Policies
Franklin Fund Allocator Series (Trust) is registered under the Investment Company Act of 1940 (1940 Act) as anopen-end management investment company, consisting of twenty-five separate funds, nine of which are included in this report (Funds) and applies the specialized accounting and reporting guidance in U.S. Generally Accepted Accounting Principles (U.S. GAAP). The Funds invest primarily in mutual funds (Underlying Funds) and exchange traded funds (ETFs), including affiliated funds managed by Franklin Templeton (FT Underlying Funds). The Funds offer five classes of shares: Class A, Class C, Class R, Class R6, and Advisor Class. Class C shares automatically convert to Class A shares after they have been held for 10 years. Each class of shares may differ by its initial sales load, contingent deferred sales charges, voting rights on matters affecting a single class, its exchange privilege and fees due to differing arrangements for distribution and transfer agent fees.
The accounting policies of the Underlying Funds are outlined in their respective shareholder reports. A copy of the Underlying Funds’ shareholder reports, in which each fund invests is available on the U.S. Securities and Exchange Commission (SEC) website at sec.gov. The Underlying Funds’ shareholder reports are not covered by this report.
The following summarizes the Funds’ significant accounting policies.
a. Financial Instrument Valuation
The Funds’ investments in financial instruments are carried at fair value daily. Fair value is the price that would be received to sell an asset or paid to transfer a liability in an orderly transaction between market participants on the measurement date. The Funds calculate the net asset value (NAV) per share each business day as of 4 p.m. Eastern time or the regularly scheduled close of the New York Stock Exchange (NYSE), whichever is earlier. Under compliance policies and procedures approved by the Trust’s Board of Trustees (the Board), the Funds’ administrator has responsibility for oversight of valuation, including leading the cross-functional Valuation Committee (VC). The Funds may utilize independent pricing services, quotations from securities and financial instrument dealers, and other market sources to determine fair value.
Investments in the Underlying Funds are valued at their closing NAV each trading day. ETFs listed on an exchange or on the NASDAQ National Market System are valued at the last quoted sale price or the official closing price of the day, respectively.
Debt securities generally trade in theover-the-counter market rather than on a securities exchange. The Funds’ pricing services use multiple valuation techniques to determine fair value. In instances where sufficient market activity exists, the pricing services may utilize a market-based approach through which quotes from market makers are used to determine fair value. In instances where sufficient market activity may not exist or is limited, the pricing services also utilize proprietary valuation models which may consider market characteristics such as benchmark yield curves, credit spreads, estimated default rates, anticipated market interest rate volatility, coupon rates, anticipated timing of principal repayments, underlying collateral, and other unique security features in order to estimate the relevant cash flows, which are then discounted to calculate the fair value.
Investments in repurchase agreements are valued at cost, which approximates fair value.
The Funds have procedures to determine the fair value of financial instruments for which market prices are not reliable or readily available. Under these procedures, the Funds primarily employs a market-based approach which may use related or comparable assets or liabilities, recent transactions, market multiples, book values, and other relevant information for the investment to determine the fair value of the investment. An income-based valuation approach may also be used in which the anticipated future cash flows of the investment are discounted to calculate fair value. Discounts may also be applied due to the nature or duration of any restrictions on the disposition of the investments. Due to the inherent uncertainty of valuations of such investments, the fair values may differ significantly from the values that would have been used had an active market existed.
b. Joint Repurchase Agreement
Certain or all Funds enter into a joint repurchase agreement whereby their uninvested cash balance is deposited into a joint cash account with other funds managed by the investment manager or an affiliate of the investment manager and is used to invest in one or more repurchase agreements. The value and face amount of the joint repurchase agreement are allocated to the funds based on theirpro-rata
| | | | |
| | | |
134 | | Annual Report | | franklintempleton.com |
FRANKLIN FUND ALLOCATOR SERIES
NOTES TO FINANCIAL STATEMENTS
interest. A repurchase agreement is accounted for as a loan by the Fund to the seller, collateralized by securities which are delivered to the Funds’ custodian. The fair value, including accrued interest, of the initial collateralization is required to be at least 102% of the dollar amount invested by the funds, with the value of the underlying securities marked to market daily to maintain coverage of at least 100%. Repurchase agreements are subject to the terms of Master Repurchase Agreements (MRAs) with approved counterparties (sellers). The MRAs contain various provisions, including but not limited to events of default and maintenance of collateral for repurchase agreements. In the event of default by either the seller or the Funds, certain MRAs may permit thenon-defaulting party to net andclose-out all transactions, if any, traded under such agreements. The Funds may sell securities it holds as collateral and apply the proceeds towards the repurchase price and any other amounts owed by the seller to the Funds in the event of default by the seller. This could involve costs or delays in addition to a loss on the securities if their value falls below the repurchase price owed by the seller. The joint repurchase agreement held by the Funds at year end, as indicated in the Statements of Investments, had been entered into on December 31, 2019.
c. Index-Linked Notes
Certain or all Funds invest in index-linked notes. Index-linked notes are senior, unsecured, subordinated debt securities issued by a financial institution, and the value is based on the price movements of the underlying index. Index-linked notes are designed to provide investors access to the returns of various market benchmarks and intended to replicate the economic effects that would apply had the Fund directly purchased the underlying referenced asset or basket of assets. The risks of investing in index-linked notes include unfavorable price movements in the underlying index and the credit risk of the issuing financial institution. There may be no guarantee of a return of principal with index-linked notes and the appreciation potential may be limited. Index-linked notes may be more volatile and less liquid than other investments held by the Funds.
d. Income Taxes
It is each Fund’s policy to qualify as a regulated investment company under the Internal Revenue Code. Each Fund intends to distribute to shareholders substantially all of its
taxable income and net realized gains to relieve it from federal income and excise taxes. As a result, no provision for U.S. federal income taxes is required.
Each Fund may recognize an income tax liability related to its uncertain tax positions under U.S. GAAP when the uncertain tax position has a less than 50% probability that it will be sustained upon examination by the tax authorities based on its technical merits. As of December 31, 2019, each Fund has determined that no tax liability is required in its financial statements related to uncertain tax positions for any open tax years (or expected to be taken in future tax years). Open tax years are those that remain subject to examination and are based on the statute of limitations in each jurisdiction in which the Fund invests.
e. Security Transactions, Investment Income, Expenses and Distributions
Security transactions are accounted for on trade date. Realized gains and losses on security transactions are determined on a specific identification basis. Interest income and estimated expenses are accrued daily. Dividend income and realized capital gain distributions are recorded on theex-dividend date. Distributions to shareholders are recorded on theex-dividend date. The Franklin LifeSmart™ Retirement Income Fund employs a managed distribution policy. Under this policy, the Fund will distribute level monthly distributions in any given year regardless of the performance of the Fund; however, the twelfth monthly payment may be greater than the initially anticipated amount if additional income or capital gains are required to be distributed. These distributions may include income and capital gains generated by the Underlying Funds, as well as a possible return of capital component, if necessary, to meet the annual distribution rate. The annual payout rate may be adjusted higher or lower from year to year in response to market conditions. Distributable earnings are determined according to income tax regulations (tax basis) and may differ from earnings recorded in accordance with U.S. GAAP. These differences may be permanent or temporary. Permanent differences are reclassified among capital accounts to reflect their tax character. These reclassifications have no impact on net assets or the results of operations. Temporary differences are not reclassified, as they may reverse in subsequent periods.
Common expenses incurred by the Trust are allocated among the Funds based on the ratio of net assets of each Fund to the combined net assets of the Trust or based on the ratio of
| | | | |
franklintempleton.com | | Annual Report | | 135 |
FRANKLIN FUND ALLOCATOR SERIES
NOTES TO FINANCIAL STATEMENTS
1. Organization and Significant Accounting Policies (continued)
e. Security Transactions, Investment Income, Expenses and Distributions(continued)
number of shareholders of each Fund to the combined number of shareholders of the Trust. Fund specific expenses are charged directly to the Fund that incurred the expense.
The Funds indirectly bear their proportionate share of expenses from the Underlying Funds and ETFs. Since the Underlying Funds and ETFs have varied expense levels and the Funds may own different proportions of the Underlying Funds and ETFs at different times, the amount of expenses incurred indirectly by the Funds will vary.
Realized and unrealized gains and losses and net investment income, excluding class specific expenses, are allocated daily to each class of shares based upon the relative proportion of net assets of each class. Differences in per share distributions by class are generally due to differences in class specific expenses.
f. Accounting Estimates
The preparation of financial statements in accordance with U.S. GAAP requires management to make estimates and assumptions that affect the reported amounts of assets and liabilities at the date of the financial statements and the amounts of income and expenses during the reporting period. Actual results could differ from those estimates.
g. Guarantees and Indemnifications
Under the Trust’s organizational documents, its officers and trustees are indemnified by the Trust against certain liabilities arising out of the performance of their duties to the Trust. Additionally, in the normal course of business, the Trust, on behalf of the Funds, enters into contracts with service providers that contain general indemnification clauses. The Trust’s maximum exposure under these arrangements is unknown as this would involve future claims that may be made against the Trust that have not yet occurred. Currently, the Trust expects the risk of loss to be remote.
2. Shares of Beneficial Interest
At December 31, 2019, there were an unlimited number of shares authorized (without par value). Transactions in the Funds’ shares were as follows:
| | | | | | | | | | | | | | | | |
| | | Franklin LifeSmart™ Retirement Income Fund | | Franklin LifeSmart™ 2020
Retirement Target Fund | |
| | | | |
| | | | |
| | | Shares | | Amount | | | Shares | | | Amount | |
| | | | |
Class A Shares: | | | | | | | | | | | | | | | | |
| | | | |
Year ended December 31, 2019 | | | | | | | | | | | | | | | | |
| | | | |
Shares solda | | | 559,233 | | | | $ 6,108,032 | | | | 607,030 | | | | $ 7,094,411 | |
| | | | |
Shares issued in reinvestment of distributions | | | 114,983 | | | | 1,257,350 | | | | 57,341 | | | | 677,198 | |
| | | | |
Shares redeemed | | | (631,790 | ) | | | (6,898,468 | ) | | | (636,674 | ) | | | (7,520,214 | ) |
| | | | |
| | | | |
Net increase (decrease) | | | 42,426 | | | | $ 466,914 | | | | 27,697 | | | | $ 251,395 | |
| | | | |
| | | | |
Year ended December 31, 2018 | | | | | | | | | | | | | | | | |
| | | | |
Shares solda | | | 846,337 | | | | $ 9,147,067 | | | | 713,018 | | | | $ 8,380,062 | |
| | | | |
Shares issued in reinvestment of distributions | | | 115,040 | | | | 1,243,885 | | | | 57,731 | | | | 654,964 | |
| | | | |
Shares redeemed | | | (852,099 | ) | | | (9,281,454 | ) | | | (303,410 | ) | | | (3,560,333 | ) |
| | | | |
| | | | |
Net increase (decrease) | | | 109,278 | | | | $ 1,109,498 | | | | 467,339 | | | | $ 5,474,693 | |
| | | | |
| | | | |
| | | |
136 | | Annual Report | | franklintempleton.com |
FRANKLIN FUND ALLOCATOR SERIES
NOTES TO FINANCIAL STATEMENTS
| | | | | | | | | | | | | | | | |
| | | Franklin LifeSmart™
Retirement Income Fund | | Franklin LifeSmart™ 2020
Retirement Target Fund | |
| | | | |
| | | | |
| | | Shares | | Amount | | | Shares | | | Amount | |
| | | | |
Class C Shares: | | | | | | | | | | | | | | | | |
| | | | |
Year ended December 31, 2019 | | | | | | | | | | | | | | | | |
| | | | |
Shares sold. | | | 205,376 | | | | $ 2,214,834 | | | | 199,052 | | | | $ 2,321,159 | |
| | | | |
Shares issued in reinvestment of distributions | | | 31,448 | | | | 339,465 | | | | 10,032 | | | | 117,703 | |
| | | | |
Shares redeemeda | | | (430,570 | ) | | | (4,647,918 | ) | | | (228,092 | ) | | | (2,642,318 | ) |
| | | | |
| | | | |
Net increase (decrease) | | | (193,746 | ) | | | $ (2,093,619 | ) | | | (19,008 | ) | | | $ (203,456 | ) |
| | | | |
| | | | |
Year ended December 31, 2018 | | | | | | | | | | | | | | | | |
| | | | |
Shares sold. | | | 220,879 | | | | $ 2,377,740 | | | | 176,919 | | | | $ 2,062,370 | |
| | | | |
Shares issued in reinvestment of distributions | | | 42,833 | | | | 458,328 | | | | 12,173 | | | | 137,095 | |
| | | | |
Shares redeemeda | | | (581,658 | ) | | | (6,233,730 | ) | | | (144,604 | ) | | | (1,679,700 | ) |
| | | | |
| | | | |
Net increase (decrease) | | | (317,946 | ) | | | $(3,397,662 | ) | | | 44,488 | | | | $ 519,765 | |
| | | | |
| | | | |
Class R Shares: | | | | | | | | | | | | | | | | |
| | | | |
Year ended December 31, 2019 | | | | | | | | | | | | | | | | |
| | | | |
Shares sold. | | | 26,806 | | | | $ 291,111 | | | | 19,468 | | | | $ 227,258 | |
| | | | |
Shares issued in reinvestment of distributions | | | 6,150 | | | | 66,979 | | | | 1,315 | | | | 15,536 | |
| | | | |
Shares redeemed | | | (101,605 | ) | | | (1,100,243 | ) | | | (29,264 | ) | | | (341,425 | ) |
| | | | |
| | | | |
Net increase (decrease) | | | (68,649 | ) | | | $ (742,153 | ) | | | (8,481 | ) | | | $ (98,631 | ) |
| | | | |
| | | | |
Year ended December 31, 2018 | | | | | | | | | | | | | | | | |
| | | | |
Shares sold. | | | 35,545 | | | | $ 385,385 | | | | 28,612 | | | | $ 336,125 | |
| | | | |
Shares issued in reinvestment of distributions | | | 8,763 | | | | 94,564 | | | | 1,840 | | | | 20,875 | |
| | | | |
Shares redeemed | | | (135,188 | ) | | | (1,463,244 | ) | | | (43,209 | ) | | | (506,570 | ) |
| | | | |
| | | | |
Net increase (decrease) | | | (90,880 | ) | | | $ (983,295 | ) | | | (12,757 | ) | | | $ (149,570 | ) |
| | | | |
| | | | |
Class R6 Shares: | | | | | | | | | | | | | | | | |
| | | | |
Year ended December 31, 2019 | | | | | | | | | | | | | | | | |
| | | | |
Shares sold. | | | 130,363 | | | | $ 1,418,631 | | | | 151,042 | | | | $ 1,772,745 | |
| | | | |
Shares issued in reinvestment of distributions | | | 197 | | | | 2,137 | | | | 50 | | | | 576 | |
| | | | |
Shares redeemed | | | (121,096 | ) | | | (1,332,941 | ) | | | (318,860 | ) | | | (3,743,724 | ) |
| | | | |
| | | | |
Net increase (decrease) | | | 9,464 | | | | $ 87,827 | | | | (167,768 | ) | | | $(1,970,403 | ) |
| | | | |
| | | | |
Year ended December 31, 2018 | | | | | | | | | | | | | | | | |
| | | | |
Shares sold. | | | 88,955 | | | | $ 975,848 | | | | 213,073 | | | | $ 2,487,718 | |
| | | | |
Shares issued in reinvestment of distributions | | | 7,584 | | | | 82,764 | | | | 206 | | | | 2,361 | |
| | | | |
Shares redeemed | | | (286,584 | ) | | | (3,102,106 | ) | | | (185,607 | ) | | | (2,171,528 | ) |
| | | | |
| | | | |
Net increase (decrease) | | | (190,045 | ) | | | $(2,043,494 | ) | | | 27,672 | | | | $ 318,551 | |
| | | | |
| | | | |
franklintempleton.com | | Annual Report | | 137 |
FRANKLIN FUND ALLOCATOR SERIES
NOTES TO FINANCIAL STATEMENTS
2. Shares of Beneficial Interest(continued)
| | | | | | | | | | | | | | | | |
| | | Franklin LifeSmart™
Retirement Income Fund | | Franklin LifeSmart™ 2020
Retirement Target Fund | |
| | | | |
| | | | |
| | | Shares | | Amount | | | Shares | | | Amount | |
| | | | |
Advisor Class Shares: | | | | | | | | | | | | | | | | |
| | | | |
Year ended December 31, 2019 | | | | | | | | | | | | | | | | |
| | | | |
Shares sold | | | 41,829 | | | | $ 456,585 | | | | 7,814 | | | | $ 93,111 | |
| | | | |
Shares issued in reinvestment of distributions | | | 6,437 | | | | 70,687 | | | | 1,609 | | | | 19,078 | |
| | | | |
Shares redeemed | | | (16,343 | ) | | | (179,767 | ) | | | (6,090 | ) | | | (72,338 | ) |
| | | | |
| | | | |
Net increase (decrease) | | | 31,923 | | | | $ 347,505 | | | | 3,333 | | | | $ 39,851 | |
| | | | |
| | | | |
Year ended December 31, 2018 | | | | | | | | | | | | | | | | |
| | | | |
Shares sold | | | 36,625 | | | | $ 397,388 | | | | 34,183 | | | | $ 400,016 | |
| | | | |
Shares issued in reinvestment of distributions | | | 5,558 | | | | 60,364 | | | | 1,759 | | | | 20,098 | |
| | | | |
Shares redeemed | | | (97,826 | ) | | | (1,071,364 | ) | | | (36,796 | ) | | | (431,546 | ) |
| | | | |
| | | | |
Net increase (decrease) | | | (55,643 | ) | | | $ (613,612 | ) | | | (854 | ) | | | $ (11,432 | ) |
| | | | |
| |
aMay include a portion of Class C shares that were automatically converted to Class A. | | | | | |
| | | Franklin LifeSmart™ 2025
Retirement Target Fund | | Franklin LifeSmart™ 2030
Retirement Target Fund | |
| | | | |
| | | | |
| | | Shares | | Amount | | | Shares | | | Amount | |
| | | | |
Class A Shares: | | | | | | | | | | | | | | | | |
| | | | |
Year ended December 31, 2019 | | | | | | | | | | | | | | | | |
| | | | |
Shares solda | | | 1,094,603 | | | | $ 13,746,669 | | | | 602,484 | | | | $ 7,611,523 | |
| | | | |
Shares issued in reinvestment of distributions | | | 238,365 | | | | 3,036,346 | | | | 57,127 | | | | 731,551 | |
| | | | |
Shares redeemed | | | (1,299,276 | ) | | | (16,296,230 | ) | | | (560,958 | ) | | | (7,067,573 | ) |
| | | | |
| | | | |
Net increase (decrease) | | | 33,692 | | | | $ 486,785 | | | | 98,653 | | | | $ 1,275,501 | |
| | | | |
| | | | |
Year ended December 31, 2018 | | | | | | | | | | | | | | | | |
| | | | |
Shares solda | | | 1,455,435 | | | | $ 18,751,088 | | | | 685,749 | | | | $ 8,628,468 | |
| | | | |
Shares issued in reinvestment of distributions | | | 394,193 | | | | 4,700,865 | | | | 61,982 | | | | 733,522 | |
| | | | |
Shares redeemed | | | (1,224,459 | ) | | | (15,769,106 | ) | | | (312,616 | ) | | | (3,968,439 | ) |
| | | | |
| | | | |
Net increase (decrease) | | | 625,169 | | | | $ 7,682,847 | | | | 435,115 | | | | $ 5,393,551 | |
| | | | |
| | | | |
Class C Shares: | | | | | | | | | | | | | | | | |
| | | | |
Year ended December 31, 2019 | | | | | | | | | | | | | | | | |
| | | | |
Shares sold | | | 357,759 | | | | $ 4,413,141 | | | | 240,212 | | | | $ 2,967,689 | |
| | | | |
Shares issued in reinvestment of distributions | | | 52,237 | | | | 655,098 | | | | 13,930 | | | | 176,408 | |
| | | | |
Shares redeemeda | | | (504,442 | ) | | | (6,217,917 | ) | | | (213,721 | ) | | | (2,619,900 | ) |
| | | | |
| | | | |
Net increase (decrease) | | | (94,446 | ) | | | $ (1,149,678 | ) | | | 40,421 | | | | $ 524,197 | |
| | | | |
| | | | |
Year ended December 31, 2018 | | | | | | | | | | | | | | | | |
| | | | |
Shares sold | | | 412,149 | | | | $ 5,254,400 | | | | 170,731 | | | | $ 2,146,806 | |
| | | | |
Shares issued in reinvestment of distributions | | | 102,701 | | | | 1,201,550 | | | | 17,293 | | | | 200,699 | |
| | | | |
Shares redeemeda | | | (719,903 | ) | | | (9,116,708 | ) | | | (140,263 | ) | | | (1,756,948 | ) |
| | | | |
| | | | |
Net increase (decrease) | | | (205,053 | ) | | | $ (2,660,758 | ) | | | 47,761 | | | | $ 590,557 | |
| | | | |
| | | | |
| | | |
138 | | Annual Report | | franklintempleton.com |
FRANKLIN FUND ALLOCATOR SERIES
NOTES TO FINANCIAL STATEMENTS
| | | | | | | | | | | | | | | | |
| | | Franklin LifeSmart™ 2025
Retirement Target Fund | | Franklin LifeSmart™ 2030
Retirement Target Fund | |
| | | | |
| | | | |
| | | Shares | | Amount | | | Shares | | | Amount | |
| | | | |
Class R Shares: | | | | | | | | | | | | | | | | |
| | | | |
Year ended December 31, 2019 | | | | | | | | | | | | | | | | |
| | | | |
Shares sold | | | 54,755 | | | | $ 683,429 | | | | 25,408 | | | | $ 320,374 | |
| | | | |
Shares issued in reinvestment of distributions | | | 10,128 | | | | 128,541 | | | | 2,060 | | | | 26,329 | |
| | | | |
Shares redeemed | | | (153,741 | ) | | | (1,915,215 | ) | | | (18,780 | ) | | | (239,489 | ) |
| | | | |
| | | | |
Net increase (decrease) | | | (88,858 | ) | | | $ (1,103,245 | ) | | | 8,688 | | | | $ 107,214 | |
| | | | |
| | | | |
Year ended December 31, 2018 | | | | | | | | | | | | | | | | |
| | | | |
Shares sold | | | 76,323 | | | | $ 979,523 | | | | 36,922 | | | | $ 459,743 | |
| | | | |
Shares issued in reinvestment of distributions | | | 19,202 | | | | 228,866 | | | | 2,295 | | | | 27,161 | |
| | | | |
Shares redeemed | | | (179,691 | ) | | | (2,313,202 | ) | | | (58,637 | ) | | | (739,291 | ) |
| | | | |
| | | | |
Net increase (decrease) | | | (84,166 | ) | | | $ (1,104,813 | ) | | | (19,420 | ) | | | $ (252,387 | ) |
| | | | |
| | | | |
Class R6 Shares: | | | | | | | | | | | | | | | | |
| | | | |
Year ended December 31, 2019 | | | | | | | | | | | | | | | | |
| | | | |
Shares sold | | | 285,703 | | | | $ 3,601,451 | | | | 415,710 | | | | $ 5,242,377 | |
| | | | |
Shares issued in reinvestment of distributions | | | 875 | | | | 11,183 | | | | 26 | | | | 330 | |
| | | | |
Shares redeemed | | | (387,125 | ) | | | (4,866,637 | ) | | | (355,006 | ) | | | (4,374,631 | ) |
| | | | |
| | | | |
Net increase (decrease) | | | (100,547 | ) | | | $ (1,254,003 | ) | | | 60,730 | | | | $ 868,076 | |
| | | | |
| | | | |
Year ended December 31, 2018 | | | | | | | | | | | | | | | | |
| | | | |
Shares sold | | | 365,683 | | | | $ 4,675,425 | | | | 314,750 | | | | $ 3,960,684 | |
| | | | |
Shares issued in reinvestment of distributions | | | 8,162 | | | | 103,814 | | | | 239 | | | | 2,873 | |
| | | | |
Shares redeemed | | | (450,139 | ) | | | (5,774,382 | ) | | | (154,162 | ) | | | (1,963,547 | ) |
| | | | |
| | | | |
Net increase (decrease) | | | (76,294 | ) | | | $ (995,143 | ) | | | 160,827 | | | | $ 2,000,010 | |
| | | | |
| | | | |
Advisor Class Shares: | | | | | | | | | | | | | | | | |
| | | | |
Year ended December 31, 2019 | | | | | | | | | | | | | | | | |
| | | | |
Shares sold | | | 19,706 | | | | $ 242,320 | | | | 11,684 | | | | $ 148,467 | |
| | | | |
Shares issued in reinvestment of distributions | | | 4,141 | | | | 52,819 | | | | 2,251 | | | | 28,917 | |
| | | | |
Shares redeemed | | | (31,572 | ) | | | (397,335 | ) | | | (7,240 | ) | | | (90,771 | ) |
| | | | |
| | | | |
Net increase (decrease) | | | (7,725 | ) | | | $ (102,196 | ) | | | 6,695 | | | | $ 86,613 | |
| | | | |
| | | | |
Year ended December 31, 2018 | | | | | | | | | | | | | | | | |
| | | | |
Shares sold | | | 33,277 | | | | $ 431,821 | | | | 23,692 | | | | $ 302,878 | |
| | | | |
Shares issued in reinvestment of distributions | | | 7,451 | | | | 89,544 | | | | 2,476 | | | | 29,588 | |
| | | | |
Shares redeemed | | | (58,779 | ) | | | (756,767 | ) | | | (10,045 | ) | | | (125,887 | ) |
| | | | |
| | | | |
Net increase (decrease) | | | (18,051 | ) | | | $ (235,402 | ) | | | 16,123 | | | | $ 206,579 | |
| | | | |
aMay include a portion of Class C shares that were automatically converted to Class A.
| | | | |
franklintempleton.com | | Annual Report | | 139 |
FRANKLIN FUND ALLOCATOR SERIES
NOTES TO FINANCIAL STATEMENTS
2. Shares of Beneficial Interest(continued)
| | | | | | | | | | | | | | | | |
| | | Franklin LifeSmart™ 2035
Retirement Target Fund | | Franklin LifeSmart™ 2040
Retirement Target Fund | |
| | | | |
| | | | |
| | | Shares | | Amount | | | Shares | | | Amount | |
| | | | |
Class A Shares: | | | | | | | | | | | | | | | | |
| | | | |
Year ended December 31, 2019 | | | | | | | | | | | | | | | | |
| | | | |
Shares solda | | | 952,514 | | | | $ 12,623,647 | | | | 424,447 | | | | $ 5,488,272 | |
| | | | |
Shares issued in reinvestment of distributions | | | 193,791 | | | | 2,637,056 | | | | 34,671 | | | | 454,570 | |
| | | | |
Shares redeemed | | | (945,824 | ) | | | (12,615,825 | ) | | | (425,571 | ) | | | (5,487,815 | ) |
| | | | |
| | | | |
Net increase (decrease) | | | 200,481 | | | | $ 2,644,878 | | | | 33,547 | | | | $ 455,027 | |
| | | | |
| | | | |
Year ended December 31, 2018 | | | | | | | | | | | | | | | | |
| | | | |
Shares solda | | | 942,846 | | | | $ 12,872,991 | | | | 433,108 | | | | $ 5,637,921 | |
| | | | |
Shares issued in reinvestment of distributions | | | 278,830 | | | | 3,485,432 | | | | 55,620 | | | | 672,314 | |
| | | | |
Shares redeemed | | | (695,333 | ) | | | (9,547,959 | ) | | | (191,890 | ) | | | (2,489,778 | ) |
| | | | |
| | | | |
Net increase (decrease) | | | 526,343 | | | | $ 6,810,464 | | | | 296,838 | | | | $ 3,820,457 | |
| | | | |
| | | | |
Class C Shares: | | | | | | | | | | | | | | | | |
| | | | |
Year ended December 31, 2019 | | | | | | | | | | | | | | | | |
| | | | |
Shares sold | | | 252,589 | | | | $ 3,280,827 | | | | 98,079 | | | | $ 1,245,027 | |
| | | | |
Shares issued in reinvestment of distributions | | | 45,597 | | | | 607,021 | | | | 7,362 | | | | 94,765 | |
| | | | |
Shares redeemeda | | | (307,638 | ) | | | (3,997,029 | ) | | | (64,241 | ) | | | (815,733 | ) |
| | | | |
| | | | |
Net increase (decrease) | | | (9,452 | ) | | | $ (109,181 | ) | | | 41,200 | | | | $ 524,059 | |
| | | | |
| | | | |
Year ended December 31, 2018 | | | | | | | | | | | | | | | | |
| | | | |
Shares sold | | | 341,805 | | | | $ 4,576,003 | | | | 100,077 | | | | $ 1,279,948 | |
| | | | |
Shares issued in reinvestment of distributions | | | 76,759 | | | | 931,152 | | | | 13,144 | | | | 154,668 | |
| | | | |
Shares redeemeda | | | (457,318 | ) | | | (6,110,172 | ) | | | (50,847 | ) | | | (647,053 | ) |
| | | | |
| | | | |
Net increase (decrease) | | | (38,754 | ) | | | $ (603,017 | ) | | | 62,374 | | | | $ 787,563 | |
| | | | |
| | | | |
Class R Shares: | | | | | | | | | | | | | | | | |
| | | | |
Year ended December 31, 2019 | | | | | | | | | | | | | | | | |
| | | | |
Shares sold | | | 75,334 | | | | $ 997,069 | | | | 29,039 | | | | $ 379,133 | |
| | | | |
Shares issued in reinvestment of distributions | | | 11,988 | | | | 162,960 | | | | 2,605 | | | | 34,053 | |
| | | | |
Shares redeemed | | | (127,008 | ) | | | (1,675,323 | ) | | | (30,192 | ) | | | (399,630 | ) |
| | | | |
| | | | |
Net increase (decrease) | | | (39,686 | ) | | | $ (515,294 | ) | | | 1,452 | | | | $ 13,556 | |
| | | | |
| | | | |
Year ended December 31, 2018 | | | | | | | | | | | | | | | | |
| | | | |
Shares sold | | | 111,104 | | | | $ 1,510,051 | | | | 25,994 | | | | $ 337,136 | |
| | | | |
Shares issued in reinvestment of distributions | | | 19,685 | | | | 246,024 | | | | 4,314 | | | | 52,003 | |
| | | | |
Shares redeemed | | | (154,125 | ) | | | (2,119,285 | ) | | | (37,246 | ) | | | (485,028 | ) |
| | | | |
| | | | |
Net increase (decrease) | | | (23,336 | ) | | | $ (363,210 | ) | | | (6,938 | ) | | | $ (95,889 | ) |
| | | | |
| | | | |
| | | |
140 | | Annual Report | | franklintempleton.com |
FRANKLIN FUND ALLOCATOR SERIES
NOTES TO FINANCIAL STATEMENTS
| | | | | | | | | | | | | | | | |
| | | Franklin LifeSmart™ 2035
Retirement Target Fund | | Franklin LifeSmart™ 2040
Retirement Target Fund | |
| | | | |
| | | | |
| | | Shares | | Amount | | | Shares | | | Amount | |
| | | | |
Class R6 Shares: | | | | | | | | | | | | | | | | |
| | | | |
Year ended December 31, 2019 | | | | | | | | | | | | | | | | |
| | | | |
Shares sold | | | 419,754 | | | | $ 5,648,454 | | | | 434,017 | | | | $ 5,617,339 | |
| | | | |
Shares issued in reinvestment of distributions | | | 707 | | | | 9,518 | | | | 570 | | | | 7,487 | |
| | | | |
Shares redeemed | | | (223,416 | ) | | | (3,016,164 | ) | | | (389,390 | ) | | | (5,061,137 | ) |
| | | | |
| | | | |
Net increase (decrease) | | | 197,045 | | | | $ 2,641,808 | | | | 45,197 | | | | $ 563,689 | |
| | | | |
| | | | |
Year ended December 31, 2018 | | | | | | | | | | | | | | | | |
| | | | |
Shares sold | | | 414,595 | | | | $ 5,606,519 | | | | 375,889 | | | | $ 4,871,182 | |
| | | | |
Shares issued in reinvestment of distributions | | | 5,525 | | | | 74,275 | | | | 971 | | | | 11,876 | |
| | | | |
Shares redeemed | | | (507,947 | ) | | | (6,956,560 | ) | | | (151,876 | ) | | | (1,985,867 | ) |
| | | | |
| | | | |
Net increase (decrease) | | | (87,827 | ) | | | $ (1,275,766 | ) | | | 224,984 | | | | $ 2,897,191 | |
| | | | |
| | | | |
Advisor Class Shares: | | | | | | | | | | | | | | | | |
| | | | |
Year ended December 31, 2019 | | | | | | | | | | | | | | | | |
| | | | |
Shares sold | | | 24,716 | | | | $ 329,525 | | | | 7,315 | | | | $ 96,559 | |
| | | | |
Shares issued in reinvestment of distributions | | | 5,834 | | | | 80,057 | | | | 185 | | | | 2,459 | |
| | | | |
Shares redeemed | | | (20,087 | ) | | | (270,776 | ) | | | (11,116 | ) | | | (129,140 | ) |
| | | | |
| | | | |
Net increase (decrease) | | | 10,463 | | | | $ 138,806 | | | | (3,616 | ) | | | $ (30,122 | ) |
| | | | |
| | | | |
Year ended December 31, 2018 | | | | | | | | | | | | | | | | |
| | | | |
Shares sold | | | 26,985 | | | | $ 381,837 | | | | 11,186 | | | | $ 136,707 | |
| | | | |
Shares issued in reinvestment of distributions | | | 8,344 | | | | 105,679 | | | | 549 | | | | 6,715 | |
| | | | |
Shares redeemed | | | (7,561 | ) | | | (106,217 | ) | | | (9,424 | ) | | | (117,999 | ) |
| | | | |
| | | | |
Net increase (decrease) | | | 27,768 | | | | $ 381,299 | | | | 2,311 | | | | $ 25,423 | |
| | | | |
aMay include a portion of Class C shares that were automatically converted to Class A. | | | | | | | | | |
| | | Franklin LifeSmart™ 2045
Retirement Target Fund | | Franklin LifeSmart™ 2050
Retirement Target Fund | |
| | | | |
| | | | |
| | | Shares | | Amount | | | Shares | | | Amount | |
| | | | |
Class A Shares: | | | | | | | | | | | | | | | | |
| | | | |
Year ended December 31, 2019 | | | | | | | | | | | | | | | | |
| | | | |
Shares solda | | | 593,185 | | | | $ 7,926,250 | | | | 546,568 | | | | $ 7,111,903 | |
| | | | |
Shares issued in reinvestment of distributions | | | 112,785 | | | | 1,550,074 | | | | 31,696 | | | | 420,832 | |
| | | | |
Shares redeemed | | | (839,331 | ) | | | (11,243,978 | ) | | | (820,620 | ) | | | (10,733,055 | ) |
| | | | |
| | | | |
Net increase (decrease) | | | (133,361 | ) | | | $ (1,767,654 | ) | | | (242,356 | ) | | | $ (3,200,320 | ) |
| | | | |
| | | | |
Year ended December 31, 2018 | | | | | | | | | | | | | | | | |
| | | | |
Shares solda | | | 743,394 | | | | $ 10,204,029 | | | | 629,521 | | | | $ 8,264,139 | |
| | | | |
Shares issued in reinvestment of distributions | | | 210,172 | | | | 2,638,382 | | | | 52,624 | | | | 643,113 | |
| | | | |
Shares redeemed | | | (610,804 | ) | | | (8,408,907 | ) | | | (293,673 | ) | | | (3,873,504 | ) |
| | | | |
| | | | |
Net increase (decrease) | | | 342,762 | | | | $ 4,433,504 | | | | 388,472 | | | | $ 5,033,748 | |
| | | | |
| | | | |
franklintempleton.com | | Annual Report | | 141 |
FRANKLIN FUND ALLOCATOR SERIES
NOTES TO FINANCIAL STATEMENTS
2. Shares of Beneficial Interest(continued)
| | | | | | | | | | | | | | | | |
| | | Franklin LifeSmart™ 2045
Retirement Target Fund | | Franklin LifeSmart™ 2050
Retirement Target Fund | |
| | | | |
| | | | |
| | | Shares | | Amount | | | Shares | | | Amount | |
| | | | |
Class C Shares: | | | | | | | | | | | | | | | | |
| | | | |
Year ended December 31, 2019 | | | | | | | | | | | | | | | | |
| | | | |
Shares sold | | | 161,488 | | | | $ 2,102,339 | | | | 120,250 | | | | $ 1,566,273 | |
| | | | |
Shares issued in reinvestment of distributions | | | 21,997 | | | | 295,130 | | | | 5,701 | | | | 75,396 | |
| | | | |
Shares redeemeda | | | (224,331 | ) | | | (2,913,987 | ) | | | (76,625 | ) | | | (987,601 | ) |
| | | | |
| | | | |
Net increase (decrease) | | | (40,846 | ) | | | $ (516,518 | ) | | | 49,326 | | | | $ 654,068 | |
| | | | |
| | | | |
Year ended December 31, 2018 | | | | | | | | | | | | | | | | |
| | | | |
Shares sold | | | 220,486 | | | | $ 2,951,191 | | | | 124,657 | | | | $ 1,633,863 | |
| | | | |
Shares issued in reinvestment of distributions | | | 48,056 | | | | 582,816 | | | | 11,314 | | | | 136,120 | |
| | | | |
Shares redeemeda | | | (248,382 | ) | | | (3,320,882 | ) | | | (68,191 | ) | | | (886,098 | ) |
| | | | |
| | | | |
Net increase (decrease) | | | 20,160 | | | | $ 213,125 | | | | 67,780 | | | | $ 883,885 | |
| | | | |
| | | | |
Class R Shares: | | | | | | | | | | | | | | | | |
| | | | |
Year ended December 31, 2019 | | | | | | | | | | | | | | | | |
| | | | |
Shares sold | | | 58,943 | | | | $ 786,075 | | | | 59,561 | | | | $ 784,449 | |
| | | | |
Shares issued in reinvestment of distributions | | | 9,740 | | | | 133,313 | | | | 3,210 | | | | 42,748 | |
| | | | |
Shares redeemed | | | (157,555 | ) | | | (2,110,104 | ) | | | (48,603 | ) | | | (642,919 | ) |
| | | | |
| | | | |
Net increase (decrease) | | | (88,872 | ) | | | $ (1,190,716 | ) | | | 14,168 | | | | $ 184,278 | |
| | | | |
| | | | |
Year ended December 31, 2018 | | | | | | | | | | | | | | | | |
| | | | |
Shares sold | | | 98,581 | | | | $ 1,331,338 | | | | 48,484 | | | | $ 634,521 | |
| | | | |
Shares issued in reinvestment of distributions | | | 20,329 | | | | 253,154 | | | | 5,403 | | | | 65,857 | |
| | | | |
Shares redeemed | | | (87,538 | ) | | | (1,204,261 | ) | | | (21,209 | ) | | | (274,568 | ) |
| | | | |
| | | | |
Net increase (decrease) | | | 31,372 | | | | $ 380,231 | | | | 32,678 | | | | $ 425,810 | |
| | | | |
| | | | |
Class R6 Shares: | | | | | | | | | | | | | | | | |
| | | | |
Year ended December 31, 2019 | | | | | | | | | | | | | | | | |
| | | | |
Shares sold | | | 529,427 | | | | $ 7,107,373 | | | | 462,889 | | | | $ 6,054,148 | |
| | | | |
Shares issued in reinvestment of distributions | | | 24 | | | | 337 | | | | 1 | | | | 16 | |
| | | | |
Shares redeemed | | | (182,629 | ) | | | (2,461,589 | ) | | | (216,990 | ) | | | (2,849,556 | ) |
| | | | |
| | | | |
Net increase (decrease) | | | 346,822 | | | | $ 4,646,121 | | | | 245,900 | | | | $ 3,204,608 | |
| | | | |
| | | | |
Year ended December 31, 2018 | | | | | | | | | | | | | | | | |
| | | | |
Shares sold | | | 304,466 | | | | $ 4,144,657 | | | | 273,723 | | | | $ 3,586,958 | |
| | | | |
Shares issued in reinvestment of distributions | | | 3,420 | | | | 46,956 | | | | 125 | | | | 1,577 | |
| | | | |
Shares redeemed | | | (255,441 | ) | | | (3,508,991 | ) | | | (186,424 | ) | | | (2,477,759 | ) |
| | | | |
| | | | |
Net increase (decrease) | | | 52,445 | | | | $ 682,622 | | | | 87,424 | | | | $ 1,110,776 | |
| | | | |
| | | | |
| | | |
142 | | Annual Report | | franklintempleton.com |
FRANKLIN FUND ALLOCATOR SERIES
NOTES TO FINANCIAL STATEMENTS
| | | | | | | | | | | | | | | | |
| | | Franklin LifeSmart™ 2045
Retirement Target Fund | | Franklin LifeSmart™ 2050
Retirement Target Fund | |
| | | | |
| | | | |
| | | Shares | | Amount | | | Shares | | | Amount | |
| | | | |
Advisor Class Shares: | | | | | | | | | | | | | | | | |
| | | | |
Year ended December 31, 2019 | | | | | | | | | | | | | | | | |
| | | | |
Shares sold | | | 10,884 | | | | $ 146,062 | | | | 9,846 | | | | $ 126,331 | |
| | | | |
Shares issued in reinvestment of distributions | | | 1,807 | | | | 25,066 | | | | 1,023 | | | | 13,716 | |
| | | | |
Shares redeemed | | | (8,476 | ) | | | (114,469 | ) | | | (6,702 | ) | | | (88,702 | ) |
| | | | |
| | | | |
Net increase (decrease) | | | 4,215 | | | | $ 56,659 | | | | 4,167 | | | | $ 51,345 | |
| | | | |
| | | | |
Year ended December 31, 2018 | | | | | | | | | | | | | | | | |
| | | | |
Shares sold | | | 20,410 | | | | $ 277,144 | | | | 5,799 | | | | $ 77,912 | |
| | | | |
Shares issued in reinvestment of distributions | | | 3,070 | | | | 38,933 | | | | 1,645 | | | | 20,381 | |
| | | | |
Shares redeemed | | | (14,162 | ) | | | (184,081 | ) | | | (6,468 | ) | | | (85,959 | ) |
| | | | |
| | | | |
Net increase (decrease) | | | 9,318 | | | | $ 131,996 | | | | 976 | | | | $ 12,334 | |
| | | | |
aMay include a portion of Class C shares that were automatically converted to Class A.
| | | | | | | | |
| | | Franklin LifeSmart™ 2055
Retirement Target Fund |
| | | | |
| | |
| | | Shares | | Amount | |
| | |
Class A Shares: | | | | | | | | |
| | |
Year ended December 31, 2019 | | | | | | | | |
| | |
Shares solda | | | 309,652 | | | | $ 3,402,692 | |
| | |
Shares issued in reinvestment of distributions | | | 12,013 | | | | 134,886 | |
| | |
Shares redeemed | | | (243,462 | ) | | | (2,653,967 | ) |
| | | | |
| | |
Net increase (decrease) | | | 78,203 | | | | $883,611 | |
| | | | |
| | |
Year ended December 31, 2018 | | | | | | | | |
| | |
Shares solda | | | 271,042 | | | | $ 2,986,319 | |
| | |
Shares issued in reinvestment of distributions | | | 17,370 | | | | 179,191 | |
| | |
Shares redeemed | | | (94,471 | ) | | | (1,040,715 | ) |
| | | | |
| | |
Net increase (decrease) | | | 193,941 | | | | $ 2,124,795 | |
| | | | |
| | |
Class C Shares: | | | | | | | | |
| | |
Year ended December 31, 2019 | | | | | | | | |
| | |
Shares sold | | | 125,134 | | | | $ 1,361,318 | |
| | |
Shares issued in reinvestment of distributions | | | 3,622 | | | | 39,940 | |
| | |
Shares redeemeda | | | (63,795 | ) | | | (693,970 | ) |
| | | | |
| | |
Net increase (decrease) | | | 64,961 | | | | $ 707,288 | |
| | | | |
| | |
Year ended December 31, 2018 | | | | | | | | |
| | |
Shares sold | | | 135,717 | | | | $ 1,480,176 | |
| | |
Shares issued in reinvestment of distributions | | | 6,397 | | | | 64,562 | |
| | |
Shares redeemeda | | | (33,053 | ) | | | (361,815 | ) |
| | | | |
| | |
Net increase (decrease) | | | 109,061 | | | | $ 1,182,923 | |
| | | | |
| | | | |
franklintempleton.com | | Annual Report | | 143 |
FRANKLIN FUND ALLOCATOR SERIES
NOTES TO FINANCIAL STATEMENTS
2. Shares of Beneficial Interest(continued)
| | | | | | | | |
| | | Franklin LifeSmart™ 2055
Retirement Target Fund |
| | | | |
| | |
| | | Shares | | Amount | |
| | |
Class R Shares: | | | | | | | | |
| | |
Year ended December 31, 2019 | | | | | | | | |
| | |
Shares sold | | | 23,437 | | | | $ 257,833 | |
| | |
Shares issued in reinvestment of distributions | | | 793 | | | | 8,843 | |
| | |
Shares redeemed | | | (21,798 | ) | | | (236,597 | ) |
| | | | |
| | |
Net increase (decrease) | | | 2,432 | | | | $ 30,079 | |
| | | | |
| | |
Year ended December 31, 2018 | | | | | | | | |
| | |
Shares sold | | | 18,477 | | | | $ 202,630 | |
| | |
Shares issued in reinvestment of distributions | | | 1,327 | | | | 13,635 | |
| | |
Shares redeemed | | | (8,805 | ) | | | (94,782 | ) |
| | | | |
| | |
Net increase (decrease) | | | 10,999 | | | | $ 121,483 | |
| | | | |
| | |
Class R6 Shares: | | | | | | | | |
| | |
Year ended December 31, 2019 | | | | | | | | |
| | |
Shares sold | | | 350,574 | | | | $ 3,859,523 | |
| | |
Shares issued in reinvestment of distributions | | | 8 | | | | 90 | |
| | |
Shares redeemed | | | (97,304 | ) | | | (1,083,684 | ) |
| | | | |
| | |
Net increase (decrease) | | | 253,278 | | | | $ 2,775,929 | |
| | | | |
| | |
Year ended December 31, 2018 | | | | | | | | |
| | |
Shares sold | | | 216,204 | | | | $ 2,390,763 | |
| | |
Shares issued in reinvestment of distributions | | | 768 | | | | 8,477 | |
| | |
Shares redeemed | | | (143,727 | ) | | | (1,590,454 | ) |
| | | | |
| | |
Net increase (decrease) | | | 73,245 | | | | $ 808,786 | |
| | | | |
| | |
Advisor Class Shares: | | | | | | | | |
| | |
Year ended December 31, 2019 | | | | | | | | |
| | |
Shares sold | | | 8,142 | | | | $ 90,279 | |
| | |
Shares issued in reinvestment of distributions | | | 209 | | | | 2,359 | |
| | |
Shares redeemed | | | (1,751 | ) | | | (19,164 | ) |
| | | | |
| | |
Net increase (decrease) | | | 6,600 | | | | $ 73,474 | |
| | | | |
| | |
Year ended December 31, 2018 | | | | | | | | |
| | |
Shares sold | | | 2,160 | | | | $ 23,911 | |
| | |
Shares issued in reinvestment of distributions | | | 134 | | | | 1,397 | |
| | |
Shares redeemed | | | (529 | ) | | | (5,741 | ) |
| | | | |
| | |
Net increase (decrease) | | | 1,765 | | | | $ 19,567 | |
| | | | |
aMay include a portion of Class C shares that were automatically converted to Class A.
| | | | |
| | | |
144 | | Annual Report | | franklintempleton.com |
FRANKLIN FUND ALLOCATOR SERIES
NOTES TO FINANCIAL STATEMENTS
3. Transactions with Affiliates
Franklin Resources, Inc. is the holding company for various subsidiaries that together are referred to as Franklin Templeton. Certain officers and trustees of the Funds are also officers and/or directors/trustees of certain of the FT Underlying Funds and of the following subsidiaries:
| | |
| Subsidiary | | Affiliation |
| |
Franklin Advisers, Inc. (Advisers) | | Investment manager |
| |
Franklin Templeton Services, LLC (FT Services) | | Administrative manager |
| |
Franklin Templeton Distributors, Inc. (Distributors) | | Principal underwriter |
| |
Franklin Templeton Investor Services, LLC (Investor Services) | | Transfer agent |
a. Management and Asset Allocation Fees
The Funds, except Franklin LifeSmartTM Retirement Income Fund, pay an asset allocation fee to Advisers of 0.25% per year of the average daily net assets of each of the Funds for investment advisory services, consisting principally of determining the allocation of assets of the Funds among the Underlying Funds and ETFs.
Franklin LifeSmartTM Retirement Income Fund pays an investment management fee to Advisers of 0.25% per year of the average daily net assets of the fund.
b. Administrative Fees
Under an agreement with Advisers, FT Services provides administrative services to the Funds and is not paid by the Funds for the services.
c. Distribution Fees
The Board has adopted distribution plans for each share class, with the exception of Class R6 and Advisor Class shares, pursuant to Rule12b-1 under the 1940 Act. Under the Funds’ Class A reimbursement distribution plans, the Funds reimburse Distributors for costs incurred in connection with the servicing, sale and distribution of each Fund’s shares up to the maximum annual plan rate for each class. Under the Class A reimbursement distribution plans, costs exceeding the maximum for the current plan year cannot be reimbursed in subsequent periods. In addition, under the Funds’ Class C and R compensation distribution plans, the Funds pay Distributors for costs incurred in connection with the servicing, sale and distribution of each Fund’s shares up to the maximum annual plan rate for each class. The plan year, for purposes of monitoring compliance with the maximum annual plan rates, is February 1 through January 31 for each Fund.
The maximum annual plan rates, based on the average daily net assets, for each class, are as follows:
| | | | |
Class A | | | 0.35% | |
| |
Class C | | | 1.00% | |
| |
Class R | | | 0.50% | |
The Board has set the current rate at 0.25% per year for Class A shares until further notice and approval by the Board.
| | | | |
franklintempleton.com | | Annual Report | | 145 |
FRANKLIN FUND ALLOCATOR SERIES
NOTES TO FINANCIAL STATEMENTS
3. Transactions with Affiliates(continued)
d. Sales Charges/Underwriting Agreements
Front-end sales charges and contingent deferred sales charges (CDSC) do not represent expenses of the Funds. These charges are deducted from the proceeds of sales of fund shares prior to investment or from redemption proceeds prior to remittance, as applicable. Distributors has advised the Funds of the following commission transactions related to the sales and redemptions of the Funds’ shares for the year:
| | | | | | | | | | | | |
| | | Franklin LifeSmart™ Retirement Income Fund | | | Franklin LifeSmart™ 2020 Retirement Target Fund | | | Franklin LifeSmart™ 2025 Retirement Target Fund | |
| |
| | | |
Sales charges retained net of commissions paid to unaffiliated brokers/dealers | | | $6,973 | | | | $9,632 | | | | $20,994 | |
| | | |
CDSC retained | | | $ 835 | | | | $2,618 | | | | $ 1,957 | |
| | | |
| | | Franklin
LifeSmart™
2030 Retirement
Target Fund | | | Franklin
LifeSmart™
2035 Retirement
Target Fund | | | Franklin
LifeSmart™
2040 Retirement
Target Fund | |
| |
| | | |
Sales charges retained net of commissions paid to unaffiliated brokers/dealers | | | $17,269 | | | | $26,096 | | | | $13,415 | |
| | | |
CDSC retained | | | $ 1,526 | | | | $ 4,225 | | | | $ 816 | |
| | | |
| | | Franklin
LifeSmart™
2045 Retirement
Target Fund | | | Franklin
LifeSmart™
2050 Retirement
Target Fund | | | Franklin
LifeSmart™
2055 Retirement
Target Fund | |
| |
| | | |
Sales charges retained net of commissions paid to unaffiliated brokers/dealers | | | $21,311 | | | | $14,409 | | | | $11,870 | |
| | | |
CDSC retained | | | $ 2,083 | | | | $ 1,338 | | | | $ 1,157 | |
e. Transfer Agent Fees
Each class of shares pays transfer agent fees to Investor Services for its performance of shareholder servicing obligations. The fees are based on an annualized asset based fee of 0.02% plus a transaction based fee. In addition, each class reimburses Investor Services for out of pocket expenses incurred and, except for Class R6, reimburses shareholder servicing fees paid to third parties. These fees are allocated daily based upon their relative proportion of such classes’ aggregate net assets. Class R6 pays Investor Services transfer agent fees specific to that class.
For the year ended December 31, 2019, the Funds paid transfer agent fees as noted in the Statements of Operations of which the following amounts were retained by Investor Services:
| | | | | | | | | | | | |
| | | Franklin
LifeSmart™
Retirement
Income Fund | | | Franklin
LifeSmart™
2020 Retirement
Target Fund | | | Franklin
LifeSmart™
2025 Retirement
Target Fund | |
| |
| | | |
Transfer agent fees | | | $58,196 | | | | $39,836 | | | | $147,769 | |
| | | | |
| | | |
146 | | Annual Report | | franklintempleton.com |
FRANKLIN FUND ALLOCATOR SERIES
NOTES TO FINANCIAL STATEMENTS
| | | | | | | | | | | | |
| | | Franklin
LifeSmart™
2030 Retirement
Target Fund | | | Franklin
LifeSmart™
2035 Retirement
Target Fund | | | Franklin
LifeSmart™
2040 Retirement
Target Fund | |
| |
| | | |
Transfer agent fees | | | $80,254 | | | | $171,790 | | | | $79,655 | |
| | | |
| | | Franklin
LifeSmart™
2045 Retirement
Target Fund | | | Franklin
LifeSmart™
2050 Retirement
Target Fund | | | Franklin
LifeSmart™
2055 Retirement
Target Fund | |
| |
| | | |
Transfer agent fees | | | $160,698 | | | | $104,933 | | | | $103,407 | |
f. Investments in FT Underlying Funds
The Funds invest in FT Underlying Funds which are managed by Advisers (or an affiliate of Advisers). The Funds do not invest in FT Underlying Funds for the purpose of exercising a controlling influence over the management or policies. Management and asset allocation fees paid by the Funds are waived on assets invested in Institutional Fiduciary Trust Money Market Portfolio (Sweep Money Fund), as noted in the Statements of Operations, in an amount not to exceed the management and administrative fees paid directly or indirectly by the Sweep Money Fund.
Investments in FT Underlying Funds for the year ended December 31, 2019, were as follows:
| | | | | | | | | | | | | | | | | | | | | | | | | | | | | | | | |
| | | Value at Beginning
of Year | | | Purchases | | | Sales | | | Realized Gain (Loss) | | | Net Change in
Unrealized
Appreciation
(Depreciation) | | | Value at End of Year | | | Number of
Shares
Held at End
of Year | | | Dividend
Income | |
| |
| Franklin LifeSmart™ Retirement Income | | | | | | | | | | | | | | | | | | | | | | | | | | | | | |
| | | | | | | |
| FundNon-Controlled Affiliates | | | | | | | | | | | | | | | | | | | | | | | | | | | | | |
Franklin Floating Rate Daily Access | | | | | | | | | | | | | | | | | | | | | | | | | | | | | | | | |
Fund, Class R6 | | $ | 11,365,789 | | | $ | 217,248 | | | $ | (11,624,674 | ) | | $ | (76,896 | ) | | $ | 118,533 | | | $ | — | a | | | — | | | $ | 228,267 | |
Franklin Income Fund, Class R6 | | | 10,261,062 | | | | 1,305,896 | | | | (2,219,234 | ) | | | 31,739 | | | | 961,693 | | | | 10,341,156 | | | | 4,438,264 | | | | 562,269 | |
Franklin Liberty U.S. Core Bond ETF | | | — | | | | 10,418,869 | | | | (203,488 | ) | | | (1,827 | ) | | | (60,148 | ) | | | 10,153,406 | | | | 404,681 | | | | 72,636 | b |
Franklin LibertyQ U.S. Equity ETF | | | 4,515,870 | | | | 5,443,444 | | | | (6,005,517 | ) | | | 89,631 | | | | 1,147,268 | | | | 5,190,696 | | | | 148,348 | | | | 95,534 | |
Franklin U.S. Government Securities Fund, Class R6 | | | 11,883,687 | | | | 7,334,385 | | | | (9,350,453 | ) | | | (177,538 | ) | | | 527,534 | | | | 10,217,615 | | | | 1,686,075 | | | | 406,798 | |
Institutional Fiduciary Trust Money Market Portfolio, 1.26% | | | 732,821 | | | | 28,947,788 | | | | (28,810,415 | ) | | | — | | | | — | | | | 870,194 | | | | 870,194 | | | | 22,562 | |
Templeton Global Total Return Fund, Class R6 | | | 2,117,321 | | | | 263,070 | | | | (482,905 | ) | | | 29,192 | | | | (104,840 | ) | | | 1,821,838 | | | | 164,278 | | | | 124,632 | |
| | | | | | | | | | | | |
| | | | | | | | |
Total Affiliated Securities | | $ | 40,876,550 | | | $ | 53,930,700 | | | $ | (58,696,686 | ) | | $ | (105,699 | ) | | $ | 2,590,040 | | | $ | 38,594,905 | | | | | | | $ | 1,512,698 | |
| | | | | | | | | | | | |
| | | | | | |
Franklin LifeSmart™ 2020 Retirement Target Fund | | | | | | | | | | | | | | | | | | | | | | | | | |
| | | | | | | | |
Non-Controlled Affiliates | | | | | | | | | | | | | | | | | | | | | | | | | | | | | | | | |
Franklin Emerging Market Core Equity (IU) Fund | | $ | — | | | $ | 1,182,590 | | | $ | — | | | $ | — | | | $ | 53,007 | | | $ | 1,235,597 | | | | 113,046 | | | $ | 5,008 | b |
Franklin Emerging Market Debt Opportunities Fund | | | 1,232,957 | | | | 95,412 | | | | (1,335,609 | ) | | | (114,808 | ) | | | 122,048 | | | | — | a | | | — | | | | — | |
Franklin Floating Rate Daily Access Fund, Class R6 | | | 1,396,370 | | | | 167,099 | | | | (1,584,276 | ) | | | (44,454 | ) | | | 65,261 | | | | — | a | | | — | | | | 5,317 | |
Franklin FTSE Europe ETF | | | 404,167 | | | | 646,196 | | | | (642,158 | ) | | | (33,785 | ) | | | 107,274 | | | | 481,694 | | | | 19,077 | | | | 19,471 | |
| | | | |
franklintempleton.com | | Annual Report | | 147 |
FRANKLIN FUND ALLOCATOR SERIES
NOTES TO FINANCIAL STATEMENTS
3. Transactions with Affiliates(continued)
f. Investments in FT Underlying Funds (continued)
| | | | | | | | | | | | | | | | | | | | | | | | | | | | | | |
| | | Value at Beginning
of Year | | | Purchases | | | Sales | | | Realized Gain (Loss) | | | Net Change in
Unrealized
Appreciation
(Depreciation) | | | Value at End of Year | | | Number of
Shares
Held at End
of Year | | | Dividend
Income |
| | | | | |
Franklin LifeSmart™ 2020 Retirement Target Fund(continued) | | | | | | | | | | | | | | | | | | | |
| | | | | | | |
Non-Controlled Affiliates(continued) | | | | | | | | | | | | | | | | | | | | | | | | | | | |
Franklin FTSE Japan ETF | | $ | 743,220 | | | $ | 134,954 | | | $ | (712,114 | ) | | $ | (82,017 | ) | | $ | 149,163 | | | $ | 233,206 | | | | 8,918 | | | $ 8,943 |
Franklin Growth Fund, Class R6 | | | 4,450,955 | | | | 1,531,952 | | | | (2,774,105 | ) | | | 118,883 | | | | 808,835 | | | | 4,136,520 | | | | 36,835 | | | 245,056b |
Franklin Growth Opportunities Fund, Class R6 | | | 1,610,029 | | | | 333,657 | | | | (2,299,984 | ) | | | 402,290 | | | | (45,992 | ) | | | — | a | | | — | | | — |
Franklin International Core Equity (IU) Fund | | | — | | | | 2,037,931 | | | | — | | | | — | | | | 161,372 | | | | 2,199,303 | | | | 198,136 | | | 23,016 |
Franklin International Growth Fund, Class R6 | | | — | | | | 1,024,161 | | | | (181,195 | ) | | | 3,857 | | | | 101,606 | | | | 948,429 | | | | 56,963 | | | 4,306 |
Franklin International Small Cap Fund, Class R6 | | | 913,595 | | | | 213,393 | | | | (1,179,801 | ) | | | (46,528 | ) | | | 99,341 | | | | — | a | | | — | | | — |
Franklin Liberty High Yield Corporate ETF | | | — | | | | 677,667 | | | | (126,236 | ) | | | (1,519 | ) | | | 6,002 | | | | 555,914 | | | | 21,230 | | | 9,338b |
Franklin Liberty U.S. Core Bond ETF | | | — | | | | 12,699,051 | | | | (3,530,204 | ) | | | 5,492 | | | | (46,583 | ) | | | 9,127,756 | | | | 363,802 | | | 64,698b |
Franklin LibertyQ Emerging Markets ETF | | | 980,335 | | | | 804,897 | | | | (1,037,876 | ) | | | 32,832 | | | | 34,077 | | | | 814,265 | | | | 27,339 | | | 56,330 |
Franklin LibertyQ U.S. Equity ETF | | | 2,269,894 | | | | 2,099,059 | | | | (1,237,201 | ) | | | (12,282 | ) | | | 724,322 | | | | 3,843,792 | | | | 109,854 | | | 73,763 |
Franklin Low Duration Total Return Fund, Class R6 | | | 5,987,285 | | | | 3,327,517 | | | | (5,719,718 | ) | | | (43,425 | ) | | | 128,252 | | | | 3,679,911 | | | | 379,764 | | | 220,067 |
Franklin Mutual International Fund, Class R6 | | | 687,321 | | | | 155,644 | | | | (884,327 | ) | | | (13,315 | ) | | | 54,677 | | | | — | a | | | — | | | — |
Franklin Pelagos Commodities Strategy Fund, Class R6 | | | 1,914,586 | | | | 162,863 | | | | (2,093,729 | ) | | | (281,474 | ) | | | 297,754 | | | | — | a | | | — | | | 13,518 |
Franklin Rising Dividends Fund, Class R6 | | | 2,268,151 | | | | 763,987 | | | | (1,446,427 | ) | | | (15,891 | ) | | | 497,077 | | | | 2,066,897 | | | | 29,718 | | | 70,080b |
Franklin Strategic Income Fund, Class R6 | | | 3,937,748 | | | | 1,369,799 | | | | (5,442,099 | ) | | | 41,012 | | | | 93,540 | | | | — | a | | | — | | | 71,255 |
Franklin U.S. Core Equity (IU) Fund | | | — | | | | 3,314,999 | | | | (2,940 | ) | | | 53 | | | | 241,038 | | | | 3,553,150 | | | | 329,300 | | | 21,251 |
Franklin U.S. Government Securities Fund, Class R6 | | | 5,451,640 | | | | 4,885,711 | | | | (10,528,753 | ) | | | 162,211 | | | | 29,191 | | | | — | a | | | — | | | 149,622 |
Franklin Utilities Fund, Class R6 | | | 667,793 | | | | 15,106 | | | | (757,705 | ) | | | 144,122 | | | | (69,316 | ) | | | — | a | | | — | | | 3,799 |
Institutional Fiduciary Trust Money Market Portfolio, 1.26% | | | 808,529 | | | | 15,896,393 | | | | (16,432,364 | ) | | | — | | | | — | | | | 272,558 | | | | 272,558 | | | 20,891 |
Templeton Foreign Fund, Class R6 | | | 966,600 | | | | 444,484 | | | | (535,910 | ) | | | (20,858 | ) | | | 90,473 | | | | 944,789 | | | | 132,509 | | | 35,799 |
Templeton Global Total Return Fund, Class R6 | | | 2,750,868 | | | | 761,721 | | | | (1,753,262 | ) | | | (19,771 | ) | | | (115,310 | ) | | | 1,624,246 | | | | 146,460 | | | 173,732 |
| | | | | | | | | | |
| | | | | | | | |
Total Affiliated Securities | | $ | 39,442,043 | | | $ | 54,746,243 | | | $ | (62,237,993 | ) | | $ | 180,625 | | | $ | 3,587,109 | | | $ | 35,718,027 | | | | | | | $1,295,260 |
| | | | | | | | | | |
| | | | | | |
Franklin LifeSmart™ 2025 Retirement Target Fund | | | | | | | | | | | | | | | | | | | | | | | |
| | | | | | | | |
Non-Controlled Affiliates | | | | | | | | | | | | | | | | | | | | | | | | | | | | | | |
Franklin Emerging Market Core Equity (IU) Fund | | $ | — | | | $ | 4,326,569 | | | $ | — | | | $ | — | | | $ | 193,656 | | | $ | 4,520,225 | | | | 413,561 | | | $18,323b |
Franklin Emerging Market Debt Opportunities Fund | | | 2,438,564 | | | | 114,260 | | | | (2,566,989 | ) | | | (227,566 | ) | | | 241,731 | | | | — | a | | | — | | | — |
| | | | |
| | | |
148 | | Annual Report | | franklintempleton.com |
FRANKLIN FUND ALLOCATOR SERIES
NOTES TO FINANCIAL STATEMENTS
| | | | | | | | | | | | | | | | | | | | | | | | | | | | | | |
| | | Value at Beginning
of Year | | | Purchases | | | Sales | | | Realized Gain (Loss) | | | Net Change in
Unrealized
Appreciation
(Depreciation) | | | Value at End of Year | | | Number of
Shares
Held at End
of Year | | | Dividend
Income |
| | | | |
Franklin LifeSmart™ 2025 Retirement Target Fund(continued) | | | | | | | | | | | | | | | |
| | | | | | |
Non-Controlled Affiliates(continued) | | | | | | | | | | | | | | | | | | | | | | | |
Franklin Floating Rate Daily Access Fund, Class R6 | | $ | 2,774,818 | | | $ | 229,480 | | | $ | (3,045,113 | ) | | $ | (87,240 | ) | | $ | 128,055 | | | $ | — | a | | | — | | | $ 10,337 |
Franklin FTSE Europe ETF | | | 1,807,838 | | | | 1,291,473 | | | | (1,727,003 | ) | | | (131,529 | ) | | | 454,430 | | | | 1,695,209 | | | | 67,137 | | | 68,445 |
Franklin FTSE Japan ETF | | | 3,105,900 | | | | 61,066 | | | | (2,631,860 | ) | | | (356,282 | ) | | | 641,580 | | | | 820,404 | | | | 31,373 | | | 31,384 |
Franklin Growth Fund, Class R6 | | | 18,586,392 | | | | 1,649,612 | | | | (8,641,745 | ) | | | 1,449,659 | | | | 2,446,335 | | | | 15,490,253 | | | | 137,936 | | | 887,048b |
Franklin Growth Opportunities Fund, Class R6 | | | 6,806,852 | | | | 39,372 | | | | (8,404,389 | ) | | | 2,811,542 | | | | (1,253,377 | ) | | | — | a | | | — | | | — |
Franklin International Core Equity (IU) Fund | | | — | | | | 7,172,044 | | | | — | | | | — | | | | 558,294 | | | | 7,730,338 | | | | 696,427 | | | 80,412 |
Franklin International Growth Fund, Class R6 | | | — | | | | 3,218,694 | | | | (132,230 | ) | | | 3,994 | | | | 382,556 | | | | 3,473,014 | | | | 208,590 | | | 15,139 |
Franklin International Small Cap Fund, Class R6 | | | 3,692,282 | | | | 321,379 | | | | (4,294,725 | ) | | | 280,044 | | | | 1,020 | | | | — | a | | | — | | | — |
Franklin Liberty High Yield Corporate ETF | | | — | | | | 1,294,815 | | | | — | | | | — | | | | 20,132 | | | | 1,314,947 | | | | 50,217 | | | 20,912b |
Franklin Liberty U.S. Core Bond ETF | | | — | | | | 22,564,318 | | | | — | | | | — | | | | (145,213 | ) | | | 22,419,105 | | | | 893,551 | | | 157,064b |
Franklin LibertyQ Emerging Markets ETF | | | 4,041,330 | | | | 2,609,523 | | | | (3,944,701 | ) | | | 187,859 | | | | 98,775 | | | | 2,992,786 | | | | 100,483 | | | 199,337 |
Franklin LibertyQ U.S. Equity ETF | | | 9,441,234 | | | | 4,798,457 | | | | (2,786,514 | ) | | | (16,120 | ) | | | 2,879,452 | | | | 14,316,509 | | | | 409,160 | | | 265,258 |
Franklin Low Duration Total Return Fund, Class R6 | | | 11,751,793 | | | | 4,211,783 | | | | (7,325,514 | ) | | | (62,581 | ) | | | 219,652 | | | | 8,795,133 | | | | 907,651 | | | 474,161 |
Franklin Mutual International Fund, Class R6 | | | 2,694,573 | | | | 82,079 | | | | (2,963,856 | ) | | | (127,769 | ) | | | 314,973 | | | | — | a | | | — | | | — |
Franklin Pelagos Commodities Strategy Fund, Class R6 | | | 5,635,340 | | | | 363,905 | | | | (6,047,255 | ) | | | (817,826 | ) | | | 865,836 | | | | — | a | | | — | | | 38,837 |
Franklin Rising Dividends Fund, Class R6 | | | 9,243,724 | | | | 584,481 | | | | (4,055,672 | ) | | | 94,900 | | | | 1,859,900 | | | | 7,727,333 | | | | 111,105 | | | 256,378b |
Franklin Strategic Income Fund, Class R6 | | | 7,777,294 | | | | 846,857 | | | | (8,892,056 | ) | | | 92,554 | | | | 175,351 | | | | — | a | | | — | | | 147,520 |
Franklin U.S. Core Equity (IU) Fund | | | — | | | | 12,181,526 | | | | (187,314 | ) | | | 3,406 | | | | 864,528 | | | | 12,862,146 | | | | 1,192,043 | | | 75,429 |
Franklin U.S. Government Securities Fund, Class R6 | | | 10,729,195 | | | | 4,383,500 | | | | (15,542,777 | ) | | | 398,561 | | | | 31,521 | | | | — | a | | | — | | | 312,001 |
Franklin Utilities Fund, Class R6 | | | 2,660,327 | | | | 22,827 | | | | (2,999,972 | ) | | | 1,109,558 | | | | (792,740 | ) | | | — | a | | | — | | | 16,578 |
Institutional Fiduciary Trust Money Market Portfolio, 1.26% | | | 3,164 | | | | 31,405,811 | | | | (31,406,994 | ) | | | — | | | | — | | | | 1,981 | | | | 1,981 | | | 60,201 |
Templeton Foreign Fund, Class R6 | | | 3,901,532 | | | | 787,329 | | | | (1,572,430 | ) | | | (11,982 | ) | | | 320,053 | | | | 3,424,502 | | | | 480,295 | | | 125,851 |
Templeton Global Total Return Fund, Class R6 | | | 5,374,162 | | | | 2,019,220 | | | | (3,127,886 | ) | | | (35,595 | ) | | | (271,698 | ) | | | 3,958,203 | | | | 356,916 | | | 370,718 |
| | | | | | | | | | |
| | | | | | | | |
Total Affiliated Securities | | $ | 112,466,314 | | | $ | 106,580,380 | | | $ | (122,296,995 | ) | | $ | 4,557,587 | | | $ | 10,234,802 | | | $ | 111,542,088 | | | | | | | $3,631,333 |
| | | | | | | | | | |
| | | | | | |
Franklin LifeSmart™ 2030 Retirement Target Fund | | | | | | | | | | | | | | | | | | | | | | | |
| | | | | | | |
Non-Controlled Affiliates | | | | | | | | | | | | | | | | | | | | | | | | | | | |
Franklin Emerging Market Core Equity (IU) Fund | | $ | — | | | $ | 2,296,359 | | | $ | — | | | $ | — | | | $ | 102,729 | | | $ | 2,399,088 | | | | 219,496 | | | $ 9,725b |
Franklin Emerging Market Debt Opportunities Fund | | | 744,004 | | | | 64,783 | | | | (813,062 | ) | | | (65,709 | ) | | | 69,984 | | | | — | a | | | — | | | — |
| | | | |
franklintempleton.com | | Annual Report | | 149 |
FRANKLIN FUND ALLOCATOR SERIES
NOTES TO FINANCIAL STATEMENTS
3. Transactions with Affiliates(continued)
f. Investments in FT Underlying Funds (continued)
| | | | | | | | | | | | | | | | | | | | | | | | | | | | | | | | |
| | | Value at Beginning
of Year | | | Purchases | | | Sales | | | Realized Gain (Loss) | | | Net Change in
Unrealized
Appreciation
(Depreciation) | | | Value at End of Year | | | Number of
Shares
Held at End
of Year | | | Dividend
Income | |
| |
| | | | | |
Franklin LifeSmart™ 2030 Retirement Target Fund(continued) | | | | | | | | | | | | | | | | | | | | | |
| | | | | | |
Non-Controlled Affiliates(continued) | | | | | | | | | | | | | | | | | | | | | | | | | |
Franklin Floating Rate Daily Access Fund, Class R6 | | $ | 846,508 | | | $ | 165,958 | | | $ | (1,024,933 | ) | | $ | (25,326 | ) | | $ | 37,793 | | | $ | — | a | | | — | | | $ | 3,298 | |
Franklin FTSE Europe ETF | | | 891,527 | | | | 864,549 | | | | (1,009,418 | ) | | | (67,123 | ) | | | 229,591 | | | | 909,126 | | | | 36,005 | | | | 36,195 | |
Franklin FTSE Japan ETF | | | 1,514,588 | | | | 160,700 | | | | (1,359,518 | ) | | | (176,408 | ) | | | 319,963 | | | | 459,325 | | | | 17,565 | | | | 16,541 | |
Franklin Growth Fund, Class R6 | | | 8,925,259 | | | | 1,475,199 | | | | (3,814,878 | ) | | | 114,792 | | | | 1,811,031 | | | | 8,511,403 | | | | 75,791 | | | | 485,683 | b |
Franklin Growth Opportunities Fund, Class R6 | | | 3,328,470 | | | | 178,033 | | | | (4,278,023 | ) | | | 767,232 | | | | 4,288 | | | | — | a | | | — | | | | — | |
Franklin International Core Equity (IU) Fund | | | — | | | | 3,846,188 | | | | — | | | | — | | | | 300,373 | | | | 4,146,561 | | | | 373,564 | | | | 43,207 | |
Franklin International Growth Fund, Class R6 | | | — | | | | 1,743,027 | | | | (88,676 | ) | | | 2,064 | | | | 206,456 | | | | 1,862,871 | | | | 111,884 | | | | 8,121 | |
Franklin International Small Cap Fund, Class R6 | | | 1,798,267 | | | | 293,219 | | | | (2,218,654 | ) | | | (90,433 | ) | | | 217,601 | | | | — | a | | | — | | | | — | |
Franklin Liberty High Yield Corporate ETF | | | — | | | | 449,821 | | | | — | | | | — | | | | 4,573 | | | | 454,394 | | | | 17,353 | | | | 7,288 | b |
Franklin Liberty U.S. Core Bond ETF | | | — | | | | 8,862,100 | | | | (1,223,771 | ) | | | 2,278 | | | | (41,328 | ) | | | 7,599,279 | | | | 302,882 | | | | 52,294 | b |
Franklin LibertyQ Emerging Markets ETF | | | 1,970,405 | | | | 1,551,779 | | | | (2,036,740 | ) | | | 78,926 | | | | 63,236 | | | | 1,627,606 | | | | 54,647 | | | | 106,025 | |
Franklin LibertyQ U.S. Equity ETF | | | 4,573,817 | | | | 2,929,145 | | | | (1,033,128 | ) | | | (23,285 | ) | | | 1,492,087 | | | | 7,938,636 | | | | 226,883 | | | | 142,242 | |
Franklin Low Duration Total Return Fund, Class R6 | | | 3,585,066 | | | | 2,384,353 | | | | (2,969,174 | ) | | | (19,899 | ) | | | 66,185 | | | | 3,046,531 | | | | 314,399 | | | | 150,071 | |
Franklin Mutual International Fund, Class R6 | | | 1,337,308 | | | | 172,784 | | | | (1,605,239 | ) | | | (54,874 | ) | | | 150,021 | | | | — | a | | | — | | | | — | |
Franklin Pelagos Commodities Strategy Fund, Class R6 | | | 2,331,348 | | | | 239,307 | | | | (2,588,053 | ) | | | (370,944 | ) | | | 388,342 | | | | — | a | | | — | | | | 17,264 | |
Franklin Rising Dividends Fund, Class R6 | | | 4,506,529 | | | | 629,289 | | | | (1,867,291 | ) | | | (25,441 | ) | | | 1,012,447 | | | | 4,255,533 | | | | 61,187 | | | | 138,206 | b |
Franklin Strategic Income Fund, Class R6 | | | 2,391,535 | | | | 720,056 | | | | (3,192,970 | ) | | | 26,234 | | | | 55,145 | | | | — | a | | | — | | | | 46,007 | |
Franklin U.S. Core Equity (IU) Fund | | | — | | | | 6,599,967 | | | | (29,243 | ) | | | 532 | | | | 471,201 | | | | 7,042,457 | | | | 652,684 | | | | 40,977 | |
Franklin U.S. Government Securities Fund, Class R6 | | | 3,273,247 | | | | 2,980,486 | | | | (6,383,515 | ) | | | 119,166 | | | | 10,616 | | | | — | a | | | — | | | | 96,993 | |
Franklin Utilities Fund, Class R6 | | | 1,273,680 | | | | 13,562 | | | | (1,441,152 | ) | | | 265,312 | | | | (111,402 | ) | | | — | a | | | — | | | | 8,085 | |
Institutional Fiduciary Trust Money Market Portfolio, 1.26% | | | 419,148 | | | | 22,377,049 | | | | (22,109,033 | ) | | | — | | | | — | | | | 687,164 | | | | 687,164 | | | | 27,521 | |
Templeton Foreign Fund, Class R6 | | | 1,903,897 | | | | 522,453 | | | | (744,271 | ) | | | (39,597 | ) | | | 194,468 | | | | 1,836,950 | | | | 257,637 | | | | 67,508 | |
Templeton Global Total Return Fund, Class R6 | | | 1,640,004 | | | | 994,582 | | | | (1,261,854 | ) | | | (37,494 | ) | | | (55,539 | ) | | | 1,279,699 | | | | 115,392 | | | | 115,397 | |
| | | | | | | | | | | | |
| | | | | | | | |
Total Affiliated Securities | | $ | 47,254,607 | | | $ | 62,514,748 | | | $ | (63,092,596 | ) | | $ | 380,003 | | | $ | 6,999,861 | | | $ | 54,056,623 | | | | | | | $ | 1,618,648 | |
| | | | | | | | | | | | |
| | | | |
| | | |
150 | | Annual Report | | franklintempleton.com |
FRANKLIN FUND ALLOCATOR SERIES
NOTES TO FINANCIAL STATEMENTS
| | | | | | | | | | | | | | | | | | | | | | | | | | | | | | | | |
| | | Value at Beginning
of Year | | | Purchases | | | Sales | | | Realized Gain (Loss) | | | Net Change in
Unrealized
Appreciation
(Depreciation) | | | Value at End of Year | | | Number of
Shares
Held at End
of Year | | | Dividend
Income | |
| | | | | | |
Franklin LifeSmart™ 2035 Retirement Target Fund | | | | | | | | | | | | | | | | | | | | | | | | | |
| | | | | | | |
Non-Controlled Affiliates | | | | | | | | | | | | | | | | | | | | | | | | | | | | | |
Franklin Emerging Market Core Equity (IU) Fund | | $ | — | | | $ | 5,591,636 | | | $ | — | | | $ | — | | | $ | 249,717 | | | $ | 5,841,353 | | | | 534,433 | | | $ | 23,679 | b |
Franklin Emerging Market Debt Opportunities Fund | | | 1,265,678 | | | | — | | | | (1,272,789 | ) | | | (114,959 | ) | | | 122,070 | | | | — | a | | | — | | | | — | |
Franklin Floating Rate Daily Access Fund, Class R6 | | | 1,440,239 | | | | 89,727 | | | | (1,550,474 | ) | | | (43,878 | ) | | | 64,386 | | | | — | a | | | — | | | | 5,271 | |
Franklin FTSE Europe ETF | | | 2,047,024 | | | | 1,800,397 | | | | (2,063,597 | ) | | | (149,832 | ) | | | 540,917 | | | | 2,174,909 | | | | 86,135 | | | | 87,823 | |
Franklin FTSE Japan ETF | | | 3,544,470 | | | | 89,690 | | | | (2,924,030 | ) | | | (414,821 | ) | | | 757,412 | | | | 1,052,721 | | | | 40,257 | | | | 40,284 | |
Franklin Growth Fund, Class R6 | | | 20,895,577 | | | | 2,224,147 | | | | (7,255,352 | ) | | | 547,700 | | | | 4,094,169 | | | | 20,506,241 | | | | 182,602 | | | | 1,187,211 | b |
Franklin Growth Opportunities Fund, Class R6 | | | 7,654,993 | | | | 368,944 | | | | (9,860,971 | ) | | | 2,941,726 | | | | (1,104,692 | ) | | | — | a | | | — | | | | — | |
Franklin International Core Equity (IU) Fund | | | — | | | | 9,203,043 | | | | — | | | | — | | | | 716,162 | | | | 9,919,205 | | | | 893,622 | | | | 103,264 | |
Franklin International Growth Fund, Class R6 | | | — | | | | 3,950,649 | | | | — | | | | — | | | | 506,401 | | | | 4,457,050 | | | | 267,691 | | | | 19,429 | |
Franklin International Small Cap Fund, Class R6 | | | 4,235,165 | | | | 469,602 | | | | (5,010,285 | ) | | | 120,461 | | | | 185,057 | | | | — | a | | | — | | | | — | |
Franklin Liberty High Yield Corporate ETF | | | — | | | | 683,968 | | | | — | | | | — | | | | 10,335 | | | | 694,303 | | | | 26,515 | | | | 10,921 | b |
Franklin Liberty U.S. Core Bond ETF | | | — | | | | 11,664,911 | | | | — | | | | — | | | | (75,083 | ) | | | 11,589,828 | | | | 461,932 | | | | 81,245 | b |
Franklin LibertyQ Emerging Markets ETF | | | 4,595,317 | | | | 3,426,129 | | | | (4,471,234 | ) | | | 189,761 | | | | 152,468 | | | | 3,892,441 | | | | 130,689 | | | | 257,156 | |
Franklin LibertyQ U.S. Equity ETF | | | 10,651,846 | | | | 6,575,013 | | | | (1,638,097 | ) | | | (6,387 | ) | | | 3,547,323 | | | | 19,129,698 | | | | 546,719 | | | | 343,783 | |
Franklin Low Duration Total Return Fund, Class R6 | | | 6,099,851 | | | | 2,696,078 | | | | (4,185,868 | ) | | | (20,427 | ) | | | 99,951 | | | | 4,689,585 | | | | 483,961 | | | | 241,532 | |
Franklin Mutual International Fund, Class R6 | | | 3,242,553 | | | | 38,766 | | | | (3,510,169 | ) | | | (285,251 | ) | | | 514,101 | | | | — | a | | | — | | | | — | |
Franklin Pelagos Commodities Strategy Fund, Class R6 | | | 5,097,035 | | | | 490,861 | | | | (5,622,502 | ) | | | (768,129 | ) | | | 802,735 | | | | — | a | | | — | | | | 37,485 | |
Franklin Rising Dividends Fund, Class R6 | | | 10,549,442 | | | | 1,076,182 | | | | (3,805,605 | ) | | | (16,619 | ) | | | 2,396,384 | | | | 10,199,784 | | | | 146,654 | | | | 337,285 | b |
Franklin Strategic Income Fund, Class R6 | | | 4,088,574 | | | | 422,196 | | | | (4,647,806 | ) | | | 51,994 | | | | 85,042 | | | | — | a | | | — | | | | 75,490 | |
Franklin U.S. Core Equity (IU) Fund | | | — | | | | 16,248,404 | | | | (187,874 | ) | | | 3,416 | | | | 1,150,726 | | | | 17,214,672 | | | | 1,595,429 | | | | 99,545 | |
Franklin U.S. Government Securities Fund, Class R6 | | | 5,567,467 | | | | 2,956,801 | | | | (8,732,896 | ) | | | 194,822 | | | | 13,806 | | | | — | a | | | — | | | | 158,433 | |
Franklin Utilities Fund, Class R6 | | | 2,948,542 | | | | 29,297 | | | | (3,349,906 | ) | | | 1,159,020 | | | | (786,953 | ) | | | — | a | | | — | | | | 19,771 | |
Institutional Fiduciary Trust Money Market Portfolio, 1.26% | | | 2,968 | | | | 32,720,567 | | | | (32,721,669 | ) | | | — | | | | — | | | | 1,866 | | | | 1,866 | | | | 59,614 | |
Templeton Foreign Fund, Class R6 | | | 4,487,990 | | | | 846,874 | | | | (1,309,592 | ) | | | (56,437 | ) | | | 425,492 | | | | 4,394,327 | | | | 616,315 | | | | 161,493 | |
Templeton Global Total Return Fund, Class R6 | | | 2,790,638 | | | | 715,039 | | | | (1,448,431 | ) | | | 123 | | | | (132,949 | ) | | | 1,924,420 | | | | 173,528 | | | | 178,671 | |
| | | | | | | | | | | | |
| | | | | | | | |
Total Affiliated Securities | | $ | 101,205,369 | | | $ | 104,378,921 | | | $ | (105,569,147 | ) | | $ | 3,332,283 | | | $ | 14,334,977 | | | $ | 117,682,403 | | | | | | | $ | 3,529,385 | |
| | | | | | | | | | | | |
| | | | |
franklintempleton.com | | Annual Report | | 151 |
FRANKLIN FUND ALLOCATOR SERIES
NOTES TO FINANCIAL STATEMENTS
3. Transactions with Affiliates(continued)
f. Investments in FT Underlying Funds (continued)
| | | | | | | | | | | | | | | | | | | | | | | | | | | | | | | | |
| | | Value at Beginning
of Year | | | Purchases | | | Sales | | | Realized Gain (Loss) | | | Net Change in
Unrealized
Appreciation
(Depreciation) | | | Value at End of Year | | | Number of
Shares
Held at End
of Year | | | Dividend
Income | |
| |
| | | | | | |
Franklin LifeSmart™ 2040 Retirement Target Fund | | | | | | | | | | | | | | | | | | | | | | | | | |
| | | | | | |
Non-Controlled Affiliates | | | | | | | | | | | | | | | | | | | | | | | | | |
Franklin Emerging Market Core Equity (IU) Fund | | $ | — | | | $ | 2,288,957 | | | $ | — | | | $ | — | | | $ | 102,151 | | | $ | 2,391,108 | | | | 218,766 | | | $ | 9,693 | b |
Franklin Emerging Market Debt Opportunities Fund | | | 394,014 | | | | 3,371 | | | | (399,615 | ) | | | (35,000 | ) | | | 37,230 | | | | — | a | | | — | | | | — | |
Franklin Floating Rate Daily Access Fund, Class R6 | | | 461,225 | | | | 33,320 | | | | (501,143 | ) | | | (13,710 | ) | | | 20,308 | | | | — | a | | | — | | | | 1,693 | |
Franklin FTSE Europe ETF | | | 776,847 | | | | 798,939 | | | | (834,462 | ) | | | (57,689 | ) | | | 209,760 | | | | 893,395 | | | | 35,382 | | | | 36,732 | |
Franklin FTSE Japan ETF | | | 1,373,085 | | | | 121,960 | | | | (1,197,290 | ) | | | (156,450 | ) | | | 290,693 | | | | 431,998 | | | | 16,520 | | | | 16,904 | |
Franklin Growth Fund, Class R6 | | | 8,094,450 | | | | 1,777,887 | | | | (3,053,505 | ) | | | 29,266 | | | | 1,815,178 | | | | 8,663,276 | | | | 77,144 | | | | 496,001 | b |
Franklin Growth Opportunities Fund, Class R6 | | | 2,961,783 | | | | 184,844 | | | | (3,862,457 | ) | | | 839,686 | | | | (123,856 | ) | | | — | a | | | — | | | | — | |
Franklin International Core Equity (IU) Fund | | | — | | | | 3,775,928 | | | | — | | | | — | | | | 299,240 | | | | 4,075,168 | | | | 367,132 | | | | 42,680 | |
Franklin International Growth Fund, Class R6 | | | — | | | | 1,764,162 | | | | (156,805 | ) | | | 1,132 | | | | 202,729 | | | | 1,811,218 | | | | 108,782 | | | | 7,830 | |
Franklin International Small Cap Fund, Class R6 | | | 1,638,447 | | | | 325,246 | | | | (2,073,152 | ) | | | (88,018 | ) | | | 197,477 | | | | — | a | | | — | | | | — | |
Franklin Liberty High Yield Corporate ETF | | | — | | | | 201,670 | | | | (30,244 | ) | | | (396 | ) | | | 1,898 | | | | 172,928 | | | | 6,604 | | | | 2,955 | b |
Franklin Liberty U.S. Core Bond ETF | | | — | | | | 3,982,001 | | | | (924,945 | ) | | | 1,722 | | | | (16,351 | ) | | | 3,042,427 | | | | 121,261 | | | | 21,103 | b |
Franklin LibertyQ Emerging Markets ETF | | | 1,783,053 | | | | 1,435,002 | | | | (1,753,445 | ) | | | 63,641 | | | | 68,469 | | | | 1,596,720 | | | | 53,610 | | | | 107,591 | |
Franklin LibertyQ U.S. Equity ETF | | | 4,093,008 | | | | 3,514,765 | | | | (936,603 | ) | | | (8,100 | ) | | | 1,428,543 | | | | 8,091,613 | | | | 231,255 | | | | 143,884 | |
Franklin Low Duration Total Return Fund, Class R6 | | | 1,924,994 | | | | 1,386,633 | | | | (2,121,978 | ) | | | (6,096 | ) | | | 31,711 | | | | 1,215,264 | | | | 125,414 | | | | 64,793 | |
Franklin Mutual International Fund, Class R6 | | | 1,285,443 | | | | 169,889 | | | | (1,538,294 | ) | | | (59,117 | ) | | | 142,079 | | | | — | a | | | — | | | | — | |
Franklin Pelagos Commodities Strategy Fund, Class R6 | | | 1,882,858 | | | | 236,993 | | | | (2,131,277 | ) | | | (304,931 | ) | | | 316,357 | | | | — | a | | | — | | | | 14,600 | |
Franklin Rising Dividends Fund, Class R6 | | | 4,059,416 | | | | 875,463 | | | | (1,539,489 | ) | | | (12,105 | ) | | | 955,358 | | | | 4,338,643 | | | | 62,382 | | | | 140,011 | b |
Franklin Strategic Income Fund, Class R6 | | | 1,297,236 | | | | 412,417 | | | | (1,751,313 | ) | | | 12,992 | | | | 28,668 | | | | — | a | | | — | | | | 21,003 | |
Franklin U.S. Core Equity (IU) Fund | | | — | | | | 6,792,557 | | | | (80,948 | ) | | | 1,472 | | | | 479,013 | | | | 7,192,094 | | | | 666,552 | | | | 41,971 | |
Franklin U.S. Government Securities Fund, Class R6 | | | 1,760,021 | | | | 1,856,970 | | | | (3,667,415 | ) | | | 44,535 | | | | 5,889 | | | | — | a | | | — | | | | 44,445 | |
Franklin Utilities Fund, Class R6 | | | 1,130,327 | | | | 14,643 | | | | (1,288,841 | ) | | | 224,218 | | | | (80,347 | ) | | | — | a | | | — | | | | 7,725 | |
Institutional Fiduciary Trust Money Market Portfolio, 1.26% | | | 1,362 | | | | 19,079,944 | | | | (18,280,778 | ) | | | — | | | | — | | | | 800,528 | | | | 800,528 | | | | 22,286 | |
Templeton Foreign Fund, Class R6 | | | 1,733,501 | | | | 577,279 | | | | (625,789 | ) | | | (42,416 | ) | | | 184,306 | | | | 1,826,881 | | | | 256,224 | | | | 67,138 | |
| | | | |
| | | |
152 | | Annual Report | | franklintempleton.com |
FRANKLIN FUND ALLOCATOR SERIES
NOTES TO FINANCIAL STATEMENTS
| | | | | | | | | | | | | | | | | | | | | | | | | | | | | | | | |
| | | Value at Beginning
of Year | | | Purchases | | | Sales | | | Realized Gain (Loss) | | | Net Change in
Unrealized
Appreciation
(Depreciation) | | | Value at End of Year | | | Number of
Shares
Held at End
of Year | | | Dividend
Income | |
| |
| | | | |
Franklin LifeSmart™ 2040 Retirement Target Fund(continued) | | | | | | | | | | | | | | | | | |
| | | | | | | |
Non-Controlled Affiliates(continued) | | | | | | | | | | | | | | | | | | | | | | | | | | | | | |
Templeton Global Total Return Fund, Class R6 | | $ | 880,861 | | | $ | 189,907 | | | $ | (1,054,784 | ) | | $ | 35,346 | | | $ | (51,330 | ) | | $ | — | a | | | — | | | $ | 32,587 | |
| | | | | | | | | | | | |
| | | | | | | | |
Total Affiliated Securities | | $ | 37,531,931 | | | $ | 51,800,747 | | | $ | (49,804,572 | ) | | $ | 469,982 | | | $ | 6,545,173 | | | $ | 46,543,261 | | | | | | | $ | 1,343,625 | |
| | | | | | | | | | | | |
| | | | | | |
Franklin LifeSmart™ 2045 Retirement Target Fund | | | | | | | | | | | | | | | | | | | | | | | | | |
| | | | | | |
Non-Controlled Affiliates | | | | | | | | | | | | | | | | | | | | | | | | | |
Franklin Emerging Market Core Equity (IU) Fund | | $ | — | | | $ | 4,634,990 | | | $ | — | | | $ | — | | | $ | 207,016 | | | $ | 4,842,006 | | | | 443,002 | | | $ | 19,628 | b |
Franklin Emerging Market Debt Opportunities Fund | | | 671,323 | | | | 7,307 | | | | (682,422 | ) | | | (59,705 | ) | | | 63,497 | | | | — | a | | | — | | | | — | |
Franklin Floating Rate Daily Access Fund, Class R6 | | | 763,772 | | | | 65,366 | | | | (840,009 | ) | | | (23,002 | ) | | | 33,873 | | | | — | a | | | — | | | | 2,793 | |
Franklin FTSE Europe ETF | | | 1,534,776 | | | | 1,561,049 | | | | (1,639,613 | ) | | | (119,721 | ) | | | 417,980 | | | | 1,754,471 | | | | 69,484 | | | | 72,651 | |
Franklin FTSE Japan ETF | | | 2,647,080 | | | | 272,286 | | | | (2,329,614 | ) | | | (319,161 | ) | | | 578,578 | | | | 849,169 | | | | 32,473 | | | | 33,477 | |
Franklin Growth Fund, Class R6 | | | 15,541,149 | | | | 3,437,765 | | | | (5,251,688 | ) | | | 109,709 | | | | 3,454,489 | | | | 17,291,424 | | | | 153,975 | | | | 990,192 | b |
Franklin Growth Opportunities Fund, Class R6 | | | 5,713,486 | | | | 632,745 | | | | (7,737,152 | ) | | | 2,103,658 | | | | (712,737 | ) | | | — | a | | | — | | | | — | |
Franklin International Core Equity (IU) Fund | | | — | | | | 7,561,869 | | | | (137,728 | ) | | | (3,708 | ) | | | 580,552 | | | | 8,000,985 | | | | 720,809 | | | | 83,796 | |
Franklin International Growth Fund, Class R6 | | | — | | | | 3,346,025 | | | | (159,964 | ) | | | 927 | | | | 408,864 | | | | 3,595,852 | | | | 215,967 | | | | 15,675 | |
Franklin International Small Cap Fund, Class R6 | | | 3,180,029 | | | | 674,452 | | | | (4,058,584 | ) | | | 33,680 | | | | 170,423 | | | | — | a | | | — | | | | — | |
Franklin Liberty U.S. Core Bond ETF | | | — | | | | 3,122,913 | | | | (163,580 | ) | | | 368 | | | | (14,147 | ) | | | 2,945,554 | | | | 117,400 | | | | 20,283 | b |
Franklin LibertyQ Emerging Markets ETF | | | 3,446,396 | | | | 2,684,874 | | | | (3,137,667 | ) | | | 130,857 | | | | 139,896 | | | | 3,264,356 | | | | 109,601 | | | | 214,147 | |
Franklin LibertyQ U.S. Equity ETF | | | 7,933,624 | | | | 6,857,892 | | | | (1,418,040 | ) | | | (20,097 | ) | | | 2,792,407 | | | | 16,145,786 | | | | 461,440 | | | | 285,289 | |
Franklin Low Duration Total Return Fund, Class R6 | | | 3,234,616 | | | | 1,155,656 | | | | (4,442,220 | ) | | | 7,302 | | | | 44,646 | | | | — | a | | | — | | | | 47,295 | |
Franklin Mutual International Fund, Class R6 | | | 2,419,331 | | | | 345,356 | | | | (2,925,362 | ) | | | (214,859 | ) | | | 375,534 | | | | — | a | | | — | | | | — | |
Franklin Pelagos Commodities Strategy Fund, Class R6 | | | 3,548,233 | | | | 384,591 | | | | (3,956,680 | ) | | | (535,619 | ) | | | 559,475 | | | | — | a | | | — | | | | 26,836 | |
Franklin Rising Dividends Fund, Class R6 | | | 7,823,837 | | | | 1,941,041 | | | | (2,943,111 | ) | | | (21,393 | ) | | | 1,858,839 | | | | 8,659,213 | | | | 124,504 | | | | 278,297 | b |
Franklin Strategic Income Fund, Class R6 | | | 2,191,537 | | | | 84,326 | | | | (2,343,080 | ) | | | 24,333 | | | | 42,884 | | | | — | a | | | — | | | | 20,210 | |
Franklin U.S. Core Equity (IU) Fund | | | — | | | | 13,515,733 | | | | (114,234 | ) | | | 2,077 | | | | 954,292 | | | | 14,357,868 | | | | 1,330,664 | | | | 83,244 | |
Franklin U.S. Government Securities Fund, Class R6 | | | 2,952,976 | | | | 1,104,535 | | | | (4,087,149 | ) | | | 22,103 | | | | 7,535 | | | | — | a | | | — | | | | 42,429 | |
Franklin Utilities Fund, Class R6 | | | 2,180,567 | | | | 112,695 | | | | (2,572,288 | ) | | | 828,282 | | | | (549,256 | ) | | | — | a | | | — | | | | 14,847 | |
Institutional Fiduciary Trust Money Market Portfolio, 1.26% | | | 2,076 | | | | 28,983,048 | | | | (28,336,897 | ) | | | — | | | | — | | | | 648,227 | | | | 648,227 | | | | 41,160 | |
Templeton Foreign Fund, Class R6 | | | 3,364,292 | | | | 980,778 | | | | (1,074,997 | ) | | | (39,088 | ) | | | 313,840 | | | | 3,544,825 | | | | 497,170 | | | | 130,273 | |
| | | | |
franklintempleton.com | | Annual Report | | 153 |
FRANKLIN FUND ALLOCATOR SERIES
NOTES TO FINANCIAL STATEMENTS
3. Transactions with Affiliates(continued)
f. Investments in FT Underlying Funds(continued)
| | | | | | | | | | | | | | | | | | | | | | | | | | | | | | | | |
| | | Value at Beginning
of Year | | | Purchases | | | Sales | | | Realized Gain (Loss) | | | Net Change in
Unrealized
Appreciation
(Depreciation) | | | Value at End of Year | | | Number of
Shares
Held at End
of Year | | | Dividend
Income | |
| | | | |
Franklin LifeSmart™ 2045 Retirement Target Fund(continued) | | | | | | | | | | | | | | | | | |
| | | | | | |
Non-Controlled Affiliates(continued) | | | | | | | | | | | | | | | | | | | | | | | | | |
Templeton Global Total Return Fund, Class R6 | | $ | 1,479,762 | | | $ | 261,697 | | | $ | (1,758,541 | ) | | $ | 130,599 | | | $ | (113,517 | ) | | $ | — | a | | | — | | | $ | 36,606 | |
| | | | | | | | | | | | |
| | | | | | | | |
Total Affiliated Securities | | $ | 70,628,862 | | | $ | 83,728,989 | | | $ | (82,110,620 | ) | | $ | 2,037,542 | | | $ | 11,614,963 | | | $ | 85,899,736 | | | | | | | $ | 2,459,128 | |
| | | | | | | | | | | | |
| | | | | | |
Franklin LifeSmart™ 2050 Retirement Target Fund | | | | | | | | | | | | | | | | | | | | | | | | | |
| | | | | | | |
Non-Controlled Affiliates | | | | | | | | | | | | | | | | | | | | | | | | | | | | | |
Franklin Emerging Market Core Equity (IU) Fund | | $ | — | | | $ | 2,172,950 | | | $ | — | | | $ | — | | | $ | 96,917 | | | $ | 2,269,867 | | | | 207,673 | | | $ | 9,202 | b |
Franklin Emerging Market Debt Opportunities Fund | | | 273,492 | | | | 5,035 | | | | (280,093 | ) | | | (22,745 | ) | | | 24,311 | | | | — | a | | | — | | | | — | |
Franklin Floating Rate Daily Access Fund, Class R6 | | | 333,526 | | | | 68,761 | | | | (407,108 | ) | | | (8,990 | ) | | | 13,811 | | | | — | a | | | — | | | | 1,293 | |
Franklin FTSE Europe ETF | | | 705,135 | | | | 902,318 | | | | (901,040 | ) | | | (59,079 | ) | | | 192,052 | | | | 839,386 | | | | 33,243 | | | | 35,714 | |
Franklin FTSE Japan ETF | | | 1,249,853 | | | | 220,907 | | | | (1,187,093 | ) | | | (141,035 | ) | | | 263,634 | | | | 406,266 | | | | 15,536 | | | | 16,537 | |
Franklin Growth Fund, Class R6 | | | 7,409,696 | | | | 2,460,374 | | | | (3,275,990 | ) | | | (6,990 | ) | | | 1,696,700 | | | | 8,283,790 | | | | 73,765 | | | | 473,466 | b |
Franklin Growth Opportunities Fund, Class R6 | | | 2,704,428 | | | | 499,826 | | | | (3,863,922 | ) | | | 741,329 | | | | (81,661 | ) | | | — | a | | | — | | | | — | |
Franklin International Core Equity (IU) Fund | | | — | | | | 3,908,509 | | | | (346,971 | ) | | | (7,573 | ) | | | 275,457 | | | | 3,829,422 | | | | 344,993 | | | | 40,629 | |
Franklin International Growth Fund, Class R6 | | | — | | | | 1,740,378 | | | | (213,081 | ) | | | (5,501 | ) | | | 199,326 | | | | 1,721,122 | | | | 103,371 | | | | 7,503 | |
Franklin International Small Cap Fund, Class R6 | | | 1,502,297 | | | | 403,846 | | | | (1,996,938 | ) | | | (99,026 | ) | | | 189,821 | | | | — | a | | | — | | | | — | |
Franklin Liberty U.S. Core Bond ETF | | | — | | | | 1,287,561 | | | | (141,694 | ) | | | 244 | | | | (3,091 | ) | | | 1,143,020 | | | | 45,557 | | | | 8,124 | b |
Franklin LibertyQ Emerging Markets ETF | | | 1,622,255 | | | | 1,601,511 | | | | (1,805,258 | ) | | | 56,753 | | | | 69,367 | | | | 1,544,628 | | | | 51,861 | | | | 102,770 | |
Franklin LibertyQ U.S. Equity ETF | | | 3,752,315 | | | | 4,043,542 | | | | (1,411,528 | ) | | | (20,703 | ) | | | 1,341,067 | | | | 7,704,693 | | | | 220,197 | | | | 141,217 | |
Franklin Low Duration Total Return Fund, Class R6 | | | 1,397,718 | | | | 590,095 | | | | (2,010,963 | ) | | | 5,710 | | | | 17,440 | | | | — | a | | | — | | | | 21,287 | |
Franklin Mutual International Fund, Class R6 | | | 1,140,318 | | | | 232,024 | | | | (1,449,481 | ) | | | (15,032 | ) | | | 92,171 | | | | — | a | | | — | | | | — | |
Franklin Pelagos Commodities Strategy Fund, Class R6 | | | 1,652,526 | | | | 227,828 | | | | (1,887,764 | ) | | | (267,523 | ) | | | 274,933 | | | | — | a | | | — | | | | 13,262 | |
Franklin Rising Dividends Fund, Class R6 | | | 3,694,774 | | | | 1,321,566 | | | | (1,751,139 | ) | | | (21,273 | ) | | | 899,602 | | | | 4,143,530 | | | | 59,576 | | | | 134,638 | b |
Franklin Strategic Income Fund, Class R6 | | | 932,826 | | | | 53,346 | | | | (1,015,489 | ) | | | 9,226 | | | | 20,091 | | | | — | a | | | — | | | | 9,063 | |
Franklin U.S. Core Equity (IU) Fund | | | — | | | | 6,932,499 | | | | (510,461 | ) | | | (11,427 | ) | | | 454,750 | | | | 6,865,361 | | | | 636,270 | | | | 40,795 | |
Franklin U.S. Government Securities Fund, Class R6 | | | 1,249,416 | | | | 580,581 | | | | (1,842,929 | ) | | | 12,842 | | | | 90 | | | | — | a | | | — | | | | 19,239 | |
Franklin Utilities Fund, Class R6 | | | 1,029,132 | | | | 19,056 | | | | (1,179,119 | ) | | | 199,110 | | | | (68,179 | ) | | | — | a | | | — | | | | 7,076 | |
Institutional Fiduciary Trust Money Market Portfolio, 1.26% | | | 105,867 | | | �� | 17,880,416 | | | | (17,478,058 | ) | | | — | | | | — | | | | 508,225 | | | | 508,225 | | | | 20,774 | |
| | | | |
| | | |
154 | | Annual Report | | franklintempleton.com |
FRANKLIN FUND ALLOCATOR SERIES
NOTES TO FINANCIAL STATEMENTS
| | | | | | | | | | | | | | | | | | | | | | | | | | | | | | | | |
| | | Value at Beginning
of Year | | | Purchases | | | Sales | | | Realized Gain (Loss) | | | Net Change in
Unrealized
Appreciation
(Depreciation) | | | Value at End of Year | | | Number of
Shares
Held at End
of Year | | | Dividend
Income | |
| | | | | |
Franklin LifeSmart™ 2050 Retirement Target Fund(continued) | | | | | | | | | | | | | | | | | | | | | |
| | | | | | |
Non-Controlled Affiliates(continued) | | | | | | | | | | | | | | | | | | | | | | | | | |
Templeton Foreign Fund, Class R6 | | $ | 1,589,329 | | | $ | 616,273 | | | $ | (631,464 | ) | | $ | (43,631 | ) | | $ | 166,191 | | | $ | 1,696,698 | | | | 237,966 | | | $ | 62,354 | |
Templeton Global Total Return Fund, Class R6 | | | 626,122 | | | | 141,630 | | | | (775,145 | ) | | | 33,953 | | | | (26,560 | ) | | | — | a | | | — | | | | 16,049 | |
| | | | | | | | | | | | |
| | | | | | | | |
Total Affiliated Securities | | $ | 32,971,025 | | | $ | 47,910,832 | | | $ | (46,362,728 | ) | | $ | 328,639 | | | $ | 6,108,240 | | | $ | 40,956,008 | | | | | | | $ | 1,180,992 | |
| | | | | | | | | | | | |
| | | | | |
Franklin LifeSmart™ 2055 Retirement Target Fund | | | | | | | | | | | | | | | | | | | | | |
| | | | | | |
Non-Controlled Affiliates | | | | | | | | | | | | | | | | | | | | | | | | | |
Franklin Emerging Market Core Equity (IU) Fund | | $ | — | | | $ | 992,503 | | | $ | — | | | $ | — | | | $ | 43,921 | | | $ | 1,036,424 | | | | 94,824 | | | $ | 4,087 | b |
Franklin Emerging Market Debt Opportunities Fund | | | 97,766 | | | | 1,922 | | | | (100,247 | ) | | | (7,770 | ) | | | 8,329 | | | | — | a | | | — | | | | — | |
Franklin Floating Rate Daily Access Fund, Class R6 | | | 119,294 | | | | 13,169 | | | | (134,184 | ) | | | (3,177 | ) | | | 4,898 | | | | — | a | | | — | | | | 445 | |
Franklin FTSE Europe ETF | | | 259,927 | | | | 433,839 | | | | (358,549 | ) | | | (17,517 | ) | | | 70,696 | | | | 388,396 | | | | 15,382 | | | | 14,286 | |
Franklin FTSE Japan ETF | | | 438,052 | | | | 136,972 | | | | (425,779 | ) | | | (45,801 | ) | | | 91,870 | | | | 195,314 | | | | 7,469 | | | | 6,457 | |
Franklin Growth Fund, Class R6 | | | 2,634,809 | | | | 1,460,800 | | | | (935,288 | ) | | | (3,252 | ) | | | 641,119 | | | | 3,798,188 | | | | 33,822 | | | | 213,880 | b |
Franklin Growth Opportunities Fund, Class R6 | | | 970,492 | | | | 386,887 | | | | (1,598,983 | ) | | | 210,198 | | | | 31,406 | | | | — | a | | | — | | | | — | |
Franklin International Core Equity (IU) Fund | | | — | | | | 1,626,093 | | | | — | | | | — | | | | 121,840 | | | | 1,747,933 | | | | 157,471 | | | | 17,834 | |
Franklin International Growth Fund, Class R6 | | | — | | | | 697,032 | | | | (5,792 | ) | | | (7 | ) | | | 89,627 | | | | 780,860 | | | | 46,898 | | | | 3,404 | |
Franklin International Small Cap Fund, Class R6 | | | 539,482 | | | | 202,870 | | | | (774,136 | ) | | | (37,845 | ) | | | 69,629 | | | | — | a | | | — | | | | — | |
Franklin Liberty U.S. Core Bond ETF | | | — | | | | 1,086,568 | | | | (546,932 | ) | | | 1,293 | | | | (1,095 | ) | | | 539,834 | | | | 21,516 | | | | 3,665 | b |
Franklin LibertyQ Emerging Markets ETF | | | 583,251 | | | | 731,961 | | | | (655,751 | ) | | | 12,502 | | | | 37,432 | | | | 709,395 | | | | 23,818 | | | | 45,427 | |
Franklin LibertyQ U.S. Equity ETF | | | 1,320,871 | | | | 1,842,158 | | | | (154,730 | ) | | | (3,781 | ) | | | 535,875 | | | | 3,540,393 | | | | 101,183 | | | | 57,640 | |
Franklin Low Duration Total Return Fund, Class R6 | | | 500,061 | | | | 255,656 | | | | (764,094 | ) | | | 1,780 | | | | 6,597 | | | | — | a | | | — | | | | 7,614 | |
Franklin Mutual International Fund, Class R6 | | | 411,600 | | | | 104,937 | | | | (544,571 | ) | | | (18,284 | ) | | | 46,318 | | | | — | a | | | — | | | | — | |
Franklin Pelagos Commodities Strategy Fund, Class R6 | | | 583,838 | | | | 118,604 | | | | (703,939 | ) | | | (103,402 | ) | | | 104,899 | | | | — | a | | | — | | | | 4,967 | |
Franklin Rising Dividends Fund, Class R6 | | | 1,310,030 | | | | 741,667 | | | | (490,380 | ) | | | (7,641 | ) | | | 344,798 | | | | 1,898,474 | | | | 27,296 | | | | 57,691 | b |
Franklin Strategic Income Fund, Class R6 | | | 336,082 | | | | 29,110 | | | | (375,716 | ) | | | 1,730 | | | | 8,794 | | | | — | a | | | — | | | | 3,169 | |
Franklin U.S. Core Equity (IU) Fund | | | — | | | | 2,956,894 | | | | — | | | | — | | | | 204,528 | | | | 3,161,422 | | | | 292,996 | | | | 17,426 | |
Franklin U.S. Government Securities Fund, Class R6 | | | 447,085 | | | | 249,444 | | | | (701,256 | ) | | | 4,842 | | | | (115 | ) | | | — | a | | | — | | | | 6,822 | |
Franklin Utilities Fund, Class R6 | | | 367,091 | | | | 25,262 | | | | (439,724 | ) | | | 58,348 | | | | (10,977 | ) | | | — | a | | | — | | | | 2,449 | |
Institutional Fiduciary Trust Money Market Portfolio, 1.26% | | | 184,376 | | | | 8,570,578 | | | | (8,357,980 | ) | | | — | | | | — | | | | 396,974 | | | | 396,974 | | | | 8,470 | |
Templeton Foreign Fund, Class R6 | | | 567,208 | | | | 323,997 | | | | (163,538 | ) | | | (17,124 | ) | | | 68,849 | | | | 779,392 | | | | 109,312 | | | | 28,643 | |
| | | | |
franklintempleton.com | | Annual Report | | 155 |
FRANKLIN FUND ALLOCATOR SERIES
NOTES TO FINANCIAL STATEMENTS
3. Transactions with Affiliates(continued)
f. Investments in FT Underlying Funds(continued)
| | | | | | | | | | | | | | | | | | | | | | | | | | | | | | | | |
| | | Value at Beginning
of Year | | | Purchases | | | Sales | | | Realized Gain (Loss) | | | Net Change in
Unrealized
Appreciation
(Depreciation) | | | Value at End of Year | | | Number of
Shares
Held at End
of Year | | | Dividend
Income | |
| | | | | | | | | | | | | | | | | | | | | | | | | | | | | | | | |
| | | | | | |
Franklin LifeSmart™ 2055 Retirement Target Fund(continued) | | | | | | | | | | | | | | | | | | | | | | | | | |
| | | | | | | |
Non-Controlled Affiliates(continued) | | | | | | | | | | | | | | | | | | | | | | | | | | | | | |
Templeton Global Total Return Fund, Class R6 | | $ | 223,894 | | | $ | 72,342 | | | $ | (298,920 | ) | | $ | 6,398 | | | $ | (3,714 | ) | | $ | — | a | | | — | | | $ | 5,706 | |
| | | | | | | | | | | | |
| | | | | | | | |
Total Affiliated Securities | | $ | 11,895,209 | | | $ | 23,061,265 | | | $ | (18,530,489 | ) | | $ | 31,490 | | | $ | 2,515,524 | | | $ | 18,972,999 | | | | | | | $ | 510,082 | |
| | | | | | | | | | | | |
aAs of December 31, 2019, no longer held by the fund.
bDividend income includes capital gain distributions received, if any, from underlying funds, and are presented in corresponding line item in the Statement of Operations.
g. Waiver and Expense Reimbursements
Advisers and Investor Services have contractually agreed in advance to waive or limit their fees and to assume as their own expense certain expenses otherwise payable by Franklin LifeSmart™ Retirement Income Fund, so that the expenses (excluding distribution fees, acquired fund fees and expenses and certainnon-routine expenses or costs, including those relating to litigation, indemnification, reorganizations, and liquidations) for Class A, Class C, Class R and Advisor Class of the Fund do not exceed 0.05%, and for Class R6 do not exceed 0.00% based on the average net assets of each class until April 30, 2020. Total expenses waived or paid are not subject to recapture subsequent to the Fund’s fiscal year end.
Effective May 1, 2019, Advisers and Investor Services have contractually agreed in advance to waive or limit their fees and to assume as their own expense certain expenses otherwise payable by the Funds, except Franklin LifeSmart™ Retirement Income Fund, so that the expenses (including acquired fund fees and expenses but excluding distribution fees and certainnon-routine expenses or costs, including those relating to litigation, indemnification, reorganizations, and liquidations) for Class A, Class C, Class R and Advisor Class of the Funds do not exceed 0.45%, and for Class R6 do not exceed 0.40% based on the average net assets of each class until April 30, 2020. Total expenses waived or paid are not subject to recapture subsequent to the Funds’ fiscal year end.
Prior to May 1, 2019, expenses (excluding certain fees and expenses as previously disclosed) for the Funds, except Franklin LifeSmart™ Retirement Income Fund, for Class A, Class C, Class R and Advisor Class were limited to 0.05%, and expenses for Class R6 were limited to 0.00% based on the average net assets of each class.
4. Expense Offset Arrangement
The Funds have entered into an arrangement with their custodian whereby credits realized as a result of uninvested cash balances are used to reduce a portion of the Funds’ custodian expenses. During the year ended December 31, 2019, the custodian fees were reduced as noted in the Statements of Operations.
| | | | |
| | | |
156 | | Annual Report | | franklintempleton.com |
FRANKLIN FUND ALLOCATOR SERIES
NOTES TO FINANCIAL STATEMENTS
5. Income Taxes
For tax purposes, capital losses may be carried over to offset future capital gains, if any. At December 31, 2019, the capital loss carryforwards were as follows:
| | | | | | | | |
| | | Franklin
LifeSmart™
Retirement
Income Fund | | | Franklin
LifeSmart™
2020 Retirement
Target Fund | |
| |
| | |
Capital loss carryforwards not subject to expiration: | | | | | | | | |
| | |
Short term | | | $ 34,021 | | | | $ 201 | |
| | |
Long term | | | 1,748,586 | | | | — | |
| | |
Total capital loss carryforwards | | | $1,782,607 | | | | $ 201 | |
During the year ended December 31, 2019, the Franklin LifeSmart™ 2020 Retirement Target Fund utilized $15,776 of capital loss carryforwards.
The tax character of distributions paid during the years ended December 31, 2019 and 2018, was as follows:
| | | | | | | | | | | | | | | | | | | | | | | | |
| | | Franklin LifeSmart™ Retirement Income Fund | | | Franklin LifeSmart™ 2020
Retirement Target Fund | | | Franklin LifeSmart™ 2025
Retirement Target Fund | |
| | | 2019 | | | 2018 | | | 2019 | | | 2018 | | | 2019 | | | 2018 | |
| | | | | | |
Distributions paid from: | | | | | | | | | | | | | | | | | | | | | | | | |
| | | | | | |
Ordinary income | | $ | 1,889,782 | | | $ | 2,108,813 | | | $ | 1,066,754 | | | $ | 1,108,392 | | | $ | 2,616,420 | | | $ | 3,271,280 | |
| | | | | | |
Long term capital gain | | | — | | | | — | | | | — | | | | — | | | | 1,881,660 | | | | 4,129,877 | |
| | $ | 1,889,782 | | | $ | 2,108,813 | | | $ | 1,066,754 | | | $ | 1,108,392 | | | $ | 4,498,080 | | | $ | 7,401,157 | |
| | | |
| | | Franklin LifeSmart™ 2030
Retirement Target Fund | | | Franklin LifeSmart™ 2035
Retirement Target Fund | | | Franklin LifeSmart™ 2040
Retirement Target Fund | |
| | | 2019 | | | 2018 | | | 2019 | | | 2018 | | | 2019 | | | 2018 | |
| | | | | | |
Distributions paid from: | | | | | | | | | | | | | | | | | | | | | | | | |
| | | | | | |
Ordinary income | | $ | 1,013,916 | | | $ | 1,315,992 | | | $ | 2,124,369 | | | $ | 2,527,142 | | | $ | 675,712 | | | $ | 997,412 | |
| | | | | | |
Long term capital gain | | | 589,632 | | | | 353,075 | | | | 2,519,106 | | | | 3,778,106 | | | | 516,792 | | | | 723,479 | |
| | $ | 1,603,548 | | | $ | 1,669,067 | | | $ | 4,643,475 | | | $ | 6,305,248 | | | $ | 1,192,504 | | | $ | 1,720,891 | |
| | | |
| | | Franklin LifeSmart™ 2045
Retirement Target Fund | | | Franklin LifeSmart™ 2050
Retirement Target Fund | | | Franklin LifeSmart™ 2055
Retirement Target Fund | |
| | | 2019 | | | 2018 | | | 2019 | | | 2018 | | | 2019 | | | 2018 | |
| | | | | | |
Distributions paid from: | | | | | | | | | | | | | | | | | | | | | | | | |
| | | | | | |
Ordinary income | | $ | 1,277,107 | | | $ | 1,560,787 | | | $ | 517,820 | | | $ | 831,581 | | | $ | 177,815 | | | $ | 253,549 | |
| | | | | | |
Long term capital gain | | | 1,381,264 | | | | 2,869,290 | | | | 434,521 | | | | 537,210 | | | | 144,701 | | | | 171,375 | |
| | $ | 2,658,371 | | | $ | 4,430,077 | | | $ | 952,341 | | | $ | 1,368,791 | | | $ | 322,516 | | | $ | 424,924 | |
| | | | |
franklintempleton.com | | Annual Report | | 157 |
FRANKLIN FUND ALLOCATOR SERIES
NOTES TO FINANCIAL STATEMENTS
5. Income Taxes(continued)
At December 31, 2019, the cost of investments, net unrealized appreciation (depreciation), undistributed ordinary income and undistributed long term capital gains for income tax purposes were as follows:
| | | | | | | | | | | | |
| | | Franklin
LifeSmart™
Retirement
Income Fund | | | Franklin
LifeSmart™
2020 Retirement
Target Fund | | | Franklin
LifeSmart™
2025 Retirement
Target Fund | |
| | | |
Cost of investments | | | $49,989,931 | | | | $39,515,338 | | | | $113,522,685 | |
| | | |
Unrealized appreciation | | | $ 1,954,164 | | | | $ 3,639,093 | | | | $ 17,244,457 | |
| | | |
Unrealized depreciation | | | (653,210 | ) | | | (491,800 | ) | | | (1,012,232 | ) |
| | | |
Net unrealized appreciation (depreciation) | | | $ 1,300,954 | | | | $ 3,147,293 | | | | $ 16,232,225 | |
| | | |
Distributable earnings: | | | | | | | | | | | | |
| | | |
Undistributed ordinary income | | | $ 402,881 | | | | $ 156,461 | | | | $ 60,130 | |
| | | |
Undistributed long term capital gains | | | — | | | | — | | | | 2,319,279 | |
| | | |
Total distributable earnings | | | $ 402,881 | | | | $ 156,461 | | | | $ 2,379,409 | |
| | | |
| | | Franklin
LifeSmart™
2030 Retirement
Target Fund | | | Franklin
LifeSmart™
2035 Retirement
Target Fund | | | Franklin
LifeSmart™
2040 Retirement
Target Fund | |
| | | |
Cost of investments | | | $54,086,040 | | | | $109,319,873 | | | | $ 42,718,915 | |
| | | |
Unrealized appreciation | | | $ 6,790,832 | | | | $20,104,772 | | | | $ 6,288,381 | |
| | | |
Unrealized depreciation | | | (452,333 | ) | | | (719,797 | ) | | | (171,240 | ) |
| | | |
Net unrealized appreciation (depreciation) | | | $ 6,338,499 | | | | $19,384,975 | | | | $ 6,117,141 | |
| | | |
Distributable earnings: | | | | | | | | | | | | |
| | | |
Undistributed ordinary income | | | $ 97,877 | | | | $ 66,161 | | | | $ 126,931 | |
| | | |
Undistributed long term capital gains | | | 687,696 | | | | 2,676,087 | | | | 718,288 | |
| | | |
Total distributable earnings | | | $ 785,573 | | | | $ 2,742,248 | | | | $ 845,219 | |
| | | | |
| | | |
158 | | Annual Report | | franklintempleton.com |
FRANKLIN FUND ALLOCATOR SERIES
NOTES TO FINANCIAL STATEMENTS
| | | | | | | | | | | | |
| | | Franklin
LifeSmart™
2045 Retirement
Target Fund | | | Franklin
LifeSmart™
2050 Retirement
Target Fund | | | Franklin
LifeSmart™
2055 Retirement
Target Fund | |
| |
| | | |
Cost of investments | | | $75,805,688 | | | | $37,111,905 | | | | $17,779,257 | |
| | | | |
| | | |
Unrealized appreciation | | | $15,365,706 | | | | $ 5,886,522 | | | | $ 2,114,539 | |
| | | |
Unrealized depreciation | | | (310,264 | ) | | | (240,704 | ) | | | (116,774 | ) |
| | | | |
| | | |
Net unrealized appreciation (depreciation) | | | $15,055,442 | | | | $ 5,645,818 | | | | $ 1,997,765 | |
| | | | |
| | | |
Distributable earnings: | | | | | | | | | | | | |
| | | |
Undistributed ordinary income | | | $ 45,755 | | | | $ 138,151 | | | | $87,456 | |
| | | |
Undistributed long term capital gains | | | 2,228,690 | | | | 599,468 | | | | 201,544 | |
| | | | |
| | | |
Total distributable earnings | | | $ 2,274,445 | | | | $ 737,619 | | | | $ 289,000 | |
| | | | |
Differences between income and/or capital gains as determined on a book basis and a tax basis are primarily due to differing treatment of wash sales.
The Funds, except Franklin LifeSmart™ Retirement Income Fund and Franklin LifeSmart™ 2020 Retirement Target Fund, utilized a tax accounting practice to treat a portion of the proceeds from capital shares redeemed as a distribution from realized capital gains.
6. Investment Transactions
Purchases and sales of Underlying Funds and ETFs (excluding short term securities) for the year ended December 31, 2019, were as follows:
| | | | | | | | | | | | |
| | | Franklin
LifeSmart™
Retirement
Income Fund | | | Franklin
LifeSmart™
2020 Retirement
Target Fund | | | Franklin
LifeSmart™
2025 Retirement
Target Fund | |
| | | |
Purchases | | | $41,640,844 | | | | $50,703,077 | | | | $103,050,255 | |
| | | |
Sales | | | $44,702,172 | | | | $53,000,241 | | | | $108,885,157 | |
| | | |
| | | Franklin
LifeSmart™
2030 Retirement
Target Fund | | | Franklin
LifeSmart™
2035 Retirement
Target Fund | | | Franklin
LifeSmart™
2040 Retirement
Target Fund | |
| | | |
Purchases | | | $51,887,778 | | | | $93,451,053 | | | | $40,444,628 | |
| | | |
Sales | | | $50,020,060 | | | | $92,432,804 | | | | $39,794,063 | |
| | | |
| | | Franklin
LifeSmart™
2045 Retirement
Target Fund | | | Franklin
LifeSmart™
2050 Retirement
Target Fund | | | Franklin
LifeSmart™
2055 Retirement
Target Fund | |
| | | |
Purchases | | | $70,803,842 | | | | $37,978,976 | | | | $18,132,494 | |
| | | |
Sales | | | $71,018,366 | | | | $37,641,801 | | | | $13,973,963 | |
| | | | |
franklintempleton.com | | Annual Report | | 159 |
FRANKLIN FUND ALLOCATOR SERIES
NOTES TO FINANCIAL STATEMENTS
7. Credit Facility
The Funds, together with other U.S. registered and foreign investment funds (collectively, Borrowers), managed by Franklin Templeton, are borrowers in a joint syndicated senior unsecured credit facility totaling $2 billion (Global Credit Facility) which matured on February 7, 2020. This Global Credit Facility provides a source of funds to the Borrowers for temporary and emergency purposes, including the ability to meet future unanticipated or unusually large redemption requests. Effective February 7, 2020, the Borrowers renewed the Global Credit Facility for a one year term, maturing February 5, 2021, for a total of $2 billion.
Under the terms of the Global Credit Facility, the Funds shall, in addition to interest charged on any borrowings made by the Funds and other costs incurred by the Funds, pay their share of fees and expenses incurred in connection with the implementation and maintenance of the Global Credit Facility, based upon their relative share of the aggregate net assets of all of the Borrowers, including an annual commitment fee of 0.15% based upon the unused portion of the Global Credit Facility. These fees are reflected in other expenses in the Statements of Operations. During the year ended December 31, 2019, the Funds did not use the Global Credit Facility.
8. Fair Value Measurements
The Funds follow a fair value hierarchy that distinguishes between market data obtained from independent sources (observable inputs) and the Funds’ own market assumptions (unobservable inputs). These inputs are used in determining the value of the Funds’ financial instruments and are summarized in the following fair value hierarchy:
| | • | Level 1 – quoted prices in active markets for identical financial instruments |
| | • | Level 2 – other significant observable inputs (including quoted prices for similar financial instruments, interest rates, prepayment speed, credit risk, etc.) |
| | • | Level 3 – significant unobservable inputs (including the Funds’ own assumptions in determining the fair value of financial instruments) |
The input levels are not necessarily an indication of the risk or liquidity associated with financial instruments at that level.
A summary of inputs used as of December 31, 2019, in valuing the Funds’ assets carried at fair value, is as follows:
| | | | | | | | | | | | | | | | |
| | | Level 1 | | | Level 2 | | | Level 3 | | | Total | |
| | | | |
Franklin LifeSmart™ Retirement Income Fund | | | | | | | | | | | | | | | | |
Assets: | | | | | | | | | | | | | | | | |
Investments in Securities:a | | | | | | | | | | | | | | | | |
Underlying Funds and Exchange Traded Funds . | | $ | 45,354,428 | | | $ | — | | | $ | — | | | $ | 45,354,428 | |
Index-Linked Notes | | | — | | | | 5,066,263 | | | | — | | | | 5,066,263 | |
Short Term Investments | | | 870,194 | | | | — | | | | — | | | | 870,194 | |
| | | | |
| | | | |
Total Investments in Securities | | $ | 46,224,622 | | | $ | 5,066,263 | | | $ | — | | | $ | 51,290,885 | |
| | | | |
| | | | |
Franklin LifeSmart™ 2020 Retirement Target Fund | | | | | | | | | | | | | | | | |
Assets: | | | | | | | | | | | | | | | | |
Investments in Securities:a | | | | | | | | | | | | | | | | |
Underlying Funds and Exchange Traded Funds | | $ | 42,217,118 | | | $ | — | | | $ | — | | | $ | 42,217,118 | |
Short Term Investments | | | 272,558 | | | | 172,955 | | | | — | | | | 445,513 | |
| | | | |
| | | | |
Total Investments in Securities | | $ | 42,489,676 | | | $ | 172,955 | | | $ | — | | | $ | 42,662,631 | |
| | | | |
| | | | |
| | | |
160 | | Annual Report | | franklintempleton.com |
FRANKLIN FUND ALLOCATOR SERIES
NOTES TO FINANCIAL STATEMENTS
| | | | | | | | | | | | | | | | |
| | | Level 1 | | | Level 2 | | | Level 3 | | | Total | |
Franklin LifeSmart™ 2025 Retirement Target Fund | | | | | | | | | | | | | | | | |
Assets: | | | | | | | | | | | | | | | | |
Investments in Securities:a | | | | | | | | | | | | | | | | |
Underlying Funds and Exchange Traded Funds . | | $ | 128,453,637 | | | $ | — | | | $ | — | | | $ | 128,453,637 | |
Short Term Investments | | | 1,981 | | | | 1,299,292 | | | | — | | | | 1,301,273 | |
| | | | |
| | | | |
Total Investments in Securities | | $ | 128,455,618 | | | $ | 1,299,292 | | | $ | — | | | $ | 129,754,910 | |
| | | | |
| |
Franklin LifeSmart™ 2030 Retirement Target Fund | | | | |
Assets: | | | | | | | | | | | | | | | | |
Investments in Securities:a | | | | |
Underlying Funds and Exchange Traded Funds . | | $ | 59,308,657 | | | $ | — | | | $ | — | | | $ | 59,308,657 | |
Short Term Investments | | | 687,164 | | | | 428,718 | | | | — | | | | 1,115,882 | |
| | | | |
| | | | |
Total Investments in Securities | | $ | 59,995,821 | | | $ | 428,718 | | | $ | — | | | $ | 60,424,539 | |
| | | | |
| | | | |
Franklin LifeSmart™ 2035 Retirement Target Fund | | | | | | | | | | | | | | | | |
Assets: | | | | | | | | | | | | | | | | |
Investments in Securities:a | | | | |
Underlying Funds and Exchange Traded Funds . | | $ | 127,161,475 | | | $ | — | | | $ | — | | | $ | 127,161,475 | |
Short Term Investments | | | 1,866 | | | | 1,541,507 | | | | — | | | | 1,543,373 | |
| | | | |
| | | | |
Total Investments in Securities | | $ | 127,163,341 | | | $ | 1,541,507 | | | $ | — | | | $ | 128,704,848 | |
| | | | |
| | | | |
Franklin LifeSmart™ 2040 Retirement Target Fund | | | | | | | | | | | | | | | | |
Assets: | | | | | | | | | | | | | | | | |
Investments in Securities:a | | | | | | | | | | | | | | | | |
Underlying Funds and Exchange Traded Funds . | | $ | 47,968,687 | | | $ | — | | | $ | — | | | $ | 47,968,687 | |
Short Term Investments | | | 800,528 | | | | 66,841 | | | | — | | | | 867,369 | |
| | | | |
| | | | |
Total Investments in Securities | | $ | 48,769,215 | | | $ | 66,841 | | | $ | — | | | $ | 48,836,056 | |
| | | | |
| | | | |
Franklin LifeSmart™ 2045 Retirement Target Fund | | | | | | | | | | | | | | | | |
Assets: | | | | | | | | | | | | | | | | |
Investments in Securities:a | | | | | | | | | | | | | | | | |
Underlying Funds and Exchange Traded Funds . | | $ | 89,379,387 | | | $ | — | | | $ | — | | | $ | 89,379,387 | |
Short Term Investments | | | 648,227 | | | | 833,516 | | | | — | | | | 1,481,743 | |
| | | | |
| | | | |
Total Investments in Securities | | $ | 90,027,614 | | | $ | 833,516 | | | $ | — | | | $ | 90,861,130 | |
| | | | |
| | | | |
Franklin LifeSmart™ 2050 Retirement Target Fund | | | | | | | | | | | | | | | | |
Assets: | | | | | | | | | | | | | | | | |
Investments in Securities:a | | | | | | | | | | | | | | | | |
Underlying Funds and Exchange Traded Funds . | | $ | 42,133,919 | | | $ | — | | | $ | — | | | $ | 42,133,919 | |
Short Term Investments | | | 508,225 | | | | 115,579 | | | | — | | | | 623,804 | |
| | | | |
| | | | |
Total Investments in Securities | | $ | 42,642,144 | | | $ | 115,579 | | | $ | — | | | $ | 42,757,723 | |
| | | | |
| | | | |
Franklin LifeSmart™ 2055 Retirement Target Fund | | | | | | | | | | | | | | | | |
Assets: | | | | | | | | | | | | | | | | |
Investments in Securities:a | | | | | | | | | | | | | | | | |
Underlying Funds and Exchange Traded Funds . | | $ | 19,380,048 | | | $ | — | | | $ | — | | | $ | 19,380,048 | |
Short Term Investments | | | 396,974 | | | | — | | | | — | | | | 396,974 | |
| | | | |
| | | | |
Total Investments in Securities | | $ | 19,777,022 | | | $ | — | | | $ | — | | | $ | 19,777,022 | |
| | | | |
aFor detailed categories, see the accompanying Statement of Investments.
| | | | |
franklintempleton.com | | Annual Report | | 161 |
FRANKLIN FUND ALLOCATOR SERIES
NOTES TO FINANCIAL STATEMENTS
9. Subsequent Events
The Funds have evaluated subsequent events through the issuance of the financial statements and determined that no events have occurred that require disclosure other than those already disclosed in the financial statements.
Abbreviations
Selected Portfolio
ETFExchange Traded Fund
| | | | |
| | | |
162 | | Annual Report | | franklintempleton.com |
FRANKLIN FUND ALLOCATOR SERIES
Report of Independent Registered Public Accounting Firm
To the Board of Trustees of Franklin Fund Allocator Series and Shareholders of Franklin LifeSmart™ Retirement Income Fund, Franklin LifeSmart™ 2020 Retirement Target Fund, Franklin LifeSmart™ 2025 Retirement Target Fund, Franklin LifeSmart™ 2030 Retirement Target Fund, Franklin LifeSmart™ 2035 Retirement Target Fund, Franklin LifeSmart™ 2040 Retirement Target Fund, Franklin LifeSmart™ 2045 Retirement Target Fund, Franklin LifeSmart™ 2050 Retirement Target Fund and Franklin LifeSmart™ 2055 Retirement Target Fund
Opinions on the Financial Statements
We have audited the accompanying statements of assets and liabilities, including the statements of investments, of Franklin LifeSmart™ Retirement Income Fund, Franklin LifeSmart™ 2020 Retirement Target Fund, Franklin LifeSmart™ 2025 Retirement Target Fund, Franklin LifeSmart™ 2030 Retirement Target Fund, Franklin LifeSmart™ 2035 Retirement Target Fund, Franklin LifeSmart™ 2040 Retirement Target Fund, Franklin LifeSmart™ 2045 Retirement Target Fund, Franklin LifeSmart™ 2050 Retirement Target Fund and Franklin LifeSmart™ 2055 Retirement Target Fund (the "Funds") as of December 31, 2019, the related statements of operations for the year ended December 31, 2019, the statements of changes in net assets for each of the two years in the period ended December 31, 2019, including the related notes, and the financial highlights for each of the periods indicated therein (collectively referred to as the “financial statements”). In our opinion, the financial statements present fairly, in all material respects, the financial position of each of the Funds as of December 31, 2019, the results of each of their operations for the year then ended, the changes in each of their net assets for each of the two years in the period ended December 31, 2019 and each of the financial highlights for each of the periods indicated therein in conformity with accounting principles generally accepted in the United States of America.
Basis for Opinions
These financial statements are the responsibility of the Funds’ management. Our responsibility is to express an opinion on the Funds’ financial statements based on our audits. We are a public accounting firm registered with the Public Company Accounting Oversight Board (United States) (PCAOB) and are required to be independent with respect to the Funds in accordance with the U.S. federal securities laws and the applicable rules and regulations of the Securities and Exchange Commission and the PCAOB.
We conducted our audits of these financial statements in accordance with the standards of the PCAOB. Those standards require that we plan and perform the audit to obtain reasonable assurance about whether the financial statements are free of material misstatement, whether due to error or fraud.
Our audits included performing procedures to assess the risks of material misstatement of the financial statements, whether due to error or fraud, and performing procedures that respond to those risks. Such procedures included examining, on a test basis, evidence regarding the amounts and disclosures in the financial statements. Our audits also included evaluating the accounting principles used and significant estimates made by management, as well as evaluating the overall presentation of the financial statements. Our procedures included confirmation of securities owned as of December 31, 2019 by correspondence with the custodian, transfer agent and brokers; when replies were not received from brokers, we performed other auditing procedures. We believe that our audits provide a reasonable basis for our opinions.
PricewaterhouseCoopers LLP
San Francisco, California
February 20, 2020
We have served as the auditor of one or more investment companies in the Franklin Templeton Group of Funds since 1948.
| | | | |
franklintempleton.com | | Annual Report | | 163 |
FRANKLIN FUND ALLOCATOR SERIES
Tax Information (unaudited)
Under Section 852(b)(3)(C) of the Internal Revenue Code, the Funds hereby report the maximum amount allowable but no less than the following amounts as long term capital gain dividends for the fiscal year ended December 31, 2019:
| | | | | | | | | | | | | | |
Franklin
LifeSmart™
2025 Retirement
Target Fund | | | Franklin
LifeSmart™ 2030 Retirement Target Fund | | | Franklin
LifeSmart™ 2035 Retiremen
Target Fund | | | Franklin
LifeSmart™
2040 Retirement
Target Fund | |
| | |
| | | |
| | $2,274,063 | | | | $687,850 | | | | $2,843,679 | | | | $644,202 | |
| | | | | | | | | | |
Franklin
LifeSmart™ 2045 Retirement
Target Fund | | | Franklin
LifeSmart™
2050 Retirement
Target Fund | | | Franklin
LifeSmart™
2055 Retirement
Target Fund | |
| | |
| | |
| | $1,657,949 | | | | $588,031 | | | | $182,659 | |
Under Section 871(k)(2)(C) of the Internal Revenue Code, the Franklin LifeSmart™ 2035 Retirement Target Fund hereby reports the maximum amount allowable but no less than $5,559 as a short term capital gain dividend for purposes of the tax imposed under Section 871(a)(1)(A) of the Internal Revenue Code for the fiscal year ended December 31, 2019.
Under Section 854(b)(1)(A) of the Internal Revenue Code, the Funds hereby report the following percentage amounts of the ordinary income dividends as income qualifying for the dividends received deduction for the fiscal year ended December 31, 2019:
| | | | | | | | | | | | | | |
Franklin
LifeSmart™
Retirement
Income Fund | | | Franklin
LifeSmart™
2020 Retirement
Target Fund | | | Franklin
LifeSmart™
2025 Retirement
Target Fund | | | Franklin
LifeSmart™
2030 Retirement
Target Fund | |
| | |
| | | |
| | 10.01% | | | | 12.86% | | | | 19.19% | | | | 26.42% | |
| | | |
Franklin
LifeSmart™
2035 Retirement
Target Fund | | | Franklin
LifeSmart™
2040 Retirement
Target Fund | | | Franklin
LifeSmart™
2045 Retirement
Target Fund | | | Franklin
LifeSmart™
2050 Retirement
Target Fund | |
| | |
| | | |
| | 30.63% | | | | 40.01% | | | | 41.94% | | | | 50.65% | |
|
| Franklin |
LifeSmart™ 2055 Retirement |
| Target Fund |
|
|
60.67% |
Under Section 854(b)(1)(B) of the Internal Revenue Code, the Funds hereby report the maximum amount allowable but no less than the following amounts as qualified dividends for purposes of the maximum rate under Section 1(h)(11) of the Internal Revenue Code for the fiscal year ended December 31, 2019:
| | | | | | | | | | | | | | |
Franklin
LifeSmart™
Retirement
Income Fund | | | Franklin
LifeSmart™
2020 Retirement
Target Fund | | | Franklin
LifeSmart™
2025 Retirement
Target Fund | | | Franklin
LifeSmart™
2030 Retirement
Target Fund | |
| | |
| | | |
| | $245,903 | | | | $293,733 | | | | $1,053,681 | | | | $562,672 | |
| | | | |
| | | |
164 | | Annual Report | | franklintempleton.com |
FRANKLIN FUND ALLOCATOR SERIES
TAX INFORMATION
| | | | | | | | | | | | | | |
Franklin
LifeSmart™
2035 Retirement
Target Fund | | | Franklin
LifeSmart™
2040 Retirement
Target Fund | | | Franklin
LifeSmart™
2045 Retirement
Target Fund | | | Franklin
LifeSmart™
2050 Retirement
Target Fund | |
| | |
| | | |
| | $1,362,956 | | | | $567,683 | | | | $1,122,920 | | | | $546,989 | |
|
| Franklin |
LifeSmart™ 2055 Retirement |
| Target Fund |
|
|
$230,548 |
Distributions, including qualified dividend income, paid during calendar year 2019 will be reported to shareholders on Form1099-DIV bymid-February 2020. Shareholders are advised to check with their tax advisors for information on the treatment of these amounts on their individual income tax returns.
During the fiscal year ended December 31, 2019, the Funds, qualified fund of funds under Section 852(g)(2) of Internal Revenue Code, received an allocation of foreign taxes paid from one or more of their underlying funds. As shown in the table below, the Funds hereby report to shareholders the foreign source income and foreign taxes paid by underlying funds, pursuant to Section 853 of the Internal Revenue Code. This written statement will allow shareholders of record on December 24, 2019 for Franklin LifeSmart™ Retirement Income Fund and December 27, 2019 for the remaining funds, to treat their proportionate share of foreign taxes paid by the underlying funds as having been paid directly by them. The shareholder shall consider these amounts as foreign taxes paid in the tax year in which they receive the Fund distribution.
| | | | |
franklintempleton.com | | Annual Report | | 165 |
FRANKLIN FUND ALLOCATOR SERIES
TAX INFORMATION
The following table provides a detailed analysis of foreign tax paid, foreign source income, and foreign source qualified dividends as reported by the Funds, to shareholders of record.
| | | | | | |
| Class | | Foreign Tax Paid
Per Share | | Foreign Source
Income Per Share | | Foreign Source Qualified
Dividends Per Share |
| | | |
Franklin LifeSmart Retirement Income Fund | | | | | | |
| | | |
Class A | | 0.0011 | | 0.0296 | | |
| | | |
Class C | | 0.0011 | | 0.0296 | | |
| | | |
Class R | | 0.0011 | | 0.0296 | | |
| | | |
Class R6 | | 0.0011 | | 0.0296 | | |
| | | |
Advisor Class | | 0.0011 | | 0.0296 | | |
| | | |
Franklin LifeSmart 2020 Retirement Target Fund | | | | | | |
| | | |
Class A | | 0.0063 | | 0.0968 | | 0.0285 |
| | | |
Class C | | 0.0063 | | 0.0968 | | 0.0285 |
| | | |
Class R | | 0.0063 | | 0.0968 | | 0.0285 |
| | | |
Class R6 | | 0.0063 | | 0.0968 | | 0.0285 |
| | | |
Advisor Class | | 0.0063 | | 0.0968 | | 0.0285 |
| | | |
Franklin LifeSmart 2025 Retirement Target Fund | | | | | | |
| | | |
Class A | | 0.0066 | | 0.0881 | | 0.0352 |
| | | |
Class C | | 0.0066 | | 0.0881 | | 0.0352 |
| | | |
Class R | | 0.0066 | | 0.0881 | | 0.0352 |
| | | |
Class R6 | | 0.0066 | | 0.0881 | | 0.0352 |
| | | |
Advisor Class | | 0.0066 | | 0.0881 | | 0.0352 |
| | | |
Franklin LifeSmart 2030 Retirement Target Fund | | | | | | |
| | | |
Class A | | 0.0070 | | 0.0849 | | 0.0406 |
| | | |
Class C | | 0.0070 | | 0.0849 | | 0.0406 |
| | | |
Class R | | 0.0070 | | 0.0849 | | 0.0406 |
| | | |
Class R6 | | 0.0070 | | 0.0849 | | 0.0406 |
| | | |
Advisor Class | | 0.0070 | | 0.0849 | | 0.0406 |
| | | |
Franklin LifeSmart 2035 Retirement Target Fund | | | | | | |
| | | |
Class A | | 0.0080 | | 0.0906 | | 0.0488 |
| | | |
Class C | | 0.0080 | | 0.0906 | | 0.0488 |
| | | |
Class R | | 0.0080 | | 0.0906 | | 0.0488 |
| | | |
Class R6 | | 0.0080 | | 0.0906 | | 0.0488 |
| | | |
Advisor Class | | 0.0080 | | 0.0906 | | 0.0488 |
| | | |
Franklin LifeSmart 2040 Retirement Target Fund | | | | | | |
| | | |
Class A | | 0.0085 | | 0.0929 | | 0.0531 |
| | | |
Class C | | 0.0085 | | 0.0929 | | 0.0531 |
| | | |
Class R | | 0.0085 | | 0.0929 | | 0.0531 |
| | | |
Class R6 | | 0.0085 | | 0.0929 | | 0.0531 |
| | | |
Advisor Class | | 0.0085 | | 0.0929 | | 0.0531 |
| | | |
Franklin LifeSmart 2045 Retirement Target Fund | | | | | | |
| | | |
Class A | | 0.0092 | | 0.0996 | | 0.0585 |
| | | |
Class C | | 0.0092 | | 0.0996 | | 0.0585 |
| | | |
Class R | | 0.0092 | | 0.0996 | | 0.0585 |
| | | |
Class R6 | | 0.0092 | | 0.0996 | | 0.0585 |
| | | |
Advisor Class | | 0.0092 | | 0.0996 | | 0.0585 |
| | | |
Franklin LifeSmart 2050 Retirement Target Fund | | | | | | |
| | | |
Class A | | 0.0093 | | 0.1002 | | 0.0600 |
| | | |
Class C | | 0.0093 | | 0.1002 | | 0.0600 |
| | | |
Class R | | 0.0093 | | 0.1002 | | 0.0600 |
| | | |
Class R6 | | 0.0093 | | 0.1002 | | 0.0600 |
| | | | |
| | | |
166 | | Annual Report | | franklintempleton.com |
FRANKLIN FUND ALLOCATOR SERIES
TAX INFORMATION
| | | | | | |
| Class | | Foreign Tax Paid
Per Share | | Foreign Source
Income Per Share | | Foreign Source Qualified
Dividends Per Share |
| | | |
Advisor Class | | 0.0093 | | 0.1002 | | 0.0600 |
| | | |
Franklin LifeSmart 2055 Retirement Target Fund | | | | | | |
| | | |
Class A | | 0.0067 | | 0.0710 | | 0.0431 |
| | | |
Class C | | 0.0067 | | 0.0710 | | 0.0431 |
| | | |
Class R | | 0.0067 | | 0.0710 | | 0.0431 |
| | | |
Class R6 | | 0.0067 | | 0.0710 | | 0.0431 |
| | | |
Advisor Class | | 0.0067 | | 0.0710 | | 0.0431 |
Foreign Tax Paid Per Share is the amount per share available to you, as a tax credit (assuming you held your shares in the Fund for a minimum of 16 days during the31-day period beginning 15 days before theex-dividend date of the Fund’s distribution to which the foreign taxes relate), or, as a tax deduction.
Foreign Source Income Per Share is the amount per share of income dividends attributable to foreign securities held by the Fund, plus any foreign taxes withheld on these dividends. The amounts reported include foreign source qualified dividends that have not been adjusted for the rate differential applicable to such dividend income.1
Foreign Source Qualified Dividends Per Share is the amount per share of foreign source qualified dividends plus any foreign taxes withheld on these dividends. These amounts represent the portion of the Foreign Source Income Per Share that were derived from qualified foreign securities held by the Fund.1
At the beginning of each calendar year, shareholders will receive Form1099-DIV which will include their share of taxes paid and foreign source income distributed during the prior calendar year. The Foreign Source Income reported on Form1099-DIV has not been adjusted for the rate differential on foreign source qualified dividend income. Shareholders are advised to check with their tax advisors for information on the treatment of these amounts on their individual income tax returns.
1Qualified dividends are taxed at reduced long term capital gains tax rates. In determining the amount of foreign tax credit that may be applied against the U.S. tax liability of individuals receiving foreign source qualified dividends, adjustments may be required to the foreign tax credit limitation calculation to reflect the rate differential applicable to such dividend income. The rules however permit certain individuals to elect not to apply the rate differential adjustments for capital gains and/or dividends for any taxable year. Please consult your tax advisor and the instructions to Form 1116 for more information.
| | | | |
franklintempleton.com | | Annual Report | | 167 |
FRANKLIN FUND ALLOCATOR SERIES
Board Members and Officers
The name, year of birth and address of the officers and board members, as well as their affiliations, positions held with the Trust, principal occupations during at least the past five years and number of U.S. registered portfolios overseen in the Franklin Templeton fund complex, are shown below. Generally, each board member serves until that person’s successor is elected and qualified.
Independent Board Members
| | | | | | | | |
Name, Year of Birth and Address | | Position | | Length of
Time Served | | Number of Portfolios in
Fund Complex Overseen by
Board Member* | | Other Directorships Held During at Least the Past 5 Years |
Harris J. Ashton (1932) | | Trustee | | Since 1995 | | 132 | | Bar-S Foods (meat packing company) |
One Franklin Parkway | | | | | | | | (1981-2010). |
San Mateo, CA 94403-1906 | | | | | | | | |
Principal Occupation During at Least the Past 5 Years: Director of various companies; andformerly,Director, RBC Holdings, Inc. (bank holding company) (until 2002); and President, Chief Executive Officer and Chairman of the Board, General Host Corporation (nursery and craft centers) (until 1998). |
Terrence J. Checki (1945) | | Trustee | | Since 2017 | | 111 | | Hess Corporation (exploration of oil and gas) (2014-present). |
One Franklin Parkway | | | | | | |
San Mateo, CA 94403-1906 | | | | | | | | |
Principal Occupation During at Least the Past 5 Years: Member of the Council on Foreign Relations (1996-present); Member of the National Committee on U.S.-China Relations (1999-present); member of the Board of Trustees of the Economic Club of New York (2013-present); member of the Board of Trustees of the Foreign Policy Association (2005-present) and member of various other boards of trustees and advisory boards; andformerly,Executive Vice President of the Federal Reserve Bank of New York and Head of its Emerging Markets and Internal Affairs Group and Member of Management Committee (1995-2014); and Visiting Fellow at the Council on Foreign Relations (2014). |
Mary C. Choksi (1950) | | Trustee | | Since 2014 | | 132 | | Avis Budget Group Inc. (car rental) (2007-present),Omnicom Group Inc. (advertising and marketing communications services) (2011-present) and White Mountains Insurance Group, Ltd. (holding company) (2017-present). |
One Franklin Parkway | | | | | | |
San Mateo, CA 94403-1906 | | | | | | |
| | | | | | |
| | | | | | |
| | | | | | |
| | | | | | |
Principal Occupation During at Least the Past 5 Years: Director of various companies; andformerly,Founder and Senior Advisor, Strategic Investment Group (investment management group) (2015-2017); Founding Partner and Senior Managing Director, Strategic Investment Group (1987-2015); Founding Partner and Managing Director, Emerging Markets Management LLC (investment management firm) (1987-2011); and Loan Officer/Senior Loan Officer/Senior Pension Investment Officer, World Bank Group (international financial institution) (1977-1987). |
Edith E. Holiday (1952) | | Lead | | Trustee since 1998 | | 132 | | Hess Corporation (exploration of oil and gas) (1993-present), Canadian National Railway (railroad) (2001-present), White Mountains Insurance Group, Ltd. (holding company) (2004-present), Santander Consumer USA Holdings, Inc. (consumer finance) (2016-present), RTI International Metals, Inc. (manufacture and distribution of titanium) (1999-2015) and H.J. Heinz Company (processed foods and allied products) (1994-2013). |
One Franklin Parkway | | Independent | | and Lead | | |
San Mateo, CA 94403-1906 | | Trustee | | Independent | | |
| | | | Trustee since | | |
| | | | March 2019 | | |
| | | | | | |
| | | | | | |
| | | | | | |
| | | | | | |
| | | | | | |
| | | | | | |
| | | | | | |
| | | | | | |
Principal Occupation During at Least the Past 5 Years:
Director or Trustee of various companies and trusts; andformerly,Assistant to the President of the United States and Secretary of the Cabinet (1990-1993); General Counsel to the United States Treasury Department (1989-1990); and Counselor to the Secretary and Assistant Secretary for Public Affairs and Public Liaison–United States Treasury Department (1988-1989).
| | | | |
| | | |
168 | | Annual Report | | franklintempleton.com |
FRANKLIN FUND ALLOCATOR SERIES
Independent Board Members(continued)
| | | | | | | | |
Name, Year of Birth and
Address | | Position | | Length of Time Served | | Number of Portfolios in
Fund Complex Overseen
by Board Member* | | Other Directorships Held
During at Least the Past 5 Years |
J. Michael Luttig (1954) | | Trustee | | Since 2009 | | 132 | | Boeing Capital Corporation (aircraft financing) (2006-2010). |
One Franklin Parkway | | | | | | |
San Mateo, CA 94403-1906 | | | | | | | | |
Principal Occupation During at Least the Past 5 Years: Private investor; andformerly,Counselor and Senior Advisor to the Chairman, CEO, and Board of Directors, of The Boeing Company (aerospace company), and member of the Executive Council (May 2019-January 1, 2020); Executive Vice President, General Counsel and member of the Executive Council, The Boeing Company (2006-2019); and Federal Appeals Court Judge, United States Court of Appeals for the Fourth Circuit (1991-2006). |
Larry D. Thompson (1945) | | Trustee | | Since 2007 | | 132 | | The Southern Company (energy company) (2014-present; previously 2010-2012), Graham Holdings Company (education and media organization) (2011-present) and Cbeyond, Inc. (business communications provider) (2010-2012). |
One Franklin Parkway | | | | | | |
San Mateo, CA 94403-1906 | | | | | | |
| | | | | | |
| | | | | | |
| | | | | | |
| | | | | | |
| | | | | | |
Principal Occupation During at Least the Past 5 Years: Director of various companies; Counsel, Finch McCranie, LLP (law firm) (2015-present); Independent Compliance Monitor and Auditor, Volkswagen AG (manufacturer of automobiles and commercial vehicles) (2017-present); John A. Sibley Professor of Corporate and Business Law, University of Georgia School of Law (2015-present; previously 2011-2012); andformerly,Executive Vice President – Government Affairs, General Counsel and Corporate Secretary, PepsiCo, Inc. (consumer products) (2012-2014); Senior Vice President – Government Affairs, General Counsel and Secretary, PepsiCo, Inc. (2004-2011); Senior Fellow of The Brookings Institution (2003-2004); Visiting Professor, University of Georgia School of Law (2004); and Deputy Attorney General, U.S. Department of Justice (2001-2003). Interested Board Members and Officers |
| | | Position | | Length of Time
Served | | Number of Portfolios in Fund
Complex Overseen by Board
Member* | | Other Directorships Held During at Least the Past 5 Years |
**Gregory E. Johnson (1961) | | Trustee | | Since 2007 | | 144 | | None |
One Franklin Parkway | | | | | | | | |
San Mateo, CA 94403-1906 | | | | | | | | |
Principal Occupation During at Least the Past 5 Years: Chairman of the Board, Member – Office of the Chairman, Director and Chief Executive Officer, Franklin Resources, Inc.; officer and/or director or trustee, as the case may be, of some of the other subsidiaries of Franklin Resources, Inc. and of 39 of the investment companies in Franklin Templeton; Vice Chairman, Investment Company Institute; andformerly,President, Franklin Resources, Inc. (1994-2015). |
**Rupert H. Johnson, Jr. (1940) | | Chairman of | | Since 2013 | | 132 | | None |
One Franklin Parkway | | the Board | | | | | | |
San Mateo, CA 94403-1906 | | and Trustee | | | | | | |
Principal Occupation During at Least the Past 5 Years: Vice Chairman, Member – Office of the Chairman and Director, Franklin Resources, Inc.; Director, Franklin Advisers, Inc. and officer and/or director or trustee, as the case may be, of some of the other subsidiaries of Franklin Resources, Inc. and of 37 of the investment companies in Franklin Templeton. |
Alison E. Baur (1964) | | Vice President | | Since 2012 | | Not Applicable | | Not Applicable |
One Franklin Parkway | | | | | | | | |
San Mateo, CA 94403-1906 | | | | | | | | |
Principal Occupation During at Least the Past 5 Years:
Deputy General Counsel, Franklin Templeton; and officer of some of the other subsidiaries of Franklin Resources, Inc. and of 41 of the investment companies in Franklin Templeton.
| | | | |
franklintempleton.com | | Annual Report | | 169 |
FRANKLIN FUND ALLOCATOR SERIES
Interested Board Members and Officers(continued)
| | | | | | | | |
| | | Position | | Length of
Time Served | | Number of Portfolios in
Fund Complex Overseen
by Board Member* | | Other Directorships Held
During at Least the Past 5 Years |
Breda M. Beckerle (1958) | | Interim Chief | | Since January | | Not Applicable | | Not Applicable |
280 Park Avenue | | Compliance | | 2009 | | | | |
New York, NY 10017 | | Officer | | | | | | |
Principal Occupation During at Least the Past 5 Years: Chief Compliance Officer, Fiduciary Investment Management International, Inc., Franklin Advisers, Inc., Franklin Advisory Services, LLC, Franklin Mutual Advisers, LLC, Franklin Templeton Institutional, LLC; and officer of 41 of the investment companies in Franklin Templeton. |
Gaston Gardey (1967) | | Treasurer, | | Since 2009 | | Not Applicable | | Not Applicable |
One Franklin Parkway | | Chief Financial | | | | | | |
San Mateo, CA 94403-1906 | | Officer and | | | | | | |
| | Chief | | | | | | |
| | Accounting | | | | | | |
| | Officer | | | | | | |
Principal Occupation During at Least the Past 5 Years: Treasurer, U.S. Fund Administration & Reporting, and officer of 24 of the investment companies in Franklin Templeton. |
Steven J. Gray (1955) | | Vice President | | Vice President | | Not Applicable | | Not Applicable |
One Franklin Parkway | | and | | since 2009 | | | | |
San Mateo, CA 94403-1906 | | Co-Secretary | | andCo-Secretary | | | | |
| | | | since 2019 | | | | |
Principal Occupation During at Least the Past 5 Years: Senior Associate General Counsel, Franklin Templeton; Vice President, Franklin Templeton Distributors, Inc. and FASA, LLC; and officer of 41 of the investment companies in Franklin Templeton. |
| Matthew T. Hinkle (1971) | | Chief Executive | | Since 2017 | | Not Applicable | | Not Applicable |
| One Franklin Parkway | | Officer – | | | | | | |
| San Mateo, CA 94403-1906 | | Finance and | | | | | | |
| | Administration | | | | | | |
Principal Occupation During at Least the Past 5 Years: Senior Vice President, Franklin Templeton Services, LLC; officer of 41 of the investment companies in Franklin Templeton; andformerly,VicePresident, Global Tax (2012-April 2017) and Treasurer/Assistant Treasurer, Franklin Templeton (2009-2017). |
Robert Lim (1948) | | Vice President | | Since 2016 | | Not Applicable | | Not Applicable |
One Franklin Parkway | | – AML | | | | | | |
San Mateo, CA 94403-1906 | | Compliance | | | | | | |
Principal Occupation During at Least the Past 5 Years: Vice President, Franklin Templeton Companies, LLC; Chief Compliance Officer, Franklin Templeton Distributors, Inc. and Franklin Templeton Investor Services, LLC; and officer of 41 of the investment companies in Franklin Templeton. |
Edward D. Perks (1970) | | President and | | Since 2018 | | Not Applicable | | Not Applicable |
One Franklin Parkway | | Chief Executive | | | | | | |
San Mateo, CA 94403-1906 | | Officer – | | | | | | |
| | Investment | | | | | | |
| | Management | | | | | | |
Principal Occupation During at Least the Past 5 Years: President and Director, Franklin Advisers, Inc.; and officer of eight of the investment companies in Franklin Templeton (since December 2018). |
Navid J. Tofigh (1972) | | Vice President | | Since 2015 | | Not Applicable | | Not Applicable |
One Franklin Parkway | | | | | | | | |
San Mateo, CA 94403-1906 | | | | | | | | |
Principal Occupation During at Least the Past 5 Years:
Associate General Counsel, and officer of 41 of the investment companies in Franklin Templeton.
| | | | |
| | | |
170 | | Annual Report | | franklintempleton.com |
FRANKLIN FUND ALLOCATOR SERIES
Interested Board Members and Officers(continued)
| | | | | | | | |
| | | Position | | Length of Time Served | | Number of Portfolios in
Fund Complex Overseen by Board Member* | | Other Directorships Held
During at Least the Past 5 Years |
Craig S. Tyle (1960) | | Vice President | | Since 2005 | | Not Applicable | | Not Applicable |
One Franklin Parkway | | | | | | | | |
San Mateo, CA 94403-1906 | | | | | | | | |
Principal Occupation During at Least the Past 5 Years: General Counsel, Executive Vice President, Franklin Resources, Inc.; and officer of some of the other subsidiaries of Franklin Resources, Inc. and of 41 of the investment companies in Franklin Templeton. |
Lori A. Weber (1964) | | Vice President | | Vice President | | Not Applicable | | Not Applicable |
300 S.E. 2nd Street | | and | | since 2011 | | | | |
Fort Lauderdale, FL 33301-1923 | | Co-Secretary | | andCo-Secretary | | | | |
| | | | since 2019 | | | | |
Principal Occupation During at Least the Past 5 Years:
Senior Associate General Counsel, Franklin Templeton; Assistant Secretary, Franklin Resources, Inc.; Vice President and Secretary, Templeton Investment Counsel, LLC; and officer of 41 of the investment companies in Franklin Templeton.
*We base the number of portfolios on each separate series of the U.S. registered investment companies within the Franklin Templeton fund complex. These portfolios have a common investment manager or affiliated investment managers.
**Gregory E. Johnson is considered to be an interested person of the Fund under the federal securities laws due to his position as an officer and director of Franklin Resources, Inc. (Resources), which is the parent company of the Fund’s investment manager and distributor. Rupert H. Johnson, Jr. is considered to be an interested person of the Fund under the federal securities laws due to his position as an officer and director and major shareholder of Resources.
Note 1: Rupert H. Johnson, Jr. is the uncle of Gregory E. Johnson.
Note 2: Effective March 12, 2019, John B. Wilson ceased to be a trustee of the Trust.
Note 3: Officer information is current as of the date of this report. It is possible that after this date, information about officers may change.
The Sarbanes-Oxley Act of 2002 and Rules adopted by the Securities and Exchange Commission require the Fund to disclose whether the Fund’s Audit Committee includes at least one member who is an audit committee financial expert within the meaning of such Act and Rules. The Fund’s Board has determined that there is at least one such financial expert on the Audit Committee and has designated Mary C. Choksi as its audit committee financial expert. The Board believes that Ms. Choksi qualifies as such an expert in view of her extensive business background and experience. She currently serves as a director of Avis Budget Group, Inc. (2007-present) and formerly, Founder and Senior Advisor, Strategic Investment Group (1987 to 2017). Ms. Choksi has been a Member of the Fund’s Audit Committee since 2014. As a result of such background and experience, the Board believes that Ms. Choksi has acquired an understanding of generally accepted accounting principles and financial statements, the general application of such principles in connection with the accounting estimates, accruals and reserves, and analyzing and evaluating financial statements that present a breadth and level of complexity of accounting issues generally comparable to those of the Fund, as well as an understanding of internal controls and procedures for financial reporting and an understanding of audit committee functions. Ms. Choksi is an independent Board member as that term is defined under the relevant Securities and Exchange Commission Rules and Releases.
The Statement of Additional Information (SAI) includes additional information about the board members and is available, without charge, upon request. Shareholders may call (800) DIALBEN/342-5236 to request the SAI.
| | | | |
franklintempleton.com | | Annual Report | | 171 |
FRANKLIN FUND ALLOCATOR SERIES
Shareholder Information
Proxy Voting Policies and Procedures
The Trust’s investment manager has established Proxy Voting Policies and Procedures (Policies) that the Trust uses to determine how to vote proxies relating to portfolio securities. Shareholders may view the Trust’s complete Policies online at franklintempleton.com. Alternatively, shareholders may request copies of the Policies free of charge by calling the Proxy Group collect at (954)527-7678 or by sending a written request to: Franklin Templeton Companies, LLC, 300 S.E. 2nd Street, Fort Lauderdale, FL 33301, Attention: Proxy Group. Copies of the Trust’s proxy voting records are also made available online at franklintempleton.com and posted on the U.S. Securities and Exchange Commission’s website at sec.gov and reflect the most recent12-month period ended June 30.
Quarterly Statement of Investments
The Trust files a complete statement of investments with the U.S. Securities and Exchange Commission for the first and third quarters for each fiscal year as an exhibit to its report on FormN-PORT. Shareholders may view the filed FormN-PORT by visiting the Commission’s website at sec.gov. The filed form may also be viewed and copied at the Commission’s Public Reference Room in Washington, DC. Information regarding the operations of the Public Reference Room may be obtained by calling(800) SEC-0330.
Householding of Reports and Prospectuses
You will receive each Fund’s financial reports every six months as well as an annual updated summary prospectus (prospectus available upon request). To reduce Fund expenses, we try to identify related shareholders in a household and send only one copy of the financial reports and summary prospectus. This process, called “householding,” will continue indefinitely unless you instruct us otherwise. If you prefer not to have these documents householded, please call us at (800)632-2301. At any time you may view current prospectuses/summary prospectuses and financial reports on our website. If you choose, you may receive these documents through electronic delivery.
| | | | |
| | | |
172 | | Annual Report | | franklintempleton.com |
Authorized for distribution only when accompanied or preceded by a summary prospectus and/or prospectus. Investors should carefully consider a fund’s investment goals, risks, charges and expenses before investing. A prospectus contains this and other information; please read it carefully before investing.
To help ensure we provide you with quality service, all calls to and from our service areas are monitored and/or recorded.
| | | | | | |
| | | Annual Report and Shareholder Letter Franklin Fund Allocator Series | | |
| | Investment Manager | | Distributor | | Shareholder Services |
| | Franklin Advisers, Inc. | | Franklin Templeton Distributors, Inc. | | (800)632-2301 |
| | | | (800) DIAL BEN®/342-5236 | | |
| | | | franklintempleton.com | | |
| | |
| © 2020 Franklin Templeton Investments. All rights reserved. | | RTF A 02/20 |
Item 2. Code of Ethics.
(a) The Registrant has adopted a code of ethics that applies to its principal executive officers and principal financial and accounting officer.
(c) N/A
(d) N/A
(f) Pursuant to Item 13(a)(1), the Registrant is attaching as an exhibit a copy of its code of ethics that applies to its principal executive officers and principal financial and accounting officer.
Item 3. Audit Committee Financial Expert.
(a)(1) The Registrant has an audit committee financial expert serving on its audit committee.
(2) The audit committee financial expert is Mary C. Choksi and she is “independent” as defined under the relevant Securities and Exchange Commission Rules and Releases.
Item 4. Principal Accountant Fees and Services.
(a) Audit Fees
The aggregate fees paid to the principal accountant for professional services rendered by the principal accountant for the audit of the registrant’s annual financial statements or for services that are normally provided by the principal accountant in connection with statutory and regulatory filings or engagements were $387,483 for the fiscal year ended December 31, 2019 and $352,507 for the fiscal year ended December 31, 2018.
(b) Audit-Related Fees
There were no fees paid to the principal accountant for assurance and related services rendered by the principal accountant to the registrant that are reasonably related to the performance of the audit of the registrant’s financial statements and are not reported under paragraph (a) of Item 4.
There were no fees paid to the principal accountant for assurance and related services rendered by the principal accountant to the registrant’s investment adviser and any entity controlling, controlled by or under common control with the investment adviser that provides ongoing services to the registrant that are reasonably related to the performance of the audit of their financial statements.
(c) Tax Fees
There were no fees paid to the principal accountant for professional services rendered by the principal accountant to the registrant for tax compliance, tax advice and tax planning.
The aggregate fees paid to the principal accountant for professional services rendered by the principal accountant to the registrant’s investment adviser and any entity controlling, controlled by or under common control with the investment adviser that provides ongoing services to the registrant for tax compliance, tax advice and tax planning were $20,000 for the fiscal year ended December 31, 2019 and $5,000 for the fiscal year ended December 31, 2018. The services for which these fees were paid included professional fees in connection with an Indonesia withholding tax refund claim, professional fees in connection with tax treatment of equipment lease transactions, and tax consulting services related to the operating agreement and term sheet for the launch of a new fund.
(d) All Other Fees
The aggregate fees paid to the principal accountant for products and services rendered by the principal accountant to the registrant not reported in paragraphs (a)-(c) of Item 4 were $0 for the fiscal year ended December 31, 2019 and $3,853 for the fiscal year ended December 31, 2018. The services for which these fees were paid included review of materials provided to the fund Board in connection with the investment management contract renewal process.
The aggregate fees paid to the principal accountant for products and services rendered by the principal accountant to the registrant’s investment adviser and any entity controlling, controlled by or under common control with the investment adviser that provides ongoing services to the registrant not reported in paragraphs (a)-(c) of Item 4
were $160,144 for the fiscal year ended December 31, 2019 and $16,500 for the fiscal year ended December 31, 2018. The services for which these fees were paid included benchmarking services in connection with the ICI TA Survey, valuation services related to Fair Value engagement, the issuance of an Auditor’s Certificate for South Korean regulatory shareholders disclosures, and assets under management certification.
(e) (1) The registrant’s audit committee is directly responsible for approving the services to be provided by the auditors, including:
(i)pre-approval of all audit and audit related services;
(ii)pre-approval of allnon-audit related services to be provided to the Fund by the auditors;
(iii)pre-approval of allnon-audit related services to be provided to the registrant by the auditors to the registrant’s investment adviser or to any entity that controls, is controlled by or is under common control with the registrant’s investment adviser and that provides ongoing services to the registrant where thenon-audit services relate directly to the operations or financial reporting of the registrant; and
(iv) establishment by the audit committee, if deemed necessary or appropriate, as an alternative to committeepre-approval of services to be provided by the auditors, as required by paragraphs (ii) and (iii) above, of policies and procedures to permit such services to bepre-approved by other means, such as through establishment of guidelines or by action of a designated member or members of the committee; provided the policies and procedures are detailed as to the particular service and the committee is informed of each service and such policies and procedures do not include delegation of audit committee responsibilities, as contemplated under the Securities Exchange Act of 1934, to management; subject, in the case of (ii) through (iv), to any waivers, exceptions or exemptions that may be available under applicable law or rules.
(e) (2) None of the services provided to the registrant described in paragraphs (b)-(d) of Item 4 were approved by the audit committee pursuant to paragraph (c)(7)(i)(C) of Rule2-01 of regulationS-X.
(f) No disclosures are required by this Item 4(f).
(g) The aggregatenon-audit fees paid to the principal accountant for services rendered by the principal accountant to the registrant and the registrant’s investment adviser and any entity controlling, controlled by or under common control with the investment adviser that provides ongoing services to the registrant were $180,144 for the fiscal year ended December 31, 2019 and $25,353 for the fiscal year ended December 31, 2018.
(h) The registrant’s audit committee of the board has considered whether the provision ofnon-audit services that were rendered to the registrant’s investment adviser (not including anysub-adviser whose role is primarily portfolio management and is subcontracted with or overseen by another investment adviser), and any entity controlling, controlled by, or under common control with the investment adviser that provides ongoing services to the registrant that were notpre-approved pursuant to paragraph (c)(7)(ii) of Rule2-01 of RegulationS-X is compatible with maintaining the principal accountant’s independence.
Item 5. Audit Committee of Listed Registrants. N/A
Item 6. Schedule of Investments. N/A
Item 7. Disclosure of Proxy Voting Policies and Procedures for Closed-End Management Investment Companies. N/A
Item 8. Portfolio Managers ofClosed-End Management Investment Companies. N/A
Item 9. Purchases of Equity Securities byClosed-End Management Investment Company and Affiliated Purchasers. N/A
Item 10. Submission of Matters to a Vote of Security Holders.
There have been no changes to the procedures by which shareholders may recommend nominees to the Registrant’s Board of Trustees that would require disclosure herein.
Item 11. Controls and Procedures.
(a) Evaluation of Disclosure Controls and Procedures. The Registrant maintains disclosure controls and procedures that are designed to provide reasonable assurance that information required to be disclosed in the Registrant’s filings under the Securities Exchange Act of 1934, as amended, and the Investment Company Act of 1940 is recorded, processed, summarized and reported within the periods specified in the rules and forms of the Securities and Exchange Commission. Such information is accumulated and communicated to the Registrant’s management, including its principal executive officer and principal financial officer, as appropriate, to allow timely decisions regarding required disclosure. The Registrant’s management, including the principal executive officer and the principal financial officer, recognizes that any set of controls and procedures, no matter how well designed and operated, can provide only reasonable assurance of achieving the desired control objectives.
Within 90 days prior to the filing date of this Shareholder Report onForm N-CSR, the Registrant had carried out an evaluation, under the supervision and with the participation of the Registrant’s management, including the Registrant’s principal executive officer and the Registrant’s principal financial officer, of the effectiveness of the design and operation of the Registrant’s disclosure controls and procedures. Based on such evaluation, the Registrant’s principal executive officer and principal financial officer concluded that the Registrant’s disclosure controls and procedures are effective.
(b) Changes in Internal Controls. There have been no changes in the Registrant’s internal control over financial reporting that occurred during the period covered by this report that has materially affected, or is reasonably likely to materially affect the internal control over financial reporting.
Item 12. Disclosure of Securities Lending Activities forClosed-End Management Investment Company. N/A
Item 13. Exhibits.
(a) (1) Code of Ethics
(a) (2) Certifications pursuant to Section 302 of the Sarbanes-Oxley Act of 2002 of Matthew T. Hinkle, Chief Executive Officer - Finance and Administration, and Gaston Gardey, Chief Financial Officer and Chief Accounting Officer
(b) Certifications pursuant to Section 906 of the Sarbanes-Oxley Act of 2002 of Matthew T. Hinkle, Chief Executive Officer - Finance and Administration, and Gaston Gardey, Chief Financial Officer and Chief Accounting Officer
SIGNATURES
Pursuant to the requirements of the Securities Exchange Act of 1934 and the Investment Company Act of 1940, the registrant has duly caused this report to be signed on its behalf by the undersigned, thereunto duly authorized.
| | |
| FRANKLIN FUND ALLOCATOR SERIES |
| |
| By | | S\ MATTHEW T. HINKLE |
| | Matthew T. Hinkle |
| | Chief Executive Officer - Finance and Administration |
Date February 28, 2020
Pursuant to the requirements of the Securities Exchange Act of 1934 and the Investment Company Act of 1940, this report has been signed below by the following persons on behalf of the registrant and in the capacities and on the dates indicated.
| | |
| By | | S\ MATTHEW T. HINKLE |
| | Matthew T. Hinkle |
| | Chief Executive Officer – Finance and Administration |
| Date February 28, 2020 |
| | |
| By | | S\ GASTON GARDEY |
| | Gaston Gardey |
| | Chief Financial Officer and Chief Accounting Officer |
Date February 28, 2020 |