Table of Contents
| (Mark One) | ||
| x | REGISTRATION STATEMENT PURSUANT TO SECTION 12(b) OR 12(g) OF THE SECURITIES EXCHANGE ACT OF 1934 | |
| OR | ||
| o | ANNUAL REPORT PURSUANT TO SECTION 13 OR 15(d) OF THE SECURITIES EXCHANGE ACT OF 1934 | |
| For the fiscal year | ||
| OR | ||
| o | TRANSITION REPORT PURSUANT TO SECTION 13 OR 15(d) OF THE SECURITIES EXCHANGE ACT OF 1934 | |
| For the transition period from to | ||
| OR | ||
| o | SHELL COMPANY REPORT PURSUANT TO SECTION 13 OR 15(d) OF THE SECURITIES EXCHANGE ACT OF 1934 | |
| Date of event requiring this shell company report | ||
| Japan (Jurisdiction of incorporation or organization) | 1-2, Marunouchi 1-chome, Chiyoda-ku, Tokyo 100-0005, Japan (Address of principal executive offices) |
1-2, Marunouchi 1-chome, Chiyoda-ku, Tokyo 100-0005, Japan
Telephone: +81-3-3282-8111 Facsimile: +81-3-4333-9954
Theodore A. Paradise, Esq.
Michael T. Dunn, Esq.
Davis Polk & Wardwell LLP
Izumi Garden Tower 33F, 1-6-1 Roppongi, Minato-ku, Tokyo 106-6033, Japan
Telephone: +81-3-5561-4421 Facsimile: +81-3-5561-4425
| Title of Each Class | Name of Each Exchange on which Registered | |
| Common stock, without par value | The New York Stock Exchange* |
stock.
None
None
covered by the annual report.
At March 31, 2010, the following shares of capital stock were outstanding: (1) 1,414,055,625 shares of common stock (including
17,070,300 shares of common stock held by the registrant and its consolidated subsidiaries and equity-method associates as treasury stock),
and (2) 70,001 shares of first series Type 6 preferred stock.
| Indicate by check mark if the registrant is a well-known seasoned issuer, as defined in Rule 405 of the Securities Act. | Yes o | No x | ||||||
| If this report is an annual or transition report, indicate by check mark if the registrant is not required to file reports pursuant to Section 13 or 15(d) of the Securities Exchange Act of 1934. | Yes o | No o | ||||||
| Indicate by check mark whether the registrant: (1) has filed all reports required to be filed by Section 13 or 15(d) of the Securities Exchange Act of 1934 during the preceding 12 months (or for such shorter period that the registrant was required to file such reports), and (2) has been subject to such filing requirements for the past 90 days. | Yes o | No x | ||||||
| Indicate by check mark whether the registrant has submitted electronically and posted on its corporate Web site, if any, every Interactive Data File required to be submitted and posted pursuant to Rule 405 of Regulation S-T during the preceding 12 months (or for such shorter period that the registrant was required to submit and post such files). | Yes o | No o | ||||||
| Indicate by check mark whether the registrant is a large accelerated filer, an accelerated filer, or a non-accelerated filer. See definition of | ||||||||
| “accelerated filer and large accelerated filer” in Rule 12b-2 of the Exchange Act. (Check one): | Large Accelerated Filer o Accelerated Filer o Non-Accelerated Filer x | |||||||
| Indicate by check mark which basis of accounting the registrant has used to prepare the financial statements included in this filing. | ||||||||
| U.S. GAAP o International Financial Reporting Standards as issued by the International Accounting Standards Board x | Other o | |||||||
| If “Other” has been checked in response to the previous question, indicate by check mark which financial statement item the registrant has elected to follow. | Item 17 o | Item 18 o | ||||||
| If this is an annual report, indicate by check mark whether the registrant is a shell company (as defined in Rule 12b-2 of the Exchange Act). | Yes o | No o | ||||||
Table of Contents
i
Table of Contents
ii
Table of Contents
PRESENTATION OF FINANCIAL INFORMATION
1
Table of Contents
| • | the fragility of any economic recovery, both globally and in Japan; |
| • | declines in the value of our securities portfolio; |
| • | insufficient liquidity; |
| • | problems of other financial institutions; |
| • | constraints on our operations due to capital adequacy requirements; |
| • | changes in capital adequacy requirements and in laws and regulations affecting our business; |
| • | regulatory limits on the amount of deferred tax assets which may be included in our and the Bank’s regulatory capital; |
| • | a significant downgrade of the Bank’s credit rating; |
| • | incurrence of significant credit-related costs; |
| • | our ability to successfully implement our business and capital strategy; |
| • | changes in interest rates and exchange rates; |
| • | exposure to new risks as we expand the scope of our business; |
| • | the success of our business alliances including those in the consumer finance industry; |
| • | failure to hire and retain qualified employees; |
| • | failure to protect or properly control personal information; |
| • | regulatory sanctions; and |
| • | suspension or limitation of dividends on the shares, depending on our financial condition. |
2
Table of Contents
3
Table of Contents
| For the fiscal year ended and at March 31, | ||||||||
| 2010 | 2009 | |||||||
| (In millions, except per share data) | ||||||||
Consolidated income statement data: | ||||||||
| Interest income | ¥ | 1,766,047 | ¥ | 2,164,048 | ||||
| Interest expense | 346,810 | 676,293 | ||||||
| Net interest income | 1,419,237 | 1,487,755 | ||||||
| Fee and commission income | 650,437 | 570,603 | ||||||
| Fee and commission expense | 121,716 | 116,240 | ||||||
| Net fee and commission income | 528,721 | 454,363 | ||||||
| Net trading income | 330,130 | 134,298 | ||||||
| Net income (loss) from financial assets at fair value through profit or loss | 75,579 | (17,951 | ) | |||||
| Net investment income | 178,552 | 159,511 | ||||||
| Other income | 232,334 | 193,119 | ||||||
| Total operating income | 2,764,553 | 2,411,095 | ||||||
| Impairment charges on financial assets | 258,641 | 1,240,710 | ||||||
| Net operating income | 2,505,912 | 1,170,385 | ||||||
| General and administrative expenses | 1,096,957 | 992,487 | ||||||
| Other expenses | 236,760 | 261,770 | ||||||
| Operating expenses | 1,333,717 | 1,254,257 | ||||||
| Share of post-tax loss in associates and joint ventures | 37,461 | 54,318 | ||||||
| Profit (loss) before tax | 1,134,734 | (138,190 | ) | |||||
| Income tax expense (benefit) | 488,041 | (56,166 | ) | |||||
| Net profit (loss) for the fiscal year | ¥ | 646,693 | ¥ | (82,024 | ) | |||
| Profit (loss) attributable to: | ||||||||
| Shareholders of Sumitomo Mitsui Financial Group, Inc. | ¥ | 528,692 | ¥ | (154,954 | ) | |||
| Non-controlling interests | 118,001 | 72,930 | ||||||
| Earnings per share: | ||||||||
| Basic | ¥ | 512 | ¥ | (214 | ) | |||
| Diluted | 482 | (260 | ) | |||||
| Weighted average number of common stocks in issue (in thousands of shares) | 1,017,066 | 772,349 | ||||||
| Dividends per share in respect of each fiscal year: | ||||||||
| Common stock | ¥ | 65 | ¥ | 140 | ||||
| $ | 0.70 | $ | 1.43 | |||||
4
Table of Contents
| For the fiscal year ended and at March 31, | ||||||||
| 2010 | 2009 | |||||||
| (In millions, except per share data) | ||||||||
| Preferred stock (Type 4): | ||||||||
| First series | ¥ | 135,000 | ¥ | 135,000 | ||||
| $ | 1,451 | $ | 1,374 | |||||
| Second series | ¥ | 135,000 | ¥ | 135,000 | ||||
| $ | 1,451 | $ | 1,374 | |||||
| Third series | ¥ | 135,000 | ¥ | 135,000 | ||||
| $ | 1,451 | $ | 1,374 | |||||
| Fourth series | ¥ | 135,000 | ¥ | 135,000 | ||||
| $ | 1,451 | $ | 1,374 | |||||
| Ninth series | ¥ | 135,000 | ¥ | 135,000 | ||||
| $ | 1,451 | $ | 1,374 | |||||
| Tenth series | ¥ | 135,000 | ¥ | 135,000 | ||||
| $ | 1,451 | $ | 1,374 | |||||
| Eleventh series | ¥ | 135,000 | ¥ | 135,000 | ||||
| $ | 1,451 | $ | 1,374 | |||||
| Twelfth series | ¥ | 135,000 | ¥ | 135,000 | ||||
| $ | 1,451 | $ | 1,374 | |||||
| Preferred stock (Type 6) | ¥ | 88,500 | ¥ | 88,500 | ||||
| $ | 951 | $ | 901 | |||||
Consolidated statement of financial position data: | ||||||||
| Total assets | ¥ | 122,992,929 | ¥ | 119,334,876 | ||||
| Loans and advances | 71,634,128 | 74,669,294 | ||||||
| Total liabilities | 115,431,259 | 114,418,861 | ||||||
| Deposits | 85,697,973 | 83,231,234 | ||||||
| Borrowings | 7,321,484 | 6,423,003 | ||||||
| Total equity | 7,561,670 | 4,916,015 | ||||||
| Capital stock | 2,337,896 | 1,370,777 | ||||||
5
Table of Contents
| High | Low | Period end | Average(1) | |||||||||||||
| (Yen per dollar) | ||||||||||||||||
Fiscal year ended March 31, | ||||||||||||||||
| 2006 | ¥ | 121.12 | ¥ | 104.76 | ¥ | 117.48 | ¥ | 116.96 | ||||||||
| 2007 | 121.79 | 109.62 | 118.09 | 113.80 | ||||||||||||
| 2008 | 123.95 | 97.05 | 100.19 | 114.13 | ||||||||||||
| 2009 | 110.29 | 87.47 | 98.23 | 100.68 | ||||||||||||
| 2010 | 100.76 | 86.31 | 93.05 | 92.61 | ||||||||||||
| Most recent six months: | ||||||||||||||||
| April | 94.43 | 92.09 | 94.04 | 93.42 | ||||||||||||
| May | 93.64 | 90.00 | 91.35 | 91.71 | ||||||||||||
| June | 92.78 | 88.52 | 88.52 | 90.93 | ||||||||||||
| July | 89.02 | 86.62 | 86.67 | 87.75 | ||||||||||||
| August | 86.68 | 84.36 | 84.56 | 85.50 | ||||||||||||
| September | 85.85 | 83.43 | 83.80 | 84.46 | ||||||||||||
| October (through October 15, 2010) | 83.55 | 81.57 | 81.59 | 82.65 | ||||||||||||
| (1) | Average exchange rates have been calculated by using the average of the exchange rates on the last day of each month during a fiscal year, except for the monthly average rate, which represents the average of the exchange rates for each day of that month. |
6
Table of Contents
| At | ||||
| March 31, 2010 | ||||
| (In millions) | ||||
Indebtedness: | ||||
| Borrowings | ¥ | 7,321,484 | ||
| Debt securities in issue: | ||||
| Commercial paper | 1,885,640 | |||
Bonds(1) | 1,191,051 | |||
| Subordinated bonds | 2,228,192 | |||
| Others | 18,273 | |||
| Total debt securities in issue | 5,323,156 | |||
Equity: | ||||
| Capital stock | 2,337,896 | |||
| Preferred stock: | ||||
| Authorized 684,101 shares; Issued and outstanding 70,001 shares | ||||
| Common stock: | ||||
Authorized 1,500,000,000 shares; Issued 1,414,055,625 shares(2)(3)(4) | ||||
| Capital surplus | 1,081,432 | |||
| Retained earnings | 1,663,618 | |||
| Other reserves | 555,289 | |||
| Treasury Stock | (124,062 | ) | ||
| Non-controlling interests | 2,047,497 | |||
| Total equity | 7,561,670 | |||
Total capitalization and indebtedness(2) | ¥ | 122,992,929 | ||
| (1) | On July 22, 2010, the Bank issued an aggregate principal amount of $1 billion of senior bonds due on July 22, 2013, or the 3-year bonds, and an aggregate principal amount of $1 billion of senior bonds due on July 22, 2015, or the 5-year bonds. These bonds bear interest commencing July 22, 2010, at an annual rate of 2.15% for the 3-year bonds and 3.15% for the 5-year bonds, payable semiannually in arrears on January 22 and July 22 of each year, with the first interest payment to be made on January 22, 2011. | |
| (2) | All of the issued shares of capital stock are outstanding, except for 3,730,100 shares of common stock we held as treasury stock as of March 31, 2010. As of March 31, 2010, the Bank held 13,340,000 shares and Nikko Cordial Securities held 200 shares of our common stock, the voting rights of which cannot be exercised by these entities. | |
| (3) | The number of shares of our common stock increased by 219,700,000 as a result of an offering on June 22, 2009 and 340,000,000 as a result of an offering on January 27, 2010. Except as disclosed in this registration statement, there has been no material change in our consolidated capitalization and indebtedness since March 31, 2010. | |
| (4) | At the shareholders meeting held on June 29, 2010, we amended our articles of incorporation to increase the total number of authorized shares of common stock from 1,500,000,000 to 3,000,000,000 and to delete the provision regarding 50,100 shares of authorized preferred stock (Type 4). Accordingly, the total number authorized shares was increased from 1,500,684,101 to 3,000,634,001. |
7
Table of Contents
8
Table of Contents
| • | net losses; |
9
Table of Contents
| • | increase of risk-weighted assets as a result of expansion of the business, strategic investments or rise in parameters including probability of defaults; | ||
| • | declines in the value of securities; and | ||
| • | an inability to refinance subordinated debt obligations. |
10
Table of Contents
| • | we may have to accept less favorable terms in our transactions with counterparties, including capital raising activities, or may be unable to enter into certain transactions; | ||
| • | our hybrid securities procurement cost may increase; | ||
| • | foreign regulatory bodies may impose restrictions on our overseas operations; | ||
| • | existing agreements or transactions may be cancelled; and | ||
| • | we may be required to provide additional collateral in connection with derivatives transactions. |
11
Table of Contents
12
Table of Contents
13
Table of Contents
14
Table of Contents
15
Table of Contents
16
Table of Contents
17
Table of Contents
| • | banking groups, including Japan’s other major banking groups; | ||
| • | government-controlled and government-affiliated entities; | ||
| • | regional banking institutions; | ||
| • | major investment banks; | ||
| • | non-bank finance companies; and | ||
| • | other financial services providers. |
18
Table of Contents
19
Table of Contents
20
Table of Contents
| • | to provide optimum added value to our customers and together with them achieve growth; | ||
| • | to create sustainable shareholder value through business growth; and |
| • | to provide a challenging and professionally rewarding work environment for our dedicated employees. |
| • | to strive to increase shareholder value and simultaneously maintain healthy relationships with our customers, employees and other important stakeholders; | ||
| • | to give utmost consideration to people’s trust in our company, abide by laws and regulations, maintain a high ethical standard, and act fairly and sincerely; | ||
| • | to acquire and continuously enhance our knowledge, ability and intelligence, increase productivity in all areas of our business and provide superior financial services at competitive prices; | ||
| • | to establish a top-brand company on a global basis by understanding the needs of each customer and providing valuable services according to the changing needs of our customers; | ||
| • | to efficiently implement the goals of our business strategy in order to become a leader in selected markets by strategically allocating managerial resources; | ||
| • | to proactively promote innovation and creativity in all business areas in order to stay ahead of our competitors; | ||
| • | to build a strong organization based on market principles and rational thinking which reflect diverse values and delegate internal authority under a strict risk management system so as to enable rapid decisions and efficient business execution; and | ||
| • | to promote the growth of our business through the development of our employees by setting high targets and using objective evaluation and compensation systems which emphasize ability and achievement of good results. |
21
Table of Contents
22
Table of Contents
| • | Housing Loans. Housing loans, which are principally secured by collateral or supported by guarantees, are one of the primary products offered by the Consumer Banking Unit. Housing loans are an important product for banks because demand is stable while credit costs tend to be low. The Bank employs a credit assessment model based on credit data amassed and analyzed by the Bank over many years. Even amid generally adverse economic conditions, the Bank increased its amounts of housing loans in the fiscal year ended March 31, 2010. The Bank provides housing loans with a variety of terms and interest rates, including 10- to 35-year term, fixed-rate loans, to meet diversified customer needs. For instance, the Bank offers a housing loan combined with an insurance policy that covers the repayment of the outstanding loan balance in the event the borrower is diagnosed with certain serious diseases, or a housing loan with a special feature that exempts borrowers from a portion of their loan payments in the event of natural disasters. | ||
| • | Investment Trust. The Bank provides a variety of investment trust products with varying degrees and types of risk-return profiles that are developed and managed by experienced investment management companies within Japan and overseas. The Consumer Banking Unit generally focuses on the distribution, rather than the development or management, of investment trust products. As of October 1, 2009, the Bank and its consolidated subsidiary Nikko Cordial Securities began providing new investment trust products that were designed to capitalize on new global economic trends. | ||
| • | Insurance Products. The Bank, as an agent, offers pension-type insurance, whereby customers make payments of fixed amounts until they reach a certain age, at which time fixed amounts are paid to the customers at specified intervals. In addition, the Bank also sells a wide range of insurance products, including life insurance, medical insurance, insurance focusing on major diseases, nursing care insurance and juvenile insurance, home fire insurance, single-premium whole life insurance and annuities. | ||
| • | Securities Intermediary Services for Individuals. The Bank offers a variety of products, including foreign currency bonds and structured bonds, to its individual customers to complement its lineup of investment trusts together with SMBC Friend Securities and launch such services with Nikko Cordial Securities from April 19, 2010. Going forward, the Bank intends to integrate its collaborative business with SMBC Friend Securities regarding individual customers, including securities intermediary business and fund wrap to Nikko Cordial Securities by the end of January 2011. | ||
| • | Settlement and Consumer Finance Services. The Bank offers a variety of settlement related and personal credit products, including the issuance of the “SMBC First Pack” credit card, in collaboration with our group companies Sumitomo Mitsui Card and Cedyna. As part of our business alliance with Promise, the Bank offers consumer loan products. Promise guarantees loans made by the Bank under this alliance. |
23
Table of Contents
| • | Business Select Loan. In 2002, the Middle Market Banking Unit began offering business select loans, or BSLs, an unsecured loan product focused on small corporate customers with annual sales of less than ¥1 billion. For SMEs, BSLs are offered for a maximum amount of ¥50 million per transaction, and employ highly sophisticated credit scoring models in the origination process. Loans to SMEs generally have higher credit risks than loans to larger corporate borrowers. The Bank continues to revise lending practices by, for example, modifying terms and conditions of its loans as well as adjusting interest rates based on the risk profile of borrowers. In addition, the Bank has improved its credit analysis, procedures and cash flow analysis for loan applications. | ||
| • | Business Promotion Services. In light of the recent trend among mid-sized companies and SMEs of expanding their businesses into overseas markets, this business unit focuses on offering products and services that help its customers to enter into new markets especially in China and other Asian countries, and accommodate an increase in international trade operations with the Global Advisory Department. | ||
| • | Services to Promote B-to-B Transactions. “Value Door” is a gateway to various settlement services of the Bank and its subsidiaries and affiliates that meet our customers’ needs through the Internet. The Bank has promoted products and services provided through Value Door to stimulate greater demand for its solutions business for SMEs. The Value Door website includes such services as Web 21, an Internet-based service that offers corporate customers means to transfer money easily and effectively, and Global e-Trade Service, an Internet-based foreign exchange service for smooth transfer of funds to and from foreign banks. |
24
Table of Contents
| • | establishing a Tianjin Binhai sub-branch in March 2007; | ||
| • | establishing a Suzhou Industrial Park sub-branch in April 2007; | ||
| • | establishing a Beijing branch in February 2008; | ||
| • | establishing a Hanoi branch in December 2008, which replaced the Hanoi representative office established in 2004; | ||
| • | establishing Sumitomo Mitsui Banking Corporation (China) Limited, which began operations in April 2009; | ||
| • | establishing ZAO Sumitomo Mitsui Rus Bank, a Russian corporation in Moscow, which began operations in December 2009; | ||
| • | enhancing the functions of its Johannesburg Representative Office in March 2010; and | ||
| • | establishing a Bogota representative office in the Republic of Colombia in September 2010. |
| • | entering into a business and capital alliance agreement with Vietnam Export Import Commercial Joint Stock Bank, or Vietnam Eximbank, one of the leading commercial banks in Vietnam, in November 2007; | ||
| • | entering into a business alliance with First Commercial Bank, one of the largest commercial banks in Taiwan, in December 2007; | ||
| • | entering into a strategic alliance agreement for shipping finance with Industrial and Commercial Bank of China in March 2008; |
25
Table of Contents
| • | entering into a business and capital alliance with Barclays PLC in June 2008; | ||
| • | entering into a business alliance agreement with Kookmin Bank, the largest Korean commercial bank based on asset size in March 2007, as well as the Bank’s acquisition of 0.5% of the shares of Kookmin Bank’s parent, KB Financial Group, in October 2008; | ||
| • | entering into a memorandum of mutual understanding on a strategic alliance with The Bank of East Asia, a major independent local bank in Hong Kong, in November 2008; | ||
| • | entering into a memorandum of understanding on local currency funding in Indonesia, collaboration in cash management services, corporate finance and other new business areas with PT Bank Central Asia, Tbk, the largest privately owned commercial bank in Indonesia, in July 2009; | ||
| • | entering into a technical service agreement with Vietnam Eximbank in August 2009 to strengthen the technical services provided by the Bank; | ||
| • | entering into an agreement with The Bank of East Asia in December 2009 under which the Bank agreed to subscribe for 2.5% of the total issued shares of The Bank of East Asia in January 2010, increasing the Bank’s holdings to 4.05% of the total issued shares of The Bank of East Asia; | ||
| • | launching collection services in China in collaboration with Industrial and Commercial Bank of China in April 2010; | ||
| • | entering into agreement on a business alliance with Absa Bank Limited, a group company of Barclays Bank PLC, in May 2010; |
| • | entering into a business cooperation agreement with Kotak Mahindra Bank Limited in June 2010; | ||
| • | entering into a memorandum of understanding on structured finance with The Export-Import Bank of Korea in July 2010; and | ||
| • | entering into a memorandum of understanding on business cooperation with Banco de Bogota in September 2010. |
| • | Government Bond Underwriting. The Bank acts as an underwriter of Japanese government bonds, government-guaranteed bonds and Japanese municipal bonds. | ||
| • | Commercial Paper Placement. The Bank acts as a placement agent for commercial paper programs for qualified corporate issuers. |
26
Table of Contents
| • | Payment Services. The Bank handles money remittances for municipalities, public and private corporations and individuals both within Japan and overseas. Domestic remittance services are significant in Japan, where checks are rarely used and money remittance is a major means of payment. The Bank also handles the presentation and collection for its customers of promissory notes, bills of exchange and checks. | ||
| • | Foreign Exchange. The Bank engages in a variety of foreign exchange transactions for its clients and for its own account, including foreign currency exchange, overseas transfers and trade finance for export and import activities. |
| • | Investment Banking Unit. In cooperation with marketing departments, the Investment Banking Unit provides a broad range of sophisticated financial products and services as follows: |
| • | Customized Financial Services and Financing Solutions. The Bank provides a wide range of innovative financial services and financing solutions to its corporate clients, including loan syndication, structured finance, LBO and MBO financing, M&A advisory, securitization, non-recourse real estate finance and derivatives. | ||
| • | Securities Intermediary Services for Corporate Clients. The Banks provides corporate clients with securities intermediary services, and offers structured bonds, subordinated bonds and other products to corporate clients in cooperation with its subsidiary Nikko Cordial Securities. | ||
| • | Corporate Bond Trust Services. The Bank serves as a trustee or co-trustee of corporate mortgage bonds. The Bank also serves as a commissioned company for bondholders and as a paying and fiscal agent for unsecured bonds that are issued and publicly offered by domestic and foreign customers. In this role, the Bank also advises the issuer of market conditions and provides administrative services on behalf of the issuer. |
| • | Asset Securitization Trust Services. The Bank has been offering other trust services to its customers since October 2002, including monetary claims trusts for asset securitizations. | ||
| • | Restructuring Advisory Services. The Bank offers its restructuring advisory services through the use of private equity funds or direct capital investments in corporate customers seeking to restructure. | ||
| • | Environmental Products. The Bank arranges carbon credit transactions through its Environmental Products Department within the Structured Finance Department. Through this department, the Bank coordinates collaboration among overseas offices and the Bank headquarters in order to provide a wide range of solutions to customers’ environmental concerns. |
| • | Corporate Advisory Division. In April 2006, the Bank established the Corporate Advisory Division in order to strengthen its service lineup for listed and non-listed companies to provide solutions required for the increasingly sophisticated and diverse management issues faced by corporate clients. The division provides a centralized information platform that maintains the Bank’s accumulated information and knowledge concerning a wide range of industries. Leveraging this centralized information platform, the Corporate Advisory Division provides the Bank’s customers with proposals for strategic actions to help enhance their corporate value. The Corporate Advisory Division establishes a separate team for each project and works in cooperation with the Bank’s other departments and SMFG Group companies, including Nikko Cordial Securities and Sumitomo Mitsui Finance and Leasing. The division aims to offer comprehensive solutions for M&A, strategic investment, business alliances and other management issues. | ||
| • | Private Advisory Division. In April 2007, the Bank established the Private Advisory Division in order to address areas where the needs of individuals and corporate clients overlap, such as private banking, workplace banking, business succession consulting and other areas. | ||
| • | Global Advisory Department. In April 2008, the Bank established the Global Advisory Department in order to enhance its information gathering and solution providing capabilities and fortify its platform for providing |
27
Table of Contents
| high quality financial services to corporate clients who plan to enter or have entered overseas markets. The department is based in Tokyo, with staff members also assigned overseas, mainly in Asia. |
28
Table of Contents
29
Table of Contents
| • | restructuring of cost structure; | ||
| • | restructuring of non-core businesses; | ||
| • | reorganizing group companies, including, merger with Sanyo Shinpan Finance Co., Ltd. in October 2010; and | ||
| • | ensuring revenue base in response to a new regulation on aggregate loan amounts and loan interest rates introduced by an amendment to the Money Lending Business Act, which is expected to lead to a shrinking unsecured loan market and interest rate decrease. |
30
Table of Contents
31
Table of Contents
32
Table of Contents
33
Table of Contents
| • | Goldman Sachs may make credit commitments covered by the arrangements only to borrowers approved by the Bank. |
| • | Unless the Bank and Goldman Sachs agree otherwise, the borrowers covered by the FLC and any SLC Series that are rated by both of the two major rating agencies must be rated investment grade by both, and borrowers that are rated only by one of the two major rating agencies must be rated investment grade by that rating agency. If neither of the two major rating agencies rates a borrower, then the borrower shall no longer be covered by the FLC or any SLC Series, if the Bank and Goldman Sachs determine the borrower’s credit conditions are lower than investment grade. | ||
| • | If the ratings of an approved borrower fall below investment grade in the judgment of both major rating agencies (or, if a borrower is rated investment grade by only one agency, and that agency downgrades the borrower below investment grade), further credit to that borrower will no longer be covered by these arrangements, unless the Bank and Goldman Sachs otherwise agree. | ||
| • | On the fifth, tenth and fifteenth anniversaries of the transaction, the Bank has the right to cause Goldman Sachs to stop extending new credit to borrowers the Bank deems to have become “unbankable”. Unbankable borrowers are those who have investment grade ratings from the two major rating agencies but are deemed by the Bank to be below BB- and below Ba3 based on the Bank’s application of rating agency methodologies and criteria. If Goldman Sachs disagrees with the Bank, the matter is to be referred to arbitration, and the suspension is effective unless and until an arbitrator rules in favor of Goldman Sachs. |
34
Table of Contents
| • | the provision of commercial banking services by the Bank in Japan to customers of Goldman Sachs; and | ||
| • | participation by the Bank as a syndicate lender in Goldman Sachs-led syndicated loans for Japan-related credits; |
| • | asset sales of the Bank and its affiliates and debtors; | ||
| • | the Bank’s Japan-related equity offerings; | ||
| • | investment banking services for the Bank and its affiliates and customers; | ||
| • | investments in merchant banking transactions in Japan; and | ||
| • | access to the Bank’s retail distribution network in Japan for investment trust products. |
35
Table of Contents
| Fiscal year ended March 31, | ||||||||
| 2010 | 2009 | |||||||
Region: | ||||||||
| Japan | 86 | % | 86 | % | ||||
| Foreign: | ||||||||
| Americas | 7 | % | 4 | % | ||||
| Europe and Middle East | 4 | % | 5 | % | ||||
| Asia and Oceania (excluding Japan) | 3 | % | 5 | % | ||||
| Total | 100 | % | 100 | % | ||||
36
Table of Contents
37
Table of Contents
38
Table of Contents
39
Table of Contents
| • | those pertaining to interest rate-related instruments and equities in the trading book; and | ||
| • | foreign exchange risk and commodities risk throughout the bank. |
40
Table of Contents
41
Table of Contents
| • | a Financial Reorganization Administrator will be appointed by the FSA Commissioner and take control of the management and assets of the failed financial institution. The administrator is expected to efficiently search for a financial institution which will succeed the business of the failed institution; | ||
| • | if no successor financial institution can be immediately found, a “bridge bank” will be established by the DIC for the purpose of temporarily maintaining the operations of the failed financial institution, and the bridge bank will seek to transfer the failed financial institution’s assets to another financial institution or dissolve the failed financial institution; and | ||
| • | in order to facilitate or encourage a financial institution to succeed a failed business, financial aid may be provided by the DIC to any successor financial institution to enhance its capital after succession or to indemnify the loss incurred by the succession. |
| • | the DIC may subscribe for shares or other instruments issued by the relevant financial institution and require the institution to submit a plan to regain soundness in its management to the DIC; |
42
Table of Contents
| • | once the financial institution fails, financial aid exceeding the cost for pay-off may be available to the institution; and | ||
| • | if the failed institution is a bank and the problem cannot be avoided by other measures then the DIC may acquire all of the shares of the bank. |
43
Table of Contents
44
Table of Contents
45
Table of Contents
46
Table of Contents
47
Table of Contents
| • | sales methods; | ||
| • | trade practices among broker-dealers; | ||
| • | use and safekeeping of customers’ funds and securities; | ||
| • | capital structure; | ||
| • | record-keeping; | ||
| • | the financing of customers’ purchases; and | ||
| • | the conduct of directors, officers and employees. |
48
Table of Contents
49
Table of Contents
| Sumitomo Mitsui Financial Group, Inc | |||||||||
| (Domestic) | SMBC’s Consumer Banking Unit | ||||||||
| Commercial Banking | Sumitomo Mitsui Banking Corporation (SMBC) ——————————— | SMBC’s Middle Market Banking Unit | |||||||
| Kansai Urban Banking Corporation | SMBC’s Corporate Banking Unit | ||||||||
| The Minato Bank, Ltd. | SMBC’s International Banking Unit | ||||||||
| The Japan Net Bank, Limited | SMBC’s Treasury Unit | ||||||||
| SMBC Guarantee Co., Ltd. | |||||||||
| (Overseas) | |||||||||
| Sumitomo Mitsui Banking Corporation Europe Limited | |||||||||
| Manufacturers Bank | |||||||||
| Sumitomo Mitsui Banking Corporation (China) | |||||||||
| Sumitomo Mitsui Banking Corporation of Canada | |||||||||
| Banco Sumitomo Mitsui Brasileiro S.A. | |||||||||
| PT Bank Sumitomo Mitsui Indonesia | |||||||||
| (Domestic) | |||||||||
| Securities | Nikko Cordial Securities Inc | ||||||||
| SMBC Friend Securities Co., Ltd. | |||||||||
| (Overseas) | |||||||||
| SMBC Securities, Inc. | |||||||||
| (Domestic) | |||||||||
| Leasing | Sumitomo Mitsui Finance and Leasing Company, Limited | ||||||||
| Sumitomo Mitsui Auto Service Company, Limited | |||||||||
| (Overseas) | |||||||||
| SMBC Leasing and Finance, Inc. | |||||||||
| (Domestic) | |||||||||
| Credit Card | Sumitomo Mitsui Card Company, Limited | ||||||||
| Cedyna Financial Corporation | |||||||||
| Sakura Card Co., Ltd. | |||||||||
| (Domestic) | |||||||||
| Others | The Japan Research Institute, Limited | ||||||||
| JSOL Corporation | |||||||||
| ORIX Credit Corporation | |||||||||
| Promise Co., Ltd. | |||||||||
| At-Loan Co., Ltd. | |||||||||
| (Overseas) | |||||||||
| SMBC Capital Markets, Inc. | |||||||||
| • | group strategy and management; | ||
| • | group resource allocation; | ||
| • | group financial accounting; | ||
| • | investor relations; |
50
Table of Contents
| • | capital strategy; | ||
| • | group IT strategy; | ||
| • | HR management for group executives; | ||
| • | group risk management and compliance; | ||
| • | compensation schemes; and | ||
| • | efficiently harmonizing our operations on a Group-wide basis. |
| At March 31, 2010 | ||||
| (In millions) | ||||
| Land | ¥ | 497,209 | ||
| Buildings | 252,121 | |||
| Leased assets | 9,546 | |||
| Others | 234,295 | |||
| Total | ¥ | 993,171 | ||
51
Table of Contents
52
Table of Contents
| • | the amount of interest-earning assets and interest-bearing liabilities; | ||
| • | the interest spread; | ||
| • | the general level of interest rates; and | ||
| • | the proportion of interest-earning assets to interest-bearing liabilities. |
53
Table of Contents
| At March 31, | ||||||||||||
| 2010 | 2009 | 2008 | ||||||||||
| Short-term prime rate | 1.475 | % | 1.475 | % | 1.875 | % | ||||||
| Three-month TIBOR | 0.438 | 0.651 | 0.839 | |||||||||
| Ordinary deposit rate | 0.040 | 0.040 | 0.200 | |||||||||
| Long-term prime rate | 1.600 | 2.250 | 2.100 | |||||||||
| Ten-year swap rate | 1.453 | 1.314 | 1.452 | |||||||||
54
Table of Contents
55
Table of Contents
56
Table of Contents
57
Table of Contents
| • | Level 1. Quoted prices (unadjusted) in active markets for identical assets or liabilities; | ||
| • | Level 2. Inputs other than quoted prices included within Level 1 that are observable for the asset or liability , either directly (i.e., as prices) or indirectly (i.e., derived from prices); and | ||
| • | Level 3. Inputs for the asset or liability that are not based on observable market data (unobservable inputs). |
58
Table of Contents
59
Table of Contents
60
Table of Contents
61
Table of Contents
62
Table of Contents
63
Table of Contents
| For the fiscal year ended | ||||||||
| March 31, | ||||||||
| 2010 | 2009 | |||||||
| (In millions, except per share data) | ||||||||
| Interest income | ¥ | 1,766,047 | ¥ | 2,164,048 | ||||
| Interest expense | 346,810 | 676,293 | ||||||
| Net interest income | 1,419,237 | 1,487,755 | ||||||
| Fee and commission income | 650,437 | 570,603 | ||||||
| Fee and commission expense | 121,716 | 116,240 | ||||||
| Net fee and commission income | 528,721 | 454,363 | ||||||
| Net trading income | 330,130 | 134,298 | ||||||
| Net income (loss) from financial assets at fair value through profit or loss | 75,579 | (17,951 | ) | |||||
| Net investment income | 178,552 | 159,511 | ||||||
| Other income | 232,334 | 193,119 | ||||||
Total operating income | 2,764,553 | 2,411,095 | ||||||
| Impairment charges on financial assets | 258,641 | 1,240,710 | ||||||
Net operating income | 2,505,912 | 1,170,385 | ||||||
| General and administrative expenses | 1,096,957 | 992,487 | ||||||
| Other expenses | 236,760 | 261,770 | ||||||
Operating expenses | 1,333,717 | 1,254,257 | ||||||
| Share of post-tax loss in associates and joint ventures | 37,461 | 54,318 | ||||||
Profit (loss) before tax | 1,134,734 | (138,190 | ) | |||||
| Income tax expense (benefit) | 488,041 | (56,166 | ) | |||||
Net profit (loss) for the fiscal year | ¥ | 646,693 | ¥ | (82,024 | ) | |||
| Profit (loss) attributable to: | ||||||||
| Shareholders of Sumitomo Mitsui Financial Group, Inc. | ¥ | 528,692 | ¥ | (154,954 | ) | |||
| Non-controlling interests | 118,001 | 72,930 | ||||||
| Earnings per share: | ||||||||
| Basic | ¥ | 511.51 | ¥ | (214.49 | ) | |||
| Diluted | 481.59 | (259.62 | ) | |||||
64
Table of Contents
65
Table of Contents
| For the fiscal year ended March 31, | ||||||||||||||||||||
| 2010 | 2009 | |||||||||||||||||||
| Average | Interest | Average | Average | Interest | Average | |||||||||||||||
| balance(3) | income | rate | balance(3) | income | rate | |||||||||||||||
| (In millions, except percentages) | ||||||||||||||||||||
Assets: | ||||||||||||||||||||
| Interest-earning deposits in other banks: | ||||||||||||||||||||
| Domestic offices | ¥ | 222,757 | ¥ | 1,005 | 0.45% | ¥ | 569,321 | ¥ | 7,409 | 1.30% | ||||||||||
| Foreign offices | 2,054,195 | 13,591 | 0.66% | 1,715,303 | 38,172 | 2.23% | ||||||||||||||
| Total | 2,276,952 | 14,596 | 0.64% | 2,284,624 | 45,581 | 2.00% | ||||||||||||||
| Call loans and bills bought: | ||||||||||||||||||||
| Domestic offices | 347,177 | 2,500 | 0.72% | 401,158 | 5,404 | 1.35% | ||||||||||||||
| Foreign offices | 819,819 | 4,952 | 0.60% | 635,338 | 10,797 | 1.70% | ||||||||||||||
| Total | 1,166,996 | 7,452 | 0.64% | 1,036,496 | 16,201 | 1.56% | ||||||||||||||
| Reverse repurchase agreements and cash collateral on securities borrowed: | ||||||||||||||||||||
| Domestic offices | 2,509,461 | 8,634 | 0.34% | 854,797 | 5,664 | 0.66% | ||||||||||||||
| Foreign offices | 24,899 | 802 | 3.22% | 136,182 | 1,942 | 1.43% | ||||||||||||||
| Total | 2,534,360 | 9,436 | 0.37% | 990,979 | 7,606 | 0.77% | ||||||||||||||
Held-to-maturity investments(1): | ||||||||||||||||||||
| Domestic offices | 2,830,378 | 28,784 | 1.02% | 1,601,687 | 17,138 | 1.07% | ||||||||||||||
| Total | 2,830,378 | 28,784 | 1.02% | 1,601,687 | 17,138 | 1.07% | ||||||||||||||
Available-for-sale financial assets(1): | ||||||||||||||||||||
| Domestic offices | 13,561,413 | 104,254 | 0.77% | 11,575,425 | 122,548 | 1.06% | ||||||||||||||
| Foreign offices | 1,120,526 | 17,819 | 1.59% | 1,037,788 | 31,050 | 2.99% | ||||||||||||||
| Total | 14,681,939 | 122,073 | 0.83% | 12,613,213 | 153,598 | 1.22% | ||||||||||||||
Loans and advances(2): | ||||||||||||||||||||
| Domestic offices | 64,768,749 | 1,317,068 | 2.03% | 63,451,358 | 1,424,878 | 2.25% | ||||||||||||||
| Foreign offices | 10,451,249 | 266,638 | 2.55% | 11,611,878 | 499,046 | 4.30% | ||||||||||||||
| Total | 75,219,998 | 1,583,706 | 2.11% | 75,063,236 | 1,923,924 | 2.56% | ||||||||||||||
| Total interest-earning assets: | ||||||||||||||||||||
| Domestic offices | 84,239,935 | 1,462,245 | 1.74% | 78,453,746 | 1,583,041 | 2.02% | ||||||||||||||
| Foreign offices | 14,470,688 | 303,802 | 2.10% | 15,136,489 | 581,007 | 3.84% | ||||||||||||||
| Total | ¥ | 98,710,623 | ¥ | 1,766,047 | 1.79% | ¥ | 93,590,235 | ¥ | 2,164,048 | 2.31% | ||||||||||
66
Table of Contents
| For the fiscal year ended March 31, | ||||||||||||||||||||
| 2010 | 2009 | |||||||||||||||||||
| Average | Interest | Average | Average | Interest | Average | |||||||||||||||
| balance(3) | expense | rate | balance(3) | expense | rate | |||||||||||||||
| (In millions, except percentages) | ||||||||||||||||||||
Liabilities: | ||||||||||||||||||||
| Deposits: | ||||||||||||||||||||
| Domestic offices | ¥ | 65,150,510 | ¥ | 119,055 | 0.18% | ¥ | 60,532,595 | ¥ | 215,634 | 0.36% | ||||||||||
| Foreign offices | 8,916,248 | 54,319 | 0.61% | 7,312,931 | 164,463 | 2.25% | ||||||||||||||
| Total | 74,066,758 | 173,374 | 0.23% | 67,845,526 | 380,097 | 0.56% | ||||||||||||||
| Call money and bills sold: | ||||||||||||||||||||
| Domestic offices | 1,857,443 | 2,855 | 0.15% | 2,727,860 | 12,528 | 0.46% | ||||||||||||||
| Foreign offices | 1,207,668 | 3,392 | 0.28% | 768,717 | 10,143 | 1.32% | ||||||||||||||
| Total | 3,065,111 | 6,247 | 0.20% | 3,496,577 | 22,671 | 0.65% | ||||||||||||||
| Repurchase agreements and cash collateral on securities lent: | ||||||||||||||||||||
| Domestic offices | 3,472,016 | 6,843 | 0.20% | 4,618,897 | 62,029 | 1.34% | ||||||||||||||
| Foreign offices | 365,884 | 703 | 0.19% | 558,910 | 5,474 | 0.98% | ||||||||||||||
| Total | 3,837,900 | 7,546 | 0.20% | 5,177,807 | 67,503 | 1.30% | ||||||||||||||
| Borrowings: | ||||||||||||||||||||
| Domestic offices | 6,066,674 | 60,837 | 1.00% | 5,692,628 | 75,665 | 1.33% | ||||||||||||||
| Foreign offices | 471,182 | 18,467 | 3.92% | 530,854 | 27,249 | 5.13% | ||||||||||||||
| Total | 6,537,856 | 79,304 | 1.21% | 6,223,482 | 102,914 | 1.65% | ||||||||||||||
| Debt securities in issue: | ||||||||||||||||||||
| Domestic offices | 4,783,157 | 67,785 | 1.42% | 4,691,973 | 75,851 | 1.62% | ||||||||||||||
| Foreign offices | 431,283 | 10,543 | 2.44% | 482,434 | 24,320 | 5.04% | ||||||||||||||
| Total | 5,214,440 | 78,328 | 1.50% | 5,174,407 | 100,171 | 1.94% | ||||||||||||||
| Other interest-bearing liabilities: | ||||||||||||||||||||
| Domestic offices | 83,198 | 1,977 | 2.38% | 96,403 | 2,908 | 3.02% | ||||||||||||||
| Foreign offices | 4,518 | 34 | 0.75% | 3,852 | 29 | 0.75% | ||||||||||||||
| Total | 87,716 | 2,011 | 2.29% | 100,255 | 2,937 | 2.93% | ||||||||||||||
| Total interest-bearing liabilities: | ||||||||||||||||||||
| Domestic offices | 81,412,998 | 259,352 | 0.32% | 78,360,356 | 444,615 | 0.57% | ||||||||||||||
| Foreign offices | 11,396,783 | 87,458 | 0.77% | 9,657,698 | 231,678 | 2.40% | ||||||||||||||
| Total | ¥ | 92,809,781 | ¥ | 346,810 | 0.37% | ¥ | 88,018,054 | ¥ | 676,293 | 0.77% | ||||||||||
| Net interest income and interest rate spread | ¥ | 1,419,237 | 1.42% | ¥ | 1,487,755 | 1.54% | ||||||||||||||
| (1) | Taxable investment securities and non-taxable investment securities are not disclosed separately because the aggregate effect of these average balances and interest income would not be material. In addition, the yields on tax-exempt obligations have not been calculated on a tax equivalent basis because the effect of such calculation would not be material. | |
| (2) | Loans and advances includes impaired loans and advances. The amortized portion of net loan origination fees (costs) is included in interest income on loans and advances. | |
| (3) | Average balances are generally based on a daily average. Weekly, month-end or quarter-end averages are used for certain average balances where it is not practical to obtain applicable daily averages. The allocations of amounts between domestic and foreign are based on the location of the office. |
67
Table of Contents
| Fiscal year ended March 31, 2010 compared with | ||||||||||||
| fiscal year ended March 31, 2009 | ||||||||||||
| Increase / (decrease) | ||||||||||||
| Volume | Rate | Net change | ||||||||||
| �� | ||||||||||||
| (In millions) | ||||||||||||
Interest income: | ||||||||||||
| Interest-earning deposits in other banks: | ||||||||||||
| Domestic offices | ¥ | (3,089 | ) | ¥ | (3,315 | ) | ¥ | (6,404 | ) | |||
| Foreign offices | 6,379 | (30,960 | ) | (24,581 | ) | |||||||
| Total | 3,290 | (34,275 | ) | (30,985 | ) | |||||||
| Call loans and bills bought: | ||||||||||||
| Domestic offices | (651 | ) | (2,253 | ) | (2,904 | ) | ||||||
| Foreign offices | 2,507 | (8,352 | ) | (5,845 | ) | |||||||
| Total | 1,856 | (10,605 | ) | (8,749 | ) | |||||||
| Reverse repurchase agreements and cash collateral on securities borrowed: | ||||||||||||
| Domestic offices | 6,742 | (3,772 | ) | 2,970 | ||||||||
| Foreign offices | (2,373 | ) | 1,233 | (1,140 | ) | |||||||
| Total | 4,369 | (2,539 | ) | 1,830 | ||||||||
| Held-to-maturity investments: | ||||||||||||
| Domestic offices | 12,535 | (889 | ) | 11,646 | ||||||||
| Total | 12,535 | (889 | ) | 11,646 | ||||||||
| Available-for-sale financial assets: | ||||||||||||
| Domestic offices | 18,808 | (37,102 | ) | (18,294 | ) | |||||||
| Foreign offices | 2,307 | (15,538 | ) | (13,231 | ) | |||||||
| Total | 21,115 | (52,640 | ) | (31,525 | ) | |||||||
| Loans and advances: | ||||||||||||
| Domestic offices | 29,080 | (136,890 | ) | (107,810 | ) | |||||||
| Foreign offices | (45,879 | ) | (186,529 | ) | (232,408 | ) | ||||||
| Total | (16,799 | ) | (323,419 | ) | (340,218 | ) | ||||||
| Total interest income: | ||||||||||||
| Domestic offices | 63,425 | (184,221 | ) | (120,796 | ) | |||||||
| Foreign offices | (37,059 | ) | (240,146 | ) | (277,205 | ) | ||||||
| Total | ¥ | 26,366 | ¥ | (424,367 | ) | ¥ | (398,001 | ) | ||||
68
Table of Contents
| Fiscal year ended March 31, 2010 compared with | ||||||||||||
| fiscal year ended March 31, 2009 | ||||||||||||
| Increase / (decrease) | ||||||||||||
| Volume | Rate | Net change | ||||||||||
| (In millions) | ||||||||||||
Interest expense: | ||||||||||||
| Deposits: | ||||||||||||
| Domestic offices | ¥ | 15,365 | ¥ | (111,944 | ) | ¥ | (96,579 | ) | ||||
| Foreign offices | 29,980 | (140,124 | ) | (110,144 | ) | |||||||
| Total | 45,345 | (252,068 | ) | (206,723 | ) | |||||||
| Call money and bills sold: | ||||||||||||
| Domestic offices | (3,135 | ) | (6,538 | ) | (9,673 | ) | ||||||
| Foreign offices | 3,875 | (10,626 | ) | (6,751 | ) | |||||||
| Total | 740 | (17,164 | ) | (16,424 | ) | |||||||
| Repurchase agreements and cash collateral on securities lent: | ||||||||||||
| Domestic offices | (12,440 | ) | (42,746 | ) | (55,186 | ) | ||||||
| Foreign offices | (1,434 | ) | (3,337 | ) | (4,771 | ) | ||||||
| Total | (13,874 | ) | (46,083 | ) | (59,957 | ) | ||||||
| Borrowings: | ||||||||||||
| Domestic offices | 4,714 | (19,542 | ) | (14,828 | ) | |||||||
| Foreign offices | (2,830 | ) | (5,952 | ) | (8,782 | ) | ||||||
| Total | 1,884 | (25,494 | ) | (23,610 | ) | |||||||
| Debt securities in issue: | ||||||||||||
| Domestic offices | 1,449 | (9,515 | ) | (8,066 | ) | |||||||
| Foreign offices | (2,352 | ) | (11,425 | ) | (13,777 | ) | ||||||
| Total | (903 | ) | (20,940 | ) | (21,843 | ) | ||||||
| Other interest-bearing liabilities: | ||||||||||||
| Domestic offices | (365 | ) | (566 | ) | (931 | ) | ||||||
| Foreign offices | 5 | — | 5 | |||||||||
| Total | (360 | ) | (566 | ) | (926 | ) | ||||||
| Total interest expense: | ||||||||||||
| Domestic offices | 5,588 | (190,851 | ) | (185,263 | ) | |||||||
| Foreign offices | 27,244 | (171,464 | ) | (144,220 | ) | |||||||
| Total | 32,832 | (362,315 | ) | (329,483 | ) | |||||||
Net interest income: | ||||||||||||
| Domestic offices | 57,837 | 6,630 | 64,467 | |||||||||
| Foreign offices | (64,303 | ) | (68,682 | ) | (132,985 | ) | ||||||
| Total | ¥ | (6,466 | ) | ¥ | (62,052 | ) | ¥ | (68,518 | ) | |||
69
Table of Contents
| For the fiscal year ended March 31, | ||||||||
| 2010 | 2009 | |||||||
| (In millions) | ||||||||
Fee and commission income from: | ||||||||
| Loans | ¥ | 81,174 | ¥ | 75,951 | ||||
| Credit card business | 143,987 | 142,499 | ||||||
| Guarantees | 11,823 | 14,355 | ||||||
| Securities-related business | 43,164 | �� | 17,232 | |||||
| Deposits | 15,819 | 15,338 | ||||||
| Remittances and transfers | 124,917 | 131,103 | ||||||
| Safe deposits | 6,685 | 6,915 | ||||||
| Trust fees | 1,779 | 2,123 | ||||||
| Investment trusts | 96,258 | 37,374 | ||||||
| Agency | 14,763 | 14,721 | ||||||
| Others | 110,068 | 112,992 | ||||||
| Total fee and commission income | 650,437 | 570,603 | ||||||
Fee and commission expense from: | ||||||||
| Remittances and transfers | 31,086 | 30,418 | ||||||
| Guarantees | 16,268 | 12,280 | ||||||
| Others | 74,362 | 73,542 | ||||||
| Total fee and commission expense | 121,716 | 116,240 | ||||||
| Net fee and commission income | ¥ | 528,721 | ¥ | 454,363 | ||||
70
Table of Contents
| For the fiscal year ended March 31, | ||||||||
| 2010 | 2009 | |||||||
| (In millions) | ||||||||
| Interest rate | ¥ | 106,562 | ¥ | 178,485 | ||||
| Foreign exchange | 104,929 | (4,192 | ) | |||||
| Equity | 36,969 | (48,305 | ) | |||||
| Credit | 53,203 | (44,217 | ) | |||||
Others(1) | 28,467 | 52,527 | ||||||
| Total net trading income | ¥ | 330,130 | ¥ | 134,298 | ||||
| Net income (loss) from debt instruments | ¥ | 65,403 | ¥ | (5,845 | ) | |||
| Net income (loss) from equity instruments | 10,176 | (12,106 | ) | |||||
| Total net income (loss) from financial assets at fair value through profit or loss | ¥ | 75,579 | ¥ | (17,951 | ) | |||
| Net gain from disposal of debt instruments | ¥ | 61,541 | ¥ | 89,956 | ||||
| Net gain (loss) from disposal of equity instruments | 58,627 | (4,112 | ) | |||||
| Dividend income | 58,384 | 73,667 | ||||||
| Total net investment income | ¥ | 178,552 | ¥ | 159,511 | ||||
| (1) | Others includes the change in fair value of a derivative embedded in the Type 4 preferred stock. |
| For the fiscal year ended | ||||||||
| March 31, | ||||||||
| 2010 | 2009 | |||||||
| (In millions) | ||||||||
| Income from operating leases | ¥ | 56,121 | ¥ | 46,467 | ||||
| Gains on disposal of assets leased | 10,344 | 5,358 | ||||||
| Income related to IT solution services | 44,319 | 53,481 | ||||||
| Gains on disposal of property, plant and equipment and other intangible assets | 17,179 | 1,314 | ||||||
| Reversal of impairment losses of investments in associates and joint ventures | 19,832 | — | ||||||
| Others | 84,539 | 86,499 | ||||||
| Total other income | ¥ | 232,334 | ¥ | 193,119 | ||||
71
Table of Contents
| For the fiscal year ended March 31, | ||||||||
| 2010 | 2009 | |||||||
| (In millions) | ||||||||
| Loans and advances | ¥ | 215,886 | ¥ | 849,495 | ||||
| Available-for-sale financial assets | 42,755 | 391,215 | ||||||
| Total impairment charges on financial assets | ¥ | 258,641 | ¥ | 1,240,710 | ||||
72
Table of Contents
| For the fiscal year ended March 31, | ||||||||
| 2010 | 2009 | |||||||
| (In millions) | ||||||||
| Personnel expenses | ¥ | 511,075 | ¥ | 438,266 | ||||
| Depreciation and amortization | 107,054 | 83,260 | ||||||
| Rent and lease expenses | 77,715 | 67,839 | ||||||
| Building and maintenance expenses | 9,176 | 10,781 | ||||||
| Supplies expenses | 14,797 | 17,237 | ||||||
| Communication expenses | 23,939 | 20,748 | ||||||
| Publicity and advertising expenses | 35,315 | 34,744 | ||||||
| Taxes and dues | 51,020 | 52,327 | ||||||
| Outsourcing expenses | 68,715 | 65,135 | ||||||
| Premiums for deposit insurance | 53,799 | 53,449 | ||||||
| Office equipment expenses | 22,537 | 23,536 | ||||||
| Others | 121,815 | 125,165 | ||||||
| Total general and administrative expenses | ¥ | 1,096,957 | ¥ | 992,487 | ||||
| For the fiscal year ended March 31, | ||||||||
| 2010 | 2009 | |||||||
| (In millions) | ||||||||
| Cost of operating leases | ¥ | 30,487 | ¥ | 26,608 | ||||
| Losses on disposal of assets leased | 6,948 | 3,423 | ||||||
| Cost related to IT solution services | 95,342 | 107,360 | ||||||
| Losses on disposal of property, plant and equipment and other intangible assets | 4,497 | 11,818 | ||||||
| Impairment losses of property, plant and equipment | 9,899 | 6,560 | ||||||
| Impairment losses of intangible assets | 6,184 | 10,890 | ||||||
| Losses on sale of investments in subsidiaries and associates | 9,412 | 12 | ||||||
| Impairment losses of investments in associates and joint ventures | 18,134 | 31,508 | ||||||
| Others | 55,857 | 63,591 | ||||||
| Total other expenses | ¥ | 236,760 | ¥ | 261,770 | ||||
73
Table of Contents
| For the fiscal year ended March 31, 2010 | ||||||||||||||||||||||||||||||||||||||||||||||||||||||||||||||||||||
| Commercial Banking | Securities | Leasing | Credit Card | Others | Total | |||||||||||||||||||||||||||||||||||||||||||||||||||||||||||||||
| SMBC | Total(4) | Total(4) | Total(4) | Total(4) | ||||||||||||||||||||||||||||||||||||||||||||||||||||||||||||||||
| Middle | Sumitomo | |||||||||||||||||||||||||||||||||||||||||||||||||||||||||||||||||||
| Consumer | Market | Corporate | Interna- | Nikko | SMBC | Mitsui | Sumitomo | |||||||||||||||||||||||||||||||||||||||||||||||||||||||||||||
| Banking | Banking | Banking | tional | Treasury | SMBC | Cordial | Friend | Finance & | Mitsui | |||||||||||||||||||||||||||||||||||||||||||||||||||||||||||
| Unit | Unit | Unit | Banking Unit | Unit | Others | Total | Securities | Securities | Leasing | Card | ||||||||||||||||||||||||||||||||||||||||||||||||||||||||||
| (In billions) | ||||||||||||||||||||||||||||||||||||||||||||||||||||||||||||||||||||
Gross profit(1) | ¥ | 391.7 | ¥ | 472.9 | ¥ | 197.3 | ¥ | 169.1 | ¥ | 272.8 | ¥ | (48.5 | ) | ¥ | 1,455.3 | ¥ | 1,669.3 | ¥ | 100.5 | ¥ | 67.2 | ¥ | 161.4 | ¥ | 97.2 | ¥ | 109.5 | ¥ | 183.6 | ¥ | 183.4 | ¥ | 19.2 | ¥ | 2,142.8 | |||||||||||||||||||||||||||||||||
| Net interest income | 357.2 | 298.2 | 125.9 | 110.1 | 187.5 | (32.5 | ) | 1,046.4 | 1,181.9 | (1.4 | ) | 0.6 | (0.2 | ) | 59.8 | 64.5 | 27.5 | 29.3 | 9.9 | 1,285.4 | ||||||||||||||||||||||||||||||||||||||||||||||||
| Net non-interest income | 34.5 | 174.7 | 71.4 | 59.0 | 85.3 | (16.0 | ) | 408.9 | 487.4 | 101.9 | 66.6 | 161.6 | 37.4 | 45.0 | 156.1 | 154.1 | 9.3 | 857.4 | ||||||||||||||||||||||||||||||||||||||||||||||||||
General and administrative expenses(1) | (288.7 | ) | (218.7 | ) | (33.3 | ) | (54.5 | ) | (16.3 | ) | (74.3 | ) | (685.8 | ) | (803.3 | ) | (77.0 | ) | (44.4 | ) | (124.3 | ) | (28.5 | ) | (40.9 | ) | (135.8 | ) | (137.9 | ) | 6.5 | (1,099.9 | ) | |||||||||||||||||||||||||||||||||||
Other profit(2) | — | — | — | — | — | — | — | (132.8 | ) | — | — | 13.7 | (24.8 | ) | (27.5 | ) | (23.5 | ) | (40.4 | ) | (23.6 | ) | (210.6 | ) | ||||||||||||||||||||||||||||||||||||||||||||
Consolidated net business profit(3)(5) | ¥ | 103.0 | ¥ | 254.2 | ¥ | 164.0 | ¥ | 114.6 | ¥ | 256.5 | ¥ | (122.8 | ) | ¥ | 769.5 | ¥ | 733.2 | ¥ | 23.5 | ¥ | 22.8 | ¥ | 50.8 | ¥ | 43.9 | ¥ | 41.1 | ¥ | 24.3 | ¥ | 5.1 | ¥ | 2.1 | ¥ | 832.3 | |||||||||||||||||||||||||||||||||
74
Table of Contents
| For the fiscal year ended March 31, 2009 | ||||||||||||||||||||||||||||||||||||||||||||||||||||||||||||||||||||
| Commercial Banking | Securities | Leasing | Credit Card | Others | Total | |||||||||||||||||||||||||||||||||||||||||||||||||||||||||||||||
| SMBC | Total(4) | Total(4) | Total(4) | Total(4) | ||||||||||||||||||||||||||||||||||||||||||||||||||||||||||||||||
| Middle | Sumitomo | |||||||||||||||||||||||||||||||||||||||||||||||||||||||||||||||||||
| Consumer | Market | Corporate | Interna- | Nikko | SMBC | Mitsui | Sumitomo | |||||||||||||||||||||||||||||||||||||||||||||||||||||||||||||
| Banking | Banking | Banking | tional | Treasury | SMBC | Cordial | Friend | Finance & | Mitsui | |||||||||||||||||||||||||||||||||||||||||||||||||||||||||||
| Unit | Unit | Unit | Banking Unit | Unit | Others | Total | Securities | Securities | Leasing | Card | ||||||||||||||||||||||||||||||||||||||||||||||||||||||||||
| (In billions) | ||||||||||||||||||||||||||||||||||||||||||||||||||||||||||||||||||||
Gross profit(1) | ¥ | 429.4 | ¥ | 539.8 | ¥ | 196.7 | ¥ | 175.0 | ¥ | 246.8 | ¥ | (62.8 | ) | ¥ | 1,524.9 | ¥ | 1,719.9 | ¥ | — | ¥ | 42.8 | ¥ | 45.5 | ¥ | 91.9 | ¥ | 100.5 | ¥ | 180.2 | ¥ | 219.3 | ¥ | (2.2 | ) | ¥ | 2,083.0 | ||||||||||||||||||||||||||||||||
| Net interest income | 396.3 | 338.3 | 121.5 | 104.0 | 123.4 | (65.1 | ) | 1,018.4 | 1,158.5 | — | 1.2 | 1.5 | 57.2 | 60.8 | 29.5 | 35.1 | (3.9 | ) | 1,252.0 | |||||||||||||||||||||||||||||||||||||||||||||||||
| Net non-interest income | 33.1 | 201.5 | 75.2 | 71.0 | 123.4 | 2.3 | 506.5 | 561.4 | — | 41.6 | 44.0 | 34.7 | 39.7 | 150.7 | 184.2 | 1.7 | 831.0 | |||||||||||||||||||||||||||||||||||||||||||||||||||
General and administrative expenses(1) | (290.7 | ) | (222.7 | ) | (31.5 | ) | (64.8 | ) | (17.9 | ) | (73.9 | ) | (701.5 | ) | (813.8 | ) | — | (40.4 | ) | (40.9 | ) | (29.5 | ) | (41.7 | ) | (137.3 | ) | (172.9 | ) | 28.5 | (1,040.8 | ) | ||||||||||||||||||||||||||||||||||||
Other profit(2) | — | — | — | — | — | — | — | (147.6 | ) | — | (0.1 | ) | (67.8 | ) | (25.9 | ) | (32.9 | ) | (20.6 | ) | (30.7 | ) | (34.5 | ) | (313.5 | ) | ||||||||||||||||||||||||||||||||||||||||||
Consolidated net business profit(3)(5) | ¥ | 138.7 | ¥ | 317.1 | ¥ | 165.2 | ¥ | 110.2 | ¥ | 228.9 | ¥ | (136.7 | ) | ¥ | 823.4 | ¥ | 758.5 | ¥ | — | ¥ | 2.3 | ¥ | (63.2 | ) | ¥ | 36.5 | ¥ | 25.9 | ¥ | 22.3 | ¥ | 15.7 | ¥ | (8.2 | ) | ¥ | 728.7 | |||||||||||||||||||||||||||||||
| (1) | Gross profit, and general and administrative expenses: The Commercial Banking segment includes subsidiaries such as the Bank, SMBC Europe, SMBC (China), Kansai Urban Banking Corporation and The Minato Bank. The Securities segment includes subsidiaries such as Nikko Cordial Securities (for the latter half of fiscal year ended March 31, 2010) and SMBC Friend Securities. The Leasing segment includes subsidiaries such as Sumitomo Mitsui Finance and Leasing. The Credit Card segment includes subsidiaries such as Sumitomo Mitsui Card. | |
| (2) | Other profits includes non-operating profits and losses of subsidiaries other than the Bank, ordinary profit of equity-method associates taking into account the shareholding ratio. | |
| (3) | Consolidated net business profit = the Bank’s business profit on a non-consolidated basis, excluding the effect of the reversal of reserve for possible loan losses + ordinary profit of other consolidated subsidiaries (with adjustment for extraordinary items) + (ordinary profit of equity-method associates * equity ratio) - internal transactions (such as dividends) under Japanese GAAP. “Equity ratio” represents our interest to the ordinary profit from the equity-method associates. | |
| (4) | Total under each business segment includes the aggregation of the results from the operating units that were not identified as reportable segments. | |
| (5) | The SMFG Group’s total credit cost for the fiscal years ended March 31, 2010 and 2009 were ¥473.0 billion and ¥767.8 billion, of which ¥395.1 billion and ¥695.6 billion were for Commercial Banking, ¥0.03 billion and ¥0.07 billion were for Securities, ¥27.4 billion and ¥26.8 billion were for Leasing, and ¥26.1 billion and ¥33.6 billion were for Credit Card, respectively. Total credit cost consists of credit cost and gains on recoveries of written-off claims. Credit cost of SMBC and gains on recoveries of written-off claims were not included in consolidated net business profit, but in “Loans and advances” in the reconciliation table in Note 4 “Segment Analysis” to our consolidated financial statements. |
75
Table of Contents
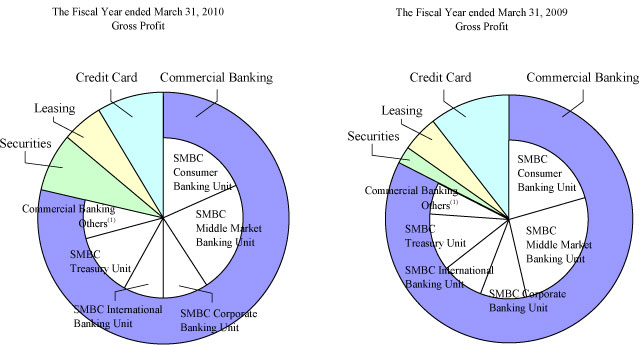
| (1) | Commercial banking others include the Bank’s others and subsidiaries, such as SMBC Europe, SMBC (China), Kansai Urban Banking Corporation and The Minato Bank. |
76
Table of Contents
77
Table of Contents
| At March 31, | At April 1, | |||||||||||
| 2010 | 2009 | 2008 | ||||||||||
| (In millions) | ||||||||||||
Asset: | ||||||||||||
| Cash and deposits with banks | ¥ | 6,239,398 | ¥ | 5,044,744 | ¥ | 4,948,469 | ||||||
| Call loans and bills bought | 1,127,035 | 973,772 | 735,139 | |||||||||
| Reverse repurchase agreements and cash collateral on securities borrowed | 5,697,669 | 2,009,141 | 2,478,762 | |||||||||
| Trading assets | 3,258,779 | 1,070,386 | 1,534,380 | |||||||||
| Derivative financial instruments | 5,061,542 | 6,062,870 | 4,774,071 | |||||||||
| Financial assets at fair value through profit or loss | 2,092,383 | 2,063,790 | 2,086,612 | |||||||||
| Investment securities | 23,152,188 | 22,929,529 | 17,992,484 | |||||||||
| Loans and advances | 71,634,128 | 74,669,294 | 71,984,280 | |||||||||
| Investments in associates and joint ventures | 289,141 | 407,835 | 457,394 | |||||||||
| Property, plant and equipment | 993,171 | 903,956 | 861,692 | |||||||||
| Intangible assets | 710,235 | 357,851 | 329,204 | |||||||||
| Other assets | 1,574,769 | 1,078,151 | 1,084,218 | |||||||||
| Current tax assets | 40,362 | 50,349 | 28,481 | |||||||||
| Deferred tax assets | 1,122,129 | 1,713,208 | 1,241,344 | |||||||||
| Total assets | ¥ | 122,992,929 | ¥ | 119,334,876 | ¥ | 110,536,530 | ||||||
78
Table of Contents
| At March 31, | At April 1, | |||||||||||
| 2010 | 2009 | 2008 | ||||||||||
| (In millions) | ||||||||||||
Domestic: | ||||||||||||
| Manufacturing | ¥ | 8,428,854 | ¥ | 8,836,291 | ¥ | 7,555,462 | ||||||
| Agriculture, forestry, fisheries and mining | 162,879 | 163,647 | 259,803 | |||||||||
| Construction | 1,492,690 | 1,716,567 | 1,815,201 | |||||||||
| Transportation, communications and public enterprises | 3,519,279 | 3,606,748 | 3,244,752 | |||||||||
| Wholesale and retail | 5,552,637 | 6,201,520 | 6,350,694 | |||||||||
| Finance and insurance | 3,431,882 | 3,613,653 | 3,582,845 | |||||||||
| Real estate and goods rental and leasing | 8,751,450 | 9,264,523 | 9,393,149 | |||||||||
| Services | 4,644,737 | 4,947,995 | 5,141,719 | |||||||||
| Municipalities | 1,346,611 | 1,274,196 | 1,086,548 | |||||||||
| Lease financing | 2,320,651 | 2,562,727 | 2,658,423 | |||||||||
Consumer(1) | 17,544,284 | 16,377,870 | 15,733,316 | |||||||||
| Others | 5,137,721 | 5,446,206 | 5,077,704 | |||||||||
| Total domestic | ¥ | 62,333,675 | ¥ | 64,011,943 | ¥ | 61,899,616 | ||||||
| (1) | The balance in Consumer consists mainly of housing loans. The housing loan balances amounted to ¥14,436,921 million, ¥13,577,902 million and ¥13,067,503 million at March 31, 2010 and 2009, and April 1, 2008, respectively. |
| At March 31, | At April 1, | |||||||||||
| 2010 | 2009 | 2008 | ||||||||||
| (In millions) | ||||||||||||
Foreign: | ||||||||||||
| Public sector | ¥ | 147,115 | ¥ | 82,598 | ¥ | 115,942 | ||||||
| Financial institutions | 2,031,812 | 1,812,218 | 1,897,715 | |||||||||
| Commerce and industry | 8,161,198 | 9,282,120 | 8,283,544 | |||||||||
| Lease financing | 205,547 | 239,728 | 227,508 | |||||||||
| Others | 442,225 | 1,017,223 | 830,568 | |||||||||
| Total foreign | ¥ | 10,987,897 | ¥ | 12,433,887 | ¥ | 11,355,277 | ||||||
79
Table of Contents
80
Table of Contents
| For the fiscal year ended | ||||||||
| March 31, | ||||||||
| 2010 | 2009 | |||||||
| (In millions) | ||||||||
| Allowance for loan losses at the beginning of the fiscal year | ¥ | 1,599,630 | ¥ | 1,094,226 | ||||
| Provision (credit) for loan losses | 215,886 | 849,495 | ||||||
| Charge-offs: | ||||||||
| Domestic | 360,895 | 306,141 | ||||||
| Foreign | 23,620 | 30,733 | ||||||
| Total | 384,515 | 336,874 | ||||||
| Recoveries: | ||||||||
| Domestic | 953 | 1,082 | ||||||
| Foreign | 16 | 15 | ||||||
| Total | 969 | 1,097 | ||||||
| Net charge-offs | 383,546 | 335,777 | ||||||
Others(1) | 101,585 | (8,314 | ) | |||||
| Allowance for loan losses at the end of the fiscal year | ¥ | 1,533,555 | ¥ | 1,599,630 | ||||
| (1) | Others mainly included an increase in the allowance for loan losses of ¥102,687 million from the acquisition of subsidiaries for the fiscal year ended March 31, 2010, whereas the amount for the fiscal year ended March 31, 2009 was primarily from foreign exchange translations. |
81
Table of Contents
| At March 31, | ||||||||||||
| �� | 2010 | 2009 | 2008 | |||||||||
| (In millions) | ||||||||||||
Potentially bankrupt, effectively bankrupt and bankrupt (loans and advances): | ||||||||||||
| Domestic: | ||||||||||||
| Manufacturing | ¥ | 180,642 | ¥ | 164,736 | ¥ | 92,741 | ||||||
| Agriculture, forestry, fisheries and mining | 7,014 | 4,842 | 1,424 | |||||||||
| Construction | 125,674 | 141,581 | 88,436 | |||||||||
| Transportation, communications and public enterprises | 78,726 | 64,451 | 62,950 | |||||||||
| Wholesale and retail | 233,124 | 217,549 | 181,170 | |||||||||
| Finance and insurance | 30,287 | 53,776 | 21,823 | |||||||||
| Real estate and goods rental and leasing | 622,944 | 566,916 | 188,899 | |||||||||
| Services | 260,917 | 227,103 | 200,822 | |||||||||
| Lease financing | 52,648 | 45,379 | 31,753 | |||||||||
| Consumer | 242,106 | 214,620 | 193,801 | |||||||||
| Others | 62,351 | 61,663 | 49,464 | |||||||||
| Total domestic | 1,896,433 | 1,762,616 | 1,113,283 | |||||||||
| Foreign: | ||||||||||||
| Public sector | 4,564 | 13 | 13 | |||||||||
| Financial institutions | 36,381 | 64,827 | 34,291 | |||||||||
| Commerce and industry | 135,958 | 165,772 | 26,065 | |||||||||
| Lease financing | 33 | 3,151 | 6,693 | |||||||||
| Others | 15,901 | 6,617 | 5,564 | |||||||||
| Total foreign | 192,837 | 240,380 | 72,626 | |||||||||
| Total | 2,089,270 | 2,002,996 | 1,185,909 | |||||||||
Past due three months or more (loans): | ||||||||||||
| Domestic | 28,434 | 31,012 | 36,646 | |||||||||
| Foreign | 635 | 11,045 | 1,139 | |||||||||
| Total | 29,069 | 42,057 | 37,785 | |||||||||
Restructured (loans): | ||||||||||||
| Domestic | 127,392 | 160,658 | 259,525 | |||||||||
| Foreign | 37,007 | 7,940 | 32,923 | |||||||||
| Total | 164,399 | 168,598 | 292,448 | |||||||||
Other impaired (loans and advances): | ||||||||||||
| Domestic | 158,653 | 121,971 | 181,835 | |||||||||
| Foreign | 1,760 | 6,069 | 5,667 | |||||||||
| Total | 160,413 | 128,040 | 187,502 | |||||||||
| Gross impaired loans and advances | 2,443,151 | 2,341,691 | 1,703,644 | |||||||||
| Less: Allowance for loan losses | (1,282,610 | ) | (1,204,091 | ) | (936,510 | ) | ||||||
| Net impaired loans and advances | ¥ | 1,160,541 | ¥ | 1,137,600 | ¥ | 767,134 | ||||||
82
Table of Contents
83
Table of Contents
| At March 31, 2010 | ||||||||||||||||
| Amortized | Gross unrealized | Gross unrealized | Estimated | |||||||||||||
| cost | gains | losses | fair value | |||||||||||||
| (In millions) | ||||||||||||||||
Held-to-maturity investments: | ||||||||||||||||
| Domestic: | ||||||||||||||||
| Japanese government bonds | ¥ | 2,871,212 | ¥ | 49,223 | ¥ | 627 | ¥ | 2,919,808 | ||||||||
| Japanese municipal bonds | 154,281 | 3,080 | 3 | 157,358 | ||||||||||||
| Japanese corporate bonds | 246,519 | 7,044 | 106 | 253,457 | ||||||||||||
| Total domestic | 3,272,012 | 59,347 | 736 | 3,330,623 | ||||||||||||
| Foreign | — | — | — | — | ||||||||||||
| Total | ¥ | 3,272,012 | ¥ | 59,347 | ¥ | 736 | ¥ | 3,330,623 | ||||||||
Available-for-sale financial assets: | ||||||||||||||||
| Domestic: | ||||||||||||||||
| Japanese government bonds | ¥ | 11,901,492 | ¥ | 27,597 | ¥ | 3,602 | ¥ | 11,925,487 | ||||||||
| Japanese municipal bonds | 266,387 | 2,065 | 161 | 268,291 | ||||||||||||
| Japanese corporate bonds | 435,063 | 3,752 | 151 | 438,664 | ||||||||||||
| Other debt instruments | 205,108 | 12,531 | — | 217,639 | ||||||||||||
| Equity instruments | 2,147,999 | 1,029,956 | 9,635 | 3,168,320 | ||||||||||||
| Total domestic | 14,956,049 | 1,075,901 | 13,549 | 16,018,401 | ||||||||||||
| Foreign: | ||||||||||||||||
| U.S. Treasury and other U.S. government agencies bonds | 2,071,258 | 1,540 | 23,252 | 2,049,546 | ||||||||||||
| Other governments and official institutions bonds | 1,283,130 | 2,624 | 2,163 | 1,283,591 | ||||||||||||
| Mortgage-backed securities | 4,595 | 46 | 4 | 4,637 | ||||||||||||
| Other debt instruments | 223,396 | 2,408 | 949 | 224,855 | ||||||||||||
| Equity instruments | 196,383 | 103,138 | 375 | 299,146 | ||||||||||||
| Total foreign | 3,778,762 | 109,756 | 26,743 | 3,861,775 | ||||||||||||
| Total | ¥ | 18,734,811 | ¥ | 1,185,657 | ¥ | 40,292 | ¥ | 19,880,176 | ||||||||
84
Table of Contents
| At March 31, 2009 | ||||||||||||||||
| Amortized | Gross unrealized | Gross unrealized | Estimated | |||||||||||||
| cost | gains | losses | fair value | |||||||||||||
| (In millions) | ||||||||||||||||
Held-to-maturity investments: | ||||||||||||||||
| Domestic: | ||||||||||||||||
| Japanese government bonds | ¥ | 1,574,005 | ¥ | 22,583 | ¥ | 296 | ¥ | 1,596,292 | ||||||||
| Japanese municipal bonds | 96,312 | 962 | 9 | 97,265 | ||||||||||||
| Japanese corporate bonds | 392,210 | 4,612 | 606 | 396,216 | ||||||||||||
| Total domestic | 2,062,527 | 28,157 | 911 | 2,089,773 | ||||||||||||
| Foreign | 9,181 | — | 504 | 8,677 | ||||||||||||
| Total | ¥ | 2,071,708 | ¥ | 28,157 | ¥ | 1,415 | ¥ | 2,098,450 | ||||||||
Available-for-sale financial assets: | ||||||||||||||||
| Domestic: | ||||||||||||||||
| Japanese government bonds | ¥ | 11,265,476 | ¥ | 15,032 | ¥ | 2,342 | ¥ | 11,278,166 | ||||||||
| Japanese municipal bonds | 242,394 | 486 | 564 | 242,316 | ||||||||||||
| Japanese corporate bonds | 618,574 | 983 | 5,483 | 614,074 | ||||||||||||
| Other debt instruments | 192,242 | 16,429 | — | 208,671 | ||||||||||||
| Equity instruments | 2,102,051 | 585,690 | 49,960 | 2,637,781 | ||||||||||||
| Total domestic | 14,420,737 | 618,620 | 58,349 | 14,981,008 | ||||||||||||
| Foreign: | ||||||||||||||||
| U.S. Treasury and other U.S. government agencies bonds | 2,967,799 | 8,090 | 4,885 | 2,971,004 | ||||||||||||
| Other governments and official institutions bonds | 2,316,989 | 24,782 | 2,449 | 2,339,322 | ||||||||||||
| Mortgage-backed securities | 230,649 | 15,207 | 116 | 245,740 | ||||||||||||
| Other debt instruments | 182,196 | 139 | 7,840 | 174,495 | ||||||||||||
| Equity instruments | 132,260 | 14,745 | 753 | 146,252 | ||||||||||||
| Total foreign | 5,829,893 | 62,963 | 16,043 | 5,876,813 | ||||||||||||
| Total | ¥ | 20,250,630 | ¥ | 681,583 | ¥ | 74,392 | ¥ | 20,857,821 | ||||||||
85
Table of Contents
| At March 31, 2010 | ||||||||||||||||||||||||
| Less than twelve months | Twelve months or more | Total | ||||||||||||||||||||||
| Estimated | Gross unrealized | Estimated | Gross unrealized | Estimated | Gross unrealized | |||||||||||||||||||
| fair value | losses | fair value | losses | fair value | losses | |||||||||||||||||||
| (In millions) | ||||||||||||||||||||||||
Held-to-maturity investments: | ||||||||||||||||||||||||
| Domestic: | ||||||||||||||||||||||||
| Japanese government bonds | ¥ | 319,472 | ¥ | 627 | ¥ | — | ¥ | — | ¥ | 319,472 | ¥ | 627 | ||||||||||||
| Japanese municipal bonds | 2,698 | 3 | — | — | 2,698 | 3 | ||||||||||||||||||
| Japanese corporate bonds | 1,842 | 68 | 2,957 | 38 | 4,799 | 106 | ||||||||||||||||||
| Total domestic | 324,012 | 698 | 2,957 | 38 | 326,969 | 736 | ||||||||||||||||||
| Foreign | — | — | — | — | — | — | ||||||||||||||||||
| Total | ¥ | 324,012 | ¥ | 698 | ¥ | 2,957 | ¥ | 38 | ¥ | 326,969 | ¥ | 736 | ||||||||||||
Available-for-sale financial assets: | ||||||||||||||||||||||||
| Domestic: | ||||||||||||||||||||||||
| Japanese government bonds | ¥ | 4,586,496 | ¥ | 3,164 | ¥ | 23,260 | ¥ | 438 | ¥ | 4,609,756 | ¥ | 3,602 | ||||||||||||
| Japanese municipal bonds | 88,816 | 156 | 2,705 | 5 | 91,521 | 161 | ||||||||||||||||||
| Japanese corporate bonds | 45,034 | 147 | 12,785 | 4 | 57,819 | 151 | ||||||||||||||||||
| Other debt instruments | — | — | — | — | — | — | ||||||||||||||||||
| Equity instruments | 106,743 | 9,635 | — | — | 106,743 | 9,635 | ||||||||||||||||||
| Total domestic | 4,827,089 | 13,102 | 38,750 | 447 | 4,865,839 | 13,549 | ||||||||||||||||||
| Foreign: | ||||||||||||||||||||||||
| U.S. Treasury and other U.S. government agencies bonds | 890,407 | 9,903 | 485,296 | 13,349 | 1,375,703 | 23,252 | ||||||||||||||||||
| Other governments and official institutions bonds | 238,518 | 237 | 71,439 | 1,926 | 309,957 | 2,163 | ||||||||||||||||||
| Mortgage-backed securities | — | — | 2,303 | 4 | 2,303 | 4 | ||||||||||||||||||
| Other debt instruments | 87,727 | 482 | 18,568 | 467 | 106,295 | 949 | ||||||||||||||||||
| Equity instruments | 5,259 | 375 | — | — | 5,259 | 375 | ||||||||||||||||||
| Total foreign | 1,221,911 | 10,997 | 577,606 | 15,746 | 1,799,517 | 26,743 | ||||||||||||||||||
| Total | ¥ | 6,049,000 | ¥ | 24,099 | ¥ | 616,356 | ¥ | 16,193 | ¥ | 6,665,356 | ¥ | 40,292 | ||||||||||||
86
Table of Contents
| At March 31, 2009 | ||||||||||||||||||||||||
| Less than twelve months | Twelve months or more | Total | ||||||||||||||||||||||
| Estimated | Gross unrealized | Estimated | Gross unrealized | Estimated | Gross unrealized | |||||||||||||||||||
| fair value | losses | fair value | losses | fair value | losses | |||||||||||||||||||
| (In millions) | ||||||||||||||||||||||||
Held-to-maturity investments: | ||||||||||||||||||||||||
| Domestic: | ||||||||||||||||||||||||
| Japanese government bonds | ¥ | 240,072 | ¥ | 233 | ¥ | 51,192 | ¥ | 63 | ¥ | 291,264 | ¥ | 296 | ||||||||||||
| Japanese municipal bonds | 20,385 | 9 | — | — | 20,385 | 9 | ||||||||||||||||||
| Japanese corporate bonds | 2,787 | 110 | 7,417 | 496 | 10,204 | 606 | ||||||||||||||||||
| Total domestic | 263,244 | 352 | 58,609 | 559 | 321,853 | 911 | ||||||||||||||||||
| Foreign | — | — | 8,677 | 504 | 8,677 | 504 | ||||||||||||||||||
| Total | ¥ | 263,244 | ¥ | 352 | ¥ | 67,286 | ¥ | 1,063 | ¥ | 330,530 | ¥ | 1,415 | ||||||||||||
Available-for-sale financial assets: | ||||||||||||||||||||||||
| Domestic: | ||||||||||||||||||||||||
| Japanese government bonds | ¥ | 4,819,596 | ¥ | 2,329 | ¥ | 5,185 | ¥ | 13 | ¥ | 4,824,781 | ¥ | 2,342 | ||||||||||||
| Japanese municipal bonds | 24,572 | 75 | 100,846 | 489 | 125,418 | 564 | ||||||||||||||||||
| Japanese corporate bonds | 111,179 | 700 | 202,870 | 4,783 | 314,049 | 5,483 | ||||||||||||||||||
| Other debt instruments | — | — | — | — | — | — | ||||||||||||||||||
| Equity instruments | 312,036 | 49,960 | — | — | 312,036 | 49,960 | ||||||||||||||||||
| Total domestic | 5,267,383 | 53,064 | 308,901 | 5,285 | 5,576,284 | 58,349 | ||||||||||||||||||
| Foreign: | ||||||||||||||||||||||||
| U.S. Treasury and other U.S. government agencies bonds | 1,022,195 | 3,688 | 24,108 | 1,197 | 1,046,303 | 4,885 | ||||||||||||||||||
| Other governments and official institutions bonds | 463,115 | 2,298 | 39,155 | 151 | 502,270 | 2,449 | ||||||||||||||||||
| Mortgage-backed securities | 6,227 | 116 | — | — | 6,227 | 116 | ||||||||||||||||||
| Other debt instruments | 57,595 | 864 | 40,466 | 6,976 | 98,061 | 7,840 | ||||||||||||||||||
| Equity instruments | 10,044 | 753 | — | — | 10,044 | 753 | ||||||||||||||||||
| Total foreign | 1,559,176 | 7,719 | 103,729 | 8,324 | 1,662,905 | 16,043 | ||||||||||||||||||
| Total | ¥ | 6,826,559 | ¥ | 60,783 | ¥ | 412,630 | ¥ | 13,609 | ¥ | 7,239,189 | ¥ | 74,392 | ||||||||||||
| At March 31, | At April 1, | |||||||||||
| 2010 | 2009 | 2008 | ||||||||||
| (In millions) | ||||||||||||
| Debt instruments | ¥ | 3,117,725 | ¥ | 958,274 | ¥ | 1,251,743 | ||||||
| Equity instruments | 141,054 | 112,112 | 282,637 | |||||||||
| Total trading assets | ¥ | 3,258,779 | ¥ | 1,070,386 | ¥ | 1,534,380 | ||||||
87
Table of Contents
| At March 31, | At April 1, | |||||||||||
| 2010 | 2009 | 2008 | ||||||||||
| (In millions) | ||||||||||||
| Debt instruments | ¥ | 1,978,149 | ¥ | 1,956,968 | ¥ | 1,968,430 | ||||||
| Equity instruments | 114,234 | 106,822 | 118,182 | |||||||||
| Total financial assets at fair value through profit or loss | ¥ | 2,092,383 | ¥ | 2,063,790 | ¥ | 2,086,612 | ||||||
| At March 31, | ||||||||||||||||
| 2010 | 2009 | |||||||||||||||
| Undrawn | Undrawn | |||||||||||||||
| Loans | commitments | Loans | commitments | |||||||||||||
| (In billions) | ||||||||||||||||
| Europe | ¥ | 261.1 | ¥ | 28.8 | ¥ | 306.0 | ¥ | 34.2 | ||||||||
| Japan | 176.2 | 11.8 | 179.9 | 29.2 | ||||||||||||
| United States | 113.2 | 73.5 | 179.0 | 70.0 | ||||||||||||
| Asia (excluding Japan) | 59.6 | 9.4 | 78.8 | 3.9 | ||||||||||||
| Total | ¥ | 610.1 | ¥ | 123.5 | ¥ | 743.7 | ¥ | 137.3 | ||||||||
88
Table of Contents
| At March 31, | At April 1, | |||||||||||
| 2010 | 2009 | 2008 | ||||||||||
| (In millions) | ||||||||||||
Liabilities: | ||||||||||||
| Deposits | ¥ | 85,697,973 | ¥ | 83,231,234 | ¥ | 75,888,958 | ||||||
| Call money and bills sold | 2,119,558 | 2,750,337 | 2,761,530 | |||||||||
| Repurchase agreements and cash collateral on securities lent | 5,437,449 | 8,372,369 | 7,583,374 | |||||||||
| Trading liabilities | 1,592,625 | 14,280 | 62,825 | |||||||||
| Derivative financial instruments | 4,756,695 | 5,743,542 | 4,486,819 | |||||||||
| Borrowings | 7,321,484 | 6,423,003 | 6,122,529 | |||||||||
| Debt securities in issue | 5,323,156 | 5,277,482 | 5,477,778 | |||||||||
| Provisions | 32,236 | 29,664 | 27,709 | |||||||||
| Other liabilities | 3,066,327 | 2,495,142 | 2,842,816 | |||||||||
| Current tax liabilities | 58,978 | 54,851 | 85,503 | |||||||||
| Deferred tax liabilities | 24,778 | 26,957 | 32,794 | |||||||||
| Total liabilities | ¥ | 115,431,259 | ¥ | 114,418,861 | ¥ | 105,372,635 | ||||||
89
Table of Contents
| At March 31, | At April 1, | |||||||||||
| 2010 | 2009 | 2008 | ||||||||||
| (In millions) | ||||||||||||
Domestic offices: | ||||||||||||
| Non-interest-bearing demand deposits | ¥ | 11,332,068 | ¥ | 11,429,205 | ¥ | 10,827,516 | ||||||
| Interest-bearing demand deposits | 30,576,605 | 29,368,330 | 29,258,135 | |||||||||
| Deposits at notice | 1,067,897 | 879,933 | 913,158 | |||||||||
| Time deposits | 25,119,463 | 23,451,996 | 21,901,597 | |||||||||
| Negotiable certificates of deposit | 5,166,705 | 6,032,611 | 2,261,006 | |||||||||
| Others | 3,620,202 | 3,882,491 | 4,066,788 | |||||||||
| Total domestic offices | 76,882,940 | 75,044,566 | 69,228,200 | |||||||||
Foreign offices: | ||||||||||||
| Non-interest-bearing demand deposits | 276,876 | 232,117 | 206,924 | |||||||||
| Interest-bearing demand deposits | 649,991 | 663,889 | 646,887 | |||||||||
| Deposits at notice | 4,295,637 | 4,282,205 | 3,755,134 | |||||||||
| Time deposits | 1,762,779 | 1,575,776 | 1,227,877 | |||||||||
| Negotiable certificates of deposit | 1,828,915 | 1,428,674 | 817,143 | |||||||||
| Others | 835 | 4,007 | 6,793 | |||||||||
| Total foreign offices | 8,815,033 | 8,186,668 | 6,660,758 | |||||||||
| Total deposits | ¥ | 85,697,973 | ¥ | 83,231,234 | ¥ | 75,888,958 | ||||||
| At March 31, | At April 1, | |||||||||||
| 2010 | 2009 | 2008 | ||||||||||
| (In millions) | ||||||||||||
Borrowings: | ||||||||||||
| Short-term borrowings | ¥ | 3,759,006 | ¥ | 2,835,898 | ¥ | 2,287,878 | ||||||
| Long-term borrowings: | ||||||||||||
| Unsubordinated | 1,458,884 | 1,292,349 | 1,368,335 | |||||||||
| Subordinated | 378,730 | 436,000 | 523,500 | |||||||||
| Liabilities associated with securitization | 1,664,686 | 1,835,164 | 1,919,934 | |||||||||
| Lease obligations | 60,178 | 23,592 | 22,882 | |||||||||
| Total borrowings | ¥ | 7,321,484 | ¥ | 6,423,003 | ¥ | 6,122,529 | ||||||
90
Table of Contents
| At March 31, | At April 1, | |||||||||||
| 2010 | 2009 | 2008 | ||||||||||
| (In millions) | ||||||||||||
Debt securities in issue: | ||||||||||||
| Commercial paper | ¥ | 1,885,640 | ¥ | 1,587,930 | ¥ | 1,446,345 | ||||||
| Bonds | 1,191,051 | 1,395,593 | 1,686,055 | |||||||||
| Subordinated bonds | 2,228,192 | 2,277,647 | 2,286,277 | |||||||||
| Other | 18,273 | 16,312 | 59,101 | |||||||||
| Total debt securities in issue | ¥ | 5,323,156 | ¥ | 5,277,482 | ¥ | 5,477,778 | ||||||
| At March 31, | At April 1, | |||||||||||
| 2010 | 2009 | 2008 | ||||||||||
| (In millions) | ||||||||||||
Equity: | ||||||||||||
| Capital stock | ¥ | 2,337,896 | ¥ | 1,370,777 | ¥ | 1,345,727 | ||||||
| Capital surplus | 1,081,432 | 114,594 | 25 | |||||||||
| Retained earnings | 1,663,618 | 1,204,952 | 1,478,736 | |||||||||
| Other reserves | 555,289 | 228,316 | 840,448 | |||||||||
| Treasury stock | (124,062 | ) | (124,024 | ) | (123,989 | ) | ||||||
| Equity attributable to shareholders of Sumitomo Mitsui Financial Group, Inc. | 5,514,173 | 2,794,615 | 3,540,947 | |||||||||
| Non-controlling interests | 2,047,497 | 2,121,400 | 1,622,948 | |||||||||
| Total equity | ¥ | 7,561,670 | ¥ | 4,916,015 | ¥ | 5,163,895 | ||||||
91
Table of Contents
| At and for the fiscal year ended | ||||||||
| March 31, 2010 | ||||||||
| Total equity | Net profit (loss) | |||||||
| (In millions) | ||||||||
| IFRS | ¥ | 7,561,670 | ¥ | 646,693 | ||||
| Differences arising from different accounting for: | ||||||||
| 1. Scope of consolidation | 96,291 | (48,220 | ) | |||||
| 2. Derivative financial instruments | 107,797 | (82,229 | ) | |||||
| 3. Investment securities | (165,130 | ) | (100,800 | ) | ||||
| 4. Loans and advances | (203,448 | ) | (232,754 | ) | ||||
| 5. Investments in associates and joint ventures | 33,679 | (19,634 | ) | |||||
| 6. Property, plant and equipment | 4,012 | (6,518 | ) | |||||
| 7. Lease accounting | (29,821 | ) | 8,752 | |||||
| 8. Defined benefit plans | 112,953 | (45,496 | ) | |||||
| 9. Deferred tax assets | (532,768 | ) | 93,804 | |||||
| 10. Classification of equity and liability | — | (20,165 | ) | |||||
| 11. Foreign currency translation | — | 1,570 | ||||||
| 12. Other | (74,948 | ) | (31,140 | ) | ||||
| 13. Tax effect of the above | 90,518 | 215,364 | ||||||
| Japanese GAAP | ¥ | 7,000,805 | ¥ | 379,227 | ||||
92
Table of Contents
| At March 31, | ||||||||
| 2010 | 2009 | |||||||
| (In millions) | ||||||||
| Loans and advances | ¥ | 71,634,128 | ¥ | 74,669,294 | ||||
| Deposits | 85,697,973 | 83,231,234 | ||||||
| At June 30, 2010 | ||||||||||
| S&P | Fitch | |||||||||
| Long-term | Outlook | Short-term | Long-term | Outlook | Short-term | |||||
| A | S | A-1 | A | S | F-1 | |||||
| At June 30, 2010 | ||||||||||
| S&P | Fitch | |||||||||
| Long-term | Outlook | Short-term | Long-term | Outlook | Short-term | |||||
| A+ | S | A-1 | A | S | F-1 | |||||
93
Table of Contents
94
Table of Contents
| At March 31, | ||||||||
| 2010 | 2009 | |||||||
| (In millions, except percentages) | ||||||||
Tier I capital: | ||||||||
| Capital stock | ¥ | 2,337,895 | ¥ | 1,420,877 | ||||
| Capital surplus | 978,897 | 57,245 | ||||||
| Retained earnings | 1,451,945 | 1,245,085 | ||||||
| Treasury stock | (124,061 | ) | (124,024 | ) | ||||
| Minority interests | 2,042,251 | 2,147,100 | ||||||
| Cash dividends to be paid | (80,665 | ) | (21,059 | ) | ||||
| Unrealized losses on other securities | — | (14,649 | ) | |||||
| Foreign currency translation adjustments | (101,650 | ) | (129,068 | ) | ||||
| Stock acquisition rights | 81 | 66 | ||||||
| Goodwill and others | (398,709 | ) | (186,792 | ) | ||||
| Gains on securitization transactions | (37,453 | ) | (42,102 | ) | ||||
| Amount equivalent to 50% of expected losses in excess of qualifying reserves | (36,249 | ) | (17,590 | ) | ||||
Deductions of deferred tax assets(1) | — | — | ||||||
| Total Tier I capital | 6,032,280 | 4,335,085 | ||||||
Tier II capital: | ||||||||
| Unrealized gains on other securities after 55% discount | 254,032 | — | ||||||
| Land revaluation excess after 55% discount | 37,033 | 37,211 | ||||||
| General reserve for possible loan losses | 69,371 | 80,374 | ||||||
| Excess amount of provisions | — | — | ||||||
| Subordinated debt | 2,203,415 | 2,303,382 | ||||||
| Total Tier II capital | 2,563,853 | 2,420,968 | ||||||
| Deductions | (467,906 | ) | (708,241 | ) | ||||
| Total qualifying capital | ¥ | 8,128,228 | ¥ | 6,047,812 | ||||
Risk-weighted assets: | ||||||||
| On-balance sheet items | 42,684,693 | 41,703,547 | ||||||
| Off-balance sheet items | 7,833,411 | 7,693,647 | ||||||
| Market risk items | 448,397 | 265,723 | ||||||
| Operational risk | 3,117,968 | 3,063,589 | ||||||
| Total risk-weighted assets | ¥ | 54,084,471 | ¥ | 52,726,507 | ||||
| Tier I risk-weighted capital ratio | 11.15% | 8.22% | ||||||
| Total risk-weighted capital ratio | 15.02% | 11.47% | ||||||
| (1) | The amount of net deferred tax assets was ¥702,065 million as of March 31, 2010 and ¥830,370 million as of March 31, 2009. Also, the upper limit of the inclusion of deferred tax assets into basic items was ¥1,206,456 million as of March 31, 2010 and ¥867,017 million as of March 31, 2009. | |
| (2) | Amounts less than ¥1 million have been omitted in the table of risk-weighted capital. As a result, the totals in Japanese yen shown in the above table do not necessarily agree with the sum of the individual amounts. |
95
Table of Contents
| Redemption | ||||||||||
| Aggregate issue | at the option | |||||||||
| Issue date | amount | of issuer(1) | Type | |||||||
| (In billions of yen or millions of dollars or pounds) | ||||||||||
Issued by SMFG’s subsidiaries: | ||||||||||
SMFG Preferred Capital USD 1 Limited(2) | Dec. 2006 | $ | 1,650.0 | Jan. 2017 | Step-up | |||||
SMFG Preferred Capital GBP 1 Limited(2) | Dec. 2006 | £ | 500.0 | Jan. 2017 | Step-up | |||||
| SMFG Preferred Capital JPY 1 Limited | Feb. 2008 | ¥ | 135.0 | Jan. 2018 | Non step-up | |||||
| SMFG Preferred Capital USD 2 Limited | May 2008 | $ | 1,800.0 | Jul. 2013 | Non step-up | |||||
| SMFG Preferred Capital USD 3 Limited | Jul. 2008 | $ | 1,350.0 | Jul. 2018 | Step-up | |||||
| SMFG Preferred Capital GBP 2 Limited | Jul. 2008 | £ | 250.0 | Jan. 2029 | Step-up | |||||
| SMFG Preferred Capital JPY 2 Limited | Dec. 2008 - Jan. 2009 | ¥ | 698.9 | Jan. 2014 | Step-up / Non step-up | |||||
| Series A | Dec. 2008 | ¥ | 113.0 | Jan. 2019 | Step-up | |||||
| Series B | Dec. 2008 | ¥ | 140.0 | Jul. 2019 | Non step-up | |||||
| Series C | Dec. 2008 | ¥ | 140.0 | Jan. 2016 | Non step-up | |||||
| Series D | Dec. 2008 | ¥ | 145.2 | Jan. 2014 | Non step-up | |||||
| Series E | Jan. 2009 | ¥ | 33.0 | Jul. 2019 | Non step-up | |||||
| Series F | Jan. 2009 | ¥ | 2.0 | Jan. 2016 | Non step-up | |||||
| Series G | Jan. 2009 | ¥ | 125.7 | Jan. 2014 | Non step-up | |||||
| SMFG Preferred Capital JPY 3 Limited | Sep. - Oct. 2009 | ¥ | 388.0 | Jan. 2015 | Step-up / Non step-up | |||||
| Series A | Sep. 2009 | ¥ | 99.0 | Jan. 2020 | Step-up | |||||
| Series B | Sep. 2009 | ¥ | 164.5 | Jan. 2020 | Non step-up | |||||
| Series C | Sep. 2009 | ¥ | 79.5 | Jan. 2015 | Non step-up | |||||
| Series D | Oct. 2009 | ¥ | 45.0 | Jan. 2015 | Non step-up | |||||
Issued by a subsidiary of Kansai Urban Banking Corporation: | ||||||||||
| KUBC Preferred Capital Cayman Limited | Jan. 2007 | ¥ | 12.5 | Jul. 2012 | Step-up | |||||
| (1) | Subject to the prior approval of the FSA. Preferred securities are redeemable at any dividend payment date on and after a specific month and the month shown in this column is such a specific month of each preferred securities. | |
| (2) | On February 9, 2010, SMFG Preferred Capital USD 1 Limited and SMFG Preferred Capital GBP 1 Limited completed tender offers for their respective preferred securities. Following the completion of the tender offers, SMFG Preferred Capital USD 1 Limited has $649.1 million preferred securities outstanding and SMFG Preferred Capital GBP 1 Limited has £73.6 million preferred securities outstanding, each on a liquidation preference basis. |
96
Table of Contents
| At March 31, | ||||||||
| 2010 | 2009 | |||||||
Consolidated capital ratios: | ||||||||
| Tier I risk-weighted capital ratio | 12.33 | % | 9.17 | % | ||||
| Total risk-weighted capital ratio | 16.68 | % | 13.54 | % | ||||
Non-consolidated capital ratios: | ||||||||
| Tier I risk-weighted capital ratio | 13.75 | % | 7.26 | % | ||||
| Total risk-weighted capital ratio | 18.28 | % | 13.85 | % | ||||
97
Table of Contents
| At March 31, | ||||||||
| 2010 | 2009 | |||||||
| (In millions) | ||||||||
| Loan commitments | ¥ | 38,824,755 | ¥ | 36,638,141 | ||||
| Financial guarantees and other credit-related contingent liabilities | 3,625,323 | 3,485,849 | ||||||
| Total | ¥ | 42,450,078 | ¥ | 40,123,990 | ||||
98
Table of Contents
| • | the activities of the SPE are being conducted on our behalf according to our specific business needs so that we obtain benefits from the SPE’s operation; | ||
| • | we have the decision-making powers to obtain the majority of the benefits of the activities of the SPE; | ||
| • | we have rights to obtain the majority of the benefits of the SPE and therefore may be exposed to risks incidental to the activities of the SPE; or | ||
| • | we retain the majority of the residual or ownership risks related to the SPE or its assets in order to obtain benefits from its activities. |
99
Table of Contents
| At March 31, 2010 | ||||||||||||
| Conduits- | ||||||||||||
| overseas | ||||||||||||
| Conduits- | (North | |||||||||||
| domestic | America) | Total | ||||||||||
| (In millions) | ||||||||||||
Loans and advances: | ||||||||||||
| Corporations | ¥ | 2,127,549 | ¥ | 105,081 | ¥ | 2,232,630 | ||||||
| Financial institutions | — | 17,680 | 17,680 | |||||||||
| Consumer | — | 15,801 | 15,801 | |||||||||
| Other | — | — | — | |||||||||
| Total loans and advances | 2,127,549 | 138,562 | 2,266,111 | |||||||||
| Other assets | 52,655 | 915 | 53,570 | |||||||||
| Total assets | ¥ | 2,180,204 | ¥ | 139,477 | ¥ | 2,319,681 | ||||||
| At March 31, 2009 | ||||||||||||
| Conduits- | ||||||||||||
| overseas | ||||||||||||
| Conduits- | (North | |||||||||||
| domestic | America) | Total | ||||||||||
| (In millions) | ||||||||||||
Loans and advances: | ||||||||||||
| Corporations | ¥ | 2,762,167 | ¥ | 212,270 | ¥ | 2,974,437 | ||||||
| Financial institutions | — | 19,646 | 19,646 | |||||||||
| Consumer | — | 28,439 | 28,439 | |||||||||
| Other | — | 589 | 589 | |||||||||
| Total loans and advances | 2,762,167 | 260,944 | 3,023,111 | |||||||||
| Other assets | 51,414 | 921 | 52,335 | |||||||||
| Total assets | ¥ | 2,813,581 | ¥ | 261,865 | ¥ | 3,075,446 | ||||||
100
Table of Contents
| At March 31, 2010 | |||||||||||||||||
| Total | Total | ||||||||||||||||
| Conduits- | Provided by | Conduits- | Provided by | ||||||||||||||
| domestic | SMFG | overseas | SMFG | ||||||||||||||
| (In millions) | |||||||||||||||||
| Commercial paper | ¥ | 228,530 | ¥ | — | ¥ | 134,144 | ¥ | — | |||||||||
| Term loans | 1,669,934 | 1,669,934 | 4,596 | 4,596 | |||||||||||||
| Other | 278,975 | — | — | — | |||||||||||||
| Total | ¥ | 2,177,439 | ¥ | 1,669,934 | ¥ | 138,740 | ¥ | 4,596 | |||||||||
| At March 31, 2009 | |||||||||||||||||
| Total | Total | ||||||||||||||||
| Conduits- | Provided by | Conduits- | Provided by | ||||||||||||||
| domestic | SMFG | overseas | SMFG | ||||||||||||||
| (In millions) | |||||||||||||||||
| Commercial paper | ¥ | 367,304 | ¥ | — | ¥ | 201,283 | ¥ | — | |||||||||
| Term loans | 2,100,173 | 2,100,173 | 60,112 | 60,112 | |||||||||||||
| Other | 339,431 | — | — | — | |||||||||||||
| Total | ¥ | 2,806,908 | ¥ | 2,100,173 | ¥ | 261,395 | ¥ | 60,112 | |||||||||
| At March 31, | ||||||||
| 2010 | 2009 | |||||||
| (In millions) | ||||||||
Loans and advances: | ||||||||
| Residential mortgage | ¥ | 1,629,361 | ¥ | 1,719,623 | ||||
| Corporate loans | 120,299 | 191,505 | ||||||
| Lease receivables | 77,833 | 125,711 | ||||||
| Card loans | 151,665 | — | ||||||
| Other | — | 13,493 | ||||||
| Total | ¥ | 1,979,158 | ¥ | 2,050,332 | ||||
101
Table of Contents
| At March 31, 2010 | ||||||||||||||||||||
| Due in one year or | Due from one year | Due from three | Due after five | |||||||||||||||||
| less | to three years | years to five years | years | Total(1) | ||||||||||||||||
| (In millions) | ||||||||||||||||||||
| Time deposits | ¥ | 22,186,996 | ¥ | 3,404,566 | ¥ | 678,462 | ¥ | 618,107 | ¥ | 26,888,131 | ||||||||||
| Negotiable certificate of deposits | 6,959,781 | 33,639 | 2,200 | — | 6,995,620 | |||||||||||||||
| Borrowings | 4,400,909 | 819,750 | 564,468 | 1,475,235 | 7,260,362 | |||||||||||||||
| Debt securities in issue | 2,265,937 | 644,471 | 536,564 | 1,880,185 | 5,327,157 | |||||||||||||||
| Capital (finance) lease obligation | 20,088 | 25,709 | 10,173 | 7,213 | 63,183 | |||||||||||||||
| Operating lease obligation | 17,153 | 25,366 | 17,130 | 27,247 | 86,896 | |||||||||||||||
Purchase obligation(2) | 22,041 | 9,242 | 3,764 | 77 | 35,124 | |||||||||||||||
| Total | ¥ | 35,872,905 | ¥ | 4,962,743 | ¥ | 1,812,761 | ¥ | 4,008,064 | ¥ | 46,656,473 | ||||||||||
| (1) | The amount of interest on debt instruments is not included in the maturity table above due to its insignificance. | |
| (2) | Purchase obligation in above table includes the contractual commitments to purchase goods or services of construction and information technology that are binding on us for the payment of more than ¥100 million. |
102
Table of Contents
| • | the risk management committee; | ||
| • | the auditing committee; | ||
| • | the compensation committee; and | ||
| • | the nominating committee. |
103
Table of Contents
| Name | Current positions and principal outside | |||||||
| (Date of birth) | positions | Business experience | Expiration of current term as director or corporate auditor | |||||
| Masayuki Oku (December 2, 1944) | Chairman of the Board and Representative Director of the Company President and Chief Executive Officer of the Bank | April 1968 | Joined Sumitomo Bank | At the close of the annual general meeting of shareholders to be held for the fiscal year ended March 31, 2011. | ||||
| June 1994 | Director of Sumitomo Bank | |||||||
| November 1998 | Managing Director of Sumitomo Bank | |||||||
| June 1999 | Managing Director and Managing Executive Officer of Sumitomo Bank | |||||||
| January 2001 | Senior Managing Director and Senior Managing Executive Officer of Sumitomo Bank | |||||||
| April 2001 | Senior Managing Director and Senior Managing Executive Officer of the Bank | |||||||
| December 2002 | Resigned as Director of the Bank | |||||||
| December 2002 | Senior Managing Director of the Company | |||||||
| June 2003 | Retired as Director of the Company Deputy President and Executive Officer of the Bank | |||||||
| June 2005 | Chairman of the Board of the Company (to present) | |||||||
| President and Chief Executive Officer of the Bank (to present) | ||||||||
| Teisuke Kitayama (October 26, 1946) | President and Representative Director of the Company Chairman of the Board of the Bank | April 1969 | Joined Mitsui Bank | At the close of the annual general meeting of shareholders to be held for the fiscal year ended March 31, 2012. | ||||
| June 1997 | Director of Sakura Bank | |||||||
| June 1999 | Resigned as Director of Sakura Bank | |||||||
| June 1999 | Executive Officer of Sakura Bank | |||||||
| April 2000 | Managing Executive Officer of Sakura Bank | |||||||
| June 2000 | Managing Director and Managing Executive Officer of Sakura Bank | |||||||
| April 2001 | Managing Director and Managing Executive Officer of the Bank | |||||||
| June 2003 | Senior Managing Executive Officer of the Company | |||||||
| Senior Managing Director and Senior Managing Executive Officer of the Bank | ||||||||
| April 2004 | Deputy President of the Company | |||||||
| June 2004 | Resigned as Director of the Bank | |||||||
| June 2004 | Director and Deputy President of the Company | |||||||
| June 2005 | Director and President of the Company (to present) | |||||||
| Chairman of the Board of the Bank (to present) | ||||||||
| Wataru Ohara (August 17, 1952) | Deputy President and Representative Director of the Company Officer in Charge of Audit Department | April 1975 | Joined Mitsui Bank | At the close of the annual general meeting of shareholders to be held for the fiscal year ended March 31, 2012. | ||||
| June 2002 | Executive Officer of the Bank | |||||||
| April 2006 | Managing Executive Officer of the Bank | |||||||
| April 2007 | Managing Executive Officer of the Company | |||||||
| April 2008 | Senior Managing Executive Officer of the Company | |||||||
| Director and Senior Managing Executive Officer of the Bank | ||||||||
| April 2009 | Deputy President of the Company | |||||||
| Director and Deputy President of the Bank | ||||||||
| March 2010 | Resigned as Director of the Bank | |||||||
| June 2010 | Representative Director and Deputy President of the Company (to present) |
104
Table of Contents
| Name | Current positions and principal outside | |||||||
| (Date of birth) | positions | Business experience | Expiration of current term as director or corporate auditor | |||||
| Hideo Shimada (September 27, 1951) | Director of the Company | April 1975 | Joined Sumitomo Bank | At the close of the annual general meeting of shareholders to be held for the fiscal year ended March 31, 2012. | ||||
Officer in Charge of IT Planning Department Director and Deputy President of the Bank | June 2002 | Executive Officer of the Bank | ||||||
| April 2004 | General Manager, IT Planning Department of the Company | |||||||
| April 2006 | Managing Executive Officer of the Bank | |||||||
| April 2007 | Managing Executive Officer of the Company | |||||||
| April 2008 | Senior Managing Executive Officer of the Company | |||||||
| Director and Senior Managing Executive Officer of the Bank | ||||||||
| April 2010 | Deputy President of the Company | |||||||
| Director and Deputy President of the Bank (to present) | ||||||||
| June 2010 | Director of the Company (to present) | |||||||
| Takeshi Kunibe (March 8, 1954) | Director of the Company | April 1976 | Joined Sumitomo Bank | At the close of the annual general meeting of shareholders to be held for the fiscal year ended March 31, 2011. | ||||
| Officer in charge of Corporate Planning Department, Financial Accounting Department, Strategic Financial Planning Department and Subsidiaries & Affiliates Department Director and Senior Managing Executive Officer of the Bank | June 2003 | Executive Officer of the Bank | ||||||
| April 2004 | General Manager of Corporate Planning Department of the Company | |||||||
| October 2006 | Managing Executive Officer of the Bank | |||||||
| April 2007 | Managing Executive Officer of the Company | |||||||
| June 2007 | Director of the Company (to present) | |||||||
| April 2009 | Director and Senior Managing Executive Officer of the Bank (to present) | |||||||
| Satoru Nakanishi (August 31, 1953) | Director of the Company | April 1976 | Joined Mitsui Bank | At the close of the annual general meeting of shareholders to be held for the fiscal year ended March 31, 2011. | ||||
| Officer in charge of Consumer Business Planning Department Director and Senior Managing Executive Officer of the Bank | April 2004 | Executive Officer of the Bank | ||||||
| April 2006 | Managing Executive Officer of the Bank | |||||||
| April 2009 | Senior Managing Executive Officer of the Company | |||||||
| Director and Senior Managing Executive Officer of the Bank (to present) | ||||||||
| June 2009 | Director of the Company (to present) | |||||||
| Junsuke Fujii (December 22, 1952) | Director of the Company | April 1976 | Joined Sumitomo Bank | At the close of the annual general meeting of shareholders to be held for the fiscal year ended March 31, 2012. | ||||
Officer in charge of General Affairs Department and Human Resources Department Director and Senior Managing Executive Officer of the Bank | December 2002 | General Manager, Human Resources Department of the Company | ||||||
| June 2003 | Executive Officer of the Bank | |||||||
| April 2006 | Managing Executive Officer of the Bank | |||||||
| April 2008 | Managing Executive Officer of the Company | |||||||
| June 2008 | Director of the Company (to present) | |||||||
| April 2009 | Director and Senior Managing Executive Officer of the Bank (to present) |
105
Table of Contents
| Name | Current positions and principal outside | |||||||
| (Date of birth) | positions | Business experience | Expiration of current term as director or corporate auditor | |||||
| Koichi Miyata (November 16, 1953) | Director of the Company | April 1976 | Joined Mitsui Bank | At the close of the annual general meeting of shareholders to be held for the fiscal year ended March 31, 2012. | ||||
| Officer in Charge of Public Relations Department, Corporate Planning Department, Financial Accounting Department, Strategic Financial Planning Department and Corporate Risk Management Department Director and Senior Managing Executive Officer of the Bank | June 2003 | Executive Officer of the Bank | ||||||
| October 2006 | Managing Executive Officer of the Bank | |||||||
| April 2009 | Director and Senior Managing Executive Officer of the Bank (to present) | |||||||
| April 2010 | Senior Managing Executive Officer of the Company | |||||||
| June 2010 | Director of the Company (to present) | |||||||
Shigeru Iwamoto(1) (March 31, 1941) | Director of the Company Director of the Bank | December 1965 | Joined Syuji Ozawa Certified Public Accountant Office | At the close of the annual general meeting of shareholders to be held for the fiscal year ended March 31, 2011. | ||||
| October 1971 | Joined Asahi Accounting Company (currently, KPMG AZSA) | |||||||
| March 1976 | Registered as a certified public accountant (to present) | |||||||
| July 1992 | Representative Partner of Asahi & Co. (currently, KPMG AZSA) | |||||||
| May 1999 | President of Asahi & Co. | |||||||
| January 2004 | President of KPMG AZSA | |||||||
| May 2004 | Chairman of KPMG AZSA | |||||||
| June 2005 | Retired from KPMG AZSA | |||||||
| June 2009 | Director of the Company (to present) | |||||||
| Director of the Bank (to present) | ||||||||
Yoshinori Yokoyama(1) (September 16, 1942) | Director of the Company Director of the Bank Director of ORIX Corporation | April 1966 | Joined Mayekawa Associates, Architects & Engineers | At the close of the annual general meeting of shareholders to be held for the fiscal year ended March 31, 2012. | ||||
| September 1973 | Joined Davis Brody & Associates | |||||||
| September 1975 | Joined McKinsey & Company, Inc. | |||||||
| July 1987 | Director (Senior Partner) of McKinsey & Company, Inc. | |||||||
| June 2002 | Retired from McKinsey & Company, Inc. | |||||||
| June 2002 | Director of ORIX Corporation (to present) | |||||||
| April 2003 | Corporate Auditor of Industrial Revitalization Corporation of Japan | |||||||
| June 2006 | Director of the Company (to present) | |||||||
| Director of the Bank (to present) | ||||||||
Kuniaki Nomura(1) (June 13, 1945) | Director of the Company | April 1970 | Registered as an attorney at law (to present) | At the close of the annual general meeting of shareholders to be held for the fiscal year ended March 31, 2011. | ||||
| Director of the Bank | Attorney at law at Yanagida Law Office (currently, Yanagida & Partners) | |||||||
| June 2009 | Director of the Company (to present) | |||||||
| Director of the Bank (to present) | ||||||||
| Attorney at law at Nomura Law Office (to present) |
106
Table of Contents
| Name | Current positions and principal outside | |||||||
| (Date of birth) | positions | Business experience | Expiration of current term as director or corporate auditor | |||||
| Hiroki Nishio (June 6, 1951) | Corporate Auditor of the Company | April 1974 | Joined Mitsui Bank | At the close of the annual general meeting of shareholders to be held for the fiscal year ended March 31, 2013. | ||||
| Corporate Auditor of the Bank | April 2001 | Executive Officer of the Bank | ||||||
| June 2005 | Managing Executive Officer of the Bank | |||||||
| April 2007 | Director and Senior Managing Executive Officer of the Bank | |||||||
| April 2008 | Senior Managing Executive Officer of the Company Director of the Bank | |||||||
| June 2008 | Resigned as Director of the Bank Senior Managing Director of the Company | |||||||
| April 2009 | Director of the Company | |||||||
| June 2009 | Resigned as Director of the Company | |||||||
| Corporate Auditor of the Company (to present) | ||||||||
| Corporate Auditor of the Bank (to present) | ||||||||
| Yoji Yamaguchi (June 14, 1955) | Corporate Auditor of the Company | April 1978 | Joined Mitsui Bank | At the close of the annual general meeting of shareholders to be held for the fiscal year ended March 31, 2012. | ||||
| July 2004 | General Manager of Hibiya Corporate Business Office I of the Bank | |||||||
| April 2006 | Co-General Manager of General Affairs Department of the Company | |||||||
| General Manager of Administrative Department of the Bank | ||||||||
| April 2008 | Senior Manager of Head Office of the Bank | |||||||
| June 2008 | Corporate Auditor of the Company (to present) | |||||||
| Hideo Sawayama (December 6, 1955) | Corporate Auditor of the Company | April 1979 | Joined Sumitomo Bank | At the close of the annual general meeting of shareholders to be held for the fiscal year ended March 31, 2013. | ||||
| April 2004 | General Manager of Kanda Corporate Business Office II of the Bank | |||||||
| April 2006 | General Manager of Ningyocho Corporate Business Office of the Bank | |||||||
| April 2009 | Senior Manager of Head Office of the Bank | |||||||
| June 2009 | Corporate Auditor of the Company (to present) | |||||||
Hiroshi Araki(2) (April 18, 1931) | Corporate Auditor of the Company | April 1954 | Joined the Tokyo Electric Power Company, Incorporated | At the close of the annual general meeting of shareholders to be held for the fiscal year ended March 31, 2012. | ||||
| Corporate Auditor of the Bank | ||||||||
| Advisor of the Tokyo Electric Power Company, Incorporated | June 1993 | Director and President of the Tokyo Electric Power Company, Incorporated | ||||||
| June 1999 | Chairman of the Board of the Tokyo Electric Power Company, Incorporated | |||||||
| September 2002 | Advisor of the Tokyo Electric Power Company, Incorporated (to present) | |||||||
| June 2004 | Corporate Auditor of the Company (to present) | |||||||
| June 2006 | Corporate Auditor of the Bank (to present) | |||||||
Ikuo Uno(2) (January 4, 1935) | Corporate Auditor of the Company | March 1959 | Joined Nippon Life Insurance Company | At the close of the annual general meeting of shareholders to be held for the fiscal year ended March 31, 2013. | ||||
| Corporate Auditor of the Bank | April 1997 | President of Nippon Life Insurance Company | ||||||
| Chairman of the Board and Representative Director of Nippon Life Insurance Company | April 2005 | Chairman of the Board and Representative Director of Nippon Life Insurance Company (to present) | ||||||
| June 2005 | Corporate Auditor of the Company (to present) | |||||||
| June 2006 | Corporate Auditor of the Bank (to present) |
107
Table of Contents
| Name | Current positions and principal outside | |||||||
| (Date of birth) | positions | Business experience | Expiration of current term as director or corporate auditor | |||||
Satoshi Itoh(2) (July 25, 1942) | Corporate Auditor of the Company Corporate Auditor of the Bank | January 1967 | Joined Tokyo Office of Arthur Andersen & Co. | At the close of the annual general meeting of shareholders to be held for the fiscal year ended March 31, 2013. | ||||
| December 1970 | Registered as a certified public accountant (to present) | |||||||
| September 1978 | Partner of Arthur Andersen & Co. | |||||||
| September 1993 | Representative Partner of Asahi & Co. (currently, KPMG AZSA) | |||||||
| August 2001 | Retired from Arthur Andersen & Co. | |||||||
| Retired from Asahi & Co. (currently, KPMG AZSA) | ||||||||
| April 2002 | Special Professor at Chuo University Graduate School of International Accounting | |||||||
| March 2007 | Retired as Special Professor from Chuo University Graduate School of International Accounting | |||||||
| June 2009 | Corporate Auditor of the Company (to present) | |||||||
| Corporate Auditor of the Bank (to present) |
| (1) | Messrs. Iwamoto, Yokoyama and Nomura satisfy the requirements for an “outside director” under the Companies Act. | |
| (2) | Messrs. Araki, Uno and Itoh satisfy the requirements for an “outside corporate auditor” under the Companies Act. |
108
Table of Contents
109
Table of Contents
110
Table of Contents
| • | U.S. companies listed on the NYSE are required to have an audit committee composed entirely of independent directors. Under the Companies Act of Japan, we are required to have a corporate governance system based on either (i) a board of corporate auditors or (ii) committees. We adopt a corporate governance system based on a board of corporate auditors. The basic function of the board of corporate auditors is similar to that of independent directors, including those who are members of the audit committee, of a NYSE-listed U.S. company, i.e., to monitor the performance of the directors and review and express opinions on the method of auditing by the independent registered public accounting firm and on such accounting firm’s audit reports for the protection of the company’s shareholders. Under the Companies Act, we are required to have at least half of our corporate auditors be outside corporate auditors who meet the independence requirements under the Companies Act. Currently, three of our six corporate auditors are outside corporate auditors that meet such independence requirements. In addition, none of the corporate auditors may at the same time be directors, managers or employees of the company or any of its subsidiaries, or accounting participants or executive officers of such subsidiaries. While the Companies Act does not require corporate auditors to have expertise in accounting or other special knowledge and experience, one of our corporate auditors is a certified |
111
Table of Contents
| • | responsible, to the extent permitted by law, for the appointment, retention and supervision of the work of a registered public accounting firm engaged for the purpose of preparing or issuing an audit report or performing other audit, review or attestation services for us; | ||
| • | subject to procedures for the receipt, retention and treatment of complaints and the confidential, anonymous submission of concerns by employees regarding the status of our internal control system on accounting and financial reporting and internal and external audits; | ||
| • | each corporate auditor has the authority to engage independent counsel and other advisers if such engagement is necessary to carry out her or his duties; and | ||
| • | each corporate auditor has the ability to require us to pay any and all expenses necessary for carrying out her or his duties. |
| • | A NYSE-listed U.S. company is required to have a nominating/corporate governance committee and a compensation committee, all of which must be composed entirely of independent directors. While we, a company which has corporate auditors, are not required to establish a nominating committee or a compensation committee under Japanese law, we voluntarily established similar committees, each with six members, three of which are outside directors, to advise the board of directors on these matters in order to ensure transparency and impartiality in matters of personnel decisions affecting the board of directors and directors’ compensation. | ||
| • | The Companies Act requires that the aggregate amount of remuneration to be paid to all directors and the aggregate amount of remuneration to be paid to all corporate auditors to be determined by a resolution of a general meeting of shareholders, unless their remuneration is provided for in the articles of incorporation. Based on the above resolution, the distribution of remuneration among directors is broadly delegated to our board of directors, which takes into consideration the advisory opinion by the compensation committee, and the distribution of remuneration among corporate auditors is determined by consultation among our corporate auditors. | ||
| • | A NYSE-listed U.S. company must adopt a code of business conduct and ethics and must post the code on its website. While we are not required to adopt such code under Japanese law or the rules of stock exchanges in Japan on which we are listed, we maintain our code of conduct as our standard for corporate conduct to be observed by our directors, officers and employees. |
112
Table of Contents
| Percentage of full-time | ||||
| employees at | ||||
| March 31, 2010 | ||||
Business segment: | ||||
Commercial Banking(1) | 52 | % | ||
| Securities | 14 | |||
| Leasing | 4 | |||
| Credit Card | 4 | |||
| All other | 26 | |||
| Total | 100 | % | ||
| (1) | The number of employees of the Bank represents 39% of the number of our employees on a consolidated basis. Further, the number of employees in the Bank’s Consumer Banking Unit, Middle Market Banking Unit, Corporate Banking Unit, International Banking Unit, Treasury Unit and Others represent 15%, 9%, 1%, 4%, 1% and 9% of the number of our employees on a consolidated basis, respectively. |
| Percentage of full-time | ||||
| employees at | ||||
| March 31, 2010 | ||||
Location: | ||||
| Japan | 91 | % | ||
| Americas | 2 | |||
| Europe and Middle East | 2 | |||
| Asia and Oceania | 5 | |||
| Total | 100 | % | ||
113
Table of Contents
| Directors and corporate auditors: | Number of shares owned | |||
| Masayuki Oku | 4,900 | |||
| Teisuke Kitayama | 4,200 | |||
| Wataru Ohara | 2,400 | |||
| Hideo Shimada | 2,500 | |||
| Takeshi Kunibe | 2,388 | |||
| Satoru Nakanishi | 2,800 | |||
| Junsuke Fujii | 2,300 | |||
| Koichi Miyata | 2,600 | |||
| Shigeru Iwamoto | 6,000 | |||
| Yoshinori Yokoyama | — | |||
| Kuniaki Nomura | — | |||
| Hiroki Nishio | 3,700 | |||
| Yoji Yamaguchi | 1,600 | |||
| Hideo Sawayama | 900 | |||
| Hiroshi Araki | — | |||
| Ikuo Uno | — | |||
| Satoshi Itoh | — | |||
114
Table of Contents
| 2002 SMFG Stock Option Plan | ||
| Date of resolution | June 27, 2002 | |
| Title and number of grantees | 677 directors and employees of the Company and the Bank | |
| Number of stock options | 1,620 | |
| Title and amount of securities called for by the options | 162,000 shares of common stock(1) of the Company | |
| Grant date | August 30, 2002 | |
| Condition for vesting | Not applicable | |
| Requisite service period | Not applicable | |
| Exercise period | June 28, 2004 to June 27, 2012 | |
| Exercise price | ¥6,649 per share subject to adjustment(1)(2) | |
| (1) | We implemented a 100-for-1 stock split of shares of our common stock and adopted a unit share system effective on January 4, 2009. The numbers described above was adjusted to reflect such stock split. At the end of March 31, 2009 and March 31, 2010, 108,100 shares of stock options were outstanding and exercisable up to June 2012. | |
| (2) | As of March 31, 2010. |
115
Table of Contents
| 2010 SMFG Stock Option Plan | ||
| Date of resolution of general meeting of shareholders | June 29, 2010 | |
| Title of grantees. | Directors and corporate auditors of the Company | |
| Number of stock options. | The maximum number of stock acquisition rights to be allocated to directors (excluding outside directors) and corporate auditors (excluding outside corporate auditors) within one year after the date of the general meeting of shareholders in each fiscal year is 1,000 and 400, respectively | |
| The maximum number of shares to be issued upon exercise of stock acquisition rights. | The maximum number of shares to be issued upon exercise of stock acquisition rights to be allocated within one year after the date of the general meeting of shareholders in each fiscal year shall be 100,000 for directors (excluding outside directors) and 40,000 for corporate auditors (excluding outside corporate auditors) | |
| Condition for vesting. | To be determined by a resolution of the board of directors granting options, including the condition that each grantee may exercise his/her stock acquisition rights after retirement | |
| Requisite service period. | Not applicable | |
| Exercise period. | Exercise period of stock acquisition rights shall be decided by the board of directors, but not exceeding 30 years from the date of allocation of stock acquisition rights | |
| Exercise price. | ¥1 per share granted upon exercise of each stock acquisition right, multiplied by the number of shares granted | |
116
Table of Contents
| 2010 SMFG Stock Option Plan | ||
| Date of resolution of board of directors | July 28, 2010 | |
| Title and number of grantees | 82 directors, corporate auditors and executive officers of the Company and the Bank | |
| Number of stock options | 1,026 | |
| The number of shares to be issued upon exercise of stock acquisition rights | 102,600 shares of common stock of the Company | |
| Grant date | August 13, 2010 | |
| Condition for vesting | Grantees may exercise their stock acquisition rights within the Exercise Period from the day when they are relieved from their positions as either as a director, corporate auditor or executive officer of the Company and the Bank and until the expiry of 20 years from such date. Provided, however, that if they are not so relieved until August 12, 2039, they may exercise their stock acquisition rights from August 13, 2039 to August 12, 2040. In addition, if the Company merges into another company or becomes a wholly-owned subsidiary in which case, they may exercise their stock acquisition rights for 15 days after the date of resolution of such merger or other corporate action at the general shareholders meeting of the Company or at the meeting of the board of directors, as applicable. | |
| Requisite service period | Not applicable | |
| Exercise period | August 13, 2010 to August 12, 2040 | |
| Exercise price | ¥1 per share granted upon exercise of each stock acquisition right, multiplied by the number of shares granted | |
117
Table of Contents
| Percentage of | ||||||||
| Number of | shares | |||||||
| Name: | shares held | issued(1) | ||||||
| Japan Trustee Services Bank, Ltd. (Trust Account) | 87,907,618 | 6.21 | % | |||||
| The Master Trust Bank of Japan, Ltd. (Trust Account) | 71,826,900 | 5.07 | % | |||||
| Japan Trustee Services Bank, Ltd. (Trust Account 9) | 26,442,000 | 1.86 | % | |||||
| THE CHASE MANHATTAN BANK, N.A. LONDON SECS LENDING OMNIBUS ACCOUNT | 21,990,703 | 1.55 | % | |||||
| SSBT OD05 OMNIBUS ACCOUNT CHINA TREATY CLIENTS | 18,141,191 | 1.28 | % | |||||
| STATE STREET BANK AND TRUST COMPANY 505223 | 17,697,920 | 1.25 | % | |||||
| STATE STREET BANK AND TRUST COMPANY 505225 | 17,664,774 | 1.24 | % | |||||
| Nippon Life Insurance Company | 15,466,682 | 1.09 | % | |||||
| MELLON BANK, N.A. AS AGENT FOR ITS CLIENT MELLON OMNIBUS US PENSION | 14,761,477 | 1.04 | % | |||||
| THE CHASE MANHATTAN BANK 385036 | 14,565,800 | 1.03 | % | |||||
| (1) | Percentages are calculated based on the total number of common stocks then issued, including our treasury stock, and have been rounded down to the nearest second decimal point. |
| Percentage of | ||||||||
| Number of | shares | |||||||
| Name: | shares held | issued(1) | ||||||
| SUMITOMO LIFE INSURANCE COMPANY | 23,334 | 33.33 | % | |||||
| Nippon Life Insurance Company | 20,000 | 28.57 | % | |||||
| MITSUI LIFE INSURANCE COMPANY LIMITED | 16,667 | 23.81 | % | |||||
| Mitsui Sumitomo Insurance Company, Limited | 10,000 | 14.29 | % | |||||
| (1) | Percentages are calculated based on the total number of preferred stocks then issued and have been rounded down to the nearest second decimal point. |
118
Table of Contents
119
Table of Contents
| Dividend per share | ||||||||
| Fiscal year ended March 31, | Paid(1) | Declared(2) | ||||||
| 2008 | ¥ | 120 | ¥ | 120 | ||||
| 2009 | 90 | 140 | ||||||
| 2010 | 100 | 65 | ||||||
| (1) | Dividend per share based on dividends in respect of each fiscal year including dividends proposed after current year end but not recognized in the financial statements and excluding dividends in respect of the previous fiscal year declared in current fiscal year. | |
| (2) | Dividend per share based on dividends declared and recognized in the financial statements during each fiscal year. |
120
Table of Contents
| Price per Share | Average daily trading volume | |||||||||||
| Fiscal year ended March 31, except quarter and month data: | High | Low | ||||||||||
| (Number of | ||||||||||||
| (In yen) | shares) | |||||||||||
| 2005 | ¥ | 8,540 | ¥ | 5,990 | 3,441,120 | |||||||
| 2006 | 13,700 | 6,590 | 3,781,119 | |||||||||
| 2007 | 13,900 | 10,100 | 3,211,378 | |||||||||
| 2008 | 12,100 | 6,330 | 4,948,529 | |||||||||
| 2009: | ||||||||||||
| First quarter | 9,640 | 6,570 | 7,087,019 | |||||||||
| Second quarter | 8,950 | 5,640 | 7,434,384 | |||||||||
| Third quarter | 6,720 | 2,685 | 10,376,319 | |||||||||
| Fourth quarter | 4,250 | 2,585 | 8,374,583 | |||||||||
| Full year | 9,640 | 2,585 | 8,135,967 | |||||||||
| 2010: | ||||||||||||
| First quarter | 4,520 | 2,905 | 14,221,225 | |||||||||
| Second quarter | 4,240 | 2,970 | 8,817,765 | |||||||||
| Third quarter | 3,500 | 2,610 | 11,095,290 | |||||||||
| Fourth quarter | 3,160 | 2,591 | 19,279,462 | |||||||||
| Full year | 4,520 | 2,591 | 13,310,559 | |||||||||
| Most recent six months: | ||||||||||||
| April | 3,355 | 3,055 | 12,788,676 | |||||||||
| May | 3,015 | 2,611 | 14,963,117 | |||||||||
| June | 2,760 | 2,500 | 8,452,777 | |||||||||
| July | 2,687 | 2,451 | 11,967,629 | |||||||||
| August | 2,743 | 2,496 | 8,104,395 | |||||||||
| September | 2,666 | 2,424 | 10,396,055 | |||||||||
| October (through October 15, 2010) | 2,533 | 2,365 | 14,223,800 | |||||||||
121
Table of Contents
| Number of shares | Number of shares | |||||||
| authorized(1) | issued(2) | |||||||
Share type: | ||||||||
| Common stock, without par value | 1,500,000,000 | 1,414,055,625 | ||||||
| Preferred stock (Type 4) | 50,100 | — | ||||||
| Preferred stock (Type 5) | 167,000 | — | ||||||
| Preferred stock (Type 6) | 70,001 | 70,001 | ||||||
| Preferred stock (Type 7) | 167,000 | — | ||||||
| Preferred stock (Type 8) | 115,000 | — | ||||||
| Preferred stock (Type 9) | 115,000 | — | ||||||
| Total | 1,500,684,101 | 1,414,125,626 | ||||||
| (1) | At the shareholders meeting held on June 29, 2010, we amended our articles of incorporation to increase the total number of authorized shares of common stock from 1,500,000,000 to 3,000,000,000 and to delete the provision regarding 50,100 shares of authorized preferred stock (Type 4). Accordingly, the total number of authorized shares was increased from 1,500,684,101 to 3,000,634,001. | |
| (2) | Includes 3,730,100 shares of common stock held as treasury stock. |
122
Table of Contents
| Applicable | ||||||||||||||||||
| Number of | Number of | exercise | ||||||||||||||||
| outstanding shares | outstanding shares | price/amount paid | ||||||||||||||||
| Issue date or period | issued or repurchased | after issue or repurchase | per share | |||||||||||||||
| (In yen) | ||||||||||||||||||
Types of issue or repurchase: | ||||||||||||||||||
| Conversion of the Fifth to Eighth series Type 4 preferred stock | April 30, 2008 | Common stock issued: | 157,151 | 8,010,905.77 | 318,800 | |||||||||||||
| Cancellation of the Fifth to Eighth series Type 4 preferred stock | May 16, 2008 | Fifth to Eighth series Type 4 preferred stock: | (16,700 | ) | 7,994,205.77 | N.A. | ||||||||||||
| 1 to 100 stock split | January 4, 2009 | Common stock issued: | 781,189,672.23 | 789,183,878 | N.A. | |||||||||||||
| Issuance of common stock | June 22, 2009 | Common stock issued: | 219,700,000 | 1,008,883,878 | 3,766 | |||||||||||||
| Issuance of common stock | July 27, 2009 | Common stock issued: | 8,931,300 | 1,017,815,178 | 3,766 | |||||||||||||
| Issuance of common stock | January 27, 2010 | Common stock issued: | 340,000,000 | 1,357,815,178 | 2,702.81 | |||||||||||||
| Conversion of the First to Fourth and Ninth to Twelfth series Type 4 preferred stock | January 28, 2010 | Common stock issued: | 36,343,848 | 1,394,159,026 | 2,757 | |||||||||||||
| Cancellation of the First to Fourth and Ninth to Twelfth series Type 4 preferred stock | February 8, 2010 | First to Fourth and Ninth to Twelfth series Type 4 preferred stock: | (33,400 | ) | 1,394,125,626 | N.A. | ||||||||||||
| Issuance of common stock | February 10, 2010 | Common stock issued: | 20,000,000 | 1,414,125,626 | 2,702.81 | |||||||||||||
| • | management of banks and other corporations which are permitted to become, or to be established as, subsidiaries under the Banking Act; and | ||
| • | any business incidental to the business mentioned in the foregoing item. |
| • | a director is not entitled to vote on a proposal or arrangement or contract in which the director has a special interest; | ||
| • | the remuneration for directors are determined at a general meeting of shareholders and, within the upper limit approved at the shareholders’ meeting, the board of directors will determine the amount of compensation for each director; however, the board of directors may, by its resolution, leave such decision to the discretion of our representative director; | ||
| • | the board of directors has authority to approve transactions between the directors and us; |
123
Table of Contents
| • | there are no provisions requiring the mandatory retirement of directors at a specified age; and | ||
| • | share ownership is not required in order to be eligible to serve as a director. |
124
Table of Contents
| (1) | our articles of incorporation so provide (our current articles of incorporation do not have a provision to that effect); | ||
| (2) | the normal term of office of our directors is no longer than one year (our current articles of incorporation provide the normal term of office of our directors expires upon the conclusion of the ordinary general shareholders’ meeting to be held for the last fiscal year ending within two years after the election); and | ||
| (3) | our non-consolidated annual financial statements and certain documents for the latest fiscal year fairly present our assets and profit or loss, as required by an ordinance of the Ministry of Justice. |
| “A” = | the total amount of other capital surplus and other retained earnings, each being the amount that appears on our non-consolidated balance sheet as of the end of the last fiscal year; | ||
| “B” = | if we have disposed of treasury stock after the end of the last fiscal year, the amount of the consideration for that treasury stock received by us less the book value thereof; |
125
Table of Contents
| “C” = | if we have reduced our stated capital after the end of the last fiscal year, the amount of that reduction less the portion thereof that has been transferred to capital reserve or retained earnings (if any); | ||
| “D” = | if we have reduced our capital reserve or retained earnings after the end of the last fiscal year, the amount of that reduction less the portion thereof that has been transferred to stated capital (if any); | ||
| “E” = | if we have cancelled treasury stock after the end of the last fiscal year, the book value of that treasury stock; | ||
| “F” = | if we have distributed surplus to our shareholders after the end of the last fiscal year, the total book value of the surplus so distributed; and | ||
| “G” = | other amounts set forth in an ordinance of the Ministry of Justice, including: |
| • | if we have reduced surplus and increased our stated capital, capital reserve or retained earnings after the end of the last fiscal year, the amount of that reduction; and | ||
| • | if we have distributed surplus to shareholders after the end of the last fiscal year, the amount set aside in our capital reserve or retained earnings, if any, as required by ordinances of the Ministry of Justice. |
| • | amending the articles of incorporation (except for amendments that may be authorized by the board of directors under the Companies Act); | ||
| • | reducing stated capital which meets certain requirements, with some exceptions; |
126
Table of Contents
| • | removing a corporate auditor; | ||
| • | dissolving, merging or consolidating requiring shareholders’ approval; | ||
| • | establishing a parent and a wholly owned subsidiary relationship by way of a share transfer (kabushiki-iten) or share exchange (kabushiki-kokan) requiring shareholders’ approval; | ||
| • | transferring the whole or a substantial part of our business; | ||
| • | taking over the whole business of another company requiring shareholders’ approval; | ||
| • | corporate split requiring shareholders’ approval; | ||
| • | consolidating shares of common stock; | ||
| • | acquiring shares of common stock from a specific shareholder other than one of our subsidiaries; | ||
| • | issuing or transferring new shares or existing shares held by us as treasury stock to persons other than the shareholders at a specially favorable price; | ||
| • | issuing stock acquisition rights (including those incorporated in bonds with stock acquisition rights) to persons other than the shareholders under specially favorable conditions; | ||
| • | exempting some liability of a director or corporate auditor; and | ||
| • | distributing surplus in-kind if shareholders are not granted the right to require us to make a distribution in cash instead of in-kind. |
127
Table of Contents
128
Table of Contents
129
Table of Contents
130
Table of Contents
| • | from the commencement of our annual general meeting of shareholders if an agenda for approval to declare a preferred dividend is not submitted to the meeting; or | ||
| • | from the close of our annual general meeting of shareholders if a proposed resolution to declare a preferred dividend is not approved at the meeting. |
| • | amendments to the articles of incorporation to add new classes of shares to be issued, alter the terms of the shares or increase the number of shares or authorized number of any class of shares, with certain exceptions; | ||
| • | consolidations or splits of shares; | ||
| • | dividends of shares or stock acquisition rights to shareholders without any consideration; | ||
| • | grants of preemptive rights for new shares or stock acquisition rights; | ||
| • | amalgamations or mergers; | ||
| • | certain corporate splits; | ||
| • | share exchanges; | ||
| • | share transfers; and | ||
| • | other matters set forth in the articles of incorporation. |
131
Table of Contents
132
Table of Contents
| • | individuals not residing in Japan; | ||
| • | corporations which are organized under the laws of foreign countries or whose principal offices are located outside Japan; | ||
| • | corporations of which 50% or more of the voting rights are held, directly or indirectly, by individuals not residing in Japan and/or corporations which are organized under the laws of foreign countries or whose principal offices are located outside Japan; and | ||
| • | corporations, a majority of officers (or a majority of officers having the power of representation) of which are individuals not residing in Japan. |
133
Table of Contents
134
Table of Contents
135
Table of Contents
| • | certain financial institutions; | ||
| • | insurance companies; | ||
| • | dealers and certain traders in securities; | ||
| • | persons holding shares or ADSs as part of a hedge, straddle, conversion or other integrated transaction; | ||
| • | persons whose functional currency for U.S. federal income tax purposes is not the U.S. dollar; | ||
| • | regulated investment companies; | ||
| • | real estate investment trusts; | ||
| • | partnerships or other entities classified as partnerships for U.S. federal income tax purposes; | ||
| • | persons liable for the alternative minimum tax; | ||
| • | tax-exempt entities, including an “individual retirement account” or “Roth IRA”; | ||
| • | persons who acquired our shares or ADSs pursuant to the exercise of an employee stock option or otherwise as compensation; | ||
| • | persons holding shares or ADSs that own or are deemed to own 10% or more of our voting stock; or | ||
| • | persons holding shares or ADSs in connection with a trade or business conducted outside the United States. |
136
Table of Contents
137
Table of Contents
138
Table of Contents
| • | set forth Group-wide basic policies for risk management after specifying the categories of risk to which these policies apply; | ||
| • | provide all necessary guidance to the Group companies to enable them to follow the Group-wide basic policies for risk management set forth by SMFG and set up their own appropriate risk management systems; and | ||
| • | monitor the risk management procedures implemented by all Group companies to ensure that their practices meet the relevant standards. |
| • | managing risk on a Group-wide basis; | ||
| • | managing risk using quantification methods; | ||
| • | ensuring consistency with business strategies; | ||
| • | setting up a system of checks and balances; | ||
| • | establishing contingency plans for emergencies and serious situations; and |
139
Table of Contents
| • | verifying preparedness to handle reasonably conceivable risk situations. |
140
Table of Contents
141
Table of Contents
142
Table of Contents
143
Table of Contents
| • | the historical simulation method; | ||
| • | a one-sided confidence interval of 99.0%; | ||
| • | a one-day holding period; and | ||
| • | an observation period of 4 years. |
144
Table of Contents
145
Table of Contents
| SMBC consolidated | SMFG consolidated | |||||||||||||||||||||||
| Strategic equity | Strategic equity | |||||||||||||||||||||||
| Trading | Banking | investment | Trading | Banking | investment | |||||||||||||||||||
| (In billions) | ||||||||||||||||||||||||
| Maximum | ¥ | 2.8 | ¥ | 42.4 | ¥ | 175.2 | ¥ | 2.8 | ¥ | 44.0 | ¥ | 178.6 | ||||||||||||
| Minimum | 1.2 | 30.9 | 100.4 | 1.2 | 31.8 | 102.3 | ||||||||||||||||||
| Daily average | 1.6 | 36.2 | 130.0 | 1.6 | 37.7 | 132.6 | ||||||||||||||||||
| SMBC consolidated | SMFG consolidated | |||||||||||||||||||||||
| Strategic equity | Strategic equity | |||||||||||||||||||||||
| Trading | Banking | investment | Trading | Banking | investment | |||||||||||||||||||
| (In billions) | ||||||||||||||||||||||||
| Maximum | ¥ | 2.8 | ¥ | 41.8 | ¥ | 170.4 | ¥ | 2.8 | ¥ | 43.9 | ¥ | 174.0 | ||||||||||||
| Minimum | 1.4 | 24.0 | 89.3 | 1.4 | 26.9 | 91.0 | ||||||||||||||||||
| Daily average | 2.0 | 31.5 | 131.9 | 2.0 | 34.2 | 134.9 | ||||||||||||||||||
| SMBC consolidated | SMFG consolidated | |||||||||||||||||||||||
| Strategic equity | Strategic equity | |||||||||||||||||||||||
| Trading | Banking | investment | Trading | Banking | investment | |||||||||||||||||||
| (In billions) | ||||||||||||||||||||||||
| Interest rate risk | ¥ | 0.8 | ¥ | 28.4 | ¥ | — | ¥ | 0.8 | ¥ | 29.3 | ¥ | — | ||||||||||||
| Foreign exchange risk | 0.8 | 0.0 | — | 0.8 | 0.0 | — | ||||||||||||||||||
Equities and commodities risk(1) | 0.2 | 7.4 | 121.0 | 0.2 | 7.4 | 123.4 | ||||||||||||||||||
Others(2) | 0.2 | 1.2 | — | 0.2 | 1.2 | — | ||||||||||||||||||
| Total VaR | 1.5 | 32.8 | 121.0 | 1.5 | 33.8 | 123.4 | ||||||||||||||||||
146
Table of Contents
| SMBC consolidated | SMFG consolidated | |||||||||||||||||||||||
| Strategic equity | Strategic equity | |||||||||||||||||||||||
| Trading | Banking | investment | Trading | Banking | investment | |||||||||||||||||||
| (In billions) | ||||||||||||||||||||||||
| Interest rate risk | ¥ | 0.8 | ¥ | 35.9 | ¥ | — | ¥ | 0.8 | ¥ | 38.1 | ¥ | — | ||||||||||||
| Foreign exchange risk | 1.2 | 0.0 | — | 1.2 | 0.0 | — | ||||||||||||||||||
Equities and commodities risk(1) | 0.1 | 5.8 | 143.1 | 0.1 | 5.8 | 146.2 | ||||||||||||||||||
Others(2) | 0.3 | 0.0 | — | 0.3 | 0.0 | — | ||||||||||||||||||
| Total VaR | 2.0 | 39.2 | 143.1 | 2.0 | 41.4 | 146.2 | ||||||||||||||||||
| (1) | Commodities risk is insignificant. | |
| (2) | This amount includes the VaR at certain subsidiaries. |
| • | The use of historical data as a proxy for estimating future events may underestimate the probability of extreme market movements. Past market movement is not necessarily a good indicator of future events. | ||
| • | The use of a holding period assumes that all positions can be liquidated or hedged in that period of time. This assumption does not fully capture the market risk arising during periods of illiquidity, when liquidation or hedging in that period of time may not be possible. | ||
| • | The use of a confidence level neither takes account of, nor makes any statement about, any losses that might occur beyond this level of confidence. | ||
| • | VaR does not capture all of the complex effects of the risk factors on the value of positions and portfolios and could underestimate potential losses. |
147
Table of Contents
| The Bank consolidated | ||||||||
| At March 31, | ||||||||
| 2010 | 2009 | |||||||
| (In billions, except percentages) | ||||||||
| Total | ¥ | 532.7 | ¥ | 588.4 | ||||
| Impact of yen interest rates | 396.7 | 272.4 | ||||||
| Impact of U.S. dollar interest rates | 90.3 | 202.4 | ||||||
| Impact of euro interest rates | 33.2 | 60.4 | ||||||
| Percentage of Tier I + Tier II | 6.1 | % | 8.6 | % | ||||
| Note: | Decline in economic value is the decline of the present value of banking portfolio after interest rate shocks (1st and 99th percentile of observed interest rate changes using a 1-year holding period and 5 years of observables). |
148
Table of Contents
149
Table of Contents
150
Table of Contents
151
Table of Contents
| • | issue and deliver additional ADSs as in the case of a share dividend; | ||
| • | amend the deposit agreement and the applicable ADRs; | ||
| • | amend the applicable registration statements on Form F-6 filed with the SEC in respect of the ADSs; | ||
| • | call for the surrender of outstanding ADRs to be exchanged for new ADRs; and | ||
| • | take any other actions as appropriate to reflect the transaction. |
152
Table of Contents
153
Table of Contents
| • | payment of stock transfer or other taxes or other governmental charges and transfer or registration fees charged by third parties for the transfer of any shares or other deposited securities; | ||
| • | satisfactory proof of the identity and genuineness of any signature or other information it deems necessary; and | ||
| • | compliance with any laws or governmental regulations, or such reasonable regulations that the depositary and we may establish consistent with the deposit agreement. |
| • | when temporary delays arise because: (i) the depositary has closed its transfer books or we have closed our transfer books; (ii) the transfer of shares is blocked to permit voting at a shareholders’ meeting; or (iii) we are paying a dividend on our shares; | ||
| • | when you or other ADS holders seeking to withdraw shares owe money to pay fees, taxes and similar charges; or | ||
| • | when it is necessary to prohibit withdrawals in order to comply with any laws or governmental regulations that apply to ADSs or to the withdrawal of shares or other deposited securities. |
| • | preceded or accompanied by a written representation and agreement from the person to whom ADSs are to be delivered whereby such person, (i) represents it or its customer, owns the shares or ADSs to be remitted, as the case may be, (ii) agrees to indicate the depositary as owner of such shares or ADSs in its records and to hold such shares or ADSs in trust for the depositary until delivered to the custodian, (iii) unconditionally guarantees to deliver to the custodian the Shares or ADSs and (iv) agrees to any additional restrictions or requirements that the depositary deems appropriate; | ||
| • | at all times fully collateralized with cash, U.S. government securities or such other collateral as the depositary deems appropriate; |
154
Table of Contents
| • | terminable by the depositary on not more than five business days’ notice; and | ||
| • | subject to such further indemnities and credit regulations as the depositary deems appropriate. In addition, the depositary will normally limit the number of ADSs that may be outstanding at any time as a result of pre-release, although the depositary may disregard the limit from time to time, if it thinks it is appropriate to do so. |
| • | are not liable if either of us is prevented or delayed by law, regulation or circumstances beyond our control from performing our obligations under the deposit agreement; | ||
| • | are not liable if either of us exercises or fails to exercise discretion permitted under the deposit agreement; | ||
| • | are not liable for any action or inaction in reliance upon the advice from legal counsel or accountants, or any other person believed by it in good faith to be competent to give such advice, or any information from any person presenting shares for deposit, any holder, any beneficial owner or authorized representative thereof; | ||
| • | are not liable for the inability of any ADS holder to benefit from any distribution, offering, right or other benefit which is made available to shareholders but is not under the terms of the deposit agreement made available to holders of ADSs; | ||
| • | are not liable for consequential or punitive damages for any breach of the terms of the deposit agreement; and | ||
| • | are only obligated to take the actions specifically set forth in the deposit agreement; | ||
| • | have no obligation to become involved in a lawsuit or other proceeding related to the ADSs or the deposit agreement on your behalf or on behalf of any other party. |
155
Table of Contents
| Service | Fees | |
| Issuance of ADSs | Up to U.S. 5¢ per ADS issued | |
| Cancellation of ADSs | Up to U.S. 5¢ per ADS canceled | |
| Distribution of cash dividends or other cash distributions | Up to U.S. 5¢ per ADS held | |
| Distribution of ADSs pursuant to stock dividends, free stock distributions or exercises of rights. | Up to U.S. 5¢ per ADS held | |
| Distribution of securities other than ADSs or rights to purchase additional ADSs | Up to U.S. 5¢ per ADS held | |
| Depositary services | Up to U.S. 5¢ per ADS held on the applicable record date(s) established by the depositary |
| • | taxes (including applicable interest and penalties) and other governmental charges; | ||
| • | such registration fees as may from time to time be in effect for the registration of shares or other deposited securities on the share register and applicable to transfers of shares or other deposited securities to or from the name of the custodian, the depositary or any nominees upon the making of deposits and withdrawals, respectively; | ||
| • | such cable, telex and facsimile transmission and delivery expenses as are expressly provided in the deposit agreement to be at the expense of the person depositing or withdrawing shares or holders and beneficial owners of ADSs; | ||
| • | the expenses and charges incurred by the depositary in the conversion of foreign currency; | ||
| • | such fees and expenses as are incurred by the depositary in connection with compliance with exchange control regulations and other regulatory requirements applicable to shares, deposited securities, ADSs and ADRs; and | ||
| • | the fees and expenses incurred by the depositary, the custodian, or any nominee in connection with the servicing or delivery of deposited securities. |
156
Table of Contents
157
Table of Contents
| Exhibit 1.1 | Articles of Incorporation of Sumitomo Mitsui Financial Group, Inc., as amended on June 29, 2010 | |
| Exhibit 1.2 | Regulations of the Board of Directors of Sumitomo Mitsui Financial Group, Inc., as amended on March 25, 2008 | |
| Exhibit 1.3 | Share Handling Regulations of Sumitomo Mitsui Financial Group, Inc., as amended on June 29, 2010 | |
| Exhibit 2.1 | Form of Deposit Agreement among the registrant, Citibank, N.A., as Depositary, and all owners and holders from time to time of American Depositary Shares issued thereunder | |
| Exhibit 8.1 | List of subsidiaries of Sumitomo Mitsui Financial Group, Inc., as of March 31, 2010 | |
| Exhibit 15.1 | Consent of Independent Registered Public Accounting Firm |
158
Table of Contents
| Sumitomo Mitsui Financial Group, Inc. | ||||
| By: | /s/ Teisuke Kitayama | |||
| Name: | Teisuke Kitayama | |||
| Title: | President and Representative Director | |||
159
Table of Contents
| For the fiscal year ended March 31, | ||||||||||||||||||||||||
| 2010 | 2009 | |||||||||||||||||||||||
| Interest | Interest | |||||||||||||||||||||||
| Average balance | income | Average rate | Average balance | income | Average rate | |||||||||||||||||||
| (In millions, except percentages) | ||||||||||||||||||||||||
Interest-earning assets: | ||||||||||||||||||||||||
| Interest-earning deposits with other banks: | ||||||||||||||||||||||||
| Domestic offices | ¥ | 222,757 | ¥ | 1,005 | 0.45% | ¥ | 569,321 | ¥ | 7,409 | 1.30% | ||||||||||||||
| Foreign offices | 2,054,195 | 13,591 | 0.66% | 1,715,303 | 38,172 | 2.23% | ||||||||||||||||||
| Total | 2,276,952 | 14,596 | 0.64% | 2,284,624 | 45,581 | 2.00% | ||||||||||||||||||
| Call loans and bills bought: | ||||||||||||||||||||||||
| Domestic offices | 347,177 | 2,500 | 0.72% | 401,158 | 5,404 | 1.35% | ||||||||||||||||||
| Foreign offices | 819,819 | 4,952 | 0.60% | 635,338 | 10,797 | 1.70% | ||||||||||||||||||
| Total | 1,166,996 | 7,452 | 0.64% | 1,036,496 | 16,201 | 1.56% | ||||||||||||||||||
| Reverse repurchase agreements and cash collateral on securities borrowed: | ||||||||||||||||||||||||
| Domestic offices | 2,509,461 | 8,634 | 0.34% | 854,797 | 5,664 | 0.66% | ||||||||||||||||||
| Foreign offices | 24,899 | 802 | 3.22% | 136,182 | 1,942 | 1.43% | ||||||||||||||||||
| Total | 2,534,360 | 9,436 | 0.37% | 990,979 | 7,606 | 0.77% | ||||||||||||||||||
Trading assets(1): | ||||||||||||||||||||||||
| Domestic offices | 1,954,014 | 7,270 | 0.37% | 1,171,989 | 8,861 | 0.76% | ||||||||||||||||||
| Foreign offices | 103,244 | 1,780 | 1.72% | 66,588 | 2,907 | 4.37% | ||||||||||||||||||
| Total | 2,057,258 | 9,050 | 0.44% | 1,238,577 | 11,768 | 0.95% | ||||||||||||||||||
Financial assets at fair value through profit or loss(2): | ||||||||||||||||||||||||
| Domestic offices | 1,990,261 | 11,664 | 0.59% | 1,969,275 | 15,218 | 0.77% | ||||||||||||||||||
Held-to-maturity investments(3): | ||||||||||||||||||||||||
| Domestic offices | 2,830,378 | 28,784 | 1.02% | 1,601,687 | 17,138 | 1.07% | ||||||||||||||||||
Available-for-sale financial assets(3): | ||||||||||||||||||||||||
| Domestic offices | 13,561,413 | 104,254 | 0.77% | 11,575,425 | 122,548 | 1.06% | ||||||||||||||||||
| Foreign offices | 1,120,526 | 17,819 | 1.59% | 1,037,788 | 31,050 | 2.99% | ||||||||||||||||||
| Total | 14,681,939 | 122,073 | 0.83% | 12,613,213 | 153,598 | 1.22% | ||||||||||||||||||
Loans and advances(4) : | ||||||||||||||||||||||||
| Domestic offices | 64,768,749 | 1,317,068 | 2.03% | 63,451,358 | 1,424,878 | 2.25% | ||||||||||||||||||
| Foreign offices | 10,451,249 | 266,638 | 2.55% | 11,611,878 | 499,046 | 4.30% | ||||||||||||||||||
| Total | 75,219,998 | 1,583,706 | 2.11% | 75,063,236 | 1,923,924 | 2.56% | ||||||||||||||||||
| Total interest-earning assets: | ||||||||||||||||||||||||
| Domestic offices | 88,184,210 | 1,481,179 | 1.68% | 81,595,010 | 1,607,120 | 1.97% | ||||||||||||||||||
| Foreign offices | 14,573,932 | 305,582 | 2.10% | 15,203,077 | 583,914 | 3.84% | ||||||||||||||||||
| Total | 102,758,142 | 1,786,761 | 1.74% | 96,798,087 | 2,191,034 | 2.26% | ||||||||||||||||||
Non-interest-earning assets: | ||||||||||||||||||||||||
| Cash and due from banks | 2,228,009 | 2,012,249 | ||||||||||||||||||||||
| Other non-interest-earning assets | 20,334,857 | 19,388,464 | ||||||||||||||||||||||
| Allowance for loan losses | (1,635,248 | ) | (1,259,802 | ) | ||||||||||||||||||||
| Total non-interest-earning assets | 20,927,618 | 20,140,911 | ||||||||||||||||||||||
Total assets | ¥ | 123,685,760 | ¥ | 116,938,998 | ||||||||||||||||||||
| Total assets attributable to foreign offices | 14.2% | 15.1% | ||||||||||||||||||||||
A-1
Table of Contents
| For the fiscal year ended March 31, | ||||||||||||||||||||||||
| 2010 | 2009 | |||||||||||||||||||||||
| Interest | Interest | |||||||||||||||||||||||
| Average balance | expense | Average rate | Average balance | expense | Average rate | |||||||||||||||||||
| (In millions, except percentages) | ||||||||||||||||||||||||
Interest-bearing liabilities: | ||||||||||||||||||||||||
| Deposits: | ||||||||||||||||||||||||
| Domestic offices | ¥ | 65,150,510 | ¥ | 119,055 | 0.18% | ¥ | 60,532,595 | ¥ | 215,634 | 0.36% | ||||||||||||||
| Foreign offices | 8,916,248 | 54,319 | 0.61% | 7,312,931 | 164,463 | 2.25% | ||||||||||||||||||
| Total | 74,066,758 | 173,374 | 0.23% | 67,845,526 | 380,097 | 0.56% | ||||||||||||||||||
| Call money and bills sold: | ||||||||||||||||||||||||
| Domestic offices | 1,857,443 | 2,855 | 0.15% | 2,727,860 | 12,528 | 0.46% | ||||||||||||||||||
| Foreign offices | 1,207,668 | 3,392 | 0.28% | 768,717 | 10,143 | 1.32% | ||||||||||||||||||
| Total | 3,065,111 | 6,247 | 0.20% | 3,496,577 | 22,671 | 0.65% | ||||||||||||||||||
| Repurchase agreements and cash collateral on securities lent: | ||||||||||||||||||||||||
| Domestic offices | 3,472,016 | 6,843 | 0.20% | 4,618,897 | 62,029 | 1.34% | ||||||||||||||||||
| Foreign offices | 365,884 | 703 | 0.19% | 558,910 | 5,474 | 0.98% | ||||||||||||||||||
| Total | 3,837,900 | 7,546 | 0.20% | 5,177,807 | 67,503 | 1.30% | ||||||||||||||||||
Trading liabilities(1): | ||||||||||||||||||||||||
| Domestic offices | 546,183 | 3,095 | 0.57% | 31,082 | 245 | 0.79% | ||||||||||||||||||
| Foreign offices | 470 | 12 | 2.55% | 1,922 | 79 | 4.11% | ||||||||||||||||||
| Total | 546,653 | 3,107 | 0.57% | 33,004 | 324 | 0.98% | ||||||||||||||||||
| Borrowings: | ||||||||||||||||||||||||
| Domestic offices | 6,066,674 | 60,837 | 1.00% | 5,692,628 | 75,665 | 1.33% | ||||||||||||||||||
| Foreign offices | 471,182 | 18,467 | 3.92% | 530,854 | 27,249 | 5.13% | ||||||||||||||||||
| Total | 6,537,856 | 79,304 | 1.21% | 6,223,482 | 102,914 | 1.65% | ||||||||||||||||||
| Debt securities in issue: | ||||||||||||||||||||||||
| Domestic offices | 4,783,157 | 67,785 | 1.42% | 4,691,973 | 75,851 | 1.62% | ||||||||||||||||||
| Foreign offices | 431,283 | 10,543 | 2.44% | 482,434 | 24,320 | 5.04% | ||||||||||||||||||
| Total | 5,214,440 | 78,328 | 1.50% | 5,174,407 | 100,171 | 1.94% | ||||||||||||||||||
| Other interest-bearing liabilities: | ||||||||||||||||||||||||
| Domestic offices | 83,198 | 1,977 | 2.38% | 96,403 | 2,908 | 3.02% | ||||||||||||||||||
| Foreign offices | 4,518 | 34 | 0.75% | 3,852 | 29 | 0.75% | ||||||||||||||||||
| Total | 87,716 | 2,011 | 2.29% | 100,255 | 2,937 | 2.93% | ||||||||||||||||||
| Total interest-bearing liabilities: | ||||||||||||||||||||||||
| Domestic offices | 81,959,181 | 262,447 | 0.32% | 78,391,438 | 444,860 | 0.57% | ||||||||||||||||||
| Foreign offices | 11,397,253 | 87,470 | 0.77% | 9,659,620 | 231,757 | 2.40% | ||||||||||||||||||
| Total | 93,356,434 | 349,917 | 0.37% | 88,051,058 | 676,617 | 0.77% | ||||||||||||||||||
Non-interest-bearing liabilities | 24,775,374 | 23,895,713 | ||||||||||||||||||||||
Total equity | 5,553,952 | 4,992,227 | ||||||||||||||||||||||
Total equity and liabilities | ¥ | 123,685,760 | ¥ | 116,938,998 | ||||||||||||||||||||
| Total liabilities attributable to foreign offices | 12.1% | 10.7% | ||||||||||||||||||||||
| Net interest income and interest rate spread | ¥ | 1,436,844 | 1.37% | ¥ | 1,514,417 | 1.49% | ||||||||||||||||||
| Net interest income as a percentage of total interest-earning assets | 1.40% | 1.56% | ||||||||||||||||||||||
| (1) | The net amount of interest income on trading assets and interest expense on trading liabilities is reported as net trading income in our consolidated income statement. | |
| (2) | Interest income on financial assets at fair value through profit or loss is reported in net income (loss) from financial assets at fair value through profit or loss in our consolidated income statement. | |
| (3) | Taxable investment securities and non-taxable investment securities are not disclosed separately because the aggregate effect of these average balances and interest income would not be material. In addition, the yields on tax-exempt obligations have not been calculated on a tax equivalent basis because the effect of such calculation would not be material. | |
| (4) | Loans and advances include impaired loans and advances. The amortized portion of net loan origination fees (costs) is included in interest income on loans and advances. |
A-2
Table of Contents
A-3
Table of Contents
| Fiscal year ended March 31, 2010 compared with | ||||||||||||
| fiscal year ended March 31, 2009 | ||||||||||||
| Increase / (decrease) | ||||||||||||
| Volume | Rate | Net change | ||||||||||
| (In millions) | ||||||||||||
Interest income: | ||||||||||||
| Interest-earning deposits with other banks: | ||||||||||||
| Domestic offices | ¥ | (3,089 | ) | ¥ | (3,315 | ) | ¥ | (6,404 | ) | |||
| Foreign offices | 6,379 | (30,960 | ) | (24,581 | ) | |||||||
| Total | 3,290 | (34,275 | ) | (30,985 | ) | |||||||
| Call loans and bills bought: | ||||||||||||
| Domestic offices | (651 | ) | (2,253 | ) | (2,904 | ) | ||||||
| Foreign offices | 2,507 | (8,352 | ) | (5,845 | ) | |||||||
| Total | 1,856 | (10,605 | ) | (8,749 | ) | |||||||
| Reverse repurchase agreements and cash collateral on securities borrowed: | ||||||||||||
| Domestic offices | 6,742 | (3,772 | ) | 2,970 | ||||||||
| Foreign offices | (2,373 | ) | 1,233 | (1,140 | ) | |||||||
| Total | 4,369 | (2,539 | ) | 1,830 | ||||||||
| Trading assets: | ||||||||||||
| Domestic offices | 4,207 | (5,798 | ) | (1,591 | ) | |||||||
| Foreign offices | 1,139 | (2,266 | ) | (1,127 | ) | |||||||
| Total | 5,346 | (8,064 | ) | (2,718 | ) | |||||||
| Financial assets at fair value through profit or loss: | ||||||||||||
| Domestic offices | 161 | (3,715 | ) | (3,554 | ) | |||||||
| Held-to-maturity investments: | ||||||||||||
| Domestic offices | 12,535 | (889 | ) | 11,646 | ||||||||
| Available-for-sale financial assets: | ||||||||||||
| Domestic offices | 18,808 | (37,102 | ) | (18,294 | ) | |||||||
| Foreign offices | 2,307 | (15,538 | ) | (13,231 | ) | |||||||
| Total | 21,115 | (52,640 | ) | (31,525 | ) | |||||||
| Loans and advances: | ||||||||||||
| Domestic offices | 29,080 | (136,890 | ) | (107,810 | ) | |||||||
| Foreign offices | (45,879 | ) | (186,529 | ) | (232,408 | ) | ||||||
| Total | (16,799 | ) | (323,419 | ) | (340,218 | ) | ||||||
| Total interest income: | ||||||||||||
| Domestic offices | 67,793 | (193,734 | ) | (125,941 | ) | |||||||
| Foreign offices | (35,920 | ) | (242,412 | ) | (278,332 | ) | ||||||
| Total | ¥ | 31,873 | ¥ | (436,146 | ) | ¥ | (404,273 | ) | ||||
A-4
Table of Contents
| Fiscal year ended March 31, 2010 compared with | ||||||||||||
| fiscal year ended March 31, 2009 | ||||||||||||
| Increase / (decrease) | ||||||||||||
| Volume | Rate | Net change | ||||||||||
| (In millions) | ||||||||||||
Interest expense: | ||||||||||||
| Deposits: | ||||||||||||
| Domestic offices | ¥ | 15,365 | ¥ | (111,944 | ) | ¥ | (96,579 | ) | ||||
| Foreign offices | 29,980 | (140,124 | ) | (110,144 | ) | |||||||
| Total | 45,345 | (252,068 | ) | (206,723 | ) | |||||||
| Call money and bills sold: | ||||||||||||
| Domestic offices | (3,135 | ) | (6,538 | ) | (9,673 | ) | ||||||
| Foreign offices | 3,875 | (10,626 | ) | (6,751 | ) | |||||||
| Total | 740 | (17,164 | ) | (16,424 | ) | |||||||
| Repurchase agreements and cash collateral on securities lent: | ||||||||||||
| Domestic offices | (12,440 | ) | (42,746 | ) | (55,186 | ) | ||||||
| Foreign offices | (1,434 | ) | (3,337 | ) | (4,771 | ) | ||||||
| Total | (13,874 | ) | (46,083 | ) | (59,957 | ) | ||||||
| Trading liabilities: | ||||||||||||
| Domestic offices | 2,938 | (88 | ) | 2,850 | ||||||||
| Foreign offices | (45 | ) | (22 | ) | (67 | ) | ||||||
| Total | 2,893 | (110 | ) | 2,783 | ||||||||
| Borrowings: | ||||||||||||
| Domestic offices | 4,714 | (19,542 | ) | (14,828 | ) | |||||||
| Foreign offices | (2,830 | ) | (5,952 | ) | (8,782 | ) | ||||||
| Total | 1,884 | (25,494 | ) | (23,610 | ) | |||||||
| Debt securities in issue: | ||||||||||||
| Domestic offices | 1,449 | (9,515 | ) | (8,066 | ) | |||||||
| Foreign offices | (2,352 | ) | (11,425 | ) | (13,777 | ) | ||||||
| Total | (903 | ) | (20,940 | ) | (21,843 | ) | ||||||
| Other interest-bearing liabilities: | ||||||||||||
| Domestic offices | (365 | ) | (566 | ) | (931 | ) | ||||||
| Foreign offices | 5 | — | 5 | |||||||||
| Total | (360 | ) | (566 | ) | (926 | ) | ||||||
| Total interest expense: | ||||||||||||
| Domestic offices | 8,526 | (190,939 | ) | (182,413 | ) | |||||||
| Foreign offices | 27,199 | (171,486 | ) | (144,287 | ) | |||||||
| Total | 35,725 | (362,425 | ) | (326,700 | ) | |||||||
Net interest income: | ||||||||||||
| Domestic offices | 59,267 | (2,795 | ) | 56,472 | ||||||||
| Foreign offices | (63,119 | ) | (70,926 | ) | (134,045 | ) | ||||||
| Total | ¥ | (3,852 | ) | ¥ | (73,721 | ) | ¥ | (77,573 | ) | |||
A-5
Table of Contents
| At March 31, | ||||||||||||||||||||||||||||||||||||
| 2010 | 2009 | 2008 | ||||||||||||||||||||||||||||||||||
| Net | Net | Net | ||||||||||||||||||||||||||||||||||
| Amortized | Estimated | unrealized | Amortized | Estimated | unrealized | Amortized | Estimated | unrealized | ||||||||||||||||||||||||||||
| cost | fair value | gains (losses) | cost | fair value | gains (losses) | cost | fair value | gains (losses) | ||||||||||||||||||||||||||||
| (In millions) | ||||||||||||||||||||||||||||||||||||
Held-to-maturity investments: | ||||||||||||||||||||||||||||||||||||
| Domestic: | ||||||||||||||||||||||||||||||||||||
| Japanese government bonds | ¥ | 2,871,212 | ¥ | 2,919,808 | ¥ | 48,596 | ¥ | 1,574,005 | ¥ | 1,596,292 | ¥ | 22,287 | ¥ | 614,281 | ¥ | 625,029 | ¥ | 10,748 | ||||||||||||||||||
| Japanese municipal bonds | 154,281 | 157,358 | 3,077 | 96,312 | 97,265 | 953 | 97,312 | 98,903 | 1,591 | |||||||||||||||||||||||||||
| Japanese corporate bonds | 246,519 | 253,457 | 6,938 | 392,210 | 396,216 | 4,006 | 390,070 | 394,679 | 4,609 | |||||||||||||||||||||||||||
| Other debt instruments | — | — | — | — | — | — | — | — | — | |||||||||||||||||||||||||||
| Total domestic | 3,272,012 | 3,330,623 | 58,611 | 2,062,527 | 2,089,773 | 27,246 | 1,101,663 | 1,118,611 | 16,948 | |||||||||||||||||||||||||||
| Foreign: | ||||||||||||||||||||||||||||||||||||
| U.S. Treasury and other U.S. government agencies bonds | — | — | — | — | — | — | — | — | — | |||||||||||||||||||||||||||
| Other governments and official institutions bonds | — | — | — | — | — | — | — | — | — | |||||||||||||||||||||||||||
| Other debt instruments | — | — | — | 9,181 | 8,677 | (504 | ) | 9,186 | 8,994 | (192 | ) | |||||||||||||||||||||||||
| Total foreign | — | — | — | 9,181 | 8,677 | (504 | ) | 9,186 | 8,994 | (192 | ) | |||||||||||||||||||||||||
| Total | ¥ | 3,272,012 | ¥ | 3,330,623 | ¥ | 58,611 | ¥ | 2,071,708 | ¥ | 2,098,450 | ¥ | 26,742 | ¥ | 1,110,849 | ¥ | 1,127,605 | ¥ | 16,756 | ||||||||||||||||||
Available-for-sale financial assets: | ||||||||||||||||||||||||||||||||||||
| Domestic: | ||||||||||||||||||||||||||||||||||||
| Japanese government bonds | ¥ | 11,901,492 | ¥ | 11,925,487 | ¥ | 23,995 | ¥ | 11,265,476 | ¥ | 11,278,166 | ¥ | 12,690 | ¥ | 6,954,928 | ¥ | 6,970,197 | ¥ | 15,269 | ||||||||||||||||||
| Japanese municipal bonds | 266,387 | 268,291 | 1,904 | 242,394 | 242,316 | (78 | ) | 342,642 | 341,802 | (840 | ) | |||||||||||||||||||||||||
| Japanese corporate bonds | 435,063 | 438,664 | 3,601 | 618,574 | 614,074 | (4,500 | ) | 671,252 | 672,156 | 904 | ||||||||||||||||||||||||||
| Other debt instruments | 205,108 | 217,639 | 12,531 | 192,242 | 208,671 | 16,429 | 186,123 | 206,130 | 20,007 | |||||||||||||||||||||||||||
| Equity instruments | 2,147,999 | 3,168,320 | 1,020,321 | 2,102,051 | 2,637,781 | 535,730 | 2,324,484 | 3,716,518 | 1,392,034 | |||||||||||||||||||||||||||
| Total domestic | 14,956,049 | 16,018,401 | 1,062,352 | 14,420,737 | 14,981,008 | 560,271 | 10,479,429 | 11,906,803 | 1,427,374 | |||||||||||||||||||||||||||
| Foreign: | ||||||||||||||||||||||||||||||||||||
| U.S. Treasury and other U.S. government agencies bonds | 2,071,258 | 2,049,546 | (21,712 | ) | 2,967,799 | 2,971,004 | 3,205 | 2,940,403 | 2,946,879 | 6,476 | ||||||||||||||||||||||||||
| Other governments and official institutions bonds | 1,283,130 | 1,283,591 | 461 | 2,316,989 | 2,339,322 | 22,333 | 1,471,220 | 1,462,546 | (8,674 | ) | ||||||||||||||||||||||||||
| Mortgage-backed securities | 4,595 | 4,637 | 42 | 230,649 | 245,740 | 15,091 | 231,226 | 233,120 | 1,894 | |||||||||||||||||||||||||||
| Other debt instruments | 223,396 | 224,855 | 1,459 | 182,196 | 174,495 | (7,701 | ) | 211,027 | 205,065 | (5,962 | ) | |||||||||||||||||||||||||
| Equity instruments | 196,383 | 299,146 | 102,763 | 132,260 | 146,252 | 13,992 | 109,701 | 127,222 | 17,521 | |||||||||||||||||||||||||||
| Total foreign | 3,778,762 | 3,861,775 | 83,013 | 5,829,893 | 5,876,813 | 46,920 | 4,963,577 | 4,974,832 | 11,255 | |||||||||||||||||||||||||||
| Total | ¥ | 18,734,811 | ¥ | 19,880,176 | ¥ | 1,145,365 | ¥ | 20,250,630 | ¥ | 20,857,821 | ¥ | 607,191 | ¥ | 15,443,006 | ¥ | 16,881,635 | ¥ | 1,438,629 | ||||||||||||||||||
A-6
Table of Contents
| Later than one year | Later than five years | |||||||||||||||||||||||||||||||||||||||
| Not later than | and not later than | and not later than | Later than | |||||||||||||||||||||||||||||||||||||
| one year | five years | ten years | ten years | Total | ||||||||||||||||||||||||||||||||||||
| Amount | Yield | Amount | Yield | Amount | Yield | Amount | Yield | Amount | Yield | |||||||||||||||||||||||||||||||
| (In millions, except percentages) | ||||||||||||||||||||||||||||||||||||||||
Held-to-maturity investments: | ||||||||||||||||||||||||||||||||||||||||
| Domestic: | ||||||||||||||||||||||||||||||||||||||||
| Japanese government bonds | ¥ | 65,494 | 0.45% | ¥ | 2,410,124 | 0.90% | ¥ | 395,594 | 1.31% | ¥ | — | — | ¥ | 2,871,212 | 0.94% | |||||||||||||||||||||||||
| Japanese municipal bonds | 355 | �� | 0.38% | 114,936 | 1.00% | 38,990 | 1.41% | — | — | 154,281 | 1.10% | |||||||||||||||||||||||||||||
| Japanese corporate bonds | 3,000 | 0.65% | 188,621 | 1.26% | 54,898 | 1.42% | — | — | 246,519 | 1.29% | ||||||||||||||||||||||||||||||
| Other debt instruments | — | — | — | — | — | — | — | — | — | — | ||||||||||||||||||||||||||||||
| Total domestic | 68,849 | 0.46% | 2,713,681 | 0.93% | 489,482 | 1.33% | — | — | 3,272,012 | 0.98% | ||||||||||||||||||||||||||||||
| Foreign: | ||||||||||||||||||||||||||||||||||||||||
| U.S. Treasury government and other U.S. government agencies bonds | — | — | — | — | — | — | — | — | — | — | ||||||||||||||||||||||||||||||
| Other governments and official institutions bonds | — | — | — | — | — | — | — | — | — | — | ||||||||||||||||||||||||||||||
| Other debt instruments | — | — | — | — | — | — | — | — | — | — | ||||||||||||||||||||||||||||||
| Total foreign | — | — | — | — | — | — | — | — | — | — | ||||||||||||||||||||||||||||||
| Total | ¥ | 68,849 | 0.46% | ¥ | 2,713,681 | 0.93% | ¥ | 489,482 | 1.33% | ¥ | — | — | ¥ | 3,272,012 | 0.98% | |||||||||||||||||||||||||
Available-for-sale financial assets: | ||||||||||||||||||||||||||||||||||||||||
| Domestic: | ||||||||||||||||||||||||||||||||||||||||
| Japanese government bonds | ¥ | 8,244,847 | 0.35% | ¥ | 3,503,687 | 0.54% | ¥ | 166,994 | 1.19% | ¥ | 9,959 | 1.85% | ¥ | 11,925,487 | 0.42% | |||||||||||||||||||||||||
| Japanese municipal bonds | 22,734 | 0.57% | 220,254 | 0.81% | 25,254 | 0.95% | 49 | 1.96% | 268,291 | 0.80% | ||||||||||||||||||||||||||||||
| Japanese corporate bonds | 119,012 | 0.99% | 304,535 | 1.05% | 15,096 | 1.24% | 21 | 0.00% | 438,664 | 1.04% | ||||||||||||||||||||||||||||||
| Other debt instruments | — | — | 217,639 | 3.16% | — | — | — | — | 217,639 | 3.16% | ||||||||||||||||||||||||||||||
| Total domestic | 8,386,593 | 0.36% | 4,246,115 | 0.73% | 207,344 | 1.17% | 10,029 | 1.85% | 12,850,081 | 0.50% | ||||||||||||||||||||||||||||||
| Foreign: | ||||||||||||||||||||||||||||||||||||||||
| U.S. Treasury and other U.S. government agencies bonds | 45,970 | 0.20% | 1,701,625 | 1.58% | 250,471 | 3.18% | 51,480 | 2.06% | 2,049,546 | 1.76% | ||||||||||||||||||||||||||||||
| Other governments and official institutions bonds | 383,205 | 2.37% | 667,960 | 2.06% | 232,426 | 2.70% | — | — | 1,283,591 | 2.27% | ||||||||||||||||||||||||||||||
| Mortgage-backed securities. | — | — | 145 | 0.00% | — | — | 4,492 | 0.44% | 4,637 | 0.43% | ||||||||||||||||||||||||||||||
| Other debt instruments | 55,117 | 1.78% | 145,552 | 1.12% | 23,183 | 3.58% | 1,003 | 3.75% | 224,855 | 1.55% | ||||||||||||||||||||||||||||||
| Total foreign | 484,292 | 2.10% | 2,515,282 | 1.68% | 506,080 | 2.98% | 56,975 | 1.96% | 3,562,629 | 1.93% | ||||||||||||||||||||||||||||||
| Total | ¥ | 8,870,885 | 0.46% | ¥ | 6,761,397 | 1.08% | ¥ | 713,424 | 2.45% | ¥ | 67,004 | 1.94% | ¥ | 16,412,710 | 0.81% | |||||||||||||||||||||||||
A-7
Table of Contents
| Amortized | Estimated fair | |||||||
| cost | value | |||||||
| (In millions) | ||||||||
| German government bonds | ¥ | 811,010 | ¥ | 821,677 | ||||
| At March 31, | ||||||||||||
| 2010 | 2009 | 2008 | ||||||||||
| (In millions) | ||||||||||||
Domestic: | ||||||||||||
| Manufacturing | ¥ | 8,428,854 | ¥ | 8,836,291 | ¥ | 7,555,462 | ||||||
| Agriculture, forestry, fisheries and mining | 162,879 | 163,647 | 259,803 | |||||||||
| Construction | 1,492,690 | 1,716,567 | 1,815,201 | |||||||||
| Transportation, communications and public enterprises | 3,519,279 | 3,606,748 | 3,244,752 | |||||||||
| Wholesale and retail | 5,552,637 | 6,201,520 | 6,350,694 | |||||||||
| Finance and insurance | 3,431,882 | 3,613,653 | 3,582,845 | |||||||||
| Real estate and goods rental and leasing | 8,751,450 | 9,264,523 | 9,393,149 | |||||||||
| Services | 4,644,737 | 4,947,995 | 5,141,719 | |||||||||
| Municipalities | 1,346,611 | 1,274,196 | 1,086,548 | |||||||||
| Lease financing | 2,320,651 | 2,562,727 | 2,658,423 | |||||||||
Consumer(1) | 17,544,284 | 16,377,870 | 15,733,316 | |||||||||
| Others | 5,137,721 | 5,446,206 | 5,077,704 | |||||||||
| Total domestic | 62,333,675 | 64,011,943 | 61,899,616 | |||||||||
Foreign: | ||||||||||||
| Public sector | 147,115 | 82,598 | 115,942 | |||||||||
| Financial institutions | 2,031,812 | 1,812,218 | 1,897,715 | |||||||||
| Commerce and industry | 8,161,198 | 9,282,120 | 8,283,544 | |||||||||
| Lease financing | 205,547 | 239,728 | 227,508 | |||||||||
| Others | 442,225 | 1,017,223 | 830,568 | |||||||||
| Total foreign | 10,987,897 | 12,433,887 | 11,355,277 | |||||||||
| Gross loans and advances | 73,321,572 | 76,445,830 | 73,254,893 | |||||||||
| Adjust: Unearned income, unamortized premiums-net and deferred loan fees-net | (153,889 | ) | (176,906 | ) | (176,387 | ) | ||||||
| Less: Allowance for loan losses | (1,533,555 | ) | (1,599,630 | ) | (1,094,226 | ) | ||||||
| Net loans and advances | ¥ | 71,634,128 | ¥ | 74,669,294 | ¥ | 71,984,280 | ||||||
| (1) | The balance in Consumer mainly consists of housing loans. The housing loan balances amounted to ¥14,436,921 million, ¥13,577,902 million and ¥13,067,503 million at March 31, 2010, 2009 and 2008, respectively. |
A-8
Table of Contents
| Maturity | ||||||||||||||||
| Later than one | ||||||||||||||||
| Not later than one | year and not later | Later than five | ||||||||||||||
| year | than five years | years | Total | |||||||||||||
| (In millions) | ||||||||||||||||
Domestic: | ||||||||||||||||
| Manufacturing | ¥ | 4,585,929 | ¥ | 3,210,865 | ¥ | 632,060 | ¥ | 8,428,854 | ||||||||
| Agriculture, forestry, fisheries and mining | 97,221 | 39,092 | 26,566 | 162,879 | ||||||||||||
| Construction | 851,209 | 483,605 | 157,876 | 1,492,690 | ||||||||||||
| Transportation, communications and public enterprises | 1,333,437 | 1,677,188 | 508,654 | 3,519,279 | ||||||||||||
| Wholesale and retail | 3,175,371 | 1,909,083 | 468,183 | 5,552,637 | ||||||||||||
| Finance and insurance | 2,134,593 | 1,203,747 | 93,542 | 3,431,882 | ||||||||||||
| Real estate and goods rental and leasing | 3,318,872 | 3,922,232 | 1,510,346 | 8,751,450 | ||||||||||||
| Services | 1,741,828 | 1,903,613 | 999,296 | 4,644,737 | ||||||||||||
| Municipalities | 278,033 | 524,340 | 544,238 | 1,346,611 | ||||||||||||
| Lease financing | 808,202 | 1,352,488 | 159,961 | 2,320,651 | ||||||||||||
| Consumer | 2,456,494 | 3,219,790 | 11,868,000 | 17,544,284 | ||||||||||||
| Others | 1,480,716 | 1,130,793 | 2,526,212 | 5,137,721 | ||||||||||||
| Total domestic | 22,261,905 | 20,576,836 | 19,494,934 | 62,333,675 | ||||||||||||
Foreign: | ||||||||||||||||
| Public sector | 44,630 | 53,103 | 49,382 | 147,115 | ||||||||||||
| Financial institutions | 733,244 | 806,245 | 492,323 | 2,031,812 | ||||||||||||
| Commerce and industry | 2,696,906 | 3,724,709 | 1,739,583 | 8,161,198 | ||||||||||||
| Lease financing | 20,046 | 68,610 | 116,891 | 205,547 | ||||||||||||
| Others | 179,158 | 245,775 | 17,292 | 442,225 | ||||||||||||
| Total foreign | 3,673,984 | 4,898,442 | 2,415,471 | 10,987,897 | ||||||||||||
| Total | ¥ | 25,935,889 | ¥ | 25,475,278 | ¥ | 21,910,405 | ¥ | 73,321,572 | ||||||||
| The above loans and advances due after one year which had predetermined interest rates and floating or adjustable interest rates at March 31, 2010 are shown below: | ||||||||||||||||
| Domestic | Foreign | Total | ||||||||||||||
| (In millions) | ||||||||||||||||
| Predetermined rate | ¥ | 12,992,376 | ¥ | 681,853 | ¥ | 13,674,229 | ||||||||||
| Floating or adjustable rate | 27,079,394 | 6,632,060 | 33,711,454 | |||||||||||||
| Total | ¥ | 40,071,770 | ¥ | 7,313,913 | ¥ | 47,385,683 | ||||||||||
A-9
Table of Contents
A-10
Table of Contents
| At March 31, | ||||||||||||
| 2010 | 2009 | 2008 | ||||||||||
| (In millions) | ||||||||||||
Potentially bankrupt, effectively bankrupt and bankrupt (loans and advances): | ||||||||||||
| Domestic: | ||||||||||||
| Manufacturing | ¥ | 180,642 | ¥ | 164,736 | ¥ | 92,741 | ||||||
| Agriculture, forestry, fisheries and mining | 7,014 | 4,842 | 1,424 | |||||||||
| Construction | 125,674 | 141,581 | 88,436 | |||||||||
| Transportation, communications and public enterprises | 78,726 | 64,451 | 62,950 | |||||||||
| Wholesale and retail | 233,124 | 217,549 | 181,170 | |||||||||
| Finance and insurance | 30,287 | 53,776 | 21,823 | |||||||||
| Real estate and goods rental and leasing | 622,944 | 566,916 | 188,899 | |||||||||
| Services | 260,917 | 227,103 | 200,822 | |||||||||
| Lease financing | 52,648 | 45,379 | 31,753 | |||||||||
| Consumer | 242,106 | 214,620 | 193,801 | |||||||||
| Others | 62,351 | 61,663 | 49,464 | |||||||||
| Total domestic | 1,896,433 | 1,762,616 | 1,113,283 | |||||||||
| Foreign: | ||||||||||||
| Public sector | 4,564 | 13 | 13 | |||||||||
| Financial institutions | 36,381 | 64,827 | 34,291 | |||||||||
| Commerce and industry | 135,958 | 165,772 | 26,065 | |||||||||
| Lease financing | 33 | 3,151 | 6,693 | |||||||||
| Others | 15,901 | 6,617 | 5,564 | |||||||||
| Total foreign | 192,837 | 240,380 | 72,626 | |||||||||
| Total | 2,089,270 | 2,002,996 | 1,185,909 | |||||||||
Past due three months or more (loans): | ||||||||||||
| Domestic | 28,434 | 31,012 | 36,646 | |||||||||
| Foreign | 635 | 11,045 | 1,139 | |||||||||
| Total | 29,069 | 42,057 | 37,785 | |||||||||
Restructured (loans): | ||||||||||||
| Domestic | 127,392 | 160,658 | 259,525 | |||||||||
| Foreign | 37,007 | 7,940 | 32,923 | |||||||||
| Total | 164,399 | 168,598 | 292,448 | |||||||||
Other impaired (loans and advances): | ||||||||||||
| Domestic | 158,653 | 121,971 | 181,835 | |||||||||
| Foreign | 1,760 | 6,069 | 5,667 | |||||||||
| Total | 160,413 | 128,040 | 187,502 | |||||||||
| Gross impaired loans and advances | 2,443,151 | 2,341,691 | 1,703,644 | |||||||||
| Less: Allowance for loan losses | (1,282,610 | ) | (1,204,091 | ) | (936,510 | ) | ||||||
| Net impaired loans and advances | ¥ | 1,160,541 | ¥ | 1,137,600 | ¥ | 767,134 | ||||||
A-11
Table of Contents
| At March 31, 2009 | ||||||||||||||||||||||||
| Public | % of total | Undrawn | ||||||||||||||||||||||
| institutions | Banks | Others | Total | assets | commitments | |||||||||||||||||||
| (In millions, except percentages) | ||||||||||||||||||||||||
| United Kingdom | ¥ | 413 | ¥ | 61,804 | ¥ | 898,111 | ¥ | 960,328 | 0.81% | ¥ | 249,912 | |||||||||||||
A-12
Table of Contents
| For the fiscal year ended | ||||||||
| March 31, | ||||||||
| 2010 | 2009 | |||||||
| (In millions, except percentages) | ||||||||
| Allowance for loan losses at the beginning of the fiscal year | ¥ | 1,599,630 | ¥ | 1,094,226 | ||||
| Provision (credit) for loan losses | 215,886 | 849,495 | ||||||
Charge-offs: | ||||||||
| Domestic: | ||||||||
| Manufacturing | 43,059 | 26,405 | ||||||
| Agriculture, forestry, fisheries and mining | 713 | 648 | ||||||
| Construction | 31,779 | 40,185 | ||||||
| Transportation, communications and public enterprises | 24,999 | 28,004 | ||||||
| Wholesale and retail | 73,299 | 71,934 | ||||||
| Finance and insurance | 701 | 8,717 | ||||||
| Real estate and goods rental and leasing | 53,930 | 30,989 | ||||||
| Services | 66,826 | 47,742 | ||||||
| Lease financing | 1,400 | 3,664 | ||||||
| Consumer | 57,436 | 47,255 | ||||||
| Others | 6,753 | 598 | ||||||
| Total domestic | 360,895 | 306,141 | ||||||
| Foreign: | ||||||||
| Financial institutions | 504 | 13,667 | ||||||
| Commerce and industry | 23,095 | 15,982 | ||||||
| Lease financing | 19 | 50 | ||||||
| Others | 2 | 1,034 | ||||||
| Total foreign | 23,620 | 30,733 | ||||||
| Total | 384,515 | 336,874 | ||||||
Recoveries: | ||||||||
| Domestic: | ||||||||
| Manufacturing | 31 | 6 | ||||||
| Construction | 11 | 4 | ||||||
| Transportation, communications and public enterprises | 7 | 8 | ||||||
| Wholesale and retail | 27 | 3 | ||||||
| Real estate and goods rental and leasing | 11 | 1 | ||||||
| Services | 26 | 7 | ||||||
| Consumer | 836 | 820 | ||||||
| Others | 4 | 233 | ||||||
| Total domestic | 953 | 1,082 | ||||||
| Foreign: | ||||||||
| Financial institutions | — | 1 | ||||||
| Commerce and industry | 6 | 5 | ||||||
| Others | 10 | 9 | ||||||
| Total foreign | 16 | 15 | ||||||
| Total | 969 | 1,097 | ||||||
| Net charge-offs | 383,546 | 335,777 | ||||||
Others(1) | 101,585 | (8,314 | ) | |||||
| Allowance for loan losses at the end of the fiscal year | ¥ | 1,533,555 | ¥ | 1,599,630 | ||||
| Allowance for loan losses applicable to foreign activities: | ||||||||
| Balance at the beginning of the fiscal year | ¥ | 192,325 | ¥ | 92,248 | ||||
| Balance at the end of the fiscal year | ¥ | 121,797 | ¥ | 192,325 | ||||
| Provision (credit) for loan losses | ¥ | (42,830 | ) | ¥ | 137,898 | |||
| Ratio of net charge-offs during the fiscal year to average loans outstanding during the fiscal year | 0.51% | 0.45% | ||||||
| (1) | Others mainly included an increase in allowance for loan losses of ¥102,687 million from acquisition of subsidiaries for the fiscal year ended March 31, 2010, whereas the amount for the fiscal year ended March 31, 2009 was primarily from foreign exchange translations. |
A-13
Table of Contents
| At March 31, | ||||||||||||||||||||||||
| 2010 | 2009 | 2008 | ||||||||||||||||||||||
| % of loans in | % of loans in | % of loans in | ||||||||||||||||||||||
| each category | each category | each category | ||||||||||||||||||||||
| Amount | to total loans | Amount | to total loans | Amount | to total loans | |||||||||||||||||||
| (In millions, except percentages) | ||||||||||||||||||||||||
Domestic: | ||||||||||||||||||||||||
| Manufacturing | ¥ | 163,598 | 11.50 | % | ¥ | 155,886 | 11.56 | % | ¥ | 93,400 | 10.31 | % | ||||||||||||
| Agriculture, forestry, fisheries and mining | 4,453 | 0.22 | % | 2,621 | 0.21 | % | 1,856 | 0.35 | % | |||||||||||||||
| Construction | 87,178 | 2.04 | % | 104,320 | 2.25 | % | 86,874 | 2.48 | % | |||||||||||||||
| Transportation, communications and public enterprises | 82,113 | 4.80 | % | 88,272 | 4.72 | % | 54,836 | 4.43 | % | |||||||||||||||
| Wholesale and retail | 179,494 | 7.58 | % | 203,240 | 8.11 | % | 160,265 | 8.67 | % | |||||||||||||||
| Finance and insurance | 18,231 | 4.68 | % | 36,596 | 4.73 | % | 21,444 | 4.89 | % | |||||||||||||||
| Real estate and goods rental and leasing | 386,706 | 11.94 | % | 301,135 | 12.12 | % | 144,984 | 12.82 | % | |||||||||||||||
| Services | 172,037 | 6.33 | % | 197,215 | 6.47 | % | 166,214 | 7.02 | % | |||||||||||||||
| Municipalities | 182 | 1.84 | % | 252 | 1.67 | % | 141 | 1.48 | % | |||||||||||||||
| Lease financing | 49,596 | 3.17 | % | 47,938 | 3.35 | % | 30,239 | 3.63 | % | |||||||||||||||
| Consumer | 214,224 | 23.93 | % | 196,729 | 21.42 | % | 172,242 | 21.48 | % | |||||||||||||||
| Others | 53,946 | 6.98 | % | 73,101 | 7.13 | % | 69,483 | 6.94 | % | |||||||||||||||
| Total domestic | 1,411,758 | 85.01 | % | 1,407,305 | 83.74 | % | 1,001,978 | 84.50 | % | |||||||||||||||
Foreign: | ||||||||||||||||||||||||
| Public sector | 84 | 0.20 | % | 103 | 0.11 | % | 225 | 0.16 | % | |||||||||||||||
| Financial institutions | 45,805 | 2.77 | % | 45,375 | 2.37 | % | 38,307 | 2.59 | % | |||||||||||||||
| Commerce and industry | 69,043 | 11.13 | % | 139,572 | 12.14 | % | 46,640 | 11.31 | % | |||||||||||||||
| Lease financing | 3,098 | 0.28 | % | 3,321 | 0.31 | % | 2,328 | 0.31 | % | |||||||||||||||
| Others | 3,767 | 0.61 | % | 3,954 | 1.33 | % | 4,748 | 1.13 | % | |||||||||||||||
| Total foreign | 121,797 | 14.99 | % | 192,325 | 16.26 | % | 92,248 | 15.50 | % | |||||||||||||||
| Total | ¥ | 1,533,555 | 100.00 | % | ¥ | 1,599,630 | 100.00 | % | ¥ | 1,094,226 | 100.00 | % | ||||||||||||
A-14
Table of Contents
| For the fiscal year ended March 31, | ||||||||||||||||
| 2010 | 2009 | |||||||||||||||
| Average amount | Average rate | Average amount | Average rate | |||||||||||||
| (In millions, except percentages) | ||||||||||||||||
Domestic offices: | ||||||||||||||||
| Non-interest-bearing demand deposits | ¥ | 10,282,862 | — | ¥ | 10,103,193 | — | ||||||||||
| Interest-bearing demand deposits | 29,884,845 | 0.04 | % | 29,371,719 | 0.16 | % | ||||||||||
| Deposits at notice | 916,101 | 0.05 | % | 807,647 | 0.15 | % | ||||||||||
| Time deposits | 24,105,635 | 0.33 | % | 22,612,150 | 0.42 | % | ||||||||||
| Negotiable certificates of deposit | 6,939,708 | 0.26 | % | 4,072,823 | 0.60 | % | ||||||||||
| Others | 3,304,221 | 0.23 | % | 3,668,256 | 1.32 | % | ||||||||||
| Total domestic offices | 75,433,372 | 70,635,788 | ||||||||||||||
Foreign offices: | ||||||||||||||||
| Non-interest-bearing deposits | 256,091 | — | 197,157 | — | ||||||||||||
| Interest-bearing deposits | 7,104,994 | 0.55 | % | 6,601,788 | 2.09 | % | ||||||||||
| Negotiable certificates of deposit | 1,811,254 | 0.85 | % | 711,143 | 3.70 | % | ||||||||||
| Total foreign offices | 9,172,339 | 7,510,088 | ||||||||||||||
| Total | ¥ | 84,605,711 | ¥ | 78,145,876 | ||||||||||||
A-15
Table of Contents
| Negotiable | ||||||||||||
| certificates of | ||||||||||||
| Time deposits | deposit | Total | ||||||||||
| (In millions) | ||||||||||||
Domestic offices: | ||||||||||||
| Not later than three months | ¥ | 7,423,023 | ¥ | 4,008,917 | ¥ | 11,431,940 | ||||||
| Later than three months and not later than six months | 4,506,980 | 779,422 | 5,286,402 | |||||||||
| Later than six months and not later than one year | 6,391,741 | 342,527 | 6,734,268 | |||||||||
| Later than one year | 3,995,343 | 35,839 | 4,031,182 | |||||||||
| Total | ¥ | 22,317,087 | ¥ | 5,166,705 | ¥ | 27,483,792 | ||||||
Foreign offices | ¥ | 1,745,181 | ¥ | 1,828,898 | ¥ | 3,574,079 | ||||||
| For the fiscal year ended March 31, | ||||||||
| 2010 | 2009 | |||||||
| Return on average total assets | 0.4 | % | (0.1% | ) | ||||
| Return on average shareholders’ equity | 15.1 | % | (5.0% | ) | ||||
Dividends payout ratio(1): | ||||||||
| Basic | 12.7 | % | — | |||||
| Diluted | 13.5 | % | — | |||||
| Average shareholders’ equity to average total assets | 2.8 | % | 2.7% | |||||
| (1) | Dividends declared per common share as a percentage of net profit per share. For the fiscal year ended March 31, 2009, the ratio was not calculated due to the net loss. |
A-16
Table of Contents
| For the fiscal year ended March 31, | ||||||||||||
| 2010 | 2009 | 2008 | ||||||||||
| (In millions, except percentages) | ||||||||||||
Call money, and payables under repurchase agreements and securities lending transactions: | ||||||||||||
| Average balance outstanding during the fiscal year | ¥ | 6,903,011 | ¥ | 8,674,384 | ¥ | n.a. | ||||||
| Maximum balance outstanding at any month-end during the fiscal year | 8,479,285 | 11,122,706 | n.a. | |||||||||
| Balance at the end of the fiscal year | 7,557,007 | 11,122,706 | 10,344,904 | |||||||||
| Weighted average interest rate during the fiscal year | 0.20% | 1.04% | n.a. | |||||||||
| Weighted average interest rate on balance at the end of the fiscal year | 0.15% | 0.29% | 1.09% | |||||||||
Commercial paper: | ||||||||||||
| Average balance outstanding during the fiscal year | 1,651,374 | 1,388,061 | n.a. | |||||||||
| Maximum balance outstanding at any month-end during the fiscal year | 1,927,229 | 1,768,437 | n.a. | |||||||||
| Balance at the end of the fiscal year | 1,885,640 | 1,587,930 | 1,446,345 | |||||||||
| Weighted average interest rate during the fiscal year | 0.31% | 1.11% | n.a. | |||||||||
| Weighted average interest rate on balance at the end of the fiscal year | 0.19% | 0.85% | 1.15% | |||||||||
Short-term borrowings: | ||||||||||||
| Average balance outstanding during the fiscal year | 2,918,335 | 2,570,272 | n.a. | |||||||||
| Maximum balance outstanding at any month-end during the fiscal year | 3,759,006 | 3,574,977 | n.a. | |||||||||
| Balance at the end of the fiscal year | 3,759,006 | 2,835,898 | 2,287,878 | |||||||||
| Weighted average interest rate during the fiscal year | 0.41% | 1.44% | n.a. | |||||||||
| Weighted average interest rate on balance at the end of the fiscal year | 0.31% | 0.64% | 1.16% | |||||||||
A-17
Table of Contents
| Page | ||||
| F-2 | ||||
| F-4 | ||||
| F-5 | ||||
| F-6 | ||||
| F-7 | ||||
| F-8 | ||||
| F-9 | ||||
F-1
Table of Contents
Sumitomo Mitsui Financial Group, Inc.
July 28, 2010
F-2
Table of Contents
F-3
Table of Contents
| At March 31, | At April 1, | |||||||||||||
| Note | 2010 | 2009 | 2008 | |||||||||||
| (In millions) | ||||||||||||||
Assets: | ||||||||||||||
| Cash and deposits with banks | 5 | ¥ | 6,239,398 | ¥ | 5,044,744 | ¥ | 4,948,469 | |||||||
| Call loans and bills bought | 1,127,035 | 973,772 | 735,139 | |||||||||||
| Reverse repurchase agreements and cash collateral on securities borrowed | 5,697,669 | 2,009,141 | 2,478,762 | |||||||||||
| Trading assets | 6 | 3,258,779 | 1,070,386 | 1,534,380 | ||||||||||
| Derivative financial instruments | 7 | 5,061,542 | 6,062,870 | 4,774,071 | ||||||||||
| Financial assets at fair value through profit or loss | 8 | 2,092,383 | 2,063,790 | 2,086,612 | ||||||||||
| Investment securities | 9 | 23,152,188 | 22,929,529 | 17,992,484 | ||||||||||
| Loans and advances | 10 | 71,634,128 | 74,669,294 | 71,984,280 | ||||||||||
| Investments in associates and joint ventures | 11 | 289,141 | 407,835 | 457,394 | ||||||||||
| Property, plant and equipment | 12 | 993,171 | 903,956 | 861,692 | ||||||||||
| Intangible assets | 14 | 710,235 | 357,851 | 329,204 | ||||||||||
| Other assets | 15 | 1,574,769 | 1,078,151 | 1,084,218 | ||||||||||
| Current tax assets | 40,362 | 50,349 | 28,481 | |||||||||||
| Deferred tax assets | 22 | 1,122,129 | 1,713,208 | 1,241,344 | ||||||||||
Total assets | ¥ | 122,992,929 | ¥ | 119,334,876 | ¥ | 110,536,530 | ||||||||
Liabilities: | ||||||||||||||
| Deposits | 16 | ¥ | 85,697,973 | ¥ | 83,231,234 | ¥ | 75,888,958 | |||||||
| Call money and bills sold | 2,119,558 | 2,750,337 | 2,761,530 | |||||||||||
| Repurchase agreements and cash collateral on securities lent | 5,437,449 | 8,372,369 | 7,583,374 | |||||||||||
| Trading liabilities | 17 | 1,592,625 | 14,280 | 62,825 | ||||||||||
| Derivative financial instruments | 7 | 4,756,695 | 5,743,542 | 4,486,819 | ||||||||||
| Borrowings | 18 | 7,321,484 | 6,423,003 | 6,122,529 | ||||||||||
| Debt securities in issue | 19 | 5,323,156 | 5,277,482 | 5,477,778 | ||||||||||
| Provisions | 20 | 32,236 | 29,664 | 27,709 | ||||||||||
| Other liabilities | 21 | 3,066,327 | 2,495,142 | 2,842,816 | ||||||||||
| Current tax liabilities | 58,978 | 54,851 | 85,503 | |||||||||||
| Deferred tax liabilities | 22 | 24,778 | 26,957 | 32,794 | ||||||||||
Total liabilities | 115,431,259 | 114,418,861 | 105,372,635 | |||||||||||
Equity: | ||||||||||||||
| Capital stock | 24 | 2,337,896 | 1,370,777 | 1,345,727 | ||||||||||
| Capital surplus | 24 | 1,081,432 | 114,594 | 25 | ||||||||||
| Retained earnings | 24 | 1,663,618 | 1,204,952 | 1,478,736 | ||||||||||
| Other reserves | 24 | 555,289 | 228,316 | 840,448 | ||||||||||
| Treasury stock | 24 | (124,062 | ) | (124,024 | ) | (123,989 | ) | |||||||
| Equity attributable to shareholders of Sumitomo Mitsui Financial Group, Inc. | 5,514,173 | 2,794,615 | 3,540,947 | |||||||||||
| Non-controlling interests | 25 | 2,047,497 | 2,121,400 | 1,622,948 | ||||||||||
Total equity | 7,561,670 | 4,916,015 | 5,163,895 | |||||||||||
Total equity and liabilities | ¥ | 122,992,929 | ¥ | 119,334,876 | ¥ | 110,536,530 | ||||||||
| The accompanying notes are an integral part of the Consolidated Financial Statements. | ||
F-4
Table of Contents
| For the fiscal year ended | ||||||||||
| March 31, | ||||||||||
| Note | 2010 | 2009 | ||||||||
| (In millions, except per share data) | ||||||||||
| Interest income | ¥ | 1,766,047 | ¥ | 2,164,048 | ||||||
| Interest expense | 346,810 | 676,293 | ||||||||
| Net interest income | 26 | 1,419,237 | 1,487,755 | |||||||
| Fee and commission income | 650,437 | 570,603 | ||||||||
| Fee and commission expense | 121,716 | 116,240 | ||||||||
| Net fee and commission income | 27 | 528,721 | 454,363 | |||||||
| Net trading income | 28 | 330,130 | 134,298 | |||||||
| Net income (loss) from financial assets at fair value through profit or loss | 29 | 75,579 | (17,951 | ) | ||||||
| Net investment income | 30 | 178,552 | 159,511 | |||||||
| Other income | 31 | 232,334 | 193,119 | |||||||
Total operating income | 2,764,553 | 2,411,095 | ||||||||
| Impairment charges on financial assets | 32 | 258,641 | 1,240,710 | |||||||
Net operating income | 2,505,912 | 1,170,385 | ||||||||
| General and administrative expenses | 33 | 1,096,957 | 992,487 | |||||||
| Other expenses | 34 | 236,760 | 261,770 | |||||||
Operating expenses | 1,333,717 | 1,254,257 | ||||||||
| Share of post-tax loss of associates and joint ventures | 37,461 | 54,318 | ||||||||
Profit (loss) before tax | 1,134,734 | (138,190 | ) | |||||||
| Income tax expense (benefit) | 35 | 488,041 | (56,166 | ) | ||||||
Net profit (loss) for the fiscal year | ¥ | 646,693 | ¥ | (82,024 | ) | |||||
| Profit (loss) attributable to: | ||||||||||
| Shareholders of Sumitomo Mitsui Financial Group, Inc. | ¥ | 528,692 | ¥ | (154,954 | ) | |||||
| Non-controlling interests | 118,001 | 72,930 | ||||||||
| Earnings per share: | ||||||||||
| Basic | 36 | ¥ | 511.51 | ¥ | (214.49 | ) | ||||
| Diluted | 36 | 481.59 | (259.62 | ) | ||||||
| The accompanying notes are an integral part of the Consolidated Financial Statements. | ||
F-5
Table of Contents
| For the fiscal year ended | ||||||||
| March 31, | ||||||||
| 2010 | 2009 | |||||||
| (In millions) | ||||||||
Net profit (loss) for the fiscal year | ¥ | 646,693 | ¥ | (82,024 | ) | |||
Other comprehensive income: | ||||||||
| Available-for-sale financial assets: | ||||||||
| Gains (losses) arising during the fiscal year, before tax | 616,762 | (1,134,743 | ) | |||||
| Reclassification adjustments for (gains) losses included in net profit, before tax | (77,339 | ) | 305,299 | |||||
| Exchange differences on translating foreign operations: | ||||||||
| Losses arising during the fiscal year, before tax | (15,009 | ) | (176,865 | ) | ||||
| Reclassification adjustments for losses included in net profit, before tax | 2 | 129 | ||||||
| Share of other comprehensive income (loss) of associates and joint ventures | 9,960 | (16,260 | ) | |||||
| Income tax relating to components of other comprehensive income | (219,887 | ) | 350,240 | |||||
Other comprehensive income (loss) for the fiscal year, net of tax | 314,489 | (672,200 | ) | |||||
Total comprehensive income (loss) for the fiscal year | ¥ | 961,182 | ¥ | (754,224 | ) | |||
| Total comprehensive income (loss) attributable to: | ||||||||
| Shareholders of Sumitomo Mitsui Financial Group, Inc. | ¥ | 855,665 | ¥ | (767,086 | ) | |||
| Non-controlling interests | 105,517 | 12,862 | ||||||
| The accompanying notes are an integral part of the Consolidated Financial Statements. | ||
F-6
Table of Contents
| Exchange | ||||||||||||||||||||||||||||||||||||
| Available- | differences on | |||||||||||||||||||||||||||||||||||
| for-sale | translating | Share- | Non- | |||||||||||||||||||||||||||||||||
| Capital | Capital | Retained | financial | the foreign | Treasury | holders’ | controlling | |||||||||||||||||||||||||||||
| stock | surplus | earnings | assets | operations | stock | equity | interests | Total equity | ||||||||||||||||||||||||||||
| (In millions) | ||||||||||||||||||||||||||||||||||||
Balance at April 1, 2008 | ¥ | 1,345,727 | ¥ | 25 | ¥ | 1,478,736 | ¥ | 840,448 | ¥ | - | ¥ | (123,989 | ) | ¥ | 3,540,947 | ¥ | 1,622,948 | ¥ | 5,163,895 | |||||||||||||||||
Comprehensive income: | ||||||||||||||||||||||||||||||||||||
| Net profit (loss) for the fiscal year | — | — | (154,954 | ) | — | — | — | (154,954 | ) | 72,930 | (82,024 | ) | ||||||||||||||||||||||||
| Other comprehensive income (loss) | — | — | — | (491,235 | ) | (120,897 | ) | — | (612,132 | ) | (60,068 | ) | (672,200 | ) | ||||||||||||||||||||||
Total comprehensive income (loss) | — | — | (154,954 | ) | (491,235 | ) | (120,897 | ) | — | (767,086 | ) | 12,862 | (754,224 | ) | ||||||||||||||||||||||
| Conversion of Type 4 preferred stock | 25,050 | 115,601 | — | — | — | — | 140,651 | — | 140,651 | |||||||||||||||||||||||||||
| Issuance of preferred securities | — | — | — | — | — | — | — | 1,059,737 | 1,059,737 | |||||||||||||||||||||||||||
| Redemption of preferred securities | — | — | — | — | — | — | — | (464,974 | ) | (464,974 | ) | |||||||||||||||||||||||||
| Transactions with non-controlling interest shareholders | — | — | — | — | — | — | — | (24,668 | ) | (24,668 | ) | |||||||||||||||||||||||||
| Acquisition and disposition of subsidiaries-net | — | — | — | — | — | — | — | 4,568 | 4,568 | |||||||||||||||||||||||||||
| Dividends to shareholders | — | — | (118,834 | ) | — | — | — | (118,834 | ) | (89,073 | ) | (207,907 | ) | |||||||||||||||||||||||
| Purchases of treasury stock | — | — | — | — | — | (943 | ) | (943 | ) | — | (943 | ) | ||||||||||||||||||||||||
| Sale of treasury stock | — | — | — | — | — | 908 | 908 | — | 908 | |||||||||||||||||||||||||||
| Loss on sale of treasury stock | — | (581 | ) | — | — | — | — | (581 | ) | — | (581 | ) | ||||||||||||||||||||||||
| Others | — | (451 | ) | 4 | — | — | — | (447 | ) | — | (447 | ) | ||||||||||||||||||||||||
Balance at March 31, 2009 | 1,370,777 | 114,594 | 1,204,952 | 349,213 | (120,897 | ) | (124,024 | ) | 2,794,615 | 2,121,400 | 4,916,015 | |||||||||||||||||||||||||
Comprehensive income: | ||||||||||||||||||||||||||||||||||||
| Net profit for the fiscal year | — | — | 528,692 | — | — | — | 528,692 | 118,001 | 646,693 | |||||||||||||||||||||||||||
| Other comprehensive income (loss) | — | — | — | 314,694 | 12,279 | — | 326,973 | (12,484 | ) | 314,489 | ||||||||||||||||||||||||||
Total comprehensive income | — | — | 528,692 | 314,694 | 12,279 | — | 855,665 | 105,517 | 961,182 | |||||||||||||||||||||||||||
| Issuance of common stock | 917,019 | 918,644 | — | — | — | — | 1,835,663 | — | 1,835,663 | |||||||||||||||||||||||||||
| Conversion of Type 4 preferred stock | 50,100 | 50,100 | — | — | — | — | 100,200 | — | 100,200 | |||||||||||||||||||||||||||
| Issuance of preferred securities | — | — | — | — | — | — | — | 388,000 | 388,000 | |||||||||||||||||||||||||||
| Redemption of preferred securities | ��� | — | — | — | — | — | — | (496,231 | ) | (496,231 | ) | |||||||||||||||||||||||||
| Transactions with non-controlling interest shareholders | — | — | — | — | — | — | — | 4,868 | 4,868 | |||||||||||||||||||||||||||
| Acquisition of subsidiaries | — | — | — | — | — | — | — | 23,025 | 23,025 | |||||||||||||||||||||||||||
| Dividends to shareholders | — | — | (71,175 | ) | — | — | — | (71,175 | ) | (99,082 | ) | (170,257 | ) | |||||||||||||||||||||||
| Purchases of treasury stock | — | — | — | — | — | (189 | ) | (189 | ) | — | (189 | ) | ||||||||||||||||||||||||
| Sale of treasury stock | — | — | — | — | — | 151 | 151 | — | 151 | |||||||||||||||||||||||||||
| Loss on sale of treasury stock | — | (108 | ) | — | — | — | — | (108 | ) | — | (108 | ) | ||||||||||||||||||||||||
| Others | — | (1,798 | ) | 1,149 | — | — | — | (649 | ) | — | (649 | ) | ||||||||||||||||||||||||
Balance at March 31, 2010 | ¥ | 2,337,896 | ¥ | 1,081,432 | ¥ | 1,663,618 | ¥ | 663,907 | ¥ | (108,618 | ) | ¥ | (124,062 | ) | ¥ | 5,514,173 | ¥ | 2,047,497 | ¥ | 7,561,670 | ||||||||||||||||
| The accompanying notes are an integral part of the Consolidated Financial Statements. | ||
F-7
Table of Contents
| For the fiscal year ended | ||||||||
| March 31, | ||||||||
| 2010 | 2009 | |||||||
| (In millions) | ||||||||
Operating Activities: | ||||||||
| Profit (loss) before tax | ¥ | 1,134,734 | ¥ | (138,190 | ) | |||
| Adjustments for: | ||||||||
| (Gains) losses on financial assets at fair value through profit or loss and investment securities | (152,924 | ) | 323,250 | |||||
| Foreign exchange losses | 135,453 | 283,855 | ||||||
| Provision for loan losses | 215,886 | 849,495 | ||||||
| Depreciation and amortization | 140,716 | 117,971 | ||||||
| Share of post-tax loss of associates and joint ventures | 37,461 | 54,318 | ||||||
| Net changes in assets and liabilities: | ||||||||
| Net (increase) decrease of term deposits with original maturities over three months | (91,035 | ) | 878,270 | |||||
| Net increase of call loans and bills bought | (137,593 | ) | (312,637 | ) | ||||
| Net (increase) decrease of reverse repurchase agreements and cash collateral on securities borrowed | (3,291,814 | ) | 457,598 | |||||
| Net (increase) decrease of loans and advances | 4,021,020 | (3,852,231 | ) | |||||
| Net change of trading assets and liabilities, and derivative financial instruments | (37,284 | ) | 347,358 | |||||
| Net increase of deposits | 1,355,456 | 7,511,655 | ||||||
| Net decrease of call money and bills sold | (1,062,075 | ) | (6,959 | ) | ||||
| Net increase (decrease) of repurchase agreements and cash collateral on securities lent | (3,072,237 | ) | 802,865 | |||||
| Net increase of other unsubordinated borrowings and debt securities in issue | 409,356 | 258,203 | ||||||
| Income taxes paid-net | (109,520 | ) | (108,943 | ) | ||||
| Other operating activities—net | 62,212 | (31,966 | ) | |||||
Net cash and cash equivalents provided by (used in) operating activities | (442,188 | ) | 7,433,912 | |||||
Investing Activities: | ||||||||
| Purchases of financial assets at fair value through profit or loss and available-for-sale financial assets | (43,936,025 | ) | (51,311,954 | ) | ||||
| Proceeds from sale of financial assets at fair value through profit or loss and available-for-sale financial assets | 32,271,697 | 34,685,510 | ||||||
| Proceeds from maturities of financial assets at fair value through profit or loss and available-for-sale financial assets | 13,252,829 | 11,368,037 | ||||||
| Purchases of held-to-maturity investments | (1,374,337 | ) | (961,945 | ) | ||||
| Proceeds from maturities of held-to-maturity investments | 173,409 | 1,416 | ||||||
| Acquisitions of the subsidiaries, net of cash and cash equivalents acquired | (223,938 | ) | (8,675 | ) | ||||
| Investments to associates and joint ventures | (60,787 | ) | (45,856 | ) | ||||
| Proceeds from sale of investments in associates and joint ventures | 152,312 | — | ||||||
| Purchases of property, plant and equipment and investment properties | (173,408 | ) | (178,327 | ) | ||||
| Purchases of intangible assets | (82,227 | ) | (73,650 | ) | ||||
| Proceeds from sale of property, plant and equipment, investment properties and intangible assets | 38,841 | 12,287 | ||||||
| Other investing activities—net | 6,837 | (27,814 | ) | |||||
Net cash and cash equivalents provided by (used in) investing activities | 45,203 | (6,540,971 | ) | |||||
Financing Activities: | ||||||||
| Proceeds from issuance of subordinated borrowings | 8,000 | 5,000 | ||||||
| Redemption of subordinated borrowings | (78,000 | ) | (92,500 | ) | ||||
| Proceeds from issuance of subordinated bonds | 607,212 | 381,036 | ||||||
| Redemption of subordinated bonds | (649,875 | ) | (316,875 | ) | ||||
| Proceeds from issuance of preferred securities | 384,970 | 1,058,977 | ||||||
| Redemption of preferred securities | (496,231 | ) | (464,974 | ) | ||||
| Proceeds from issuance of common stock | 1,824,896 | — | ||||||
| Dividends paid to shareholders of Sumitomo Mitsui Financial Group, Inc. | (71,063 | ) | (118,759 | ) | ||||
| Dividends paid to non-controlling interest shareholders | (99,171 | ) | (89,073 | ) | ||||
| Purchases of treasury stock and proceeds from sale of treasury stock—net | (146 | ) | (616 | ) | ||||
Net cash and cash equivalents provided by financing activities | 1,430,592 | 362,216 | ||||||
| Effect of exchange rate changes on cash and cash equivalents | (55,223 | ) | (140,480 | ) | ||||
Net increase of cash and cash equivalents | 978,384 | 1,114,677 | ||||||
Cash and cash equivalents at the beginning of the fiscal year | 4,633,179 | 3,518,502 | ||||||
Cash and cash equivalents at the end of the fiscal year | ¥ | 5,611,563 | ¥ | 4,633,179 | ||||
Net cash and cash equivalents provided by (used in) operating activities includes: | ||||||||
| Interests and dividends received | ¥ | 1,838,253 | ¥ | 2,287,371 | ||||
| Interests paid | 370,902 | 693,138 | ||||||
| The accompanying notes are an integral part of the Consolidated Financial Statements. | ||
F-8
Table of Contents
| 1 | GENERAL INFORMATION |
| 2 | SUMMARY OF SIGNIFICANT ACCOUNTING POLICIES |
| • | trading assets and liabilities are measured at fair value; | ||
| • | derivative financial instruments are measured at fair value; | ||
| • | financial assets at fair value through profit or loss are measured at fair value; | ||
| • | available-for-sale financial assets are measured at fair value; and | ||
| • | the liabilities and the assets recognized in the consolidated statement of financial position in respect of defined benefit plans are the present value of the defined benefit obligation less the fair value of plan assets, together with adjustments for unrecognized actuarial gains or losses and past service costs. |
F-9
Table of Contents
| • | the activities of the SPE are being conducted on behalf of the SMFG Group according to its specific business needs so that the SMFG Group obtains benefits from the SPE’s operation; | ||
| • | the SMFG Group has the decision-making powers to obtain the majority of the benefits of the activities of the SPE or, by setting up an “autopilot” mechanism, the SMFG Group has delegated its decision-making powers; | ||
| • | the SMFG Group has rights to obtain the majority of the benefits of the SPE and therefore may be exposed to risks incident to the activities of the SPE; or | ||
| • | the SMFG Group retains the majority of the residual or ownership risks related to the SPE or its assets in order to obtain benefits from its activities. |
F-10
Table of Contents
F-11
Table of Contents
F-12
Table of Contents
| • | those that the SMFG Group intends to sell immediately or in the short-term, which are classified as held for trading, and those that the SMFG Group upon initial recognition designates as at fair value through profit or loss; | ||
| • | those that the SMFG Group upon initial recognition classifies as available-for-sale; or | ||
| • | those for which the SMFG Group may not recover substantially all of its initial investment, other than because of credit deterioration. |
F-13
Table of Contents
F-14
Table of Contents
| • | significant financial difficulty of an issuer or an obligor; | ||
| • | a default or delinquency in interest or principal payments; | ||
| • | restructuring of a financial asset by the SMFG Group due to the borrower’s financial difficulties on terms that the SMFG Group would not otherwise consider; |
F-15
Table of Contents
| • | indications that a borrower or issuer will enter bankruptcy; | ||
| • | disappearance of an active market for a security because of the borrower’s financial difficulties; and | ||
| • | other observable data relating to a group of assets, such as adverse changes in the payment status of borrowers or issuers in the group, or national or local economic conditions that correlate with defaults in the group. |
F-16
Table of Contents
| • | Buildings: 7–50 years; | ||
| • | Leased assets: the shorter of the lease term and the estimated useful life, which is principally 5–20 years; and | ||
| • | Others (principally equipment and furniture): 2–20 years. |
F-17
Table of Contents
F-18
Table of Contents
F-19
Table of Contents
F-20
Table of Contents
F-21
Table of Contents
F-22
Table of Contents
F-23
Table of Contents
F-24
Table of Contents
F-25
Table of Contents
| 3 | CRITICAL ACCOUNTING ESTIMATES AND JUDGMENTS |
F-26
Table of Contents
F-27
Table of Contents
| 4 | SEGMENT ANALYSIS |
F-28
Table of Contents
F-29
Table of Contents
F-30
Table of Contents
| For the fiscal year ended March 31, 2010 | ||||||||||||||||||||||||||||||||||||||||||||||||||||||||||||||||||||
| Commercial Banking | Securities | Leasing | Credit Card | Others | Total | |||||||||||||||||||||||||||||||||||||||||||||||||||||||||||||||
| SMBC | Total(4) | Total(4) | Total(4) | Total(4) | ||||||||||||||||||||||||||||||||||||||||||||||||||||||||||||||||
| Middle | Interna- | Sumitomo | ||||||||||||||||||||||||||||||||||||||||||||||||||||||||||||||||||
| Consumer | Market | Corporate | tional | Nikko | SMBC | Mitsui | Sumitomo | |||||||||||||||||||||||||||||||||||||||||||||||||||||||||||||
| Banking | Banking | Banking | Banking | Treasury | SMBC | Cordial | Friend | Finance & | Mitsui | |||||||||||||||||||||||||||||||||||||||||||||||||||||||||||
| Unit | Unit | Unit | Unit | Unit | Others | Total | Securities | Securities | Leasing | Card | ||||||||||||||||||||||||||||||||||||||||||||||||||||||||||
| (In billions) | ||||||||||||||||||||||||||||||||||||||||||||||||||||||||||||||||||||
Gross profit(1) | ¥ | 391.7 | ¥ | 472.9 | ¥ | 197.3 | ¥ | 169.1 | ¥ | 272.8 | ¥ | (48.5 | ) | ¥ | 1,455.3 | ¥ | 1,669.3 | ¥ | 100.5 | ¥ | 67.2 | ¥ | 161.4 | ¥ | 97.2 | ¥ | 109.5 | ¥ | 183.6 | ¥ | 183.4 | ¥ | 19.2 | ¥ | 2,142.8 | |||||||||||||||||||||||||||||||||
| Net interest income | 357.2 | 298.2 | 125.9 | 110.1 | 187.5 | (32.5 | ) | 1,046.4 | 1,181.9 | (1.4 | ) | 0.6 | (0.2 | ) | 59.8 | 64.5 | 27.5 | 29.3 | 9.9 | 1,285.4 | ||||||||||||||||||||||||||||||||||||||||||||||||
| Net non-interest income | 34.5 | 174.7 | 71.4 | 59.0 | 85.3 | (16.0 | ) | 408.9 | 487.4 | 101.9 | 66.6 | 161.6 | 37.4 | 45.0 | 156.1 | 154.1 | 9.3 | 857.4 | ||||||||||||||||||||||||||||||||||||||||||||||||||
General and administrative expenses(1) | (288.7 | ) | (218.7 | ) | (33.3 | ) | (54.5 | ) | (16.3 | ) | (74.3 | ) | (685.8 | ) | (803.3 | ) | (77.0 | ) | (44.4 | ) | (124.3 | ) | (28.5 | ) | (40.9 | ) | (135.8 | ) | (137.9 | ) | 6.5 | (1,099.9 | ) | |||||||||||||||||||||||||||||||||||
Other profit(2) | — | — | — | — | — | — | — | (132.8 | ) | — | — | 13.7 | (24.8 | ) | (27.5 | ) | (23.5 | ) | (40.4 | ) | (23.6 | ) | (210.6 | ) | ||||||||||||||||||||||||||||||||||||||||||||
Consolidated net business profit(3)(5) | ¥ | 103.0 | ¥ | 254.2 | ¥ | 164.0 | ¥ | 114.6 | ¥ | 256.5 | ¥ | (122.8 | ) | ¥ | 769.5 | ¥ | 733.2 | ¥ | 23.5 | ¥ | 22.8 | ¥ | 50.8 | ¥ | 43.9 | ¥ | 41.1 | ¥ | 24.3 | ¥ | 5.1 | ¥ | 2.1 | ¥ | 832.3 | |||||||||||||||||||||||||||||||||
| For the fiscal year ended March 31, 2009 | ||||||||||||||||||||||||||||||||||||||||||||||||||||||||||||||||||||
| Commercial Banking | Securities | Leasing | Credit Card | Others | Total | |||||||||||||||||||||||||||||||||||||||||||||||||||||||||||||||
| SMBC | Total(4) | Total(4) | Total(4) | Total(4) | ||||||||||||||||||||||||||||||||||||||||||||||||||||||||||||||||
| Middle | Interna- | Sumitomo | ||||||||||||||||||||||||||||||||||||||||||||||||||||||||||||||||||
| Consumer | Market | Corporate | tional | Nikko | SMBC | Mitsui | Sumitomo | |||||||||||||||||||||||||||||||||||||||||||||||||||||||||||||
| Banking | Banking | Banking | Banking | Treasury | SMBC | Cordial | Friend | Finance & | Mitsui | |||||||||||||||||||||||||||||||||||||||||||||||||||||||||||
| Unit | Unit | Unit | Unit | Unit | Others | Total | Securities | Securities | Leasing | Card | ||||||||||||||||||||||||||||||||||||||||||||||||||||||||||
| (In billions) | ||||||||||||||||||||||||||||||||||||||||||||||||||||||||||||||||||||
Gross profit(1) | ¥ | 429.4 | ¥ | 539.8 | ¥ | 196.7 | ¥ | 175.0 | ¥ | 246.8 | ¥ | (62.8 | ) | ¥ | 1,524.9 | ¥ | 1,719.9 | ¥ | — | ¥ | 42.8 | ¥ | 45.5 | ¥ | 91.9 | ¥ | 100.5 | ¥ | 180.2 | ¥ | 219.3 | ¥ | (2.2 | ) | ¥ | 2,083.0 | ||||||||||||||||||||||||||||||||
| Net interest income | 396.3 | 338.3 | 121.5 | 104.0 | 123.4 | (65.1 | ) | 1,018.4 | 1,158.5 | — | 1.2 | 1.5 | 57.2 | 60.8 | 29.5 | 35.1 | (3.9 | ) | 1,252.0 | |||||||||||||||||||||||||||||||||||||||||||||||||
| Net non-interest income | 33.1 | 201.5 | 75.2 | 71.0 | 123.4 | 2.3 | 506.5 | 561.4 | — | 41.6 | 44.0 | 34.7 | 39.7 | 150.7 | 184.2 | 1.7 | 831.0 | |||||||||||||||||||||||||||||||||||||||||||||||||||
General and administrative expenses(1) | (290.7 | ) | (222.7 | ) | (31.5 | ) | (64.8 | ) | (17.9 | ) | (73.9 | ) | (701.5 | ) | (813.8 | ) | — | (40.4 | ) | (40.9 | ) | (29.5 | ) | (41.7 | ) | (137.3 | ) | (172.9 | ) | 28.5 | (1,040.8 | ) | ||||||||||||||||||||||||||||||||||||
Other profit(2) | — | — | — | — | — | — | — | (147.6 | ) | — | (0.1 | ) | (67.8 | ) | (25.9 | ) | (32.9 | ) | (20.6 | ) | (30.7 | ) | (34.5 | ) | (313.5 | ) | ||||||||||||||||||||||||||||||||||||||||||
Consolidated net business profit(3)(5) | ¥ | 138.7 | ¥ | 317.1 | ¥ | 165.2 | ¥ | 110.2 | ¥ | 228.9 | ¥ | (136.7 | ) | ¥ | 823.4 | ¥ | 758.5 | ¥ | — | ¥ | 2.3 | ¥ | (63.2 | ) | ¥ | 36.5 | ¥ | 25.9 | ¥ | 22.3 | ¥ | 15.7 | ¥ | (8.2 | ) | ¥ | 728.7 | |||||||||||||||||||||||||||||||
| (1) | Gross profit, and General and administrative expenses: The Commercial Banking segment includes SMFG’s subsidiaries such as SMBC, Sumitomo Mitsui Banking Corporation Europe, Manufacturers Bank, Sumitomo Mitsui Banking Corporation (China), Kansai Urban Banking Corporation and THE MINATO BANK. The Securities segment includes SMFG’s subsidiaries such as Nikko Cordial Securities (for the latter half of fiscal year ended March 31, 2010) and SMBC Friend Securities. The Leasing segment includes SMFG’s subsidiaries such as Sumitomo Mitsui Finance and Leasing. The Credit Card segment includes SMFG’s subsidiaries such as Sumitomo Mitsui Card. | |
| (2) | Other profits includes non-operating profits and losses of subsidiaries other than SMBC, ordinary profit of equity-method associates taking into account the shareholding ratio. | |
| (3) | Consolidated net business profit = SMBC’s business profit on a non-consolidated basis, excluding the effect of the reversal of reserve for possible loan losses + ordinary profit of other consolidated subsidiaries (with adjustment for extraordinary items) + (ordinary profit of equity-method associates * equity ratio) – internal transactions (such as dividends) under Japanese GAAP. “Equity ratio” represents the SMFG Group’s interest to the ordinary profit from the equity-method associates. | |
| (4) | Total under each business segment includes the aggregation of the results from the operating units that were not identified as reportable segments. | |
| (5) | The SMFG Group’s total credit cost for the fiscal years ended March 31, 2010 and 2009 were ¥473.0 billion and ¥767.8 billion, of which ¥395.1 billion and ¥695.6 billion were for Commercial Banking, ¥0.03 billion and ¥0.07 billion were for Securities, ¥27.4 billion and ¥26.8 billion were for Leasing, and ¥26.1 billion and ¥33.6 billion were for Credit Card, respectively. Total credit cost consists of credit cost and gains on recoveries of written-off claims. Credit cost of SMBC and gains on recoveries of written-off claims were not included in consolidated net business profit, but in “Loans and advances” in the reconciliation table in the section “Reconciliation of Segmental Results of Operations to Consolidated Income Statements”. |
F-31
Table of Contents
| Reconciliation between | ||||||||||||
| Consolidated net business profit and Profit (loss) before tax | ||||||||||||
| Reconciliation | ||||||||||||
| between | ||||||||||||
| Management | Differences between | |||||||||||
| reporting and | IFRS and Japanese | |||||||||||
| For the fiscal year ended March 31, 2010 | Japanese GAAP | GAAP | Total | |||||||||
| (In billions) | ||||||||||||
| Consolidated net business profit | ¥ | 832.3 | ¥ | 832.3 | ||||||||
| Consolidation | 91.7 | ¥ | 48.2 | 139.9 | ||||||||
| Derivative financial instruments | — | 82.2 | 82.2 | |||||||||
| Investment securities | 3.8 | 100.8 | 104.6 | |||||||||
| Loans and advances | (257.9 | ) | 232.8 | (25.1 | ) | |||||||
| Investments in associates and joint ventures | (27.5 | ) | 19.6 | (7.9 | ) | |||||||
| Property, plant and equipment | (1.7 | ) | 6.5 | 4.8 | ||||||||
| Defined benefit plans | (48.0 | ) | 45.5 | (2.5 | ) | |||||||
| Classification of equity and liability | — | 20.2 | 20.2 | |||||||||
| Foreign currency translation | — | (1.5 | ) | (1.5 | ) | |||||||
| Lease accounting | — | (8.8 | ) | (8.8 | ) | |||||||
| Others | (34.6 | ) | 31.1 | (3.5 | ) | |||||||
| Profit (loss) before tax under Japanese GAAP | ¥ | 558.1 | ||||||||||
| Total differences between IFRS and Japanese GAAP | ¥ | 576.6 | ||||||||||
| Profit (loss) before tax under IFRS | ¥ | 1,134.7 | ||||||||||
| Reconciliation between | ||||||||||||
| Consolidated net business profit and Profit (loss) before tax | ||||||||||||
| Reconciliation | ||||||||||||
| between | ||||||||||||
| Management | Differences between | |||||||||||
| reporting and | IFRS and Japanese | |||||||||||
| For the fiscal year ended March 31, 2009 | Japanese GAAP | GAAP | Total | |||||||||
| (In billions) | ||||||||||||
| Consolidated net business profit | ¥ | 728.7 | ¥ | 728.7 | ||||||||
| Consolidation | 83.3 | ¥ | 3.0 | 86.3 | ||||||||
| Derivative financial instruments | — | 1.7 | 1.7 | |||||||||
| Investment securities | (220.4 | ) | (190.5 | ) | (410.9 | ) | ||||||
| Loans and advances | (553.9 | ) | (112.1 | ) | (666.0 | ) | ||||||
| Investments in associates and joint ventures | (16.9 | ) | 11.8 | (5.1 | ) | |||||||
| Property, plant and equipment | (18.2 | ) | 4.3 | (13.9 | ) | |||||||
| Defined benefit plans | (19.6 | ) | 36.3 | 16.7 | ||||||||
| Classification of equity and liability | — | 47.9 | 47.9 | |||||||||
| Foreign currency translation | — | 33.6 | 33.6 | |||||||||
| Lease accounting | — | (7.3 | ) | (7.3 | ) | |||||||
| Others | 46.5 | 3.6 | 50.1 | |||||||||
| Profit (loss) before tax under Japanese GAAP | ¥ | 29.5 | ||||||||||
| Total differences between IFRS and Japanese GAAP | ¥ | (167.7 | ) | |||||||||
| Profit (loss) before tax under IFRS | ¥ | (138.2 | ) | |||||||||
F-32
Table of Contents
| For the fiscal year ended | ||||||||
| March 31, | ||||||||
| 2010 | 2009 | |||||||
| (In millions) | ||||||||
Domestic: | ||||||||
| Japan | ¥ | 2,372,369 | ¥ | 2,073,563 | ||||
| Total domestic | 2,372,369 | 2,073,563 | ||||||
Foreign: | ||||||||
| Americas | 194,470 | 87,704 | ||||||
| Europe and Middle East | 101,749 | 127,849 | ||||||
| Asia and Oceania | 95,965 | 121,979 | ||||||
| Total foreign | 392,184 | 337,532 | ||||||
| Consolidated total operating income | ¥ | 2,764,553 | ¥ | 2,411,095 | ||||
| (1) | This table presents consolidated total operating income by geographical area for the fiscal years ended March 31, 2010 and 2009, respectively. Total operating income comprises net interest income, net fee and commission income, net trading income, net income (loss) from financial assets at fair value through profit or loss, net investment income and other income. | |
| (2) | The geographical segmentation is determined based on the degrees of the following factors: geographic proximity, similarity of economic activities and relationship of business activities among regions. | |
| (3) | Americas includes the United States, Brazil, Canada and others; Europe and Middle East includes the United Kingdom, Germany, France and others; Asia and Oceania includes China, Singapore, Australia and others except Japan. |
| 5 | CASH AND DEPOSITS WITH BANKS |
| At March 31, | At April 1, | |||||||||||||||
| 2010 | 2009 | 2008 | ||||||||||||||
| (In millions) | ||||||||||||||||
| Cash | ¥ | 1,108,248 | ¥ | 996,076 | ¥ | 1,170,275 | ||||||||||
| Deposits with banks | 5,131,150 | 4,048,668 | 3,778,194 | |||||||||||||
| Total cash and deposits with banks | ¥ | 6,239,398 | ¥ | 5,044,744 | ¥ | 4,948,469 | ||||||||||
F-33
Table of Contents
| At March 31, | At April 1, | |||||||||||
| 2010 | 2009 | 2008 | ||||||||||
| (In millions) | ||||||||||||
| Cash and deposits with banks | ¥ | 6,239,398 | ¥ | 5,044,744 | ¥ | 4,948,469 | ||||||
| Less: term deposits with original maturities over three months | (436,334 | ) | (342,320 | ) | (1,329,910 | ) | ||||||
| Less: cash segregated as deposits and others | (191,501 | ) | (69,245 | ) | (100,057 | ) | ||||||
| Cash and cash equivalents | ¥ | 5,611,563 | ¥ | 4,633,179 | ¥ | 3,518,502 | ||||||
| 6 | TRADING ASSETS |
| At March 31, | At April 1, | |||||||||||
| 2010 | 2009 | 2008 | ||||||||||
| (In millions) | ||||||||||||
| Debt instruments | ¥ | 3,117,725 | ¥ | 958,274 | ¥ | 1,251,743 | ||||||
| Equity instruments | 141,054 | 112,112 | 282,637 | |||||||||
| Total trading assets | ¥ | 3,258,779 | ¥ | 1,070,386 | ¥ | 1,534,380 | ||||||
| 7 | DERIVATIVE FINANCIAL INSTRUMENTS |
F-34
Table of Contents
| At March 31, 2010 | ||||||||||||||||||||||||
| Trading | Risk Management (1) | |||||||||||||||||||||||
| Notional | Notional | |||||||||||||||||||||||
| amounts | Assets | Liabilities | amounts | Assets | Liabilities | |||||||||||||||||||
| (In millions) | ||||||||||||||||||||||||
| Interest rate derivatives | ¥ | 507,846,491 | ¥ | 3,032,882 | ¥ | 2,951,906 | ¥ | 50,710,183 | ¥ | 334,244 | ¥ | 313,540 | ||||||||||||
| Futures and Listed Options | 62,508,724 | �� | 39,216 | 36,413 | 16,486,526 | 2,147 | 412 | |||||||||||||||||
| Forwards, Swaps and OTC Options | 445,337,767 | 2,993,666 | 2,915,493 | 34,223,657 | 332,097 | 313,128 | ||||||||||||||||||
| Currency derivatives | 67,015,235 | 1,284,991 | 1,281,646 | 2,088,256 | 178,905 | 15,108 | ||||||||||||||||||
| Futures | 5,862 | 2 | – | – | – | – | ||||||||||||||||||
| Forwards, Swaps and OTC Options | 67,009,373 | 1,284,989 | 1,281,646 | 2,088,256 | 178,905 | 15,108 | ||||||||||||||||||
| Equity derivatives | 543,161 | 42,670 | 47,175 | 9,534 | – | 276 | ||||||||||||||||||
| Futures and Listed Options | 99,929 | 1,085 | 1,470 | – | – | – | ||||||||||||||||||
| Forwards, Swaps and OTC Options | 443,232 | 41,585 | 45,705 | 9,534 | – | 276 | ||||||||||||||||||
| Commodity derivatives | 458,301 | 117,234 | 64,453 | – | – | – | ||||||||||||||||||
| Futures and Listed Options | 24,234 | 173 | 180 | – | – | – | ||||||||||||||||||
| Forwards, Swaps and OTC Options | 434,067 | 117,061 | 64,273 | – | – | – | ||||||||||||||||||
| Credit derivatives | 2,747,245 | 70,616 | 82,591 | – | – | – | ||||||||||||||||||
| Total derivative financial instruments | ¥ | 578,610,433 | ¥ | 4,548,393 | ¥ | 4,427,771 | ¥ | 52,807,973 | ¥ | 513,149 | ¥ | 328,924 | ||||||||||||
| (1) | Derivative instruments categorized as “Risk Management” are used for certain economic hedging, such as managing the exposure to changes in fair value of the loan portfolio, and are identified as hedges under Japanese GAAP, but without applying hedge accounting under IFRS. |
F-35
Table of Contents
| At March 31, 2009 | ||||||||||||||||||||||||
| Trading | Risk Management (1) | |||||||||||||||||||||||
| Notional | Notional | |||||||||||||||||||||||
| amounts | Assets | Liabilities | amounts | Assets | Liabilities | |||||||||||||||||||
| (In millions) | ||||||||||||||||||||||||
| Interest rate derivatives | ¥ | 510,211,240 | ¥ | 3,278,381 | ¥ | 3,143,514 | ¥ | 40,610,081 | ¥ | 420,519 | ¥ | 357,697 | ||||||||||||
| Futures and Listed Options | 39,256,743 | 65,285 | 55,866 | 9,476,900 | 2,655 | 2,830 | ||||||||||||||||||
| Forwards, Swaps and OTC Options | 470,954,497 | 3,213,096 | 3,087,648 | 31,133,181 | 417,864 | 354,867 | ||||||||||||||||||
| Currency derivatives | 77,294,811 | 1,858,964 | 1,846,824 | 2,435,931 | 141,979 | 20,702 | ||||||||||||||||||
| Futures | – | – | – | – | – | – | ||||||||||||||||||
| Forwards, Swaps and OTC Options | 77,294,811 | 1,858,964 | 1,846,824 | 2,435,931 | 141,979 | 20,702 | ||||||||||||||||||
| Equity derivatives | 453,995 | 54,410 | 64,700 | – | – | – | ||||||||||||||||||
| Futures and Listed Options | 32,518 | 970 | 958 | – | – | – | ||||||||||||||||||
| Forwards, Swaps and OTC Options | 421,477 | 53,440 | 63,742 | – | – | – | ||||||||||||||||||
| Commodity derivatives | 592,811 | 131,800 | 70,523 | – | – | – | ||||||||||||||||||
| Futures and Listed Options | 156 | 25 | – | – | – | – | ||||||||||||||||||
| Forwards, Swaps and OTC Options | 592,655 | 131,775 | 70,523 | – | – | – | ||||||||||||||||||
| Credit derivatives | 2,817,300 | 176,817 | 239,582 | – | – | – | ||||||||||||||||||
| Total derivative financial instruments | ¥ | 591,370,157 | ¥ | 5,500,372 | ¥ | 5,365,143 | ¥ | 43,046,012 | ¥ | 562,498 | ¥ | 378,399 | ||||||||||||
| (1) | Derivative instruments categorized as “Risk Management” are used for certain economic hedging, such as managing the exposure to changes in fair value of the loan portfolio, and are identified as hedges under Japanese GAAP, but without applying hedge accounting under IFRS. |
F-36
Table of Contents
| At April 1, 2008 | ||||||||||||||||||||||||
| Trading | Risk Management (1) | |||||||||||||||||||||||
| Notional | Notional | |||||||||||||||||||||||
| amounts | Assets | Liabilities | amounts | Assets | Liabilities | |||||||||||||||||||
| (In millions) | ||||||||||||||||||||||||
| Interest rate derivatives | ¥ | 571,663,709 | ¥ | 2,212,586 | ¥ | 2,101,095 | ¥ | 49,000,539 | ¥ | 229,428 | ¥ | 272,936 | ||||||||||||
| Futures and Listed Options | 64,302,637 | 105,499 | 100,536 | 17,564,739 | 3,074 | 1,324 | ||||||||||||||||||
| Forwards, Swaps and OTC Options | 507,361,072 | 2,107,087 | 2,000,559 | 31,435,800 | 226,354 | 271,612 | ||||||||||||||||||
| Currency derivatives | 92,850,609 | 1,991,919 | 1,861,792 | 1,065,732 | 35,811 | 11,123 | ||||||||||||||||||
| Futures | 26,851 | 40 | 26 | – | – | – | ||||||||||||||||||
| Forwards, Swaps and OTC Options | 92,823,758 | 1,991,879 | 1,861,766 | 1,065,732 | 35,811 | 11,123 | ||||||||||||||||||
| Equity derivatives | 642,945 | 31,268 | 33,911 | – | – | – | ||||||||||||||||||
| Futures and Listed Options | 139,807 | 1,405 | 1,194 | – | – | – | ||||||||||||||||||
| Forwards, Swaps and OTC Options | 503,138 | 29,863 | 32,717 | – | – | – | ||||||||||||||||||
| Commodity derivatives | 573,721 | 223,353 | 145,686 | – | – | – | ||||||||||||||||||
| Futures and Listed Options | 209 | 4 | 1 | – | – | – | ||||||||||||||||||
| Forwards, Swaps and OTC Options | 573,512 | 223,349 | 145,685 | – | – | – | ||||||||||||||||||
| Credit derivatives | 3,281,528 | 49,706 | 60,276 | – | – | – | ||||||||||||||||||
| Total derivative financial instruments | ¥ | 669,012,512 | ¥ | 4,508,832 | ¥ | 4,202,760 | ¥ | 50,066,271 | ¥ | 265,239 | ¥ | 284,059 | ||||||||||||
| (1) | Derivative instruments categorized as “Risk Management” are used for certain economic hedging, such as managing the exposure to changes in fair value of the loan portfolio, and are identified as hedges under Japanese GAAP, but without applying hedge accounting under IFRS. |
F-37
Table of Contents
| At March 31, 2010 | ||||||||||||||||||||||||
| Protection purchased | Protection sold | |||||||||||||||||||||||
| Notional | Notional | |||||||||||||||||||||||
| amounts | Assets | Liabilities | amounts | Assets | Liabilities | |||||||||||||||||||
| (In millions) | ||||||||||||||||||||||||
Managing our credit risk portfolio | ¥ | 524,704 | ¥ | 2,312 | ¥ | 380 | ¥ | 622,232 | ¥ | 1,294 | ¥ | 8,262 | ||||||||||||
| Trading purposes | 12,808 | 59 | 196 | 4,393 | 10 | 2 | ||||||||||||||||||
| Facilitating client transactions | 791,554 | 66,941 | — | 791,554 | — | 73,751 | ||||||||||||||||||
| Total | ¥ | 1,329,066 | ¥ | 69,312 | ¥ | 576 | ¥ | 1,418,179 | ¥ | 1,304 | ¥ | 82,015 | ||||||||||||
| At March 31, 2009 | ||||||||||||||||||||||||
| Protection purchased | Protection sold | |||||||||||||||||||||||
| Notional | Notional | |||||||||||||||||||||||
| amounts | Assets | Liabilities | amounts | Assets | Liabilities | |||||||||||||||||||
| (In millions) | ||||||||||||||||||||||||
Managing our credit risk portfolio | ¥ | 539,296 | ¥ | 24,960 | ¥ | 98 | ¥ | 582,570 | ¥ | 71 | ¥ | 63,674 | ||||||||||||
| Trading purposes | 11,683 | 881 | 4 | 1,287 | 21 | 44 | ||||||||||||||||||
| Facilitating client transactions | 841,232 | 150,884 | — | 841,232 | — | 175,762 | ||||||||||||||||||
| Total | ¥ | 1,392,211 | ¥ | 176,725 | ¥ | 102 | ¥ | 1,425,089 | ¥ | 92 | ¥ | 239,480 | ||||||||||||
| At April 1, 2008 | ||||||||||||||||||||||||
| Protection purchased | Protection sold | |||||||||||||||||||||||
| Notional | Notional | |||||||||||||||||||||||
| amounts | Assets | Liabilities | amounts | Assets | Liabilities | |||||||||||||||||||
| (In millions) | ||||||||||||||||||||||||
Managing our credit risk portfolio | ¥ | 560,551 | ¥ | 7,976 | ¥ | 99 | ¥ | 537,193 | ¥ | 6 | ¥ | 27,613 | ||||||||||||
| Trading purposes | 44,946 | 1,119 | 126 | 6,910 | 36 | 4 | ||||||||||||||||||
| Facilitating client transactions | 949,891 | 40,569 | — | 1,182,037 | — | 32,434 | ||||||||||||||||||
| Total | ¥ | 1,555,388 | ¥ | 49,664 | ¥ | 225 | ¥ | 1,726,140 | ¥ | 42 | ¥ | 60,051 | ||||||||||||
F-38
Table of Contents
| At March 31, 2010 | At March 31, 2009 | At April 1, 2008 | ||||||||||||||||||||||
| Notional amounts | Notional amounts | Notional amounts | ||||||||||||||||||||||
| Protection | Protection | Protection | Protection | Protection | Protection | |||||||||||||||||||
| Type of counterparty | purchased | sold | purchased | sold | purchased | sold | ||||||||||||||||||
| (In millions) | ||||||||||||||||||||||||
| Banks and broker-dealers | ¥ | 825,967 | ¥ | 1,418,179 | ¥ | 855,492 | ¥ | 1,425,089 | ¥ | 996,238 | ¥ | 1,726,140 | ||||||||||||
| Insurance and other financial guaranty firms | 503,099 | — | 536,719 | — | 559,150 | — | ||||||||||||||||||
| Total | ¥ | 1,329,066 | ¥ | 1,418,179 | ¥ | 1,392,211 | ¥ | 1,425,089 | ¥ | 1,555,388 | ¥ | 1,726,140 | ||||||||||||
| At March 31, | At April 1, | |||||||||||
| 2010 | 2009 | 2008 | ||||||||||
| (In millions) | ||||||||||||
| Debt instruments | ¥ | 1,978,149 | ¥ | 1,956,968 | ¥ | 1,968,430 | ||||||
| Equity instruments | 114,234 | 106,822 | 118,182 | |||||||||
| Total financial assets at fair value through profit or loss | ¥ | 2,092,383 | ¥ | 2,063,790 | ¥ | 2,086,612 | ||||||
| At March 31, | At April 1, | |||||||||||
| 2010 | 2009 | 2008 | ||||||||||
| (In millions) | ||||||||||||
Held-to-maturity investments: | ||||||||||||
| Japanese government bonds | ¥ | 2,871,212 | ¥ | 1,574,005 | ¥ | 614,281 | ||||||
| Other debt instruments | 400,800 | 497,703 | 496,568 | |||||||||
| Total held-to-maturity investments | 3,272,012 | 2,071,708 | 1,110,849 | |||||||||
Available-for-sale financial assets: | ||||||||||||
| Japanese government bonds | 11,925,487 | 11,278,166 | 6,970,197 | |||||||||
| Other debt instruments | 4,487,223 | 6,795,622 | 6,067,698 | |||||||||
| Equity instruments | 3,467,466 | 2,784,033 | 3,843,740 | |||||||||
| Total available-for-sale financial assets | 19,880,176 | 20,857,821 | 16,881,635 | |||||||||
| Total investment securities | ¥ | 23,152,188 | ¥ | 22,929,529 | ¥ | 17,992,484 | ||||||
F-39
Table of Contents
F-40
Table of Contents
| At March 31, | At April 1, | |||||||||||
| 2010 | 2009 | 2008 | ||||||||||
| (In millions) | ||||||||||||
Domestic: | ||||||||||||
| Manufacturing | ¥ | 8,428,854 | ¥ | 8,836,291 | ¥ | 7,555,462 | ||||||
| Agriculture, forestry, fisheries and mining | 162,879 | 163,647 | 259,803 | |||||||||
| Construction | 1,492,690 | 1,716,567 | 1,815,201 | |||||||||
| Transportation, communications and public enterprises | 3,519,279 | 3,606,748 | 3,244,752 | |||||||||
| Wholesale and retail | 5,552,637 | 6,201,520 | 6,350,694 | |||||||||
| Finance and insurance | 3,431,882 | 3,613,653 | 3,582,845 | |||||||||
| Real estate and goods rental and leasing | 8,751,450 | 9,264,523 | 9,393,149 | |||||||||
| Services | 4,644,737 | 4,947,995 | 5,141,719 | |||||||||
| Municipalities | 1,346,611 | 1,274,196 | 1,086,548 | |||||||||
| Lease financing | 2,320,651 | 2,562,727 | 2,658,423 | |||||||||
Consumer(1) | 17,544,284 | 16,377,870 | 15,733,316 | |||||||||
| Others | 5,137,721 | 5,446,206 | 5,077,704 | |||||||||
| Total domestic | 62,333,675 | 64,011,943 | 61,899,616 | |||||||||
Foreign: | ||||||||||||
| Public sector | 147,115 | 82,598 | 115,942 | |||||||||
| Financial institutions | 2,031,812 | 1,812,218 | 1,897,715 | |||||||||
| Commerce and industry | 8,161,198 | 9,282,120 | 8,283,544 | |||||||||
| Lease financing | 205,547 | 239,728 | 227,508 | |||||||||
| Others | 442,225 | 1,017,223 | 830,568 | |||||||||
| Total foreign | 10,987,897 | 12,433,887 | 11,355,277 | |||||||||
| Gross loans and advances | 73,321,572 | 76,445,830 | 73,254,893 | |||||||||
| Adjust: Unearned income, unamortized premiums-net and deferred loan fees-net | (153,889 | ) | (176,906 | ) | (176,387 | ) | ||||||
| Less: Allowance for loan losses | (1,533,555 | ) | (1,599,630 | ) | (1,094,226 | ) | ||||||
| Net loans and advances | ¥ | 71,634,128 | ¥ | 74,669,294 | ¥ | 71,984,280 | ||||||
| (1) | The balance in Consumer mainly consists of housing loans. The housing loan balances amounted to ¥14,436,921 million, ¥13,577,902 million and ¥13,067,503 million at March 31, 2010 and 2009, and April 1, 2008, respectively. |
F-41
Table of Contents
| For the fiscal year ended | ||||||||
| March 31, | ||||||||
| 2010 | 2009 | |||||||
| (In millions, except percentages) | ||||||||
| Allowance for loan losses at the beginning of the fiscal year | ¥ | 1,599,630 | ¥ | 1,094,226 | ||||
| Provision (credit) for loan losses | 215,886 | 849,495 | ||||||
| Charge-offs: | ||||||||
| Domestic | 360,895 | 306,141 | ||||||
| Foreign | 23,620 | 30,733 | ||||||
| Total | 384,515 | 336,874 | ||||||
| Recoveries: | ||||||||
| Domestic | 953 | 1,082 | ||||||
| Foreign | 16 | 15 | ||||||
| Total | 969 | 1,097 | ||||||
| Net charge-offs | 383,546 | 335,777 | ||||||
Others(1) | 101,585 | (8,314 | ) | |||||
| Allowance for loan losses at the end of the fiscal year | ¥ | 1,533,555 | ¥ | 1,599,630 | ||||
| Allowance for loan losses applicable to foreign activities: | ||||||||
| Balance at the beginning of the fiscal year | ¥ | 192,325 | ¥ | 92,248 | ||||
| Balance at the end of the fiscal year | ¥ | 121,797 | ¥ | 192,325 | ||||
| Provision (credit) for loan losses | ¥ | (42,830 | ) | ¥ | 137,898 | |||
| Ratio of net charge-offs during the fiscal year to average loans outstanding during the fiscal year | 0.51 | % | 0.45 | % | ||||
| (1) | Others mainly included an increase in allowance for loan losses of ¥102,687 million from acquisition of subsidiaries for the fiscal year ended March 31, 2010, whereas the amount for the fiscal year ended March 31, 2009 was primarily from foreign exchange translations. |
F-42
Table of Contents
| Percentage | ||||||||||||
| of SMFG’s | ||||||||||||
| Issued | Voting | |||||||||||
| Company Name | Capital | Rights | Main Business | |||||||||
| (In millions) | % | |||||||||||
Principal Associates | ||||||||||||
| Daiwa SMBC Capital Co., Ltd. | ¥ | 18,767 | 40.00 | Venture capital | ||||||||
| Daiwa SB Investments Ltd. | 2,000 | 43.96 | Investment advisory and investment trust management | |||||||||
| Sumitomo Mitsui Asset Management Company, Limited | 2,000 | 27.50 | Investment advisory and investment trust management | |||||||||
| JSOL Corporation | 5,000 | 50.00 | System development and data processing | |||||||||
| Sakura Information System Co., Ltd. | 600 | 49.00 | System engineering and data processing | |||||||||
Vietnam Export Import Commercial Joint Stock Bank(1) | 12,526 | (2) | 15.06 | Commercial banking | ||||||||
| Promise Co., Ltd. | 80,737 | 22.02 | Consumer finance | |||||||||
| At-Loan Co., Ltd. | 10,912 | 49.99 | Consumer finance | |||||||||
Cedyna Financial Corporation(3) | 57,843 | 48.04 | Credit card and shopping credit services | |||||||||
| Sumitomo Mitsui Auto Service Company, Limited | 6,950 | 39.99 | Leasing | |||||||||
| NEC Capital Solutions Limited | 3,776 | 25.03 | Leasing | |||||||||
Principal Joint Venture | ||||||||||||
Daiwa Securities SMBC Principal Investments Co., Ltd.(4) | 500 | 40.00 | Investments, fund management | |||||||||
| (1) | The investment in Vietnam Export Import Commercial Joint Stock Bank is accounted for as an associate since the SMFG Group has the ability to exercise significant influence over the entity through the participation in the policy making process at the meeting of the Board of Directors and the provision of essential technical information by virtue of a strategic alliance agreement. | |
| (2) | The amount is presented in billion Vietnamese dong. | |
| (3) | Cedyna Financial Corporation became a subsidiary when the SMFG Group subscribed to its newly issued shares and obtained control over Cedyna Financial Corporation on May 31, 2010. Refer to Note 48 “Acquisitions”. | |
| (4) | The SMFG Group previously owned a 40.00% equity interest in Daiwa Securities SMBC Co., Ltd. and accounted for it as an associate. On December 31, 2009, the SMFG Group sold its entire interest in Daiwa Securities SMBC Co., Ltd. to Daiwa Securities Group Inc. but maintained a 40.00% equity interest in Daiwa Securities SMBC Principal Investments Co., Ltd. which had been a wholly owned subsidiary of Daiwa Securities SMBC Co., Ltd., and which has become a joint venture after the transaction. The losses related to the transaction were ¥8,752 million and recorded in “Other expenses” in the consolidated income statement for the fiscal year ended March 31, 2010. |
F-43
Table of Contents
| Associates and Joint Ventures | ||||||||
| 2010 | 2009 | |||||||
| (In millions) | ||||||||
| At the beginning of the fiscal year | ¥ | 407,835 | ¥ | 457,394 | ||||
| Share of post-tax loss of associates and joint ventures | (37,461 | ) | (54,318 | ) | ||||
| Dividends paid | (1,623 | ) | (3,095 | ) | ||||
| New investments | 60,787 | 22,250 | ||||||
| Acquisitions | — | 23,606 | ||||||
| Disposals | (160,441 | ) | — | |||||
Impairment losses(1) | (18,134 | ) | (31,508 | ) | ||||
Reversal of impairment losses(2) | 19,832 | — | ||||||
| Exchange and other adjustments | 18,346 | (6,494 | ) | |||||
| At the end of the fiscal year | ¥ | 289,141 | ¥ | 407,835 | ||||
| (1) | Impairment losses are recorded in “Other expenses” in the consolidated income statement. | |
| (2) | Reversal of impairment losses are recorded in “Other income” in the consolidated income statement. |
| At March 31, | ||||||||
| 2010 | 2009 | |||||||
| (In millions) | ||||||||
| Total assets | ¥ | 5,829,836 | ¥ | 19,531,995 | ||||
| Total liabilities | 4,896,821 | 18,187,332 | ||||||
| Revenues | 1,643,425 | 2,280,886 | ||||||
| Expenses | 1,658,503 | 2,478,873 | ||||||
| Net profit (loss) | (15,078 | ) | (197,987 | ) | ||||
F-44
Table of Contents
| Fair Value | ||||||||||||
| At March 31, | At April 1, | |||||||||||
| 2010 | 2009 | 2008 | ||||||||||
| (In millions) | ||||||||||||
| Promise Co., Ltd. | ¥ | 24,212 | ¥ | 43,063 | ¥ | 80,010 | ||||||
| Cedyna Financial Corporation (Former OMC Card, Inc.) | 38,699 | 23,063 | 20,148 | |||||||||
Vietnam Export Import Commercial Joint Stock Bank(1) | 15,135 | — | — | |||||||||
Daiwa SMBC Capital Co., Ltd.(2) | — | 6,617 | 13,990 | |||||||||
| NEC Capital Solutions Limited | 6,506 | 3,611 | 7,056 | |||||||||
| (1) | The stock of Vietnam Export Import Commercial Joint Stock Bank was listed on the Ho Chi Minh City Stock Exchange in October 2009. | |
| (2) | The stock of Daiwa SMBC Capital Co., Ltd was delisted from JASDAQ Securities Exchange in September 2009. |
F-45
Table of Contents
| Land | Buildings | Leased Assets | Others | Total | ||||||||||||||||
| (In millions) | ||||||||||||||||||||
| Cost | ¥ | 493,881 | ¥ | 531,857 | ¥ | 4,821 | ¥ | 464,048 | ¥ | 1,494,607 | ||||||||||
| Accumulated depreciation and impairment losses | (6,830 | ) | (306,787 | ) | (2,726 | ) | (316,572 | ) | (632,915 | ) | ||||||||||
| Net carrying amount at April 1, 2008 | 487,051 | 225,070 | 2,095 | 147,476 | 861,692 | |||||||||||||||
| Additions | 6,173 | 33,446 | 6,105 | 91,715 | 137,439 | |||||||||||||||
| Acquisition of subsidiaries | — | 69 | — | 4,382 | 4,451 | |||||||||||||||
| Disposals | (5,209 | ) | (3,991 | ) | (17 | ) | (9,582 | ) | (18,799 | ) | ||||||||||
| Disposal of subsidiaries | (122 | ) | (1,174 | ) | (439 | ) | (1,450 | ) | (3,185 | ) | ||||||||||
| Depreciation | — | (15,304 | ) | (725 | ) | (52,215 | ) | (68,244 | ) | |||||||||||
| Impairment losses | (155 | ) | (6,405 | ) | — | — | (6,560 | ) | ||||||||||||
| Exchange differences | (839 | ) | (318 | ) | — | (1,862 | ) | (3,019 | ) | |||||||||||
| Other changes | 390 | 3,656 | — | (3,865 | ) | 181 | ||||||||||||||
| Net carrying amount | 487,289 | 235,049 | 7,019 | 174,599 | 903,956 | |||||||||||||||
| Cost | 493,673 | 554,894 | 9,181 | 488,251 | 1,545,999 | |||||||||||||||
| Accumulated depreciation and impairment losses | (6,384 | ) | (319,845 | ) | (2,162 | ) | (313,652 | ) | (642,043 | ) | ||||||||||
| Net carrying amount at March 31, 2009 | 487,289 | 235,049 | 7,019 | 174,599 | 903,956 | |||||||||||||||
| Additions | 10,437 | 22,758 | 4,117 | 122,861 | 160,173 | |||||||||||||||
| Acquisition of subsidiaries | 13,175 | 16,041 | 3,048 | 5,659 | 37,923 | |||||||||||||||
| Disposals | (11,986 | ) | (4,429 | ) | (590 | ) | (3,532 | ) | (20,537 | ) | ||||||||||
| Disposal of subsidiaries | — | — | — | — | — | |||||||||||||||
| Depreciation | — | (16,233 | ) | (3,462 | ) | (55,995 | ) | (75,690 | ) | |||||||||||
| Impairment losses | (1,739 | ) | (7,996 | ) | — | (164 | ) | (9,899 | ) | |||||||||||
| Exchange differences | 34 | (248 | ) | — | (131 | ) | (345 | ) | ||||||||||||
| Other changes | (1 | ) | 7,179 | (586 | ) | (9,002 | ) | (2,410 | ) | |||||||||||
| Net carrying amount | 497,209 | 252,121 | 9,546 | 234,295 | 993,171 | |||||||||||||||
| Cost | 505,046 | 589,708 | 13,575 | 570,982 | 1,679,311 | |||||||||||||||
| Accumulated depreciation and impairment losses | (7,837 | ) | (337,587 | ) | (4,029 | ) | (336,687 | ) | (686,140 | ) | ||||||||||
| Net carrying amount at March 31, 2010 | ¥ | 497,209 | ¥ | 252,121 | ¥ | 9,546 | ¥ | 234,295 | ¥ | 993,171 | ||||||||||
F-46
Table of Contents
| At March 31, | At April 1, | |||||||||||
| 2010 | 2009 | 2008 | ||||||||||
| (In millions) | ||||||||||||
| Tangible assets: | ||||||||||||
| Land and buildings | ¥ | 4,954 | ¥ | 5,298 | ¥ | — | ||||||
Other tangible assets(1) | 4,592 | 1,721 | 2,095 | |||||||||
Total(2) | 9,546 | 7,019 | 2,095 | |||||||||
| Software | 367 | 417 | 2,085 | |||||||||
Total(3) | ¥ | 9,913 | ¥ | 7,436 | ¥ | 4,180 | ||||||
| (1) | Other tangible assets include mainly equipment, machinery, and vehicles. | |
| (2) | Cross-reference to Leased assets in Note 12 “Property, Plant and Equipment”. | |
| (3) | The SMFG Group has sublet leased assets classified as finance leases (the carrying amount of those assets are not included in table above). Future minimum sublease payments related to sublet leased assets are included in finance lease commitments. |
| At March 31, | At April 1, | |||||||||||
| 2010 | 2009 | 2008 | ||||||||||
| (In millions) | ||||||||||||
Future minimum lease payments: | ||||||||||||
| Not later than one year | ¥ | 20,088 | ¥ | 7,020 | ¥ | 8,354 | ||||||
| Later than one year and not later than five years | 35,882 | 11,330 | 13,069 | |||||||||
| Later than five years | 7,213 | 6,974 | 1,854 | |||||||||
| Total | 63,183 | 25,324 | 23,277 | |||||||||
| Less: Future interest charges | (3,005 | ) | (1,732 | ) | (395 | ) | ||||||
Present value of finance lease commitments(1) | ¥ | 60,178 | ¥ | 23,592 | ¥ | 22,882 | ||||||
| (1) | Present value of finance lease commitments is included within “Borrowings” in the consolidated statement of financial position. |
F-47
Table of Contents
| At March 31, | At April 1, | |||||||||||
| 2010 | 2009 | 2008 | ||||||||||
| (In millions) | ||||||||||||
Future minimum lease payments under non-cancellable operating leases: | ||||||||||||
| Not later than one year | ¥ | 17,153 | ¥ | 13,071 | ¥ | 13,925 | ||||||
| Later than one year and not later than five years | 42,496 | 33,256 | 33,745 | |||||||||
| Later than five years | 27,247 | 19,605 | 30,341 | |||||||||
| Total future minimum lease payments under non-cancellable operating leases | ¥ | 86,896 | ¥ | 65,932 | ¥ | 78,011 | ||||||
| At March 31, 2010 | ||||||||||||||||
| Present value of | ||||||||||||||||
| Unearned | the minimum | |||||||||||||||
| Gross investment | finance | lease payments | Unguaranteed | |||||||||||||
| in the lease | income | receivable(1) | residual values(1) | |||||||||||||
| (In millions) | ||||||||||||||||
| Not later than one year | ¥ | 878,804 | ¥ | 77,110 | ¥ | 801,694 | ¥ | 26,554 | ||||||||
| Later than one year and not later than five years | 1,469,215 | 118,227 | 1,350,988 | 70,110 | ||||||||||||
| Later than five years | 288,896 | 41,810 | 247,086 | 29,766 | ||||||||||||
| Total | ¥ | 2,636,915 | ¥ | 237,147 | ¥ | 2,399,768 | ¥ | 126,430 | ||||||||
F-48
Table of Contents
| At March 31, 2009 | ||||||||||||||||
| Present value of | ||||||||||||||||
| Unearned | the minimum | |||||||||||||||
| Gross investment | finance | lease payments | Unguaranteed | |||||||||||||
| in the lease | income | receivable(1) | residual values(1) | |||||||||||||
| (In millions) | ||||||||||||||||
| Not later than one year | ¥ | 977,759 | ¥ | 84,359 | ¥ | 893,400 | ¥ | 29,607 | ||||||||
| Later than one year and not later than five years | 1,668,456 | 138,143 | 1,530,313 | 75,147 | ||||||||||||
| Later than five years | 295,421 | 48,432 | 246,989 | 26,999 | ||||||||||||
| Total | ¥ | 2,941,636 | ¥ | 270,934 | ¥ | 2,670,702 | ¥ | 131,753 | ||||||||
| At April 1, 2008 | ||||||||||||||||
| Present value of | ||||||||||||||||
| Unearned | the minimum | |||||||||||||||
| Gross investment | finance | lease payments | Unguaranteed | |||||||||||||
| in the lease | income | receivable(1) | residual values(1) | |||||||||||||
| (In millions) | ||||||||||||||||
| Not later than one year | ¥ | 950,254 | ¥ | 93,919 | ¥ | 856,335 | ¥ | 24,307 | ||||||||
| Later than one year and not later than five years | 1,757,031 | 147,361 | 1,609,670 | 79,579 | ||||||||||||
| Later than five years | 362,468 | 76,786 | 285,682 | 30,358 | ||||||||||||
| Total | ¥ | 3,069,753 | ¥ | 318,066 | ¥ | 2,751,687 | ¥ | 134,244 | ||||||||
| (1) | Present value of the minimum lease payments receivable and unguaranteed residual values are included within “Loans and advances” in the consolidated statement of financial position. |
| At March 31, | At April 1, | |||||||||||
| 2010 | 2009 | 2008 | ||||||||||
| (In millions) | ||||||||||||
Future minimum lease payments receivable under non-cancellable operating leases: | ||||||||||||
| Not later than one year | ¥ | 25,126 | ¥ | 19,104 | ¥ | 12,849 | ||||||
| Later than one year and not later than five years | 84,479 | 61,877 | 13,082 | |||||||||
| Later than five years | 44,958 | 19,802 | 29,048 | |||||||||
| Total | ¥ | 154,563 | ¥ | 100,783 | ¥ | 54,979 | ||||||
F-49
Table of Contents
| Commercial | ||||||||||||||||||||||||
| Banking | Securities | Leasing | Credit Card | Others | Total | |||||||||||||||||||
| (In millions) | ||||||||||||||||||||||||
| Gross amount of goodwill | ¥ | — | ¥ | 92,496 | ¥ | 85,888 | ¥ | 260 | ¥ | 74 | ¥ | 178,718 | ||||||||||||
| Accumulated impairment losses | — | — | — | — | — | — | ||||||||||||||||||
| Net carrying amount at April 1, 2008 | — | 92,496 | 85,888 | 260 | 74 | 178,718 | ||||||||||||||||||
| Acquisitions | 465 | — | 16,822 | — | 1,466 | 18,753 | ||||||||||||||||||
| Disposals | — | — | — | — | — | — | ||||||||||||||||||
| Impairment losses | — | (10,067 | ) | — | — | (74 | ) | (10,141 | ) | |||||||||||||||
| Net carrying amount | 465 | 82,429 | 102,710 | 260 | 1,466 | 187,330 | ||||||||||||||||||
| Gross amount of goodwill | 465 | 92,496 | 102,710 | 260 | 1,540 | 197,471 | ||||||||||||||||||
| Accumulated impairment losses | — | (10,067 | ) | — | — | (74 | ) | (10,141 | ) | |||||||||||||||
| Net carrying amount at March 31, 2009 | 465 | 82,429 | 102,710 | 260 | 1,466 | 187,330 | ||||||||||||||||||
| Acquisitions | 10,787 | 164,440 | — | — | 3,918 | 179,145 | ||||||||||||||||||
| Disposals | (55 | ) | — | — | — | — | (55 | ) | ||||||||||||||||
| Impairment losses | — | — | — | — | (3,918 | ) | (3,918 | ) | ||||||||||||||||
| Net carrying amount | 11,197 | 246,869 | 102,710 | 260 | 1,466 | 362,502 | ||||||||||||||||||
| Gross amount of goodwill | 11,197 | 256,936 | 102,710 | 260 | 5,458 | 376,561 | ||||||||||||||||||
| Accumulated impairment losses | — | (10,067 | ) | — | — | (3,992 | ) | (14,059 | ) | |||||||||||||||
| Net carrying amount at March 31, 2010 | ¥ | 11,197 | ¥ | 246,869 | ¥ | 102,710 | ¥ | 260 | ¥ | 1,466 | ¥ | 362,502 | ||||||||||||
F-50
Table of Contents
F-51
Table of Contents
| For the fiscal year ended March 31, | ||||||||||||||||||||
| 2010 | 2009 | |||||||||||||||||||
| SMBC Friend | Nikko Cordial | SMBC Friend | ||||||||||||||||||
| Securities | Securities | SMFL | Securities | SMFL | ||||||||||||||||
| Pre-tax discount rate | 12.51 | % | 15.33 | % | 12.89 | % | 13.85 | % | 13.49 | % | ||||||||||
| Growth rate | 1.00 | % | 1.00 | % | 1.00 | % | 1.00 | % | 1.00 | % | ||||||||||
F-52
Table of Contents
| Internally | Contractual | |||||||||||||||||||||||
| generated | Purchased | customer | Other | |||||||||||||||||||||
| software | software | relationships | Trademarks | intangibles | Total | |||||||||||||||||||
| (In millions) | ||||||||||||||||||||||||
| Cost | ¥ | 187,509 | ¥ | 115,990 | ¥ | — | ¥ | — | ¥ | 14,820 | ¥ | 318,319 | ||||||||||||
| Accumulated amortization and impairment losses | (105,032 | ) | (60,840 | ) | — | — | (1,961 | ) | (167,833 | ) | ||||||||||||||
| Net carrying amount at April 1, 2008 | 82,477 | 55,150 | — | — | 12,859 | 150,486 | ||||||||||||||||||
| Additions | 41,840 | 29,630 | — | — | 2,307 | 73,777 | ||||||||||||||||||
| Acquisition of subsidiaries | — | 147 | — | — | 1 | 148 | ||||||||||||||||||
| Disposals | (3 | ) | (3,915 | ) | — | — | (70 | ) | (3,988 | ) | ||||||||||||||
| Disposal of subsidiaries | (1,378 | ) | (638 | ) | — | — | (60 | ) | (2,076 | ) | ||||||||||||||
| Amortization | (24,938 | ) | (21,260 | ) | — | — | (1,644 | ) | (47,842 | ) | ||||||||||||||
| Impairment losses | (169 | ) | — | — | — | (580 | ) | (749 | ) | |||||||||||||||
| Exchange differences | (41 | ) | (175 | ) | — | — | (1 | ) | (217 | ) | ||||||||||||||
| Other changes | 2,656 | 1,418 | — | — | (3,092 | ) | 982 | |||||||||||||||||
| Net carrying amount | 100,444 | 60,357 | — | — | 9,720 | 170,521 | ||||||||||||||||||
| Cost | 221,386 | 108,055 | — | — | 12,268 | 341,709 | ||||||||||||||||||
| Accumulated amortization and impairment losses | (120,942 | ) | (47,698 | ) | — | — | (2,548 | ) | (171,188 | ) | ||||||||||||||
| Net carrying amount at March 31, 2009 | 100,444 | 60,357 | — | — | 9,720 | 170,521 | ||||||||||||||||||
| Additions | 41,913 | 36,853 | — | — | 3,506 | 82,272 | ||||||||||||||||||
| Acquisition of subsidiaries | 20,145 | 13,606 | 86,066 | 37,055 | 5,263 | 162,135 | ||||||||||||||||||
| Disposals | (830 | ) | (516 | ) | — | — | (40 | ) | (1,386 | ) | ||||||||||||||
| Disposal of subsidiaries | — | — | — | — | — | — | ||||||||||||||||||
| Amortization | (36,347 | ) | (21,196 | ) | (2,869 | ) | (1,853 | ) | (432 | ) | (62,697 | ) | ||||||||||||
| Impairment losses | (1,574 | ) | (666 | ) | — | — | (26 | ) | (2,266 | ) | ||||||||||||||
| Exchange differences | (2 | ) | (78 | ) | — | — | 1 | (79 | ) | |||||||||||||||
| Other changes | 2,164 | 1,290 | — | — | (4,221 | ) | (767 | ) | ||||||||||||||||
| Net carrying amount | 125,913 | 89,650 | 83,197 | 35,202 | 13,771 | 347,733 | ||||||||||||||||||
| Cost | 280,176 | 128,642 | 86,066 | 37,055 | 16,278 | 548,217 | ||||||||||||||||||
| Accumulated amortization and impairment losses | (154,263 | ) | (38,992 | ) | (2,869 | ) | (1,853 | ) | (2,507 | ) | (200,484 | ) | ||||||||||||
| Net carrying amount at March 31, 2010 | ¥ | 125,913 | ¥ | 89,650 | ¥ | 83,197 | ¥ | 35,202 | ¥ | 13,771 | ¥ | 347,733 | ||||||||||||
F-53
Table of Contents
| At March 31, | At April 1, | |||||||||||
| 2010 | 2009 | 2008 | ||||||||||
| (In millions) | ||||||||||||
| Prepaid expenses | ¥ | 36,619 | ¥ | 31,845 | ¥ | 41,800 | ||||||
| Accrued income | 243,175 | 265,115 | 295,779 | |||||||||
| Receivables from unsettled regular way trades | 592,154 | 188,451 | 244,806 | |||||||||
| Retirement benefit assets | 91,261 | 60,659 | 22,695 | |||||||||
| Security deposits | 115,275 | 97,372 | 99,110 | |||||||||
Investment properties(1) | 125,188 | 115,425 | 69,808 | |||||||||
| Others | 371,097 | 319,284 | 310,220 | |||||||||
| Total other assets | ¥ | 1,574,769 | ¥ | 1,078,151 | ¥ | 1,084,218 | ||||||
| (1) | Investment properties are carried at cost less accumulated depreciation and accumulated impairment losses. The fair values of investment properties were ¥125,034 million, ¥117,096 million, and ¥76,598 million at March 31, 2010 and 2009, and April 1, 2008, respectively. The fair values were mainly determined based on market values provided by independent valuation appraisers having the appropriate recognized professional qualifications and recent experience in the locations and categories of properties being valued. Rental income from investment properties were ¥9,758 million and ¥8,012 million for the fiscal years ended March 31, 2010 and 2009, respectively. |
| At March 31, | At April 1, | |||||||||||
| 2010 | 2009 | 2008 | ||||||||||
| (In millions) | ||||||||||||
| Non-interest-bearing demand deposits | ¥ | 11,608,944 | ¥ | 11,661,322 | ¥ | 11,034,440 | ||||||
| Interest-bearing deposits: | ||||||||||||
| Demand deposits | 31,226,596 | 30,032,219 | 29,905,022 | |||||||||
| Deposits at notice | 5,363,534 | 5,162,138 | 4,668,292 | |||||||||
| Time deposits | 26,882,242 | 25,027,772 | 23,129,474 | |||||||||
| Negotiable certificates of deposit | 6,995,620 | 7,461,285 | 3,078,149 | |||||||||
| Others | 3,621,037 | 3,886,498 | 4,073,581 | |||||||||
| Total deposits | ¥ | 85,697,973 | ¥ | 83,231,234 | ¥ | 75,888,958 | ||||||
F-54
Table of Contents
| At March 31, | At April 1, | |||||||||||
| 2010 | 2009 | 2008 | ||||||||||
| (In millions) | ||||||||||||
| Debt instruments “short position” | ¥ | 1,589,366 | ¥ | 12,492 | ¥ | 62,497 | ||||||
| Equity instruments “short position” | 3,259 | 1,788 | 328 | |||||||||
| Total trading liabilities | ¥ | 1,592,625 | ¥ | 14,280 | ¥ | 62,825 | ||||||
F-55
Table of Contents
| At March 31, | At April 1, | |||||||||||||||
| Interest rate | 2010 | 2009 | 2008 | |||||||||||||
| (In millions) | ||||||||||||||||
SMBC: | ||||||||||||||||
| Short-term borrowings | 0.10%-6.70 | % | ¥ | 919,778 | ¥ | 2,195,754 | ¥ | 1,704,817 | ||||||||
| Long-term borrowings: | ||||||||||||||||
| Unsubordinated | ||||||||||||||||
| Floating rate borrowing, payable in Japanese yen, due 2008-2023 | 0.25%-6.10 | % | 63,839 | 117,790 | 140,773 | |||||||||||
| Floating rate borrowing, payable in United States dollars, due 2008-2015 | 0.65%-5.02 | % | 158,185 | — | 20,038 | |||||||||||
| Other fixed or floating rate borrowing, due 2008-2010 | 1.00%-5.85 | % | 6,245 | 3,437 | 743 | |||||||||||
| Subordinated | ||||||||||||||||
| Fixed rate borrowing, payable in Japanese yen, due 2008-2018 | 1.25%-5.00 | % | 346,000 | 398,000 | 472,500 | |||||||||||
| Floating rate borrowing, payable in Japanese yen, due 2008-2012 | 1.75%-2.70 | % | 5,000 | 20,000 | 33,000 | |||||||||||
| Total SMBC | 1,499,047 | 2,734,981 | 2,371,871 | |||||||||||||
Other subsidiaries: | ||||||||||||||||
| Short-term borrowings | 0.06%-7.20 | % | 2,839,228 | 640,144 | 583,061 | |||||||||||
| Long-term borrowings: | ||||||||||||||||
| Unsubordinated | ||||||||||||||||
| Fixed rate borrowing, payable in Japanese yen, due 2008-2021 | 0.25%-3.60 | % | 488,500 | 502,076 | 603,805 | |||||||||||
| Fixed rate borrowing, payable in United States dollars, due 2008-2017 | 1.30%-5.95 | % | 108,644 | 125,233 | 159,668 | |||||||||||
| Fixed rate borrowing, payable in Thai baht, due 2008-2013 | 3.25%-6.65 | % | 10,777 | 8,326 | 6,559 | |||||||||||
| Fixed rate borrowing, payable in Chinese yuan, due 2010-2012 | 0.05%-0.07 | % | 12,150 | 1,333 | — | |||||||||||
| Floating rate borrowing, payable in Japanese yen, due 2008-2025 | 0.37%-2.04 | % | 591,422 | 526,528 | 419,869 | |||||||||||
| Floating rate borrowing, payable in Chinese yuan, due 2011-2012 | 0.05%-0.07 | % | 12,781 | 698 | — | |||||||||||
| Other fixed or floating rate borrowing, due 2008-2017 | 0.32%-6.97 | % | 6,341 | 6,928 | 16,880 | |||||||||||
| Subordinated | ||||||||||||||||
| Floating rate borrowing, payable in Japanese yen, due 2014-2017 | 1.80%-3.91 | % | 27,730 | 18,000 | 18,000 | |||||||||||
| Total other subsidiaries | 4,097,573 | 1,829,266 | 1,807,842 | |||||||||||||
Liabilities associated with securitization transactions: | ||||||||||||||||
| Fixed rate borrowing, payable in Japanese yen, due 2008-2044 | 0.34%-2.78 | % | 1,519,857 | 1,616,538 | 1,707,208 | |||||||||||
| Floating rate borrowing, payable in Japanese yen, due 2008-2038 | 0.46%-2.43 | % | 144,829 | 218,626 | 212,726 | |||||||||||
| Total liabilities associated with securitization transactions | 1,664,686 | 1,835,164 | 1,919,934 | |||||||||||||
Lease obligations | — | 60,178 | 23,592 | 22,882 | ||||||||||||
| Total borrowings | ¥ | 7,321,484 | ¥ | 6,423,003 | ¥ | 6,122,529 | ||||||||||
F-56
Table of Contents
| At March 31, | At April 1, | |||||||||||||||
| Interest rate | 2010 | 2009 | 2008 | |||||||||||||
| (In millions) | ||||||||||||||||
SMBC: | ||||||||||||||||
| Commercial paper | 0.11%-0.59 | % | ¥ | 475,466 | ¥ | 114,243 | ¥ | — | ||||||||
| Bonds: | ||||||||||||||||
| Bonds, payable in Japanese yen | 0.00%-5.49 | % | 1,055,625 | 1,268,558 | 1,510,398 | |||||||||||
| Bonds, payable in Australian dollars | 5.76% | 45,561 | — | — | ||||||||||||
| Subordinated bonds: | ||||||||||||||||
| Subordinated bonds, payable in Japanese yen | 0.50%-3.00 | % | 1,972,906 | 1,574,169 | 1,420,432 | |||||||||||
| Subordinated bonds, payable in United States dollars | 5.63%-8.15 | % | 102,091 | 206,849 | 296,189 | |||||||||||
| Subordinated bonds, payable in British pound sterling | 6.98% | — | — | 2,403 | ||||||||||||
| Subordinated bonds, payable in Euros | 4.38% | 40,955 | 251,947 | 306,337 | ||||||||||||
| Total SMBC | 3,692,604 | 3,415,766 | 3,535,759 | |||||||||||||
Other subsidiaries: | ||||||||||||||||
| Commercial paper | 0.11%-4.90 | % | 1,410,174 | 1,473,687 | 1,446,345 | |||||||||||
| Bonds: | ||||||||||||||||
| Bonds, payable in Japanese yen | 0.00%-3.50 | % | 89,865 | 126,125 | 172,703 | |||||||||||
| Bonds, payable in United States dollars | 7.00% | — | 910 | 1,142 | ||||||||||||
| Bonds, payable in British pound sterling | 3.95% | — | — | 1,812 | ||||||||||||
| Subordinated bonds: | ||||||||||||||||
| Subordinated bonds, payable in Japanese yen | 1.05%-4.95 | % | 112,240 | 146,452 | 160,726 | |||||||||||
| Subordinated bonds, payable in United States dollars | 8.50% | — | 98,230 | 100,190 | ||||||||||||
| Other: | ||||||||||||||||
| Liabilities to third parties under investment contracts | — | 18,273 | 16,312 | 59,101 | ||||||||||||
| Total other subsidiaries | 1,630,552 | 1,861,716 | 1,942,019 | |||||||||||||
| Total debt securities in issue | ¥ | 5,323,156 | ¥ | 5,277,482 | ¥ | 5,477,778 | ||||||||||
F-57
Table of Contents
| Provision for | ||||||||||||
| interest | ||||||||||||
| repayment | Other provisions | Total | ||||||||||
| (In millions) | ||||||||||||
| Balance at April 1, 2008 | ¥ | 8,442 | ¥ | 19,267 | ¥ | 27,709 | ||||||
| Additional provisions | 1,559 | 8,807 | 10,366 | |||||||||
| Amounts used | (1,297 | ) | (6,827 | ) | (8,124 | ) | ||||||
| Unused amounts reversed | (9 | ) | (437 | ) | (446 | ) | ||||||
| Amortization of discount and effect of change in discount rate | — | 595 | 595 | |||||||||
| Others | — | (436 | ) | (436 | ) | |||||||
| Balance at March 31, 2009 | 8,695 | 20,969 | 29,664 | |||||||||
| Additional provisions | 2,729 | 5,541 | 8,270 | |||||||||
| Amounts used | (1,618 | ) | (5,025 | ) | (6,643 | ) | ||||||
| Unused amounts reversed | — | (135 | ) | (135 | ) | |||||||
| Amortization of discount and effect of change in discount rate | — | (413 | ) | (413 | ) | |||||||
| Others | 10 | 1,483 | 1,493 | |||||||||
| Balance at March 31, 2010 | ¥ | 9,816 | ¥ | 22,420 | ¥ | 32,236 | ||||||
F-58
Table of Contents
| At March 31, | At April 1, | |||||||||||
| 2010 | 2009 | 2008 | ||||||||||
| (In millions) | ||||||||||||
| Accrued expenses | ¥ | 198,721 | ¥ | 195,596 | ¥ | 253,449 | ||||||
| Unearned income | 169,333 | 164,648 | 167,114 | |||||||||
| Financial guarantees and other credit related contingent liabilities | 26,677 | 30,235 | 27,090 | |||||||||
| Due to trust account | 159,554 | 60,918 | 80,796 | |||||||||
| Payables from unsettled regular way trades | 1,107,212 | 705,639 | 705,807 | |||||||||
| Payable related to credit card services | 273,953 | 258,880 | 255,826 | |||||||||
| Obligations from factoring transactions | 164,102 | 173,844 | 209,508 | |||||||||
| Retirement benefit liabilities | 58,184 | 53,584 | 58,101 | |||||||||
| Guarantee deposits received | 117,979 | 101,638 | 95,000 | |||||||||
Preferred stock classified as liability(1) | — | 120,365 | 308,877 | |||||||||
| Others | 790,612 | 629,795 | 681,248 | |||||||||
| Total other liabilities | ¥ | 3,066,327 | ¥ | 2,495,142 | ¥ | 2,842,816 | ||||||
| (1) | Cross-reference to Type 4 preferred stock in Note 24 “Shareholders’ Equity”. |
| For the fiscal year ended | ||||||||
| March 31, | ||||||||
| 2010 | 2009 | |||||||
| (In millions) | ||||||||
| At the beginning of the fiscal year | ¥ | 1,686,251 | ¥ | 1,208,550 | ||||
| Deferred tax (expense) benefit | (385,991 | ) | 129,410 | |||||
| Deferred tax relating to other comprehensive income: | ||||||||
| Available-for-sale financial assets reserve | (219,946 | ) | 336,007 | |||||
| Exchange differences on translating the foreign operations reserve | 59 | 14,233 | ||||||
| Acquisitions and disposals of subsidiaries-net | 20,243 | (541 | ) | |||||
| Exchange differences and others | (3,265 | ) | (1,408 | ) | ||||
| At the end of the fiscal year | ¥ | 1,097,351 | ¥ | 1,686,251 | ||||
F-59
Table of Contents
| At March 31, | At April 1, | |||||||||||
| 2010 | 2009 | 2008 | ||||||||||
| (In millions) | ||||||||||||
Deferred tax assets: | ||||||||||||
| Loans and advances | ¥ | 468,299 | ¥ | 460,181 | ¥ | 277,106 | ||||||
| Tax losses carried forward | 438,084 | 686,283 | 856,540 | |||||||||
| Retirement benefits | 88,972 | 98,625 | 114,146 | |||||||||
| Derivative financial instruments | 72,885 | 103,562 | 114,737 | |||||||||
| Investment securities | 64,495 | 357,907 | 9,149 | |||||||||
| Other deductible temporary differences | 130,802 | 126,173 | 138,229 | |||||||||
| Total deferred tax assets | 1,263,537 | 1,832,731 | 1,509,907 | |||||||||
Deferred tax liabilities: | ||||||||||||
| Lease transactions | 40,428 | 44,771 | 80,463 | |||||||||
| Deposits | 35,218 | 26,762 | 24,914 | |||||||||
| Property, plant and equipment | 34,282 | 34,962 | 34,256 | |||||||||
| Investment securities | 23,746 | 19,144 | 145,875 | |||||||||
| Other taxable temporary differences | 32,512 | 20,841 | 15,849 | |||||||||
| Total deferred tax liabilities | 166,186 | 146,480 | 301,357 | |||||||||
Total deferred tax assets-net(1) | ¥ | 1,097,351 | ¥ | 1,686,251 | ¥ | 1,208,550 | ||||||
| (1) | Deferred tax assets and deferred tax liabilities were offset in the consolidated statement of financial position if the entity has a legally enforceable right to set off current tax assets against current tax liabilities, and the deferred tax assets and the deferred tax liabilities relate to income taxes levied by the same taxation authority on the same taxable entity. |
F-60
Table of Contents
| At March 31, | At April 1, | |||||||||||
| 2010 | 2009 | 2008 | ||||||||||
| (In millions) | ||||||||||||
| Deductible temporary differences | ¥ | 171,579 | ¥ | 33,546 | ¥ | 24,649 | ||||||
| Tax losses carried forward which will expire in 1 year | 361,086 | (1) | 1,827 | 3,512 | ||||||||
| 2 years | 367 | 332,457 | (1) | 2,604 | ||||||||
| 3 years | 90,131 | (1) | — | 1,857 | ||||||||
| 4 years | 183 | 52 | — | |||||||||
| 5 years | 8,142 | — | 52 | |||||||||
| 6 years | 3,105 | 4,713 | — | |||||||||
| 7 years and thereafter | 26,011 | 5,479 | 7,552 | |||||||||
| Total deductible temporary differences and tax losses carried forward | ¥ | 660,604 | ¥ | 378,074 | ¥ | 40,226 | ||||||
| (1) | The amount of unrecognized deferred tax assets for ¥361 billion, ¥90 billion and ¥332 billion of tax losses carried forward would be ¥26 billion, ¥6 billion and ¥24 billion, respectively, if recognized. The majority of these unrecognized deferred tax assets were for tax losses of enterprise taxes in Japan which were calculated using an applicable effective tax rate of 7.0%. Most of the other unrecognized deferred tax assets for temporary differences and tax losses carried forward would be calculated using an applicable tax rate of 40.7%, if recognized. |
F-61
Table of Contents
| For the fiscal year ended | ||||||||
| March 31, | ||||||||
| 2010 | 2009 | |||||||
| (In millions) | ||||||||
| Tax losses carried forward | ¥ | (252,234 | ) | ¥ | (168,608 | ) | ||
| Investment securities | (83,652 | ) | 135,939 | |||||
| Derivative financial instruments | (28,938 | ) | (10,876 | ) | ||||
| Retirement benefits | (11,304 | ) | (14,576 | ) | ||||
| Deposits | (8,456 | ) | (1,848 | ) | ||||
| Lease transactions | 4,659 | 26,188 | ||||||
| Loans and advances | (1,828 | ) | 186,458 | |||||
| Property, plant and equipment | 595 | (574 | ) | |||||
| Other temporary differences-net | (4,833 | ) | (22,693 | ) | ||||
| Deferred tax (expense) benefit | ¥ | (385,991 | ) | ¥ | 129,410 | |||
F-62
Table of Contents
| At March 31, | At April 1, | |||||||||||
| 2010 | 2009 | 2008 | ||||||||||
| (In millions) | ||||||||||||
| Present value of unfunded obligations | ¥ | (43,721 | ) | ¥ | (42,635 | ) | ¥ | (46,131 | ) | |||
| Present value of funded obligations | (953,566 | ) | (931,763 | ) | (961,131 | ) | ||||||
| Fair value of plan assets | 888,577 | 737,978 | 971,917 | |||||||||
| Net surplus (deficit) | (108,710 | ) | (236,420 | ) | (35,345 | ) | ||||||
| Unrecognized actuarial losses (gains) | 142,359 | 243,364 | — | |||||||||
| Unrecognized past service cost | (572 | ) | 131 | (61 | ) | |||||||
| Net retirement benefit assets (liabilities) | 33,077 | 7,075 | (35,406 | ) | ||||||||
| Retirement benefit liabilities included in “Other liabilities” | (58,184 | ) | (53,584 | ) | (58,101 | ) | ||||||
| Retirement benefit assets included in “Other assets” | 91,261 | 60,659 | 22,695 | |||||||||
| Net retirement benefit assets (liabilities) | ¥ | 33,077 | ¥ | 7,075 | ¥ | (35,406 | ) | |||||
F-63
Table of Contents
| For the fiscal year ended | ||||||||
| March 31, | ||||||||
| 2010 | 2009 | |||||||
| (In millions) | ||||||||
| At the beginning of the fiscal year | ¥ | 974,398 | ¥ | 1,007,262 | ||||
| Current service cost | 23,803 | 25,562 | ||||||
| Interest cost | 20,508 | 18,605 | ||||||
| Actuarial losses (gains) | 7,174 | (21,734 | ) | |||||
| Benefits paid | (33,972 | ) | (31,717 | ) | ||||
| Lump-sum payments | (18,043 | ) | (18,069 | ) | ||||
| Past service cost | (786 | ) | 121 | |||||
| Acquisition and disposal of subsidiaries | 24,153 | (5,558 | ) | |||||
| Others | 52 | (74 | ) | |||||
| At the end of the fiscal year | ¥ | 997,287 | ¥ | 974,398 | ||||
| For the fiscal year ended | ||||||||
| March 31, | ||||||||
| 2010 | 2009 | |||||||
| (In millions) | ||||||||
| At the beginning of the fiscal year | ¥ | 737,978 | ¥ | 971,917 | ||||
| Expected return on plan assets | 31,366 | 44,965 | ||||||
| Actuarial gains (losses) | 95,762 | (265,098 | ) | |||||
| Contributions by employer | 39,055 | 17,870 | ||||||
| Benefits paid | (33,972 | ) | (31,717 | ) | ||||
| Acquisition and disposal of subsidiaries | 18,357 | (2 | ) | |||||
| Others | 31 | 43 | ||||||
| At the end of the fiscal year | ¥ | 888,577 | ¥ | 737,978 | ||||
| For the fiscal year ended | ||||||||
| March 31, | ||||||||
| 2010 | 2009 | |||||||
| (In millions) | ||||||||
| Current service cost | ¥ | 23,803 | ¥ | 25,562 | ||||
| Interest cost | 20,508 | 18,605 | ||||||
| Expected return on plan assets | (31,366 | ) | (44,965 | ) | ||||
| Amortization of actuarial losses (gains) | 12,417 | — | ||||||
| Amortization of past service cost | (83 | ) | (71 | ) | ||||
| Total | ¥ | 25,279 | ¥ | (869 | ) | |||
F-64
Table of Contents
| At March 31, | At April 1, | |||||||||||
| 2010 | 2009 | 2008 | ||||||||||
| (% of total fair value of plan assets) | ||||||||||||
| Plan assets retained in the Pension Funds | ||||||||||||
| Equity instruments | 25.8 | % | 20.8 | % | 29.1 | % | ||||||
| Debt instruments | 29.0 | % | 35.2 | % | 23.9 | % | ||||||
| General account of life insurance companies | 2.0 | % | 2.0 | % | 1.6 | % | ||||||
| Other short-term assets | 6.9 | % | 7.5 | % | 6.6 | % | ||||||
| Plan assets retained in the retirement benefit trusts | ||||||||||||
| Japanese equity instruments | 31.0 | % | 28.5 | % | 34.8 | % | ||||||
| Other short-term assets | 5.3 | % | 6.0 | % | 4.0 | % | ||||||
| Total | 100.0 | % | 100.0 | % | 100.0 | % | ||||||
| At March 31, | At April 1, | |||||||||||
| 2010 | 2009 | 2008 | ||||||||||
| Discount rates | 2.1 | % | 2.0 | % | 1.8 | % | ||||||
| Expected rates of return on plan assets | 4.2 | % | 4.6 | % | — | |||||||
| Expected rates of salary (benefit) increases | 6.0 | % | 5.8 | % | 5.7 | % | ||||||
F-65
Table of Contents
| At March 31, | ||||||||
| 2010 | 2009 | |||||||
| (In millions) | ||||||||
| Present value of defined benefit obligations | ¥ | (997,287 | ) | ¥ | (974,398 | ) | ||
| Fair value of plan assets | 888,577 | 737,978 | ||||||
| Net surplus (deficit) | ¥ | (108,710 | ) | ¥ | (236,420 | ) | ||
| Experience gains (losses) on defined benefit obligations | ¥ | (8,524 | ) | ¥ | (3,125 | ) | ||
| Experience gains (losses) on plan assets | 95,762 | (265,098 | ) | |||||
| For the fiscal year ended March 31, | ||||||||||||||||
| 2010 | 2009 | |||||||||||||||
| Outstanding | In treasury | Outstanding | In treasury | |||||||||||||
| At the beginning of the fiscal year | 789,080,477 | 20,049,818 | 773,365,377 | 17,600,841 | ||||||||||||
| Issuance of common stock | 588,631,300 | — | — | — | ||||||||||||
| Conversion of Type 4 preferred stock | 36,343,848 | — | 15,715,100 | — | ||||||||||||
| Net change | — | (2,979,478 | ) | — | 2,448,977 | |||||||||||
| At the end of the fiscal year | 1,414,055,625 | 17,070,340 | 789,080,477 | 20,049,818 | ||||||||||||
F-66
Table of Contents
| Number of shares | ||||||||||||||||
| Liquidation value | ||||||||||||||||
| Aggregate amount | Authorized | Issued | per share | |||||||||||||
| At March 31, 2010: | (In millions) | (In yen) | ||||||||||||||
| Class of stock | ||||||||||||||||
| Type 4 preferred stock | ¥ | — | 50,100 | — | ¥ | — | ||||||||||
| Type 5 preferred stock | — | 167,000 | — | — | ||||||||||||
| Type 6 preferred stock | 210,003 | 70,001 | 70,001 | 3,000,000 | ||||||||||||
| Type 7 preferred stock | — | 167,000 | — | — | ||||||||||||
| Type 8 preferred stock | — | 115,000 | — | — | ||||||||||||
| Type 9 preferred stock | — | 115,000 | — | — | ||||||||||||
| Number of shares | ||||||||||||||||
| Liquidation value | ||||||||||||||||
| Aggregate amount | Authorized | Issued | per share | |||||||||||||
| At March 31, 2009: | (In millions) | (In yen) | ||||||||||||||
| Class of stock | ||||||||||||||||
| Type 4 preferred stock | ¥ | 100,200 | 50,100 | 33,400 | ¥ | 3,000,000 | ||||||||||
| Type 5 preferred stock | — | 167,000 | — | — | ||||||||||||
| Type 6 preferred stock | 210,003 | 70,001 | 70,001 | 3,000,000 | ||||||||||||
| Type 7 preferred stock | — | 167,000 | — | — | ||||||||||||
| Type 8 preferred stock | — | 115,000 | — | — | ||||||||||||
| Type 9 preferred stock | — | 115,000 | — | — | ||||||||||||
| Number of shares | ||||||||||||||||
| Liquidation value | ||||||||||||||||
| Aggregate amount | Authorized | Issued | per share | |||||||||||||
| At April 1, 2008: | (In millions) | (In yen) | ||||||||||||||
| Class of stock | ||||||||||||||||
| Type 4 preferred stock | ¥ | 150,300 | 50,100 | 50,100 | ¥ | 3,000,000 | ||||||||||
| Type 5 preferred stock | — | 167,000 | — | — | ||||||||||||
| Type 6 preferred stock | 210,003 | 70,001 | 70,001 | 3,000,000 | ||||||||||||
| Type 7 preferred stock | — | 167,000 | — | — | ||||||||||||
| Type 8 preferred stock | — | 115,000 | — | — | ||||||||||||
| Type 9 preferred stock | — | 115,000 | — | — | ||||||||||||
F-67
Table of Contents
| Type 4 preferred stock | Type 6 preferred stock | |||||||||||||||
| Aggregate amount | Number of shares | Aggregate amount | Number of shares | |||||||||||||
| (In millions) | (In millions) | |||||||||||||||
| Balance at April 1, 2008 | ¥ | 150,300 | 50,100 | ¥ | 210,003 | 70,001 | ||||||||||
| Conversion to common stock | (50,100 | ) | (16,700 | ) | — | — | ||||||||||
| Balance at March 31, 2009 | 100,200 | 33,400 | 210,003 | 70,001 | ||||||||||||
| Conversion to common stock | (100,200 | ) | (33,400 | ) | — | — | ||||||||||
| Balance at March 31, 2010 | ¥ | — | — | ¥ | 210,003 | 70,001 | ||||||||||
F-68
Table of Contents
F-69
Table of Contents
| For the fiscal year ended | ||||||||
| March 31, | ||||||||
| 2010 | 2009 | |||||||
| (In millions) | ||||||||
| At the beginning of the fiscal year | ¥ | 349,213 | ¥ | 840,448 | ||||
| Gains (losses) arising during the fiscal year, before tax | 616,762 | (1,134,743 | ) | |||||
| Income tax (expenses) benefits for changes arising during the fiscal year | (251,308 | ) | 459,570 | |||||
| Reclassification adjustments for (gains) losses included in net profit, before tax | (77,339 | ) | 305,299 | |||||
| Income tax expenses (benefits) for reclassification adjustments | 31,362 | (123,563 | ) | |||||
| Amount attributable to non-controlling interests | (9,012 | ) | 5,941 | |||||
| Share of other comprehensive income of associates and joint ventures | 4,229 | (3,739 | ) | |||||
| At the end of the fiscal year | ¥ | 663,907 | ¥ | 349,213 | ||||
F-70
Table of Contents
| For the fiscal year ended | ||||||||
| March 31, | ||||||||
| 2010 | 2009 | |||||||
| (In millions) | ||||||||
| At the beginning of the fiscal year | ¥ | (120,897 | ) | ¥ | — | |||
| Losses arising during the fiscal year, before tax | (15,009 | ) | (176,865 | ) | ||||
| Income tax benefits for losses arising during the fiscal year | 59 | 14,233 | ||||||
| Reclassification adjustments for losses included in net profit, before tax | 2 | 129 | ||||||
| Amount attributable to non-controlling interests | 21,496 | 54,127 | ||||||
| Share of other comprehensive income of associates and joint ventures | 5,731 | (12,521 | ) | |||||
| At the end of the fiscal year | ¥ | (108,618 | ) | ¥ | (120,897 | ) | ||
| At March 31, | At April 1, | |||||||||||
| 2010 | 2009 | 2008 | ||||||||||
| (In millions) | ||||||||||||
| Preferred securities issued by subsidiaries | ¥ | 1,633,330 | ¥ | 1,763,294 | ¥ | 1,217,011 | ||||||
| Others | 414,167 | 358,106 | 405,937 | |||||||||
| Non-controlling interest | ¥ | 2,047,497 | ¥ | 2,121,400 | ¥ | 1,622,948 | ||||||
F-71
Table of Contents
| At March 31, | At April 1, | |||||||||||
| 2010 | 2009 | 2008 | ||||||||||
| (In millions) | ||||||||||||
Issued by SMFG’s subsidiaries, other than SMBC: | ||||||||||||
SMFG Preferred Capital USD 1 Limited(1) (non-cumulative step-up perpetual preferred securities) | ¥ | 60,402 | ¥ | 162,080 | ¥ | 165,314 | ||||||
SMFG Preferred Capital GBP 1 Limited(1) (non-cumulative step-up perpetual preferred securities) | 10,327 | 70,260 | 100,105 | |||||||||
| SMFG Preferred Capital JPY 1 Limited (non-cumulative perpetual preferred securities) | 135,000 | 135,000 | 135,000 | |||||||||
| SMFG Preferred Capital USD 2 Limited (non-cumulative perpetual preferred securities) | 167,490 | 176,814 | — | |||||||||
| SMFG Preferred Capital USD 3 Limited (non-cumulative step-up perpetual preferred securities) | 125,618 | 132,610 | — | |||||||||
| SMFG Preferred Capital GBP 2 Limited (non-cumulative step-up perpetual preferred securities) | 35,093 | 35,130 | — | |||||||||
| SMFG Preferred Capital JPY 2 Limited | ||||||||||||
| Series A (non-cumulative step-up perpetual preferred securities) | 113,000 | 113,000 | — | |||||||||
| Series B (non-cumulative perpetual preferred securities) | 140,000 | 140,000 | — | |||||||||
| Series C (non-cumulative perpetual preferred securities) | 140,000 | 140,000 | — | |||||||||
| Series D (non-cumulative perpetual preferred securities) | 145,200 | 145,200 | — | |||||||||
| Series E (non-cumulative perpetual preferred securities) | 33,000 | 33,000 | — | |||||||||
| Series F (non-cumulative perpetual preferred securities) | 2,000 | 2,000 | — | |||||||||
| Series G (non-cumulative perpetual preferred securities) | 125,700 | 125,700 | — | |||||||||
| SMFG Preferred Capital JPY 3 Limited | ||||||||||||
| Series A (non-cumulative step-up perpetual preferred securities) | 99,000 | — | — | |||||||||
| Series B (non-cumulative perpetual preferred securities) | 164,500 | — | — | |||||||||
| Series C (non-cumulative perpetual preferred securities) | 79,500 | — | — | |||||||||
| Series D (non-cumulative perpetual preferred securities) | 45,000 | — | — | |||||||||
Issued by SMBC’s subsidiaries: | ||||||||||||
| SB Equity Securities (Cayman), Limited | ||||||||||||
| Series A-1 (non-cumulative perpetual preferred securities) | — | 315,000 | 315,000 | |||||||||
| Series A-2 (non-cumulative perpetual preferred securities) | — | 5,000 | 5,000 | |||||||||
| Series B (non-cumulative perpetual preferred securities) | — | 20,000 | 20,000 | |||||||||
| SB Treasury Company L.L.C. (non-cumulative step-up perpetual preferred securities) | — | — | 180,342 | |||||||||
| Sakura Preferred Capital (Cayman) Limited | ||||||||||||
| Initial Series (non-cumulative perpetual preferred securities) | — | — | 258,750 | |||||||||
| Series B (non-cumulative perpetual preferred securities) | — | — | 25,000 | |||||||||
Issued by a subsidiary of Kansai Urban Banking Corporation: | ||||||||||||
| KUBC Preferred Capital Cayman Limited (non-cumulative step-up perpetual preferred securities) | 12,500 | 12,500 | 12,500 | |||||||||
| Preferred securities issued by subsidiaries | ¥ | 1,633,330 | ¥ | 1,763,294 | ¥ | 1,217,011 | ||||||
| (1) | On February 9, 2010, SMFG Preferred Capital USD 1 Limited and SMFG Preferred Capital GBP 1 Limited completed tender offers for their respective preferred securities. Following the completion of the tender offers, SMFG Preferred Capital USD 1 Limited has $649.1 million of preferred securities outstanding and SMFG Preferred Capital GBP 1 Limited has £73.6 million of preferred securities outstanding, each on a liquidation preference basis. |
F-72
Table of Contents
| For the fiscal year ended March 31, | ||||||||
| 2010 | 2009 | |||||||
| (In millions) | ||||||||
Interest income from: | ||||||||
| Deposits with banks | ¥ | 14,596 | ¥ | 45,581 | ||||
| Call loans and bills bought | 7,452 | 16,201 | ||||||
| Reverse repurchase agreements and cash collateral on securities borrowed | 9,436 | 7,606 | ||||||
| Investment securities | 150,857 | 170,736 | ||||||
| Loans and advances | 1,583,706 | 1,923,924 | ||||||
| Total interest income | 1,766,047 | 2,164,048 | ||||||
Interest expense from: | ||||||||
| Deposits | 173,374 | 380,097 | ||||||
| Call money and bills sold | 6,247 | 22,671 | ||||||
| Repurchase agreements and cash collateral on securities lent | 7,546 | 67,503 | ||||||
| Borrowings | 79,304 | 102,914 | ||||||
| Debt securities in issue | 78,328 | 100,171 | ||||||
| Others | 2,011 | 2,937 | ||||||
| Total interest expense | 346,810 | 676,293 | ||||||
| Net interest income | ¥ | 1,419,237 | ¥ | 1,487,755 | ||||
F-73
Table of Contents
| For the fiscal year ended March 31, | ||||||||
| 2010 | 2009 | |||||||
| (In millions) | ||||||||
Fee and commission income from: | ||||||||
| Loans | ¥ | 81,174 | ¥ | 75,951 | ||||
| Credit card business | 143,987 | 142,499 | ||||||
| Guarantees | 11,823 | 14,355 | ||||||
| Securities-related business | 43,164 | 17,232 | ||||||
| Deposits | 15,819 | 15,338 | ||||||
| Remittances and transfers | 124,917 | 131,103 | ||||||
| Safe deposits | 6,685 | 6,915 | ||||||
| Trust fees | 1,779 | 2,123 | ||||||
| Investment trusts | 96,258 | 37,374 | ||||||
| Agency | 14,763 | 14,721 | ||||||
| Others | 110,068 | 112,992 | ||||||
| Total fee and commission income | 650,437 | 570,603 | ||||||
Fee and commission expense from: | ||||||||
| Remittances and transfers | 31,086 | 30,418 | ||||||
| Guarantees | 16,268 | 12,280 | ||||||
| Others | 74,362 | 73,542 | ||||||
| Total fee and commission expense | 121,716 | 116,240 | ||||||
| Net fee and commission income | ¥ | 528,721 | ¥ | 454,363 | ||||
| For the fiscal year ended | ||||||||
| March 31, | ||||||||
| 2010 | 2009 | |||||||
| (In millions) | ||||||||
| Interest rate | ¥ | 106,562 | ¥ | 178,485 | ||||
| Foreign exchange | 104,929 | (4,192 | ) | |||||
| Equity | 36,969 | (48,305 | ) | |||||
| Credit | 53,203 | (44,217 | ) | |||||
Others(1) | 28,467 | 52,527 | ||||||
| Total net trading income | ¥ | 330,130 | ¥ | 134,298 | ||||
| (1) | Others includes the change in fair value of the derivative embedded in the Type 4 preferred stock. |
F-74
Table of Contents
| For the fiscal year ended | ||||||||
| March 31, | ||||||||
| 2010 | 2009 | |||||||
| (In millions) | ||||||||
| Net income (loss) from debt instruments | ¥ | 65,403 | ¥ | (5,845 | ) | |||
| Net income (loss) from equity instruments | 10,176 | (12,106 | ) | |||||
| Total net income (loss) from financial assets at fair value through profit or loss | ¥ | 75,579 | ¥ | (17,951 | ) | |||
| For the fiscal year ended | ||||||||
| March 31, | ||||||||
| 2010 | 2009 | |||||||
| (In millions) | ||||||||
| Net gain from disposal of debt instruments | ¥ | 61,541 | ¥ | 89,956 | ||||
| Net gain (loss) from disposal of equity instruments | 58,627 | (4,112 | ) | |||||
| Dividend income | 58,384 | 73,667 | ||||||
| Total net investment income | ¥ | 178,552 | ¥ | 159,511 | ||||
| For the fiscal year ended | ||||||||
| March 31, | ||||||||
| 2010 | 2009 | |||||||
| (In millions) | ||||||||
| Income from operating leases | ¥ | 56,121 | ¥ | 46,467 | ||||
| Gains on disposal of assets leased | 10,344 | 5,358 | ||||||
| Income related to IT solution services | 44,319 | 53,481 | ||||||
| Gains on disposal of property, plant and equipment and other intangible assets | 17,179 | 1,314 | ||||||
| Reversal of impairment losses of investments in associates and joint ventures | 19,832 | — | ||||||
| Others | 84,539 | 86,499 | ||||||
| Total other income | ¥ | 232,334 | ¥ | 193,119 | ||||
F-75
Table of Contents
| For the fiscal year ended | ||||||||
| March 31, | ||||||||
| 2010 | 2009 | |||||||
| (In millions) | ||||||||
Loans and advances(1) | ¥ | 215,886 | ¥ | 849,495 | ||||
| Available-for-sale financial assets | 42,755 | 391,215 | ||||||
| Total impairment charges on financial assets | ¥ | 258,641 | ¥ | 1,240,710 | ||||
| (1) | Cross-reference to Provision (credit) for loan losses in Note 10 “Loans and Advances”. |
| For the fiscal year ended | ||||||||
| March 31, | ||||||||
| 2010 | 2009 | |||||||
| (In millions) | ||||||||
| Personnel expenses | ¥ | 511,075 | ¥ | 438,266 | ||||
| Depreciation and amortization | 107,054 | 83,260 | ||||||
| Rent and lease expenses | 77,715 | 67,839 | ||||||
| Building and maintenance expenses | 9,176 | 10,781 | ||||||
| Supplies expenses | 14,797 | 17,237 | ||||||
| Communication expenses | 23,939 | 20,748 | ||||||
| Publicity and advertising expenses | 35,315 | 34,744 | ||||||
| Taxes and dues | 51,020 | 52,327 | ||||||
| Outsourcing expenses | 68,715 | 65,135 | ||||||
| Premiums for deposit insurance | 53,799 | 53,449 | ||||||
| Office equipment expenses | 22,537 | 23,536 | ||||||
| Others | 121,815 | 125,165 | ||||||
| Total general and administrative expenses | ¥ | 1,096,957 | ¥ | 992,487 | ||||
F-76
Table of Contents
| For the fiscal year ended | ||||||||
| March 31, | ||||||||
| 2010 | 2009 | |||||||
| (In millions) | ||||||||
| Cost of operating leases | ¥ | 30,487 | ¥ | 26,608 | ||||
| Losses on disposal of assets leased | 6,948 | 3,423 | ||||||
| Cost related to IT solution services | 95,342 | 107,360 | ||||||
| Losses on disposal of property, plant and equipment and other intangible assets | 4,497 | 11,818 | ||||||
| Impairment losses of property, plant and equipment | 9,899 | 6,560 | ||||||
| Impairment losses of intangible assets | 6,184 | 10,890 | ||||||
| Losses on sale of investments in subsidiaries and associates | 9,412 | 12 | ||||||
| Impairment losses of investments in associates and joint ventures | 18,134 | 31,508 | ||||||
| Others | 55,857 | 63,591 | ||||||
| Total other expenses | ¥ | 236,760 | ¥ | 261,770 | ||||
| For the fiscal year ended | ||||||||
| March 31, | ||||||||
| 2010 | 2009 | |||||||
| (In millions) | ||||||||
Current tax: | ||||||||
| Charge for the fiscal year | ¥ | 102,050 | ¥ | 73,244 | ||||
Deferred tax: | ||||||||
| Origination and reversal of temporary differences | 345,809 | (152,141 | ) | |||||
| Change in the write-down of deferred tax assets on the current year income tax expense | 40,182 | 22,731 | ||||||
| Total deferred tax expense (benefit) | 385,991 | (129,410 | ) | |||||
| Total income tax expense (benefit) | ¥ | 488,041 | ¥ | (56,166 | ) | |||
F-77
Table of Contents
| For the fiscal year ended | ||||||||
| March 31, | ||||||||
| 2010 | 2009 | |||||||
| (In millions, except percentages) | ||||||||
| Profit (loss) before tax | ¥ | 1,134,734 | ¥ | (138,190 | ) | |||
| Income tax expense (benefit) | 488,041 | (56,166 | ) | |||||
| Effective income tax rate | 43.0% | 40.6% | ||||||
| Statutory tax rate in Japan | 40.7% | 40.7% | ||||||
| Effect of the change in the write-down of deferred tax assets on the current year income tax expense | 3.5% | (16.5% | ) | |||||
| Tax impact of share of post tax losses in associates | 1.1% | (16.8% | ) | |||||
| Income or loss from derivative and liability component of Type 4 preferred stock which were not taxable or deductible | (0.7% | ) | 14.1% | |||||
Tax benefit arising on SMFG stock as a result of an intra-group transfer between SMFG and SMBC(1) | — | 18.9% | ||||||
| Others-net | (1.6% | ) | 0.2% | |||||
| Effective income tax rate | 43.0% | 40.6% | ||||||
| (1) | Treasury stock held by SMFG was transferred to SMBC as part of an intra-group restructuring of the credit card business in December 2008. At the consolidated level, this transfer does not effect the Group’s financial statements however it does effect the tax status of this treasury stock because there will be a tax effect on disposal of the stock by SMBC whereas there would have been no tax effect of SMFG disposing of the stock. Consequently this tax effect has been accounted for and the SMFG Group recognized a deferred tax asset through the consolidated income statement as it is considered probable that the deductible temporary difference will reverse in the near future through the sale of these treasury stocks. |
F-78
Table of Contents
| For the fiscal year ended | ||||||||
| March 31, | ||||||||
| 2010 | 2009 | |||||||
| (In millions, except number of shares and per share data) | ||||||||
| Basic: | ||||||||
| Profit (loss) attributable to shareholders of SMFG | ¥ | 528,692 | ¥ | (154,954 | ) | |||
| Dividend payable on preferred stocks classified as equity | 8,450 | 10,704 | ||||||
| Profit (loss) attributable to the common shareholders of SMFG | 520,242 | (165,658 | ) | |||||
| Weighted average number of common stocks in issue (in thousands of shares) | 1,017,066 | 772,349 | ||||||
| Basic earnings per share | 511.51 | (214.49 | ) | |||||
| For the fiscal year ended | ||||||||
| March 31, | ||||||||
| 2010 | 2009 | |||||||
| (In millions, except number of shares and per share data) | ||||||||
| Diluted: | ||||||||
| Profit (loss) attributable to the common shareholders of SMFG | ¥ | 520,242 | ¥ | (165,658 | ) | |||
| Dividend payable on preferred stocks classified as equity | 2,255 | 4,509 | ||||||
| Net profit on a liability component of Type 4 preferred stock | (20,165 | ) | (47,860 | ) | ||||
| Net profit (loss) used to determine diluted earnings per share | 502,332 | (209,009 | ) | |||||
| Weighted average number of common stocks in issue (in thousands of shares) | 1,017,066 | 772,349 | ||||||
| Adjustments for preferred stock | 26,005 | 32,722 | ||||||
| Weighted average number of common stocks for diluted earnings per share (in thousands of shares) | 1,043,071 | 805,071 | ||||||
| Diluted earnings per share | 481.59 | (259.62 | ) | |||||
F-79
Table of Contents
| At March 31, | ||||||||||||||||
| 2010 | 2009 | |||||||||||||||
| Carrying amount | Associated | Carrying amount | Associated | |||||||||||||
| of assets | liabilities | of assets | liabilities | |||||||||||||
| (In millions) | ||||||||||||||||
Nature of transaction: | ||||||||||||||||
| Repurchase agreements and securities lending transactions | ¥ | 4,791,441 | ¥ | 4,786,242 | ¥ | 7,108,713 | ¥ | 7,115,862 | ||||||||
| Loans and advances | 114,530 | 82,139 | 157,042 | 124,651 | ||||||||||||
| Total | ¥ | 4,905,971 | ¥ | 4,868,381 | ¥ | 7,265,755 | ¥ | 7,240,513 | ||||||||
| At March 31, | ||||||||
| 2010 | 2009 | |||||||
| (In millions) | ||||||||
| Cash and deposits with banks | ¥ | 26,508 | ¥ | 20,897 | ||||
| Call loans and bills bought | 367,036 | 597,618 | ||||||
| Trading assets | 2,451,395 | 667,314 | ||||||
| Financial assets at fair value through profit or loss | 1,499,159 | 1,513,872 | ||||||
| Held-to-maturity investments | 3,144,287 | 2,013,741 | ||||||
| Available-for-sale financial assets | 14,073,392 | 15,493,842 | ||||||
| Loans and advances | 2,946,238 | 3,526,159 | ||||||
| Property, plant and equipment | 16,166 | 11,154 | ||||||
| Other assets | 194,868 | 92,374 | ||||||
| Total | ¥ | 24,719,049 | ¥ | 23,936,971 | ||||
F-80
Table of Contents
| For the fiscal year ended | ||||||||
| March 31, | ||||||||
| 2010 | 2009 | |||||||
| (In millions) | ||||||||
| At the beginning of the fiscal year | ¥ | 9,042 | ¥ | 11,538 | ||||
| Released to profit or loss during the fiscal year | (2,496 | ) | (2,496 | ) | ||||
| At the end of the fiscal year | ¥ | 6,546 | ¥ | 9,042 | ||||
| For the fiscal year ended March 31, | ||||||||||||||||
| 2010 | 2009 | |||||||||||||||
| Number of options | Exercise price(1) | Number of options | Exercise price | |||||||||||||
| Outstanding at the beginning of the fiscal year | 108,100 | ¥ | 6,698 | 108,100 | ¥ | 6,698 | ||||||||||
| Outstanding at the end of the fiscal year | 108,100 | 6,649 | 108,100 | 6,698 | ||||||||||||
| Exercisable at the end of the fiscal year | 108,100 | 6,649 | 108,100 | 6,698 | ||||||||||||
| (1) | Exercise price was adjusted by the issuance of common stock during the fiscal year ended in March 31, 2010. |
F-81
Table of Contents
| For the fiscal year ended March 31, | ||||||||||||||||
| Dividend per share | Aggregate amount | |||||||||||||||
| 2010 | 2009 | 2010 | 2009 | |||||||||||||
| (In yen) | (In millions) | |||||||||||||||
| Common stock | ¥ | 65 | ¥ | 140 | ¥ | 60,471 | ¥ | 107,003 | ||||||||
1st to 12th series Type 4 preferred stock | 135,000 | 135,000 | 4,509 | 5,636 | ||||||||||||
1st series Type 6 preferred stock | 88,500 | 88,500 | 6,195 | 6,195 | ||||||||||||
| Dividend per | Aggregate | |||||||
| share | amount | |||||||
| (In yen) | (In millions) | |||||||
| Common stock | ¥ | 55 | ¥ | 76,834 | ||||
1st series Type 6 preferred stock | 44,250 | 3,098 | ||||||
F-82
Table of Contents
| At March 31, | ||||||||
| 2010 | 2009 | |||||||
| (In millions) | ||||||||
| Loan commitments | ¥ | 38,824,755 | ¥ | 36,638,141 | ||||
| Financial guarantees and other credit related contingent liabilities | 3,625,323 | 3,485,849 | ||||||
| Total | ¥ | 42,450,078 | ¥ | 40,123,990 | ||||
F-83
Table of Contents
| At March 31, 2010 | ||||||||||||||||||||||||
| Financial assets | ||||||||||||||||||||||||
| and liabilities at | Financial | |||||||||||||||||||||||
| fair value | liabilities | |||||||||||||||||||||||
| through profit or | Held-to-maturity | Loans and | Available-for-sale | measured at | ||||||||||||||||||||
| loss | investments | receivables | financial assets | amortized cost | Total | |||||||||||||||||||
| (In millions) | ||||||||||||||||||||||||
Financial assets: | ||||||||||||||||||||||||
| Cash and deposits with banks | ¥ | — | ¥ | — | ¥ | 6,239,398 | ¥ | — | ¥ | — | ¥ | 6,239,398 | ||||||||||||
| Call loans and bills bought | — | — | 1,127,035 | — | — | 1,127,035 | ||||||||||||||||||
| Reverse repurchase agreements and cash collateral on securities borrowed | — | — | 5,697,669 | — | — | 5,697,669 | ||||||||||||||||||
| Trading assets | 3,258,779 | — | — | — | — | 3,258,779 | ||||||||||||||||||
| Derivative financial instruments | 5,061,542 | — | — | — | — | 5,061,542 | ||||||||||||||||||
| Financial assets at fair value through profit or loss | 2,092,383 | — | — | — | — | 2,092,383 | ||||||||||||||||||
| Investment securities | — | 3,272,012 | — | 19,880,176 | — | 23,152,188 | ||||||||||||||||||
Loans and advances(1) | 8,873 | — | 71,625,255 | — | — | 71,634,128 | ||||||||||||||||||
Other financial assets(2) | — | — | 1,232,336 | — | — | 1,232,336 | ||||||||||||||||||
| Total | ¥ | 10,421,577 | ¥ | 3,272,012 | ¥ | 85,921,693 | ¥ | 19,880,176 | ¥ | — | ¥ | 119,495,458 | ||||||||||||
Financial liabilities: | ||||||||||||||||||||||||
Deposits(1) | ¥ | (5,888 | ) | ¥ | — | ¥ | — | ¥ | — | ¥ | 85,703,861 | ¥ | 85,697,973 | |||||||||||
| Call money and bills sold | — | — | — | — | 2,119,558 | 2,119,558 | ||||||||||||||||||
| Repurchase agreements and cash collateral on securities lent | — | — | — | — | 5,437,449 | 5,437,449 | ||||||||||||||||||
| Trading liabilities | 1,592,625 | — | — | — | — | 1,592,625 | ||||||||||||||||||
| Derivative financial instruments | 4,756,695 | — | — | — | — | 4,756,695 | ||||||||||||||||||
Borrowings(1) | 944 | — | — | — | 7,320,540 | 7,321,484 | ||||||||||||||||||
Debt securities in issue(1) | 3,571 | — | — | — | 5,319,585 | 5,323,156 | ||||||||||||||||||
Other financial liabilities(2) | — | — | — | — | 2,688,994 | 2,688,994 | ||||||||||||||||||
| Total | ¥ | 6,347,947 | ¥ | — | ¥ | — | ¥ | — | ¥ | 108,589,987 | ¥ | 114,937,934 | ||||||||||||
F-84
Table of Contents
| At March 31, 2009 | ||||||||||||||||||||||||
| Financial assets | ||||||||||||||||||||||||
| and liabilities at | Financial | |||||||||||||||||||||||
| fair value | liabilities | |||||||||||||||||||||||
| through profit or | Held-to-maturity | Loans and | Available-for-sale | measured at | ||||||||||||||||||||
| loss | investments | receivables | financial assets | amortized cost | Total | |||||||||||||||||||
| (In millions) | ||||||||||||||||||||||||
Financial assets: | ||||||||||||||||||||||||
| Cash and deposits with banks | ¥ | — | ¥ | — | ¥ | 5,044,744 | ¥ | — | ¥ | — | ¥ | 5,044,744 | ||||||||||||
| Call loans and bills bought | — | — | 973,772 | — | — | 973,772 | ||||||||||||||||||
| Reverse repurchase agreements and cash collateral on securities borrowed | — | — | 2,009,141 | — | — | 2,009,141 | ||||||||||||||||||
| Trading assets | 1,070,386 | — | — | — | — | 1,070,386 | ||||||||||||||||||
| Derivative financial instruments | 6,062,870 | — | — | — | — | 6,062,870 | ||||||||||||||||||
| Financial assets at fair value through profit or loss | 2,063,790 | — | — | — | — | 2,063,790 | ||||||||||||||||||
| Investment securities | — | 2,071,708 | — | 20,857,821 | — | 22,929,529 | ||||||||||||||||||
Loans and advances(1) | 10,342 | — | 74,658,952 | — | — | 74,669,294 | ||||||||||||||||||
Other financial assets(2) | — | — | 712,119 | — | — | 712,119 | ||||||||||||||||||
| Total | ¥ | 9,207,388 | ¥ | 2,071,708 | ¥ | 83,398,728 | ¥ | 20,857,821 | ¥ | — | ¥ | 115,535,645 | ||||||||||||
Financial liabilities: | ||||||||||||||||||||||||
Deposits(1) | ¥ | (11,318 | ) | ¥ | — | ¥ | — | ¥ | — | ¥ | 83,242,552 | ¥ | 83,231,234 | |||||||||||
| Call money and bills sold | — | — | — | — | 2,750,337 | 2,750,337 | ||||||||||||||||||
| Repurchase agreements and cash collateral on securities lent | — | — | — | — | 8,372,369 | 8,372,369 | ||||||||||||||||||
| Trading liabilities | 14,280 | — | — | — | — | 14,280 | ||||||||||||||||||
| Derivative financial instruments | 5,743,542 | — | — | — | — | 5,743,542 | ||||||||||||||||||
Borrowings(1) | (85 | ) | — | — | — | 6,423,088 | 6,423,003 | |||||||||||||||||
Debt securities in issue(1) | (4,568 | ) | — | — | — | 5,282,050 | 5,277,482 | |||||||||||||||||
Other financial liabilities(2) | 101,821 | — | — | — | 2,048,891 | 2,150,712 | ||||||||||||||||||
| Total | ¥ | 5,843,672 | ¥ | — | ¥ | — | ¥ | — | ¥ | 108,119,287 | ¥ | 113,962,959 | ||||||||||||
F-85
Table of Contents
| At April 1, 2008 | ||||||||||||||||||||||||
| Financial assets | ||||||||||||||||||||||||
| and liabilities at | Financial | |||||||||||||||||||||||
| fair value | liabilities | |||||||||||||||||||||||
| through profit or | Held-to-maturity | Loans and | Available-for-sale | measured at | ||||||||||||||||||||
| loss | investments | receivables | financial assets | amortized cost | Total | |||||||||||||||||||
| (In millions) | ||||||||||||||||||||||||
Financial assets: | ||||||||||||||||||||||||
| Cash and deposits with banks | ¥ | — | ¥ | — | ¥ | 4,948,469 | ¥ | — | ¥ | — | ¥ | 4,948,469 | ||||||||||||
| Call loans and bills bought | — | — | 735,139 | — | — | 735,139 | ||||||||||||||||||
| Reverse repurchase agreements and cash collateral on securities borrowed | — | — | 2,478,762 | — | — | 2,478,762 | ||||||||||||||||||
| Trading assets | 1,534,380 | — | — | — | — | 1,534,380 | ||||||||||||||||||
| Derivative financial instruments | 4,774,071 | — | — | — | — | 4,774,071 | ||||||||||||||||||
| Financial assets at fair value through profit or loss | 2,086,612 | — | — | — | — | 2,086,612 | ||||||||||||||||||
| Investment securities | — | 1,110,849 | — | 16,881,635 | — | 17,992,484 | ||||||||||||||||||
Loans and advances(1) | 7,738 | — | 71,976,542 | — | — | 71,984,280 | ||||||||||||||||||
Other financial assets(2) | — | — | 828,645 | — | — | 828,645 | ||||||||||||||||||
| Total | ¥ | 8,402,801 | ¥ | 1,110,849 | ¥ | 80,967,557 | ¥ | 16,881,635 | ¥ | — | ¥ | 107,362,842 | ||||||||||||
Financial liabilities: | ||||||||||||||||||||||||
Deposits(1) | ¥ | (4,361 | ) | ¥ | — | ¥ | — | ¥ | — | ¥ | 75,893,319 | ¥ | 75,888,958 | |||||||||||
| Call money and bills sold | — | — | — | — | 2,761,530 | 2,761,530 | ||||||||||||||||||
| Repurchase agreements and cash collateral on securities lent | — | — | — | — | 7,583,374 | 7,583,374 | ||||||||||||||||||
| Trading liabilities | 62,825 | — | — | — | — | 62,825 | ||||||||||||||||||
| Derivative financial instruments | 4,486,819 | — | — | — | — | 4,486,819 | ||||||||||||||||||
Borrowings(1) | 58 | — | — | — | 6,122,471 | 6,122,529 | ||||||||||||||||||
Debt securities in issue(1) | 122 | — | — | — | 5,477,656 | 5,477,778 | ||||||||||||||||||
Other financial liabilities(2) | 283,439 | — | — | — | 2,171,559 | 2,454,998 | ||||||||||||||||||
| Total | ¥ | 4,828,902 | ¥ | — | ¥ | — | ¥ | — | ¥ | 100,009,909 | ¥ | 104,838,811 | ||||||||||||
| (1) | Embedded derivatives which are separately accounted for but presented together with the host contract in the consolidated statement of financial position are disclosed in this table within the category of “Financial assets and liabilities at fair value through profit or loss”. Although the separated embedded derivatives may have a positive or a negative fair value, they have been presented in this table as assets or liabilities to be consistent with the line of the host contract. | |
| (2) | Other financial assets and liabilities comprise of those included in other assets and liabilities, which meet the definition of a financial asset and liability. |
F-86
Table of Contents
| At March 31, | |||||||||||||||||||||
| 2010 | 2009 | ||||||||||||||||||||
| Carrying | Carrying | ||||||||||||||||||||
| Notes | amount | Fair value | amount | Fair value | |||||||||||||||||
| (In millions) | |||||||||||||||||||||
Financial assets: | |||||||||||||||||||||
| Cash and deposits with banks: | |||||||||||||||||||||
| Cash and non-interest bearing deposits | a | ¥ | 3,371,014 | �� | ¥ | 3,371,013 | ¥ | 3,783,486 | ¥ | 3,783,486 | |||||||||||
| Interest bearing deposits with banks | a | 2,868,384 | 2,867,479 | 1,261,258 | 1,261,157 | ||||||||||||||||
| Call loans and bills bought: | |||||||||||||||||||||
| Call loans | a | 1,084,297 | 1,084,485 | 942,470 | 942,485 | ||||||||||||||||
| Bills bought | a | 42,738 | 42,709 | 31,302 | 31,338 | ||||||||||||||||
| Reverse repurchase agreements and cash collateral on securities borrowed | a | 5,697,669 | 5,697,669 | 2,009,141 | 2,009,141 | ||||||||||||||||
| Trading assets | b | 3,258,779 | 3,258,779 | 1,070,386 | 1,070,386 | ||||||||||||||||
| Derivative financial instruments | b | 5,061,542 | 5,061,542 | 6,062,870 | 6,062,870 | ||||||||||||||||
| Financial assets at fair value through profit or loss | b | 2,092,383 | 2,092,383 | 2,063,790 | 2,063,790 | ||||||||||||||||
| Investment securities: | |||||||||||||||||||||
| Held-to-maturity investments | c | 3,272,012 | 3,330,623 | 2,071,708 | 2,098,450 | ||||||||||||||||
| Available-for-sale financial assets | b | 19,880,176 | 19,880,176 | 20,857,821 | 20,857,821 | ||||||||||||||||
| Loans and advances | a | 71,634,128 | 72,955,984 | 74,669,294 | 76,323,219 | ||||||||||||||||
| Other financial assets | a | 1,232,336 | 1,229,115 | 712,119 | 708,118 | ||||||||||||||||
Financial liabilities: | |||||||||||||||||||||
| Deposits: | |||||||||||||||||||||
| Non-interest-bearing deposits, demand deposits, and deposits at notice | d | ¥ | 48,199,074 | ¥ | 48,199,348 | ¥ | 46,855,679 | ¥ | 46,856,706 | ||||||||||||
| Other deposits | d | 37,498,899 | 37,524,758 | 36,375,555 | 36,366,083 | ||||||||||||||||
| Call money and bills sold: | |||||||||||||||||||||
| Call money | d | 2,119,558 | 2,119,557 | 2,750,337 | 2,750,345 | ||||||||||||||||
| Bills sold | — | — | — | — | |||||||||||||||||
| Repurchase agreements and cash collateral on securities lent | d | 5,437,449 | 5,437,449 | 8,372,369 | 8,372,369 | ||||||||||||||||
| Trading liabilities | b | 1,592,625 | 1,592,625 | 14,280 | 14,280 | ||||||||||||||||
| Derivative financial instruments | b | 4,756,695 | 4,756,695 | 5,743,542 | 5,743,542 | ||||||||||||||||
| Borrowings | d | 7,321,484 | 7,432,514 | 6,423,003 | 6,524,186 | ||||||||||||||||
| Debt securities in issue | d | 5,323,156 | 5,422,569 | 5,277,482 | 5,350,337 | ||||||||||||||||
| Other financial liabilities | d | 2,688,994 | 2,686,474 | 2,150,712 | 2,147,024 | ||||||||||||||||
| Notes: | ||
| a. | (i) The carrying amounts of deposits with banks without maturity and loans with no specified repayment dates represent a reasonable estimate of fair value as these financial instruments are short-term in nature. | |
| (ii) Financial assets with a remaining maturity of 6 months or less: The carrying amounts represent a reasonable estimate of fair value. | ||
| (iii) Financial assets with a remaining maturity of more than 6 months: Except for impaired loans and advances, the fair values are mostly determined using discounted cash flow models taking into account factors such as counterparties’ credit ratings, pledged collateral, market interest rates, and an overhead ratio. The fair values of impaired loans and advances are generally determined by discounting the estimated future cash flows over the time period they are expected to be recovered and may be based on the appraisal value of underlying collateral as appropriate. | ||
| Note that some of the financial assets in this category include embedded derivatives, which are separately accounted for but presented together with the host contract. | ||
| b. | The carrying amounts of financial instruments which are classified as trading assets and trading liabilities, derivative financial instruments, financial assets at fair value through profit or loss, and available-for-sale financial assets are measured at fair value. Further description and analysis of these fair values, including the detailed valuation techniques, are set out below. | |
F-87
Table of Contents
| c. | The fair values for held-to-maturity investments are determined using quoted prices in active markets. | |
| d. | (i) The carrying amounts of demand deposits and deposits without maturity represent reasonable estimates of fair value as these financial instruments are short-term in nature. | |
| (ii) Financial liabilities with a remaining maturity of 6 months or less: The carrying amounts represent a reasonable estimate of fair value. | ||
| (iii) Financial liabilities with a remaining maturity of more than 6 months: The fair values are, in principle, based on the present values of future cash flows calculated using the refinancing rate applied to the same type of instruments for similar remaining maturities. The fair values of debt securities in issue are based on the present values of future cash flows calculated using the rate derived from yields of bonds issued by SMBC and publicly-offered subordinated bonds published by securities firms. | ||
| Note that some of the financial liabilities in this category include embedded derivatives, which are separately accounted for but presented together with the host contract. |
| • | quoted prices (unadjusted) in active markets for identical assets or liabilities (Level 1); | ||
| • | inputs other than quoted prices included within Level 1 that are observable for the asset or liability , either directly (i.e., as prices) or indirectly (i.e., derived from prices) (Level 2); and | ||
| • | inputs for the asset or liability that are not based on observable market data (unobservable inputs) (Level 3). |
F-88
Table of Contents
| At March 31, 2010 | ||||||||||||||||
| Valuation | ||||||||||||||||
| Valuation | techniques - | |||||||||||||||
| Quoted market | techniques - | significant | ||||||||||||||
| price in an active | observable inputs | unobservable | ||||||||||||||
| market (Level 1) | (Level 2) | inputs (Level 3) | Total | |||||||||||||
| (In millions) | ||||||||||||||||
Assets: | ||||||||||||||||
| Trading assets | ¥ | 2,526,069 | ¥ | 655,157 | ¥ | 77,553 | ¥ | 3,258,779 | ||||||||
| Derivative financial instruments | 42,625 | 5,018,917 | — | 5,061,542 | ||||||||||||
| Financial assets at fair value through profit or loss | — | 1,832,044 | 260,339 | 2,092,383 | ||||||||||||
| Available-for-sale financial assets | 17,684,974 | 1,495,269 | 699,933 | 19,880,176 | ||||||||||||
Others(1) | — | 8,873 | — | 8,873 | ||||||||||||
Liabilities: | ||||||||||||||||
| Trading liabilities | ¥ | 1,572,812 | ¥ | 19,813 | ¥ | — | ¥ | 1,592,625 | ||||||||
| Derivative financial instruments | 38,475 | 4,710,833 | 7,387 | 4,756,695 | ||||||||||||
Others(1) | — | (1,373 | ) | — | (1,373 | ) | ||||||||||
| (1) | Embedded derivatives which are separately accounted for but presented together with the host contract in the consolidated statement of financial position are disclosed in this table within others. Although the separated embedded derivatives may have a positive or a negative fair value, they have been presented in this table as assets or liabilities to be consistent with the classification of the host contract. The embedded derivative component in the Type 4 preferred stock was categorized in level 3 and included in Others at March 31, 2009. However, the derivative was terminated upon the exercise of the Type 4 preferred stock conversion right on January 28, 2010, and there was no outstanding balance at March 31, 2010. |
F-89
Table of Contents
| Financial | ||||||||||||||||||||||||
| Derivative | assets at fair | Available-for- | ||||||||||||||||||||||
| financial | value through | sale financial | ||||||||||||||||||||||
| Trading assets | instruments | profit or loss | assets | Others | Total | |||||||||||||||||||
| (In millions) | ||||||||||||||||||||||||
| At April 1, 2009 | ¥ | 84,002 | ¥ | (57,327 | ) | ¥ | 287,538 | ¥ | 633,552 | ¥ | (101,821 | ) | ¥ | 845,944 | ||||||||||
| Total gains (losses) | 2,624 | 53,995 | 4,407 | 13,091 | 23,626 | 97,743 | ||||||||||||||||||
| In profit (loss) | 7,061 | 50,874 | 4,407 | (12,833 | ) | 23,626 | 73,135 | |||||||||||||||||
| In other comprehensive income | (4,437 | ) | 3,121 | — | 25,924 | — | 24,608 | |||||||||||||||||
| Purchases | 14,504 | — | 13,423 | 104,749 | — | 132,676 | ||||||||||||||||||
| Sales | (23,577 | ) | — | (6,366 | ) | (18,480 | ) | — | (48,423 | ) | ||||||||||||||
| Settlements | — | (4,055 | ) | (38,663 | ) | (31,855 | ) | 78,195 | 3,622 | |||||||||||||||
| Transfers out of Level 3 | — | — | — | (1,124 | ) | — | (1,124 | ) | ||||||||||||||||
| At March 31, 2010 | ¥ | 77,553 | ¥ | (7,387 | ) | ¥ | 260,339 | ¥ | 699,933 | ¥ | — | ¥ | 1,030,438 | |||||||||||
| Total gains (losses) for the period included in profit (loss) for assets and liabilities held at the end of the reporting period | ¥ | 7,061 | ¥ | 50,874 | ¥ | 6,695 | ¥ | (22,545 | ) | ¥ | — | ¥ | 42,085 | |||||||||||
| Net income | ||||||||||||||||||||
| from financial | ||||||||||||||||||||
| assets at fair | ||||||||||||||||||||
| Net trading | value through | Net investment | Impairment | |||||||||||||||||
| income | profit or loss | income (loss) | charges | Total | ||||||||||||||||
| (In millions) | ||||||||||||||||||||
| Total gains (losses) included in profit (loss) for the period | ¥ | 81,561 | ¥ | 4,407 | ¥ | 10,802 | ¥ | (23,635 | ) | ¥ | 73,135 | |||||||||
| Total gains (losses) for the period included in profit (loss) for assets and liabilities held at the end of the reporting period | 57,935 | 6,695 | (492 | ) | (22,053 | ) | 42,085 | |||||||||||||
F-90
Table of Contents
F-91
Table of Contents
F-92
Table of Contents
| At March 31, 2010 | ||||||||||||||||||||
| Total fair value measured using valuation | Effect recorded | Effect recorded | ||||||||||||||||||
| in profit or loss | directly in equity | |||||||||||||||||||
| Favorable | Unfavorable | Favorable | Unfavorable | |||||||||||||||||
| techniques | changes | changes | changes | changes | ||||||||||||||||
| (In millions) | ||||||||||||||||||||
| Trading assets | ¥ | 77,553 | ¥ | 1,305 | ¥ | (1,305 | ) | ¥ | — | ¥ | — | |||||||||
| Derivative financial instruments | (7,387 | ) | 4,298 | (4,915 | ) | — | — | |||||||||||||
| Financial assets at fair value through profit or loss | 260,339 | 32,824 | (9,223 | ) | — | — | ||||||||||||||
| Available-for-sale financial assets | 699,933 | — | — | 16,818 | (16,271 | ) | ||||||||||||||
| At March 31, 2009 | ||||||||||||||||||||
| Total fair value measured using valuation | Effect recorded | Effect recorded | ||||||||||||||||||
| in profit or loss | directly in equity | |||||||||||||||||||
| Favorable | Unfavorable | Favorable | Unfavorable | |||||||||||||||||
| techniques | changes | changes | changes | changes | ||||||||||||||||
| (In millions) | ||||||||||||||||||||
| Trading assets | ¥ | 84,002 | ¥ | 1,403 | ¥ | (1,403 | ) | ¥ | — | ¥ | — | |||||||||
| Derivative financial instruments | (57,327 | ) | 9,200 | (6,464 | ) | — | — | |||||||||||||
| Financial assets at fair value through profit or loss | 287,538 | 32,089 | (7,686 | ) | — | — | ||||||||||||||
| Available-for-sale financial assets | 633,552 | — | — | 13,778 | (13,344 | ) | ||||||||||||||
| Other financial liabilities | (101,821 | ) | 13,028 | (29,171 | ) | — | — | |||||||||||||
F-93
Table of Contents
| • | managing risk on a Group-wide basis; | ||
| • | managing risk using quantification methods; | ||
| • | ensuring consistency with business strategies; | ||
| • | setting up a system of checks and balances; | ||
| • | establishing contingency plans for emergencies and serious situations; and | ||
| • | verifying preparedness to handle reasonably conceivable risk situations. |
F-94
Table of Contents
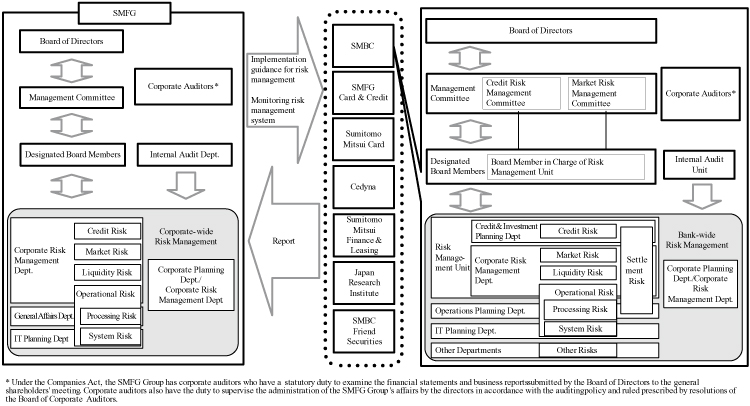
F-95
Table of Contents
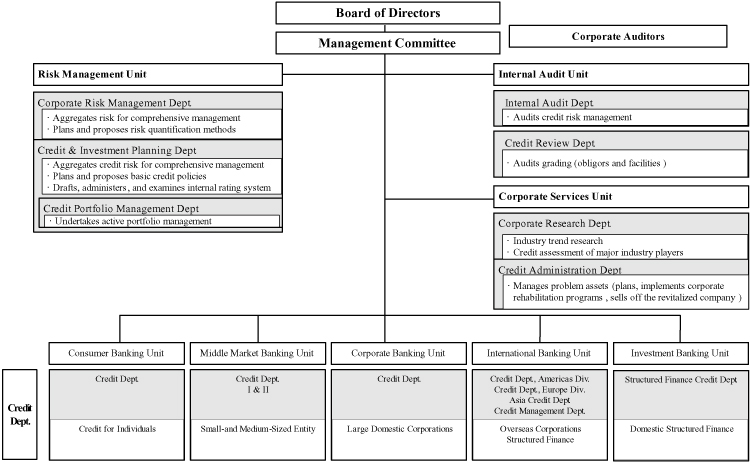
F-96
Table of Contents
F-97
Table of Contents
| Obligor Grade | Definition | Borrower Category | |||||||||
| Domestic (C&I), etc. | Overseas (C&I), etc. | ||||||||||
| J1 | G1 | Very high certainty of debt repayment | Normal Borrowers | ||||||||
| J2 | G2 | High certainty of debt repayment | |||||||||
| J3 | G3 | Satisfactory certainty of debt repayment | |||||||||
| J4 | G4 | Debt repayment is likely but this could change in cases of significant changes in economic trends or business environment | |||||||||
| J5 | G5 | No problem with debt repayment over the short term, but not satisfactory over the mid to long term and the situation could change in cases of significant changes in economic trends or business environment | |||||||||
| J6 | G6 | Currently no problem with debt repayment, but there are unstable business and financial factors that could lead to debt repayment problems | |||||||||
| J7 | G7 | Close monitoring is required due to problems in meeting loan terms and conditions, sluggish/unstable business, or financial problems | Borrowers Requiring Caution | ||||||||
| J7R | G7R | Obligors with loans that are more than three months past due or with restructured loans within the “Borrowers Requiring Caution” category | Substandard Borrowers | ||||||||
| J8 | G8 | Currently not bankrupt, but experiencing business difficulties, making insufficient progress in restructuring, and highly likely to go bankrupt | Potentially Bankrupt Borrowers | ||||||||
| J9 | G9 | Though not yet legally or formally bankrupt, has serious business difficulties and rehabilitation is unlikely; thus, effectively bankrupt | Effectively Bankrupt Borrowers | ||||||||
| J10 | G10 | Legally or formally bankrupt | Bankrupt Borrowers | ||||||||
F-98
Table of Contents
F-99
Table of Contents
| At March 31, | At April 1, | |||||||||||
| 2010 | 2009 | 2008 | ||||||||||
| (In millions) | ||||||||||||
Credit risk exposures relating to assets on the consolidated statement of financial position: | ||||||||||||
| Deposits with banks | ¥ | 5,131,150 | ¥ | 4,048,668 | ¥ | 3,778,194 | ||||||
| Call loans and bills bought | 1,127,035 | 973,772 | 735,139 | |||||||||
| Reverse repurchase agreements and cash collateral on securities borrowed | 5,697,669 | 2,009,141 | 2,478,762 | |||||||||
| Trading assets | 3,117,725 | 958,274 | 1,251,743 | |||||||||
| Derivative financial instruments | 5,061,542 | 6,062,870 | 4,774,071 | |||||||||
| Financial assets at fair value through profit or loss | 1,978,149 | 1,956,968 | 1,968,430 | |||||||||
| Investment securities | ||||||||||||
| Held-to-maturity investments | 3,272,012 | 2,071,708 | 1,110,849 | |||||||||
| Available-for-sale financial assets | 16,412,710 | 18,073,788 | 13,037,895 | |||||||||
| Loans and advances | 71,634,128 | 74,669,294 | 71,984,280 | |||||||||
| Other financial assets | 1,232,336 | 712,119 | 828,645 | |||||||||
Credit risk exposures relating to off-balance sheet items(1): | ||||||||||||
| Loan commitments | 38,824,755 | 36,638,141 | 37,652,908 | |||||||||
| Financial guarantees and other credit related contingent liabilities | 3,625,323 | 3,485,849 | 4,224,115 | |||||||||
| Total | ¥ | 157,114,534 | ¥ | 151,660,592 | ¥ | 143,825,031 | ||||||
| (1) | The off-balance sheet items represent the nominal amounts of undrawn loan commitments, financial guarantees and other credit related contingent liabilities. |
F-100
Table of Contents
| At March 31, | At April 1, | |||||||||||
| 2010 | 2009 | 2008 | ||||||||||
| (In millions) | ||||||||||||
| Domestic | ¥ | 62,333,675 | ¥ | 64,011,943 | ¥ | 61,899,616 | ||||||
| Foreign: | ||||||||||||
| Americas | 4,119,139 | 5,019,513 | 4,220,130 | |||||||||
| Europe | 2,486,017 | 2,990,388 | 2,897,496 | |||||||||
| Asia | 3,187,341 | 3,228,987 | 3,078,534 | |||||||||
| Others | 1,195,400 | 1,194,999 | 1,159,117 | |||||||||
| Total foreign | 10,987,897 | 12,433,887 | 11,355,277 | |||||||||
| Gross loans and advances | 73,321,572 | 76,445,830 | 73,254,893 | |||||||||
| Adjust: Unearned income, unamortized premiums-net and deferred loan fees-net | (153,889 | ) | (176,906 | ) | (176,387 | ) | ||||||
| Less: Allowance for loan losses | (1,533,555 | ) | (1,599,630 | ) | (1,094,226 | ) | ||||||
| Net loans and advances | ¥ | 71,634,128 | ¥ | 74,669,294 | ¥ | 71,984,280 | ||||||
F-101
Table of Contents
| At March 31, | At April 1, | |||||||||||
| 2010 | 2009 | 2008 | ||||||||||
| (In millions) | ||||||||||||
Domestic: | ||||||||||||
| Manufacturing | ¥ | 8,428,854 | ¥ | 8,836,291 | ¥ | 7,555,462 | ||||||
| Agriculture, forestry, fisheries and mining | 162,879 | 163,647 | 259,803 | |||||||||
| Construction | 1,492,690 | 1,716,567 | 1,815,201 | |||||||||
| Transportation, communications and public enterprises | 3,519,279 | 3,606,748 | 3,244,752 | |||||||||
| Wholesale and retail | 5,552,637 | 6,201,520 | 6,350,694 | |||||||||
| Finance and insurance | 3,431,882 | 3,613,653 | 3,582,845 | |||||||||
| Real estate and goods rental and leasing | 8,751,450 | 9,264,523 | 9,393,149 | |||||||||
| Services | 4,644,737 | 4,947,995 | 5,141,719 | |||||||||
| Municipalities | 1,346,611 | 1,274,196 | 1,086,548 | |||||||||
| Lease financing | 2,320,651 | 2,562,727 | 2,658,423 | |||||||||
Consumer(1) | 17,544,284 | 16,377,870 | 15,733,316 | |||||||||
| Others | 5,137,721 | 5,446,206 | 5,077,704 | |||||||||
| Total domestic | 62,333,675 | 64,011,943 | 61,899,616 | |||||||||
Foreign: | ||||||||||||
| Public sector | 147,115 | 82,598 | 115,942 | |||||||||
| Financial institutions | 2,031,812 | 1,812,218 | 1,897,715 | |||||||||
| Commerce and industry | 8,161,198 | 9,282,120 | 8,283,544 | |||||||||
| Lease financing | 205,547 | 239,728 | 227,508 | |||||||||
| Others | 442,225 | 1,017,223 | 830,568 | |||||||||
| Total foreign | 10,987,897 | 12,433,887 | 11,355,277 | |||||||||
| Gross loans and advances | 73,321,572 | 76,445,830 | 73,254,893 | |||||||||
| Adjust: Unearned income, unamortized premiums-net and deferred loan fees-net | (153,889 | ) | (176,906 | ) | (176,387 | ) | ||||||
| Less: Allowance for loan losses | (1,533,555 | ) | (1,599,630 | ) | (1,094,226 | ) | ||||||
| Net loans and advances | ¥ | 71,634,128 | ¥ | 74,669,294 | ¥ | 71,984,280 | ||||||
| (1) | The balance in Consumer mainly consists of housing loans. The housing loan balances amounted to ¥14,436,921 million, ¥13,577,902 million and ¥13,067,503 million at March 31, 2010 and 2009, and April 1, 2008, respectively. |
F-102
Table of Contents
| At March 31, | At April 1, | |||||||||||
| 2010 | 2009 | 2008 | ||||||||||
| (In millions) | ||||||||||||
| Real estate finance | ¥ | 1,835,169 | ¥ | 1,928,043 | ¥ | 1,779,734 | ||||||
| Project finance | 1,203,010 | 1,020,972 | 869,468 | |||||||||
| Other structured finance | 307,468 | 315,020 | 193,387 | |||||||||
| Total structured finance | ¥ | 3,345,647 | ¥ | 3,264,035 | ¥ | 2,842,589 | ||||||
| Consumer | ||||||||||||
| At March 31, | At April 1, | |||||||||||
| 2010 | 2009 | 2008 | ||||||||||
| (In millions) | ||||||||||||
Secured loans(1) | ¥ | 15,742,706 | ¥ | 14,901,925 | ¥ | 14,268,303 | ||||||
| Unsecured loans | 1,801,578 | 1,475,945 | 1,465,013 | |||||||||
| Total consumer | ¥ | 17,544,284 | ¥ | 16,377,870 | ¥ | 15,733,316 | ||||||
| (1) | The secured loans and advances mainly represent housing loans. The housing loan balances amounted to ¥14,436,921 million, ¥13,577,902 million, and ¥13,067,503 million at March 31, 2010 and 2009, and April 1, 2008, respectively. |
| At March 31, | At April 1, | |||||||||||
| 2010 | 2009 | 2008 | ||||||||||
| (In millions) | ||||||||||||
| Neither past due nor impaired | ¥ | 70,745,696 | ¥ | 73,919,286 | ¥ | 71,381,177 | ||||||
| Past due but not impaired | 132,725 | 184,853 | 170,072 | |||||||||
Impaired(1) | 2,443,151 | 2,341,691 | 1,703,644 | |||||||||
| Gross loans and advances | 73,321,572 | 76,445,830 | 73,254,893 | |||||||||
| Adjust: Unearned income, unamortized premiums-net and deferred loan fees-net | (153,889 | ) | (176,906 | ) | (176,387 | ) | ||||||
| Less: Allowance for loan losses | (1,533,555 | ) | (1,599,630 | ) | (1,094,226 | ) | ||||||
| Net loans and advances | ¥ | 71,634,128 | ¥ | 74,669,294 | ¥ | 71,984,280 | ||||||
| (1) | Loans and advances to borrowers who are classified in the borrower categories of substandard borrowers, potentially bankrupt borrowers, effectively bankrupt borrowers, and bankrupt borrowers described in the obligor grading system represent impaired loans and advances. |
F-103
Table of Contents
| At March 31, 2010 | ||||||||||||||||||||||||||||
| Normal | Requiring Caution | |||||||||||||||||||||||||||
| Japanese | ||||||||||||||||||||||||||||
| government | ||||||||||||||||||||||||||||
| and local | ||||||||||||||||||||||||||||
| municipal | ||||||||||||||||||||||||||||
| J 1-3 | J 4-6 | corporations | Other | J 7 | Other | Total | ||||||||||||||||||||||
| (In millions) | ||||||||||||||||||||||||||||
Domestic: | ||||||||||||||||||||||||||||
| Manufacturing | ¥ | 3,812,942 | ¥ | 2,496,869 | ¥ | — | ¥ | 1,402,655 | ¥ | 366,841 | ¥ | 134,786 | ¥ | 8,214,093 | ||||||||||||||
| Agriculture, forestry, fisheries and mining | 36,801 | 72,581 | — | 8,543 | 35,833 | 1,772 | 155,530 | |||||||||||||||||||||
| Construction | 277,398 | 420,209 | — | 501,791 | 87,157 | 69,990 | 1,356,545 | |||||||||||||||||||||
| Transportation, communications and public enterprises | 1,403,614 | 1,256,211 | 111,122 | 458,473 | 115,195 | 77,043 | 3,421,658 | |||||||||||||||||||||
| Wholesale and retail | 1,315,120 | 2,482,092 | — | 1,057,664 | 298,366 | 134,549 | 5,287,791 | |||||||||||||||||||||
| Finance and insurance | 752,917 | 316,629 | 98,291 | 1,878,601 | 302,115 | 64,184 | 3,412,737 | |||||||||||||||||||||
| Real estate and goods rental and leasing | 2,285,826 | 3,463,276 | 69,792 | 1,490,943 | 535,500 | 203,849 | 8,049,186 | |||||||||||||||||||||
| Services | 684,926 | 2,055,987 | 189,972 | 881,609 | 353,731 | 155,821 | 4,322,046 | |||||||||||||||||||||
| Municipalities | — | — | 1,213,657 | 112,523 | — | 20,431 | 1,346,611 | |||||||||||||||||||||
| Lease financing | — | — | — | 2,154,707 | — | 99,007 | 2,253,714 | |||||||||||||||||||||
Consumer(1) | — | 386 | — | 16,576,495 | 7,411 | 546,376 | 17,130,668 | |||||||||||||||||||||
| Others | 7,494 | 2,477,853 | 1,250,829 | 929,685 | 364,742 | 12,210 | 5,042,813 | |||||||||||||||||||||
| Total domestic | 10,577,038 | 15,042,093 | 2,933,663 | 27,453,689 | 2,466,891 | 1,520,018 | 59,993,392 | |||||||||||||||||||||
| G 1-3 | G 4-6 | — | Other | G 7 | Other | Total | ||||||||||||||||||||||
Foreign: | ||||||||||||||||||||||||||||
| Public sector | 53,882 | 3,538 | — | 84,156 | — | 864 | 142,440 | |||||||||||||||||||||
| Financial institutions | 1,079,729 | 83,970 | — | 740,654 | 43,273 | 48,688 | 1,996,314 | |||||||||||||||||||||
| Commerce and industry | 4,622,925 | 1,647,417 | — | 1,235,524 | 358,159 | 118,145 | 7,982,170 | |||||||||||||||||||||
| Lease financing | — | — | — | 184,537 | — | 20,977 | 205,514 | |||||||||||||||||||||
| Others | 237,076 | 41,713 | — | 117,643 | 24,735 | 4,699 | 425,866 | |||||||||||||||||||||
| Total foreign | 5,993,612 | 1,776,638 | — | 2,362,514 | 426,167 | 193,373 | 10,752,304 | |||||||||||||||||||||
| Total | ¥ | 16,570,650 | ¥ | 16,818,731 | ¥ | 2,933,663 | ¥ | 29,816,203 | ¥ | 2,893,058 | ¥ | 1,713,391 | ¥ | 70,745,696 | ||||||||||||||
| (1) | The balance in the grade category of “Other” in Consumer includes housing loans, which amounted to ¥14,152,348 million and ¥138,102 million for the borrower category of Normal and Requiring Caution, respectively. |
F-104
Table of Contents
| At March 31, 2009 | ||||||||||||||||||||||||||||
| Normal | Requiring Caution | |||||||||||||||||||||||||||
| Japanese | ||||||||||||||||||||||||||||
| government | ||||||||||||||||||||||||||||
| and local | ||||||||||||||||||||||||||||
| municipal | ||||||||||||||||||||||||||||
| J 1-3 | J 4-6 | corporations | Other | J 7 | Other | Total | ||||||||||||||||||||||
| (In millions) | ||||||||||||||||||||||||||||
Domestic: | ||||||||||||||||||||||||||||
| Manufacturing | ¥ | 4,700,621 | ¥ | 1,952,930 | ¥ | — | ¥ | 1,586,106 | ¥ | 329,943 | ¥ | 78,097 | ¥ | 8,647,697 | ||||||||||||||
| Agriculture, forestry, fisheries and mining | 70,534 | 43,083 | — | 9,317 | 33,641 | 1,334 | 157,909 | |||||||||||||||||||||
| Construction | 382,087 | 438,319 | — | 614,664 | 72,849 | 51,030 | 1,558,949 | |||||||||||||||||||||
| Transportation, communications and public enterprises | 1,855,662 | 866,750 | 109,328 | 471,288 | 130,335 | 53,113 | 3,486,476 | |||||||||||||||||||||
| Wholesale and retail | 2,158,793 | 2,200,475 | — | 1,187,122 | 291,675 | 103,749 | 5,941,814 | |||||||||||||||||||||
| Finance and insurance | 1,042,594 | 146,983 | 98,691 | 1,900,948 | 331,089 | 54,814 | 3,575,119 | |||||||||||||||||||||
| Real estate and goods rental and leasing | 2,990,136 | 2,737,713 | 124,916 | 1,976,708 | 604,702 | 171,153 | 8,605,328 | |||||||||||||||||||||
| Services | 992,410 | 2,000,986 | 203,316 | 964,000 | 340,594 | 112,996 | 4,614,302 | |||||||||||||||||||||
| Municipalities | — | — | 1,186,508 | 76,716 | — | 10,178 | 1,273,402 | |||||||||||||||||||||
| Lease financing | — | — | — | 2,398,660 | — | 109,409 | 2,508,069 | |||||||||||||||||||||
Consumer(1) | — | 933 | — | 15,631,479 | 8,282 | 381,835 | 16,022,529 | |||||||||||||||||||||
| Others | 143,496 | 2,173,095 | 1,202,569 | 1,493,793 | 296,984 | 60,258 | 5,370,195 | |||||||||||||||||||||
| Total domestic | 14,336,333 | 12,561,267 | 2,925,328 | 28,310,801 | 2,440,094 | 1,187,966 | 61,761,789 | |||||||||||||||||||||
| G 1-3 | G 4-6 | — | Other | G 7 | Other | Total | ||||||||||||||||||||||
Foreign: | ||||||||||||||||||||||||||||
| Public sector | 59,871 | 6,016 | — | 16,127 | — | 536 | 82,550 | |||||||||||||||||||||
| Financial institutions | 1,282,081 | 56,885 | — | 394,102 | 434 | 17,566 | 1,751,068 | |||||||||||||||||||||
| Commerce and industry | 6,290,745 | 1,217,937 | — | 1,063,406 | 439,660 | 65,113 | 9,076,861 | |||||||||||||||||||||
| Lease financing | — | — | — | 216,719 | — | 19,858 | 236,577 | |||||||||||||||||||||
| Others | 319,714 | 79,065 | — | 587,583 | 3,301 | 20,778 | 1,010,441 | |||||||||||||||||||||
| Total foreign | 7,952,411 | 1,359,903 | — | 2,277,937 | 443,395 | 123,851 | 12,157,497 | |||||||||||||||||||||
| Total | ¥ | 22,288,744 | ¥ | 13,921,170 | ¥ | 2,925,328 | ¥ | 30,588,738 | ¥ | 2,883,489 | ¥ | 1,311,817 | ¥ | 73,919,286 | ||||||||||||||
| (1) | The balance in the grade category of “Other” in Consumer includes housing loans, which amounted to ¥13,331,008 million and ¥105,255 million for the borrower category of Normal and Requiring Caution, respectively. |
F-105
Table of Contents
| At April 1, 2008 | ||||||||||||||||||||||||||||
| Normal | Requiring Caution | |||||||||||||||||||||||||||
| Japanese | ||||||||||||||||||||||||||||
| government | ||||||||||||||||||||||||||||
| and local | ||||||||||||||||||||||||||||
| municipal | ||||||||||||||||||||||||||||
| J 1-3 | J 4-6 | corporations | Other | J 7 | Other | Total | ||||||||||||||||||||||
| (In millions) | ||||||||||||||||||||||||||||
Domestic: | ||||||||||||||||||||||||||||
| Manufacturing | ¥ | 3,395,962 | ¥ | 2,038,314 | ¥ | — | ¥ | 1,669,076 | ¥ | 245,038 | ¥ | 63,214 | ¥ | 7,411,604 | ||||||||||||||
| Agriculture, forestry, fisheries and mining | 166,964 | 44,034 | — | 13,440 | 27,939 | 688 | 253,065 | |||||||||||||||||||||
| Construction | 341,962 | 552,434 | — | 708,005 | 60,038 | 20,732 | 1,683,171 | |||||||||||||||||||||
| Transportation, communications and public enterprises | 1,598,468 | 833,412 | 73,063 | 528,133 | 98,165 | 19,219 | 3,150,460 | |||||||||||||||||||||
| Wholesale and retail | 1,935,691 | 2,654,800 | — | 1,235,407 | 205,295 | 47,701 | 6,078,894 | |||||||||||||||||||||
| Finance and insurance | 975,287 | 264,487 | 61,425 | 1,852,971 | 394,422 | 7,916 | 3,556,508 | |||||||||||||||||||||
| Real estate and goods rental and leasing | 2,928,720 | 3,277,628 | 180,693 | 2,286,638 | 363,586 | 91,070 | 9,128,335 | |||||||||||||||||||||
| Services | 856,388 | 2,187,417 | 259,869 | 1,146,349 | 320,267 | 45,142 | 4,815,432 | |||||||||||||||||||||
| Municipalities | — | — | 1,020,507 | 60,910 | — | 5,131 | 1,086,548 | |||||||||||||||||||||
| Lease financing | — | — | — | 2,554,030 | — | 63,489 | 2,617,519 | |||||||||||||||||||||
Consumer(1) | — | 332 | — | 15,093,018 | 8,016 | 271,303 | 15,372,669 | |||||||||||||||||||||
| Others | 129,183 | 2,019,752 | 832,816 | 1,580,450 | 374,213 | 57,287 | 4,993,701 | |||||||||||||||||||||
| Total domestic | 12,328,625 | 13,872,610 | 2,428,373 | 28,728,427 | 2,096,979 | 692,892 | 60,147,906 | |||||||||||||||||||||
| G 1-3 | G 4-6 | — | Other | G 7 | Other | Total | ||||||||||||||||||||||
Foreign: | ||||||||||||||||||||||||||||
| Public sector | 43,463 | 5,733 | — | 64,951 | — | 1,747 | 115,894 | |||||||||||||||||||||
| Financial institutions | 1,178,114 | 77,370 | — | 594,846 | 3,819 | 10,455 | 1,864,604 | |||||||||||||||||||||
| Commerce and industry | 5,666,673 | 987,134 | — | 1,420,883 | 94,139 | 39,391 | 8,208,220 | |||||||||||||||||||||
| Lease financing | — | — | — | 210,878 | — | 9,937 | 220,815 | |||||||||||||||||||||
| Others | 353,776 | 35,827 | — | 420,099 | 5,189 | 8,847 | 823,738 | |||||||||||||||||||||
| Total foreign | 7,242,026 | 1,106,064 | — | 2,711,657 | 103,147 | 70,377 | 11,233,271 | |||||||||||||||||||||
| Total | ¥ | 19,570,651 | ¥ | 14,978,674 | ¥ | 2,428,373 | ¥ | 31,440,084 | ¥ | 2,200,126 | ¥ | 763,269 | ¥ | 71,381,177 | ||||||||||||||
| (1) | The balance in the grade category of “Other” in Consumer includes housing loans, which amounted to ¥12,838,152 million and ¥95,043 million for the borrower category of Normal and Requiring Caution, respectively. |
| (b) | Loans and advances past due but not impaired |
F-106
Table of Contents
| At March 31, 2010 | ||||||||||||||||
| Past due up to 1 | Past due 1 – 2 | Past due 2 – 3 | ||||||||||||||
| month | months | months | Total | |||||||||||||
| (In millions) | ||||||||||||||||
Domestic: | ||||||||||||||||
| Manufacturing | ¥ | 10,073 | ¥ | 579 | ¥ | 414 | ¥ | 11,066 | ||||||||
| Agriculture, forestry, fisheries and mining | 96 | — | — | 96 | ||||||||||||
| Construction | 3,169 | 939 | 328 | 4,436 | ||||||||||||
| Transportation, communications and public enterprises | 2,286 | 255 | 2,361 | 4,902 | ||||||||||||
| Wholesale and retail | 10,776 | 2,573 | 3,992 | 17,341 | ||||||||||||
| Finance and insurance | 436 | — | — | 436 | ||||||||||||
| Real estate and goods rental and leasing | 5,137 | 1,362 | 2,250 | 8,749 | ||||||||||||
| Services | 10,647 | 918 | 945 | 12,510 | ||||||||||||
| Municipalities | — | — | — | — | ||||||||||||
| Lease financing | 207 | — | 216 | 423 | ||||||||||||
| Consumer | 37,642 | 20,778 | 8,888 | 67,308 | ||||||||||||
| Others | 2,015 | 31 | 58 | 2,104 | ||||||||||||
| Total domestic | 82,484 | 27,435 | 19,452 | 129,371 | ||||||||||||
Foreign: | ||||||||||||||||
| Public sector | — | — | 34 | 34 | ||||||||||||
| Financial institutions | 1 | 25 | — | 26 | ||||||||||||
| Commerce and industry | 2,431 | 467 | — | 2,898 | ||||||||||||
| Others | 396 | — | — | 396 | ||||||||||||
| Total foreign | 2,828 | 492 | 34 | 3,354 | ||||||||||||
| Total | ¥ | 85,312 | ¥ | 27,927 | ¥ | 19,486 | ¥ | 132,725 | ||||||||
F-107
Table of Contents
| At March 31, 2009 | ||||||||||||||||
| Past due up to 1 | Past due 1 – 2 | Past due 2 – 3 | ||||||||||||||
| month | months | months | Total | |||||||||||||
| (In millions) | ||||||||||||||||
Domestic: | ||||||||||||||||
| Manufacturing | ¥ | 14,439 | ¥ | 1,822 | ¥ | 568 | ¥ | 16,829 | ||||||||
| Agriculture, forestry, fisheries and mining | 646 | 8 | 6 | 660 | ||||||||||||
| Construction | 3,541 | 2,242 | 1,659 | 7,442 | ||||||||||||
| Transportation, communications and public enterprises | 6,088 | 521 | 138 | 6,747 | ||||||||||||
| Wholesale and retail | 17,612 | 3,276 | 3,039 | 23,927 | ||||||||||||
| Finance and insurance | 111 | — | — | 111 | ||||||||||||
| Real estate and goods rental and leasing | 18,574 | 8,610 | 2,068 | 29,252 | ||||||||||||
| Services | 20,154 | 1,686 | 1,428 | 23,268 | ||||||||||||
| Municipalities | 794 | — | — | 794 | ||||||||||||
| Lease financing | 257 | 183 | 7 | 447 | ||||||||||||
| Consumer | 36,705 | 20,027 | 6,293 | 63,025 | ||||||||||||
| Others | 1,345 | 22 | 28 | 1,395 | ||||||||||||
| Total domestic | 120,266 | 38,397 | 15,234 | 173,897 | ||||||||||||
Foreign: | ||||||||||||||||
| Public sector | — | — | 34 | 34 | ||||||||||||
| Financial institutions | 12 | 15 | — | 27 | ||||||||||||
| Commerce and industry | 10,467 | 296 | 98 | 10,861 | ||||||||||||
| Others | 34 | — | — | 34 | ||||||||||||
| Total foreign | 10,513 | 311 | 132 | 10,956 | ||||||||||||
| Total | ¥ | 130,779 | ¥ | 38,708 | ¥ | 15,366 | ¥ | 184,853 | ||||||||
F-108
Table of Contents
| At April 1, 2008 | ||||||||||||||||
| Past due up to 1 | Past due 1 – 2 | Past due 2 – 3 | ||||||||||||||
| month | months | months | Total | |||||||||||||
| (In millions) | ||||||||||||||||
Domestic: | ||||||||||||||||
| Manufacturing | ¥ | 10,195 | ¥ | 1,505 | ¥ | 1,315 | ¥ | 13,015 | ||||||||
| Agriculture, forestry, fisheries and mining | 326 | 21 | — | 347 | ||||||||||||
| Construction | 6,445 | 1,513 | 868 | 8,826 | ||||||||||||
| Transportation, communications and public enterprises | 3,157 | 459 | 1,276 | 4,892 | ||||||||||||
| Wholesale and retail | 16,376 | 1,535 | 1,926 | 19,837 | ||||||||||||
| Finance and insurance | 6,566 | 2 | 6 | 6,574 | ||||||||||||
| Real estate and goods rental and leasing | 22,351 | 3,456 | 2,950 | 28,757 | ||||||||||||
| Services | 16,845 | 4,147 | 1,396 | 22,388 | ||||||||||||
| Municipalities | — | — | — | — | ||||||||||||
| Lease financing | 29 | 767 | — | 796 | ||||||||||||
| Consumer | 31,973 | 16,504 | 5,602 | 54,079 | ||||||||||||
| Others | 611 | 114 | 185 | 910 | ||||||||||||
| Total domestic | 114,874 | 30,023 | 15,524 | 160,421 | ||||||||||||
Foreign: | ||||||||||||||||
| Public sector | — | — | 34 | 34 | ||||||||||||
| Financial institutions | 65 | 29 | — | 94 | ||||||||||||
| Commerce and industry | 8,658 | 102 | 145 | 8,905 | ||||||||||||
| Others | 618 | — | — | 618 | ||||||||||||
| Total foreign | 9,341 | 131 | 179 | 9,651 | ||||||||||||
| Total | ¥ | 124,215 | ¥ | 30,154 | ¥ | 15,703 | ¥ | 170,072 | ||||||||
F-109
Table of Contents
| At March 31, | At April 1, | |||||||||||
| 2010 | 2009 | 2008 | ||||||||||
| (In millions) | ||||||||||||
Domestic: | ||||||||||||
| Manufacturing | ¥ | 203,695 | ¥ | 171,765 | ¥ | 130,843 | ||||||
| Agriculture, forestry, fisheries and mining | 7,253 | 5,078 | 6,391 | |||||||||
| Construction | 131,709 | 150,176 | 123,204 | |||||||||
| Transportation, communications and public enterprises | 92,719 | 113,525 | 89,400 | |||||||||
| Wholesale and retail | 247,505 | 235,779 | 251,963 | |||||||||
| Finance and insurance | 18,709 | 38,423 | 19,763 | |||||||||
| Real estate and goods rental and leasing | 693,515 | 629,943 | 236,057 | |||||||||
| Services | 310,181 | 310,425 | 303,899 | |||||||||
| Municipalities | — | — | — | |||||||||
| Lease financing | 66,514 | 54,211 | 40,108 | |||||||||
| Consumer | 346,308 | 292,316 | 306,568 | |||||||||
| Others | 92,804 | 74,616 | 83,093 | |||||||||
| Total domestic | 2,210,912 | 2,076,257 | 1,591,289 | |||||||||
Foreign: | ||||||||||||
| Public sector | 4,641 | 14 | 14 | |||||||||
| Financial institutions | 35,472 | 61,123 | 33,017 | |||||||||
| Commerce and industry | 176,130 | 194,398 | 66,419 | |||||||||
| Lease financing | 33 | 3,151 | 6,693 | |||||||||
| Others | 15,963 | 6,748 | 6,212 | |||||||||
| Total foreign | 232,239 | 265,434 | 112,355 | |||||||||
| Total impaired loans and advances before allowance for loan losses | 2,443,151 | 2,341,691 | 1,703,644 | |||||||||
| Less: Allowance for loan losses | (1,282,610 | ) | (1,204,091 | ) | (936,510 | ) | ||||||
| Net impaired loans and advances | ¥ | 1,160,541 | ¥ | 1,137,600 | ¥ | 767,134 | ||||||
| At March 31, | At April 1, | |||||||||||
| 2010 | 2009 | 2008 | ||||||||||
| (In millions) | ||||||||||||
| Individually significant impaired loans and advances | ¥ | 1,146,486 | ¥ | 1,154,208 | ¥ | 360,395 | ||||||
| Fair value of collateral held as security and other credit enhancements for the above | 489,475 | 545,720 | 79,357 | |||||||||
F-110
Table of Contents
| At March 31, | At April 1, | |||||||||||
| 2010 | 2009 | 2008 | ||||||||||
| (In millions) | ||||||||||||
| Renegotiated loans and advances | ¥ | 1,147,762 | ¥ | 615,918 | ¥ | 310,479 | ||||||
F-111
Table of Contents
| At March 31, 2010 | ||||||||||||||||||||
| Financial | ||||||||||||||||||||
| assets at fair | Held-to- | Available-for- | ||||||||||||||||||
| Trading | value through | maturity | sale financial | |||||||||||||||||
| assets | profit or loss | investments | assets | Total | ||||||||||||||||
| (In millions) | ||||||||||||||||||||
| AAA | ¥ | 2,492,140 | ¥ | 1,832,044 | ¥ | 3,091,799 | ¥ | 15,274,931 | ¥ | 22,690,914 | ||||||||||
| AA- to AA+ | 258,810 | — | 162,336 | 475,632 | 896,778 | |||||||||||||||
| A- to A+ | 301,401 | 86,053 | 15,213 | 279,224 | 681,891 | |||||||||||||||
| Lower than A- | 54,937 | — | 999 | 79,787 | 135,723 | |||||||||||||||
| Unrated | 10,437 | 60,052 | 1,665 | 303,136 | 375,290 | |||||||||||||||
| Total | ¥ | 3,117,725 | ¥ | 1,978,149 | ¥ | 3,272,012 | ¥ | 16,412,710 | ¥ | 24,780,596 | ||||||||||
| At March 31, 2009 | ||||||||||||||||||||
| Financial | ||||||||||||||||||||
| assets at fair | Held-to- | Available-for- | ||||||||||||||||||
| Trading | value through | maturity | sale financial | |||||||||||||||||
| assets | profit or loss | investments | assets | Total | ||||||||||||||||
| (In millions) | ||||||||||||||||||||
| AAA | ¥ | 349,998 | ¥ | 1,776,252 | ¥ | 1,948,331 | ¥ | 16,926,881 | ¥ | 21,001,462 | ||||||||||
| AA- to AA+ | 170,870 | — | 103,386 | 573,754 | 848,010 | |||||||||||||||
| A- to A+ | 406,022 | 82,961 | 19,991 | 158,949 | 667,923 | |||||||||||||||
| Lower than A- | 26,388 | — | — | 109,897 | 136,285 | |||||||||||||||
| Unrated | 4,996 | 97,755 | — | 304,307 | 407,058 | |||||||||||||||
| Total | ¥ | 958,274 | ¥ | 1,956,968 | ¥ | 2,071,708 | ¥ | 18,073,788 | ¥ | 23,060,738 | ||||||||||
| At April 1, 2008 | ||||||||||||||||||||
| Financial | ||||||||||||||||||||
| assets at fair | Held-to- | Available-for- | ||||||||||||||||||
| Trading | value through | maturity | sale financial | |||||||||||||||||
| assets | profit or loss | investments | assets | Total | ||||||||||||||||
| (In millions) | ||||||||||||||||||||
| AAA | ¥ | 273,089 | ¥ | 1,771,353 | ¥ | 995,052 | ¥ | 11,628,067 | ¥ | 14,667,561 | ||||||||||
| AA- to AA+ | 361,851 | — | 103,305 | 598,705 | 1,063,861 | |||||||||||||||
| A- to A+ | 584,613 | 87,183 | 12,484 | 215,476 | 899,756 | |||||||||||||||
| Lower than A- | 21,042 | — | — | 118,759 | 139,801 | |||||||||||||||
| Unrated | 11,148 | 109,894 | 8 | 476,888 | 597,938 | |||||||||||||||
| Total | ¥ | 1,251,743 | ¥ | 1,968,430 | ¥ | 1,110,849 | ¥ | 13,037,895 | ¥ | 17,368,917 | ||||||||||
F-112
Table of Contents
F-113
Table of Contents
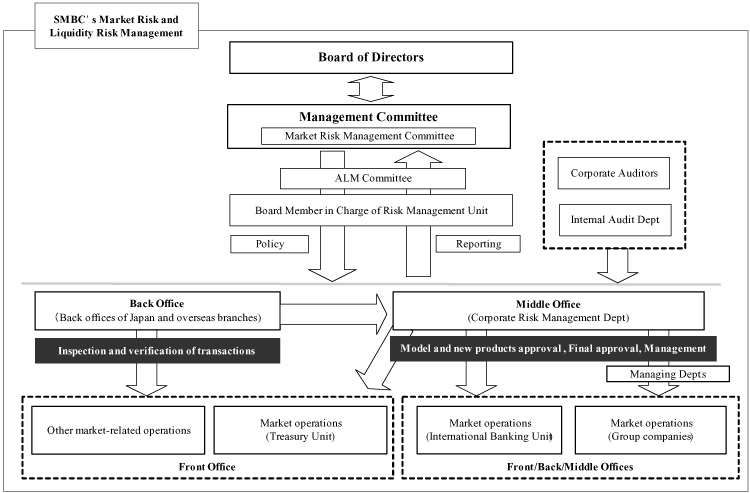
F-114
Table of Contents
| • | the historical simulation method; | ||
| • | a one-sided confidence interval of 99.0%; | ||
| • | a one-day holding period, and | ||
| • | an observation period of 4 years. |
| SMBC Consolidated | SMFG Consolidated | |||||||||||||||||||||||
| Strategic | Strategic | |||||||||||||||||||||||
| equity | equity | |||||||||||||||||||||||
| Trading | Banking | investment | Trading | Banking | investment | |||||||||||||||||||
| (In billions) | ||||||||||||||||||||||||
| Maximum | ¥ | 2.8 | ¥ | 42.4 | ¥ | 175.2 | ¥ | 2.8 | ¥ | 44.0 | ¥ | 178.6 | ||||||||||||
| Minimum | 1.2 | 30.9 | 100.4 | 1.2 | 31.8 | 102.3 | ||||||||||||||||||
| Daily average | 1.6 | 36.2 | 130.0 | 1.6 | 37.7 | 132.6 | ||||||||||||||||||
| SMBC Consolidated | SMFG Consolidated | |||||||||||||||||||||||
| Strategic | Strategic | |||||||||||||||||||||||
| equity | equity | |||||||||||||||||||||||
| Trading | Banking | investment | Trading | Banking | investment | |||||||||||||||||||
| (In billions) | ||||||||||||||||||||||||
| Maximum | ¥ | 2.8 | ¥ | 41.8 | ¥ | 170.4 | ¥ | 2.8 | ¥ | 43.9 | ¥ | 174.0 | ||||||||||||
| Minimum | 1.4 | 24.0 | 89.3 | 1.4 | 26.9 | 91.0 | ||||||||||||||||||
| Daily average | 2.0 | 31.5 | 131.9 | 2.0 | 34.2 | 134.9 | ||||||||||||||||||
F-115
Table of Contents
| SMBC Consolidated | SMFG Consolidated | |||||||||||||||||||||||
| Strategic | Strategic | |||||||||||||||||||||||
| equity | equity | |||||||||||||||||||||||
| Trading | Banking | investment | Trading | Banking | investment | |||||||||||||||||||
| (In billions) | ||||||||||||||||||||||||
| Interest rate risk | ¥ | 0.8 | ¥ | 28.4 | ¥ | — | ¥ | 0.8 | ¥ | 29.3 | ¥ | — | ||||||||||||
| Foreign exchange risk | 0.8 | 0.0 | — | 0.8 | 0.0 | — | ||||||||||||||||||
Equities and commodities risk(1) | 0.2 | 7.4 | 121.0 | 0.2 | 7.4 | 123.4 | ||||||||||||||||||
Others(2) | 0.2 | 1.2 | — | 0.2 | 1.2 | — | ||||||||||||||||||
| Total VaR | ¥ | 1.5 | ¥ | 32.8 | ¥ | 121.0 | ¥ | 1.5 | ¥ | 33.8 | ¥ | 123.4 | ||||||||||||
| SMBC Consolidated | SMFG Consolidated | |||||||||||||||||||||||
| Strategic | Strategic | |||||||||||||||||||||||
| equity | equity | |||||||||||||||||||||||
| Trading | Banking | investment | Trading | Banking | investment | |||||||||||||||||||
| (In billions) | ||||||||||||||||||||||||
| Interest rate risk | ¥ | 0.8 | ¥ | 35.9 | ¥ | — | ¥ | 0.8 | ¥ | 38.1 | ¥ | — | ||||||||||||
| Foreign exchange risk | 1.2 | 0.0 | — | 1.2 | 0.0 | — | ||||||||||||||||||
Equities and commodities risk(1) | 0.1 | 5.8 | 143.1 | 0.1 | 5.8 | 146.2 | ||||||||||||||||||
Others(2) | 0.3 | 0.0 | — | 0.3 | 0.0 | — | ||||||||||||||||||
| Total VaR | ¥ | 2.0 | ¥ | 39.2 | ¥ | 143.1 | ¥ | 2.0 | ¥ | 41.4 | ¥ | 146.2 | ||||||||||||
| (1) | Commodities risk is insignificant. | |
| (2) | This amount includes the VaR at certain subsidiaries. |
| • | The use of historical data as a proxy for estimating future events may underestimate the probability of extreme market movements. Past market movement is not necessarily a good indicator of future events. | ||
| • | The use of a holding period assumes that all positions can be liquidated or hedged in that period of time. This assumption does not fully capture the market risk arising during periods of illiquidity, when liquidation or hedging in that period of time may not be possible. | ||
| • | The use of a confidence level neither takes account of, nor makes any statement about, any losses that might occur beyond this level of confidence. | ||
| • | VaR does not capture all of the complex effects of the risk factors on the value of positions and portfolios and could underestimate potential losses. |
F-116
Table of Contents
| At March 31, | ||||||||
| 2010 | 2009 | |||||||
| (In billions, except for | ||||||||
| percentages) | ||||||||
| Total | ¥ | 532.7 | ¥ | 588.4 | ||||
| Impact of Japanese yen interest rates | 396.7 | 272.4 | ||||||
| Impact of U.S. dollar interest rates | 90.3 | 202.4 | ||||||
| Impact of Euro interest rates | 33.2 | 60.4 | ||||||
| Percentage of Tier I + Tier II | 6.1% | 8.6% | ||||||
| Note: “Decline in economic value” is the decline of the present value of the banking portfolio after interest rate shocks ( 1st and 99th percentile of observed interest rate changes using a 1-year holding period and 5 years of observables). | ||
F-117
Table of Contents
| At March 31, 2010 | ||||||||||||||||||||||||||||
| Later than | ||||||||||||||||||||||||||||
| Later than | Later than | three years | ||||||||||||||||||||||||||
| three months | one year and | and not later | ||||||||||||||||||||||||||
| On | Not later than | and not later | not later than | than five | Later than | |||||||||||||||||||||||
| demand | three months | than one year | three years | years | five years | Total | ||||||||||||||||||||||
| (In millions) | ||||||||||||||||||||||||||||
Non-derivative financial instruments: | ||||||||||||||||||||||||||||
| Deposits | ¥ | 47,416,348 | ¥ | 19,265,567 | ¥ | 14,274,881 | ¥ | 3,443,641 | ¥ | 684,950 | ¥ | 618,474 | ¥ | 85,703,861 | ||||||||||||||
| Call money and bills sold | — | 1,965,254 | 154,304 | — | — | — | 2,119,558 | |||||||||||||||||||||
| Repurchase agreements and cash collateral on securities lent | — | 5,339,230 | 98,219 | — | — | — | 5,437,449 | |||||||||||||||||||||
| Trading liabilities | 1,592,625 | — | — | — | — | — | 1,592,625 | |||||||||||||||||||||
| Borrowings | 36,917 | 939,777 | 3,424,215 | 819,750 | 564,468 | 1,475,235 | 7,260,362 | |||||||||||||||||||||
| Debt securities in issue | — | 1,884,881 | 381,056 | 644,471 | 536,564 | 1,880,185 | 5,327,157 | |||||||||||||||||||||
| Lease payable | — | 5,566 | 14,522 | 25,709 | 10,173 | 7,213 | 63,183 | |||||||||||||||||||||
| Other financial liabilities | 580,864 | 2,007,746 | 6,134 | 30,777 | 12,421 | 51,052 | 2,688,994 | |||||||||||||||||||||
Off balance sheet items: | ||||||||||||||||||||||||||||
| Loan commitments | 38,824,755 | — | — | — | — | — | 38,824,755 | |||||||||||||||||||||
| Financial guarantee contracts | 3,625,323 | — | — | — | — | — | 3,625,323 | |||||||||||||||||||||
| Total non-derivative financial instruments | ¥ | 92,076,832 | ¥ | 31,408,021 | ¥ | 18,353,331 | ¥ | 4,964,348 | ¥ | 1,808,576 | ¥ | 4,032,159 | ¥ | 152,643,267 | ||||||||||||||
Derivative financial instruments | ¥ | 4,756,695 | ¥ | — | ¥ | — | ¥ | — | ¥ | — | ¥ | — | ¥ | 4,756,695 | ||||||||||||||
F-118
Table of Contents
| At March 31, 2009 | ||||||||||||||||||||||||||||
| Later than | ||||||||||||||||||||||||||||
| Later than | Later than | three years | ||||||||||||||||||||||||||
| three months | one year and | and not later | ||||||||||||||||||||||||||
| On | Not later than | and not later | not later than | than five | Later than | |||||||||||||||||||||||
| demand | three months | than one year | three years | years | five years | Total | ||||||||||||||||||||||
| (In millions) | ||||||||||||||||||||||||||||
Non-derivative financial instruments: | ||||||||||||||||||||||||||||
| Deposits | ¥ | 49,093,401 | ¥ | 17,497,883 | ¥ | 12,208,073 | ¥ | 3,275,004 | ¥ | 538,223 | ¥ | 629,970 | ¥ | 83,242,554 | ||||||||||||||
| Call money and bills sold | 251,223 | 2,402,115 | 96,999 | — | — | — | 2,750,337 | |||||||||||||||||||||
| Repurchase agreements and cash collateral on securities lent | — | 7,906,064 | 466,305 | — | — | — | 8,372,369 | |||||||||||||||||||||
| Trading liabilities | 14,280 | — | — | — | — | — | 14,280 | |||||||||||||||||||||
| Borrowings | 40,299 | 2,733,910 | 644,491 | 900,509 | 536,073 | 1,544,213 | 6,399,495 | |||||||||||||||||||||
| Debt securities in issue | — | 1,549,506 | 641,673 | 586,600 | 613,985 | 1,897,355 | 5,289,119 | |||||||||||||||||||||
| Lease payable | — | 1,790 | 5,230 | 7,936 | 3,394 | 6,974 | 25,324 | |||||||||||||||||||||
Other financial liabilities(1) | 334,270 | 1,586,431 | 6,621 | 38,316 | 13,939 | 50,770 | 2,030,347 | |||||||||||||||||||||
Off balance sheet items: | ||||||||||||||||||||||||||||
| Loan commitments | 36,638,141 | — | — | — | — | — | 36,638,141 | |||||||||||||||||||||
| Financial guarantee contracts | 3,485,849 | — | — | — | — | — | 3,485,849 | |||||||||||||||||||||
| Total non-derivative financial instruments | ¥ | 89,857,463 | ¥ | 33,677,699 | ¥ | 14,069,392 | ¥ | 4,808,365 | ¥ | 1,705,614 | ¥ | 4,129,282 | ¥ | 148,247,815 | ||||||||||||||
Derivative financial instruments | ¥ | 5,743,542 | ¥ | — | ¥ | — | ¥ | — | ¥ | — | ¥ | — | ¥ | 5,743,542 | ||||||||||||||
| (1) | Other financial liabilities do not include preferred stock classified as a liability. | |
| Note: The amount of interest on debt instruments is not included in the maturity table above due to its insignificance. | ||
| At March 31, | ||||||||
| 2010 | 2009 | |||||||
| (In millions) | ||||||||
| Loans and advances | ¥ | 71,634,128 | ¥ | 74,669,294 | ||||
| Deposits | 85,697,973 | 83,231,234 | ||||||
F-119
Table of Contents
| At March 31, | ||||||||
| 2010 | 2009 | |||||||
| (In millions) | ||||||||
Domestic: | ||||||||
| Japanese government bonds | ¥ | 11,925,487 | ¥ | 11,278,166 | ||||
| Japanese municipal bonds | 268,291 | 242,316 | ||||||
| Japanese corporate bonds | 438,664 | 614,074 | ||||||
| Other debt instruments | 217,639 | 208,671 | ||||||
| Equity instruments | 3,168,320 | 2,637,781 | ||||||
| Total domestic | 16,018,401 | 14,981,008 | ||||||
Foreign: | ||||||||
| U.S. Treasury and other U.S. government agencies bonds | 2,049,546 | 2,971,004 | ||||||
| Other governments and official institutions bonds | 1,283,591 | 2,339,322 | ||||||
| Mortgage-backed securities | 4,637 | 245,740 | ||||||
| Other debt instruments | 224,855 | 174,495 | ||||||
| Equity instruments | 299,146 | 146,252 | ||||||
| Total foreign | 3,861,775 | 5,876,813 | ||||||
| Total | ¥ | 19,880,176 | ¥ | 20,857,821 | ||||
F-120
Table of Contents
F-121
Table of Contents
| At March 31, | ||||||||
| 2010 | 2009 | |||||||
| (In millions, except percentages) | ||||||||
Tier I capital: | ||||||||
| Capital stock | ¥ | 2,337,895 | ¥ | 1,420,877 | ||||
| Capital surplus | 978,897 | 57,245 | ||||||
| Retained earnings | 1,451,945 | 1,245,085 | ||||||
| Treasury stock | (124,061 | ) | (124,024 | ) | ||||
| Minority interests | 2,042,251 | 2,147,100 | ||||||
| Cash dividends to be paid | (80,665 | ) | (21,059 | ) | ||||
| Unrealized losses on other securities | — | (14,649 | ) | |||||
| Foreign currency translation adjustments | (101,650 | ) | (129,068 | ) | ||||
| Stock acquisition rights | 81 | 66 | ||||||
| Goodwill and others | (398,709 | ) | (186,792 | ) | ||||
| Gains on securitization transactions | (37,453 | ) | (42,102 | ) | ||||
| Amount equivalent to 50% of expected losses in excess of qualifying reserves | (36,249 | ) | (17,590 | ) | ||||
Deductions of deferred tax assets(1) | — | — | ||||||
| Total Tier I capital | 6,032,280 | 4,335,085 | ||||||
Tier II capital: | ||||||||
| Unrealized gains on other securities after 55% discount | 254,032 | — | ||||||
| Land revaluation excess after 55% discount | 37,033 | 37,211 | ||||||
| General reserve for possible loan losses | 69,371 | 80,374 | ||||||
| Excess amount of provisions | — | — | ||||||
| Subordinated debt | 2,203,415 | 2,303,382 | ||||||
| Total Tier II capital | 2,563,853 | 2,420,968 | ||||||
| Deductions | (467,906 | ) | (708,241 | ) | ||||
| Total qualifying capital | ¥ | 8,128,228 | ¥ | 6,047,812 | ||||
Risk-weighted assets: | ||||||||
| On-balance sheet items | 42,684,693 | 41,703,547 | ||||||
| Off-balance sheet items | 7,833,411 | 7,693,647 | ||||||
| Market risk items | 448,397 | 265,723 | ||||||
| Operational risk | 3,117,968 | 3,063,589 | ||||||
| Total risk-weighted assets | ¥ | 54,084,471 | ¥ | 52,726,507 | ||||
| Tier I risk-weighted capital ratio | 11.15% | 8.22% | ||||||
| Total risk-weighted capital ratio | 15.02% | 11.47% | ||||||
| (1) | The amount of net deferred tax assets was ¥702,065 million as of March 31, 2010 and ¥830,370 million as of March 31, 2009. Also, the upper limit of the inclusion of deferred tax assets into basic items was ¥1,206,456 million as of March 31, 2010 and ¥867,017 million as of March 31, 2009. | |
| (2) | Amounts less than 1 million yen have been omitted in the table of Regulatory Capital. As a result, the totals in Japanese yen shown in the above table do not necessarily agree to the sum of the individual amounts. |
F-122
Table of Contents
| At March 31, | ||||||||
| 2010 | 2009 | |||||||
| (In millions) | ||||||||
Assets: | ||||||||
| Loans and advances | ¥ | 763,254 | ¥ | 974,861 | ||||
| Others | 2,603 | 22,046 | ||||||
Liabilities: | ||||||||
| Deposits | ¥ | 245,407 | ¥ | 249,590 | ||||
| Call money and bills sold | — | 648,400 | ||||||
| Repurchase agreements and cash collateral on securities lent | — | 192,877 | ||||||
| Others | 2,738 | 48,008 | ||||||
| For the fiscal year ended | ||||||||
| March 31, | ||||||||
| 2010 | 2009 | |||||||
| (In millions) | ||||||||
Income statement: | ||||||||
| Income (interest income, and fee and commission income) | ¥ | 59,810 | ¥ | 63,754 | ||||
| Expense (interest expense and other expenses) | 45,778 | 51,020 | ||||||
F-123
Table of Contents
| At March 31, | ||||||||
| 2010 | 2009 | |||||||
| (In millions) | ||||||||
Assets: | ||||||||
| Loans and advances | ¥ | 1 | ¥ | 6 | ||||
Liabilities: | ||||||||
| Deposits | ¥ | 549 | ¥ | 284 | ||||
| Others | 71 | 34 | ||||||
| For the fiscal year ended | ||||||||
| March 31, | ||||||||
| 2010 | 2009 | |||||||
| (In millions) | ||||||||
| Short-term employee benefits | ¥ | 607 | ¥ | 568 | ||||
| Retirement benefits | 312 | 236 | ||||||
| Share-based compensation | 22 | 64 | ||||||
F-124
Table of Contents
| Percentage of | ||||||||||
| SMFG’s | ||||||||||
| Company Name | Issued Capital | Voting Rights | Main Business | |||||||
| (In millions) | % | |||||||||
| Sumitomo Mitsui Banking Corporation | ¥ | 1,770,996 | 100.00 | Commercial banking | ||||||
| Sumitomo Mitsui Card Company, Limited | 34,000 | 65.99 | Credit card services | |||||||
| Sumitomo Mitsui Finance and Leasing Company, Limited | 15,000 | 60.00 | Leasing | |||||||
| The Japan Research Institute, Limited | 10,000 | 100.00 | System development, data processing, management consulting, and economic research | |||||||
| SMBC Friend Securities Co., Ltd. | 27,270 | 100.00 | Securities | |||||||
| Nikko Cordial Securities Inc. | 10,000 | 100.00 | Securities | |||||||
| ORIX Credit Corporation | 22,170 | 50.99 | Consumer finance | |||||||
| SAKURA CARD CO., Ltd. | 7,438 | 95.74 | Credit card services | |||||||
SMM Auto Finance, Inc.(1) | 7,700 | 41.00 | Automobile sales finance | |||||||
| The Japan Net Bank, Limited | 37,250 | 59.70 | (2) | Internet banking | ||||||
| SMBC Guarantee Co., Ltd. | 187,720 | 100.00 | Credit guarantee | |||||||
| SMBC Finance Service Co., Ltd. | 71,705 | 100.00 | Loans, factoring and collecting agent | |||||||
| Financial Link Company, Limited | 160 | 100.00 | Data processing service and consulting | |||||||
| SMBC Consulting Co., Ltd. | 1,100 | 100.00 | Management consulting and information services | |||||||
| SAKURA KCS Corporation | 2,054 | 50.21 | System engineering and data processing | |||||||
THE MINATO BANK, LTD.(1) | 27,484 | 46.44 | (3) | Commercial banking | ||||||
| Kansai Urban Banking Corporation | 47,039 | 56.46 | Commercial banking | |||||||
| Japan Pension Navigator Co., Ltd. | 1,600 | 69.71 | Operational management of defined contribution pension plans | |||||||
| Percentage of | ||||||||||||||||
| SMFG’s | ||||||||||||||||
| Company Name | Country | Issued Capital | Voting Rights | Main Business | ||||||||||||
| % | ||||||||||||||||
| Sumitomo Mitsui Banking Corporation Europe Limited | U.K. | US$1,600 million | 100.00 | Commercial banking | ||||||||||||
| Sumitomo Mitsui Banking Corporation (China) Limited | China | CNY7,000 million | 100.00 | Commercial banking | ||||||||||||
| Manufacturers Bank | U.S.A. | US$80.786 million | 100.00 | Commercial banking | ||||||||||||
| Sumitomo Mitsui Banking Corporation of Canada | Canada | C$169 million | 100.00 | Commercial banking | ||||||||||||
| Banco Sumitomo Mitsui Brasileiro S.A. | Brazil | R$409.356 million | 100.00 | Commercial banking | ||||||||||||
| ZAO Sumitomo Mitsui Rus Bank | Russia | RUB1,600 million | 100.00 | Commercial banking | ||||||||||||
| PT Bank Sumitomo Mitsui Indonesia | Indonesia | Rp1,502.4 billion | 99.00 | Commercial banking | ||||||||||||
| SMBC Leasing and Finance, Inc. | U.S.A. | US$1,620 | 100.00 | Leasing | ||||||||||||
| SMBC Capital Markets, Inc. | U.S.A. | US$100 | 100.00 | Derivatives and investments | ||||||||||||
| SMBC Securities, Inc. | U.S.A. | US$100 | 100.00 | Securities | ||||||||||||
| SMBC Capital Markets Limited | U.K. | US$797 million | 100.00 | Derivatives | ||||||||||||
| (1) | SMM Auto Finance, Inc. and THE MINATO BANK, LTD. are subsidiaries, although the SMFG Group holds less than 50% of the voting rights. The SMFG Group is able to govern the financial and operating policies of these companies by virtue of a law or an agreement. | |
| (2) | The SMFG Group’s equity interest in The Japan Net Bank, Limited is 40.00%, which is different from its percentage of voting rights, because The Japan Net Bank, Limited issued non-voting shares. | |
| (3) | Although the SMFG Group has a 6.05% direct holding in THE MINATO BANK, LTD., it is able to control a further 40.39% of the voting rights held by SMBC’s retirement benefit trust under contractual agreements between SMBC and the retirement benefit trust. |
F-125
Table of Contents
| • | Government or Central Bank restrictions relating to local exchange control laws; | ||
| • | Government or Central Bank capital adequacy requirements; and | ||
| • | Companies Act restrictions relating to dividends. |
F-126
Table of Contents
| Carrying | ||||||||||||
| amounts before | Adjustments to | |||||||||||
| the acquisition | fair value | Fair value | ||||||||||
| (In millions) | ||||||||||||
Assets: | ||||||||||||
| Trading assets | ¥ | 644,252 | ¥ | — | ¥ | 644,252 | ||||||
| Intangible assets | 38,759 | 116,040 | 154,799 | |||||||||
| All other assets | 1,390,097 | 1,623 | 1,391,720 | |||||||||
| Total assets | ¥ | 2,073,108 | ¥ | 117,663 | ¥ | 2,190,771 | ||||||
Liabilities: | ||||||||||||
| Borrowing | ¥ | 333,091 | ¥ | — | ¥ | 333,091 | ||||||
| All other liabilities | 1,450,678 | 2,631 | 1,453,309 | |||||||||
| Total liabilities | ¥ | 1,783,769 | ¥ | 2,631 | ¥ | 1,786,400 | ||||||
| Net assets | ¥ | 404,371 | ||||||||||
| Non-controlling interests | 711 | |||||||||||
| Net assets acquired | 403,660 | |||||||||||
| Goodwill | 164,440 | |||||||||||
| Consideration | ¥ | 568,100 | ||||||||||
Consideration: | ||||||||||||
| Cash | ¥ | 565,155 | ||||||||||
| Costs directly attributable to the acquisition | 2,945 | |||||||||||
| Total | ¥ | 568,100 | ||||||||||
F-127
Table of Contents
| Carrying | ||||||||||||
| amounts before | Adjustments to | |||||||||||
| the acquisition | fair value | Fair value | ||||||||||
| (In millions) | ||||||||||||
Assets: | ||||||||||||
| Loans and advances | ¥ | 805,980 | ¥ | 5,022 | ¥ | 811,002 | ||||||
| Intangible assets | 1,128 | 3,848 | 4,976 | |||||||||
| All other assets | 296,473 | (6,438 | ) | 290,035 | ||||||||
| Total assets | ¥ | 1,103,581 | ¥ | 2,432 | ¥ | 1,106,013 | ||||||
Liabilities: | ||||||||||||
| Deposits | ¥ | 1,030,994 | ¥ | 2,263 | ¥ | 1,033,257 | ||||||
| All other liabilities | 73,500 | 1,858 | 75,358 | |||||||||
| Total liabilities | ¥ | 1,104,494 | ¥ | 4,121 | ¥ | 1,108,615 | ||||||
| Net assets | ¥ | (2,602 | ) | |||||||||
| Non-controlling interests | 208 | |||||||||||
| Net assets acquired | (2,810 | ) | ||||||||||
| Goodwill | 10,787 | |||||||||||
| Consideration | ¥ | 7,977 | ||||||||||
Consideration: | ||||||||||||
| Fair value of consideration transferred | ¥ | 5,610 | ||||||||||
| Equity interest held before the acquisition | 2,030 | |||||||||||
| Costs directly attributable to the acquisition | 337 | |||||||||||
| Total | ¥ | 7,977 | ||||||||||
F-128
Table of Contents
| For the fiscal | ||||
| year ended | ||||
| March 31, | ||||
| 2010 | ||||
| (In millions) | ||||
Net cash outflow arising on acquisition: | ||||
| Cash consideration | ¥ | 595,728 | ||
| Cash and cash equivalents acquired | (371,790 | ) | ||
| Net cash outflow on acquisition | ¥ | 223,938 | ||
F-129
Table of Contents
| At March 31, 2010 | ||||||||||||
| Amounts recovered or settled | ||||||||||||
| Not more than | More than | |||||||||||
| twelve months | twelve months | Total | ||||||||||
| (In millions) | ||||||||||||
Assets: | ||||||||||||
| Call loans and bills bought | ¥ | 1,127,035 | ¥ | — | ¥ | 1,127,035 | ||||||
| Reverse repurchase agreements and cash collateral on securities borrowed | 5,697,669 | — | 5,697,669 | |||||||||
| Financial assets at fair value through profit or loss | — | 2,092,383 | 2,092,383 | |||||||||
| Investment securities: | ||||||||||||
| Held-to-maturity investments | 68,849 | 3,203,163 | 3,272,012 | |||||||||
| Available-for-sale financial assets | 8,870,885 | 11,009,291 | 19,880,176 | |||||||||
| Loans and advances | 25,313,363 | 46,320,765 | 71,634,128 | |||||||||
| Other financial assets | 1,111,501 | 120,835 | 1,232,336 | |||||||||
Liabilities: | ||||||||||||
| Deposits | ¥ | 80,956,842 | ¥ | 4,741,131 | ¥ | 85,697,973 | ||||||
| Call money and bills sold | 2,119,558 | — | 2,119,558 | |||||||||
| Repurchase agreements and cash collateral on securities lent | 5,437,449 | — | 5,437,449 | |||||||||
| Borrowings | 4,420,114 | 2,901,370 | 7,321,484 | |||||||||
| Debt securities in issue | 2,265,879 | 3,057,277 | 5,323,156 | |||||||||
| Other financial liabilities | 2,594,744 | 94,250 | 2,688,994 | |||||||||
F-130
Table of Contents
| At March 31, 2009 | ||||||||||||
| Amounts recovered or settled | ||||||||||||
| Not more than | More than | |||||||||||
| twelve months | twelve months | Total | ||||||||||
| (In millions) | ||||||||||||
Assets: | ||||||||||||
| Call loans and bills bought | ¥ | 973,772 | ¥ | — | ¥ | 973,772 | ||||||
| Reverse repurchase agreements and cash collateral on securities borrowed | 2,009,141 | — | 2,009,141 | |||||||||
| Financial assets at fair value through profit or loss | — | 2,063,790 | 2,063,790 | |||||||||
| Investment securities: | ||||||||||||
| Held-to-maturity investments | 167,414 | 1,904,294 | 2,071,708 | |||||||||
| Available-for-sale financial assets | 3,865,277 | 16,992,544 | 20,857,821 | |||||||||
| Loans and advances | 28,535,152 | 46,134,142 | 74,669,294 | |||||||||
| Other financial assets | 613,750 | 98,369 | 712,119 | |||||||||
Liabilities: | ||||||||||||
| Deposits | ¥ | 78,799,349 | ¥ | 4,431,885 | ¥ | 83,231,234 | ||||||
| Call money and bills sold | 2,750,337 | — | 2,750,337 | |||||||||
| Repurchase agreements and cash collateral on securities lent | 8,372,369 | — | 8,372,369 | |||||||||
| Borrowings | 3,425,499 | 2,997,504 | 6,423,003 | |||||||||
| Debt securities in issue | 2,190,964 | 3,086,518 | 5,277,482 | |||||||||
| Other financial liabilities | 1,927,322 | 223,390 | 2,150,712 | |||||||||
| At March 31, | At April 1, | |||||||||||
| 2010 | 2009 | 2008 | ||||||||||
| (In millions) | ||||||||||||
Assets: | ||||||||||||
| Deposits with SMBC | ¥ | 86,284 | ¥ | 1,281 | ¥ | 53,736 | ||||||
| Investments in SMBC | 5,377,728 | 3,165,708 | 3,165,708 | |||||||||
| Investments in other subsidiaries and associates | 637,898 | 802,949 | 783,127 | |||||||||
| Other assets | 694 | 452 | 608 | |||||||||
| Current tax assets | 24,066 | 21,972 | 14,267 | |||||||||
| Deferred tax assets | — | 5,596 | 2,055 | |||||||||
| Total assets | ¥ | 6,126,670 | ¥ | 3,997,958 | ¥ | 4,019,501 | ||||||
Liabilities and equity: | ||||||||||||
| Short-term borrowings from SMBC | ¥ | 948,030 | ¥ | 1,078,030 | ¥ | 1,049,030 | ||||||
| Debt securities due to a subsidiary | 392,900 | — | — | |||||||||
| Preferred stock classified as a liability | — | 120,365 | 308,877 | |||||||||
| Other liabilities | 6,270 | 1,736 | 3,437 | |||||||||
| Total liabilities | 1,347,200 | 1,200,131 | 1,361,344 | |||||||||
| Shareholders’ equity | 4,779,470 | 2,797,827 | 2,658,157 | |||||||||
| Total liabilities and shareholders’ equity | ¥ | 6,126,670 | ¥ | 3,997,958 | ¥ | 4,019,501 | ||||||
F-131
Table of Contents
| For the fiscal year ended | ||||||||
| March 31, | ||||||||
| 2010 | 2009 | |||||||
| (In millions) | ||||||||
Income: | ||||||||
| Dividends from SMBC | ¥ | 113,315 | ¥ | 93,941 | ||||
| Dividends from other subsidiaries and associates | 5,504 | 23,110 | ||||||
| Fees and commission income from subsidiaries | 14,561 | 17,722 | ||||||
Derivative income(1) | 23,626 | 49,395 | ||||||
| Income from disposal of an associate | 7,670 | — | ||||||
| Other income | 3,343 | 265 | ||||||
| Total income | 168,019 | 184,433 | ||||||
Expense: | ||||||||
| Interest expense to SMBC | 9,116 | 11,911 | ||||||
| Interest expense due to a subsidiary | 8,288 | — | ||||||
| Other interest expense | 1,429 | 1,648 | ||||||
| Impairment loss of investment in associates | — | 42,865 | ||||||
| Operating and other expense | 11,671 | 19,964 | ||||||
| Total expense | 30,504 | 76,388 | ||||||
| Profit before tax | 137,515 | 108,045 | ||||||
| Income tax expense (benefit) | 10,703 | (847 | ) | |||||
| Net profit for the fiscal year | ¥ | 126,812 | ¥ | 108,892 | ||||
| (1) | Derivative income represents income from the derivative embedded in Type 4 preferred stock. The detail of the instruments is described in Note 24 “Shareholders’ Equity”. |
F-132
Table of Contents
| For the fiscal year ended | ||||||||
| March 31, | ||||||||
| 2010 | 2009 | |||||||
| (In millions) | ||||||||
Operating Activities: | ||||||||
| Profit before tax | ¥ | 137,515 | ¥ | 108,045 | ||||
| Adjustments for: | ||||||||
| Derivative income | (23,626 | ) | (49,395 | ) | ||||
| Impairment loss of investments in associates | — | 42,865 | ||||||
| Income from disposal of an associate | (7,670 | ) | — | |||||
| Income taxes paid-net | (2,618 | ) | (11,264 | ) | ||||
| Other operating activities–net | 5,037 | 1,088 | ||||||
| Net cash and cash equivalents provided by operating activities | 108,638 | 91,339 | ||||||
Investing Activities: | ||||||||
| Investment to SMBC | (2,212,020 | ) | — | |||||
| Investments to and establishment of subsidiaries and associates | (4,900 | ) | (51,264 | ) | ||||
| Proceeds from disposal of investment in an associate | 180,595 | — | ||||||
| Other investing activities–net | — | (8 | ) | |||||
| Net cash and cash equivalents used in investing activities | (2,036,325 | ) | (51,272 | ) | ||||
Financing Activities: | ||||||||
| Proceeds from issuance of debt securities | 392,900 | — | ||||||
| Net increase (decrease) of short-term borrowings | (130,000 | ) | 29,000 | |||||
| Proceeds from issuance of common stock | 1,824,896 | — | ||||||
| Dividends paid | (71,930 | ) | (120,166 | ) | ||||
| Purchases of treasury stock and proceeds from sale of treasury stock–net | (146 | ) | (616 | ) | ||||
| Other financing activities–net | (3,030 | ) | (740 | ) | ||||
| Net cash and cash equivalents provided by (used in) financing activities | 2,012,690 | (92,522 | ) | |||||
| Net increase (decrease) of cash and cash equivalents | 85,003 | (52,455 | ) | |||||
| Cash and cash equivalents at the beginning of fiscal year | 1,281 | 53,736 | ||||||
| Cash and cash equivalents at the end of fiscal year | ¥ | 86,284 | ¥ | 1,281 | ||||
F-133
Table of Contents
F-134
Table of Contents
F-135
Table of Contents
| Effect of transition | ||||||||||||||||||
| Notes | Japanese GAAP | Reclassification | to IFRS | IFRS | ||||||||||||||
| (In millions) | ||||||||||||||||||
Assets: | ||||||||||||||||||
| Cash and deposits with banks | A | ¥ | 5,017,326 | ¥ | (62,086 | ) | ¥ | (6,771 | ) | ¥ | 4,948,469 | |||||||
| Call loans and bills bought | 595,802 | 124,377 | 14,960 | 735,139 | ||||||||||||||
| Reverse repurchase agreements and cash collateral on securities borrowed | A | 2,297,246 | — | 181,516 | 2,478,762 | |||||||||||||
| Trading assets | A,C | 4,123,612 | (3,008,799 | ) | 419,567 | 1,534,380 | ||||||||||||
| Derivative financial instruments | B,L | — | 4,501,689 | 272,382 | 4,774,071 | |||||||||||||
| Financial assets at fair value through profit or loss | C | — | — | 2,086,612 | 2,086,612 | |||||||||||||
| Investment securities | A,C | 23,524,832 | (494,129 | ) | (5,038,219 | ) | 17,992,484 | |||||||||||
| Loans and advances | A,D,G | 63,296,809 | 2,250,710 | 6,436,761 | 71,984,280 | |||||||||||||
| Investments in associates and joint ventures | A,E, | — | 494,129 | (36,735 | ) | 457,394 | ||||||||||||
| Property, plant and equipment | A,F,G | 2,245,509 | (1,425,097 | ) | 41,280 | 861,692 | ||||||||||||
| Intangible assets | 332,526 | — | (3,322 | ) | 329,204 | |||||||||||||
| Other assets | A,H,L | 4,951,587 | (2,409,205 | ) | (1,458,164 | ) | 1,084,218 | |||||||||||
| Current tax assets | — | 28,411 | 70 | 28,481 | ||||||||||||||
| Deferred tax assets | I | 985,529 | — | 255,815 | 1,241,344 | |||||||||||||
| Customers’ liabilities for acceptances and guarantees | D | 4,585,141 | — | (4,585,141 | ) | — | ||||||||||||
| Total assets | ¥ | 111,955,919 | ¥ | — | ¥ | (1,419,389 | ) | ¥ | 110,536,530 | |||||||||
Liabilities: | ||||||||||||||||||
| Deposits | B | ¥ | 75,768,773 | ¥ | 192,394 | ¥ | (72,209 | ) | ¥ | 75,888,958 | ||||||||
| Call money and bills sold | 2,638,142 | 123,388 | — | 2,761,530 | ||||||||||||||
| Repurchase agreements and cash collateral on securities lent | A | 7,564,510 | — | 18,864 | 7,583,374 | |||||||||||||
| Trading liabilities | A | 2,671,317 | (2,651,271 | ) | 42,779 | 62,825 | ||||||||||||
| Derivative financial instruments | B,L | — | 4,055,887 | 430,932 | 4,486,819 | |||||||||||||
| Borrowings | A,G | 4,279,034 | 214,863 | 1,628,632 | 6,122,529 | |||||||||||||
| Debt securities in issue | A | 4,738,408 | — | 739,370 | 5,477,778 | |||||||||||||
| Provisions | 88,675 | (45,576 | ) | (15,390 | ) | 27,709 | ||||||||||||
| Other liabilities | A,H,J,L | 4,298,348 | (1,946,457 | ) | 490,925 | 2,842,816 | ||||||||||||
| Current tax liabilities | — | 56,772 | 28,731 | 85,503 | ||||||||||||||
| Deferred tax liabilities | 99,494 | — | (66,700 | ) | 32,794 | |||||||||||||
| Acceptances and guarantees | D | 4,585,141 | — | (4,585,141 | ) | — | ||||||||||||
| Total liabilities | 106,731,842 | — | (1,359,207 | ) | 105,372,635 | |||||||||||||
Equity: | ||||||||||||||||||
| Capital stock | J | 1,420,877 | — | (75,150 | ) | 1,345,727 | ||||||||||||
| Capital surplus | J | 57,827 | — | (57,802 | ) | 25 | ||||||||||||
| Retained earnings | 1,740,610 | — | (261,874 | ) | 1,478,736 | |||||||||||||
| Other reserves | B,C,K | 483,002 | — | 357,446 | 840,448 | |||||||||||||
| Treasury stock | (123,989 | ) | — | — | (123,989 | ) | ||||||||||||
| Equity attributable to shareholders of Sumitomo Mitsui Financial Group, Inc. | 3,578,327 | — | (37,380 | ) | 3,540,947 | |||||||||||||
| Non-controlling interests | A | 1,645,750 | — | (22,802 | ) | 1,622,948 | ||||||||||||
| Total equity | 5,224,077 | — | (60,182 | ) | 5,163,895 | |||||||||||||
| Total equity and liabilities | ¥ | 111,955,919 | ¥ | — | ¥ | (1,419,389 | ) | ¥ | 110,536,530 | |||||||||
F-136
Table of Contents
| Effect of transition | ||||||||||||||||||
| Notes | Japanese GAAP | Reclassification | to IFRS | IFRS | ||||||||||||||
| (In millions) | ||||||||||||||||||
Assets: | ||||||||||||||||||
| Cash and deposits with banks | A | ¥ | 5,241,694 | ¥ | (186,354 | ) | ¥ | (10,596 | ) | ¥ | 5,044,744 | |||||||
| Call loans and bills bought | 633,655 | 338,433 | 1,684 | 973,772 | ||||||||||||||
| Reverse repurchase agreements and cash collateral on securities borrowed | A | 1,830,716 | — | 178,425 | 2,009,141 | |||||||||||||
| Trading assets | A,C | 4,924,962 | (4,066,827 | ) | 212,251 | 1,070,386 | ||||||||||||
| Derivative financial instruments | B,L | — | 5,472,920 | 589,950 | 6,062,870 | |||||||||||||
| Financial assets at fair value through profit or loss | C | — | — | 2,063,790 | 2,063,790 | |||||||||||||
| Investment securities | A,C | 28,707,149 | (469,966 | ) | (5,307,654 | ) | 22,929,529 | |||||||||||
| Loans and advances | A,D,G | 67,934,948 | 1,539,670 | 5,194,676 | 74,669,294 | |||||||||||||
| Investments in associates and joint ventures | A,E, | — | 469,966 | (62,131 | ) | 407,835 | ||||||||||||
| Property, plant and equipment | A,F,G | 1,008,801 | — | (104,845 | ) | 903,956 | ||||||||||||
| Intangible assets | 361,884 | — | (4,033 | ) | 357,851 | |||||||||||||
| Other assets | A,H,L | 4,257,252 | (3,148,187 | ) | (30,914 | ) | 1,078,151 | |||||||||||
| Current tax assets | — | 50,345 | 4 | 50,349 | ||||||||||||||
| Deferred tax assets | I | 857,659 | — | 855,549 | 1,713,208 | |||||||||||||
| Customers’ liabilities for acceptances and guarantees | D | 3,878,504 | — | (3,878,504 | ) | — | ||||||||||||
| Total assets | ¥ | 119,637,224 | ¥ | — | ¥ | (302,348 | ) | ¥ | 119,334,876 | |||||||||
Liabilities: | ||||||||||||||||||
| Deposits | B | ¥ | 83,030,783 | ¥ | 212,096 | ¥ | (11,645 | ) | ¥ | 83,231,234 | ||||||||
| Call money and bills sold | 2,499,113 | 251,224 | — | 2,750,337 | ||||||||||||||
| Repurchase agreements and cash collateral on securities lent | A | 8,368,276 | — | 4,093 | 8,372,369 | |||||||||||||
| Trading liabilities | A | 3,597,659 | (3,590,186 | ) | 6,807 | 14,280 | ||||||||||||
| Derivative financial instruments | B,L | — | 4,907,489 | 836,053 | 5,743,542 | |||||||||||||
| Borrowings | A,G | 4,644,700 | 120,815 | 1,657,488 | 6,423,003 | |||||||||||||
| Debt securities in issue | A | 4,702,827 | — | 574,655 | 5,277,482 | |||||||||||||
| Provisions | 83,984 | (36,303 | ) | (18,017 | ) | 29,664 | ||||||||||||
| Other liabilities | A,H,J,L | 4,145,109 | (1,910,241 | ) | 260,274 | 2,495,142 | ||||||||||||
| Current tax liabilities | — | 45,106 | 9,745 | 54,851 | ||||||||||||||
| Deferred tax liabilities | 74,505 | — | (47,548 | ) | 26,957 | |||||||||||||
| Acceptances and guarantees | D | 3,878,504 | — | (3,878,504 | ) | — | ||||||||||||
| Total liabilities | 115,025,460 | — | (606,599 | ) | 114,418,861 | |||||||||||||
Equity: | ||||||||||||||||||
| Capital stock | J | 1,420,877 | — | (50,100 | ) | 1,370,777 | ||||||||||||
| Capital surplus | J | 57,246 | — | 57,348 | 114,594 | |||||||||||||
| Retained earnings | 1,245,086 | — | (40,134 | ) | 1,204,952 | |||||||||||||
| Other reserves | B,C,K | (129,395 | ) | — | 357,711 | 228,316 | ||||||||||||
| Treasury stock | (124,025 | ) | — | 1 | (124,024 | ) | ||||||||||||
| Equity attributable to shareholders of Sumitomo Mitsui Financial Group, Inc. | 2,469,789 | — | 324,826 | 2,794,615 | ||||||||||||||
| Non-controlling interests | A | 2,141,975 | — | (20,575 | ) | 2,121,400 | ||||||||||||
| Total equity | 4,611,764 | — | 304,251 | 4,916,015 | ||||||||||||||
| Total equity and liabilities | ¥ | 119,637,224 | ¥ | — | ¥ | (302,348 | ) | ¥ | 119,334,876 | |||||||||
F-137
Table of Contents
| At April 1, | At March 31, | |||||||||
| Notes | 2008 | 2009 | ||||||||
| (In millions) | ||||||||||
Total equity as previously reported under Japanese GAAP | ¥ | 5,224,077 | ¥ | 4,611,764 | ||||||
| Scope of consolidation | A | (118,677 | ) | (125,462 | ) | |||||
| Embedded derivatives | B (i) | (48,682 | ) | (48,531 | ) | |||||
| Hedge accounting | B (ii) | (8,904 | ) | 77 | ||||||
| Fair value measurement of derivative financial instruments | B (iii) | (55,559 | ) | (157,215 | ) | |||||
| Fair value measurement of investment securities | C (i) | 355,188 | 114,504 | |||||||
| Impairment of loans and advances | D (i) | 204,283 | 111,598 | |||||||
| Loan origination fees and costs | D (ii) | (132,534 | ) | (143,604 | ) | |||||
| Loan commitments and financial guarantees | D (iii) | 9 | (1,173 | ) | ||||||
| Investments in associates and joint ventures | E | (58,730 | ) | (80,648 | ) | |||||
| Property, plant and equipment | F | (14,721 | ) | (10,495 | ) | |||||
| Lease accounting | G | 45,267 | 38,609 | |||||||
| Defined benefit plans | H | (194,775 | ) | (158,449 | ) | |||||
| Deferred tax assets | I | 351,162 | 793,308 | |||||||
| Classification of equity and liability | J | (308,877 | ) | (120,365 | ) | |||||
| Others | (45,985 | ) | (17,695 | ) | ||||||
| Tax effect of the above | (28,647 | ) | 109,792 | |||||||
Total equity under IFRS | ¥ | 5,163,895 | ¥ | 4,916,015 | ||||||
F-138
Table of Contents
| Effect of transition | ||||||||||||||||||
| Notes | Japanese GAAP | Reclassification | to IFRS | IFRS | ||||||||||||||
| (In millions) | ||||||||||||||||||
| Interest income | A,B,D,G | �� | 2,087,348 | ¥ | (52,889 | ) | ¥ | 129,589 | ¥ | 2,164,048 | ||||||||
| Interest expense | A,B,G | 748,894 | (83,759 | ) | 11,158 | 676,293 | ||||||||||||
| Net interest income | 1,338,454 | 30,870 | 118,431 | 1,487,755 | ||||||||||||||
| Fee and commission income | A,D | 674,876 | — | (104,273 | ) | 570,603 | ||||||||||||
| Fee and commission expense | 115,574 | — | 666 | 116,240 | ||||||||||||||
| Net fee and commission income | 559,302 | — | (104,939 | ) | 454,363 | |||||||||||||
| Net trading income | A,B,C,J | 211,739 | (87,182 | ) | 9,741 | 134,298 | ||||||||||||
| Net income (loss) from financial assets at fair value through profit or loss | C | — | — | (17,951 | ) | (17,951 | ) | |||||||||||
| Net investment income | A,C | — | 118,997 | 40,514 | 159,511 | |||||||||||||
| Other income | A | 582,573 | (368,890 | ) | (20,564 | ) | 193,119 | |||||||||||
| Total operating income | 2,692,068 | (306,205 | ) | 25,232 | 2,411,095 | |||||||||||||
| Impairment charges on financial assets | A,C,D | 402,808 | 561,359 | 276,543 | 1,240,710 | |||||||||||||
| Net operating income | 2,289,260 | (867,564 | ) | (251,311 | ) | 1,170,385 | ||||||||||||
| General and administrative expenses | A,F,H | 1,063,420 | (1,559 | ) | (69,374 | ) | 992,487 | |||||||||||
| Other expenses | E | 1,101,467 | (866,005 | ) | 26,308 | 261,770 | ||||||||||||
| Operating expenses | 2,164,887 | (867,564 | ) | (43,066 | ) | 1,254,257 | ||||||||||||
| Share of post-tax loss of associates and joint ventures | A,E | 94,877 | — | (40,559 | ) | 54,318 | ||||||||||||
| Profit (loss) before tax | 29,496 | — | (167,686 | ) | (138,190 | ) | ||||||||||||
| Income tax expense (benefit) | I | 334,644 | — | (390,810 | ) | (56,166 | ) | |||||||||||
| Net profit (loss) for the fiscal year | ¥ | (305,148 | ) | ¥ | — | ¥ | 223,124 | ¥ | (82,024 | ) | ||||||||
| Profit (loss) attributable to: | ||||||||||||||||||
| Shareholders of Sumitomo Mitsui Financial Group, Inc. | ¥ | (373,456 | ) | ¥ | — | ¥ | 218,502 | ¥ | (154,954 | ) | ||||||||
| Non-controlling interests | 68,308 | — | 4,622 | 72,930 | ||||||||||||||
F-139
Table of Contents
| For the fiscal | ||||||
| year ended | ||||||
| March 31, | ||||||
| Notes | 2009 | |||||
| (In millions) | ||||||
Net profit (loss) as previously reported under Japanese GAAP(1) | ¥ | (305,148 | ) | |||
| Scope of consolidation | A | 2,969 | ||||
| Embedded derivatives | B (i) | 151 | ||||
| Hedge accounting | B (ii) | 104,552 | ||||
| Fair value measurement of derivative financial instruments | B (iii) | (102,969 | ) | |||
| Fair value measurement of investment securities | C (i) | (28,614 | ) | |||
| Impairment of available-for-sale financial assets | C (ii) | (161,921 | ) | |||
| Impairment of loans and advances | D (i) | (96,720 | ) | |||
| Loan origination fees and costs | D (ii) | (14,233 | ) | |||
| Loan commitments and financial guarantees | D (iii) | (1,183 | ) | |||
| Investments in associates and joint ventures | E | 11,843 | ||||
| Property, plant and equipment | F | 4,272 | ||||
| Lease accounting | G | (7,324 | ) | |||
| Defined benefit plans | H | 36,326 | ||||
| Deferred tax assets | I | 303,945 | ||||
| Classification of equity and liability | J | 47,860 | ||||
| Foreign currency translation | K | 33,647 | ||||
| Others | 3,659 | |||||
| Tax effect of the above | 86,864 | |||||
Net profit (loss) under IFRS | ¥ | (82,024 | ) | |||
| (1) | The SMFG Group reconciled net profit (loss) reported under Japanese GAAP to its net profit (loss) under IFRS as it did not report total comprehensive income under Japanese GAAP. The reconciliation between net profit (loss) under IFRS and total comprehensive income (loss) under IFRS is shown in the consolidated statement of comprehensive income (page F-6). |
F-140
Table of Contents
F-141
Table of Contents
F-142
Table of Contents
F-143
Table of Contents
F-144
Table of Contents
F-145
Table of Contents
FOR THE THREE MONTH PERIOD ENDED JUNE 30, 2010
| 1. | Financial Results (for the three months ended June 30, 2010) |
| (1) | Operating Results |
| Ordinary Income | Ordinary Profit | Net Income | |||||||||||||||||||||||||||
| Three Months ended June 30, 2010 | ¥ | 871,144 | 13.9 | % | ¥ | 273,204 | 137.1 | % | ¥ | 211,807 | 191.1 | % | |||||||||||||||||
| Three Months ended June 30, 2009 | 764,985 | (19.6 | ) | 115,248 | 56.5 | 72,773 | 25.3 | ||||||||||||||||||||||
| Net Income | Net Income | ||||||||||||||||||||||||||||
| Per Share | Per Share (Diluted) | ||||||||||||||||||||||||||||
| Three Months ended June 30, 2010 | ¥ 151.62 | ¥ 151.61 | |||||||||||||||||||||||||||
| Three Months ended June 30, 2009 | 86.09 | 82.78 | |||||||||||||||||||||||||||
| (2) | Financial Position |
| Total Assets | Net Assets | Net Assets Ratio | Net Assets per Share | |||||||||||||||||||
| June 30, 2010 | ¥ | 128,209,062 | ¥ | 7,087,652 | 3.9 | % | ¥ | 3,431.37 | ||||||||||||||
| March 31, 2010 | 123,159,513 | 7,000,805 | 4.0 | 3,391.75 | ||||||||||||||||||
| Notes: 1. Stockholders’ equity as of June 30, 2010: ¥5,003,554 million as of March 31, 2010: ¥4,951,323 million |
| 2. Net assets ratio = {(Net assets – Stock acquisition rights – Minority interests) / Total assets} X 100 | |||
S-1
Table of Contents
| (Yen) |
| 1st Quarter 2nd Quarter 3rd Quarter 4th Quarter Annual |
| Fiscal Year ended March 31, 2010 ¥— ¥ 45 ¥— ¥ 55 ¥ 100 |
| Fiscal Year ending March 31, 2011 - |
| Fiscal Year ending March 31, 2011 (Forecast) 50 — 50 100 |
| Notes: 1. Dividend forecast remains unchanged. | |||
| 2. Dividends on unlisted preferred stock are reported on page 2. | |||
| (1) | There was no change in material consolidated subsidiaries in the three months ended June 30, 2010. | ||
| (2) | Simplified and special accounting methods used for preparing quarterly consolidated financial statements were adopted. | ||
| (3) | There are changes in accounting principles, procedures and presentation when preparing quarterly consolidated financial statements due to revisions in accounting standards. | ||
| (4) | Number of Shares Issued (common stock) |
| As of June 30, 2010 | As of March 31, 2010 | |||||||
| (a) Number of shares issued (including treasury shares) | 1,414,055,625 shares | 1,414,055,625 shares | ||||||
| (b) Number of treasury shares | 17,074,900 shares | 17,070,100 shares | ||||||
| Three Months ended | Three Months ended | |||||||
| June 30, 2010 | June 30, 2009 | |||||||
| (c) Average number of shares issued in the period | 1,396,981,367 shares | 845,274,702 shares | ||||||
S-2
Table of Contents
| 1st Quarter 2nd Quarter 3rd Quarter 4th Quarter Annual |
| Preferred stock (Type 4) Fiscal Year ended March 31, 2010 Y- Y45 — Y55 Y100 |
| Preferred stock (Type 6) Fiscal Year ending March 31, 2010 — 44,250 — 44,250 88,500 |
| Fiscal Year ending March 31, 2011 — 88,500 |
| Fiscal Year ending March 31, 2011 (Forecast) 44,250 — 44,250 |
| Forecasted net income – Forecasted preferred stock dividends | ||
| Forecasted average number of common stocks during the period (excluding treasury stock) | ||
S-3
Table of Contents
| <Consolidated> | (Billions of yen) |
| Change from the three months ended June 30, 2009 | |||||||||||||||||||||||||||
| Three months | Fiscal year ended | ||||||||||||||||||||||||||
| ended June 30, | March 31, 2010 | ||||||||||||||||||||||||||
| 2010 | (reference) | ||||||||||||||||||||||||||
| Gross profit | ¥ | 618.2 | ¥ | 82.0 | ¥ | 2,236.6 | |||||||||||||||||||||
| General and administrative expenses | (314.2 | ) | (46.2 | ) | (1,161.3 | ) | |||||||||||||||||||||
| Total credit cost | (31.8 | ) | 88.0 | (473.0 | ) | ||||||||||||||||||||||
| Gains (losses) on stocks | 0.2 | 2.7 | (10.1 | ) | |||||||||||||||||||||||
| Ordinary profit | 273.2 | 158.0 | 558.8 | ||||||||||||||||||||||||
| Net income (loss) | 211.8 | 139.0 | 271.6 | ||||||||||||||||||||||||
| <SMBC, Non-consolidated> | |||||||||||||||||||||||||||
| Gross banking profit | ¥ | 395.1 | ¥ | 24.1 | ¥ | 1,455.3 | |||||||||||||||||||||
| Expenses (excluding non-recurring losses) | (175.2 | ) | 0.4 | (685.8 | ) | ||||||||||||||||||||||
| Banking profit (*) | 219.9 | 24.5 | 769.5 | ||||||||||||||||||||||||
| Net gains (losses) on bonds | 75.2 | 34.7 | 37.3 | ||||||||||||||||||||||||
| Total credit cost | (10.8 | ) | 58.5 | (254.7 | ) | ||||||||||||||||||||||
| Gains (losses) on stocks | 2.3 | 3.5 | 3.9 | ||||||||||||||||||||||||
| Ordinary profit | 198.0 | 88.7 | 462.7 | ||||||||||||||||||||||||
| Net income (loss) | 175.8 | 67.8 | 318.0 | ||||||||||||||||||||||||
| (*) Banking profit (before provision for general reserve for possible loan losses) |
S-4
Table of Contents
| (1) | Simplified and Special Accounting Methods Used for Preparing Quarterly Consolidated Financial Statements |
| (a) | Depreciation Depreciation cost for tangible fixed assets depreciated using the straight-line method was calculated by proportionally allocating the estimated annual cost to the 1st quarter. | ||
| (b) | Tax Effect Accounting Current and deferred income tax amounts corresponding to the 1st quarter were calculated on the assumption that at the end of this fiscal year retained earnings of consolidated domestic subsidiaries will be transferred to the reserve for losses on overseas investments. |
| (2) | Changes of Accounting Procedures and Presentation Accounting Standard for Asset Retirement Obligations |
S-5
Table of Contents
| (1) | Consolidated Balance Sheets |
| (Millions of yen) | ||||||||
| June 30, 2010 | March 31, 2010 | |||||||
| (condensed) | ||||||||
Assets: | ||||||||
| Cash and due from banks | ¥ | 5,342,055 | ¥ | 5,839,672 | ||||
| Call loans and bills bought | 896,163 | 1,121,145 | ||||||
| Receivables under resale agreements | 38,341 | 25,226 | ||||||
| Receivables under securities borrowing transactions | 3,518,722 | 5,440,622 | ||||||
| Monetary claims bought | 1,028,990 | 1,006,738 | ||||||
| Trading assets | 8,958,457 | 6,708,688 | ||||||
| Money held in trust | 22,149 | 18,734 | ||||||
| Securities | 31,861,549 | 28,623,968 | ||||||
| Loans and bills discounted | 62,492,044 | 62,701,033 | ||||||
| Foreign exchanges | 1,203,035 | 1,107,289 | ||||||
| Lease receivables and investment assets | 1,793,277 | 1,839,662 | ||||||
| Other assets | 4,830,302 | 3,610,046 | ||||||
| Tangible fixed assets | 1,081,056 | 1,081,125 | ||||||
| Intangible fixed assets | 664,901 | 626,248 | ||||||
| Deferred tax assets | 733,340 | 728,586 | ||||||
| Customers’ liabilities for acceptances and guarantees | 4,802,598 | 3,749,056 | ||||||
| Reserve for possible loan losses | (1,057,924 | ) | (1,068,329 | ) | ||||
Total assets | ¥ | 128,209,062 | ¥ | 123,159,513 | ||||
Liabilities: | ||||||||
| Deposits | ¥ | 78,709,554 | ¥ | 78,648,595 | ||||
| Negotiable certificates of deposit | 7,546,953 | 6,995,619 | ||||||
| Call money and bills sold | 2,592,537 | 2,119,557 | ||||||
| Payables under repurchase agreements | 1,387,564 | 1,120,860 | ||||||
| Payables under securities lending transactions | 4,100,088 | 4,315,774 | ||||||
| Commercial paper | 323,359 | 310,787 | ||||||
| Trading liabilities | 6,130,728 | 5,066,727 | ||||||
| Borrowed money | 5,936,216 | 5,470,578 | ||||||
| Foreign exchanges | 371,520 | 192,299 | ||||||
| Short-term bonds | 1,235,591 | 1,212,178 | ||||||
| Bonds | 3,264,762 | 3,422,672 | ||||||
| Due to trust account | 158,477 | 159,554 | ||||||
| Other liabilities | 4,314,212 | 3,193,146 | ||||||
| Reserve for employee bonuses | 14,271 | 43,443 | ||||||
| Reserve for executive bonuses | — | 2,333 | ||||||
| Reserve for employee retirement benefits | 49,354 | 41,691 | ||||||
| Reserve for executive retirement benefits | 2,062 | 8,216 | ||||||
| Provision for point service program | 20,599 | |||||||
| Reserve for reimbursement of deposits | 10,597 | 11,734 | ||||||
| Provision for loss on interest repayment | 77,399 | |||||||
| Reserves under the special laws | 361 | 393 | ||||||
| Deferred tax liabilities | 25,649 | 26,520 | ||||||
| Deferred tax liabilities for land revaluation | 46,949 | 46,966 | ||||||
| Acceptances and guarantees | 4,802,598 | 3,749,056 | ||||||
Total liabilities | 121,121,410 | 116,158,708 | ||||||
Net assets: | ||||||||
| Capital stock | 2,337,895 | 2,337,895 | ||||||
| Capital surplus | 978,881 | 978,897 | ||||||
| Retained earnings | 1,583,847 | 1,451,945 | ||||||
| Treasury stock | (124,059 | ) | (124,061 | ) | ||||
Stockholders’ equity | 4,776,564 | 4,644,677 | ||||||
| Net unrealized gains (losses) on other securities | 289,424 | 412,708 | ||||||
| Net deferred losses on hedges | (7,818 | ) | (39,367 | ) | ||||
| Land revaluation excess | 34,938 | 34,955 | ||||||
| Foreign currency translation adjustments | (89,554 | ) | (101,650 | ) | ||||
Valuation and translation adjustments | 226,989 | 306,646 | ||||||
| Stock acquisition rights | 85 | 81 | ||||||
| Minority interests | 2,084,012 | 2,049,400 | ||||||
Total net assets | 7,087,652 | 7,000,805 | ||||||
Total liabilities and net assets | ¥ | 128,209,062 | ¥ | 123,159,513 | ||||
S-6
Table of Contents
| (Millions of yen) | ||||||||
| Three months ended June 30, | 2009 | 2010 | ||||||
| Ordinary income | ¥ | 764,985 | ¥ | 871,144 | ||||
| Interest income | 433,278 | 394,964 | ||||||
| Interest on loans and discounts | 333,865 | 297,347 | ||||||
| Interest and dividends on securities | 60,852 | 58,294 | ||||||
| Trust fees | 251 | 572 | ||||||
| Fees and commissions | 154,370 | 200,490 | ||||||
| Trading income | 33,495 | 96,782 | ||||||
| Other operating income | 139,185 | 170,653 | ||||||
| Other income | 4,405 | 7,680 | ||||||
| Ordinary expenses | 649,737 | 597,939 | ||||||
| Interest expenses | 96,341 | 85,661 | ||||||
| Interest on deposits | 42,818 | 29,687 | ||||||
| Fees and commissions payments | 30,674 | 34,027 | ||||||
| Trading losses | — | 438 | ||||||
| Other operating expenses | 97,370 | 125,104 | ||||||
| General and administrative expenses | 268,024 | 314,239 | ||||||
| Other expenses | 157,326 | 38,467 | ||||||
| Ordinary profit | 115,248 | 273,204 | ||||||
| Extraordinary gains | 358 | 12,558 | ||||||
| Extraordinary losses | 1,494 | 5,473 | ||||||
| Income before income taxes and minority interests | 114,111 | 280,290 | ||||||
| Income taxes | ||||||||
| current | 28,888 | 13,898 | ||||||
| deferred | (16,956 | ) | 24,990 | |||||
| Minority interests in net income | 29,405 | 29,593 | ||||||
| Net income | ¥ | 72,773 | ¥ | 211,807 | ||||
S-7
Table of Contents
| Exhibit 1.1 | Articles of Incorporation of Sumitomo Mitsui Financial Group, Inc., as amended on June 29, 2010 | |
| Exhibit 1.2 | Regulations of the Board of Directors of Sumitomo Mitsui Financial Group, Inc., as amended on June 29, 2010 | |
| Exhibit 1.3 | Share Handling Regulations of Sumitomo Mitsui Financial Group, Inc., as amended on June 29, 2010 | |
| Exhibit 2.1 | Form of Deposit Agreement among the registrant, Citibank, N.A., as Depositary, and all owners and holders from time to time of American Depositary Shares issued thereunder | |
| Exhibit 8.1 | List of subsidiaries of Sumitomo Mitsui Financial Group, Inc., as of March 31, 2010 | |
| Exhibit 15.1 | Consent of Independent Registered Public Accounting Firm |
1